Cities with the Most Immigrants from Northern Europe in Minnesota
RELATED REPORTS & OPTIONS
Northern Europe
Minnesota
Compare Cities
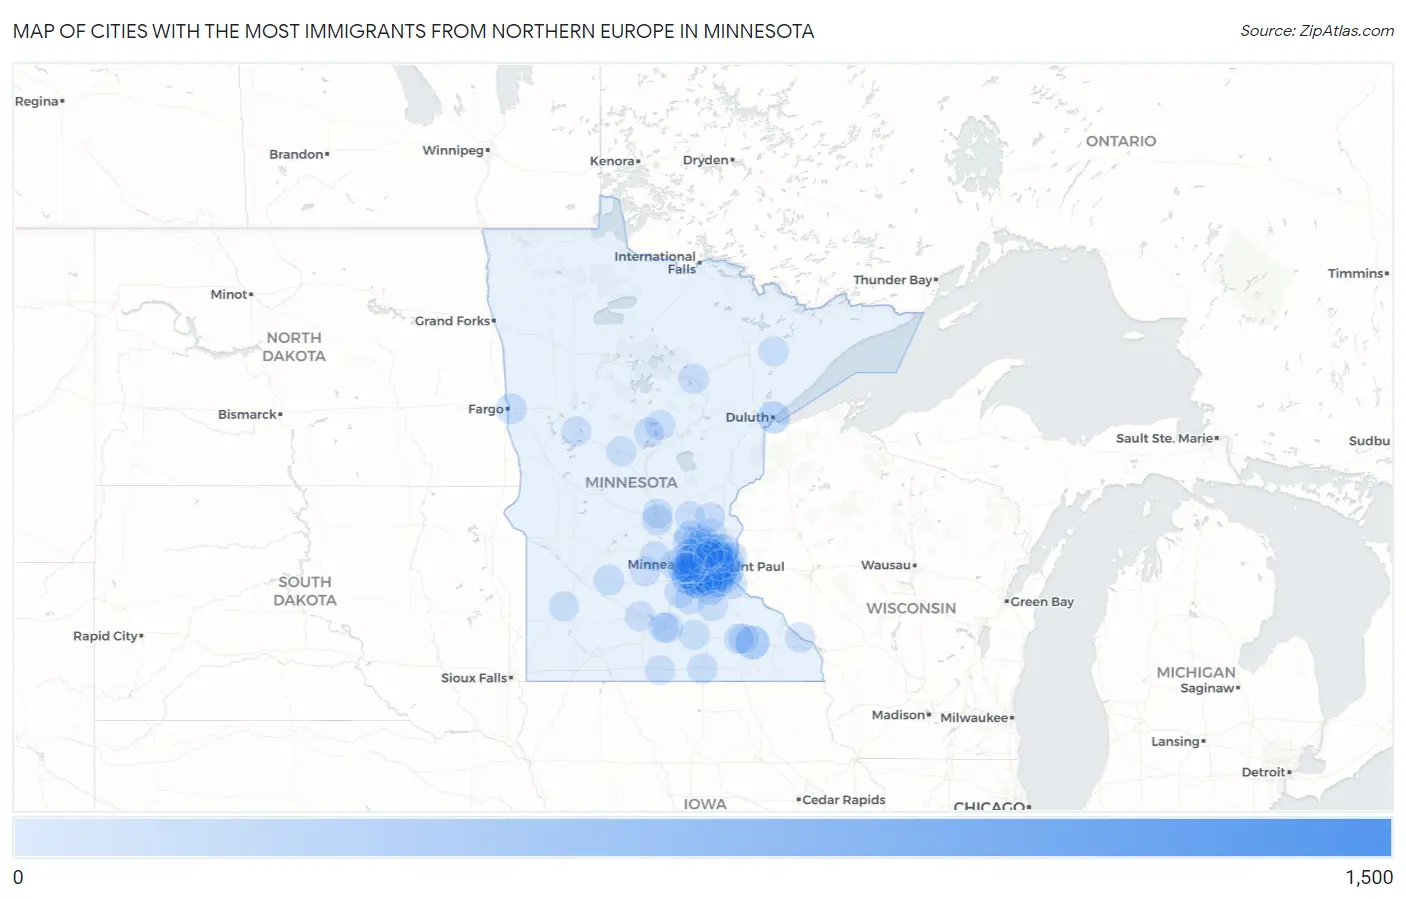
Map of Cities with the Most Immigrants from Northern Europe in Minnesota
0
1,500
Cities with the Most Immigrants from Northern Europe in Minnesota
| City | Northern Europe | vs State | vs National | |
| 1. | Minneapolis | 1,100 | 8,158(13.48%)#1 | 944,917(0.12%)#74 |
| 2. | St Paul | 601 | 8,158(7.37%)#2 | 944,917(0.06%)#169 |
| 3. | Eden Prairie | 379 | 8,158(4.65%)#3 | 944,917(0.04%)#310 |
| 4. | Bloomington | 244 | 8,158(2.99%)#4 | 944,917(0.03%)#546 |
| 5. | Chaska | 219 | 8,158(2.68%)#5 | 944,917(0.02%)#637 |
| 6. | Rochester | 211 | 8,158(2.59%)#6 | 944,917(0.02%)#658 |
| 7. | Plymouth | 193 | 8,158(2.37%)#7 | 944,917(0.02%)#726 |
| 8. | West St Paul | 150 | 8,158(1.84%)#8 | 944,917(0.02%)#959 |
| 9. | Minnetonka | 142 | 8,158(1.74%)#9 | 944,917(0.02%)#1,012 |
| 10. | Woodbury | 134 | 8,158(1.64%)#10 | 944,917(0.01%)#1,076 |
| 11. | St Louis Park | 134 | 8,158(1.64%)#11 | 944,917(0.01%)#1,078 |
| 12. | Eagan | 126 | 8,158(1.54%)#12 | 944,917(0.01%)#1,141 |
| 13. | Lakeville | 125 | 8,158(1.53%)#13 | 944,917(0.01%)#1,151 |
| 14. | Duluth | 124 | 8,158(1.52%)#14 | 944,917(0.01%)#1,162 |
| 15. | Shakopee | 122 | 8,158(1.50%)#15 | 944,917(0.01%)#1,179 |
| 16. | Golden Valley | 113 | 8,158(1.39%)#16 | 944,917(0.01%)#1,271 |
| 17. | Apple Valley | 111 | 8,158(1.36%)#17 | 944,917(0.01%)#1,287 |
| 18. | Chanhassen | 103 | 8,158(1.26%)#18 | 944,917(0.01%)#1,388 |
| 19. | Roseville | 100 | 8,158(1.23%)#19 | 944,917(0.01%)#1,440 |
| 20. | Brooklyn Center | 99 | 8,158(1.21%)#20 | 944,917(0.01%)#1,456 |
| 21. | Shoreview | 98 | 8,158(1.20%)#21 | 944,917(0.01%)#1,468 |
| 22. | Edina | 96 | 8,158(1.18%)#22 | 944,917(0.01%)#1,501 |
| 23. | Maple Grove | 84 | 8,158(1.03%)#23 | 944,917(0.01%)#1,687 |
| 24. | Coon Rapids | 81 | 8,158(0.99%)#24 | 944,917(0.01%)#1,728 |
| 25. | New Brighton | 75 | 8,158(0.92%)#25 | 944,917(0.01%)#1,837 |
| 26. | Columbia Heights | 73 | 8,158(0.89%)#26 | 944,917(0.01%)#1,876 |
| 27. | Anoka | 72 | 8,158(0.88%)#27 | 944,917(0.01%)#1,898 |
| 28. | Blaine | 60 | 8,158(0.74%)#28 | 944,917(0.01%)#2,196 |
| 29. | Hastings | 59 | 8,158(0.72%)#29 | 944,917(0.01%)#2,231 |
| 30. | Mendota Heights | 57 | 8,158(0.70%)#30 | 944,917(0.01%)#2,302 |
| 31. | Oakdale | 54 | 8,158(0.66%)#31 | 944,917(0.01%)#2,384 |
| 32. | Lake Elmo | 54 | 8,158(0.66%)#32 | 944,917(0.01%)#2,400 |
| 33. | Moorhead | 53 | 8,158(0.65%)#33 | 944,917(0.01%)#2,422 |
| 34. | Ramsey | 52 | 8,158(0.64%)#34 | 944,917(0.01%)#2,457 |
| 35. | Mankato | 50 | 8,158(0.61%)#35 | 944,917(0.01%)#2,538 |
| 36. | Richfield | 50 | 8,158(0.61%)#36 | 944,917(0.01%)#2,540 |
| 37. | Andover | 49 | 8,158(0.60%)#37 | 944,917(0.01%)#2,573 |
| 38. | Inver Grove Heights | 44 | 8,158(0.54%)#38 | 944,917(0.00%)#2,760 |
| 39. | New Prague | 44 | 8,158(0.54%)#39 | 944,917(0.00%)#2,775 |
| 40. | Belle Plaine | 44 | 8,158(0.54%)#40 | 944,917(0.00%)#2,778 |
| 41. | Brooklyn Park | 42 | 8,158(0.51%)#41 | 944,917(0.00%)#2,838 |
| 42. | Crystal | 42 | 8,158(0.51%)#42 | 944,917(0.00%)#2,849 |
| 43. | Orono | 42 | 8,158(0.51%)#43 | 944,917(0.00%)#2,870 |
| 44. | Wayzata | 42 | 8,158(0.51%)#44 | 944,917(0.00%)#2,874 |
| 45. | St Cloud | 41 | 8,158(0.50%)#45 | 944,917(0.00%)#2,882 |
| 46. | Olivia | 41 | 8,158(0.50%)#46 | 944,917(0.00%)#2,909 |
| 47. | Savage | 40 | 8,158(0.49%)#47 | 944,917(0.00%)#2,918 |
| 48. | Cottage Grove | 39 | 8,158(0.48%)#48 | 944,917(0.00%)#2,966 |
| 49. | Shorewood | 36 | 8,158(0.44%)#49 | 944,917(0.00%)#3,147 |
| 50. | Lino Lakes | 33 | 8,158(0.40%)#50 | 944,917(0.00%)#3,295 |
| 51. | Vadnais Heights | 31 | 8,158(0.38%)#51 | 944,917(0.00%)#3,432 |
| 52. | Robbinsdale | 30 | 8,158(0.37%)#52 | 944,917(0.00%)#3,490 |
| 53. | Prior Lake | 29 | 8,158(0.36%)#53 | 944,917(0.00%)#3,539 |
| 54. | Elk River | 29 | 8,158(0.36%)#54 | 944,917(0.00%)#3,540 |
| 55. | Victoria | 29 | 8,158(0.36%)#55 | 944,917(0.00%)#3,554 |
| 56. | Burnsville | 28 | 8,158(0.34%)#56 | 944,917(0.00%)#3,606 |
| 57. | Minnetrista | 28 | 8,158(0.34%)#57 | 944,917(0.00%)#3,636 |
| 58. | St Anthony City Hennepin And Ramsey Counties | 27 | 8,158(0.33%)#58 | 944,917(0.00%)#3,699 |
| 59. | Byron | 26 | 8,158(0.32%)#59 | 944,917(0.00%)#3,773 |
| 60. | Winona | 25 | 8,158(0.31%)#60 | 944,917(0.00%)#3,819 |
| 61. | Otsego | 25 | 8,158(0.31%)#61 | 944,917(0.00%)#3,824 |
| 62. | North Oaks | 25 | 8,158(0.31%)#62 | 944,917(0.00%)#3,862 |
| 63. | Hopkins | 24 | 8,158(0.29%)#63 | 944,917(0.00%)#3,908 |
| 64. | Albert Lea | 24 | 8,158(0.29%)#64 | 944,917(0.00%)#3,909 |
| 65. | Corcoran | 24 | 8,158(0.29%)#65 | 944,917(0.00%)#3,933 |
| 66. | Grand Rapids | 22 | 8,158(0.27%)#66 | 944,917(0.00%)#4,108 |
| 67. | New Ulm | 20 | 8,158(0.25%)#67 | 944,917(0.00%)#4,288 |
| 68. | East Bethel | 20 | 8,158(0.25%)#68 | 944,917(0.00%)#4,293 |
| 69. | Deephaven | 20 | 8,158(0.25%)#69 | 944,917(0.00%)#4,338 |
| 70. | Waseca | 19 | 8,158(0.23%)#70 | 944,917(0.00%)#4,424 |
| 71. | Hoyt Lakes | 18 | 8,158(0.22%)#71 | 944,917(0.00%)#4,587 |
| 72. | White Bear Lake | 17 | 8,158(0.21%)#72 | 944,917(0.00%)#4,620 |
| 73. | North Mankato | 17 | 8,158(0.21%)#73 | 944,917(0.00%)#4,634 |
| 74. | Mounds View | 17 | 8,158(0.21%)#74 | 944,917(0.00%)#4,637 |
| 75. | Watertown | 17 | 8,158(0.21%)#75 | 944,917(0.00%)#4,678 |
| 76. | New Hope | 16 | 8,158(0.20%)#76 | 944,917(0.00%)#4,747 |
| 77. | Credit River | 16 | 8,158(0.20%)#77 | 944,917(0.00%)#4,785 |
| 78. | Blue Earth | 16 | 8,158(0.20%)#78 | 944,917(0.00%)#4,813 |
| 79. | Northfield | 15 | 8,158(0.18%)#79 | 944,917(0.00%)#4,875 |
| 80. | Stillwater | 15 | 8,158(0.18%)#80 | 944,917(0.00%)#4,878 |
| 81. | Independence | 15 | 8,158(0.18%)#81 | 944,917(0.00%)#4,956 |
| 82. | Hutchinson | 14 | 8,158(0.17%)#82 | 944,917(0.00%)#5,038 |
| 83. | Medina | 14 | 8,158(0.17%)#83 | 944,917(0.00%)#5,078 |
| 84. | Perham | 14 | 8,158(0.17%)#84 | 944,917(0.00%)#5,113 |
| 85. | Crosslake | 14 | 8,158(0.17%)#85 | 944,917(0.00%)#5,136 |
| 86. | Hugo | 13 | 8,158(0.16%)#86 | 944,917(0.00%)#5,190 |
| 87. | Sauk Rapids | 13 | 8,158(0.16%)#87 | 944,917(0.00%)#5,199 |
| 88. | Spring Lake Park | 13 | 8,158(0.16%)#88 | 944,917(0.00%)#5,240 |
| 89. | Fridley | 12 | 8,158(0.15%)#89 | 944,917(0.00%)#5,342 |
| 90. | Mound | 12 | 8,158(0.15%)#90 | 944,917(0.00%)#5,384 |
| 91. | Kasson | 12 | 8,158(0.15%)#91 | 944,917(0.00%)#5,401 |
| 92. | Cokato | 12 | 8,158(0.15%)#92 | 944,917(0.00%)#5,443 |
| 93. | Staples | 12 | 8,158(0.15%)#93 | 944,917(0.00%)#5,455 |
| 94. | Pequot Lakes | 12 | 8,158(0.15%)#94 | 944,917(0.00%)#5,462 |
| 95. | Spring Park | 12 | 8,158(0.15%)#95 | 944,917(0.00%)#5,467 |
| 96. | Maplewood | 11 | 8,158(0.13%)#96 | 944,917(0.00%)#5,527 |
| 97. | Rosemount | 11 | 8,158(0.13%)#97 | 944,917(0.00%)#5,533 |
| 98. | Marshall | 11 | 8,158(0.13%)#98 | 944,917(0.00%)#5,555 |
| 99. | Cambridge | 11 | 8,158(0.13%)#99 | 944,917(0.00%)#5,577 |
| 100. | Princeton | 11 | 8,158(0.13%)#100 | 944,917(0.00%)#5,608 |
Common Questions
What are the Top 10 Cities with the Most Immigrants from Northern Europe in Minnesota?
Top 10 Cities with the Most Immigrants from Northern Europe in Minnesota are:
#1
1,100
#2
601
#3
379
#4
244
#5
219
#6
211
#7
193
#8
150
#9
142
#10
134
What city has the Most Immigrants from Northern Europe in Minnesota?
Minneapolis has the Most Immigrants from Northern Europe in Minnesota with 1,100.
What is the Total Immigrants from Northern Europe in the State of Minnesota?
Total Immigrants from Northern Europe in Minnesota is 8,158.
What is the Total Immigrants from Northern Europe in the United States?
Total Immigrants from Northern Europe in the United States is 944,917.