Cities with the Most Immigrants from Northern Europe in Tennessee
RELATED REPORTS & OPTIONS
Northern Europe
Tennessee
Compare Cities
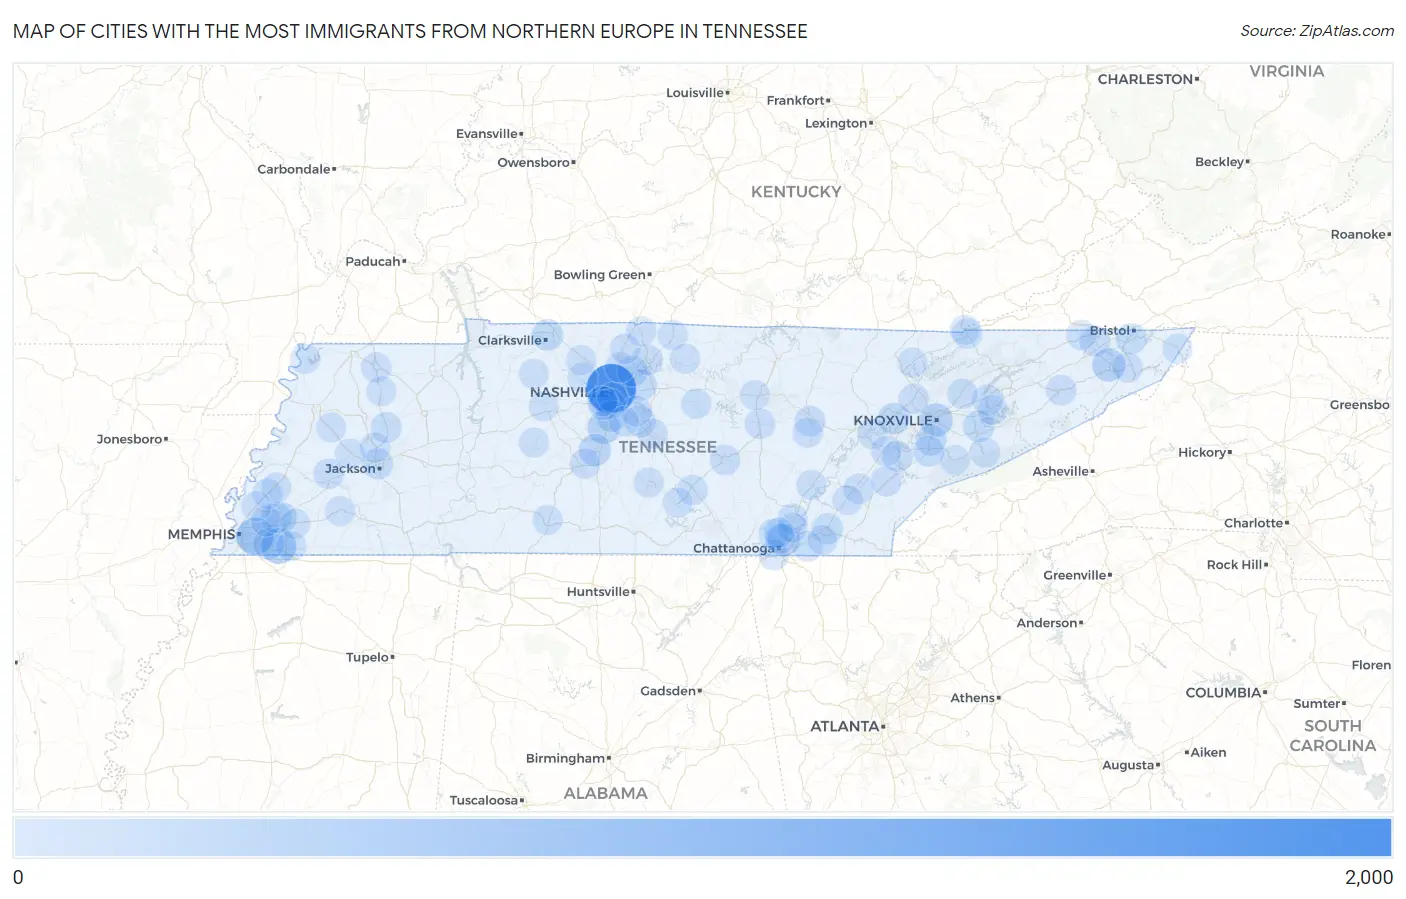
Map of Cities with the Most Immigrants from Northern Europe in Tennessee
0
2,000
Cities with the Most Immigrants from Northern Europe in Tennessee
| City | Northern Europe | vs State | vs National | |
| 1. | Nashville | 1,790 | 10,473(17.09%)#1 | 944,917(0.19%)#31 |
| 2. | Memphis | 609 | 10,473(5.81%)#2 | 944,917(0.06%)#165 |
| 3. | Collierville | 451 | 10,473(4.31%)#3 | 944,917(0.05%)#229 |
| 4. | Knoxville | 281 | 10,473(2.68%)#4 | 944,917(0.03%)#436 |
| 5. | Johnson City | 264 | 10,473(2.52%)#5 | 944,917(0.03%)#487 |
| 6. | Franklin | 239 | 10,473(2.28%)#6 | 944,917(0.03%)#564 |
| 7. | Chattanooga | 194 | 10,473(1.85%)#7 | 944,917(0.02%)#724 |
| 8. | Spring Hill | 174 | 10,473(1.66%)#8 | 944,917(0.02%)#798 |
| 9. | Oak Ridge | 141 | 10,473(1.35%)#9 | 944,917(0.01%)#1,020 |
| 10. | Brentwood | 125 | 10,473(1.19%)#10 | 944,917(0.01%)#1,153 |
| 11. | Sevierville | 120 | 10,473(1.15%)#11 | 944,917(0.01%)#1,198 |
| 12. | Clarksville | 114 | 10,473(1.09%)#12 | 944,917(0.01%)#1,257 |
| 13. | Arlington | 114 | 10,473(1.09%)#13 | 944,917(0.01%)#1,264 |
| 14. | Germantown | 110 | 10,473(1.05%)#14 | 944,917(0.01%)#1,301 |
| 15. | Smyrna | 101 | 10,473(0.96%)#15 | 944,917(0.01%)#1,420 |
| 16. | Lakeland | 93 | 10,473(0.89%)#16 | 944,917(0.01%)#1,554 |
| 17. | Cleveland | 91 | 10,473(0.87%)#17 | 944,917(0.01%)#1,582 |
| 18. | Mount Juliet | 91 | 10,473(0.87%)#18 | 944,917(0.01%)#1,584 |
| 19. | Jackson | 83 | 10,473(0.79%)#19 | 944,917(0.01%)#1,704 |
| 20. | Bristol | 82 | 10,473(0.78%)#20 | 944,917(0.01%)#1,718 |
| 21. | Alcoa | 81 | 10,473(0.77%)#21 | 944,917(0.01%)#1,739 |
| 22. | Maryville | 80 | 10,473(0.76%)#22 | 944,917(0.01%)#1,750 |
| 23. | Hendersonville | 66 | 10,473(0.63%)#23 | 944,917(0.01%)#2,021 |
| 24. | Milan | 66 | 10,473(0.63%)#24 | 944,917(0.01%)#2,041 |
| 25. | Tellico Village | 66 | 10,473(0.63%)#25 | 944,917(0.01%)#2,046 |
| 26. | Gallatin | 64 | 10,473(0.61%)#26 | 944,917(0.01%)#2,072 |
| 27. | Kingsport | 62 | 10,473(0.59%)#27 | 944,917(0.01%)#2,127 |
| 28. | Jefferson City | 61 | 10,473(0.58%)#28 | 944,917(0.01%)#2,181 |
| 29. | Crossville | 49 | 10,473(0.47%)#29 | 944,917(0.01%)#2,584 |
| 30. | Athens | 44 | 10,473(0.42%)#30 | 944,917(0.00%)#2,770 |
| 31. | Sparta | 44 | 10,473(0.42%)#31 | 944,917(0.00%)#2,785 |
| 32. | Greeneville | 43 | 10,473(0.41%)#32 | 944,917(0.00%)#2,811 |
| 33. | Murfreesboro | 40 | 10,473(0.38%)#33 | 944,917(0.00%)#2,913 |
| 34. | Mcminnville | 40 | 10,473(0.38%)#34 | 944,917(0.00%)#2,932 |
| 35. | La Vergne | 37 | 10,473(0.35%)#35 | 944,917(0.00%)#3,065 |
| 36. | Madisonville | 37 | 10,473(0.35%)#36 | 944,917(0.00%)#3,094 |
| 37. | Bartlett | 36 | 10,473(0.34%)#37 | 944,917(0.00%)#3,122 |
| 38. | Columbia | 36 | 10,473(0.34%)#38 | 944,917(0.00%)#3,125 |
| 39. | Manchester | 36 | 10,473(0.34%)#39 | 944,917(0.00%)#3,142 |
| 40. | Lynchburg | 36 | 10,473(0.34%)#40 | 944,917(0.00%)#3,149 |
| 41. | Goodlettsville | 33 | 10,473(0.32%)#41 | 944,917(0.00%)#3,302 |
| 42. | Blaine | 32 | 10,473(0.31%)#42 | 944,917(0.00%)#3,400 |
| 43. | Signal Mountain | 31 | 10,473(0.30%)#43 | 944,917(0.00%)#3,442 |
| 44. | Brownsville | 30 | 10,473(0.29%)#44 | 944,917(0.00%)#3,499 |
| 45. | Clinton | 29 | 10,473(0.28%)#45 | 944,917(0.00%)#3,559 |
| 46. | Atoka | 27 | 10,473(0.26%)#46 | 944,917(0.00%)#3,693 |
| 47. | Collegedale | 24 | 10,473(0.23%)#47 | 944,917(0.00%)#3,920 |
| 48. | White House | 23 | 10,473(0.22%)#48 | 944,917(0.00%)#4,006 |
| 49. | Oak Hill | 20 | 10,473(0.19%)#49 | 944,917(0.00%)#4,324 |
| 50. | Elizabethton | 17 | 10,473(0.16%)#50 | 944,917(0.00%)#4,633 |
| 51. | Martin | 16 | 10,473(0.15%)#51 | 944,917(0.00%)#4,761 |
| 52. | Lookout Mountain | 16 | 10,473(0.15%)#52 | 944,917(0.00%)#4,832 |
| 53. | Forest Hills | 15 | 10,473(0.14%)#53 | 944,917(0.00%)#4,940 |
| 54. | Alexandria | 15 | 10,473(0.14%)#54 | 944,917(0.00%)#5,001 |
| 55. | Portland | 14 | 10,473(0.13%)#55 | 944,917(0.00%)#5,044 |
| 56. | Whiteville | 14 | 10,473(0.13%)#56 | 944,917(0.00%)#5,096 |
| 57. | Rarity Bay | 14 | 10,473(0.13%)#57 | 944,917(0.00%)#5,166 |
| 58. | Walnut Grove Cdp Sumner County | 13 | 10,473(0.12%)#58 | 944,917(0.00%)#5,325 |
| 59. | Lawrenceburg | 12 | 10,473(0.11%)#59 | 944,917(0.00%)#5,369 |
| 60. | Dayton | 12 | 10,473(0.11%)#60 | 944,917(0.00%)#5,398 |
| 61. | Riceville | 12 | 10,473(0.11%)#61 | 944,917(0.00%)#5,505 |
| 62. | Soddy Daisy | 11 | 10,473(0.11%)#62 | 944,917(0.00%)#5,558 |
| 63. | Westmoreland | 11 | 10,473(0.11%)#63 | 944,917(0.00%)#5,648 |
| 64. | Berry Hill | 11 | 10,473(0.11%)#64 | 944,917(0.00%)#5,672 |
| 65. | Three Way | 11 | 10,473(0.11%)#65 | 944,917(0.00%)#5,681 |
| 66. | Shelbyville | 10 | 10,473(0.10%)#66 | 944,917(0.00%)#5,732 |
| 67. | Hartsville Trousdale County | 10 | 10,473(0.10%)#67 | 944,917(0.00%)#5,760 |
| 68. | Kingston | 10 | 10,473(0.10%)#68 | 944,917(0.00%)#5,795 |
| 69. | Lake Tansi | 10 | 10,473(0.10%)#69 | 944,917(0.00%)#5,810 |
| 70. | Harrogate | 10 | 10,473(0.10%)#70 | 944,917(0.00%)#5,812 |
| 71. | Ashland City | 9 | 10,473(0.09%)#71 | 944,917(0.00%)#6,013 |
| 72. | Nolensville | 8 | 10,473(0.08%)#72 | 944,917(0.00%)#6,182 |
| 73. | Oakland | 8 | 10,473(0.08%)#73 | 944,917(0.00%)#6,205 |
| 74. | Pleasant View | 8 | 10,473(0.08%)#74 | 944,917(0.00%)#6,242 |
| 75. | Mountain City | 8 | 10,473(0.08%)#75 | 944,917(0.00%)#6,288 |
| 76. | Red Bank | 7 | 10,473(0.07%)#76 | 944,917(0.00%)#6,415 |
| 77. | Loudon | 7 | 10,473(0.07%)#77 | 944,917(0.00%)#6,452 |
| 78. | Dandridge | 7 | 10,473(0.07%)#78 | 944,917(0.00%)#6,482 |
| 79. | Piperton | 7 | 10,473(0.07%)#79 | 944,917(0.00%)#6,515 |
| 80. | Cumberland Gap | 7 | 10,473(0.07%)#80 | 944,917(0.00%)#6,601 |
| 81. | Slayden | 7 | 10,473(0.07%)#81 | 944,917(0.00%)#6,615 |
| 82. | Dickson | 6 | 10,473(0.06%)#82 | 944,917(0.00%)#6,639 |
| 83. | Middle Valley | 6 | 10,473(0.06%)#83 | 944,917(0.00%)#6,648 |
| 84. | Mount Carmel | 6 | 10,473(0.06%)#84 | 944,917(0.00%)#6,681 |
| 85. | Centerville | 6 | 10,473(0.06%)#85 | 944,917(0.00%)#6,701 |
| 86. | Bells | 6 | 10,473(0.06%)#86 | 944,917(0.00%)#6,718 |
| 87. | Millington | 5 | 10,473(0.05%)#87 | 944,917(0.00%)#6,897 |
| 88. | La Follette | 5 | 10,473(0.05%)#88 | 944,917(0.00%)#6,915 |
| 89. | South Cleveland | 5 | 10,473(0.05%)#89 | 944,917(0.00%)#6,916 |
| 90. | Tiptonville | 5 | 10,473(0.05%)#90 | 944,917(0.00%)#6,936 |
| 91. | Gatlinburg | 5 | 10,473(0.05%)#91 | 944,917(0.00%)#6,938 |
| 92. | Belle Meade | 5 | 10,473(0.05%)#92 | 944,917(0.00%)#6,958 |
| 93. | Greenfield | 5 | 10,473(0.05%)#93 | 944,917(0.00%)#6,983 |
| 94. | Walden | 5 | 10,473(0.05%)#94 | 944,917(0.00%)#7,008 |
| 95. | Cookeville | 4 | 10,473(0.04%)#95 | 944,917(0.00%)#7,115 |
| 96. | Tullahoma | 4 | 10,473(0.04%)#96 | 944,917(0.00%)#7,122 |
| 97. | Rocky Top | 4 | 10,473(0.04%)#97 | 944,917(0.00%)#7,222 |
| 98. | Friendship | 4 | 10,473(0.04%)#98 | 944,917(0.00%)#7,306 |
| 99. | Townsend | 4 | 10,473(0.04%)#99 | 944,917(0.00%)#7,317 |
| 100. | Brighton | 3 | 10,473(0.03%)#100 | 944,917(0.00%)#7,421 |
Common Questions
What are the Top 10 Cities with the Most Immigrants from Northern Europe in Tennessee?
Top 10 Cities with the Most Immigrants from Northern Europe in Tennessee are:
#1
1,790
#2
609
#3
451
#4
281
#5
264
#6
239
#7
194
#8
174
#9
141
#10
125
What city has the Most Immigrants from Northern Europe in Tennessee?
Nashville has the Most Immigrants from Northern Europe in Tennessee with 1,790.
What is the Total Immigrants from Northern Europe in the State of Tennessee?
Total Immigrants from Northern Europe in Tennessee is 10,473.
What is the Total Immigrants from Northern Europe in the United States?
Total Immigrants from Northern Europe in the United States is 944,917.