Cheektowaga, NY Map & Demographics
Cheektowaga Map
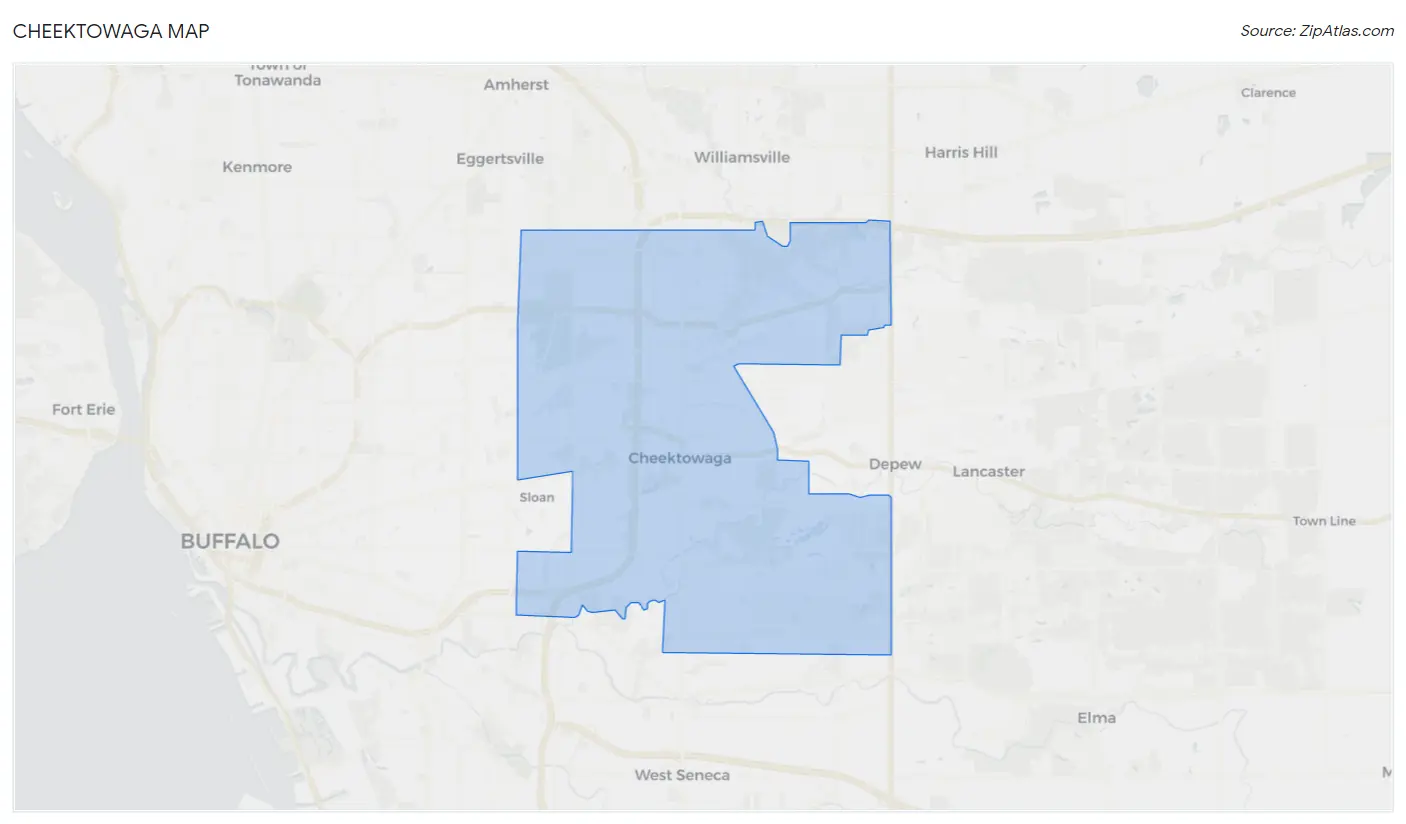
Cheektowaga Overview
$34,897
PER CAPITA INCOME
$81,433
AVG FAMILY INCOME
$64,066
AVG HOUSEHOLD INCOME
17.7%
WAGE / INCOME GAP [ % ]
82.3¢/ $1
WAGE / INCOME GAP [ $ ]
$10,696
FAMILY INCOME DEFICIT
0.40
INEQUALITY / GINI INDEX
76,483
TOTAL POPULATION
36,922
MALE POPULATION
39,561
FEMALE POPULATION
93.33
MALES / 100 FEMALES
107.15
FEMALES / 100 MALES
39.2
MEDIAN AGE
2.9
AVG FAMILY SIZE
2.2
AVG HOUSEHOLD SIZE
41,910
LABOR FORCE [ PEOPLE ]
65.5%
PERCENT IN LABOR FORCE
3.9%
UNEMPLOYMENT RATE
Cheektowaga Area Codes
Income in Cheektowaga
Income Overview in Cheektowaga
Per Capita Income in Cheektowaga is $34,897, while median incomes of families and households are $81,433 and $64,066 respectively.
| Characteristic | Number | Measure |
| Per Capita Income | 76,483 | $34,897 |
| Median Family Income | 18,645 | $81,433 |
| Mean Family Income | 18,645 | $93,507 |
| Median Household Income | 34,065 | $64,066 |
| Mean Household Income | 34,065 | $77,168 |
| Income Deficit | 18,645 | $10,696 |
| Wage / Income Gap (%) | 76,483 | 17.74% |
| Wage / Income Gap ($) | 76,483 | 82.26¢ per $1 |
| Gini / Inequality Index | 76,483 | 0.40 |
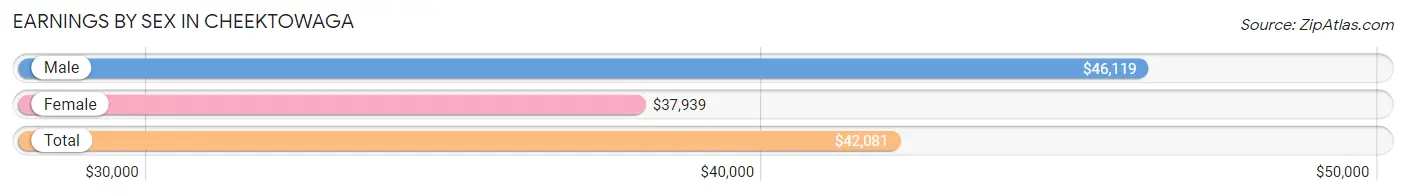
Earnings by Sex in Cheektowaga
Average Earnings in Cheektowaga are $42,081, $46,119 for men and $37,939 for women, a difference of 17.7%.
| Sex | Number | Average Earnings |
| Male | 21,820 (50.4%) | $46,119 |
| Female | 21,507 (49.6%) | $37,939 |
| Total | 43,327 (100.0%) | $42,081 |
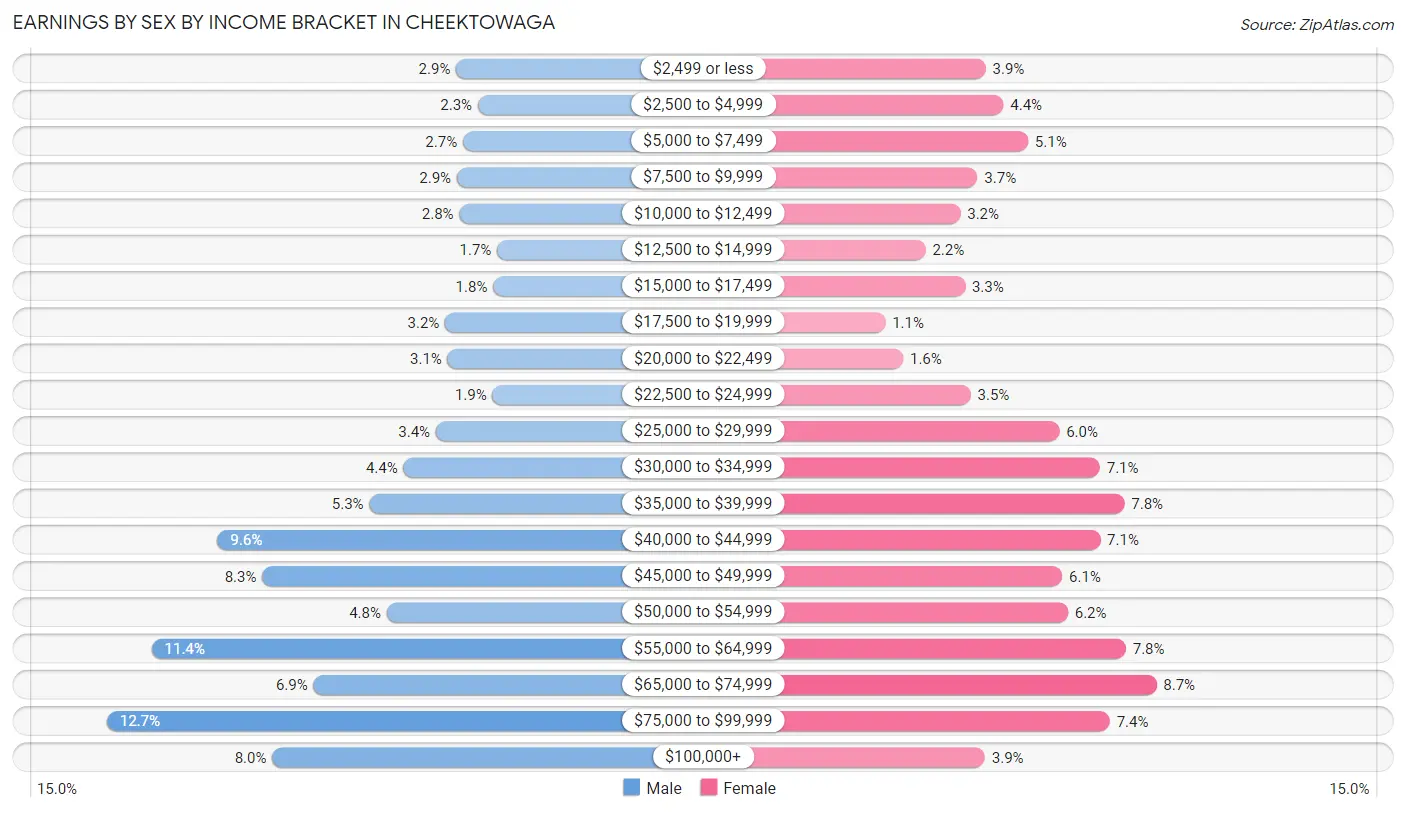
Earnings by Sex by Income Bracket in Cheektowaga
The most common earnings brackets in Cheektowaga are $75,000 to $99,999 for men (2,769 | 12.7%) and $65,000 to $74,999 for women (1,871 | 8.7%).
| Income | Male | Female |
| $2,499 or less | 627 (2.9%) | 838 (3.9%) |
| $2,500 to $4,999 | 494 (2.3%) | 946 (4.4%) |
| $5,000 to $7,499 | 585 (2.7%) | 1,095 (5.1%) |
| $7,500 to $9,999 | 622 (2.9%) | 789 (3.7%) |
| $10,000 to $12,499 | 607 (2.8%) | 687 (3.2%) |
| $12,500 to $14,999 | 376 (1.7%) | 476 (2.2%) |
| $15,000 to $17,499 | 399 (1.8%) | 713 (3.3%) |
| $17,500 to $19,999 | 694 (3.2%) | 233 (1.1%) |
| $20,000 to $22,499 | 678 (3.1%) | 340 (1.6%) |
| $22,500 to $24,999 | 404 (1.8%) | 749 (3.5%) |
| $25,000 to $29,999 | 750 (3.4%) | 1,284 (6.0%) |
| $30,000 to $34,999 | 949 (4.3%) | 1,529 (7.1%) |
| $35,000 to $39,999 | 1,159 (5.3%) | 1,677 (7.8%) |
| $40,000 to $44,999 | 2,090 (9.6%) | 1,531 (7.1%) |
| $45,000 to $49,999 | 1,815 (8.3%) | 1,302 (6.0%) |
| $50,000 to $54,999 | 1,051 (4.8%) | 1,336 (6.2%) |
| $55,000 to $64,999 | 2,495 (11.4%) | 1,687 (7.8%) |
| $65,000 to $74,999 | 1,501 (6.9%) | 1,871 (8.7%) |
| $75,000 to $99,999 | 2,769 (12.7%) | 1,590 (7.4%) |
| $100,000+ | 1,755 (8.0%) | 834 (3.9%) |
| Total | 21,820 (100.0%) | 21,507 (100.0%) |
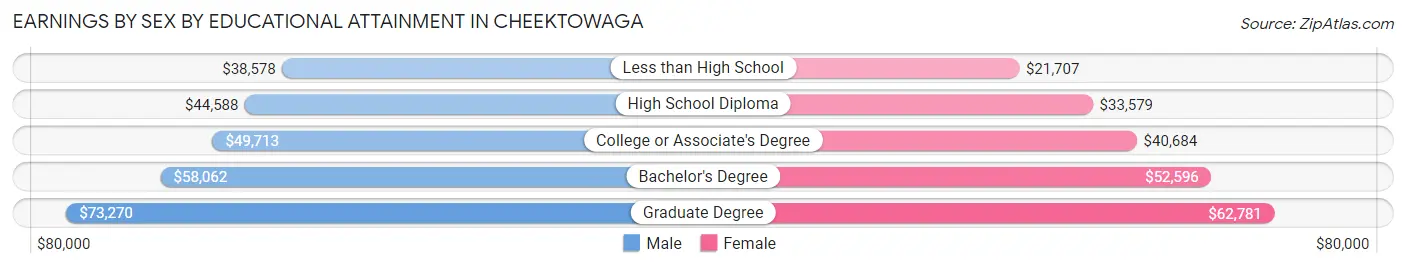
Earnings by Sex by Educational Attainment in Cheektowaga
Average earnings in Cheektowaga are $49,304 for men and $42,216 for women, a difference of 14.4%. Men with an educational attainment of graduate degree enjoy the highest average annual earnings of $73,270, while those with less than high school education earn the least with $38,578. Women with an educational attainment of graduate degree earn the most with the average annual earnings of $62,781, while those with less than high school education have the smallest earnings of $21,707.
| Educational Attainment | Male Income | Female Income |
| Less than High School | $38,578 | $21,707 |
| High School Diploma | $44,588 | $33,579 |
| College or Associate's Degree | $49,713 | $40,684 |
| Bachelor's Degree | $58,062 | $52,596 |
| Graduate Degree | $73,270 | $62,781 |
| Total | $49,304 | $42,216 |
Family Income in Cheektowaga
Family Income Brackets in Cheektowaga
According to the Cheektowaga family income data, there are 4,307 families falling into the $100,000 to $149,999 income range, which is the most common income bracket and makes up 23.1% of all families. Conversely, the $10,000 to $14,999 income bracket is the least frequent group with only 186 families (1.0%) belonging to this category.
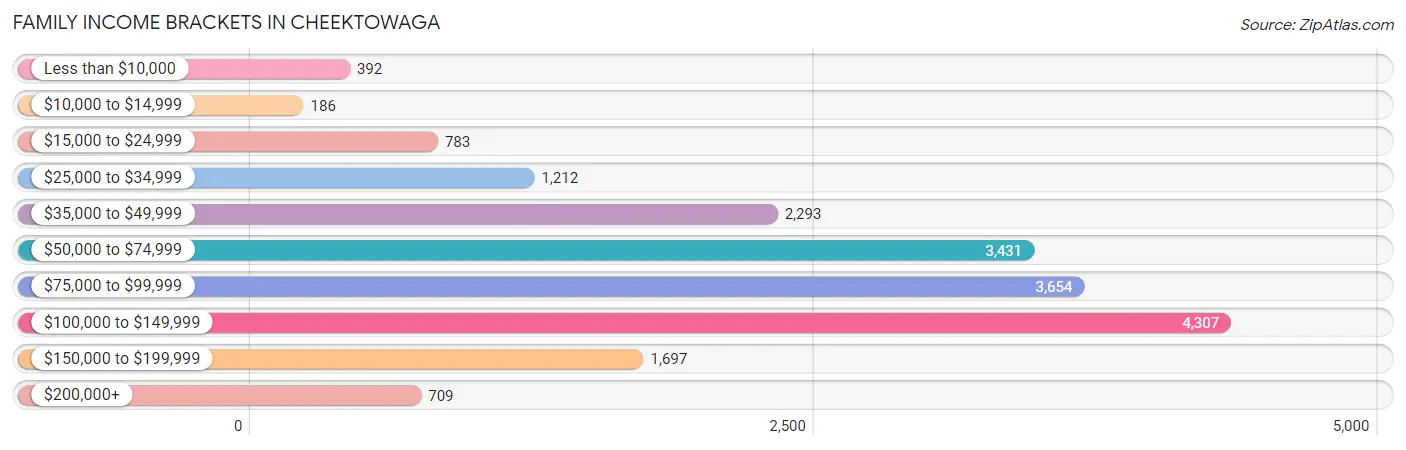
| Income Bracket | # Families | % Families |
| Less than $10,000 | 392 | 2.1% |
| $10,000 to $14,999 | 186 | 1.0% |
| $15,000 to $24,999 | 783 | 4.2% |
| $25,000 to $34,999 | 1,212 | 6.5% |
| $35,000 to $49,999 | 2,293 | 12.3% |
| $50,000 to $74,999 | 3,431 | 18.4% |
| $75,000 to $99,999 | 3,654 | 19.6% |
| $100,000 to $149,999 | 4,307 | 23.1% |
| $150,000 to $199,999 | 1,697 | 9.1% |
| $200,000+ | 709 | 3.8% |
Family Income by Famaliy Size in Cheektowaga
4-person families (2,827 | 15.2%) account for the highest median family income in Cheektowaga with $106,520 per family, while 2-person families (9,872 | 52.9%) have the highest median income of $35,636 per family member.
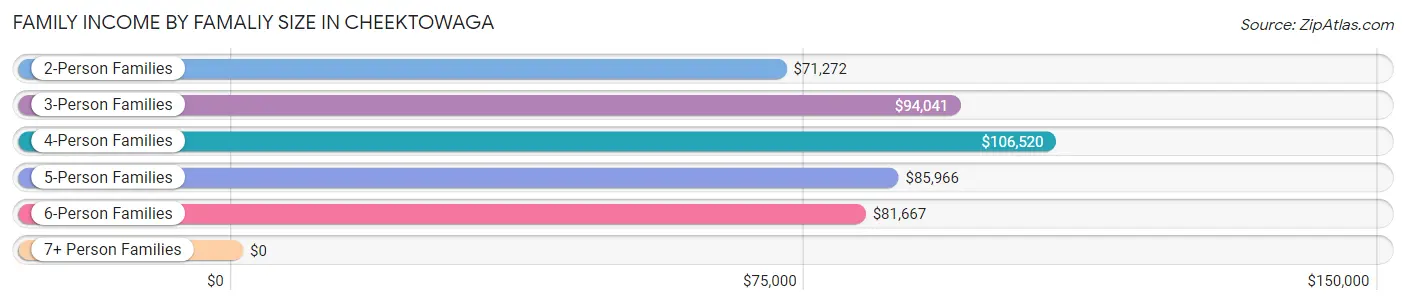
| Income Bracket | # Families | Median Income |
| 2-Person Families | 9,872 (52.9%) | $71,272 |
| 3-Person Families | 4,275 (22.9%) | $94,041 |
| 4-Person Families | 2,827 (15.2%) | $106,520 |
| 5-Person Families | 857 (4.6%) | $85,966 |
| 6-Person Families | 606 (3.3%) | $81,667 |
| 7+ Person Families | 208 (1.1%) | $0 |
| Total | 18,645 (100.0%) | $81,433 |
Family Income by Number of Earners in Cheektowaga
The median family income in Cheektowaga is $81,433, with families comprising 3+ earners (2,307) having the highest median family income of $135,677, while families with no earners (2,768) have the lowest median family income of $53,069, accounting for 12.4% and 14.8% of families, respectively.
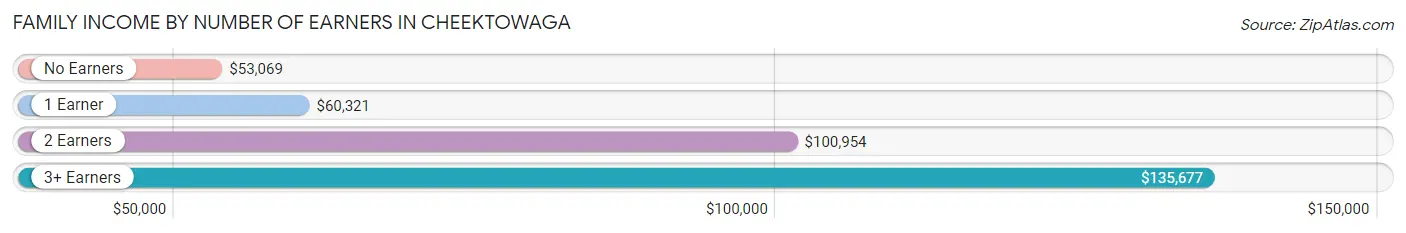
| Number of Earners | # Families | Median Income |
| No Earners | 2,768 (14.8%) | $53,069 |
| 1 Earner | 6,170 (33.1%) | $60,321 |
| 2 Earners | 7,400 (39.7%) | $100,954 |
| 3+ Earners | 2,307 (12.4%) | $135,677 |
| Total | 18,645 (100.0%) | $81,433 |
Household Income in Cheektowaga
Household Income Brackets in Cheektowaga
With 6,540 households falling in the category, the $50,000 to $74,999 income range is the most frequent in Cheektowaga, accounting for 19.2% of all households. In contrast, only 886 households (2.6%) fall into the $10,000 to $14,999 income bracket, making it the least populous group.
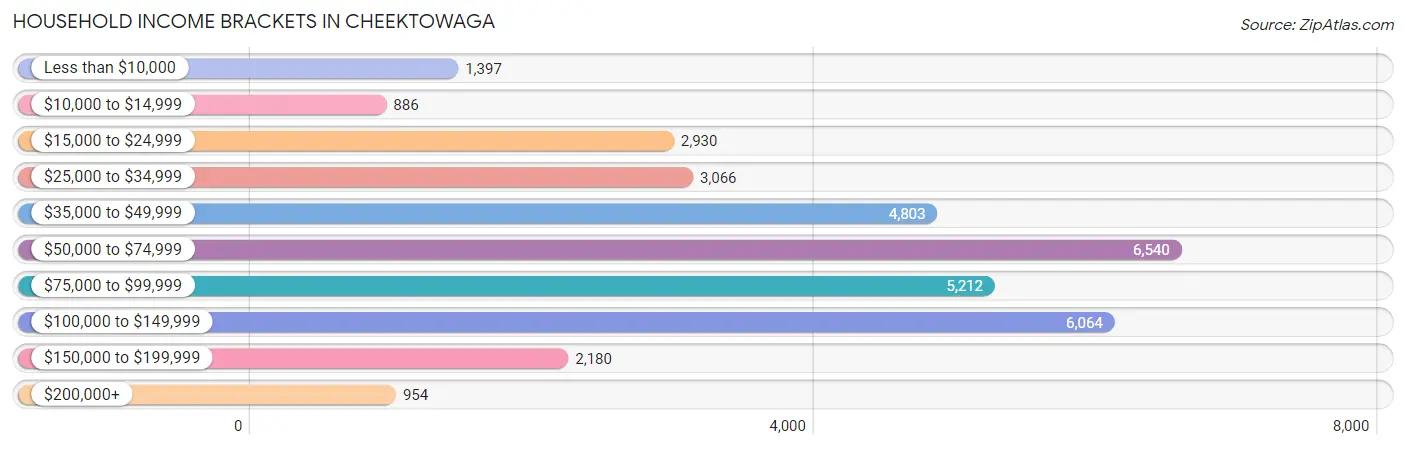
| Income Bracket | # Households | % Households |
| Less than $10,000 | 1,397 | 4.1% |
| $10,000 to $14,999 | 886 | 2.6% |
| $15,000 to $24,999 | 2,930 | 8.6% |
| $25,000 to $34,999 | 3,066 | 9.0% |
| $35,000 to $49,999 | 4,803 | 14.1% |
| $50,000 to $74,999 | 6,540 | 19.2% |
| $75,000 to $99,999 | 5,212 | 15.3% |
| $100,000 to $149,999 | 6,064 | 17.8% |
| $150,000 to $199,999 | 2,180 | 6.4% |
| $200,000+ | 954 | 2.8% |
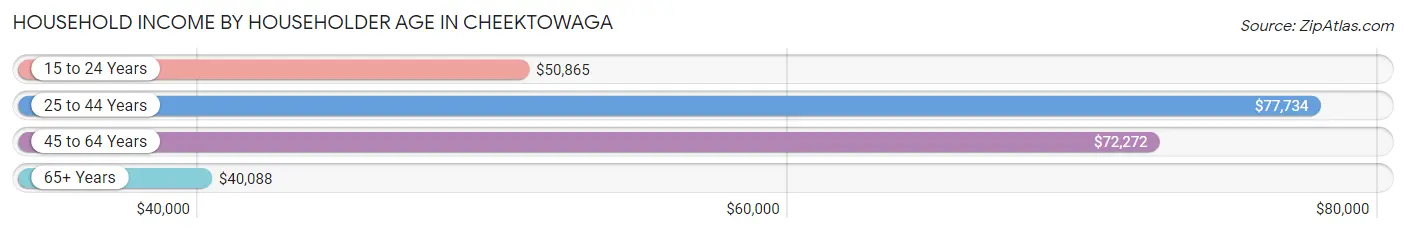
Household Income by Householder Age in Cheektowaga
The median household income in Cheektowaga is $64,066, with the highest median household income of $77,734 found in the 25 to 44 years age bracket for the primary householder. A total of 11,260 households (33.1%) fall into this category. Meanwhile, the 65+ years age bracket for the primary householder has the lowest median household income of $40,088, with 10,567 households (31.0%) in this group.
| Income Bracket | # Households | Median Income |
| 15 to 24 Years | 897 (2.6%) | $50,865 |
| 25 to 44 Years | 11,260 (33.1%) | $77,734 |
| 45 to 64 Years | 11,341 (33.3%) | $72,272 |
| 65+ Years | 10,567 (31.0%) | $40,088 |
| Total | 34,065 (100.0%) | $64,066 |
Poverty in Cheektowaga
Income Below Poverty by Sex and Age in Cheektowaga
With 8.1% poverty level for males and 9.5% for females among the residents of Cheektowaga, 12 to 14 year old males and 12 to 14 year old females are the most vulnerable to poverty, with 155 males (13.8%) and 226 females (24.7%) in their respective age groups living below the poverty level.
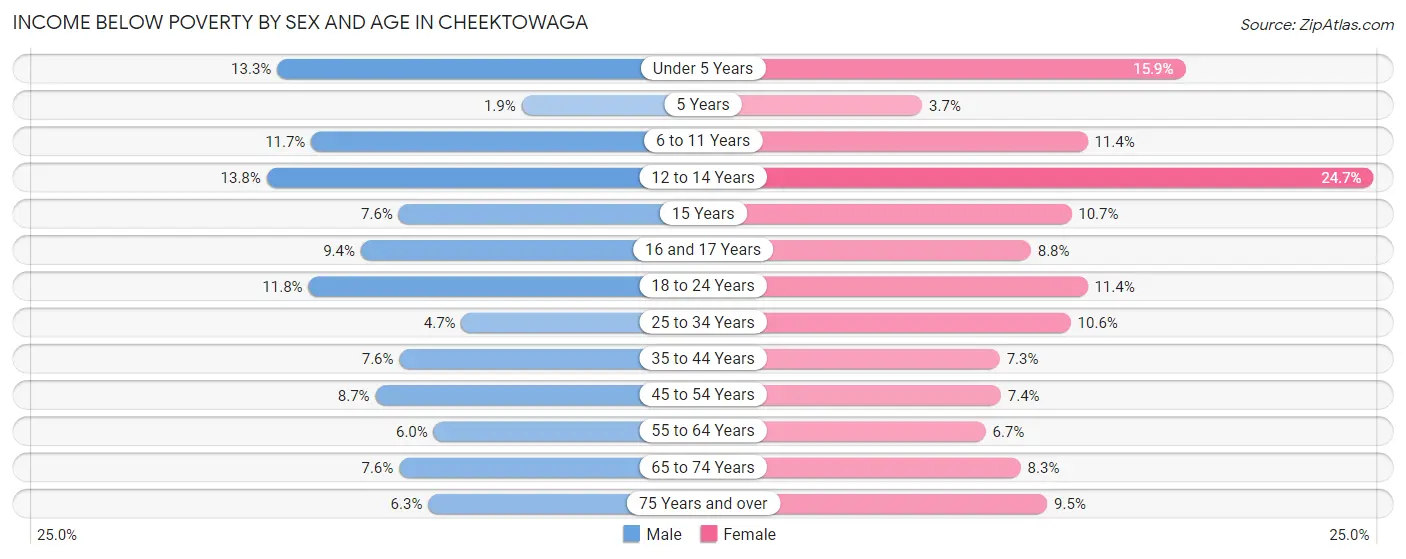
| Age Bracket | Male | Female |
| Under 5 Years | 269 (13.3%) | 251 (15.9%) |
| 5 Years | 8 (1.9%) | 16 (3.7%) |
| 6 to 11 Years | 266 (11.7%) | 282 (11.4%) |
| 12 to 14 Years | 155 (13.8%) | 226 (24.7%) |
| 15 Years | 33 (7.6%) | 51 (10.6%) |
| 16 and 17 Years | 63 (9.4%) | 59 (8.8%) |
| 18 to 24 Years | 371 (11.8%) | 361 (11.4%) |
| 25 to 34 Years | 275 (4.7%) | 630 (10.6%) |
| 35 to 44 Years | 364 (7.6%) | 333 (7.3%) |
| 45 to 54 Years | 374 (8.7%) | 311 (7.4%) |
| 55 to 64 Years | 303 (6.0%) | 347 (6.7%) |
| 65 to 74 Years | 262 (7.6%) | 363 (8.3%) |
| 75 Years and over | 173 (6.3%) | 422 (9.5%) |
| Total | 2,916 (8.1%) | 3,652 (9.5%) |
Income Above Poverty by Sex and Age in Cheektowaga
According to the poverty statistics in Cheektowaga, males aged 5 years and females aged 5 years are the age groups that are most secure financially, with 98.1% of males and 96.3% of females in these age groups living above the poverty line.
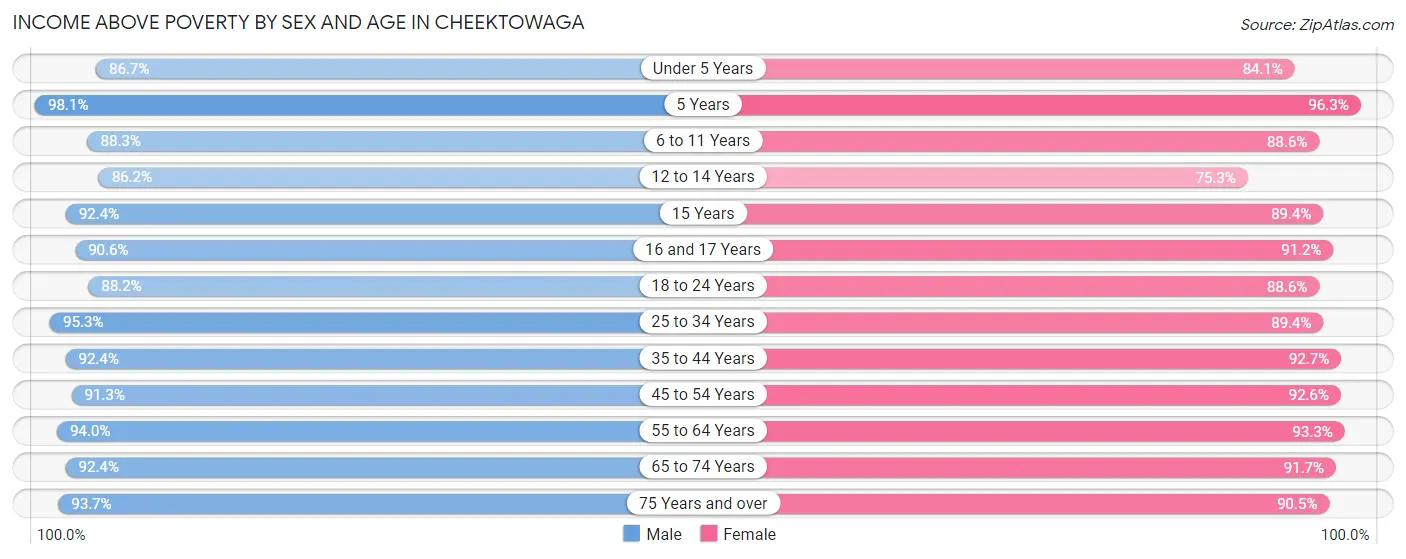
| Age Bracket | Male | Female |
| Under 5 Years | 1,757 (86.7%) | 1,324 (84.1%) |
| 5 Years | 404 (98.1%) | 413 (96.3%) |
| 6 to 11 Years | 2,008 (88.3%) | 2,192 (88.6%) |
| 12 to 14 Years | 971 (86.2%) | 690 (75.3%) |
| 15 Years | 399 (92.4%) | 428 (89.3%) |
| 16 and 17 Years | 607 (90.6%) | 614 (91.2%) |
| 18 to 24 Years | 2,766 (88.2%) | 2,805 (88.6%) |
| 25 to 34 Years | 5,535 (95.3%) | 5,300 (89.4%) |
| 35 to 44 Years | 4,420 (92.4%) | 4,212 (92.7%) |
| 45 to 54 Years | 3,914 (91.3%) | 3,904 (92.6%) |
| 55 to 64 Years | 4,732 (94.0%) | 4,857 (93.3%) |
| 65 to 74 Years | 3,177 (92.4%) | 4,008 (91.7%) |
| 75 Years and over | 2,587 (93.7%) | 4,007 (90.5%) |
| Total | 33,277 (91.9%) | 34,754 (90.5%) |
Income Below Poverty Among Married-Couple Families in Cheektowaga
The poverty statistics for married-couple families in Cheektowaga show that 3.4% or 441 of the total 12,985 families live below the poverty line. Families with 5 or more children have the highest poverty rate of 100.0%, comprising of 29 families. On the other hand, families with no children have the lowest poverty rate of 2.2%, which includes 179 families.
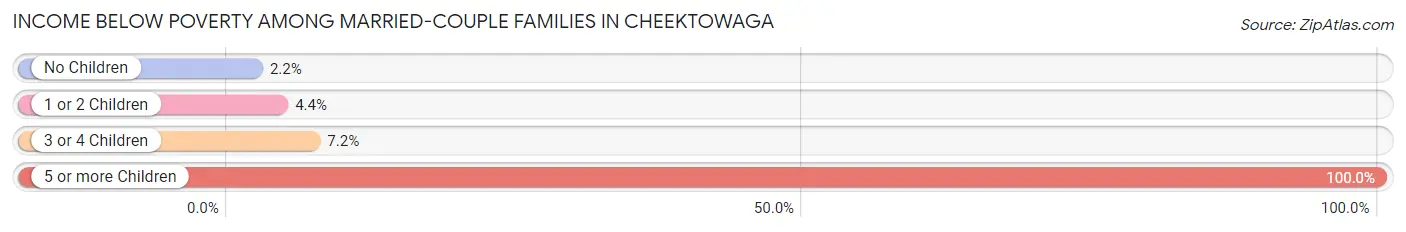
| Children | Above Poverty | Below Poverty |
| No Children | 8,075 (97.8%) | 179 (2.2%) |
| 1 or 2 Children | 3,563 (95.6%) | 163 (4.4%) |
| 3 or 4 Children | 906 (92.8%) | 70 (7.2%) |
| 5 or more Children | 0 (0.0%) | 29 (100.0%) |
| Total | 12,544 (96.6%) | 441 (3.4%) |
Income Below Poverty Among Single-Parent Households in Cheektowaga
According to the poverty data in Cheektowaga, 6.1% or 97 single-father households and 11.7% or 475 single-mother households are living below the poverty line. Among single-father households, those with 3 or 4 children have the highest poverty rate, with 5 households (17.9%) experiencing poverty. Likewise, among single-mother households, those with 5 or more children have the highest poverty rate, with 7 households (50.0%) falling below the poverty line.
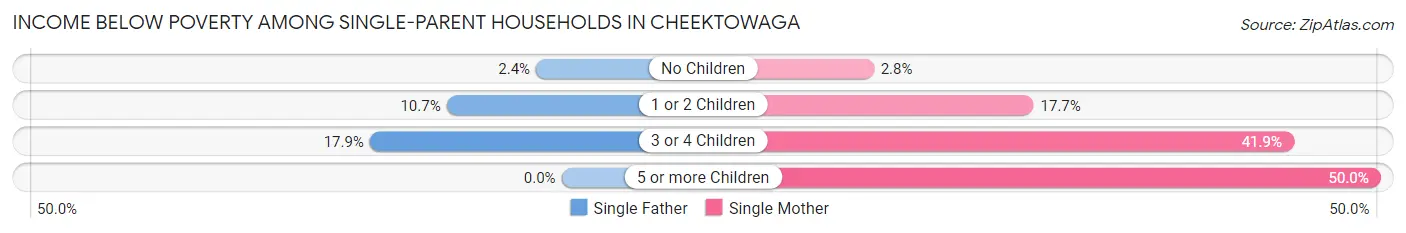
| Children | Single Father | Single Mother |
| No Children | 21 (2.4%) | 58 (2.8%) |
| 1 or 2 Children | 71 (10.7%) | 309 (17.7%) |
| 3 or 4 Children | 5 (17.9%) | 101 (41.9%) |
| 5 or more Children | 0 (0.0%) | 7 (50.0%) |
| Total | 97 (6.1%) | 475 (11.7%) |
Income Below Poverty Among Married-Couple vs Single-Parent Households in Cheektowaga
The poverty data for Cheektowaga shows that 441 of the married-couple family households (3.4%) and 572 of the single-parent households (10.1%) are living below the poverty level. Within the married-couple family households, those with 5 or more children have the highest poverty rate, with 29 households (100.0%) falling below the poverty line. Among the single-parent households, those with 3 or 4 children have the highest poverty rate, with 106 household (39.4%) living below poverty.
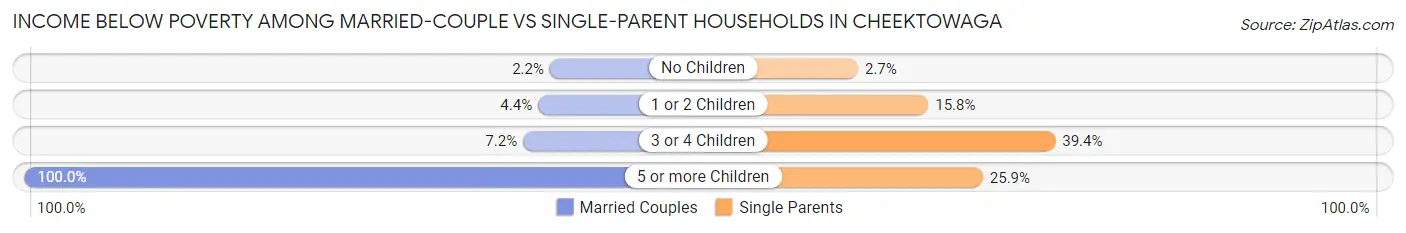
| Children | Married-Couple Families | Single-Parent Households |
| No Children | 179 (2.2%) | 79 (2.7%) |
| 1 or 2 Children | 163 (4.4%) | 380 (15.8%) |
| 3 or 4 Children | 70 (7.2%) | 106 (39.4%) |
| 5 or more Children | 29 (100.0%) | 7 (25.9%) |
| Total | 441 (3.4%) | 572 (10.1%) |
Race in Cheektowaga
The most populous races in Cheektowaga are White / Caucasian (58,949 | 77.1%), Black / African American (10,229 | 13.4%), and Two or more Races (3,732 | 4.9%).
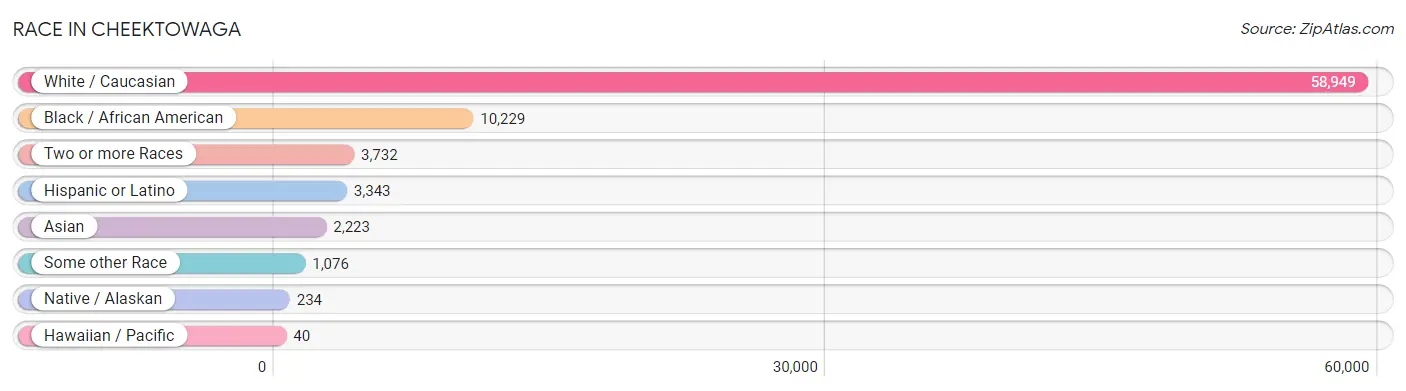
| Race | # Population | % Population |
| Asian | 2,223 | 2.9% |
| Black / African American | 10,229 | 13.4% |
| Hawaiian / Pacific | 40 | 0.1% |
| Hispanic or Latino | 3,343 | 4.4% |
| Native / Alaskan | 234 | 0.3% |
| White / Caucasian | 58,949 | 77.1% |
| Two or more Races | 3,732 | 4.9% |
| Some other Race | 1,076 | 1.4% |
| Total | 76,483 | 100.0% |
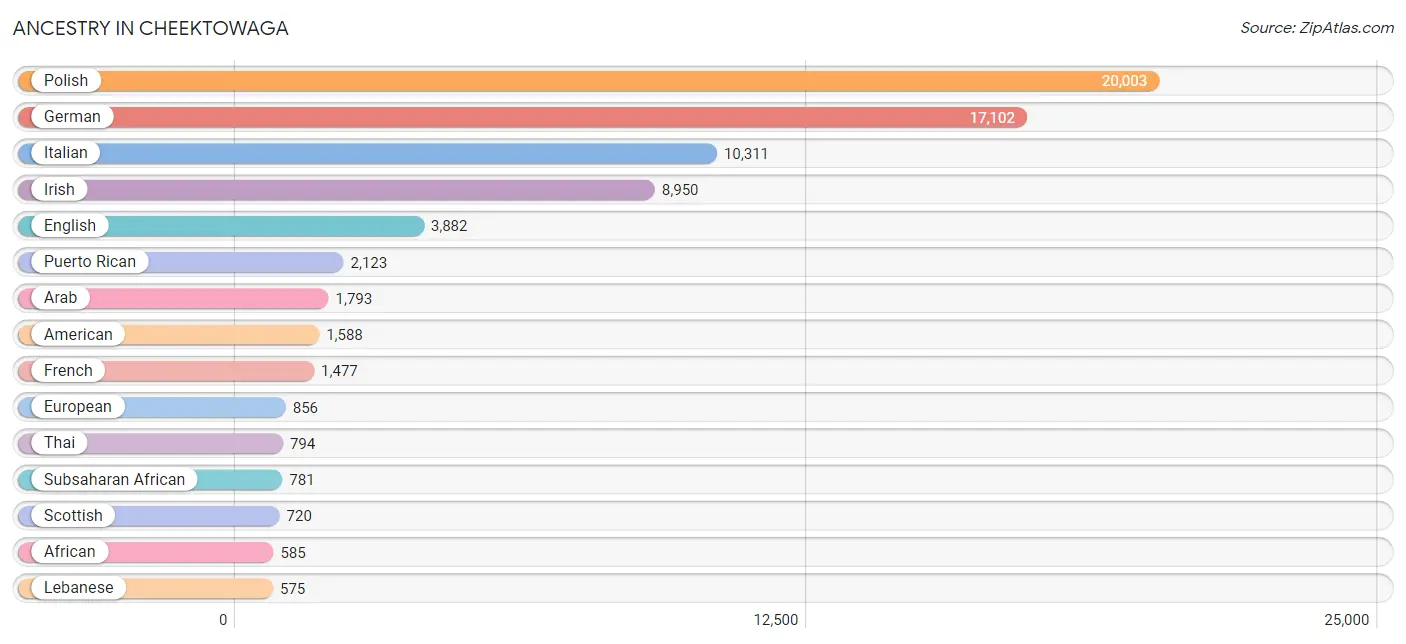
Ancestry in Cheektowaga
The most populous ancestries reported in Cheektowaga are Polish (20,003 | 26.2%), German (17,102 | 22.4%), Italian (10,311 | 13.5%), Irish (8,950 | 11.7%), and English (3,882 | 5.1%), together accounting for 78.8% of all Cheektowaga residents.
| Ancestry | # Population | % Population |
| Afghan | 82 | 0.1% |
| African | 585 | 0.8% |
| American | 1,588 | 2.1% |
| Arab | 1,793 | 2.3% |
| Armenian | 43 | 0.1% |
| Australian | 7 | 0.0% |
| Austrian | 213 | 0.3% |
| Barbadian | 12 | 0.0% |
| Belgian | 16 | 0.0% |
| Bhutanese | 79 | 0.1% |
| Brazilian | 13 | 0.0% |
| British | 152 | 0.2% |
| British West Indian | 12 | 0.0% |
| Bulgarian | 47 | 0.1% |
| Burmese | 68 | 0.1% |
| Canadian | 121 | 0.2% |
| Central American | 288 | 0.4% |
| Central American Indian | 6 | 0.0% |
| Cherokee | 244 | 0.3% |
| Colombian | 39 | 0.1% |
| Costa Rican | 16 | 0.0% |
| Croatian | 129 | 0.2% |
| Cuban | 51 | 0.1% |
| Czech | 85 | 0.1% |
| Czechoslovakian | 123 | 0.2% |
| Danish | 8 | 0.0% |
| Delaware | 48 | 0.1% |
| Dominican | 316 | 0.4% |
| Dutch | 568 | 0.7% |
| Eastern European | 199 | 0.3% |
| Egyptian | 115 | 0.2% |
| English | 3,882 | 5.1% |
| Estonian | 9 | 0.0% |
| Ethiopian | 36 | 0.1% |
| European | 856 | 1.1% |
| Filipino | 28 | 0.0% |
| Finnish | 48 | 0.1% |
| French | 1,477 | 1.9% |
| French Canadian | 452 | 0.6% |
| German | 17,102 | 22.4% |
| German Russian | 48 | 0.1% |
| Ghanaian | 7 | 0.0% |
| Greek | 426 | 0.6% |
| Guamanian / Chamorro | 4 | 0.0% |
| Guatemalan | 18 | 0.0% |
| Haitian | 107 | 0.1% |
| Hungarian | 401 | 0.5% |
| Indian (Asian) | 148 | 0.2% |
| Indonesian | 219 | 0.3% |
| Iranian | 5 | 0.0% |
| Iraqi | 194 | 0.3% |
| Irish | 8,950 | 11.7% |
| Iroquois | 254 | 0.3% |
| Italian | 10,311 | 13.5% |
| Jamaican | 176 | 0.2% |
| Jordanian | 42 | 0.1% |
| Kenyan | 1 | 0.0% |
| Korean | 94 | 0.1% |
| Laotian | 91 | 0.1% |
| Latvian | 19 | 0.0% |
| Lebanese | 575 | 0.7% |
| Lithuanian | 85 | 0.1% |
| Malaysian | 24 | 0.0% |
| Mexican | 297 | 0.4% |
| Native Hawaiian | 36 | 0.1% |
| Nigerian | 25 | 0.0% |
| Northern European | 5 | 0.0% |
| Norwegian | 110 | 0.1% |
| Panamanian | 8 | 0.0% |
| Pennsylvania German | 15 | 0.0% |
| Peruvian | 8 | 0.0% |
| Polish | 20,003 | 26.2% |
| Portuguese | 32 | 0.0% |
| Puerto Rican | 2,123 | 2.8% |
| Romanian | 227 | 0.3% |
| Russian | 400 | 0.5% |
| Salvadoran | 228 | 0.3% |
| Scandinavian | 49 | 0.1% |
| Scotch-Irish | 250 | 0.3% |
| Scottish | 720 | 0.9% |
| Serbian | 67 | 0.1% |
| Slavic | 35 | 0.1% |
| Slovak | 50 | 0.1% |
| Slovene | 11 | 0.0% |
| South African | 29 | 0.0% |
| South American | 47 | 0.1% |
| Spaniard | 73 | 0.1% |
| Spanish | 78 | 0.1% |
| Sri Lankan | 161 | 0.2% |
| Subsaharan African | 781 | 1.0% |
| Swedish | 274 | 0.4% |
| Swiss | 89 | 0.1% |
| Syrian | 50 | 0.1% |
| Thai | 794 | 1.0% |
| Turkish | 62 | 0.1% |
| Ukrainian | 280 | 0.4% |
| Vietnamese | 387 | 0.5% |
| Welsh | 289 | 0.4% |
| West Indian | 74 | 0.1% | View All 99 Rows |
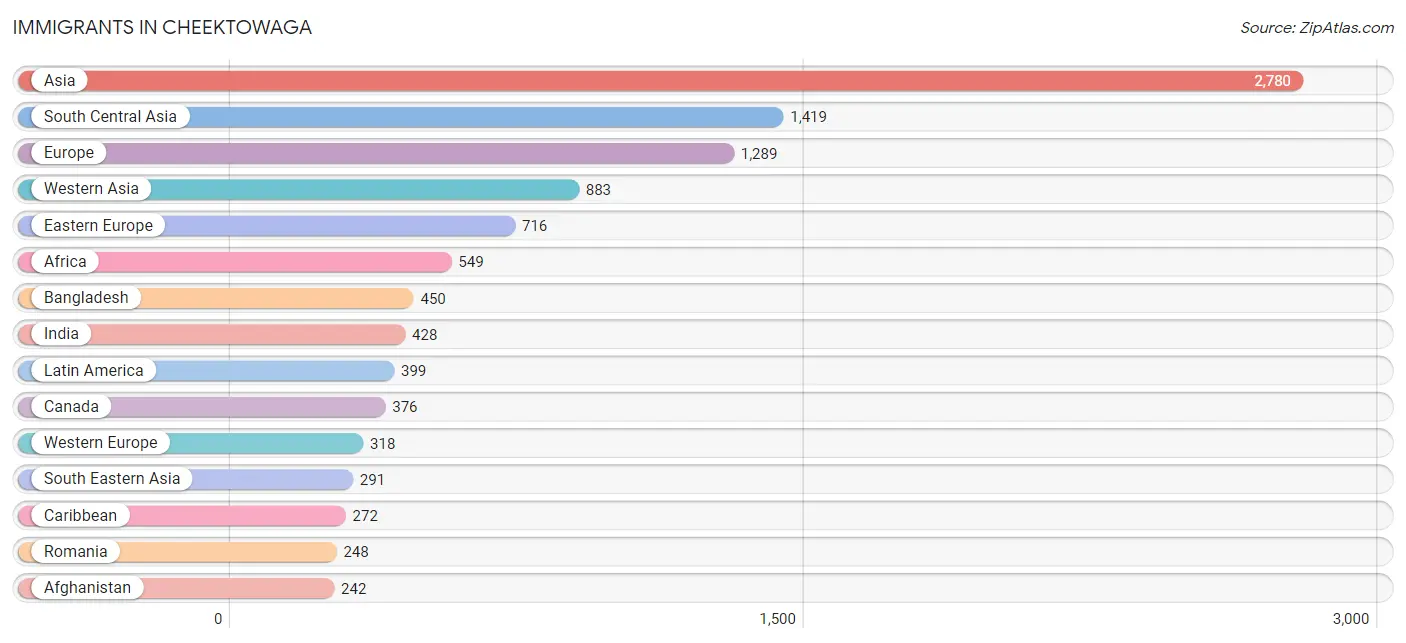
Immigrants in Cheektowaga
The most numerous immigrant groups reported in Cheektowaga came from Asia (2,780 | 3.6%), South Central Asia (1,419 | 1.9%), Europe (1,289 | 1.7%), Western Asia (883 | 1.1%), and Eastern Europe (716 | 0.9%), together accounting for 9.3% of all Cheektowaga residents.
| Immigration Origin | # Population | % Population |
| Afghanistan | 242 | 0.3% |
| Africa | 549 | 0.7% |
| Asia | 2,780 | 3.6% |
| Austria | 96 | 0.1% |
| Bangladesh | 450 | 0.6% |
| Barbados | 12 | 0.0% |
| Brazil | 19 | 0.0% |
| Bulgaria | 64 | 0.1% |
| Canada | 376 | 0.5% |
| Caribbean | 272 | 0.4% |
| Central America | 57 | 0.1% |
| China | 163 | 0.2% |
| Colombia | 22 | 0.0% |
| Congo | 13 | 0.0% |
| Croatia | 11 | 0.0% |
| Cuba | 71 | 0.1% |
| Dominican Republic | 82 | 0.1% |
| Eastern Africa | 219 | 0.3% |
| Eastern Asia | 187 | 0.2% |
| Eastern Europe | 716 | 0.9% |
| Egypt | 34 | 0.0% |
| El Salvador | 14 | 0.0% |
| England | 41 | 0.1% |
| Eritrea | 36 | 0.1% |
| Ethiopia | 12 | 0.0% |
| Europe | 1,289 | 1.7% |
| Germany | 203 | 0.3% |
| Ghana | 134 | 0.2% |
| Guatemala | 6 | 0.0% |
| Guyana | 29 | 0.0% |
| Haiti | 9 | 0.0% |
| Hong Kong | 26 | 0.0% |
| Hungary | 45 | 0.1% |
| India | 428 | 0.6% |
| Iran | 5 | 0.0% |
| Iraq | 201 | 0.3% |
| Ireland | 37 | 0.1% |
| Israel | 60 | 0.1% |
| Italy | 118 | 0.2% |
| Jamaica | 30 | 0.0% |
| Japan | 7 | 0.0% |
| Jordan | 27 | 0.0% |
| Kenya | 1 | 0.0% |
| Korea | 17 | 0.0% |
| Kuwait | 13 | 0.0% |
| Latin America | 399 | 0.5% |
| Lebanon | 194 | 0.3% |
| Malaysia | 15 | 0.0% |
| Mexico | 37 | 0.1% |
| Middle Africa | 90 | 0.1% |
| Morocco | 5 | 0.0% |
| Nepal | 17 | 0.0% |
| Netherlands | 6 | 0.0% |
| Nigeria | 16 | 0.0% |
| Northern Africa | 59 | 0.1% |
| Northern Europe | 137 | 0.2% |
| Pakistan | 90 | 0.1% |
| Philippines | 26 | 0.0% |
| Poland | 237 | 0.3% |
| Romania | 248 | 0.3% |
| Russia | 40 | 0.1% |
| Saudi Arabia | 83 | 0.1% |
| Serbia | 37 | 0.1% |
| South Africa | 21 | 0.0% |
| South America | 70 | 0.1% |
| South Central Asia | 1,419 | 1.9% |
| South Eastern Asia | 291 | 0.4% |
| Southern Europe | 118 | 0.2% |
| Sri Lanka | 34 | 0.0% |
| Switzerland | 13 | 0.0% |
| Syria | 35 | 0.1% |
| Taiwan | 17 | 0.0% |
| Trinidad and Tobago | 43 | 0.1% |
| Turkey | 25 | 0.0% |
| Ukraine | 30 | 0.0% |
| Vietnam | 128 | 0.2% |
| West Indies | 25 | 0.0% |
| Western Africa | 160 | 0.2% |
| Western Asia | 883 | 1.1% |
| Western Europe | 318 | 0.4% |
| Yemen | 234 | 0.3% |
| Zaire | 71 | 0.1% | View All 82 Rows |
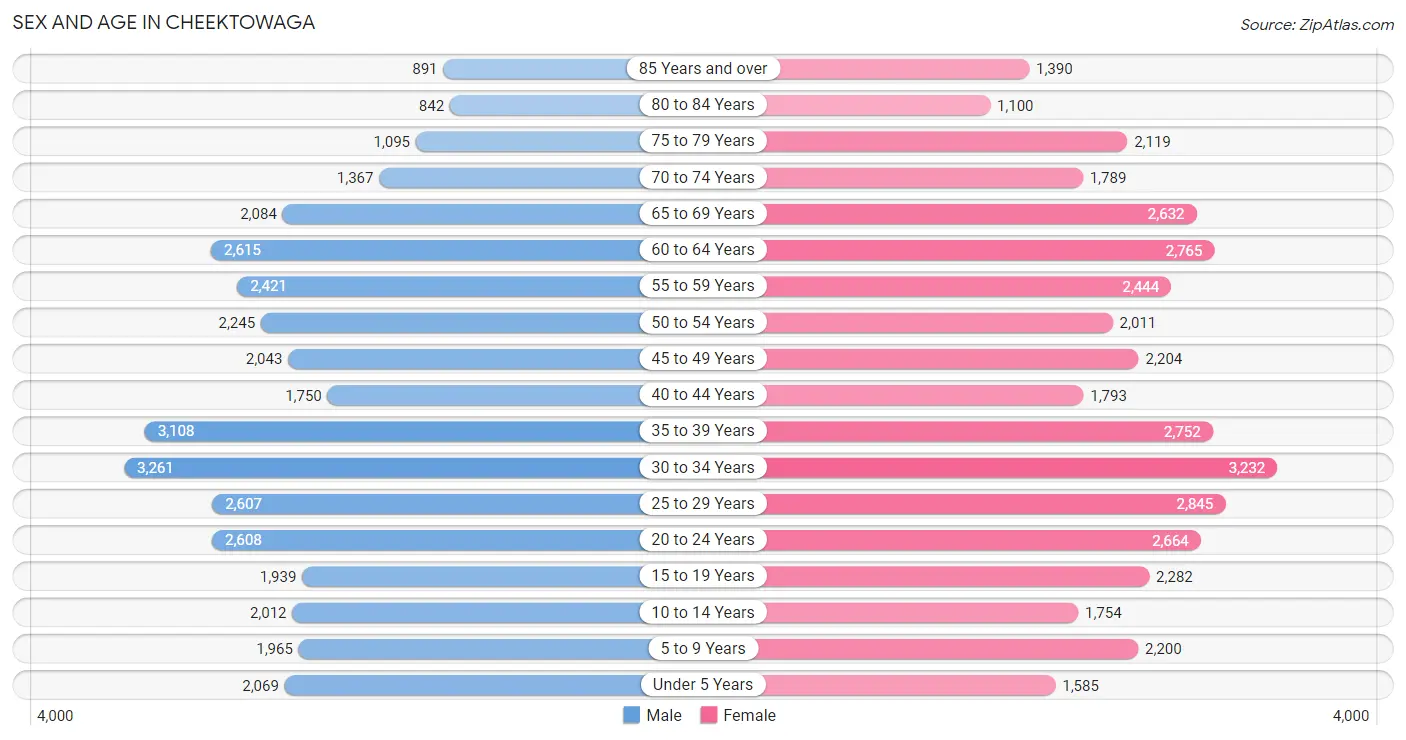
Sex and Age in Cheektowaga
Sex and Age in Cheektowaga
The most populous age groups in Cheektowaga are 30 to 34 Years (3,261 | 8.8%) for men and 30 to 34 Years (3,232 | 8.2%) for women.
| Age Bracket | Male | Female |
| Under 5 Years | 2,069 (5.6%) | 1,585 (4.0%) |
| 5 to 9 Years | 1,965 (5.3%) | 2,200 (5.6%) |
| 10 to 14 Years | 2,012 (5.4%) | 1,754 (4.4%) |
| 15 to 19 Years | 1,939 (5.2%) | 2,282 (5.8%) |
| 20 to 24 Years | 2,608 (7.1%) | 2,664 (6.7%) |
| 25 to 29 Years | 2,607 (7.1%) | 2,845 (7.2%) |
| 30 to 34 Years | 3,261 (8.8%) | 3,232 (8.2%) |
| 35 to 39 Years | 3,108 (8.4%) | 2,752 (7.0%) |
| 40 to 44 Years | 1,750 (4.7%) | 1,793 (4.5%) |
| 45 to 49 Years | 2,043 (5.5%) | 2,204 (5.6%) |
| 50 to 54 Years | 2,245 (6.1%) | 2,011 (5.1%) |
| 55 to 59 Years | 2,421 (6.6%) | 2,444 (6.2%) |
| 60 to 64 Years | 2,615 (7.1%) | 2,765 (7.0%) |
| 65 to 69 Years | 2,084 (5.6%) | 2,632 (6.7%) |
| 70 to 74 Years | 1,367 (3.7%) | 1,789 (4.5%) |
| 75 to 79 Years | 1,095 (3.0%) | 2,119 (5.4%) |
| 80 to 84 Years | 842 (2.3%) | 1,100 (2.8%) |
| 85 Years and over | 891 (2.4%) | 1,390 (3.5%) |
| Total | 36,922 (100.0%) | 39,561 (100.0%) |
Families and Households in Cheektowaga
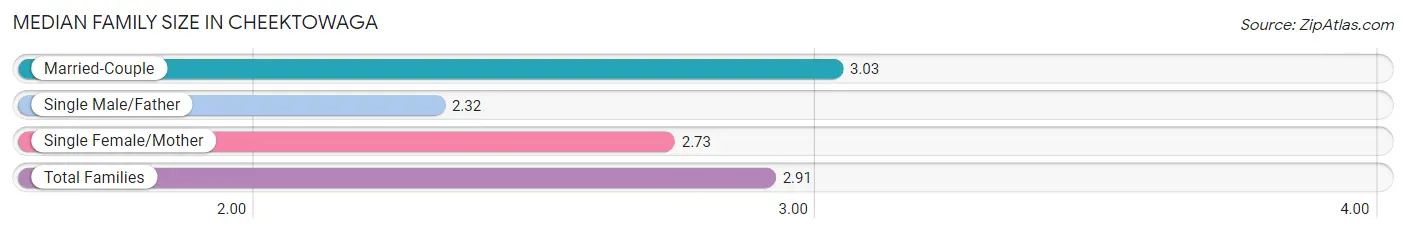
Median Family Size in Cheektowaga
The median family size in Cheektowaga is 2.91 persons per family, with married-couple families (12,985 | 69.6%) accounting for the largest median family size of 3.03 persons per family. On the other hand, single male/father families (1,588 | 8.5%) represent the smallest median family size with 2.32 persons per family.
| Family Type | # Families | Family Size |
| Married-Couple | 12,985 (69.6%) | 3.03 |
| Single Male/Father | 1,588 (8.5%) | 2.32 |
| Single Female/Mother | 4,072 (21.8%) | 2.73 |
| Total Families | 18,645 (100.0%) | 2.91 |
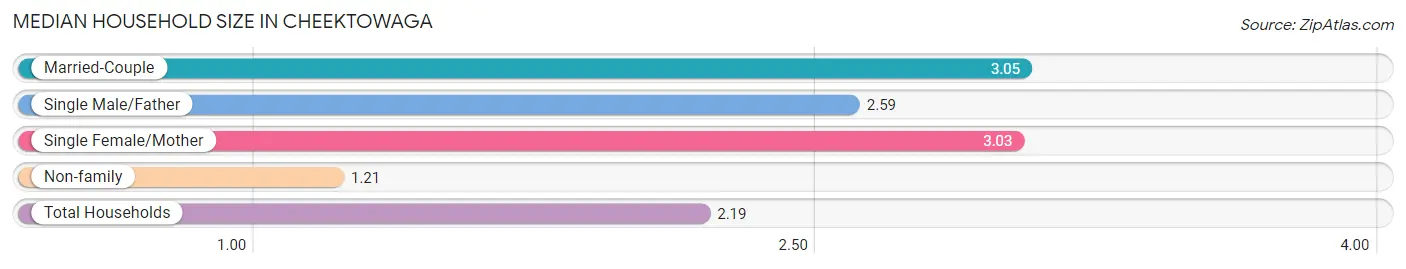
Median Household Size in Cheektowaga
The median household size in Cheektowaga is 2.19 persons per household, with married-couple households (12,985 | 38.1%) accounting for the largest median household size of 3.05 persons per household. non-family households (15,420 | 45.3%) represent the smallest median household size with 1.21 persons per household.
| Household Type | # Households | Household Size |
| Married-Couple | 12,985 (38.1%) | 3.05 |
| Single Male/Father | 1,588 (4.7%) | 2.59 |
| Single Female/Mother | 4,072 (11.9%) | 3.03 |
| Non-family | 15,420 (45.3%) | 1.21 |
| Total Households | 34,065 (100.0%) | 2.19 |
Household Size by Marriage Status in Cheektowaga
Out of a total of 34,065 households in Cheektowaga, 18,645 (54.7%) are family households, while 15,420 (45.3%) are nonfamily households. The most numerous type of family households are 2-person households, comprising 9,171, and the most common type of nonfamily households are 1-person households, comprising 12,365.
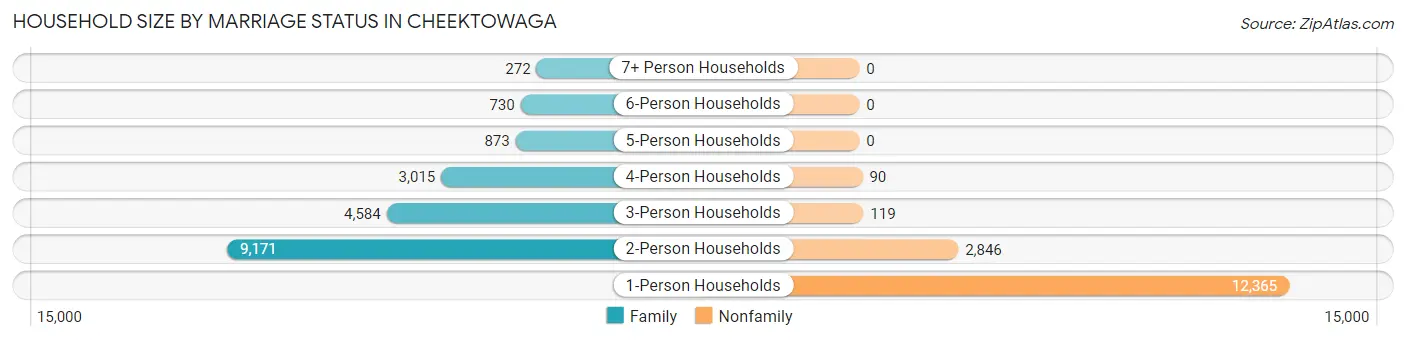
| Household Size | Family Households | Nonfamily Households |
| 1-Person Households | - | 12,365 (36.3%) |
| 2-Person Households | 9,171 (26.9%) | 2,846 (8.4%) |
| 3-Person Households | 4,584 (13.5%) | 119 (0.4%) |
| 4-Person Households | 3,015 (8.8%) | 90 (0.3%) |
| 5-Person Households | 873 (2.6%) | 0 (0.0%) |
| 6-Person Households | 730 (2.1%) | 0 (0.0%) |
| 7+ Person Households | 272 (0.8%) | 0 (0.0%) |
| Total | 18,645 (54.7%) | 15,420 (45.3%) |
Female Fertility in Cheektowaga
Fertility by Age in Cheektowaga
Average fertility rate in Cheektowaga is 46.0 births per 1,000 women. Women in the age bracket of 20 to 34 years have the highest fertility rate with 64.0 births per 1,000 women. Women in the age bracket of 20 to 34 years acount for 67.1% of all women with births.
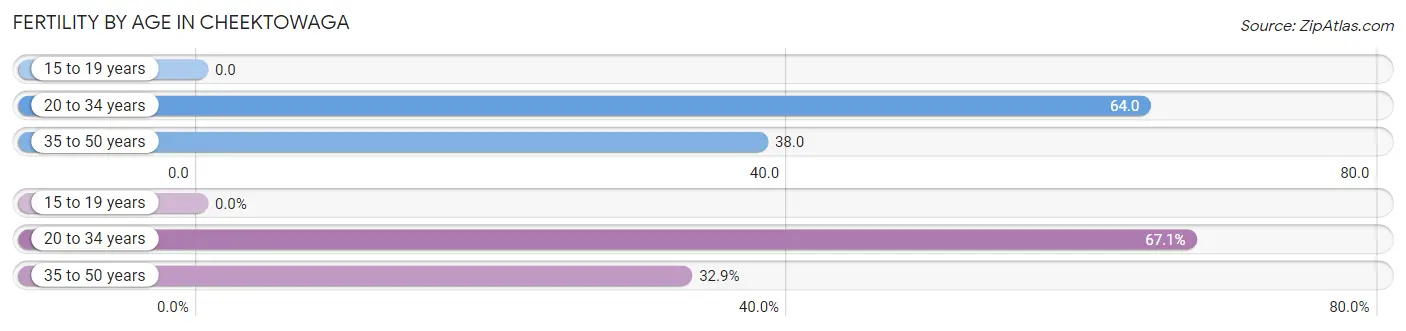
| Age Bracket | Women with Births | Births / 1,000 Women |
| 15 to 19 years | 0 (0.0%) | 0.0 |
| 20 to 34 years | 562 (67.1%) | 64.0 |
| 35 to 50 years | 275 (32.9%) | 38.0 |
| Total | 837 (100.0%) | 46.0 |
Fertility by Age by Marriage Status in Cheektowaga
86.7% of women with births (837) in Cheektowaga are married. The highest percentage of unmarried women with births falls into 20 to 34 years age bracket with 14.2% of them unmarried at the time of birth, while the lowest percentage of unmarried women with births belong to 35 to 50 years age bracket with 11.3% of them unmarried.
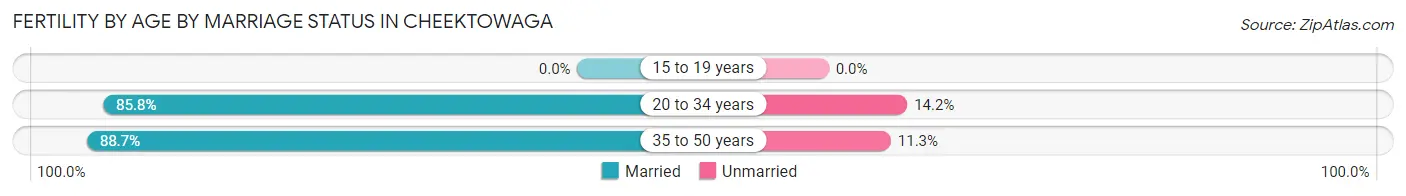
| Age Bracket | Married | Unmarried |
| 15 to 19 years | 0 (0.0%) | 0 (0.0%) |
| 20 to 34 years | 482 (85.8%) | 80 (14.2%) |
| 35 to 50 years | 244 (88.7%) | 31 (11.3%) |
| Total | 726 (86.7%) | 111 (13.3%) |
Fertility by Education in Cheektowaga
Average fertility rate in Cheektowaga is 46.0 births per 1,000 women. Women with the education attainment of bachelor's degree have the highest fertility rate of 68.0 births per 1,000 women, while women with the education attainment of high school diploma have the lowest fertility at 25.0 births per 1,000 women. Women with the education attainment of bachelor's degree represent 30.5% of all women with births.
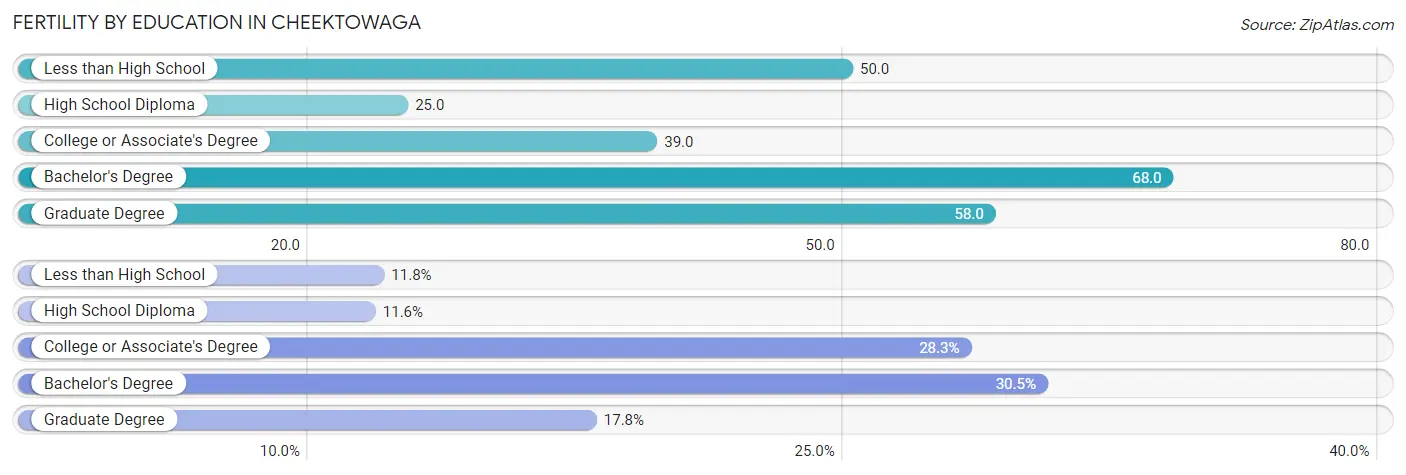
| Educational Attainment | Women with Births | Births / 1,000 Women |
| Less than High School | 99 (11.8%) | 50.0 |
| High School Diploma | 97 (11.6%) | 25.0 |
| College or Associate's Degree | 237 (28.3%) | 39.0 |
| Bachelor's Degree | 255 (30.5%) | 68.0 |
| Graduate Degree | 149 (17.8%) | 58.0 |
| Total | 837 (100.0%) | 46.0 |
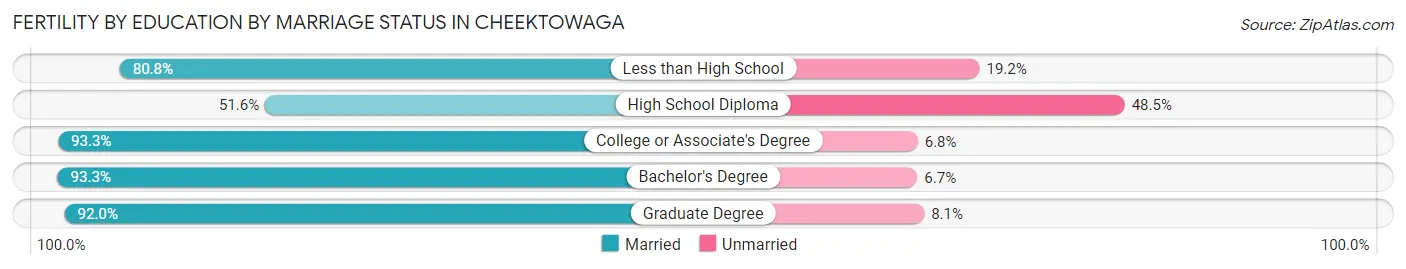
Fertility by Education by Marriage Status in Cheektowaga
13.3% of women with births in Cheektowaga are unmarried. Women with the educational attainment of bachelor's degree are most likely to be married with 93.3% of them married at childbirth, while women with the educational attainment of high school diploma are least likely to be married with 48.4% of them unmarried at childbirth.
| Educational Attainment | Married | Unmarried |
| Less than High School | 80 (80.8%) | 19 (19.2%) |
| High School Diploma | 50 (51.5%) | 47 (48.4%) |
| College or Associate's Degree | 221 (93.2%) | 16 (6.8%) |
| Bachelor's Degree | 238 (93.3%) | 17 (6.7%) |
| Graduate Degree | 137 (91.9%) | 12 (8.1%) |
| Total | 726 (86.7%) | 111 (13.3%) |
Employment Characteristics in Cheektowaga
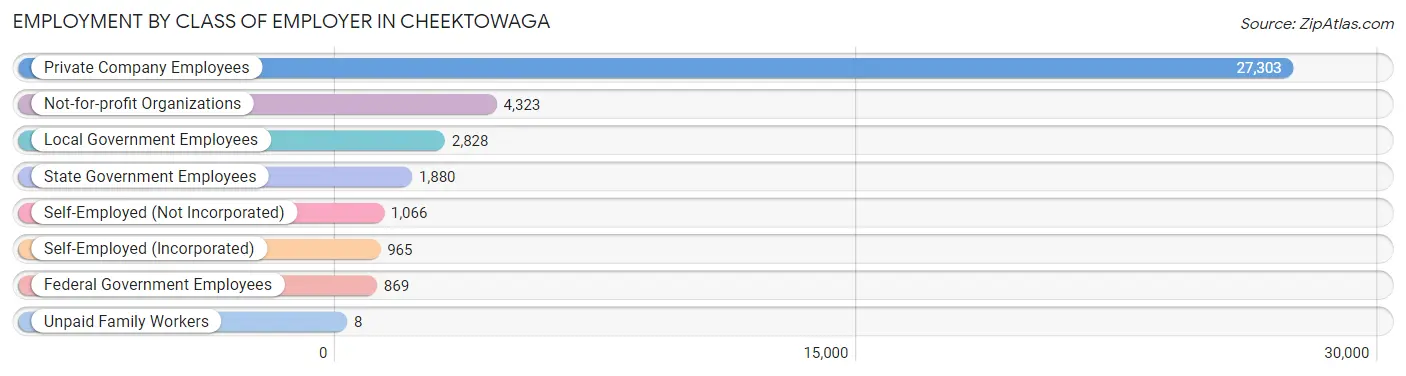
Employment by Class of Employer in Cheektowaga
Among the 39,242 employed individuals in Cheektowaga, private company employees (27,303 | 69.6%), not-for-profit organizations (4,323 | 11.0%), and local government employees (2,828 | 7.2%) make up the most common classes of employment.
| Employer Class | # Employees | % Employees |
| Private Company Employees | 27,303 | 69.6% |
| Self-Employed (Incorporated) | 965 | 2.5% |
| Self-Employed (Not Incorporated) | 1,066 | 2.7% |
| Not-for-profit Organizations | 4,323 | 11.0% |
| Local Government Employees | 2,828 | 7.2% |
| State Government Employees | 1,880 | 4.8% |
| Federal Government Employees | 869 | 2.2% |
| Unpaid Family Workers | 8 | 0.0% |
| Total | 39,242 | 100.0% |
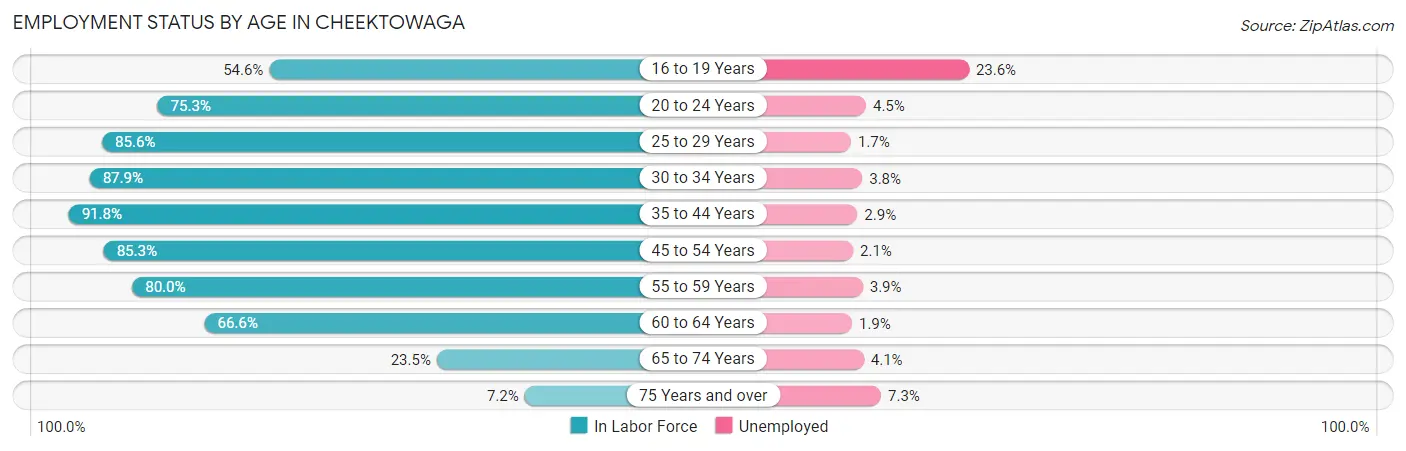
Employment Status by Age in Cheektowaga
According to the labor force statistics for Cheektowaga, out of the total population over 16 years of age (63,985), 65.5% or 41,910 individuals are in the labor force, with 3.9% or 1,634 of them unemployed. The age group with the highest labor force participation rate is 35 to 44 years, with 91.8% or 8,632 individuals in the labor force. Within the labor force, the 16 to 19 years age range has the highest percentage of unemployed individuals, with 23.6% or 426 of them being unemployed.
| Age Bracket | In Labor Force | Unemployed |
| 16 to 19 Years | 1,806 (54.6%) | 426 (23.6%) |
| 20 to 24 Years | 3,970 (75.3%) | 179 (4.5%) |
| 25 to 29 Years | 4,667 (85.6%) | 79 (1.7%) |
| 30 to 34 Years | 5,707 (87.9%) | 217 (3.8%) |
| 35 to 44 Years | 8,632 (91.8%) | 250 (2.9%) |
| 45 to 54 Years | 7,253 (85.3%) | 152 (2.1%) |
| 55 to 59 Years | 3,892 (80.0%) | 152 (3.9%) |
| 60 to 64 Years | 3,583 (66.6%) | 68 (1.9%) |
| 65 to 74 Years | 1,850 (23.5%) | 76 (4.1%) |
| 75 Years and over | 535 (7.2%) | 39 (7.3%) |
| Total | 41,910 (65.5%) | 1,634 (3.9%) |
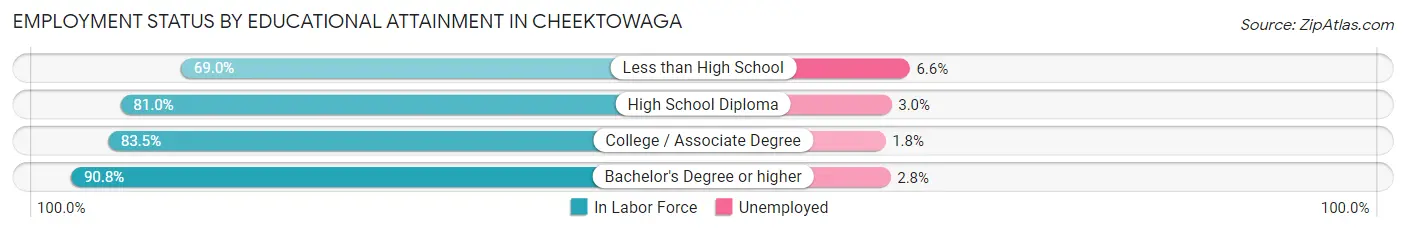
Employment Status by Educational Attainment in Cheektowaga
According to labor force statistics for Cheektowaga, 84.1% of individuals (33,721) out of the total population between 25 and 64 years of age (40,096) are in the labor force, with 2.7% or 910 of them being unemployed. The group with the highest labor force participation rate are those with the educational attainment of bachelor's degree or higher, with 90.8% or 11,365 individuals in the labor force. Within the labor force, individuals with less than high school education have the highest percentage of unemployment, with 6.6% or 112 of them being unemployed.
| Educational Attainment | In Labor Force | Unemployed |
| Less than High School | 1,696 (69.0%) | 162 (6.6%) |
| High School Diploma | 9,338 (81.0%) | 346 (3.0%) |
| College / Associate Degree | 11,350 (83.5%) | 245 (1.8%) |
| Bachelor's Degree or higher | 11,365 (90.8%) | 350 (2.8%) |
| Total | 33,721 (84.1%) | 1,083 (2.7%) |
Employment Occupations by Sex in Cheektowaga
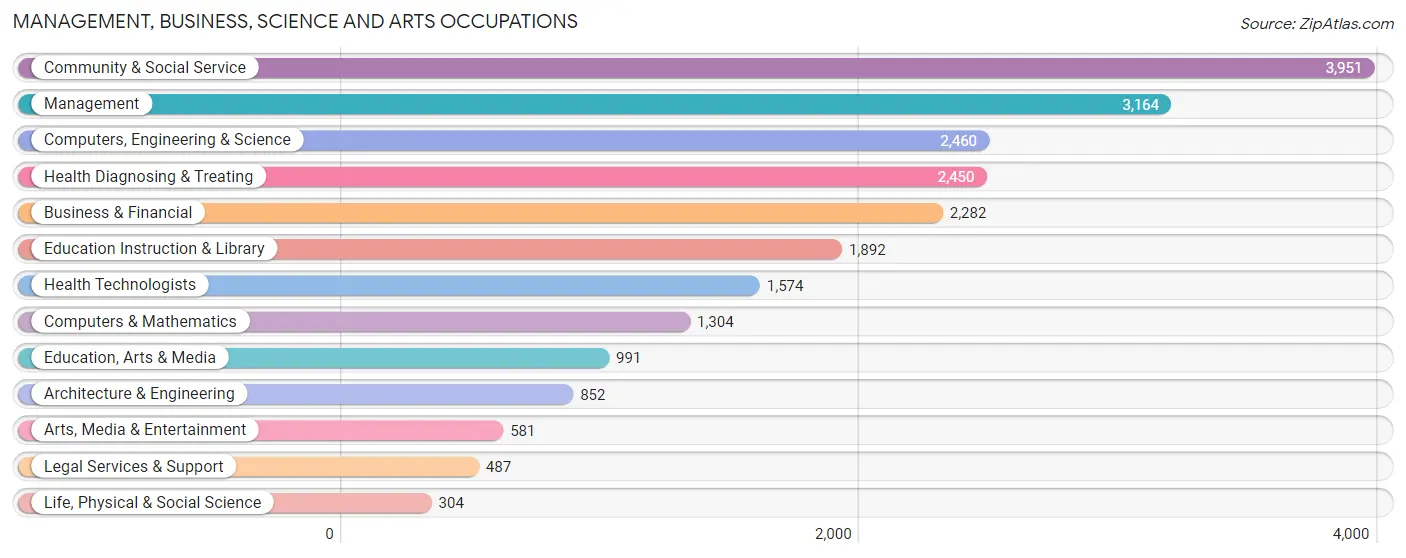
Management, Business, Science and Arts Occupations
The most common Management, Business, Science and Arts occupations in Cheektowaga are Community & Social Service (3,951 | 9.8%), Management (3,164 | 7.9%), Computers, Engineering & Science (2,460 | 6.1%), Health Diagnosing & Treating (2,450 | 6.1%), and Business & Financial (2,282 | 5.7%).
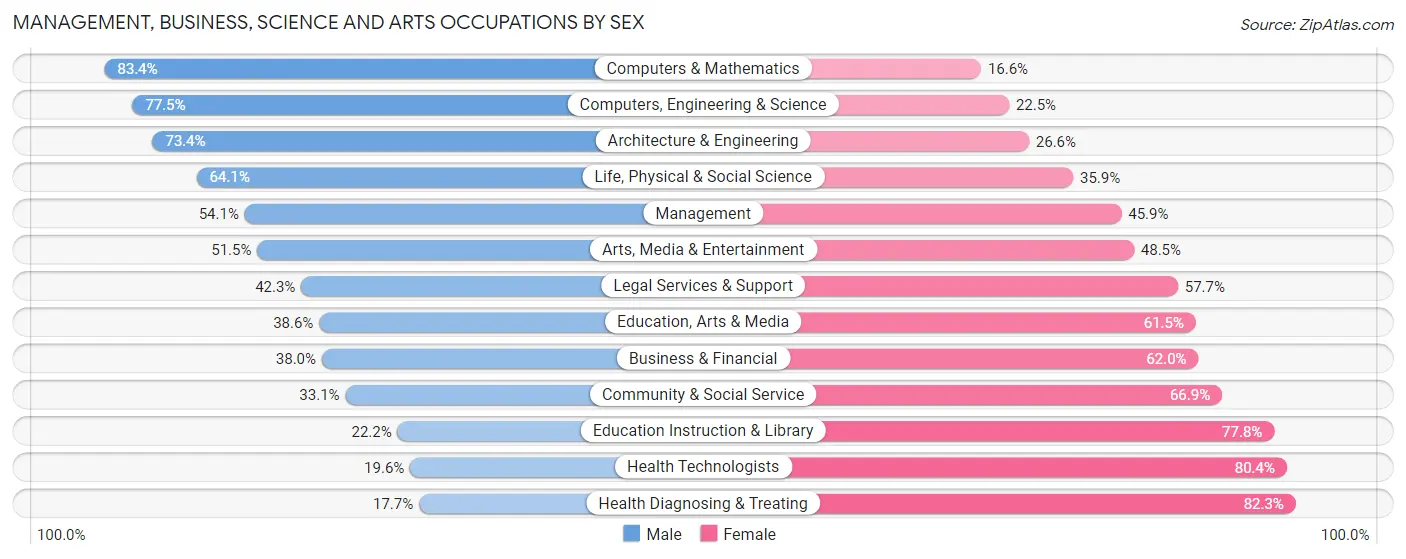
Management, Business, Science and Arts Occupations by Sex
Within the Management, Business, Science and Arts occupations in Cheektowaga, the most male-oriented occupations are Computers & Mathematics (83.4%), Computers, Engineering & Science (77.5%), and Architecture & Engineering (73.4%), while the most female-oriented occupations are Health Diagnosing & Treating (82.3%), Health Technologists (80.4%), and Education Instruction & Library (77.8%).
| Occupation | Male | Female |
| Management | 1,711 (54.1%) | 1,453 (45.9%) |
| Business & Financial | 867 (38.0%) | 1,415 (62.0%) |
| Computers, Engineering & Science | 1,907 (77.5%) | 553 (22.5%) |
| Computers & Mathematics | 1,087 (83.4%) | 217 (16.6%) |
| Architecture & Engineering | 625 (73.4%) | 227 (26.6%) |
| Life, Physical & Social Science | 195 (64.1%) | 109 (35.9%) |
| Community & Social Service | 1,307 (33.1%) | 2,644 (66.9%) |
| Education, Arts & Media | 382 (38.6%) | 609 (61.5%) |
| Legal Services & Support | 206 (42.3%) | 281 (57.7%) |
| Education Instruction & Library | 420 (22.2%) | 1,472 (77.8%) |
| Arts, Media & Entertainment | 299 (51.5%) | 282 (48.5%) |
| Health Diagnosing & Treating | 434 (17.7%) | 2,016 (82.3%) |
| Health Technologists | 308 (19.6%) | 1,266 (80.4%) |
| Total (Category) | 6,226 (43.5%) | 8,081 (56.5%) |
| Total (Overall) | 20,270 (50.4%) | 19,947 (49.6%) |
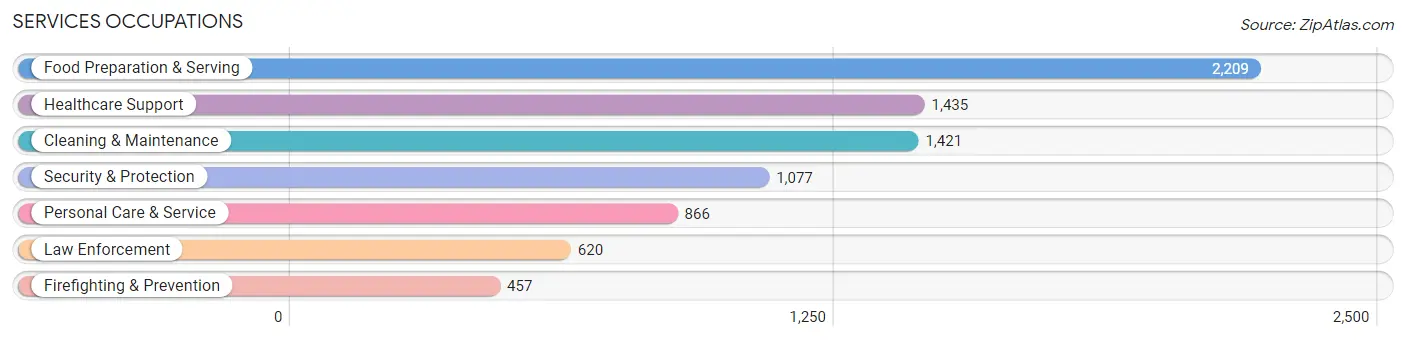
Services Occupations
The most common Services occupations in Cheektowaga are Food Preparation & Serving (2,209 | 5.5%), Healthcare Support (1,435 | 3.6%), Cleaning & Maintenance (1,421 | 3.5%), Security & Protection (1,077 | 2.7%), and Personal Care & Service (866 | 2.1%).
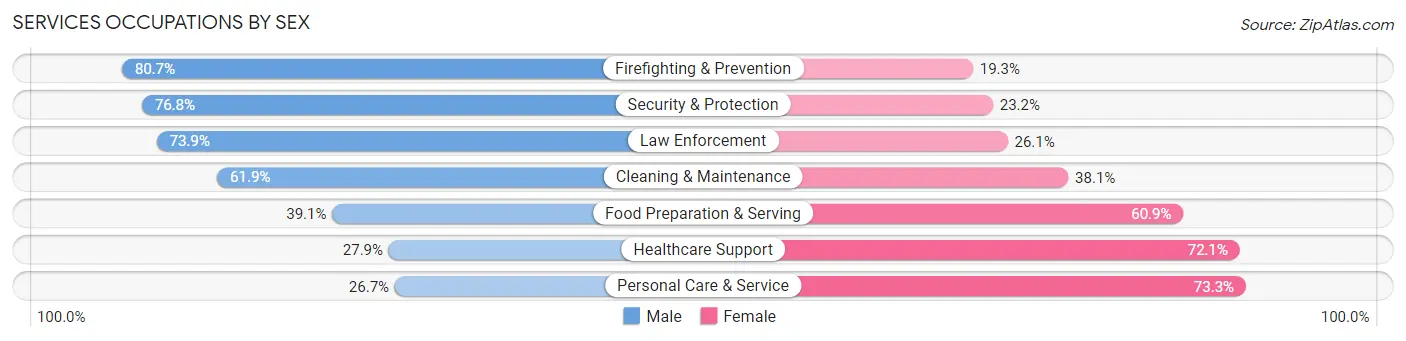
Services Occupations by Sex
Within the Services occupations in Cheektowaga, the most male-oriented occupations are Firefighting & Prevention (80.7%), Security & Protection (76.8%), and Law Enforcement (73.9%), while the most female-oriented occupations are Personal Care & Service (73.3%), Healthcare Support (72.1%), and Food Preparation & Serving (60.9%).
| Occupation | Male | Female |
| Healthcare Support | 400 (27.9%) | 1,035 (72.1%) |
| Security & Protection | 827 (76.8%) | 250 (23.2%) |
| Firefighting & Prevention | 369 (80.7%) | 88 (19.3%) |
| Law Enforcement | 458 (73.9%) | 162 (26.1%) |
| Food Preparation & Serving | 863 (39.1%) | 1,346 (60.9%) |
| Cleaning & Maintenance | 879 (61.9%) | 542 (38.1%) |
| Personal Care & Service | 231 (26.7%) | 635 (73.3%) |
| Total (Category) | 3,200 (45.7%) | 3,808 (54.3%) |
| Total (Overall) | 20,270 (50.4%) | 19,947 (49.6%) |
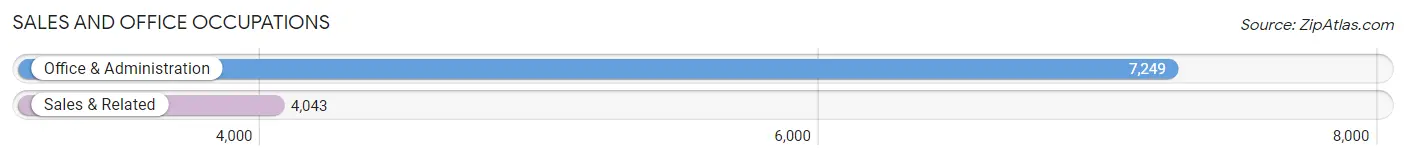
Sales and Office Occupations
The most common Sales and Office occupations in Cheektowaga are Office & Administration (7,249 | 18.0%), and Sales & Related (4,043 | 10.1%).
Sales and Office Occupations by Sex
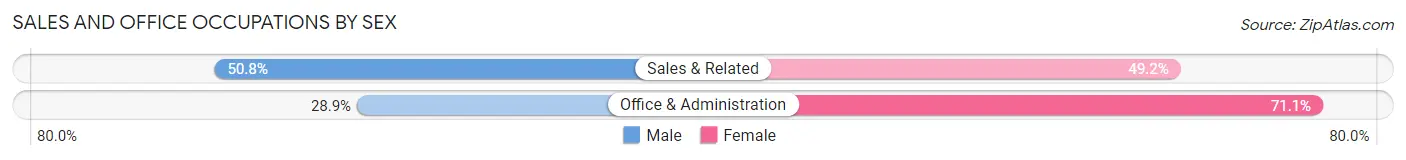
| Occupation | Male | Female |
| Sales & Related | 2,053 (50.8%) | 1,990 (49.2%) |
| Office & Administration | 2,093 (28.9%) | 5,156 (71.1%) |
| Total (Category) | 4,146 (36.7%) | 7,146 (63.3%) |
| Total (Overall) | 20,270 (50.4%) | 19,947 (49.6%) |
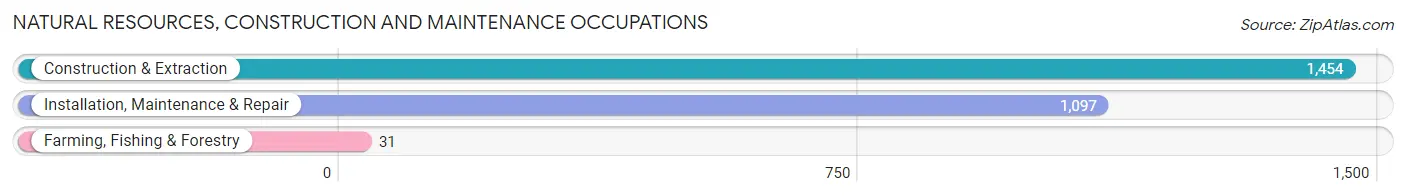
Natural Resources, Construction and Maintenance Occupations
The most common Natural Resources, Construction and Maintenance occupations in Cheektowaga are Construction & Extraction (1,454 | 3.6%), Installation, Maintenance & Repair (1,097 | 2.7%), and Farming, Fishing & Forestry (31 | 0.1%).
Natural Resources, Construction and Maintenance Occupations by Sex
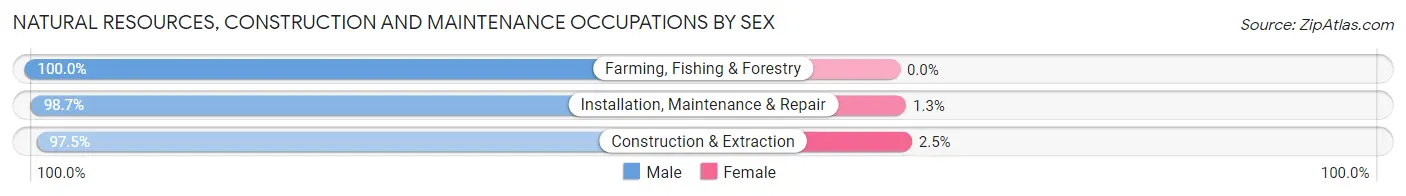
| Occupation | Male | Female |
| Farming, Fishing & Forestry | 31 (100.0%) | 0 (0.0%) |
| Construction & Extraction | 1,418 (97.5%) | 36 (2.5%) |
| Installation, Maintenance & Repair | 1,083 (98.7%) | 14 (1.3%) |
| Total (Category) | 2,532 (98.1%) | 50 (1.9%) |
| Total (Overall) | 20,270 (50.4%) | 19,947 (49.6%) |
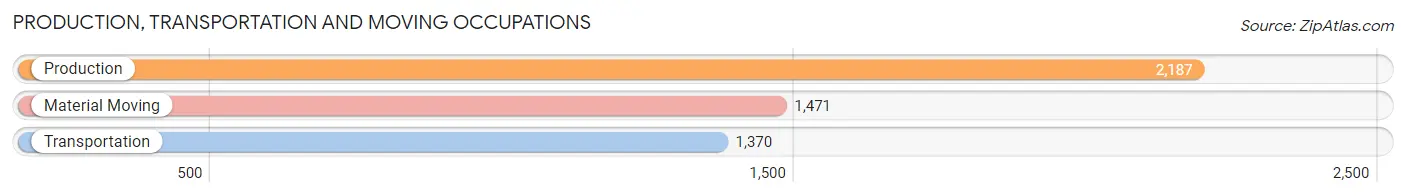
Production, Transportation and Moving Occupations
The most common Production, Transportation and Moving occupations in Cheektowaga are Production (2,187 | 5.4%), Material Moving (1,471 | 3.7%), and Transportation (1,370 | 3.4%).
Production, Transportation and Moving Occupations by Sex
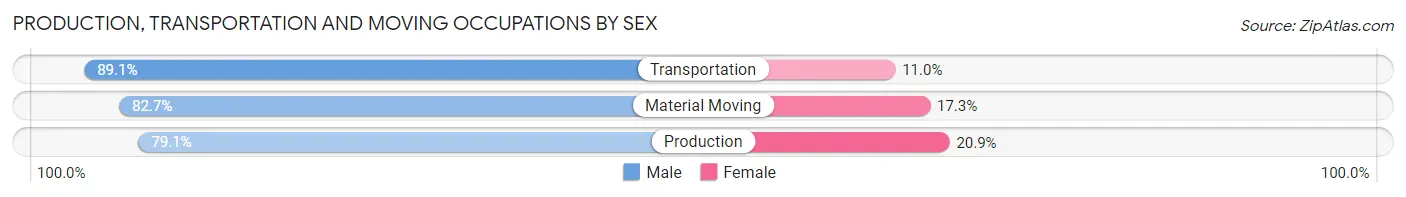
| Occupation | Male | Female |
| Production | 1,730 (79.1%) | 457 (20.9%) |
| Transportation | 1,220 (89.0%) | 150 (11.0%) |
| Material Moving | 1,216 (82.7%) | 255 (17.3%) |
| Total (Category) | 4,166 (82.9%) | 862 (17.1%) |
| Total (Overall) | 20,270 (50.4%) | 19,947 (49.6%) |
Employment Industries by Sex in Cheektowaga
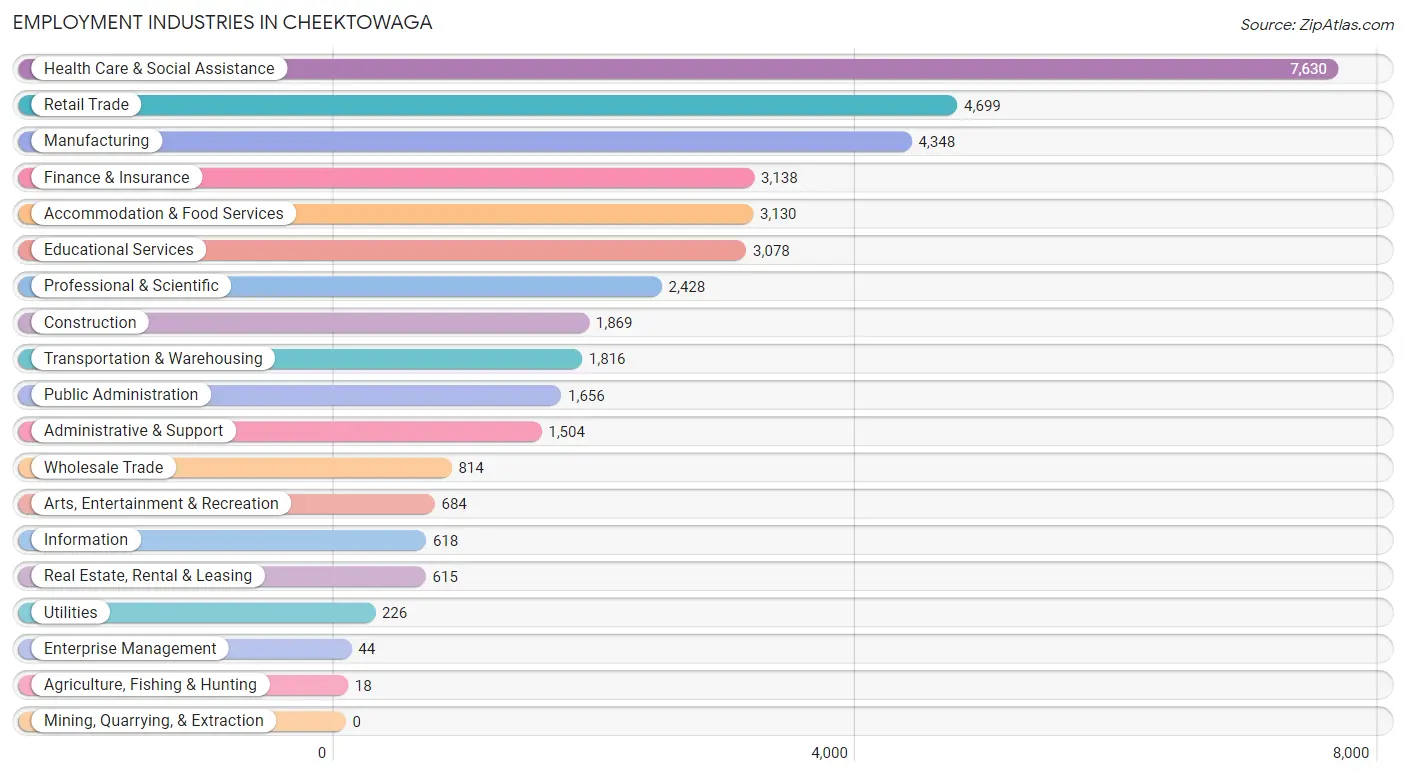
Employment Industries in Cheektowaga
The major employment industries in Cheektowaga include Health Care & Social Assistance (7,630 | 19.0%), Retail Trade (4,699 | 11.7%), Manufacturing (4,348 | 10.8%), Finance & Insurance (3,138 | 7.8%), and Accommodation & Food Services (3,130 | 7.8%).
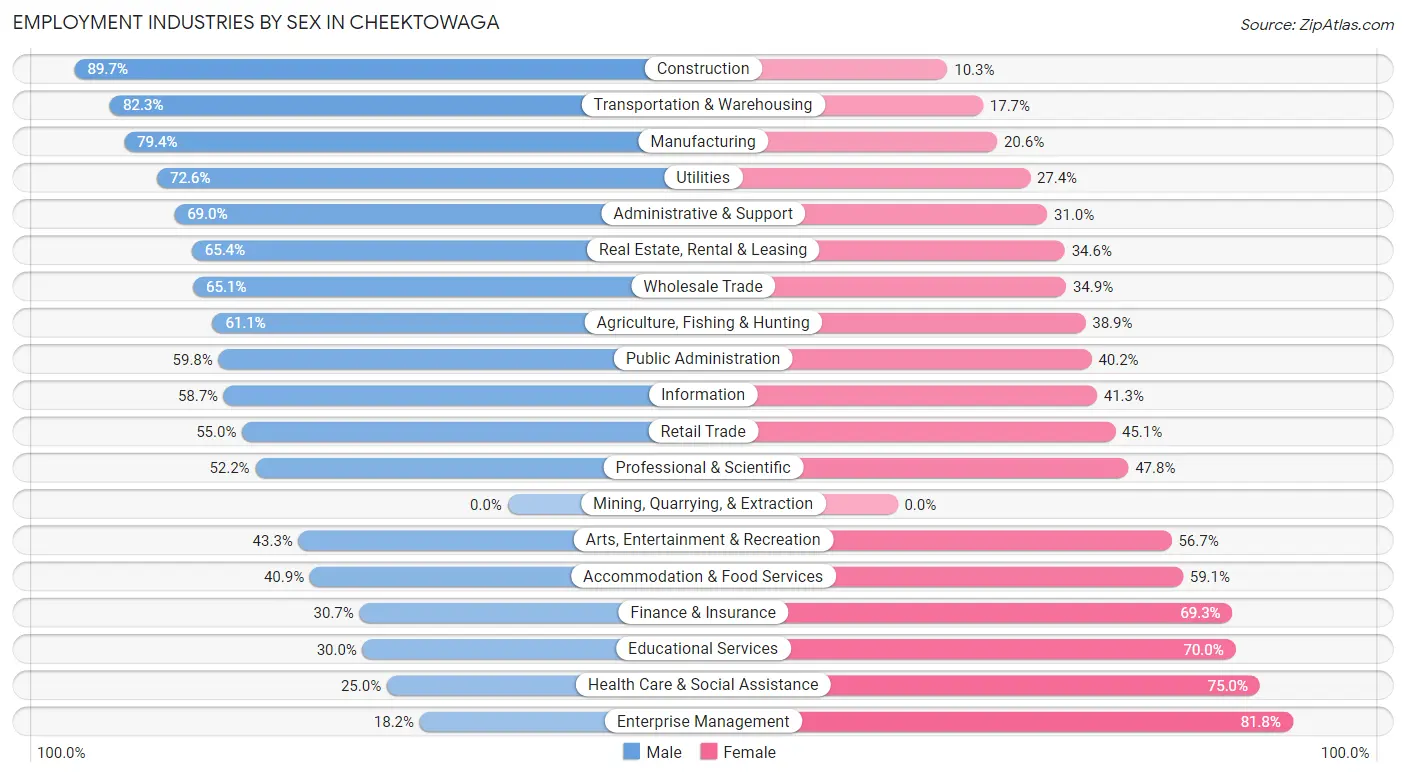
Employment Industries by Sex in Cheektowaga
The Cheektowaga industries that see more men than women are Construction (89.7%), Transportation & Warehousing (82.3%), and Manufacturing (79.4%), whereas the industries that tend to have a higher number of women are Enterprise Management (81.8%), Health Care & Social Assistance (75.0%), and Educational Services (70.0%).
| Industry | Male | Female |
| Agriculture, Fishing & Hunting | 11 (61.1%) | 7 (38.9%) |
| Mining, Quarrying, & Extraction | 0 (0.0%) | 0 (0.0%) |
| Construction | 1,676 (89.7%) | 193 (10.3%) |
| Manufacturing | 3,452 (79.4%) | 896 (20.6%) |
| Wholesale Trade | 530 (65.1%) | 284 (34.9%) |
| Retail Trade | 2,582 (54.9%) | 2,117 (45.1%) |
| Transportation & Warehousing | 1,495 (82.3%) | 321 (17.7%) |
| Utilities | 164 (72.6%) | 62 (27.4%) |
| Information | 363 (58.7%) | 255 (41.3%) |
| Finance & Insurance | 962 (30.7%) | 2,176 (69.3%) |
| Real Estate, Rental & Leasing | 402 (65.4%) | 213 (34.6%) |
| Professional & Scientific | 1,268 (52.2%) | 1,160 (47.8%) |
| Enterprise Management | 8 (18.2%) | 36 (81.8%) |
| Administrative & Support | 1,038 (69.0%) | 466 (31.0%) |
| Educational Services | 924 (30.0%) | 2,154 (70.0%) |
| Health Care & Social Assistance | 1,907 (25.0%) | 5,723 (75.0%) |
| Arts, Entertainment & Recreation | 296 (43.3%) | 388 (56.7%) |
| Accommodation & Food Services | 1,281 (40.9%) | 1,849 (59.1%) |
| Public Administration | 991 (59.8%) | 665 (40.2%) |
| Total | 20,270 (50.4%) | 19,947 (49.6%) |
Education in Cheektowaga
School Enrollment in Cheektowaga
The most common levels of schooling among the 16,055 students in Cheektowaga are college / undergraduate (4,542 | 28.3%), elementary school (3,497 | 21.8%), and high school (3,109 | 19.4%).
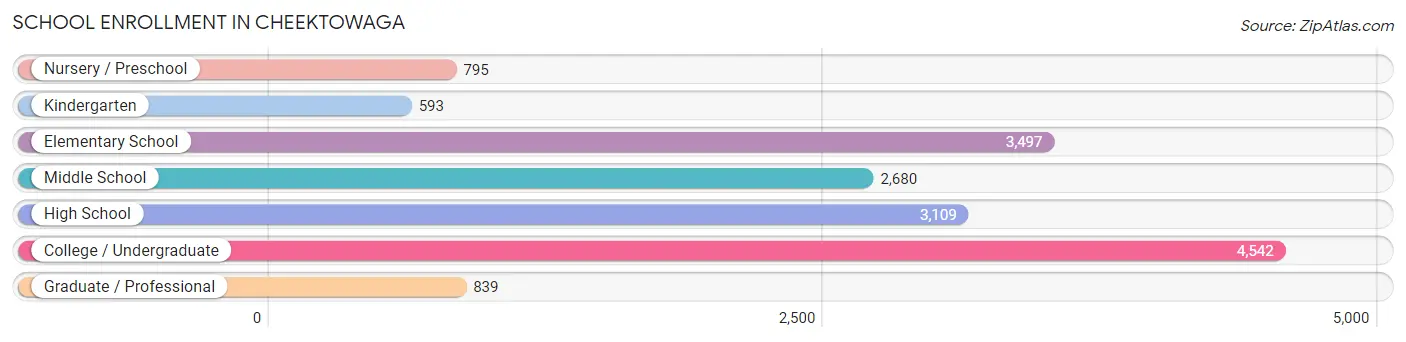
| School Level | # Students | % Students |
| Nursery / Preschool | 795 | 5.0% |
| Kindergarten | 593 | 3.7% |
| Elementary School | 3,497 | 21.8% |
| Middle School | 2,680 | 16.7% |
| High School | 3,109 | 19.4% |
| College / Undergraduate | 4,542 | 28.3% |
| Graduate / Professional | 839 | 5.2% |
| Total | 16,055 | 100.0% |
School Enrollment by Age by Funding Source in Cheektowaga
Out of a total of 16,055 students who are enrolled in schools in Cheektowaga, 2,665 (16.6%) attend a private institution, while the remaining 13,390 (83.4%) are enrolled in public schools. The age group of 20 to 24 year olds has the highest likelihood of being enrolled in private schools, with 804 (38.0% in the age bracket) enrolled. Conversely, the age group of 10 to 14 year olds has the lowest likelihood of being enrolled in a private school, with 3,418 (93.9% in the age bracket) attending a public institution.
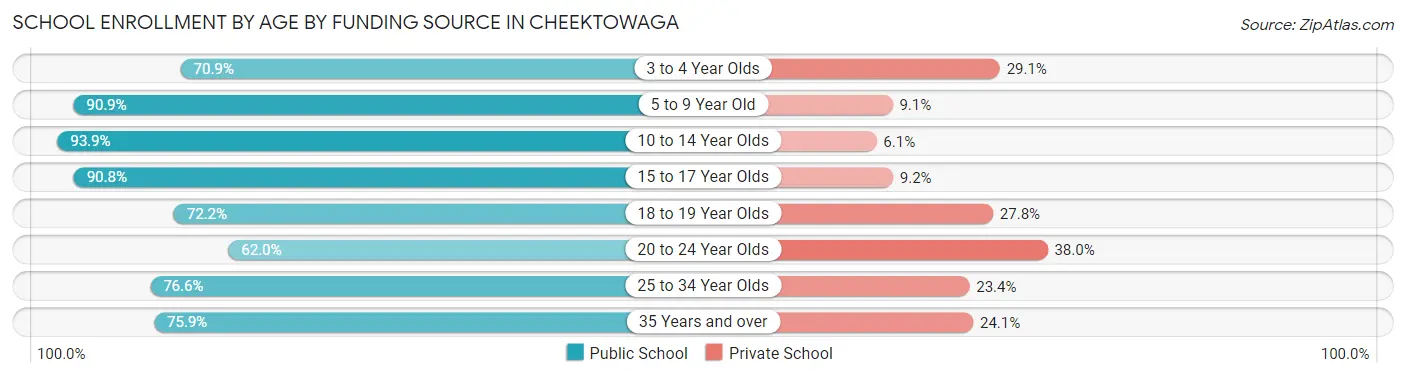
| Age Bracket | Public School | Private School |
| 3 to 4 Year Olds | 398 (70.9%) | 163 (29.1%) |
| 5 to 9 Year Old | 3,542 (90.9%) | 354 (9.1%) |
| 10 to 14 Year Olds | 3,418 (93.9%) | 222 (6.1%) |
| 15 to 17 Year Olds | 1,994 (90.8%) | 201 (9.2%) |
| 18 to 19 Year Olds | 1,062 (72.2%) | 409 (27.8%) |
| 20 to 24 Year Olds | 1,314 (62.0%) | 804 (38.0%) |
| 25 to 34 Year Olds | 1,195 (76.6%) | 365 (23.4%) |
| 35 Years and over | 466 (75.9%) | 148 (24.1%) |
| Total | 13,390 (83.4%) | 2,665 (16.6%) |
Educational Attainment by Field of Study in Cheektowaga
Business (2,925 | 18.0%), education (1,919 | 11.8%), science & technology (1,732 | 10.6%), social sciences (1,435 | 8.8%), and arts & humanities (1,312 | 8.1%) are the most common fields of study among 16,286 individuals in Cheektowaga who have obtained a bachelor's degree or higher.
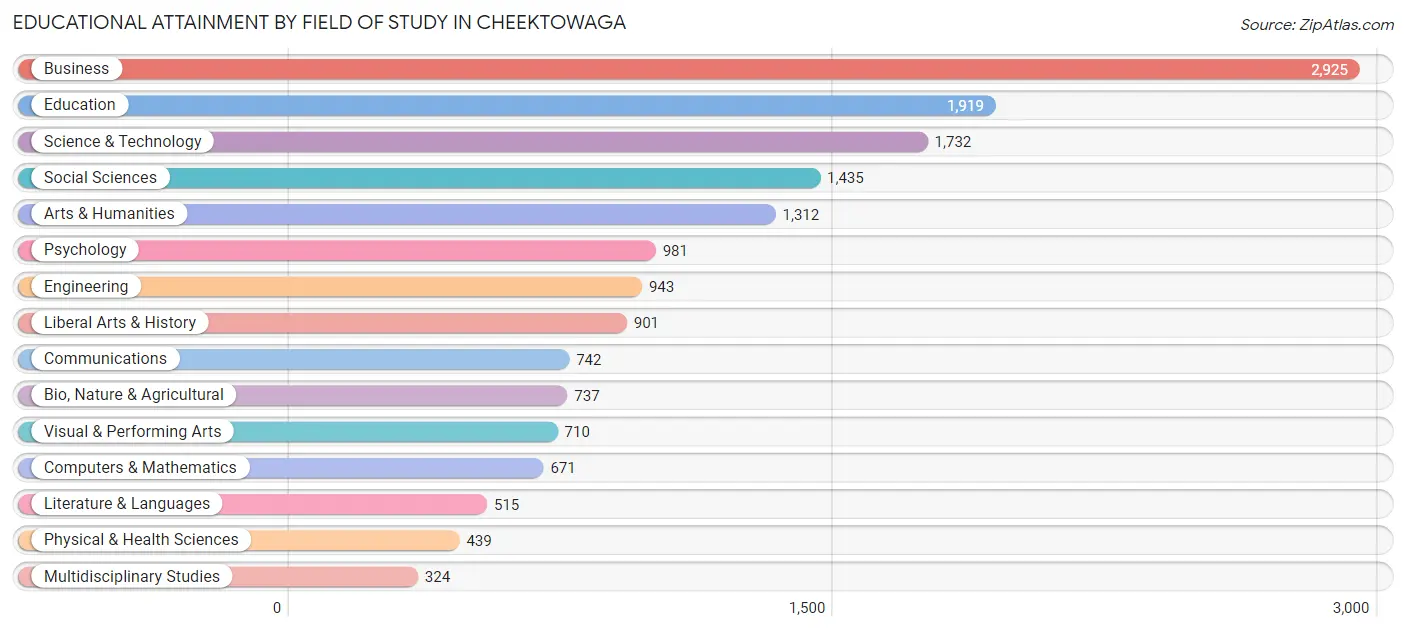
| Field of Study | # Graduates | % Graduates |
| Computers & Mathematics | 671 | 4.1% |
| Bio, Nature & Agricultural | 737 | 4.5% |
| Physical & Health Sciences | 439 | 2.7% |
| Psychology | 981 | 6.0% |
| Social Sciences | 1,435 | 8.8% |
| Engineering | 943 | 5.8% |
| Multidisciplinary Studies | 324 | 2.0% |
| Science & Technology | 1,732 | 10.6% |
| Business | 2,925 | 18.0% |
| Education | 1,919 | 11.8% |
| Literature & Languages | 515 | 3.2% |
| Liberal Arts & History | 901 | 5.5% |
| Visual & Performing Arts | 710 | 4.4% |
| Communications | 742 | 4.6% |
| Arts & Humanities | 1,312 | 8.1% |
| Total | 16,286 | 100.0% |
Transportation & Commute in Cheektowaga
Vehicle Availability by Sex in Cheektowaga
The most prevalent vehicle ownership categories in Cheektowaga are males with 2 vehicles (9,423, accounting for 47.8%) and females with 2 vehicles (8,641, making up 49.4%).
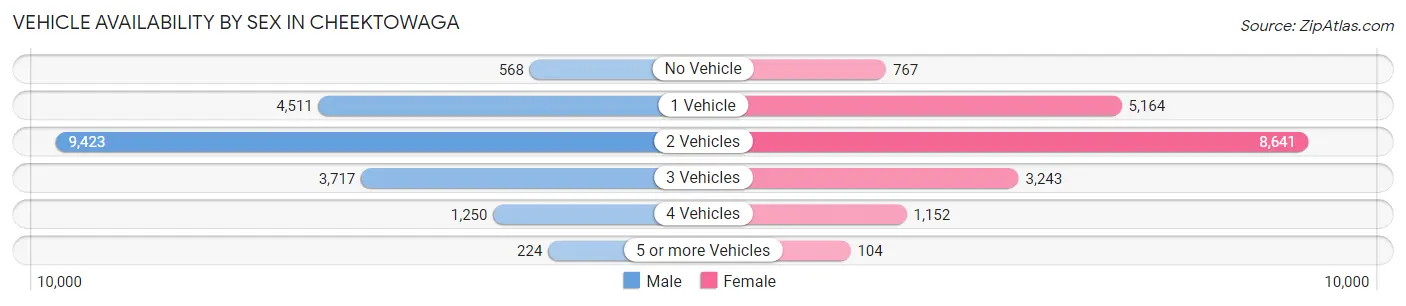
| Vehicles Available | Male | Female |
| No Vehicle | 568 (2.9%) | 767 (4.0%) |
| 1 Vehicle | 4,511 (22.9%) | 5,164 (27.1%) |
| 2 Vehicles | 9,423 (47.8%) | 8,641 (45.3%) |
| 3 Vehicles | 3,717 (18.9%) | 3,243 (17.0%) |
| 4 Vehicles | 1,250 (6.4%) | 1,152 (6.0%) |
| 5 or more Vehicles | 224 (1.1%) | 104 (0.5%) |
| Total | 19,693 (100.0%) | 19,071 (100.0%) |
Commute Time in Cheektowaga
The most frequently occuring commute durations in Cheektowaga are 15 to 19 minutes (8,756 commuters, 24.3%), 20 to 24 minutes (7,439 commuters, 20.6%), and 10 to 14 minutes (7,041 commuters, 19.5%).
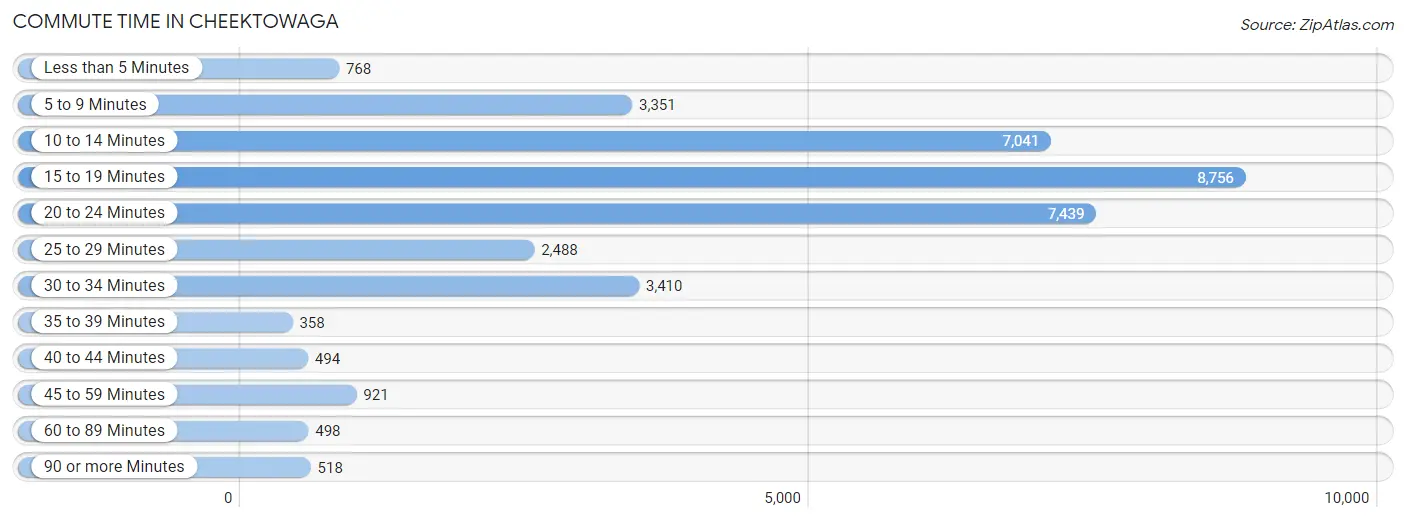
| Commute Time | # Commuters | % Commuters |
| Less than 5 Minutes | 768 | 2.1% |
| 5 to 9 Minutes | 3,351 | 9.3% |
| 10 to 14 Minutes | 7,041 | 19.5% |
| 15 to 19 Minutes | 8,756 | 24.3% |
| 20 to 24 Minutes | 7,439 | 20.6% |
| 25 to 29 Minutes | 2,488 | 6.9% |
| 30 to 34 Minutes | 3,410 | 9.5% |
| 35 to 39 Minutes | 358 | 1.0% |
| 40 to 44 Minutes | 494 | 1.4% |
| 45 to 59 Minutes | 921 | 2.6% |
| 60 to 89 Minutes | 498 | 1.4% |
| 90 or more Minutes | 518 | 1.4% |
Commute Time by Sex in Cheektowaga
The most common commute times in Cheektowaga are 15 to 19 minutes (4,438 commuters, 24.0%) for males and 15 to 19 minutes (4,318 commuters, 24.6%) for females.
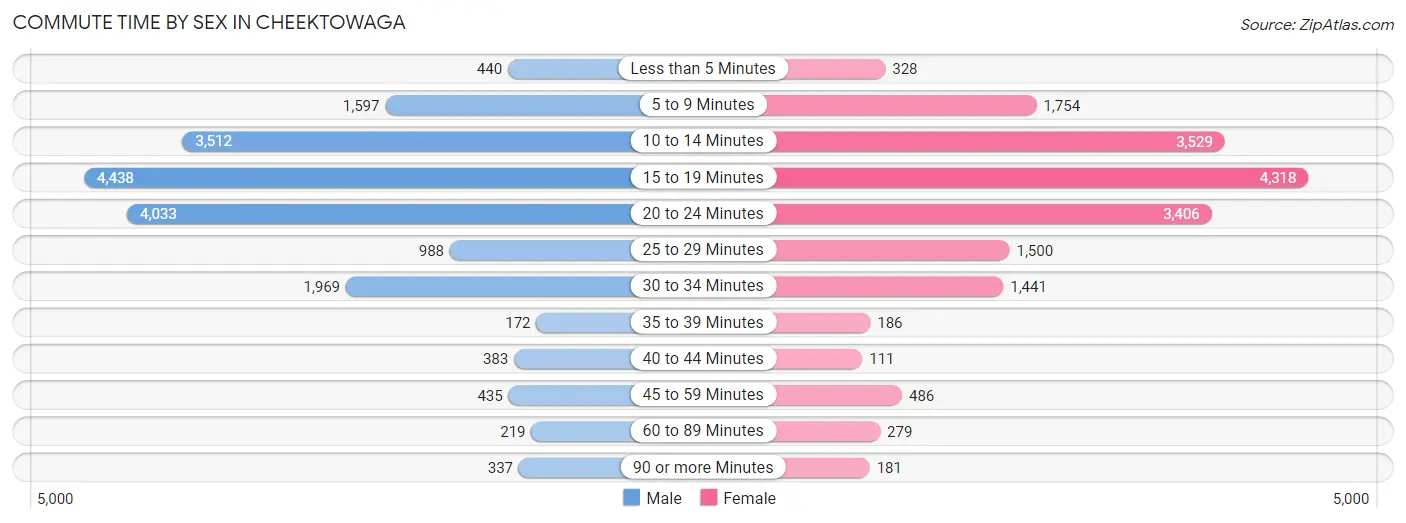
| Commute Time | Male | Female |
| Less than 5 Minutes | 440 (2.4%) | 328 (1.9%) |
| 5 to 9 Minutes | 1,597 (8.6%) | 1,754 (10.0%) |
| 10 to 14 Minutes | 3,512 (19.0%) | 3,529 (20.1%) |
| 15 to 19 Minutes | 4,438 (24.0%) | 4,318 (24.6%) |
| 20 to 24 Minutes | 4,033 (21.8%) | 3,406 (19.4%) |
| 25 to 29 Minutes | 988 (5.3%) | 1,500 (8.6%) |
| 30 to 34 Minutes | 1,969 (10.6%) | 1,441 (8.2%) |
| 35 to 39 Minutes | 172 (0.9%) | 186 (1.1%) |
| 40 to 44 Minutes | 383 (2.1%) | 111 (0.6%) |
| 45 to 59 Minutes | 435 (2.4%) | 486 (2.8%) |
| 60 to 89 Minutes | 219 (1.2%) | 279 (1.6%) |
| 90 or more Minutes | 337 (1.8%) | 181 (1.0%) |
Time of Departure to Work by Sex in Cheektowaga
The most frequent times of departure to work in Cheektowaga are 8:00 AM to 8:29 AM (2,865, 15.5%) for males and 8:00 AM to 8:29 AM (3,328, 19.0%) for females.
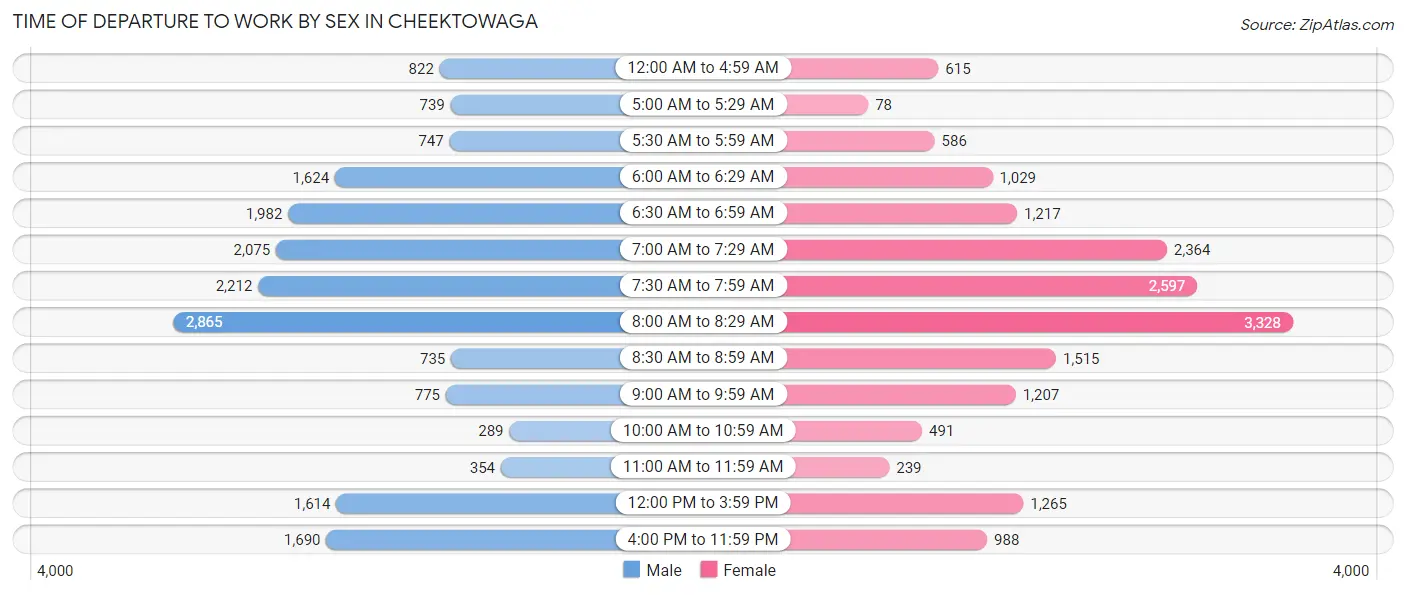
| Time of Departure | Male | Female |
| 12:00 AM to 4:59 AM | 822 (4.4%) | 615 (3.5%) |
| 5:00 AM to 5:29 AM | 739 (4.0%) | 78 (0.4%) |
| 5:30 AM to 5:59 AM | 747 (4.0%) | 586 (3.3%) |
| 6:00 AM to 6:29 AM | 1,624 (8.8%) | 1,029 (5.9%) |
| 6:30 AM to 6:59 AM | 1,982 (10.7%) | 1,217 (7.0%) |
| 7:00 AM to 7:29 AM | 2,075 (11.2%) | 2,364 (13.5%) |
| 7:30 AM to 7:59 AM | 2,212 (11.9%) | 2,597 (14.8%) |
| 8:00 AM to 8:29 AM | 2,865 (15.5%) | 3,328 (19.0%) |
| 8:30 AM to 8:59 AM | 735 (4.0%) | 1,515 (8.6%) |
| 9:00 AM to 9:59 AM | 775 (4.2%) | 1,207 (6.9%) |
| 10:00 AM to 10:59 AM | 289 (1.6%) | 491 (2.8%) |
| 11:00 AM to 11:59 AM | 354 (1.9%) | 239 (1.4%) |
| 12:00 PM to 3:59 PM | 1,614 (8.7%) | 1,265 (7.2%) |
| 4:00 PM to 11:59 PM | 1,690 (9.1%) | 988 (5.6%) |
| Total | 18,523 (100.0%) | 17,519 (100.0%) |
Housing Occupancy in Cheektowaga
Occupancy by Ownership in Cheektowaga
Of the total 34,065 dwellings in Cheektowaga, owner-occupied units account for 23,780 (69.8%), while renter-occupied units make up 10,285 (30.2%).
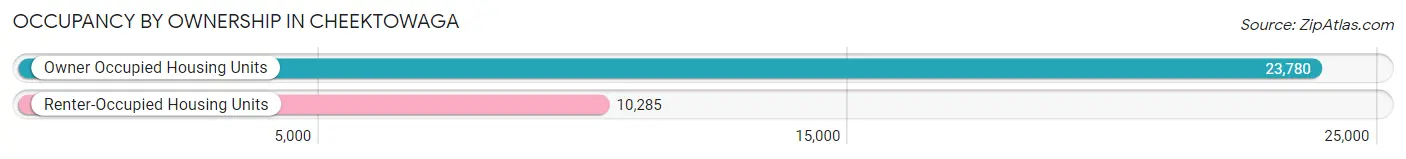
| Occupancy | # Housing Units | % Housing Units |
| Owner Occupied Housing Units | 23,780 | 69.8% |
| Renter-Occupied Housing Units | 10,285 | 30.2% |
| Total Occupied Housing Units | 34,065 | 100.0% |
Occupancy by Household Size in Cheektowaga
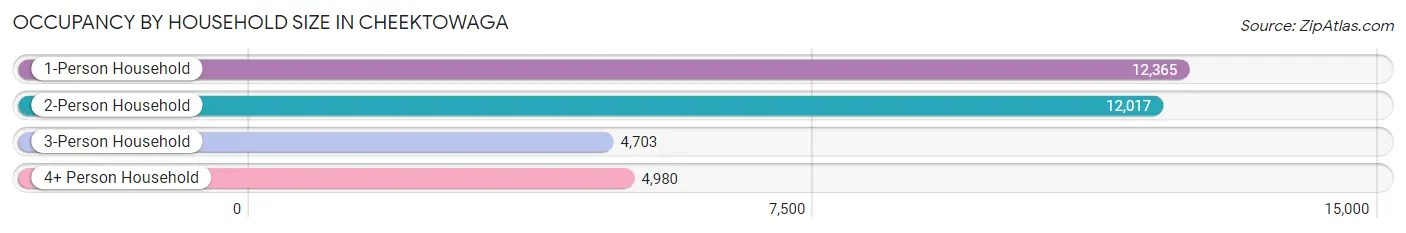
| Household Size | # Housing Units | % Housing Units |
| 1-Person Household | 12,365 | 36.3% |
| 2-Person Household | 12,017 | 35.3% |
| 3-Person Household | 4,703 | 13.8% |
| 4+ Person Household | 4,980 | 14.6% |
| Total Housing Units | 34,065 | 100.0% |
Occupancy by Ownership by Household Size in Cheektowaga
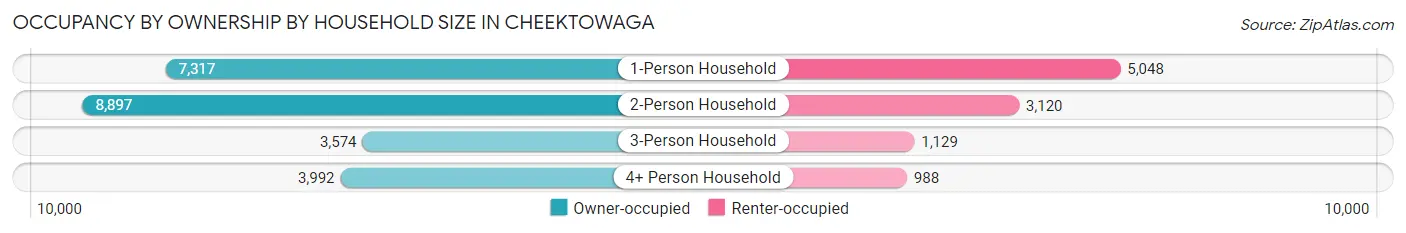
| Household Size | Owner-occupied | Renter-occupied |
| 1-Person Household | 7,317 (59.2%) | 5,048 (40.8%) |
| 2-Person Household | 8,897 (74.0%) | 3,120 (26.0%) |
| 3-Person Household | 3,574 (76.0%) | 1,129 (24.0%) |
| 4+ Person Household | 3,992 (80.2%) | 988 (19.8%) |
| Total Housing Units | 23,780 (69.8%) | 10,285 (30.2%) |
Occupancy by Educational Attainment in Cheektowaga
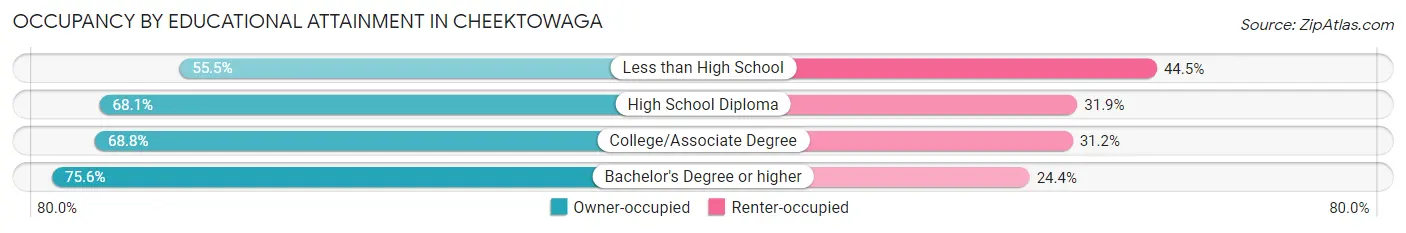
| Household Size | Owner-occupied | Renter-occupied |
| Less than High School | 996 (55.5%) | 800 (44.5%) |
| High School Diploma | 7,734 (68.1%) | 3,624 (31.9%) |
| College/Associate Degree | 7,749 (68.8%) | 3,510 (31.2%) |
| Bachelor's Degree or higher | 7,301 (75.6%) | 2,351 (24.4%) |
Occupancy by Age of Householder in Cheektowaga
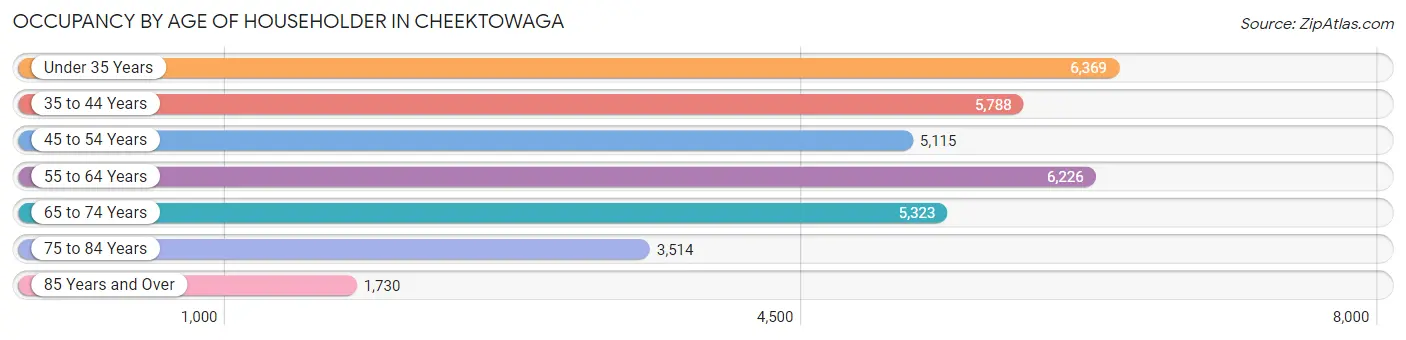
| Age Bracket | # Households | % Households |
| Under 35 Years | 6,369 | 18.7% |
| 35 to 44 Years | 5,788 | 17.0% |
| 45 to 54 Years | 5,115 | 15.0% |
| 55 to 64 Years | 6,226 | 18.3% |
| 65 to 74 Years | 5,323 | 15.6% |
| 75 to 84 Years | 3,514 | 10.3% |
| 85 Years and Over | 1,730 | 5.1% |
| Total | 34,065 | 100.0% |
Housing Finances in Cheektowaga
Median Income by Occupancy in Cheektowaga
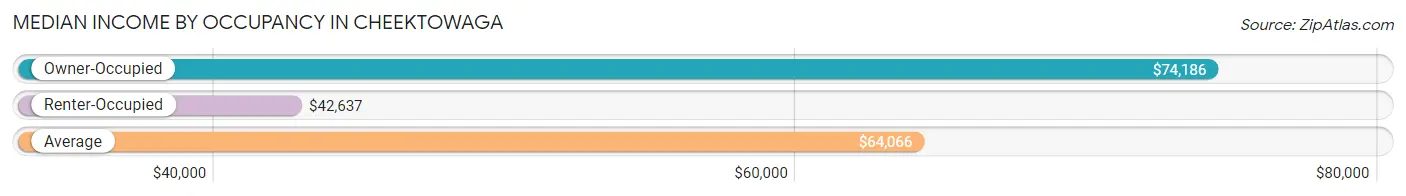
| Occupancy Type | # Households | Median Income |
| Owner-Occupied | 23,780 (69.8%) | $74,186 |
| Renter-Occupied | 10,285 (30.2%) | $42,637 |
| Average | 34,065 (100.0%) | $64,066 |
Occupancy by Householder Income Bracket in Cheektowaga
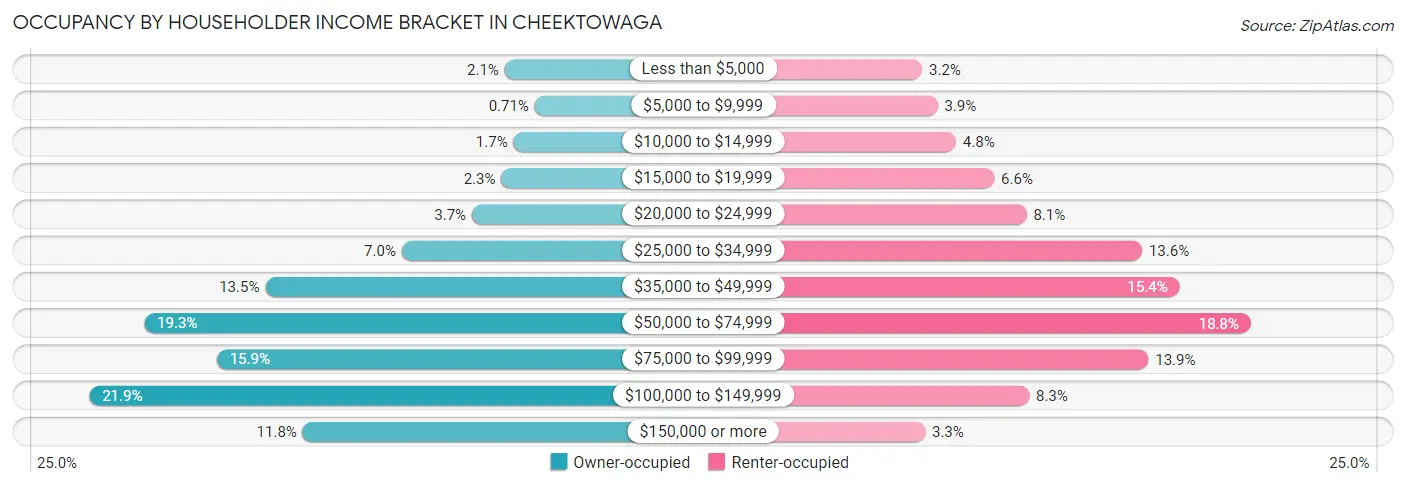
| Income Bracket | Owner-occupied | Renter-occupied |
| Less than $5,000 | 508 (2.1%) | 326 (3.2%) |
| $5,000 to $9,999 | 170 (0.7%) | 401 (3.9%) |
| $10,000 to $14,999 | 409 (1.7%) | 492 (4.8%) |
| $15,000 to $19,999 | 548 (2.3%) | 679 (6.6%) |
| $20,000 to $24,999 | 880 (3.7%) | 837 (8.1%) |
| $25,000 to $34,999 | 1,675 (7.0%) | 1,403 (13.6%) |
| $35,000 to $49,999 | 3,219 (13.5%) | 1,587 (15.4%) |
| $50,000 to $74,999 | 4,593 (19.3%) | 1,936 (18.8%) |
| $75,000 to $99,999 | 3,768 (15.9%) | 1,434 (13.9%) |
| $100,000 to $149,999 | 5,213 (21.9%) | 850 (8.3%) |
| $150,000 or more | 2,797 (11.8%) | 340 (3.3%) |
| Total | 23,780 (100.0%) | 10,285 (100.0%) |
Monthly Housing Cost Tiers in Cheektowaga
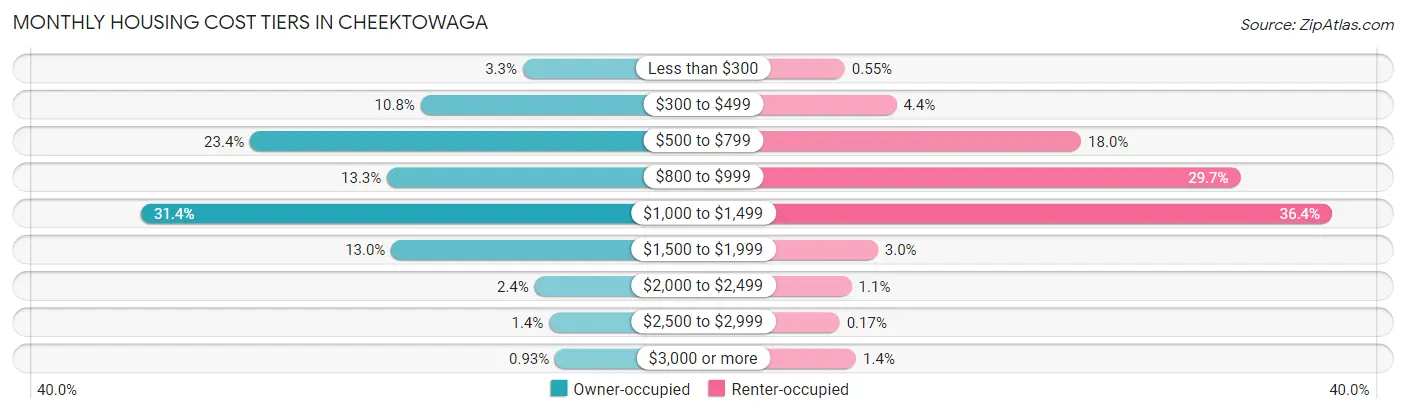
| Monthly Cost | Owner-occupied | Renter-occupied |
| Less than $300 | 787 (3.3%) | 57 (0.5%) |
| $300 to $499 | 2,576 (10.8%) | 447 (4.3%) |
| $500 to $799 | 5,562 (23.4%) | 1,846 (17.9%) |
| $800 to $999 | 3,163 (13.3%) | 3,052 (29.7%) |
| $1,000 to $1,499 | 7,472 (31.4%) | 3,745 (36.4%) |
| $1,500 to $1,999 | 3,092 (13.0%) | 307 (3.0%) |
| $2,000 to $2,499 | 581 (2.4%) | 108 (1.1%) |
| $2,500 to $2,999 | 325 (1.4%) | 17 (0.2%) |
| $3,000 or more | 222 (0.9%) | 142 (1.4%) |
| Total | 23,780 (100.0%) | 10,285 (100.0%) |
Physical Housing Characteristics in Cheektowaga
Housing Structures in Cheektowaga
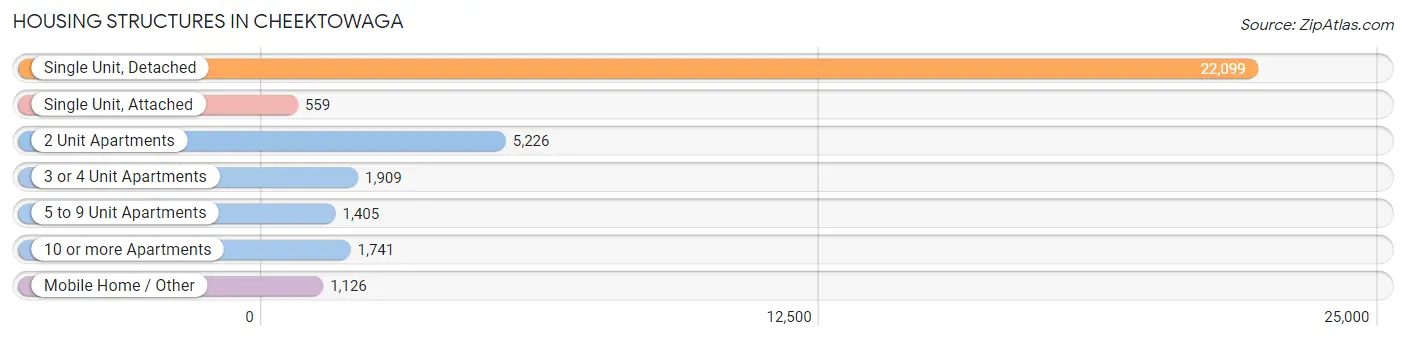
| Structure Type | # Housing Units | % Housing Units |
| Single Unit, Detached | 22,099 | 64.9% |
| Single Unit, Attached | 559 | 1.6% |
| 2 Unit Apartments | 5,226 | 15.3% |
| 3 or 4 Unit Apartments | 1,909 | 5.6% |
| 5 to 9 Unit Apartments | 1,405 | 4.1% |
| 10 or more Apartments | 1,741 | 5.1% |
| Mobile Home / Other | 1,126 | 3.3% |
| Total | 34,065 | 100.0% |
Housing Structures by Occupancy in Cheektowaga
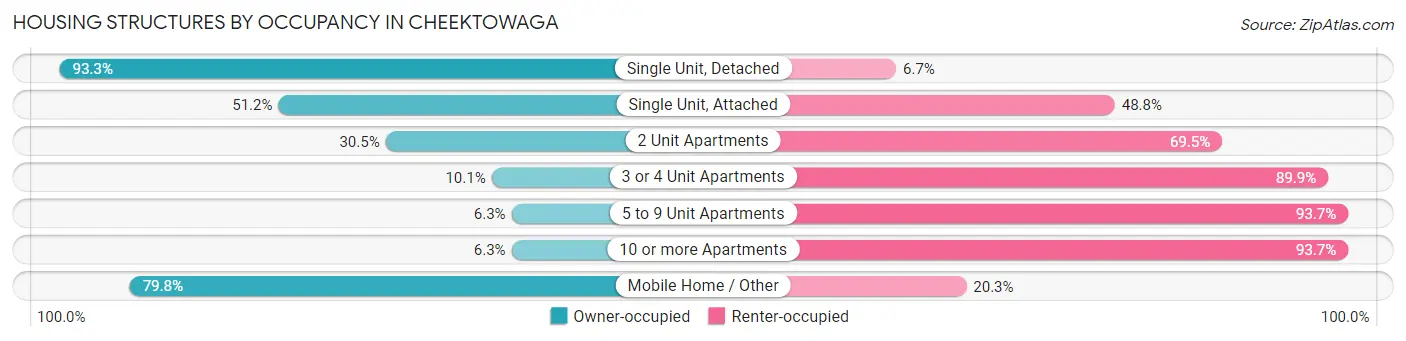
| Structure Type | Owner-occupied | Renter-occupied |
| Single Unit, Detached | 20,611 (93.3%) | 1,488 (6.7%) |
| Single Unit, Attached | 286 (51.2%) | 273 (48.8%) |
| 2 Unit Apartments | 1,595 (30.5%) | 3,631 (69.5%) |
| 3 or 4 Unit Apartments | 193 (10.1%) | 1,716 (89.9%) |
| 5 to 9 Unit Apartments | 88 (6.3%) | 1,317 (93.7%) |
| 10 or more Apartments | 109 (6.3%) | 1,632 (93.7%) |
| Mobile Home / Other | 898 (79.7%) | 228 (20.3%) |
| Total | 23,780 (69.8%) | 10,285 (30.2%) |
Housing Structures by Number of Rooms in Cheektowaga
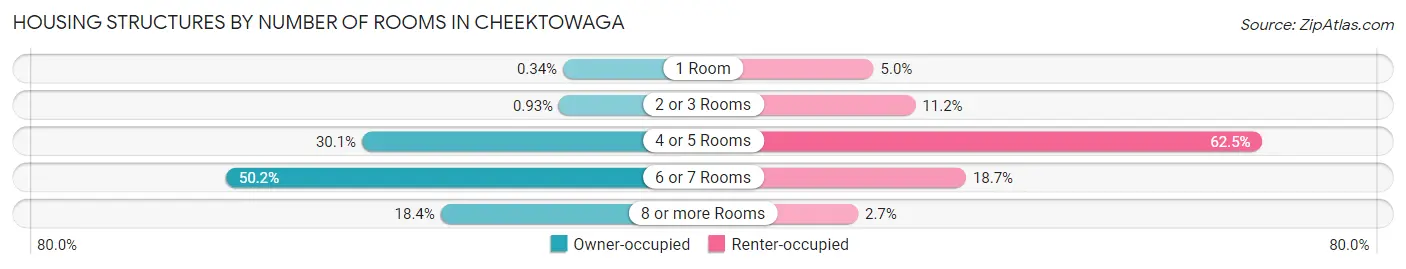
| Number of Rooms | Owner-occupied | Renter-occupied |
| 1 Room | 80 (0.3%) | 512 (5.0%) |
| 2 or 3 Rooms | 221 (0.9%) | 1,149 (11.2%) |
| 4 or 5 Rooms | 7,153 (30.1%) | 6,430 (62.5%) |
| 6 or 7 Rooms | 11,942 (50.2%) | 1,918 (18.6%) |
| 8 or more Rooms | 4,384 (18.4%) | 276 (2.7%) |
| Total | 23,780 (100.0%) | 10,285 (100.0%) |
Housing Structure by Heating Type in Cheektowaga
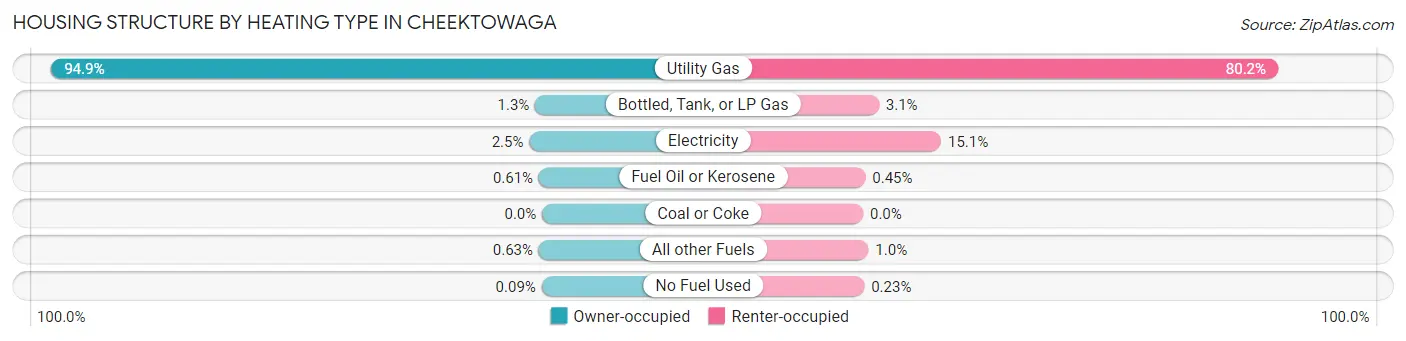
| Heating Type | Owner-occupied | Renter-occupied |
| Utility Gas | 22,556 (94.9%) | 8,243 (80.1%) |
| Bottled, Tank, or LP Gas | 318 (1.3%) | 314 (3.0%) |
| Electricity | 588 (2.5%) | 1,551 (15.1%) |
| Fuel Oil or Kerosene | 146 (0.6%) | 46 (0.4%) |
| Coal or Coke | 0 (0.0%) | 0 (0.0%) |
| All other Fuels | 151 (0.6%) | 107 (1.0%) |
| No Fuel Used | 21 (0.1%) | 24 (0.2%) |
| Total | 23,780 (100.0%) | 10,285 (100.0%) |
Household Vehicle Usage in Cheektowaga
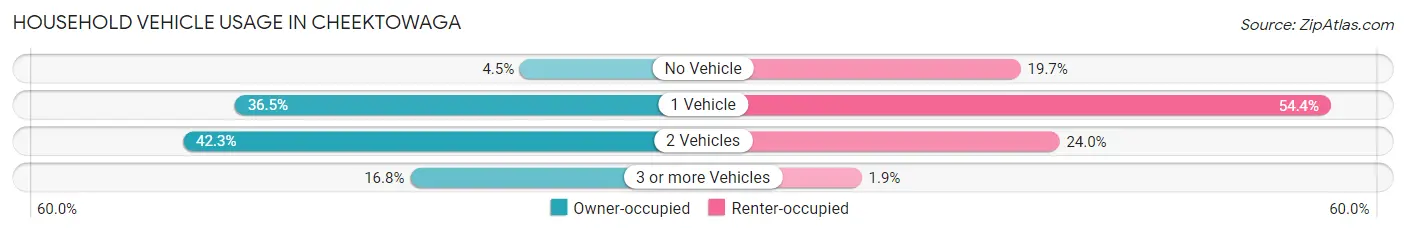
| Vehicles per Household | Owner-occupied | Renter-occupied |
| No Vehicle | 1,070 (4.5%) | 2,024 (19.7%) |
| 1 Vehicle | 8,670 (36.5%) | 5,598 (54.4%) |
| 2 Vehicles | 10,046 (42.2%) | 2,471 (24.0%) |
| 3 or more Vehicles | 3,994 (16.8%) | 192 (1.9%) |
| Total | 23,780 (100.0%) | 10,285 (100.0%) |
Real Estate & Mortgages in Cheektowaga
Real Estate and Mortgage Overview in Cheektowaga
| Characteristic | Without Mortgage | With Mortgage |
| Housing Units | 9,531 | 14,249 |
| Median Property Value | $146,100 | $155,400 |
| Median Household Income | $55,574 | $2,018 |
| Monthly Housing Costs | $579 | $222 |
| Real Estate Taxes | $3,790 | $544 |
Property Value by Mortgage Status in Cheektowaga
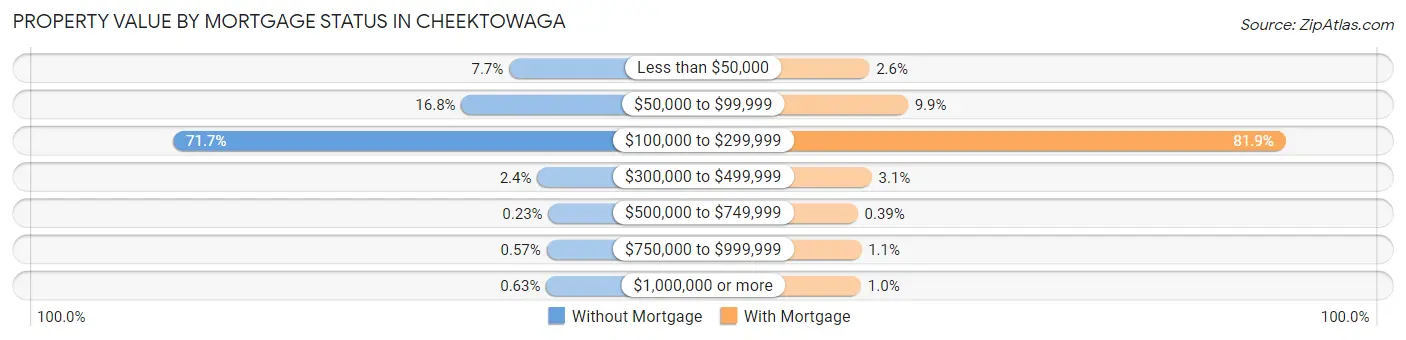
| Property Value | Without Mortgage | With Mortgage |
| Less than $50,000 | 735 (7.7%) | 370 (2.6%) |
| $50,000 to $99,999 | 1,601 (16.8%) | 1,415 (9.9%) |
| $100,000 to $299,999 | 6,835 (71.7%) | 11,673 (81.9%) |
| $300,000 to $499,999 | 224 (2.4%) | 436 (3.1%) |
| $500,000 to $749,999 | 22 (0.2%) | 55 (0.4%) |
| $750,000 to $999,999 | 54 (0.6%) | 154 (1.1%) |
| $1,000,000 or more | 60 (0.6%) | 146 (1.0%) |
| Total | 9,531 (100.0%) | 14,249 (100.0%) |
Household Income by Mortgage Status in Cheektowaga
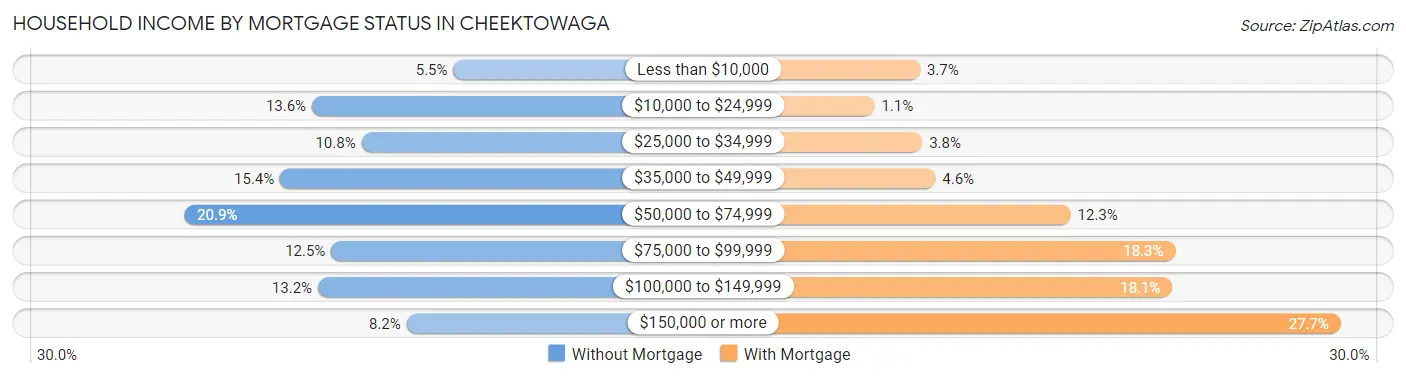
| Household Income | Without Mortgage | With Mortgage |
| Less than $10,000 | 524 (5.5%) | 524 (3.7%) |
| $10,000 to $24,999 | 1,294 (13.6%) | 154 (1.1%) |
| $25,000 to $34,999 | 1,025 (10.7%) | 543 (3.8%) |
| $35,000 to $49,999 | 1,468 (15.4%) | 650 (4.6%) |
| $50,000 to $74,999 | 1,990 (20.9%) | 1,751 (12.3%) |
| $75,000 to $99,999 | 1,189 (12.5%) | 2,603 (18.3%) |
| $100,000 to $149,999 | 1,262 (13.2%) | 2,579 (18.1%) |
| $150,000 or more | 779 (8.2%) | 3,951 (27.7%) |
| Total | 9,531 (100.0%) | 14,249 (100.0%) |
Property Value to Household Income Ratio in Cheektowaga
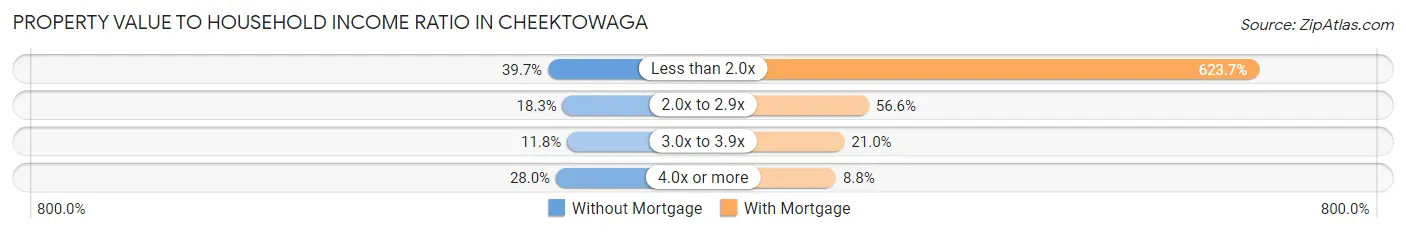
| Value-to-Income Ratio | Without Mortgage | With Mortgage |
| Less than 2.0x | 3,780 (39.7%) | 88,872 (623.7%) |
| 2.0x to 2.9x | 1,741 (18.3%) | 8,067 (56.6%) |
| 3.0x to 3.9x | 1,120 (11.7%) | 2,997 (21.0%) |
| 4.0x or more | 2,671 (28.0%) | 1,260 (8.8%) |
| Total | 9,531 (100.0%) | 14,249 (100.0%) |
Real Estate Taxes by Mortgage Status in Cheektowaga
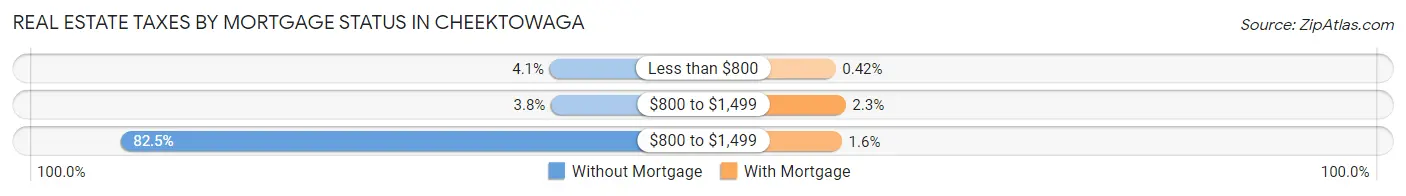
| Property Taxes | Without Mortgage | With Mortgage |
| Less than $800 | 387 (4.1%) | 60 (0.4%) |
| $800 to $1,499 | 364 (3.8%) | 322 (2.3%) |
| $800 to $1,499 | 7,864 (82.5%) | 224 (1.6%) |
| Total | 9,531 (100.0%) | 14,249 (100.0%) |
Health & Disability in Cheektowaga
Health Insurance Coverage by Age in Cheektowaga
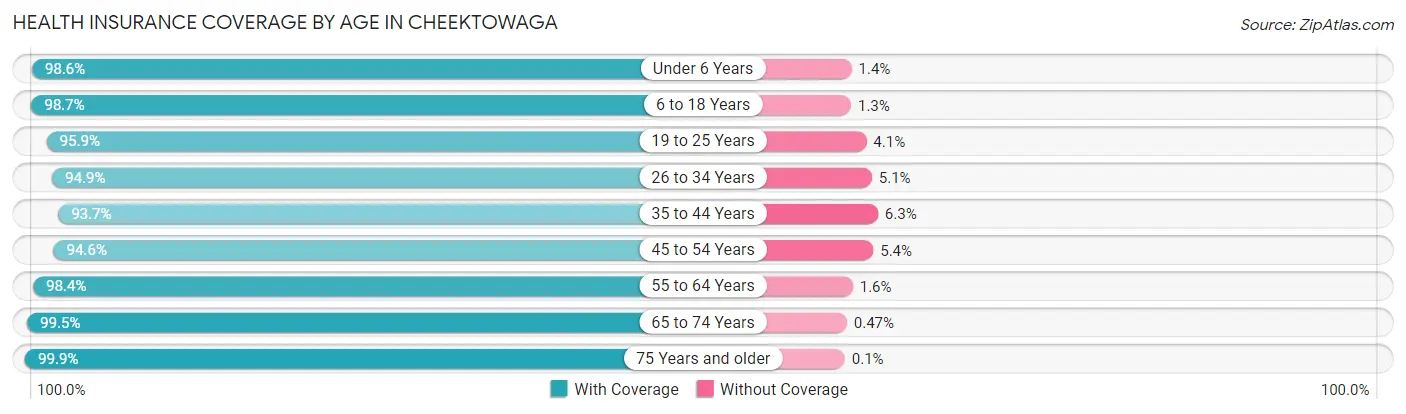
| Age Bracket | With Coverage | Without Coverage |
| Under 6 Years | 4,435 (98.6%) | 61 (1.4%) |
| 6 to 18 Years | 10,227 (98.7%) | 130 (1.3%) |
| 19 to 25 Years | 6,981 (95.9%) | 300 (4.1%) |
| 26 to 34 Years | 10,292 (94.9%) | 558 (5.1%) |
| 35 to 44 Years | 8,797 (93.7%) | 588 (6.3%) |
| 45 to 54 Years | 8,043 (94.6%) | 460 (5.4%) |
| 55 to 64 Years | 10,077 (98.4%) | 162 (1.6%) |
| 65 to 74 Years | 7,773 (99.5%) | 37 (0.5%) |
| 75 Years and older | 7,182 (99.9%) | 7 (0.1%) |
| Total | 73,807 (97.0%) | 2,303 (3.0%) |
Health Insurance Coverage by Citizenship Status in Cheektowaga
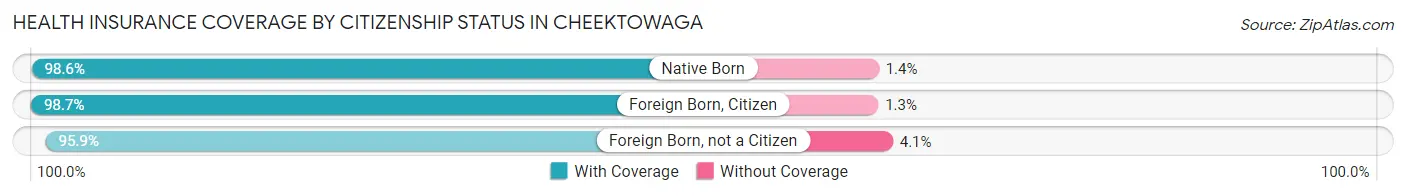
| Citizenship Status | With Coverage | Without Coverage |
| Native Born | 4,435 (98.6%) | 61 (1.4%) |
| Foreign Born, Citizen | 10,227 (98.7%) | 130 (1.3%) |
| Foreign Born, not a Citizen | 6,981 (95.9%) | 300 (4.1%) |
Health Insurance Coverage by Household Income in Cheektowaga
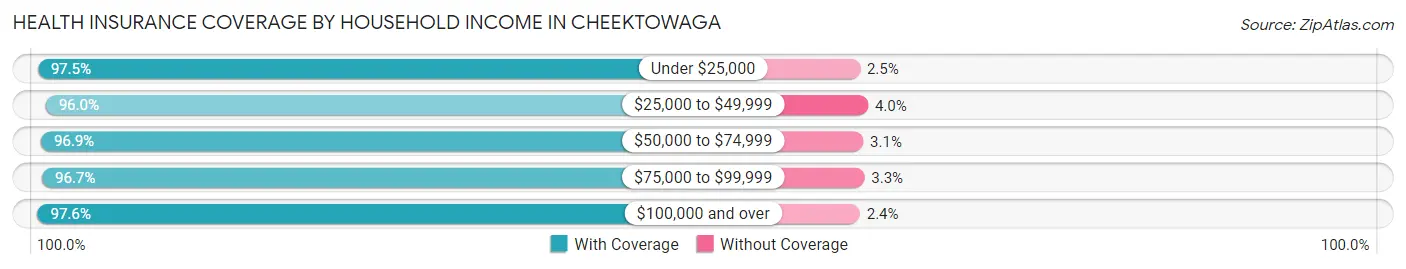
| Household Income | With Coverage | Without Coverage |
| Under $25,000 | 7,391 (97.5%) | 187 (2.5%) |
| $25,000 to $49,999 | 13,659 (96.0%) | 565 (4.0%) |
| $50,000 to $74,999 | 13,091 (96.9%) | 414 (3.1%) |
| $75,000 to $99,999 | 11,789 (96.7%) | 401 (3.3%) |
| $100,000 and over | 26,496 (97.6%) | 660 (2.4%) |
Public vs Private Health Insurance Coverage by Age in Cheektowaga
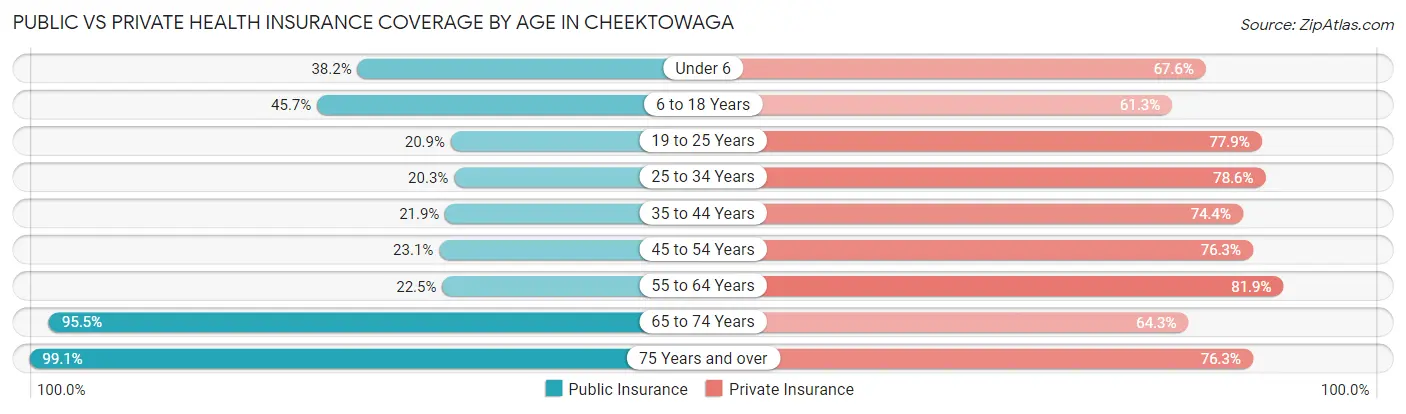
| Age Bracket | Public Insurance | Private Insurance |
| Under 6 | 1,718 (38.2%) | 3,037 (67.5%) |
| 6 to 18 Years | 4,734 (45.7%) | 6,350 (61.3%) |
| 19 to 25 Years | 1,521 (20.9%) | 5,672 (77.9%) |
| 25 to 34 Years | 2,199 (20.3%) | 8,529 (78.6%) |
| 35 to 44 Years | 2,058 (21.9%) | 6,985 (74.4%) |
| 45 to 54 Years | 1,960 (23.1%) | 6,487 (76.3%) |
| 55 to 64 Years | 2,301 (22.5%) | 8,390 (81.9%) |
| 65 to 74 Years | 7,458 (95.5%) | 5,023 (64.3%) |
| 75 Years and over | 7,124 (99.1%) | 5,484 (76.3%) |
| Total | 31,073 (40.8%) | 55,957 (73.5%) |
Disability Status by Sex by Age in Cheektowaga
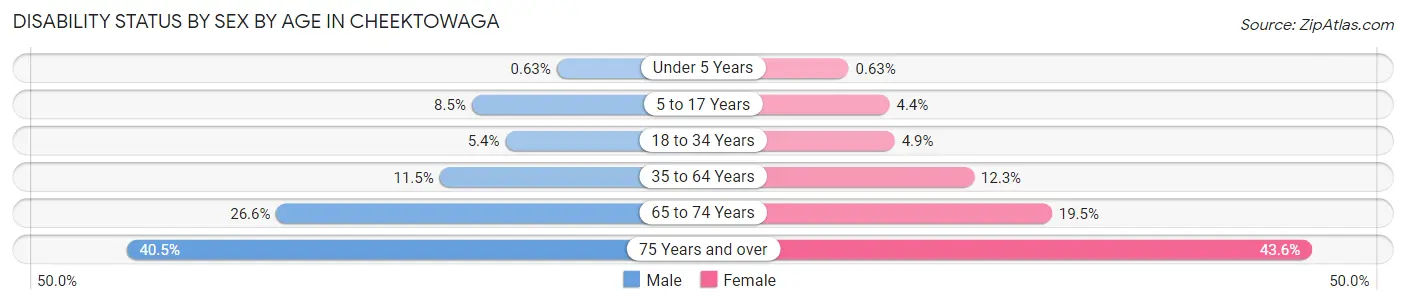
| Age Bracket | Male | Female |
| Under 5 Years | 13 (0.6%) | 10 (0.6%) |
| 5 to 17 Years | 433 (8.5%) | 226 (4.4%) |
| 18 to 34 Years | 499 (5.4%) | 484 (4.9%) |
| 35 to 64 Years | 1,629 (11.5%) | 1,710 (12.3%) |
| 65 to 74 Years | 916 (26.6%) | 852 (19.5%) |
| 75 Years and over | 1,119 (40.5%) | 1,933 (43.6%) |
Disability Class by Sex by Age in Cheektowaga
Disability Class: Hearing Difficulty
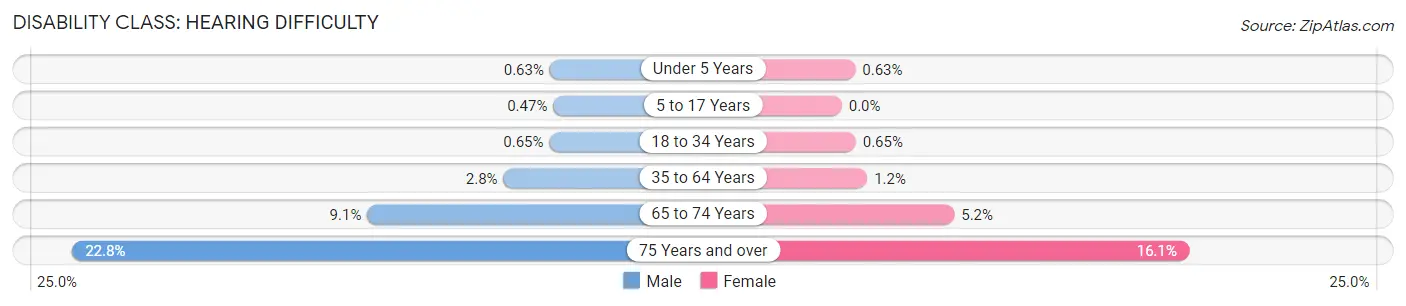
| Age Bracket | Male | Female |
| Under 5 Years | 13 (0.6%) | 10 (0.6%) |
| 5 to 17 Years | 24 (0.5%) | 0 (0.0%) |
| 18 to 34 Years | 60 (0.6%) | 64 (0.6%) |
| 35 to 64 Years | 394 (2.8%) | 164 (1.2%) |
| 65 to 74 Years | 313 (9.1%) | 228 (5.2%) |
| 75 Years and over | 629 (22.8%) | 713 (16.1%) |
Disability Class: Vision Difficulty
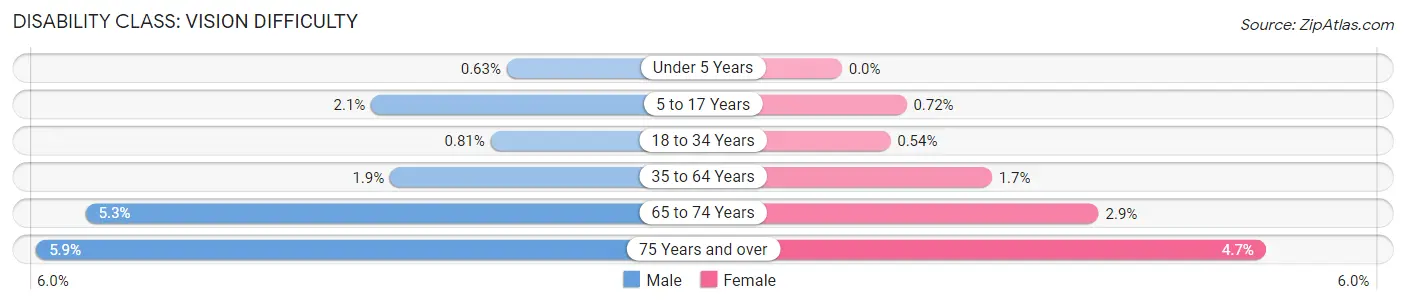
| Age Bracket | Male | Female |
| Under 5 Years | 13 (0.6%) | 0 (0.0%) |
| 5 to 17 Years | 109 (2.1%) | 37 (0.7%) |
| 18 to 34 Years | 75 (0.8%) | 53 (0.5%) |
| 35 to 64 Years | 274 (1.9%) | 233 (1.7%) |
| 65 to 74 Years | 183 (5.3%) | 125 (2.9%) |
| 75 Years and over | 162 (5.9%) | 209 (4.7%) |
Disability Class: Cognitive Difficulty
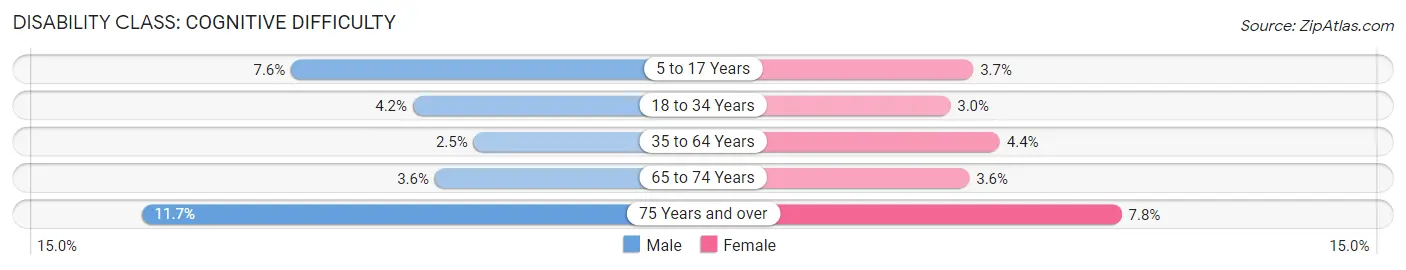
| Age Bracket | Male | Female |
| 5 to 17 Years | 386 (7.6%) | 187 (3.7%) |
| 18 to 34 Years | 388 (4.2%) | 298 (3.0%) |
| 35 to 64 Years | 355 (2.5%) | 614 (4.4%) |
| 65 to 74 Years | 123 (3.6%) | 155 (3.5%) |
| 75 Years and over | 324 (11.7%) | 345 (7.8%) |
Disability Class: Ambulatory Difficulty
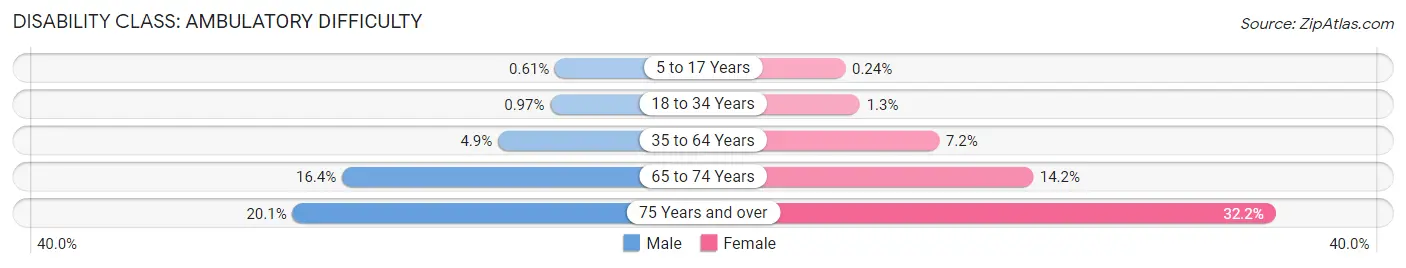
| Age Bracket | Male | Female |
| 5 to 17 Years | 31 (0.6%) | 12 (0.2%) |
| 18 to 34 Years | 90 (1.0%) | 131 (1.3%) |
| 35 to 64 Years | 688 (4.9%) | 1,005 (7.2%) |
| 65 to 74 Years | 565 (16.4%) | 620 (14.2%) |
| 75 Years and over | 555 (20.1%) | 1,426 (32.2%) |
Disability Class: Self-Care Difficulty
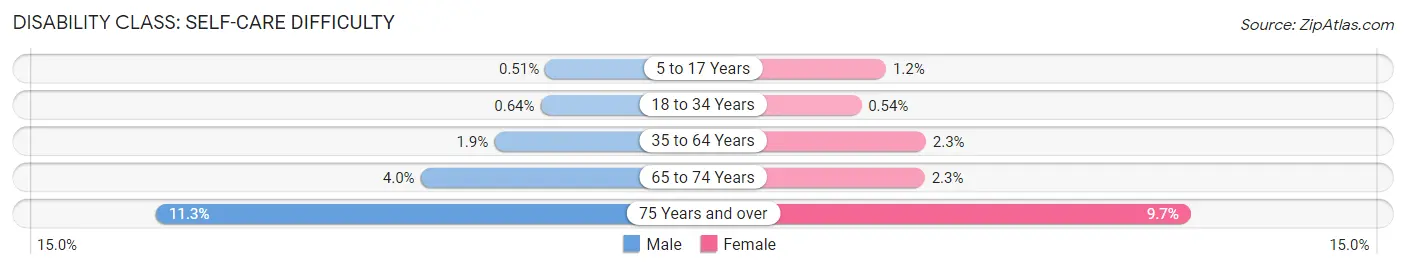
| Age Bracket | Male | Female |
| 5 to 17 Years | 26 (0.5%) | 63 (1.2%) |
| 18 to 34 Years | 59 (0.6%) | 53 (0.5%) |
| 35 to 64 Years | 274 (1.9%) | 327 (2.3%) |
| 65 to 74 Years | 137 (4.0%) | 101 (2.3%) |
| 75 Years and over | 313 (11.3%) | 430 (9.7%) |
Technology Access in Cheektowaga
Computing Device Access in Cheektowaga
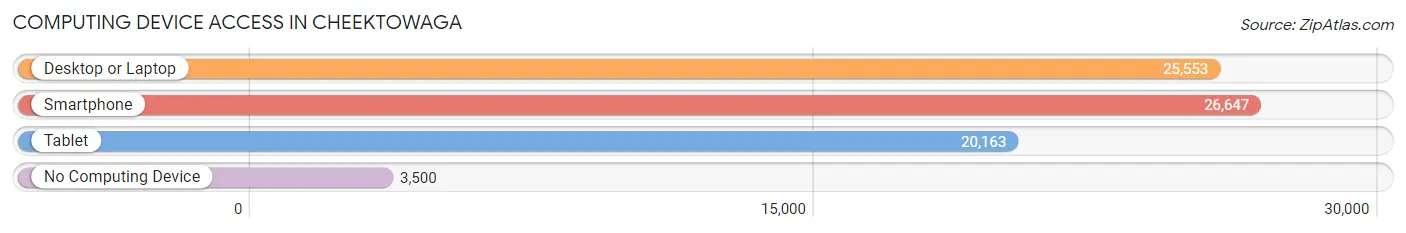
| Device Type | # Households | % Households |
| Desktop or Laptop | 25,553 | 75.0% |
| Smartphone | 26,647 | 78.2% |
| Tablet | 20,163 | 59.2% |
| No Computing Device | 3,500 | 10.3% |
| Total | 34,065 | 100.0% |
Internet Access in Cheektowaga
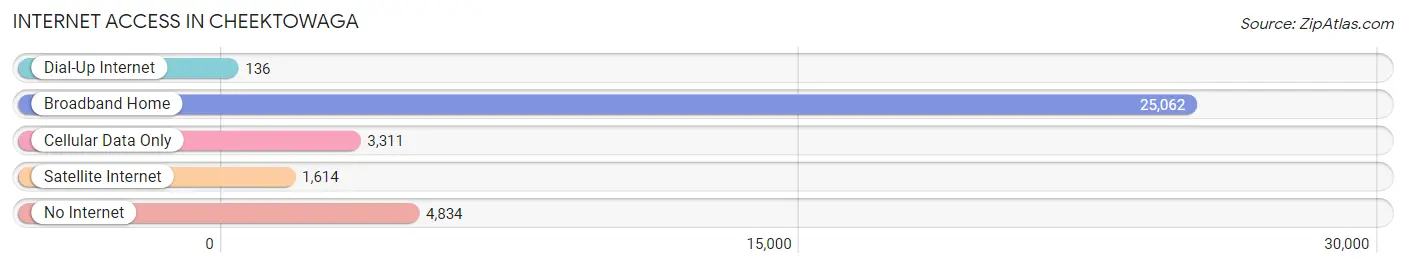
| Internet Type | # Households | % Households |
| Dial-Up Internet | 136 | 0.4% |
| Broadband Home | 25,062 | 73.6% |
| Cellular Data Only | 3,311 | 9.7% |
| Satellite Internet | 1,614 | 4.7% |
| No Internet | 4,834 | 14.2% |
| Total | 34,065 | 100.0% |
Cheektowaga Summary
Cheektowaga is a town located in Erie County, New York, United States. It is part of the Buffalo-Niagara Falls metropolitan area. As of the 2010 census, the town had a total population of 88,226. The town is in the north-central part of the county and borders the city of Buffalo.
History
Cheektowaga was first settled in 1806 by a group of German immigrants. The town was originally part of the town of Amherst, but was separated in 1839 and incorporated as its own town. The name Cheektowaga is derived from a Native American word meaning "place of the crabapple tree".
The town was largely agricultural until the 1950s, when it began to experience rapid growth due to the influx of people from Buffalo. This growth continued into the 1970s, when the town became a major suburb of Buffalo.
Geography
Cheektowaga is located in the north-central part of Erie County, bordered by the city of Buffalo to the west and the towns of Amherst and Lancaster to the east. The town is located on the eastern edge of the Niagara Frontier, and is part of the Buffalo-Niagara Falls metropolitan area.
The town has a total area of 33.2 square miles, of which 32.9 square miles is land and 0.3 square miles is water. The town is bisected by the Niagara River, which forms the border between Erie County and Niagara County.
Economy
Cheektowaga is home to a variety of businesses and industries. The town is home to the Buffalo Niagara International Airport, which is the largest airport in the region. The airport is a major employer in the town, as well as a major source of economic activity.
The town is also home to a number of retail and service businesses, including the Walden Galleria Mall, which is the largest shopping mall in the region. The town is also home to a number of manufacturing and industrial businesses, including General Motors, which has a large plant in the town.
Demographics
As of the 2010 census, there were 88,226 people, 35,945 households, and 22,945 families residing in the town. The population density was 2,664.3 people per square mile. There were 37,945 housing units at an average density of 1,150.7 per square mile.
The racial makeup of the town was 87.2% White, 8.2% African American, 0.3% Native American, 1.7% Asian, 0.1% Pacific Islander, 0.7% from other races, and 1.9% from two or more races. Hispanic or Latino of any race were 3.2% of the population.
The median income for a household in the town was $45,945, and the median income for a family was $54,945. Males had a median income of $41,945 versus $31,945 for females. The per capita income for the town was $22,945. About 5.2% of families and 7.2% of the population were below the poverty line, including 9.2% of those under age 18 and 5.2% of those age 65 or over.
Common Questions
What is Per Capita Income in Cheektowaga?
Per Capita income in Cheektowaga is $34,897.
What is the Median Family Income in Cheektowaga?
Median Family Income in Cheektowaga is $81,433.
What is the Median Household income in Cheektowaga?
Median Household Income in Cheektowaga is $64,066.
What is Income or Wage Gap in Cheektowaga?
Income or Wage Gap in Cheektowaga is 17.7%.
Women in Cheektowaga earn 82.3 cents for every dollar earned by a man.
What is Family Income Deficit in Cheektowaga?
Family Income Deficit in Cheektowaga is $10,696.
Families that are below poverty line in Cheektowaga earn $10,696 less on average than the poverty threshold level.
What is Inequality or Gini Index in Cheektowaga?
Inequality or Gini Index in Cheektowaga is 0.40.
What is the Total Population of Cheektowaga?
Total Population of Cheektowaga is 76,483.
What is the Total Male Population of Cheektowaga?
Total Male Population of Cheektowaga is 36,922.
What is the Total Female Population of Cheektowaga?
Total Female Population of Cheektowaga is 39,561.
What is the Ratio of Males per 100 Females in Cheektowaga?
There are 93.33 Males per 100 Females in Cheektowaga.
What is the Ratio of Females per 100 Males in Cheektowaga?
There are 107.15 Females per 100 Males in Cheektowaga.
What is the Median Population Age in Cheektowaga?
Median Population Age in Cheektowaga is 39.2 Years.
What is the Average Family Size in Cheektowaga
Average Family Size in Cheektowaga is 2.9 People.
What is the Average Household Size in Cheektowaga
Average Household Size in Cheektowaga is 2.2 People.
How Large is the Labor Force in Cheektowaga?
There are 41,910 People in the Labor Forcein in Cheektowaga.
What is the Percentage of People in the Labor Force in Cheektowaga?
65.5% of People are in the Labor Force in Cheektowaga.
What is the Unemployment Rate in Cheektowaga?
Unemployment Rate in Cheektowaga is 3.9%.