Paterson, NJ Map & Demographics
Paterson Map
Paterson Overview
$23,035
PER CAPITA INCOME
$59,976
AVG FAMILY INCOME
$52,092
AVG HOUSEHOLD INCOME
21.5%
WAGE / INCOME GAP [ % ]
78.5¢/ $1
WAGE / INCOME GAP [ $ ]
$10,869
FAMILY INCOME DEFICIT
0.47
INEQUALITY / GINI INDEX
157,864
TOTAL POPULATION
78,130
MALE POPULATION
79,734
FEMALE POPULATION
97.99
MALES / 100 FEMALES
102.05
FEMALES / 100 MALES
33.1
MEDIAN AGE
3.7
AVG FAMILY SIZE
3.1
AVG HOUSEHOLD SIZE
75,364
LABOR FORCE [ PEOPLE ]
63.4%
PERCENT IN LABOR FORCE
10.5%
UNEMPLOYMENT RATE
Income in Paterson
Income Overview in Paterson
Per Capita Income in Paterson is $23,035, while median incomes of families and households are $59,976 and $52,092 respectively.
| Characteristic | Number | Measure |
| Per Capita Income | 157,864 | $23,035 |
| Median Family Income | 36,335 | $59,976 |
| Mean Family Income | 36,335 | $76,904 |
| Median Household Income | 49,678 | $52,092 |
| Mean Household Income | 49,678 | $70,777 |
| Income Deficit | 36,335 | $10,869 |
| Wage / Income Gap (%) | 157,864 | 21.53% |
| Wage / Income Gap ($) | 157,864 | 78.47¢ per $1 |
| Gini / Inequality Index | 157,864 | 0.47 |
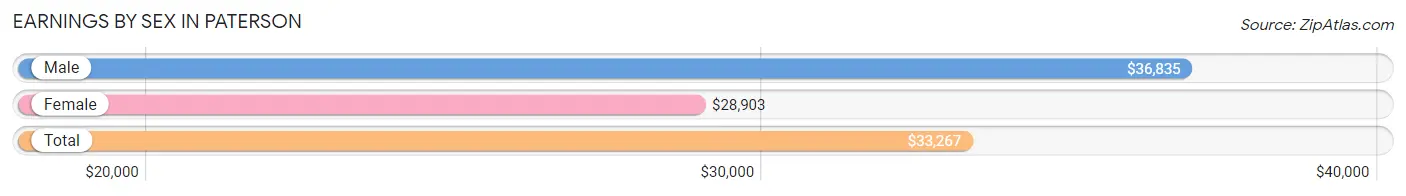
Earnings by Sex in Paterson
Average Earnings in Paterson are $33,267, $36,835 for men and $28,903 for women, a difference of 21.5%.
| Sex | Number | Average Earnings |
| Male | 40,269 (53.4%) | $36,835 |
| Female | 35,203 (46.6%) | $28,903 |
| Total | 75,472 (100.0%) | $33,267 |
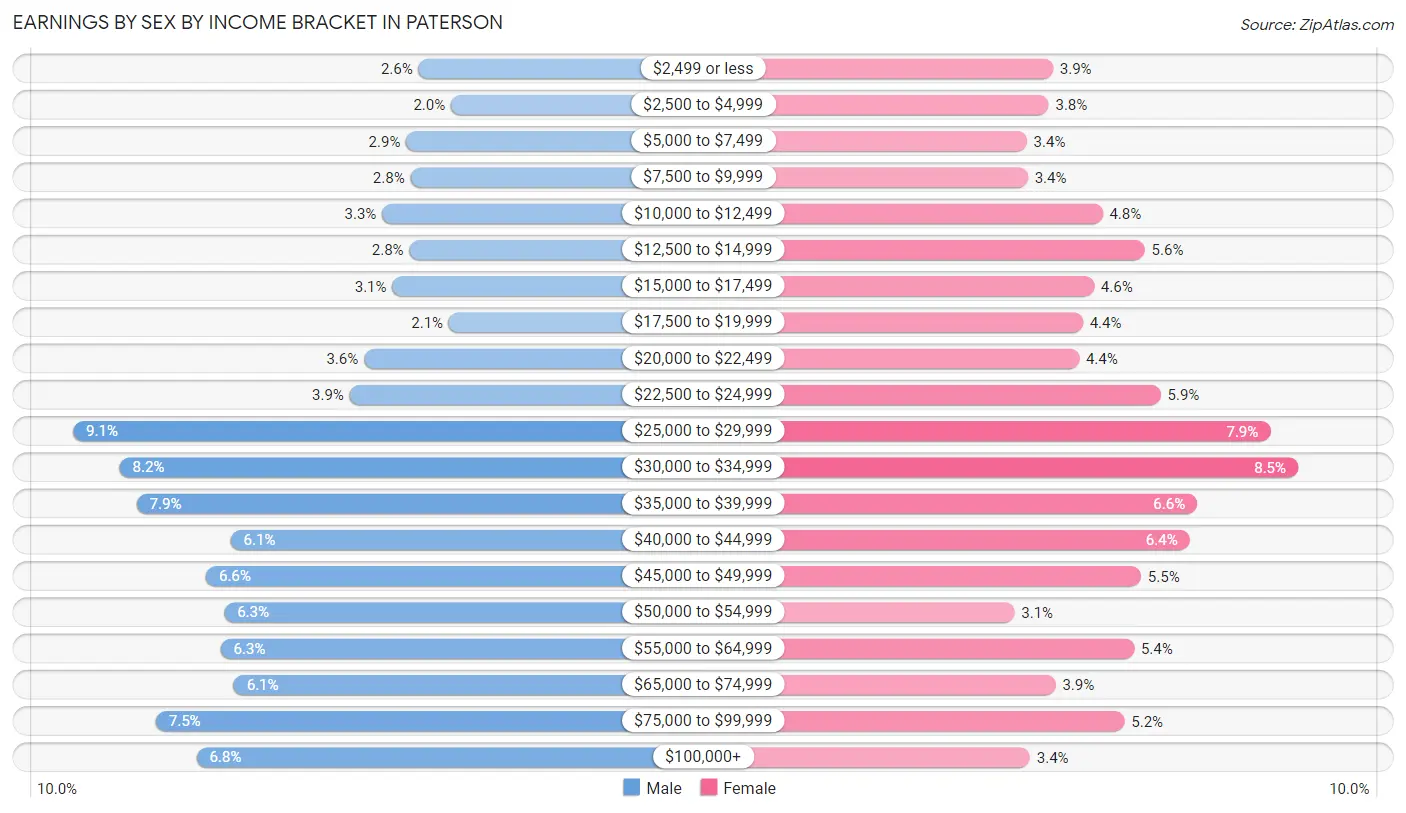
Earnings by Sex by Income Bracket in Paterson
The most common earnings brackets in Paterson are $25,000 to $29,999 for men (3,659 | 9.1%) and $30,000 to $34,999 for women (2,975 | 8.5%).
| Income | Male | Female |
| $2,499 or less | 1,056 (2.6%) | 1,360 (3.9%) |
| $2,500 to $4,999 | 809 (2.0%) | 1,332 (3.8%) |
| $5,000 to $7,499 | 1,149 (2.9%) | 1,186 (3.4%) |
| $7,500 to $9,999 | 1,115 (2.8%) | 1,192 (3.4%) |
| $10,000 to $12,499 | 1,329 (3.3%) | 1,687 (4.8%) |
| $12,500 to $14,999 | 1,125 (2.8%) | 1,963 (5.6%) |
| $15,000 to $17,499 | 1,254 (3.1%) | 1,630 (4.6%) |
| $17,500 to $19,999 | 825 (2.1%) | 1,556 (4.4%) |
| $20,000 to $22,499 | 1,467 (3.6%) | 1,531 (4.3%) |
| $22,500 to $24,999 | 1,575 (3.9%) | 2,071 (5.9%) |
| $25,000 to $29,999 | 3,659 (9.1%) | 2,792 (7.9%) |
| $30,000 to $34,999 | 3,310 (8.2%) | 2,975 (8.5%) |
| $35,000 to $39,999 | 3,181 (7.9%) | 2,308 (6.6%) |
| $40,000 to $44,999 | 2,472 (6.1%) | 2,261 (6.4%) |
| $45,000 to $49,999 | 2,658 (6.6%) | 1,941 (5.5%) |
| $50,000 to $54,999 | 2,522 (6.3%) | 1,106 (3.1%) |
| $55,000 to $64,999 | 2,550 (6.3%) | 1,894 (5.4%) |
| $65,000 to $74,999 | 2,448 (6.1%) | 1,377 (3.9%) |
| $75,000 to $99,999 | 3,036 (7.5%) | 1,832 (5.2%) |
| $100,000+ | 2,729 (6.8%) | 1,209 (3.4%) |
| Total | 40,269 (100.0%) | 35,203 (100.0%) |
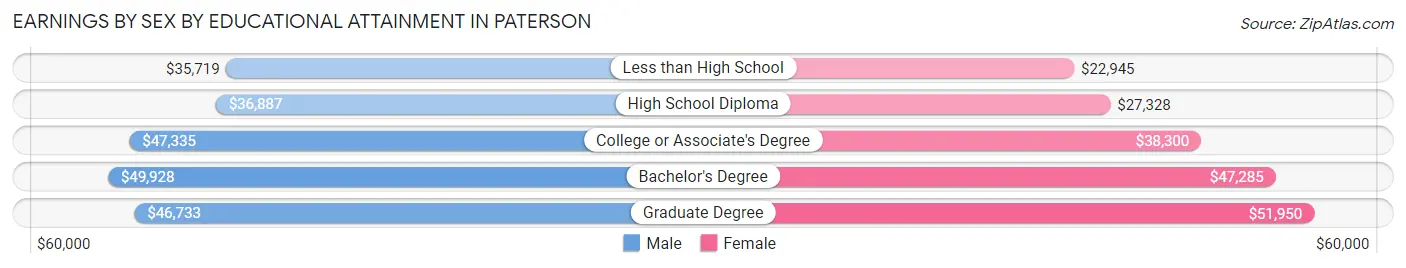
Earnings by Sex by Educational Attainment in Paterson
Average earnings in Paterson are $41,003 for men and $31,665 for women, a difference of 22.8%. Men with an educational attainment of bachelor's degree enjoy the highest average annual earnings of $49,928, while those with less than high school education earn the least with $35,719. Women with an educational attainment of graduate degree earn the most with the average annual earnings of $51,950, while those with less than high school education have the smallest earnings of $22,945.
| Educational Attainment | Male Income | Female Income |
| Less than High School | $35,719 | $22,945 |
| High School Diploma | $36,887 | $27,328 |
| College or Associate's Degree | $47,335 | $38,300 |
| Bachelor's Degree | $49,928 | $47,285 |
| Graduate Degree | $46,733 | $51,950 |
| Total | $41,003 | $31,665 |
Family Income in Paterson
Family Income Brackets in Paterson
According to the Paterson family income data, there are 6,104 families falling into the $50,000 to $74,999 income range, which is the most common income bracket and makes up 16.8% of all families. Conversely, the $10,000 to $14,999 income bracket is the least frequent group with only 1,599 families (4.4%) belonging to this category.
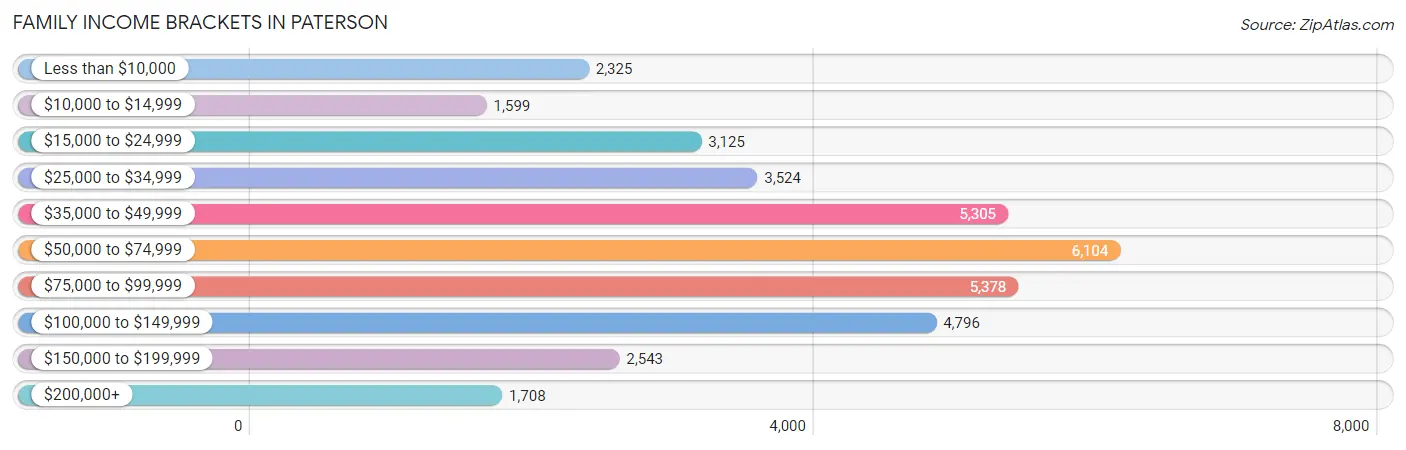
| Income Bracket | # Families | % Families |
| Less than $10,000 | 2,325 | 6.4% |
| $10,000 to $14,999 | 1,599 | 4.4% |
| $15,000 to $24,999 | 3,125 | 8.6% |
| $25,000 to $34,999 | 3,524 | 9.7% |
| $35,000 to $49,999 | 5,305 | 14.6% |
| $50,000 to $74,999 | 6,104 | 16.8% |
| $75,000 to $99,999 | 5,378 | 14.8% |
| $100,000 to $149,999 | 4,796 | 13.2% |
| $150,000 to $199,999 | 2,543 | 7.0% |
| $200,000+ | 1,708 | 4.7% |
Family Income by Famaliy Size in Paterson
7+ person families (1,821 | 5.0%) account for the highest median family income in Paterson with $115,031 per family, while 2-person families (11,290 | 31.1%) have the highest median income of $22,350 per family member.
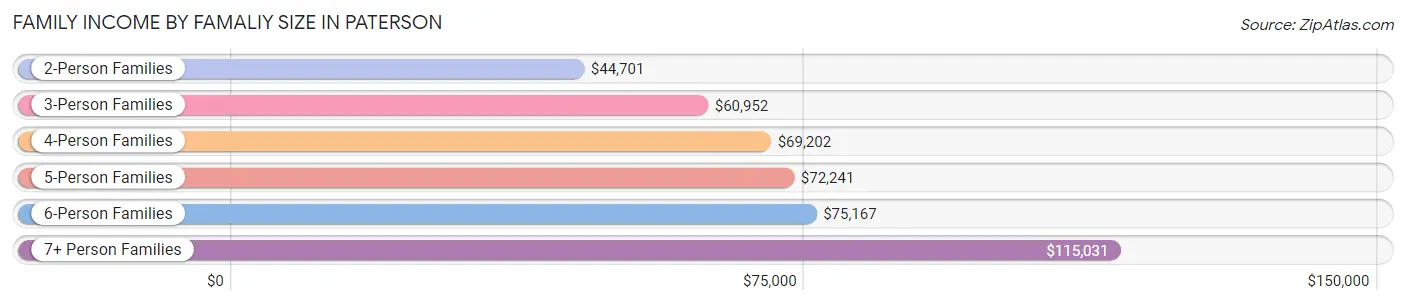
| Income Bracket | # Families | Median Income |
| 2-Person Families | 11,290 (31.1%) | $44,701 |
| 3-Person Families | 8,619 (23.7%) | $60,952 |
| 4-Person Families | 8,591 (23.6%) | $69,202 |
| 5-Person Families | 4,136 (11.4%) | $72,241 |
| 6-Person Families | 1,878 (5.2%) | $75,167 |
| 7+ Person Families | 1,821 (5.0%) | $115,031 |
| Total | 36,335 (100.0%) | $59,976 |
Family Income by Number of Earners in Paterson
The median family income in Paterson is $59,976, with families comprising 3+ earners (6,661) having the highest median family income of $129,107, while families with no earners (4,683) have the lowest median family income of $13,995, accounting for 18.3% and 12.9% of families, respectively.
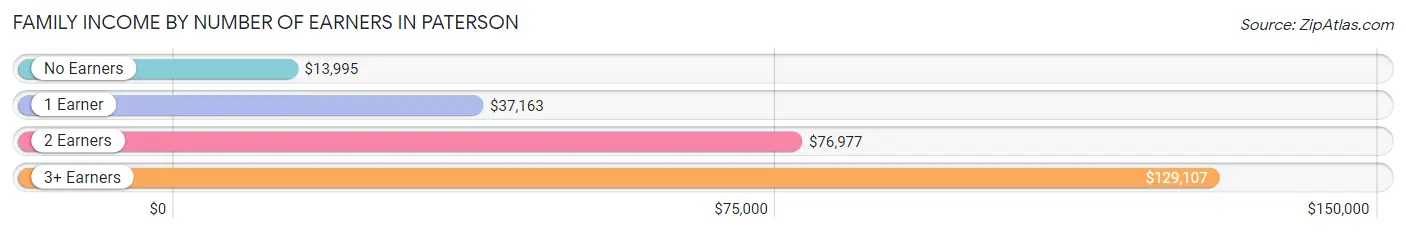
| Number of Earners | # Families | Median Income |
| No Earners | 4,683 (12.9%) | $13,995 |
| 1 Earner | 12,567 (34.6%) | $37,163 |
| 2 Earners | 12,424 (34.2%) | $76,977 |
| 3+ Earners | 6,661 (18.3%) | $129,107 |
| Total | 36,335 (100.0%) | $59,976 |
Household Income in Paterson
Household Income Brackets in Paterson
With 7,998 households falling in the category, the $50,000 to $74,999 income range is the most frequent in Paterson, accounting for 16.1% of all households. In contrast, only 2,236 households (4.5%) fall into the $200,000+ income bracket, making it the least populous group.
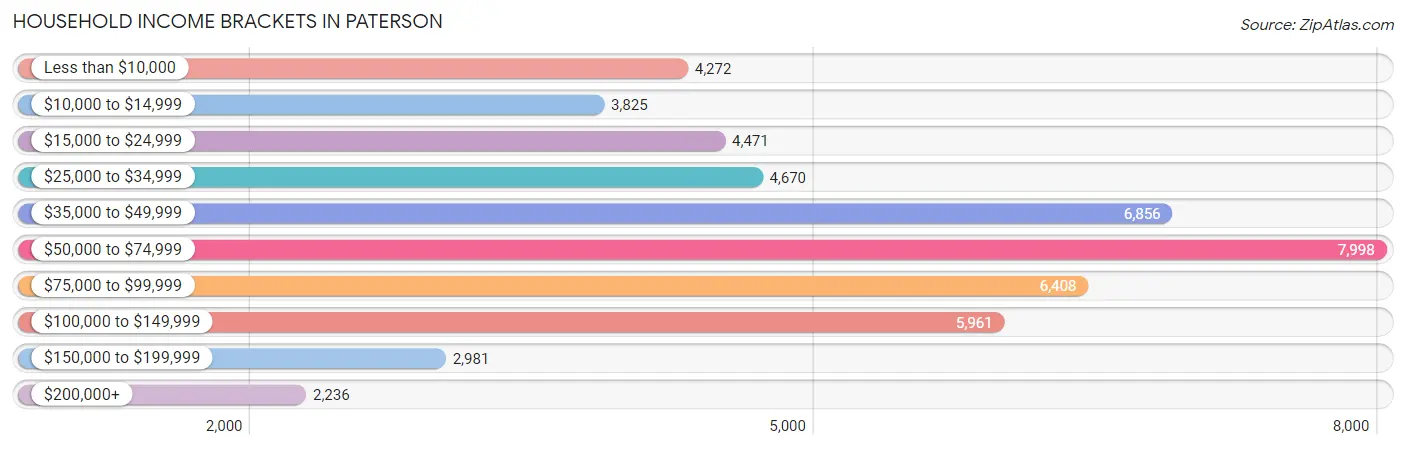
| Income Bracket | # Households | % Households |
| Less than $10,000 | 4,272 | 8.6% |
| $10,000 to $14,999 | 3,825 | 7.7% |
| $15,000 to $24,999 | 4,471 | 9.0% |
| $25,000 to $34,999 | 4,670 | 9.4% |
| $35,000 to $49,999 | 6,856 | 13.8% |
| $50,000 to $74,999 | 7,998 | 16.1% |
| $75,000 to $99,999 | 6,408 | 12.9% |
| $100,000 to $149,999 | 5,961 | 12.0% |
| $150,000 to $199,999 | 2,981 | 6.0% |
| $200,000+ | 2,236 | 4.5% |
Household Income by Householder Age in Paterson
The median household income in Paterson is $52,092, with the highest median household income of $63,813 found in the 45 to 64 years age bracket for the primary householder. A total of 20,037 households (40.3%) fall into this category. Meanwhile, the 65+ years age bracket for the primary householder has the lowest median household income of $29,910, with 10,291 households (20.7%) in this group.
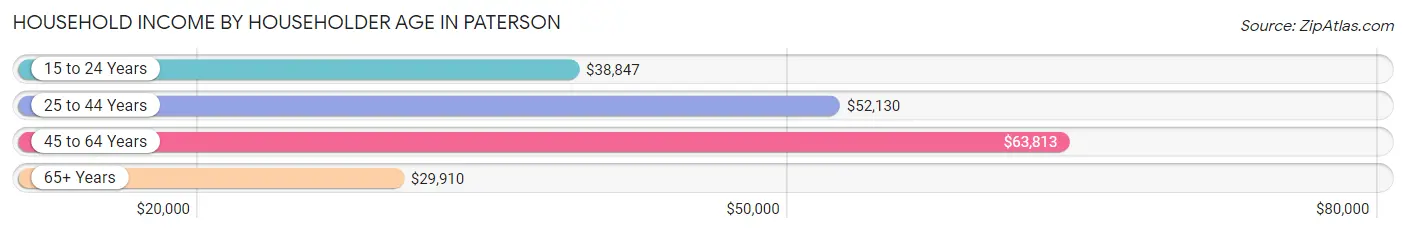
| Income Bracket | # Households | Median Income |
| 15 to 24 Years | 1,321 (2.7%) | $38,847 |
| 25 to 44 Years | 18,029 (36.3%) | $52,130 |
| 45 to 64 Years | 20,037 (40.3%) | $63,813 |
| 65+ Years | 10,291 (20.7%) | $29,910 |
| Total | 49,678 (100.0%) | $52,092 |
Poverty in Paterson
Income Below Poverty by Sex and Age in Paterson
With 22.1% poverty level for males and 25.3% for females among the residents of Paterson, 5 year old males and 15 year old females are the most vulnerable to poverty, with 540 males (41.8%) and 535 females (38.2%) in their respective age groups living below the poverty level.
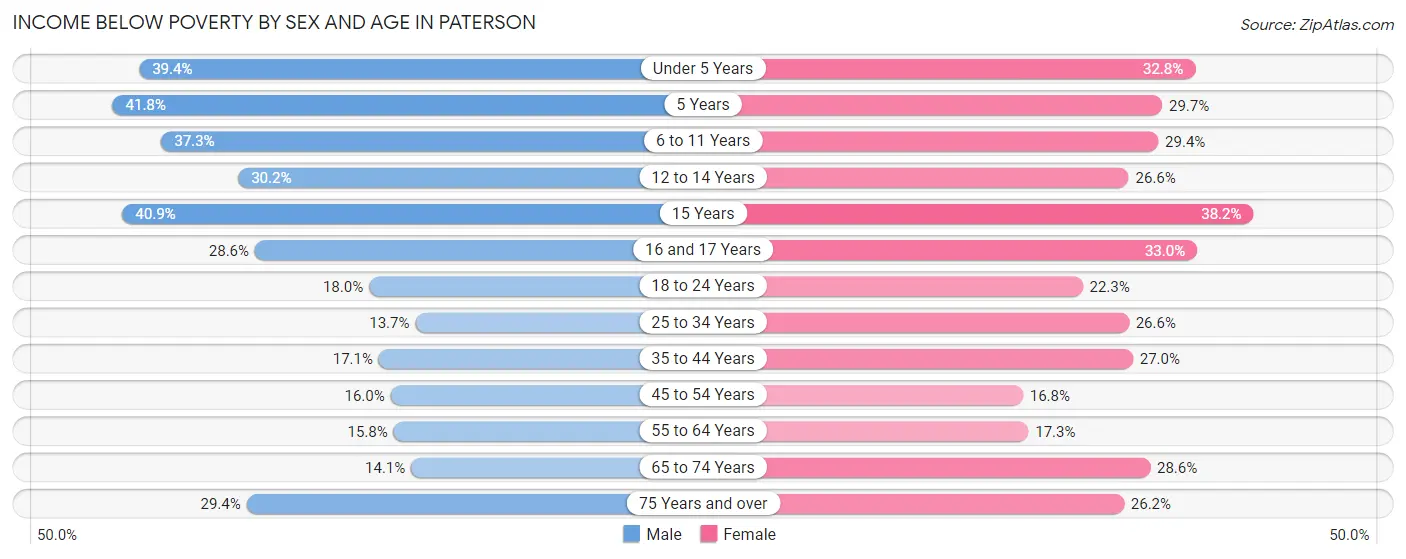
| Age Bracket | Male | Female |
| Under 5 Years | 2,458 (39.4%) | 2,000 (32.8%) |
| 5 Years | 540 (41.8%) | 356 (29.7%) |
| 6 to 11 Years | 2,773 (37.3%) | 2,027 (29.4%) |
| 12 to 14 Years | 1,139 (30.2%) | 848 (26.6%) |
| 15 Years | 426 (40.9%) | 535 (38.2%) |
| 16 and 17 Years | 637 (28.6%) | 706 (33.0%) |
| 18 to 24 Years | 1,443 (18.0%) | 1,769 (22.3%) |
| 25 to 34 Years | 1,623 (13.7%) | 3,134 (26.6%) |
| 35 to 44 Years | 1,688 (17.1%) | 2,767 (27.0%) |
| 45 to 54 Years | 1,524 (16.0%) | 1,612 (16.8%) |
| 55 to 64 Years | 1,285 (15.8%) | 1,530 (17.3%) |
| 65 to 74 Years | 724 (14.1%) | 1,678 (28.6%) |
| 75 Years and over | 843 (29.4%) | 1,078 (26.2%) |
| Total | 17,103 (22.1%) | 20,040 (25.3%) |
Income Above Poverty by Sex and Age in Paterson
According to the poverty statistics in Paterson, males aged 25 to 34 years and females aged 45 to 54 years are the age groups that are most secure financially, with 86.3% of males and 83.2% of females in these age groups living above the poverty line.
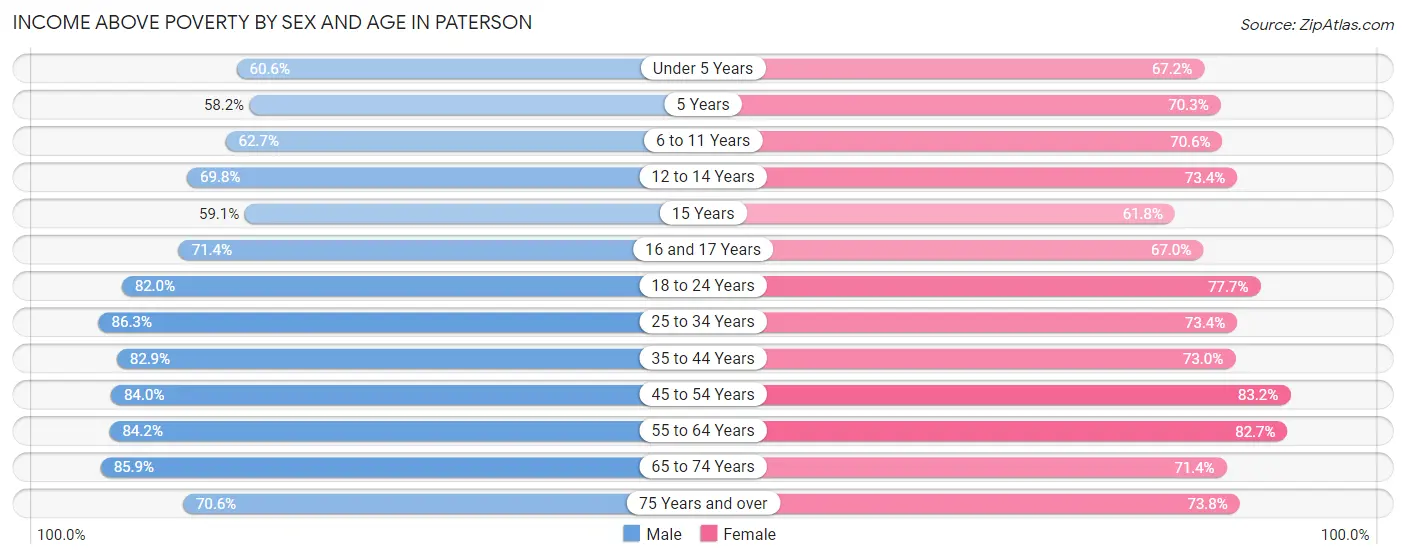
| Age Bracket | Male | Female |
| Under 5 Years | 3,787 (60.6%) | 4,102 (67.2%) |
| 5 Years | 751 (58.2%) | 842 (70.3%) |
| 6 to 11 Years | 4,659 (62.7%) | 4,877 (70.6%) |
| 12 to 14 Years | 2,636 (69.8%) | 2,338 (73.4%) |
| 15 Years | 615 (59.1%) | 866 (61.8%) |
| 16 and 17 Years | 1,588 (71.4%) | 1,436 (67.0%) |
| 18 to 24 Years | 6,557 (82.0%) | 6,151 (77.7%) |
| 25 to 34 Years | 10,193 (86.3%) | 8,634 (73.4%) |
| 35 to 44 Years | 8,166 (82.9%) | 7,478 (73.0%) |
| 45 to 54 Years | 7,978 (84.0%) | 7,984 (83.2%) |
| 55 to 64 Years | 6,866 (84.2%) | 7,308 (82.7%) |
| 65 to 74 Years | 4,401 (85.9%) | 4,187 (71.4%) |
| 75 Years and over | 2,024 (70.6%) | 3,040 (73.8%) |
| Total | 60,221 (77.9%) | 59,243 (74.7%) |
Income Below Poverty Among Married-Couple Families in Paterson
The poverty statistics for married-couple families in Paterson show that 11.1% or 1,941 of the total 17,418 families live below the poverty line. Families with 5 or more children have the highest poverty rate of 45.6%, comprising of 99 families. On the other hand, families with no children have the lowest poverty rate of 7.7%, which includes 607 families.
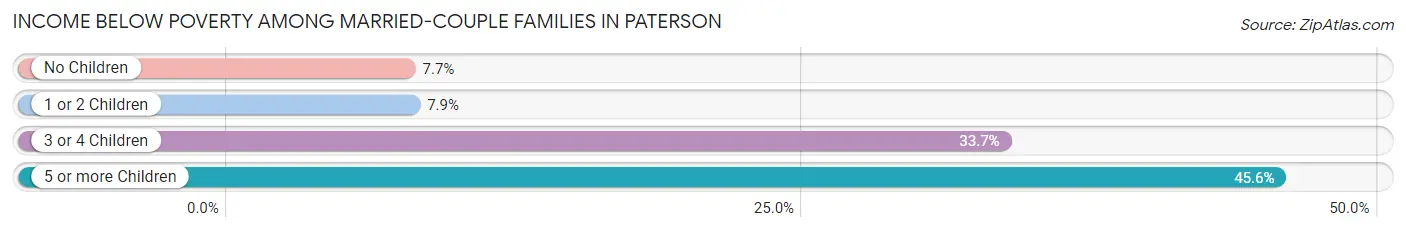
| Children | Above Poverty | Below Poverty |
| No Children | 7,246 (92.3%) | 607 (7.7%) |
| 1 or 2 Children | 6,840 (92.1%) | 589 (7.9%) |
| 3 or 4 Children | 1,273 (66.3%) | 646 (33.7%) |
| 5 or more Children | 118 (54.4%) | 99 (45.6%) |
| Total | 15,477 (88.9%) | 1,941 (11.1%) |
Income Below Poverty Among Single-Parent Households in Paterson
According to the poverty data in Paterson, 15.1% or 694 single-father households and 34.5% or 4,951 single-mother households are living below the poverty line. Among single-father households, those with 3 or 4 children have the highest poverty rate, with 200 households (42.4%) experiencing poverty. Likewise, among single-mother households, those with 3 or 4 children have the highest poverty rate, with 1,196 households (62.3%) falling below the poverty line.
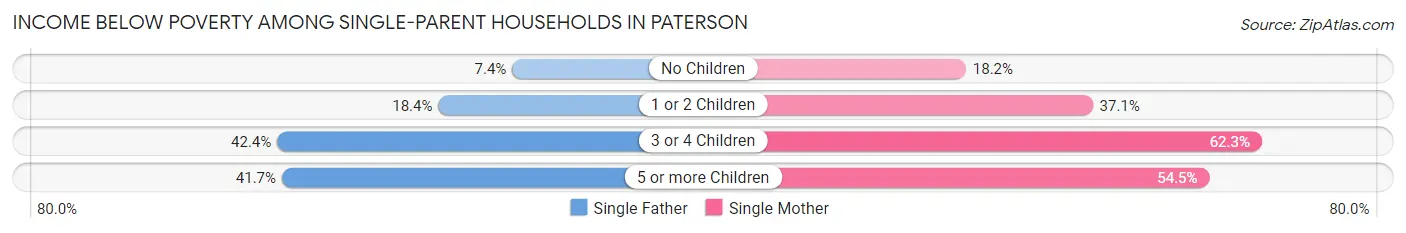
| Children | Single Father | Single Mother |
| No Children | 180 (7.3%) | 849 (18.2%) |
| 1 or 2 Children | 299 (18.3%) | 2,809 (37.1%) |
| 3 or 4 Children | 200 (42.4%) | 1,196 (62.3%) |
| 5 or more Children | 15 (41.7%) | 97 (54.5%) |
| Total | 694 (15.1%) | 4,951 (34.5%) |
Income Below Poverty Among Married-Couple vs Single-Parent Households in Paterson
The poverty data for Paterson shows that 1,941 of the married-couple family households (11.1%) and 5,645 of the single-parent households (29.8%) are living below the poverty level. Within the married-couple family households, those with 5 or more children have the highest poverty rate, with 99 households (45.6%) falling below the poverty line. Among the single-parent households, those with 3 or 4 children have the highest poverty rate, with 1,396 household (58.4%) living below poverty.
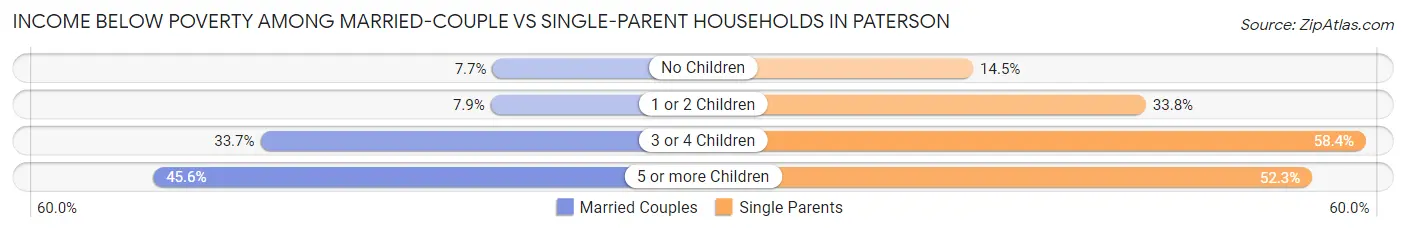
| Children | Married-Couple Families | Single-Parent Households |
| No Children | 607 (7.7%) | 1,029 (14.5%) |
| 1 or 2 Children | 589 (7.9%) | 3,108 (33.8%) |
| 3 or 4 Children | 646 (33.7%) | 1,396 (58.4%) |
| 5 or more Children | 99 (45.6%) | 112 (52.3%) |
| Total | 1,941 (11.1%) | 5,645 (29.8%) |
Race in Paterson
The most populous races in Paterson are Hispanic or Latino (99,537 | 63.0%), Some other Race (56,927 | 36.1%), and Black / African American (38,481 | 24.4%).
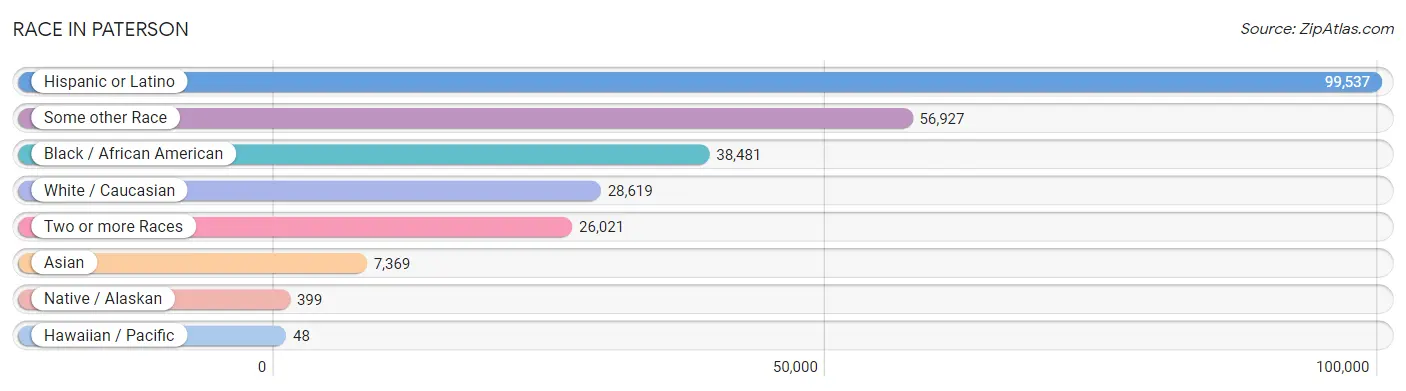
| Race | # Population | % Population |
| Asian | 7,369 | 4.7% |
| Black / African American | 38,481 | 24.4% |
| Hawaiian / Pacific | 48 | 0.0% |
| Hispanic or Latino | 99,537 | 63.0% |
| Native / Alaskan | 399 | 0.3% |
| White / Caucasian | 28,619 | 18.1% |
| Two or more Races | 26,021 | 16.5% |
| Some other Race | 56,927 | 36.1% |
| Total | 157,864 | 100.0% |
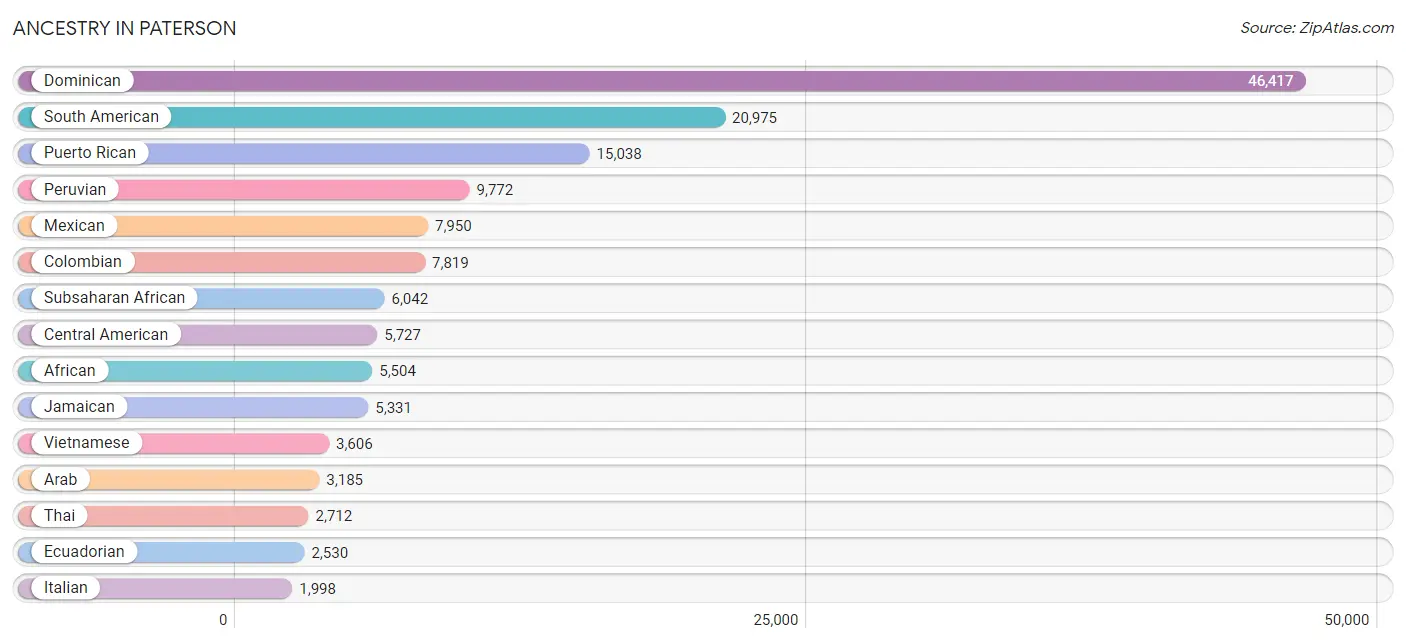
Ancestry in Paterson
The most populous ancestries reported in Paterson are Dominican (46,417 | 29.4%), South American (20,975 | 13.3%), Puerto Rican (15,038 | 9.5%), Peruvian (9,772 | 6.2%), and Mexican (7,950 | 5.0%), together accounting for 63.4% of all Paterson residents.
| Ancestry | # Population | % Population |
| Afghan | 71 | 0.0% |
| African | 5,504 | 3.5% |
| Albanian | 261 | 0.2% |
| American | 1,391 | 0.9% |
| Arab | 3,185 | 2.0% |
| Argentinean | 248 | 0.2% |
| Armenian | 38 | 0.0% |
| Australian | 2 | 0.0% |
| Austrian | 18 | 0.0% |
| Bhutanese | 65 | 0.0% |
| Blackfeet | 10 | 0.0% |
| Bolivian | 92 | 0.1% |
| Brazilian | 267 | 0.2% |
| British | 13 | 0.0% |
| British West Indian | 154 | 0.1% |
| Bulgarian | 20 | 0.0% |
| Burmese | 267 | 0.2% |
| Canadian | 57 | 0.0% |
| Central American | 5,727 | 3.6% |
| Central American Indian | 311 | 0.2% |
| Cherokee | 54 | 0.0% |
| Chilean | 58 | 0.0% |
| Colombian | 7,819 | 5.0% |
| Costa Rican | 1,420 | 0.9% |
| Cuban | 455 | 0.3% |
| Czechoslovakian | 39 | 0.0% |
| Dominican | 46,417 | 29.4% |
| Dutch | 89 | 0.1% |
| Eastern European | 11 | 0.0% |
| Ecuadorian | 2,530 | 1.6% |
| Egyptian | 544 | 0.3% |
| English | 232 | 0.2% |
| Ethiopian | 77 | 0.1% |
| European | 13 | 0.0% |
| French | 109 | 0.1% |
| French Canadian | 11 | 0.0% |
| German | 620 | 0.4% |
| Ghanaian | 350 | 0.2% |
| Greek | 95 | 0.1% |
| Guatemalan | 1,365 | 0.9% |
| Guyanese | 453 | 0.3% |
| Haitian | 930 | 0.6% |
| Honduran | 832 | 0.5% |
| Hungarian | 57 | 0.0% |
| Indian (Asian) | 81 | 0.1% |
| Iraqi | 39 | 0.0% |
| Irish | 1,148 | 0.7% |
| Israeli | 9 | 0.0% |
| Italian | 1,998 | 1.3% |
| Jamaican | 5,331 | 3.4% |
| Jordanian | 993 | 0.6% |
| Korean | 185 | 0.1% |
| Laotian | 28 | 0.0% |
| Lebanese | 18 | 0.0% |
| Lithuanian | 68 | 0.0% |
| Macedonian | 97 | 0.1% |
| Mexican | 7,950 | 5.0% |
| Moroccan | 207 | 0.1% |
| Native Hawaiian | 10 | 0.0% |
| Nicaraguan | 333 | 0.2% |
| Nigerian | 84 | 0.1% |
| Norwegian | 49 | 0.0% |
| Pakistani | 49 | 0.0% |
| Palestinian | 452 | 0.3% |
| Peruvian | 9,772 | 6.2% |
| Polish | 499 | 0.3% |
| Portuguese | 57 | 0.0% |
| Puerto Rican | 15,038 | 9.5% |
| Romanian | 14 | 0.0% |
| Russian | 254 | 0.2% |
| Salvadoran | 1,777 | 1.1% |
| Scotch-Irish | 38 | 0.0% |
| Scottish | 78 | 0.1% |
| Serbian | 123 | 0.1% |
| Slovak | 29 | 0.0% |
| South African | 13 | 0.0% |
| South American | 20,975 | 13.3% |
| South American Indian | 71 | 0.0% |
| Spaniard | 350 | 0.2% |
| Spanish | 82 | 0.1% |
| Sri Lankan | 19 | 0.0% |
| Subsaharan African | 6,042 | 3.8% |
| Swedish | 35 | 0.0% |
| Swiss | 28 | 0.0% |
| Syrian | 202 | 0.1% |
| Thai | 2,712 | 1.7% |
| Trinidadian and Tobagonian | 161 | 0.1% |
| Turkish | 846 | 0.5% |
| Ugandan | 13 | 0.0% |
| Ukrainian | 17 | 0.0% |
| Uruguayan | 81 | 0.1% |
| Venezuelan | 311 | 0.2% |
| Vietnamese | 3,606 | 2.3% |
| West Indian | 133 | 0.1% |
| Yugoslavian | 43 | 0.0% | View All 95 Rows |
Immigrants in Paterson
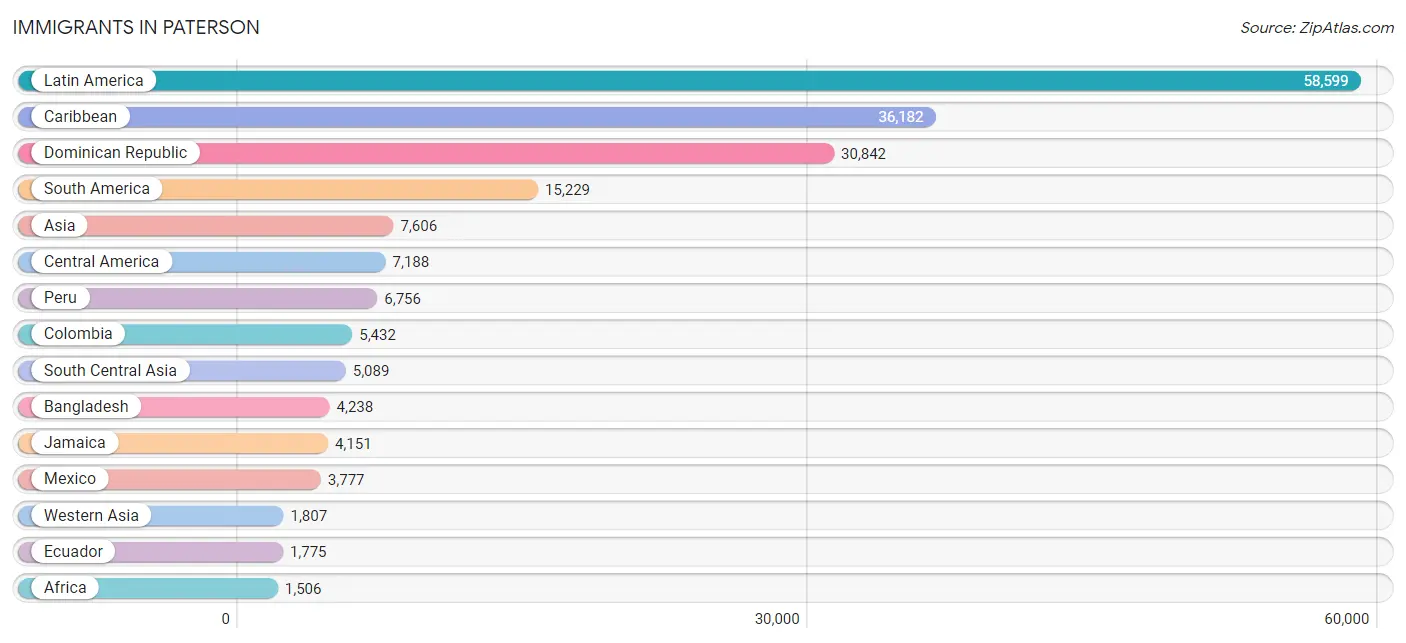
The most numerous immigrant groups reported in Paterson came from Latin America (58,599 | 37.1%), Caribbean (36,182 | 22.9%), Dominican Republic (30,842 | 19.5%), South America (15,229 | 9.7%), and Asia (7,606 | 4.8%), together accounting for 94.1% of all Paterson residents.
| Immigration Origin | # Population | % Population |
| Afghanistan | 71 | 0.0% |
| Africa | 1,506 | 0.9% |
| Albania | 365 | 0.2% |
| Argentina | 177 | 0.1% |
| Asia | 7,606 | 4.8% |
| Austria | 16 | 0.0% |
| Bahamas | 22 | 0.0% |
| Bangladesh | 4,238 | 2.7% |
| Belize | 24 | 0.0% |
| Bolivia | 75 | 0.1% |
| Brazil | 279 | 0.2% |
| Bulgaria | 1 | 0.0% |
| Canada | 45 | 0.0% |
| Caribbean | 36,182 | 22.9% |
| Central America | 7,188 | 4.5% |
| Chile | 77 | 0.1% |
| China | 29 | 0.0% |
| Colombia | 5,432 | 3.4% |
| Costa Rica | 840 | 0.5% |
| Cuba | 281 | 0.2% |
| Dominica | 133 | 0.1% |
| Dominican Republic | 30,842 | 19.5% |
| Eastern Africa | 59 | 0.0% |
| Eastern Asia | 191 | 0.1% |
| Eastern Europe | 666 | 0.4% |
| Ecuador | 1,775 | 1.1% |
| Egypt | 392 | 0.3% |
| El Salvador | 1,190 | 0.7% |
| England | 45 | 0.0% |
| Europe | 1,186 | 0.7% |
| France | 104 | 0.1% |
| Germany | 23 | 0.0% |
| Ghana | 536 | 0.3% |
| Guatemala | 532 | 0.3% |
| Guyana | 391 | 0.3% |
| Haiti | 562 | 0.4% |
| Honduras | 581 | 0.4% |
| Hungary | 20 | 0.0% |
| India | 352 | 0.2% |
| Indonesia | 35 | 0.0% |
| Iran | 8 | 0.0% |
| Iraq | 39 | 0.0% |
| Italy | 259 | 0.2% |
| Jamaica | 4,151 | 2.6% |
| Japan | 19 | 0.0% |
| Jordan | 672 | 0.4% |
| Kenya | 59 | 0.0% |
| Korea | 143 | 0.1% |
| Kuwait | 34 | 0.0% |
| Latin America | 58,599 | 37.1% |
| Lebanon | 126 | 0.1% |
| Liberia | 26 | 0.0% |
| Mexico | 3,777 | 2.4% |
| Morocco | 295 | 0.2% |
| Nicaragua | 244 | 0.2% |
| Nigeria | 68 | 0.0% |
| North Macedonia | 38 | 0.0% |
| Northern Africa | 715 | 0.4% |
| Northern Europe | 91 | 0.1% |
| Norway | 29 | 0.0% |
| Pakistan | 420 | 0.3% |
| Peru | 6,756 | 4.3% |
| Philippines | 126 | 0.1% |
| Poland | 40 | 0.0% |
| Portugal | 27 | 0.0% |
| Romania | 14 | 0.0% |
| Russia | 51 | 0.0% |
| Saudi Arabia | 68 | 0.0% |
| Serbia | 69 | 0.0% |
| South Africa | 13 | 0.0% |
| South America | 15,229 | 9.7% |
| South Central Asia | 5,089 | 3.2% |
| South Eastern Asia | 210 | 0.1% |
| Southern Europe | 286 | 0.2% |
| St. Vincent and the Grenadines | 34 | 0.0% |
| Syria | 156 | 0.1% |
| Thailand | 49 | 0.0% |
| Trinidad and Tobago | 146 | 0.1% |
| Turkey | 564 | 0.4% |
| Uruguay | 60 | 0.0% |
| Venezuela | 207 | 0.1% |
| Western Africa | 631 | 0.4% |
| Western Asia | 1,807 | 1.1% |
| Western Europe | 143 | 0.1% |
| Yemen | 75 | 0.1% | View All 85 Rows |
Sex and Age in Paterson
Sex and Age in Paterson
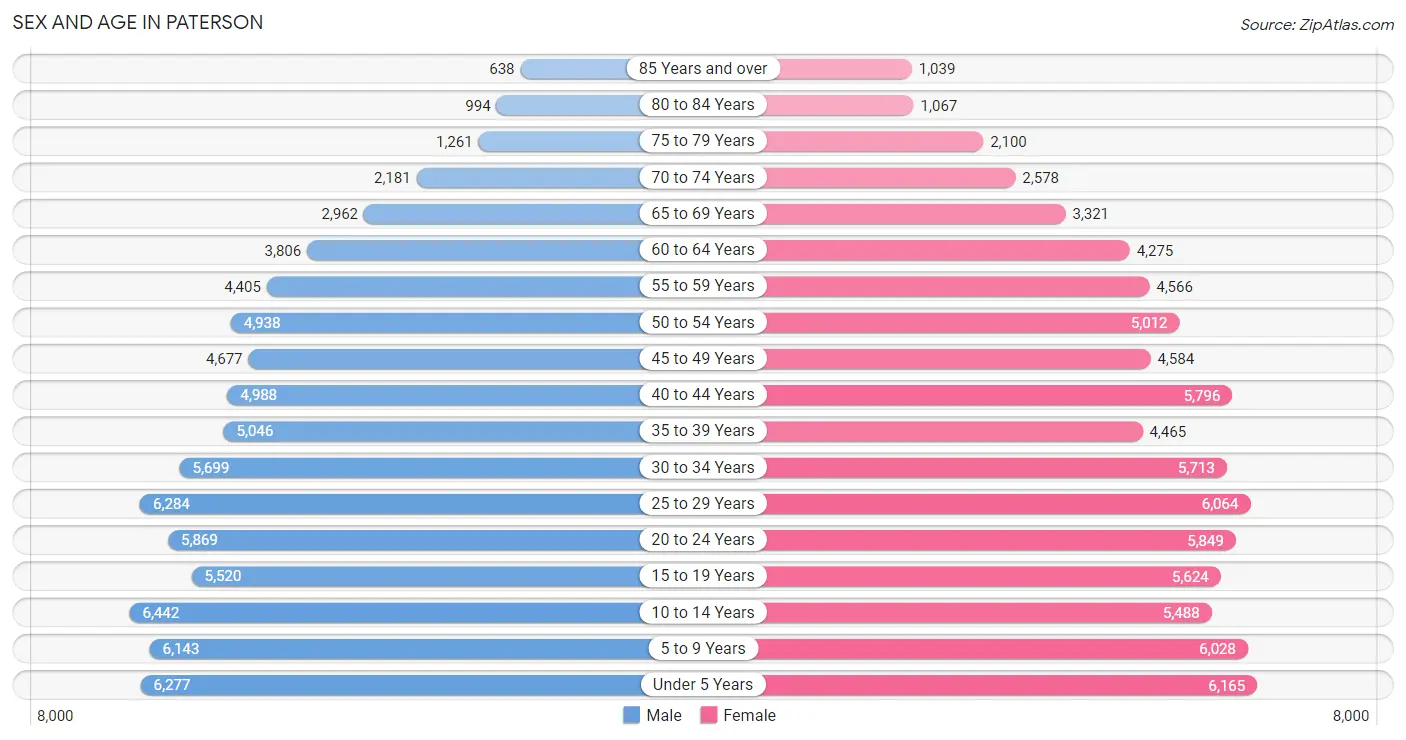
The most populous age groups in Paterson are 10 to 14 Years (6,442 | 8.3%) for men and Under 5 Years (6,165 | 7.7%) for women.
| Age Bracket | Male | Female |
| Under 5 Years | 6,277 (8.0%) | 6,165 (7.7%) |
| 5 to 9 Years | 6,143 (7.9%) | 6,028 (7.6%) |
| 10 to 14 Years | 6,442 (8.3%) | 5,488 (6.9%) |
| 15 to 19 Years | 5,520 (7.1%) | 5,624 (7.0%) |
| 20 to 24 Years | 5,869 (7.5%) | 5,849 (7.3%) |
| 25 to 29 Years | 6,284 (8.0%) | 6,064 (7.6%) |
| 30 to 34 Years | 5,699 (7.3%) | 5,713 (7.2%) |
| 35 to 39 Years | 5,046 (6.5%) | 4,465 (5.6%) |
| 40 to 44 Years | 4,988 (6.4%) | 5,796 (7.3%) |
| 45 to 49 Years | 4,677 (6.0%) | 4,584 (5.8%) |
| 50 to 54 Years | 4,938 (6.3%) | 5,012 (6.3%) |
| 55 to 59 Years | 4,405 (5.6%) | 4,566 (5.7%) |
| 60 to 64 Years | 3,806 (4.9%) | 4,275 (5.4%) |
| 65 to 69 Years | 2,962 (3.8%) | 3,321 (4.2%) |
| 70 to 74 Years | 2,181 (2.8%) | 2,578 (3.2%) |
| 75 to 79 Years | 1,261 (1.6%) | 2,100 (2.6%) |
| 80 to 84 Years | 994 (1.3%) | 1,067 (1.3%) |
| 85 Years and over | 638 (0.8%) | 1,039 (1.3%) |
| Total | 78,130 (100.0%) | 79,734 (100.0%) |
Families and Households in Paterson
Median Family Size in Paterson
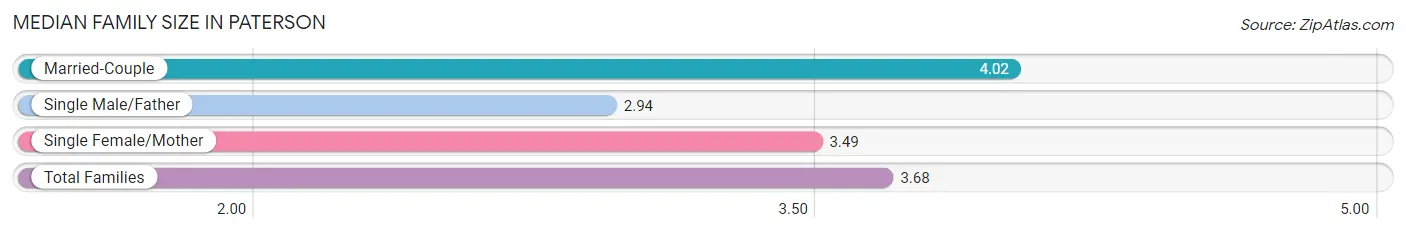
The median family size in Paterson is 3.68 persons per family, with married-couple families (17,418 | 47.9%) accounting for the largest median family size of 4.02 persons per family. On the other hand, single male/father families (4,585 | 12.6%) represent the smallest median family size with 2.94 persons per family.
| Family Type | # Families | Family Size |
| Married-Couple | 17,418 (47.9%) | 4.02 |
| Single Male/Father | 4,585 (12.6%) | 2.94 |
| Single Female/Mother | 14,332 (39.4%) | 3.49 |
| Total Families | 36,335 (100.0%) | 3.68 |
Median Household Size in Paterson
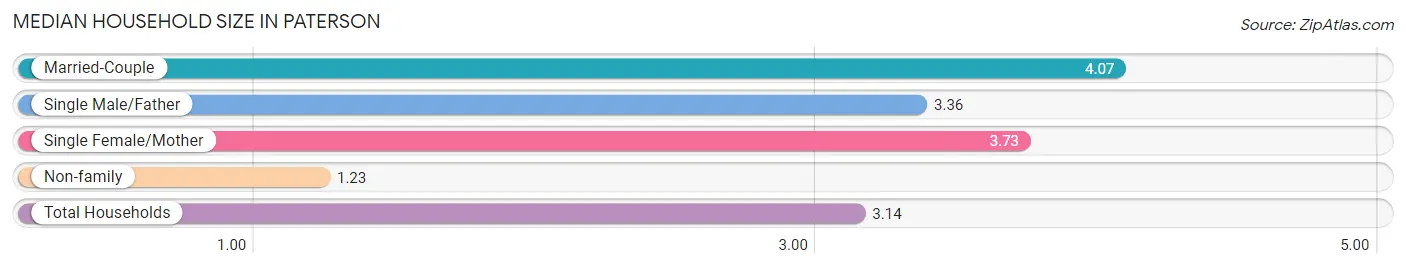
The median household size in Paterson is 3.14 persons per household, with married-couple households (17,418 | 35.1%) accounting for the largest median household size of 4.07 persons per household. non-family households (13,343 | 26.9%) represent the smallest median household size with 1.23 persons per household.
| Household Type | # Households | Household Size |
| Married-Couple | 17,418 (35.1%) | 4.07 |
| Single Male/Father | 4,585 (9.2%) | 3.36 |
| Single Female/Mother | 14,332 (28.8%) | 3.73 |
| Non-family | 13,343 (26.9%) | 1.23 |
| Total Households | 49,678 (100.0%) | 3.14 |
Household Size by Marriage Status in Paterson
Out of a total of 49,678 households in Paterson, 36,335 (73.1%) are family households, while 13,343 (26.9%) are nonfamily households. The most numerous type of family households are 2-person households, comprising 9,723, and the most common type of nonfamily households are 1-person households, comprising 11,112.
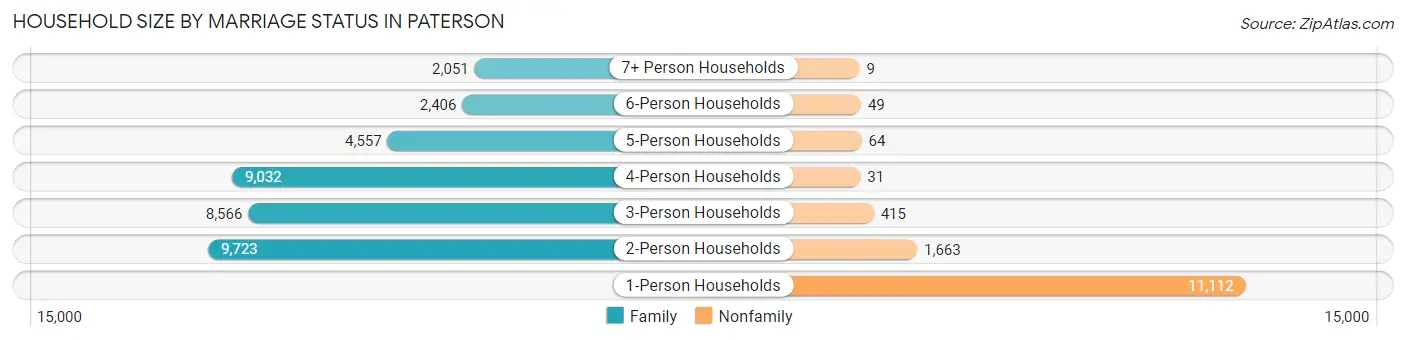
| Household Size | Family Households | Nonfamily Households |
| 1-Person Households | - | 11,112 (22.4%) |
| 2-Person Households | 9,723 (19.6%) | 1,663 (3.4%) |
| 3-Person Households | 8,566 (17.2%) | 415 (0.8%) |
| 4-Person Households | 9,032 (18.2%) | 31 (0.1%) |
| 5-Person Households | 4,557 (9.2%) | 64 (0.1%) |
| 6-Person Households | 2,406 (4.8%) | 49 (0.1%) |
| 7+ Person Households | 2,051 (4.1%) | 9 (0.0%) |
| Total | 36,335 (73.1%) | 13,343 (26.9%) |
Female Fertility in Paterson
Fertility by Age in Paterson
Average fertility rate in Paterson is 51.0 births per 1,000 women. Women in the age bracket of 20 to 34 years have the highest fertility rate with 90.0 births per 1,000 women. Women in the age bracket of 20 to 34 years acount for 79.8% of all women with births.
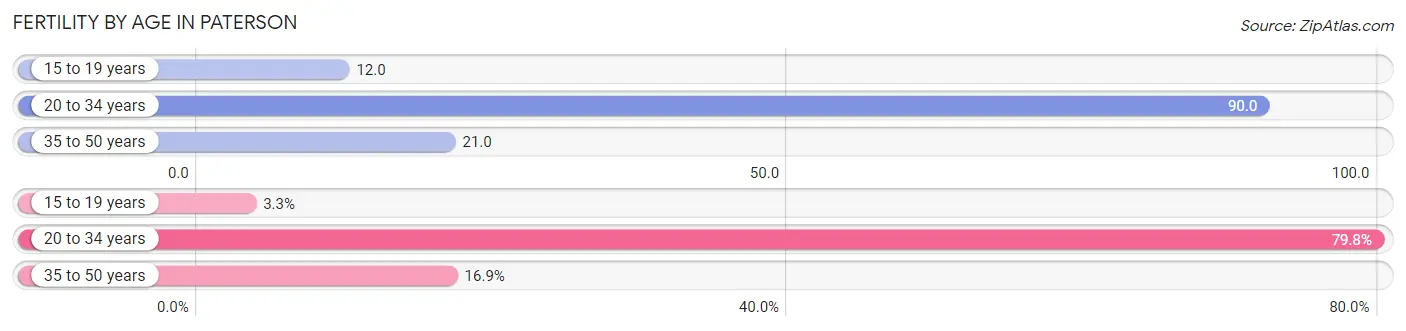
| Age Bracket | Women with Births | Births / 1,000 Women |
| 15 to 19 years | 65 (3.3%) | 12.0 |
| 20 to 34 years | 1,587 (79.8%) | 90.0 |
| 35 to 50 years | 337 (16.9%) | 21.0 |
| Total | 1,989 (100.0%) | 51.0 |
Fertility by Age by Marriage Status in Paterson
43.2% of women with births (1,989) in Paterson are married. The highest percentage of unmarried women with births falls into 15 to 19 years age bracket with 61.5% of them unmarried at the time of birth, while the lowest percentage of unmarried women with births belong to 35 to 50 years age bracket with 38.3% of them unmarried.
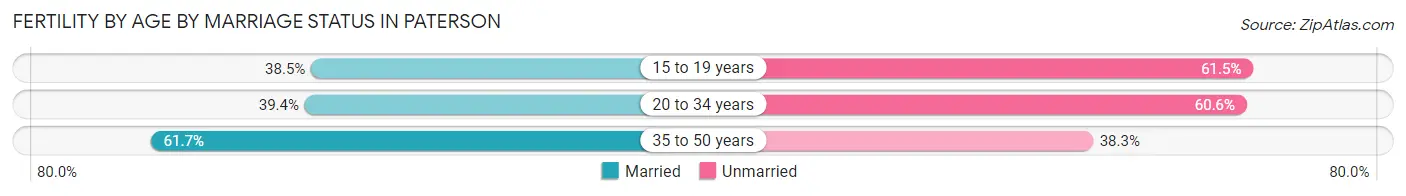
| Age Bracket | Married | Unmarried |
| 15 to 19 years | 25 (38.5%) | 40 (61.5%) |
| 20 to 34 years | 625 (39.4%) | 962 (60.6%) |
| 35 to 50 years | 208 (61.7%) | 129 (38.3%) |
| Total | 859 (43.2%) | 1,130 (56.8%) |
Fertility by Education in Paterson
Average fertility rate in Paterson is 51.0 births per 1,000 women. Women with the education attainment of graduate degree have the highest fertility rate of 71.0 births per 1,000 women, while women with the education attainment of less than high school have the lowest fertility at 35.0 births per 1,000 women. Women with the education attainment of college or associate's degree represent 38.2% of all women with births.
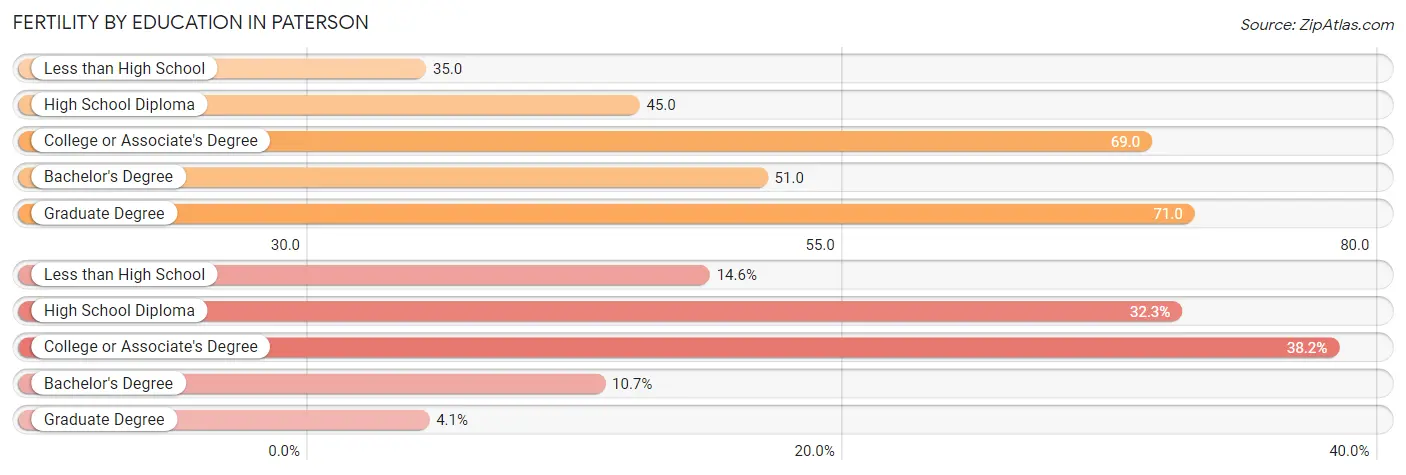
| Educational Attainment | Women with Births | Births / 1,000 Women |
| Less than High School | 291 (14.6%) | 35.0 |
| High School Diploma | 643 (32.3%) | 45.0 |
| College or Associate's Degree | 760 (38.2%) | 69.0 |
| Bachelor's Degree | 213 (10.7%) | 51.0 |
| Graduate Degree | 82 (4.1%) | 71.0 |
| Total | 1,989 (100.0%) | 51.0 |
Fertility by Education by Marriage Status in Paterson
56.8% of women with births in Paterson are unmarried. Women with the educational attainment of graduate degree are most likely to be married with 100.0% of them married at childbirth, while women with the educational attainment of college or associate's degree are least likely to be married with 69.6% of them unmarried at childbirth.
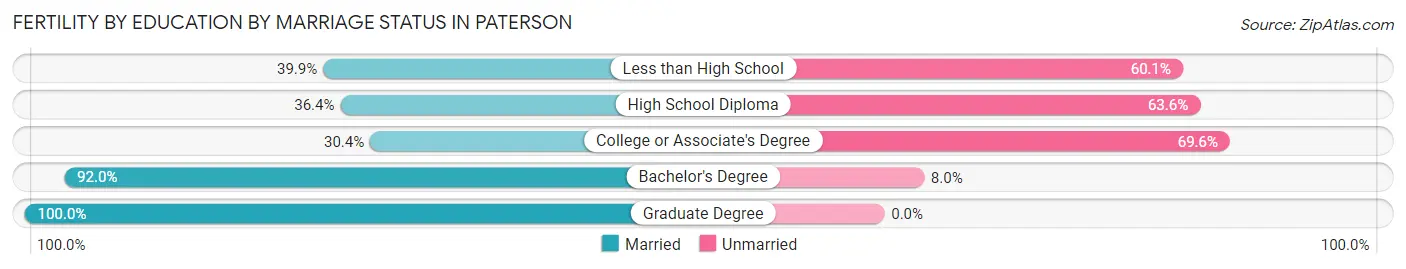
| Educational Attainment | Married | Unmarried |
| Less than High School | 116 (39.9%) | 175 (60.1%) |
| High School Diploma | 234 (36.4%) | 409 (63.6%) |
| College or Associate's Degree | 231 (30.4%) | 529 (69.6%) |
| Bachelor's Degree | 196 (92.0%) | 17 (8.0%) |
| Graduate Degree | 82 (100.0%) | 0 (0.0%) |
| Total | 859 (43.2%) | 1,130 (56.8%) |
Employment Characteristics in Paterson
Employment by Class of Employer in Paterson
Among the 65,934 employed individuals in Paterson, private company employees (53,646 | 81.4%), self-employed (not incorporated) (3,085 | 4.7%), and local government employees (2,710 | 4.1%) make up the most common classes of employment.
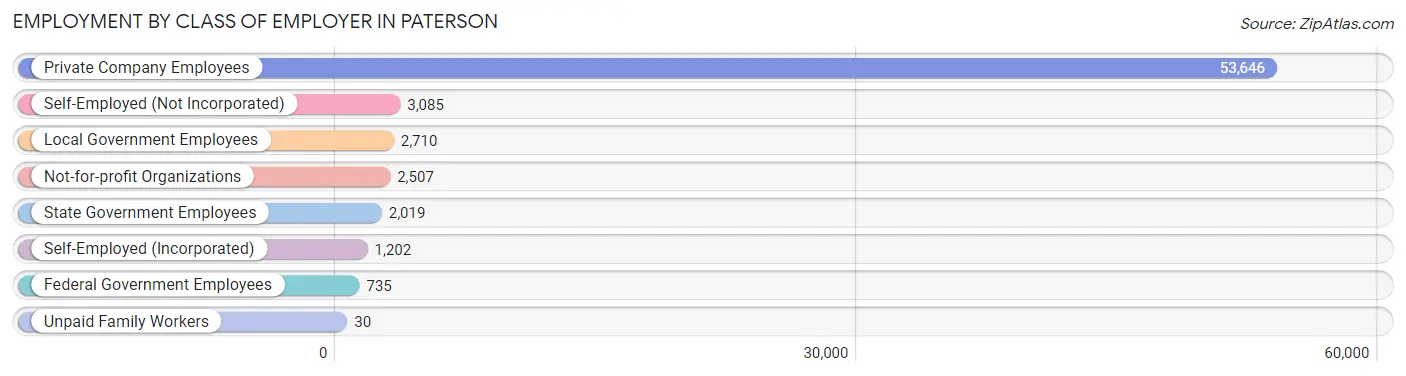
| Employer Class | # Employees | % Employees |
| Private Company Employees | 53,646 | 81.4% |
| Self-Employed (Incorporated) | 1,202 | 1.8% |
| Self-Employed (Not Incorporated) | 3,085 | 4.7% |
| Not-for-profit Organizations | 2,507 | 3.8% |
| Local Government Employees | 2,710 | 4.1% |
| State Government Employees | 2,019 | 3.1% |
| Federal Government Employees | 735 | 1.1% |
| Unpaid Family Workers | 30 | 0.1% |
| Total | 65,934 | 100.0% |
Employment Status by Age in Paterson
According to the labor force statistics for Paterson, out of the total population over 16 years of age (118,871), 63.4% or 75,364 individuals are in the labor force, with 10.5% or 7,913 of them unemployed. The age group with the highest labor force participation rate is 35 to 44 years, with 80.6% or 16,358 individuals in the labor force. Within the labor force, the 16 to 19 years age range has the highest percentage of unemployed individuals, with 17.9% or 426 of them being unemployed.
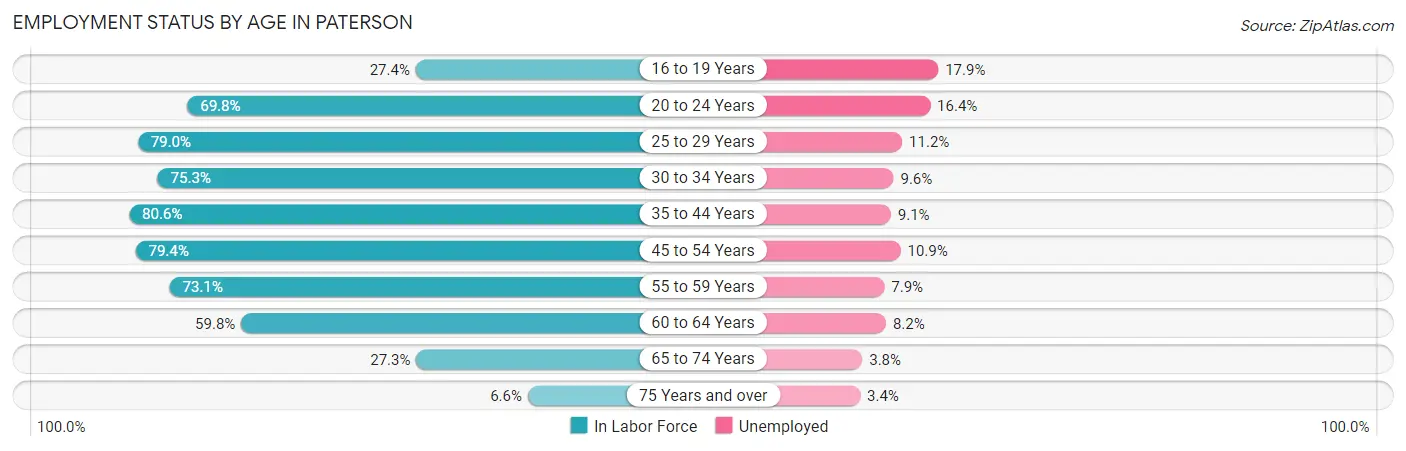
| Age Bracket | In Labor Force | Unemployed |
| 16 to 19 Years | 2,382 (27.4%) | 426 (17.9%) |
| 20 to 24 Years | 8,179 (69.8%) | 1,341 (16.4%) |
| 25 to 29 Years | 9,755 (79.0%) | 1,093 (11.2%) |
| 30 to 34 Years | 8,593 (75.3%) | 825 (9.6%) |
| 35 to 44 Years | 16,358 (80.6%) | 1,489 (9.1%) |
| 45 to 54 Years | 15,254 (79.4%) | 1,663 (10.9%) |
| 55 to 59 Years | 6,558 (73.1%) | 518 (7.9%) |
| 60 to 64 Years | 4,832 (59.8%) | 396 (8.2%) |
| 65 to 74 Years | 3,014 (27.3%) | 115 (3.8%) |
| 75 Years and over | 469 (6.6%) | 16 (3.4%) |
| Total | 75,364 (63.4%) | 7,913 (10.5%) |
Employment Status by Educational Attainment in Paterson
According to labor force statistics for Paterson, 76.4% of individuals (61,363) out of the total population between 25 and 64 years of age (80,318) are in the labor force, with 9.8% or 6,014 of them being unemployed. The group with the highest labor force participation rate are those with the educational attainment of college / associate degree, with 84.5% or 15,577 individuals in the labor force. Within the labor force, individuals with high school diploma education have the highest percentage of unemployment, with 11.4% or 2,990 of them being unemployed.
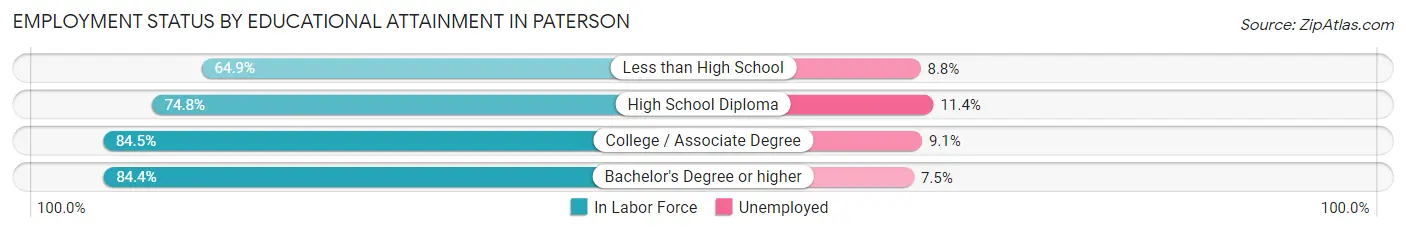
| Educational Attainment | In Labor Force | Unemployed |
| Less than High School | 10,288 (64.9%) | 1,395 (8.8%) |
| High School Diploma | 26,228 (74.8%) | 3,997 (11.4%) |
| College / Associate Degree | 15,577 (84.5%) | 1,677 (9.1%) |
| Bachelor's Degree or higher | 9,257 (84.4%) | 823 (7.5%) |
| Total | 61,363 (76.4%) | 7,871 (9.8%) |
Employment Occupations by Sex in Paterson
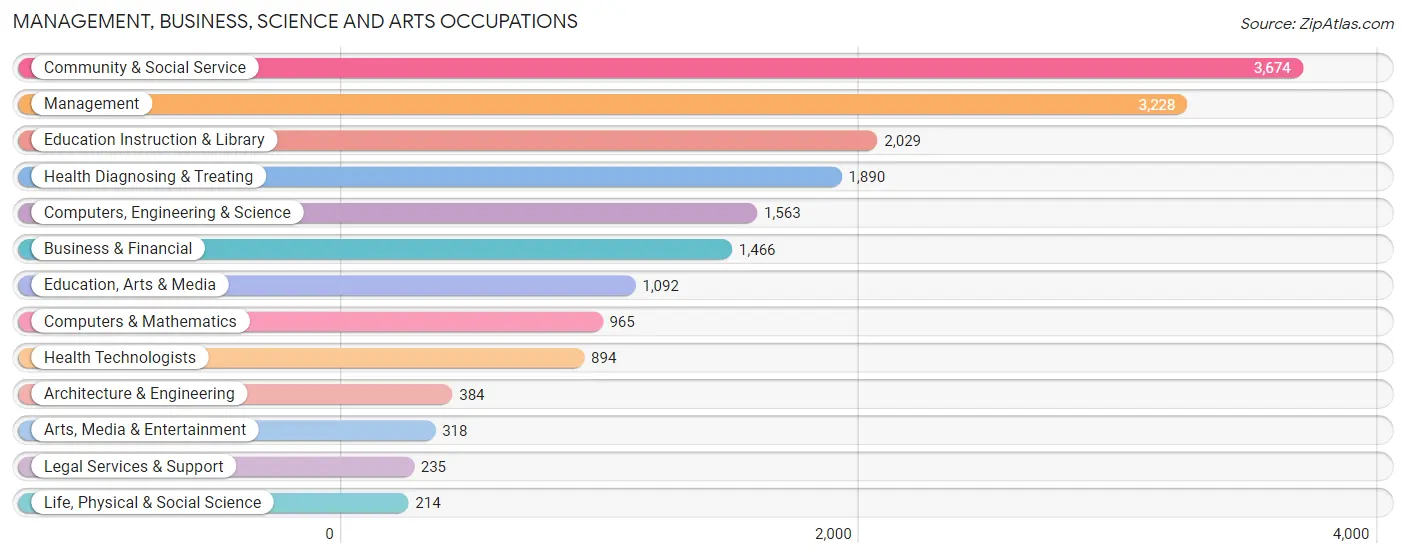
Management, Business, Science and Arts Occupations
The most common Management, Business, Science and Arts occupations in Paterson are Community & Social Service (3,674 | 5.4%), Management (3,228 | 4.8%), Education Instruction & Library (2,029 | 3.0%), Health Diagnosing & Treating (1,890 | 2.8%), and Computers, Engineering & Science (1,563 | 2.3%).
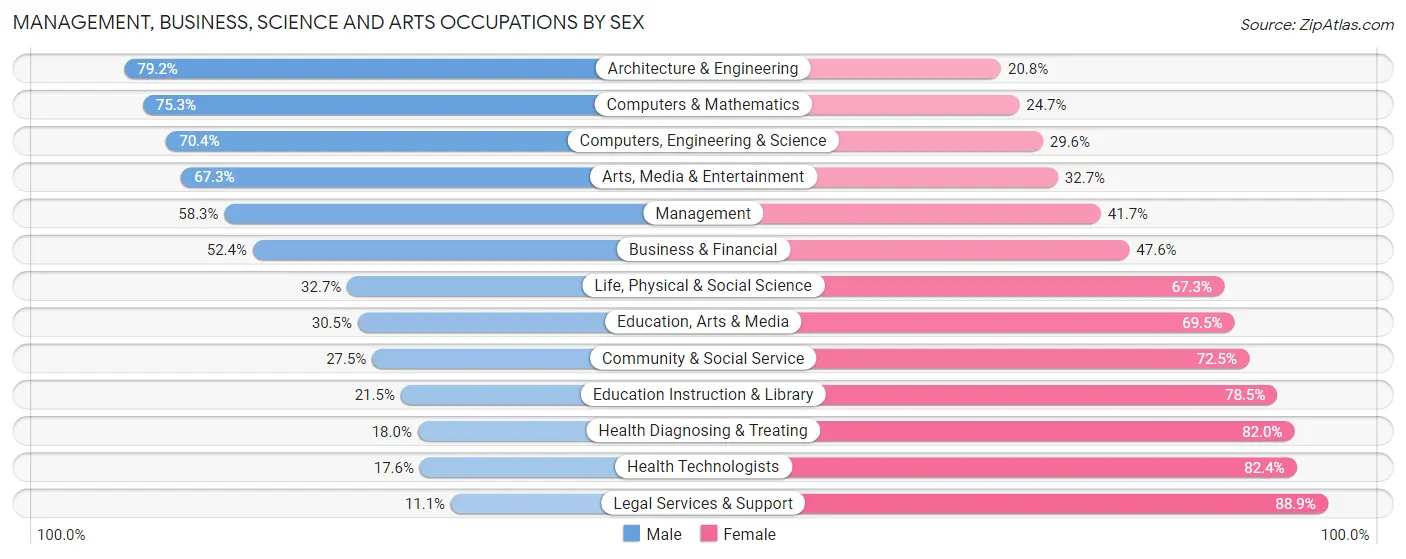
Management, Business, Science and Arts Occupations by Sex
Within the Management, Business, Science and Arts occupations in Paterson, the most male-oriented occupations are Architecture & Engineering (79.2%), Computers & Mathematics (75.3%), and Computers, Engineering & Science (70.4%), while the most female-oriented occupations are Legal Services & Support (88.9%), Health Technologists (82.4%), and Health Diagnosing & Treating (82.0%).
| Occupation | Male | Female |
| Management | 1,883 (58.3%) | 1,345 (41.7%) |
| Business & Financial | 768 (52.4%) | 698 (47.6%) |
| Computers, Engineering & Science | 1,101 (70.4%) | 462 (29.6%) |
| Computers & Mathematics | 727 (75.3%) | 238 (24.7%) |
| Architecture & Engineering | 304 (79.2%) | 80 (20.8%) |
| Life, Physical & Social Science | 70 (32.7%) | 144 (67.3%) |
| Community & Social Service | 1,010 (27.5%) | 2,664 (72.5%) |
| Education, Arts & Media | 333 (30.5%) | 759 (69.5%) |
| Legal Services & Support | 26 (11.1%) | 209 (88.9%) |
| Education Instruction & Library | 437 (21.5%) | 1,592 (78.5%) |
| Arts, Media & Entertainment | 214 (67.3%) | 104 (32.7%) |
| Health Diagnosing & Treating | 340 (18.0%) | 1,550 (82.0%) |
| Health Technologists | 157 (17.6%) | 737 (82.4%) |
| Total (Category) | 5,102 (43.2%) | 6,719 (56.8%) |
| Total (Overall) | 36,275 (53.8%) | 31,195 (46.2%) |
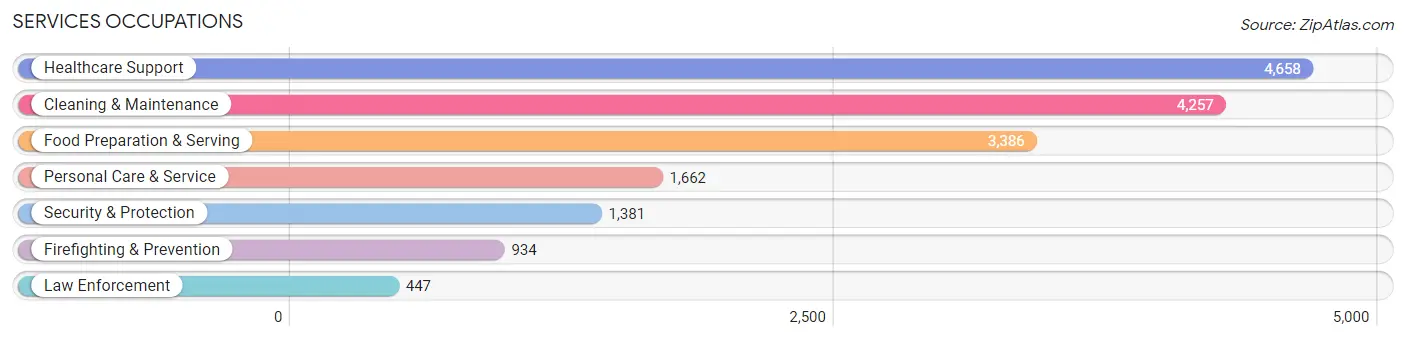
Services Occupations
The most common Services occupations in Paterson are Healthcare Support (4,658 | 6.9%), Cleaning & Maintenance (4,257 | 6.3%), Food Preparation & Serving (3,386 | 5.0%), Personal Care & Service (1,662 | 2.5%), and Security & Protection (1,381 | 2.1%).
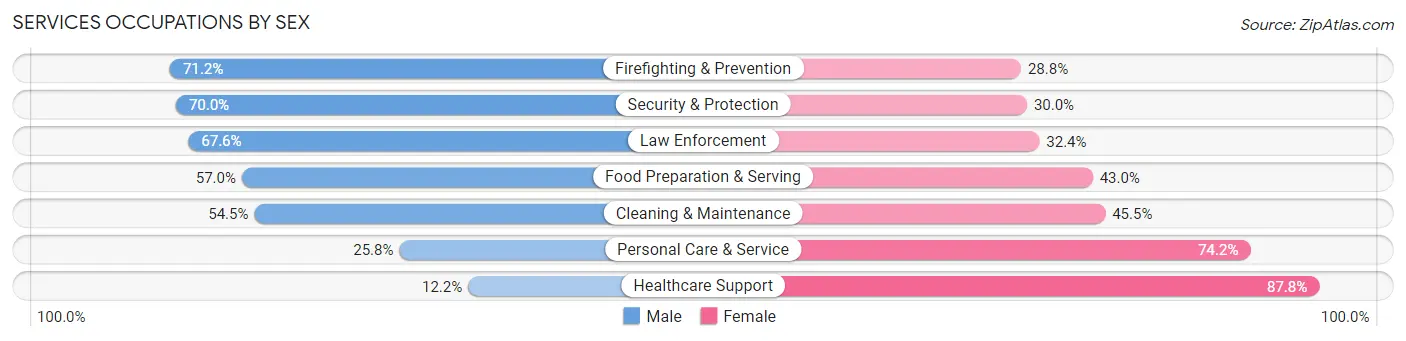
Services Occupations by Sex
Within the Services occupations in Paterson, the most male-oriented occupations are Firefighting & Prevention (71.2%), Security & Protection (70.0%), and Law Enforcement (67.6%), while the most female-oriented occupations are Healthcare Support (87.8%), Personal Care & Service (74.2%), and Cleaning & Maintenance (45.5%).
| Occupation | Male | Female |
| Healthcare Support | 568 (12.2%) | 4,090 (87.8%) |
| Security & Protection | 967 (70.0%) | 414 (30.0%) |
| Firefighting & Prevention | 665 (71.2%) | 269 (28.8%) |
| Law Enforcement | 302 (67.6%) | 145 (32.4%) |
| Food Preparation & Serving | 1,930 (57.0%) | 1,456 (43.0%) |
| Cleaning & Maintenance | 2,321 (54.5%) | 1,936 (45.5%) |
| Personal Care & Service | 429 (25.8%) | 1,233 (74.2%) |
| Total (Category) | 6,215 (40.5%) | 9,129 (59.5%) |
| Total (Overall) | 36,275 (53.8%) | 31,195 (46.2%) |
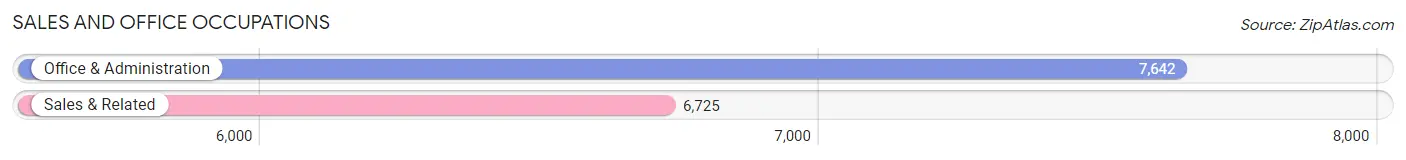
Sales and Office Occupations
The most common Sales and Office occupations in Paterson are Office & Administration (7,642 | 11.3%), and Sales & Related (6,725 | 10.0%).
Sales and Office Occupations by Sex
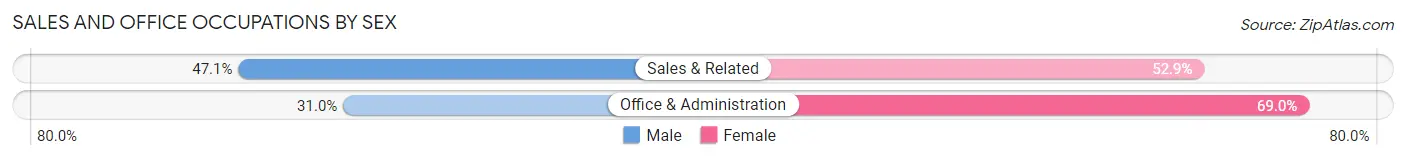
| Occupation | Male | Female |
| Sales & Related | 3,169 (47.1%) | 3,556 (52.9%) |
| Office & Administration | 2,368 (31.0%) | 5,274 (69.0%) |
| Total (Category) | 5,537 (38.5%) | 8,830 (61.5%) |
| Total (Overall) | 36,275 (53.8%) | 31,195 (46.2%) |
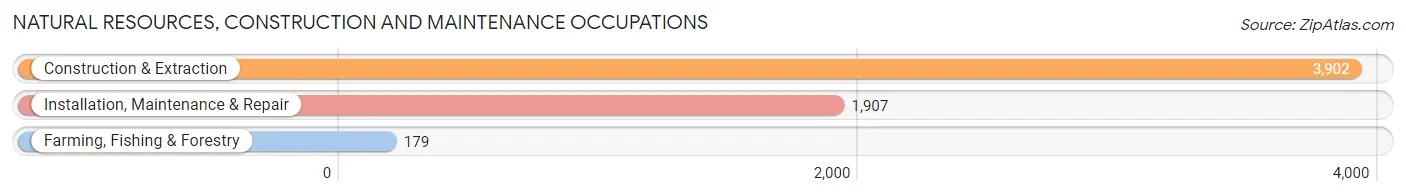
Natural Resources, Construction and Maintenance Occupations
The most common Natural Resources, Construction and Maintenance occupations in Paterson are Construction & Extraction (3,902 | 5.8%), Installation, Maintenance & Repair (1,907 | 2.8%), and Farming, Fishing & Forestry (179 | 0.3%).
Natural Resources, Construction and Maintenance Occupations by Sex
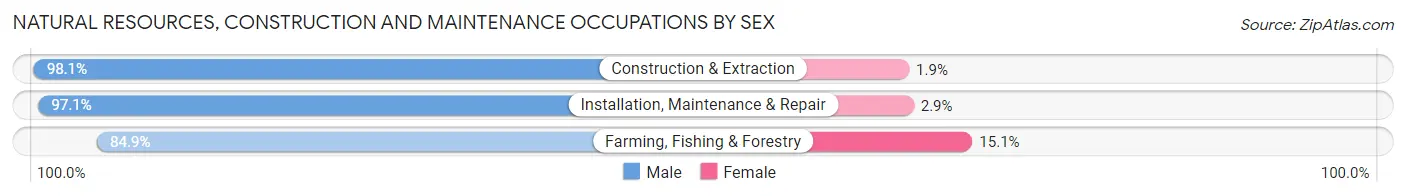
| Occupation | Male | Female |
| Farming, Fishing & Forestry | 152 (84.9%) | 27 (15.1%) |
| Construction & Extraction | 3,827 (98.1%) | 75 (1.9%) |
| Installation, Maintenance & Repair | 1,852 (97.1%) | 55 (2.9%) |
| Total (Category) | 5,831 (97.4%) | 157 (2.6%) |
| Total (Overall) | 36,275 (53.8%) | 31,195 (46.2%) |
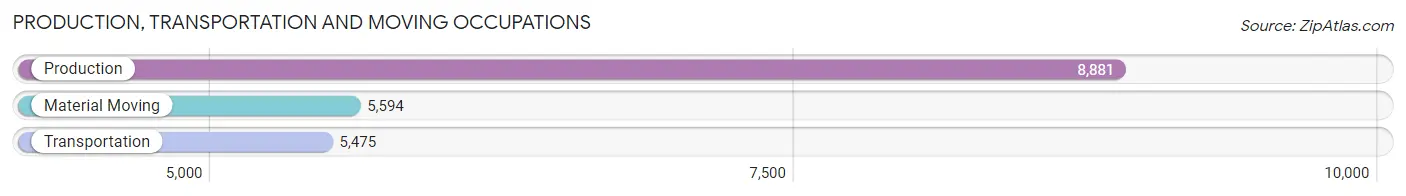
Production, Transportation and Moving Occupations
The most common Production, Transportation and Moving occupations in Paterson are Production (8,881 | 13.2%), Material Moving (5,594 | 8.3%), and Transportation (5,475 | 8.1%).
Production, Transportation and Moving Occupations by Sex
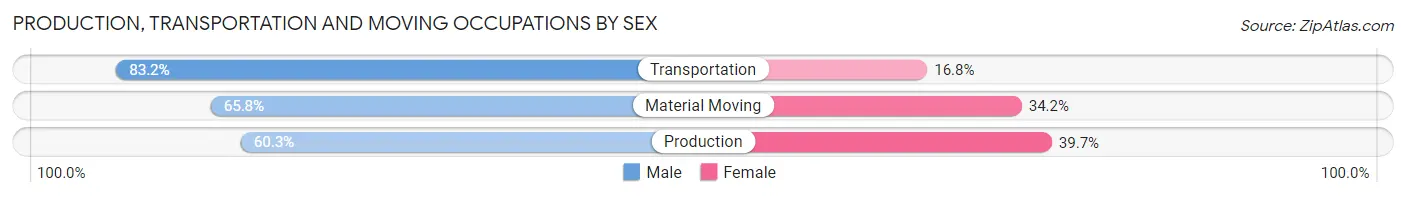
| Occupation | Male | Female |
| Production | 5,355 (60.3%) | 3,526 (39.7%) |
| Transportation | 4,553 (83.2%) | 922 (16.8%) |
| Material Moving | 3,682 (65.8%) | 1,912 (34.2%) |
| Total (Category) | 13,590 (68.1%) | 6,360 (31.9%) |
| Total (Overall) | 36,275 (53.8%) | 31,195 (46.2%) |
Employment Industries by Sex in Paterson
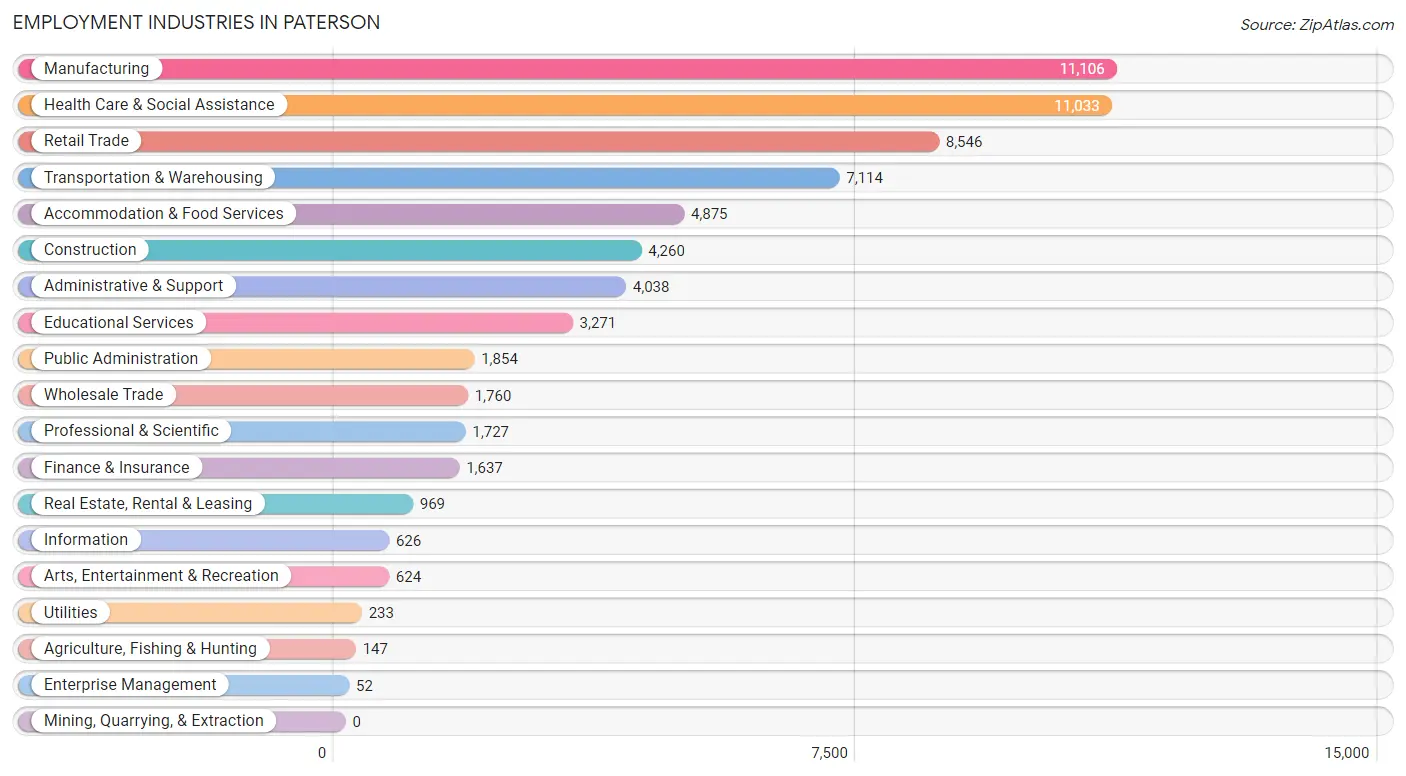
Employment Industries in Paterson
The major employment industries in Paterson include Manufacturing (11,106 | 16.5%), Health Care & Social Assistance (11,033 | 16.4%), Retail Trade (8,546 | 12.7%), Transportation & Warehousing (7,114 | 10.5%), and Accommodation & Food Services (4,875 | 7.2%).
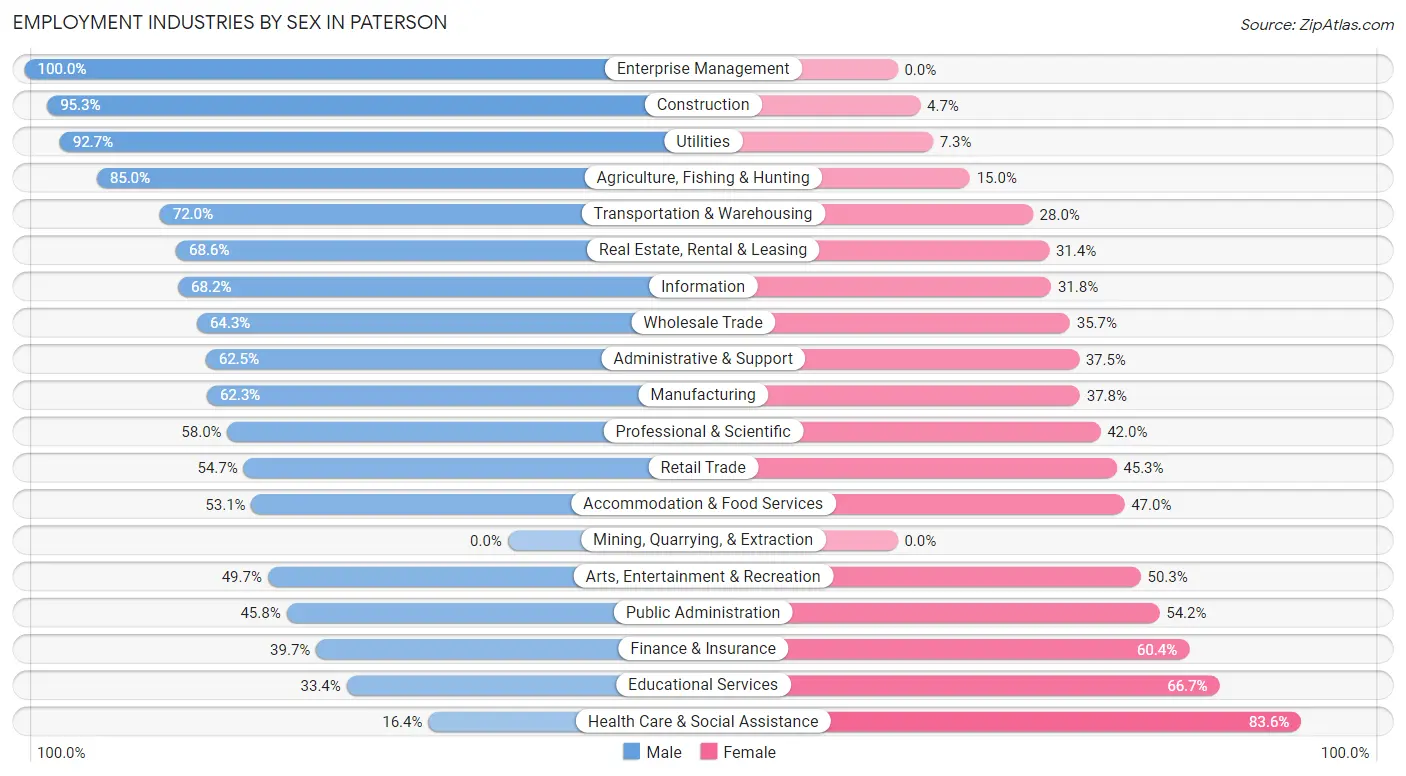
Employment Industries by Sex in Paterson
The Paterson industries that see more men than women are Enterprise Management (100.0%), Construction (95.3%), and Utilities (92.7%), whereas the industries that tend to have a higher number of women are Health Care & Social Assistance (83.6%), Educational Services (66.6%), and Finance & Insurance (60.4%).
| Industry | Male | Female |
| Agriculture, Fishing & Hunting | 125 (85.0%) | 22 (15.0%) |
| Mining, Quarrying, & Extraction | 0 (0.0%) | 0 (0.0%) |
| Construction | 4,060 (95.3%) | 200 (4.7%) |
| Manufacturing | 6,913 (62.3%) | 4,193 (37.8%) |
| Wholesale Trade | 1,132 (64.3%) | 628 (35.7%) |
| Retail Trade | 4,673 (54.7%) | 3,873 (45.3%) |
| Transportation & Warehousing | 5,123 (72.0%) | 1,991 (28.0%) |
| Utilities | 216 (92.7%) | 17 (7.3%) |
| Information | 427 (68.2%) | 199 (31.8%) |
| Finance & Insurance | 649 (39.7%) | 988 (60.4%) |
| Real Estate, Rental & Leasing | 665 (68.6%) | 304 (31.4%) |
| Professional & Scientific | 1,002 (58.0%) | 725 (42.0%) |
| Enterprise Management | 52 (100.0%) | 0 (0.0%) |
| Administrative & Support | 2,523 (62.5%) | 1,515 (37.5%) |
| Educational Services | 1,091 (33.4%) | 2,180 (66.6%) |
| Health Care & Social Assistance | 1,814 (16.4%) | 9,219 (83.6%) |
| Arts, Entertainment & Recreation | 310 (49.7%) | 314 (50.3%) |
| Accommodation & Food Services | 2,586 (53.0%) | 2,289 (46.9%) |
| Public Administration | 849 (45.8%) | 1,005 (54.2%) |
| Total | 36,275 (53.8%) | 31,195 (46.2%) |
Education in Paterson
School Enrollment in Paterson
The most common levels of schooling among the 43,120 students in Paterson are elementary school (9,820 | 22.8%), high school (9,695 | 22.5%), and middle school (9,559 | 22.2%).
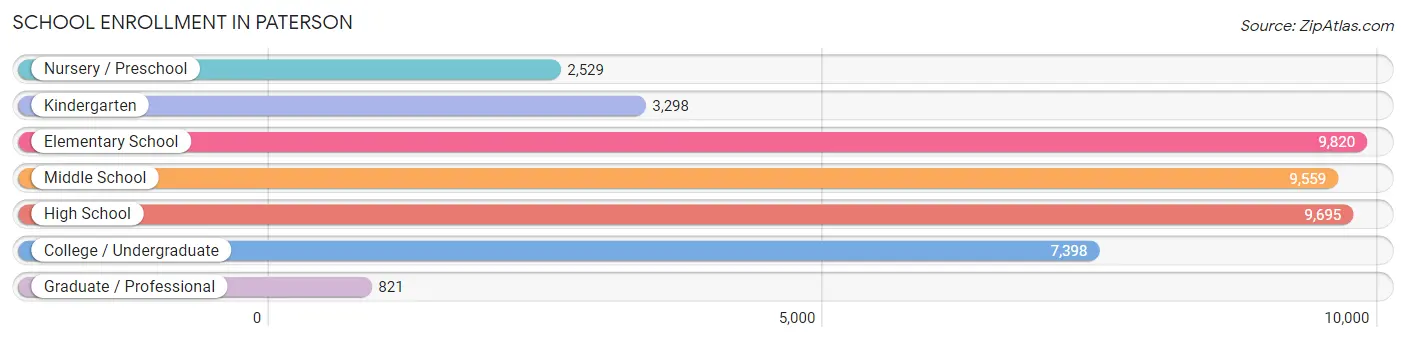
| School Level | # Students | % Students |
| Nursery / Preschool | 2,529 | 5.9% |
| Kindergarten | 3,298 | 7.6% |
| Elementary School | 9,820 | 22.8% |
| Middle School | 9,559 | 22.2% |
| High School | 9,695 | 22.5% |
| College / Undergraduate | 7,398 | 17.2% |
| Graduate / Professional | 821 | 1.9% |
| Total | 43,120 | 100.0% |
School Enrollment by Age by Funding Source in Paterson
Out of a total of 43,120 students who are enrolled in schools in Paterson, 1,768 (4.1%) attend a private institution, while the remaining 41,352 (95.9%) are enrolled in public schools. The age group of 25 to 34 year olds has the highest likelihood of being enrolled in private schools, with 318 (16.4% in the age bracket) enrolled. Conversely, the age group of 3 to 4 year olds has the lowest likelihood of being enrolled in a private school, with 2,774 (98.3% in the age bracket) attending a public institution.
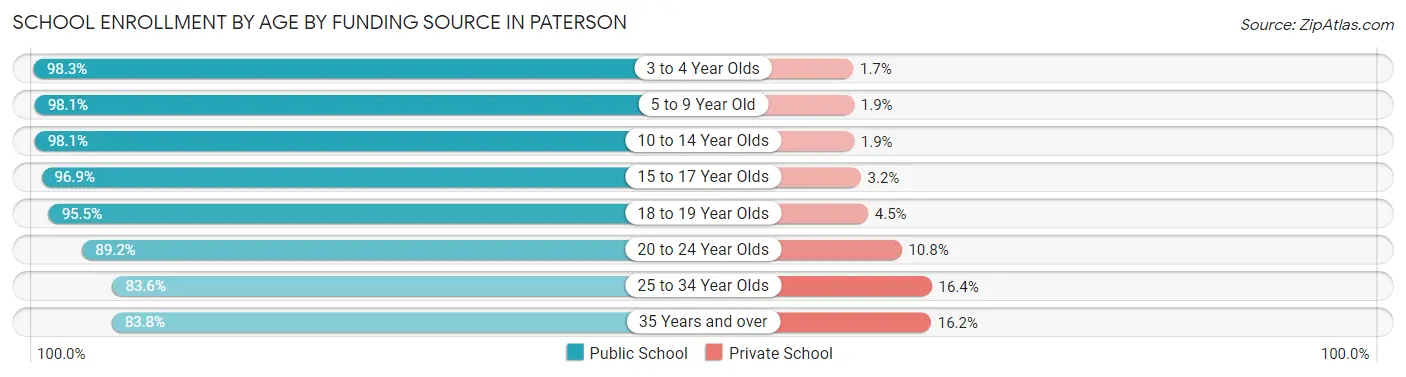
| Age Bracket | Public School | Private School |
| 3 to 4 Year Olds | 2,774 (98.3%) | 49 (1.7%) |
| 5 to 9 Year Old | 11,626 (98.1%) | 224 (1.9%) |
| 10 to 14 Year Olds | 11,456 (98.1%) | 221 (1.9%) |
| 15 to 17 Year Olds | 6,363 (96.9%) | 207 (3.2%) |
| 18 to 19 Year Olds | 3,079 (95.5%) | 145 (4.5%) |
| 20 to 24 Year Olds | 3,646 (89.2%) | 440 (10.8%) |
| 25 to 34 Year Olds | 1,623 (83.6%) | 318 (16.4%) |
| 35 Years and over | 795 (83.8%) | 154 (16.2%) |
| Total | 41,352 (95.9%) | 1,768 (4.1%) |
Educational Attainment by Field of Study in Paterson
Business (3,093 | 23.6%), education (1,591 | 12.1%), arts & humanities (1,267 | 9.7%), psychology (1,223 | 9.3%), and social sciences (1,204 | 9.2%) are the most common fields of study among 13,109 individuals in Paterson who have obtained a bachelor's degree or higher.
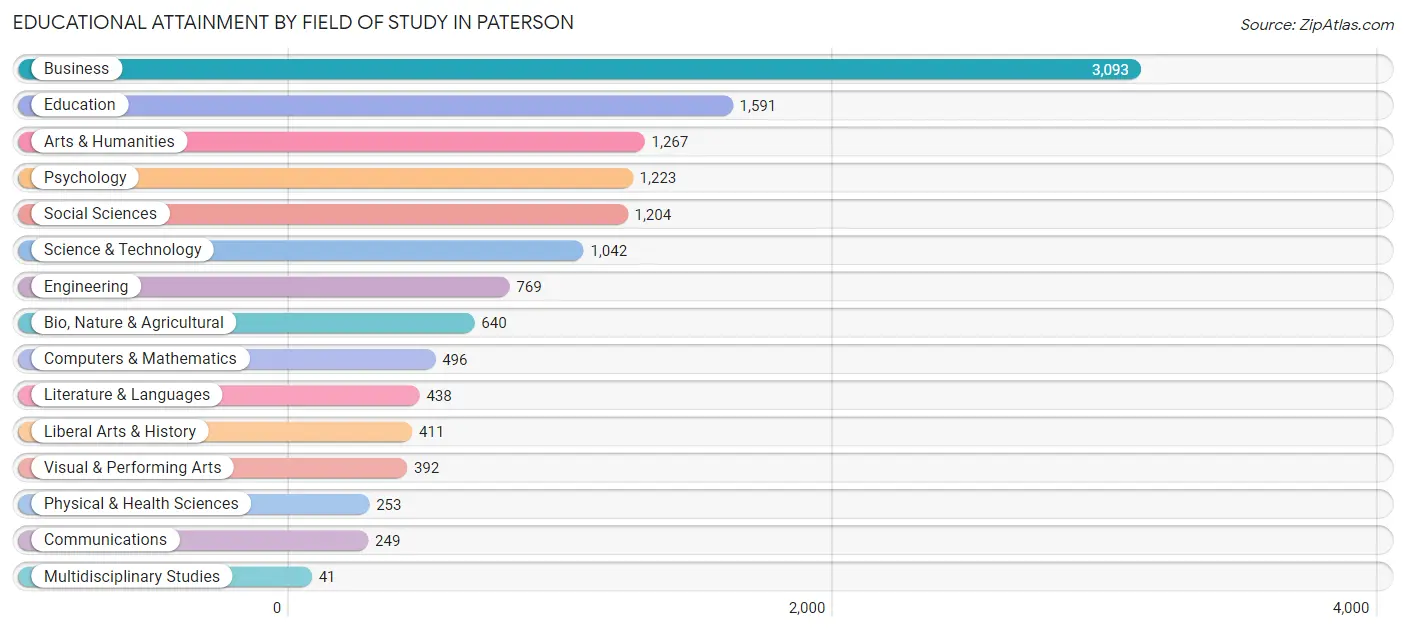
| Field of Study | # Graduates | % Graduates |
| Computers & Mathematics | 496 | 3.8% |
| Bio, Nature & Agricultural | 640 | 4.9% |
| Physical & Health Sciences | 253 | 1.9% |
| Psychology | 1,223 | 9.3% |
| Social Sciences | 1,204 | 9.2% |
| Engineering | 769 | 5.9% |
| Multidisciplinary Studies | 41 | 0.3% |
| Science & Technology | 1,042 | 8.0% |
| Business | 3,093 | 23.6% |
| Education | 1,591 | 12.1% |
| Literature & Languages | 438 | 3.3% |
| Liberal Arts & History | 411 | 3.1% |
| Visual & Performing Arts | 392 | 3.0% |
| Communications | 249 | 1.9% |
| Arts & Humanities | 1,267 | 9.7% |
| Total | 13,109 | 100.0% |
Transportation & Commute in Paterson
Vehicle Availability by Sex in Paterson
The most prevalent vehicle ownership categories in Paterson are males with 1 vehicle (12,357, accounting for 34.6%) and females with 1 vehicle (11,070, making up 41.0%).
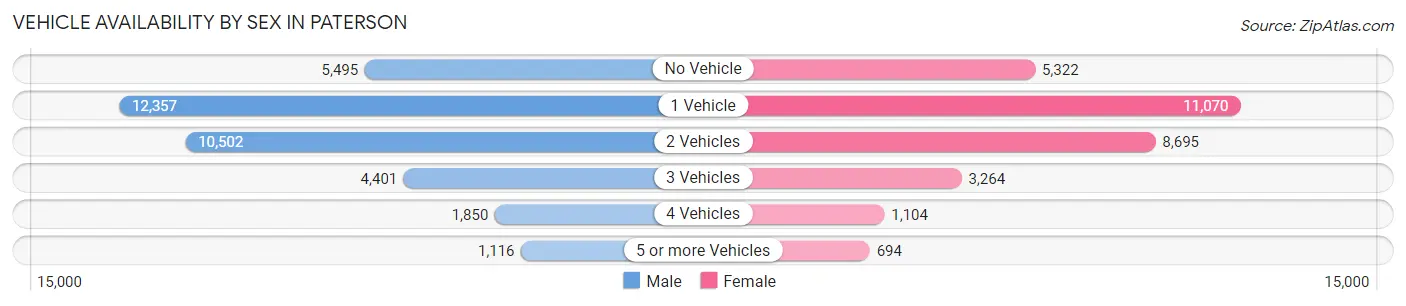
| Vehicles Available | Male | Female |
| No Vehicle | 5,495 (15.4%) | 5,322 (17.6%) |
| 1 Vehicle | 12,357 (34.6%) | 11,070 (36.7%) |
| 2 Vehicles | 10,502 (29.4%) | 8,695 (28.8%) |
| 3 Vehicles | 4,401 (12.3%) | 3,264 (10.8%) |
| 4 Vehicles | 1,850 (5.2%) | 1,104 (3.7%) |
| 5 or more Vehicles | 1,116 (3.1%) | 694 (2.3%) |
| Total | 35,721 (100.0%) | 30,149 (100.0%) |
Commute Time in Paterson
The most frequently occuring commute durations in Paterson are 10 to 14 minutes (12,944 commuters, 20.4%), 15 to 19 minutes (10,843 commuters, 17.1%), and 20 to 24 minutes (10,243 commuters, 16.1%).
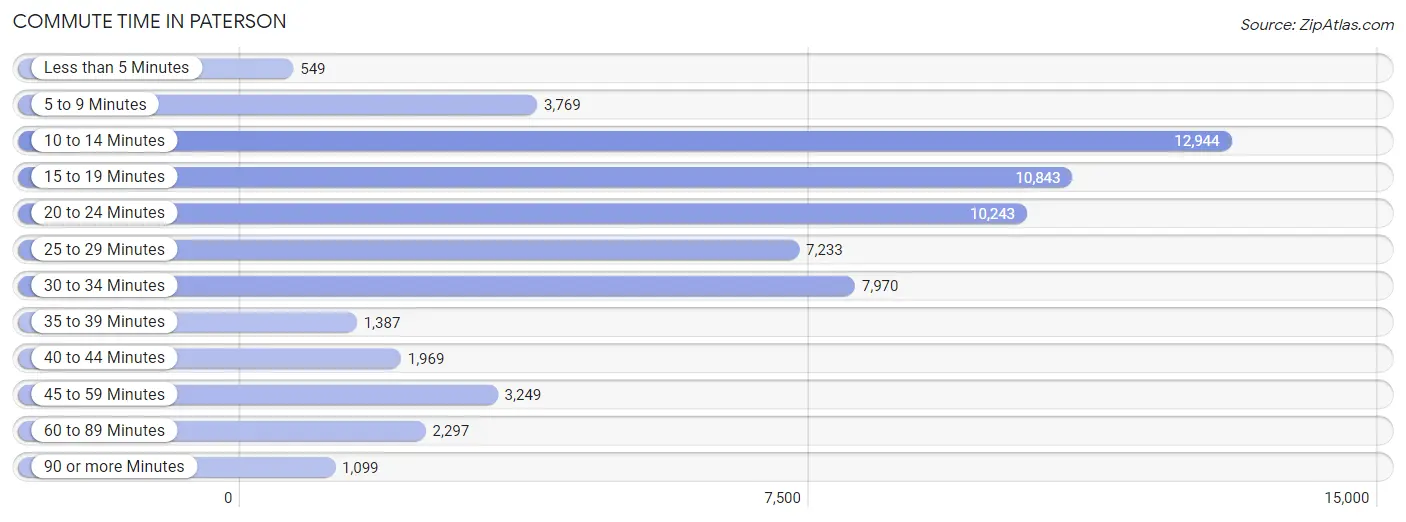
| Commute Time | # Commuters | % Commuters |
| Less than 5 Minutes | 549 | 0.9% |
| 5 to 9 Minutes | 3,769 | 5.9% |
| 10 to 14 Minutes | 12,944 | 20.4% |
| 15 to 19 Minutes | 10,843 | 17.1% |
| 20 to 24 Minutes | 10,243 | 16.1% |
| 25 to 29 Minutes | 7,233 | 11.4% |
| 30 to 34 Minutes | 7,970 | 12.5% |
| 35 to 39 Minutes | 1,387 | 2.2% |
| 40 to 44 Minutes | 1,969 | 3.1% |
| 45 to 59 Minutes | 3,249 | 5.1% |
| 60 to 89 Minutes | 2,297 | 3.6% |
| 90 or more Minutes | 1,099 | 1.7% |
Commute Time by Sex in Paterson
The most common commute times in Paterson are 10 to 14 minutes (6,947 commuters, 20.0%) for males and 10 to 14 minutes (5,997 commuters, 20.9%) for females.
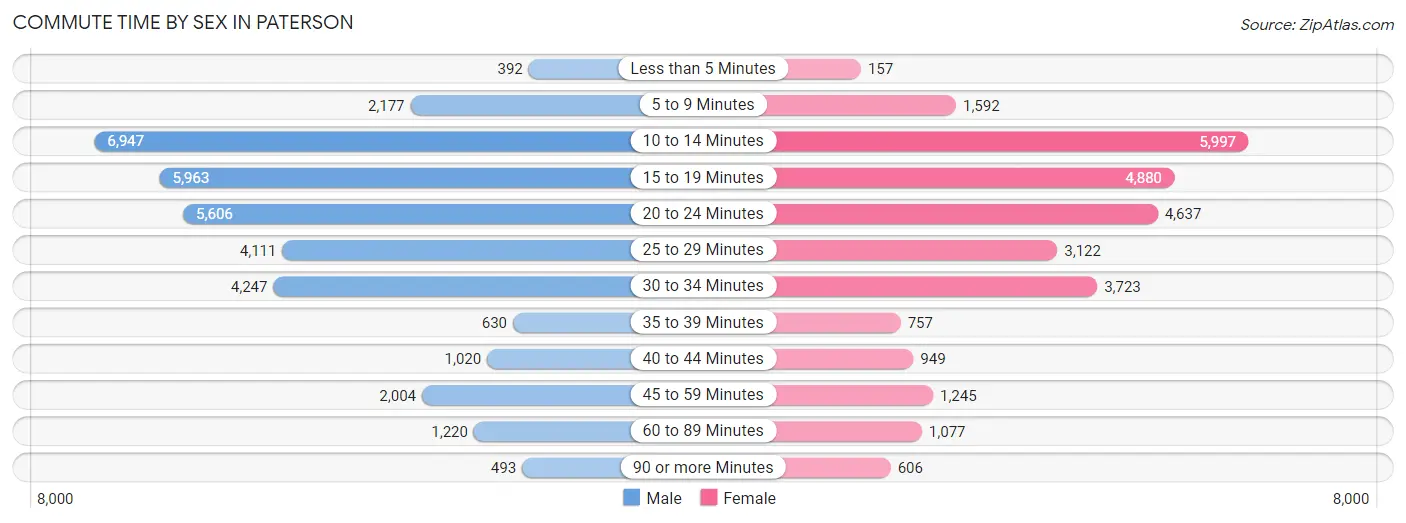
| Commute Time | Male | Female |
| Less than 5 Minutes | 392 (1.1%) | 157 (0.5%) |
| 5 to 9 Minutes | 2,177 (6.2%) | 1,592 (5.5%) |
| 10 to 14 Minutes | 6,947 (20.0%) | 5,997 (20.9%) |
| 15 to 19 Minutes | 5,963 (17.1%) | 4,880 (17.0%) |
| 20 to 24 Minutes | 5,606 (16.1%) | 4,637 (16.1%) |
| 25 to 29 Minutes | 4,111 (11.8%) | 3,122 (10.9%) |
| 30 to 34 Minutes | 4,247 (12.2%) | 3,723 (13.0%) |
| 35 to 39 Minutes | 630 (1.8%) | 757 (2.6%) |
| 40 to 44 Minutes | 1,020 (2.9%) | 949 (3.3%) |
| 45 to 59 Minutes | 2,004 (5.8%) | 1,245 (4.3%) |
| 60 to 89 Minutes | 1,220 (3.5%) | 1,077 (3.7%) |
| 90 or more Minutes | 493 (1.4%) | 606 (2.1%) |
Time of Departure to Work by Sex in Paterson
The most frequent times of departure to work in Paterson are 6:30 AM to 6:59 AM (6,975, 20.0%) for males and 8:00 AM to 8:29 AM (5,334, 18.6%) for females.
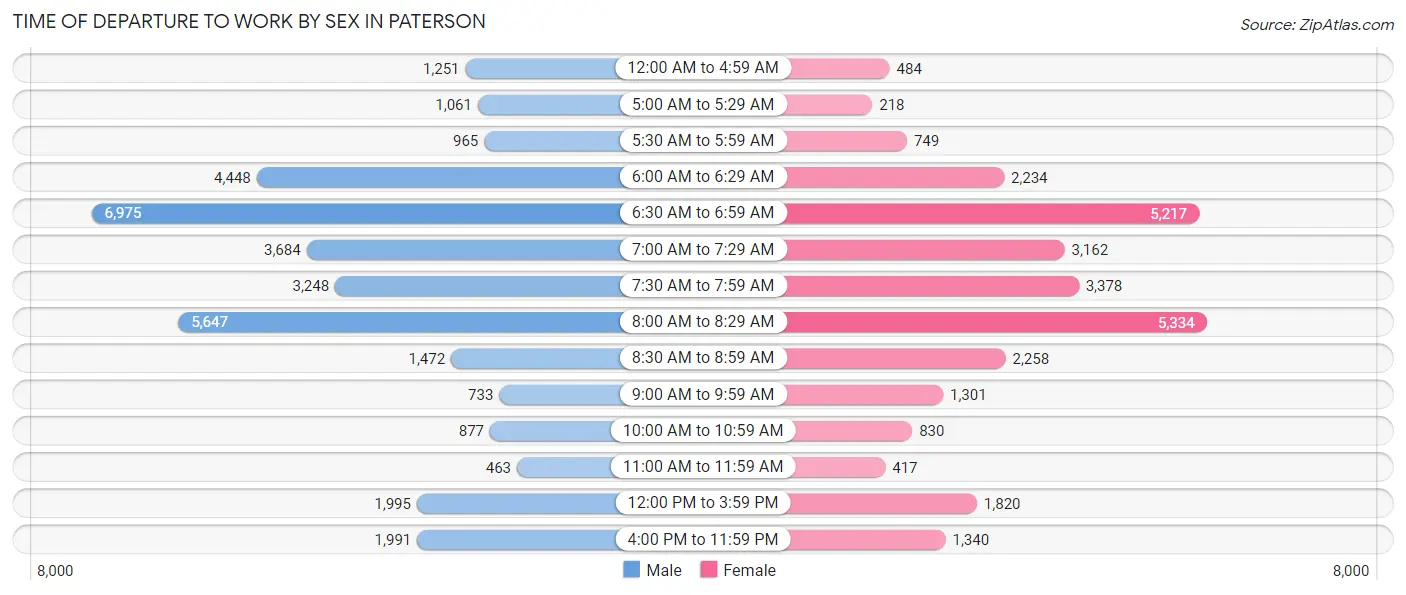
| Time of Departure | Male | Female |
| 12:00 AM to 4:59 AM | 1,251 (3.6%) | 484 (1.7%) |
| 5:00 AM to 5:29 AM | 1,061 (3.0%) | 218 (0.8%) |
| 5:30 AM to 5:59 AM | 965 (2.8%) | 749 (2.6%) |
| 6:00 AM to 6:29 AM | 4,448 (12.8%) | 2,234 (7.8%) |
| 6:30 AM to 6:59 AM | 6,975 (20.0%) | 5,217 (18.1%) |
| 7:00 AM to 7:29 AM | 3,684 (10.6%) | 3,162 (11.0%) |
| 7:30 AM to 7:59 AM | 3,248 (9.3%) | 3,378 (11.7%) |
| 8:00 AM to 8:29 AM | 5,647 (16.2%) | 5,334 (18.6%) |
| 8:30 AM to 8:59 AM | 1,472 (4.2%) | 2,258 (7.9%) |
| 9:00 AM to 9:59 AM | 733 (2.1%) | 1,301 (4.5%) |
| 10:00 AM to 10:59 AM | 877 (2.5%) | 830 (2.9%) |
| 11:00 AM to 11:59 AM | 463 (1.3%) | 417 (1.5%) |
| 12:00 PM to 3:59 PM | 1,995 (5.7%) | 1,820 (6.3%) |
| 4:00 PM to 11:59 PM | 1,991 (5.7%) | 1,340 (4.7%) |
| Total | 34,810 (100.0%) | 28,742 (100.0%) |
Housing Occupancy in Paterson
Occupancy by Ownership in Paterson
Of the total 49,678 dwellings in Paterson, owner-occupied units account for 13,064 (26.3%), while renter-occupied units make up 36,614 (73.7%).
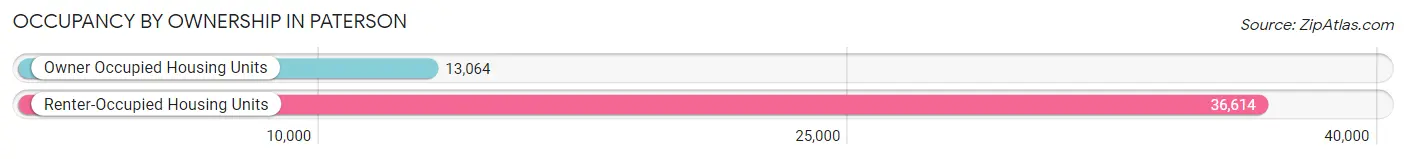
| Occupancy | # Housing Units | % Housing Units |
| Owner Occupied Housing Units | 13,064 | 26.3% |
| Renter-Occupied Housing Units | 36,614 | 73.7% |
| Total Occupied Housing Units | 49,678 | 100.0% |
Occupancy by Household Size in Paterson
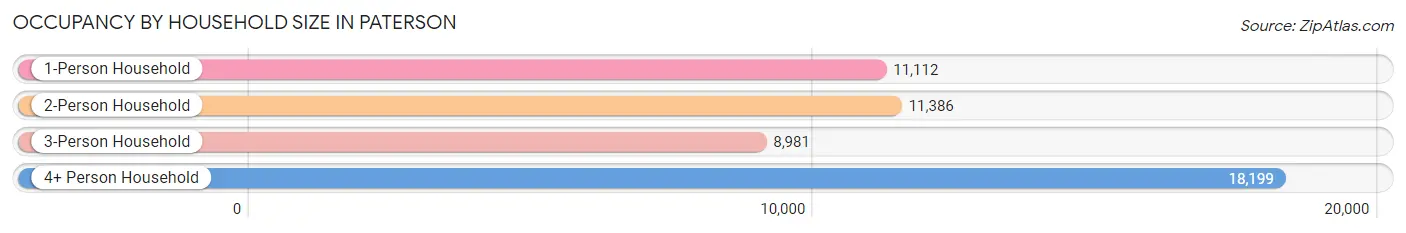
| Household Size | # Housing Units | % Housing Units |
| 1-Person Household | 11,112 | 22.4% |
| 2-Person Household | 11,386 | 22.9% |
| 3-Person Household | 8,981 | 18.1% |
| 4+ Person Household | 18,199 | 36.6% |
| Total Housing Units | 49,678 | 100.0% |
Occupancy by Ownership by Household Size in Paterson
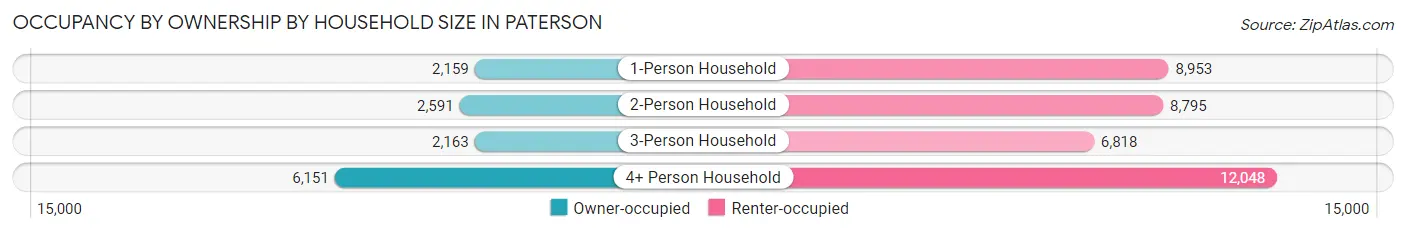
| Household Size | Owner-occupied | Renter-occupied |
| 1-Person Household | 2,159 (19.4%) | 8,953 (80.6%) |
| 2-Person Household | 2,591 (22.8%) | 8,795 (77.2%) |
| 3-Person Household | 2,163 (24.1%) | 6,818 (75.9%) |
| 4+ Person Household | 6,151 (33.8%) | 12,048 (66.2%) |
| Total Housing Units | 13,064 (26.3%) | 36,614 (73.7%) |
Occupancy by Educational Attainment in Paterson
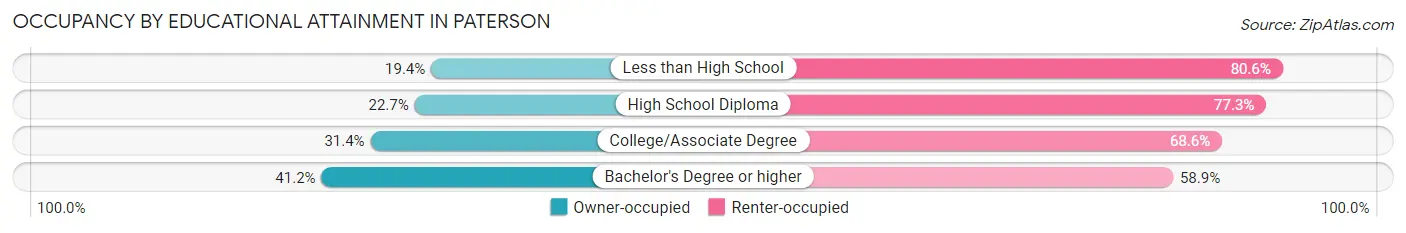
| Household Size | Owner-occupied | Renter-occupied |
| Less than High School | 2,195 (19.4%) | 9,118 (80.6%) |
| High School Diploma | 4,624 (22.7%) | 15,753 (77.3%) |
| College/Associate Degree | 3,739 (31.4%) | 8,159 (68.6%) |
| Bachelor's Degree or higher | 2,506 (41.1%) | 3,584 (58.9%) |
Occupancy by Age of Householder in Paterson
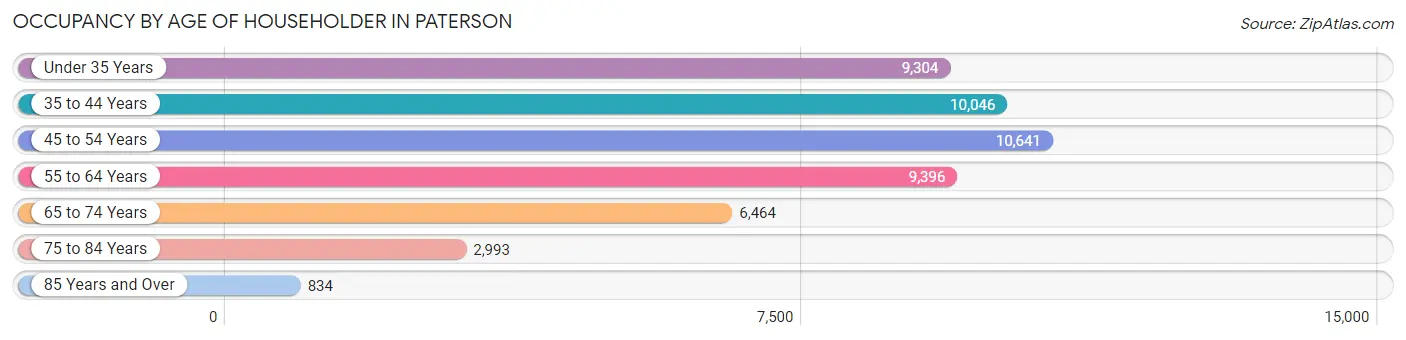
| Age Bracket | # Households | % Households |
| Under 35 Years | 9,304 | 18.7% |
| 35 to 44 Years | 10,046 | 20.2% |
| 45 to 54 Years | 10,641 | 21.4% |
| 55 to 64 Years | 9,396 | 18.9% |
| 65 to 74 Years | 6,464 | 13.0% |
| 75 to 84 Years | 2,993 | 6.0% |
| 85 Years and Over | 834 | 1.7% |
| Total | 49,678 | 100.0% |
Housing Finances in Paterson
Median Income by Occupancy in Paterson
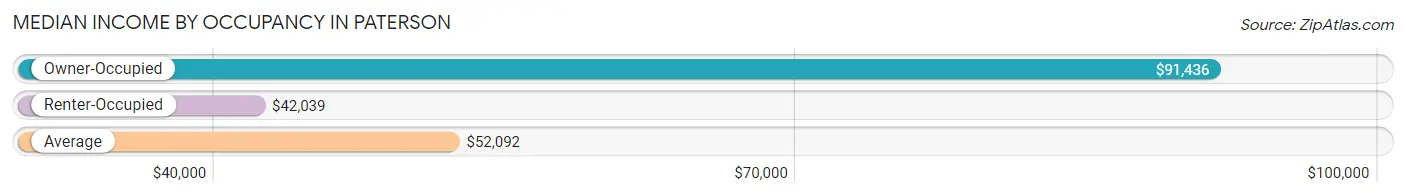
| Occupancy Type | # Households | Median Income |
| Owner-Occupied | 13,064 (26.3%) | $91,436 |
| Renter-Occupied | 36,614 (73.7%) | $42,039 |
| Average | 49,678 (100.0%) | $52,092 |
Occupancy by Householder Income Bracket in Paterson
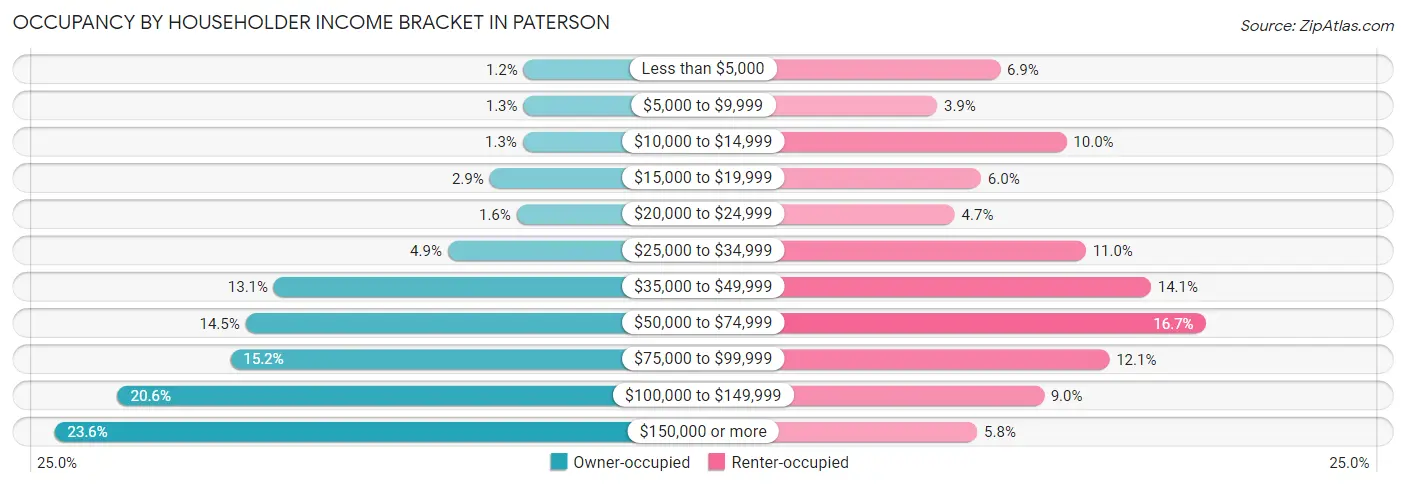
| Income Bracket | Owner-occupied | Renter-occupied |
| Less than $5,000 | 162 (1.2%) | 2,519 (6.9%) |
| $5,000 to $9,999 | 163 (1.3%) | 1,419 (3.9%) |
| $10,000 to $14,999 | 167 (1.3%) | 3,675 (10.0%) |
| $15,000 to $19,999 | 373 (2.9%) | 2,185 (6.0%) |
| $20,000 to $24,999 | 205 (1.6%) | 1,730 (4.7%) |
| $25,000 to $34,999 | 634 (4.9%) | 4,014 (11.0%) |
| $35,000 to $49,999 | 1,715 (13.1%) | 5,149 (14.1%) |
| $50,000 to $74,999 | 1,892 (14.5%) | 6,099 (16.7%) |
| $75,000 to $99,999 | 1,986 (15.2%) | 4,423 (12.1%) |
| $100,000 to $149,999 | 2,687 (20.6%) | 3,281 (9.0%) |
| $150,000 or more | 3,080 (23.6%) | 2,120 (5.8%) |
| Total | 13,064 (100.0%) | 36,614 (100.0%) |
Monthly Housing Cost Tiers in Paterson
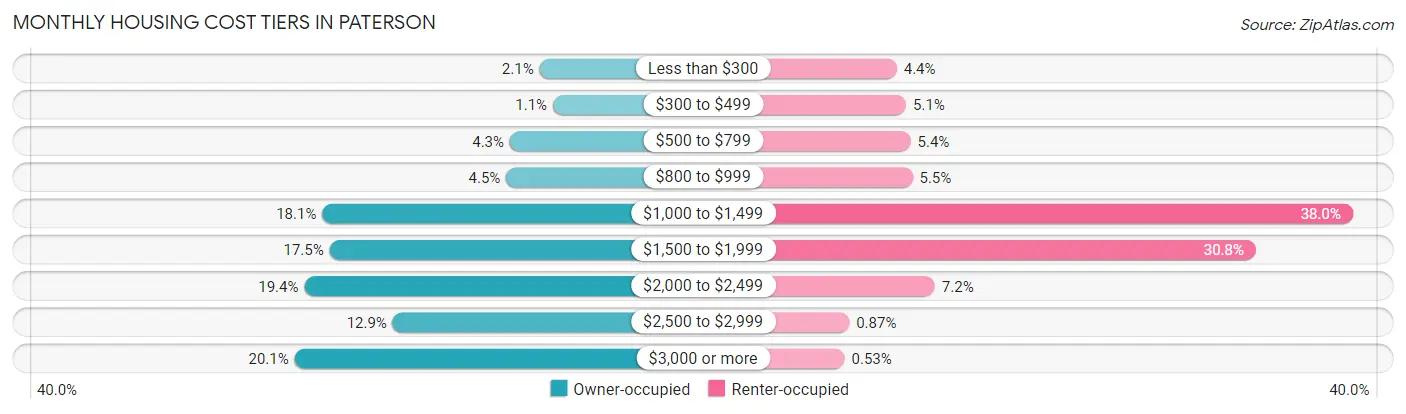
| Monthly Cost | Owner-occupied | Renter-occupied |
| Less than $300 | 272 (2.1%) | 1,601 (4.4%) |
| $300 to $499 | 143 (1.1%) | 1,853 (5.1%) |
| $500 to $799 | 556 (4.3%) | 1,975 (5.4%) |
| $800 to $999 | 592 (4.5%) | 2,024 (5.5%) |
| $1,000 to $1,499 | 2,362 (18.1%) | 13,894 (38.0%) |
| $1,500 to $1,999 | 2,291 (17.5%) | 11,281 (30.8%) |
| $2,000 to $2,499 | 2,535 (19.4%) | 2,630 (7.2%) |
| $2,500 to $2,999 | 1,684 (12.9%) | 318 (0.9%) |
| $3,000 or more | 2,629 (20.1%) | 195 (0.5%) |
| Total | 13,064 (100.0%) | 36,614 (100.0%) |
Physical Housing Characteristics in Paterson
Housing Structures in Paterson
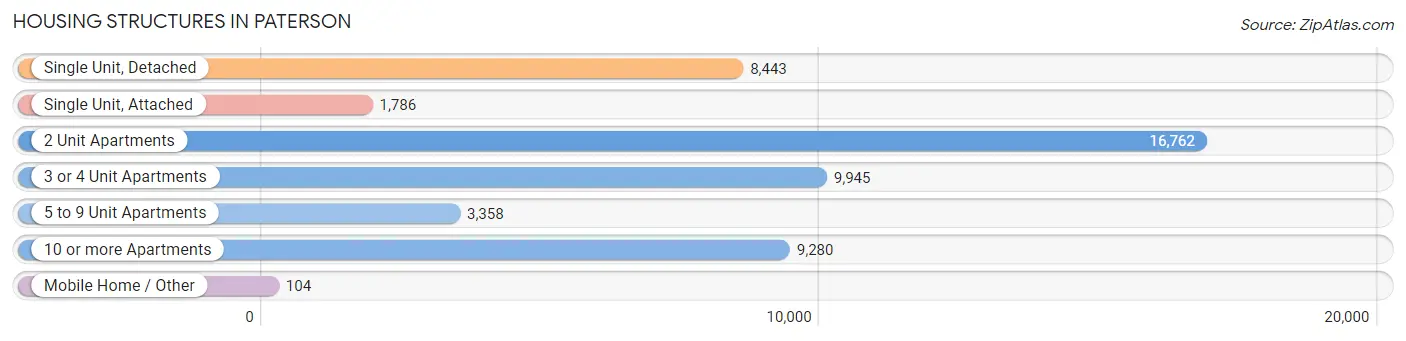
| Structure Type | # Housing Units | % Housing Units |
| Single Unit, Detached | 8,443 | 17.0% |
| Single Unit, Attached | 1,786 | 3.6% |
| 2 Unit Apartments | 16,762 | 33.7% |
| 3 or 4 Unit Apartments | 9,945 | 20.0% |
| 5 to 9 Unit Apartments | 3,358 | 6.8% |
| 10 or more Apartments | 9,280 | 18.7% |
| Mobile Home / Other | 104 | 0.2% |
| Total | 49,678 | 100.0% |
Housing Structures by Occupancy in Paterson
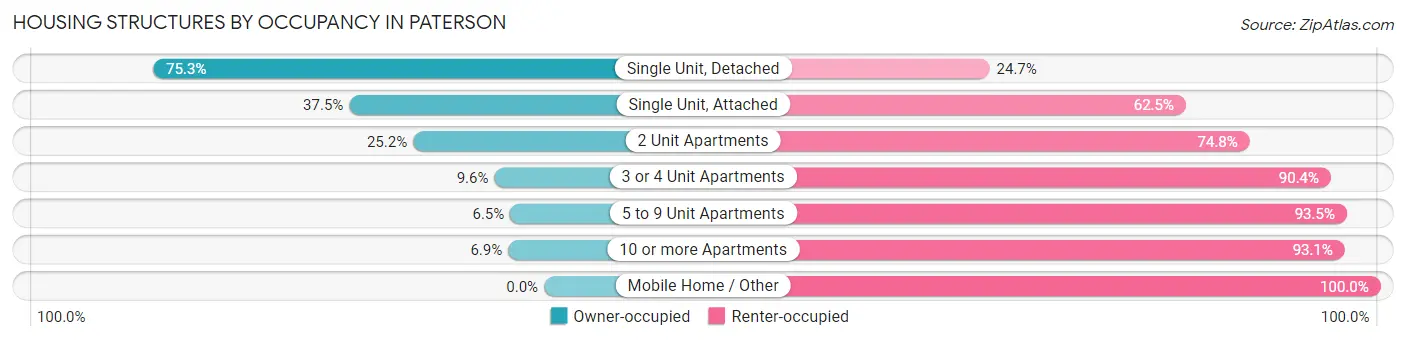
| Structure Type | Owner-occupied | Renter-occupied |
| Single Unit, Detached | 6,355 (75.3%) | 2,088 (24.7%) |
| Single Unit, Attached | 670 (37.5%) | 1,116 (62.5%) |
| 2 Unit Apartments | 4,227 (25.2%) | 12,535 (74.8%) |
| 3 or 4 Unit Apartments | 952 (9.6%) | 8,993 (90.4%) |
| 5 to 9 Unit Apartments | 219 (6.5%) | 3,139 (93.5%) |
| 10 or more Apartments | 641 (6.9%) | 8,639 (93.1%) |
| Mobile Home / Other | 0 (0.0%) | 104 (100.0%) |
| Total | 13,064 (26.3%) | 36,614 (73.7%) |
Housing Structures by Number of Rooms in Paterson
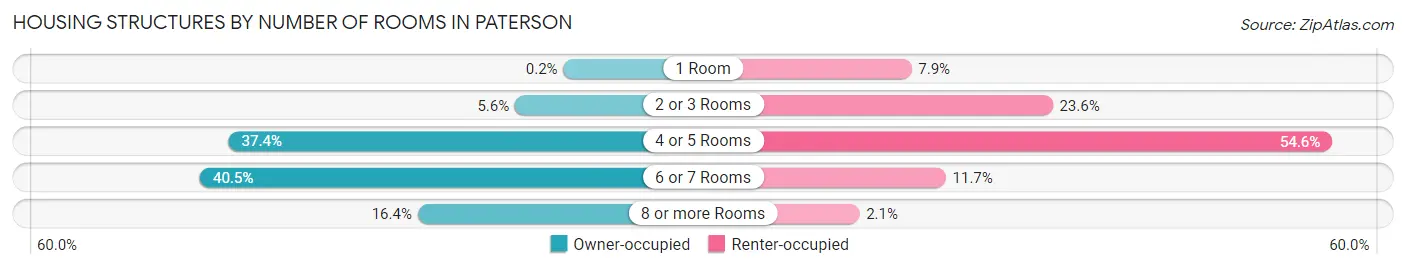
| Number of Rooms | Owner-occupied | Renter-occupied |
| 1 Room | 26 (0.2%) | 2,902 (7.9%) |
| 2 or 3 Rooms | 728 (5.6%) | 8,638 (23.6%) |
| 4 or 5 Rooms | 4,879 (37.3%) | 19,997 (54.6%) |
| 6 or 7 Rooms | 5,293 (40.5%) | 4,293 (11.7%) |
| 8 or more Rooms | 2,138 (16.4%) | 784 (2.1%) |
| Total | 13,064 (100.0%) | 36,614 (100.0%) |
Housing Structure by Heating Type in Paterson
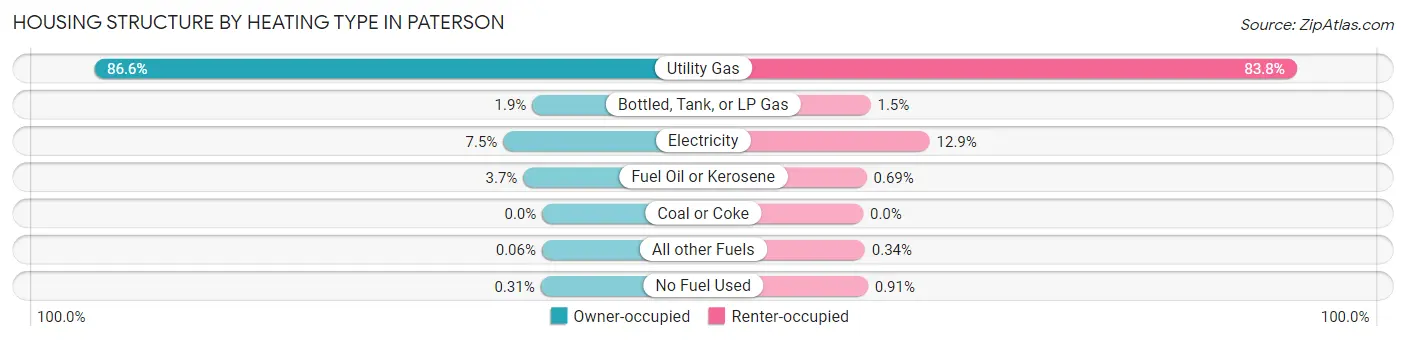
| Heating Type | Owner-occupied | Renter-occupied |
| Utility Gas | 11,308 (86.6%) | 30,668 (83.8%) |
| Bottled, Tank, or LP Gas | 249 (1.9%) | 530 (1.5%) |
| Electricity | 982 (7.5%) | 4,707 (12.9%) |
| Fuel Oil or Kerosene | 477 (3.6%) | 253 (0.7%) |
| Coal or Coke | 0 (0.0%) | 0 (0.0%) |
| All other Fuels | 8 (0.1%) | 123 (0.3%) |
| No Fuel Used | 40 (0.3%) | 333 (0.9%) |
| Total | 13,064 (100.0%) | 36,614 (100.0%) |
Household Vehicle Usage in Paterson
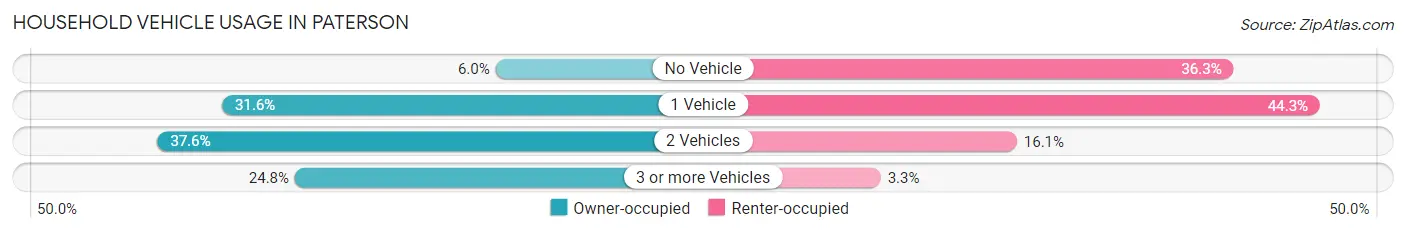
| Vehicles per Household | Owner-occupied | Renter-occupied |
| No Vehicle | 789 (6.0%) | 13,279 (36.3%) |
| 1 Vehicle | 4,125 (31.6%) | 16,236 (44.3%) |
| 2 Vehicles | 4,914 (37.6%) | 5,875 (16.1%) |
| 3 or more Vehicles | 3,236 (24.8%) | 1,224 (3.3%) |
| Total | 13,064 (100.0%) | 36,614 (100.0%) |
Real Estate & Mortgages in Paterson
Real Estate and Mortgage Overview in Paterson
| Characteristic | Without Mortgage | With Mortgage |
| Housing Units | 4,282 | 8,782 |
| Median Property Value | $304,400 | $318,000 |
| Median Household Income | $58,039 | $2,492 |
| Monthly Housing Costs | $1,191 | $2,591 |
| Real Estate Taxes | $8,887 | $250 |
Property Value by Mortgage Status in Paterson
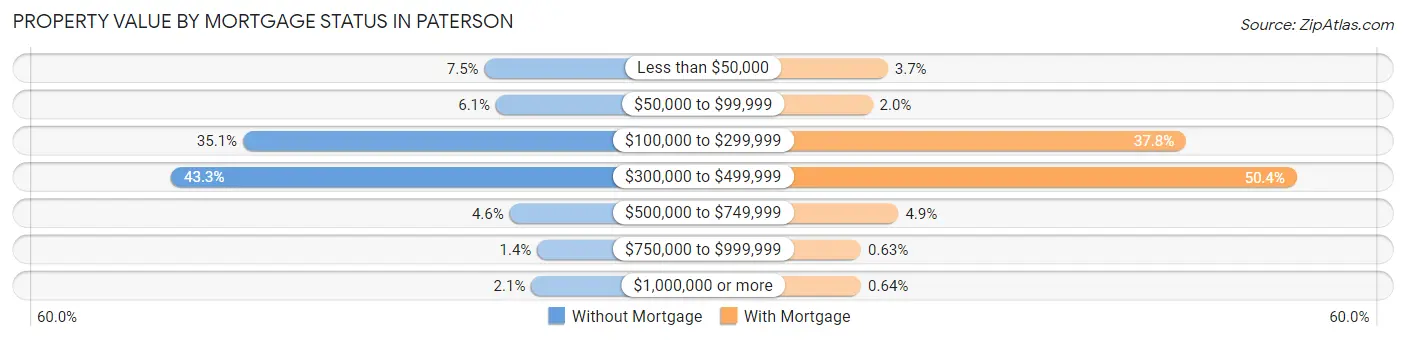
| Property Value | Without Mortgage | With Mortgage |
| Less than $50,000 | 319 (7.4%) | 324 (3.7%) |
| $50,000 to $99,999 | 263 (6.1%) | 171 (1.9%) |
| $100,000 to $299,999 | 1,501 (35.0%) | 3,317 (37.8%) |
| $300,000 to $499,999 | 1,852 (43.2%) | 4,428 (50.4%) |
| $500,000 to $749,999 | 196 (4.6%) | 431 (4.9%) |
| $750,000 to $999,999 | 61 (1.4%) | 55 (0.6%) |
| $1,000,000 or more | 90 (2.1%) | 56 (0.6%) |
| Total | 4,282 (100.0%) | 8,782 (100.0%) |
Household Income by Mortgage Status in Paterson
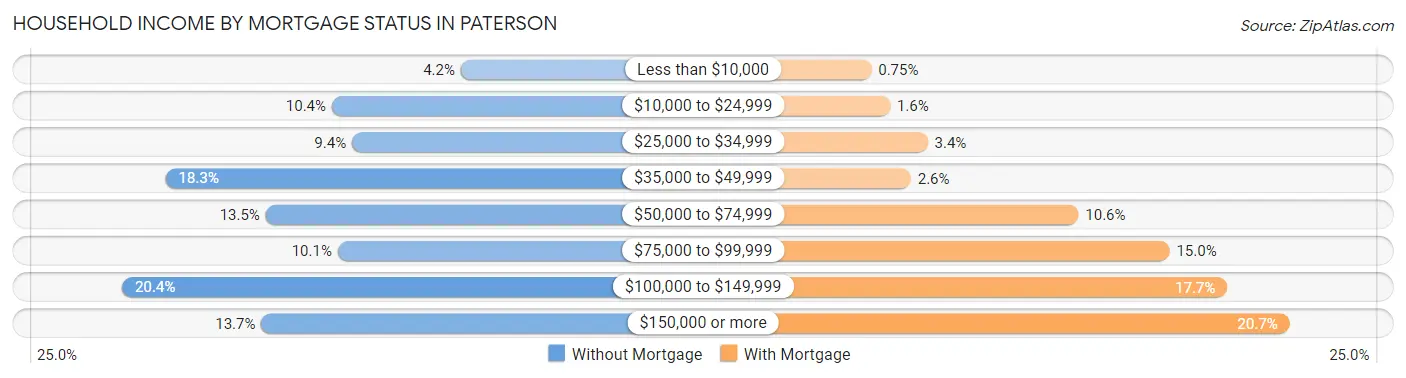
| Household Income | Without Mortgage | With Mortgage |
| Less than $10,000 | 181 (4.2%) | 66 (0.7%) |
| $10,000 to $24,999 | 444 (10.4%) | 144 (1.6%) |
| $25,000 to $34,999 | 403 (9.4%) | 301 (3.4%) |
| $35,000 to $49,999 | 783 (18.3%) | 231 (2.6%) |
| $50,000 to $74,999 | 579 (13.5%) | 932 (10.6%) |
| $75,000 to $99,999 | 432 (10.1%) | 1,313 (14.9%) |
| $100,000 to $149,999 | 872 (20.4%) | 1,554 (17.7%) |
| $150,000 or more | 588 (13.7%) | 1,815 (20.7%) |
| Total | 4,282 (100.0%) | 8,782 (100.0%) |
Property Value to Household Income Ratio in Paterson
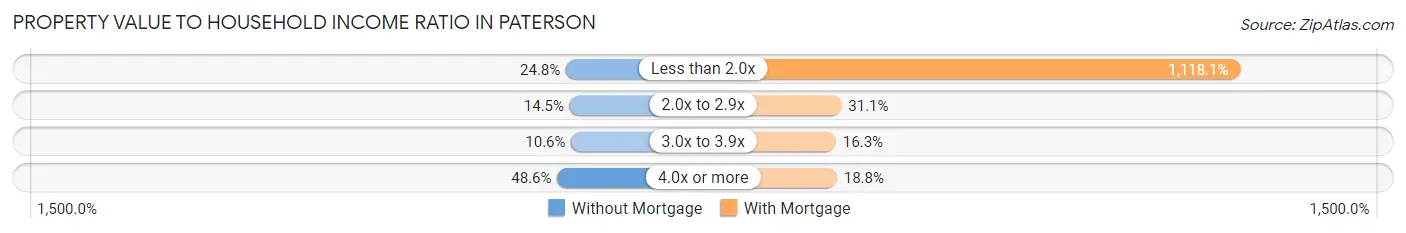
| Value-to-Income Ratio | Without Mortgage | With Mortgage |
| Less than 2.0x | 1,063 (24.8%) | 98,190 (1,118.1%) |
| 2.0x to 2.9x | 622 (14.5%) | 2,730 (31.1%) |
| 3.0x to 3.9x | 452 (10.6%) | 1,432 (16.3%) |
| 4.0x or more | 2,081 (48.6%) | 1,651 (18.8%) |
| Total | 4,282 (100.0%) | 8,782 (100.0%) |
Real Estate Taxes by Mortgage Status in Paterson
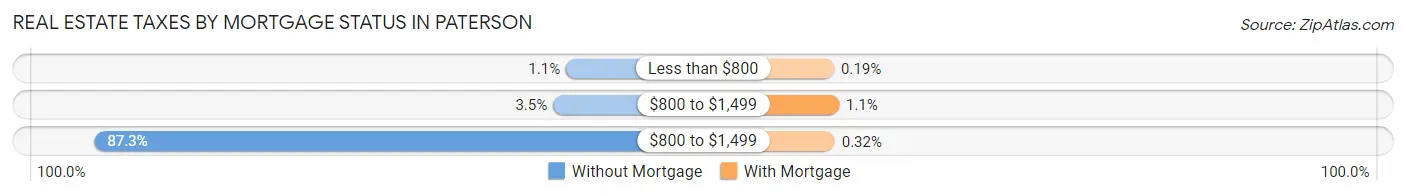
| Property Taxes | Without Mortgage | With Mortgage |
| Less than $800 | 48 (1.1%) | 17 (0.2%) |
| $800 to $1,499 | 149 (3.5%) | 95 (1.1%) |
| $800 to $1,499 | 3,736 (87.3%) | 28 (0.3%) |
| Total | 4,282 (100.0%) | 8,782 (100.0%) |
Health & Disability in Paterson
Health Insurance Coverage by Age in Paterson
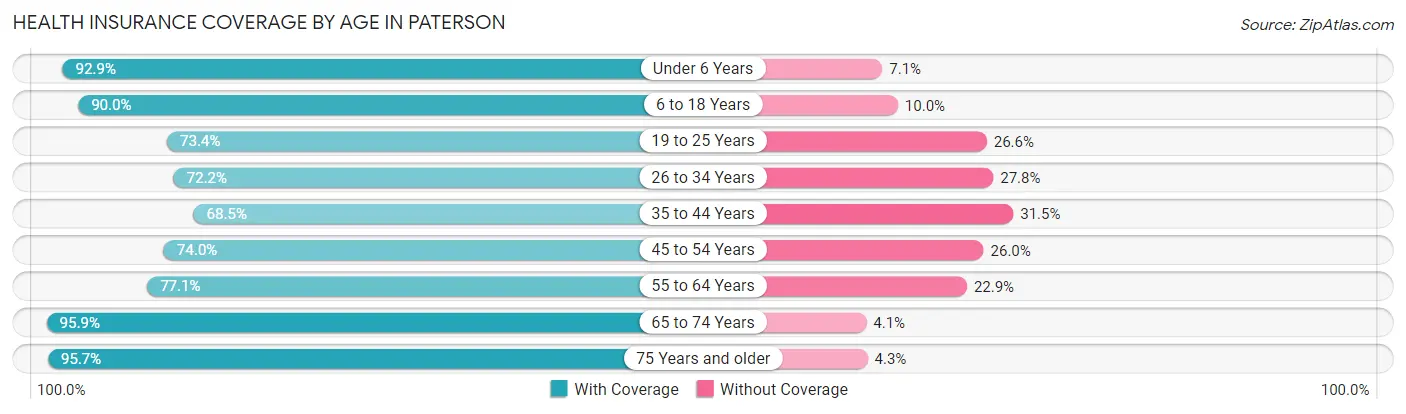
| Age Bracket | With Coverage | Without Coverage |
| Under 6 Years | 13,885 (92.9%) | 1,059 (7.1%) |
| 6 to 18 Years | 27,531 (90.0%) | 3,058 (10.0%) |
| 19 to 25 Years | 11,855 (73.4%) | 4,292 (26.6%) |
| 26 to 34 Years | 15,255 (72.2%) | 5,870 (27.8%) |
| 35 to 44 Years | 13,763 (68.5%) | 6,336 (31.5%) |
| 45 to 54 Years | 14,136 (74.0%) | 4,962 (26.0%) |
| 55 to 64 Years | 13,104 (77.1%) | 3,885 (22.9%) |
| 65 to 74 Years | 10,538 (95.9%) | 452 (4.1%) |
| 75 Years and older | 6,682 (95.7%) | 303 (4.3%) |
| Total | 126,749 (80.7%) | 30,217 (19.3%) |
Health Insurance Coverage by Citizenship Status in Paterson
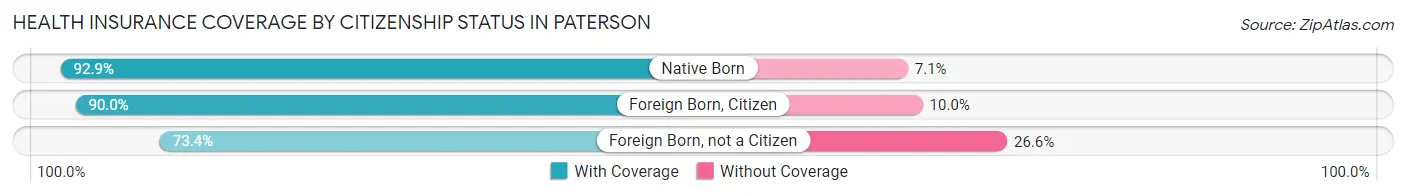
| Citizenship Status | With Coverage | Without Coverage |
| Native Born | 13,885 (92.9%) | 1,059 (7.1%) |
| Foreign Born, Citizen | 27,531 (90.0%) | 3,058 (10.0%) |
| Foreign Born, not a Citizen | 11,855 (73.4%) | 4,292 (26.6%) |
Health Insurance Coverage by Household Income in Paterson
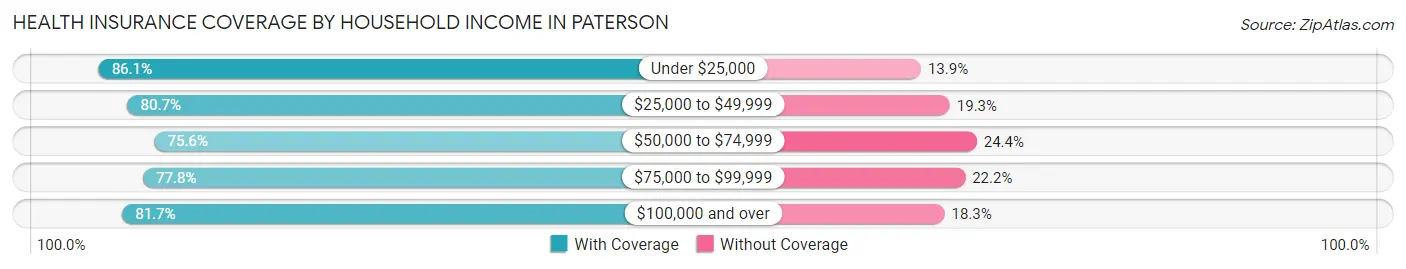
| Household Income | With Coverage | Without Coverage |
| Under $25,000 | 23,200 (86.1%) | 3,746 (13.9%) |
| $25,000 to $49,999 | 27,272 (80.7%) | 6,528 (19.3%) |
| $50,000 to $74,999 | 19,669 (75.6%) | 6,336 (24.4%) |
| $75,000 to $99,999 | 17,363 (77.8%) | 4,952 (22.2%) |
| $100,000 and over | 38,330 (81.7%) | 8,591 (18.3%) |
Public vs Private Health Insurance Coverage by Age in Paterson
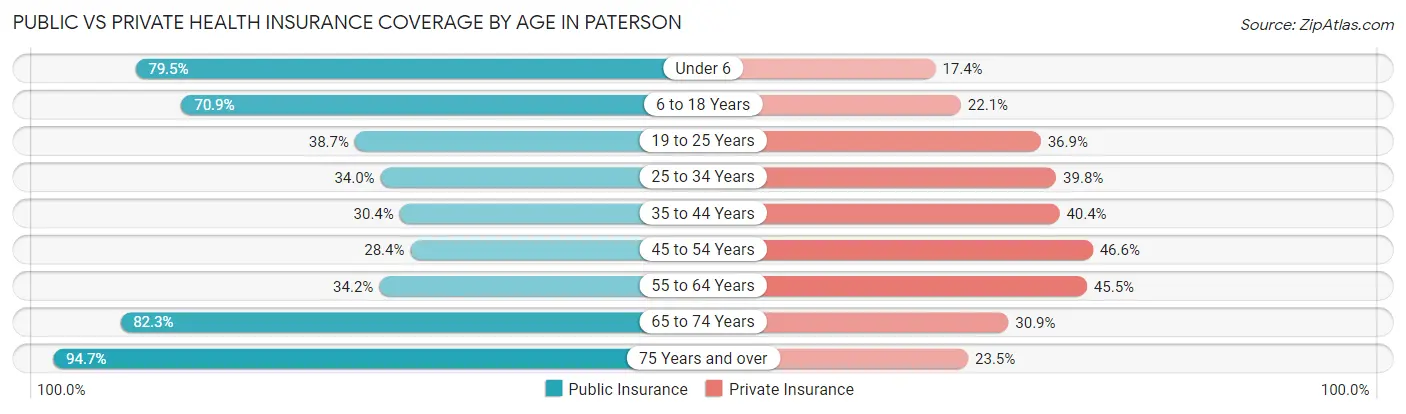
| Age Bracket | Public Insurance | Private Insurance |
| Under 6 | 11,873 (79.4%) | 2,598 (17.4%) |
| 6 to 18 Years | 21,689 (70.9%) | 6,764 (22.1%) |
| 19 to 25 Years | 6,250 (38.7%) | 5,963 (36.9%) |
| 25 to 34 Years | 7,172 (34.0%) | 8,406 (39.8%) |
| 35 to 44 Years | 6,108 (30.4%) | 8,120 (40.4%) |
| 45 to 54 Years | 5,425 (28.4%) | 8,896 (46.6%) |
| 55 to 64 Years | 5,808 (34.2%) | 7,730 (45.5%) |
| 65 to 74 Years | 9,039 (82.3%) | 3,398 (30.9%) |
| 75 Years and over | 6,614 (94.7%) | 1,638 (23.4%) |
| Total | 79,978 (50.9%) | 53,513 (34.1%) |
Disability Status by Sex by Age in Paterson
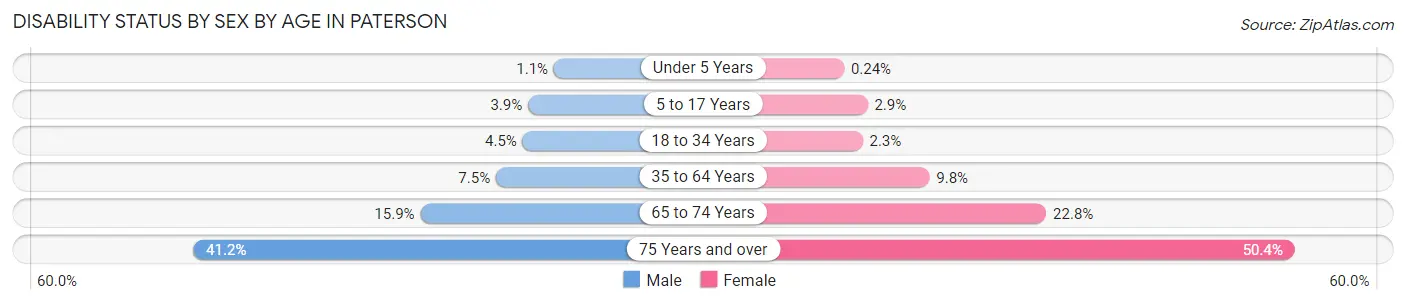
| Age Bracket | Male | Female |
| Under 5 Years | 66 (1.1%) | 15 (0.2%) |
| 5 to 17 Years | 623 (3.9%) | 430 (2.9%) |
| 18 to 34 Years | 898 (4.5%) | 454 (2.3%) |
| 35 to 64 Years | 2,064 (7.5%) | 2,796 (9.8%) |
| 65 to 74 Years | 816 (15.9%) | 1,335 (22.8%) |
| 75 Years and over | 1,182 (41.2%) | 2,077 (50.4%) |
Disability Class by Sex by Age in Paterson
Disability Class: Hearing Difficulty
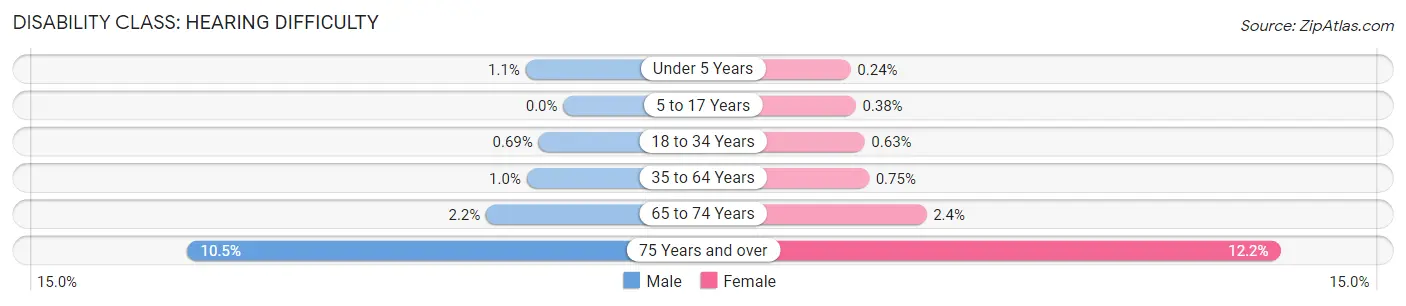
| Age Bracket | Male | Female |
| Under 5 Years | 66 (1.1%) | 15 (0.2%) |
| 5 to 17 Years | 0 (0.0%) | 57 (0.4%) |
| 18 to 34 Years | 136 (0.7%) | 123 (0.6%) |
| 35 to 64 Years | 280 (1.0%) | 216 (0.7%) |
| 65 to 74 Years | 110 (2.1%) | 138 (2.4%) |
| 75 Years and over | 300 (10.5%) | 503 (12.2%) |
Disability Class: Vision Difficulty
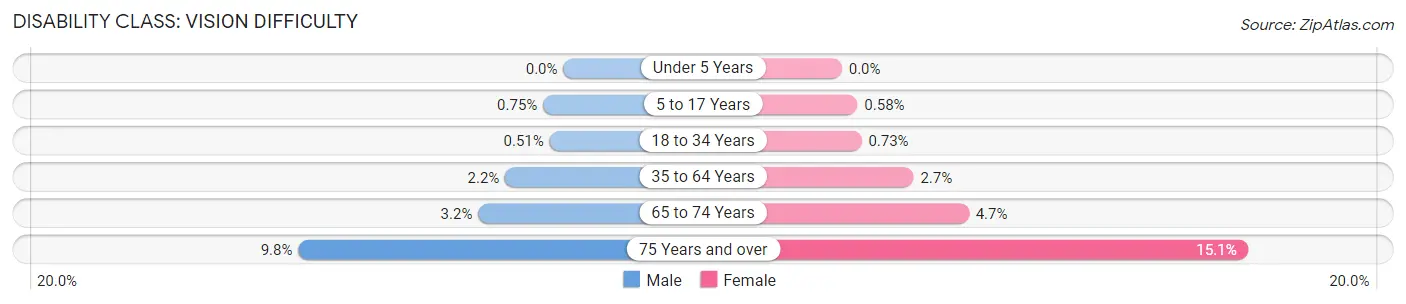
| Age Bracket | Male | Female |
| Under 5 Years | 0 (0.0%) | 0 (0.0%) |
| 5 to 17 Years | 119 (0.7%) | 88 (0.6%) |
| 18 to 34 Years | 101 (0.5%) | 143 (0.7%) |
| 35 to 64 Years | 595 (2.2%) | 763 (2.7%) |
| 65 to 74 Years | 162 (3.2%) | 276 (4.7%) |
| 75 Years and over | 282 (9.8%) | 622 (15.1%) |
Disability Class: Cognitive Difficulty
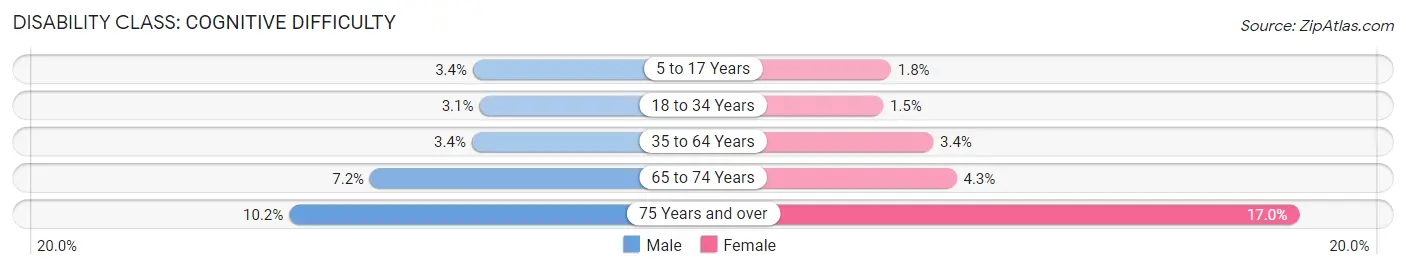
| Age Bracket | Male | Female |
| 5 to 17 Years | 532 (3.4%) | 274 (1.8%) |
| 18 to 34 Years | 618 (3.1%) | 301 (1.5%) |
| 35 to 64 Years | 934 (3.4%) | 972 (3.4%) |
| 65 to 74 Years | 368 (7.2%) | 250 (4.3%) |
| 75 Years and over | 292 (10.2%) | 699 (17.0%) |
Disability Class: Ambulatory Difficulty
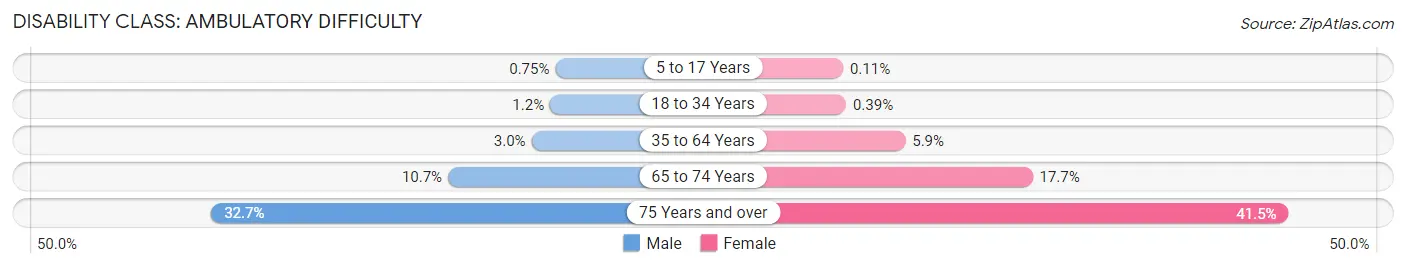
| Age Bracket | Male | Female |
| 5 to 17 Years | 119 (0.7%) | 17 (0.1%) |
| 18 to 34 Years | 246 (1.2%) | 76 (0.4%) |
| 35 to 64 Years | 814 (3.0%) | 1,690 (5.9%) |
| 65 to 74 Years | 549 (10.7%) | 1,038 (17.7%) |
| 75 Years and over | 937 (32.7%) | 1,707 (41.4%) |
Disability Class: Self-Care Difficulty
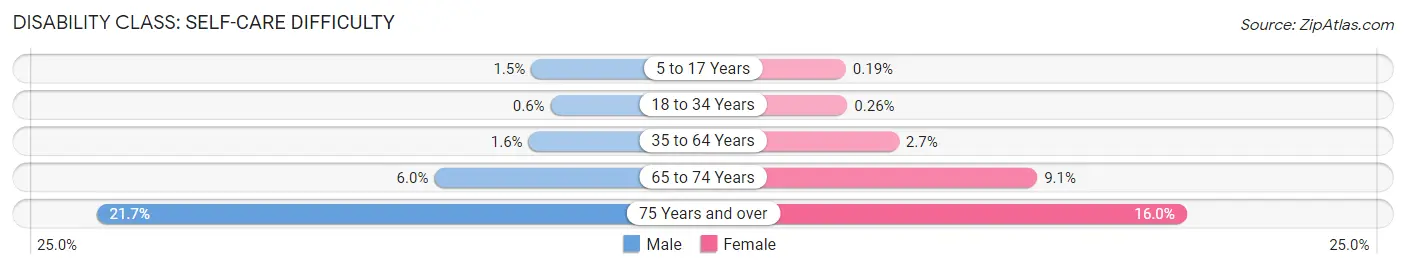
| Age Bracket | Male | Female |
| 5 to 17 Years | 237 (1.5%) | 29 (0.2%) |
| 18 to 34 Years | 118 (0.6%) | 51 (0.3%) |
| 35 to 64 Years | 446 (1.6%) | 760 (2.6%) |
| 65 to 74 Years | 307 (6.0%) | 532 (9.1%) |
| 75 Years and over | 621 (21.7%) | 659 (16.0%) |
Technology Access in Paterson
Computing Device Access in Paterson
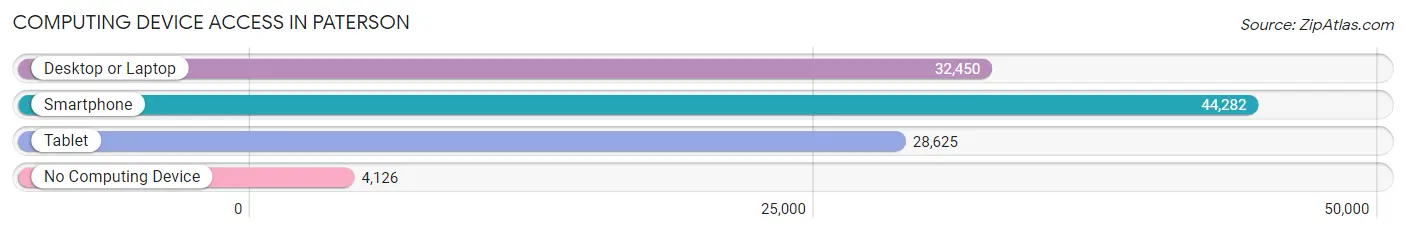
| Device Type | # Households | % Households |
| Desktop or Laptop | 32,450 | 65.3% |
| Smartphone | 44,282 | 89.1% |
| Tablet | 28,625 | 57.6% |
| No Computing Device | 4,126 | 8.3% |
| Total | 49,678 | 100.0% |
Internet Access in Paterson
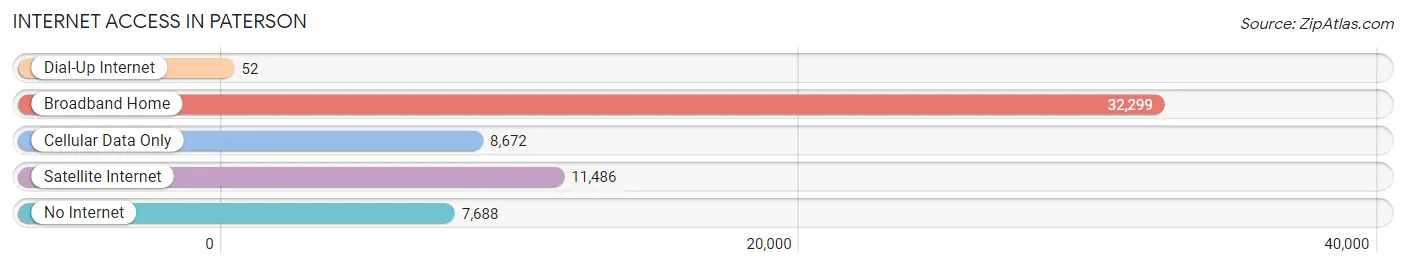
| Internet Type | # Households | % Households |
| Dial-Up Internet | 52 | 0.1% |
| Broadband Home | 32,299 | 65.0% |
| Cellular Data Only | 8,672 | 17.5% |
| Satellite Internet | 11,486 | 23.1% |
| No Internet | 7,688 | 15.5% |
| Total | 49,678 | 100.0% |
Paterson Summary
Paterson, NJ is a city located in Passaic County, New Jersey. It is the county seat and the third-largest city in the state. The city was founded in 1791 by Alexander Hamilton and is named after William Paterson, the first Governor of New Jersey. Paterson is located on the Passaic River, which is a major tributary of the Hudson River.
Geography
Paterson is located in the northeastern part of New Jersey, about 20 miles northwest of New York City. The city is situated on the Passaic River, which is a major tributary of the Hudson River. The city is bordered by the towns of Clifton, Haledon, Prospect Park, and Totowa. The city has a total area of 8.3 square miles, of which 8.2 square miles is land and 0.1 square miles is water.
The city is located in the humid subtropical climate zone, with hot, humid summers and cold, wet winters. The average annual temperature is around 54°F, with an average high of around 75°F in the summer and an average low of around 33°F in the winter. The average annual precipitation is around 45 inches.
Economy
Paterson has a diverse economy, with a mix of manufacturing, retail, and service industries. The city is home to several large manufacturing companies, including the Paterson Silk Mill, the Paterson Carpet Mill, and the Paterson Foundry. The city is also home to several large retail stores, including the Paterson Mall and the Paterson Plaza Shopping Center.
The city is also home to several large service industries, including healthcare, education, and finance. The city is home to St. Joseph's Regional Medical Center, which is the largest hospital in the area. The city is also home to several colleges and universities, including William Paterson University and Passaic County Community College. The city is also home to several large financial institutions, including Bank of America and Wells Fargo.
Demographics
As of the 2010 census, Paterson had a population of 146,199. The racial makeup of the city was 44.3% White, 33.3% African American, 0.7% Native American, 8.2% Asian, 0.1% Pacific Islander, 10.3% from other races, and 3.3% from two or more races. Hispanic or Latino of any race were 33.9% of the population.
The median income for a household in the city was $35,945, and the median income for a family was $41,945. The per capita income for the city was $17,945. About 22.3% of the population was below the poverty line.
Paterson is a diverse city, with a mix of cultures and ethnicities. The city is home to a large Hispanic population, as well as a large African American population. The city is also home to a large Asian population, with the largest groups being Chinese, Indian, and Filipino. The city is also home to a large Jewish population.
Common Questions
What is Per Capita Income in Paterson?
Per Capita income in Paterson is $23,035.
What is the Median Family Income in Paterson?
Median Family Income in Paterson is $59,976.
What is the Median Household income in Paterson?
Median Household Income in Paterson is $52,092.
What is Income or Wage Gap in Paterson?
Income or Wage Gap in Paterson is 21.5%.
Women in Paterson earn 78.5 cents for every dollar earned by a man.
What is Family Income Deficit in Paterson?
Family Income Deficit in Paterson is $10,869.
Families that are below poverty line in Paterson earn $10,869 less on average than the poverty threshold level.
What is Inequality or Gini Index in Paterson?
Inequality or Gini Index in Paterson is 0.47.
What is the Total Population of Paterson?
Total Population of Paterson is 157,864.
What is the Total Male Population of Paterson?
Total Male Population of Paterson is 78,130.
What is the Total Female Population of Paterson?
Total Female Population of Paterson is 79,734.
What is the Ratio of Males per 100 Females in Paterson?
There are 97.99 Males per 100 Females in Paterson.
What is the Ratio of Females per 100 Males in Paterson?
There are 102.05 Females per 100 Males in Paterson.
What is the Median Population Age in Paterson?
Median Population Age in Paterson is 33.1 Years.
What is the Average Family Size in Paterson
Average Family Size in Paterson is 3.7 People.
What is the Average Household Size in Paterson
Average Household Size in Paterson is 3.1 People.
How Large is the Labor Force in Paterson?
There are 75,364 People in the Labor Forcein in Paterson.
What is the Percentage of People in the Labor Force in Paterson?
63.4% of People are in the Labor Force in Paterson.
What is the Unemployment Rate in Paterson?
Unemployment Rate in Paterson is 10.5%.