Hamtramck, MI Map & Demographics
Hamtramck Map
Hamtramck Overview
$14,776
PER CAPITA INCOME
$43,315
AVG FAMILY INCOME
$39,648
AVG HOUSEHOLD INCOME
19.1%
WAGE / INCOME GAP [ % ]
80.9¢/ $1
WAGE / INCOME GAP [ $ ]
$13,757
FAMILY INCOME DEFICIT
0.44
INEQUALITY / GINI INDEX
27,842
TOTAL POPULATION
14,412
MALE POPULATION
13,430
FEMALE POPULATION
107.31
MALES / 100 FEMALES
93.19
FEMALES / 100 MALES
27.8
MEDIAN AGE
4.6
AVG FAMILY SIZE
3.7
AVG HOUSEHOLD SIZE
9,090
LABOR FORCE [ PEOPLE ]
45.9%
PERCENT IN LABOR FORCE
11.7%
UNEMPLOYMENT RATE
Hamtramck Zip Codes
Hamtramck Area Codes
Income in Hamtramck
Income Overview in Hamtramck
Per Capita Income in Hamtramck is $14,776, while median incomes of families and households are $43,315 and $39,648 respectively.
| Characteristic | Number | Measure |
| Per Capita Income | 27,842 | $14,776 |
| Median Family Income | 5,325 | $43,315 |
| Mean Family Income | 5,325 | $56,714 |
| Median Household Income | 7,342 | $39,648 |
| Mean Household Income | 7,342 | $51,559 |
| Income Deficit | 5,325 | $13,757 |
| Wage / Income Gap (%) | 27,842 | 19.12% |
| Wage / Income Gap ($) | 27,842 | 80.88¢ per $1 |
| Gini / Inequality Index | 27,842 | 0.44 |
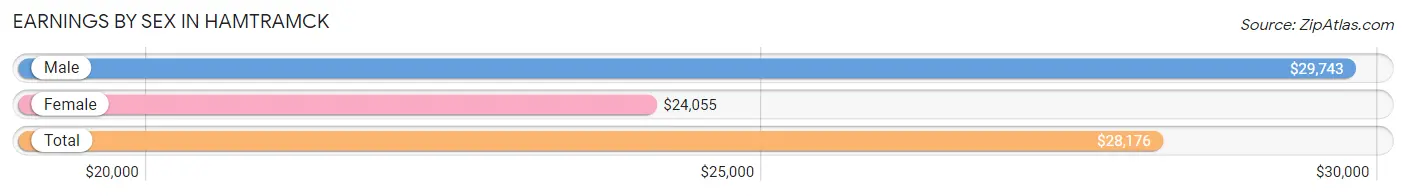
Earnings by Sex in Hamtramck
Average Earnings in Hamtramck are $28,176, $29,743 for men and $24,055 for women, a difference of 19.1%.
| Sex | Number | Average Earnings |
| Male | 6,426 (68.0%) | $29,743 |
| Female | 3,025 (32.0%) | $24,055 |
| Total | 9,451 (100.0%) | $28,176 |
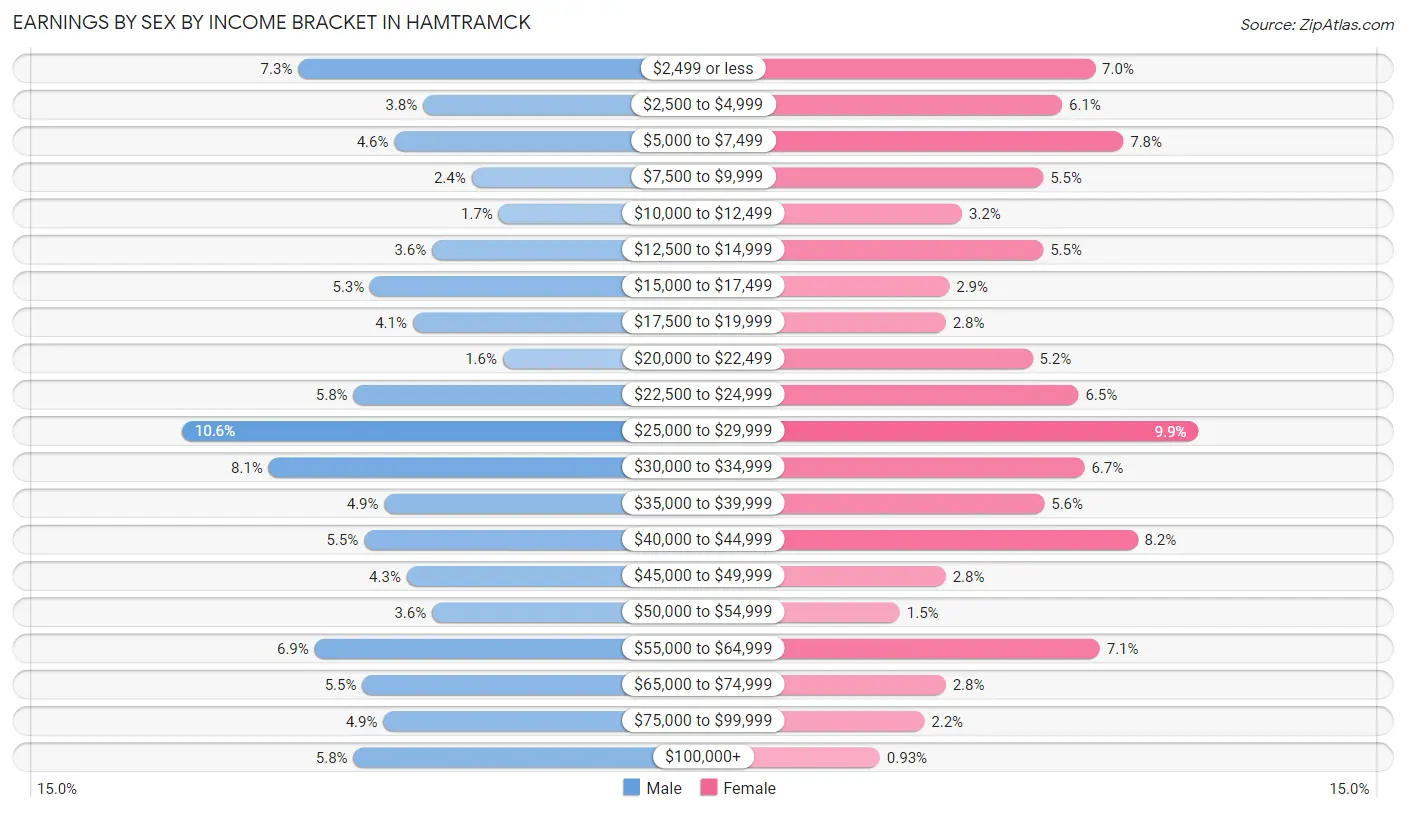
Earnings by Sex by Income Bracket in Hamtramck
The most common earnings brackets in Hamtramck are $25,000 to $29,999 for men (680 | 10.6%) and $25,000 to $29,999 for women (299 | 9.9%).
| Income | Male | Female |
| $2,499 or less | 470 (7.3%) | 211 (7.0%) |
| $2,500 to $4,999 | 244 (3.8%) | 183 (6.0%) |
| $5,000 to $7,499 | 296 (4.6%) | 235 (7.8%) |
| $7,500 to $9,999 | 157 (2.4%) | 167 (5.5%) |
| $10,000 to $12,499 | 108 (1.7%) | 98 (3.2%) |
| $12,500 to $14,999 | 228 (3.5%) | 167 (5.5%) |
| $15,000 to $17,499 | 340 (5.3%) | 87 (2.9%) |
| $17,500 to $19,999 | 263 (4.1%) | 84 (2.8%) |
| $20,000 to $22,499 | 100 (1.6%) | 158 (5.2%) |
| $22,500 to $24,999 | 370 (5.8%) | 197 (6.5%) |
| $25,000 to $29,999 | 680 (10.6%) | 299 (9.9%) |
| $30,000 to $34,999 | 523 (8.1%) | 202 (6.7%) |
| $35,000 to $39,999 | 314 (4.9%) | 168 (5.6%) |
| $40,000 to $44,999 | 351 (5.5%) | 247 (8.2%) |
| $45,000 to $49,999 | 274 (4.3%) | 84 (2.8%) |
| $50,000 to $54,999 | 228 (3.5%) | 45 (1.5%) |
| $55,000 to $64,999 | 440 (6.9%) | 215 (7.1%) |
| $65,000 to $74,999 | 354 (5.5%) | 84 (2.8%) |
| $75,000 to $99,999 | 316 (4.9%) | 66 (2.2%) |
| $100,000+ | 370 (5.8%) | 28 (0.9%) |
| Total | 6,426 (100.0%) | 3,025 (100.0%) |
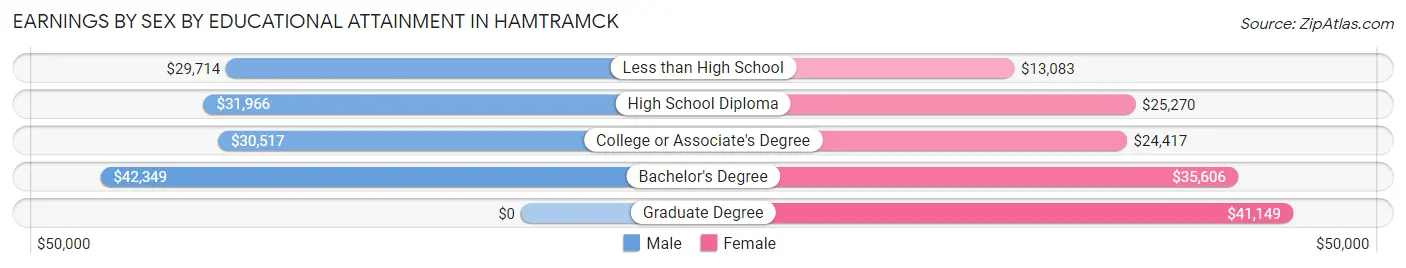
Earnings by Sex by Educational Attainment in Hamtramck
Average earnings in Hamtramck are $32,763 for men and $26,712 for women, a difference of 18.5%. Men with an educational attainment of bachelor's degree enjoy the highest average annual earnings of $42,349, while those with less than high school education earn the least with $29,714. Women with an educational attainment of graduate degree earn the most with the average annual earnings of $41,149, while those with less than high school education have the smallest earnings of $13,083.
| Educational Attainment | Male Income | Female Income |
| Less than High School | $29,714 | $13,083 |
| High School Diploma | $31,966 | $25,270 |
| College or Associate's Degree | $30,517 | $24,417 |
| Bachelor's Degree | $42,349 | $35,606 |
| Graduate Degree | - | - |
| Total | $32,763 | $26,712 |
Family Income in Hamtramck
Family Income Brackets in Hamtramck
According to the Hamtramck family income data, there are 1,038 families falling into the $50,000 to $74,999 income range, which is the most common income bracket and makes up 19.5% of all families. Conversely, the $200,000+ income bracket is the least frequent group with only 128 families (2.4%) belonging to this category.
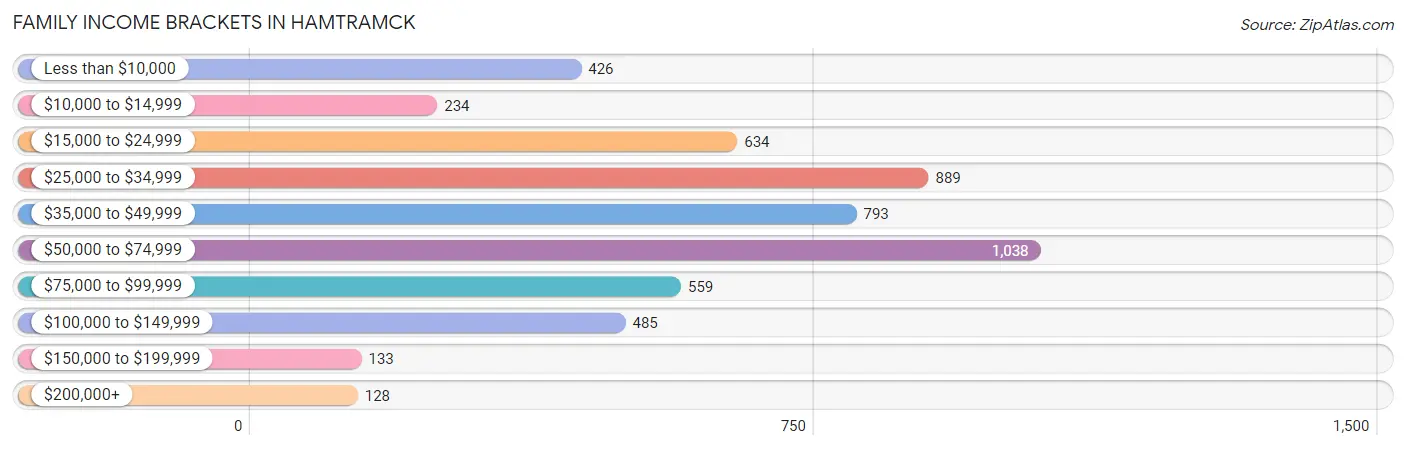
| Income Bracket | # Families | % Families |
| Less than $10,000 | 426 | 8.0% |
| $10,000 to $14,999 | 234 | 4.4% |
| $15,000 to $24,999 | 634 | 11.9% |
| $25,000 to $34,999 | 889 | 16.7% |
| $35,000 to $49,999 | 793 | 14.9% |
| $50,000 to $74,999 | 1,038 | 19.5% |
| $75,000 to $99,999 | 559 | 10.5% |
| $100,000 to $149,999 | 485 | 9.1% |
| $150,000 to $199,999 | 133 | 2.5% |
| $200,000+ | 128 | 2.4% |
Family Income by Famaliy Size in Hamtramck
5-person families (645 | 12.1%) account for the highest median family income in Hamtramck with $49,531 per family, while 2-person families (1,278 | 24.0%) have the highest median income of $21,250 per family member.
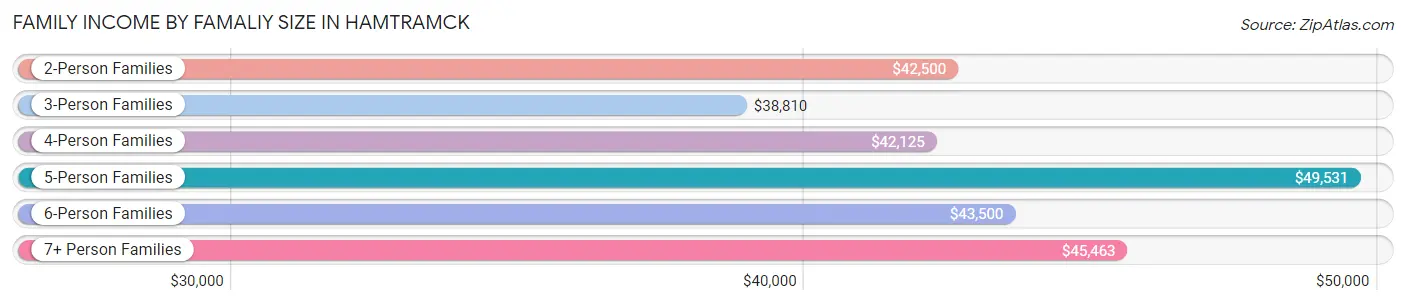
| Income Bracket | # Families | Median Income |
| 2-Person Families | 1,278 (24.0%) | $42,500 |
| 3-Person Families | 795 (14.9%) | $38,810 |
| 4-Person Families | 1,067 (20.0%) | $42,125 |
| 5-Person Families | 645 (12.1%) | $49,531 |
| 6-Person Families | 706 (13.3%) | $43,500 |
| 7+ Person Families | 834 (15.7%) | $45,463 |
| Total | 5,325 (100.0%) | $43,315 |
Family Income by Number of Earners in Hamtramck
The median family income in Hamtramck is $43,315, with families comprising 3+ earners (536) having the highest median family income of $99,179, while families with no earners (615) have the lowest median family income of $13,464, accounting for 10.1% and 11.6% of families, respectively.
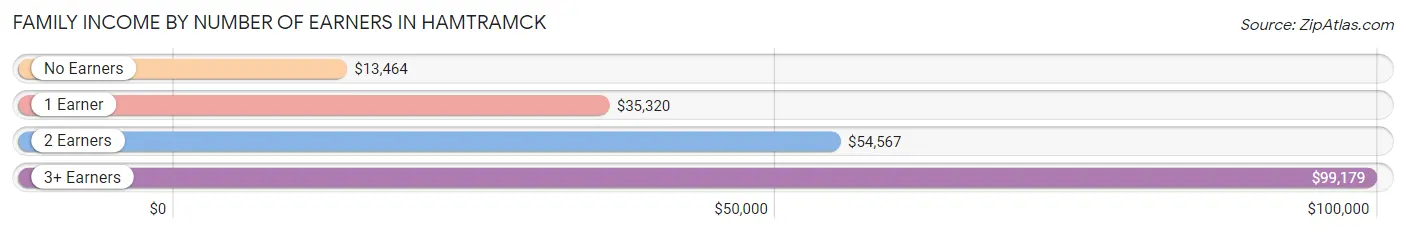
| Number of Earners | # Families | Median Income |
| No Earners | 615 (11.6%) | $13,464 |
| 1 Earner | 2,752 (51.7%) | $35,320 |
| 2 Earners | 1,422 (26.7%) | $54,567 |
| 3+ Earners | 536 (10.1%) | $99,179 |
| Total | 5,325 (100.0%) | $43,315 |
Household Income in Hamtramck
Household Income Brackets in Hamtramck
With 1,292 households falling in the category, the $50,000 to $74,999 income range is the most frequent in Hamtramck, accounting for 17.6% of all households. In contrast, only 132 households (1.8%) fall into the $200,000+ income bracket, making it the least populous group.
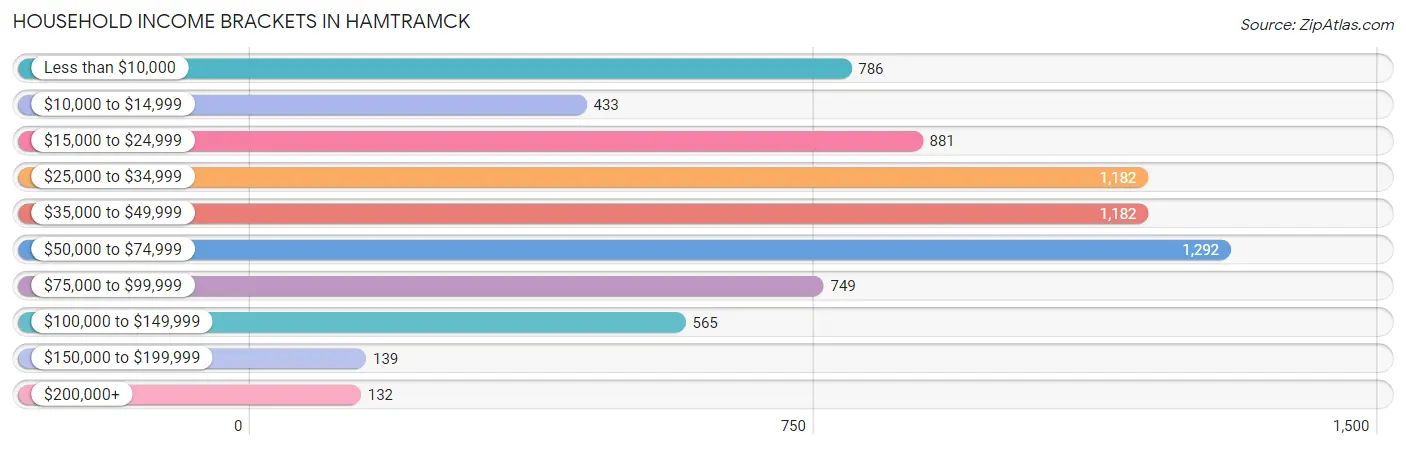
| Income Bracket | # Households | % Households |
| Less than $10,000 | 786 | 10.7% |
| $10,000 to $14,999 | 433 | 5.9% |
| $15,000 to $24,999 | 881 | 12.0% |
| $25,000 to $34,999 | 1,182 | 16.1% |
| $35,000 to $49,999 | 1,182 | 16.1% |
| $50,000 to $74,999 | 1,292 | 17.6% |
| $75,000 to $99,999 | 749 | 10.2% |
| $100,000 to $149,999 | 565 | 7.7% |
| $150,000 to $199,999 | 139 | 1.9% |
| $200,000+ | 132 | 1.8% |
Household Income by Householder Age in Hamtramck
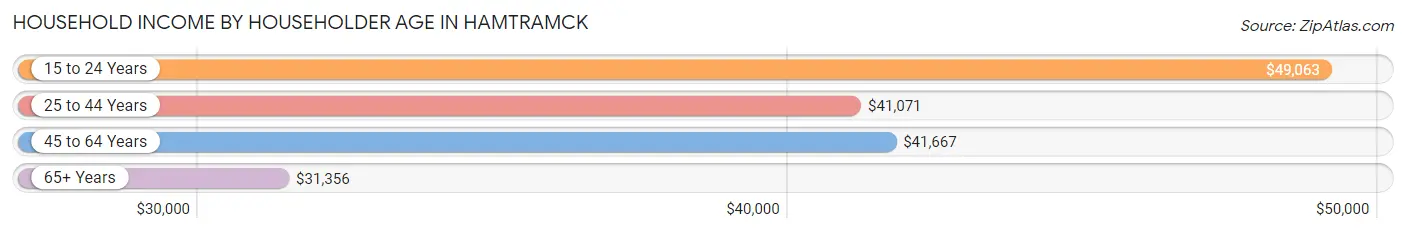
The median household income in Hamtramck is $39,648, with the highest median household income of $49,063 found in the 15 to 24 years age bracket for the primary householder. A total of 250 households (3.4%) fall into this category. Meanwhile, the 65+ years age bracket for the primary householder has the lowest median household income of $31,356, with 1,230 households (16.8%) in this group.
| Income Bracket | # Households | Median Income |
| 15 to 24 Years | 250 (3.4%) | $49,063 |
| 25 to 44 Years | 3,290 (44.8%) | $41,071 |
| 45 to 64 Years | 2,572 (35.0%) | $41,667 |
| 65+ Years | 1,230 (16.8%) | $31,356 |
| Total | 7,342 (100.0%) | $39,648 |
Poverty in Hamtramck
Income Below Poverty by Sex and Age in Hamtramck
With 35.7% poverty level for males and 39.9% for females among the residents of Hamtramck, 12 to 14 year old males and 15 year old females are the most vulnerable to poverty, with 394 males (53.2%) and 215 females (78.2%) in their respective age groups living below the poverty level.
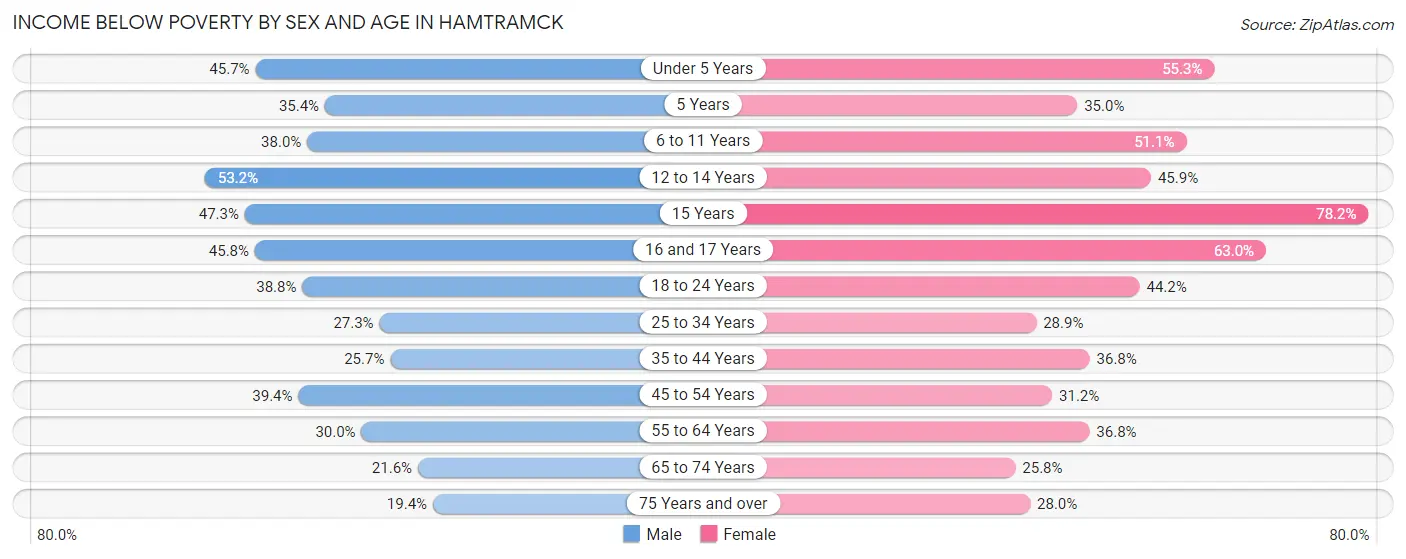
| Age Bracket | Male | Female |
| Under 5 Years | 621 (45.7%) | 637 (55.3%) |
| 5 Years | 80 (35.4%) | 122 (35.0%) |
| 6 to 11 Years | 622 (38.0%) | 561 (51.1%) |
| 12 to 14 Years | 394 (53.2%) | 365 (45.9%) |
| 15 Years | 149 (47.3%) | 215 (78.2%) |
| 16 and 17 Years | 306 (45.8%) | 228 (63.0%) |
| 18 to 24 Years | 710 (38.8%) | 775 (44.2%) |
| 25 to 34 Years | 487 (27.3%) | 615 (28.9%) |
| 35 to 44 Years | 497 (25.7%) | 711 (36.8%) |
| 45 to 54 Years | 593 (39.4%) | 362 (31.2%) |
| 55 to 64 Years | 352 (30.0%) | 410 (36.8%) |
| 65 to 74 Years | 111 (21.6%) | 235 (25.8%) |
| 75 Years and over | 49 (19.4%) | 78 (28.0%) |
| Total | 4,971 (35.7%) | 5,314 (39.9%) |
Income Above Poverty by Sex and Age in Hamtramck
According to the poverty statistics in Hamtramck, males aged 75 years and over and females aged 65 to 74 years are the age groups that are most secure financially, with 80.6% of males and 74.2% of females in these age groups living above the poverty line.
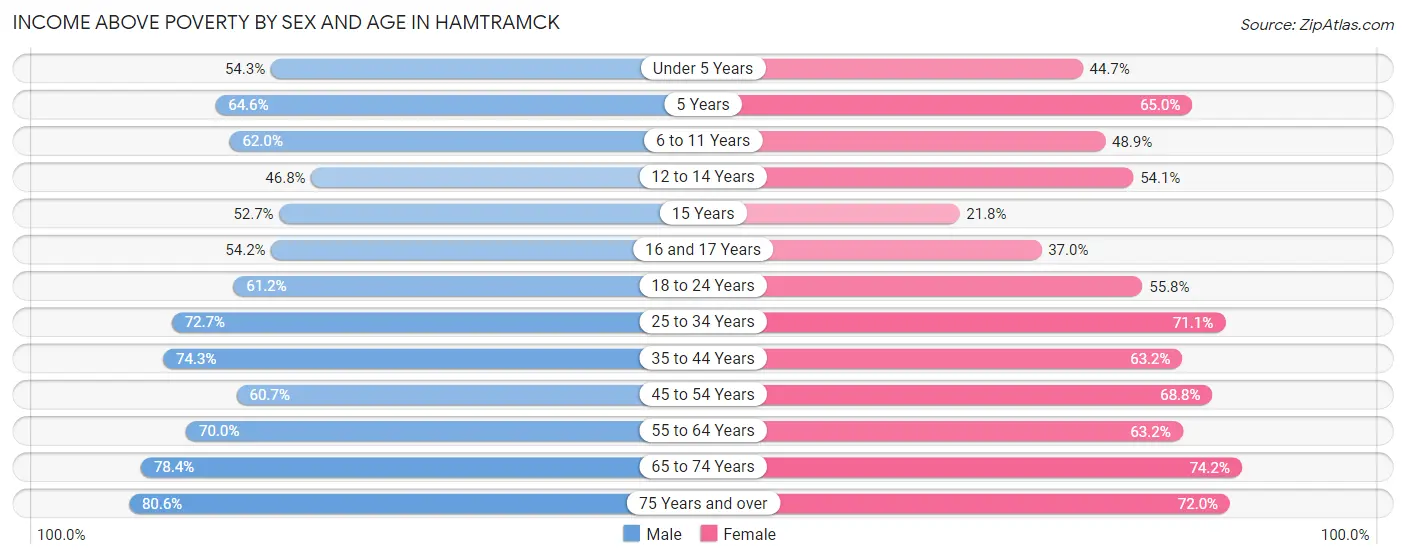
| Age Bracket | Male | Female |
| Under 5 Years | 737 (54.3%) | 515 (44.7%) |
| 5 Years | 146 (64.6%) | 227 (65.0%) |
| 6 to 11 Years | 1,013 (62.0%) | 536 (48.9%) |
| 12 to 14 Years | 346 (46.8%) | 430 (54.1%) |
| 15 Years | 166 (52.7%) | 60 (21.8%) |
| 16 and 17 Years | 362 (54.2%) | 134 (37.0%) |
| 18 to 24 Years | 1,122 (61.2%) | 978 (55.8%) |
| 25 to 34 Years | 1,296 (72.7%) | 1,515 (71.1%) |
| 35 to 44 Years | 1,436 (74.3%) | 1,221 (63.2%) |
| 45 to 54 Years | 914 (60.7%) | 797 (68.8%) |
| 55 to 64 Years | 822 (70.0%) | 705 (63.2%) |
| 65 to 74 Years | 403 (78.4%) | 677 (74.2%) |
| 75 Years and over | 204 (80.6%) | 201 (72.0%) |
| Total | 8,967 (64.3%) | 7,996 (60.1%) |
Income Below Poverty Among Married-Couple Families in Hamtramck
The poverty statistics for married-couple families in Hamtramck show that 30.9% or 1,295 of the total 4,194 families live below the poverty line. Families with 5 or more children have the highest poverty rate of 76.3%, comprising of 200 families. On the other hand, families with no children have the lowest poverty rate of 12.1%, which includes 169 families.
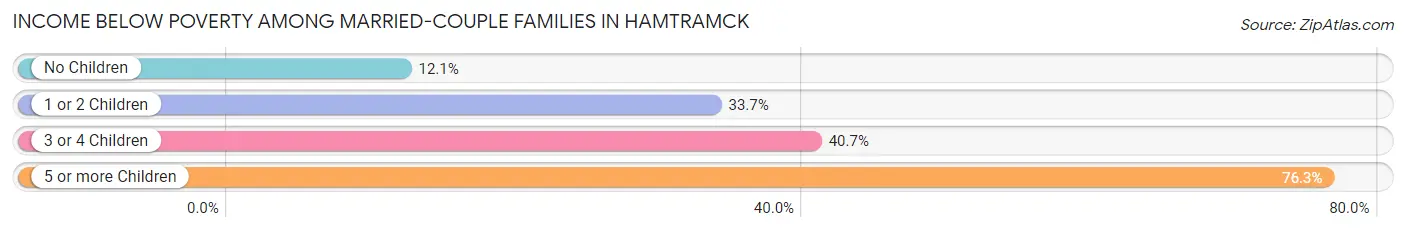
| Children | Above Poverty | Below Poverty |
| No Children | 1,230 (87.9%) | 169 (12.1%) |
| 1 or 2 Children | 985 (66.3%) | 500 (33.7%) |
| 3 or 4 Children | 622 (59.4%) | 426 (40.6%) |
| 5 or more Children | 62 (23.7%) | 200 (76.3%) |
| Total | 2,899 (69.1%) | 1,295 (30.9%) |
Income Below Poverty Among Single-Parent Households in Hamtramck
According to the poverty data in Hamtramck, 32.4% or 92 single-father households and 46.6% or 395 single-mother households are living below the poverty line. Among single-father households, those with 3 or 4 children have the highest poverty rate, with 30 households (62.5%) experiencing poverty. Likewise, among single-mother households, those with 5 or more children have the highest poverty rate, with 9 households (100.0%) falling below the poverty line.
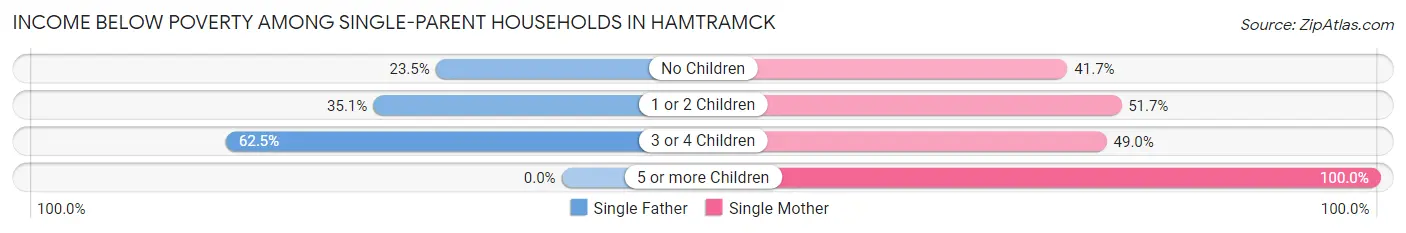
| Children | Single Father | Single Mother |
| No Children | 42 (23.5%) | 185 (41.7%) |
| 1 or 2 Children | 20 (35.1%) | 153 (51.7%) |
| 3 or 4 Children | 30 (62.5%) | 48 (49.0%) |
| 5 or more Children | 0 (0.0%) | 9 (100.0%) |
| Total | 92 (32.4%) | 395 (46.6%) |
Income Below Poverty Among Married-Couple vs Single-Parent Households in Hamtramck
The poverty data for Hamtramck shows that 1,295 of the married-couple family households (30.9%) and 487 of the single-parent households (43.1%) are living below the poverty level. Within the married-couple family households, those with 5 or more children have the highest poverty rate, with 200 households (76.3%) falling below the poverty line. Among the single-parent households, those with 5 or more children have the highest poverty rate, with 9 household (100.0%) living below poverty.
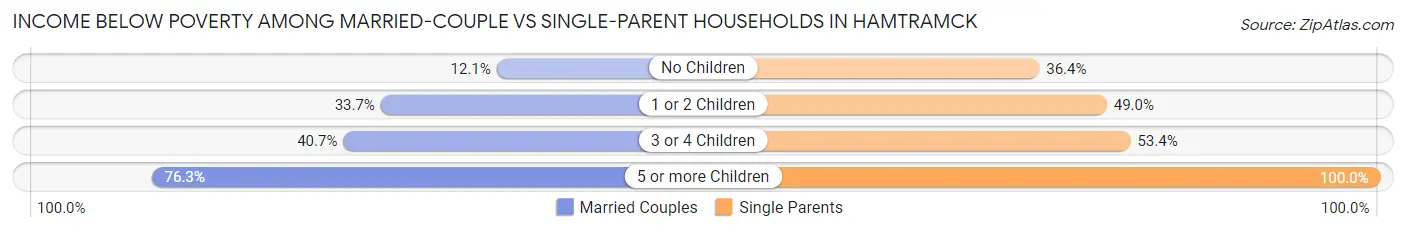
| Children | Married-Couple Families | Single-Parent Households |
| No Children | 169 (12.1%) | 227 (36.4%) |
| 1 or 2 Children | 500 (33.7%) | 173 (49.0%) |
| 3 or 4 Children | 426 (40.6%) | 78 (53.4%) |
| 5 or more Children | 200 (76.3%) | 9 (100.0%) |
| Total | 1,295 (30.9%) | 487 (43.1%) |
Race in Hamtramck
The most populous races in Hamtramck are White / Caucasian (15,069 | 54.1%), Asian (7,253 | 26.1%), and Black / African American (2,717 | 9.8%).
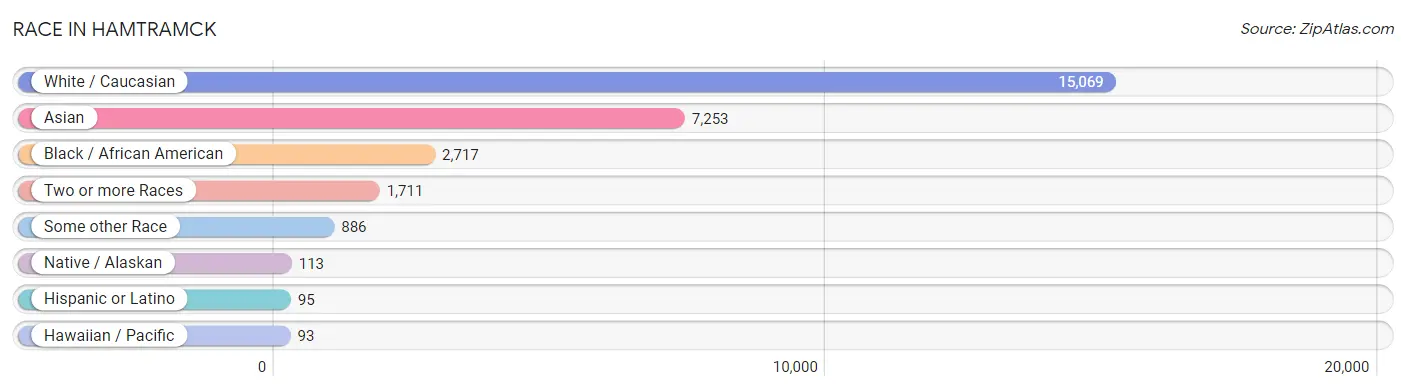
| Race | # Population | % Population |
| Asian | 7,253 | 26.1% |
| Black / African American | 2,717 | 9.8% |
| Hawaiian / Pacific | 93 | 0.3% |
| Hispanic or Latino | 95 | 0.3% |
| Native / Alaskan | 113 | 0.4% |
| White / Caucasian | 15,069 | 54.1% |
| Two or more Races | 1,711 | 6.1% |
| Some other Race | 886 | 3.2% |
| Total | 27,842 | 100.0% |
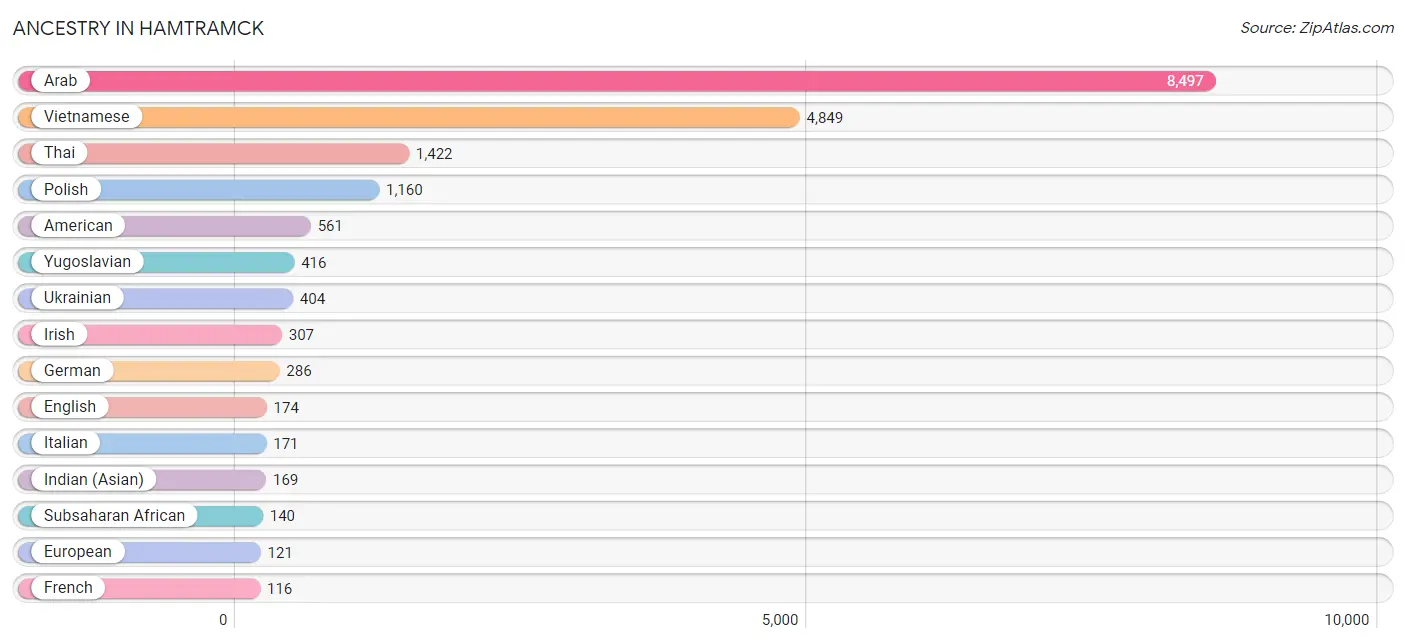
Ancestry in Hamtramck
The most populous ancestries reported in Hamtramck are Arab (8,497 | 30.5%), Vietnamese (4,849 | 17.4%), Thai (1,422 | 5.1%), Polish (1,160 | 4.2%), and American (561 | 2.0%), together accounting for 59.2% of all Hamtramck residents.
| Ancestry | # Population | % Population |
| African | 25 | 0.1% |
| Albanian | 72 | 0.3% |
| American | 561 | 2.0% |
| Arab | 8,497 | 30.5% |
| Austrian | 10 | 0.0% |
| Bangladeshi | 102 | 0.4% |
| Belgian | 41 | 0.2% |
| Bhutanese | 11 | 0.0% |
| British | 8 | 0.0% |
| Burmese | 18 | 0.1% |
| Cherokee | 4 | 0.0% |
| Choctaw | 2 | 0.0% |
| Czech | 5 | 0.0% |
| Dutch | 66 | 0.2% |
| English | 174 | 0.6% |
| European | 121 | 0.4% |
| French | 116 | 0.4% |
| French Canadian | 18 | 0.1% |
| German | 286 | 1.0% |
| Greek | 23 | 0.1% |
| Hungarian | 50 | 0.2% |
| Indian (Asian) | 169 | 0.6% |
| Iranian | 29 | 0.1% |
| Iraqi | 6 | 0.0% |
| Irish | 307 | 1.1% |
| Italian | 171 | 0.6% |
| Jamaican | 22 | 0.1% |
| Korean | 20 | 0.1% |
| Latvian | 9 | 0.0% |
| Lebanese | 72 | 0.3% |
| Liberian | 91 | 0.3% |
| Lithuanian | 15 | 0.1% |
| Macedonian | 3 | 0.0% |
| Mexican | 78 | 0.3% |
| Mexican American Indian | 11 | 0.0% |
| Norwegian | 16 | 0.1% |
| Polish | 1,160 | 4.2% |
| Puerto Rican | 17 | 0.1% |
| Russian | 18 | 0.1% |
| Scotch-Irish | 45 | 0.2% |
| Scottish | 18 | 0.1% |
| Serbian | 7 | 0.0% |
| Slavic | 19 | 0.1% |
| Slovak | 24 | 0.1% |
| Sri Lankan | 74 | 0.3% |
| Subsaharan African | 140 | 0.5% |
| Swedish | 39 | 0.1% |
| Syrian | 11 | 0.0% |
| Thai | 1,422 | 5.1% |
| Ukrainian | 404 | 1.5% |
| Vietnamese | 4,849 | 17.4% |
| Welsh | 3 | 0.0% |
| Yugoslavian | 416 | 1.5% | View All 53 Rows |
Immigrants in Hamtramck
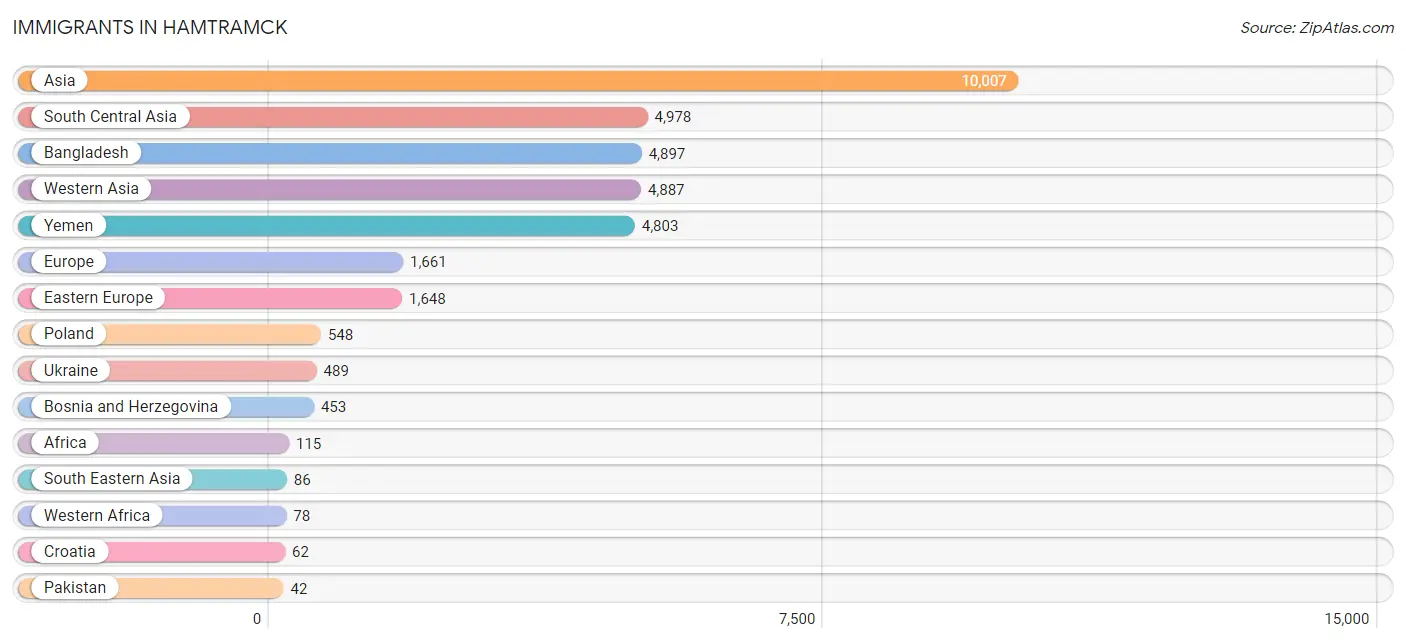
The most numerous immigrant groups reported in Hamtramck came from Asia (10,007 | 35.9%), South Central Asia (4,978 | 17.9%), Bangladesh (4,897 | 17.6%), Western Asia (4,887 | 17.5%), and Yemen (4,803 | 17.2%), together accounting for 106.2% of all Hamtramck residents.
| Immigration Origin | # Population | % Population |
| Africa | 115 | 0.4% |
| Albania | 11 | 0.0% |
| Asia | 10,007 | 35.9% |
| Bangladesh | 4,897 | 17.6% |
| Bosnia and Herzegovina | 453 | 1.6% |
| Caribbean | 9 | 0.0% |
| Croatia | 62 | 0.2% |
| Eastern Africa | 13 | 0.1% |
| Eastern Europe | 1,648 | 5.9% |
| Europe | 1,661 | 6.0% |
| India | 11 | 0.0% |
| Iraq | 6 | 0.0% |
| Italy | 9 | 0.0% |
| Jamaica | 9 | 0.0% |
| Jordan | 9 | 0.0% |
| Kenya | 13 | 0.1% |
| Laos | 8 | 0.0% |
| Latin America | 13 | 0.1% |
| Lebanon | 11 | 0.0% |
| Liberia | 34 | 0.1% |
| Netherlands | 4 | 0.0% |
| North Macedonia | 3 | 0.0% |
| Northern Africa | 24 | 0.1% |
| Pakistan | 42 | 0.2% |
| Philippines | 24 | 0.1% |
| Poland | 548 | 2.0% |
| Saudi Arabia | 11 | 0.0% |
| South America | 4 | 0.0% |
| South Central Asia | 4,978 | 17.9% |
| South Eastern Asia | 86 | 0.3% |
| Southern Europe | 9 | 0.0% |
| Sri Lanka | 28 | 0.1% |
| Thailand | 35 | 0.1% |
| Ukraine | 489 | 1.8% |
| Uruguay | 4 | 0.0% |
| Vietnam | 13 | 0.1% |
| Western Africa | 78 | 0.3% |
| Western Asia | 4,887 | 17.5% |
| Western Europe | 4 | 0.0% |
| Yemen | 4,803 | 17.2% | View All 40 Rows |
Sex and Age in Hamtramck
Sex and Age in Hamtramck
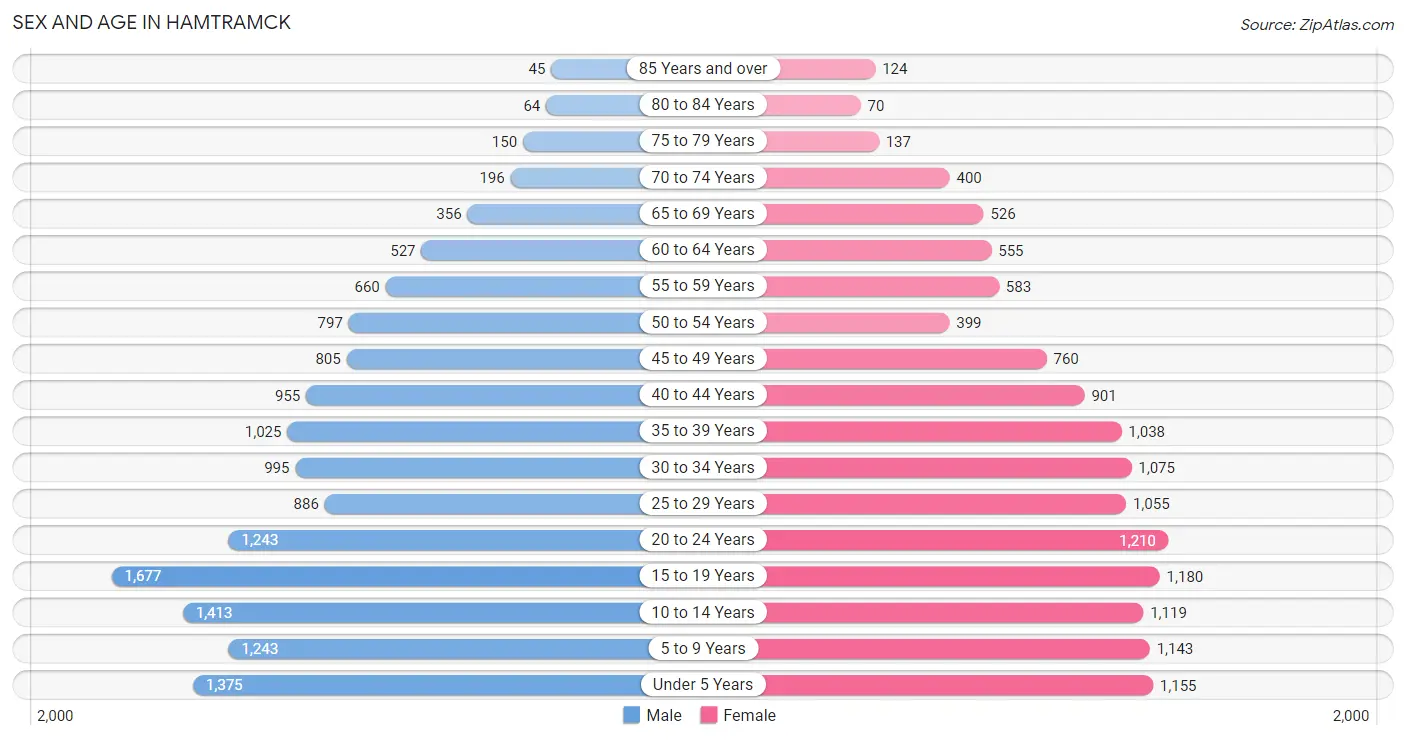
The most populous age groups in Hamtramck are 15 to 19 Years (1,677 | 11.6%) for men and 20 to 24 Years (1,210 | 9.0%) for women.
| Age Bracket | Male | Female |
| Under 5 Years | 1,375 (9.5%) | 1,155 (8.6%) |
| 5 to 9 Years | 1,243 (8.6%) | 1,143 (8.5%) |
| 10 to 14 Years | 1,413 (9.8%) | 1,119 (8.3%) |
| 15 to 19 Years | 1,677 (11.6%) | 1,180 (8.8%) |
| 20 to 24 Years | 1,243 (8.6%) | 1,210 (9.0%) |
| 25 to 29 Years | 886 (6.1%) | 1,055 (7.9%) |
| 30 to 34 Years | 995 (6.9%) | 1,075 (8.0%) |
| 35 to 39 Years | 1,025 (7.1%) | 1,038 (7.7%) |
| 40 to 44 Years | 955 (6.6%) | 901 (6.7%) |
| 45 to 49 Years | 805 (5.6%) | 760 (5.7%) |
| 50 to 54 Years | 797 (5.5%) | 399 (3.0%) |
| 55 to 59 Years | 660 (4.6%) | 583 (4.3%) |
| 60 to 64 Years | 527 (3.7%) | 555 (4.1%) |
| 65 to 69 Years | 356 (2.5%) | 526 (3.9%) |
| 70 to 74 Years | 196 (1.4%) | 400 (3.0%) |
| 75 to 79 Years | 150 (1.0%) | 137 (1.0%) |
| 80 to 84 Years | 64 (0.4%) | 70 (0.5%) |
| 85 Years and over | 45 (0.3%) | 124 (0.9%) |
| Total | 14,412 (100.0%) | 13,430 (100.0%) |
Families and Households in Hamtramck
Median Family Size in Hamtramck
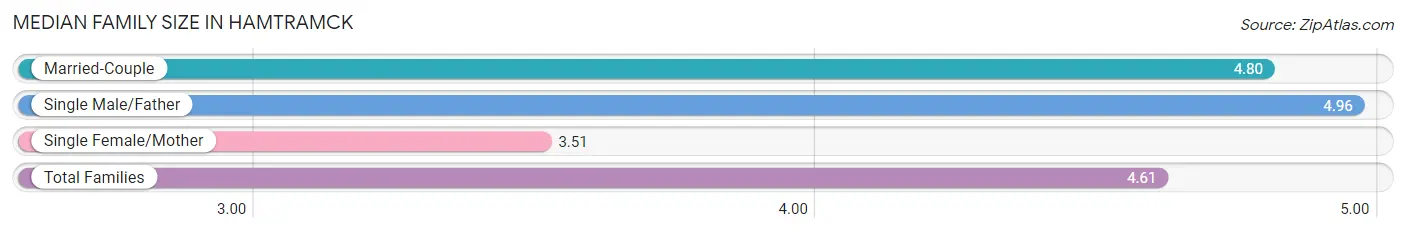
The median family size in Hamtramck is 4.61 persons per family, with single male/father families (284 | 5.3%) accounting for the largest median family size of 4.96 persons per family. On the other hand, single female/mother families (847 | 15.9%) represent the smallest median family size with 3.51 persons per family.
| Family Type | # Families | Family Size |
| Married-Couple | 4,194 (78.8%) | 4.80 |
| Single Male/Father | 284 (5.3%) | 4.96 |
| Single Female/Mother | 847 (15.9%) | 3.51 |
| Total Families | 5,325 (100.0%) | 4.61 |
Median Household Size in Hamtramck
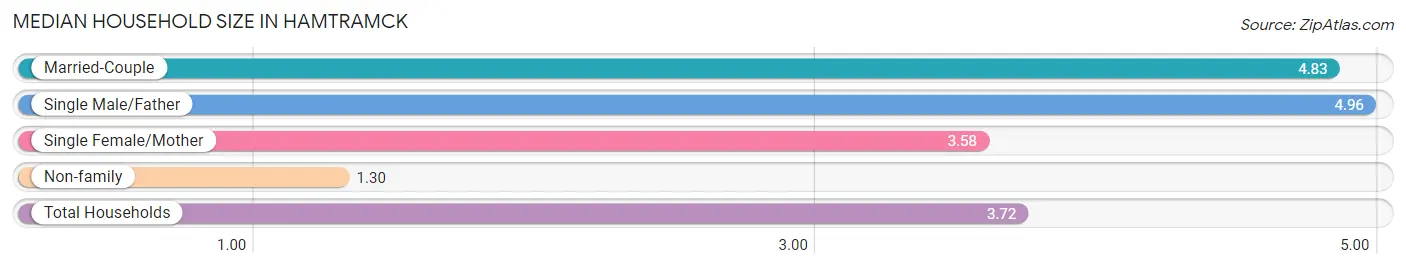
The median household size in Hamtramck is 3.72 persons per household, with single male/father households (284 | 3.9%) accounting for the largest median household size of 4.96 persons per household. non-family households (2,017 | 27.5%) represent the smallest median household size with 1.30 persons per household.
| Household Type | # Households | Household Size |
| Married-Couple | 4,194 (57.1%) | 4.83 |
| Single Male/Father | 284 (3.9%) | 4.96 |
| Single Female/Mother | 847 (11.5%) | 3.58 |
| Non-family | 2,017 (27.5%) | 1.30 |
| Total Households | 7,342 (100.0%) | 3.72 |
Household Size by Marriage Status in Hamtramck
Out of a total of 7,342 households in Hamtramck, 5,325 (72.5%) are family households, while 2,017 (27.5%) are nonfamily households. The most numerous type of family households are 2-person households, comprising 1,247, and the most common type of nonfamily households are 1-person households, comprising 1,648.
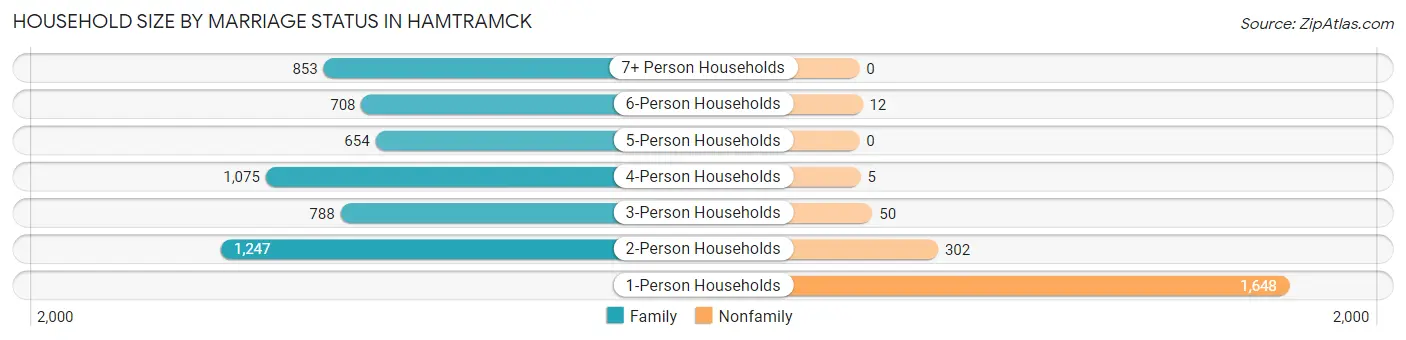
| Household Size | Family Households | Nonfamily Households |
| 1-Person Households | - | 1,648 (22.5%) |
| 2-Person Households | 1,247 (17.0%) | 302 (4.1%) |
| 3-Person Households | 788 (10.7%) | 50 (0.7%) |
| 4-Person Households | 1,075 (14.6%) | 5 (0.1%) |
| 5-Person Households | 654 (8.9%) | 0 (0.0%) |
| 6-Person Households | 708 (9.6%) | 12 (0.2%) |
| 7+ Person Households | 853 (11.6%) | 0 (0.0%) |
| Total | 5,325 (72.5%) | 2,017 (27.5%) |
Female Fertility in Hamtramck
Fertility by Age in Hamtramck
Average fertility rate in Hamtramck is 63.0 births per 1,000 women. Women in the age bracket of 35 to 50 years have the highest fertility rate with 85.0 births per 1,000 women. Women in the age bracket of 35 to 50 years acount for 50.8% of all women with births.
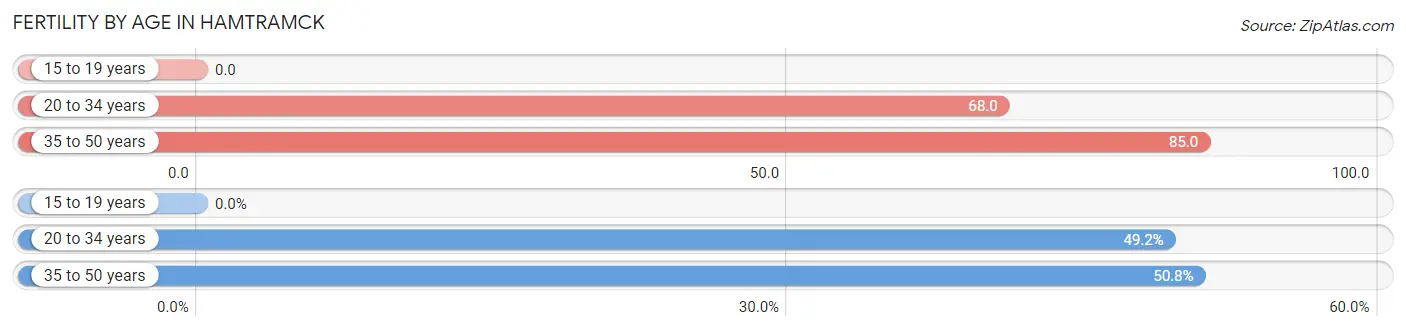
| Age Bracket | Women with Births | Births / 1,000 Women |
| 15 to 19 years | 0 (0.0%) | 0.0 |
| 20 to 34 years | 227 (49.2%) | 68.0 |
| 35 to 50 years | 234 (50.8%) | 85.0 |
| Total | 461 (100.0%) | 63.0 |
Fertility by Age by Marriage Status in Hamtramck
99.8% of women with births (461) in Hamtramck are married. The highest percentage of unmarried women with births falls into 35 to 50 years age bracket with 0.4% of them unmarried at the time of birth, while the lowest percentage of unmarried women with births belong to 20 to 34 years age bracket with 0.0% of them unmarried.
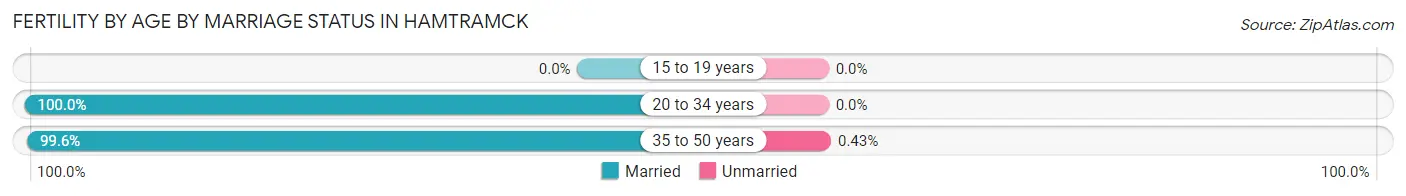
| Age Bracket | Married | Unmarried |
| 15 to 19 years | 0 (0.0%) | 0 (0.0%) |
| 20 to 34 years | 227 (100.0%) | 0 (0.0%) |
| 35 to 50 years | 233 (99.6%) | 1 (0.4%) |
| Total | 460 (99.8%) | 1 (0.2%) |
Fertility by Education in Hamtramck
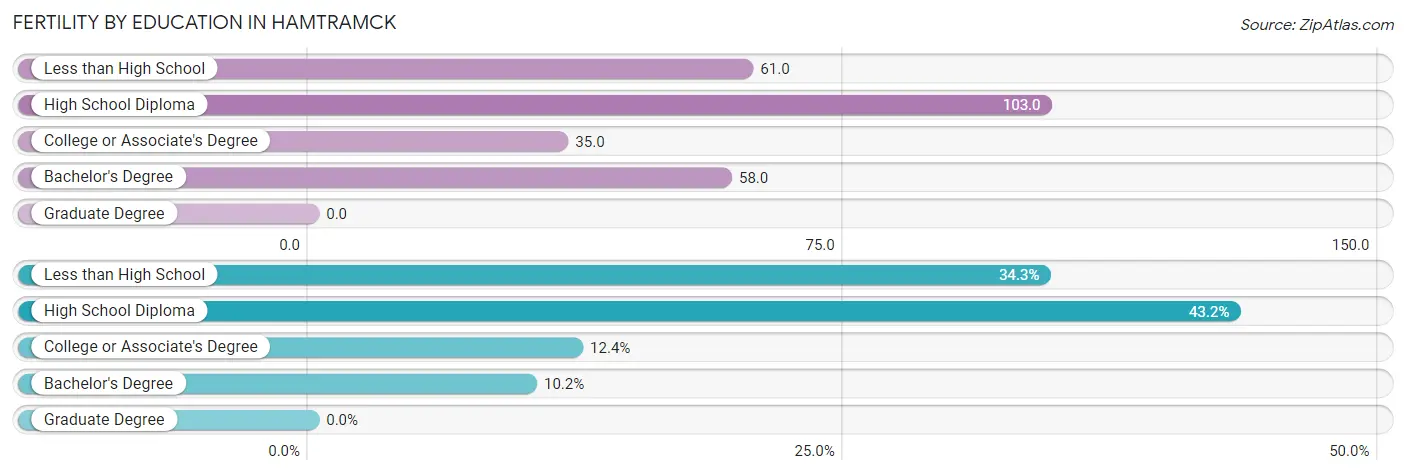
| Educational Attainment | Women with Births | Births / 1,000 Women |
| Less than High School | 158 (34.3%) | 61.0 |
| High School Diploma | 199 (43.2%) | 103.0 |
| College or Associate's Degree | 57 (12.4%) | 35.0 |
| Bachelor's Degree | 47 (10.2%) | 58.0 |
| Graduate Degree | 0 (0.0%) | 0.0 |
| Total | 461 (100.0%) | 63.0 |
Fertility by Education by Marriage Status in Hamtramck
0.2% of women with births in Hamtramck are unmarried. Women with the educational attainment of less than high school are most likely to be married with 100.0% of them married at childbirth, while women with the educational attainment of college or associate's degree are least likely to be married with 1.8% of them unmarried at childbirth.
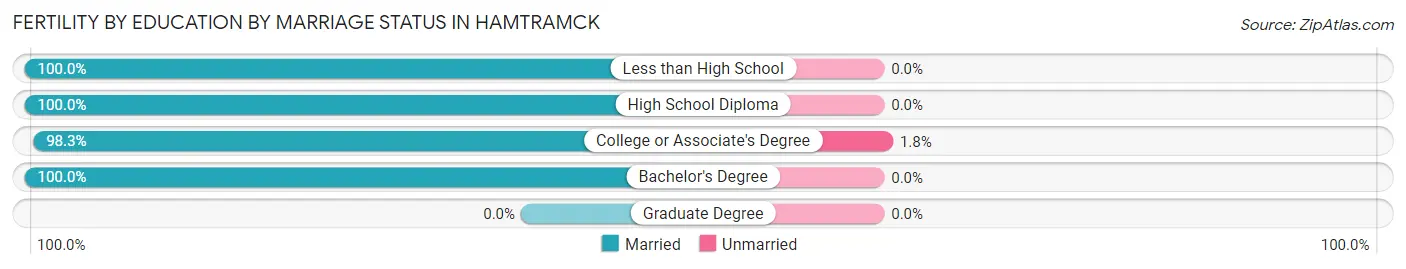
| Educational Attainment | Married | Unmarried |
| Less than High School | 158 (100.0%) | 0 (0.0%) |
| High School Diploma | 199 (100.0%) | 0 (0.0%) |
| College or Associate's Degree | 56 (98.3%) | 1 (1.8%) |
| Bachelor's Degree | 47 (100.0%) | 0 (0.0%) |
| Graduate Degree | 0 (0.0%) | 0 (0.0%) |
| Total | 460 (99.8%) | 1 (0.2%) |
Employment Characteristics in Hamtramck
Employment by Class of Employer in Hamtramck
Among the 7,853 employed individuals in Hamtramck, private company employees (6,073 | 77.3%), not-for-profit organizations (810 | 10.3%), and self-employed (not incorporated) (252 | 3.2%) make up the most common classes of employment.
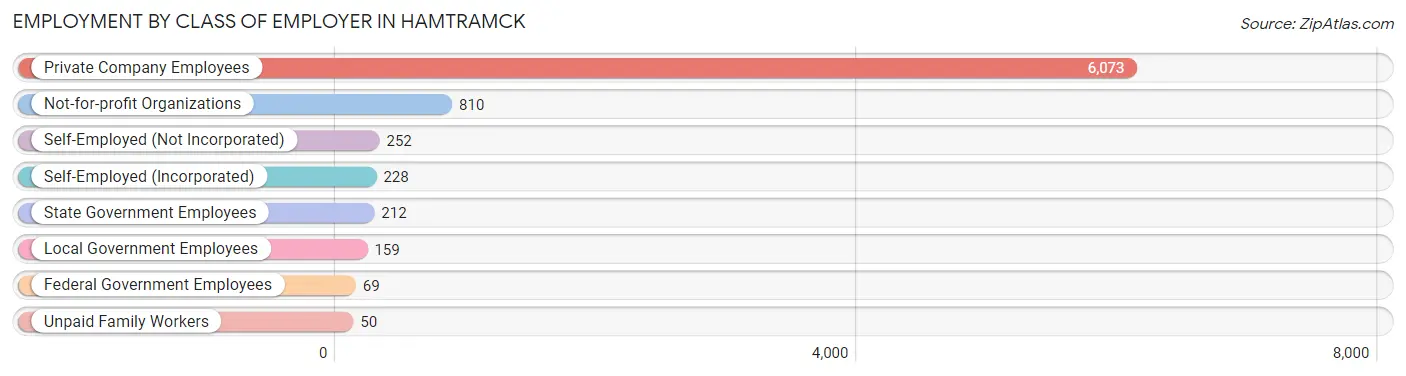
| Employer Class | # Employees | % Employees |
| Private Company Employees | 6,073 | 77.3% |
| Self-Employed (Incorporated) | 228 | 2.9% |
| Self-Employed (Not Incorporated) | 252 | 3.2% |
| Not-for-profit Organizations | 810 | 10.3% |
| Local Government Employees | 159 | 2.0% |
| State Government Employees | 212 | 2.7% |
| Federal Government Employees | 69 | 0.9% |
| Unpaid Family Workers | 50 | 0.6% |
| Total | 7,853 | 100.0% |
Employment Status by Age in Hamtramck
According to the labor force statistics for Hamtramck, out of the total population over 16 years of age (19,804), 45.9% or 9,090 individuals are in the labor force, with 11.7% or 1,064 of them unemployed. The age group with the highest labor force participation rate is 25 to 29 years, with 65.0% or 1,262 individuals in the labor force. Within the labor force, the 75 years and over age range has the highest percentage of unemployed individuals, with 50.0% or 24 of them being unemployed.
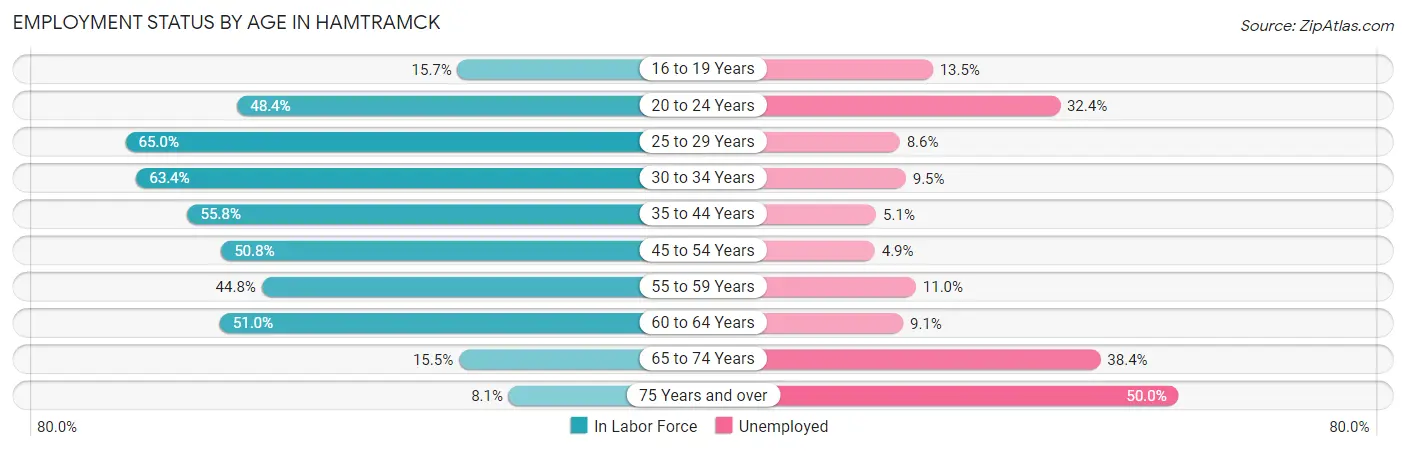
| Age Bracket | In Labor Force | Unemployed |
| 16 to 19 Years | 356 (15.7%) | 48 (13.5%) |
| 20 to 24 Years | 1,187 (48.4%) | 385 (32.4%) |
| 25 to 29 Years | 1,262 (65.0%) | 109 (8.6%) |
| 30 to 34 Years | 1,312 (63.4%) | 125 (9.5%) |
| 35 to 44 Years | 2,187 (55.8%) | 112 (5.1%) |
| 45 to 54 Years | 1,403 (50.8%) | 69 (4.9%) |
| 55 to 59 Years | 557 (44.8%) | 61 (11.0%) |
| 60 to 64 Years | 552 (51.0%) | 50 (9.1%) |
| 65 to 74 Years | 229 (15.5%) | 88 (38.4%) |
| 75 Years and over | 48 (8.1%) | 24 (50.0%) |
| Total | 9,090 (45.9%) | 1,064 (11.7%) |
Employment Status by Educational Attainment in Hamtramck
According to labor force statistics for Hamtramck, 55.9% of individuals (7,276) out of the total population between 25 and 64 years of age (13,016) are in the labor force, with 7.2% or 524 of them being unemployed. The group with the highest labor force participation rate are those with the educational attainment of bachelor's degree or higher, with 79.1% or 1,924 individuals in the labor force. Within the labor force, individuals with college / associate degree education have the highest percentage of unemployment, with 9.4% or 170 of them being unemployed.
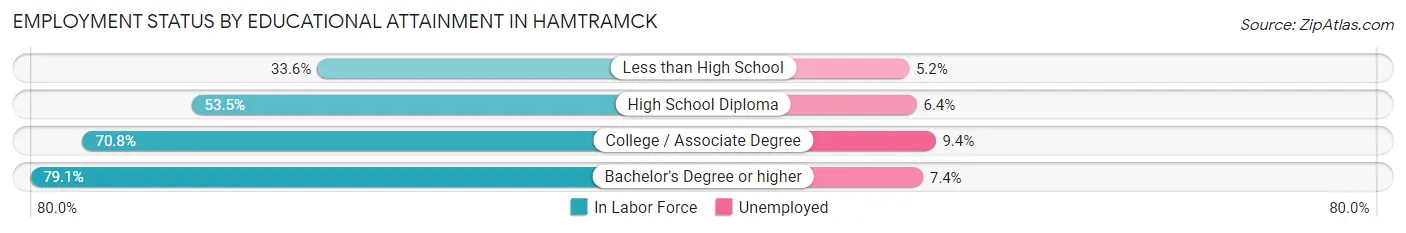
| Educational Attainment | In Labor Force | Unemployed |
| Less than High School | 1,277 (33.6%) | 198 (5.2%) |
| High School Diploma | 2,263 (53.5%) | 271 (6.4%) |
| College / Associate Degree | 1,808 (70.8%) | 240 (9.4%) |
| Bachelor's Degree or higher | 1,924 (79.1%) | 180 (7.4%) |
| Total | 7,276 (55.9%) | 937 (7.2%) |
Employment Occupations by Sex in Hamtramck
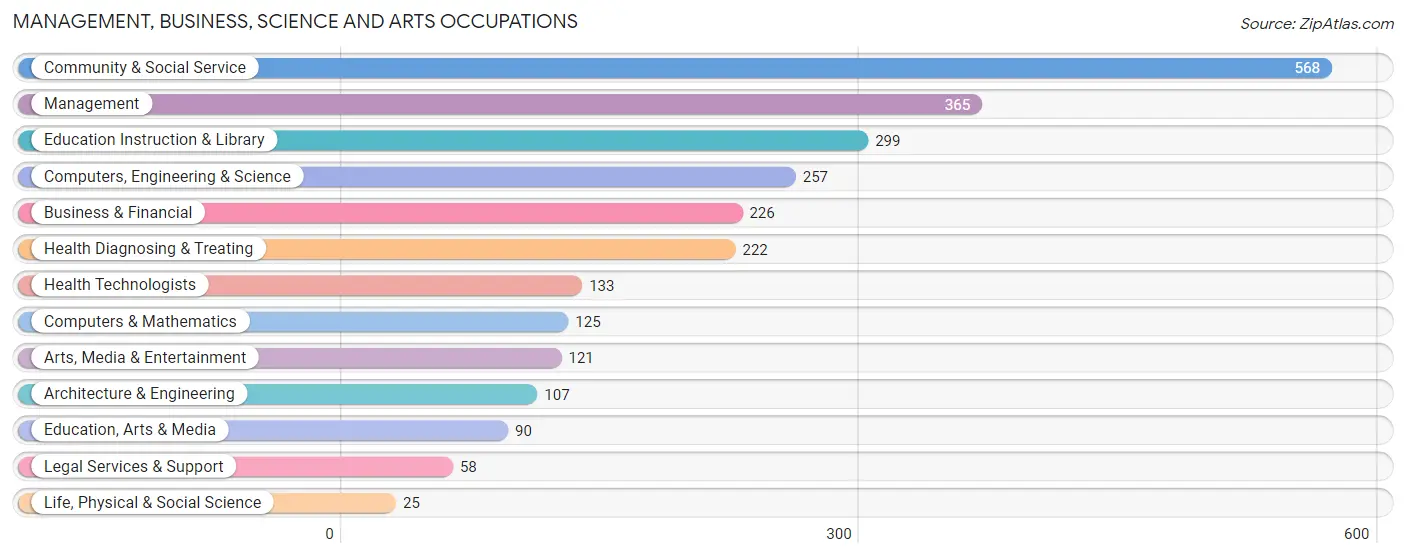
Management, Business, Science and Arts Occupations
The most common Management, Business, Science and Arts occupations in Hamtramck are Community & Social Service (568 | 7.1%), Management (365 | 4.5%), Education Instruction & Library (299 | 3.7%), Computers, Engineering & Science (257 | 3.2%), and Business & Financial (226 | 2.8%).
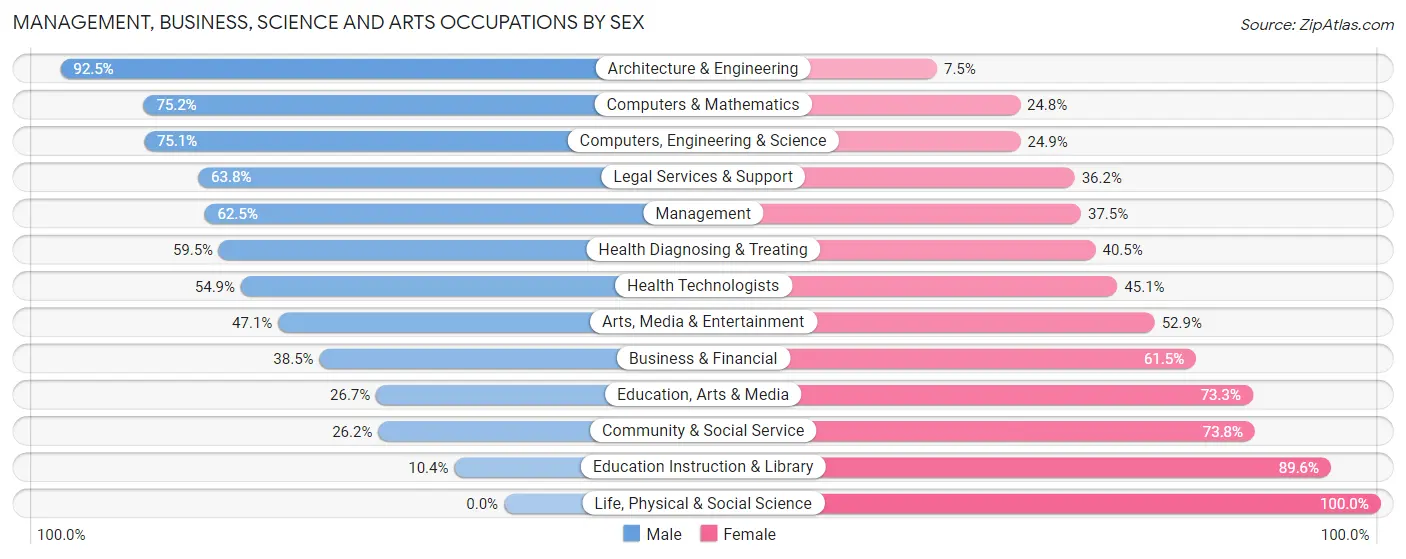
Management, Business, Science and Arts Occupations by Sex
Within the Management, Business, Science and Arts occupations in Hamtramck, the most male-oriented occupations are Architecture & Engineering (92.5%), Computers & Mathematics (75.2%), and Computers, Engineering & Science (75.1%), while the most female-oriented occupations are Life, Physical & Social Science (100.0%), Education Instruction & Library (89.6%), and Community & Social Service (73.8%).
| Occupation | Male | Female |
| Management | 228 (62.5%) | 137 (37.5%) |
| Business & Financial | 87 (38.5%) | 139 (61.5%) |
| Computers, Engineering & Science | 193 (75.1%) | 64 (24.9%) |
| Computers & Mathematics | 94 (75.2%) | 31 (24.8%) |
| Architecture & Engineering | 99 (92.5%) | 8 (7.5%) |
| Life, Physical & Social Science | 0 (0.0%) | 25 (100.0%) |
| Community & Social Service | 149 (26.2%) | 419 (73.8%) |
| Education, Arts & Media | 24 (26.7%) | 66 (73.3%) |
| Legal Services & Support | 37 (63.8%) | 21 (36.2%) |
| Education Instruction & Library | 31 (10.4%) | 268 (89.6%) |
| Arts, Media & Entertainment | 57 (47.1%) | 64 (52.9%) |
| Health Diagnosing & Treating | 132 (59.5%) | 90 (40.5%) |
| Health Technologists | 73 (54.9%) | 60 (45.1%) |
| Total (Category) | 789 (48.2%) | 849 (51.8%) |
| Total (Overall) | 5,506 (68.6%) | 2,519 (31.4%) |
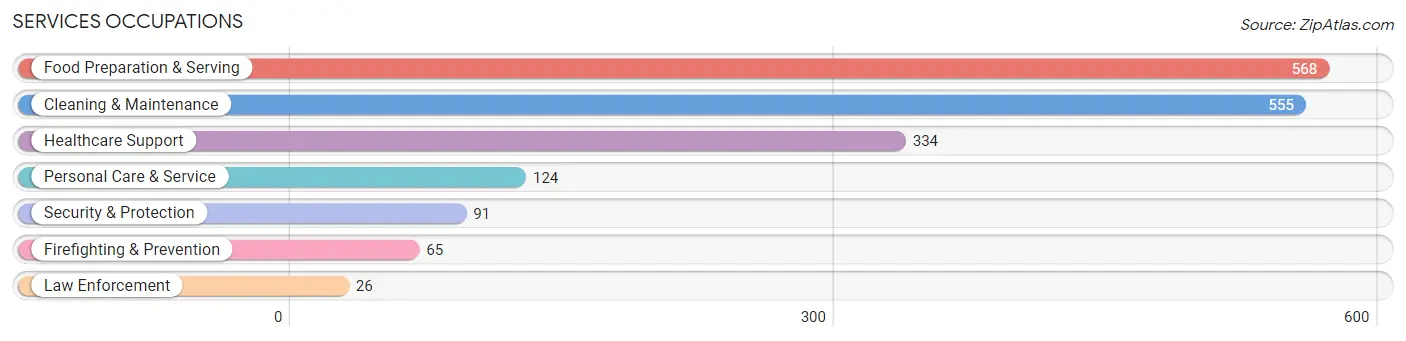
Services Occupations
The most common Services occupations in Hamtramck are Food Preparation & Serving (568 | 7.1%), Cleaning & Maintenance (555 | 6.9%), Healthcare Support (334 | 4.2%), Personal Care & Service (124 | 1.5%), and Security & Protection (91 | 1.1%).
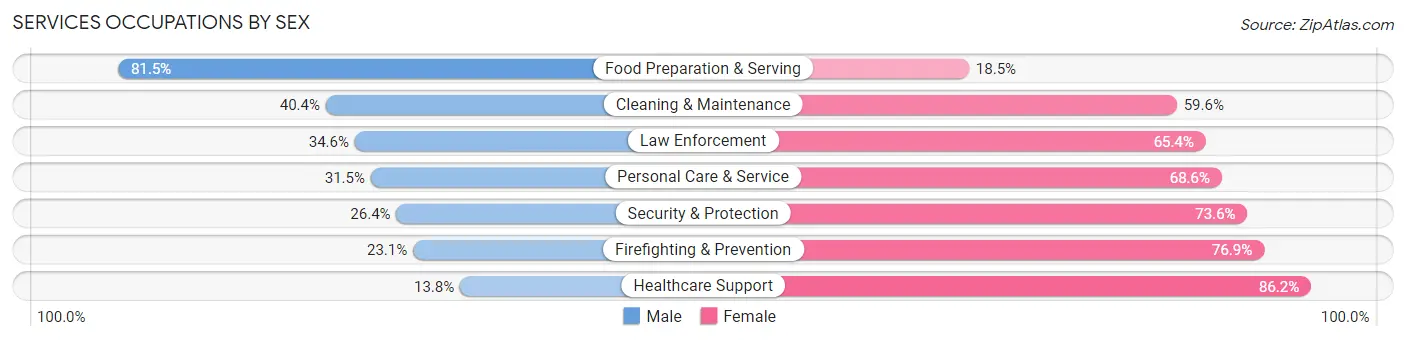
Services Occupations by Sex
Within the Services occupations in Hamtramck, the most male-oriented occupations are Food Preparation & Serving (81.5%), Cleaning & Maintenance (40.4%), and Law Enforcement (34.6%), while the most female-oriented occupations are Healthcare Support (86.2%), Firefighting & Prevention (76.9%), and Security & Protection (73.6%).
| Occupation | Male | Female |
| Healthcare Support | 46 (13.8%) | 288 (86.2%) |
| Security & Protection | 24 (26.4%) | 67 (73.6%) |
| Firefighting & Prevention | 15 (23.1%) | 50 (76.9%) |
| Law Enforcement | 9 (34.6%) | 17 (65.4%) |
| Food Preparation & Serving | 463 (81.5%) | 105 (18.5%) |
| Cleaning & Maintenance | 224 (40.4%) | 331 (59.6%) |
| Personal Care & Service | 39 (31.5%) | 85 (68.5%) |
| Total (Category) | 796 (47.6%) | 876 (52.4%) |
| Total (Overall) | 5,506 (68.6%) | 2,519 (31.4%) |
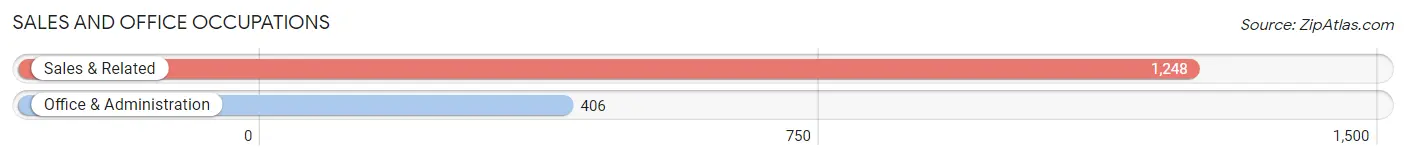
Sales and Office Occupations
The most common Sales and Office occupations in Hamtramck are Sales & Related (1,248 | 15.5%), and Office & Administration (406 | 5.1%).
Sales and Office Occupations by Sex
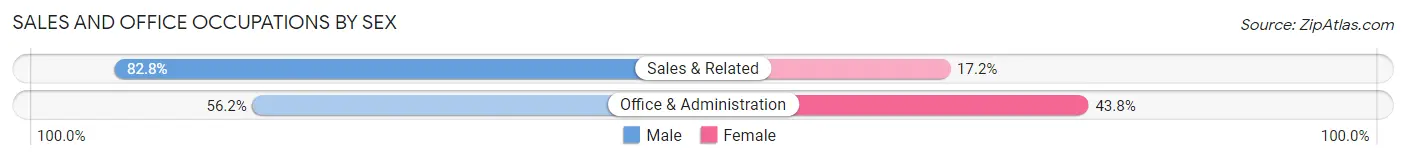
| Occupation | Male | Female |
| Sales & Related | 1,033 (82.8%) | 215 (17.2%) |
| Office & Administration | 228 (56.2%) | 178 (43.8%) |
| Total (Category) | 1,261 (76.2%) | 393 (23.8%) |
| Total (Overall) | 5,506 (68.6%) | 2,519 (31.4%) |
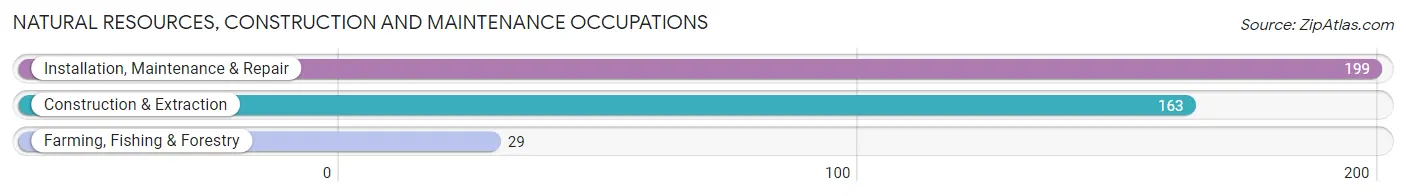
Natural Resources, Construction and Maintenance Occupations
The most common Natural Resources, Construction and Maintenance occupations in Hamtramck are Installation, Maintenance & Repair (199 | 2.5%), Construction & Extraction (163 | 2.0%), and Farming, Fishing & Forestry (29 | 0.4%).
Natural Resources, Construction and Maintenance Occupations by Sex
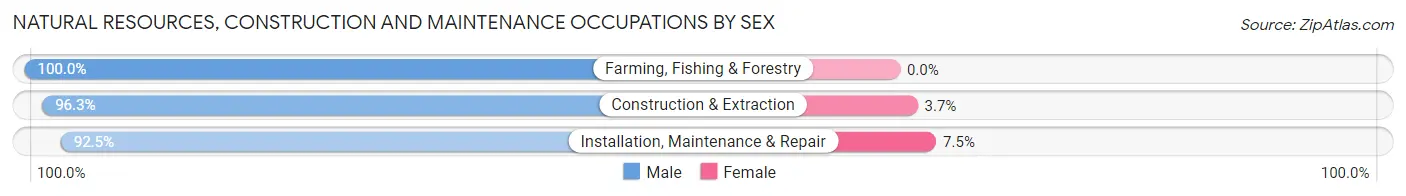
| Occupation | Male | Female |
| Farming, Fishing & Forestry | 29 (100.0%) | 0 (0.0%) |
| Construction & Extraction | 157 (96.3%) | 6 (3.7%) |
| Installation, Maintenance & Repair | 184 (92.5%) | 15 (7.5%) |
| Total (Category) | 370 (94.6%) | 21 (5.4%) |
| Total (Overall) | 5,506 (68.6%) | 2,519 (31.4%) |
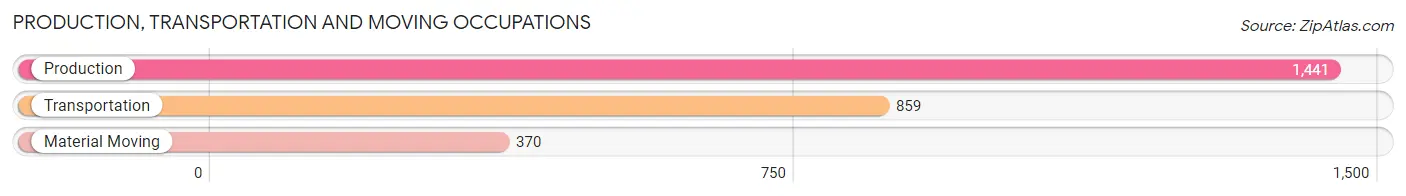
Production, Transportation and Moving Occupations
The most common Production, Transportation and Moving occupations in Hamtramck are Production (1,441 | 18.0%), Transportation (859 | 10.7%), and Material Moving (370 | 4.6%).
Production, Transportation and Moving Occupations by Sex
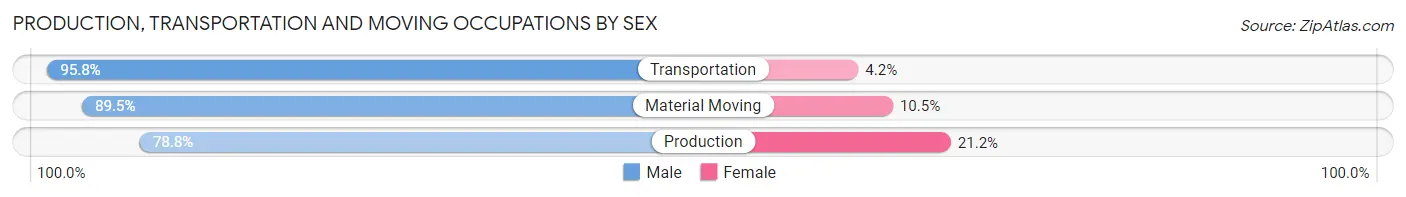
| Occupation | Male | Female |
| Production | 1,136 (78.8%) | 305 (21.2%) |
| Transportation | 823 (95.8%) | 36 (4.2%) |
| Material Moving | 331 (89.5%) | 39 (10.5%) |
| Total (Category) | 2,290 (85.8%) | 380 (14.2%) |
| Total (Overall) | 5,506 (68.6%) | 2,519 (31.4%) |
Employment Industries by Sex in Hamtramck
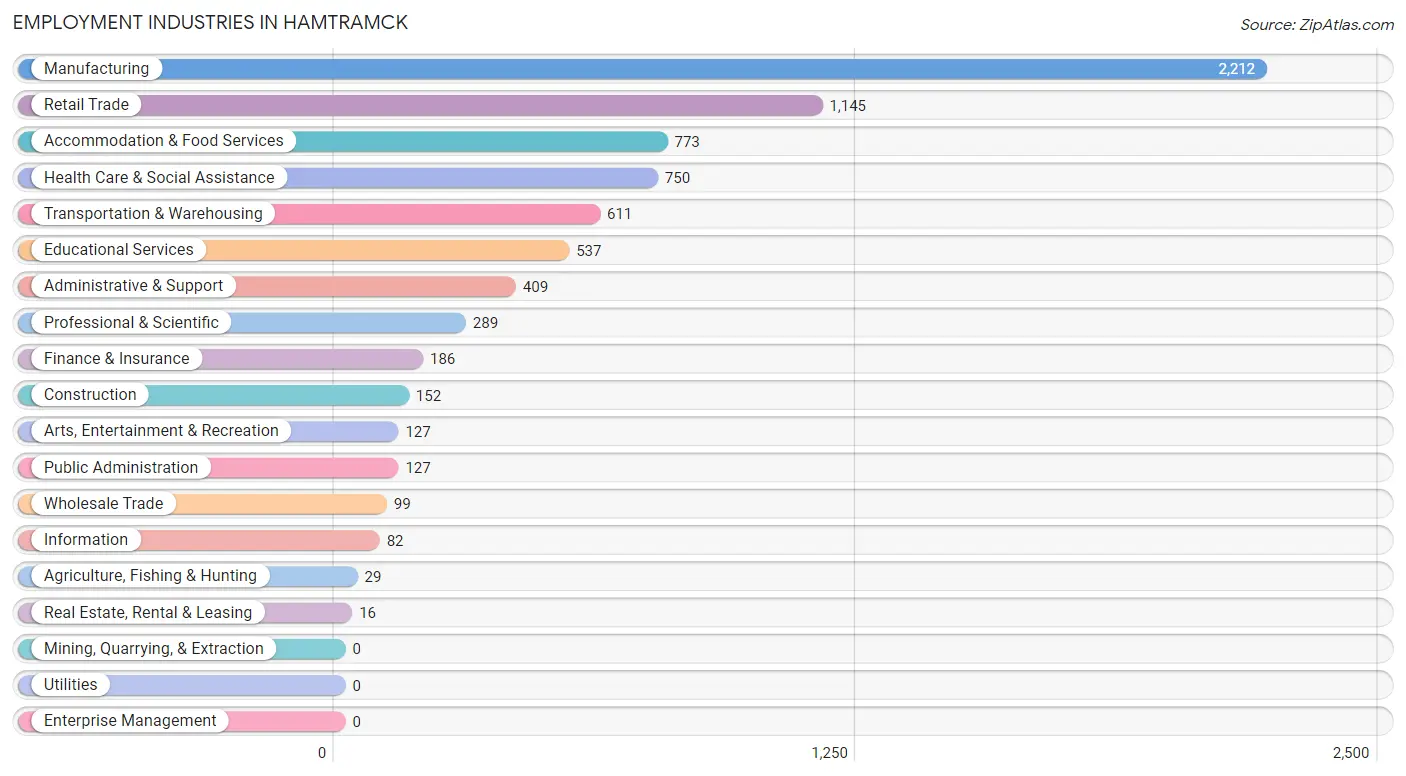
Employment Industries in Hamtramck
The major employment industries in Hamtramck include Manufacturing (2,212 | 27.6%), Retail Trade (1,145 | 14.3%), Accommodation & Food Services (773 | 9.6%), Health Care & Social Assistance (750 | 9.3%), and Transportation & Warehousing (611 | 7.6%).
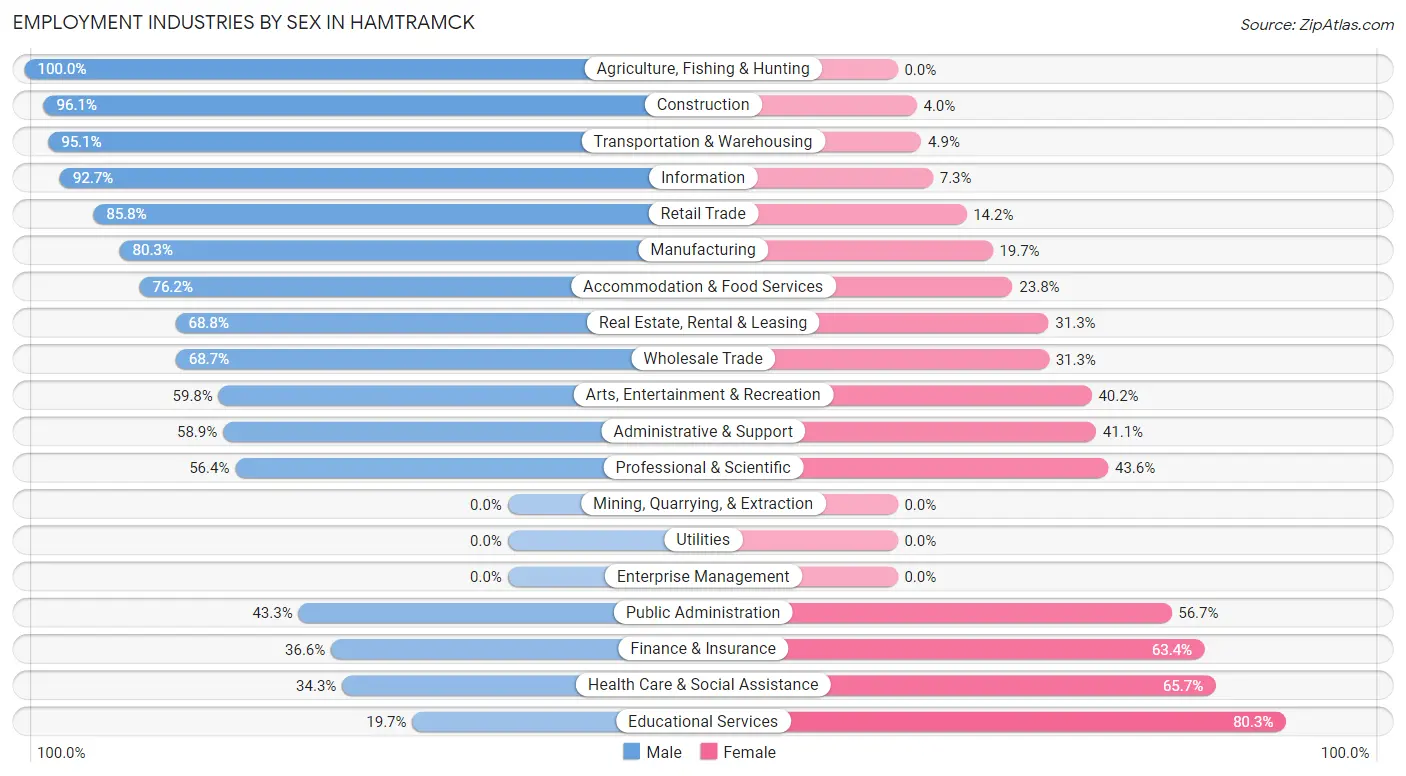
Employment Industries by Sex in Hamtramck
The Hamtramck industries that see more men than women are Agriculture, Fishing & Hunting (100.0%), Construction (96.1%), and Transportation & Warehousing (95.1%), whereas the industries that tend to have a higher number of women are Educational Services (80.3%), Health Care & Social Assistance (65.7%), and Finance & Insurance (63.4%).
| Industry | Male | Female |
| Agriculture, Fishing & Hunting | 29 (100.0%) | 0 (0.0%) |
| Mining, Quarrying, & Extraction | 0 (0.0%) | 0 (0.0%) |
| Construction | 146 (96.1%) | 6 (4.0%) |
| Manufacturing | 1,777 (80.3%) | 435 (19.7%) |
| Wholesale Trade | 68 (68.7%) | 31 (31.3%) |
| Retail Trade | 982 (85.8%) | 163 (14.2%) |
| Transportation & Warehousing | 581 (95.1%) | 30 (4.9%) |
| Utilities | 0 (0.0%) | 0 (0.0%) |
| Information | 76 (92.7%) | 6 (7.3%) |
| Finance & Insurance | 68 (36.6%) | 118 (63.4%) |
| Real Estate, Rental & Leasing | 11 (68.8%) | 5 (31.2%) |
| Professional & Scientific | 163 (56.4%) | 126 (43.6%) |
| Enterprise Management | 0 (0.0%) | 0 (0.0%) |
| Administrative & Support | 241 (58.9%) | 168 (41.1%) |
| Educational Services | 106 (19.7%) | 431 (80.3%) |
| Health Care & Social Assistance | 257 (34.3%) | 493 (65.7%) |
| Arts, Entertainment & Recreation | 76 (59.8%) | 51 (40.2%) |
| Accommodation & Food Services | 589 (76.2%) | 184 (23.8%) |
| Public Administration | 55 (43.3%) | 72 (56.7%) |
| Total | 5,506 (68.6%) | 2,519 (31.4%) |
Education in Hamtramck
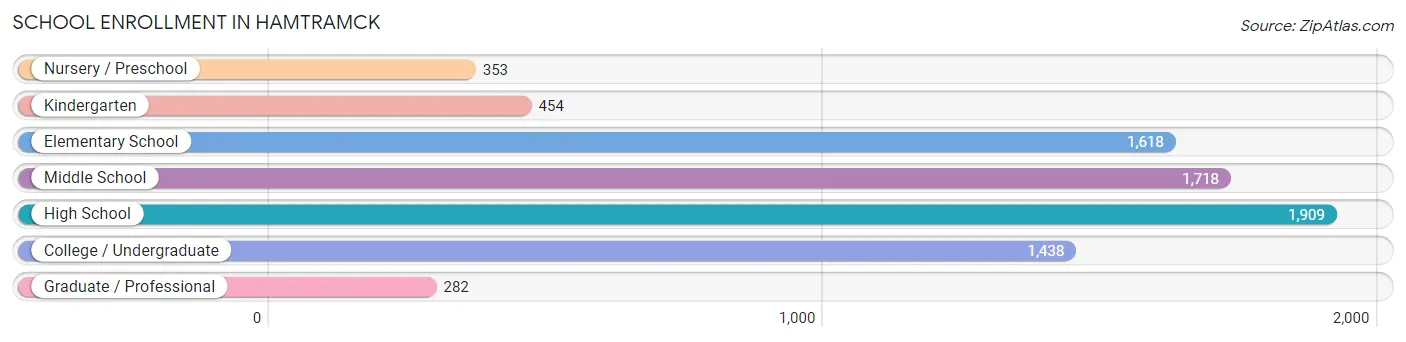
School Enrollment in Hamtramck
The most common levels of schooling among the 7,772 students in Hamtramck are high school (1,909 | 24.6%), middle school (1,718 | 22.1%), and elementary school (1,618 | 20.8%).
| School Level | # Students | % Students |
| Nursery / Preschool | 353 | 4.5% |
| Kindergarten | 454 | 5.8% |
| Elementary School | 1,618 | 20.8% |
| Middle School | 1,718 | 22.1% |
| High School | 1,909 | 24.6% |
| College / Undergraduate | 1,438 | 18.5% |
| Graduate / Professional | 282 | 3.6% |
| Total | 7,772 | 100.0% |
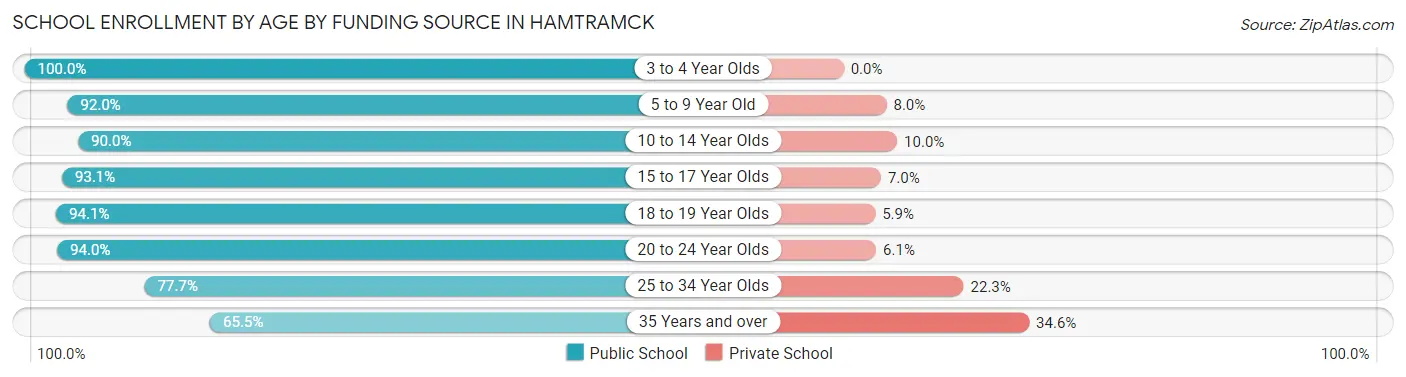
School Enrollment by Age by Funding Source in Hamtramck
Out of a total of 7,772 students who are enrolled in schools in Hamtramck, 684 (8.8%) attend a private institution, while the remaining 7,088 (91.2%) are enrolled in public schools. The age group of 35 years and over has the highest likelihood of being enrolled in private schools, with 38 (34.5% in the age bracket) enrolled. Conversely, the age group of 3 to 4 year olds has the lowest likelihood of being enrolled in a private school, with 325 (100.0% in the age bracket) attending a public institution.
| Age Bracket | Public School | Private School |
| 3 to 4 Year Olds | 325 (100.0%) | 0 (0.0%) |
| 5 to 9 Year Old | 1,856 (92.0%) | 161 (8.0%) |
| 10 to 14 Year Olds | 1,790 (90.0%) | 198 (10.0%) |
| 15 to 17 Year Olds | 1,084 (93.0%) | 81 (7.0%) |
| 18 to 19 Year Olds | 704 (94.1%) | 44 (5.9%) |
| 20 to 24 Year Olds | 900 (94.0%) | 58 (6.0%) |
| 25 to 34 Year Olds | 358 (77.7%) | 103 (22.3%) |
| 35 Years and over | 72 (65.4%) | 38 (34.5%) |
| Total | 7,088 (91.2%) | 684 (8.8%) |
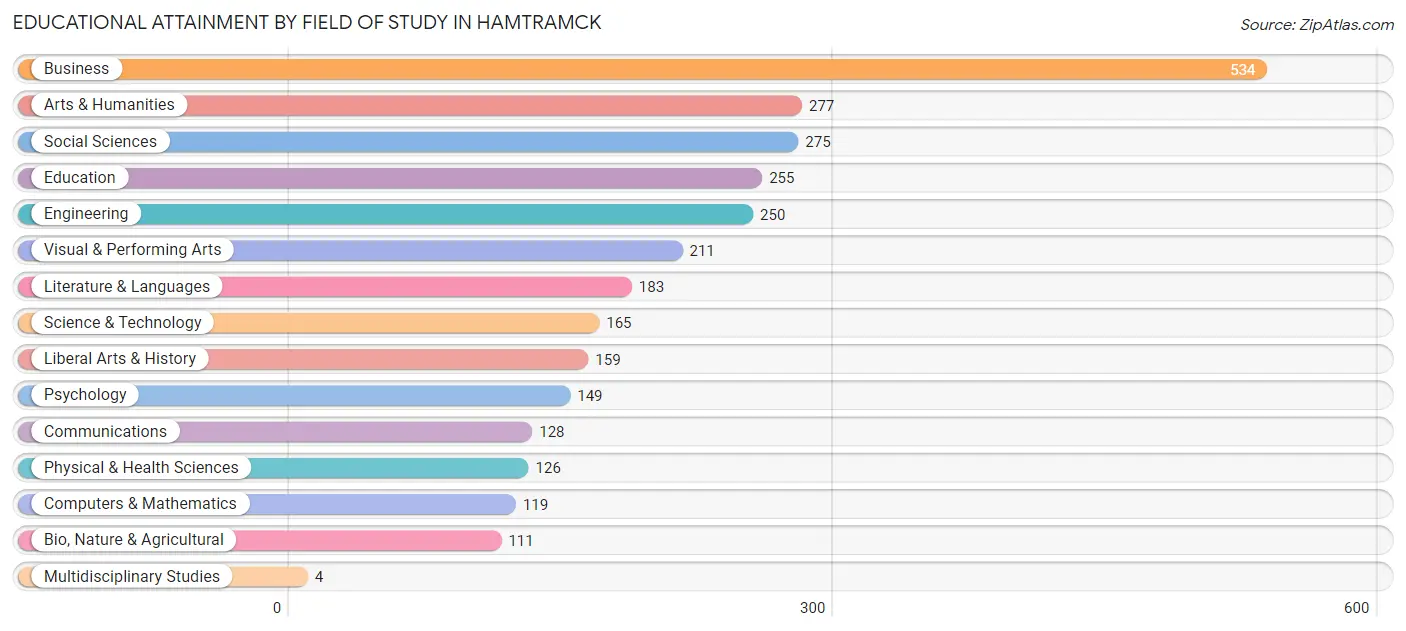
Educational Attainment by Field of Study in Hamtramck
Business (534 | 18.1%), arts & humanities (277 | 9.4%), social sciences (275 | 9.3%), education (255 | 8.7%), and engineering (250 | 8.5%) are the most common fields of study among 2,946 individuals in Hamtramck who have obtained a bachelor's degree or higher.
| Field of Study | # Graduates | % Graduates |
| Computers & Mathematics | 119 | 4.0% |
| Bio, Nature & Agricultural | 111 | 3.8% |
| Physical & Health Sciences | 126 | 4.3% |
| Psychology | 149 | 5.1% |
| Social Sciences | 275 | 9.3% |
| Engineering | 250 | 8.5% |
| Multidisciplinary Studies | 4 | 0.1% |
| Science & Technology | 165 | 5.6% |
| Business | 534 | 18.1% |
| Education | 255 | 8.7% |
| Literature & Languages | 183 | 6.2% |
| Liberal Arts & History | 159 | 5.4% |
| Visual & Performing Arts | 211 | 7.2% |
| Communications | 128 | 4.3% |
| Arts & Humanities | 277 | 9.4% |
| Total | 2,946 | 100.0% |
Transportation & Commute in Hamtramck
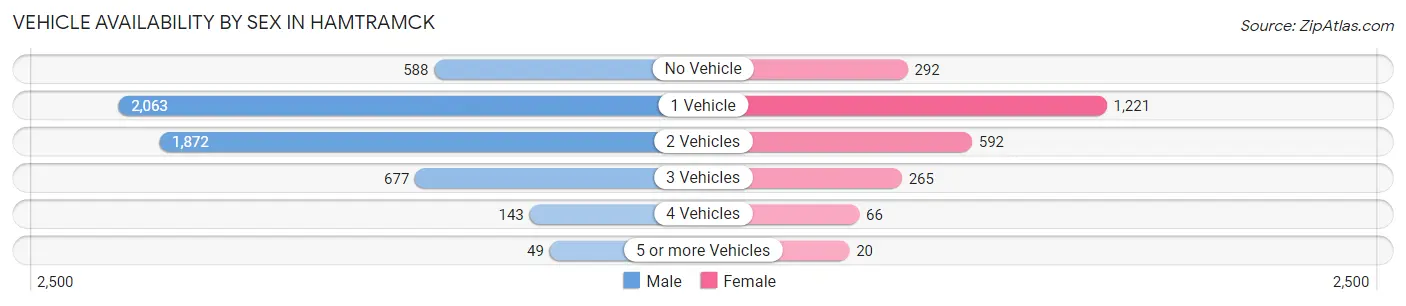
Vehicle Availability by Sex in Hamtramck
The most prevalent vehicle ownership categories in Hamtramck are males with 1 vehicle (2,063, accounting for 38.3%) and females with 1 vehicle (1,221, making up 84.0%).
| Vehicles Available | Male | Female |
| No Vehicle | 588 (10.9%) | 292 (11.9%) |
| 1 Vehicle | 2,063 (38.3%) | 1,221 (49.7%) |
| 2 Vehicles | 1,872 (34.7%) | 592 (24.1%) |
| 3 Vehicles | 677 (12.6%) | 265 (10.8%) |
| 4 Vehicles | 143 (2.6%) | 66 (2.7%) |
| 5 or more Vehicles | 49 (0.9%) | 20 (0.8%) |
| Total | 5,392 (100.0%) | 2,456 (100.0%) |
Commute Time in Hamtramck
The most frequently occuring commute durations in Hamtramck are 30 to 34 minutes (1,316 commuters, 17.7%), 20 to 24 minutes (1,306 commuters, 17.6%), and 15 to 19 minutes (1,144 commuters, 15.4%).
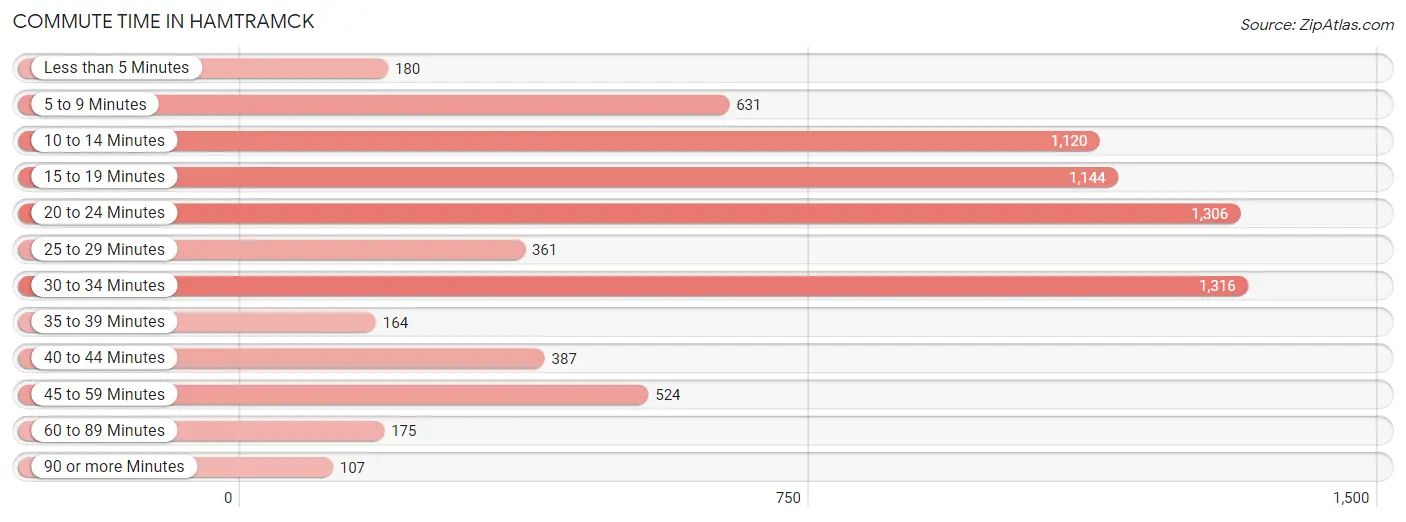
| Commute Time | # Commuters | % Commuters |
| Less than 5 Minutes | 180 | 2.4% |
| 5 to 9 Minutes | 631 | 8.5% |
| 10 to 14 Minutes | 1,120 | 15.1% |
| 15 to 19 Minutes | 1,144 | 15.4% |
| 20 to 24 Minutes | 1,306 | 17.6% |
| 25 to 29 Minutes | 361 | 4.9% |
| 30 to 34 Minutes | 1,316 | 17.7% |
| 35 to 39 Minutes | 164 | 2.2% |
| 40 to 44 Minutes | 387 | 5.2% |
| 45 to 59 Minutes | 524 | 7.1% |
| 60 to 89 Minutes | 175 | 2.4% |
| 90 or more Minutes | 107 | 1.4% |
Commute Time by Sex in Hamtramck
The most common commute times in Hamtramck are 30 to 34 minutes (1,152 commuters, 22.5%) for males and 20 to 24 minutes (552 commuters, 24.0%) for females.
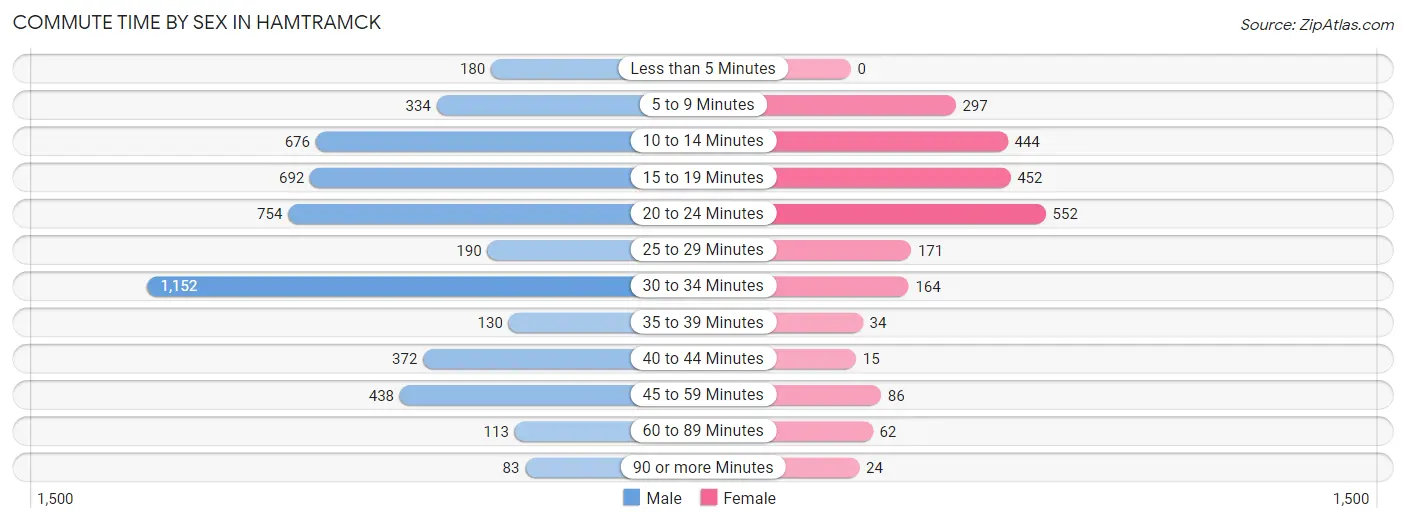
| Commute Time | Male | Female |
| Less than 5 Minutes | 180 (3.5%) | 0 (0.0%) |
| 5 to 9 Minutes | 334 (6.5%) | 297 (12.9%) |
| 10 to 14 Minutes | 676 (13.2%) | 444 (19.3%) |
| 15 to 19 Minutes | 692 (13.5%) | 452 (19.6%) |
| 20 to 24 Minutes | 754 (14.7%) | 552 (24.0%) |
| 25 to 29 Minutes | 190 (3.7%) | 171 (7.4%) |
| 30 to 34 Minutes | 1,152 (22.5%) | 164 (7.1%) |
| 35 to 39 Minutes | 130 (2.5%) | 34 (1.5%) |
| 40 to 44 Minutes | 372 (7.3%) | 15 (0.6%) |
| 45 to 59 Minutes | 438 (8.6%) | 86 (3.7%) |
| 60 to 89 Minutes | 113 (2.2%) | 62 (2.7%) |
| 90 or more Minutes | 83 (1.6%) | 24 (1.0%) |
Time of Departure to Work by Sex in Hamtramck
The most frequent times of departure to work in Hamtramck are 12:00 PM to 3:59 PM (1,445, 28.3%) for males and 9:00 AM to 9:59 AM (456, 19.8%) for females.
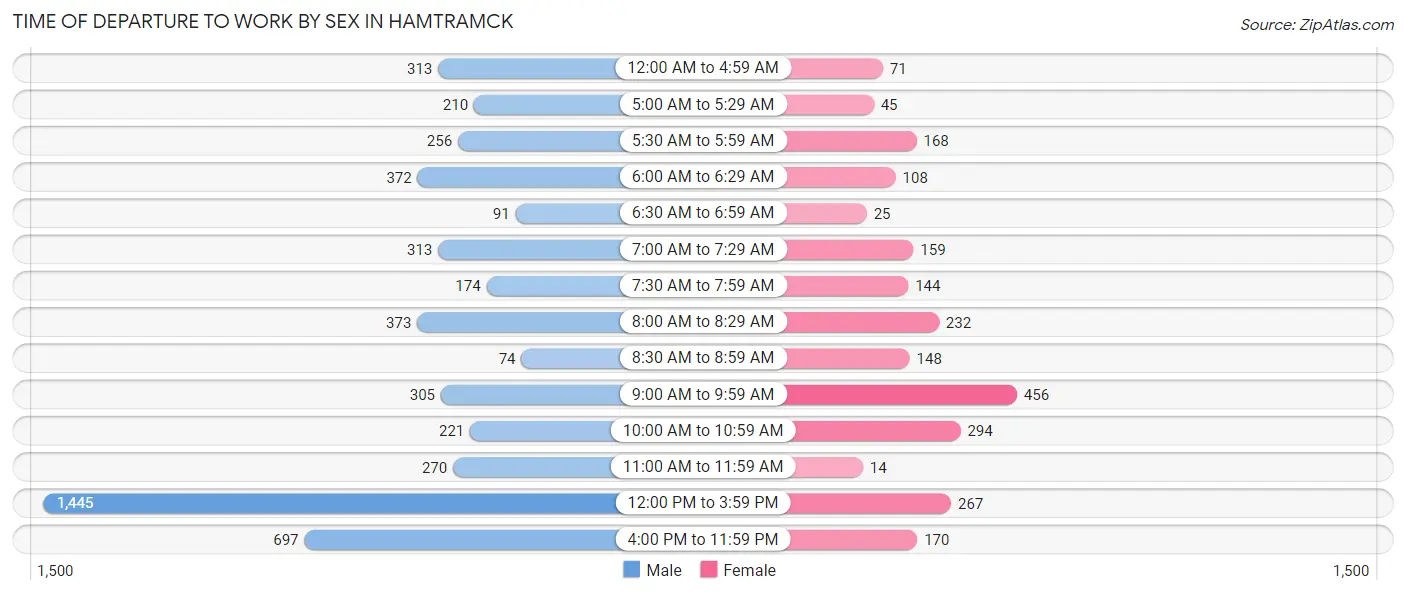
| Time of Departure | Male | Female |
| 12:00 AM to 4:59 AM | 313 (6.1%) | 71 (3.1%) |
| 5:00 AM to 5:29 AM | 210 (4.1%) | 45 (2.0%) |
| 5:30 AM to 5:59 AM | 256 (5.0%) | 168 (7.3%) |
| 6:00 AM to 6:29 AM | 372 (7.3%) | 108 (4.7%) |
| 6:30 AM to 6:59 AM | 91 (1.8%) | 25 (1.1%) |
| 7:00 AM to 7:29 AM | 313 (6.1%) | 159 (6.9%) |
| 7:30 AM to 7:59 AM | 174 (3.4%) | 144 (6.3%) |
| 8:00 AM to 8:29 AM | 373 (7.3%) | 232 (10.1%) |
| 8:30 AM to 8:59 AM | 74 (1.5%) | 148 (6.4%) |
| 9:00 AM to 9:59 AM | 305 (6.0%) | 456 (19.8%) |
| 10:00 AM to 10:59 AM | 221 (4.3%) | 294 (12.8%) |
| 11:00 AM to 11:59 AM | 270 (5.3%) | 14 (0.6%) |
| 12:00 PM to 3:59 PM | 1,445 (28.3%) | 267 (11.6%) |
| 4:00 PM to 11:59 PM | 697 (13.6%) | 170 (7.4%) |
| Total | 5,114 (100.0%) | 2,301 (100.0%) |
Housing Occupancy in Hamtramck
Occupancy by Ownership in Hamtramck
Of the total 7,342 dwellings in Hamtramck, owner-occupied units account for 4,180 (56.9%), while renter-occupied units make up 3,162 (43.1%).
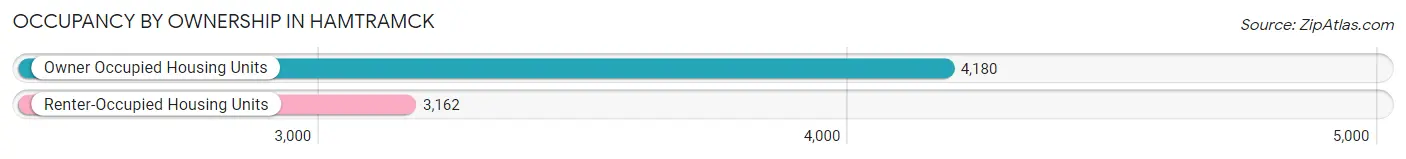
| Occupancy | # Housing Units | % Housing Units |
| Owner Occupied Housing Units | 4,180 | 56.9% |
| Renter-Occupied Housing Units | 3,162 | 43.1% |
| Total Occupied Housing Units | 7,342 | 100.0% |
Occupancy by Household Size in Hamtramck
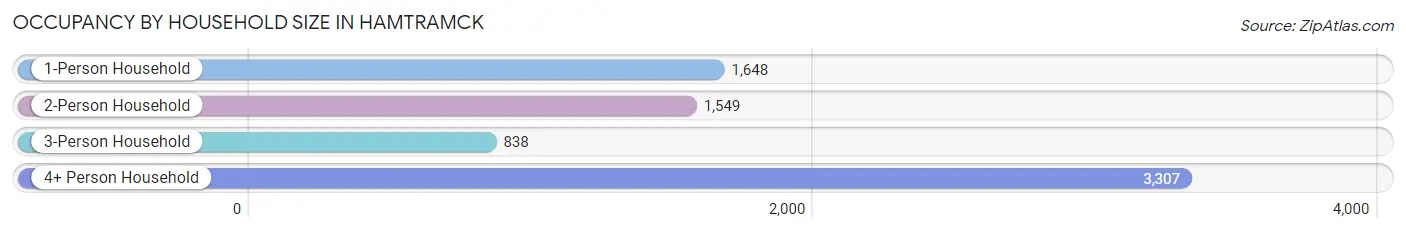
| Household Size | # Housing Units | % Housing Units |
| 1-Person Household | 1,648 | 22.5% |
| 2-Person Household | 1,549 | 21.1% |
| 3-Person Household | 838 | 11.4% |
| 4+ Person Household | 3,307 | 45.0% |
| Total Housing Units | 7,342 | 100.0% |
Occupancy by Ownership by Household Size in Hamtramck
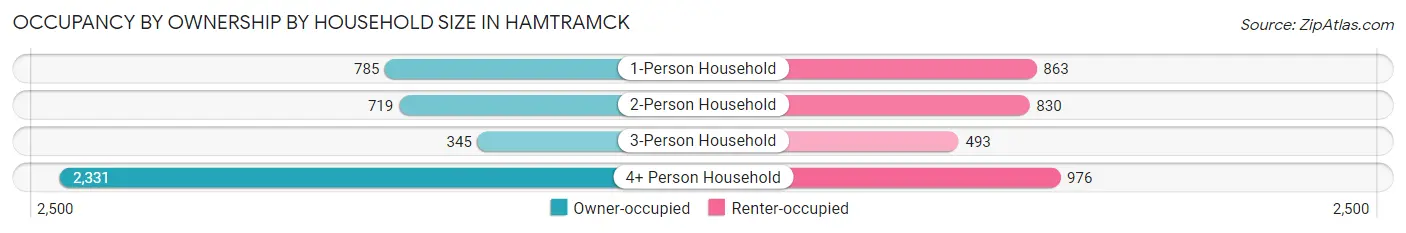
| Household Size | Owner-occupied | Renter-occupied |
| 1-Person Household | 785 (47.6%) | 863 (52.4%) |
| 2-Person Household | 719 (46.4%) | 830 (53.6%) |
| 3-Person Household | 345 (41.2%) | 493 (58.8%) |
| 4+ Person Household | 2,331 (70.5%) | 976 (29.5%) |
| Total Housing Units | 4,180 (56.9%) | 3,162 (43.1%) |
Occupancy by Educational Attainment in Hamtramck
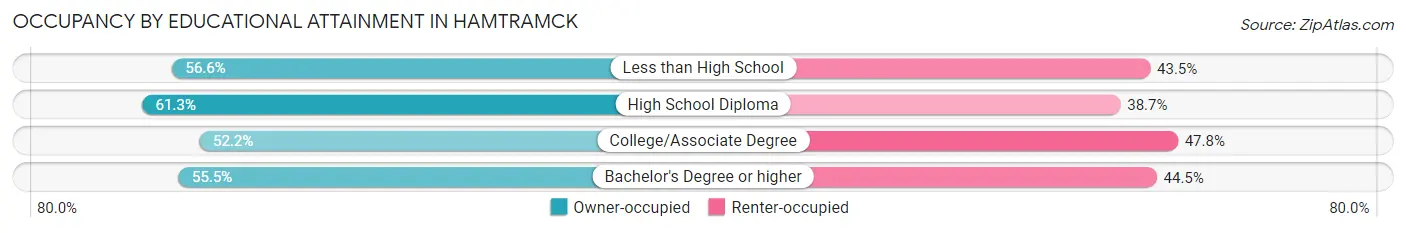
| Household Size | Owner-occupied | Renter-occupied |
| Less than High School | 764 (56.6%) | 587 (43.4%) |
| High School Diploma | 1,573 (61.3%) | 994 (38.7%) |
| College/Associate Degree | 903 (52.2%) | 828 (47.8%) |
| Bachelor's Degree or higher | 940 (55.5%) | 753 (44.5%) |
Occupancy by Age of Householder in Hamtramck
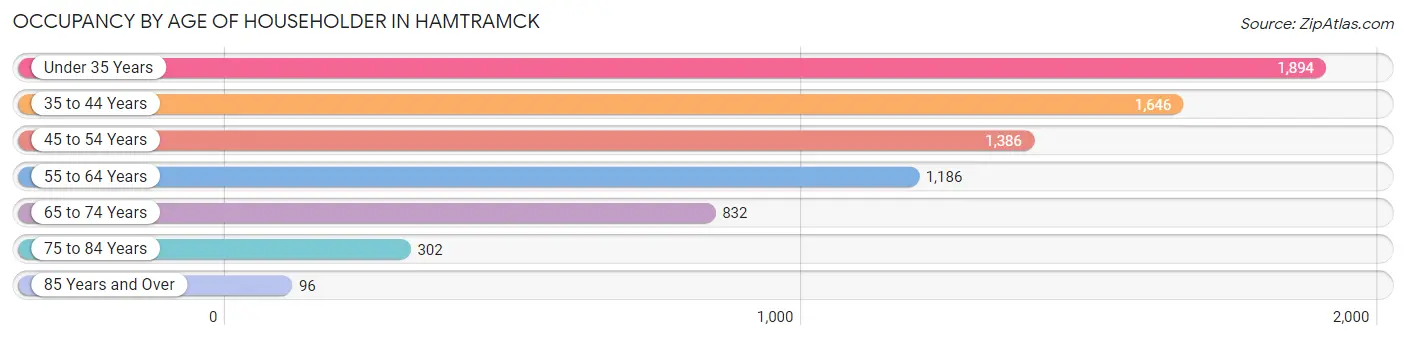
| Age Bracket | # Households | % Households |
| Under 35 Years | 1,894 | 25.8% |
| 35 to 44 Years | 1,646 | 22.4% |
| 45 to 54 Years | 1,386 | 18.9% |
| 55 to 64 Years | 1,186 | 16.2% |
| 65 to 74 Years | 832 | 11.3% |
| 75 to 84 Years | 302 | 4.1% |
| 85 Years and Over | 96 | 1.3% |
| Total | 7,342 | 100.0% |
Housing Finances in Hamtramck
Median Income by Occupancy in Hamtramck
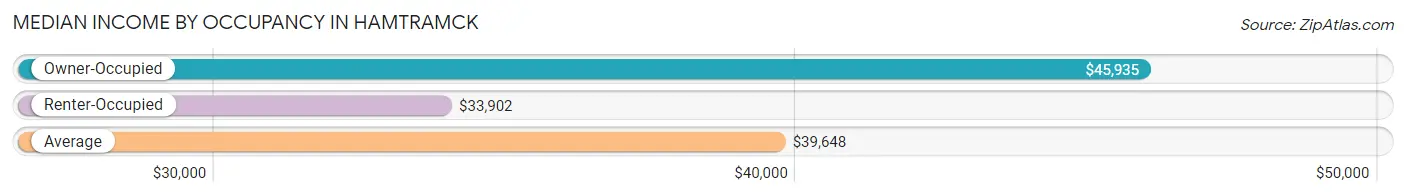
| Occupancy Type | # Households | Median Income |
| Owner-Occupied | 4,180 (56.9%) | $45,935 |
| Renter-Occupied | 3,162 (43.1%) | $33,902 |
| Average | 7,342 (100.0%) | $39,648 |
Occupancy by Householder Income Bracket in Hamtramck
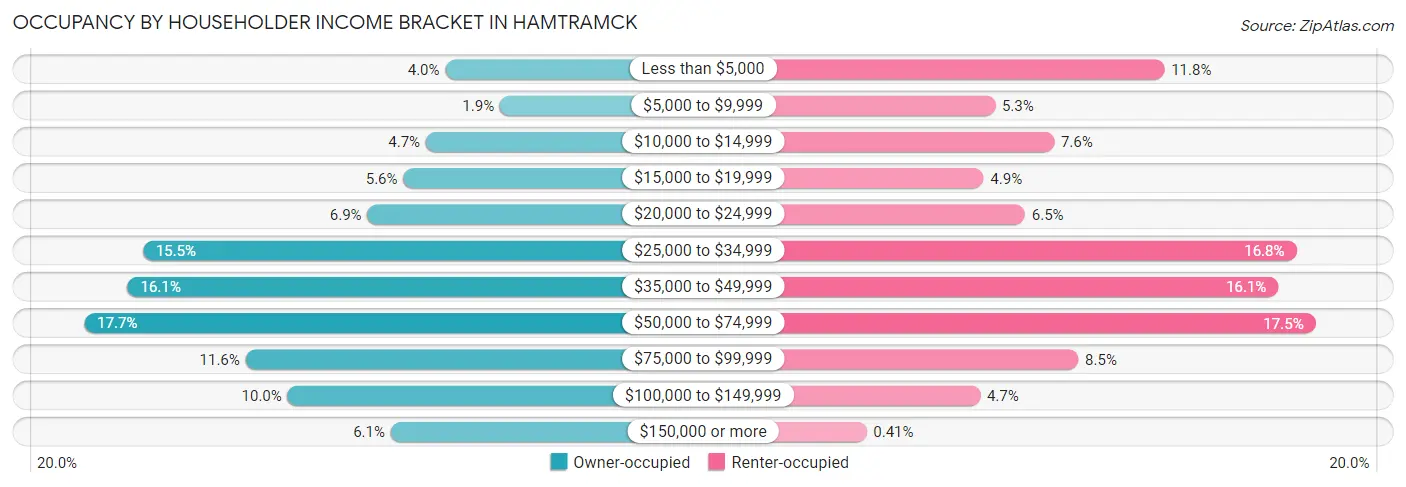
| Income Bracket | Owner-occupied | Renter-occupied |
| Less than $5,000 | 166 (4.0%) | 372 (11.8%) |
| $5,000 to $9,999 | 79 (1.9%) | 168 (5.3%) |
| $10,000 to $14,999 | 197 (4.7%) | 239 (7.6%) |
| $15,000 to $19,999 | 233 (5.6%) | 154 (4.9%) |
| $20,000 to $24,999 | 290 (6.9%) | 204 (6.5%) |
| $25,000 to $34,999 | 648 (15.5%) | 531 (16.8%) |
| $35,000 to $49,999 | 672 (16.1%) | 509 (16.1%) |
| $50,000 to $74,999 | 741 (17.7%) | 554 (17.5%) |
| $75,000 to $99,999 | 484 (11.6%) | 268 (8.5%) |
| $100,000 to $149,999 | 417 (10.0%) | 150 (4.7%) |
| $150,000 or more | 253 (6.0%) | 13 (0.4%) |
| Total | 4,180 (100.0%) | 3,162 (100.0%) |
Monthly Housing Cost Tiers in Hamtramck
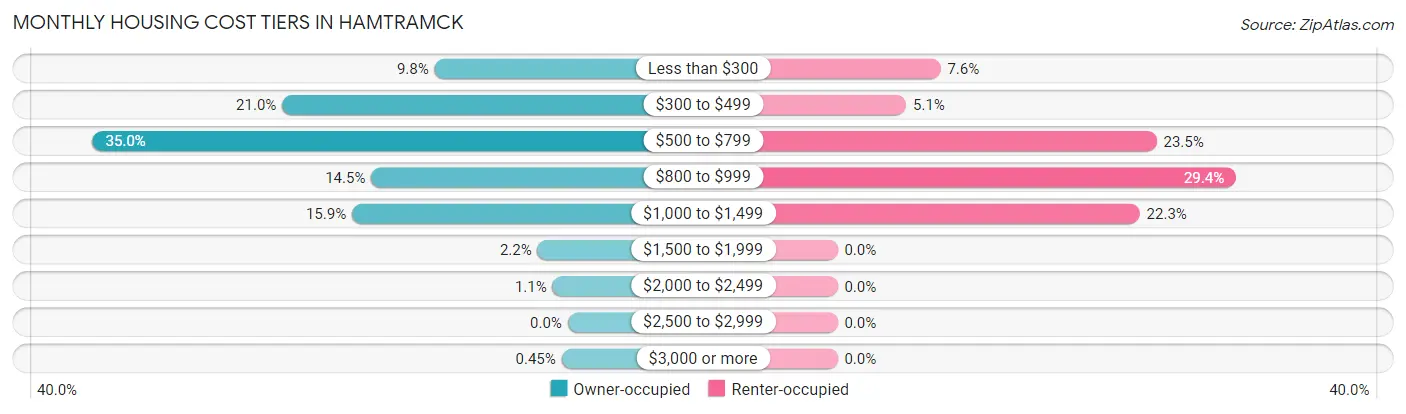
| Monthly Cost | Owner-occupied | Renter-occupied |
| Less than $300 | 410 (9.8%) | 240 (7.6%) |
| $300 to $499 | 879 (21.0%) | 160 (5.1%) |
| $500 to $799 | 1,463 (35.0%) | 743 (23.5%) |
| $800 to $999 | 605 (14.5%) | 928 (29.3%) |
| $1,000 to $1,499 | 664 (15.9%) | 704 (22.3%) |
| $1,500 to $1,999 | 93 (2.2%) | 0 (0.0%) |
| $2,000 to $2,499 | 47 (1.1%) | 0 (0.0%) |
| $2,500 to $2,999 | 0 (0.0%) | 0 (0.0%) |
| $3,000 or more | 19 (0.4%) | 0 (0.0%) |
| Total | 4,180 (100.0%) | 3,162 (100.0%) |
Physical Housing Characteristics in Hamtramck
Housing Structures in Hamtramck
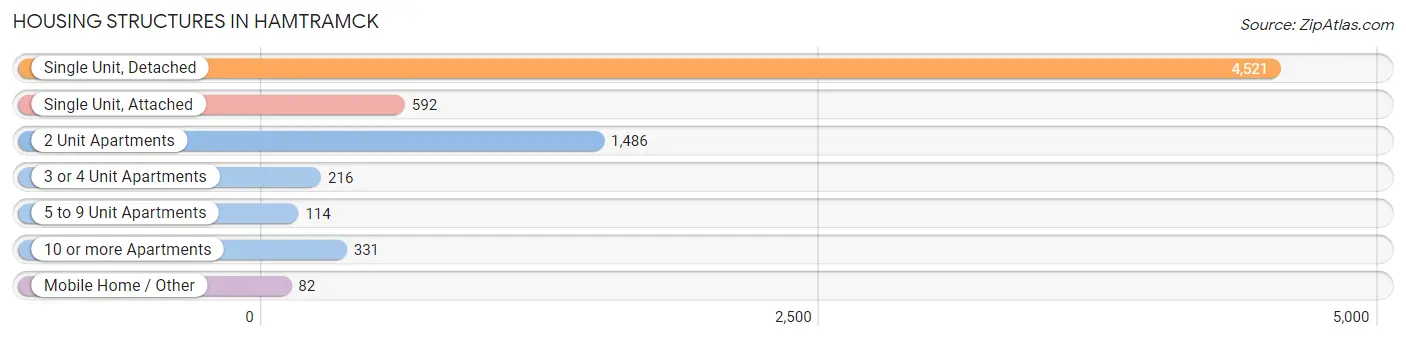
| Structure Type | # Housing Units | % Housing Units |
| Single Unit, Detached | 4,521 | 61.6% |
| Single Unit, Attached | 592 | 8.1% |
| 2 Unit Apartments | 1,486 | 20.2% |
| 3 or 4 Unit Apartments | 216 | 2.9% |
| 5 to 9 Unit Apartments | 114 | 1.5% |
| 10 or more Apartments | 331 | 4.5% |
| Mobile Home / Other | 82 | 1.1% |
| Total | 7,342 | 100.0% |
Housing Structures by Occupancy in Hamtramck
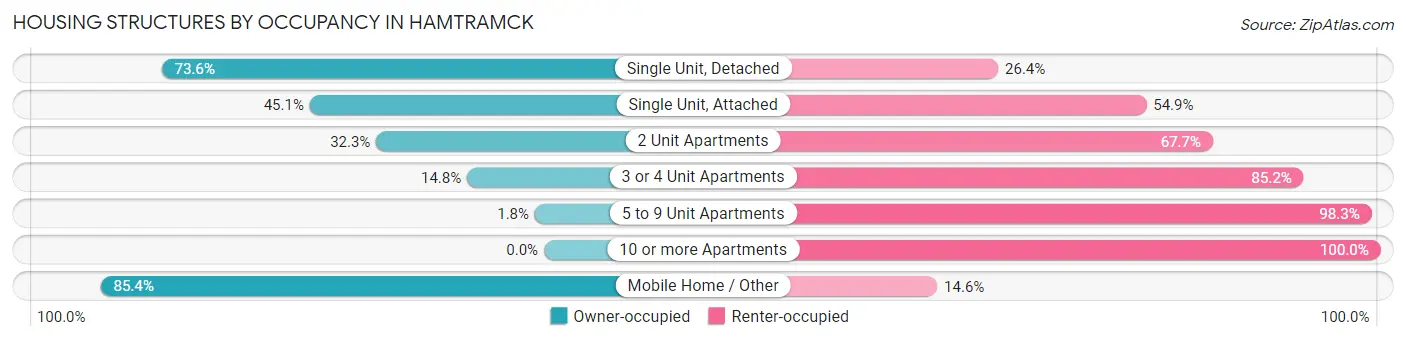
| Structure Type | Owner-occupied | Renter-occupied |
| Single Unit, Detached | 3,329 (73.6%) | 1,192 (26.4%) |
| Single Unit, Attached | 267 (45.1%) | 325 (54.9%) |
| 2 Unit Apartments | 480 (32.3%) | 1,006 (67.7%) |
| 3 or 4 Unit Apartments | 32 (14.8%) | 184 (85.2%) |
| 5 to 9 Unit Apartments | 2 (1.8%) | 112 (98.3%) |
| 10 or more Apartments | 0 (0.0%) | 331 (100.0%) |
| Mobile Home / Other | 70 (85.4%) | 12 (14.6%) |
| Total | 4,180 (56.9%) | 3,162 (43.1%) |
Housing Structures by Number of Rooms in Hamtramck
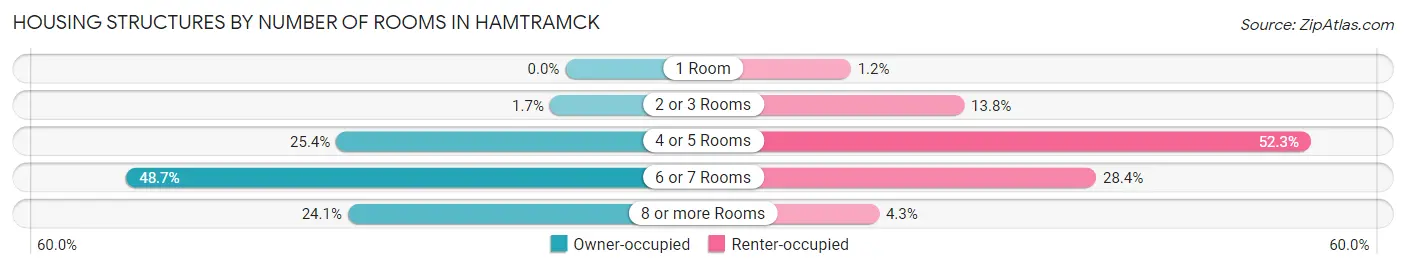
| Number of Rooms | Owner-occupied | Renter-occupied |
| 1 Room | 0 (0.0%) | 38 (1.2%) |
| 2 or 3 Rooms | 72 (1.7%) | 436 (13.8%) |
| 4 or 5 Rooms | 1,063 (25.4%) | 1,652 (52.2%) |
| 6 or 7 Rooms | 2,036 (48.7%) | 899 (28.4%) |
| 8 or more Rooms | 1,009 (24.1%) | 137 (4.3%) |
| Total | 4,180 (100.0%) | 3,162 (100.0%) |
Housing Structure by Heating Type in Hamtramck
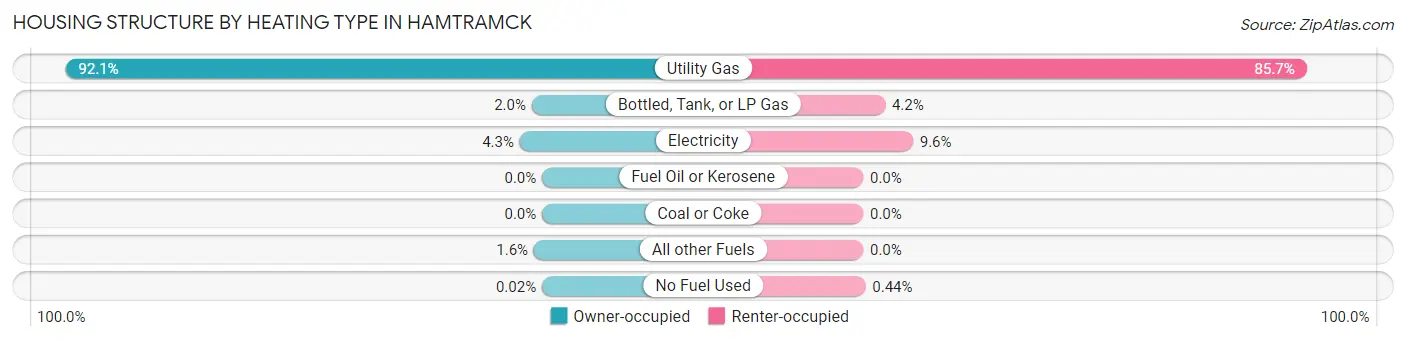
| Heating Type | Owner-occupied | Renter-occupied |
| Utility Gas | 3,850 (92.1%) | 2,710 (85.7%) |
| Bottled, Tank, or LP Gas | 83 (2.0%) | 134 (4.2%) |
| Electricity | 180 (4.3%) | 304 (9.6%) |
| Fuel Oil or Kerosene | 0 (0.0%) | 0 (0.0%) |
| Coal or Coke | 0 (0.0%) | 0 (0.0%) |
| All other Fuels | 66 (1.6%) | 0 (0.0%) |
| No Fuel Used | 1 (0.0%) | 14 (0.4%) |
| Total | 4,180 (100.0%) | 3,162 (100.0%) |
Household Vehicle Usage in Hamtramck
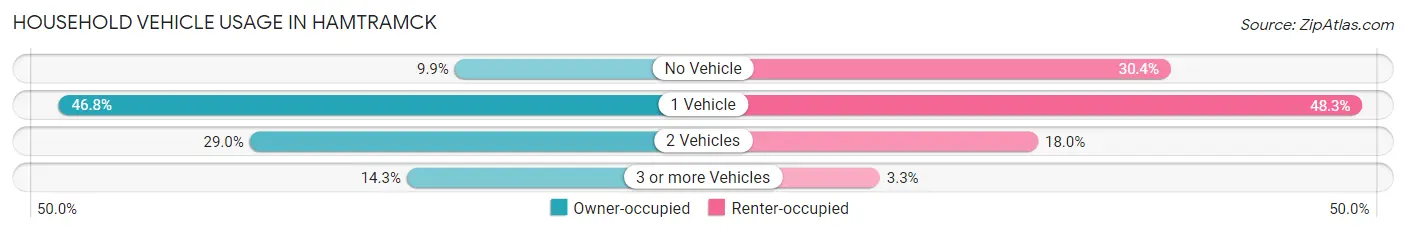
| Vehicles per Household | Owner-occupied | Renter-occupied |
| No Vehicle | 412 (9.9%) | 962 (30.4%) |
| 1 Vehicle | 1,957 (46.8%) | 1,527 (48.3%) |
| 2 Vehicles | 1,212 (29.0%) | 570 (18.0%) |
| 3 or more Vehicles | 599 (14.3%) | 103 (3.3%) |
| Total | 4,180 (100.0%) | 3,162 (100.0%) |
Real Estate & Mortgages in Hamtramck
Real Estate and Mortgage Overview in Hamtramck
| Characteristic | Without Mortgage | With Mortgage |
| Housing Units | 3,022 | 1,158 |
| Median Property Value | $98,100 | $122,100 |
| Median Household Income | $44,975 | $80 |
| Monthly Housing Costs | $545 | $10 |
| Real Estate Taxes | $1,667 | $74 |
Property Value by Mortgage Status in Hamtramck
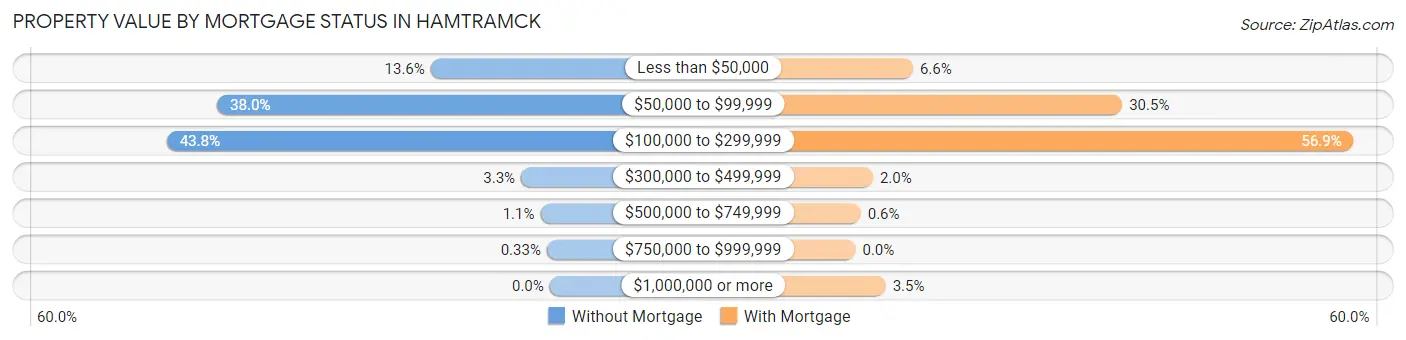
| Property Value | Without Mortgage | With Mortgage |
| Less than $50,000 | 411 (13.6%) | 76 (6.6%) |
| $50,000 to $99,999 | 1,148 (38.0%) | 353 (30.5%) |
| $100,000 to $299,999 | 1,322 (43.8%) | 659 (56.9%) |
| $300,000 to $499,999 | 99 (3.3%) | 23 (2.0%) |
| $500,000 to $749,999 | 32 (1.1%) | 7 (0.6%) |
| $750,000 to $999,999 | 10 (0.3%) | 0 (0.0%) |
| $1,000,000 or more | 0 (0.0%) | 40 (3.5%) |
| Total | 3,022 (100.0%) | 1,158 (100.0%) |
Household Income by Mortgage Status in Hamtramck
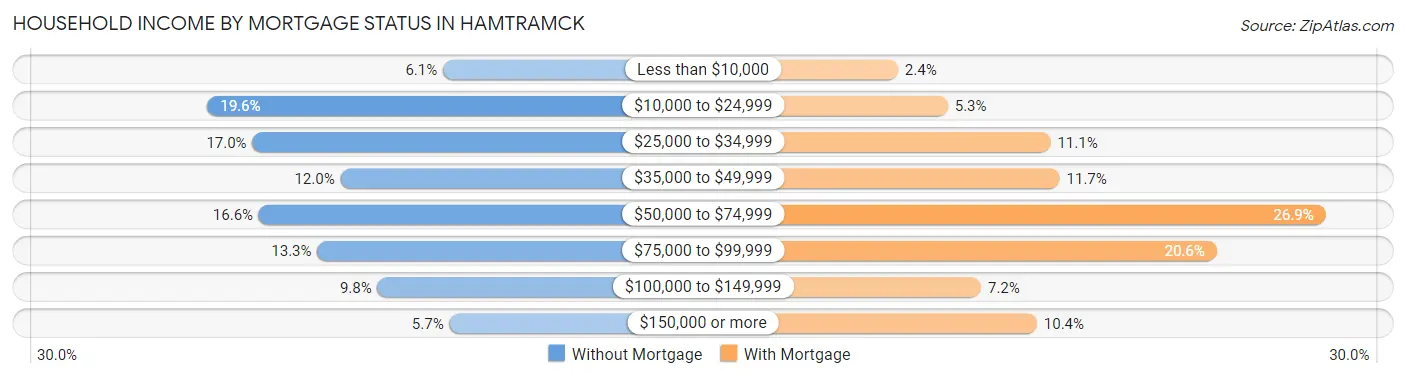
| Household Income | Without Mortgage | With Mortgage |
| Less than $10,000 | 184 (6.1%) | 28 (2.4%) |
| $10,000 to $24,999 | 591 (19.6%) | 61 (5.3%) |
| $25,000 to $34,999 | 513 (17.0%) | 129 (11.1%) |
| $35,000 to $49,999 | 361 (11.9%) | 135 (11.7%) |
| $50,000 to $74,999 | 502 (16.6%) | 311 (26.9%) |
| $75,000 to $99,999 | 401 (13.3%) | 239 (20.6%) |
| $100,000 to $149,999 | 297 (9.8%) | 83 (7.2%) |
| $150,000 or more | 173 (5.7%) | 120 (10.4%) |
| Total | 3,022 (100.0%) | 1,158 (100.0%) |
Property Value to Household Income Ratio in Hamtramck
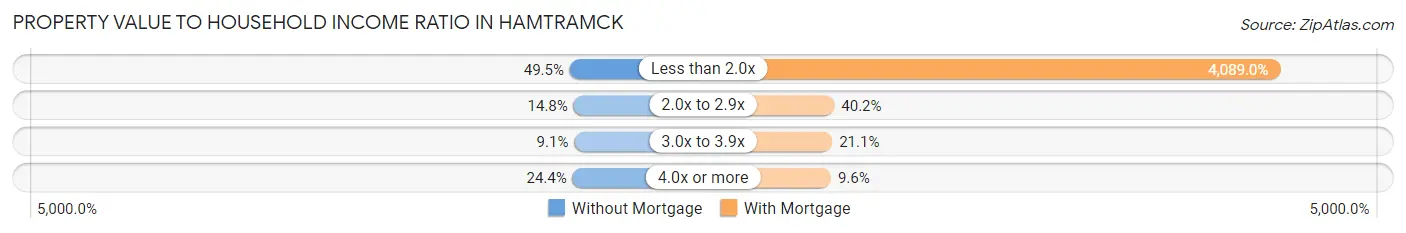
| Value-to-Income Ratio | Without Mortgage | With Mortgage |
| Less than 2.0x | 1,495 (49.5%) | 47,350 (4,088.9%) |
| 2.0x to 2.9x | 447 (14.8%) | 465 (40.2%) |
| 3.0x to 3.9x | 276 (9.1%) | 244 (21.1%) |
| 4.0x or more | 738 (24.4%) | 111 (9.6%) |
| Total | 3,022 (100.0%) | 1,158 (100.0%) |
Real Estate Taxes by Mortgage Status in Hamtramck
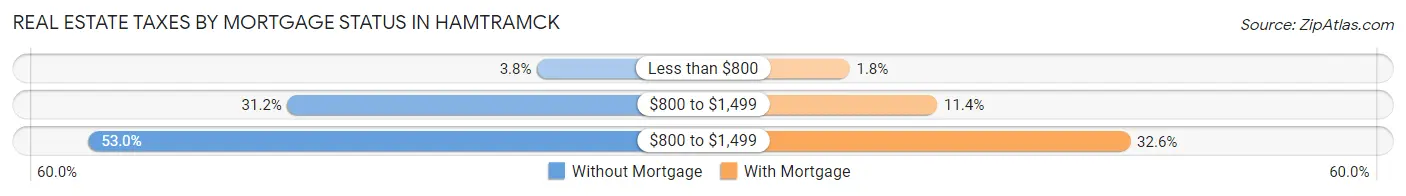
| Property Taxes | Without Mortgage | With Mortgage |
| Less than $800 | 115 (3.8%) | 21 (1.8%) |
| $800 to $1,499 | 942 (31.2%) | 132 (11.4%) |
| $800 to $1,499 | 1,602 (53.0%) | 377 (32.6%) |
| Total | 3,022 (100.0%) | 1,158 (100.0%) |
Health & Disability in Hamtramck
Health Insurance Coverage by Age in Hamtramck
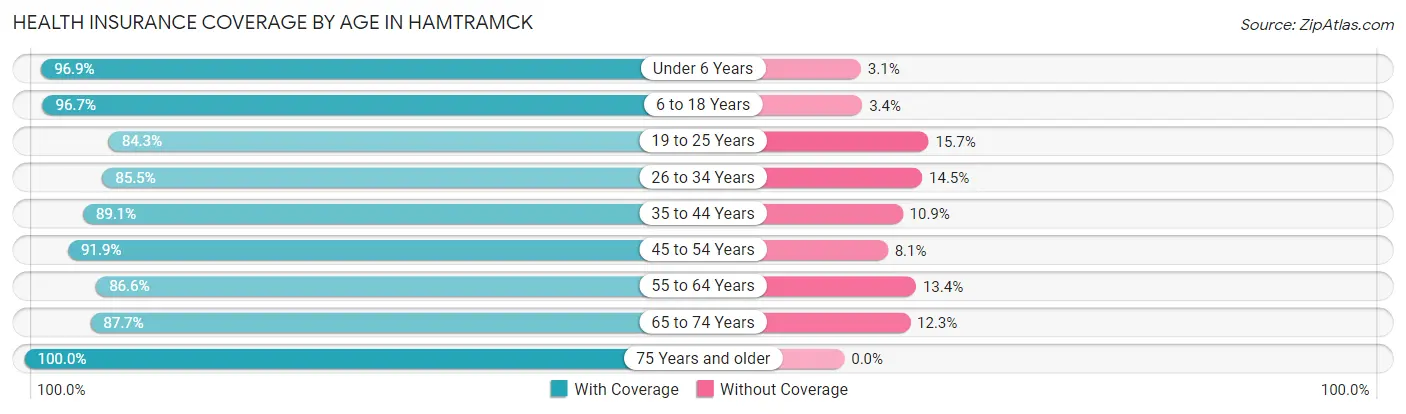
| Age Bracket | With Coverage | Without Coverage |
| Under 6 Years | 3,028 (96.9%) | 97 (3.1%) |
| 6 to 18 Years | 6,344 (96.7%) | 220 (3.4%) |
| 19 to 25 Years | 2,800 (84.3%) | 522 (15.7%) |
| 26 to 34 Years | 3,039 (85.5%) | 516 (14.5%) |
| 35 to 44 Years | 3,445 (89.1%) | 420 (10.9%) |
| 45 to 54 Years | 2,450 (91.9%) | 216 (8.1%) |
| 55 to 64 Years | 1,983 (86.6%) | 306 (13.4%) |
| 65 to 74 Years | 1,251 (87.7%) | 175 (12.3%) |
| 75 Years and older | 532 (100.0%) | 0 (0.0%) |
| Total | 24,872 (91.0%) | 2,472 (9.0%) |
Health Insurance Coverage by Citizenship Status in Hamtramck
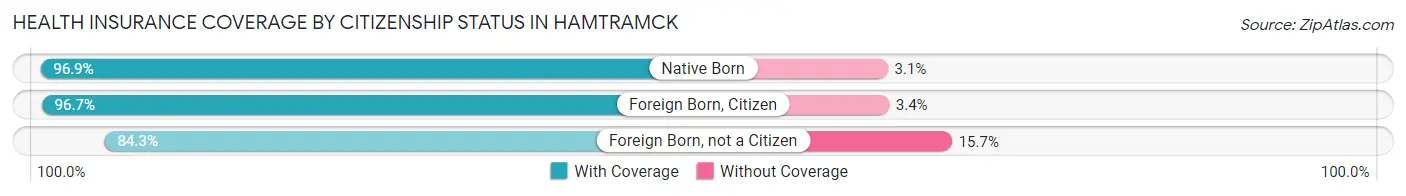
| Citizenship Status | With Coverage | Without Coverage |
| Native Born | 3,028 (96.9%) | 97 (3.1%) |
| Foreign Born, Citizen | 6,344 (96.7%) | 220 (3.4%) |
| Foreign Born, not a Citizen | 2,800 (84.3%) | 522 (15.7%) |
Health Insurance Coverage by Household Income in Hamtramck
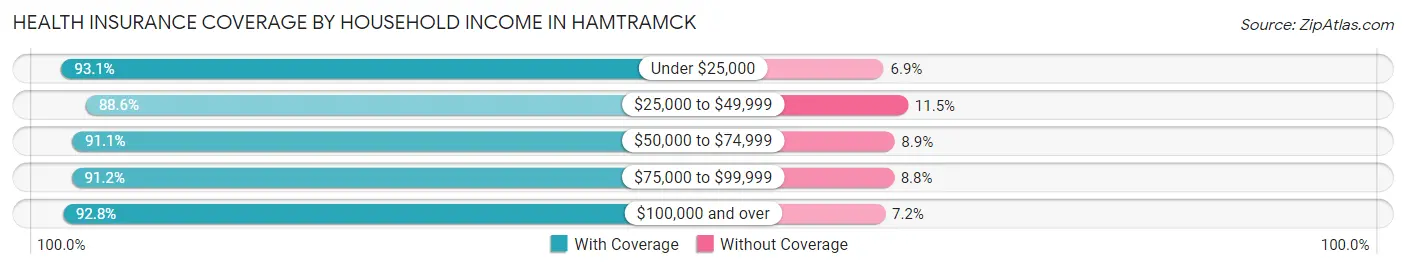
| Household Income | With Coverage | Without Coverage |
| Under $25,000 | 5,778 (93.1%) | 428 (6.9%) |
| $25,000 to $49,999 | 8,051 (88.5%) | 1,041 (11.5%) |
| $50,000 to $74,999 | 4,881 (91.1%) | 478 (8.9%) |
| $75,000 to $99,999 | 2,458 (91.2%) | 237 (8.8%) |
| $100,000 and over | 3,685 (92.8%) | 285 (7.2%) |
Public vs Private Health Insurance Coverage by Age in Hamtramck

| Age Bracket | Public Insurance | Private Insurance |
| Under 6 | 2,514 (80.4%) | 594 (19.0%) |
| 6 to 18 Years | 5,462 (83.2%) | 1,051 (16.0%) |
| 19 to 25 Years | 1,965 (59.2%) | 904 (27.2%) |
| 25 to 34 Years | 1,791 (50.4%) | 1,280 (36.0%) |
| 35 to 44 Years | 2,432 (62.9%) | 1,107 (28.6%) |
| 45 to 54 Years | 1,646 (61.7%) | 920 (34.5%) |
| 55 to 64 Years | 1,390 (60.7%) | 659 (28.8%) |
| 65 to 74 Years | 1,230 (86.3%) | 394 (27.6%) |
| 75 Years and over | 531 (99.8%) | 292 (54.9%) |
| Total | 18,961 (69.3%) | 7,201 (26.3%) |
Disability Status by Sex by Age in Hamtramck
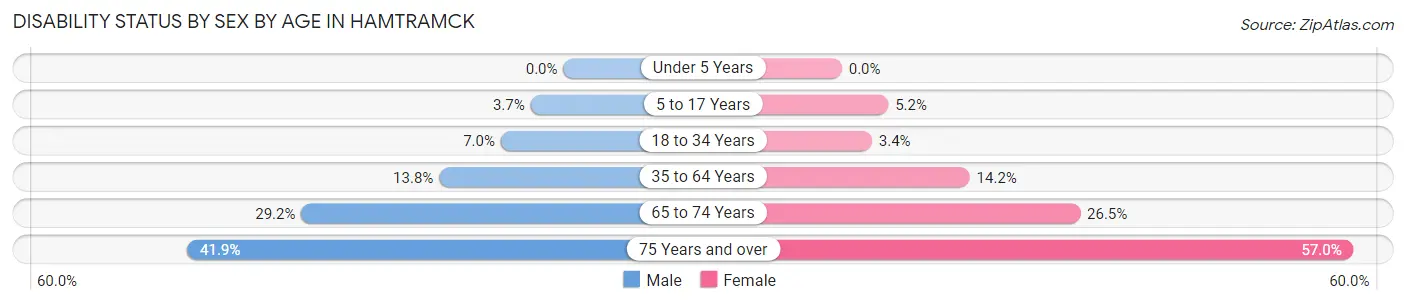
| Age Bracket | Male | Female |
| Under 5 Years | 0 (0.0%) | 0 (0.0%) |
| 5 to 17 Years | 133 (3.6%) | 150 (5.2%) |
| 18 to 34 Years | 252 (7.0%) | 130 (3.4%) |
| 35 to 64 Years | 638 (13.8%) | 599 (14.2%) |
| 65 to 74 Years | 150 (29.2%) | 242 (26.5%) |
| 75 Years and over | 106 (41.9%) | 159 (57.0%) |
Disability Class by Sex by Age in Hamtramck
Disability Class: Hearing Difficulty
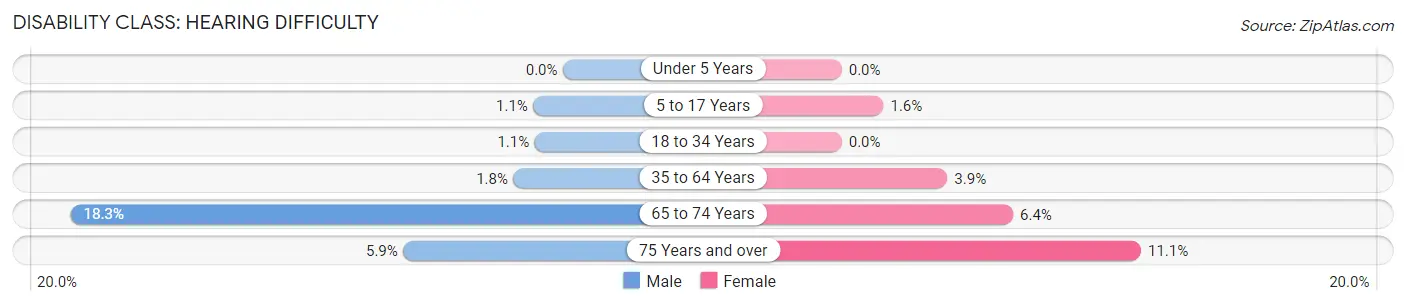
| Age Bracket | Male | Female |
| Under 5 Years | 0 (0.0%) | 0 (0.0%) |
| 5 to 17 Years | 40 (1.1%) | 45 (1.5%) |
| 18 to 34 Years | 38 (1.1%) | 0 (0.0%) |
| 35 to 64 Years | 85 (1.8%) | 165 (3.9%) |
| 65 to 74 Years | 94 (18.3%) | 58 (6.4%) |
| 75 Years and over | 15 (5.9%) | 31 (11.1%) |
Disability Class: Vision Difficulty
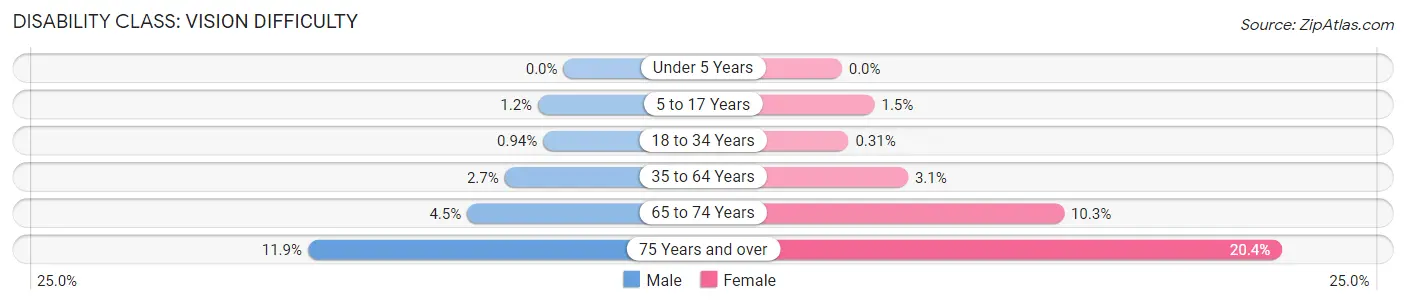
| Age Bracket | Male | Female |
| Under 5 Years | 0 (0.0%) | 0 (0.0%) |
| 5 to 17 Years | 43 (1.2%) | 44 (1.5%) |
| 18 to 34 Years | 34 (0.9%) | 12 (0.3%) |
| 35 to 64 Years | 126 (2.7%) | 129 (3.1%) |
| 65 to 74 Years | 23 (4.5%) | 94 (10.3%) |
| 75 Years and over | 30 (11.9%) | 57 (20.4%) |
Disability Class: Cognitive Difficulty
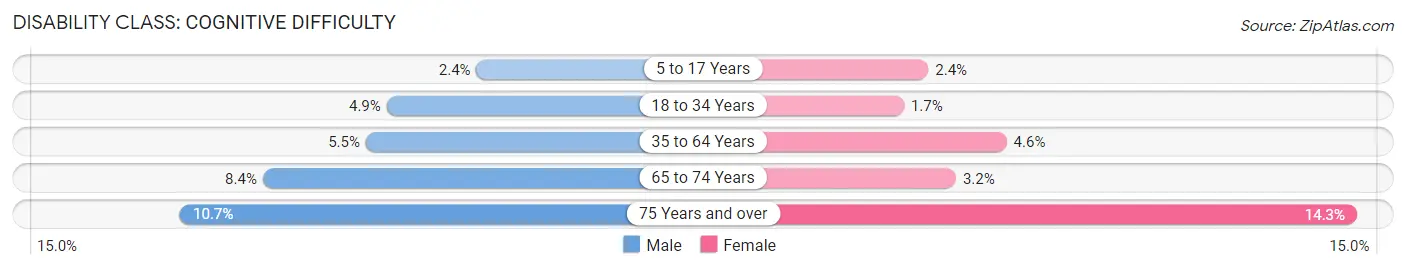
| Age Bracket | Male | Female |
| 5 to 17 Years | 88 (2.4%) | 70 (2.4%) |
| 18 to 34 Years | 178 (4.9%) | 67 (1.7%) |
| 35 to 64 Years | 254 (5.5%) | 193 (4.6%) |
| 65 to 74 Years | 43 (8.4%) | 29 (3.2%) |
| 75 Years and over | 27 (10.7%) | 40 (14.3%) |
Disability Class: Ambulatory Difficulty
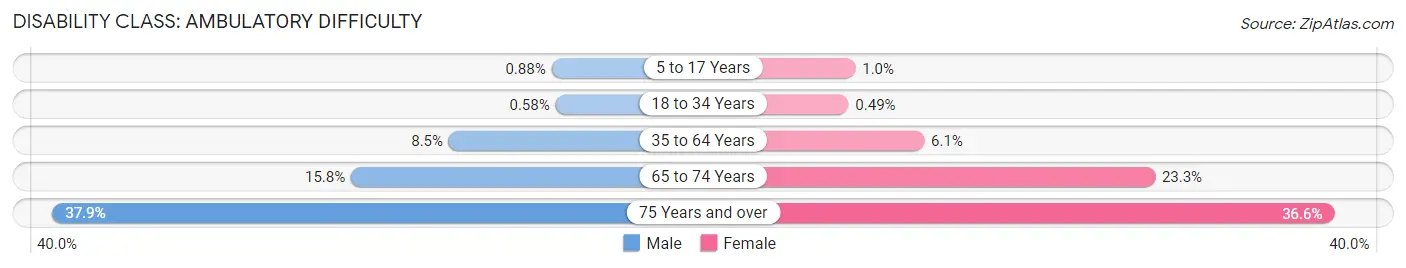
| Age Bracket | Male | Female |
| 5 to 17 Years | 32 (0.9%) | 29 (1.0%) |
| 18 to 34 Years | 21 (0.6%) | 19 (0.5%) |
| 35 to 64 Years | 392 (8.5%) | 257 (6.1%) |
| 65 to 74 Years | 81 (15.8%) | 212 (23.3%) |
| 75 Years and over | 96 (37.9%) | 102 (36.6%) |
Disability Class: Self-Care Difficulty
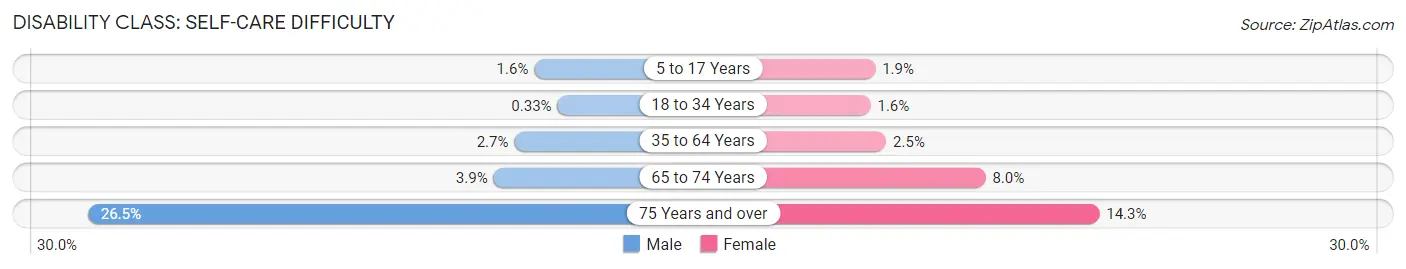
| Age Bracket | Male | Female |
| 5 to 17 Years | 59 (1.6%) | 54 (1.9%) |
| 18 to 34 Years | 12 (0.3%) | 62 (1.6%) |
| 35 to 64 Years | 126 (2.7%) | 104 (2.5%) |
| 65 to 74 Years | 20 (3.9%) | 73 (8.0%) |
| 75 Years and over | 67 (26.5%) | 40 (14.3%) |
Technology Access in Hamtramck
Computing Device Access in Hamtramck
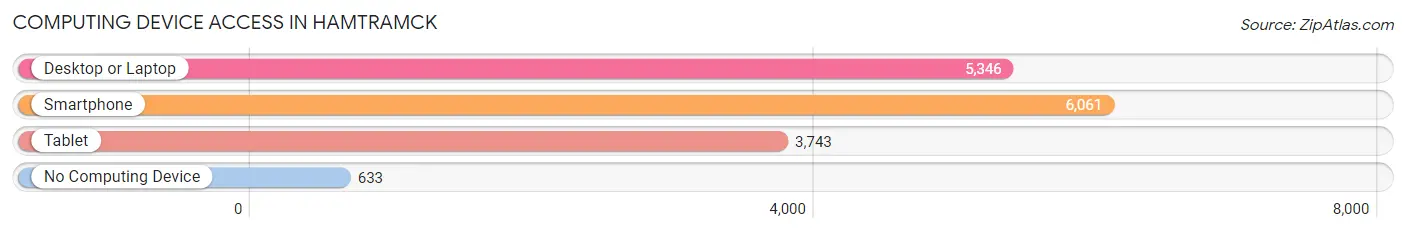
| Device Type | # Households | % Households |
| Desktop or Laptop | 5,346 | 72.8% |
| Smartphone | 6,061 | 82.6% |
| Tablet | 3,743 | 51.0% |
| No Computing Device | 633 | 8.6% |
| Total | 7,342 | 100.0% |
Internet Access in Hamtramck
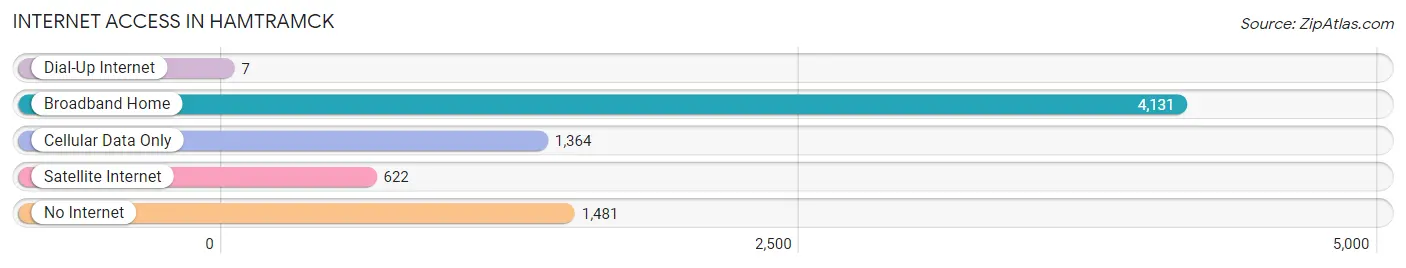
| Internet Type | # Households | % Households |
| Dial-Up Internet | 7 | 0.1% |
| Broadband Home | 4,131 | 56.3% |
| Cellular Data Only | 1,364 | 18.6% |
| Satellite Internet | 622 | 8.5% |
| No Internet | 1,481 | 20.2% |
| Total | 7,342 | 100.0% |
Hamtramck Summary
Hamtramck, Michigan is a small city located in Wayne County, Michigan, just north of Detroit. It is a diverse city with a population of 22,423 people as of the 2010 census. The city is known for its Polish heritage, and is home to a large Polish-American population.
History
Hamtramck was founded in 1798 by French-Canadian fur trader, Jean-Francois Hamtramck. The city was originally known as Hamtramck Township, and was incorporated as a village in 1901. The city was named after Hamtramck, who was a French-Canadian soldier and explorer.
In the early 1900s, the city was a popular destination for Polish immigrants. The city was known for its Polish culture and heritage, and was home to a large Polish-American population. The city was also home to a large number of German immigrants, and was known for its German culture and heritage.
In the 1920s, the city was home to a large number of auto factories, and was known as the “Motor City”. The city was also home to a large number of Polish and German immigrants, and was known for its diverse culture and heritage.
In the 1950s, the city was home to a large number of African-American immigrants, and was known for its African-American culture and heritage. The city was also home to a large number of Polish and German immigrants, and was known for its diverse culture and heritage.
Geography
Hamtramck is located in Wayne County, Michigan, just north of Detroit. The city is bordered by Detroit to the south, Highland Park to the west, and Warren to the north. The city is located on the Detroit River, and is home to a number of parks and recreational areas.
The city has a total area of 2.2 square miles, and is home to a number of parks and recreational areas. The city is home to a number of parks, including Hamtramck Park, which is a large park located in the center of the city. The city is also home to a number of historic sites, including the Hamtramck Historical Museum.
Economy
Hamtramck is home to a number of businesses and industries. The city is home to a number of auto factories, and is known as the “Motor City”. The city is also home to a number of manufacturing and industrial businesses, including the Detroit Diesel Corporation, which is a major manufacturer of diesel engines.
The city is also home to a number of retail businesses, including a number of Polish and German restaurants, and a number of Polish and German grocery stores. The city is also home to a number of small businesses, including a number of Polish and German bakeries.
Demographics
As of the 2010 census, the population of Hamtramck was 22,423 people. The city is home to a large Polish-American population, and is known for its Polish culture and heritage. The city is also home to a large number of African-American and German-American populations, and is known for its diverse culture and heritage.
The median household income in the city is $30,945, and the median family income is $37,945. The city has a poverty rate of 28.3%, and the unemployment rate is 8.2%. The city is home to a large number of immigrants, and is known for its diverse culture and heritage.
Common Questions
What is Per Capita Income in Hamtramck?
Per Capita income in Hamtramck is $14,776.
What is the Median Family Income in Hamtramck?
Median Family Income in Hamtramck is $43,315.
What is the Median Household income in Hamtramck?
Median Household Income in Hamtramck is $39,648.
What is Income or Wage Gap in Hamtramck?
Income or Wage Gap in Hamtramck is 19.1%.
Women in Hamtramck earn 80.9 cents for every dollar earned by a man.
What is Family Income Deficit in Hamtramck?
Family Income Deficit in Hamtramck is $13,757.
Families that are below poverty line in Hamtramck earn $13,757 less on average than the poverty threshold level.
What is Inequality or Gini Index in Hamtramck?
Inequality or Gini Index in Hamtramck is 0.44.
What is the Total Population of Hamtramck?
Total Population of Hamtramck is 27,842.
What is the Total Male Population of Hamtramck?
Total Male Population of Hamtramck is 14,412.
What is the Total Female Population of Hamtramck?
Total Female Population of Hamtramck is 13,430.
What is the Ratio of Males per 100 Females in Hamtramck?
There are 107.31 Males per 100 Females in Hamtramck.
What is the Ratio of Females per 100 Males in Hamtramck?
There are 93.19 Females per 100 Males in Hamtramck.
What is the Median Population Age in Hamtramck?
Median Population Age in Hamtramck is 27.8 Years.
What is the Average Family Size in Hamtramck
Average Family Size in Hamtramck is 4.6 People.
What is the Average Household Size in Hamtramck
Average Household Size in Hamtramck is 3.7 People.
How Large is the Labor Force in Hamtramck?
There are 9,090 People in the Labor Forcein in Hamtramck.
What is the Percentage of People in the Labor Force in Hamtramck?
45.9% of People are in the Labor Force in Hamtramck.
What is the Unemployment Rate in Hamtramck?
Unemployment Rate in Hamtramck is 11.7%.