Lorton, VA Map & Demographics
Lorton Map
Lorton Overview
$48,202
PER CAPITA INCOME
$144,940
AVG FAMILY INCOME
$131,581
AVG HOUSEHOLD INCOME
25.5%
WAGE / INCOME GAP [ % ]
74.5¢/ $1
WAGE / INCOME GAP [ $ ]
0.37
INEQUALITY / GINI INDEX
22,049
TOTAL POPULATION
10,391
MALE POPULATION
11,658
FEMALE POPULATION
89.13
MALES / 100 FEMALES
112.19
FEMALES / 100 MALES
38.0
MEDIAN AGE
3.7
AVG FAMILY SIZE
3.2
AVG HOUSEHOLD SIZE
11,768
LABOR FORCE [ PEOPLE ]
70.2%
PERCENT IN LABOR FORCE
4.9%
UNEMPLOYMENT RATE
Lorton Zip Codes
Income in Lorton
Income Overview in Lorton
Per Capita Income in Lorton is $48,202, while median incomes of families and households are $144,940 and $131,581 respectively.
| Characteristic | Number | Measure |
| Per Capita Income | 22,049 | $48,202 |
| Median Family Income | 5,292 | $144,940 |
| Mean Family Income | 5,292 | $156,131 |
| Median Household Income | 6,773 | $131,581 |
| Mean Household Income | 6,773 | $153,184 |
| Income Deficit | 5,292 | $0 |
| Wage / Income Gap (%) | 22,049 | 25.45% |
| Wage / Income Gap ($) | 22,049 | 74.55¢ per $1 |
| Gini / Inequality Index | 22,049 | 0.37 |
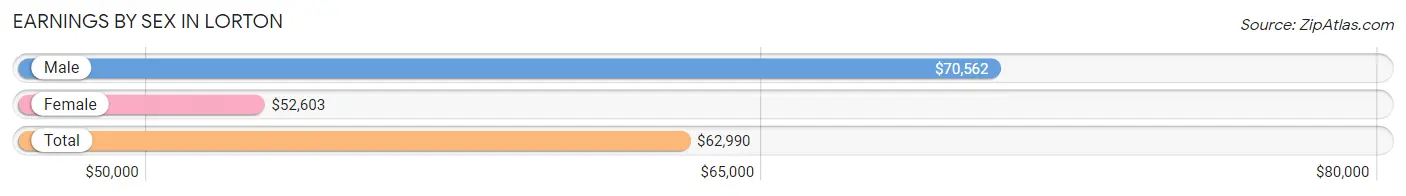
Earnings by Sex in Lorton
Average Earnings in Lorton are $62,990, $70,562 for men and $52,603 for women, a difference of 25.5%.
| Sex | Number | Average Earnings |
| Male | 6,327 (51.3%) | $70,562 |
| Female | 6,004 (48.7%) | $52,603 |
| Total | 12,331 (100.0%) | $62,990 |
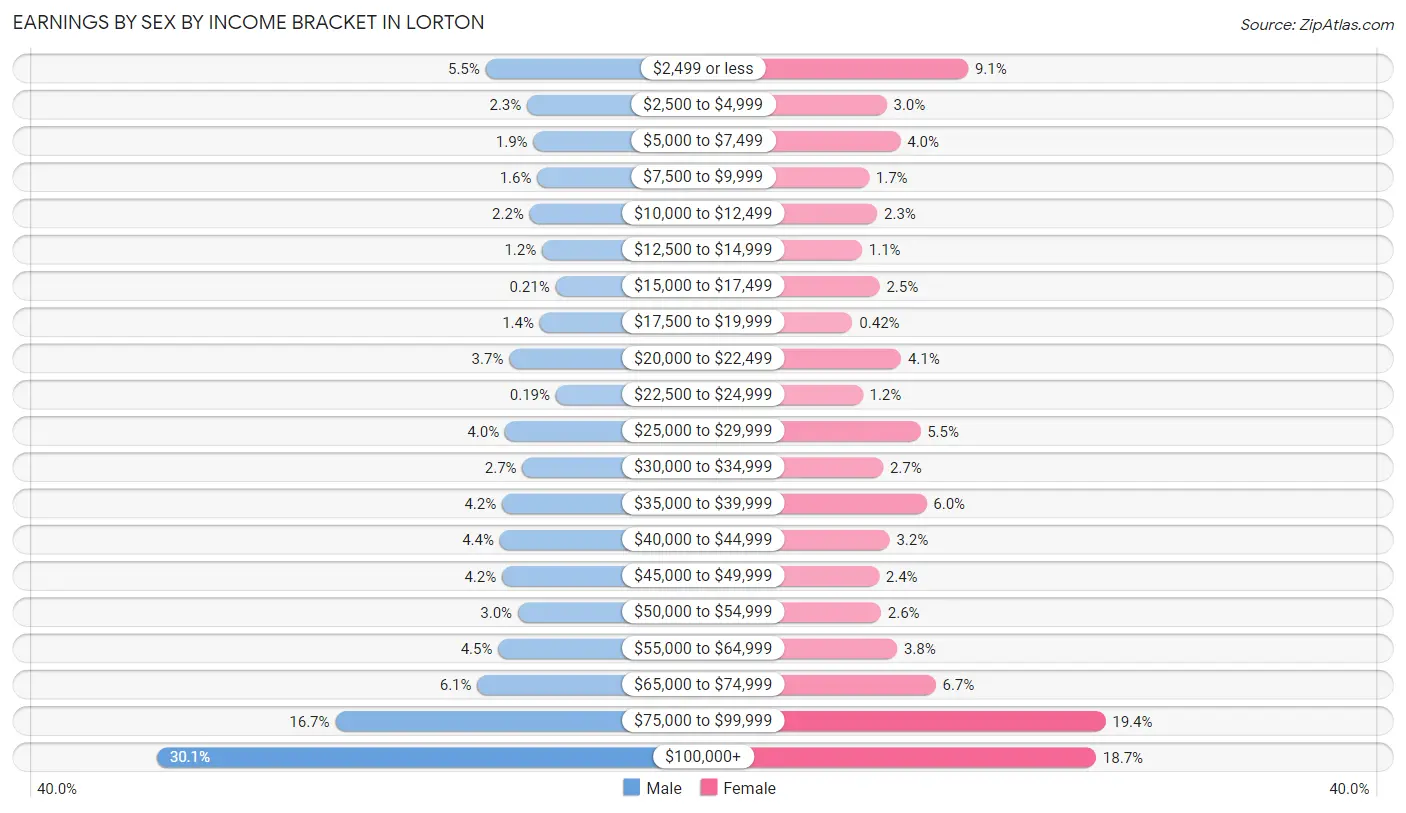
Earnings by Sex by Income Bracket in Lorton
The most common earnings brackets in Lorton are $100,000+ for men (1,904 | 30.1%) and $75,000 to $99,999 for women (1,163 | 19.4%).
| Income | Male | Female |
| $2,499 or less | 345 (5.4%) | 545 (9.1%) |
| $2,500 to $4,999 | 148 (2.3%) | 179 (3.0%) |
| $5,000 to $7,499 | 118 (1.9%) | 241 (4.0%) |
| $7,500 to $9,999 | 100 (1.6%) | 99 (1.7%) |
| $10,000 to $12,499 | 136 (2.1%) | 136 (2.3%) |
| $12,500 to $14,999 | 77 (1.2%) | 68 (1.1%) |
| $15,000 to $17,499 | 13 (0.2%) | 147 (2.5%) |
| $17,500 to $19,999 | 88 (1.4%) | 25 (0.4%) |
| $20,000 to $22,499 | 233 (3.7%) | 244 (4.1%) |
| $22,500 to $24,999 | 12 (0.2%) | 71 (1.2%) |
| $25,000 to $29,999 | 253 (4.0%) | 330 (5.5%) |
| $30,000 to $34,999 | 170 (2.7%) | 163 (2.7%) |
| $35,000 to $39,999 | 267 (4.2%) | 358 (6.0%) |
| $40,000 to $44,999 | 278 (4.4%) | 192 (3.2%) |
| $45,000 to $49,999 | 267 (4.2%) | 144 (2.4%) |
| $50,000 to $54,999 | 192 (3.0%) | 153 (2.5%) |
| $55,000 to $64,999 | 285 (4.5%) | 226 (3.8%) |
| $65,000 to $74,999 | 384 (6.1%) | 399 (6.7%) |
| $75,000 to $99,999 | 1,057 (16.7%) | 1,163 (19.4%) |
| $100,000+ | 1,904 (30.1%) | 1,121 (18.7%) |
| Total | 6,327 (100.0%) | 6,004 (100.0%) |
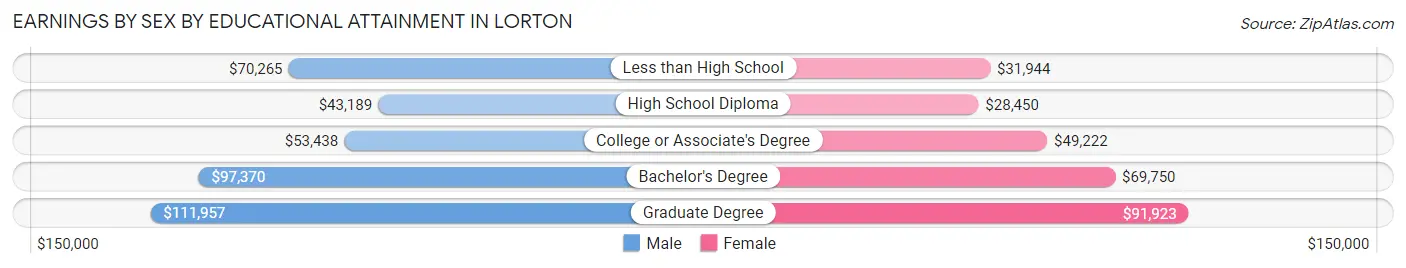
Earnings by Sex by Educational Attainment in Lorton
Average earnings in Lorton are $79,208 for men and $68,678 for women, a difference of 13.3%. Men with an educational attainment of graduate degree enjoy the highest average annual earnings of $111,957, while those with high school diploma education earn the least with $43,189. Women with an educational attainment of graduate degree earn the most with the average annual earnings of $91,923, while those with high school diploma education have the smallest earnings of $28,450.
| Educational Attainment | Male Income | Female Income |
| Less than High School | $70,265 | $31,944 |
| High School Diploma | $43,189 | $28,450 |
| College or Associate's Degree | $53,438 | $49,222 |
| Bachelor's Degree | $97,370 | $69,750 |
| Graduate Degree | $111,957 | $91,923 |
| Total | $79,208 | $68,678 |
Family Income in Lorton
Family Income Brackets in Lorton
According to the Lorton family income data, there are 1,355 families falling into the $200,000+ income range, which is the most common income bracket and makes up 25.6% of all families.
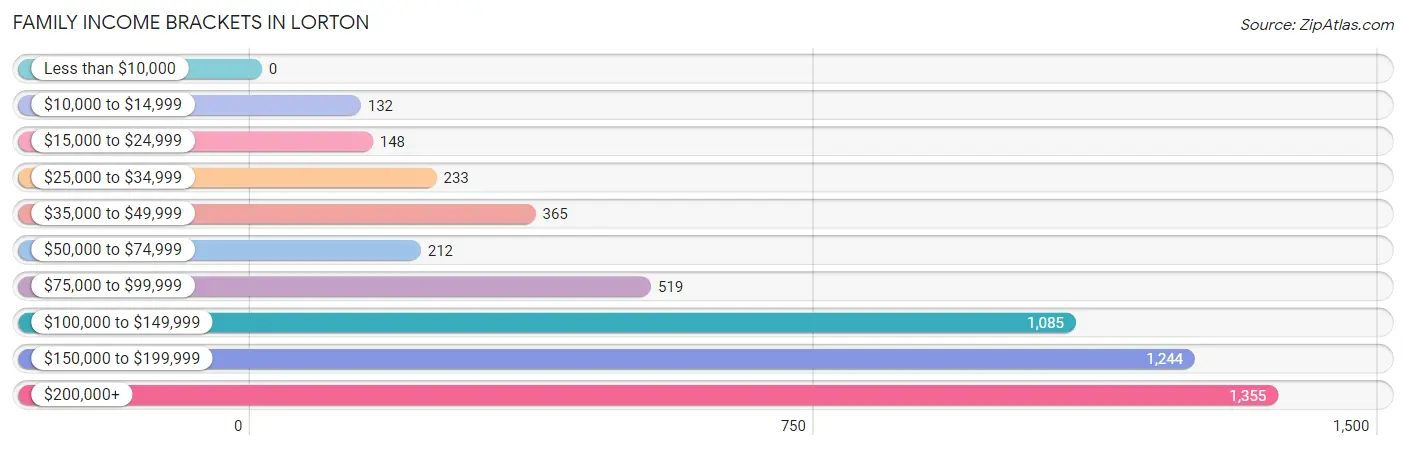
| Income Bracket | # Families | % Families |
| Less than $10,000 | 0 | 0.0% |
| $10,000 to $14,999 | 132 | 2.5% |
| $15,000 to $24,999 | 148 | 2.8% |
| $25,000 to $34,999 | 233 | 4.4% |
| $35,000 to $49,999 | 365 | 6.9% |
| $50,000 to $74,999 | 212 | 4.0% |
| $75,000 to $99,999 | 519 | 9.8% |
| $100,000 to $149,999 | 1,085 | 20.5% |
| $150,000 to $199,999 | 1,244 | 23.5% |
| $200,000+ | 1,355 | 25.6% |
Family Income by Famaliy Size in Lorton
7+ person families (171 | 3.2%) account for the highest median family income in Lorton with $198,313 per family, while 2-person families (1,340 | 25.3%) have the highest median income of $62,272 per family member.
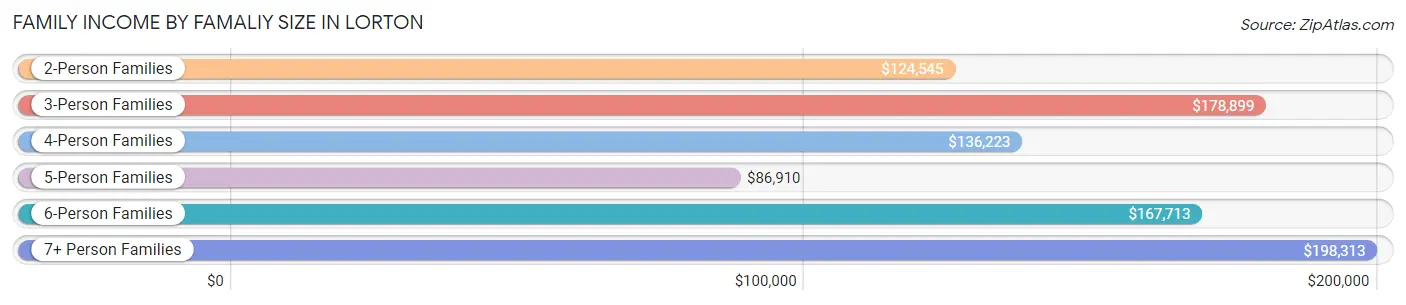
| Income Bracket | # Families | Median Income |
| 2-Person Families | 1,340 (25.3%) | $124,545 |
| 3-Person Families | 1,553 (29.3%) | $178,899 |
| 4-Person Families | 1,039 (19.6%) | $136,223 |
| 5-Person Families | 740 (14.0%) | $86,910 |
| 6-Person Families | 449 (8.5%) | $167,713 |
| 7+ Person Families | 171 (3.2%) | $198,313 |
| Total | 5,292 (100.0%) | $144,940 |
Family Income by Number of Earners in Lorton
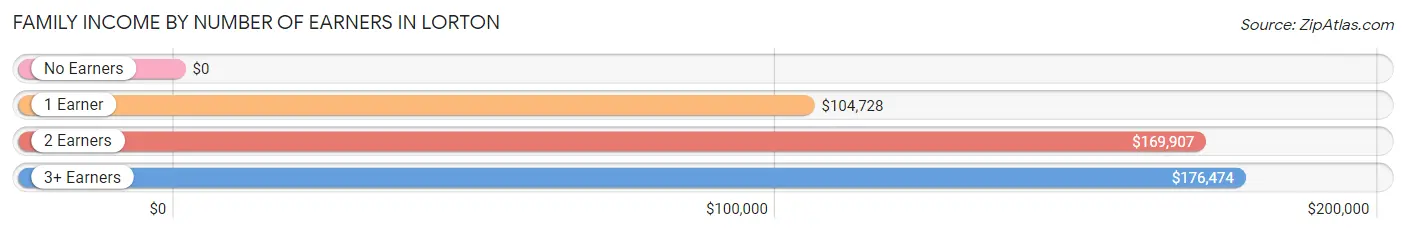
| Number of Earners | # Families | Median Income |
| No Earners | 285 (5.4%) | $0 |
| 1 Earner | 1,419 (26.8%) | $104,728 |
| 2 Earners | 2,346 (44.3%) | $169,907 |
| 3+ Earners | 1,242 (23.5%) | $176,474 |
| Total | 5,292 (100.0%) | $144,940 |
Household Income in Lorton
Household Income Brackets in Lorton
With 1,578 households falling in the category, the $100,000 to $149,999 income range is the most frequent in Lorton, accounting for 23.3% of all households. In contrast, only 88 households (1.3%) fall into the less than $10,000 income bracket, making it the least populous group.
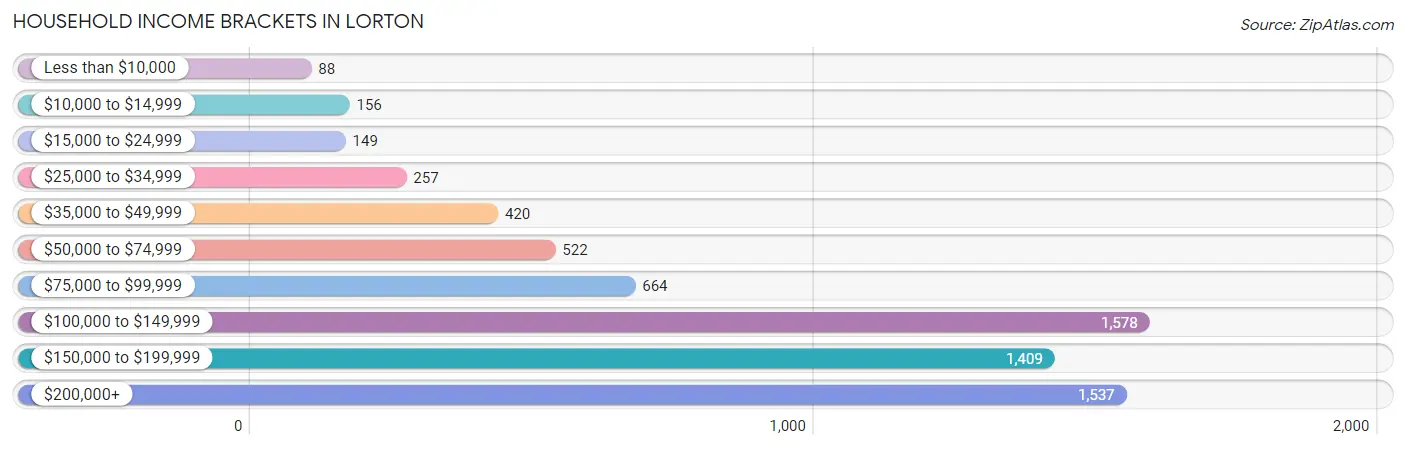
| Income Bracket | # Households | % Households |
| Less than $10,000 | 88 | 1.3% |
| $10,000 to $14,999 | 156 | 2.3% |
| $15,000 to $24,999 | 149 | 2.2% |
| $25,000 to $34,999 | 257 | 3.8% |
| $35,000 to $49,999 | 420 | 6.2% |
| $50,000 to $74,999 | 522 | 7.7% |
| $75,000 to $99,999 | 664 | 9.8% |
| $100,000 to $149,999 | 1,578 | 23.3% |
| $150,000 to $199,999 | 1,409 | 20.8% |
| $200,000+ | 1,537 | 22.7% |
Household Income by Householder Age in Lorton
The median household income in Lorton is $131,581, with the highest median household income of $165,115 found in the 45 to 64 years age bracket for the primary householder. A total of 3,081 households (45.5%) fall into this category. Meanwhile, the 65+ years age bracket for the primary householder has the lowest median household income of $113,611, with 1,176 households (17.4%) in this group.
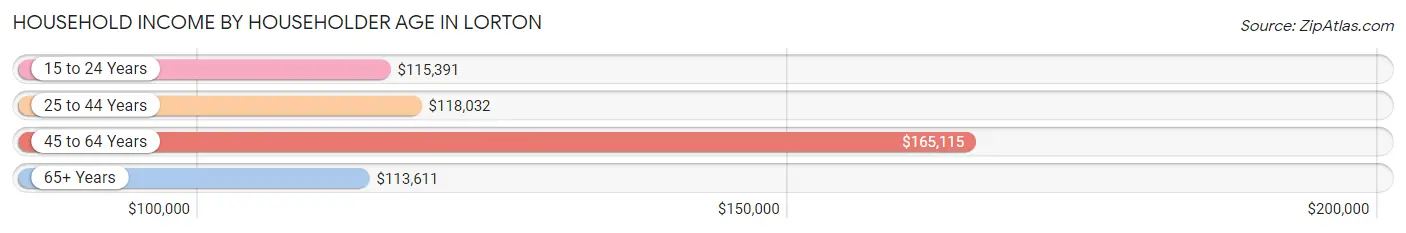
| Income Bracket | # Households | Median Income |
| 15 to 24 Years | 207 (3.1%) | $115,391 |
| 25 to 44 Years | 2,309 (34.1%) | $118,032 |
| 45 to 64 Years | 3,081 (45.5%) | $165,115 |
| 65+ Years | 1,176 (17.4%) | $113,611 |
| Total | 6,773 (100.0%) | $131,581 |
Poverty in Lorton
Income Below Poverty by Sex and Age in Lorton
With 8.6% poverty level for males and 8.5% for females among the residents of Lorton, 16 and 17 year old males and under 5 year old females are the most vulnerable to poverty, with 121 males (22.1%) and 98 females (17.9%) in their respective age groups living below the poverty level.
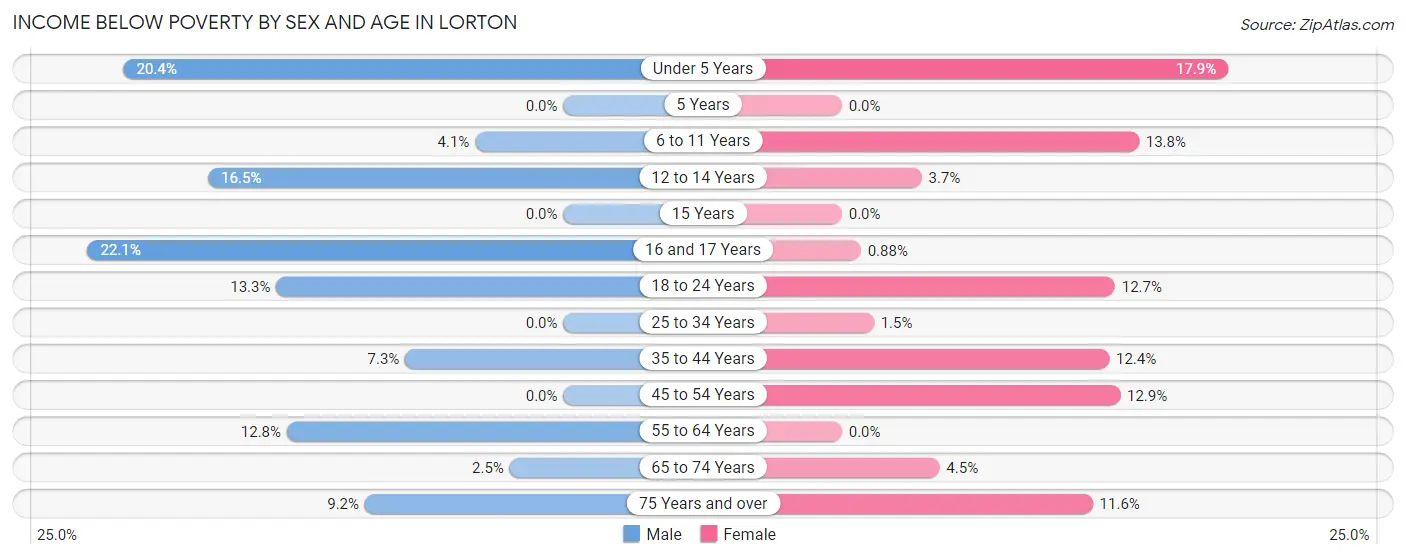
| Age Bracket | Male | Female |
| Under 5 Years | 181 (20.4%) | 98 (17.9%) |
| 5 Years | 0 (0.0%) | 0 (0.0%) |
| 6 to 11 Years | 37 (4.1%) | 97 (13.8%) |
| 12 to 14 Years | 73 (16.5%) | 40 (3.7%) |
| 15 Years | 0 (0.0%) | 0 (0.0%) |
| 16 and 17 Years | 121 (22.1%) | 3 (0.9%) |
| 18 to 24 Years | 142 (13.3%) | 146 (12.7%) |
| 25 to 34 Years | 0 (0.0%) | 16 (1.5%) |
| 35 to 44 Years | 106 (7.3%) | 209 (12.4%) |
| 45 to 54 Years | 0 (0.0%) | 261 (12.9%) |
| 55 to 64 Years | 180 (12.8%) | 0 (0.0%) |
| 65 to 74 Years | 13 (2.5%) | 33 (4.5%) |
| 75 Years and over | 34 (9.2%) | 88 (11.6%) |
| Total | 887 (8.6%) | 991 (8.5%) |
Income Above Poverty by Sex and Age in Lorton
According to the poverty statistics in Lorton, males aged 5 years and females aged 5 years are the age groups that are most secure financially, with 100.0% of males and 100.0% of females in these age groups living above the poverty line.
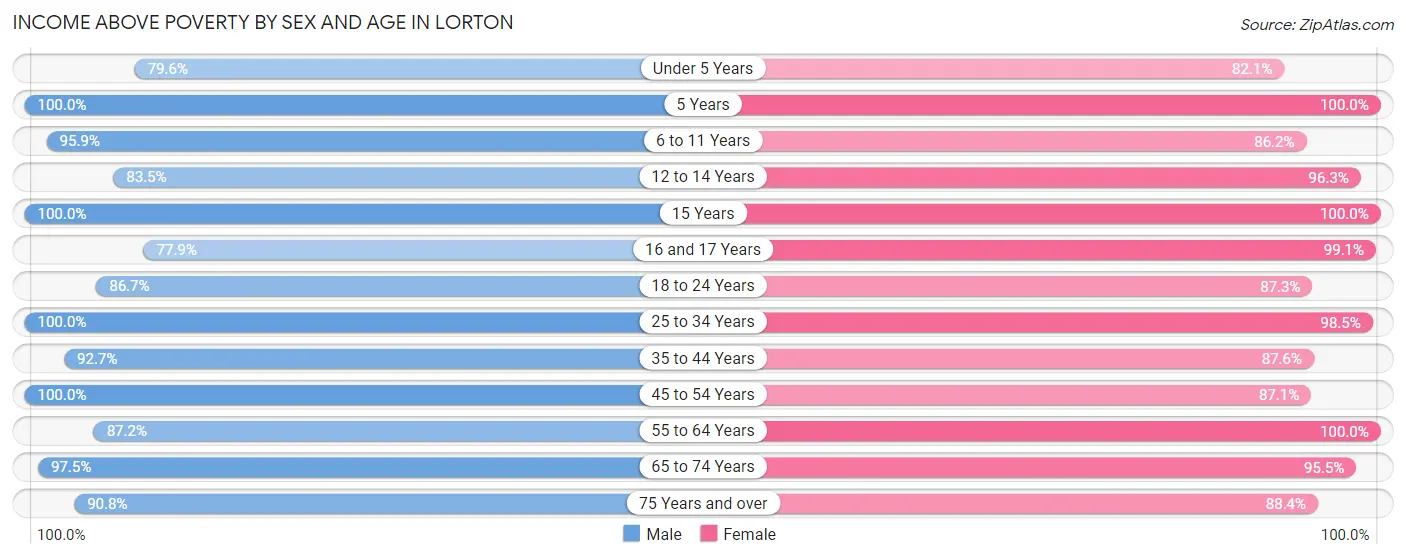
| Age Bracket | Male | Female |
| Under 5 Years | 706 (79.6%) | 449 (82.1%) |
| 5 Years | 54 (100.0%) | 81 (100.0%) |
| 6 to 11 Years | 867 (95.9%) | 607 (86.2%) |
| 12 to 14 Years | 370 (83.5%) | 1,042 (96.3%) |
| 15 Years | 156 (100.0%) | 387 (100.0%) |
| 16 and 17 Years | 427 (77.9%) | 337 (99.1%) |
| 18 to 24 Years | 924 (86.7%) | 1,006 (87.3%) |
| 25 to 34 Years | 818 (100.0%) | 1,065 (98.5%) |
| 35 to 44 Years | 1,339 (92.7%) | 1,477 (87.6%) |
| 45 to 54 Years | 1,691 (100.0%) | 1,761 (87.1%) |
| 55 to 64 Years | 1,223 (87.2%) | 1,056 (100.0%) |
| 65 to 74 Years | 509 (97.5%) | 696 (95.5%) |
| 75 Years and over | 335 (90.8%) | 668 (88.4%) |
| Total | 9,419 (91.4%) | 10,632 (91.5%) |
Income Below Poverty Among Married-Couple Families in Lorton
The poverty statistics for married-couple families in Lorton show that 5.6% or 241 of the total 4,271 families live below the poverty line. Families with 3 or 4 children have the highest poverty rate of 17.4%, comprising of 93 families. On the other hand, families with 5 or more children have the lowest poverty rate of 0.0%, which includes 0 families.
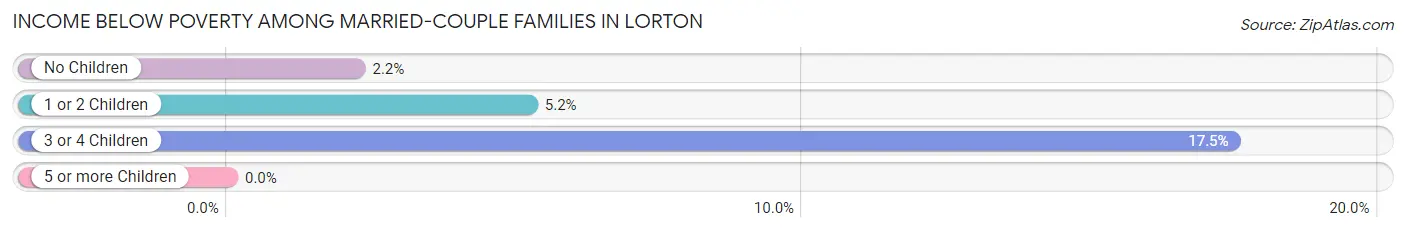
| Children | Above Poverty | Below Poverty |
| No Children | 1,500 (97.8%) | 34 (2.2%) |
| 1 or 2 Children | 2,070 (94.8%) | 114 (5.2%) |
| 3 or 4 Children | 440 (82.6%) | 93 (17.4%) |
| 5 or more Children | 20 (100.0%) | 0 (0.0%) |
| Total | 4,030 (94.4%) | 241 (5.6%) |
Income Below Poverty Among Single-Parent Households in Lorton
According to the poverty data in Lorton, 22.9% or 63 single-father households and 13.1% or 98 single-mother households are living below the poverty line. Among single-father households, those with 1 or 2 children have the highest poverty rate, with 50 households (28.9%) experiencing poverty. Likewise, among single-mother households, those with 1 or 2 children have the highest poverty rate, with 98 households (28.7%) falling below the poverty line.
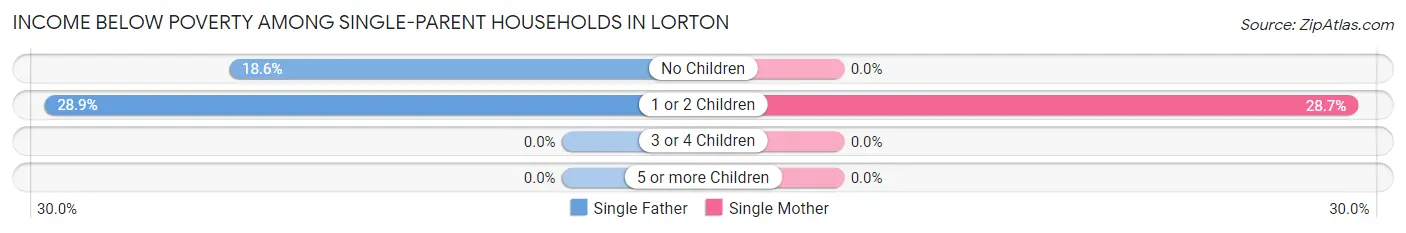
| Children | Single Father | Single Mother |
| No Children | 13 (18.6%) | 0 (0.0%) |
| 1 or 2 Children | 50 (28.9%) | 98 (28.7%) |
| 3 or 4 Children | 0 (0.0%) | 0 (0.0%) |
| 5 or more Children | 0 (0.0%) | 0 (0.0%) |
| Total | 63 (22.9%) | 98 (13.1%) |
Income Below Poverty Among Married-Couple vs Single-Parent Households in Lorton
The poverty data for Lorton shows that 241 of the married-couple family households (5.6%) and 161 of the single-parent households (15.8%) are living below the poverty level. Within the married-couple family households, those with 3 or 4 children have the highest poverty rate, with 93 households (17.4%) falling below the poverty line. Among the single-parent households, those with 1 or 2 children have the highest poverty rate, with 148 household (28.8%) living below poverty.
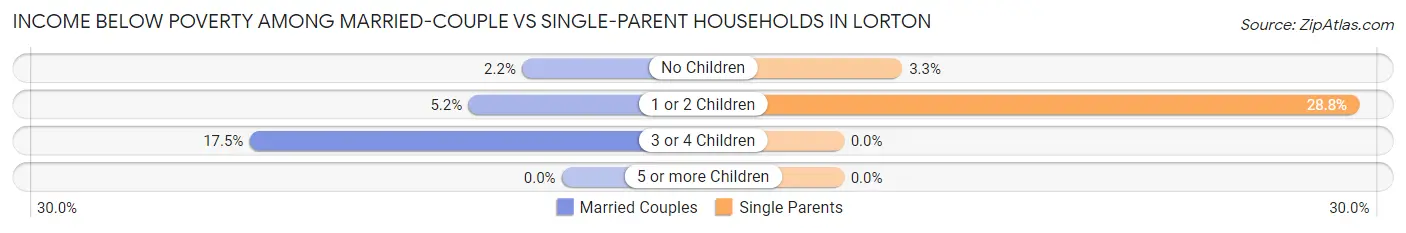
| Children | Married-Couple Families | Single-Parent Households |
| No Children | 34 (2.2%) | 13 (3.3%) |
| 1 or 2 Children | 114 (5.2%) | 148 (28.8%) |
| 3 or 4 Children | 93 (17.4%) | 0 (0.0%) |
| 5 or more Children | 0 (0.0%) | 0 (0.0%) |
| Total | 241 (5.6%) | 161 (15.8%) |
Race in Lorton
The most populous races in Lorton are White / Caucasian (7,093 | 32.2%), Black / African American (6,342 | 28.8%), and Asian (4,647 | 21.1%).
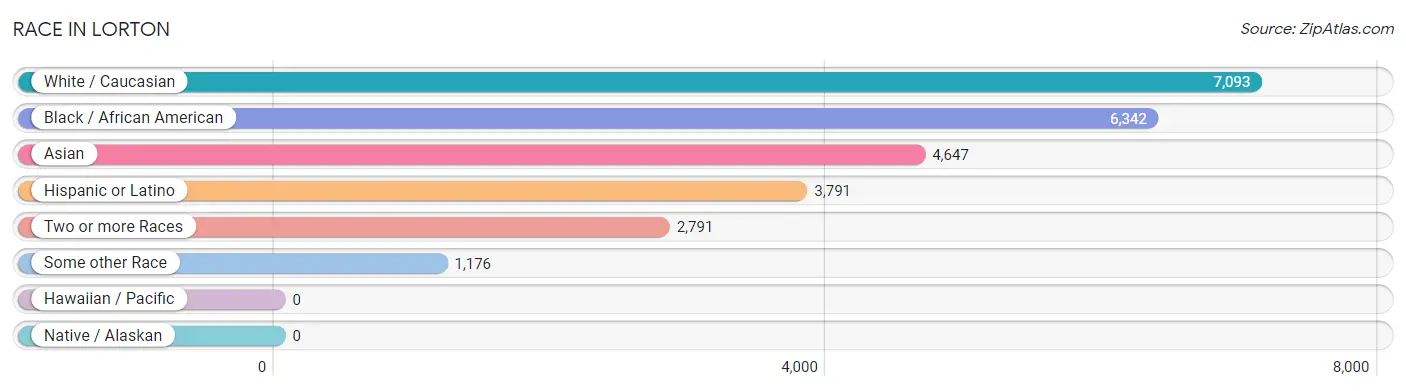
| Race | # Population | % Population |
| Asian | 4,647 | 21.1% |
| Black / African American | 6,342 | 28.8% |
| Hawaiian / Pacific | 0 | 0.0% |
| Hispanic or Latino | 3,791 | 17.2% |
| Native / Alaskan | 0 | 0.0% |
| White / Caucasian | 7,093 | 32.2% |
| Two or more Races | 2,791 | 12.7% |
| Some other Race | 1,176 | 5.3% |
| Total | 22,049 | 100.0% |
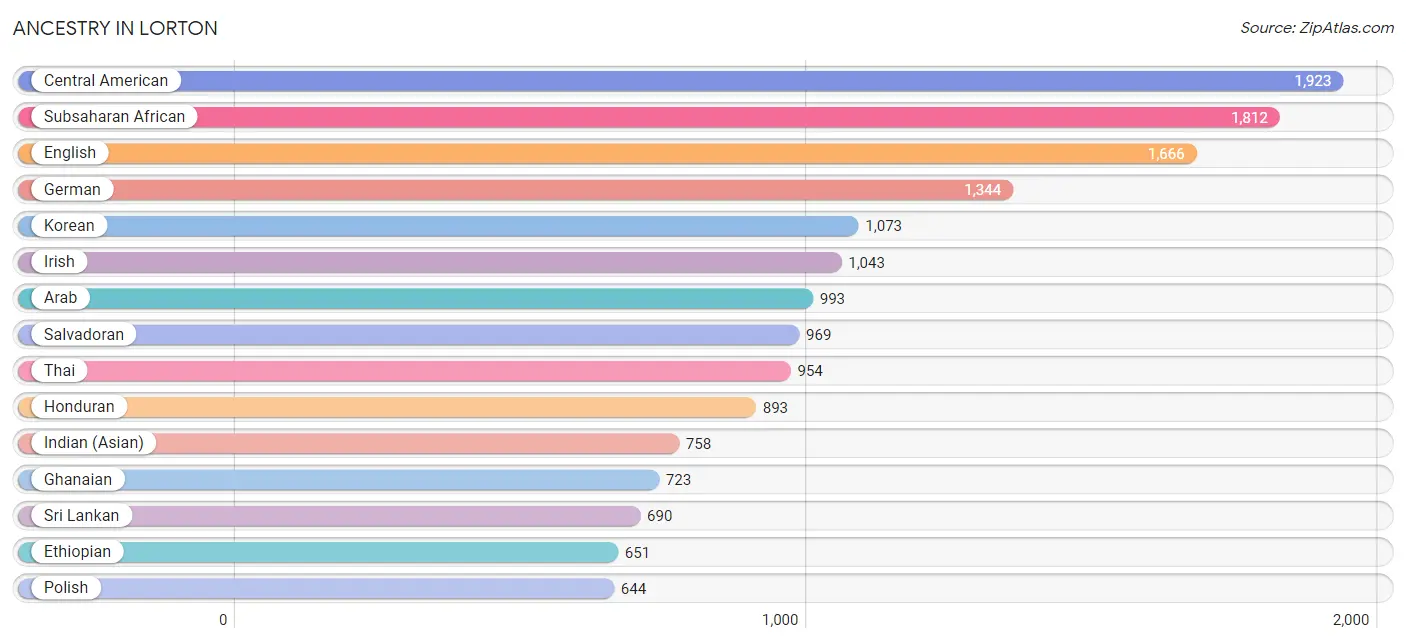
Ancestry in Lorton
The most populous ancestries reported in Lorton are Central American (1,923 | 8.7%), Subsaharan African (1,812 | 8.2%), English (1,666 | 7.6%), German (1,344 | 6.1%), and Korean (1,073 | 4.9%), together accounting for 35.5% of all Lorton residents.
| Ancestry | # Population | % Population |
| Afghan | 231 | 1.1% |
| African | 186 | 0.8% |
| American | 472 | 2.1% |
| Arab | 993 | 4.5% |
| Australian | 30 | 0.1% |
| Austrian | 42 | 0.2% |
| Belgian | 27 | 0.1% |
| Bhutanese | 98 | 0.4% |
| Bolivian | 237 | 1.1% |
| Brazilian | 42 | 0.2% |
| British | 127 | 0.6% |
| Burmese | 635 | 2.9% |
| Canadian | 41 | 0.2% |
| Central American | 1,923 | 8.7% |
| Cherokee | 33 | 0.2% |
| Chilean | 95 | 0.4% |
| Czech | 43 | 0.2% |
| Czechoslovakian | 11 | 0.1% |
| Danish | 20 | 0.1% |
| Dominican | 69 | 0.3% |
| Dutch | 24 | 0.1% |
| Dutch West Indian | 38 | 0.2% |
| Eastern European | 12 | 0.1% |
| English | 1,666 | 7.6% |
| Ethiopian | 651 | 2.9% |
| European | 231 | 1.1% |
| Finnish | 18 | 0.1% |
| French | 68 | 0.3% |
| French Canadian | 14 | 0.1% |
| German | 1,344 | 6.1% |
| Ghanaian | 723 | 3.3% |
| Greek | 31 | 0.1% |
| Guamanian / Chamorro | 203 | 0.9% |
| Honduran | 893 | 4.1% |
| Hungarian | 59 | 0.3% |
| Indian (Asian) | 758 | 3.4% |
| Iranian | 104 | 0.5% |
| Iraqi | 234 | 1.1% |
| Irish | 1,043 | 4.7% |
| Italian | 203 | 0.9% |
| Jamaican | 79 | 0.4% |
| Korean | 1,073 | 4.9% |
| Lebanese | 152 | 0.7% |
| Lithuanian | 19 | 0.1% |
| Malaysian | 297 | 1.3% |
| Mexican | 490 | 2.2% |
| Moroccan | 321 | 1.5% |
| Native Hawaiian | 12 | 0.1% |
| Nicaraguan | 46 | 0.2% |
| Norwegian | 67 | 0.3% |
| Pakistani | 34 | 0.2% |
| Palestinian | 54 | 0.2% |
| Panamanian | 15 | 0.1% |
| Pennsylvania German | 7 | 0.0% |
| Peruvian | 209 | 0.9% |
| Polish | 644 | 2.9% |
| Portuguese | 30 | 0.1% |
| Puerto Rican | 299 | 1.4% |
| Romanian | 8 | 0.0% |
| Russian | 48 | 0.2% |
| Salvadoran | 969 | 4.4% |
| Scandinavian | 11 | 0.1% |
| Scotch-Irish | 118 | 0.5% |
| Scottish | 268 | 1.2% |
| Sierra Leonean | 202 | 0.9% |
| Slavic | 8 | 0.0% |
| Slovak | 61 | 0.3% |
| South American | 555 | 2.5% |
| Spaniard | 246 | 1.1% |
| Sri Lankan | 690 | 3.1% |
| Subsaharan African | 1,812 | 8.2% |
| Swedish | 73 | 0.3% |
| Thai | 954 | 4.3% |
| Ukrainian | 11 | 0.1% |
| Uruguayan | 14 | 0.1% |
| Vietnamese | 290 | 1.3% |
| Welsh | 28 | 0.1% |
| West Indian | 232 | 1.1% |
| Zimbabwean | 50 | 0.2% | View All 79 Rows |
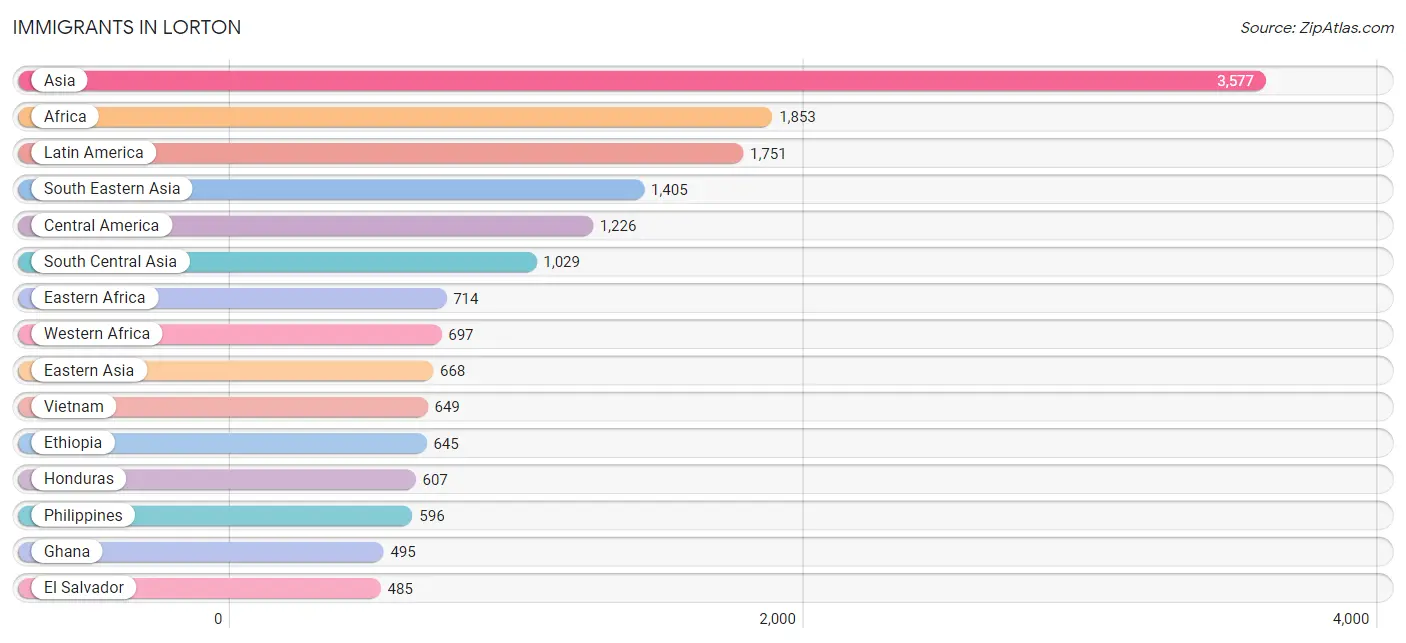
Immigrants in Lorton
The most numerous immigrant groups reported in Lorton came from Asia (3,577 | 16.2%), Africa (1,853 | 8.4%), Latin America (1,751 | 7.9%), South Eastern Asia (1,405 | 6.4%), and Central America (1,226 | 5.6%), together accounting for 44.5% of all Lorton residents.
| Immigration Origin | # Population | % Population |
| Afghanistan | 113 | 0.5% |
| Africa | 1,853 | 8.4% |
| Asia | 3,577 | 16.2% |
| Australia | 20 | 0.1% |
| Bangladesh | 280 | 1.3% |
| Bolivia | 177 | 0.8% |
| Brazil | 14 | 0.1% |
| Canada | 15 | 0.1% |
| Caribbean | 106 | 0.5% |
| Central America | 1,226 | 5.6% |
| Chile | 66 | 0.3% |
| China | 356 | 1.6% |
| Dominican Republic | 46 | 0.2% |
| Eastern Africa | 714 | 3.2% |
| Eastern Asia | 668 | 3.0% |
| Eastern Europe | 31 | 0.1% |
| Egypt | 118 | 0.5% |
| El Salvador | 485 | 2.2% |
| Eritrea | 69 | 0.3% |
| Ethiopia | 645 | 2.9% |
| Europe | 305 | 1.4% |
| France | 3 | 0.0% |
| Germany | 49 | 0.2% |
| Ghana | 495 | 2.2% |
| Honduras | 607 | 2.8% |
| India | 413 | 1.9% |
| Iran | 50 | 0.2% |
| Iraq | 261 | 1.2% |
| Japan | 17 | 0.1% |
| Jordan | 5 | 0.0% |
| Kazakhstan | 8 | 0.0% |
| Korea | 295 | 1.3% |
| Laos | 142 | 0.6% |
| Latin America | 1,751 | 7.9% |
| Lebanon | 49 | 0.2% |
| Malaysia | 18 | 0.1% |
| Mexico | 88 | 0.4% |
| Morocco | 97 | 0.4% |
| Nepal | 37 | 0.2% |
| Nicaragua | 46 | 0.2% |
| Northern Africa | 344 | 1.6% |
| Northern Europe | 222 | 1.0% |
| Oceania | 20 | 0.1% |
| Pakistan | 128 | 0.6% |
| Peru | 148 | 0.7% |
| Philippines | 596 | 2.7% |
| Romania | 8 | 0.0% |
| Russia | 23 | 0.1% |
| Saudi Arabia | 141 | 0.6% |
| Sierra Leone | 202 | 0.9% |
| South Africa | 16 | 0.1% |
| South America | 419 | 1.9% |
| South Central Asia | 1,029 | 4.7% |
| South Eastern Asia | 1,405 | 6.4% |
| Sudan | 23 | 0.1% |
| Taiwan | 61 | 0.3% |
| Trinidad and Tobago | 60 | 0.3% |
| Uruguay | 14 | 0.1% |
| Vietnam | 649 | 2.9% |
| Western Africa | 697 | 3.2% |
| Western Asia | 456 | 2.1% |
| Western Europe | 52 | 0.2% | View All 62 Rows |
Sex and Age in Lorton
Sex and Age in Lorton
The most populous age groups in Lorton are 45 to 49 Years (963 | 9.3%) for men and 10 to 14 Years (1,398 | 12.0%) for women.
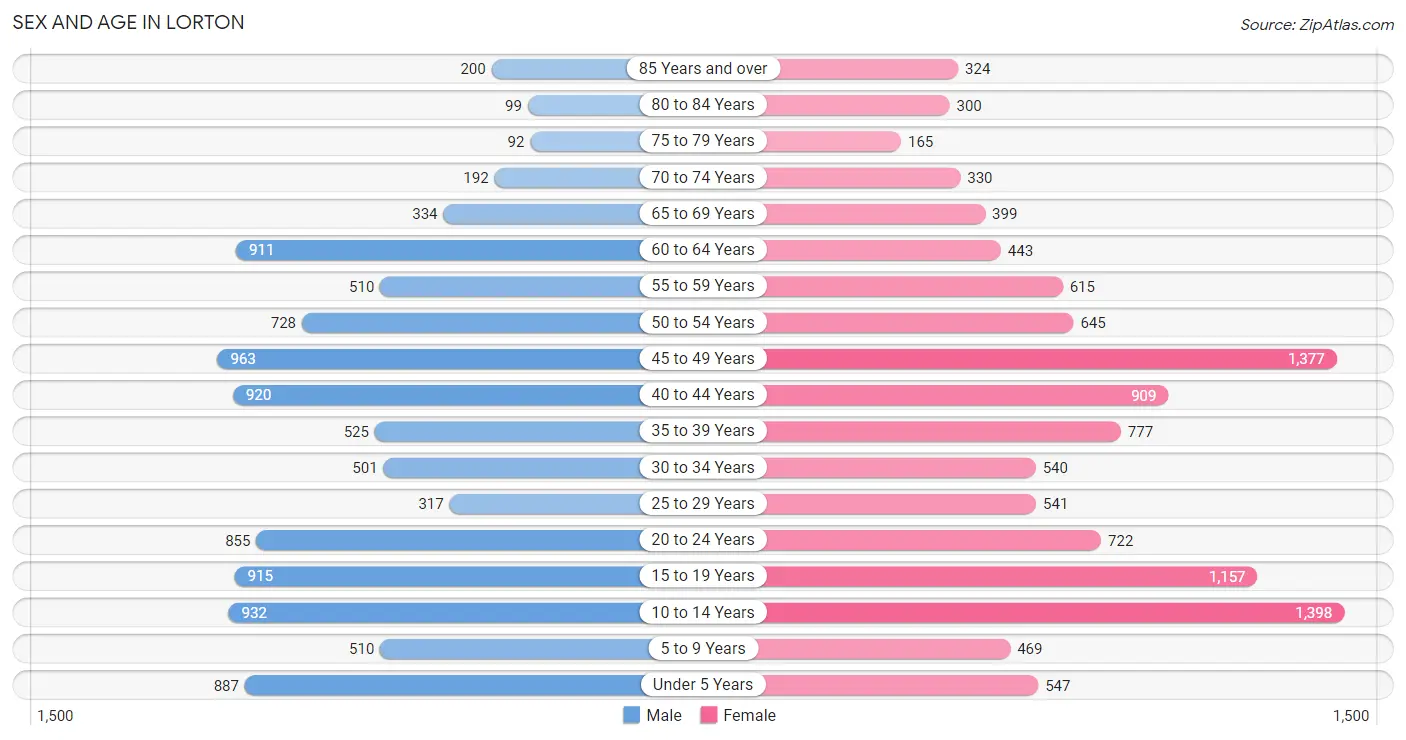
| Age Bracket | Male | Female |
| Under 5 Years | 887 (8.5%) | 547 (4.7%) |
| 5 to 9 Years | 510 (4.9%) | 469 (4.0%) |
| 10 to 14 Years | 932 (9.0%) | 1,398 (12.0%) |
| 15 to 19 Years | 915 (8.8%) | 1,157 (9.9%) |
| 20 to 24 Years | 855 (8.2%) | 722 (6.2%) |
| 25 to 29 Years | 317 (3.0%) | 541 (4.6%) |
| 30 to 34 Years | 501 (4.8%) | 540 (4.6%) |
| 35 to 39 Years | 525 (5.1%) | 777 (6.7%) |
| 40 to 44 Years | 920 (8.8%) | 909 (7.8%) |
| 45 to 49 Years | 963 (9.3%) | 1,377 (11.8%) |
| 50 to 54 Years | 728 (7.0%) | 645 (5.5%) |
| 55 to 59 Years | 510 (4.9%) | 615 (5.3%) |
| 60 to 64 Years | 911 (8.8%) | 443 (3.8%) |
| 65 to 69 Years | 334 (3.2%) | 399 (3.4%) |
| 70 to 74 Years | 192 (1.8%) | 330 (2.8%) |
| 75 to 79 Years | 92 (0.9%) | 165 (1.4%) |
| 80 to 84 Years | 99 (0.9%) | 300 (2.6%) |
| 85 Years and over | 200 (1.9%) | 324 (2.8%) |
| Total | 10,391 (100.0%) | 11,658 (100.0%) |
Families and Households in Lorton
Median Family Size in Lorton
The median family size in Lorton is 3.74 persons per family, with married-couple families (4,271 | 80.7%) accounting for the largest median family size of 3.79 persons per family. On the other hand, single male/father families (275 | 5.2%) represent the smallest median family size with 3.49 persons per family.
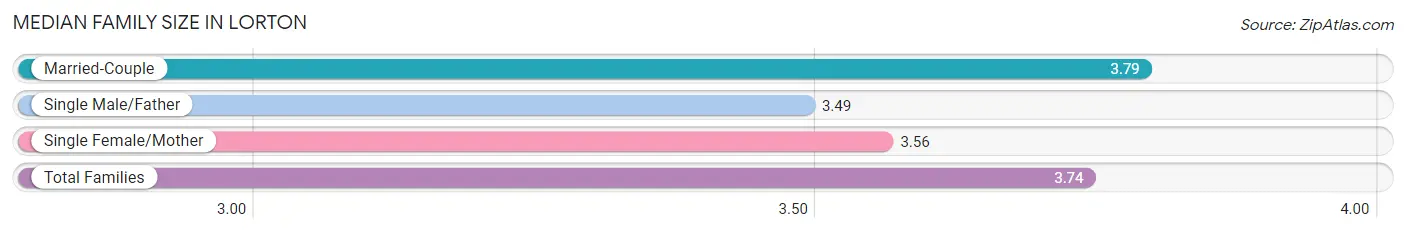
| Family Type | # Families | Family Size |
| Married-Couple | 4,271 (80.7%) | 3.79 |
| Single Male/Father | 275 (5.2%) | 3.49 |
| Single Female/Mother | 746 (14.1%) | 3.56 |
| Total Families | 5,292 (100.0%) | 3.74 |
Median Household Size in Lorton
The median household size in Lorton is 3.24 persons per household, with single male/father households (275 | 4.1%) accounting for the largest median household size of 4.09 persons per household. non-family households (1,481 | 21.9%) represent the smallest median household size with 1.19 persons per household.
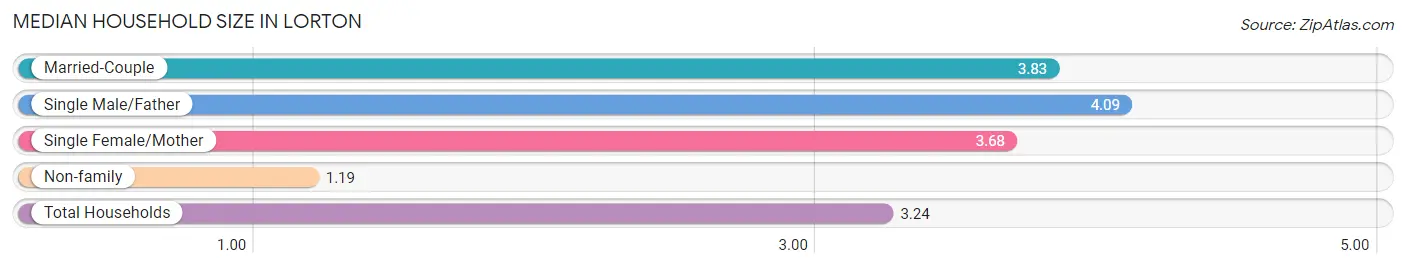
| Household Type | # Households | Household Size |
| Married-Couple | 4,271 (63.1%) | 3.83 |
| Single Male/Father | 275 (4.1%) | 4.09 |
| Single Female/Mother | 746 (11.0%) | 3.68 |
| Non-family | 1,481 (21.9%) | 1.19 |
| Total Households | 6,773 (100.0%) | 3.24 |
Household Size by Marriage Status in Lorton
Out of a total of 6,773 households in Lorton, 5,292 (78.1%) are family households, while 1,481 (21.9%) are nonfamily households. The most numerous type of family households are 3-person households, comprising 1,405, and the most common type of nonfamily households are 1-person households, comprising 1,249.
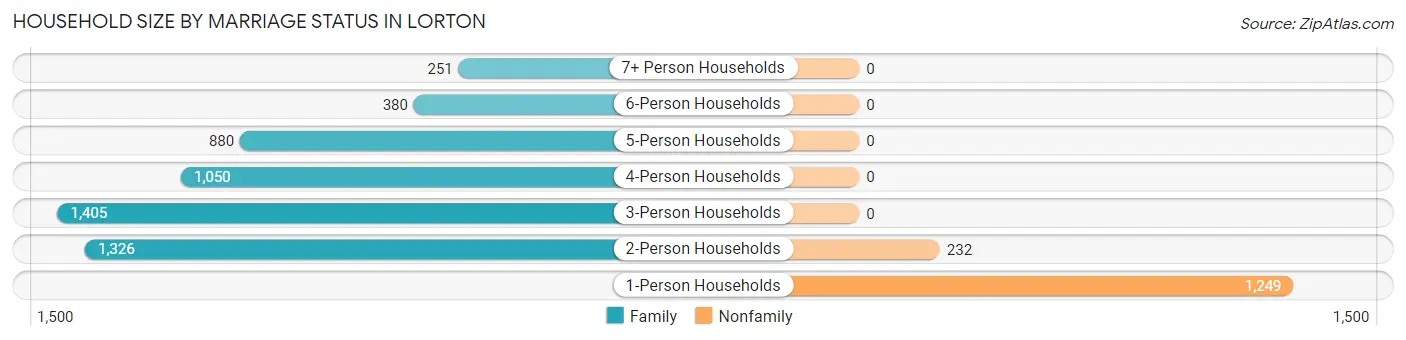
| Household Size | Family Households | Nonfamily Households |
| 1-Person Households | - | 1,249 (18.4%) |
| 2-Person Households | 1,326 (19.6%) | 232 (3.4%) |
| 3-Person Households | 1,405 (20.7%) | 0 (0.0%) |
| 4-Person Households | 1,050 (15.5%) | 0 (0.0%) |
| 5-Person Households | 880 (13.0%) | 0 (0.0%) |
| 6-Person Households | 380 (5.6%) | 0 (0.0%) |
| 7+ Person Households | 251 (3.7%) | 0 (0.0%) |
| Total | 5,292 (78.1%) | 1,481 (21.9%) |
Female Fertility in Lorton
Fertility by Age in Lorton
Average fertility rate in Lorton is 23.0 births per 1,000 women. Women in the age bracket of 35 to 50 years have the highest fertility rate with 40.0 births per 1,000 women. Women in the age bracket of 35 to 50 years acount for 88.9% of all women with births.
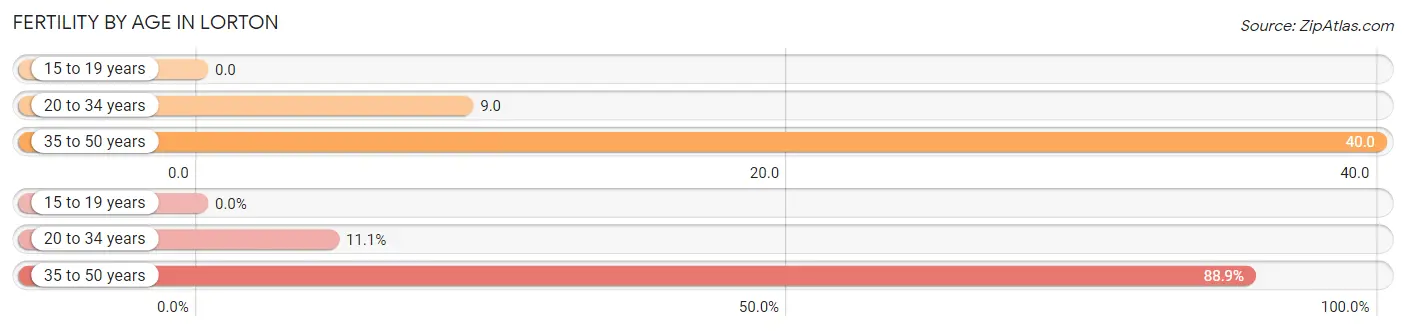
| Age Bracket | Women with Births | Births / 1,000 Women |
| 15 to 19 years | 0 (0.0%) | 0.0 |
| 20 to 34 years | 16 (11.1%) | 9.0 |
| 35 to 50 years | 128 (88.9%) | 40.0 |
| Total | 144 (100.0%) | 23.0 |
Fertility by Age by Marriage Status in Lorton
84.0% of women with births (144) in Lorton are married. The highest percentage of unmarried women with births falls into 35 to 50 years age bracket with 18.0% of them unmarried at the time of birth, while the lowest percentage of unmarried women with births belong to 20 to 34 years age bracket with 0.0% of them unmarried.
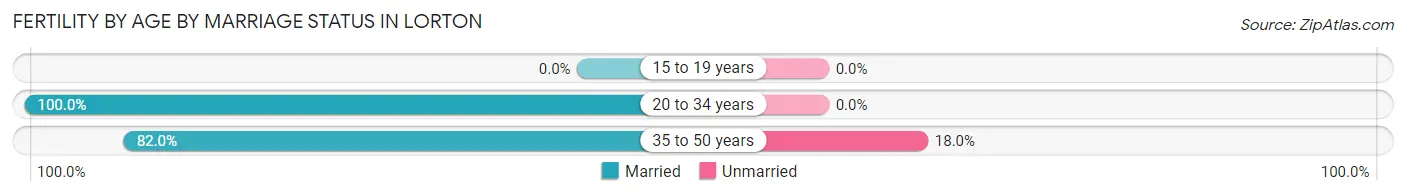
| Age Bracket | Married | Unmarried |
| 15 to 19 years | 0 (0.0%) | 0 (0.0%) |
| 20 to 34 years | 16 (100.0%) | 0 (0.0%) |
| 35 to 50 years | 105 (82.0%) | 23 (18.0%) |
| Total | 121 (84.0%) | 23 (16.0%) |
Fertility by Education in Lorton
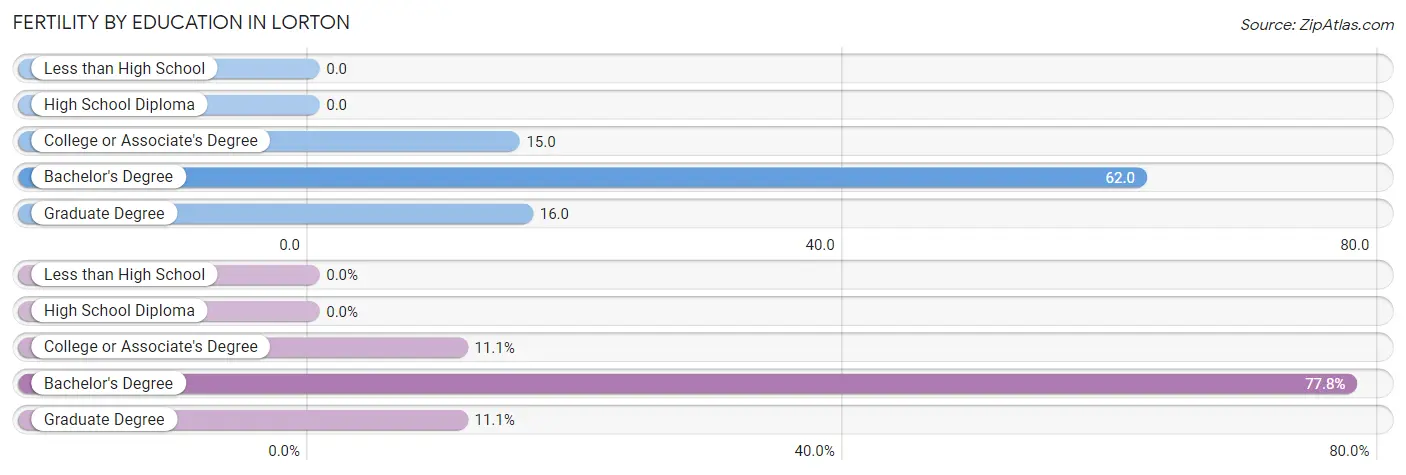
| Educational Attainment | Women with Births | Births / 1,000 Women |
| Less than High School | 0 (0.0%) | 0.0 |
| High School Diploma | 0 (0.0%) | 0.0 |
| College or Associate's Degree | 16 (11.1%) | 15.0 |
| Bachelor's Degree | 112 (77.8%) | 62.0 |
| Graduate Degree | 16 (11.1%) | 16.0 |
| Total | 144 (100.0%) | 23.0 |
Fertility by Education by Marriage Status in Lorton
16.0% of women with births in Lorton are unmarried. Women with the educational attainment of college or associate's degree are most likely to be married with 100.0% of them married at childbirth, while women with the educational attainment of bachelor's degree are least likely to be married with 20.5% of them unmarried at childbirth.
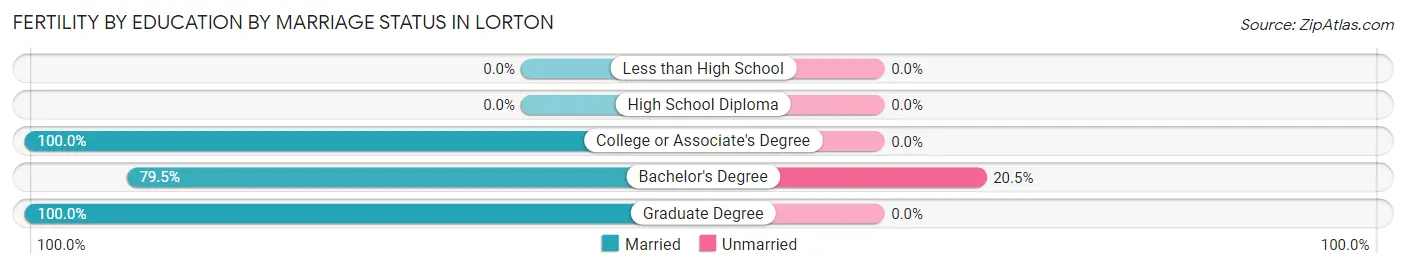
| Educational Attainment | Married | Unmarried |
| Less than High School | 0 (0.0%) | 0 (0.0%) |
| High School Diploma | 0 (0.0%) | 0 (0.0%) |
| College or Associate's Degree | 16 (100.0%) | 0 (0.0%) |
| Bachelor's Degree | 89 (79.5%) | 23 (20.5%) |
| Graduate Degree | 16 (100.0%) | 0 (0.0%) |
| Total | 121 (84.0%) | 23 (16.0%) |
Employment Characteristics in Lorton
Employment by Class of Employer in Lorton
Among the 11,060 employed individuals in Lorton, private company employees (5,654 | 51.1%), federal government employees (2,790 | 25.2%), and local government employees (908 | 8.2%) make up the most common classes of employment.
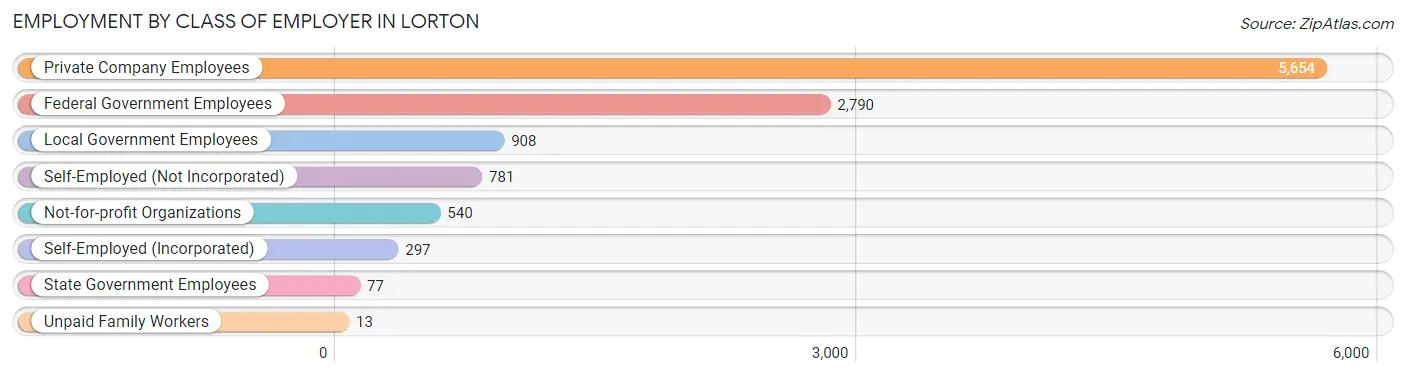
| Employer Class | # Employees | % Employees |
| Private Company Employees | 5,654 | 51.1% |
| Self-Employed (Incorporated) | 297 | 2.7% |
| Self-Employed (Not Incorporated) | 781 | 7.1% |
| Not-for-profit Organizations | 540 | 4.9% |
| Local Government Employees | 908 | 8.2% |
| State Government Employees | 77 | 0.7% |
| Federal Government Employees | 2,790 | 25.2% |
| Unpaid Family Workers | 13 | 0.1% |
| Total | 11,060 | 100.0% |
Employment Status by Age in Lorton
According to the labor force statistics for Lorton, out of the total population over 16 years of age (16,763), 70.2% or 11,768 individuals are in the labor force, with 4.9% or 577 of them unemployed. The age group with the highest labor force participation rate is 55 to 59 years, with 88.9% or 1,000 individuals in the labor force. Within the labor force, the 16 to 19 years age range has the highest percentage of unemployed individuals, with 24.9% or 155 of them being unemployed.
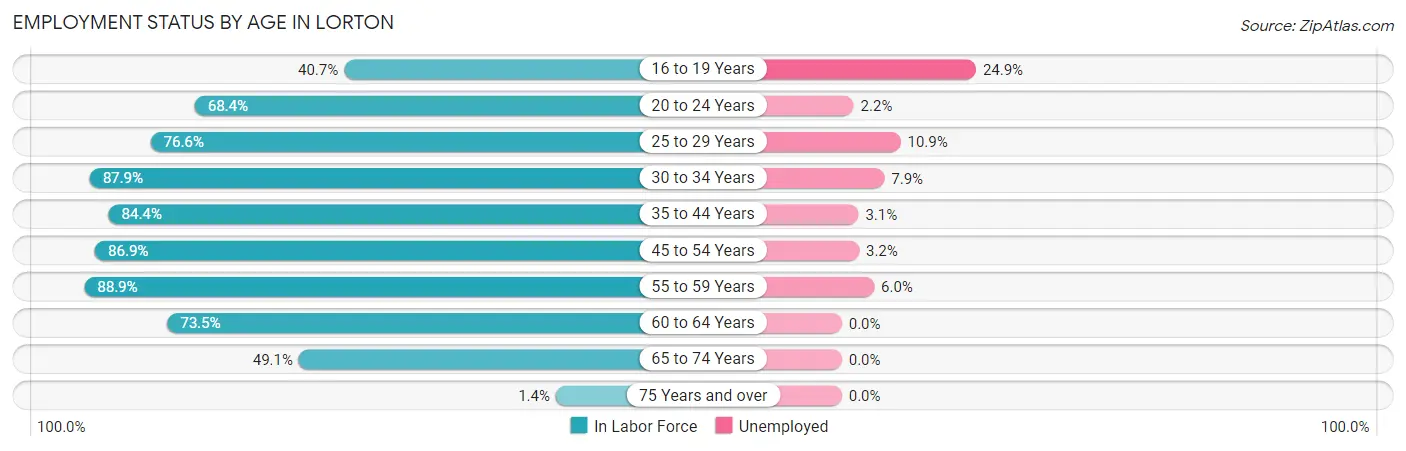
| Age Bracket | In Labor Force | Unemployed |
| 16 to 19 Years | 622 (40.7%) | 155 (24.9%) |
| 20 to 24 Years | 1,079 (68.4%) | 24 (2.2%) |
| 25 to 29 Years | 657 (76.6%) | 72 (10.9%) |
| 30 to 34 Years | 915 (87.9%) | 72 (7.9%) |
| 35 to 44 Years | 2,643 (84.4%) | 82 (3.1%) |
| 45 to 54 Years | 3,227 (86.9%) | 103 (3.2%) |
| 55 to 59 Years | 1,000 (88.9%) | 60 (6.0%) |
| 60 to 64 Years | 995 (73.5%) | 0 (0.0%) |
| 65 to 74 Years | 616 (49.1%) | 0 (0.0%) |
| 75 Years and over | 17 (1.4%) | 0 (0.0%) |
| Total | 11,768 (70.2%) | 577 (4.9%) |
Employment Status by Educational Attainment in Lorton
According to labor force statistics for Lorton, 84.1% of individuals (9,438) out of the total population between 25 and 64 years of age (11,222) are in the labor force, with 4.2% or 396 of them being unemployed. The group with the highest labor force participation rate are those with the educational attainment of bachelor's degree or higher, with 87.3% or 5,520 individuals in the labor force. Within the labor force, individuals with less than high school education have the highest percentage of unemployment, with 17.1% or 84 of them being unemployed.
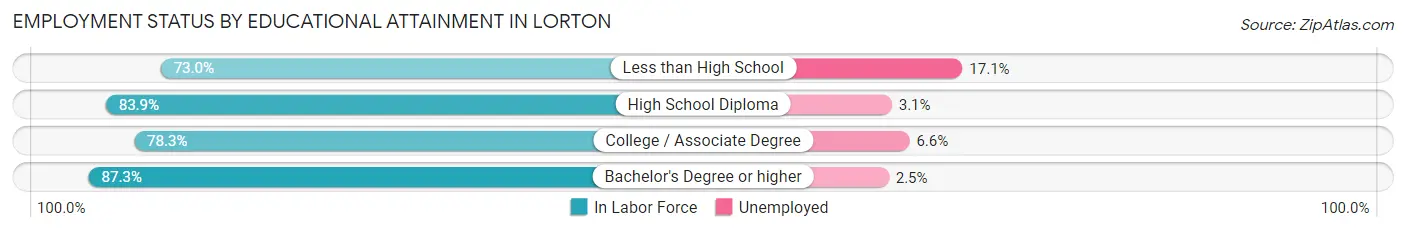
| Educational Attainment | In Labor Force | Unemployed |
| Less than High School | 492 (73.0%) | 115 (17.1%) |
| High School Diploma | 1,766 (83.9%) | 65 (3.1%) |
| College / Associate Degree | 1,660 (78.3%) | 140 (6.6%) |
| Bachelor's Degree or higher | 5,520 (87.3%) | 158 (2.5%) |
| Total | 9,438 (84.1%) | 471 (4.2%) |
Employment Occupations by Sex in Lorton
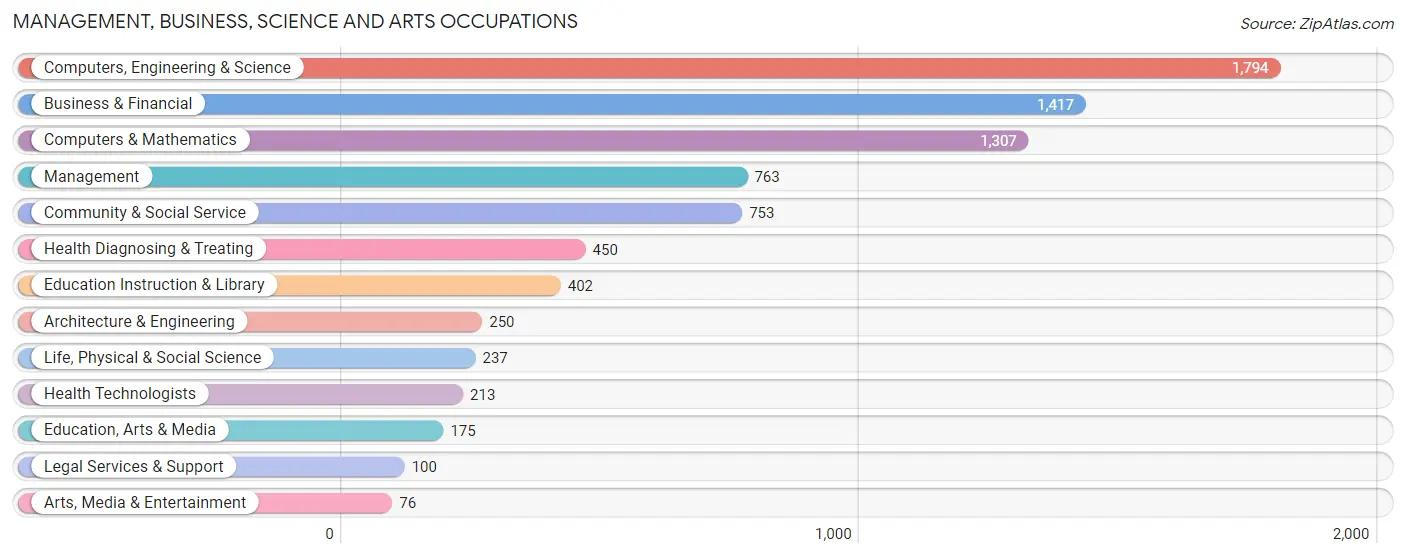
Management, Business, Science and Arts Occupations
The most common Management, Business, Science and Arts occupations in Lorton are Computers, Engineering & Science (1,794 | 16.9%), Business & Financial (1,417 | 13.4%), Computers & Mathematics (1,307 | 12.3%), Management (763 | 7.2%), and Community & Social Service (753 | 7.1%).
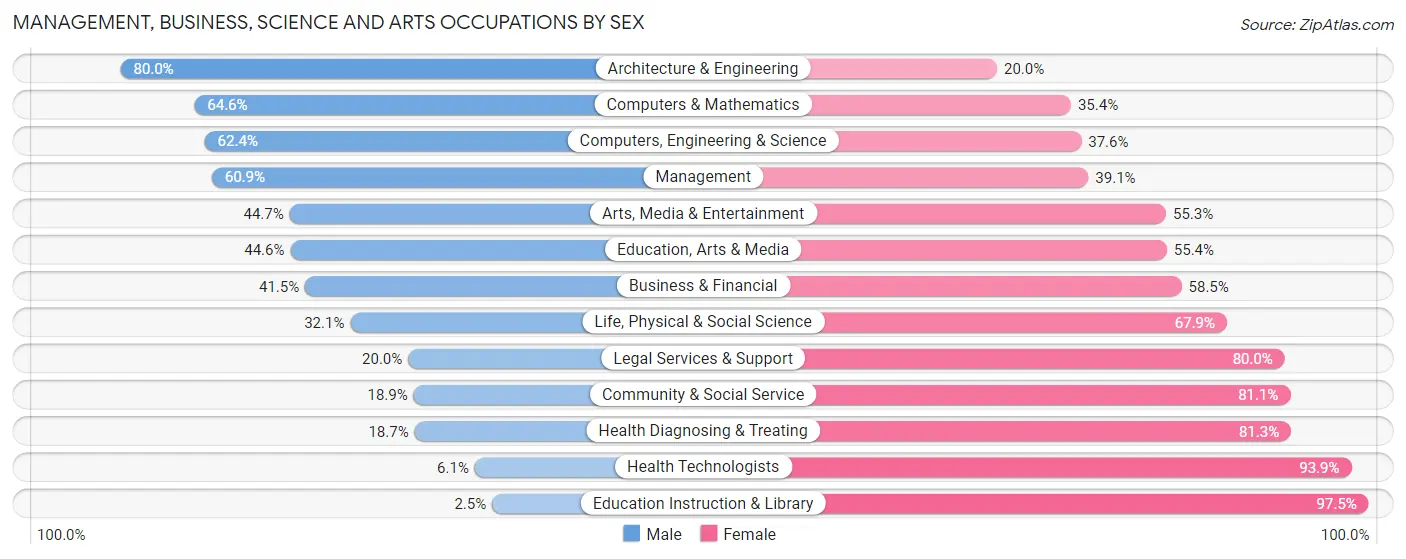
Management, Business, Science and Arts Occupations by Sex
Within the Management, Business, Science and Arts occupations in Lorton, the most male-oriented occupations are Architecture & Engineering (80.0%), Computers & Mathematics (64.6%), and Computers, Engineering & Science (62.4%), while the most female-oriented occupations are Education Instruction & Library (97.5%), Health Technologists (93.9%), and Health Diagnosing & Treating (81.3%).
| Occupation | Male | Female |
| Management | 465 (60.9%) | 298 (39.1%) |
| Business & Financial | 588 (41.5%) | 829 (58.5%) |
| Computers, Engineering & Science | 1,120 (62.4%) | 674 (37.6%) |
| Computers & Mathematics | 844 (64.6%) | 463 (35.4%) |
| Architecture & Engineering | 200 (80.0%) | 50 (20.0%) |
| Life, Physical & Social Science | 76 (32.1%) | 161 (67.9%) |
| Community & Social Service | 142 (18.9%) | 611 (81.1%) |
| Education, Arts & Media | 78 (44.6%) | 97 (55.4%) |
| Legal Services & Support | 20 (20.0%) | 80 (80.0%) |
| Education Instruction & Library | 10 (2.5%) | 392 (97.5%) |
| Arts, Media & Entertainment | 34 (44.7%) | 42 (55.3%) |
| Health Diagnosing & Treating | 84 (18.7%) | 366 (81.3%) |
| Health Technologists | 13 (6.1%) | 200 (93.9%) |
| Total (Category) | 2,399 (46.3%) | 2,778 (53.7%) |
| Total (Overall) | 5,255 (49.6%) | 5,334 (50.4%) |
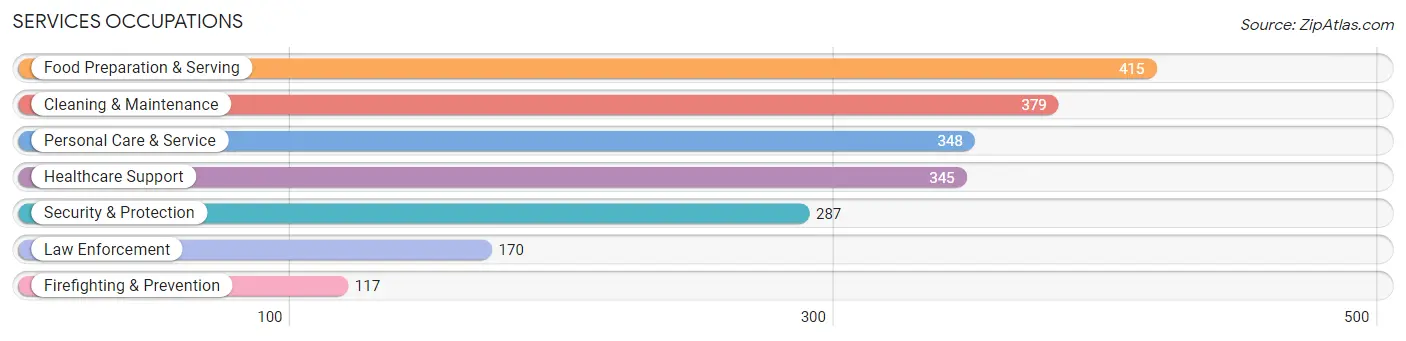
Services Occupations
The most common Services occupations in Lorton are Food Preparation & Serving (415 | 3.9%), Cleaning & Maintenance (379 | 3.6%), Personal Care & Service (348 | 3.3%), Healthcare Support (345 | 3.3%), and Security & Protection (287 | 2.7%).
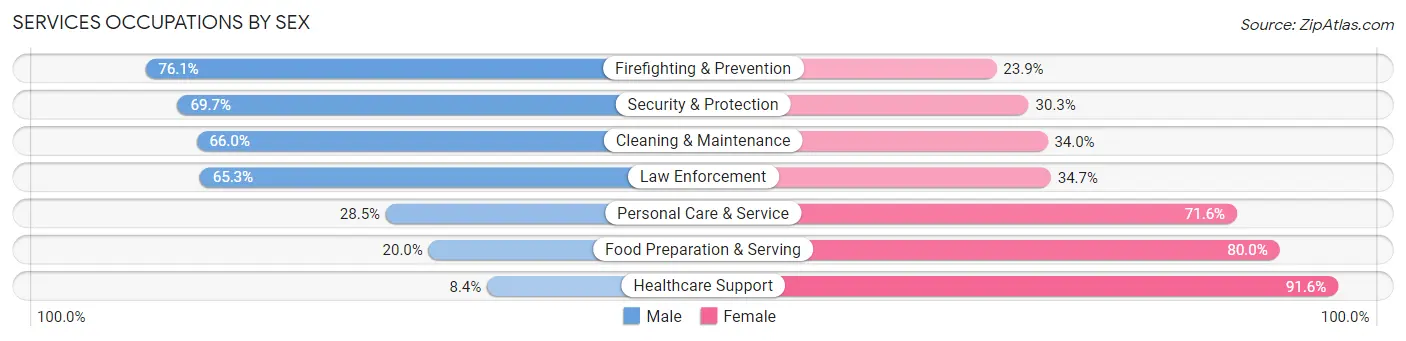
Services Occupations by Sex
Within the Services occupations in Lorton, the most male-oriented occupations are Firefighting & Prevention (76.1%), Security & Protection (69.7%), and Cleaning & Maintenance (66.0%), while the most female-oriented occupations are Healthcare Support (91.6%), Food Preparation & Serving (80.0%), and Personal Care & Service (71.6%).
| Occupation | Male | Female |
| Healthcare Support | 29 (8.4%) | 316 (91.6%) |
| Security & Protection | 200 (69.7%) | 87 (30.3%) |
| Firefighting & Prevention | 89 (76.1%) | 28 (23.9%) |
| Law Enforcement | 111 (65.3%) | 59 (34.7%) |
| Food Preparation & Serving | 83 (20.0%) | 332 (80.0%) |
| Cleaning & Maintenance | 250 (66.0%) | 129 (34.0%) |
| Personal Care & Service | 99 (28.4%) | 249 (71.6%) |
| Total (Category) | 661 (37.3%) | 1,113 (62.7%) |
| Total (Overall) | 5,255 (49.6%) | 5,334 (50.4%) |
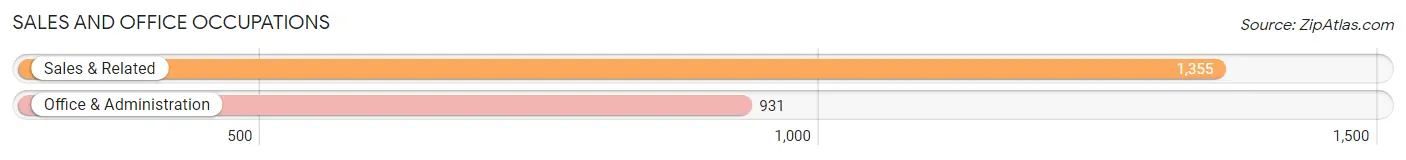
Sales and Office Occupations
The most common Sales and Office occupations in Lorton are Sales & Related (1,355 | 12.8%), and Office & Administration (931 | 8.8%).
Sales and Office Occupations by Sex
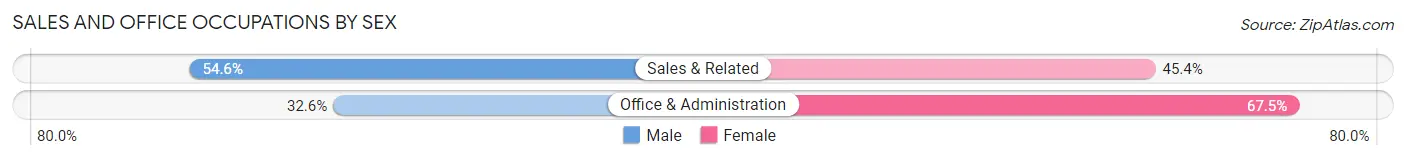
| Occupation | Male | Female |
| Sales & Related | 740 (54.6%) | 615 (45.4%) |
| Office & Administration | 303 (32.6%) | 628 (67.4%) |
| Total (Category) | 1,043 (45.6%) | 1,243 (54.4%) |
| Total (Overall) | 5,255 (49.6%) | 5,334 (50.4%) |
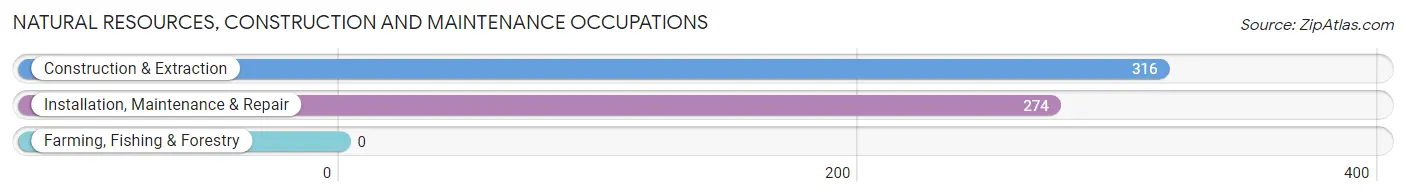
Natural Resources, Construction and Maintenance Occupations
The most common Natural Resources, Construction and Maintenance occupations in Lorton are Construction & Extraction (316 | 3.0%), and Installation, Maintenance & Repair (274 | 2.6%).
Natural Resources, Construction and Maintenance Occupations by Sex
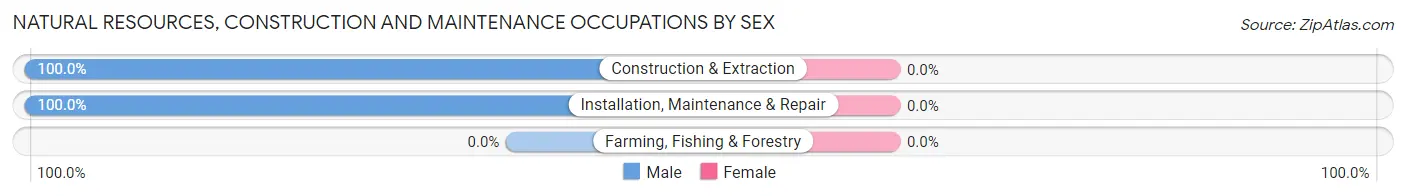
| Occupation | Male | Female |
| Farming, Fishing & Forestry | 0 (0.0%) | 0 (0.0%) |
| Construction & Extraction | 316 (100.0%) | 0 (0.0%) |
| Installation, Maintenance & Repair | 274 (100.0%) | 0 (0.0%) |
| Total (Category) | 590 (100.0%) | 0 (0.0%) |
| Total (Overall) | 5,255 (49.6%) | 5,334 (50.4%) |
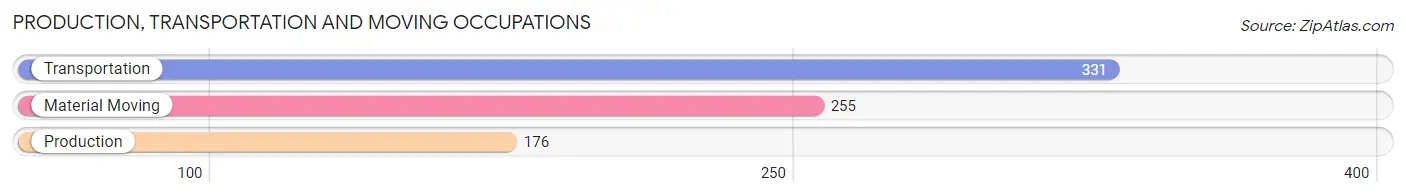
Production, Transportation and Moving Occupations
The most common Production, Transportation and Moving occupations in Lorton are Transportation (331 | 3.1%), Material Moving (255 | 2.4%), and Production (176 | 1.7%).
Production, Transportation and Moving Occupations by Sex
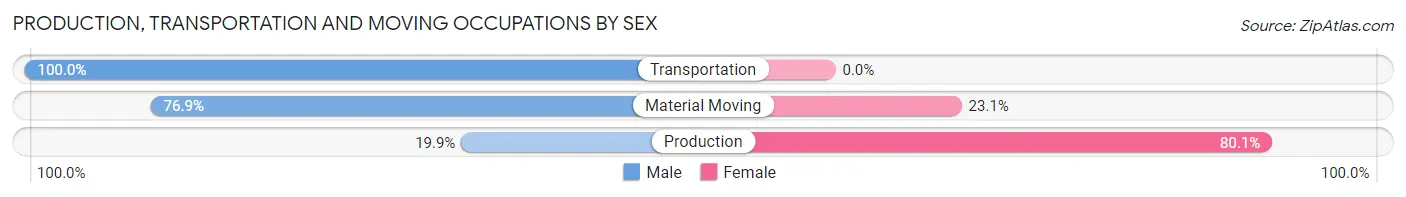
| Occupation | Male | Female |
| Production | 35 (19.9%) | 141 (80.1%) |
| Transportation | 331 (100.0%) | 0 (0.0%) |
| Material Moving | 196 (76.9%) | 59 (23.1%) |
| Total (Category) | 562 (73.8%) | 200 (26.3%) |
| Total (Overall) | 5,255 (49.6%) | 5,334 (50.4%) |
Employment Industries by Sex in Lorton
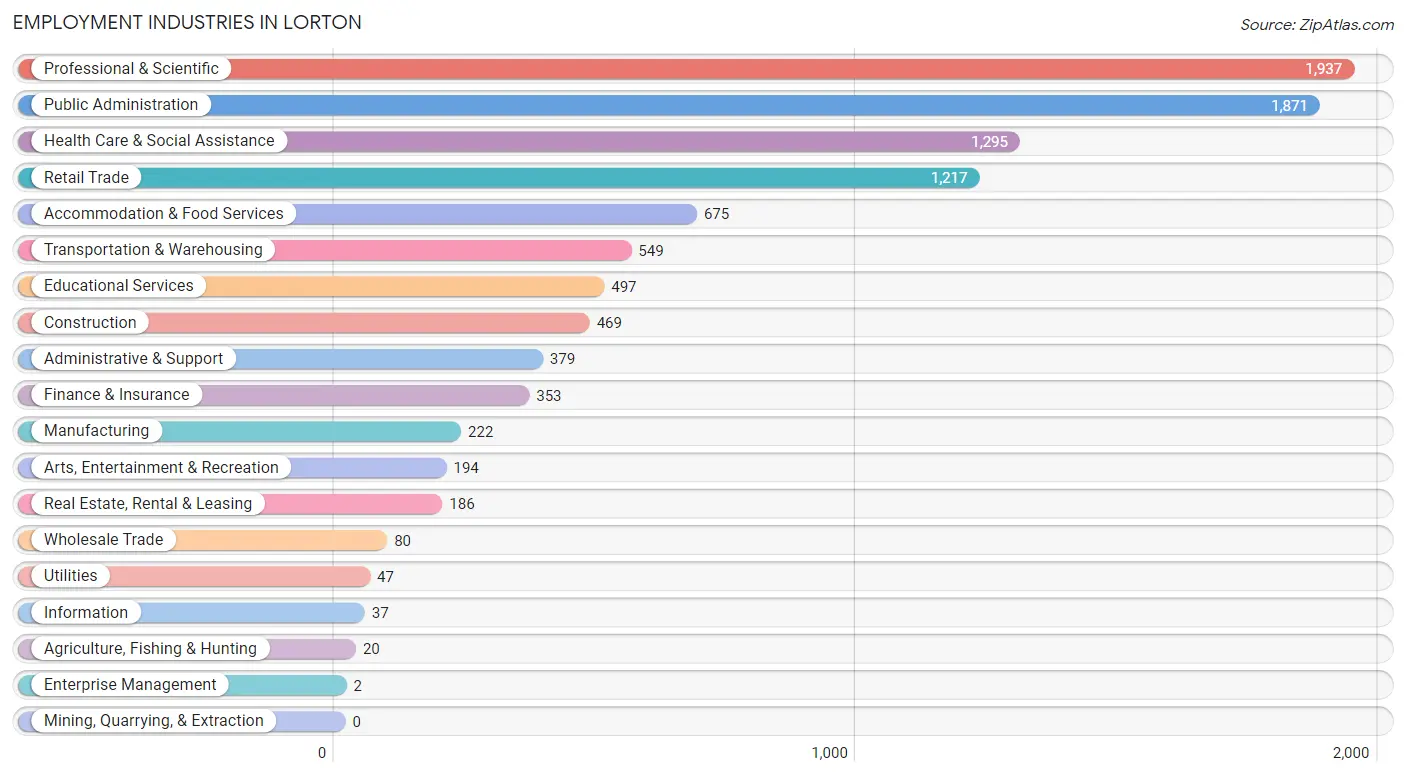
Employment Industries in Lorton
The major employment industries in Lorton include Professional & Scientific (1,937 | 18.3%), Public Administration (1,871 | 17.7%), Health Care & Social Assistance (1,295 | 12.2%), Retail Trade (1,217 | 11.5%), and Accommodation & Food Services (675 | 6.4%).
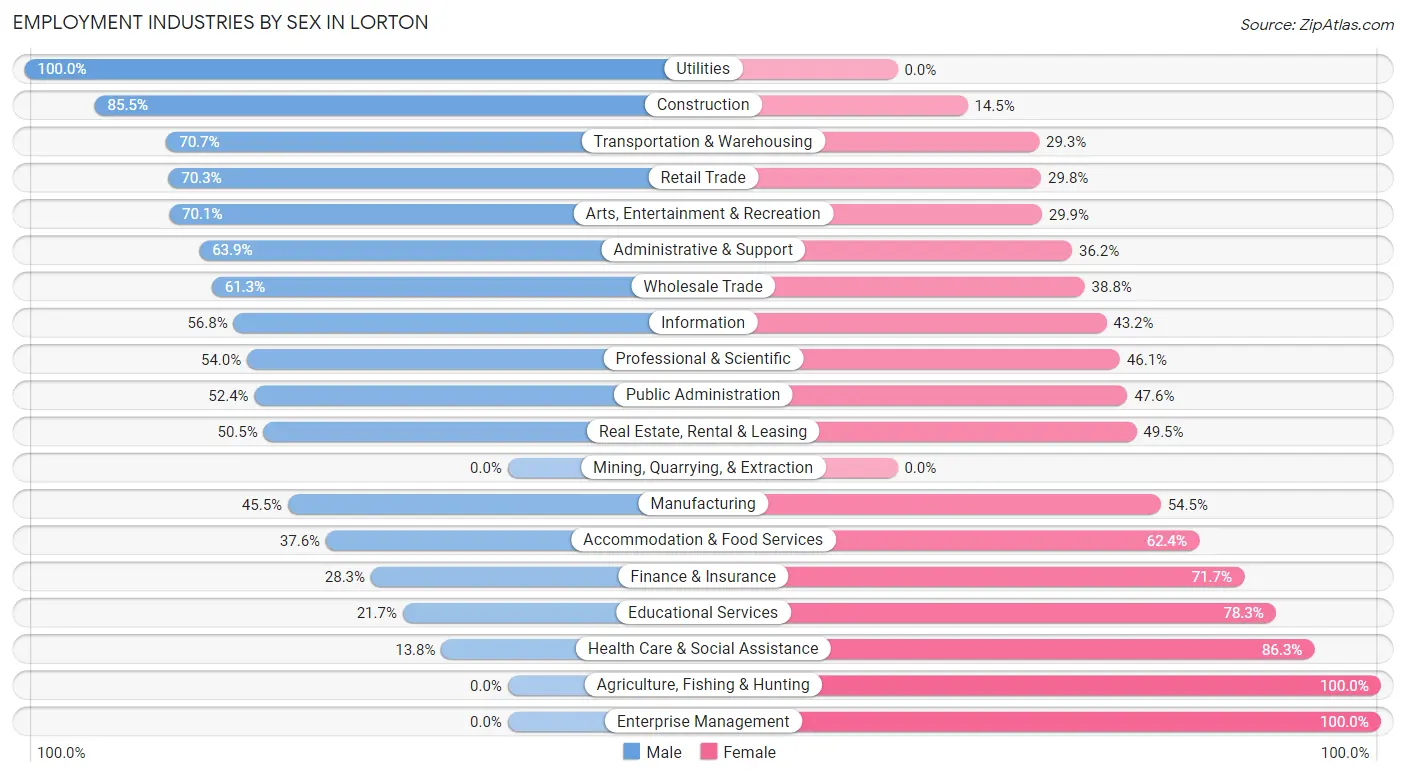
Employment Industries by Sex in Lorton
The Lorton industries that see more men than women are Utilities (100.0%), Construction (85.5%), and Transportation & Warehousing (70.7%), whereas the industries that tend to have a higher number of women are Agriculture, Fishing & Hunting (100.0%), Enterprise Management (100.0%), and Health Care & Social Assistance (86.3%).
| Industry | Male | Female |
| Agriculture, Fishing & Hunting | 0 (0.0%) | 20 (100.0%) |
| Mining, Quarrying, & Extraction | 0 (0.0%) | 0 (0.0%) |
| Construction | 401 (85.5%) | 68 (14.5%) |
| Manufacturing | 101 (45.5%) | 121 (54.5%) |
| Wholesale Trade | 49 (61.3%) | 31 (38.8%) |
| Retail Trade | 855 (70.3%) | 362 (29.7%) |
| Transportation & Warehousing | 388 (70.7%) | 161 (29.3%) |
| Utilities | 47 (100.0%) | 0 (0.0%) |
| Information | 21 (56.8%) | 16 (43.2%) |
| Finance & Insurance | 100 (28.3%) | 253 (71.7%) |
| Real Estate, Rental & Leasing | 94 (50.5%) | 92 (49.5%) |
| Professional & Scientific | 1,045 (53.9%) | 892 (46.1%) |
| Enterprise Management | 0 (0.0%) | 2 (100.0%) |
| Administrative & Support | 242 (63.8%) | 137 (36.1%) |
| Educational Services | 108 (21.7%) | 389 (78.3%) |
| Health Care & Social Assistance | 178 (13.8%) | 1,117 (86.3%) |
| Arts, Entertainment & Recreation | 136 (70.1%) | 58 (29.9%) |
| Accommodation & Food Services | 254 (37.6%) | 421 (62.4%) |
| Public Administration | 981 (52.4%) | 890 (47.6%) |
| Total | 5,255 (49.6%) | 5,334 (50.4%) |
Education in Lorton
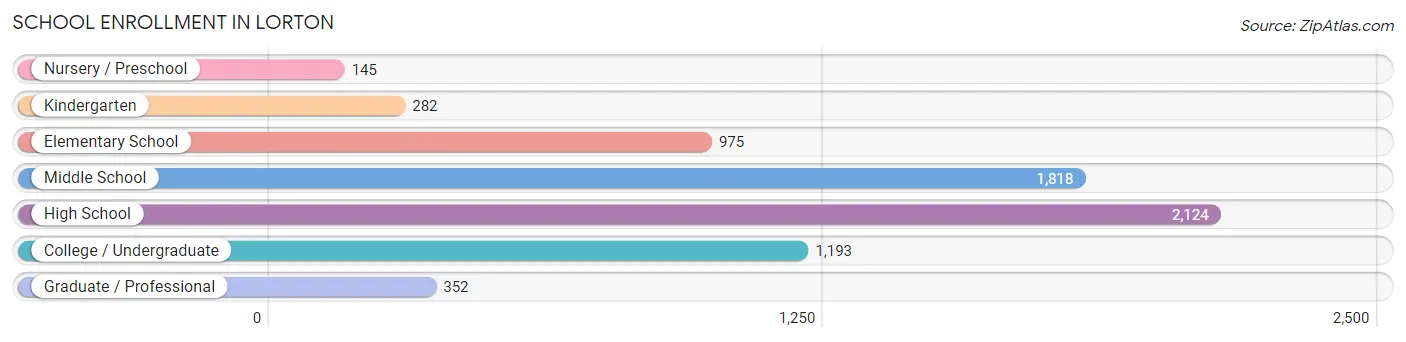
School Enrollment in Lorton
The most common levels of schooling among the 6,889 students in Lorton are high school (2,124 | 30.8%), middle school (1,818 | 26.4%), and college / undergraduate (1,193 | 17.3%).
| School Level | # Students | % Students |
| Nursery / Preschool | 145 | 2.1% |
| Kindergarten | 282 | 4.1% |
| Elementary School | 975 | 14.1% |
| Middle School | 1,818 | 26.4% |
| High School | 2,124 | 30.8% |
| College / Undergraduate | 1,193 | 17.3% |
| Graduate / Professional | 352 | 5.1% |
| Total | 6,889 | 100.0% |
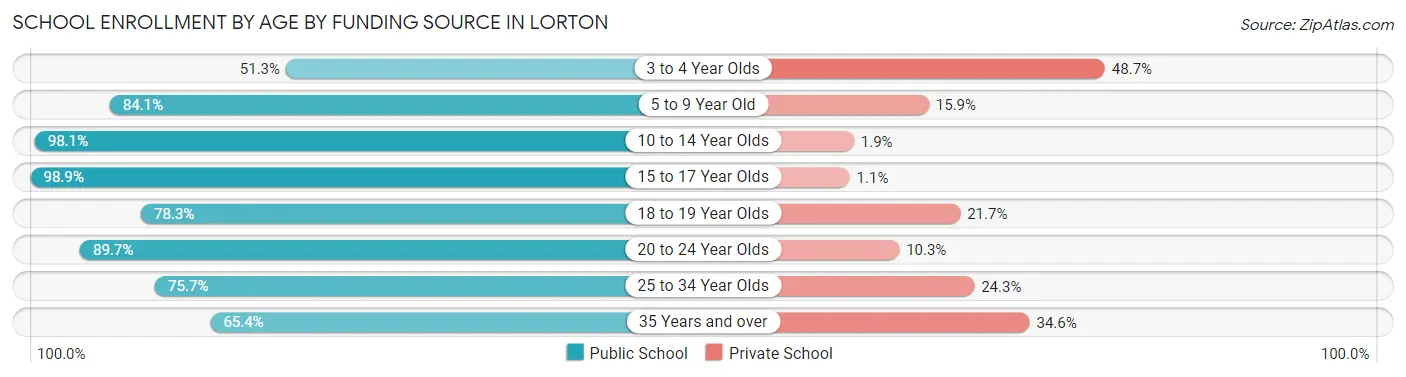
School Enrollment by Age by Funding Source in Lorton
Out of a total of 6,889 students who are enrolled in schools in Lorton, 723 (10.5%) attend a private institution, while the remaining 6,166 (89.5%) are enrolled in public schools. The age group of 3 to 4 year olds has the highest likelihood of being enrolled in private schools, with 109 (48.7% in the age bracket) enrolled. Conversely, the age group of 15 to 17 year olds has the lowest likelihood of being enrolled in a private school, with 1,415 (98.9% in the age bracket) attending a public institution.
| Age Bracket | Public School | Private School |
| 3 to 4 Year Olds | 115 (51.3%) | 109 (48.7%) |
| 5 to 9 Year Old | 806 (84.1%) | 152 (15.9%) |
| 10 to 14 Year Olds | 2,269 (98.1%) | 44 (1.9%) |
| 15 to 17 Year Olds | 1,415 (98.9%) | 16 (1.1%) |
| 18 to 19 Year Olds | 458 (78.3%) | 127 (21.7%) |
| 20 to 24 Year Olds | 624 (89.7%) | 72 (10.3%) |
| 25 to 34 Year Olds | 221 (75.7%) | 71 (24.3%) |
| 35 Years and over | 255 (65.4%) | 135 (34.6%) |
| Total | 6,166 (89.5%) | 723 (10.5%) |
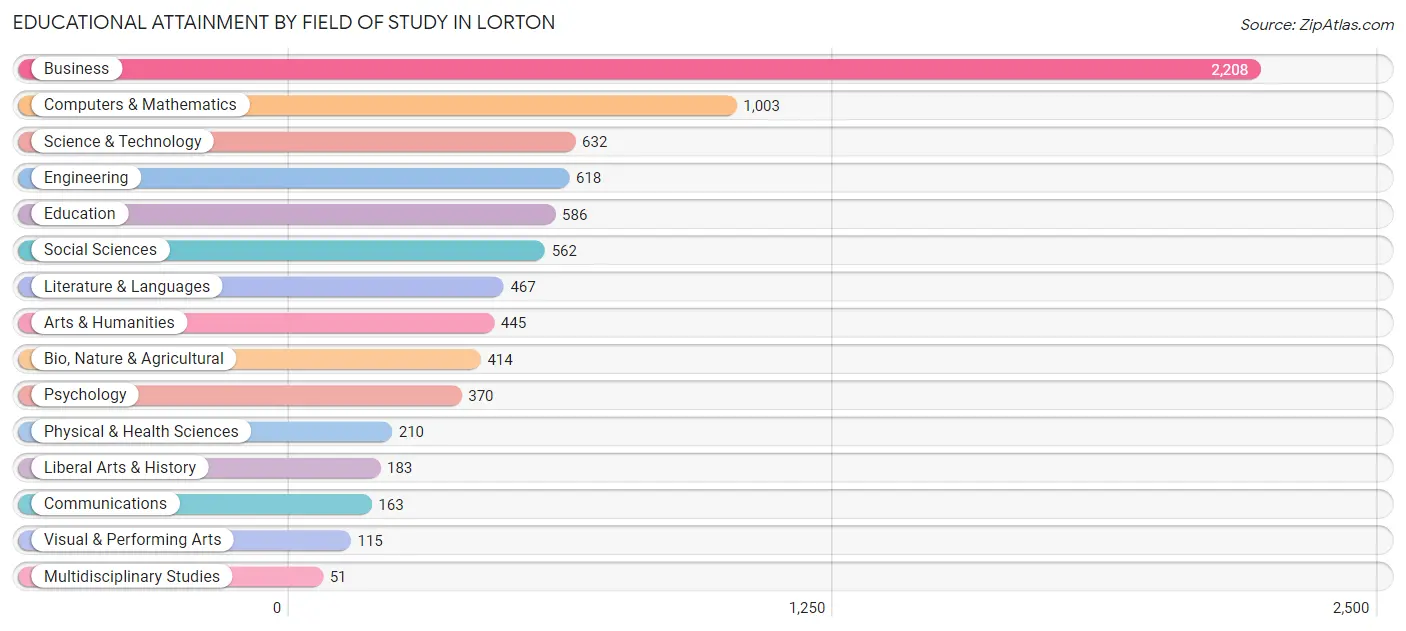
Educational Attainment by Field of Study in Lorton
Business (2,208 | 27.5%), computers & mathematics (1,003 | 12.5%), science & technology (632 | 7.9%), engineering (618 | 7.7%), and education (586 | 7.3%) are the most common fields of study among 8,027 individuals in Lorton who have obtained a bachelor's degree or higher.
| Field of Study | # Graduates | % Graduates |
| Computers & Mathematics | 1,003 | 12.5% |
| Bio, Nature & Agricultural | 414 | 5.2% |
| Physical & Health Sciences | 210 | 2.6% |
| Psychology | 370 | 4.6% |
| Social Sciences | 562 | 7.0% |
| Engineering | 618 | 7.7% |
| Multidisciplinary Studies | 51 | 0.6% |
| Science & Technology | 632 | 7.9% |
| Business | 2,208 | 27.5% |
| Education | 586 | 7.3% |
| Literature & Languages | 467 | 5.8% |
| Liberal Arts & History | 183 | 2.3% |
| Visual & Performing Arts | 115 | 1.4% |
| Communications | 163 | 2.0% |
| Arts & Humanities | 445 | 5.5% |
| Total | 8,027 | 100.0% |
Transportation & Commute in Lorton
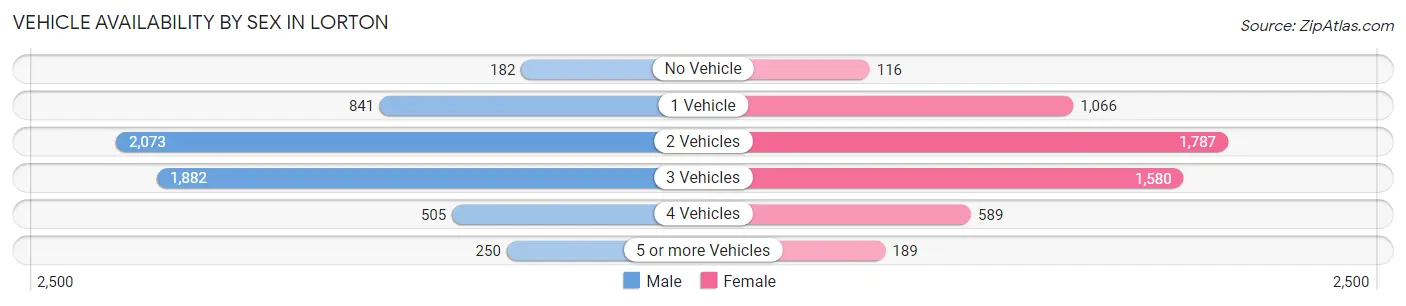
Vehicle Availability by Sex in Lorton
The most prevalent vehicle ownership categories in Lorton are males with 2 vehicles (2,073, accounting for 36.2%) and females with 2 vehicles (1,787, making up 38.9%).
| Vehicles Available | Male | Female |
| No Vehicle | 182 (3.2%) | 116 (2.2%) |
| 1 Vehicle | 841 (14.7%) | 1,066 (20.0%) |
| 2 Vehicles | 2,073 (36.2%) | 1,787 (33.6%) |
| 3 Vehicles | 1,882 (32.8%) | 1,580 (29.7%) |
| 4 Vehicles | 505 (8.8%) | 589 (11.1%) |
| 5 or more Vehicles | 250 (4.4%) | 189 (3.5%) |
| Total | 5,733 (100.0%) | 5,327 (100.0%) |
Commute Time in Lorton
The most frequently occuring commute durations in Lorton are 30 to 34 minutes (1,798 commuters, 19.9%), 60 to 89 minutes (1,314 commuters, 14.5%), and 15 to 19 minutes (1,273 commuters, 14.1%).
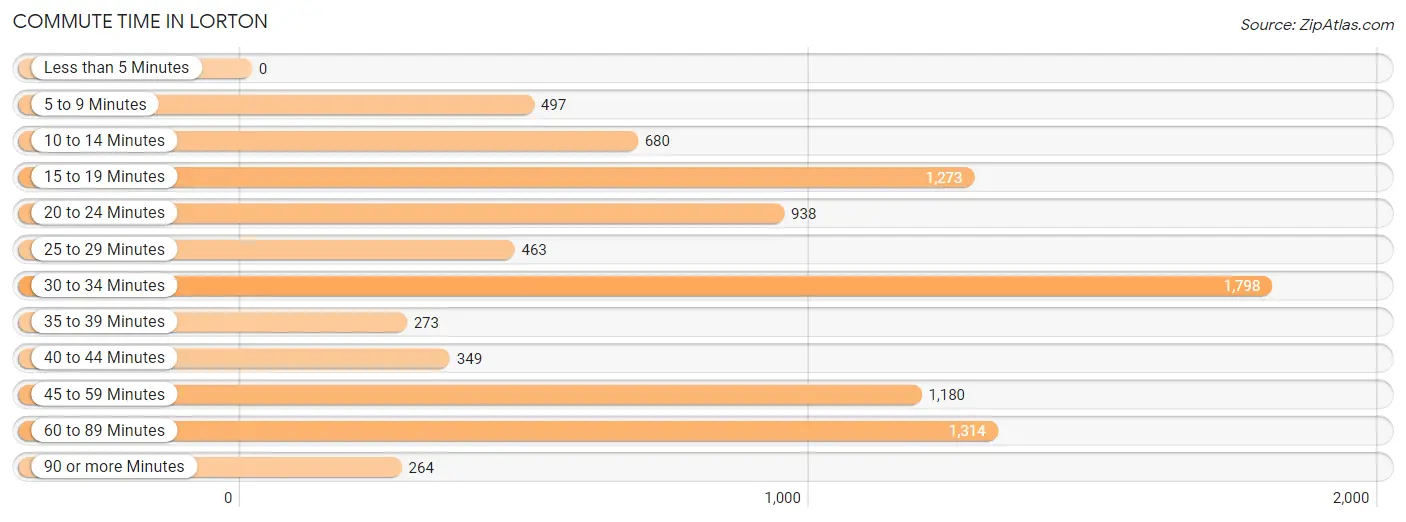
| Commute Time | # Commuters | % Commuters |
| Less than 5 Minutes | 0 | 0.0% |
| 5 to 9 Minutes | 497 | 5.5% |
| 10 to 14 Minutes | 680 | 7.5% |
| 15 to 19 Minutes | 1,273 | 14.1% |
| 20 to 24 Minutes | 938 | 10.4% |
| 25 to 29 Minutes | 463 | 5.1% |
| 30 to 34 Minutes | 1,798 | 19.9% |
| 35 to 39 Minutes | 273 | 3.0% |
| 40 to 44 Minutes | 349 | 3.9% |
| 45 to 59 Minutes | 1,180 | 13.1% |
| 60 to 89 Minutes | 1,314 | 14.5% |
| 90 or more Minutes | 264 | 2.9% |
Commute Time by Sex in Lorton
The most common commute times in Lorton are 60 to 89 minutes (823 commuters, 17.4%) for males and 30 to 34 minutes (1,038 commuters, 24.1%) for females.
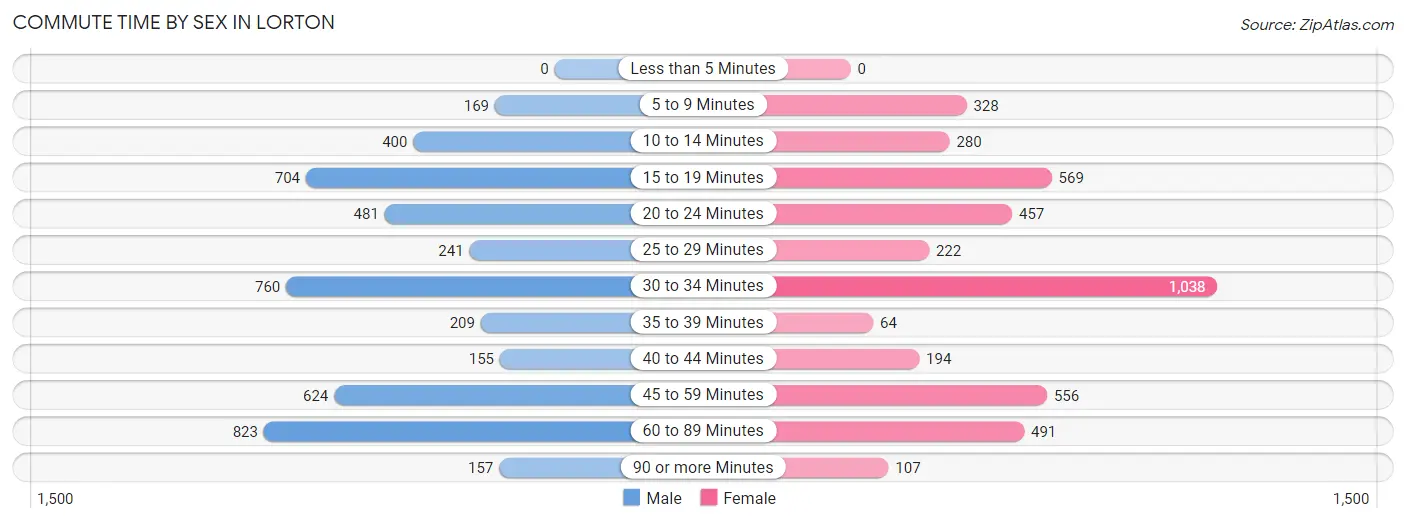
| Commute Time | Male | Female |
| Less than 5 Minutes | 0 (0.0%) | 0 (0.0%) |
| 5 to 9 Minutes | 169 (3.6%) | 328 (7.6%) |
| 10 to 14 Minutes | 400 (8.5%) | 280 (6.5%) |
| 15 to 19 Minutes | 704 (14.9%) | 569 (13.2%) |
| 20 to 24 Minutes | 481 (10.2%) | 457 (10.6%) |
| 25 to 29 Minutes | 241 (5.1%) | 222 (5.2%) |
| 30 to 34 Minutes | 760 (16.1%) | 1,038 (24.1%) |
| 35 to 39 Minutes | 209 (4.4%) | 64 (1.5%) |
| 40 to 44 Minutes | 155 (3.3%) | 194 (4.5%) |
| 45 to 59 Minutes | 624 (13.2%) | 556 (12.9%) |
| 60 to 89 Minutes | 823 (17.4%) | 491 (11.4%) |
| 90 or more Minutes | 157 (3.3%) | 107 (2.5%) |
Time of Departure to Work by Sex in Lorton
The most frequent times of departure to work in Lorton are 7:00 AM to 7:29 AM (768, 16.3%) for males and 8:00 AM to 8:29 AM (846, 19.7%) for females.
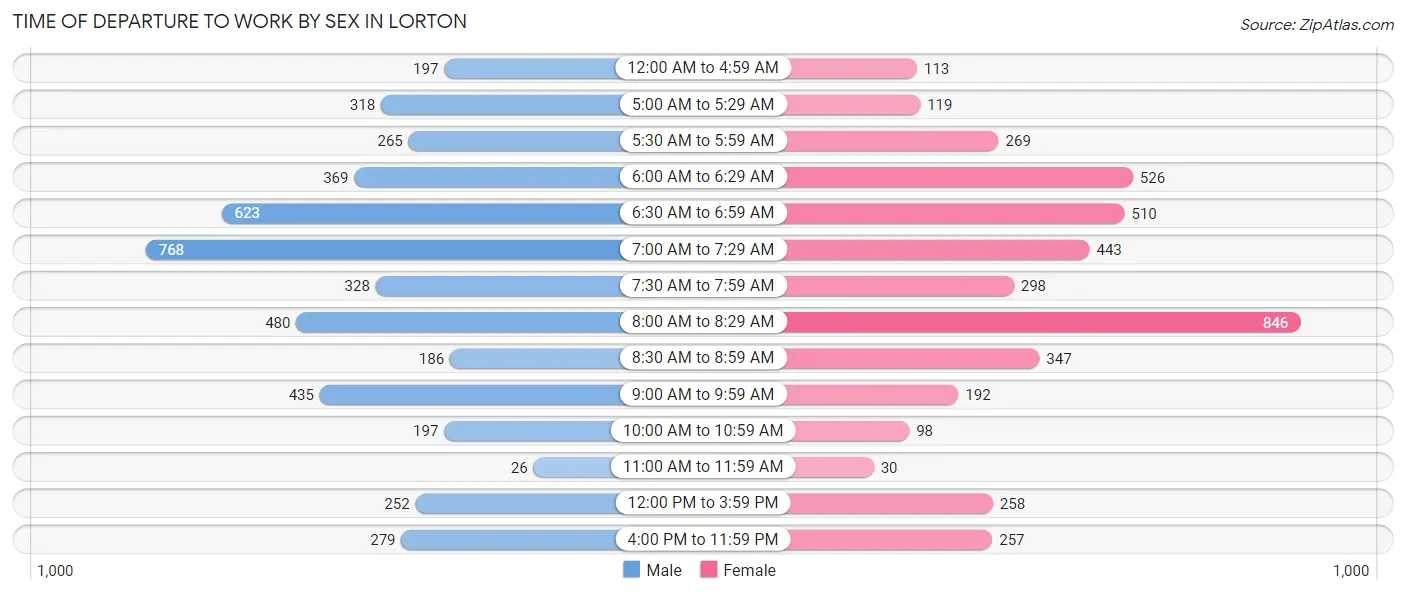
| Time of Departure | Male | Female |
| 12:00 AM to 4:59 AM | 197 (4.2%) | 113 (2.6%) |
| 5:00 AM to 5:29 AM | 318 (6.7%) | 119 (2.8%) |
| 5:30 AM to 5:59 AM | 265 (5.6%) | 269 (6.2%) |
| 6:00 AM to 6:29 AM | 369 (7.8%) | 526 (12.2%) |
| 6:30 AM to 6:59 AM | 623 (13.2%) | 510 (11.8%) |
| 7:00 AM to 7:29 AM | 768 (16.3%) | 443 (10.3%) |
| 7:30 AM to 7:59 AM | 328 (6.9%) | 298 (6.9%) |
| 8:00 AM to 8:29 AM | 480 (10.2%) | 846 (19.7%) |
| 8:30 AM to 8:59 AM | 186 (3.9%) | 347 (8.1%) |
| 9:00 AM to 9:59 AM | 435 (9.2%) | 192 (4.5%) |
| 10:00 AM to 10:59 AM | 197 (4.2%) | 98 (2.3%) |
| 11:00 AM to 11:59 AM | 26 (0.5%) | 30 (0.7%) |
| 12:00 PM to 3:59 PM | 252 (5.3%) | 258 (6.0%) |
| 4:00 PM to 11:59 PM | 279 (5.9%) | 257 (6.0%) |
| Total | 4,723 (100.0%) | 4,306 (100.0%) |
Housing Occupancy in Lorton
Occupancy by Ownership in Lorton
Of the total 6,773 dwellings in Lorton, owner-occupied units account for 4,201 (62.0%), while renter-occupied units make up 2,572 (38.0%).
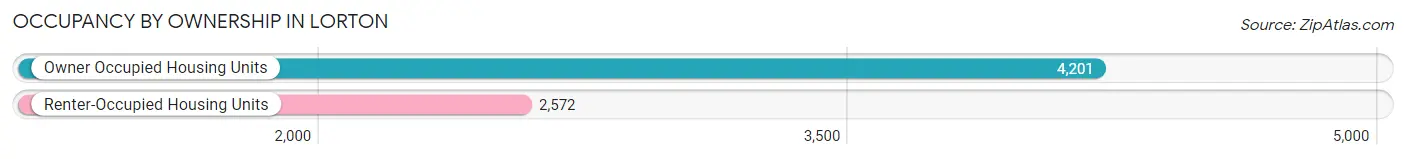
| Occupancy | # Housing Units | % Housing Units |
| Owner Occupied Housing Units | 4,201 | 62.0% |
| Renter-Occupied Housing Units | 2,572 | 38.0% |
| Total Occupied Housing Units | 6,773 | 100.0% |
Occupancy by Household Size in Lorton
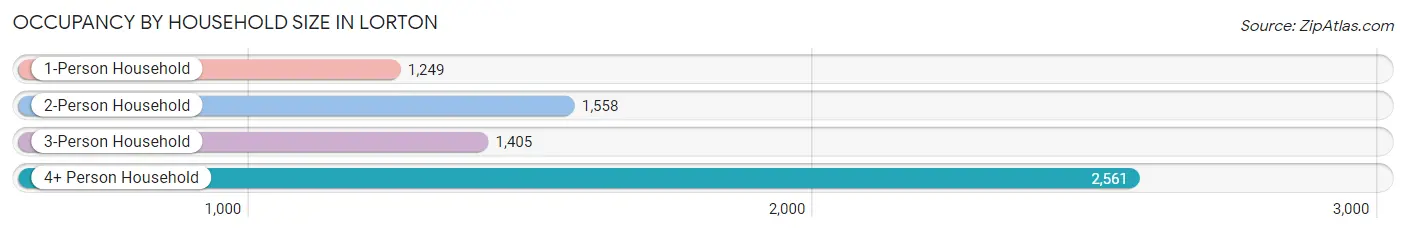
| Household Size | # Housing Units | % Housing Units |
| 1-Person Household | 1,249 | 18.4% |
| 2-Person Household | 1,558 | 23.0% |
| 3-Person Household | 1,405 | 20.7% |
| 4+ Person Household | 2,561 | 37.8% |
| Total Housing Units | 6,773 | 100.0% |
Occupancy by Ownership by Household Size in Lorton
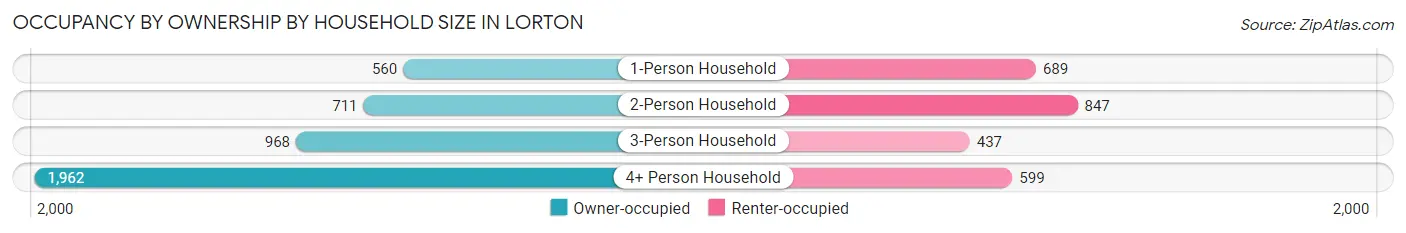
| Household Size | Owner-occupied | Renter-occupied |
| 1-Person Household | 560 (44.8%) | 689 (55.2%) |
| 2-Person Household | 711 (45.6%) | 847 (54.4%) |
| 3-Person Household | 968 (68.9%) | 437 (31.1%) |
| 4+ Person Household | 1,962 (76.6%) | 599 (23.4%) |
| Total Housing Units | 4,201 (62.0%) | 2,572 (38.0%) |
Occupancy by Educational Attainment in Lorton
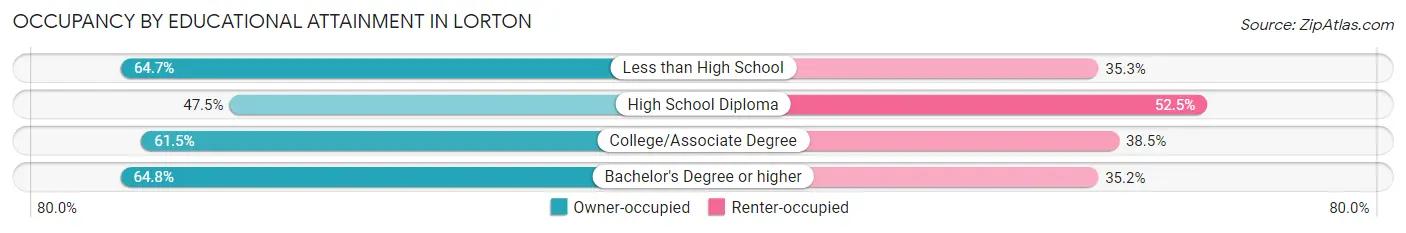
| Household Size | Owner-occupied | Renter-occupied |
| Less than High School | 220 (64.7%) | 120 (35.3%) |
| High School Diploma | 376 (47.5%) | 415 (52.5%) |
| College/Associate Degree | 934 (61.5%) | 585 (38.5%) |
| Bachelor's Degree or higher | 2,671 (64.8%) | 1,452 (35.2%) |
Occupancy by Age of Householder in Lorton
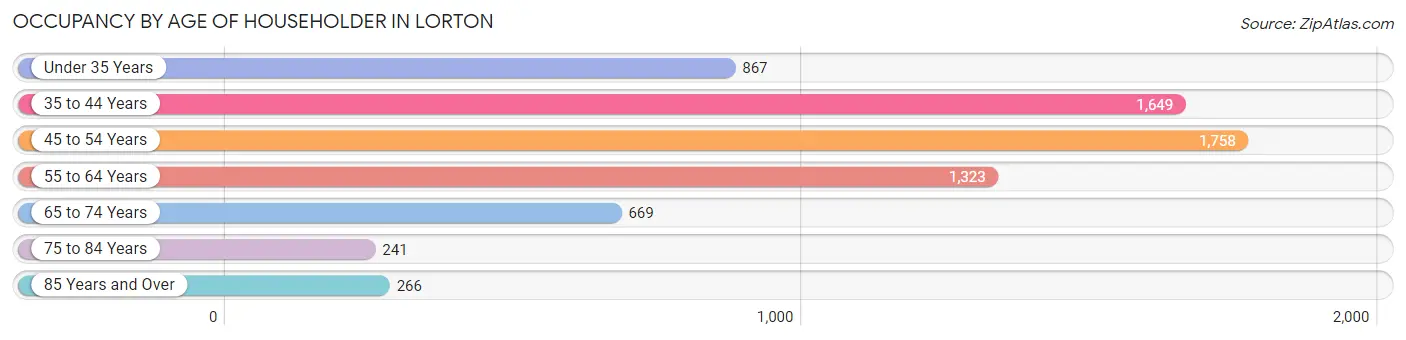
| Age Bracket | # Households | % Households |
| Under 35 Years | 867 | 12.8% |
| 35 to 44 Years | 1,649 | 24.3% |
| 45 to 54 Years | 1,758 | 26.0% |
| 55 to 64 Years | 1,323 | 19.5% |
| 65 to 74 Years | 669 | 9.9% |
| 75 to 84 Years | 241 | 3.6% |
| 85 Years and Over | 266 | 3.9% |
| Total | 6,773 | 100.0% |
Housing Finances in Lorton
Median Income by Occupancy in Lorton
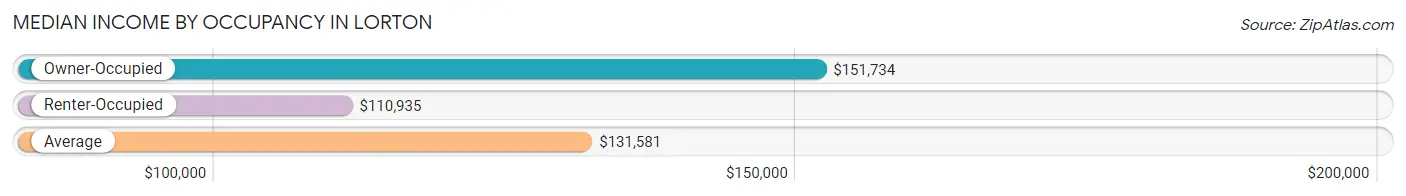
| Occupancy Type | # Households | Median Income |
| Owner-Occupied | 4,201 (62.0%) | $151,734 |
| Renter-Occupied | 2,572 (38.0%) | $110,935 |
| Average | 6,773 (100.0%) | $131,581 |
Occupancy by Householder Income Bracket in Lorton
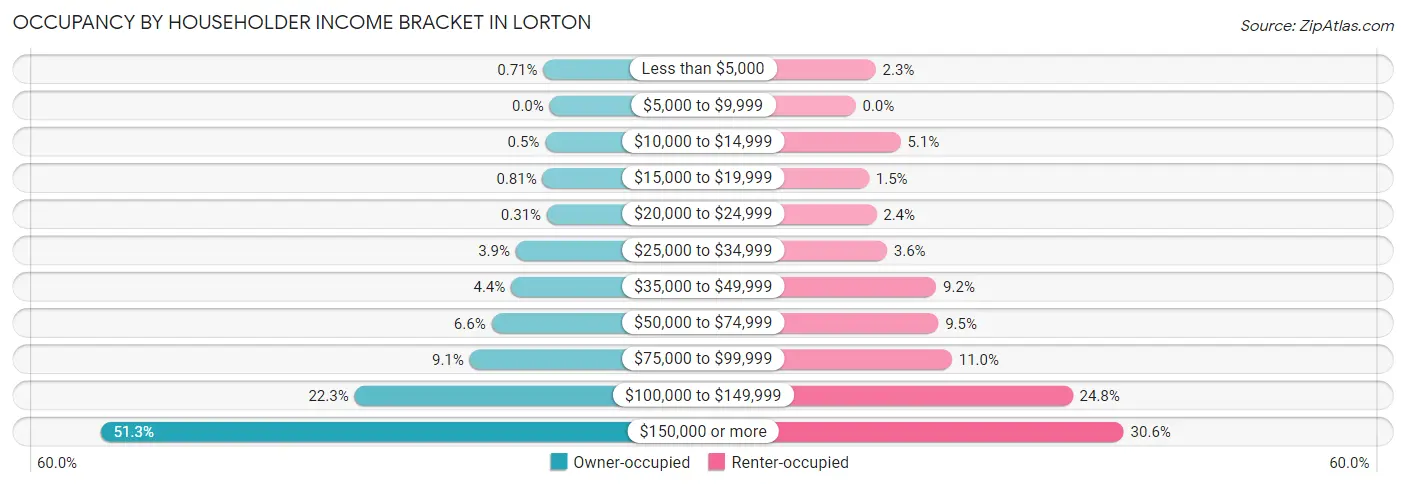
| Income Bracket | Owner-occupied | Renter-occupied |
| Less than $5,000 | 30 (0.7%) | 59 (2.3%) |
| $5,000 to $9,999 | 0 (0.0%) | 0 (0.0%) |
| $10,000 to $14,999 | 21 (0.5%) | 132 (5.1%) |
| $15,000 to $19,999 | 34 (0.8%) | 39 (1.5%) |
| $20,000 to $24,999 | 13 (0.3%) | 61 (2.4%) |
| $25,000 to $34,999 | 162 (3.9%) | 92 (3.6%) |
| $35,000 to $49,999 | 185 (4.4%) | 237 (9.2%) |
| $50,000 to $74,999 | 279 (6.6%) | 243 (9.5%) |
| $75,000 to $99,999 | 384 (9.1%) | 283 (11.0%) |
| $100,000 to $149,999 | 937 (22.3%) | 638 (24.8%) |
| $150,000 or more | 2,156 (51.3%) | 788 (30.6%) |
| Total | 4,201 (100.0%) | 2,572 (100.0%) |
Monthly Housing Cost Tiers in Lorton
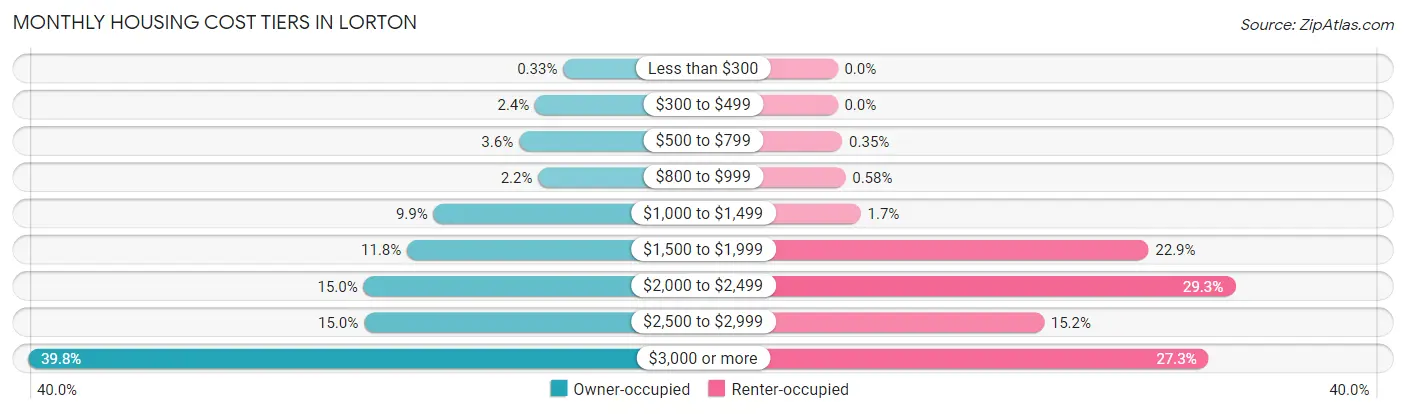
| Monthly Cost | Owner-occupied | Renter-occupied |
| Less than $300 | 14 (0.3%) | 0 (0.0%) |
| $300 to $499 | 101 (2.4%) | 0 (0.0%) |
| $500 to $799 | 151 (3.6%) | 9 (0.4%) |
| $800 to $999 | 91 (2.2%) | 15 (0.6%) |
| $1,000 to $1,499 | 415 (9.9%) | 44 (1.7%) |
| $1,500 to $1,999 | 497 (11.8%) | 589 (22.9%) |
| $2,000 to $2,499 | 632 (15.0%) | 753 (29.3%) |
| $2,500 to $2,999 | 630 (15.0%) | 391 (15.2%) |
| $3,000 or more | 1,670 (39.8%) | 703 (27.3%) |
| Total | 4,201 (100.0%) | 2,572 (100.0%) |
Physical Housing Characteristics in Lorton
Housing Structures in Lorton
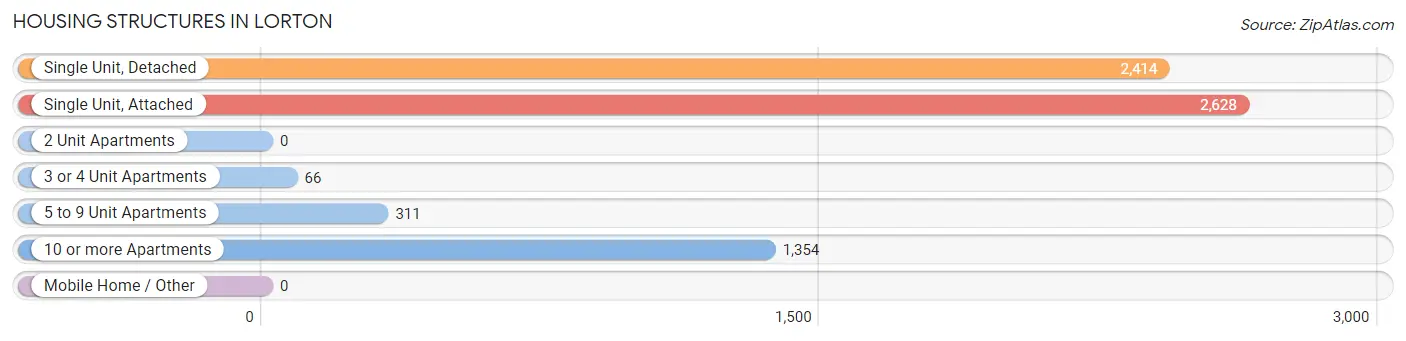
| Structure Type | # Housing Units | % Housing Units |
| Single Unit, Detached | 2,414 | 35.6% |
| Single Unit, Attached | 2,628 | 38.8% |
| 2 Unit Apartments | 0 | 0.0% |
| 3 or 4 Unit Apartments | 66 | 1.0% |
| 5 to 9 Unit Apartments | 311 | 4.6% |
| 10 or more Apartments | 1,354 | 20.0% |
| Mobile Home / Other | 0 | 0.0% |
| Total | 6,773 | 100.0% |
Housing Structures by Occupancy in Lorton
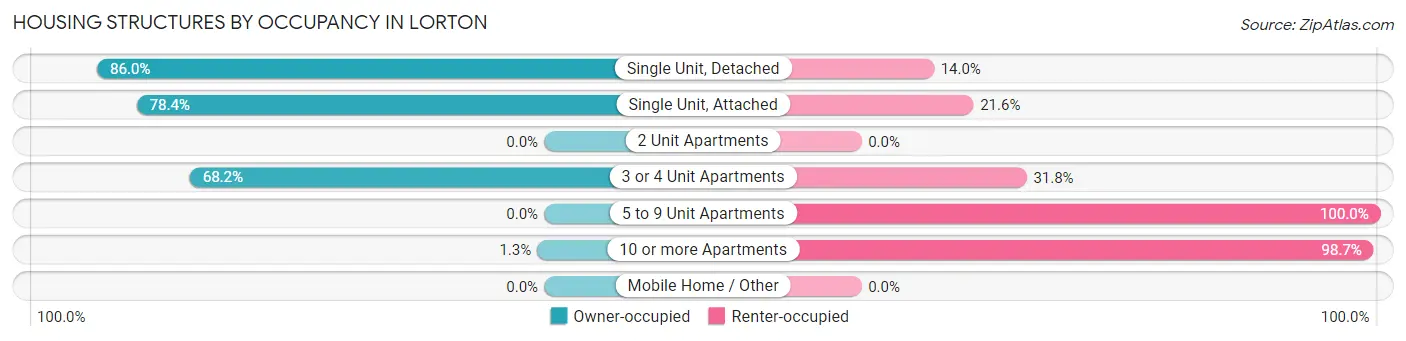
| Structure Type | Owner-occupied | Renter-occupied |
| Single Unit, Detached | 2,077 (86.0%) | 337 (14.0%) |
| Single Unit, Attached | 2,061 (78.4%) | 567 (21.6%) |
| 2 Unit Apartments | 0 (0.0%) | 0 (0.0%) |
| 3 or 4 Unit Apartments | 45 (68.2%) | 21 (31.8%) |
| 5 to 9 Unit Apartments | 0 (0.0%) | 311 (100.0%) |
| 10 or more Apartments | 18 (1.3%) | 1,336 (98.7%) |
| Mobile Home / Other | 0 (0.0%) | 0 (0.0%) |
| Total | 4,201 (62.0%) | 2,572 (38.0%) |
Housing Structures by Number of Rooms in Lorton
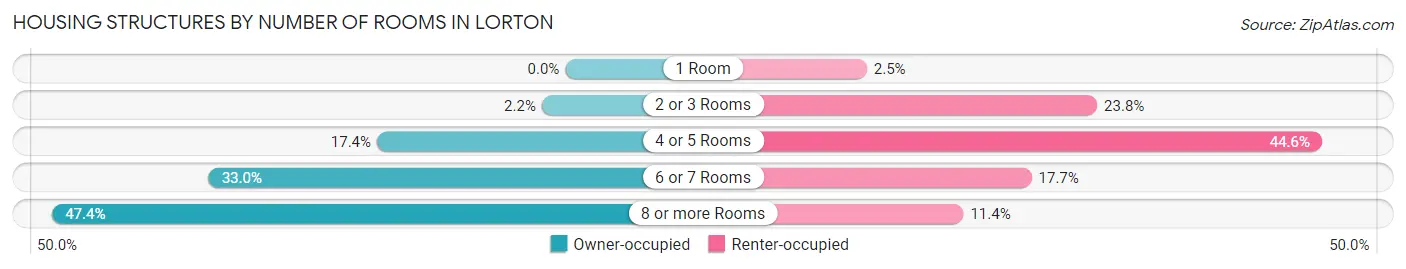
| Number of Rooms | Owner-occupied | Renter-occupied |
| 1 Room | 0 (0.0%) | 64 (2.5%) |
| 2 or 3 Rooms | 91 (2.2%) | 612 (23.8%) |
| 4 or 5 Rooms | 732 (17.4%) | 1,146 (44.6%) |
| 6 or 7 Rooms | 1,385 (33.0%) | 456 (17.7%) |
| 8 or more Rooms | 1,993 (47.4%) | 294 (11.4%) |
| Total | 4,201 (100.0%) | 2,572 (100.0%) |
Housing Structure by Heating Type in Lorton
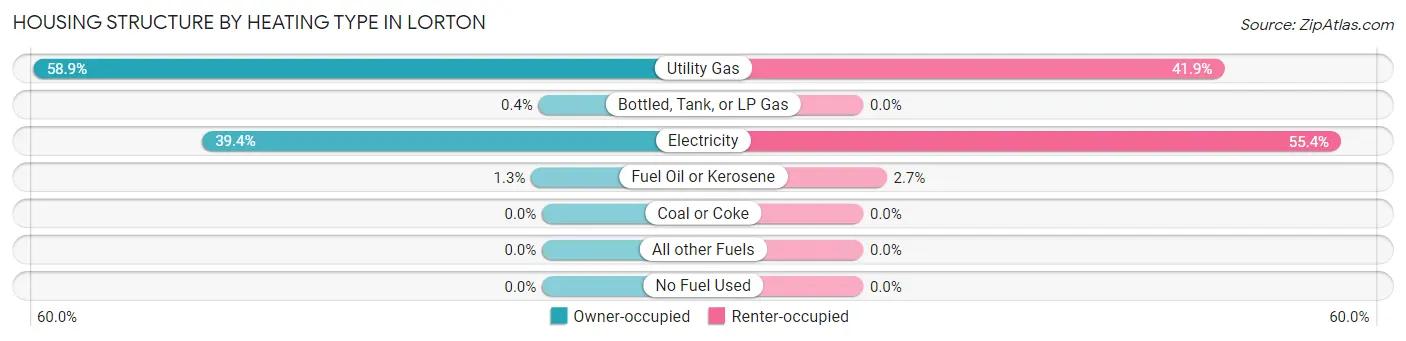
| Heating Type | Owner-occupied | Renter-occupied |
| Utility Gas | 2,476 (58.9%) | 1,077 (41.9%) |
| Bottled, Tank, or LP Gas | 17 (0.4%) | 0 (0.0%) |
| Electricity | 1,655 (39.4%) | 1,425 (55.4%) |
| Fuel Oil or Kerosene | 53 (1.3%) | 70 (2.7%) |
| Coal or Coke | 0 (0.0%) | 0 (0.0%) |
| All other Fuels | 0 (0.0%) | 0 (0.0%) |
| No Fuel Used | 0 (0.0%) | 0 (0.0%) |
| Total | 4,201 (100.0%) | 2,572 (100.0%) |
Household Vehicle Usage in Lorton
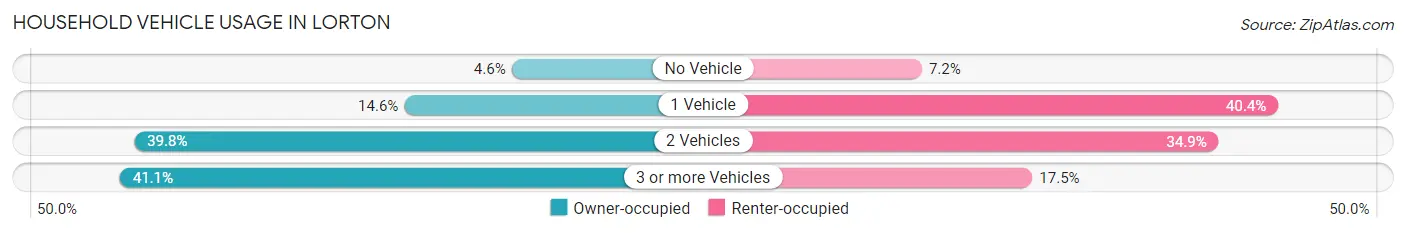
| Vehicles per Household | Owner-occupied | Renter-occupied |
| No Vehicle | 191 (4.5%) | 185 (7.2%) |
| 1 Vehicle | 612 (14.6%) | 1,040 (40.4%) |
| 2 Vehicles | 1,671 (39.8%) | 897 (34.9%) |
| 3 or more Vehicles | 1,727 (41.1%) | 450 (17.5%) |
| Total | 4,201 (100.0%) | 2,572 (100.0%) |
Real Estate & Mortgages in Lorton
Real Estate and Mortgage Overview in Lorton
| Characteristic | Without Mortgage | With Mortgage |
| Housing Units | 583 | 3,618 |
| Median Property Value | $544,100 | $555,000 |
| Median Household Income | $182,795 | $1,826 |
| Monthly Housing Costs | $1,002 | $1,670 |
| Real Estate Taxes | $5,749 | $49 |
Property Value by Mortgage Status in Lorton
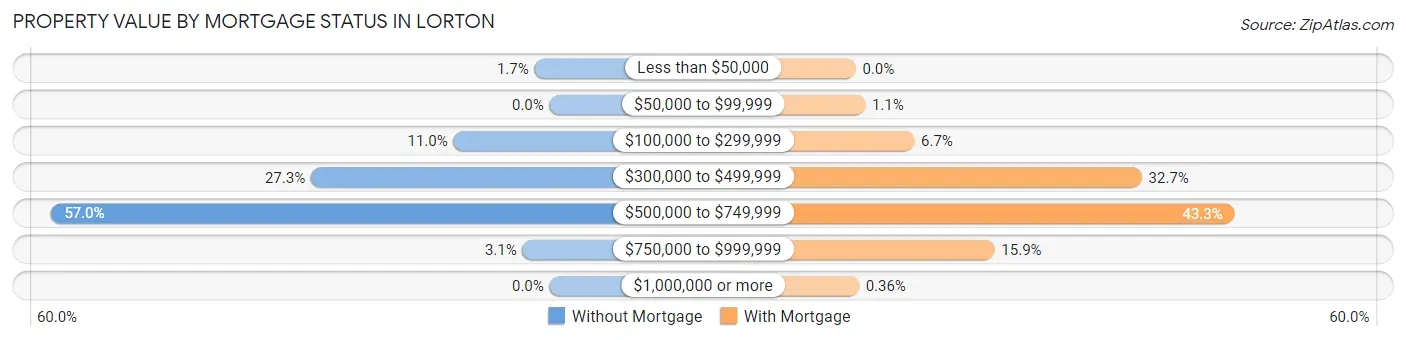
| Property Value | Without Mortgage | With Mortgage |
| Less than $50,000 | 10 (1.7%) | 0 (0.0%) |
| $50,000 to $99,999 | 0 (0.0%) | 39 (1.1%) |
| $100,000 to $299,999 | 64 (11.0%) | 242 (6.7%) |
| $300,000 to $499,999 | 159 (27.3%) | 1,183 (32.7%) |
| $500,000 to $749,999 | 332 (57.0%) | 1,567 (43.3%) |
| $750,000 to $999,999 | 18 (3.1%) | 574 (15.9%) |
| $1,000,000 or more | 0 (0.0%) | 13 (0.4%) |
| Total | 583 (100.0%) | 3,618 (100.0%) |
Household Income by Mortgage Status in Lorton
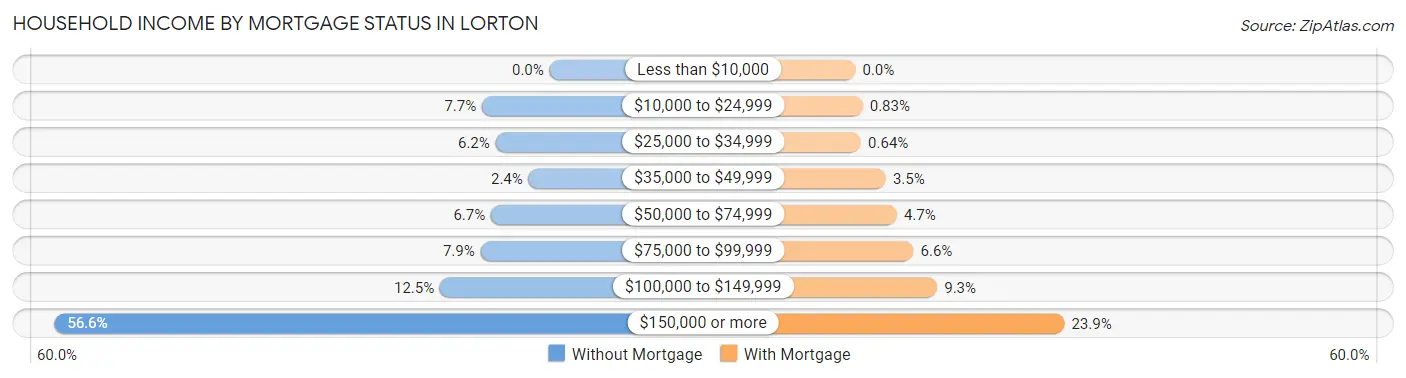
| Household Income | Without Mortgage | With Mortgage |
| Less than $10,000 | 0 (0.0%) | 0 (0.0%) |
| $10,000 to $24,999 | 45 (7.7%) | 30 (0.8%) |
| $25,000 to $34,999 | 36 (6.2%) | 23 (0.6%) |
| $35,000 to $49,999 | 14 (2.4%) | 126 (3.5%) |
| $50,000 to $74,999 | 39 (6.7%) | 171 (4.7%) |
| $75,000 to $99,999 | 46 (7.9%) | 240 (6.6%) |
| $100,000 to $149,999 | 73 (12.5%) | 338 (9.3%) |
| $150,000 or more | 330 (56.6%) | 864 (23.9%) |
| Total | 583 (100.0%) | 3,618 (100.0%) |
Property Value to Household Income Ratio in Lorton
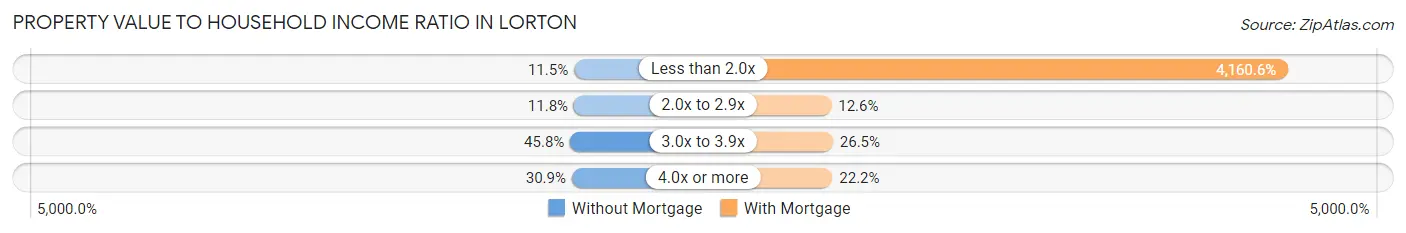
| Value-to-Income Ratio | Without Mortgage | With Mortgage |
| Less than 2.0x | 67 (11.5%) | 150,531 (4,160.6%) |
| 2.0x to 2.9x | 69 (11.8%) | 454 (12.6%) |
| 3.0x to 3.9x | 267 (45.8%) | 958 (26.5%) |
| 4.0x or more | 180 (30.9%) | 802 (22.2%) |
| Total | 583 (100.0%) | 3,618 (100.0%) |
Real Estate Taxes by Mortgage Status in Lorton
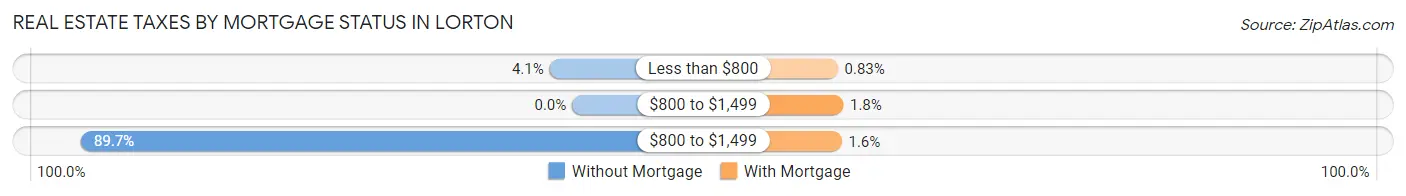
| Property Taxes | Without Mortgage | With Mortgage |
| Less than $800 | 24 (4.1%) | 30 (0.8%) |
| $800 to $1,499 | 0 (0.0%) | 66 (1.8%) |
| $800 to $1,499 | 523 (89.7%) | 56 (1.5%) |
| Total | 583 (100.0%) | 3,618 (100.0%) |
Health & Disability in Lorton
Health Insurance Coverage by Age in Lorton
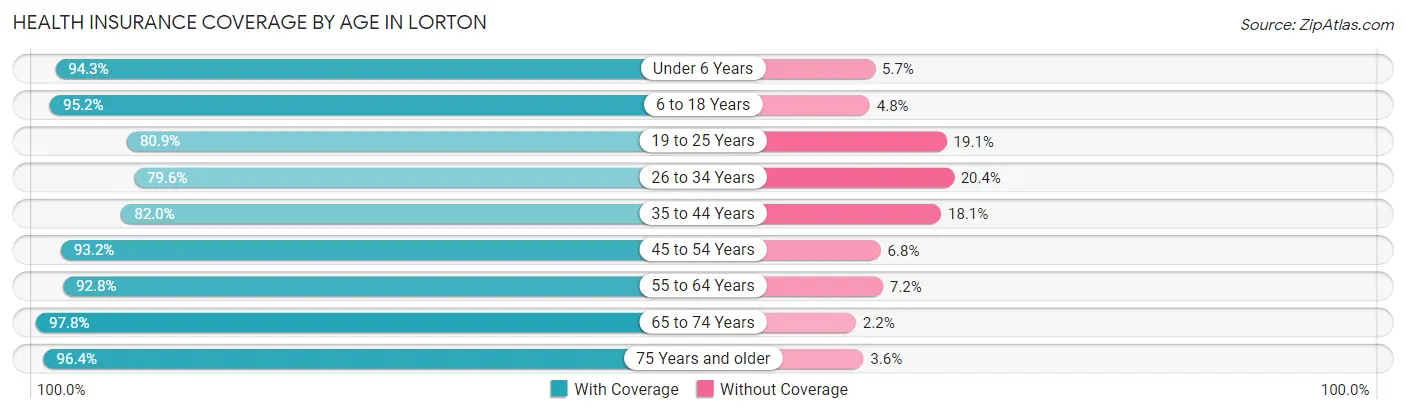
| Age Bracket | With Coverage | Without Coverage |
| Under 6 Years | 1,479 (94.3%) | 90 (5.7%) |
| 6 to 18 Years | 4,693 (95.2%) | 235 (4.8%) |
| 19 to 25 Years | 1,530 (80.9%) | 361 (19.1%) |
| 26 to 34 Years | 1,409 (79.6%) | 361 (20.4%) |
| 35 to 44 Years | 2,261 (82.0%) | 498 (18.0%) |
| 45 to 54 Years | 3,342 (93.2%) | 243 (6.8%) |
| 55 to 64 Years | 2,282 (92.8%) | 177 (7.2%) |
| 65 to 74 Years | 1,224 (97.8%) | 27 (2.2%) |
| 75 Years and older | 1,085 (96.4%) | 40 (3.6%) |
| Total | 19,305 (90.5%) | 2,032 (9.5%) |
Health Insurance Coverage by Citizenship Status in Lorton
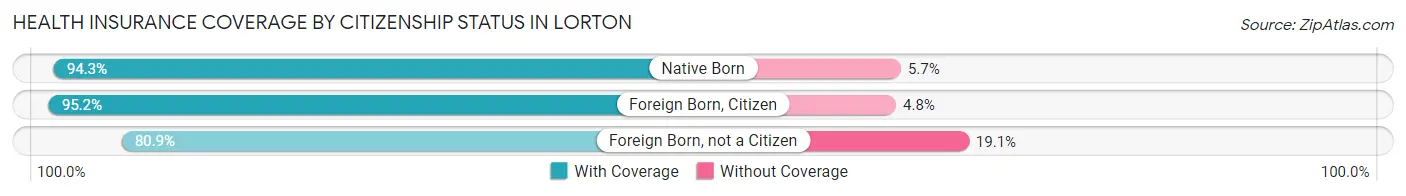
| Citizenship Status | With Coverage | Without Coverage |
| Native Born | 1,479 (94.3%) | 90 (5.7%) |
| Foreign Born, Citizen | 4,693 (95.2%) | 235 (4.8%) |
| Foreign Born, not a Citizen | 1,530 (80.9%) | 361 (19.1%) |
Health Insurance Coverage by Household Income in Lorton
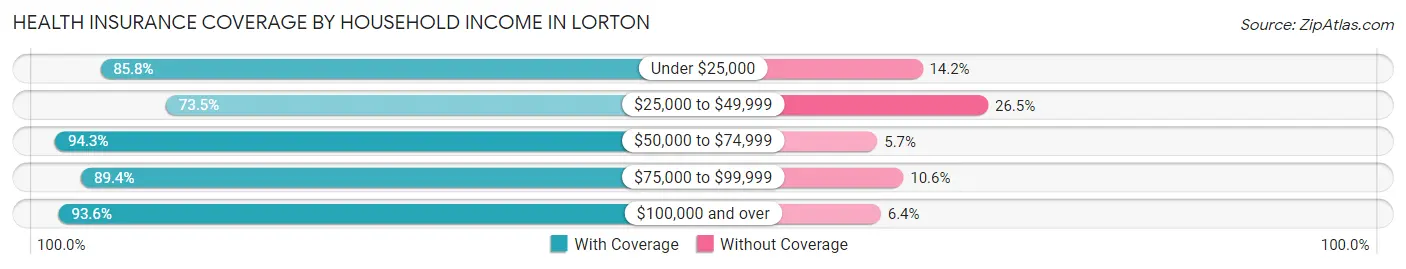
| Household Income | With Coverage | Without Coverage |
| Under $25,000 | 757 (85.8%) | 125 (14.2%) |
| $25,000 to $49,999 | 1,931 (73.5%) | 695 (26.5%) |
| $50,000 to $74,999 | 1,205 (94.3%) | 73 (5.7%) |
| $75,000 to $99,999 | 1,798 (89.4%) | 213 (10.6%) |
| $100,000 and over | 13,614 (93.6%) | 926 (6.4%) |
Public vs Private Health Insurance Coverage by Age in Lorton
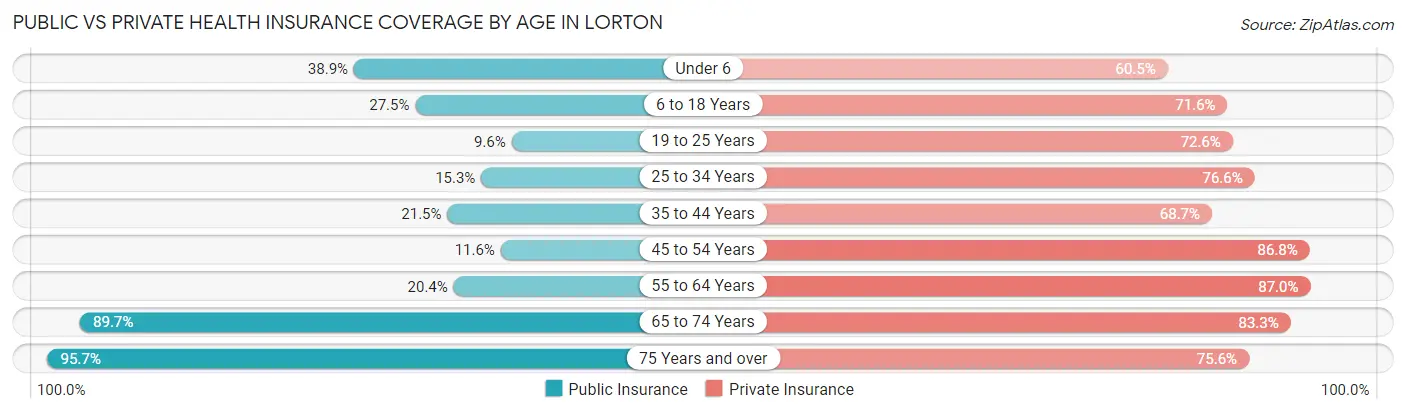
| Age Bracket | Public Insurance | Private Insurance |
| Under 6 | 610 (38.9%) | 949 (60.5%) |
| 6 to 18 Years | 1,354 (27.5%) | 3,527 (71.6%) |
| 19 to 25 Years | 182 (9.6%) | 1,372 (72.6%) |
| 25 to 34 Years | 270 (15.2%) | 1,356 (76.6%) |
| 35 to 44 Years | 594 (21.5%) | 1,895 (68.7%) |
| 45 to 54 Years | 417 (11.6%) | 3,113 (86.8%) |
| 55 to 64 Years | 501 (20.4%) | 2,138 (87.0%) |
| 65 to 74 Years | 1,122 (89.7%) | 1,042 (83.3%) |
| 75 Years and over | 1,077 (95.7%) | 850 (75.6%) |
| Total | 6,127 (28.7%) | 16,242 (76.1%) |
Disability Status by Sex by Age in Lorton
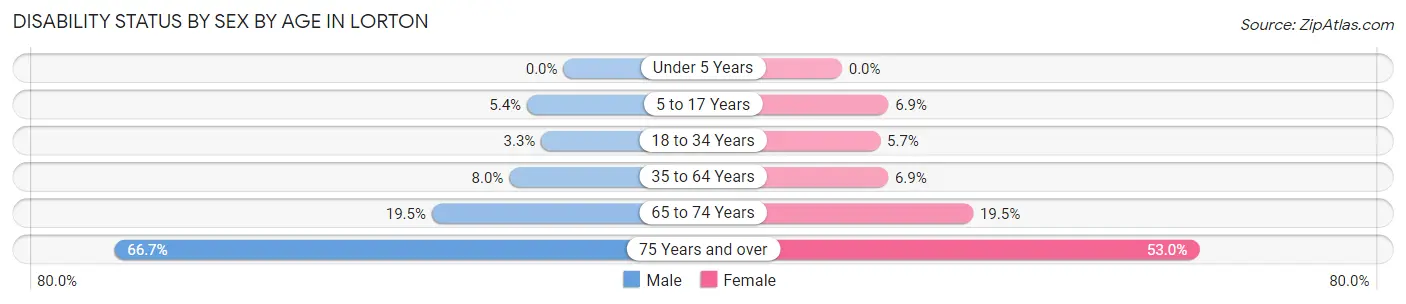
| Age Bracket | Male | Female |
| Under 5 Years | 0 (0.0%) | 0 (0.0%) |
| 5 to 17 Years | 116 (5.4%) | 179 (6.9%) |
| 18 to 34 Years | 60 (3.3%) | 123 (5.7%) |
| 35 to 64 Years | 328 (8.0%) | 324 (6.9%) |
| 65 to 74 Years | 102 (19.5%) | 142 (19.5%) |
| 75 Years and over | 246 (66.7%) | 401 (53.0%) |
Disability Class by Sex by Age in Lorton
Disability Class: Hearing Difficulty
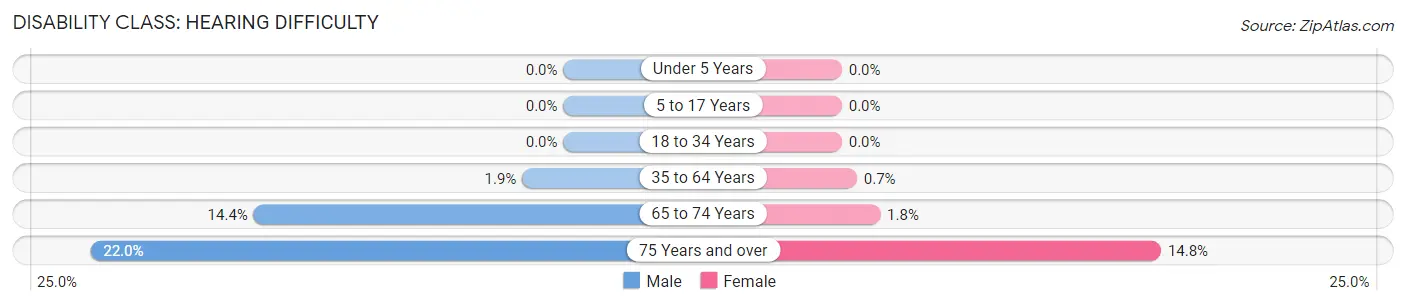
| Age Bracket | Male | Female |
| Under 5 Years | 0 (0.0%) | 0 (0.0%) |
| 5 to 17 Years | 0 (0.0%) | 0 (0.0%) |
| 18 to 34 Years | 0 (0.0%) | 0 (0.0%) |
| 35 to 64 Years | 78 (1.9%) | 33 (0.7%) |
| 65 to 74 Years | 75 (14.4%) | 13 (1.8%) |
| 75 Years and over | 81 (22.0%) | 112 (14.8%) |
Disability Class: Vision Difficulty
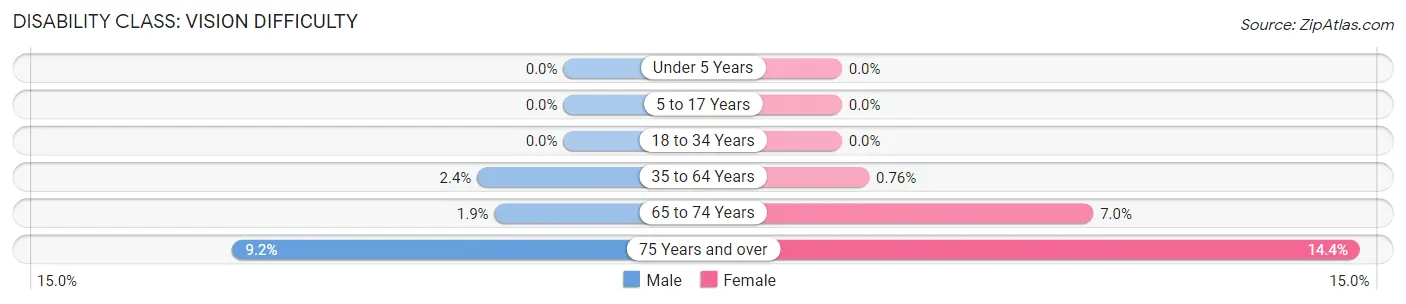
| Age Bracket | Male | Female |
| Under 5 Years | 0 (0.0%) | 0 (0.0%) |
| 5 to 17 Years | 0 (0.0%) | 0 (0.0%) |
| 18 to 34 Years | 0 (0.0%) | 0 (0.0%) |
| 35 to 64 Years | 98 (2.4%) | 36 (0.8%) |
| 65 to 74 Years | 10 (1.9%) | 51 (7.0%) |
| 75 Years and over | 34 (9.2%) | 109 (14.4%) |
Disability Class: Cognitive Difficulty
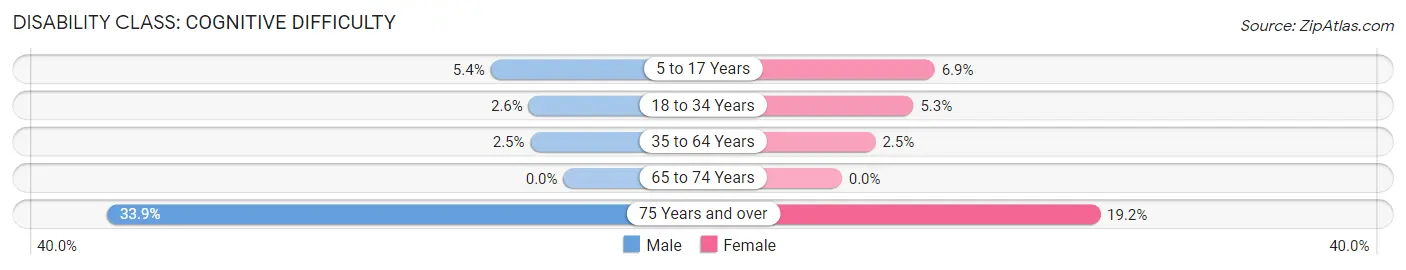
| Age Bracket | Male | Female |
| 5 to 17 Years | 116 (5.4%) | 179 (6.9%) |
| 18 to 34 Years | 47 (2.6%) | 115 (5.3%) |
| 35 to 64 Years | 100 (2.5%) | 118 (2.5%) |
| 65 to 74 Years | 0 (0.0%) | 0 (0.0%) |
| 75 Years and over | 125 (33.9%) | 145 (19.2%) |
Disability Class: Ambulatory Difficulty
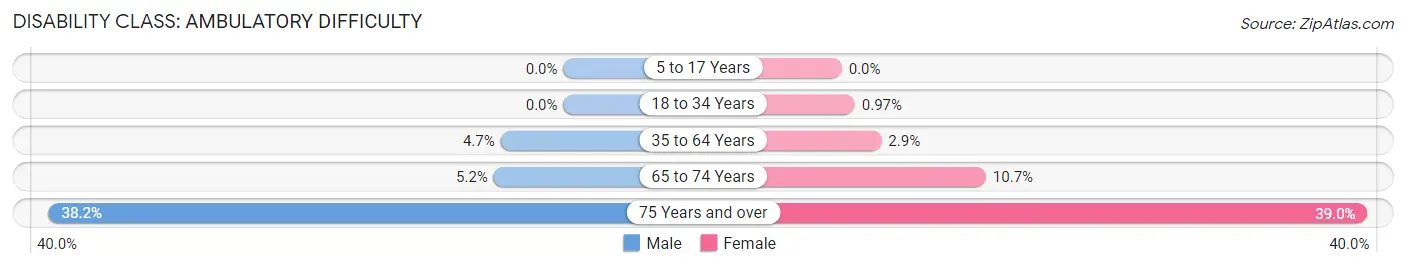
| Age Bracket | Male | Female |
| 5 to 17 Years | 0 (0.0%) | 0 (0.0%) |
| 18 to 34 Years | 0 (0.0%) | 21 (1.0%) |
| 35 to 64 Years | 190 (4.7%) | 139 (2.9%) |
| 65 to 74 Years | 27 (5.2%) | 78 (10.7%) |
| 75 Years and over | 141 (38.2%) | 295 (39.0%) |
Disability Class: Self-Care Difficulty
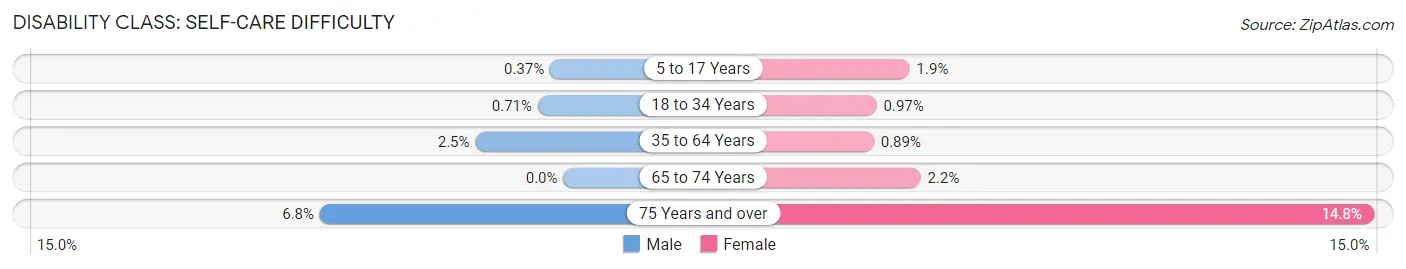
| Age Bracket | Male | Female |
| 5 to 17 Years | 8 (0.4%) | 49 (1.9%) |
| 18 to 34 Years | 13 (0.7%) | 21 (1.0%) |
| 35 to 64 Years | 100 (2.5%) | 42 (0.9%) |
| 65 to 74 Years | 0 (0.0%) | 16 (2.2%) |
| 75 Years and over | 25 (6.8%) | 112 (14.8%) |
Technology Access in Lorton
Computing Device Access in Lorton
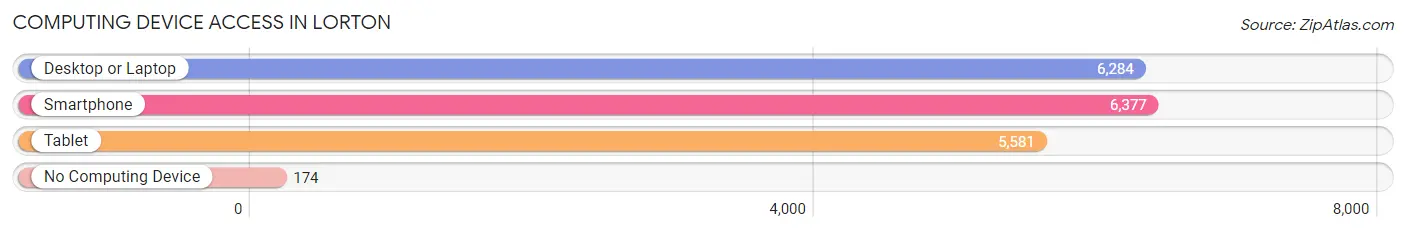
| Device Type | # Households | % Households |
| Desktop or Laptop | 6,284 | 92.8% |
| Smartphone | 6,377 | 94.2% |
| Tablet | 5,581 | 82.4% |
| No Computing Device | 174 | 2.6% |
| Total | 6,773 | 100.0% |
Internet Access in Lorton
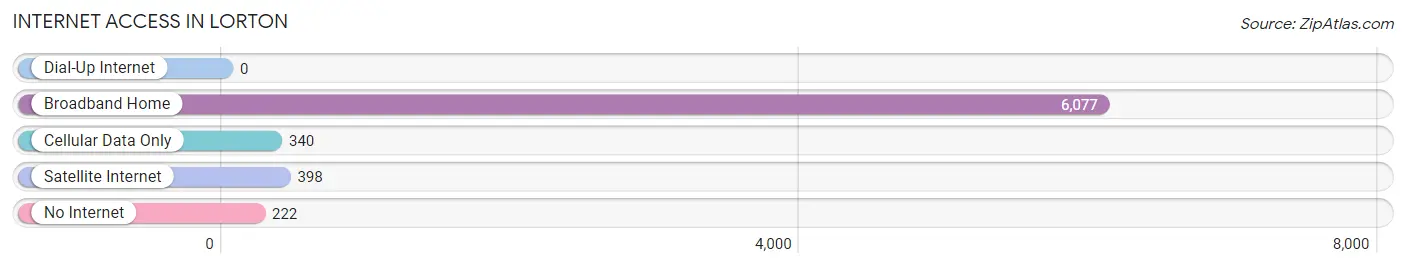
| Internet Type | # Households | % Households |
| Dial-Up Internet | 0 | 0.0% |
| Broadband Home | 6,077 | 89.7% |
| Cellular Data Only | 340 | 5.0% |
| Satellite Internet | 398 | 5.9% |
| No Internet | 222 | 3.3% |
| Total | 6,773 | 100.0% |
Lorton Summary
Lorton is an unincorporated community located in Fairfax County, Virginia. It is located approximately 20 miles south of Washington, D.C. and is part of the Washington metropolitan area. The population of Lorton was 19,619 as of the 2010 census.
History
Lorton was first settled in the early 1700s by the Lorton family, who were among the first settlers in the area. The Lorton family owned a large tract of land in the area, which was eventually divided up and sold off. In the late 1800s, the area was known as Lorton Valley and was home to a number of small farms.
In 1910, the U.S. government purchased the land in the area to build a prison. The prison, known as the Lorton Reformatory, was opened in 1910 and operated until 2001. During its operation, the prison housed a number of high-profile inmates, including Al Capone and Malcolm X.
In the late 1990s, the prison was closed and the land was sold to developers. The area is now home to a number of residential neighborhoods, as well as a number of businesses and retail establishments.
Geography
Lorton is located in northern Fairfax County, Virginia. It is situated along the Occoquan River, which forms the border between Fairfax County and Prince William County. The area is mostly flat, with some rolling hills in the northern part of the community.
The climate in Lorton is temperate, with hot summers and mild winters. The average annual temperature is around 55 degrees Fahrenheit.
Economy
The economy of Lorton is largely based on the service industry. The area is home to a number of retail establishments, including grocery stores, restaurants, and other retail stores. The area is also home to a number of government offices, including the U.S. Department of Defense and the U.S. Department of Homeland Security.
The area is also home to a number of technology companies, including Northrop Grumman and Lockheed Martin. The area is also home to a number of educational institutions, including George Mason University and Northern Virginia Community College.
Demographics
As of the 2010 census, the population of Lorton was 19,619. The racial makeup of the community was 68.3% White, 17.2% African American, 8.2% Asian, and 4.3% Hispanic or Latino. The median household income in the area was $90,945, and the median home value was $400,000.
The majority of the population in Lorton is employed in the service industry. The largest employers in the area are the U.S. government, Northrop Grumman, and Lockheed Martin. The area is also home to a number of educational institutions, including George Mason University and Northern Virginia Community College.
Common Questions
What is Per Capita Income in Lorton?
Per Capita income in Lorton is $48,202.
What is the Median Family Income in Lorton?
Median Family Income in Lorton is $144,940.
What is the Median Household income in Lorton?
Median Household Income in Lorton is $131,581.
What is Income or Wage Gap in Lorton?
Income or Wage Gap in Lorton is 25.5%.
Women in Lorton earn 74.5 cents for every dollar earned by a man.
What is Inequality or Gini Index in Lorton?
Inequality or Gini Index in Lorton is 0.37.
What is the Total Population of Lorton?
Total Population of Lorton is 22,049.
What is the Total Male Population of Lorton?
Total Male Population of Lorton is 10,391.
What is the Total Female Population of Lorton?
Total Female Population of Lorton is 11,658.
What is the Ratio of Males per 100 Females in Lorton?
There are 89.13 Males per 100 Females in Lorton.
What is the Ratio of Females per 100 Males in Lorton?
There are 112.19 Females per 100 Males in Lorton.
What is the Median Population Age in Lorton?
Median Population Age in Lorton is 38.0 Years.
What is the Average Family Size in Lorton
Average Family Size in Lorton is 3.7 People.
What is the Average Household Size in Lorton
Average Household Size in Lorton is 3.2 People.
How Large is the Labor Force in Lorton?
There are 11,768 People in the Labor Forcein in Lorton.
What is the Percentage of People in the Labor Force in Lorton?
70.2% of People are in the Labor Force in Lorton.
What is the Unemployment Rate in Lorton?
Unemployment Rate in Lorton is 4.9%.