Ronkonkoma, NY Map & Demographics
Ronkonkoma Map
Ronkonkoma Overview
$44,661
PER CAPITA INCOME
$137,894
AVG FAMILY INCOME
$123,681
AVG HOUSEHOLD INCOME
22.9%
WAGE / INCOME GAP [ % ]
77.1¢/ $1
WAGE / INCOME GAP [ $ ]
0.35
INEQUALITY / GINI INDEX
18,838
TOTAL POPULATION
9,512
MALE POPULATION
9,326
FEMALE POPULATION
101.99
MALES / 100 FEMALES
98.04
FEMALES / 100 MALES
37.5
MEDIAN AGE
3.5
AVG FAMILY SIZE
3.0
AVG HOUSEHOLD SIZE
11,190
LABOR FORCE [ PEOPLE ]
72.5%
PERCENT IN LABOR FORCE
7.2%
UNEMPLOYMENT RATE
Ronkonkoma Zip Codes
Income in Ronkonkoma
Income Overview in Ronkonkoma
Per Capita Income in Ronkonkoma is $44,661, while median incomes of families and households are $137,894 and $123,681 respectively.
| Characteristic | Number | Measure |
| Per Capita Income | 18,838 | $44,661 |
| Median Family Income | 4,597 | $137,894 |
| Mean Family Income | 4,597 | $147,417 |
| Median Household Income | 6,190 | $123,681 |
| Mean Household Income | 6,190 | $132,720 |
| Income Deficit | 4,597 | $0 |
| Wage / Income Gap (%) | 18,838 | 22.86% |
| Wage / Income Gap ($) | 18,838 | 77.14¢ per $1 |
| Gini / Inequality Index | 18,838 | 0.35 |
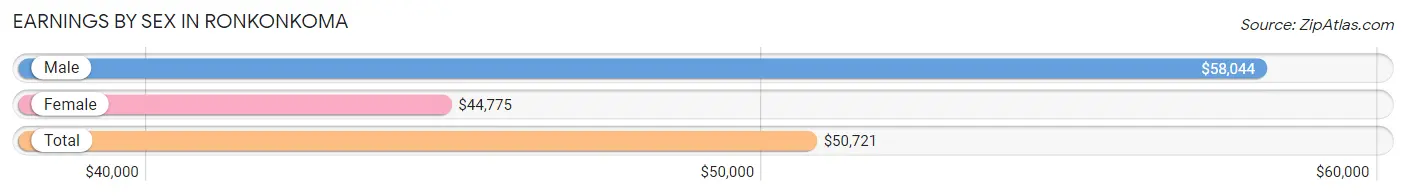
Earnings by Sex in Ronkonkoma
Average Earnings in Ronkonkoma are $50,721, $58,044 for men and $44,775 for women, a difference of 22.9%.
| Sex | Number | Average Earnings |
| Male | 6,045 (53.2%) | $58,044 |
| Female | 5,313 (46.8%) | $44,775 |
| Total | 11,358 (100.0%) | $50,721 |
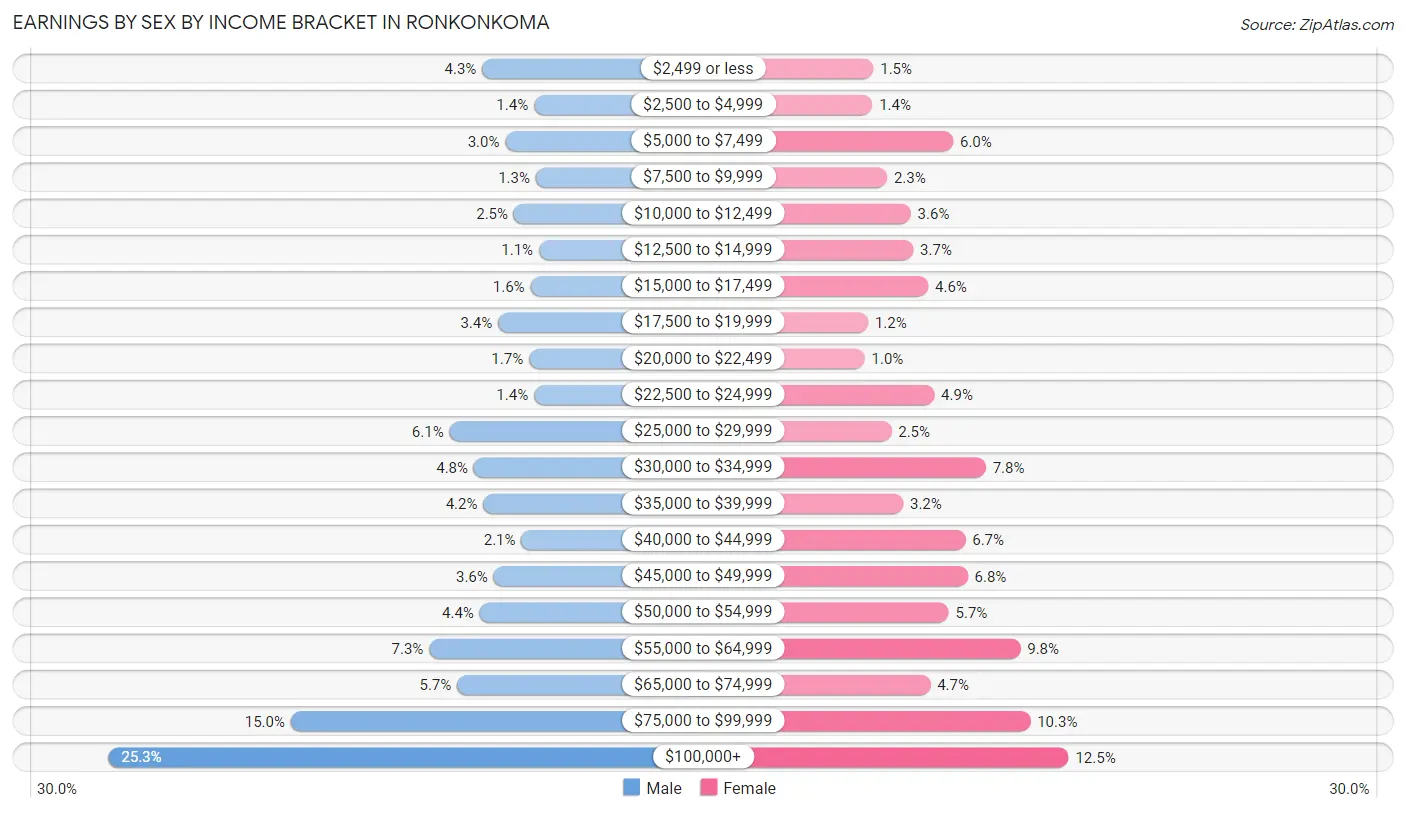
Earnings by Sex by Income Bracket in Ronkonkoma
The most common earnings brackets in Ronkonkoma are $100,000+ for men (1,529 | 25.3%) and $100,000+ for women (662 | 12.5%).
| Income | Male | Female |
| $2,499 or less | 259 (4.3%) | 79 (1.5%) |
| $2,500 to $4,999 | 83 (1.4%) | 76 (1.4%) |
| $5,000 to $7,499 | 180 (3.0%) | 317 (6.0%) |
| $7,500 to $9,999 | 77 (1.3%) | 120 (2.3%) |
| $10,000 to $12,499 | 151 (2.5%) | 191 (3.6%) |
| $12,500 to $14,999 | 66 (1.1%) | 198 (3.7%) |
| $15,000 to $17,499 | 95 (1.6%) | 243 (4.6%) |
| $17,500 to $19,999 | 205 (3.4%) | 63 (1.2%) |
| $20,000 to $22,499 | 100 (1.7%) | 53 (1.0%) |
| $22,500 to $24,999 | 83 (1.4%) | 261 (4.9%) |
| $25,000 to $29,999 | 370 (6.1%) | 133 (2.5%) |
| $30,000 to $34,999 | 287 (4.8%) | 415 (7.8%) |
| $35,000 to $39,999 | 255 (4.2%) | 168 (3.2%) |
| $40,000 to $44,999 | 126 (2.1%) | 354 (6.7%) |
| $45,000 to $49,999 | 220 (3.6%) | 361 (6.8%) |
| $50,000 to $54,999 | 267 (4.4%) | 304 (5.7%) |
| $55,000 to $64,999 | 439 (7.3%) | 518 (9.8%) |
| $65,000 to $74,999 | 344 (5.7%) | 249 (4.7%) |
| $75,000 to $99,999 | 909 (15.0%) | 548 (10.3%) |
| $100,000+ | 1,529 (25.3%) | 662 (12.5%) |
| Total | 6,045 (100.0%) | 5,313 (100.0%) |
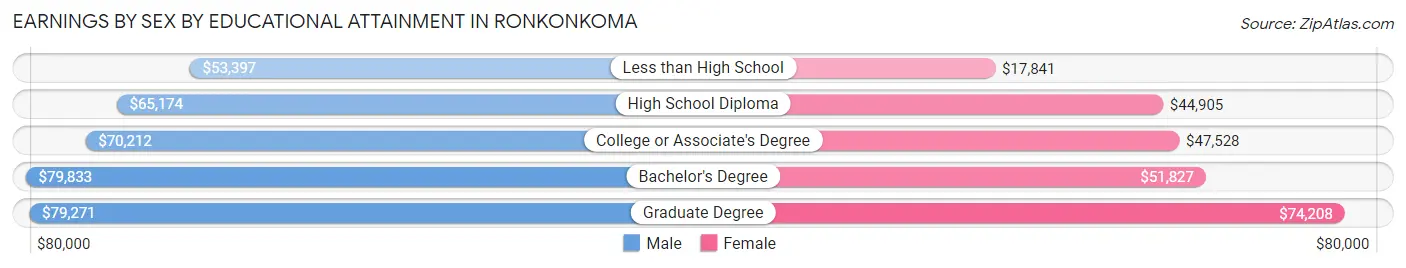
Earnings by Sex by Educational Attainment in Ronkonkoma
Average earnings in Ronkonkoma are $70,327 for men and $49,712 for women, a difference of 29.3%. Men with an educational attainment of bachelor's degree enjoy the highest average annual earnings of $79,833, while those with less than high school education earn the least with $53,397. Women with an educational attainment of graduate degree earn the most with the average annual earnings of $74,208, while those with less than high school education have the smallest earnings of $17,841.
| Educational Attainment | Male Income | Female Income |
| Less than High School | $53,397 | $17,841 |
| High School Diploma | $65,174 | $44,905 |
| College or Associate's Degree | $70,212 | $47,528 |
| Bachelor's Degree | $79,833 | $51,827 |
| Graduate Degree | $79,271 | $74,208 |
| Total | $70,327 | $49,712 |
Family Income in Ronkonkoma
Family Income Brackets in Ronkonkoma
According to the Ronkonkoma family income data, there are 1,333 families falling into the $100,000 to $149,999 income range, which is the most common income bracket and makes up 29.0% of all families. Conversely, the less than $10,000 income bracket is the least frequent group with only 9 families (0.2%) belonging to this category.
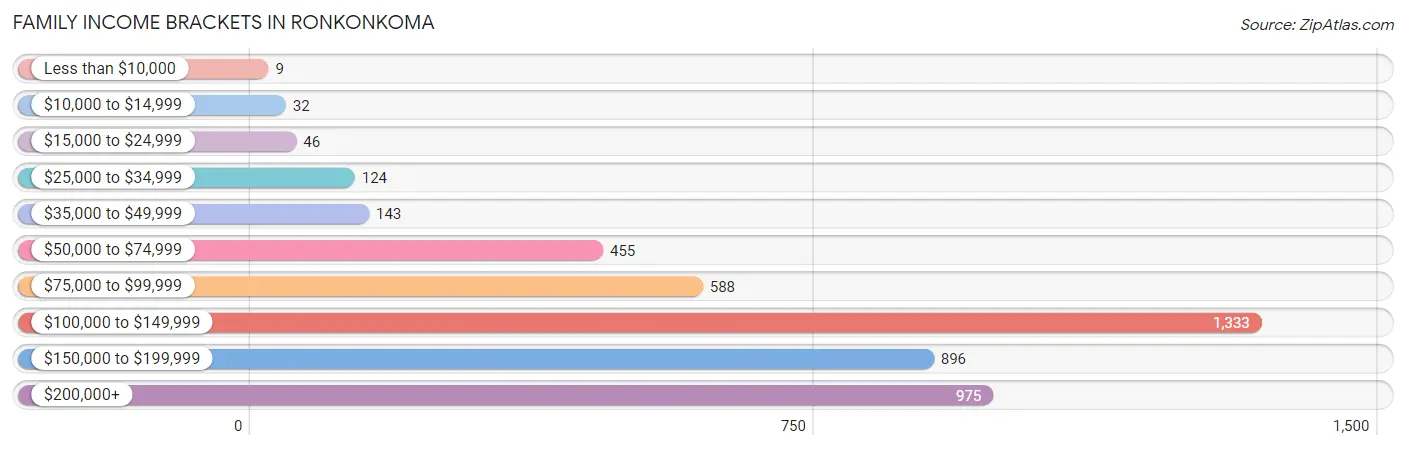
| Income Bracket | # Families | % Families |
| Less than $10,000 | 9 | 0.2% |
| $10,000 to $14,999 | 32 | 0.7% |
| $15,000 to $24,999 | 46 | 1.0% |
| $25,000 to $34,999 | 124 | 2.7% |
| $35,000 to $49,999 | 143 | 3.1% |
| $50,000 to $74,999 | 455 | 9.9% |
| $75,000 to $99,999 | 588 | 12.8% |
| $100,000 to $149,999 | 1,333 | 29.0% |
| $150,000 to $199,999 | 896 | 19.5% |
| $200,000+ | 975 | 21.2% |
Family Income by Famaliy Size in Ronkonkoma
4-person families (1,159 | 25.2%) account for the highest median family income in Ronkonkoma with $167,188 per family, while 2-person families (1,606 | 34.9%) have the highest median income of $57,778 per family member.
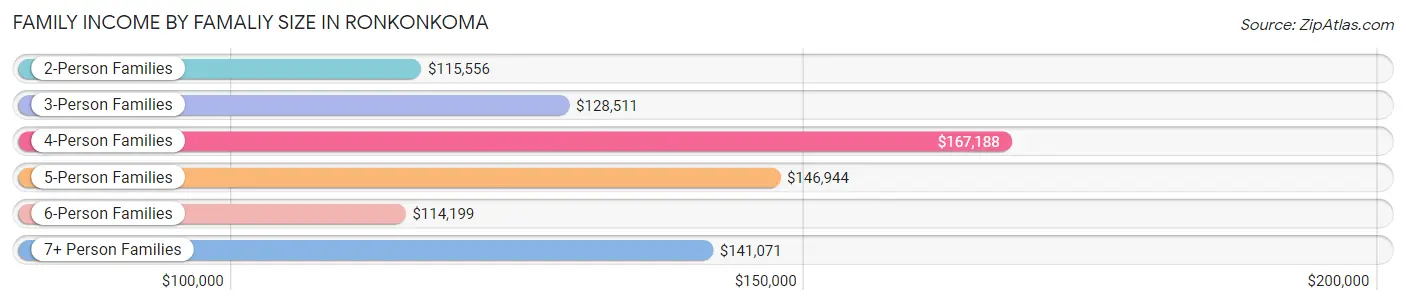
| Income Bracket | # Families | Median Income |
| 2-Person Families | 1,606 (34.9%) | $115,556 |
| 3-Person Families | 1,150 (25.0%) | $128,511 |
| 4-Person Families | 1,159 (25.2%) | $167,188 |
| 5-Person Families | 366 (8.0%) | $146,944 |
| 6-Person Families | 252 (5.5%) | $114,199 |
| 7+ Person Families | 64 (1.4%) | $141,071 |
| Total | 4,597 (100.0%) | $137,894 |
Family Income by Number of Earners in Ronkonkoma
The median family income in Ronkonkoma is $137,894, with families comprising 3+ earners (1,190) having the highest median family income of $190,658, while families with no earners (315) have the lowest median family income of $75,694, accounting for 25.9% and 6.9% of families, respectively.
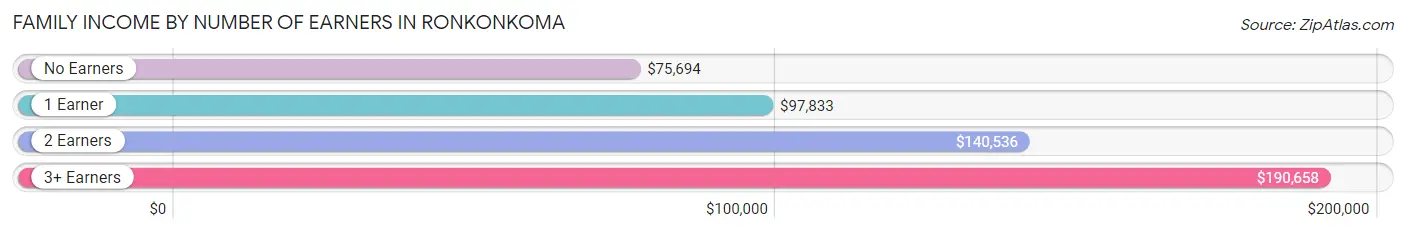
| Number of Earners | # Families | Median Income |
| No Earners | 315 (6.9%) | $75,694 |
| 1 Earner | 1,356 (29.5%) | $97,833 |
| 2 Earners | 1,736 (37.8%) | $140,536 |
| 3+ Earners | 1,190 (25.9%) | $190,658 |
| Total | 4,597 (100.0%) | $137,894 |
Household Income in Ronkonkoma
Household Income Brackets in Ronkonkoma
With 1,548 households falling in the category, the $100,000 to $149,999 income range is the most frequent in Ronkonkoma, accounting for 25.0% of all households. In contrast, only 50 households (0.8%) fall into the $10,000 to $14,999 income bracket, making it the least populous group.
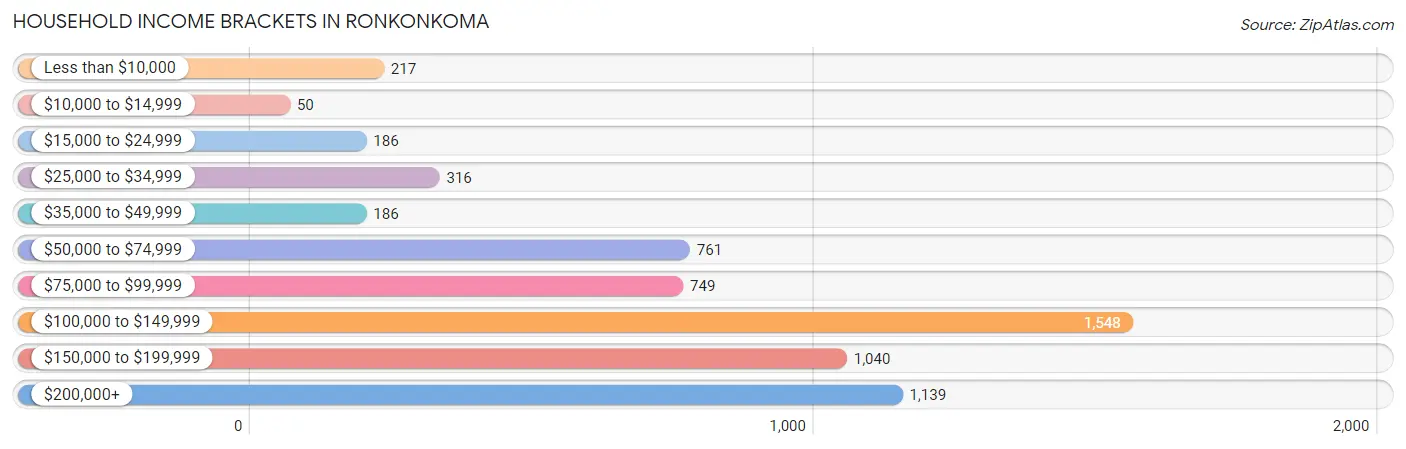
| Income Bracket | # Households | % Households |
| Less than $10,000 | 217 | 3.5% |
| $10,000 to $14,999 | 50 | 0.8% |
| $15,000 to $24,999 | 186 | 3.0% |
| $25,000 to $34,999 | 316 | 5.1% |
| $35,000 to $49,999 | 186 | 3.0% |
| $50,000 to $74,999 | 761 | 12.3% |
| $75,000 to $99,999 | 749 | 12.1% |
| $100,000 to $149,999 | 1,548 | 25.0% |
| $150,000 to $199,999 | 1,040 | 16.8% |
| $200,000+ | 1,139 | 18.4% |
Household Income by Householder Age in Ronkonkoma
The median household income in Ronkonkoma is $123,681, with the highest median household income of $146,122 found in the 45 to 64 years age bracket for the primary householder. A total of 2,611 households (42.2%) fall into this category. Meanwhile, the 65+ years age bracket for the primary householder has the lowest median household income of $83,423, with 1,551 households (25.1%) in this group.
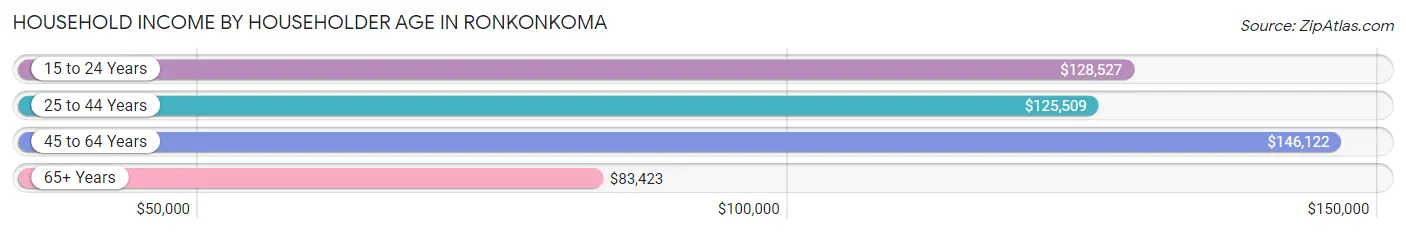
| Income Bracket | # Households | Median Income |
| 15 to 24 Years | 63 (1.0%) | $128,527 |
| 25 to 44 Years | 1,965 (31.7%) | $125,509 |
| 45 to 64 Years | 2,611 (42.2%) | $146,122 |
| 65+ Years | 1,551 (25.1%) | $83,423 |
| Total | 6,190 (100.0%) | $123,681 |
Poverty in Ronkonkoma
Income Below Poverty by Sex and Age in Ronkonkoma
With 3.6% poverty level for males and 3.3% for females among the residents of Ronkonkoma, 15 year old males and 5 year old females are the most vulnerable to poverty, with 14 males (9.3%) and 9 females (8.0%) in their respective age groups living below the poverty level.
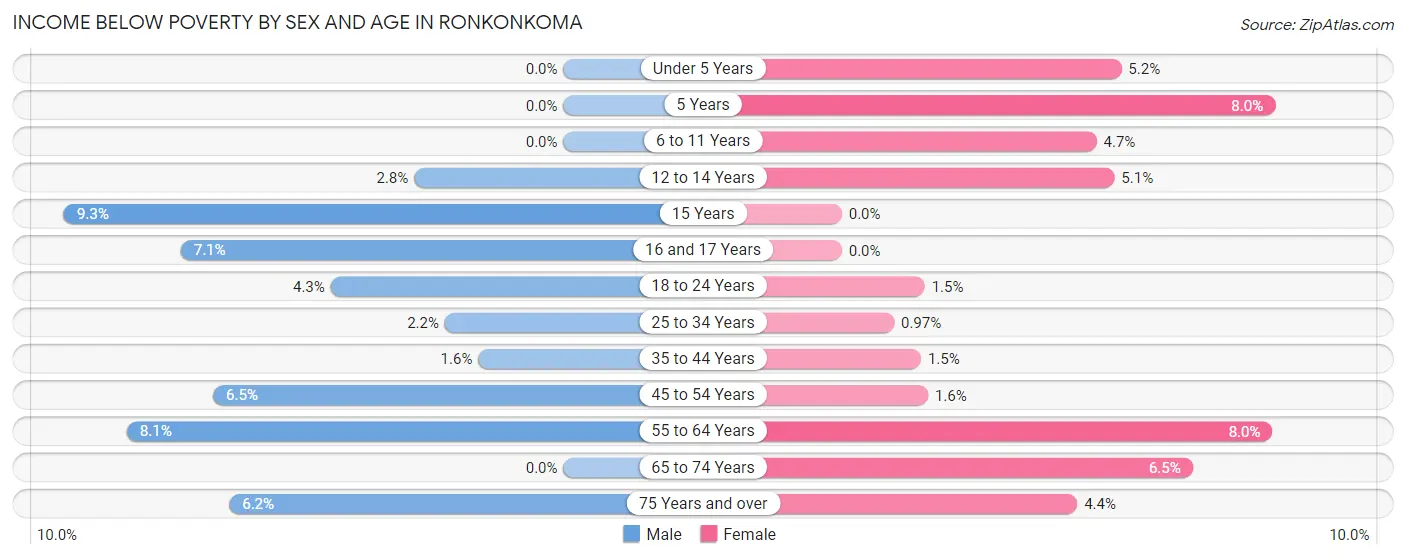
| Age Bracket | Male | Female |
| Under 5 Years | 0 (0.0%) | 22 (5.2%) |
| 5 Years | 0 (0.0%) | 9 (8.0%) |
| 6 to 11 Years | 0 (0.0%) | 23 (4.7%) |
| 12 to 14 Years | 8 (2.8%) | 18 (5.1%) |
| 15 Years | 14 (9.3%) | 0 (0.0%) |
| 16 and 17 Years | 12 (7.1%) | 0 (0.0%) |
| 18 to 24 Years | 46 (4.3%) | 15 (1.5%) |
| 25 to 34 Years | 31 (2.2%) | 15 (1.0%) |
| 35 to 44 Years | 22 (1.6%) | 16 (1.5%) |
| 45 to 54 Years | 83 (6.5%) | 25 (1.6%) |
| 55 to 64 Years | 97 (8.1%) | 88 (8.0%) |
| 65 to 74 Years | 0 (0.0%) | 46 (6.5%) |
| 75 Years and over | 29 (6.2%) | 30 (4.4%) |
| Total | 342 (3.6%) | 307 (3.3%) |
Income Above Poverty by Sex and Age in Ronkonkoma
According to the poverty statistics in Ronkonkoma, males aged under 5 years and females aged 15 years are the age groups that are most secure financially, with 100.0% of males and 100.0% of females in these age groups living above the poverty line.
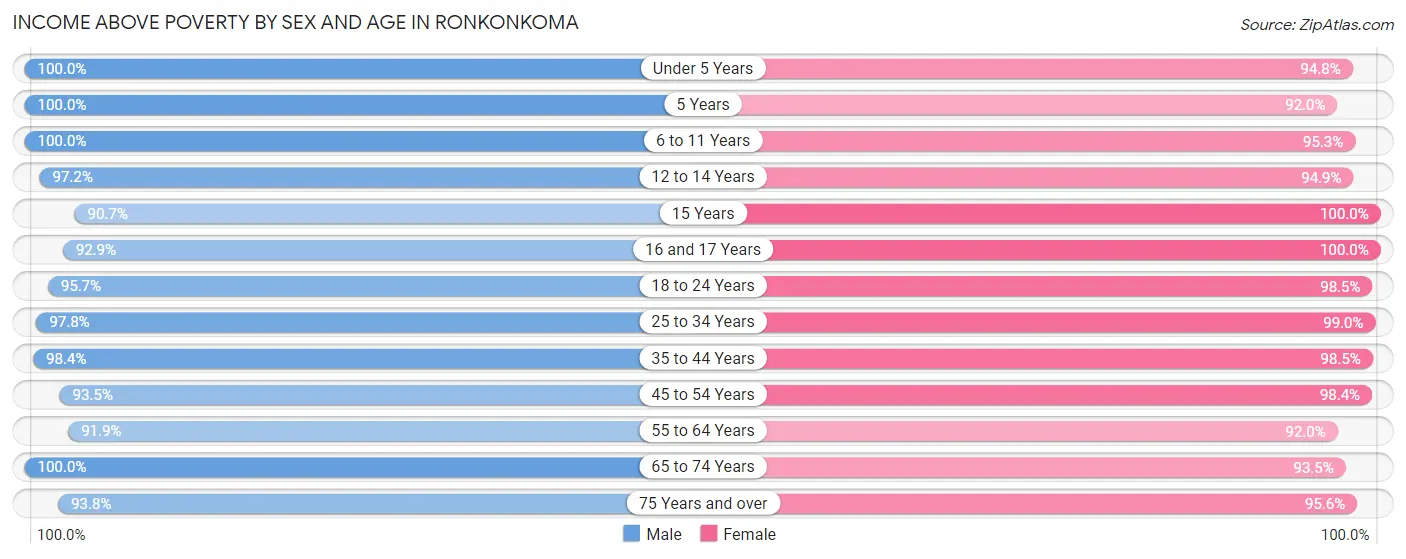
| Age Bracket | Male | Female |
| Under 5 Years | 644 (100.0%) | 402 (94.8%) |
| 5 Years | 40 (100.0%) | 103 (92.0%) |
| 6 to 11 Years | 821 (100.0%) | 463 (95.3%) |
| 12 to 14 Years | 281 (97.2%) | 338 (94.9%) |
| 15 Years | 137 (90.7%) | 37 (100.0%) |
| 16 and 17 Years | 157 (92.9%) | 215 (100.0%) |
| 18 to 24 Years | 1,018 (95.7%) | 961 (98.5%) |
| 25 to 34 Years | 1,375 (97.8%) | 1,524 (99.0%) |
| 35 to 44 Years | 1,372 (98.4%) | 1,072 (98.5%) |
| 45 to 54 Years | 1,193 (93.5%) | 1,536 (98.4%) |
| 55 to 64 Years | 1,101 (91.9%) | 1,013 (92.0%) |
| 65 to 74 Years | 586 (100.0%) | 661 (93.5%) |
| 75 Years and over | 439 (93.8%) | 656 (95.6%) |
| Total | 9,164 (96.4%) | 8,981 (96.7%) |
Income Below Poverty Among Married-Couple Families in Ronkonkoma
The poverty statistics for married-couple families in Ronkonkoma show that 1.1% or 41 of the total 3,579 families live below the poverty line. Families with 5 or more children have the highest poverty rate of 44.4%, comprising of 8 families. On the other hand, families with 3 or 4 children have the lowest poverty rate of 0.0%, which includes 0 families.
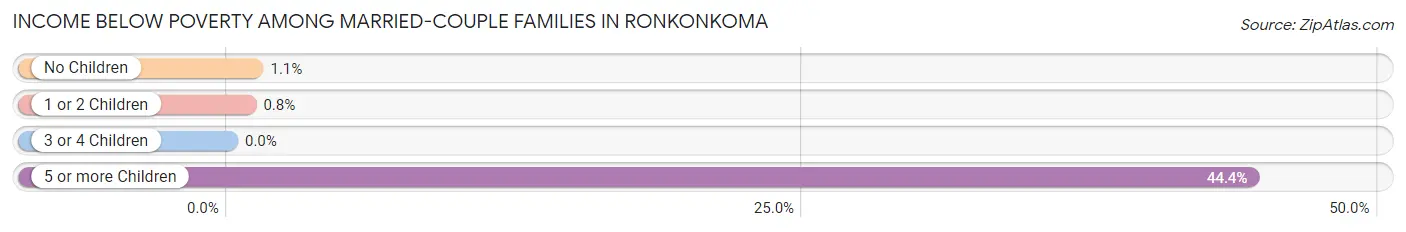
| Children | Above Poverty | Below Poverty |
| No Children | 2,229 (98.9%) | 25 (1.1%) |
| 1 or 2 Children | 988 (99.2%) | 8 (0.8%) |
| 3 or 4 Children | 311 (100.0%) | 0 (0.0%) |
| 5 or more Children | 10 (55.6%) | 8 (44.4%) |
| Total | 3,538 (98.9%) | 41 (1.1%) |
Income Below Poverty Among Single-Parent Households in Ronkonkoma
According to the poverty data in Ronkonkoma, 5.8% or 18 single-father households and 3.4% or 24 single-mother households are living below the poverty line. Among single-father households, those with no children have the highest poverty rate, with 18 households (8.3%) experiencing poverty. Likewise, among single-mother households, those with 1 or 2 children have the highest poverty rate, with 24 households (7.8%) falling below the poverty line.
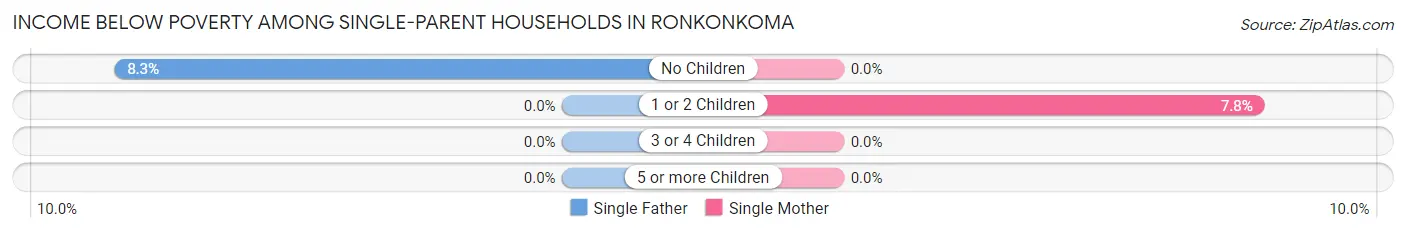
| Children | Single Father | Single Mother |
| No Children | 18 (8.3%) | 0 (0.0%) |
| 1 or 2 Children | 0 (0.0%) | 24 (7.8%) |
| 3 or 4 Children | 0 (0.0%) | 0 (0.0%) |
| 5 or more Children | 0 (0.0%) | 0 (0.0%) |
| Total | 18 (5.8%) | 24 (3.4%) |
Income Below Poverty Among Married-Couple vs Single-Parent Households in Ronkonkoma
The poverty data for Ronkonkoma shows that 41 of the married-couple family households (1.1%) and 42 of the single-parent households (4.1%) are living below the poverty level. Within the married-couple family households, those with 5 or more children have the highest poverty rate, with 8 households (44.4%) falling below the poverty line. Among the single-parent households, those with 1 or 2 children have the highest poverty rate, with 24 household (6.2%) living below poverty.
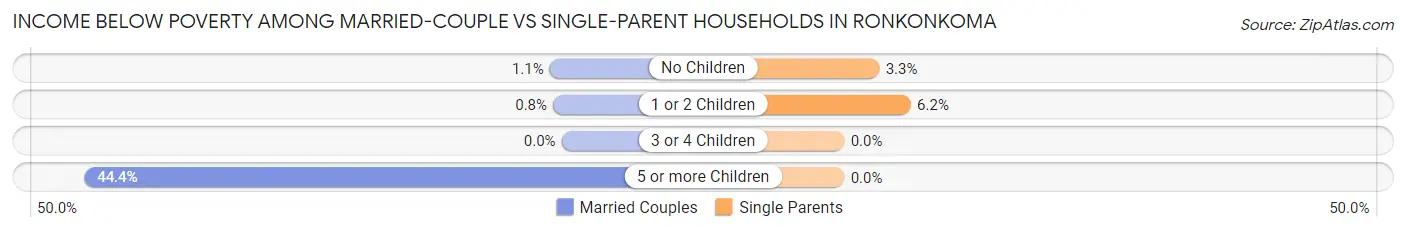
| Children | Married-Couple Families | Single-Parent Households |
| No Children | 25 (1.1%) | 18 (3.3%) |
| 1 or 2 Children | 8 (0.8%) | 24 (6.2%) |
| 3 or 4 Children | 0 (0.0%) | 0 (0.0%) |
| 5 or more Children | 8 (44.4%) | 0 (0.0%) |
| Total | 41 (1.1%) | 42 (4.1%) |
Race in Ronkonkoma
The most populous races in Ronkonkoma are White / Caucasian (14,231 | 75.5%), Hispanic or Latino (3,794 | 20.1%), and Asian (1,519 | 8.1%).
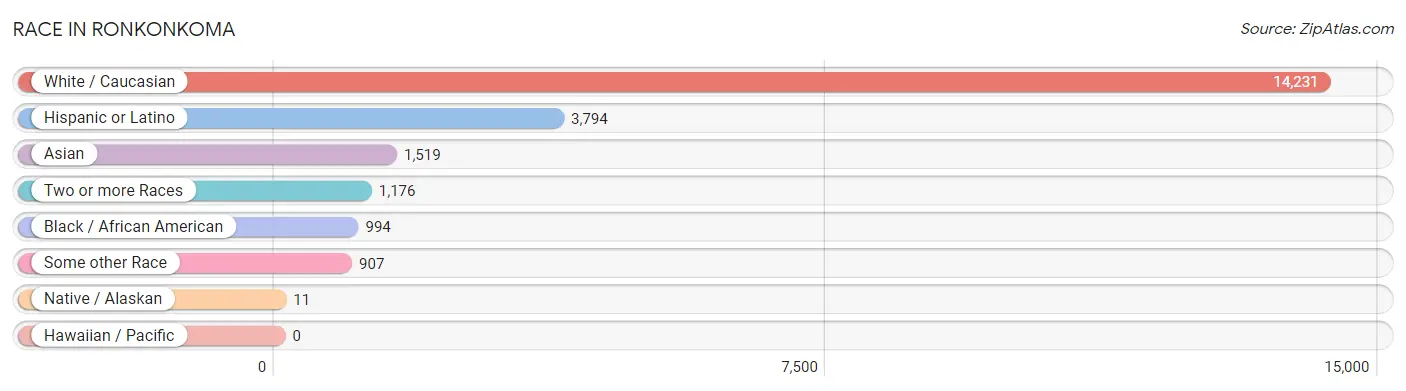
| Race | # Population | % Population |
| Asian | 1,519 | 8.1% |
| Black / African American | 994 | 5.3% |
| Hawaiian / Pacific | 0 | 0.0% |
| Hispanic or Latino | 3,794 | 20.1% |
| Native / Alaskan | 11 | 0.1% |
| White / Caucasian | 14,231 | 75.5% |
| Two or more Races | 1,176 | 6.2% |
| Some other Race | 907 | 4.8% |
| Total | 18,838 | 100.0% |
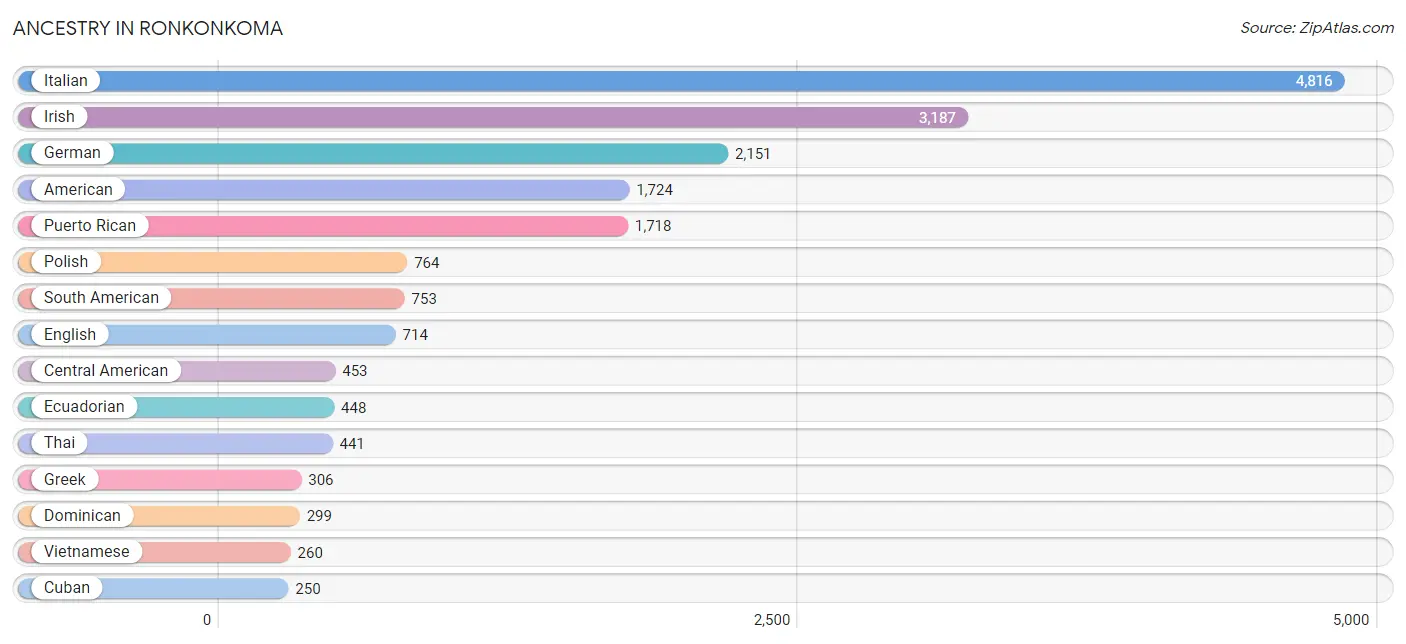
Ancestry in Ronkonkoma
The most populous ancestries reported in Ronkonkoma are Italian (4,816 | 25.6%), Irish (3,187 | 16.9%), German (2,151 | 11.4%), American (1,724 | 9.1%), and Puerto Rican (1,718 | 9.1%), together accounting for 72.2% of all Ronkonkoma residents.
| Ancestry | # Population | % Population |
| African | 140 | 0.7% |
| American | 1,724 | 9.1% |
| Austrian | 110 | 0.6% |
| Basque | 6 | 0.0% |
| Bhutanese | 13 | 0.1% |
| Blackfeet | 13 | 0.1% |
| Brazilian | 65 | 0.4% |
| British | 44 | 0.2% |
| British West Indian | 19 | 0.1% |
| Burmese | 27 | 0.1% |
| Central American | 453 | 2.4% |
| Cherokee | 21 | 0.1% |
| Chilean | 19 | 0.1% |
| Colombian | 193 | 1.0% |
| Croatian | 6 | 0.0% |
| Cuban | 250 | 1.3% |
| Czech | 34 | 0.2% |
| Czechoslovakian | 4 | 0.0% |
| Danish | 12 | 0.1% |
| Dominican | 299 | 1.6% |
| Dutch | 15 | 0.1% |
| Eastern European | 25 | 0.1% |
| Ecuadorian | 448 | 2.4% |
| English | 714 | 3.8% |
| European | 65 | 0.4% |
| Finnish | 12 | 0.1% |
| French | 244 | 1.3% |
| French Canadian | 33 | 0.2% |
| German | 2,151 | 11.4% |
| Ghanaian | 6 | 0.0% |
| Greek | 306 | 1.6% |
| Guatemalan | 149 | 0.8% |
| Haitian | 46 | 0.2% |
| Honduran | 85 | 0.4% |
| Houma | 11 | 0.1% |
| Hungarian | 108 | 0.6% |
| Indian (Asian) | 187 | 1.0% |
| Iranian | 4 | 0.0% |
| Irish | 3,187 | 16.9% |
| Italian | 4,816 | 25.6% |
| Jamaican | 114 | 0.6% |
| Korean | 56 | 0.3% |
| Lithuanian | 74 | 0.4% |
| Maltese | 54 | 0.3% |
| Mexican | 247 | 1.3% |
| Navajo | 67 | 0.4% |
| Norwegian | 58 | 0.3% |
| Panamanian | 37 | 0.2% |
| Peruvian | 93 | 0.5% |
| Polish | 764 | 4.1% |
| Portuguese | 139 | 0.7% |
| Puerto Rican | 1,718 | 9.1% |
| Romanian | 98 | 0.5% |
| Russian | 34 | 0.2% |
| Salvadoran | 182 | 1.0% |
| Scandinavian | 14 | 0.1% |
| Scotch-Irish | 20 | 0.1% |
| Scottish | 47 | 0.3% |
| Slovak | 3 | 0.0% |
| South American | 753 | 4.0% |
| South American Indian | 9 | 0.1% |
| Spaniard | 14 | 0.1% |
| Spanish | 30 | 0.2% |
| Sri Lankan | 30 | 0.2% |
| Subsaharan African | 152 | 0.8% |
| Swedish | 56 | 0.3% |
| Swiss | 6 | 0.0% |
| Thai | 441 | 2.3% |
| Trinidadian and Tobagonian | 94 | 0.5% |
| Turkish | 101 | 0.5% |
| Ukrainian | 93 | 0.5% |
| Vietnamese | 260 | 1.4% |
| West Indian | 12 | 0.1% | View All 73 Rows |
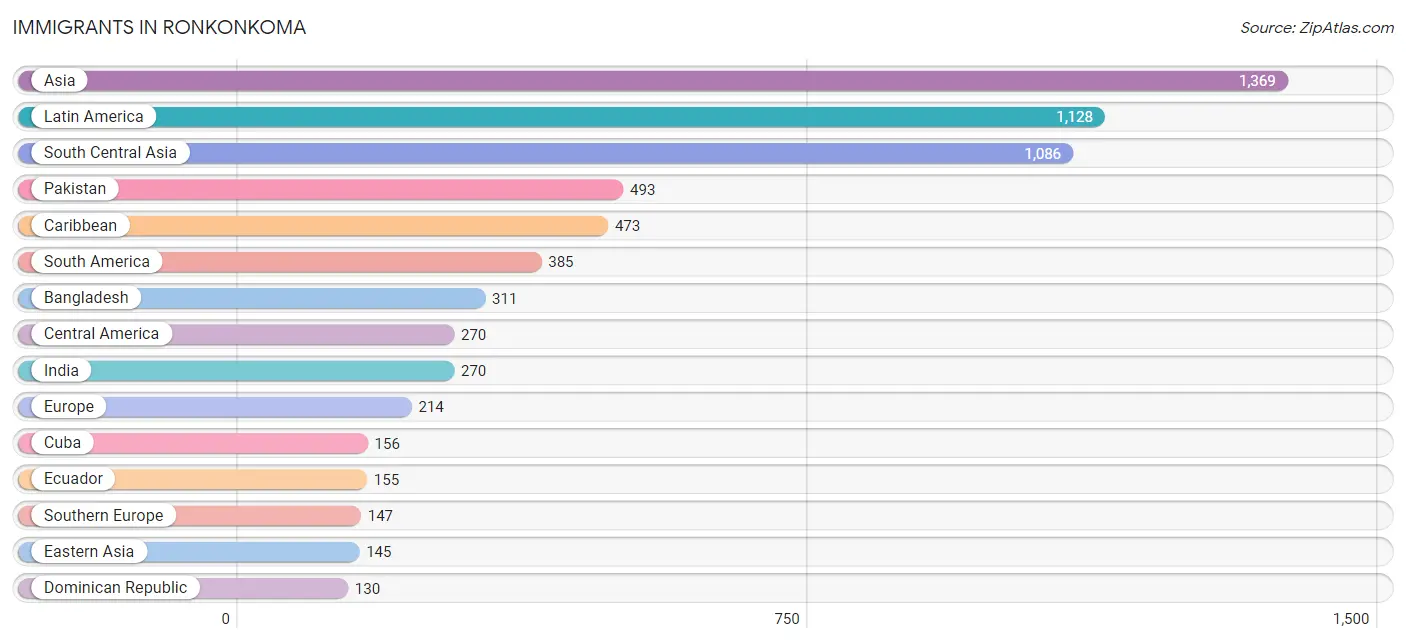
Immigrants in Ronkonkoma
The most numerous immigrant groups reported in Ronkonkoma came from Asia (1,369 | 7.3%), Latin America (1,128 | 6.0%), South Central Asia (1,086 | 5.8%), Pakistan (493 | 2.6%), and Caribbean (473 | 2.5%), together accounting for 24.1% of all Ronkonkoma residents.
| Immigration Origin | # Population | % Population |
| Afghanistan | 12 | 0.1% |
| Africa | 12 | 0.1% |
| Argentina | 65 | 0.4% |
| Asia | 1,369 | 7.3% |
| Bangladesh | 311 | 1.7% |
| Brazil | 7 | 0.0% |
| Canada | 18 | 0.1% |
| Caribbean | 473 | 2.5% |
| Central America | 270 | 1.4% |
| China | 120 | 0.6% |
| Colombia | 119 | 0.6% |
| Cuba | 156 | 0.8% |
| Czechoslovakia | 10 | 0.1% |
| Denmark | 7 | 0.0% |
| Dominican Republic | 130 | 0.7% |
| Eastern Asia | 145 | 0.8% |
| Eastern Europe | 28 | 0.2% |
| Ecuador | 155 | 0.8% |
| El Salvador | 101 | 0.5% |
| England | 1 | 0.0% |
| Europe | 214 | 1.1% |
| Germany | 1 | 0.0% |
| Ghana | 6 | 0.0% |
| Greece | 47 | 0.3% |
| Guatemala | 129 | 0.7% |
| Haiti | 36 | 0.2% |
| Honduras | 17 | 0.1% |
| India | 270 | 1.4% |
| Ireland | 30 | 0.2% |
| Italy | 11 | 0.1% |
| Jamaica | 35 | 0.2% |
| Japan | 4 | 0.0% |
| Korea | 21 | 0.1% |
| Latin America | 1,128 | 6.0% |
| Latvia | 9 | 0.1% |
| Mexico | 23 | 0.1% |
| Northern Europe | 38 | 0.2% |
| Pakistan | 493 | 2.6% |
| Peru | 32 | 0.2% |
| Philippines | 14 | 0.1% |
| Poland | 9 | 0.1% |
| Portugal | 81 | 0.4% |
| South America | 385 | 2.0% |
| South Central Asia | 1,086 | 5.8% |
| South Eastern Asia | 44 | 0.2% |
| Southern Europe | 147 | 0.8% |
| Spain | 8 | 0.0% |
| Trinidad and Tobago | 97 | 0.5% |
| Turkey | 94 | 0.5% |
| Venezuela | 7 | 0.0% |
| Vietnam | 30 | 0.2% |
| Western Africa | 12 | 0.1% |
| Western Asia | 94 | 0.5% |
| Western Europe | 1 | 0.0% | View All 54 Rows |
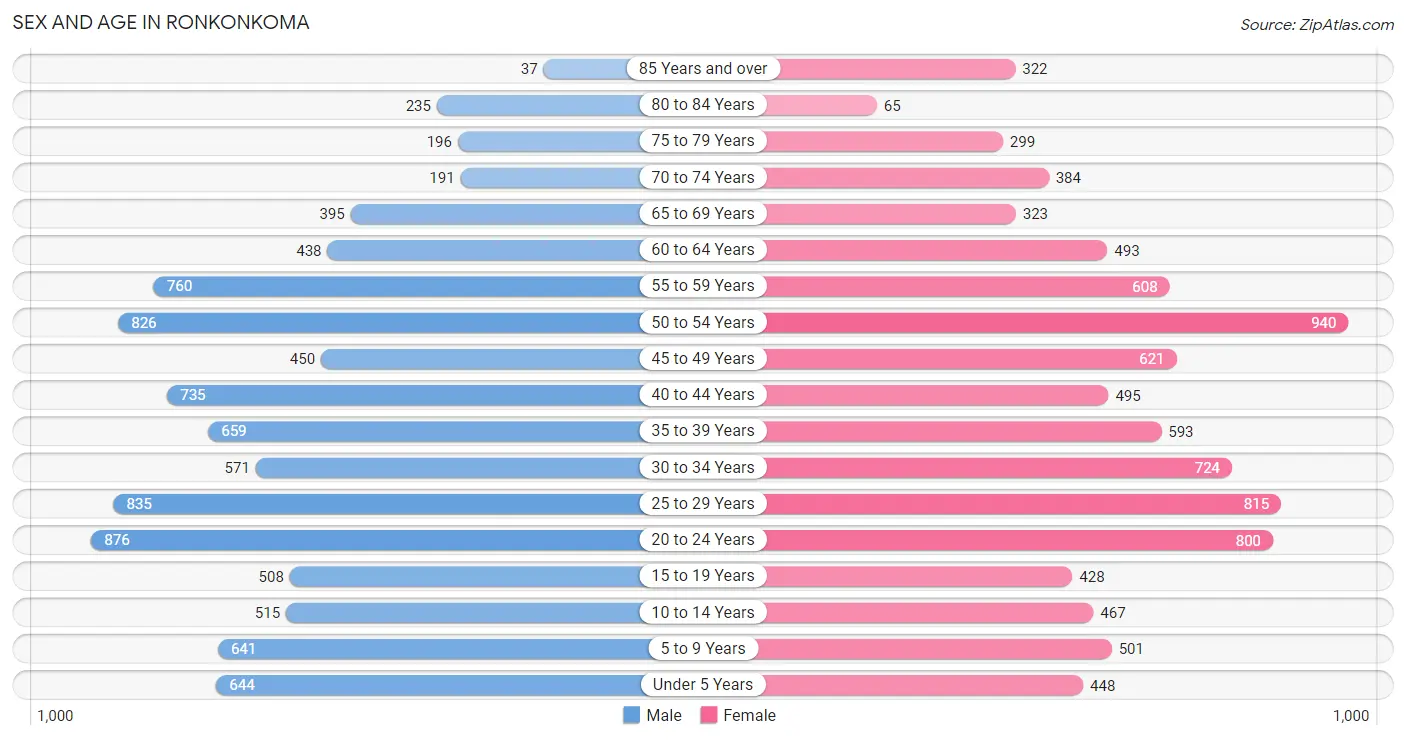
Sex and Age in Ronkonkoma
Sex and Age in Ronkonkoma
The most populous age groups in Ronkonkoma are 20 to 24 Years (876 | 9.2%) for men and 50 to 54 Years (940 | 10.1%) for women.
| Age Bracket | Male | Female |
| Under 5 Years | 644 (6.8%) | 448 (4.8%) |
| 5 to 9 Years | 641 (6.7%) | 501 (5.4%) |
| 10 to 14 Years | 515 (5.4%) | 467 (5.0%) |
| 15 to 19 Years | 508 (5.3%) | 428 (4.6%) |
| 20 to 24 Years | 876 (9.2%) | 800 (8.6%) |
| 25 to 29 Years | 835 (8.8%) | 815 (8.7%) |
| 30 to 34 Years | 571 (6.0%) | 724 (7.8%) |
| 35 to 39 Years | 659 (6.9%) | 593 (6.4%) |
| 40 to 44 Years | 735 (7.7%) | 495 (5.3%) |
| 45 to 49 Years | 450 (4.7%) | 621 (6.7%) |
| 50 to 54 Years | 826 (8.7%) | 940 (10.1%) |
| 55 to 59 Years | 760 (8.0%) | 608 (6.5%) |
| 60 to 64 Years | 438 (4.6%) | 493 (5.3%) |
| 65 to 69 Years | 395 (4.2%) | 323 (3.5%) |
| 70 to 74 Years | 191 (2.0%) | 384 (4.1%) |
| 75 to 79 Years | 196 (2.1%) | 299 (3.2%) |
| 80 to 84 Years | 235 (2.5%) | 65 (0.7%) |
| 85 Years and over | 37 (0.4%) | 322 (3.5%) |
| Total | 9,512 (100.0%) | 9,326 (100.0%) |
Families and Households in Ronkonkoma
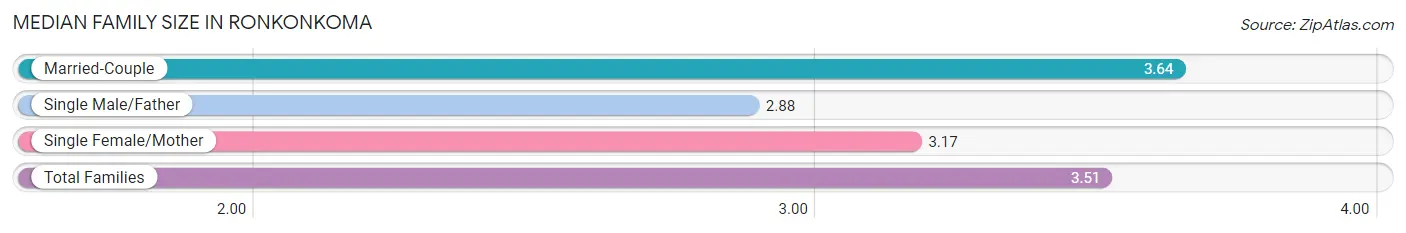
Median Family Size in Ronkonkoma
The median family size in Ronkonkoma is 3.51 persons per family, with married-couple families (3,579 | 77.9%) accounting for the largest median family size of 3.64 persons per family. On the other hand, single male/father families (308 | 6.7%) represent the smallest median family size with 2.88 persons per family.
| Family Type | # Families | Family Size |
| Married-Couple | 3,579 (77.9%) | 3.64 |
| Single Male/Father | 308 (6.7%) | 2.88 |
| Single Female/Mother | 710 (15.4%) | 3.17 |
| Total Families | 4,597 (100.0%) | 3.51 |
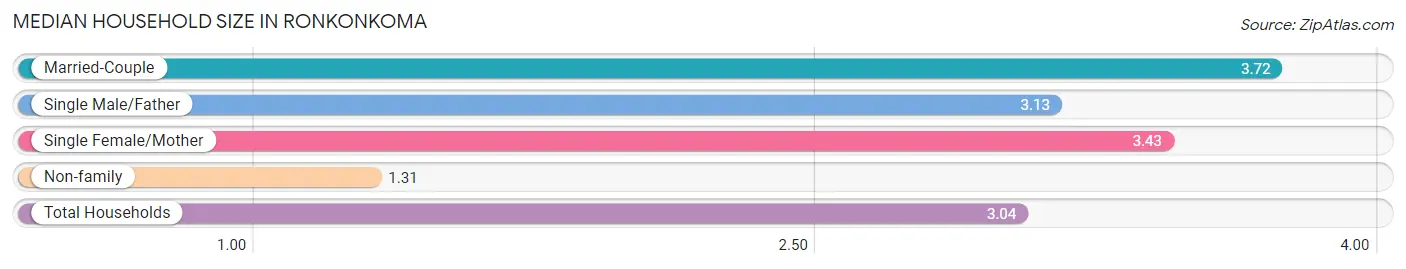
Median Household Size in Ronkonkoma
The median household size in Ronkonkoma is 3.04 persons per household, with married-couple households (3,579 | 57.8%) accounting for the largest median household size of 3.72 persons per household. non-family households (1,593 | 25.7%) represent the smallest median household size with 1.31 persons per household.
| Household Type | # Households | Household Size |
| Married-Couple | 3,579 (57.8%) | 3.72 |
| Single Male/Father | 308 (5.0%) | 3.13 |
| Single Female/Mother | 710 (11.5%) | 3.43 |
| Non-family | 1,593 (25.7%) | 1.31 |
| Total Households | 6,190 (100.0%) | 3.04 |
Household Size by Marriage Status in Ronkonkoma
Out of a total of 6,190 households in Ronkonkoma, 4,597 (74.3%) are family households, while 1,593 (25.7%) are nonfamily households. The most numerous type of family households are 2-person households, comprising 1,422, and the most common type of nonfamily households are 1-person households, comprising 1,145.
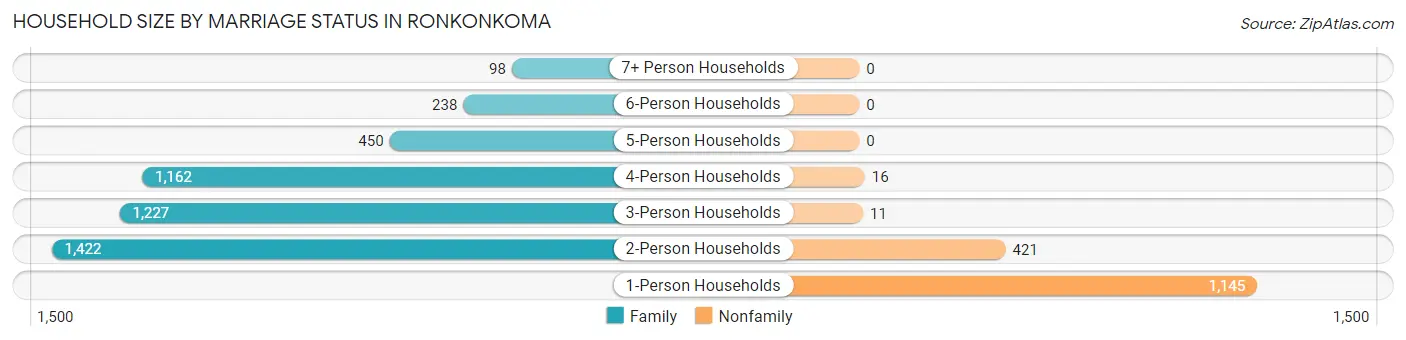
| Household Size | Family Households | Nonfamily Households |
| 1-Person Households | - | 1,145 (18.5%) |
| 2-Person Households | 1,422 (23.0%) | 421 (6.8%) |
| 3-Person Households | 1,227 (19.8%) | 11 (0.2%) |
| 4-Person Households | 1,162 (18.8%) | 16 (0.3%) |
| 5-Person Households | 450 (7.3%) | 0 (0.0%) |
| 6-Person Households | 238 (3.8%) | 0 (0.0%) |
| 7+ Person Households | 98 (1.6%) | 0 (0.0%) |
| Total | 4,597 (74.3%) | 1,593 (25.7%) |
Female Fertility in Ronkonkoma
Fertility by Age in Ronkonkoma
Average fertility rate in Ronkonkoma is 50.0 births per 1,000 women. Women in the age bracket of 20 to 34 years have the highest fertility rate with 88.0 births per 1,000 women. Women in the age bracket of 20 to 34 years acount for 89.2% of all women with births.
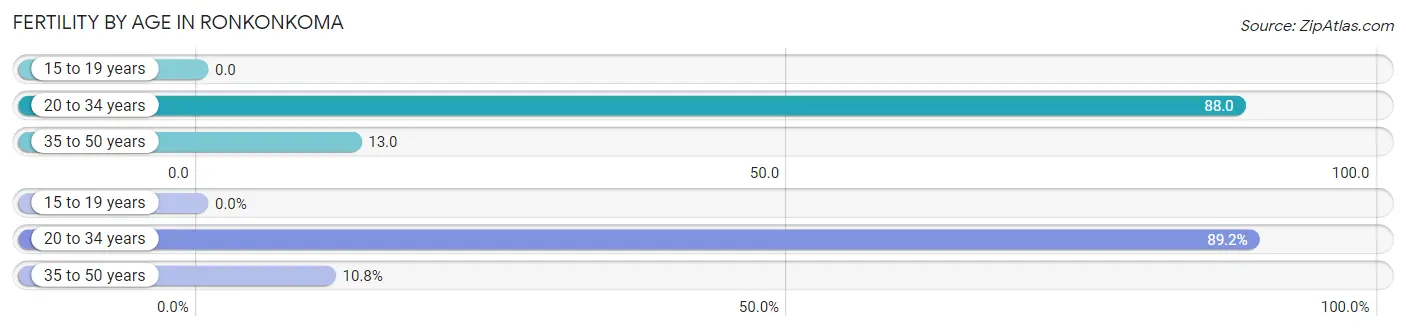
| Age Bracket | Women with Births | Births / 1,000 Women |
| 15 to 19 years | 0 (0.0%) | 0.0 |
| 20 to 34 years | 206 (89.2%) | 88.0 |
| 35 to 50 years | 25 (10.8%) | 13.0 |
| Total | 231 (100.0%) | 50.0 |
Fertility by Age by Marriage Status in Ronkonkoma
79.7% of women with births (231) in Ronkonkoma are married. The highest percentage of unmarried women with births falls into 35 to 50 years age bracket with 28.0% of them unmarried at the time of birth, while the lowest percentage of unmarried women with births belong to 20 to 34 years age bracket with 19.4% of them unmarried.
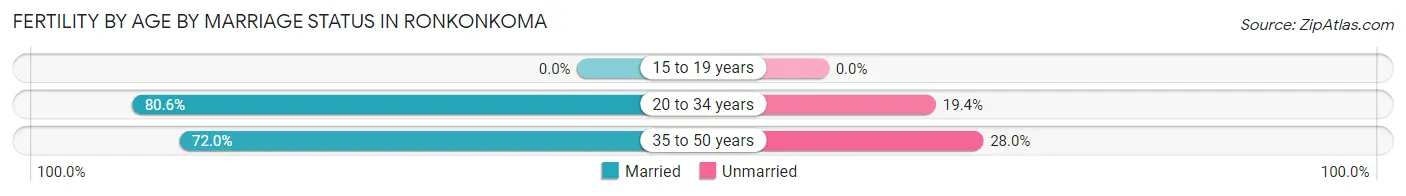
| Age Bracket | Married | Unmarried |
| 15 to 19 years | 0 (0.0%) | 0 (0.0%) |
| 20 to 34 years | 166 (80.6%) | 40 (19.4%) |
| 35 to 50 years | 18 (72.0%) | 7 (28.0%) |
| Total | 184 (79.6%) | 47 (20.3%) |
Fertility by Education in Ronkonkoma
Average fertility rate in Ronkonkoma is 50.0 births per 1,000 women. Women with the education attainment of bachelor's degree have the highest fertility rate of 111.0 births per 1,000 women, while women with the education attainment of high school diploma have the lowest fertility at 10.0 births per 1,000 women. Women with the education attainment of bachelor's degree represent 48.0% of all women with births.
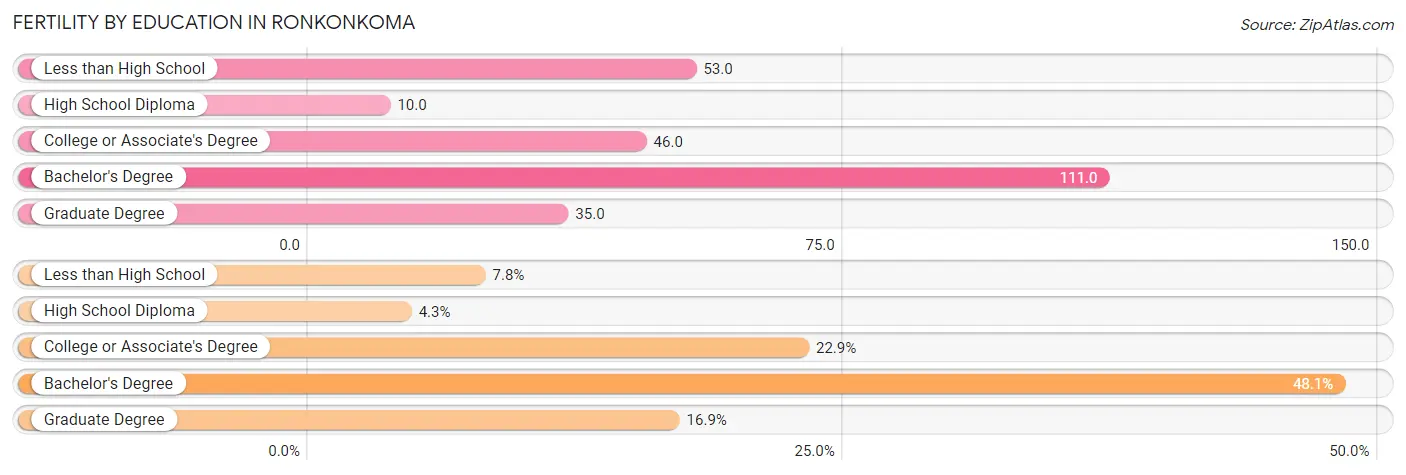
| Educational Attainment | Women with Births | Births / 1,000 Women |
| Less than High School | 18 (7.8%) | 53.0 |
| High School Diploma | 10 (4.3%) | 10.0 |
| College or Associate's Degree | 53 (22.9%) | 46.0 |
| Bachelor's Degree | 111 (48.0%) | 111.0 |
| Graduate Degree | 39 (16.9%) | 35.0 |
| Total | 231 (100.0%) | 50.0 |
Fertility by Education by Marriage Status in Ronkonkoma
20.3% of women with births in Ronkonkoma are unmarried. Women with the educational attainment of high school diploma are most likely to be married with 100.0% of them married at childbirth, while women with the educational attainment of less than high school are least likely to be married with 38.9% of them unmarried at childbirth.
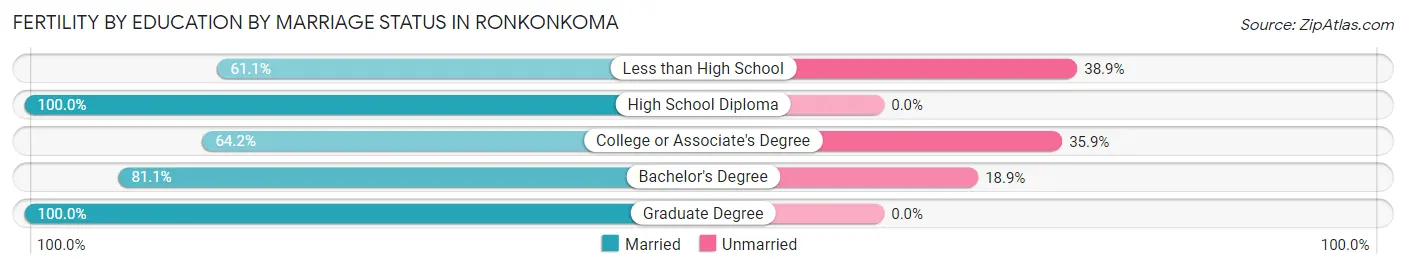
| Educational Attainment | Married | Unmarried |
| Less than High School | 11 (61.1%) | 7 (38.9%) |
| High School Diploma | 10 (100.0%) | 0 (0.0%) |
| College or Associate's Degree | 34 (64.1%) | 19 (35.8%) |
| Bachelor's Degree | 90 (81.1%) | 21 (18.9%) |
| Graduate Degree | 39 (100.0%) | 0 (0.0%) |
| Total | 184 (79.6%) | 47 (20.3%) |
Employment Characteristics in Ronkonkoma
Employment by Class of Employer in Ronkonkoma
Among the 10,115 employed individuals in Ronkonkoma, private company employees (6,800 | 67.2%), local government employees (1,164 | 11.5%), and not-for-profit organizations (622 | 6.1%) make up the most common classes of employment.
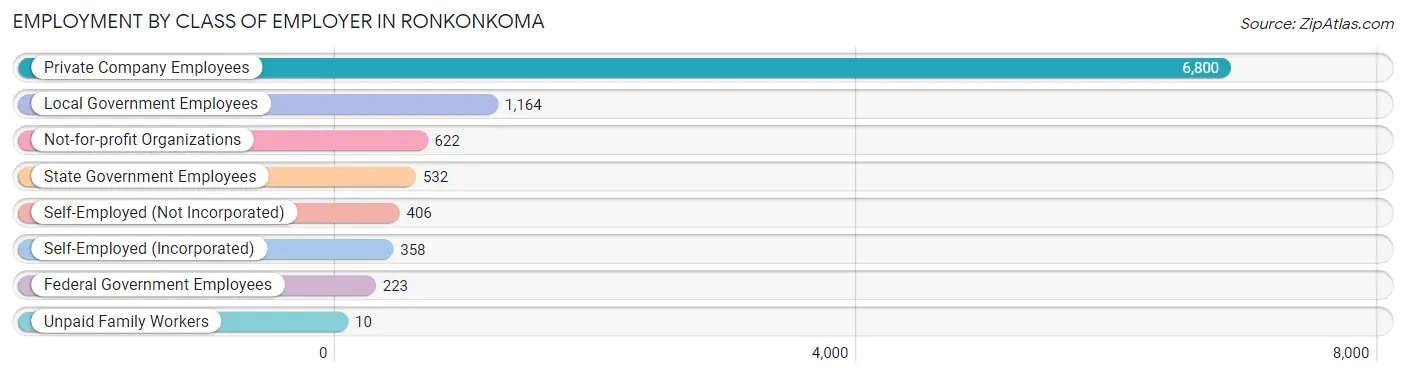
| Employer Class | # Employees | % Employees |
| Private Company Employees | 6,800 | 67.2% |
| Self-Employed (Incorporated) | 358 | 3.5% |
| Self-Employed (Not Incorporated) | 406 | 4.0% |
| Not-for-profit Organizations | 622 | 6.1% |
| Local Government Employees | 1,164 | 11.5% |
| State Government Employees | 532 | 5.3% |
| Federal Government Employees | 223 | 2.2% |
| Unpaid Family Workers | 10 | 0.1% |
| Total | 10,115 | 100.0% |
Employment Status by Age in Ronkonkoma
According to the labor force statistics for Ronkonkoma, out of the total population over 16 years of age (15,434), 72.5% or 11,190 individuals are in the labor force, with 7.2% or 806 of them unemployed. The age group with the highest labor force participation rate is 25 to 29 years, with 92.5% or 1,526 individuals in the labor force. Within the labor force, the 20 to 24 years age range has the highest percentage of unemployed individuals, with 22.0% or 291 of them being unemployed.
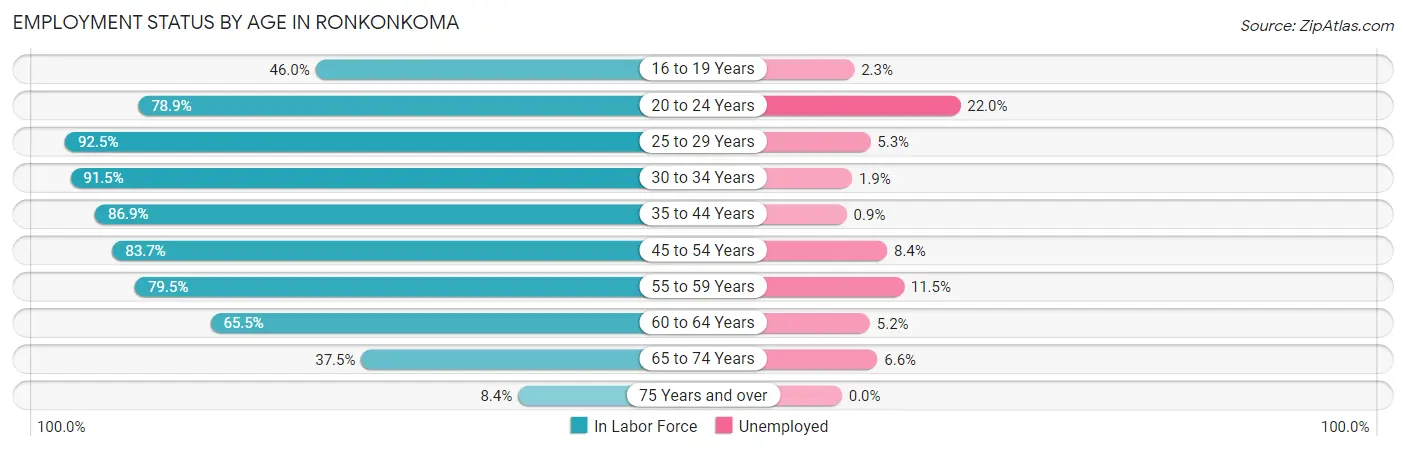
| Age Bracket | In Labor Force | Unemployed |
| 16 to 19 Years | 344 (46.0%) | 8 (2.3%) |
| 20 to 24 Years | 1,322 (78.9%) | 291 (22.0%) |
| 25 to 29 Years | 1,526 (92.5%) | 81 (5.3%) |
| 30 to 34 Years | 1,185 (91.5%) | 23 (1.9%) |
| 35 to 44 Years | 2,157 (86.9%) | 19 (0.9%) |
| 45 to 54 Years | 2,375 (83.7%) | 200 (8.4%) |
| 55 to 59 Years | 1,088 (79.5%) | 125 (11.5%) |
| 60 to 64 Years | 610 (65.5%) | 32 (5.2%) |
| 65 to 74 Years | 485 (37.5%) | 32 (6.6%) |
| 75 Years and over | 97 (8.4%) | 0 (0.0%) |
| Total | 11,190 (72.5%) | 806 (7.2%) |
Employment Status by Educational Attainment in Ronkonkoma
According to labor force statistics for Ronkonkoma, 84.6% of individuals (8,936) out of the total population between 25 and 64 years of age (10,563) are in the labor force, with 5.4% or 483 of them being unemployed. The group with the highest labor force participation rate are those with the educational attainment of bachelor's degree or higher, with 86.3% or 3,633 individuals in the labor force. Within the labor force, individuals with college / associate degree education have the highest percentage of unemployment, with 10.6% or 286 of them being unemployed.
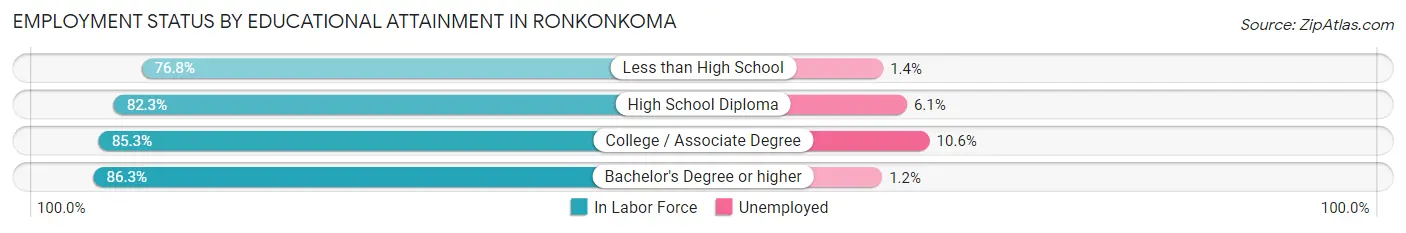
| Educational Attainment | In Labor Force | Unemployed |
| Less than High School | 281 (76.8%) | 5 (1.4%) |
| High School Diploma | 2,327 (82.3%) | 172 (6.1%) |
| College / Associate Degree | 2,695 (85.3%) | 335 (10.6%) |
| Bachelor's Degree or higher | 3,633 (86.3%) | 51 (1.2%) |
| Total | 8,936 (84.6%) | 570 (5.4%) |
Employment Occupations by Sex in Ronkonkoma
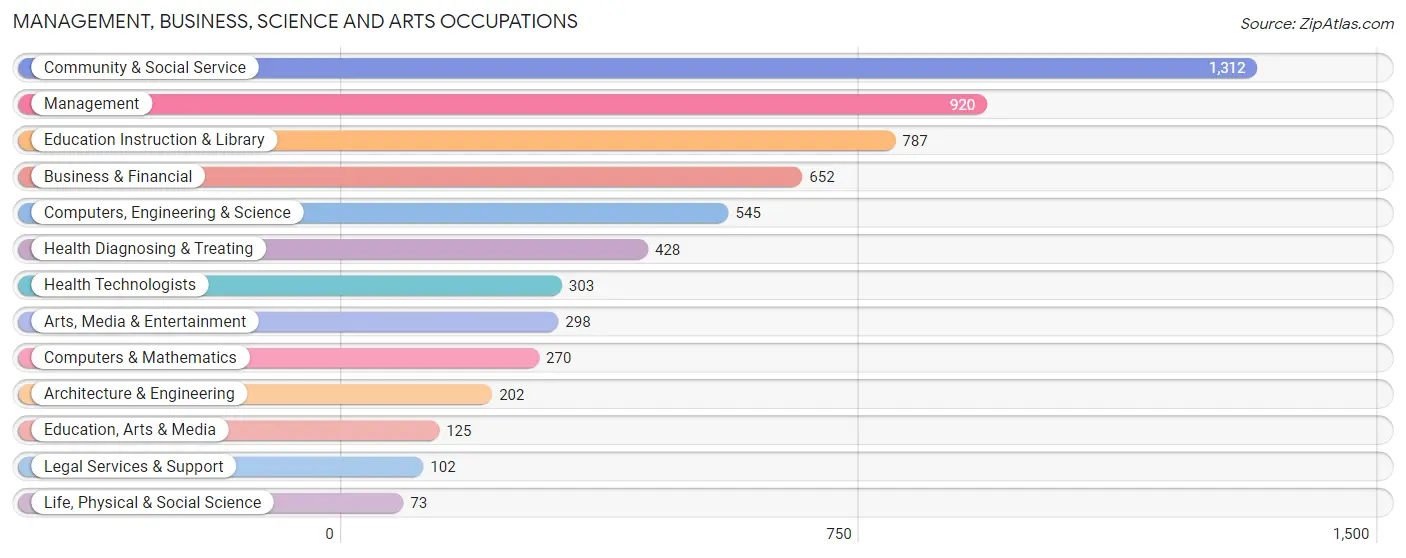
Management, Business, Science and Arts Occupations
The most common Management, Business, Science and Arts occupations in Ronkonkoma are Community & Social Service (1,312 | 12.6%), Management (920 | 8.9%), Education Instruction & Library (787 | 7.6%), Business & Financial (652 | 6.3%), and Computers, Engineering & Science (545 | 5.2%).
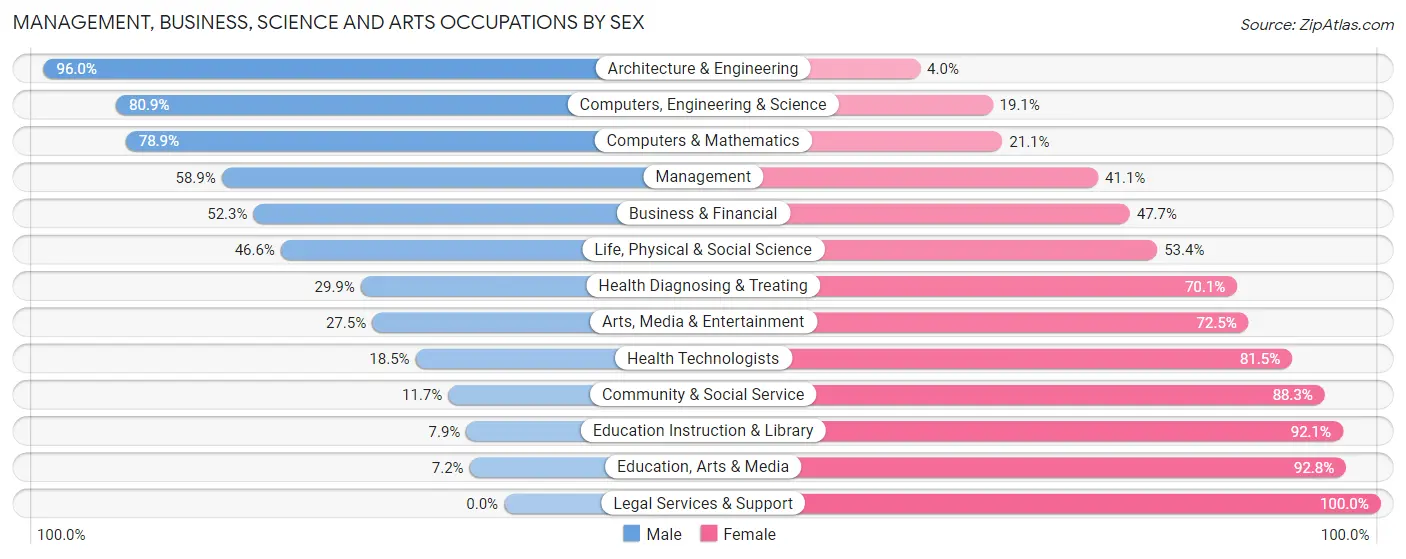
Management, Business, Science and Arts Occupations by Sex
Within the Management, Business, Science and Arts occupations in Ronkonkoma, the most male-oriented occupations are Architecture & Engineering (96.0%), Computers, Engineering & Science (80.9%), and Computers & Mathematics (78.9%), while the most female-oriented occupations are Legal Services & Support (100.0%), Education, Arts & Media (92.8%), and Education Instruction & Library (92.1%).
| Occupation | Male | Female |
| Management | 542 (58.9%) | 378 (41.1%) |
| Business & Financial | 341 (52.3%) | 311 (47.7%) |
| Computers, Engineering & Science | 441 (80.9%) | 104 (19.1%) |
| Computers & Mathematics | 213 (78.9%) | 57 (21.1%) |
| Architecture & Engineering | 194 (96.0%) | 8 (4.0%) |
| Life, Physical & Social Science | 34 (46.6%) | 39 (53.4%) |
| Community & Social Service | 153 (11.7%) | 1,159 (88.3%) |
| Education, Arts & Media | 9 (7.2%) | 116 (92.8%) |
| Legal Services & Support | 0 (0.0%) | 102 (100.0%) |
| Education Instruction & Library | 62 (7.9%) | 725 (92.1%) |
| Arts, Media & Entertainment | 82 (27.5%) | 216 (72.5%) |
| Health Diagnosing & Treating | 128 (29.9%) | 300 (70.1%) |
| Health Technologists | 56 (18.5%) | 247 (81.5%) |
| Total (Category) | 1,605 (41.6%) | 2,252 (58.4%) |
| Total (Overall) | 5,538 (53.4%) | 4,841 (46.6%) |
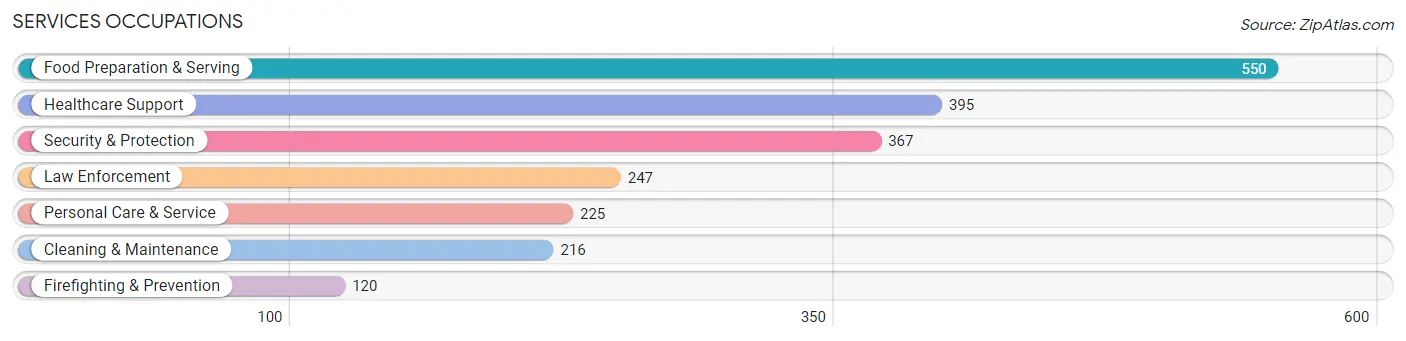
Services Occupations
The most common Services occupations in Ronkonkoma are Food Preparation & Serving (550 | 5.3%), Healthcare Support (395 | 3.8%), Security & Protection (367 | 3.5%), Law Enforcement (247 | 2.4%), and Personal Care & Service (225 | 2.2%).
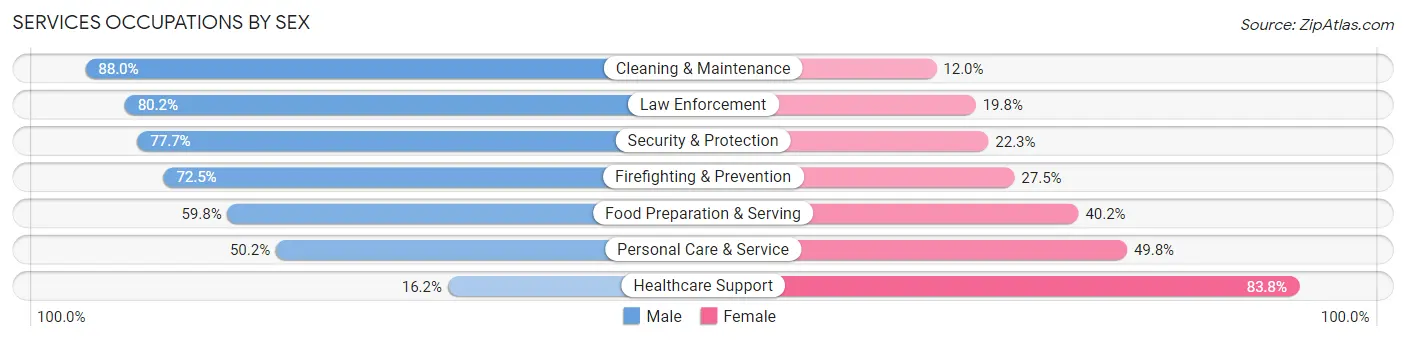
Services Occupations by Sex
Within the Services occupations in Ronkonkoma, the most male-oriented occupations are Cleaning & Maintenance (88.0%), Law Enforcement (80.2%), and Security & Protection (77.7%), while the most female-oriented occupations are Healthcare Support (83.8%), Personal Care & Service (49.8%), and Food Preparation & Serving (40.2%).
| Occupation | Male | Female |
| Healthcare Support | 64 (16.2%) | 331 (83.8%) |
| Security & Protection | 285 (77.7%) | 82 (22.3%) |
| Firefighting & Prevention | 87 (72.5%) | 33 (27.5%) |
| Law Enforcement | 198 (80.2%) | 49 (19.8%) |
| Food Preparation & Serving | 329 (59.8%) | 221 (40.2%) |
| Cleaning & Maintenance | 190 (88.0%) | 26 (12.0%) |
| Personal Care & Service | 113 (50.2%) | 112 (49.8%) |
| Total (Category) | 981 (56.0%) | 772 (44.0%) |
| Total (Overall) | 5,538 (53.4%) | 4,841 (46.6%) |
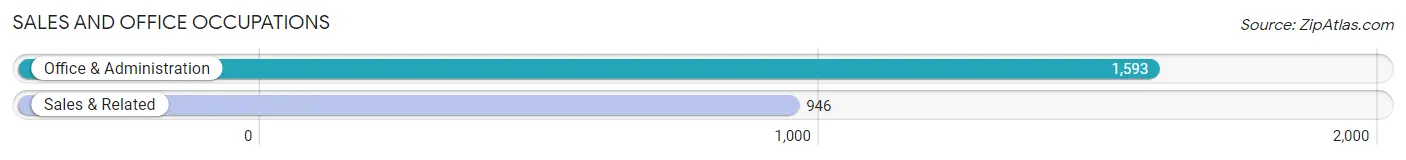
Sales and Office Occupations
The most common Sales and Office occupations in Ronkonkoma are Office & Administration (1,593 | 15.3%), and Sales & Related (946 | 9.1%).
Sales and Office Occupations by Sex
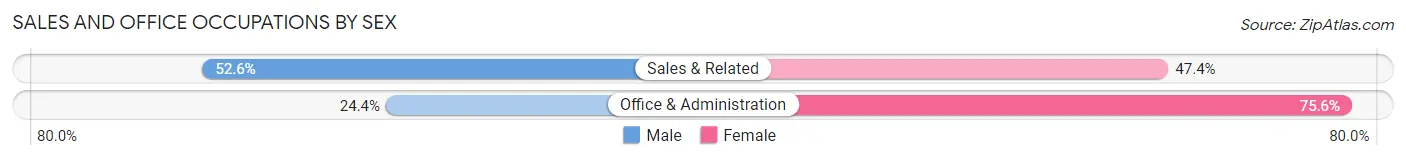
| Occupation | Male | Female |
| Sales & Related | 498 (52.6%) | 448 (47.4%) |
| Office & Administration | 389 (24.4%) | 1,204 (75.6%) |
| Total (Category) | 887 (34.9%) | 1,652 (65.1%) |
| Total (Overall) | 5,538 (53.4%) | 4,841 (46.6%) |
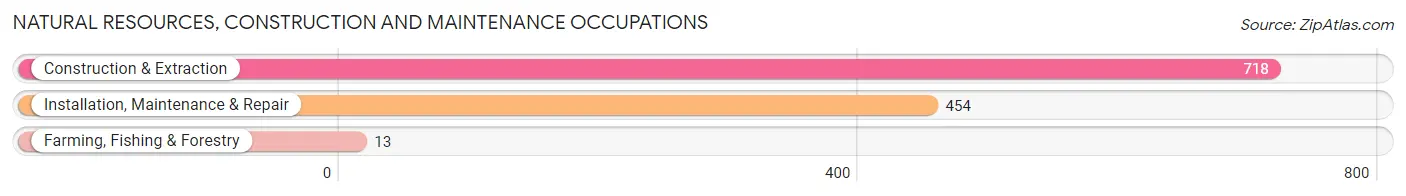
Natural Resources, Construction and Maintenance Occupations
The most common Natural Resources, Construction and Maintenance occupations in Ronkonkoma are Construction & Extraction (718 | 6.9%), Installation, Maintenance & Repair (454 | 4.4%), and Farming, Fishing & Forestry (13 | 0.1%).
Natural Resources, Construction and Maintenance Occupations by Sex
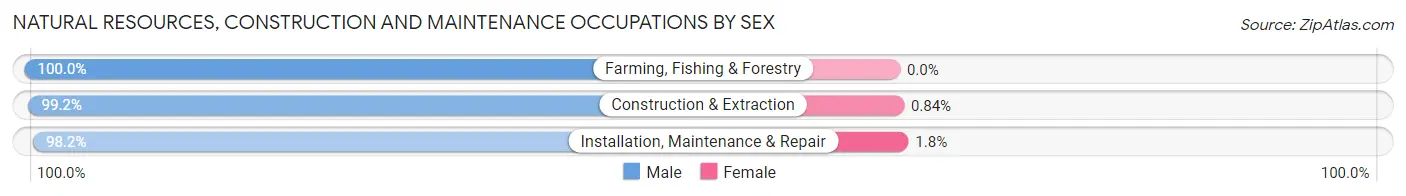
| Occupation | Male | Female |
| Farming, Fishing & Forestry | 13 (100.0%) | 0 (0.0%) |
| Construction & Extraction | 712 (99.2%) | 6 (0.8%) |
| Installation, Maintenance & Repair | 446 (98.2%) | 8 (1.8%) |
| Total (Category) | 1,171 (98.8%) | 14 (1.2%) |
| Total (Overall) | 5,538 (53.4%) | 4,841 (46.6%) |
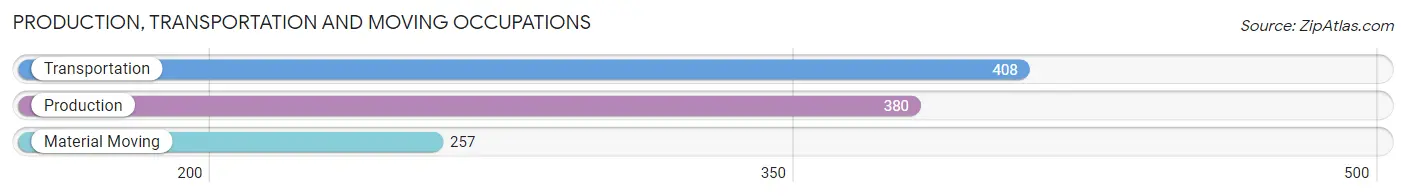
Production, Transportation and Moving Occupations
The most common Production, Transportation and Moving occupations in Ronkonkoma are Transportation (408 | 3.9%), Production (380 | 3.7%), and Material Moving (257 | 2.5%).
Production, Transportation and Moving Occupations by Sex
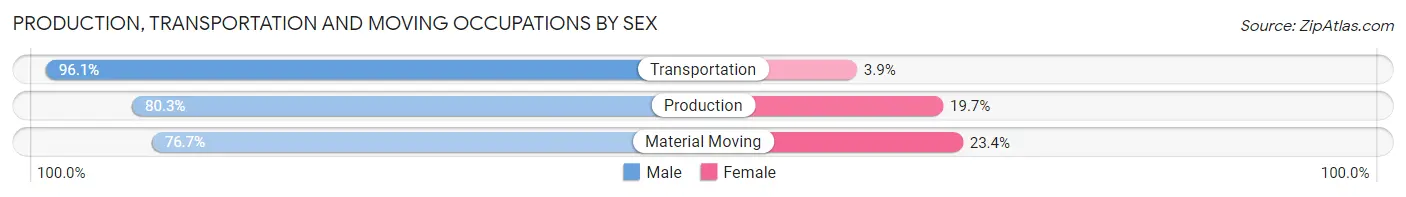
| Occupation | Male | Female |
| Production | 305 (80.3%) | 75 (19.7%) |
| Transportation | 392 (96.1%) | 16 (3.9%) |
| Material Moving | 197 (76.6%) | 60 (23.4%) |
| Total (Category) | 894 (85.6%) | 151 (14.4%) |
| Total (Overall) | 5,538 (53.4%) | 4,841 (46.6%) |
Employment Industries by Sex in Ronkonkoma
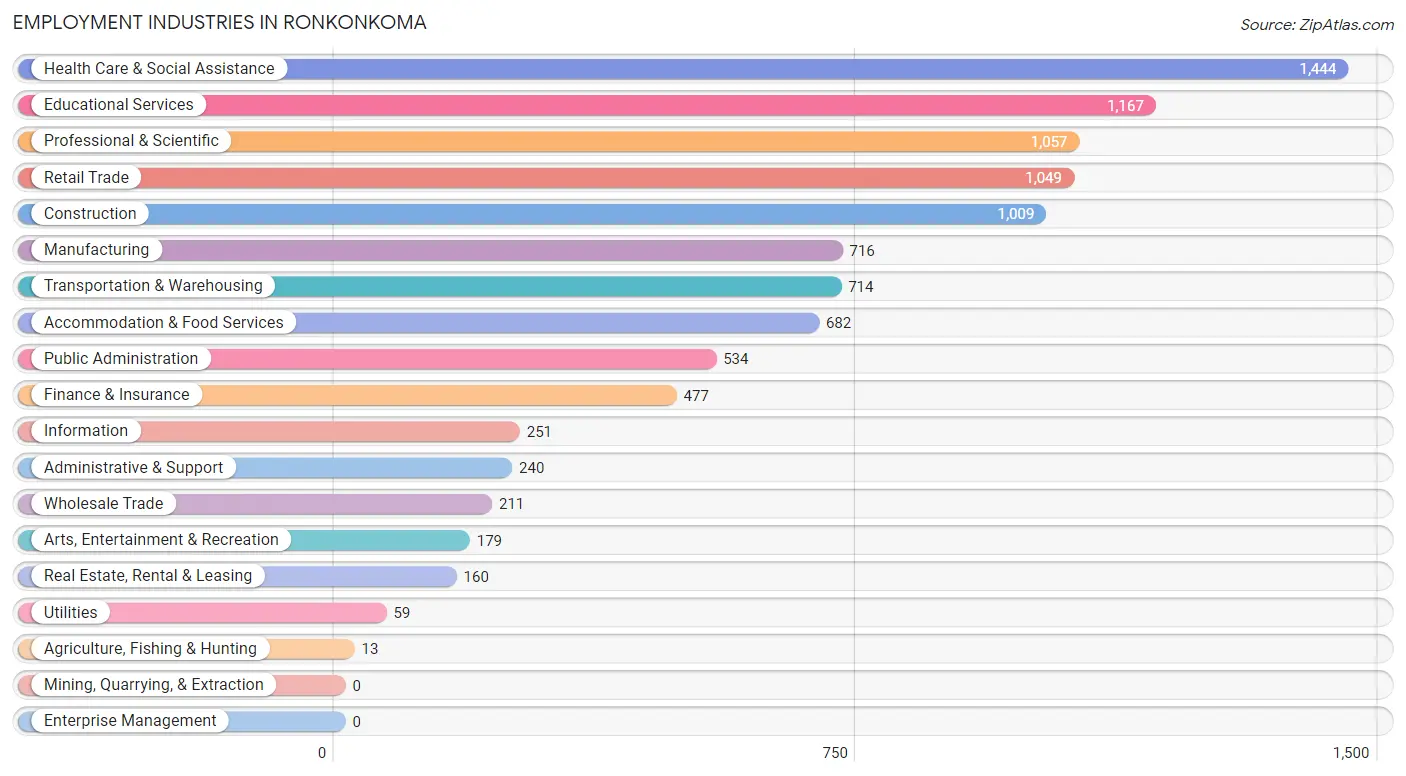
Employment Industries in Ronkonkoma
The major employment industries in Ronkonkoma include Health Care & Social Assistance (1,444 | 13.9%), Educational Services (1,167 | 11.2%), Professional & Scientific (1,057 | 10.2%), Retail Trade (1,049 | 10.1%), and Construction (1,009 | 9.7%).
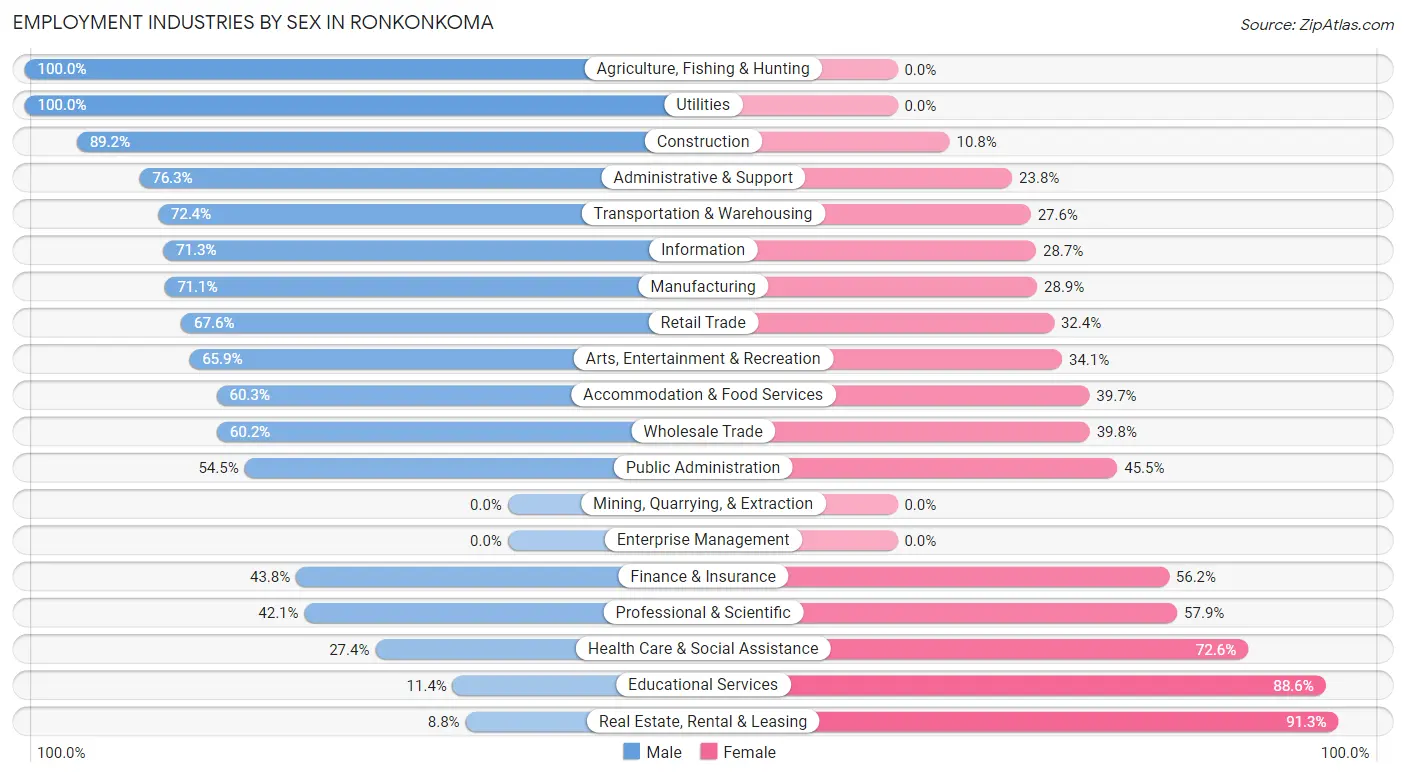
Employment Industries by Sex in Ronkonkoma
The Ronkonkoma industries that see more men than women are Agriculture, Fishing & Hunting (100.0%), Utilities (100.0%), and Construction (89.2%), whereas the industries that tend to have a higher number of women are Real Estate, Rental & Leasing (91.2%), Educational Services (88.6%), and Health Care & Social Assistance (72.6%).
| Industry | Male | Female |
| Agriculture, Fishing & Hunting | 13 (100.0%) | 0 (0.0%) |
| Mining, Quarrying, & Extraction | 0 (0.0%) | 0 (0.0%) |
| Construction | 900 (89.2%) | 109 (10.8%) |
| Manufacturing | 509 (71.1%) | 207 (28.9%) |
| Wholesale Trade | 127 (60.2%) | 84 (39.8%) |
| Retail Trade | 709 (67.6%) | 340 (32.4%) |
| Transportation & Warehousing | 517 (72.4%) | 197 (27.6%) |
| Utilities | 59 (100.0%) | 0 (0.0%) |
| Information | 179 (71.3%) | 72 (28.7%) |
| Finance & Insurance | 209 (43.8%) | 268 (56.2%) |
| Real Estate, Rental & Leasing | 14 (8.7%) | 146 (91.2%) |
| Professional & Scientific | 445 (42.1%) | 612 (57.9%) |
| Enterprise Management | 0 (0.0%) | 0 (0.0%) |
| Administrative & Support | 183 (76.2%) | 57 (23.7%) |
| Educational Services | 133 (11.4%) | 1,034 (88.6%) |
| Health Care & Social Assistance | 396 (27.4%) | 1,048 (72.6%) |
| Arts, Entertainment & Recreation | 118 (65.9%) | 61 (34.1%) |
| Accommodation & Food Services | 411 (60.3%) | 271 (39.7%) |
| Public Administration | 291 (54.5%) | 243 (45.5%) |
| Total | 5,538 (53.4%) | 4,841 (46.6%) |
Education in Ronkonkoma
School Enrollment in Ronkonkoma
The most common levels of schooling among the 4,284 students in Ronkonkoma are college / undergraduate (1,028 | 24.0%), elementary school (937 | 21.9%), and high school (815 | 19.0%).
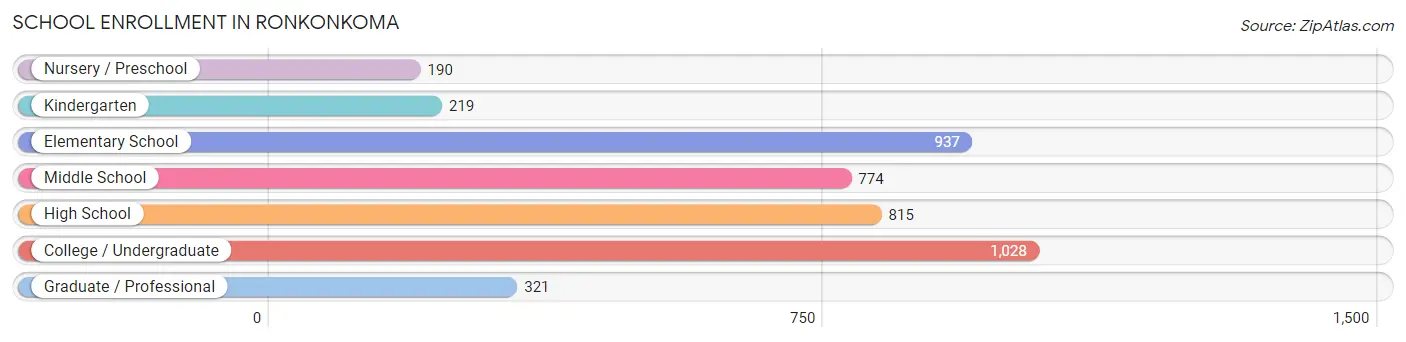
| School Level | # Students | % Students |
| Nursery / Preschool | 190 | 4.4% |
| Kindergarten | 219 | 5.1% |
| Elementary School | 937 | 21.9% |
| Middle School | 774 | 18.1% |
| High School | 815 | 19.0% |
| College / Undergraduate | 1,028 | 24.0% |
| Graduate / Professional | 321 | 7.5% |
| Total | 4,284 | 100.0% |
School Enrollment by Age by Funding Source in Ronkonkoma
Out of a total of 4,284 students who are enrolled in schools in Ronkonkoma, 441 (10.3%) attend a private institution, while the remaining 3,843 (89.7%) are enrolled in public schools. The age group of 3 to 4 year olds has the highest likelihood of being enrolled in private schools, with 64 (36.6% in the age bracket) enrolled. Conversely, the age group of 15 to 17 year olds has the lowest likelihood of being enrolled in a private school, with 572 (100.0% in the age bracket) attending a public institution.
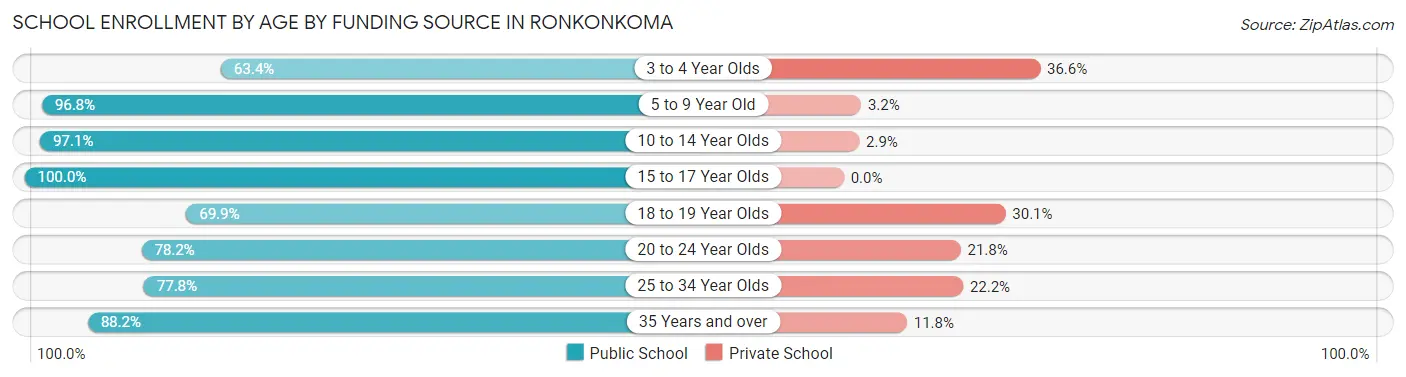
| Age Bracket | Public School | Private School |
| 3 to 4 Year Olds | 111 (63.4%) | 64 (36.6%) |
| 5 to 9 Year Old | 1,083 (96.8%) | 36 (3.2%) |
| 10 to 14 Year Olds | 949 (97.1%) | 28 (2.9%) |
| 15 to 17 Year Olds | 572 (100.0%) | 0 (0.0%) |
| 18 to 19 Year Olds | 181 (69.9%) | 78 (30.1%) |
| 20 to 24 Year Olds | 618 (78.2%) | 172 (21.8%) |
| 25 to 34 Year Olds | 133 (77.8%) | 38 (22.2%) |
| 35 Years and over | 195 (88.2%) | 26 (11.8%) |
| Total | 3,843 (89.7%) | 441 (10.3%) |
Educational Attainment by Field of Study in Ronkonkoma
Business (1,087 | 20.6%), science & technology (677 | 12.8%), education (642 | 12.2%), engineering (391 | 7.4%), and literature & languages (364 | 6.9%) are the most common fields of study among 5,274 individuals in Ronkonkoma who have obtained a bachelor's degree or higher.
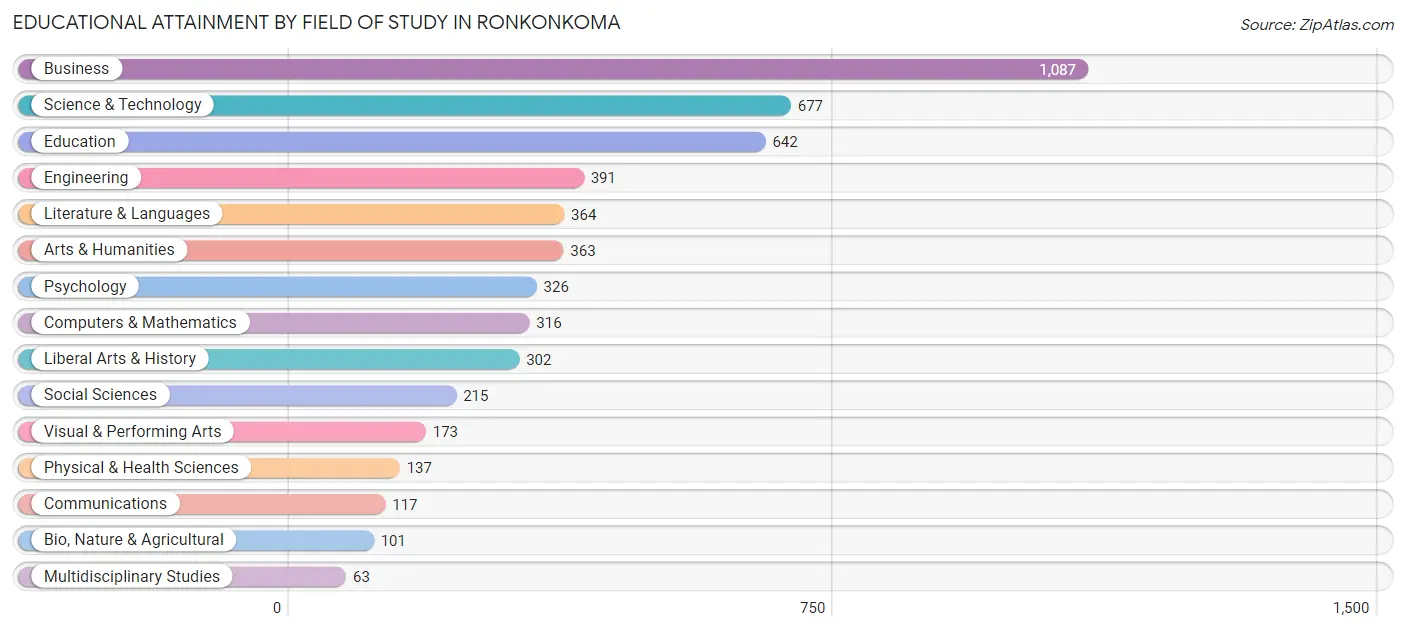
| Field of Study | # Graduates | % Graduates |
| Computers & Mathematics | 316 | 6.0% |
| Bio, Nature & Agricultural | 101 | 1.9% |
| Physical & Health Sciences | 137 | 2.6% |
| Psychology | 326 | 6.2% |
| Social Sciences | 215 | 4.1% |
| Engineering | 391 | 7.4% |
| Multidisciplinary Studies | 63 | 1.2% |
| Science & Technology | 677 | 12.8% |
| Business | 1,087 | 20.6% |
| Education | 642 | 12.2% |
| Literature & Languages | 364 | 6.9% |
| Liberal Arts & History | 302 | 5.7% |
| Visual & Performing Arts | 173 | 3.3% |
| Communications | 117 | 2.2% |
| Arts & Humanities | 363 | 6.9% |
| Total | 5,274 | 100.0% |
Transportation & Commute in Ronkonkoma
Vehicle Availability by Sex in Ronkonkoma
The most prevalent vehicle ownership categories in Ronkonkoma are males with 2 vehicles (1,592, accounting for 29.3%) and females with 2 vehicles (1,427, making up 34.1%).
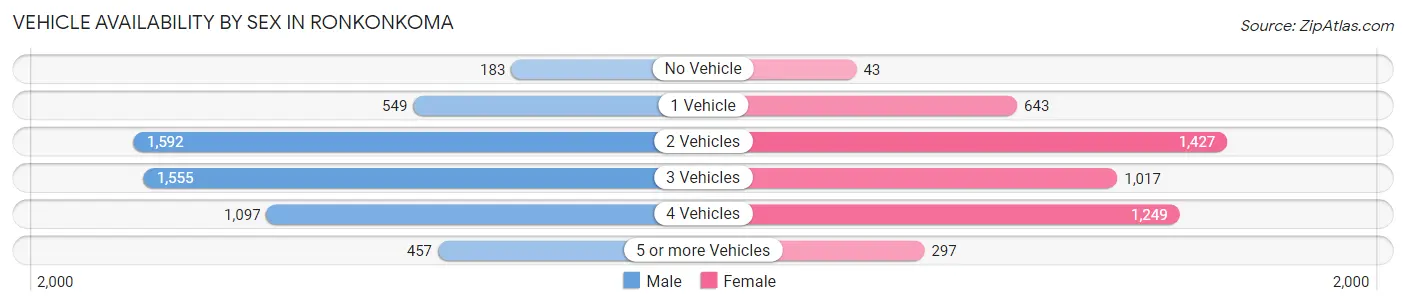
| Vehicles Available | Male | Female |
| No Vehicle | 183 (3.4%) | 43 (0.9%) |
| 1 Vehicle | 549 (10.1%) | 643 (13.8%) |
| 2 Vehicles | 1,592 (29.3%) | 1,427 (30.5%) |
| 3 Vehicles | 1,555 (28.6%) | 1,017 (21.7%) |
| 4 Vehicles | 1,097 (20.2%) | 1,249 (26.7%) |
| 5 or more Vehicles | 457 (8.4%) | 297 (6.4%) |
| Total | 5,433 (100.0%) | 4,676 (100.0%) |
Commute Time in Ronkonkoma
The most frequently occuring commute durations in Ronkonkoma are 30 to 34 minutes (1,545 commuters, 16.4%), 15 to 19 minutes (1,520 commuters, 16.1%), and 10 to 14 minutes (1,266 commuters, 13.4%).
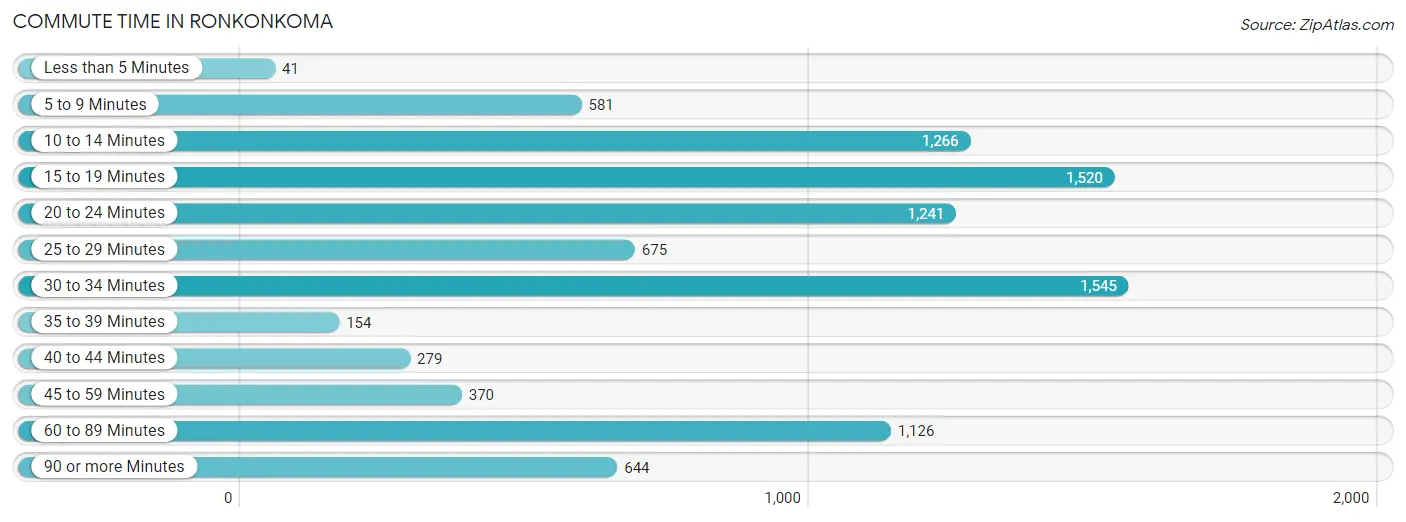
| Commute Time | # Commuters | % Commuters |
| Less than 5 Minutes | 41 | 0.4% |
| 5 to 9 Minutes | 581 | 6.1% |
| 10 to 14 Minutes | 1,266 | 13.4% |
| 15 to 19 Minutes | 1,520 | 16.1% |
| 20 to 24 Minutes | 1,241 | 13.1% |
| 25 to 29 Minutes | 675 | 7.1% |
| 30 to 34 Minutes | 1,545 | 16.4% |
| 35 to 39 Minutes | 154 | 1.6% |
| 40 to 44 Minutes | 279 | 2.9% |
| 45 to 59 Minutes | 370 | 3.9% |
| 60 to 89 Minutes | 1,126 | 11.9% |
| 90 or more Minutes | 644 | 6.8% |
Commute Time by Sex in Ronkonkoma
The most common commute times in Ronkonkoma are 30 to 34 minutes (891 commuters, 17.4%) for males and 15 to 19 minutes (808 commuters, 18.6%) for females.
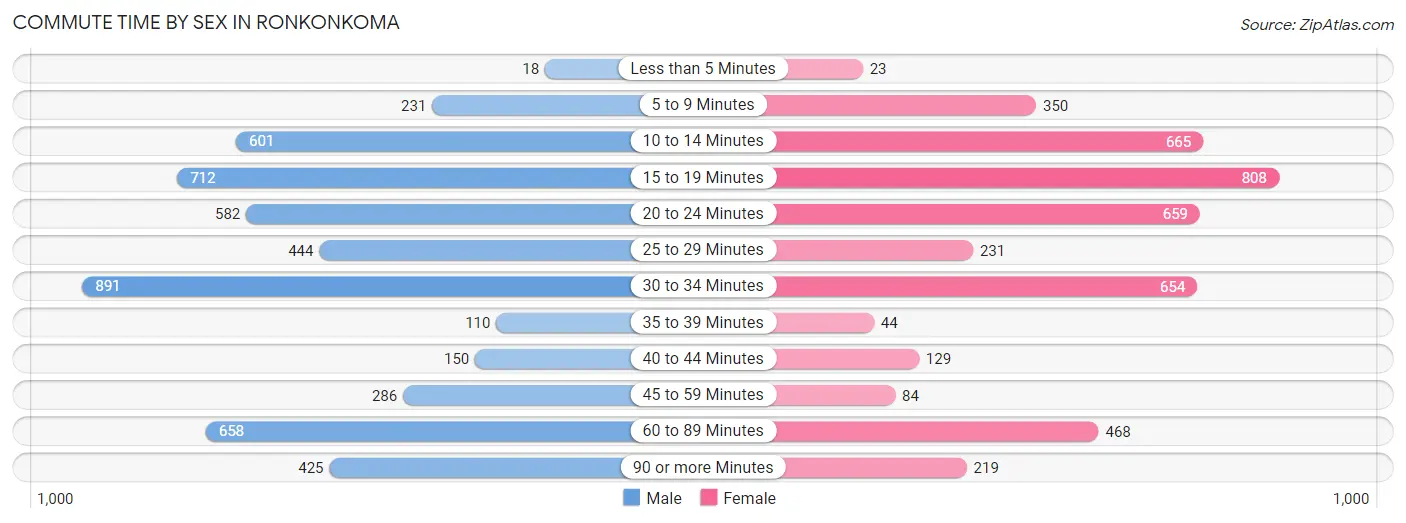
| Commute Time | Male | Female |
| Less than 5 Minutes | 18 (0.4%) | 23 (0.5%) |
| 5 to 9 Minutes | 231 (4.5%) | 350 (8.1%) |
| 10 to 14 Minutes | 601 (11.8%) | 665 (15.3%) |
| 15 to 19 Minutes | 712 (13.9%) | 808 (18.6%) |
| 20 to 24 Minutes | 582 (11.4%) | 659 (15.2%) |
| 25 to 29 Minutes | 444 (8.7%) | 231 (5.3%) |
| 30 to 34 Minutes | 891 (17.4%) | 654 (15.1%) |
| 35 to 39 Minutes | 110 (2.1%) | 44 (1.0%) |
| 40 to 44 Minutes | 150 (2.9%) | 129 (3.0%) |
| 45 to 59 Minutes | 286 (5.6%) | 84 (1.9%) |
| 60 to 89 Minutes | 658 (12.9%) | 468 (10.8%) |
| 90 or more Minutes | 425 (8.3%) | 219 (5.1%) |
Time of Departure to Work by Sex in Ronkonkoma
The most frequent times of departure to work in Ronkonkoma are 8:00 AM to 8:29 AM (891, 17.4%) for males and 8:00 AM to 8:29 AM (1,104, 25.5%) for females.
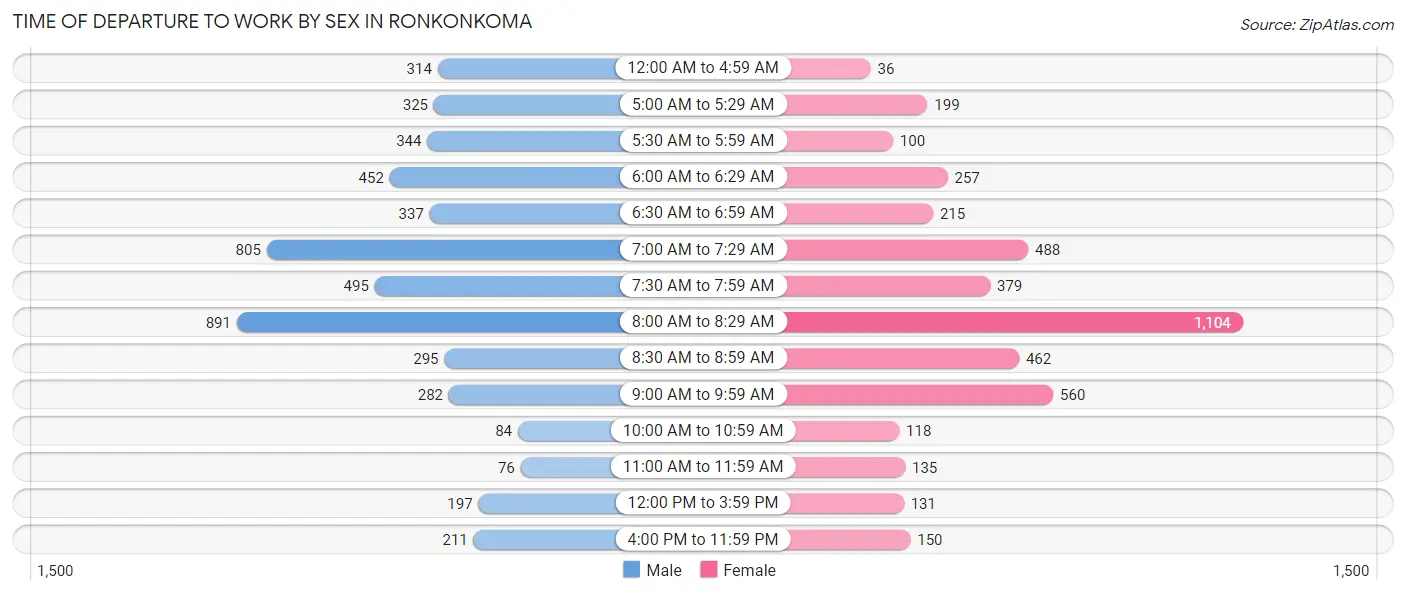
| Time of Departure | Male | Female |
| 12:00 AM to 4:59 AM | 314 (6.1%) | 36 (0.8%) |
| 5:00 AM to 5:29 AM | 325 (6.4%) | 199 (4.6%) |
| 5:30 AM to 5:59 AM | 344 (6.7%) | 100 (2.3%) |
| 6:00 AM to 6:29 AM | 452 (8.8%) | 257 (5.9%) |
| 6:30 AM to 6:59 AM | 337 (6.6%) | 215 (5.0%) |
| 7:00 AM to 7:29 AM | 805 (15.8%) | 488 (11.3%) |
| 7:30 AM to 7:59 AM | 495 (9.7%) | 379 (8.7%) |
| 8:00 AM to 8:29 AM | 891 (17.4%) | 1,104 (25.5%) |
| 8:30 AM to 8:59 AM | 295 (5.8%) | 462 (10.7%) |
| 9:00 AM to 9:59 AM | 282 (5.5%) | 560 (12.9%) |
| 10:00 AM to 10:59 AM | 84 (1.6%) | 118 (2.7%) |
| 11:00 AM to 11:59 AM | 76 (1.5%) | 135 (3.1%) |
| 12:00 PM to 3:59 PM | 197 (3.9%) | 131 (3.0%) |
| 4:00 PM to 11:59 PM | 211 (4.1%) | 150 (3.5%) |
| Total | 5,108 (100.0%) | 4,334 (100.0%) |
Housing Occupancy in Ronkonkoma
Occupancy by Ownership in Ronkonkoma
Of the total 6,190 dwellings in Ronkonkoma, owner-occupied units account for 4,877 (78.8%), while renter-occupied units make up 1,313 (21.2%).
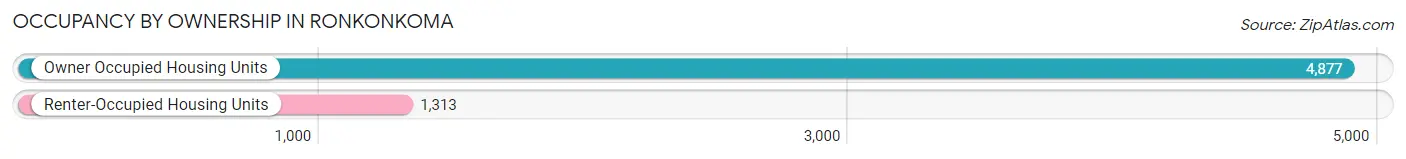
| Occupancy | # Housing Units | % Housing Units |
| Owner Occupied Housing Units | 4,877 | 78.8% |
| Renter-Occupied Housing Units | 1,313 | 21.2% |
| Total Occupied Housing Units | 6,190 | 100.0% |
Occupancy by Household Size in Ronkonkoma
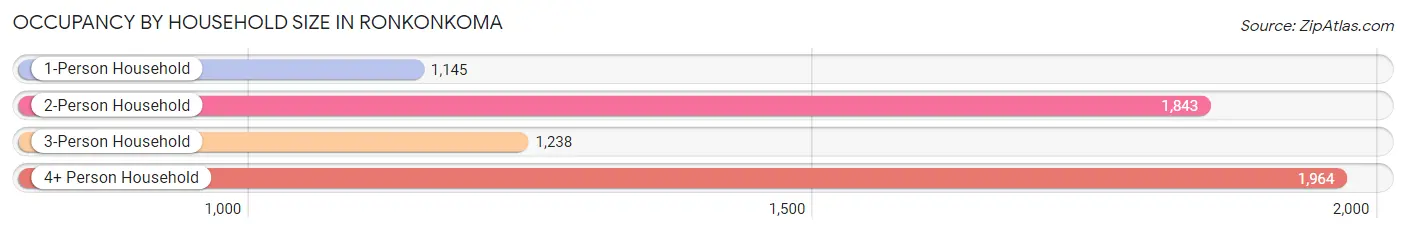
| Household Size | # Housing Units | % Housing Units |
| 1-Person Household | 1,145 | 18.5% |
| 2-Person Household | 1,843 | 29.8% |
| 3-Person Household | 1,238 | 20.0% |
| 4+ Person Household | 1,964 | 31.7% |
| Total Housing Units | 6,190 | 100.0% |
Occupancy by Ownership by Household Size in Ronkonkoma
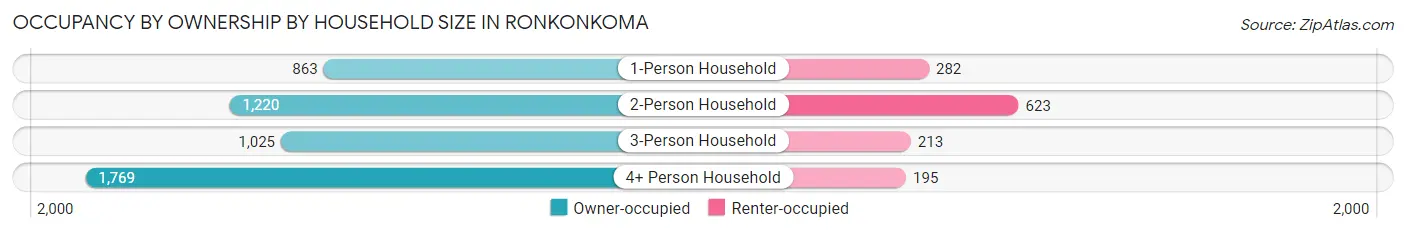
| Household Size | Owner-occupied | Renter-occupied |
| 1-Person Household | 863 (75.4%) | 282 (24.6%) |
| 2-Person Household | 1,220 (66.2%) | 623 (33.8%) |
| 3-Person Household | 1,025 (82.8%) | 213 (17.2%) |
| 4+ Person Household | 1,769 (90.1%) | 195 (9.9%) |
| Total Housing Units | 4,877 (78.8%) | 1,313 (21.2%) |
Occupancy by Educational Attainment in Ronkonkoma
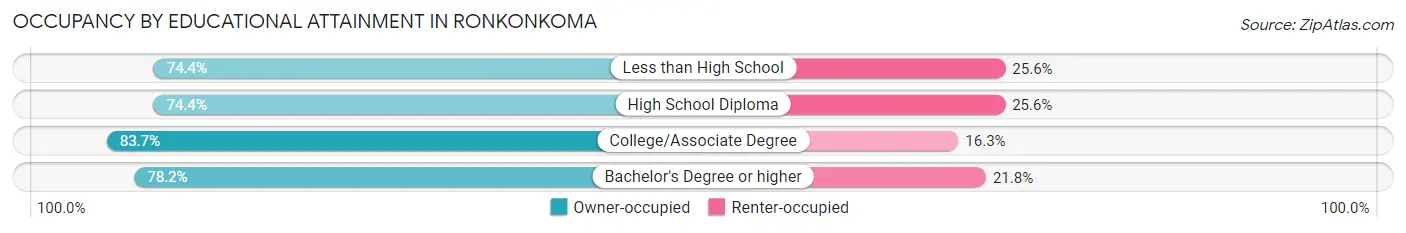
| Household Size | Owner-occupied | Renter-occupied |
| Less than High School | 119 (74.4%) | 41 (25.6%) |
| High School Diploma | 1,251 (74.4%) | 430 (25.6%) |
| College/Associate Degree | 1,602 (83.7%) | 312 (16.3%) |
| Bachelor's Degree or higher | 1,905 (78.2%) | 530 (21.8%) |
Occupancy by Age of Householder in Ronkonkoma
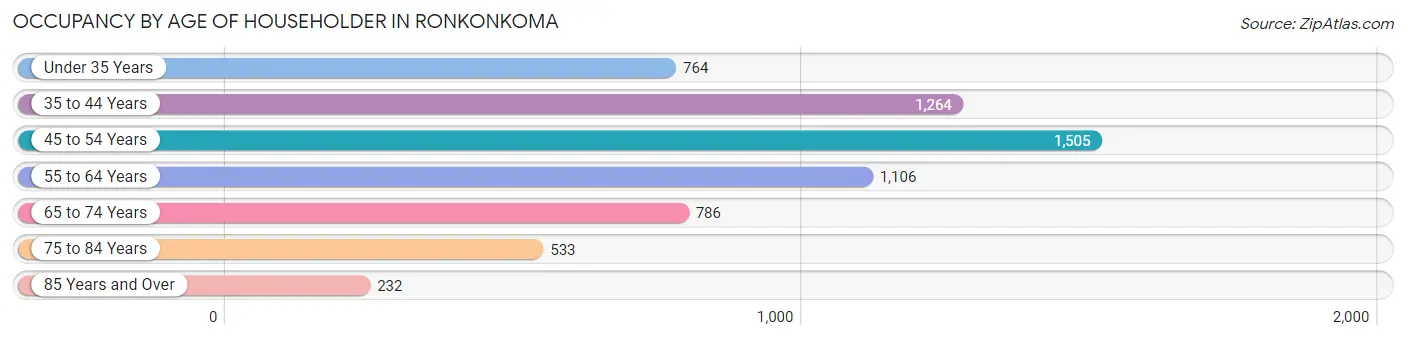
| Age Bracket | # Households | % Households |
| Under 35 Years | 764 | 12.3% |
| 35 to 44 Years | 1,264 | 20.4% |
| 45 to 54 Years | 1,505 | 24.3% |
| 55 to 64 Years | 1,106 | 17.9% |
| 65 to 74 Years | 786 | 12.7% |
| 75 to 84 Years | 533 | 8.6% |
| 85 Years and Over | 232 | 3.7% |
| Total | 6,190 | 100.0% |
Housing Finances in Ronkonkoma
Median Income by Occupancy in Ronkonkoma
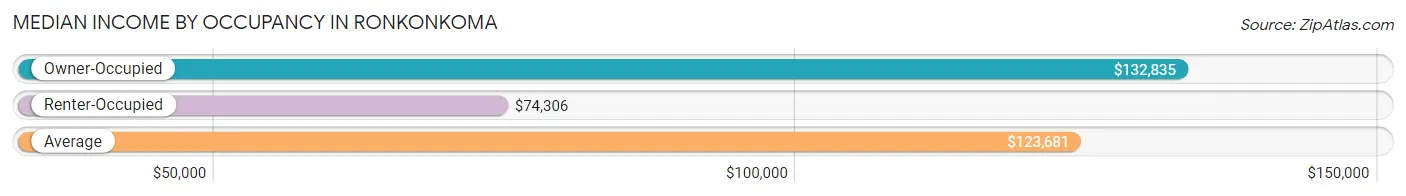
| Occupancy Type | # Households | Median Income |
| Owner-Occupied | 4,877 (78.8%) | $132,835 |
| Renter-Occupied | 1,313 (21.2%) | $74,306 |
| Average | 6,190 (100.0%) | $123,681 |
Occupancy by Householder Income Bracket in Ronkonkoma
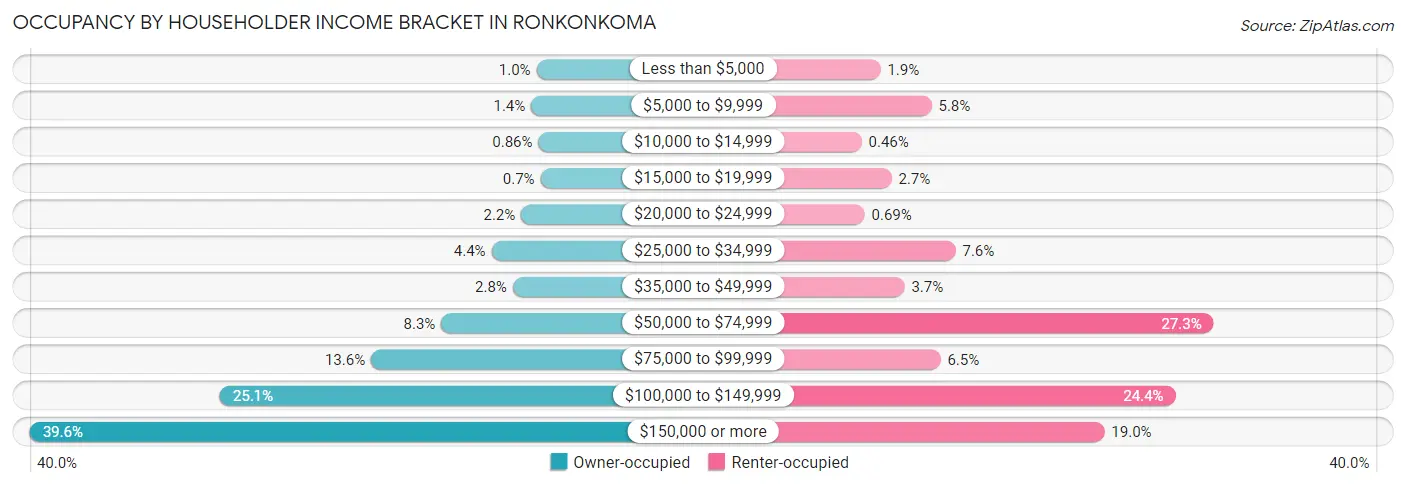
| Income Bracket | Owner-occupied | Renter-occupied |
| Less than $5,000 | 49 (1.0%) | 25 (1.9%) |
| $5,000 to $9,999 | 69 (1.4%) | 76 (5.8%) |
| $10,000 to $14,999 | 42 (0.9%) | 6 (0.5%) |
| $15,000 to $19,999 | 34 (0.7%) | 36 (2.7%) |
| $20,000 to $24,999 | 106 (2.2%) | 9 (0.7%) |
| $25,000 to $34,999 | 216 (4.4%) | 100 (7.6%) |
| $35,000 to $49,999 | 137 (2.8%) | 49 (3.7%) |
| $50,000 to $74,999 | 403 (8.3%) | 358 (27.3%) |
| $75,000 to $99,999 | 664 (13.6%) | 85 (6.5%) |
| $100,000 to $149,999 | 1,225 (25.1%) | 320 (24.4%) |
| $150,000 or more | 1,932 (39.6%) | 249 (19.0%) |
| Total | 4,877 (100.0%) | 1,313 (100.0%) |
Monthly Housing Cost Tiers in Ronkonkoma
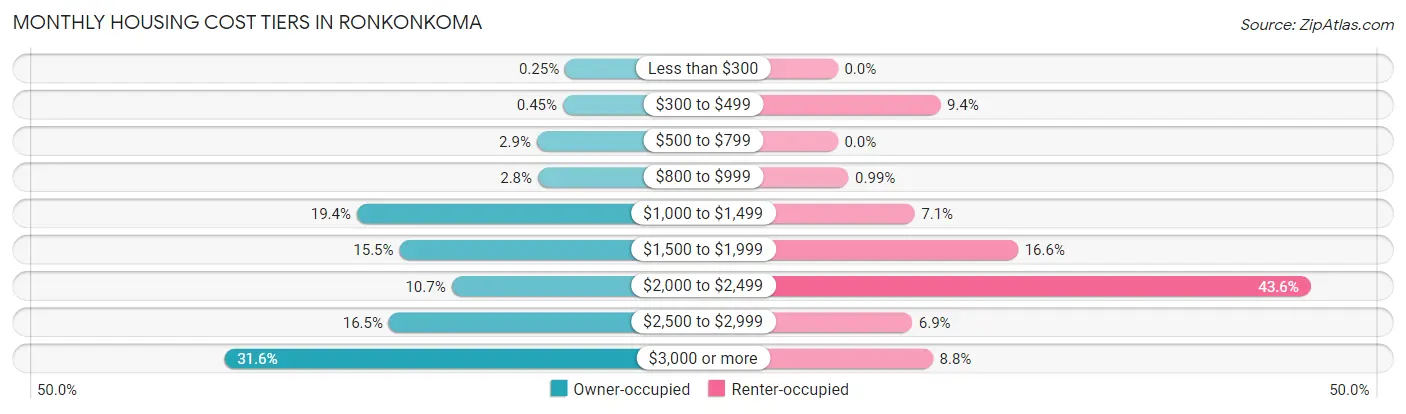
| Monthly Cost | Owner-occupied | Renter-occupied |
| Less than $300 | 12 (0.3%) | 0 (0.0%) |
| $300 to $499 | 22 (0.4%) | 124 (9.4%) |
| $500 to $799 | 139 (2.9%) | 0 (0.0%) |
| $800 to $999 | 134 (2.8%) | 13 (1.0%) |
| $1,000 to $1,499 | 947 (19.4%) | 93 (7.1%) |
| $1,500 to $1,999 | 756 (15.5%) | 218 (16.6%) |
| $2,000 to $2,499 | 522 (10.7%) | 572 (43.6%) |
| $2,500 to $2,999 | 803 (16.5%) | 90 (6.9%) |
| $3,000 or more | 1,542 (31.6%) | 115 (8.8%) |
| Total | 4,877 (100.0%) | 1,313 (100.0%) |
Physical Housing Characteristics in Ronkonkoma
Housing Structures in Ronkonkoma
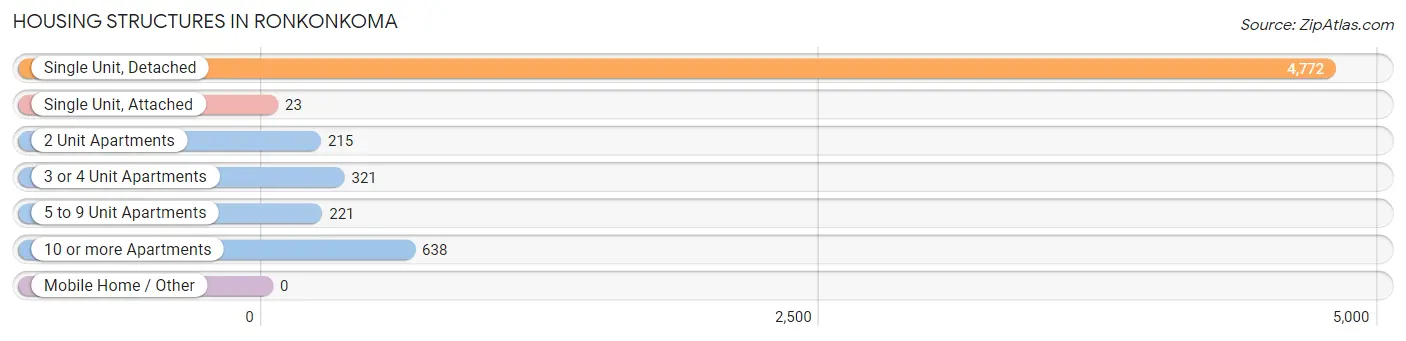
| Structure Type | # Housing Units | % Housing Units |
| Single Unit, Detached | 4,772 | 77.1% |
| Single Unit, Attached | 23 | 0.4% |
| 2 Unit Apartments | 215 | 3.5% |
| 3 or 4 Unit Apartments | 321 | 5.2% |
| 5 to 9 Unit Apartments | 221 | 3.6% |
| 10 or more Apartments | 638 | 10.3% |
| Mobile Home / Other | 0 | 0.0% |
| Total | 6,190 | 100.0% |
Housing Structures by Occupancy in Ronkonkoma
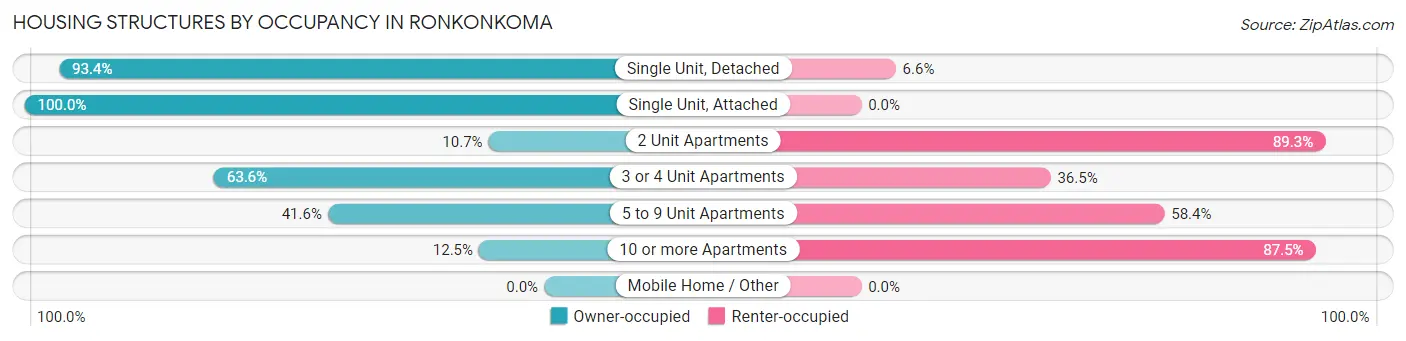
| Structure Type | Owner-occupied | Renter-occupied |
| Single Unit, Detached | 4,455 (93.4%) | 317 (6.6%) |
| Single Unit, Attached | 23 (100.0%) | 0 (0.0%) |
| 2 Unit Apartments | 23 (10.7%) | 192 (89.3%) |
| 3 or 4 Unit Apartments | 204 (63.5%) | 117 (36.4%) |
| 5 to 9 Unit Apartments | 92 (41.6%) | 129 (58.4%) |
| 10 or more Apartments | 80 (12.5%) | 558 (87.5%) |
| Mobile Home / Other | 0 (0.0%) | 0 (0.0%) |
| Total | 4,877 (78.8%) | 1,313 (21.2%) |
Housing Structures by Number of Rooms in Ronkonkoma
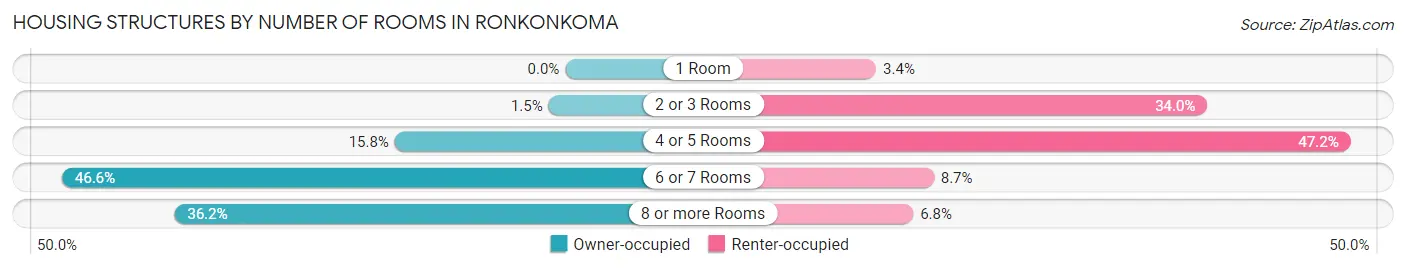
| Number of Rooms | Owner-occupied | Renter-occupied |
| 1 Room | 0 (0.0%) | 44 (3.4%) |
| 2 or 3 Rooms | 75 (1.5%) | 446 (34.0%) |
| 4 or 5 Rooms | 769 (15.8%) | 620 (47.2%) |
| 6 or 7 Rooms | 2,270 (46.6%) | 114 (8.7%) |
| 8 or more Rooms | 1,763 (36.1%) | 89 (6.8%) |
| Total | 4,877 (100.0%) | 1,313 (100.0%) |
Housing Structure by Heating Type in Ronkonkoma
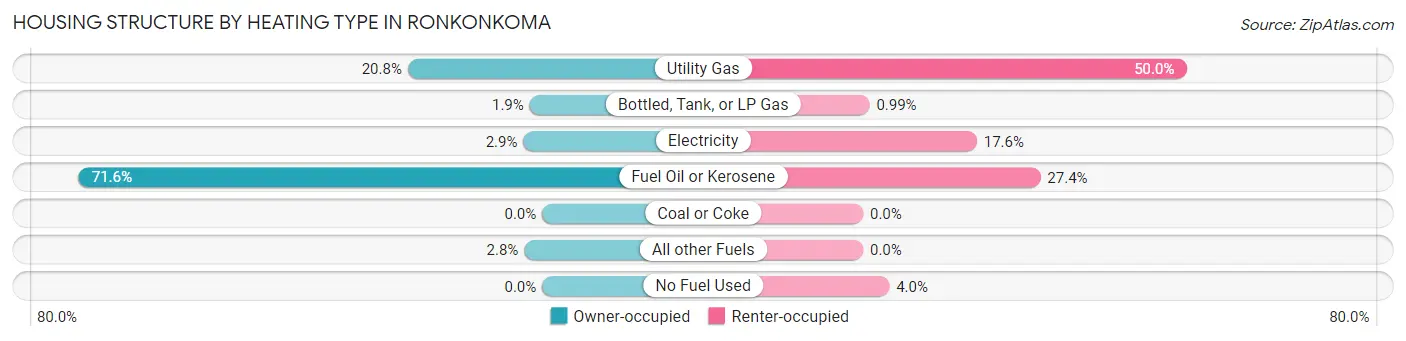
| Heating Type | Owner-occupied | Renter-occupied |
| Utility Gas | 1,013 (20.8%) | 656 (50.0%) |
| Bottled, Tank, or LP Gas | 94 (1.9%) | 13 (1.0%) |
| Electricity | 142 (2.9%) | 231 (17.6%) |
| Fuel Oil or Kerosene | 3,493 (71.6%) | 360 (27.4%) |
| Coal or Coke | 0 (0.0%) | 0 (0.0%) |
| All other Fuels | 135 (2.8%) | 0 (0.0%) |
| No Fuel Used | 0 (0.0%) | 53 (4.0%) |
| Total | 4,877 (100.0%) | 1,313 (100.0%) |
Household Vehicle Usage in Ronkonkoma
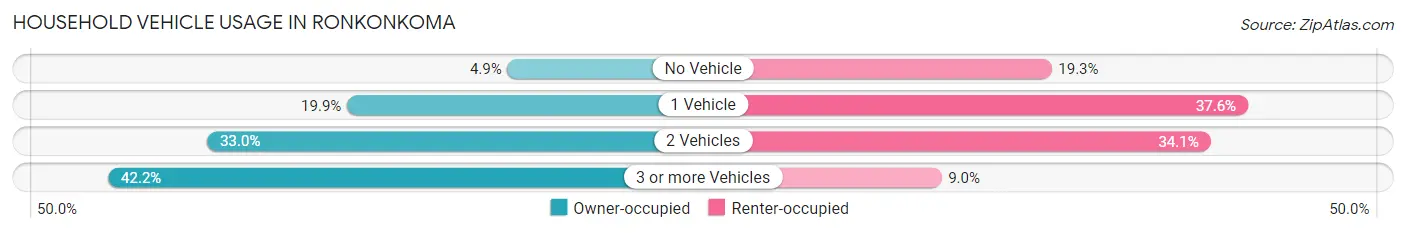
| Vehicles per Household | Owner-occupied | Renter-occupied |
| No Vehicle | 240 (4.9%) | 253 (19.3%) |
| 1 Vehicle | 970 (19.9%) | 494 (37.6%) |
| 2 Vehicles | 1,608 (33.0%) | 448 (34.1%) |
| 3 or more Vehicles | 2,059 (42.2%) | 118 (9.0%) |
| Total | 4,877 (100.0%) | 1,313 (100.0%) |
Real Estate & Mortgages in Ronkonkoma
Real Estate and Mortgage Overview in Ronkonkoma
| Characteristic | Without Mortgage | With Mortgage |
| Housing Units | 1,690 | 3,187 |
| Median Property Value | $433,500 | $438,800 |
| Median Household Income | $87,458 | $1,493 |
| Monthly Housing Costs | $1,298 | $1,526 |
| Real Estate Taxes | $9,426 | $6 |
Property Value by Mortgage Status in Ronkonkoma
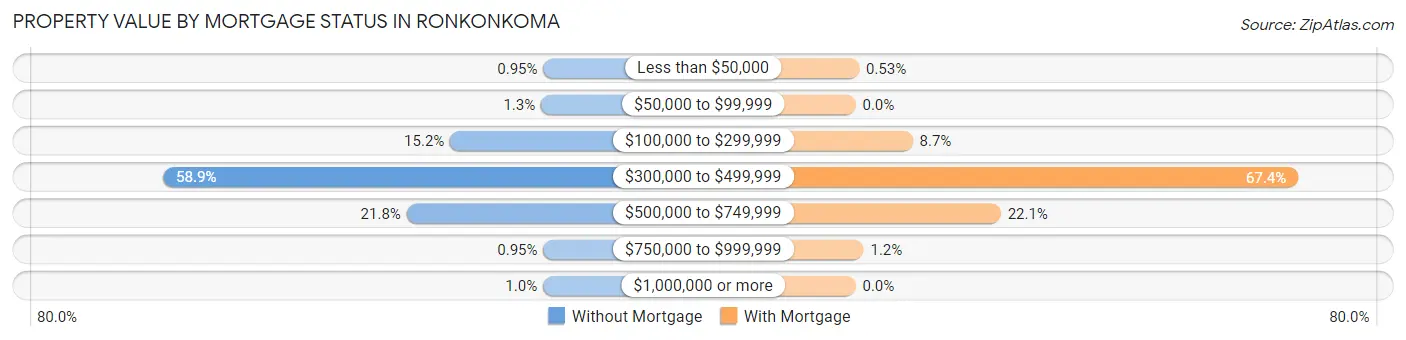
| Property Value | Without Mortgage | With Mortgage |
| Less than $50,000 | 16 (0.9%) | 17 (0.5%) |
| $50,000 to $99,999 | 22 (1.3%) | 0 (0.0%) |
| $100,000 to $299,999 | 256 (15.1%) | 277 (8.7%) |
| $300,000 to $499,999 | 995 (58.9%) | 2,149 (67.4%) |
| $500,000 to $749,999 | 368 (21.8%) | 705 (22.1%) |
| $750,000 to $999,999 | 16 (0.9%) | 39 (1.2%) |
| $1,000,000 or more | 17 (1.0%) | 0 (0.0%) |
| Total | 1,690 (100.0%) | 3,187 (100.0%) |
Household Income by Mortgage Status in Ronkonkoma
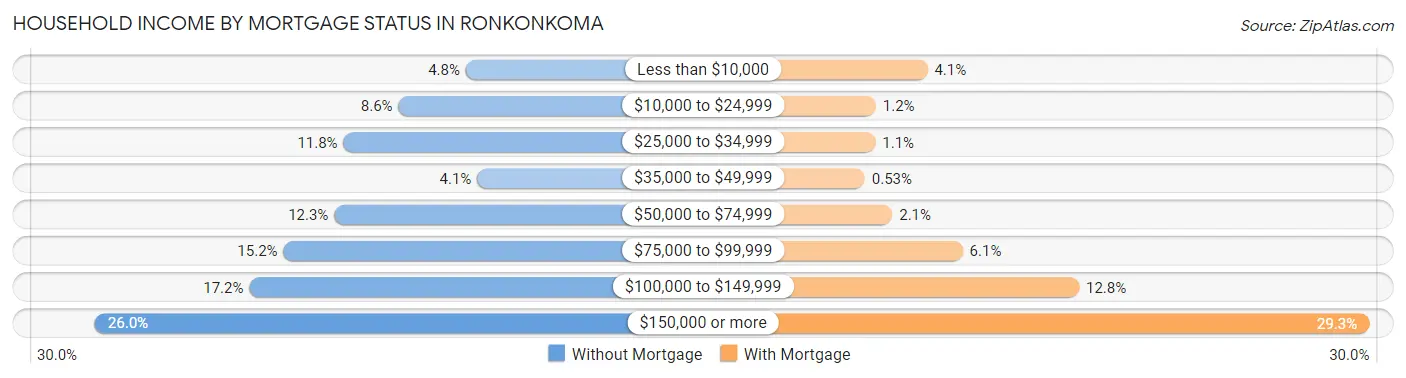
| Household Income | Without Mortgage | With Mortgage |
| Less than $10,000 | 81 (4.8%) | 131 (4.1%) |
| $10,000 to $24,999 | 146 (8.6%) | 37 (1.2%) |
| $25,000 to $34,999 | 199 (11.8%) | 36 (1.1%) |
| $35,000 to $49,999 | 70 (4.1%) | 17 (0.5%) |
| $50,000 to $74,999 | 208 (12.3%) | 67 (2.1%) |
| $75,000 to $99,999 | 257 (15.2%) | 195 (6.1%) |
| $100,000 to $149,999 | 290 (17.2%) | 407 (12.8%) |
| $150,000 or more | 439 (26.0%) | 935 (29.3%) |
| Total | 1,690 (100.0%) | 3,187 (100.0%) |
Property Value to Household Income Ratio in Ronkonkoma
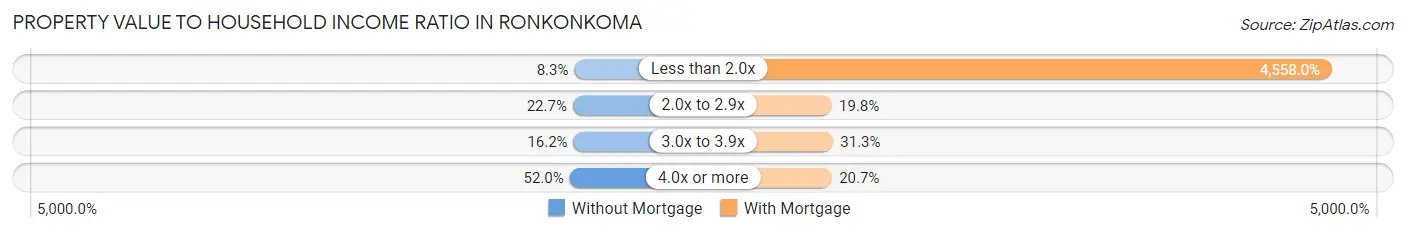
| Value-to-Income Ratio | Without Mortgage | With Mortgage |
| Less than 2.0x | 141 (8.3%) | 145,262 (4,558.0%) |
| 2.0x to 2.9x | 383 (22.7%) | 632 (19.8%) |
| 3.0x to 3.9x | 273 (16.2%) | 996 (31.2%) |
| 4.0x or more | 878 (51.9%) | 658 (20.6%) |
| Total | 1,690 (100.0%) | 3,187 (100.0%) |
Real Estate Taxes by Mortgage Status in Ronkonkoma
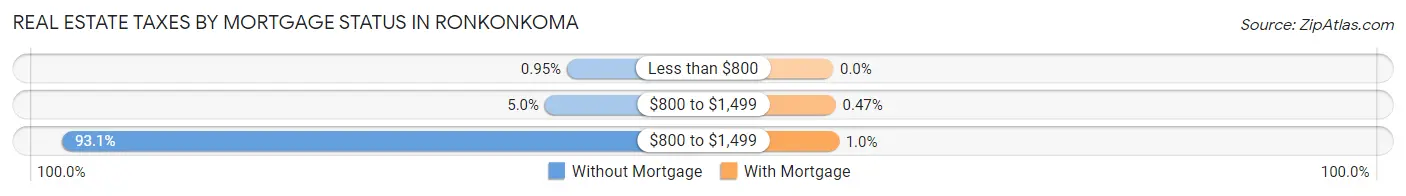
| Property Taxes | Without Mortgage | With Mortgage |
| Less than $800 | 16 (0.9%) | 0 (0.0%) |
| $800 to $1,499 | 84 (5.0%) | 15 (0.5%) |
| $800 to $1,499 | 1,574 (93.1%) | 33 (1.0%) |
| Total | 1,690 (100.0%) | 3,187 (100.0%) |
Health & Disability in Ronkonkoma
Health Insurance Coverage by Age in Ronkonkoma
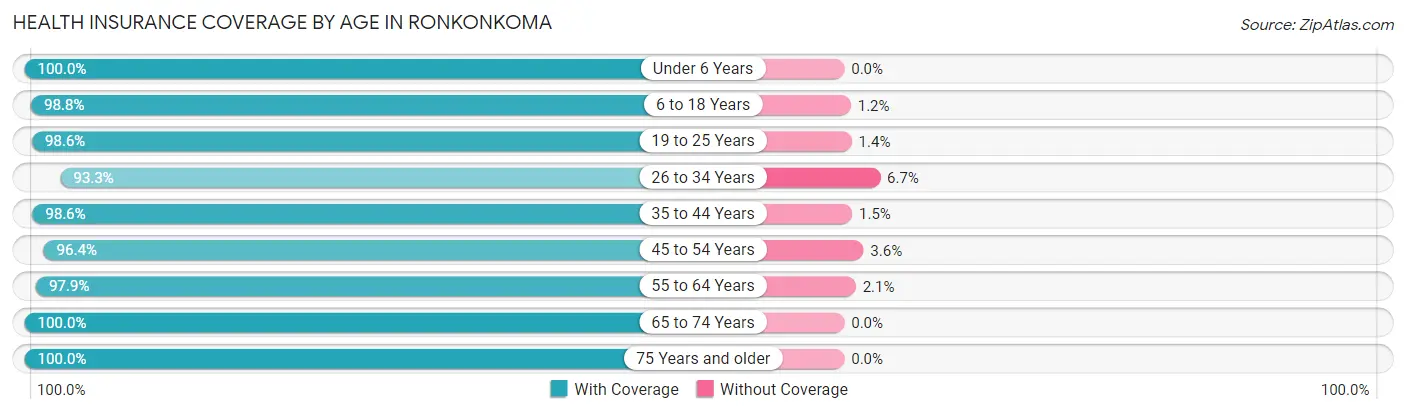
| Age Bracket | With Coverage | Without Coverage |
| Under 6 Years | 1,257 (100.0%) | 0 (0.0%) |
| 6 to 18 Years | 2,695 (98.8%) | 33 (1.2%) |
| 19 to 25 Years | 2,021 (98.6%) | 28 (1.4%) |
| 26 to 34 Years | 2,556 (93.3%) | 183 (6.7%) |
| 35 to 44 Years | 2,446 (98.6%) | 36 (1.5%) |
| 45 to 54 Years | 2,736 (96.4%) | 101 (3.6%) |
| 55 to 64 Years | 2,250 (97.9%) | 49 (2.1%) |
| 65 to 74 Years | 1,293 (100.0%) | 0 (0.0%) |
| 75 Years and older | 1,154 (100.0%) | 0 (0.0%) |
| Total | 18,408 (97.7%) | 430 (2.3%) |
Health Insurance Coverage by Citizenship Status in Ronkonkoma
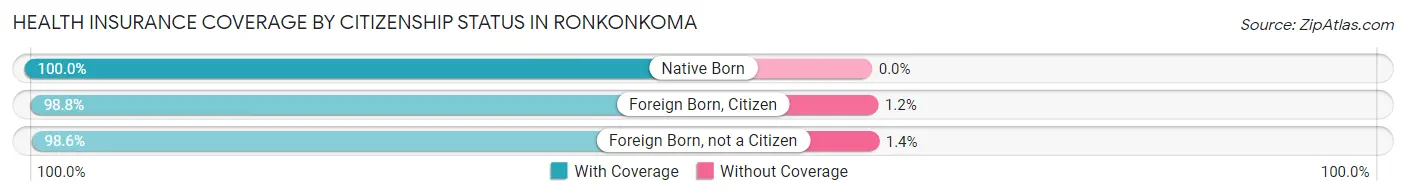
| Citizenship Status | With Coverage | Without Coverage |
| Native Born | 1,257 (100.0%) | 0 (0.0%) |
| Foreign Born, Citizen | 2,695 (98.8%) | 33 (1.2%) |
| Foreign Born, not a Citizen | 2,021 (98.6%) | 28 (1.4%) |
Health Insurance Coverage by Household Income in Ronkonkoma
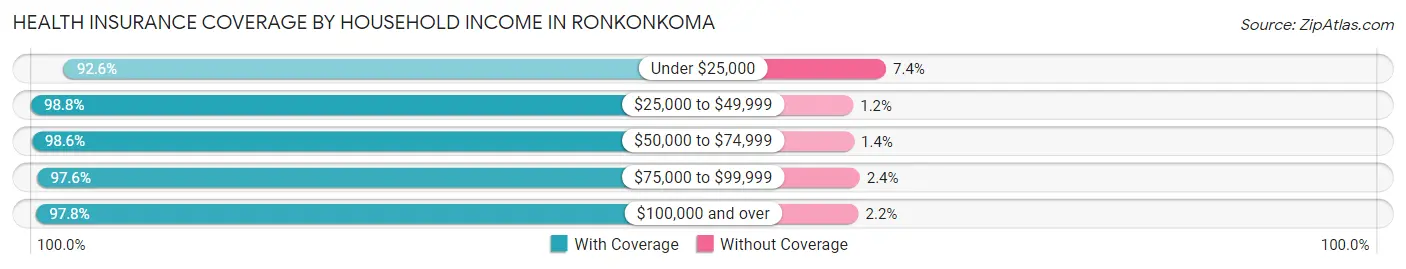
| Household Income | With Coverage | Without Coverage |
| Under $25,000 | 579 (92.6%) | 46 (7.4%) |
| $25,000 to $49,999 | 968 (98.8%) | 12 (1.2%) |
| $50,000 to $74,999 | 1,581 (98.6%) | 22 (1.4%) |
| $75,000 to $99,999 | 2,124 (97.6%) | 53 (2.4%) |
| $100,000 and over | 13,117 (97.8%) | 297 (2.2%) |
Public vs Private Health Insurance Coverage by Age in Ronkonkoma
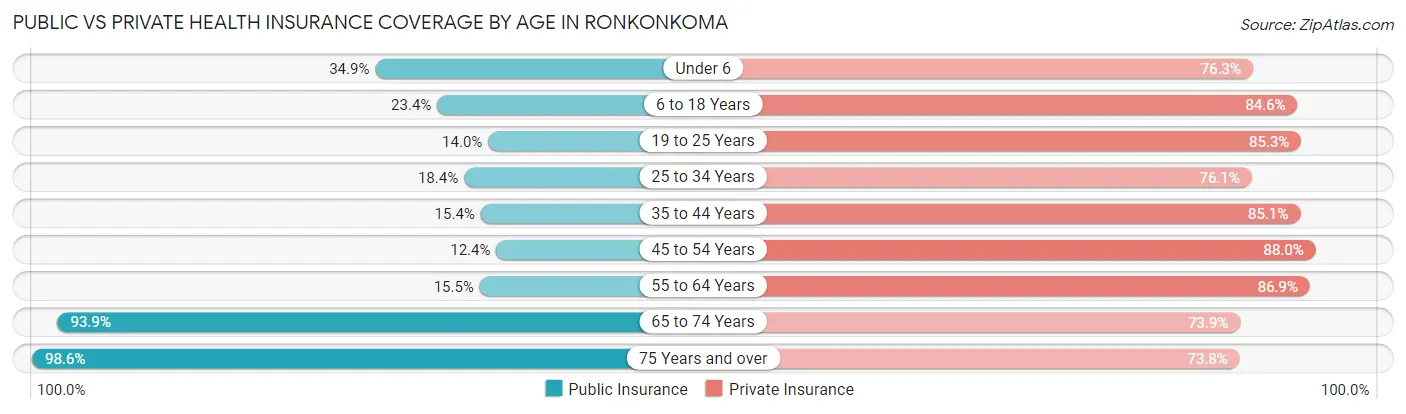
| Age Bracket | Public Insurance | Private Insurance |
| Under 6 | 439 (34.9%) | 959 (76.3%) |
| 6 to 18 Years | 639 (23.4%) | 2,307 (84.6%) |
| 19 to 25 Years | 286 (14.0%) | 1,747 (85.3%) |
| 25 to 34 Years | 505 (18.4%) | 2,083 (76.0%) |
| 35 to 44 Years | 381 (15.3%) | 2,111 (85.1%) |
| 45 to 54 Years | 353 (12.4%) | 2,495 (87.9%) |
| 55 to 64 Years | 357 (15.5%) | 1,997 (86.9%) |
| 65 to 74 Years | 1,214 (93.9%) | 956 (73.9%) |
| 75 Years and over | 1,138 (98.6%) | 852 (73.8%) |
| Total | 5,312 (28.2%) | 15,507 (82.3%) |
Disability Status by Sex by Age in Ronkonkoma
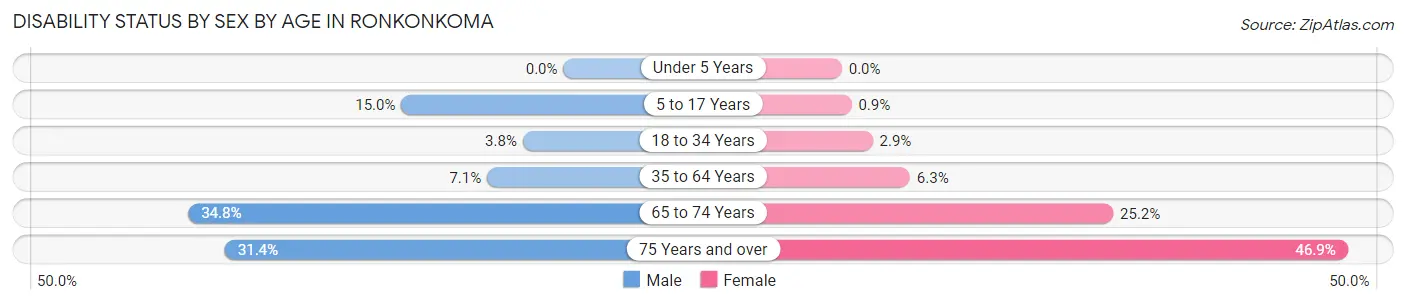
| Age Bracket | Male | Female |
| Under 5 Years | 0 (0.0%) | 0 (0.0%) |
| 5 to 17 Years | 222 (15.0%) | 11 (0.9%) |
| 18 to 34 Years | 93 (3.8%) | 72 (2.9%) |
| 35 to 64 Years | 274 (7.1%) | 237 (6.3%) |
| 65 to 74 Years | 204 (34.8%) | 178 (25.2%) |
| 75 Years and over | 147 (31.4%) | 322 (46.9%) |
Disability Class by Sex by Age in Ronkonkoma
Disability Class: Hearing Difficulty
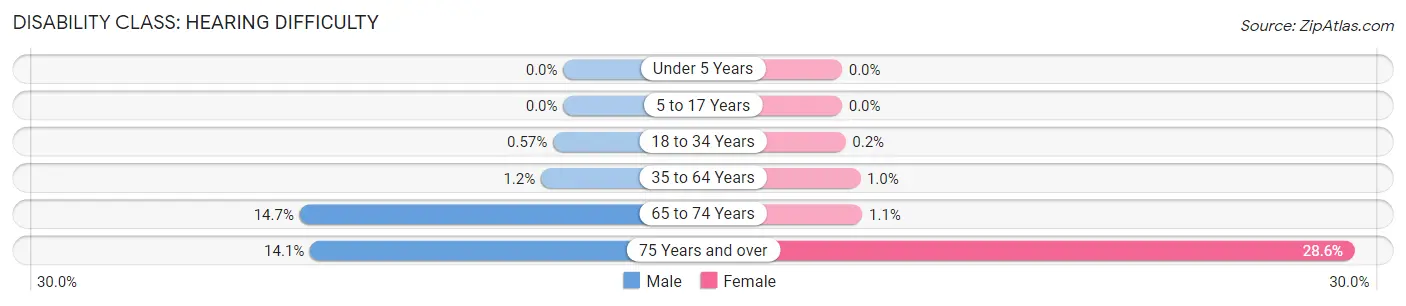
| Age Bracket | Male | Female |
| Under 5 Years | 0 (0.0%) | 0 (0.0%) |
| 5 to 17 Years | 0 (0.0%) | 0 (0.0%) |
| 18 to 34 Years | 14 (0.6%) | 5 (0.2%) |
| 35 to 64 Years | 48 (1.2%) | 38 (1.0%) |
| 65 to 74 Years | 86 (14.7%) | 8 (1.1%) |
| 75 Years and over | 66 (14.1%) | 196 (28.6%) |
Disability Class: Vision Difficulty
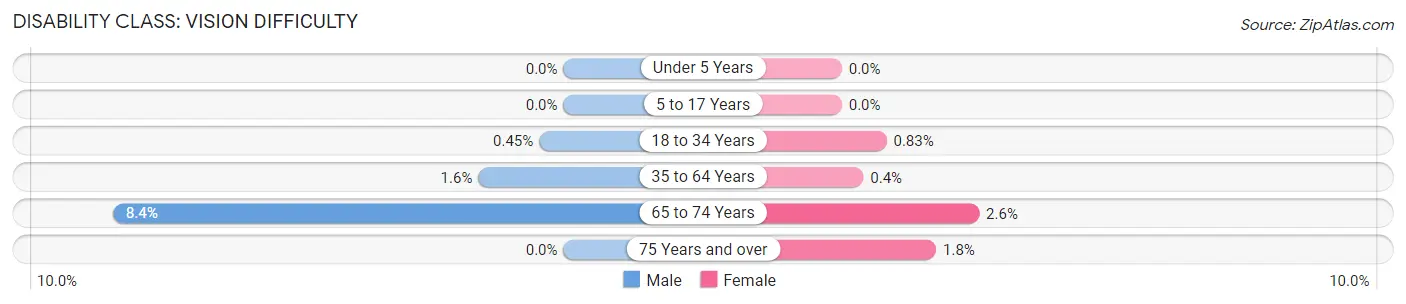
| Age Bracket | Male | Female |
| Under 5 Years | 0 (0.0%) | 0 (0.0%) |
| 5 to 17 Years | 0 (0.0%) | 0 (0.0%) |
| 18 to 34 Years | 11 (0.4%) | 21 (0.8%) |
| 35 to 64 Years | 61 (1.6%) | 15 (0.4%) |
| 65 to 74 Years | 49 (8.4%) | 18 (2.5%) |
| 75 Years and over | 0 (0.0%) | 12 (1.8%) |
Disability Class: Cognitive Difficulty
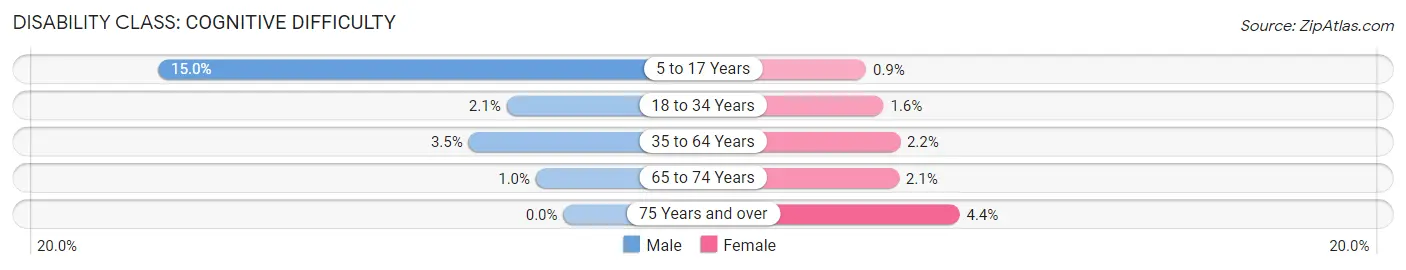
| Age Bracket | Male | Female |
| 5 to 17 Years | 222 (15.0%) | 11 (0.9%) |
| 18 to 34 Years | 52 (2.1%) | 39 (1.5%) |
| 35 to 64 Years | 136 (3.5%) | 81 (2.2%) |
| 65 to 74 Years | 6 (1.0%) | 15 (2.1%) |
| 75 Years and over | 0 (0.0%) | 30 (4.4%) |
Disability Class: Ambulatory Difficulty
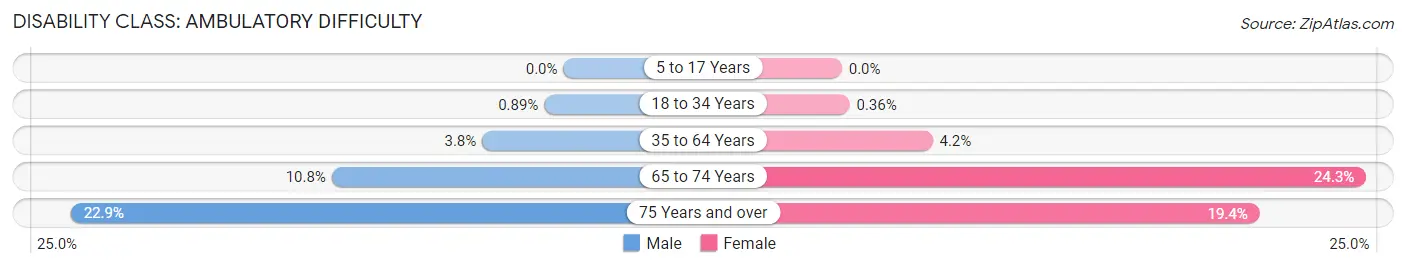
| Age Bracket | Male | Female |
| 5 to 17 Years | 0 (0.0%) | 0 (0.0%) |
| 18 to 34 Years | 22 (0.9%) | 9 (0.4%) |
| 35 to 64 Years | 146 (3.8%) | 158 (4.2%) |
| 65 to 74 Years | 63 (10.7%) | 172 (24.3%) |
| 75 Years and over | 107 (22.9%) | 133 (19.4%) |
Disability Class: Self-Care Difficulty
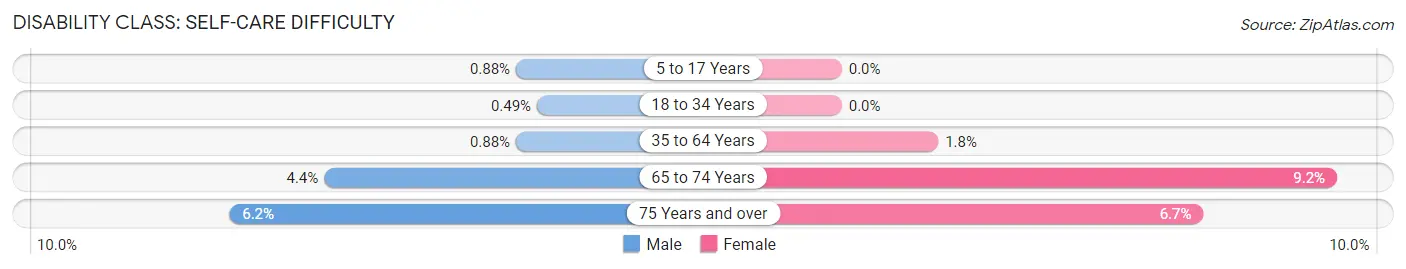
| Age Bracket | Male | Female |
| 5 to 17 Years | 13 (0.9%) | 0 (0.0%) |
| 18 to 34 Years | 12 (0.5%) | 0 (0.0%) |
| 35 to 64 Years | 34 (0.9%) | 67 (1.8%) |
| 65 to 74 Years | 26 (4.4%) | 65 (9.2%) |
| 75 Years and over | 29 (6.2%) | 46 (6.7%) |
Technology Access in Ronkonkoma
Computing Device Access in Ronkonkoma
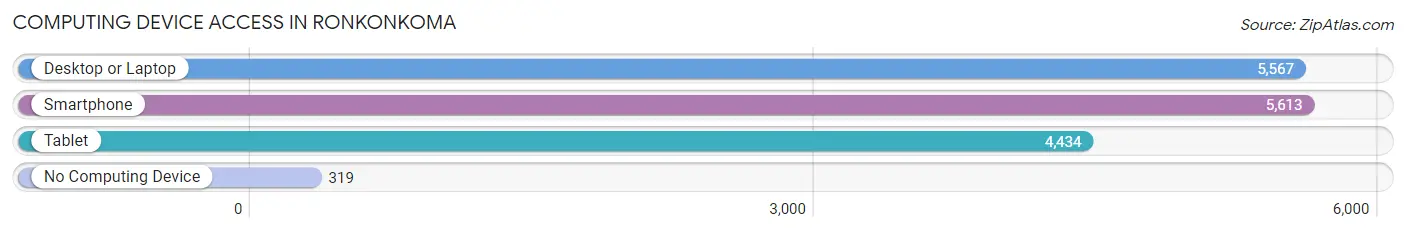
| Device Type | # Households | % Households |
| Desktop or Laptop | 5,567 | 89.9% |
| Smartphone | 5,613 | 90.7% |
| Tablet | 4,434 | 71.6% |
| No Computing Device | 319 | 5.1% |
| Total | 6,190 | 100.0% |
Internet Access in Ronkonkoma
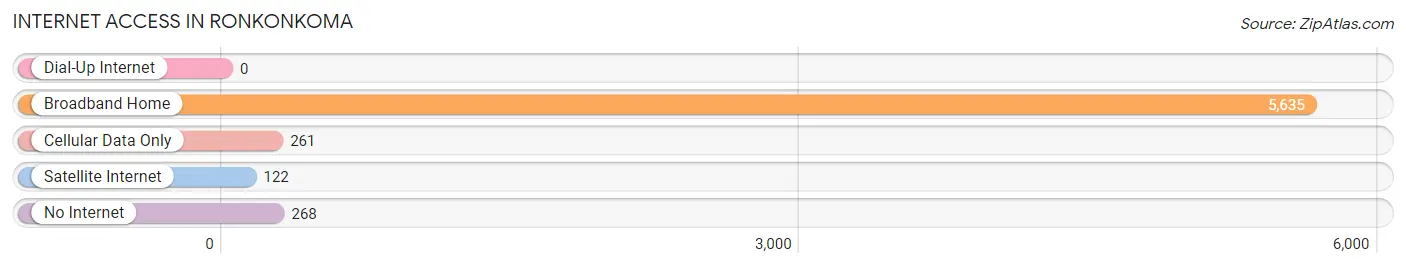
| Internet Type | # Households | % Households |
| Dial-Up Internet | 0 | 0.0% |
| Broadband Home | 5,635 | 91.0% |
| Cellular Data Only | 261 | 4.2% |
| Satellite Internet | 122 | 2.0% |
| No Internet | 268 | 4.3% |
| Total | 6,190 | 100.0% |
Ronkonkoma Summary
Ronkonkoma is a hamlet and census-designated place (CDP) located in the Town of Islip in Suffolk County, New York, United States. The population was 19,082 at the 2010 census.
History
The area now known as Ronkonkoma was originally inhabited by the Secatogue Indians, a sub-tribe of the larger Algonquin Nation. The Secatogue Indians were a peaceful people who lived off the land, fishing, hunting, and farming. The name Ronkonkoma is derived from the Secatogue Indian word meaning “boundary fishing place”.
The first European settlers arrived in the area in the late 1600s. The area was originally part of the Town of Islip, and was known as “Smithtown”. In 1845, the area was renamed “Ronkonkoma”.
In the late 1800s, the area began to develop as a resort destination. The Long Island Rail Road was extended to Ronkonkoma in 1844, and the area became a popular destination for city dwellers looking to escape the hustle and bustle of the city. The area was also known for its mineral springs, which were believed to have healing properties.
In the early 1900s, the area began to develop as a residential community. The Long Island Motor Parkway, which opened in 1908, provided easy access to the area from New York City. The area also became a popular destination for summer homes.
In the 1950s, the area began to develop as an industrial center. The Grumman Corporation opened a plant in the area in 1958, and the area became a major employer. The area also became a popular destination for shopping, with the opening of the Smith Haven Mall in 1968.
Geography
Ronkonkoma is located at 40°48'17" North, 73°6'45" West (40.804722, -73.112500). According to the United States Census Bureau, the CDP has a total area of 8.2 square miles, of which 8.1 square miles is land and 0.1 square miles is water.
Economy
Ronkonkoma is a major employment center in Suffolk County. The Grumman Corporation, which opened a plant in the area in 1958, is the largest employer in the area. Other major employers include the Long Island Rail Road, the Smith Haven Mall, and the Long Island MacArthur Airport.
Demographics
As of the census of 2000, there were 19,082 people, 6,845 households, and 4,845 families residing in the CDP. The population density was 2,346.2 people per square mile (905.3/km²). There were 7,039 housing units at an average density of 871.3/sq mi (336.3/km²). The racial makeup of the CDP was 87.90% White, 4.45% African American, 0.17% Native American, 3.17% Asian, 0.02% Pacific Islander, 2.45% from other races, and 1.84% from two or more races. Hispanic or Latino of any race were 8.17% of the population.
There were 6,845 households out of which 33.2% had children under the age of 18 living with them, 54.2% were married couples living together, 10.7% had a female householder with no husband present, and 30.7% were non-families. 24.2% of all households were made up of individuals and 8.2% had someone living alone who was 65 years of age or older. The average household size was 2.76 and the average family size was 3.30.
In the CDP, the population was spread out with 24.2% under the age of 18, 7.2% from 18 to 24, 33.2% from 25 to 44, 22.7% from 45 to 64, and 12.7% who were 65 years of age or older. The median age was 37 years. For every 100 females, there were 95.2 males. For every 100 females age 18 and over, there were 92.2 males.
The median income for a household in the CDP was $62,845, and the median income for a family was $71,945. Males had a median income of $50,945 versus $35,945 for females. The per capita income for the CDP was $25,945. About 3.2% of families and 4.7% of the population were below the poverty line, including 5.2% of those under age 18 and 4.2% of those age 65 or over.
Common Questions
What is Per Capita Income in Ronkonkoma?
Per Capita income in Ronkonkoma is $44,661.
What is the Median Family Income in Ronkonkoma?
Median Family Income in Ronkonkoma is $137,894.
What is the Median Household income in Ronkonkoma?
Median Household Income in Ronkonkoma is $123,681.
What is Income or Wage Gap in Ronkonkoma?
Income or Wage Gap in Ronkonkoma is 22.9%.
Women in Ronkonkoma earn 77.1 cents for every dollar earned by a man.
What is Inequality or Gini Index in Ronkonkoma?
Inequality or Gini Index in Ronkonkoma is 0.35.
What is the Total Population of Ronkonkoma?
Total Population of Ronkonkoma is 18,838.
What is the Total Male Population of Ronkonkoma?
Total Male Population of Ronkonkoma is 9,512.
What is the Total Female Population of Ronkonkoma?
Total Female Population of Ronkonkoma is 9,326.
What is the Ratio of Males per 100 Females in Ronkonkoma?
There are 101.99 Males per 100 Females in Ronkonkoma.
What is the Ratio of Females per 100 Males in Ronkonkoma?
There are 98.04 Females per 100 Males in Ronkonkoma.
What is the Median Population Age in Ronkonkoma?
Median Population Age in Ronkonkoma is 37.5 Years.
What is the Average Family Size in Ronkonkoma
Average Family Size in Ronkonkoma is 3.5 People.
What is the Average Household Size in Ronkonkoma
Average Household Size in Ronkonkoma is 3.0 People.
How Large is the Labor Force in Ronkonkoma?
There are 11,190 People in the Labor Forcein in Ronkonkoma.
What is the Percentage of People in the Labor Force in Ronkonkoma?
72.5% of People are in the Labor Force in Ronkonkoma.
What is the Unemployment Rate in Ronkonkoma?
Unemployment Rate in Ronkonkoma is 7.2%.