Deerfield Beach, FL Map & Demographics
Deerfield Beach Map
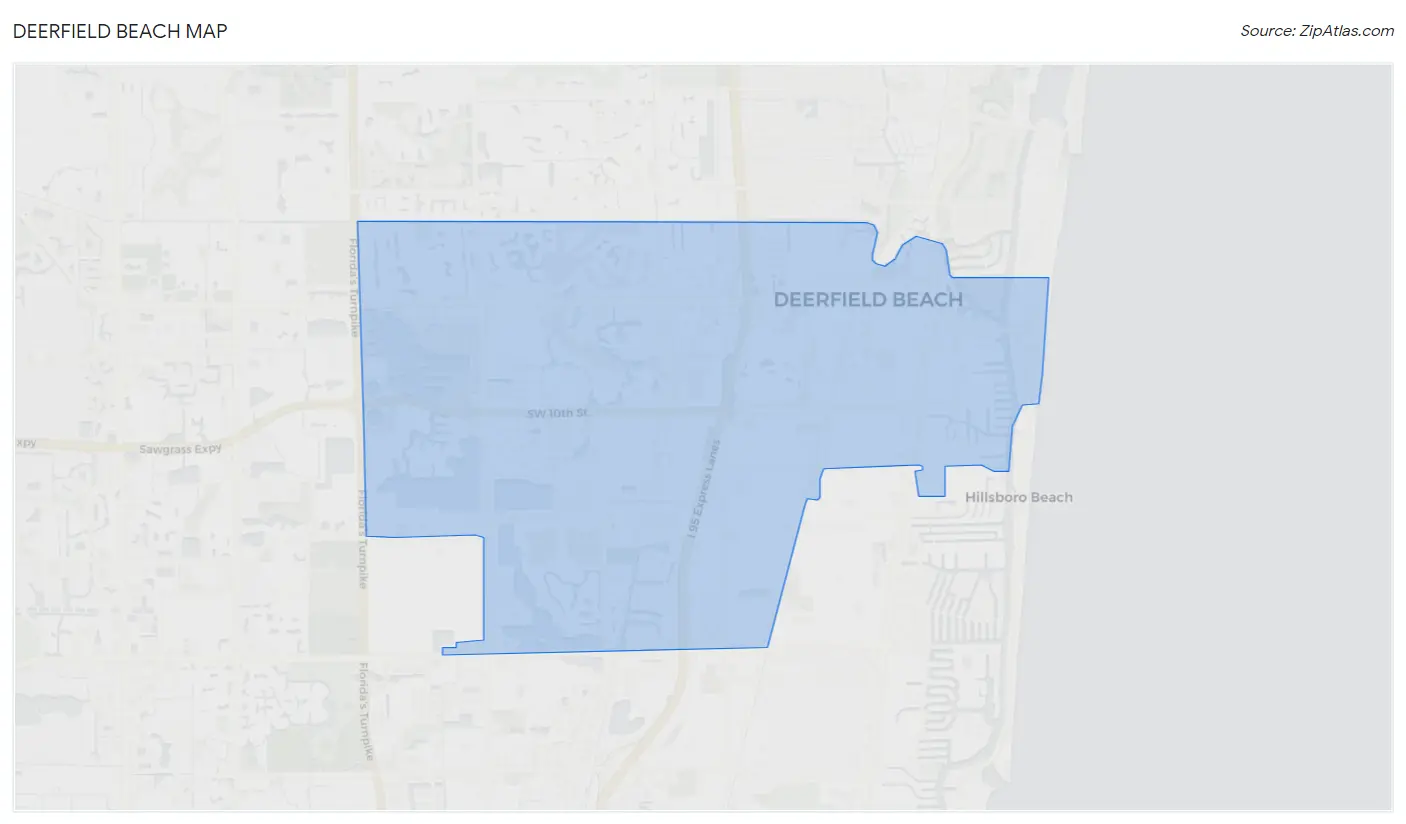
Deerfield Beach Overview
$31,878
PER CAPITA INCOME
$66,934
AVG FAMILY INCOME
$53,741
AVG HOUSEHOLD INCOME
17.9%
WAGE / INCOME GAP [ % ]
82.1¢/ $1
WAGE / INCOME GAP [ $ ]
$9,644
FAMILY INCOME DEFICIT
0.48
INEQUALITY / GINI INDEX
86,455
TOTAL POPULATION
40,391
MALE POPULATION
46,064
FEMALE POPULATION
87.68
MALES / 100 FEMALES
114.05
FEMALES / 100 MALES
43.5
MEDIAN AGE
3.1
AVG FAMILY SIZE
2.3
AVG HOUSEHOLD SIZE
44,611
LABOR FORCE [ PEOPLE ]
61.4%
PERCENT IN LABOR FORCE
6.3%
UNEMPLOYMENT RATE
Income in Deerfield Beach
Income Overview in Deerfield Beach
Per Capita Income in Deerfield Beach is $31,878, while median incomes of families and households are $66,934 and $53,741 respectively.
| Characteristic | Number | Measure |
| Per Capita Income | 86,455 | $31,878 |
| Median Family Income | 19,976 | $66,934 |
| Mean Family Income | 19,976 | $91,571 |
| Median Household Income | 36,219 | $53,741 |
| Mean Household Income | 36,219 | $73,329 |
| Income Deficit | 19,976 | $9,644 |
| Wage / Income Gap (%) | 86,455 | 17.93% |
| Wage / Income Gap ($) | 86,455 | 82.07¢ per $1 |
| Gini / Inequality Index | 86,455 | 0.48 |
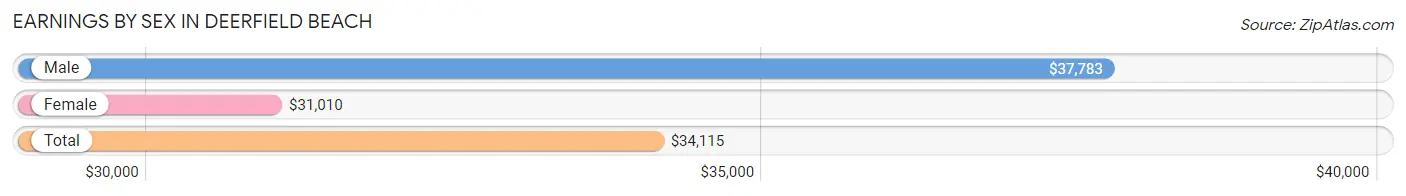
Earnings by Sex in Deerfield Beach
Average Earnings in Deerfield Beach are $34,115, $37,783 for men and $31,010 for women, a difference of 17.9%.
| Sex | Number | Average Earnings |
| Male | 22,881 (50.1%) | $37,783 |
| Female | 22,772 (49.9%) | $31,010 |
| Total | 45,653 (100.0%) | $34,115 |
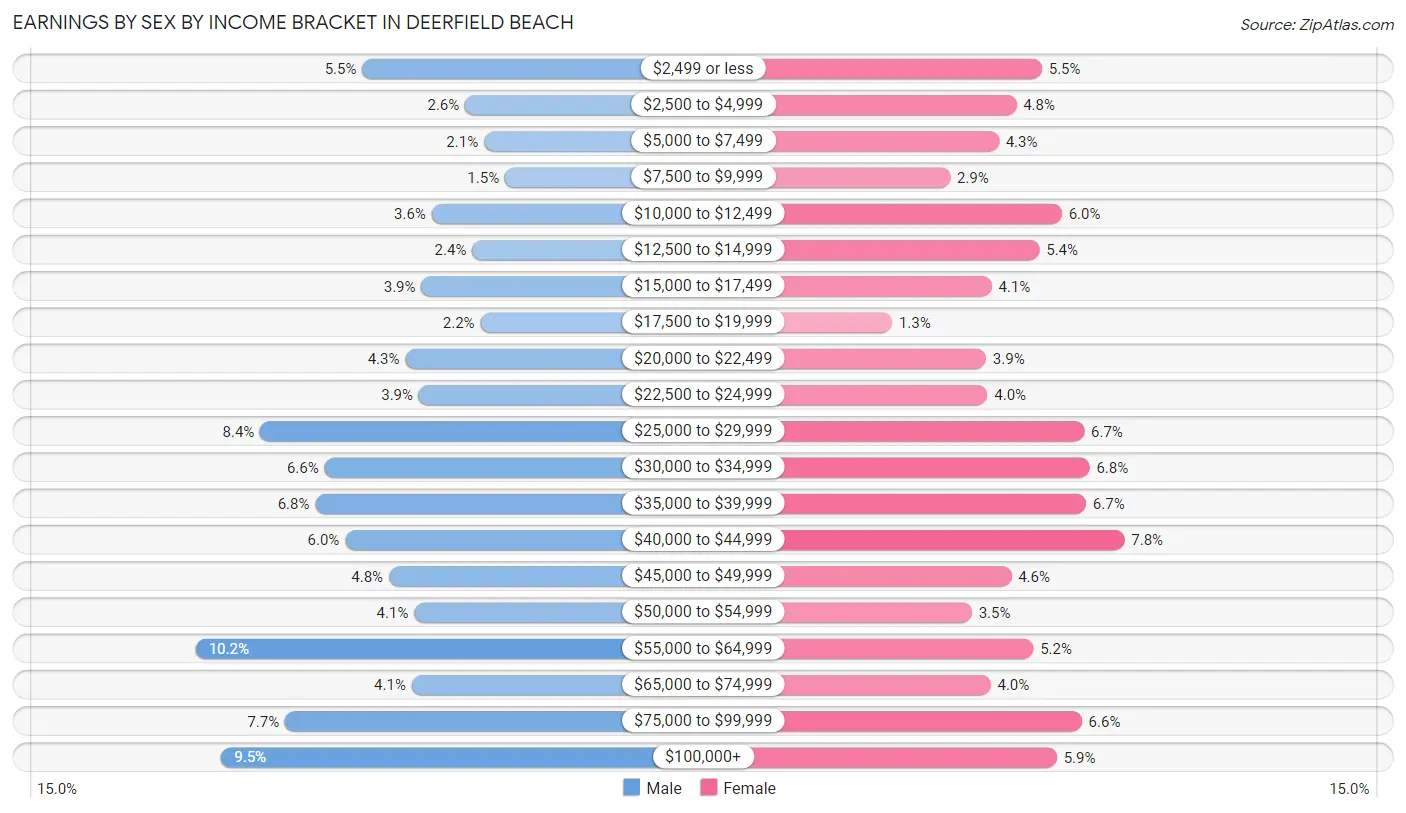
Earnings by Sex by Income Bracket in Deerfield Beach
The most common earnings brackets in Deerfield Beach are $55,000 to $64,999 for men (2,331 | 10.2%) and $40,000 to $44,999 for women (1,777 | 7.8%).
| Income | Male | Female |
| $2,499 or less | 1,260 (5.5%) | 1,248 (5.5%) |
| $2,500 to $4,999 | 600 (2.6%) | 1,085 (4.8%) |
| $5,000 to $7,499 | 479 (2.1%) | 972 (4.3%) |
| $7,500 to $9,999 | 343 (1.5%) | 660 (2.9%) |
| $10,000 to $12,499 | 814 (3.6%) | 1,375 (6.0%) |
| $12,500 to $14,999 | 554 (2.4%) | 1,233 (5.4%) |
| $15,000 to $17,499 | 880 (3.8%) | 927 (4.1%) |
| $17,500 to $19,999 | 502 (2.2%) | 289 (1.3%) |
| $20,000 to $22,499 | 984 (4.3%) | 890 (3.9%) |
| $22,500 to $24,999 | 898 (3.9%) | 900 (4.0%) |
| $25,000 to $29,999 | 1,917 (8.4%) | 1,518 (6.7%) |
| $30,000 to $34,999 | 1,503 (6.6%) | 1,553 (6.8%) |
| $35,000 to $39,999 | 1,563 (6.8%) | 1,530 (6.7%) |
| $40,000 to $44,999 | 1,371 (6.0%) | 1,777 (7.8%) |
| $45,000 to $49,999 | 1,088 (4.8%) | 1,053 (4.6%) |
| $50,000 to $54,999 | 927 (4.1%) | 800 (3.5%) |
| $55,000 to $64,999 | 2,331 (10.2%) | 1,194 (5.2%) |
| $65,000 to $74,999 | 943 (4.1%) | 920 (4.0%) |
| $75,000 to $99,999 | 1,757 (7.7%) | 1,504 (6.6%) |
| $100,000+ | 2,167 (9.5%) | 1,344 (5.9%) |
| Total | 22,881 (100.0%) | 22,772 (100.0%) |
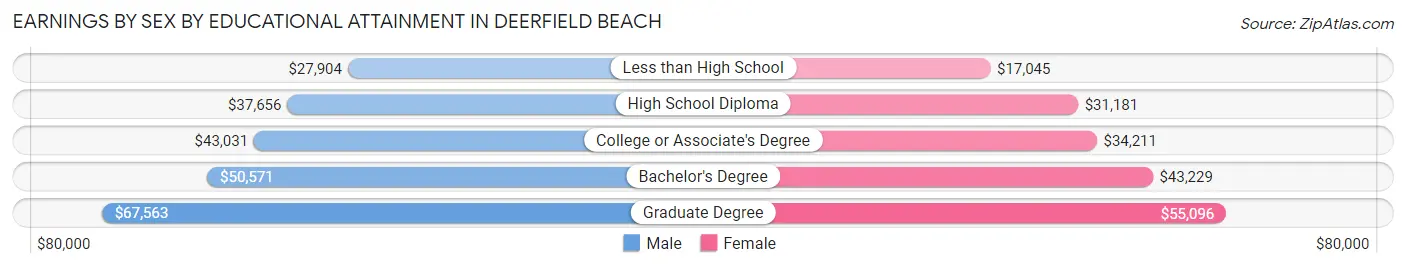
Earnings by Sex by Educational Attainment in Deerfield Beach
Average earnings in Deerfield Beach are $40,260 for men and $34,541 for women, a difference of 14.2%. Men with an educational attainment of graduate degree enjoy the highest average annual earnings of $67,563, while those with less than high school education earn the least with $27,904. Women with an educational attainment of graduate degree earn the most with the average annual earnings of $55,096, while those with less than high school education have the smallest earnings of $17,045.
| Educational Attainment | Male Income | Female Income |
| Less than High School | $27,904 | $17,045 |
| High School Diploma | $37,656 | $31,181 |
| College or Associate's Degree | $43,031 | $34,211 |
| Bachelor's Degree | $50,571 | $43,229 |
| Graduate Degree | $67,563 | $55,096 |
| Total | $40,260 | $34,541 |
Family Income in Deerfield Beach
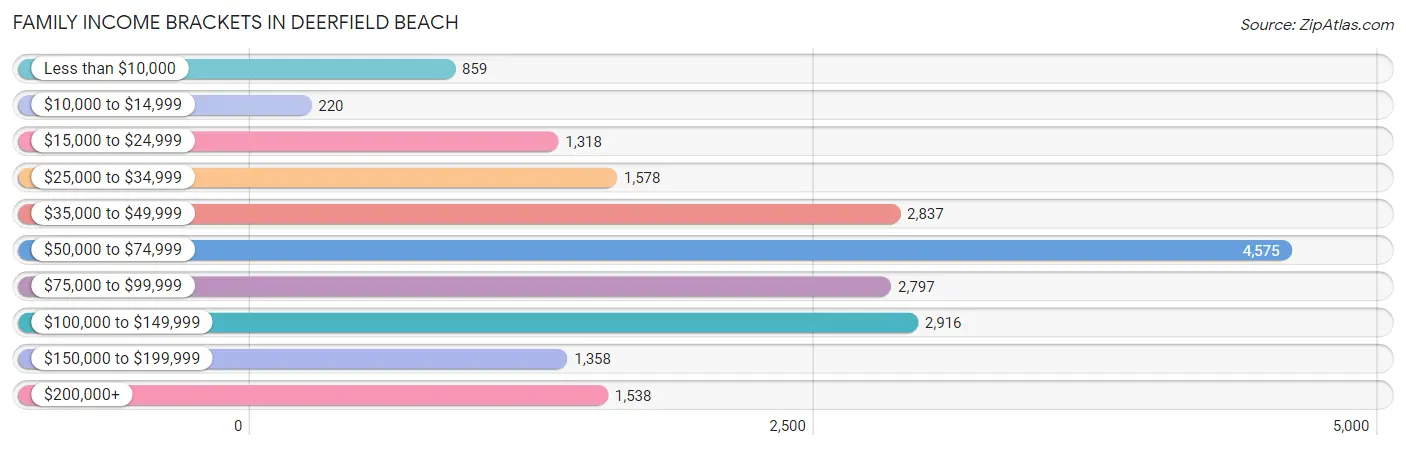
Family Income Brackets in Deerfield Beach
According to the Deerfield Beach family income data, there are 4,575 families falling into the $50,000 to $74,999 income range, which is the most common income bracket and makes up 22.9% of all families. Conversely, the $10,000 to $14,999 income bracket is the least frequent group with only 220 families (1.1%) belonging to this category.
| Income Bracket | # Families | % Families |
| Less than $10,000 | 859 | 4.3% |
| $10,000 to $14,999 | 220 | 1.1% |
| $15,000 to $24,999 | 1,318 | 6.6% |
| $25,000 to $34,999 | 1,578 | 7.9% |
| $35,000 to $49,999 | 2,837 | 14.2% |
| $50,000 to $74,999 | 4,575 | 22.9% |
| $75,000 to $99,999 | 2,797 | 14.0% |
| $100,000 to $149,999 | 2,916 | 14.6% |
| $150,000 to $199,999 | 1,358 | 6.8% |
| $200,000+ | 1,538 | 7.7% |
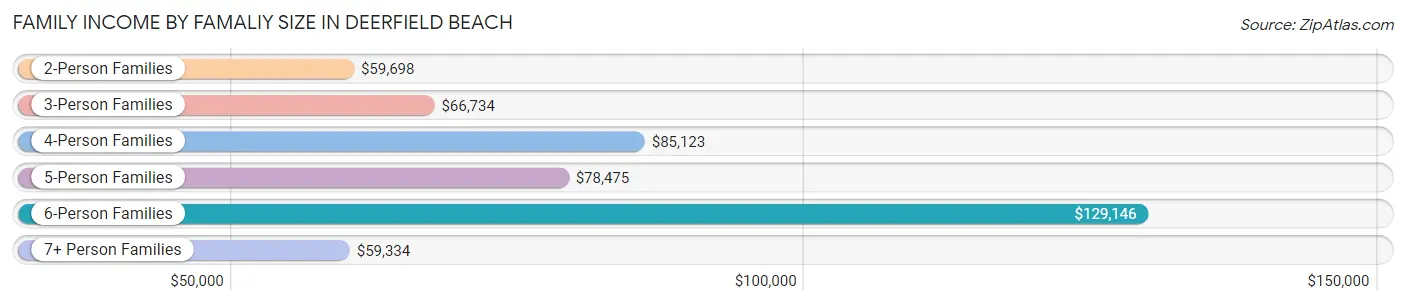
Family Income by Famaliy Size in Deerfield Beach
6-person families (307 | 1.5%) account for the highest median family income in Deerfield Beach with $129,146 per family, while 2-person families (10,139 | 50.8%) have the highest median income of $29,849 per family member.
| Income Bracket | # Families | Median Income |
| 2-Person Families | 10,139 (50.8%) | $59,698 |
| 3-Person Families | 4,805 (24.0%) | $66,734 |
| 4-Person Families | 3,153 (15.8%) | $85,123 |
| 5-Person Families | 1,227 (6.1%) | $78,475 |
| 6-Person Families | 307 (1.5%) | $129,146 |
| 7+ Person Families | 345 (1.7%) | $59,334 |
| Total | 19,976 (100.0%) | $66,934 |
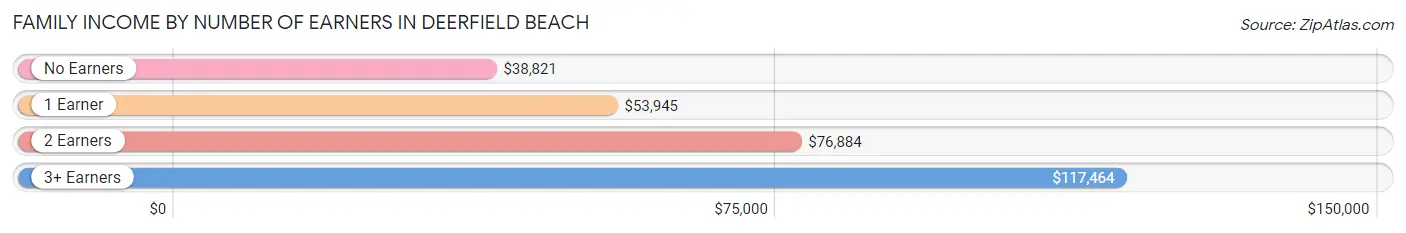
Family Income by Number of Earners in Deerfield Beach
The median family income in Deerfield Beach is $66,934, with families comprising 3+ earners (2,277) having the highest median family income of $117,464, while families with no earners (3,271) have the lowest median family income of $38,821, accounting for 11.4% and 16.4% of families, respectively.
| Number of Earners | # Families | Median Income |
| No Earners | 3,271 (16.4%) | $38,821 |
| 1 Earner | 6,572 (32.9%) | $53,945 |
| 2 Earners | 7,856 (39.3%) | $76,884 |
| 3+ Earners | 2,277 (11.4%) | $117,464 |
| Total | 19,976 (100.0%) | $66,934 |
Household Income in Deerfield Beach
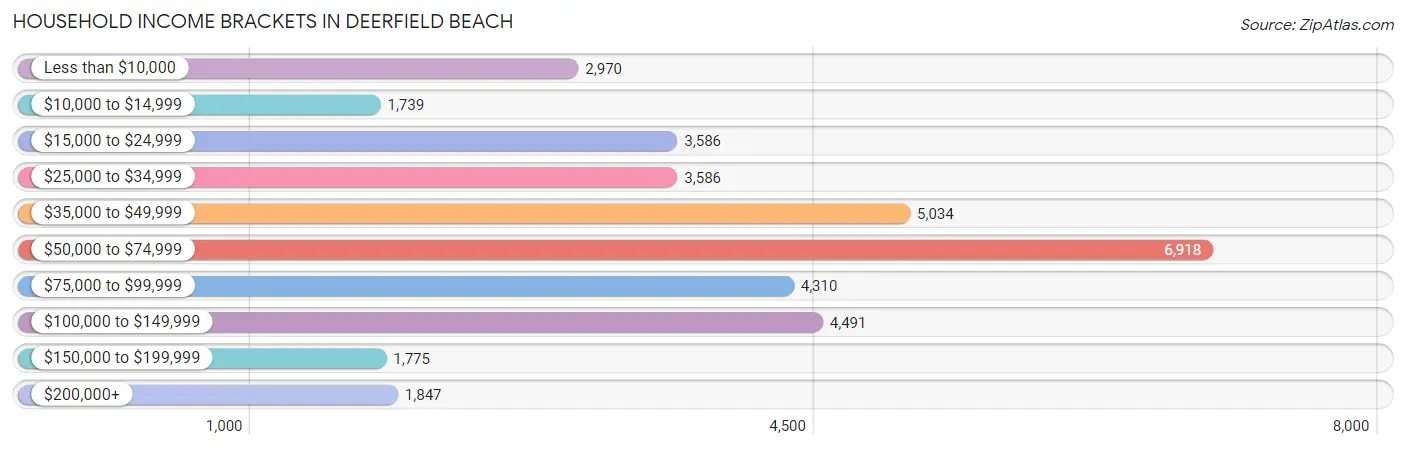
Household Income Brackets in Deerfield Beach
With 6,918 households falling in the category, the $50,000 to $74,999 income range is the most frequent in Deerfield Beach, accounting for 19.1% of all households. In contrast, only 1,739 households (4.8%) fall into the $10,000 to $14,999 income bracket, making it the least populous group.
| Income Bracket | # Households | % Households |
| Less than $10,000 | 2,970 | 8.2% |
| $10,000 to $14,999 | 1,739 | 4.8% |
| $15,000 to $24,999 | 3,586 | 9.9% |
| $25,000 to $34,999 | 3,586 | 9.9% |
| $35,000 to $49,999 | 5,034 | 13.9% |
| $50,000 to $74,999 | 6,918 | 19.1% |
| $75,000 to $99,999 | 4,310 | 11.9% |
| $100,000 to $149,999 | 4,491 | 12.4% |
| $150,000 to $199,999 | 1,775 | 4.9% |
| $200,000+ | 1,847 | 5.1% |
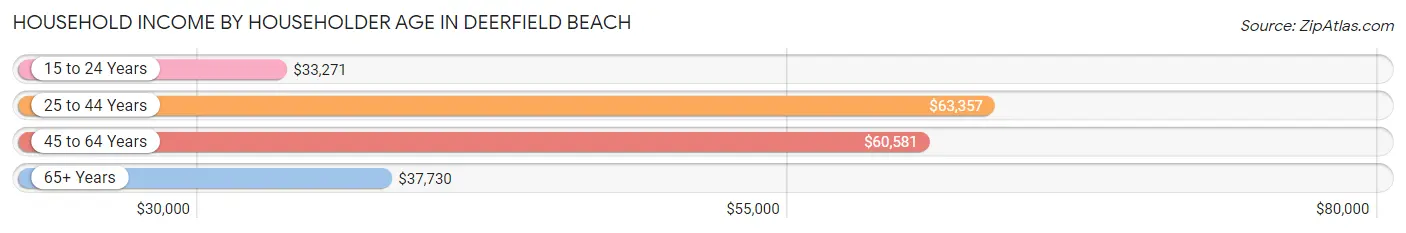
Household Income by Householder Age in Deerfield Beach
The median household income in Deerfield Beach is $53,741, with the highest median household income of $63,357 found in the 25 to 44 years age bracket for the primary householder. A total of 10,555 households (29.1%) fall into this category. Meanwhile, the 15 to 24 years age bracket for the primary householder has the lowest median household income of $33,271, with 686 households (1.9%) in this group.
| Income Bracket | # Households | Median Income |
| 15 to 24 Years | 686 (1.9%) | $33,271 |
| 25 to 44 Years | 10,555 (29.1%) | $63,357 |
| 45 to 64 Years | 12,221 (33.7%) | $60,581 |
| 65+ Years | 12,757 (35.2%) | $37,730 |
| Total | 36,219 (100.0%) | $53,741 |
Poverty in Deerfield Beach
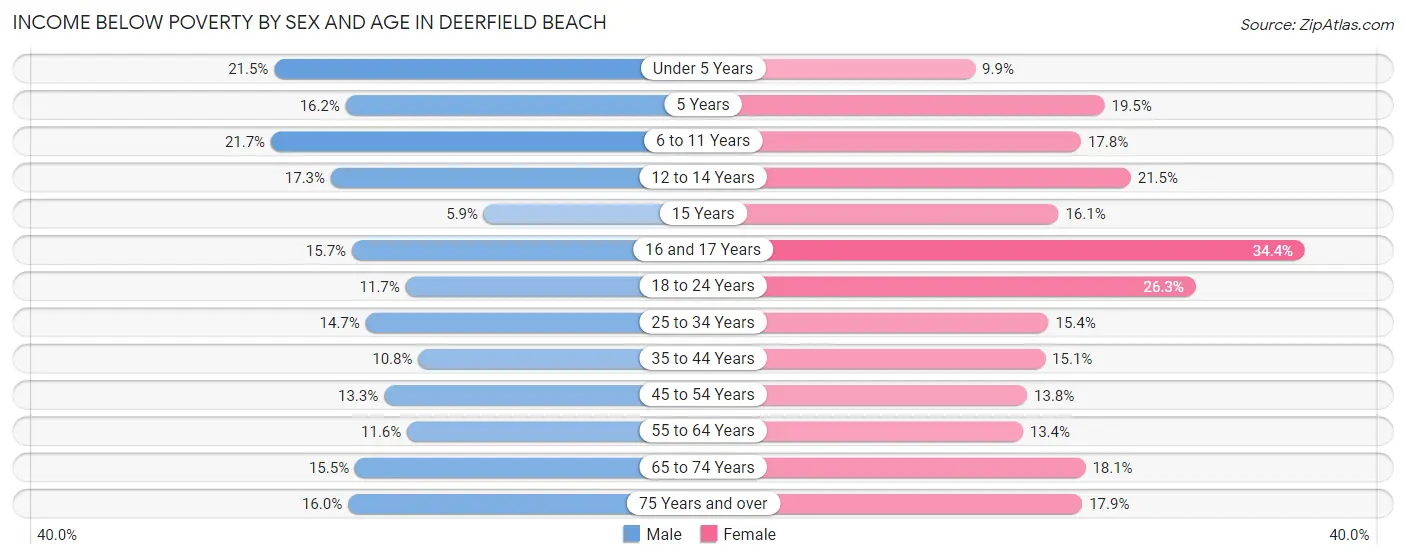
Income Below Poverty by Sex and Age in Deerfield Beach
With 14.4% poverty level for males and 16.5% for females among the residents of Deerfield Beach, 6 to 11 year old males and 16 and 17 year old females are the most vulnerable to poverty, with 585 males (21.7%) and 165 females (34.4%) in their respective age groups living below the poverty level.
| Age Bracket | Male | Female |
| Under 5 Years | 469 (21.5%) | 218 (9.9%) |
| 5 Years | 48 (16.2%) | 72 (19.5%) |
| 6 to 11 Years | 585 (21.7%) | 470 (17.8%) |
| 12 to 14 Years | 249 (17.3%) | 153 (21.5%) |
| 15 Years | 19 (5.9%) | 56 (16.1%) |
| 16 and 17 Years | 124 (15.7%) | 165 (34.4%) |
| 18 to 24 Years | 315 (11.7%) | 774 (26.3%) |
| 25 to 34 Years | 757 (14.7%) | 1,067 (15.3%) |
| 35 to 44 Years | 650 (10.8%) | 810 (15.1%) |
| 45 to 54 Years | 604 (13.3%) | 849 (13.8%) |
| 55 to 64 Years | 607 (11.6%) | 742 (13.4%) |
| 65 to 74 Years | 711 (15.5%) | 971 (18.1%) |
| 75 Years and over | 513 (16.0%) | 1,135 (17.8%) |
| Total | 5,651 (14.4%) | 7,482 (16.5%) |
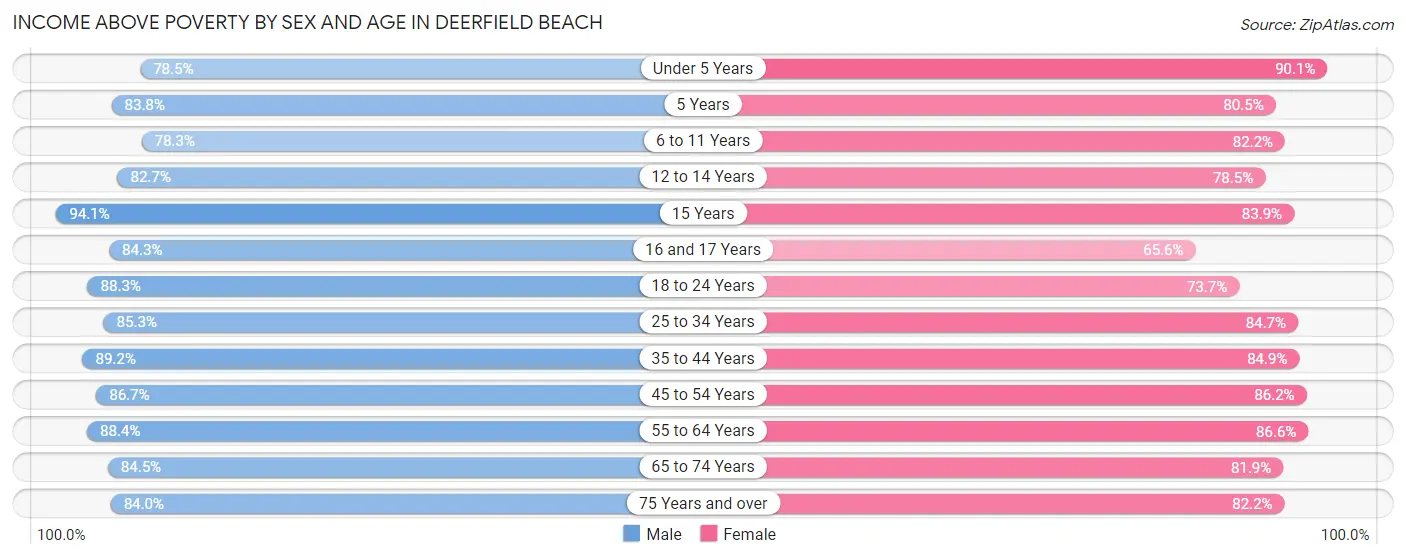
Income Above Poverty by Sex and Age in Deerfield Beach
According to the poverty statistics in Deerfield Beach, males aged 15 years and females aged under 5 years are the age groups that are most secure financially, with 94.1% of males and 90.1% of females in these age groups living above the poverty line.
| Age Bracket | Male | Female |
| Under 5 Years | 1,715 (78.5%) | 1,985 (90.1%) |
| 5 Years | 249 (83.8%) | 297 (80.5%) |
| 6 to 11 Years | 2,110 (78.3%) | 2,176 (82.2%) |
| 12 to 14 Years | 1,194 (82.7%) | 560 (78.5%) |
| 15 Years | 303 (94.1%) | 292 (83.9%) |
| 16 and 17 Years | 666 (84.3%) | 315 (65.6%) |
| 18 to 24 Years | 2,375 (88.3%) | 2,172 (73.7%) |
| 25 to 34 Years | 4,398 (85.3%) | 5,884 (84.7%) |
| 35 to 44 Years | 5,386 (89.2%) | 4,553 (84.9%) |
| 45 to 54 Years | 3,933 (86.7%) | 5,322 (86.2%) |
| 55 to 64 Years | 4,627 (88.4%) | 4,780 (86.6%) |
| 65 to 74 Years | 3,886 (84.5%) | 4,397 (81.9%) |
| 75 Years and over | 2,695 (84.0%) | 5,223 (82.2%) |
| Total | 33,537 (85.6%) | 37,956 (83.5%) |
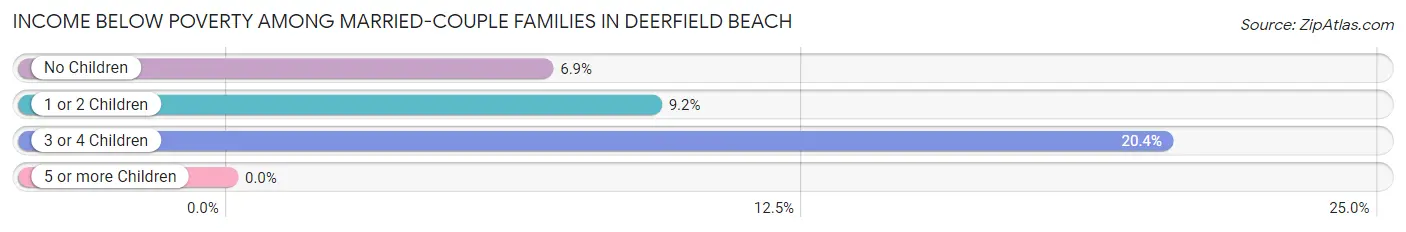
Income Below Poverty Among Married-Couple Families in Deerfield Beach
The poverty statistics for married-couple families in Deerfield Beach show that 7.9% or 1,074 of the total 13,537 families live below the poverty line. Families with 3 or 4 children have the highest poverty rate of 20.4%, comprising of 79 families. On the other hand, families with 5 or more children have the lowest poverty rate of 0.0%, which includes 0 families.
| Children | Above Poverty | Below Poverty |
| No Children | 8,032 (93.1%) | 592 (6.9%) |
| 1 or 2 Children | 3,967 (90.8%) | 403 (9.2%) |
| 3 or 4 Children | 309 (79.6%) | 79 (20.4%) |
| 5 or more Children | 155 (100.0%) | 0 (0.0%) |
| Total | 12,463 (92.1%) | 1,074 (7.9%) |
Income Below Poverty Among Single-Parent Households in Deerfield Beach
According to the poverty data in Deerfield Beach, 10.5% or 182 single-father households and 17.8% or 836 single-mother households are living below the poverty line. Among single-father households, those with no children have the highest poverty rate, with 165 households (16.3%) experiencing poverty. Likewise, among single-mother households, those with 5 or more children have the highest poverty rate, with 29 households (100.0%) falling below the poverty line.
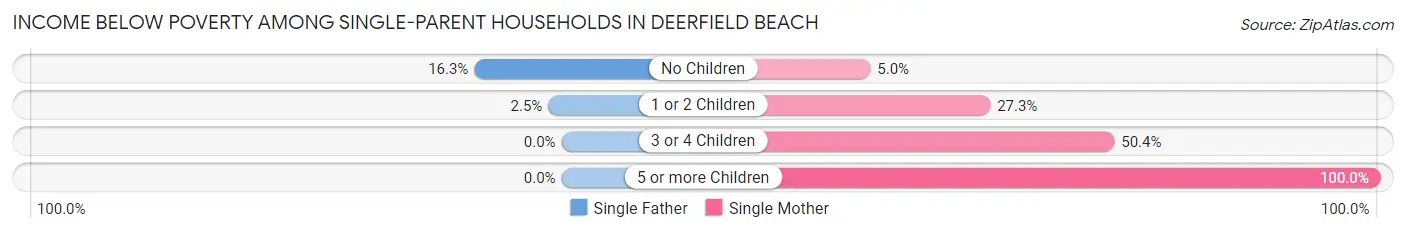
| Children | Single Father | Single Mother |
| No Children | 165 (16.3%) | 117 (5.0%) |
| 1 or 2 Children | 17 (2.5%) | 567 (27.3%) |
| 3 or 4 Children | 0 (0.0%) | 123 (50.4%) |
| 5 or more Children | 0 (0.0%) | 29 (100.0%) |
| Total | 182 (10.5%) | 836 (17.8%) |
Income Below Poverty Among Married-Couple vs Single-Parent Households in Deerfield Beach
The poverty data for Deerfield Beach shows that 1,074 of the married-couple family households (7.9%) and 1,018 of the single-parent households (15.8%) are living below the poverty level. Within the married-couple family households, those with 3 or 4 children have the highest poverty rate, with 79 households (20.4%) falling below the poverty line. Among the single-parent households, those with 5 or more children have the highest poverty rate, with 29 household (100.0%) living below poverty.
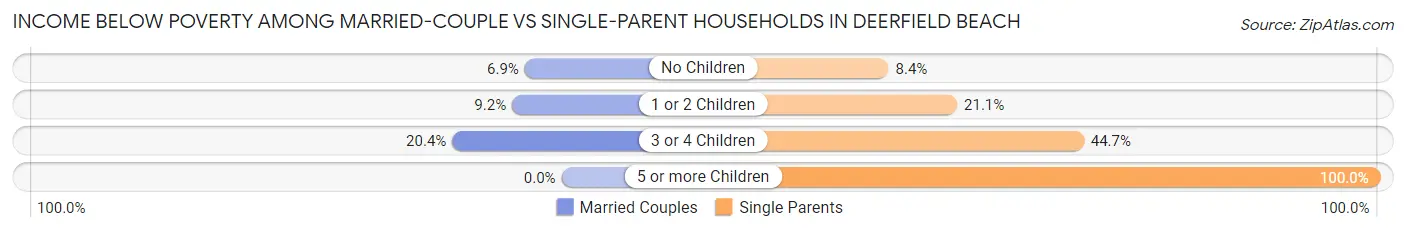
| Children | Married-Couple Families | Single-Parent Households |
| No Children | 592 (6.9%) | 282 (8.4%) |
| 1 or 2 Children | 403 (9.2%) | 584 (21.1%) |
| 3 or 4 Children | 79 (20.4%) | 123 (44.7%) |
| 5 or more Children | 0 (0.0%) | 29 (100.0%) |
| Total | 1,074 (7.9%) | 1,018 (15.8%) |
Race in Deerfield Beach
The most populous races in Deerfield Beach are White / Caucasian (44,099 | 51.0%), Hispanic or Latino (20,770 | 24.0%), and Black / African American (20,678 | 23.9%).
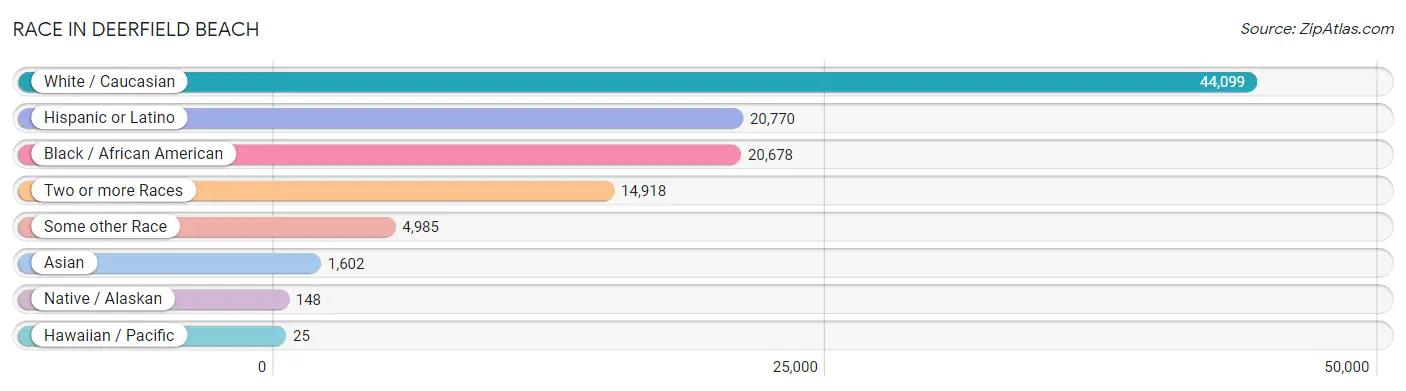
| Race | # Population | % Population |
| Asian | 1,602 | 1.8% |
| Black / African American | 20,678 | 23.9% |
| Hawaiian / Pacific | 25 | 0.0% |
| Hispanic or Latino | 20,770 | 24.0% |
| Native / Alaskan | 148 | 0.2% |
| White / Caucasian | 44,099 | 51.0% |
| Two or more Races | 14,918 | 17.3% |
| Some other Race | 4,985 | 5.8% |
| Total | 86,455 | 100.0% |
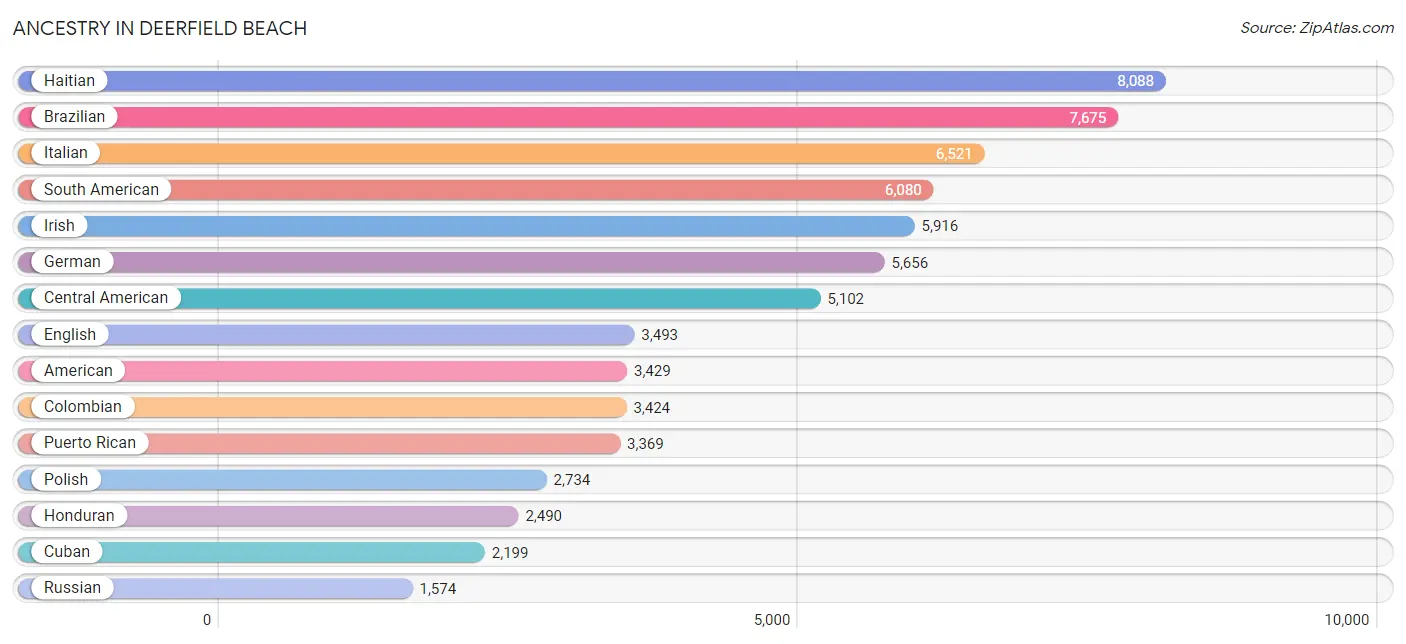
Ancestry in Deerfield Beach
The most populous ancestries reported in Deerfield Beach are Haitian (8,088 | 9.4%), Brazilian (7,675 | 8.9%), Italian (6,521 | 7.5%), South American (6,080 | 7.0%), and Irish (5,916 | 6.8%), together accounting for 39.7% of all Deerfield Beach residents.
| Ancestry | # Population | % Population |
| African | 579 | 0.7% |
| American | 3,429 | 4.0% |
| Arab | 799 | 0.9% |
| Argentinean | 247 | 0.3% |
| Armenian | 599 | 0.7% |
| Australian | 12 | 0.0% |
| Austrian | 219 | 0.3% |
| Bahamian | 209 | 0.2% |
| Barbadian | 146 | 0.2% |
| Belgian | 122 | 0.1% |
| Belizean | 44 | 0.1% |
| Bhutanese | 81 | 0.1% |
| Blackfeet | 45 | 0.1% |
| Brazilian | 7,675 | 8.9% |
| British | 380 | 0.4% |
| British West Indian | 102 | 0.1% |
| Bulgarian | 9 | 0.0% |
| Burmese | 143 | 0.2% |
| Cajun | 10 | 0.0% |
| Canadian | 648 | 0.7% |
| Central American | 5,102 | 5.9% |
| Central American Indian | 129 | 0.2% |
| Cherokee | 27 | 0.0% |
| Chilean | 38 | 0.0% |
| Choctaw | 2 | 0.0% |
| Colombian | 3,424 | 4.0% |
| Costa Rican | 192 | 0.2% |
| Croatian | 100 | 0.1% |
| Cuban | 2,199 | 2.5% |
| Czech | 251 | 0.3% |
| Czechoslovakian | 41 | 0.1% |
| Danish | 85 | 0.1% |
| Dominican | 1,240 | 1.4% |
| Dutch | 238 | 0.3% |
| Dutch West Indian | 26 | 0.0% |
| Eastern European | 262 | 0.3% |
| Ecuadorian | 236 | 0.3% |
| Egyptian | 104 | 0.1% |
| English | 3,493 | 4.0% |
| Estonian | 20 | 0.0% |
| European | 673 | 0.8% |
| Finnish | 11 | 0.0% |
| French | 1,371 | 1.6% |
| French American Indian | 7 | 0.0% |
| French Canadian | 496 | 0.6% |
| German | 5,656 | 6.5% |
| Greek | 352 | 0.4% |
| Guamanian / Chamorro | 9 | 0.0% |
| Guatemalan | 1,492 | 1.7% |
| Guyanese | 24 | 0.0% |
| Haitian | 8,088 | 9.4% |
| Honduran | 2,490 | 2.9% |
| Hungarian | 457 | 0.5% |
| Icelander | 33 | 0.0% |
| Indian (Asian) | 91 | 0.1% |
| Iranian | 54 | 0.1% |
| Irish | 5,916 | 6.8% |
| Israeli | 189 | 0.2% |
| Italian | 6,521 | 7.5% |
| Jamaican | 1,139 | 1.3% |
| Korean | 540 | 0.6% |
| Latvian | 36 | 0.0% |
| Lebanese | 641 | 0.7% |
| Lithuanian | 136 | 0.2% |
| Lumbee | 5 | 0.0% |
| Luxembourger | 22 | 0.0% |
| Mexican | 1,454 | 1.7% |
| Moroccan | 26 | 0.0% |
| Nicaraguan | 299 | 0.4% |
| Northern European | 29 | 0.0% |
| Norwegian | 245 | 0.3% |
| Pakistani | 27 | 0.0% |
| Panamanian | 228 | 0.3% |
| Peruvian | 739 | 0.9% |
| Polish | 2,734 | 3.2% |
| Portuguese | 1,516 | 1.8% |
| Puerto Rican | 3,369 | 3.9% |
| Romanian | 272 | 0.3% |
| Russian | 1,574 | 1.8% |
| Salvadoran | 179 | 0.2% |
| Scandinavian | 37 | 0.0% |
| Scotch-Irish | 409 | 0.5% |
| Scottish | 427 | 0.5% |
| Serbian | 41 | 0.1% |
| Sioux | 159 | 0.2% |
| Slavic | 31 | 0.0% |
| Slovak | 79 | 0.1% |
| Slovene | 10 | 0.0% |
| South African | 33 | 0.0% |
| South American | 6,080 | 7.0% |
| South American Indian | 231 | 0.3% |
| Spaniard | 268 | 0.3% |
| Spanish | 298 | 0.3% |
| Sri Lankan | 74 | 0.1% |
| Subsaharan African | 670 | 0.8% |
| Swedish | 392 | 0.4% |
| Swiss | 289 | 0.3% |
| Thai | 1,098 | 1.3% |
| Trinidadian and Tobagonian | 268 | 0.3% |
| Turkish | 104 | 0.1% |
| Ukrainian | 250 | 0.3% |
| Uruguayan | 126 | 0.2% |
| Venezuelan | 1,262 | 1.5% |
| Welsh | 109 | 0.1% |
| West Indian | 208 | 0.2% |
| Yugoslavian | 23 | 0.0% | View All 106 Rows |
Immigrants in Deerfield Beach
The most numerous immigrant groups reported in Deerfield Beach came from Latin America (26,203 | 30.3%), South America (12,844 | 14.9%), Caribbean (9,438 | 10.9%), Brazil (7,313 | 8.5%), and Haiti (5,677 | 6.6%), together accounting for 71.1% of all Deerfield Beach residents.
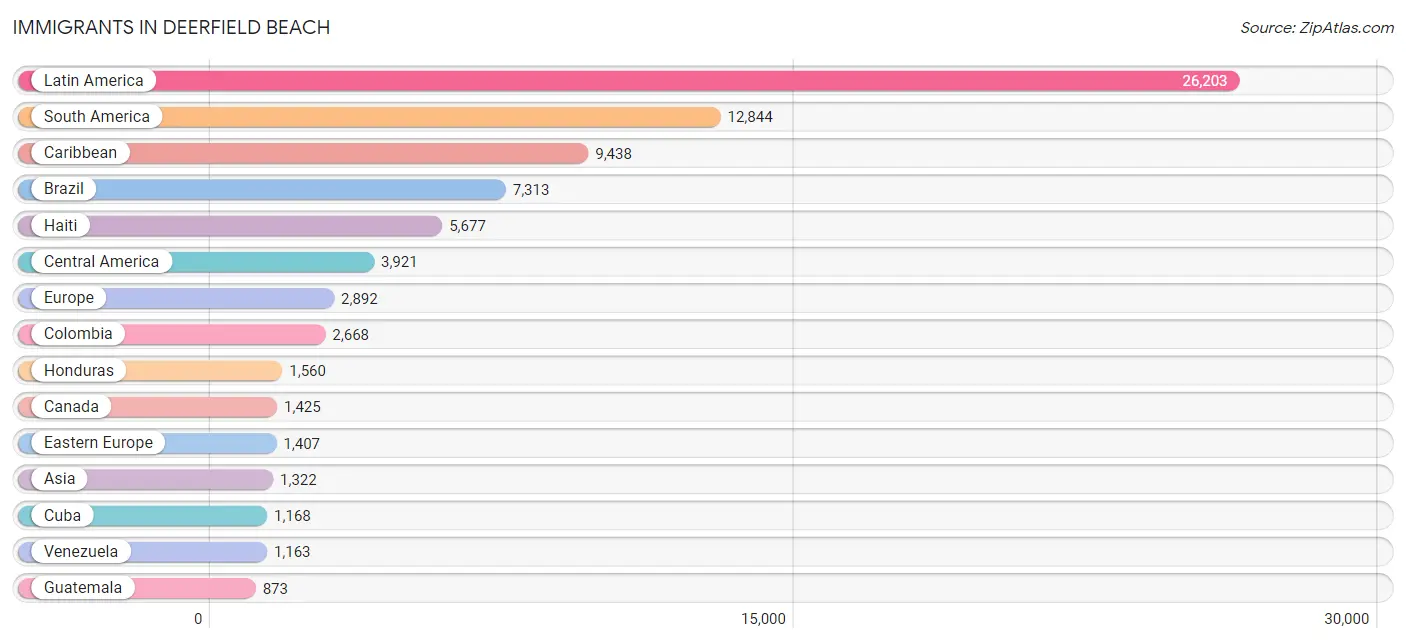
| Immigration Origin | # Population | % Population |
| Africa | 392 | 0.4% |
| Argentina | 331 | 0.4% |
| Asia | 1,322 | 1.5% |
| Bahamas | 50 | 0.1% |
| Bangladesh | 283 | 0.3% |
| Barbados | 73 | 0.1% |
| Belarus | 91 | 0.1% |
| Belgium | 343 | 0.4% |
| Belize | 44 | 0.1% |
| Bosnia and Herzegovina | 83 | 0.1% |
| Brazil | 7,313 | 8.5% |
| Bulgaria | 9 | 0.0% |
| Cameroon | 58 | 0.1% |
| Canada | 1,425 | 1.7% |
| Caribbean | 9,438 | 10.9% |
| Central America | 3,921 | 4.5% |
| Chile | 42 | 0.1% |
| China | 42 | 0.1% |
| Colombia | 2,668 | 3.1% |
| Congo | 9 | 0.0% |
| Costa Rica | 209 | 0.2% |
| Croatia | 10 | 0.0% |
| Cuba | 1,168 | 1.3% |
| Czechoslovakia | 34 | 0.0% |
| Dominica | 21 | 0.0% |
| Dominican Republic | 714 | 0.8% |
| Eastern Asia | 200 | 0.2% |
| Eastern Europe | 1,407 | 1.6% |
| Ecuador | 225 | 0.3% |
| Egypt | 150 | 0.2% |
| El Salvador | 149 | 0.2% |
| England | 128 | 0.2% |
| Europe | 2,892 | 3.4% |
| Fiji | 23 | 0.0% |
| France | 69 | 0.1% |
| Germany | 72 | 0.1% |
| Greece | 34 | 0.0% |
| Guatemala | 873 | 1.0% |
| Guyana | 374 | 0.4% |
| Haiti | 5,677 | 6.6% |
| Honduras | 1,560 | 1.8% |
| Hong Kong | 2 | 0.0% |
| Hungary | 33 | 0.0% |
| India | 36 | 0.0% |
| Indonesia | 55 | 0.1% |
| Iran | 31 | 0.0% |
| Ireland | 35 | 0.0% |
| Israel | 91 | 0.1% |
| Italy | 435 | 0.5% |
| Jamaica | 756 | 0.9% |
| Japan | 15 | 0.0% |
| Korea | 143 | 0.2% |
| Latin America | 26,203 | 30.3% |
| Latvia | 23 | 0.0% |
| Lebanon | 201 | 0.2% |
| Mexico | 637 | 0.7% |
| Middle Africa | 67 | 0.1% |
| Morocco | 26 | 0.0% |
| Netherlands | 32 | 0.0% |
| Nicaragua | 339 | 0.4% |
| Northern Africa | 245 | 0.3% |
| Northern Europe | 310 | 0.4% |
| Norway | 22 | 0.0% |
| Oceania | 59 | 0.1% |
| Panama | 110 | 0.1% |
| Peru | 599 | 0.7% |
| Philippines | 246 | 0.3% |
| Poland | 233 | 0.3% |
| Portugal | 95 | 0.1% |
| Romania | 89 | 0.1% |
| Russia | 497 | 0.6% |
| Saudi Arabia | 10 | 0.0% |
| Scotland | 12 | 0.0% |
| South Africa | 80 | 0.1% |
| South America | 12,844 | 14.9% |
| South Central Asia | 357 | 0.4% |
| South Eastern Asia | 349 | 0.4% |
| Southern Europe | 576 | 0.7% |
| Spain | 12 | 0.0% |
| Sweden | 17 | 0.0% |
| Switzerland | 76 | 0.1% |
| Thailand | 27 | 0.0% |
| Trinidad and Tobago | 276 | 0.3% |
| Turkey | 89 | 0.1% |
| Ukraine | 239 | 0.3% |
| Uruguay | 129 | 0.2% |
| Uzbekistan | 7 | 0.0% |
| Venezuela | 1,163 | 1.3% |
| Vietnam | 21 | 0.0% |
| West Indies | 38 | 0.0% |
| Western Asia | 416 | 0.5% |
| Western Europe | 592 | 0.7% | View All 92 Rows |
Sex and Age in Deerfield Beach
Sex and Age in Deerfield Beach
The most populous age groups in Deerfield Beach are 35 to 39 Years (3,416 | 8.5%) for men and 30 to 34 Years (3,486 | 7.6%) for women.
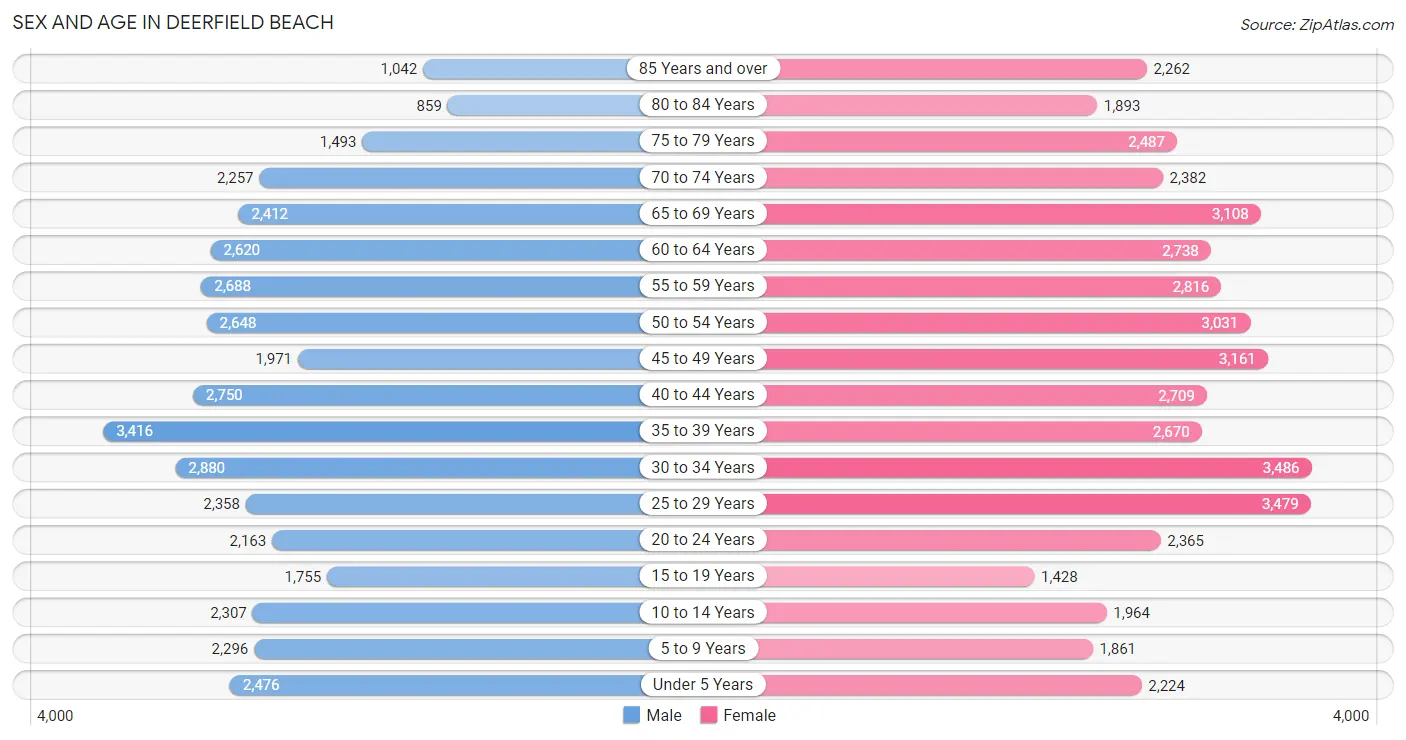
| Age Bracket | Male | Female |
| Under 5 Years | 2,476 (6.1%) | 2,224 (4.8%) |
| 5 to 9 Years | 2,296 (5.7%) | 1,861 (4.0%) |
| 10 to 14 Years | 2,307 (5.7%) | 1,964 (4.3%) |
| 15 to 19 Years | 1,755 (4.3%) | 1,428 (3.1%) |
| 20 to 24 Years | 2,163 (5.4%) | 2,365 (5.1%) |
| 25 to 29 Years | 2,358 (5.8%) | 3,479 (7.5%) |
| 30 to 34 Years | 2,880 (7.1%) | 3,486 (7.6%) |
| 35 to 39 Years | 3,416 (8.5%) | 2,670 (5.8%) |
| 40 to 44 Years | 2,750 (6.8%) | 2,709 (5.9%) |
| 45 to 49 Years | 1,971 (4.9%) | 3,161 (6.9%) |
| 50 to 54 Years | 2,648 (6.6%) | 3,031 (6.6%) |
| 55 to 59 Years | 2,688 (6.7%) | 2,816 (6.1%) |
| 60 to 64 Years | 2,620 (6.5%) | 2,738 (5.9%) |
| 65 to 69 Years | 2,412 (6.0%) | 3,108 (6.8%) |
| 70 to 74 Years | 2,257 (5.6%) | 2,382 (5.2%) |
| 75 to 79 Years | 1,493 (3.7%) | 2,487 (5.4%) |
| 80 to 84 Years | 859 (2.1%) | 1,893 (4.1%) |
| 85 Years and over | 1,042 (2.6%) | 2,262 (4.9%) |
| Total | 40,391 (100.0%) | 46,064 (100.0%) |
Families and Households in Deerfield Beach
Median Family Size in Deerfield Beach
The median family size in Deerfield Beach is 3.15 persons per family, with single female/mother families (4,707 | 23.6%) accounting for the largest median family size of 3.31 persons per family. On the other hand, single male/father families (1,732 | 8.7%) represent the smallest median family size with 2.90 persons per family.
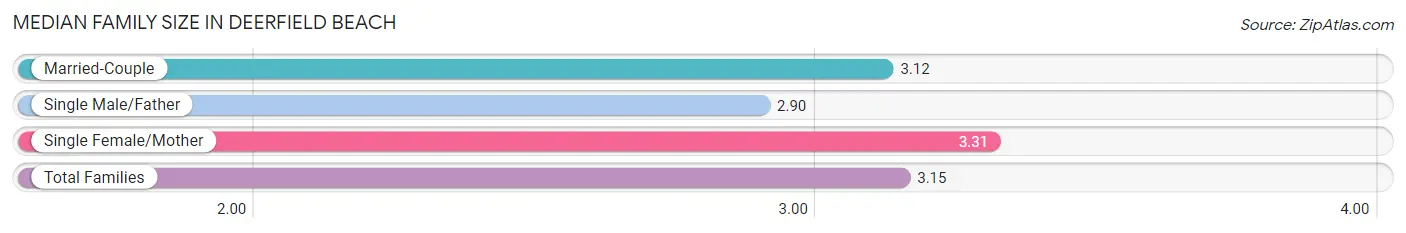
| Family Type | # Families | Family Size |
| Married-Couple | 13,537 (67.8%) | 3.12 |
| Single Male/Father | 1,732 (8.7%) | 2.90 |
| Single Female/Mother | 4,707 (23.6%) | 3.31 |
| Total Families | 19,976 (100.0%) | 3.15 |
Median Household Size in Deerfield Beach
The median household size in Deerfield Beach is 2.34 persons per household, with single female/mother households (4,707 | 13.0%) accounting for the largest median household size of 3.6 persons per household. non-family households (16,243 | 44.9%) represent the smallest median household size with 1.22 persons per household.
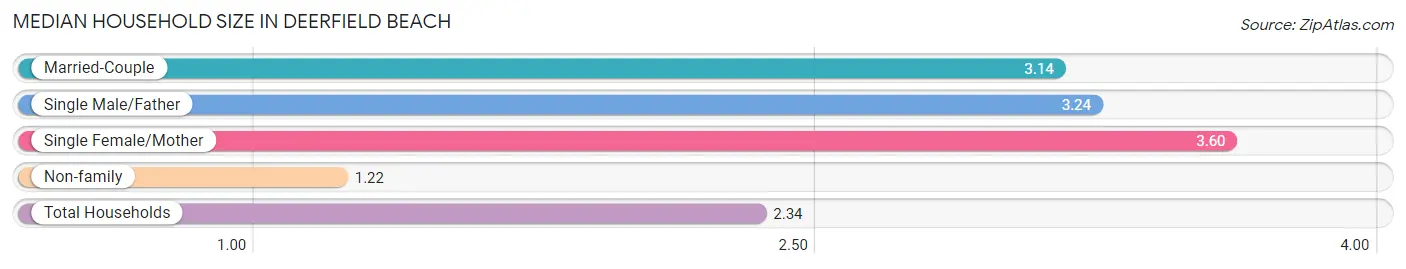
| Household Type | # Households | Household Size |
| Married-Couple | 13,537 (37.4%) | 3.14 |
| Single Male/Father | 1,732 (4.8%) | 3.24 |
| Single Female/Mother | 4,707 (13.0%) | 3.60 |
| Non-family | 16,243 (44.9%) | 1.22 |
| Total Households | 36,219 (100.0%) | 2.34 |
Household Size by Marriage Status in Deerfield Beach
Out of a total of 36,219 households in Deerfield Beach, 19,976 (55.1%) are family households, while 16,243 (44.9%) are nonfamily households. The most numerous type of family households are 2-person households, comprising 9,151, and the most common type of nonfamily households are 1-person households, comprising 13,639.
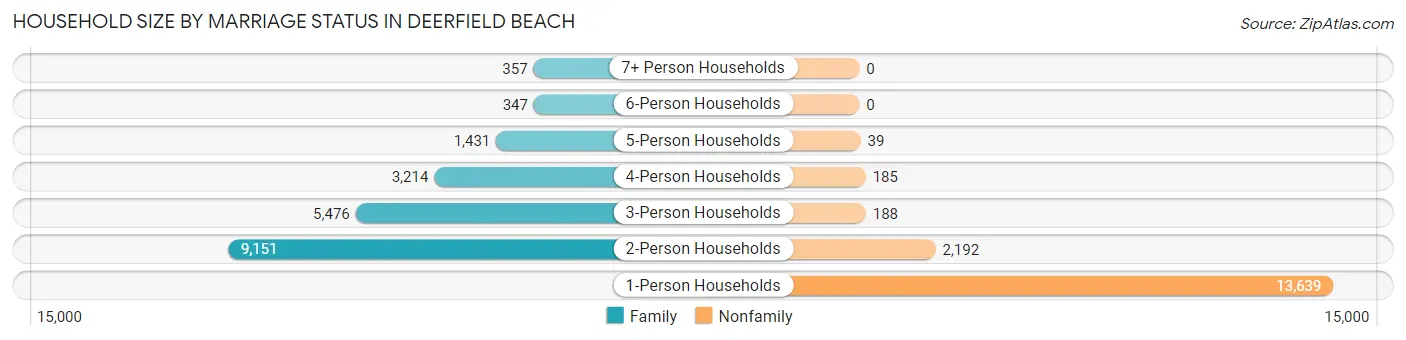
| Household Size | Family Households | Nonfamily Households |
| 1-Person Households | - | 13,639 (37.7%) |
| 2-Person Households | 9,151 (25.3%) | 2,192 (6.0%) |
| 3-Person Households | 5,476 (15.1%) | 188 (0.5%) |
| 4-Person Households | 3,214 (8.9%) | 185 (0.5%) |
| 5-Person Households | 1,431 (4.0%) | 39 (0.1%) |
| 6-Person Households | 347 (1.0%) | 0 (0.0%) |
| 7+ Person Households | 357 (1.0%) | 0 (0.0%) |
| Total | 19,976 (55.1%) | 16,243 (44.9%) |
Female Fertility in Deerfield Beach
Fertility by Age in Deerfield Beach
Average fertility rate in Deerfield Beach is 66.0 births per 1,000 women. Women in the age bracket of 20 to 34 years have the highest fertility rate with 111.0 births per 1,000 women. Women in the age bracket of 20 to 34 years acount for 79.4% of all women with births.
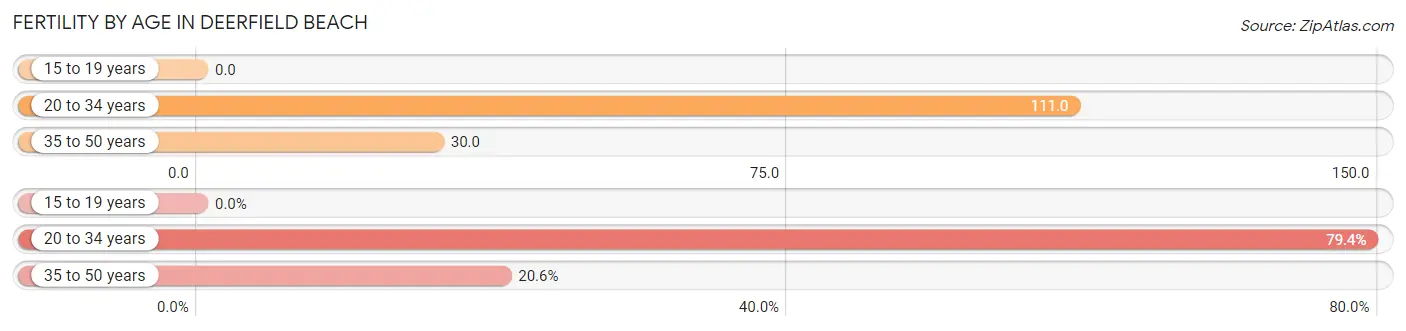
| Age Bracket | Women with Births | Births / 1,000 Women |
| 15 to 19 years | 0 (0.0%) | 0.0 |
| 20 to 34 years | 1,034 (79.4%) | 111.0 |
| 35 to 50 years | 268 (20.6%) | 30.0 |
| Total | 1,302 (100.0%) | 66.0 |
Fertility by Age by Marriage Status in Deerfield Beach
78.0% of women with births (1,302) in Deerfield Beach are married. The highest percentage of unmarried women with births falls into 20 to 34 years age bracket with 22.2% of them unmarried at the time of birth, while the lowest percentage of unmarried women with births belong to 35 to 50 years age bracket with 21.3% of them unmarried.
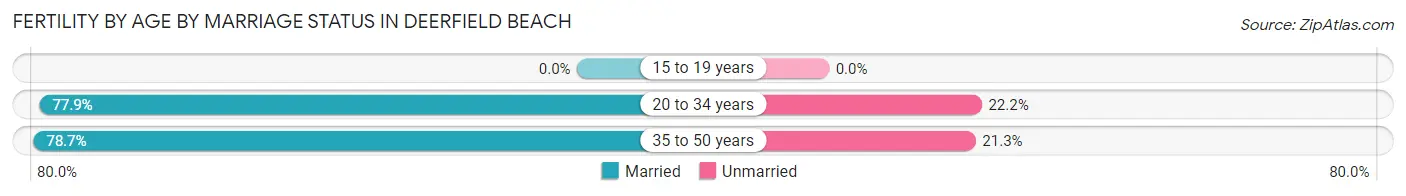
| Age Bracket | Married | Unmarried |
| 15 to 19 years | 0 (0.0%) | 0 (0.0%) |
| 20 to 34 years | 805 (77.8%) | 229 (22.2%) |
| 35 to 50 years | 211 (78.7%) | 57 (21.3%) |
| Total | 1,016 (78.0%) | 286 (22.0%) |
Fertility by Education in Deerfield Beach
Average fertility rate in Deerfield Beach is 66.0 births per 1,000 women. Women with the education attainment of college or associate's degree have the highest fertility rate of 89.0 births per 1,000 women, while women with the education attainment of less than high school have the lowest fertility at 1.0 births per 1,000 women. Women with the education attainment of college or associate's degree represent 42.1% of all women with births.
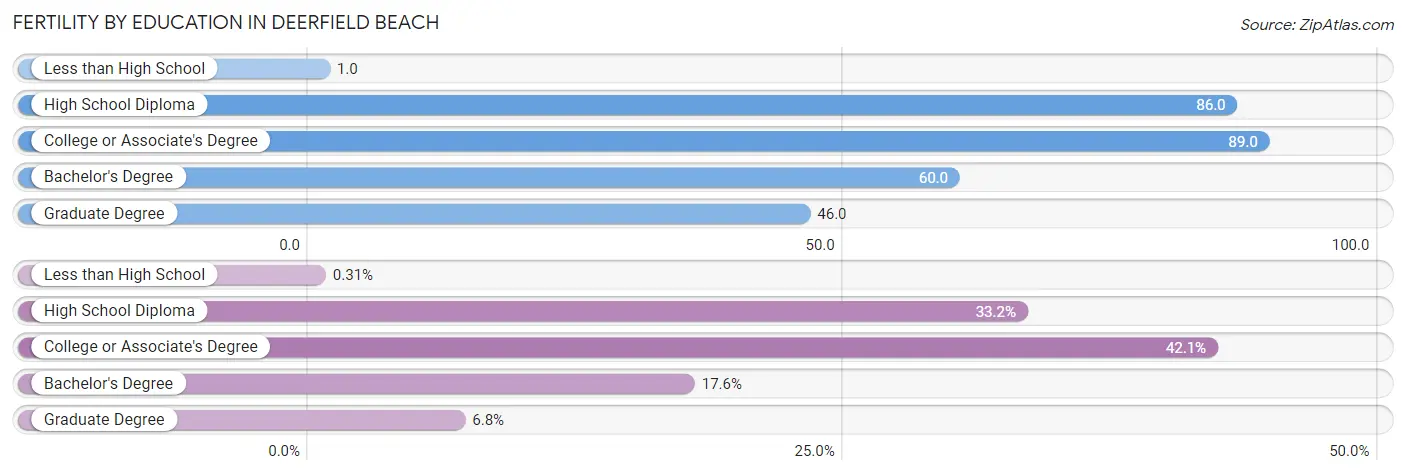
| Educational Attainment | Women with Births | Births / 1,000 Women |
| Less than High School | 4 (0.3%) | 1.0 |
| High School Diploma | 432 (33.2%) | 86.0 |
| College or Associate's Degree | 548 (42.1%) | 89.0 |
| Bachelor's Degree | 229 (17.6%) | 60.0 |
| Graduate Degree | 89 (6.8%) | 46.0 |
| Total | 1,302 (100.0%) | 66.0 |
Fertility by Education by Marriage Status in Deerfield Beach
22.0% of women with births in Deerfield Beach are unmarried. Women with the educational attainment of bachelor's degree are most likely to be married with 100.0% of them married at childbirth, while women with the educational attainment of less than high school are least likely to be married with 100.0% of them unmarried at childbirth.
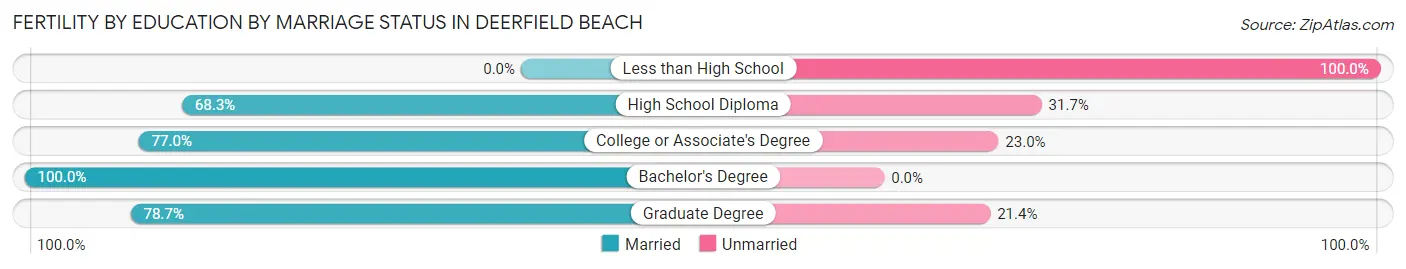
| Educational Attainment | Married | Unmarried |
| Less than High School | 0 (0.0%) | 4 (100.0%) |
| High School Diploma | 295 (68.3%) | 137 (31.7%) |
| College or Associate's Degree | 422 (77.0%) | 126 (23.0%) |
| Bachelor's Degree | 229 (100.0%) | 0 (0.0%) |
| Graduate Degree | 70 (78.6%) | 19 (21.3%) |
| Total | 1,016 (78.0%) | 286 (22.0%) |
Employment Characteristics in Deerfield Beach
Employment by Class of Employer in Deerfield Beach
Among the 41,232 employed individuals in Deerfield Beach, private company employees (27,216 | 66.0%), self-employed (not incorporated) (3,922 | 9.5%), and self-employed (incorporated) (3,027 | 7.3%) make up the most common classes of employment.
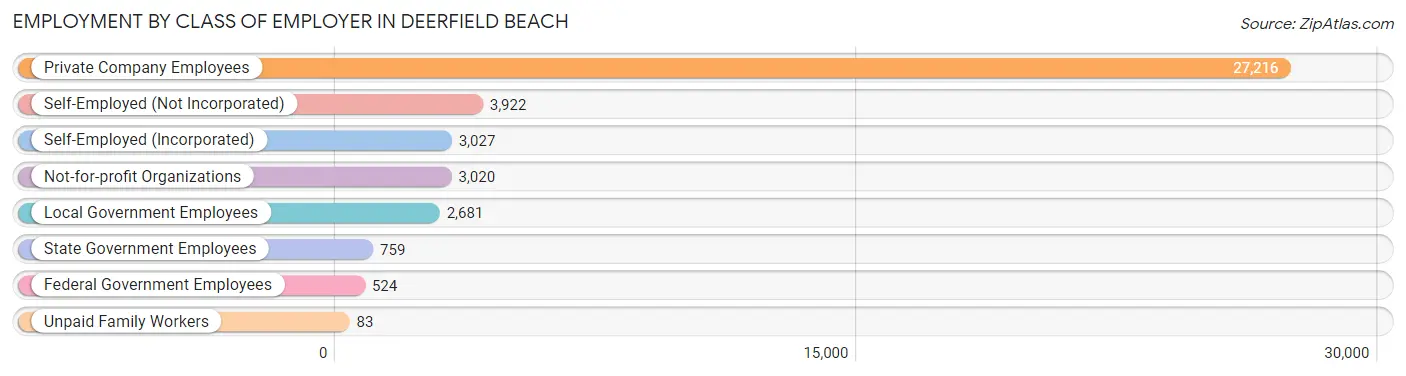
| Employer Class | # Employees | % Employees |
| Private Company Employees | 27,216 | 66.0% |
| Self-Employed (Incorporated) | 3,027 | 7.3% |
| Self-Employed (Not Incorporated) | 3,922 | 9.5% |
| Not-for-profit Organizations | 3,020 | 7.3% |
| Local Government Employees | 2,681 | 6.5% |
| State Government Employees | 759 | 1.8% |
| Federal Government Employees | 524 | 1.3% |
| Unpaid Family Workers | 83 | 0.2% |
| Total | 41,232 | 100.0% |
Employment Status by Age in Deerfield Beach
According to the labor force statistics for Deerfield Beach, out of the total population over 16 years of age (72,657), 61.4% or 44,611 individuals are in the labor force, with 6.3% or 2,810 of them unemployed. The age group with the highest labor force participation rate is 35 to 44 years, with 85.5% or 9,871 individuals in the labor force. Within the labor force, the 20 to 24 years age range has the highest percentage of unemployed individuals, with 20.7% or 672 of them being unemployed.
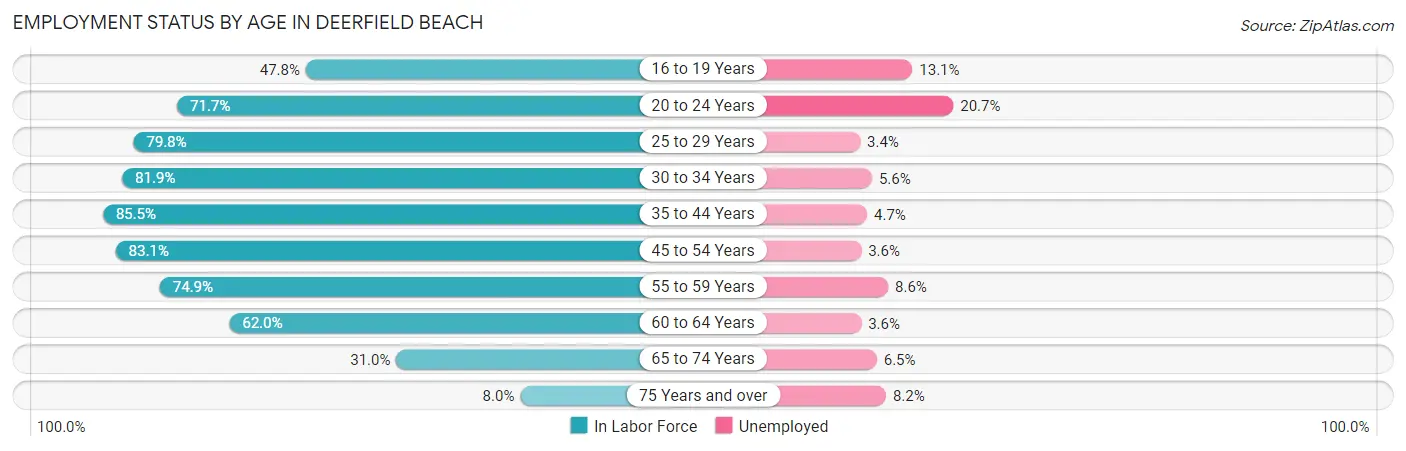
| Age Bracket | In Labor Force | Unemployed |
| 16 to 19 Years | 1,201 (47.8%) | 157 (13.1%) |
| 20 to 24 Years | 3,247 (71.7%) | 672 (20.7%) |
| 25 to 29 Years | 4,658 (79.8%) | 158 (3.4%) |
| 30 to 34 Years | 5,214 (81.9%) | 292 (5.6%) |
| 35 to 44 Years | 9,871 (85.5%) | 464 (4.7%) |
| 45 to 54 Years | 8,984 (83.1%) | 323 (3.6%) |
| 55 to 59 Years | 4,122 (74.9%) | 354 (8.6%) |
| 60 to 64 Years | 3,322 (62.0%) | 120 (3.6%) |
| 65 to 74 Years | 3,149 (31.0%) | 205 (6.5%) |
| 75 Years and over | 803 (8.0%) | 66 (8.2%) |
| Total | 44,611 (61.4%) | 2,810 (6.3%) |
Employment Status by Educational Attainment in Deerfield Beach
According to labor force statistics for Deerfield Beach, 79.7% of individuals (36,201) out of the total population between 25 and 64 years of age (45,421) are in the labor force, with 4.7% or 1,701 of them being unemployed. The group with the highest labor force participation rate are those with the educational attainment of bachelor's degree or higher, with 85.9% or 10,993 individuals in the labor force. Within the labor force, individuals with high school diploma education have the highest percentage of unemployment, with 7.0% or 673 of them being unemployed.
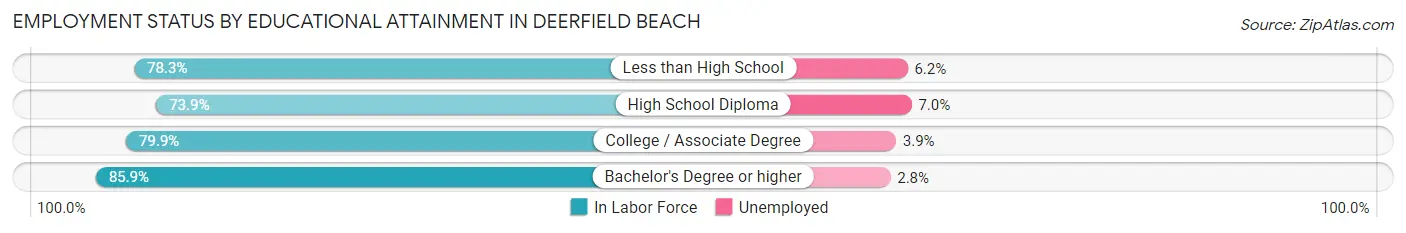
| Educational Attainment | In Labor Force | Unemployed |
| Less than High School | 4,899 (78.3%) | 388 (6.2%) |
| High School Diploma | 9,617 (73.9%) | 911 (7.0%) |
| College / Associate Degree | 10,669 (79.9%) | 521 (3.9%) |
| Bachelor's Degree or higher | 10,993 (85.9%) | 358 (2.8%) |
| Total | 36,201 (79.7%) | 2,135 (4.7%) |
Employment Occupations by Sex in Deerfield Beach
Management, Business, Science and Arts Occupations
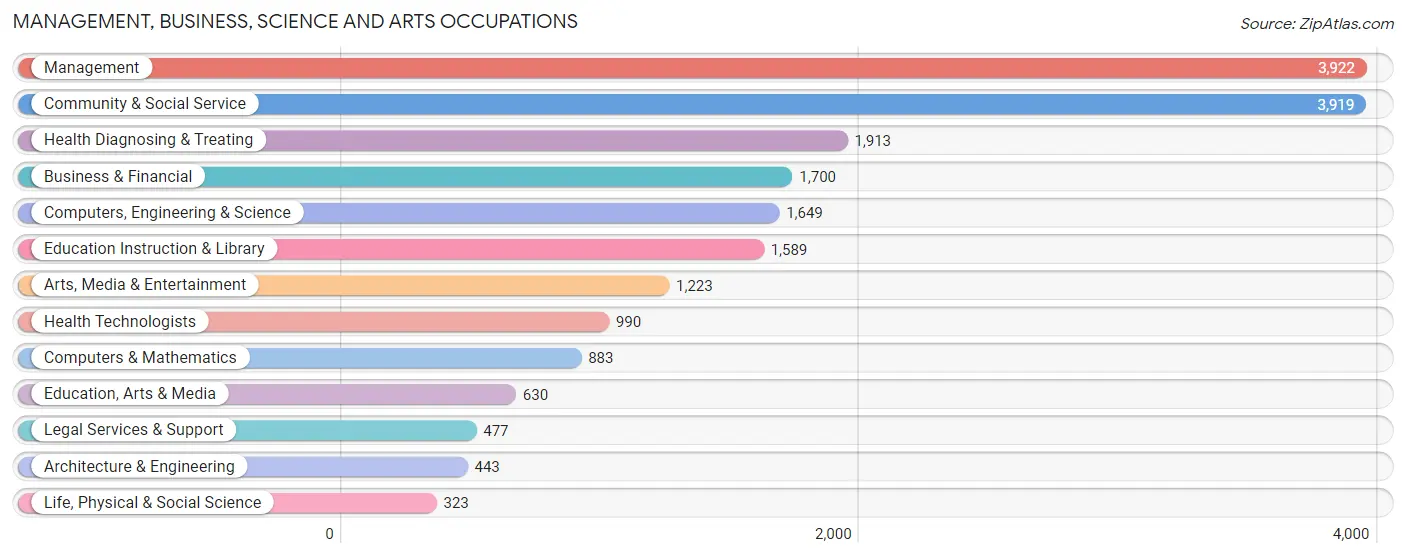
The most common Management, Business, Science and Arts occupations in Deerfield Beach are Management (3,922 | 9.4%), Community & Social Service (3,919 | 9.4%), Health Diagnosing & Treating (1,913 | 4.6%), Business & Financial (1,700 | 4.1%), and Computers, Engineering & Science (1,649 | 4.0%).
Management, Business, Science and Arts Occupations by Sex
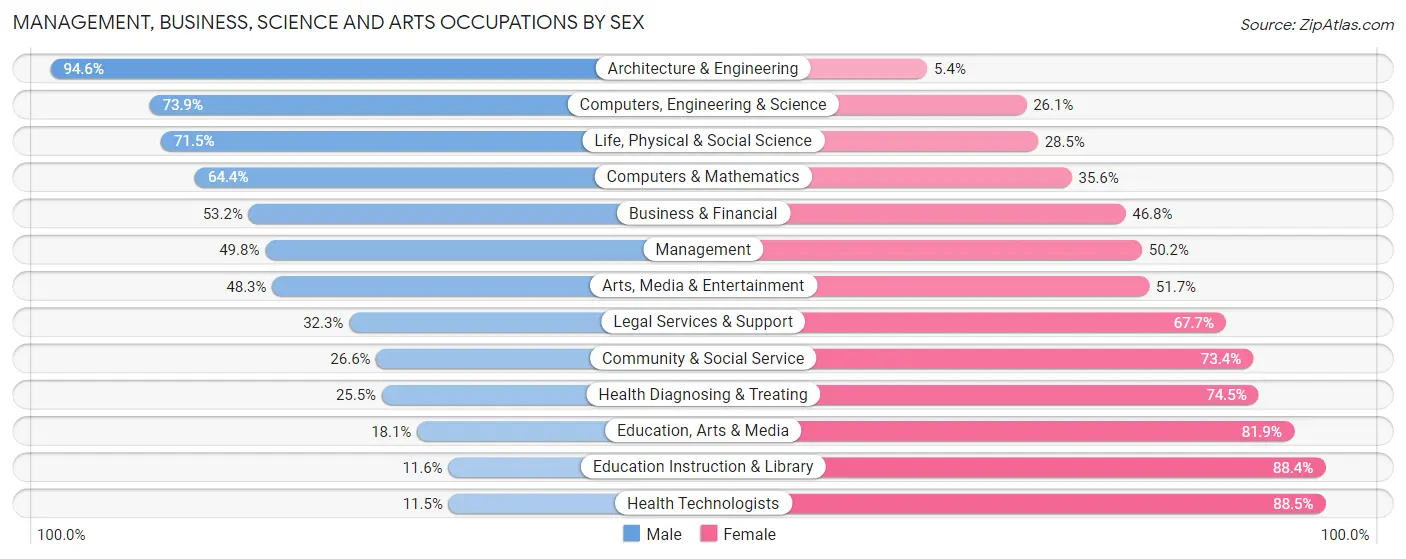
Within the Management, Business, Science and Arts occupations in Deerfield Beach, the most male-oriented occupations are Architecture & Engineering (94.6%), Computers, Engineering & Science (73.9%), and Life, Physical & Social Science (71.5%), while the most female-oriented occupations are Health Technologists (88.5%), Education Instruction & Library (88.4%), and Education, Arts & Media (81.9%).
| Occupation | Male | Female |
| Management | 1,953 (49.8%) | 1,969 (50.2%) |
| Business & Financial | 905 (53.2%) | 795 (46.8%) |
| Computers, Engineering & Science | 1,219 (73.9%) | 430 (26.1%) |
| Computers & Mathematics | 569 (64.4%) | 314 (35.6%) |
| Architecture & Engineering | 419 (94.6%) | 24 (5.4%) |
| Life, Physical & Social Science | 231 (71.5%) | 92 (28.5%) |
| Community & Social Service | 1,043 (26.6%) | 2,876 (73.4%) |
| Education, Arts & Media | 114 (18.1%) | 516 (81.9%) |
| Legal Services & Support | 154 (32.3%) | 323 (67.7%) |
| Education Instruction & Library | 184 (11.6%) | 1,405 (88.4%) |
| Arts, Media & Entertainment | 591 (48.3%) | 632 (51.7%) |
| Health Diagnosing & Treating | 487 (25.5%) | 1,426 (74.5%) |
| Health Technologists | 114 (11.5%) | 876 (88.5%) |
| Total (Category) | 5,607 (42.8%) | 7,496 (57.2%) |
| Total (Overall) | 20,667 (49.6%) | 21,010 (50.4%) |
Services Occupations
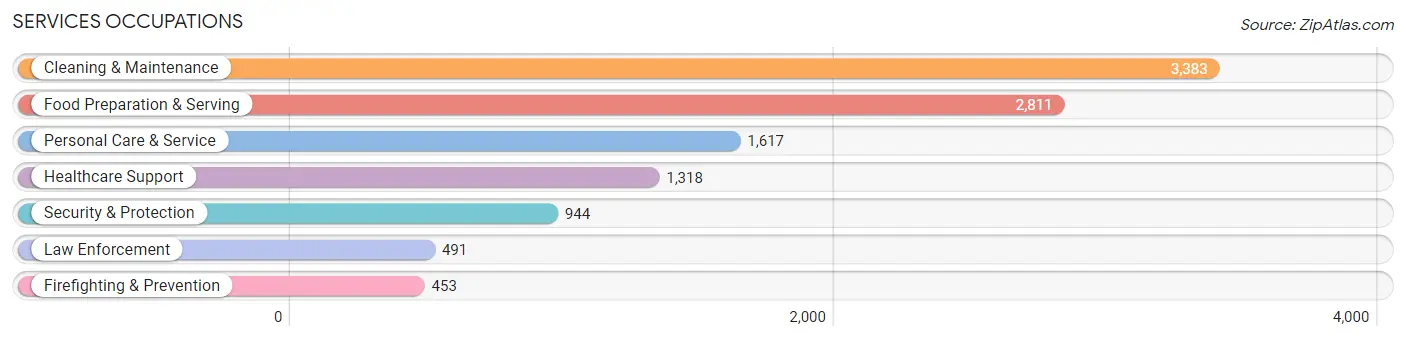
The most common Services occupations in Deerfield Beach are Cleaning & Maintenance (3,383 | 8.1%), Food Preparation & Serving (2,811 | 6.7%), Personal Care & Service (1,617 | 3.9%), Healthcare Support (1,318 | 3.2%), and Security & Protection (944 | 2.3%).
Services Occupations by Sex
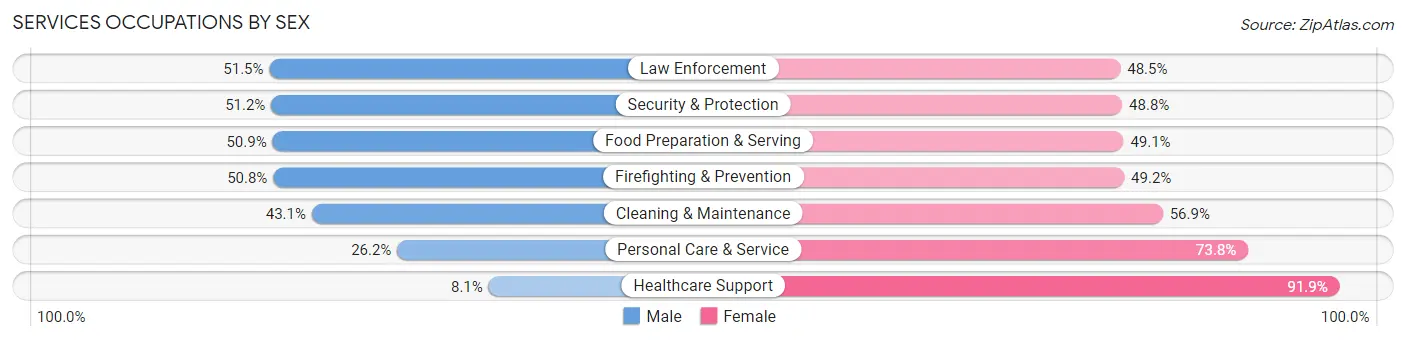
Within the Services occupations in Deerfield Beach, the most male-oriented occupations are Law Enforcement (51.5%), Security & Protection (51.2%), and Food Preparation & Serving (50.9%), while the most female-oriented occupations are Healthcare Support (91.9%), Personal Care & Service (73.8%), and Cleaning & Maintenance (56.9%).
| Occupation | Male | Female |
| Healthcare Support | 107 (8.1%) | 1,211 (91.9%) |
| Security & Protection | 483 (51.2%) | 461 (48.8%) |
| Firefighting & Prevention | 230 (50.8%) | 223 (49.2%) |
| Law Enforcement | 253 (51.5%) | 238 (48.5%) |
| Food Preparation & Serving | 1,431 (50.9%) | 1,380 (49.1%) |
| Cleaning & Maintenance | 1,459 (43.1%) | 1,924 (56.9%) |
| Personal Care & Service | 424 (26.2%) | 1,193 (73.8%) |
| Total (Category) | 3,904 (38.8%) | 6,169 (61.2%) |
| Total (Overall) | 20,667 (49.6%) | 21,010 (50.4%) |
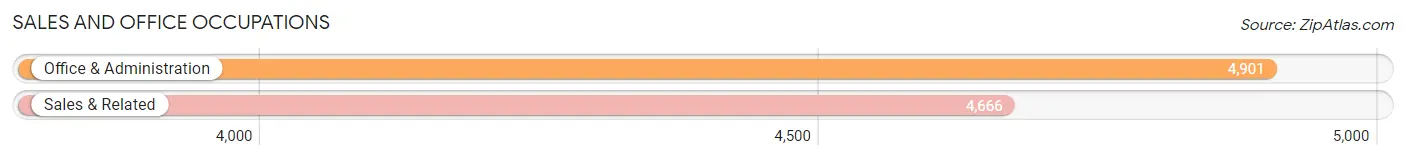
Sales and Office Occupations
The most common Sales and Office occupations in Deerfield Beach are Office & Administration (4,901 | 11.8%), and Sales & Related (4,666 | 11.2%).
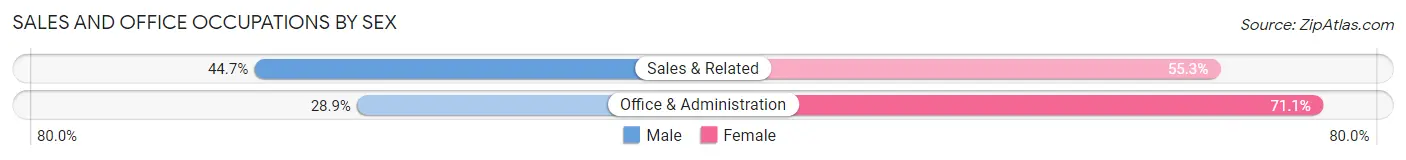
Sales and Office Occupations by Sex
| Occupation | Male | Female |
| Sales & Related | 2,086 (44.7%) | 2,580 (55.3%) |
| Office & Administration | 1,417 (28.9%) | 3,484 (71.1%) |
| Total (Category) | 3,503 (36.6%) | 6,064 (63.4%) |
| Total (Overall) | 20,667 (49.6%) | 21,010 (50.4%) |
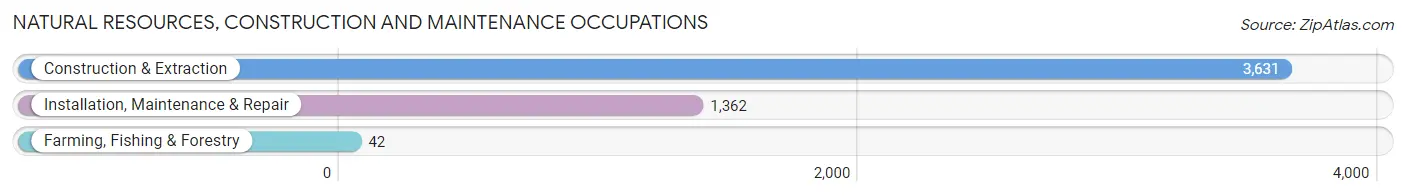
Natural Resources, Construction and Maintenance Occupations
The most common Natural Resources, Construction and Maintenance occupations in Deerfield Beach are Construction & Extraction (3,631 | 8.7%), Installation, Maintenance & Repair (1,362 | 3.3%), and Farming, Fishing & Forestry (42 | 0.1%).
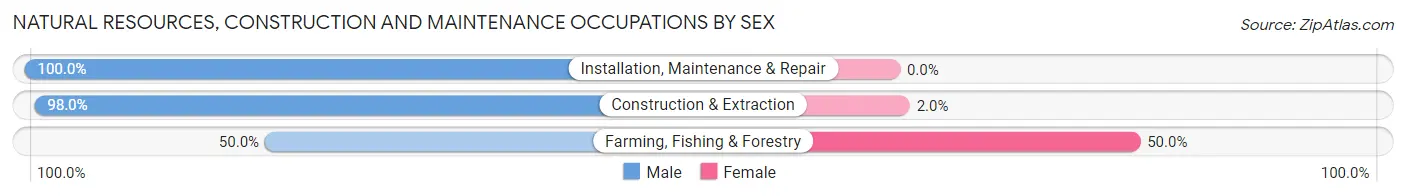
Natural Resources, Construction and Maintenance Occupations by Sex
| Occupation | Male | Female |
| Farming, Fishing & Forestry | 21 (50.0%) | 21 (50.0%) |
| Construction & Extraction | 3,557 (98.0%) | 74 (2.0%) |
| Installation, Maintenance & Repair | 1,362 (100.0%) | 0 (0.0%) |
| Total (Category) | 4,940 (98.1%) | 95 (1.9%) |
| Total (Overall) | 20,667 (49.6%) | 21,010 (50.4%) |
Production, Transportation and Moving Occupations
The most common Production, Transportation and Moving occupations in Deerfield Beach are Transportation (1,519 | 3.6%), Material Moving (1,195 | 2.9%), and Production (1,185 | 2.8%).
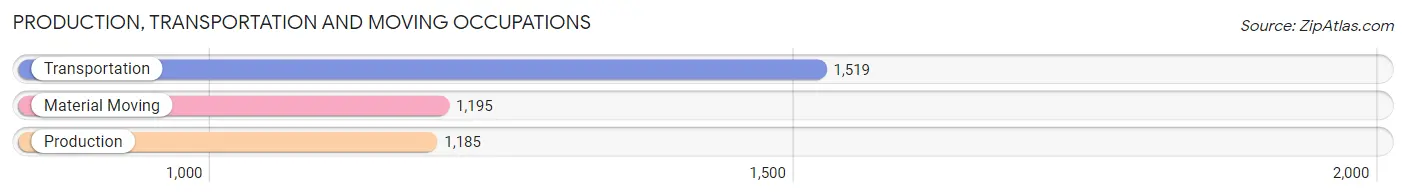
Production, Transportation and Moving Occupations by Sex
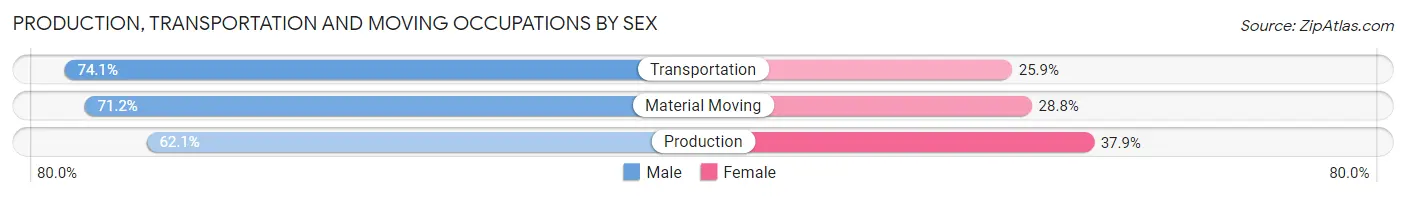
| Occupation | Male | Female |
| Production | 736 (62.1%) | 449 (37.9%) |
| Transportation | 1,126 (74.1%) | 393 (25.9%) |
| Material Moving | 851 (71.2%) | 344 (28.8%) |
| Total (Category) | 2,713 (69.6%) | 1,186 (30.4%) |
| Total (Overall) | 20,667 (49.6%) | 21,010 (50.4%) |
Employment Industries by Sex in Deerfield Beach
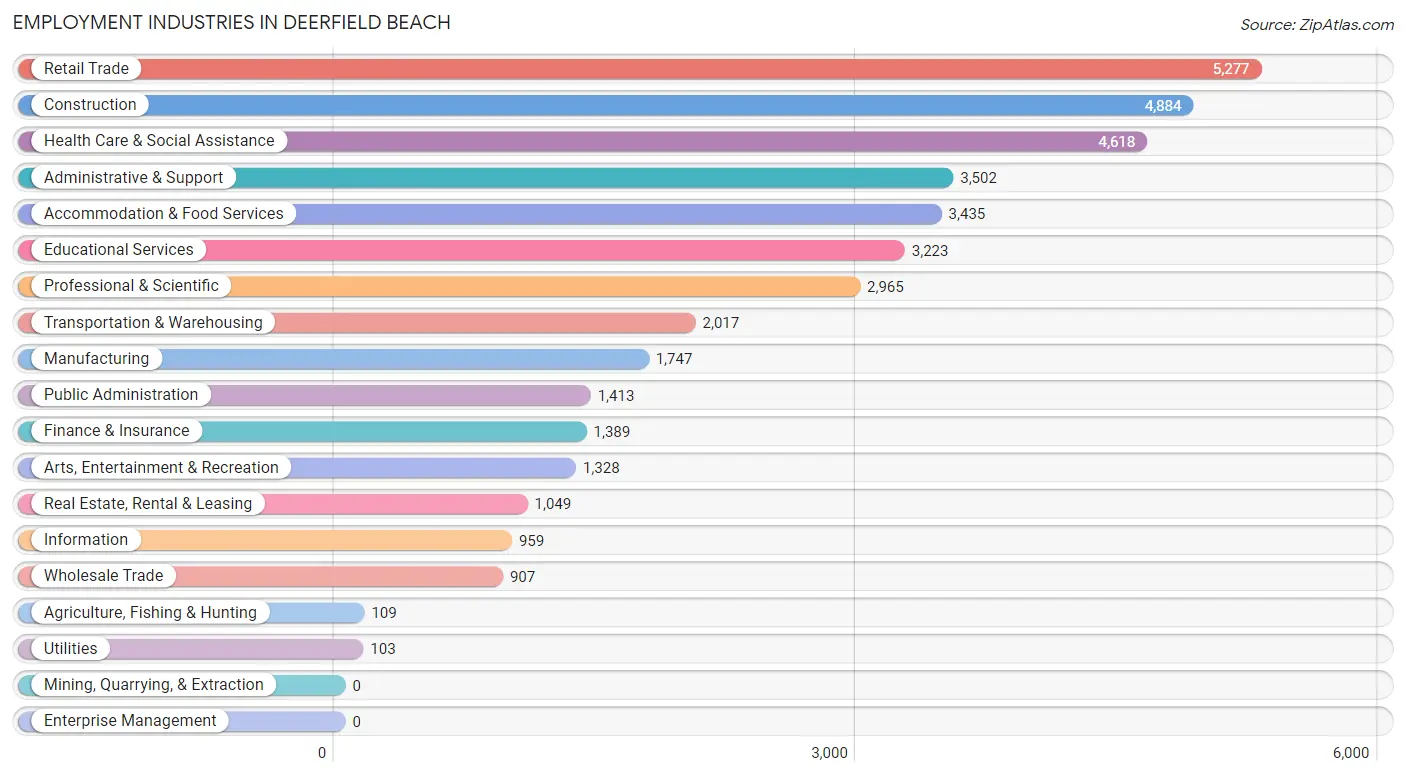
Employment Industries in Deerfield Beach
The major employment industries in Deerfield Beach include Retail Trade (5,277 | 12.7%), Construction (4,884 | 11.7%), Health Care & Social Assistance (4,618 | 11.1%), Administrative & Support (3,502 | 8.4%), and Accommodation & Food Services (3,435 | 8.2%).
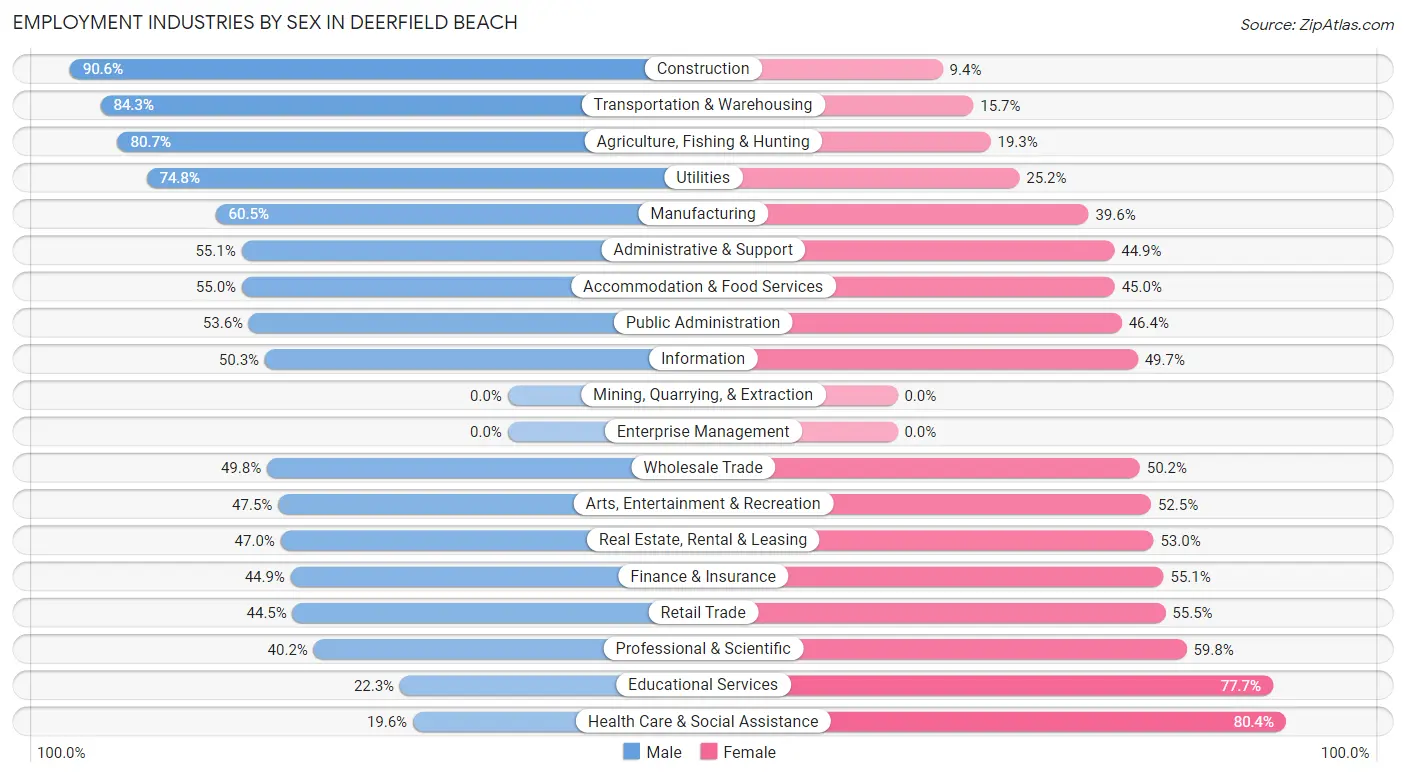
Employment Industries by Sex in Deerfield Beach
The Deerfield Beach industries that see more men than women are Construction (90.6%), Transportation & Warehousing (84.3%), and Agriculture, Fishing & Hunting (80.7%), whereas the industries that tend to have a higher number of women are Health Care & Social Assistance (80.4%), Educational Services (77.7%), and Professional & Scientific (59.8%).
| Industry | Male | Female |
| Agriculture, Fishing & Hunting | 88 (80.7%) | 21 (19.3%) |
| Mining, Quarrying, & Extraction | 0 (0.0%) | 0 (0.0%) |
| Construction | 4,427 (90.6%) | 457 (9.4%) |
| Manufacturing | 1,056 (60.5%) | 691 (39.6%) |
| Wholesale Trade | 452 (49.8%) | 455 (50.2%) |
| Retail Trade | 2,350 (44.5%) | 2,927 (55.5%) |
| Transportation & Warehousing | 1,700 (84.3%) | 317 (15.7%) |
| Utilities | 77 (74.8%) | 26 (25.2%) |
| Information | 482 (50.3%) | 477 (49.7%) |
| Finance & Insurance | 624 (44.9%) | 765 (55.1%) |
| Real Estate, Rental & Leasing | 493 (47.0%) | 556 (53.0%) |
| Professional & Scientific | 1,191 (40.2%) | 1,774 (59.8%) |
| Enterprise Management | 0 (0.0%) | 0 (0.0%) |
| Administrative & Support | 1,930 (55.1%) | 1,572 (44.9%) |
| Educational Services | 719 (22.3%) | 2,504 (77.7%) |
| Health Care & Social Assistance | 906 (19.6%) | 3,712 (80.4%) |
| Arts, Entertainment & Recreation | 631 (47.5%) | 697 (52.5%) |
| Accommodation & Food Services | 1,890 (55.0%) | 1,545 (45.0%) |
| Public Administration | 757 (53.6%) | 656 (46.4%) |
| Total | 20,667 (49.6%) | 21,010 (50.4%) |
Education in Deerfield Beach
School Enrollment in Deerfield Beach
The most common levels of schooling among the 16,253 students in Deerfield Beach are college / undergraduate (3,740 | 23.0%), middle school (3,650 | 22.5%), and elementary school (3,406 | 21.0%).
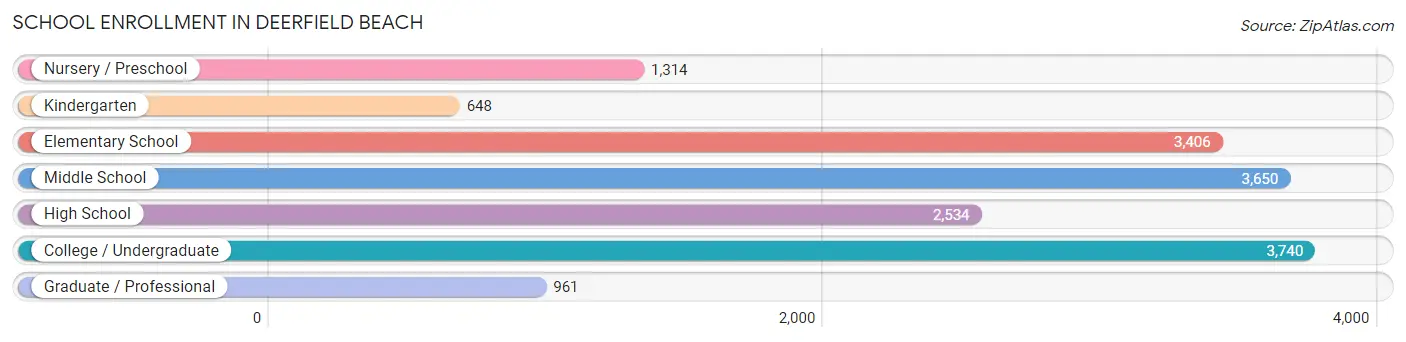
| School Level | # Students | % Students |
| Nursery / Preschool | 1,314 | 8.1% |
| Kindergarten | 648 | 4.0% |
| Elementary School | 3,406 | 21.0% |
| Middle School | 3,650 | 22.5% |
| High School | 2,534 | 15.6% |
| College / Undergraduate | 3,740 | 23.0% |
| Graduate / Professional | 961 | 5.9% |
| Total | 16,253 | 100.0% |
School Enrollment by Age by Funding Source in Deerfield Beach
Out of a total of 16,253 students who are enrolled in schools in Deerfield Beach, 2,991 (18.4%) attend a private institution, while the remaining 13,262 (81.6%) are enrolled in public schools. The age group of 3 to 4 year olds has the highest likelihood of being enrolled in private schools, with 469 (42.9% in the age bracket) enrolled. Conversely, the age group of 10 to 14 year olds has the lowest likelihood of being enrolled in a private school, with 3,828 (90.2% in the age bracket) attending a public institution.
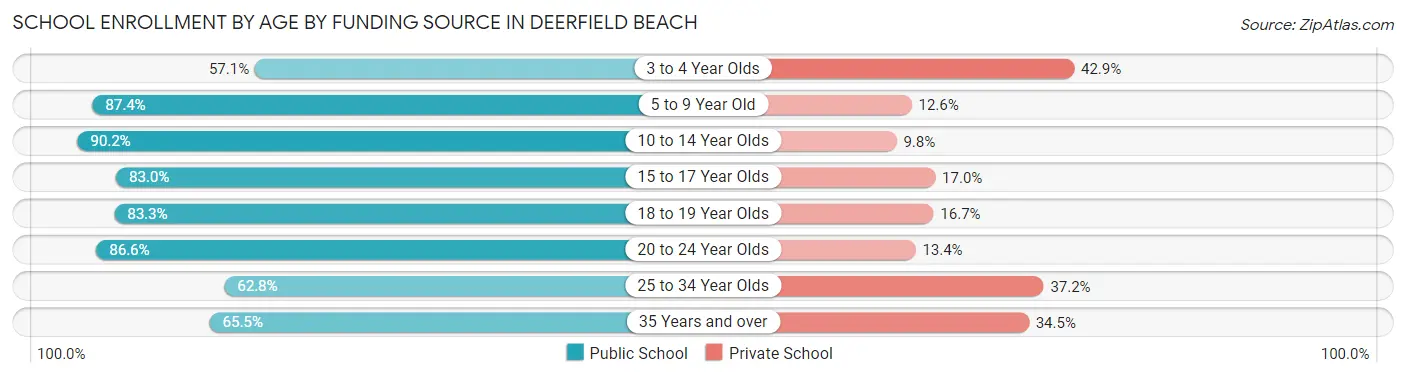
| Age Bracket | Public School | Private School |
| 3 to 4 Year Olds | 624 (57.1%) | 469 (42.9%) |
| 5 to 9 Year Old | 3,408 (87.4%) | 493 (12.6%) |
| 10 to 14 Year Olds | 3,828 (90.2%) | 418 (9.8%) |
| 15 to 17 Year Olds | 1,592 (83.0%) | 327 (17.0%) |
| 18 to 19 Year Olds | 767 (83.3%) | 154 (16.7%) |
| 20 to 24 Year Olds | 1,399 (86.6%) | 216 (13.4%) |
| 25 to 34 Year Olds | 832 (62.8%) | 493 (37.2%) |
| 35 Years and over | 808 (65.5%) | 425 (34.5%) |
| Total | 13,262 (81.6%) | 2,991 (18.4%) |
Educational Attainment by Field of Study in Deerfield Beach
Business (4,245 | 23.0%), education (2,315 | 12.6%), science & technology (1,654 | 9.0%), engineering (1,619 | 8.8%), and arts & humanities (1,386 | 7.5%) are the most common fields of study among 18,444 individuals in Deerfield Beach who have obtained a bachelor's degree or higher.
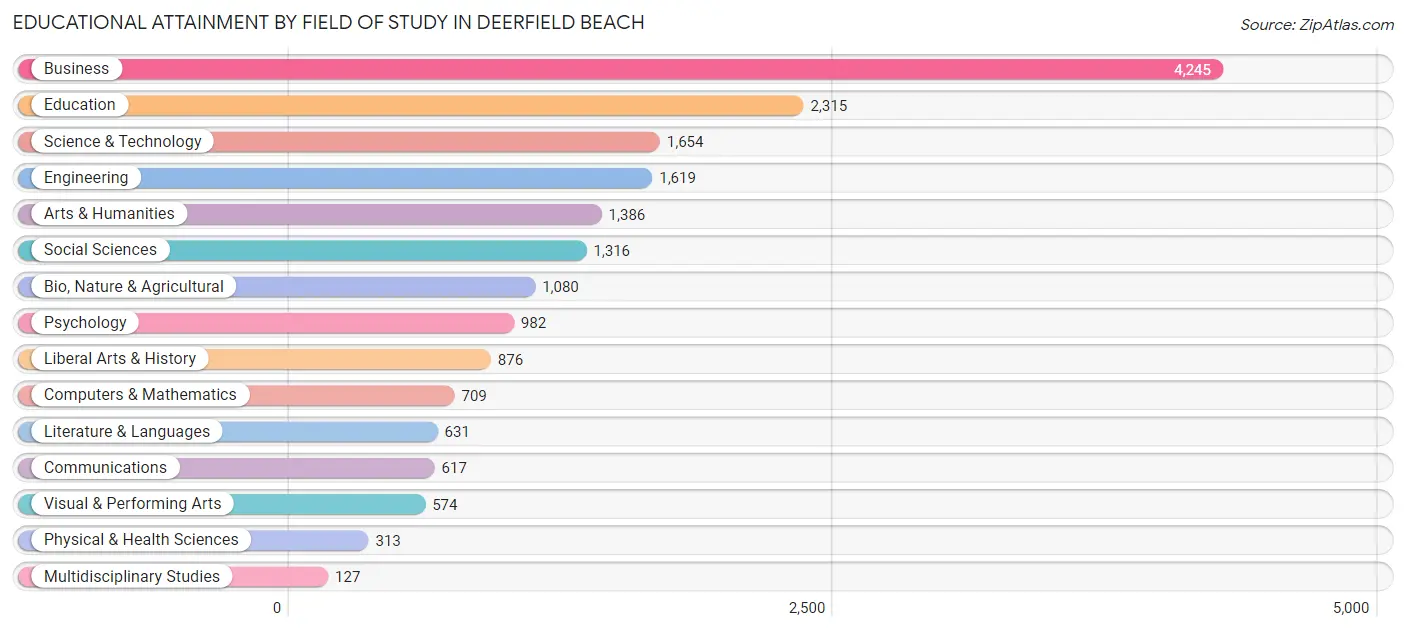
| Field of Study | # Graduates | % Graduates |
| Computers & Mathematics | 709 | 3.8% |
| Bio, Nature & Agricultural | 1,080 | 5.9% |
| Physical & Health Sciences | 313 | 1.7% |
| Psychology | 982 | 5.3% |
| Social Sciences | 1,316 | 7.1% |
| Engineering | 1,619 | 8.8% |
| Multidisciplinary Studies | 127 | 0.7% |
| Science & Technology | 1,654 | 9.0% |
| Business | 4,245 | 23.0% |
| Education | 2,315 | 12.6% |
| Literature & Languages | 631 | 3.4% |
| Liberal Arts & History | 876 | 4.8% |
| Visual & Performing Arts | 574 | 3.1% |
| Communications | 617 | 3.4% |
| Arts & Humanities | 1,386 | 7.5% |
| Total | 18,444 | 100.0% |
Transportation & Commute in Deerfield Beach
Vehicle Availability by Sex in Deerfield Beach
The most prevalent vehicle ownership categories in Deerfield Beach are males with 2 vehicles (8,907, accounting for 43.4%) and females with 2 vehicles (8,177, making up 43.0%).
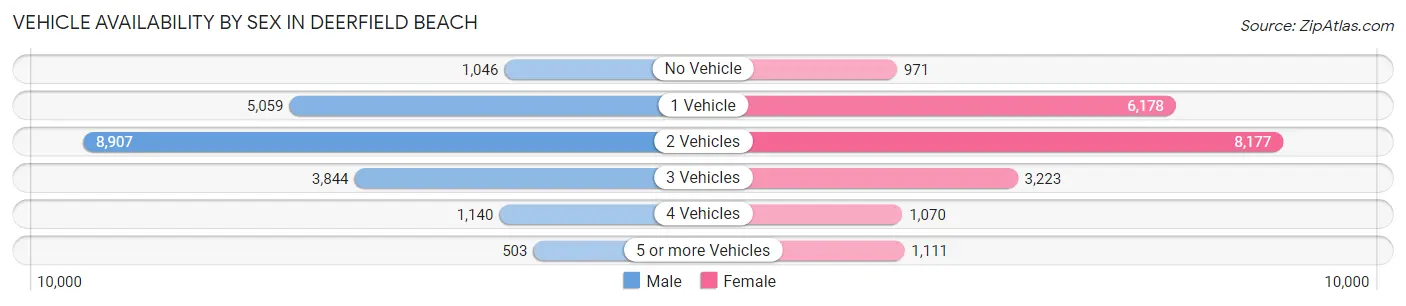
| Vehicles Available | Male | Female |
| No Vehicle | 1,046 (5.1%) | 971 (4.7%) |
| 1 Vehicle | 5,059 (24.7%) | 6,178 (29.8%) |
| 2 Vehicles | 8,907 (43.4%) | 8,177 (39.5%) |
| 3 Vehicles | 3,844 (18.8%) | 3,223 (15.5%) |
| 4 Vehicles | 1,140 (5.6%) | 1,070 (5.2%) |
| 5 or more Vehicles | 503 (2.5%) | 1,111 (5.4%) |
| Total | 20,499 (100.0%) | 20,730 (100.0%) |
Commute Time in Deerfield Beach
The most frequently occuring commute durations in Deerfield Beach are 30 to 34 minutes (7,816 commuters, 21.2%), 15 to 19 minutes (5,943 commuters, 16.1%), and 20 to 24 minutes (5,486 commuters, 14.9%).
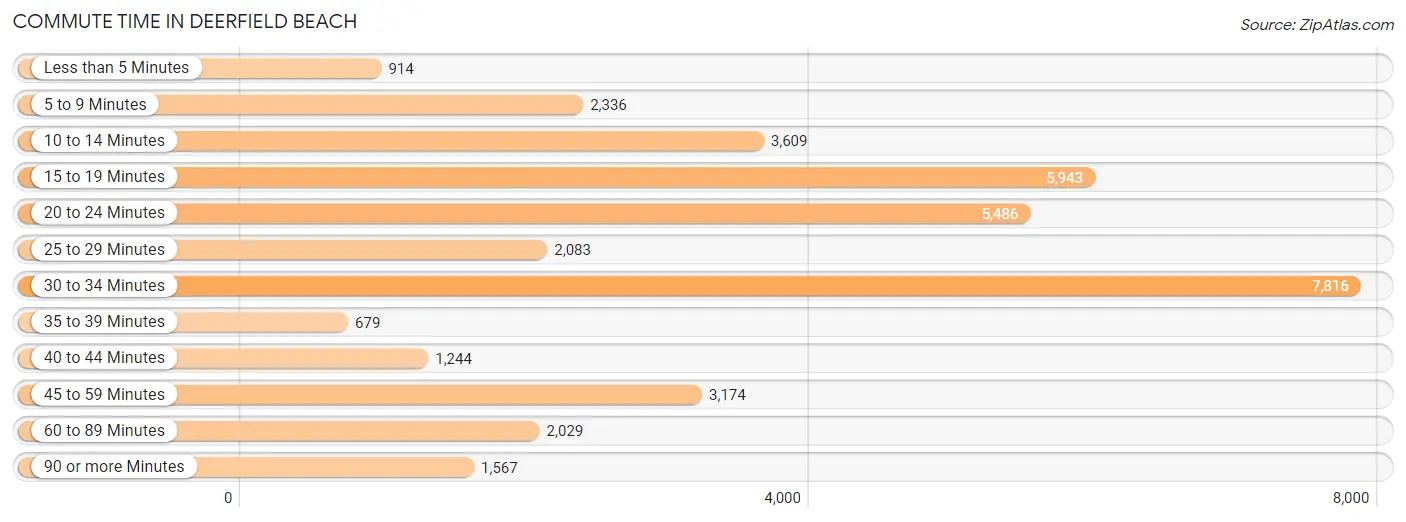
| Commute Time | # Commuters | % Commuters |
| Less than 5 Minutes | 914 | 2.5% |
| 5 to 9 Minutes | 2,336 | 6.3% |
| 10 to 14 Minutes | 3,609 | 9.8% |
| 15 to 19 Minutes | 5,943 | 16.1% |
| 20 to 24 Minutes | 5,486 | 14.9% |
| 25 to 29 Minutes | 2,083 | 5.7% |
| 30 to 34 Minutes | 7,816 | 21.2% |
| 35 to 39 Minutes | 679 | 1.8% |
| 40 to 44 Minutes | 1,244 | 3.4% |
| 45 to 59 Minutes | 3,174 | 8.6% |
| 60 to 89 Minutes | 2,029 | 5.5% |
| 90 or more Minutes | 1,567 | 4.3% |
Commute Time by Sex in Deerfield Beach
The most common commute times in Deerfield Beach are 30 to 34 minutes (4,047 commuters, 21.5%) for males and 30 to 34 minutes (3,769 commuters, 20.8%) for females.
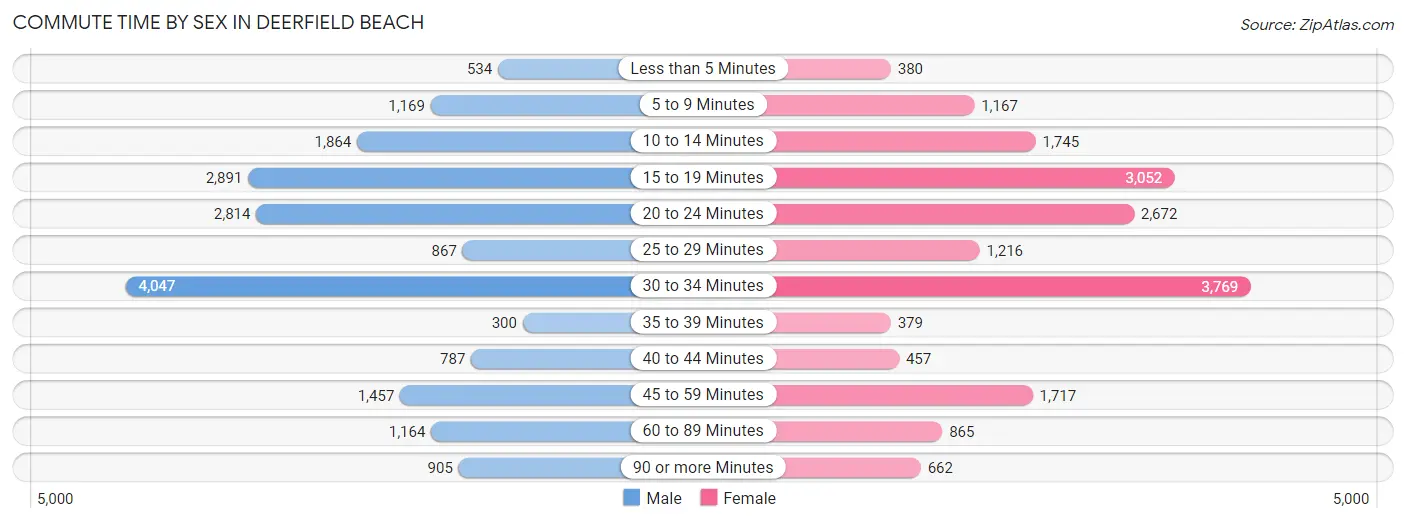
| Commute Time | Male | Female |
| Less than 5 Minutes | 534 (2.8%) | 380 (2.1%) |
| 5 to 9 Minutes | 1,169 (6.2%) | 1,167 (6.5%) |
| 10 to 14 Minutes | 1,864 (9.9%) | 1,745 (9.7%) |
| 15 to 19 Minutes | 2,891 (15.4%) | 3,052 (16.9%) |
| 20 to 24 Minutes | 2,814 (15.0%) | 2,672 (14.8%) |
| 25 to 29 Minutes | 867 (4.6%) | 1,216 (6.7%) |
| 30 to 34 Minutes | 4,047 (21.5%) | 3,769 (20.8%) |
| 35 to 39 Minutes | 300 (1.6%) | 379 (2.1%) |
| 40 to 44 Minutes | 787 (4.2%) | 457 (2.5%) |
| 45 to 59 Minutes | 1,457 (7.7%) | 1,717 (9.5%) |
| 60 to 89 Minutes | 1,164 (6.2%) | 865 (4.8%) |
| 90 or more Minutes | 905 (4.8%) | 662 (3.7%) |
Time of Departure to Work by Sex in Deerfield Beach
The most frequent times of departure to work in Deerfield Beach are 8:00 AM to 8:29 AM (3,477, 18.5%) for males and 7:00 AM to 7:29 AM (3,168, 17.5%) for females.
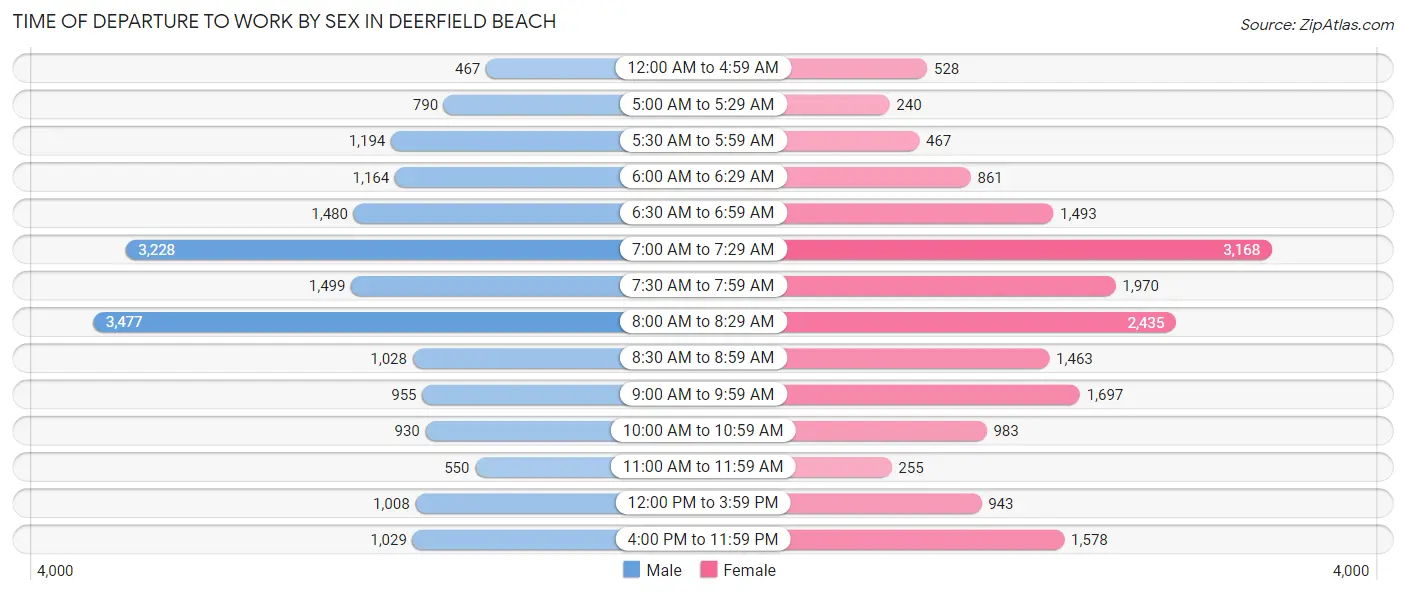
| Time of Departure | Male | Female |
| 12:00 AM to 4:59 AM | 467 (2.5%) | 528 (2.9%) |
| 5:00 AM to 5:29 AM | 790 (4.2%) | 240 (1.3%) |
| 5:30 AM to 5:59 AM | 1,194 (6.4%) | 467 (2.6%) |
| 6:00 AM to 6:29 AM | 1,164 (6.2%) | 861 (4.8%) |
| 6:30 AM to 6:59 AM | 1,480 (7.9%) | 1,493 (8.3%) |
| 7:00 AM to 7:29 AM | 3,228 (17.2%) | 3,168 (17.5%) |
| 7:30 AM to 7:59 AM | 1,499 (8.0%) | 1,970 (10.9%) |
| 8:00 AM to 8:29 AM | 3,477 (18.5%) | 2,435 (13.5%) |
| 8:30 AM to 8:59 AM | 1,028 (5.5%) | 1,463 (8.1%) |
| 9:00 AM to 9:59 AM | 955 (5.1%) | 1,697 (9.4%) |
| 10:00 AM to 10:59 AM | 930 (5.0%) | 983 (5.4%) |
| 11:00 AM to 11:59 AM | 550 (2.9%) | 255 (1.4%) |
| 12:00 PM to 3:59 PM | 1,008 (5.4%) | 943 (5.2%) |
| 4:00 PM to 11:59 PM | 1,029 (5.5%) | 1,578 (8.7%) |
| Total | 18,799 (100.0%) | 18,081 (100.0%) |
Housing Occupancy in Deerfield Beach
Occupancy by Ownership in Deerfield Beach
Of the total 36,219 dwellings in Deerfield Beach, owner-occupied units account for 22,123 (61.1%), while renter-occupied units make up 14,096 (38.9%).
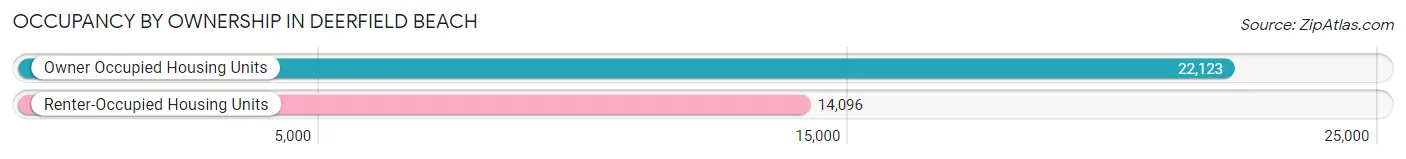
| Occupancy | # Housing Units | % Housing Units |
| Owner Occupied Housing Units | 22,123 | 61.1% |
| Renter-Occupied Housing Units | 14,096 | 38.9% |
| Total Occupied Housing Units | 36,219 | 100.0% |
Occupancy by Household Size in Deerfield Beach
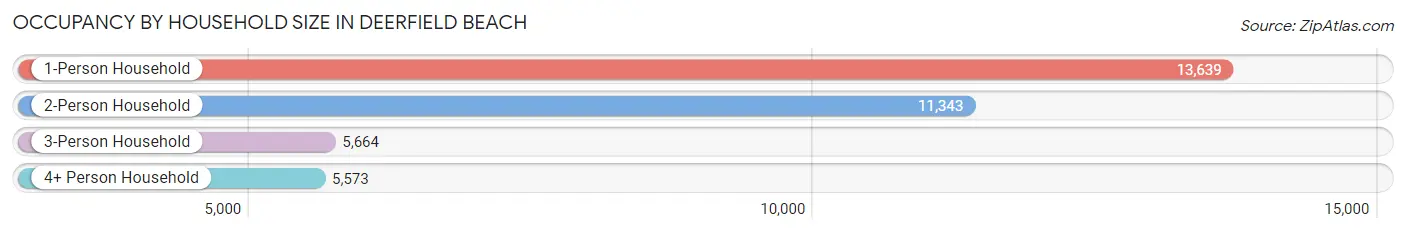
| Household Size | # Housing Units | % Housing Units |
| 1-Person Household | 13,639 | 37.7% |
| 2-Person Household | 11,343 | 31.3% |
| 3-Person Household | 5,664 | 15.6% |
| 4+ Person Household | 5,573 | 15.4% |
| Total Housing Units | 36,219 | 100.0% |
Occupancy by Ownership by Household Size in Deerfield Beach
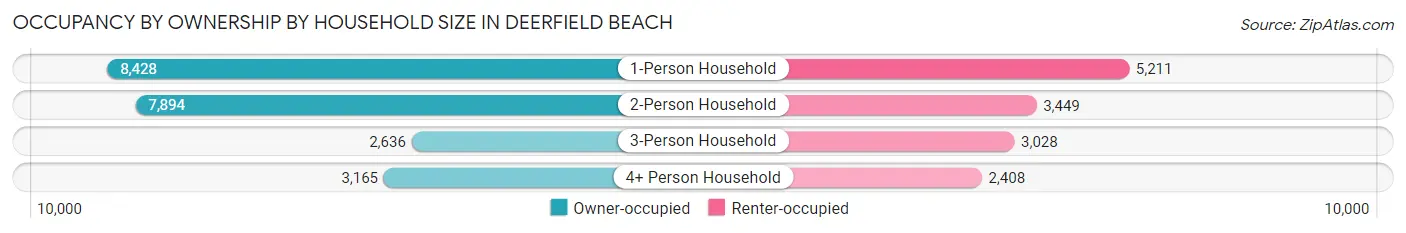
| Household Size | Owner-occupied | Renter-occupied |
| 1-Person Household | 8,428 (61.8%) | 5,211 (38.2%) |
| 2-Person Household | 7,894 (69.6%) | 3,449 (30.4%) |
| 3-Person Household | 2,636 (46.5%) | 3,028 (53.5%) |
| 4+ Person Household | 3,165 (56.8%) | 2,408 (43.2%) |
| Total Housing Units | 22,123 (61.1%) | 14,096 (38.9%) |
Occupancy by Educational Attainment in Deerfield Beach
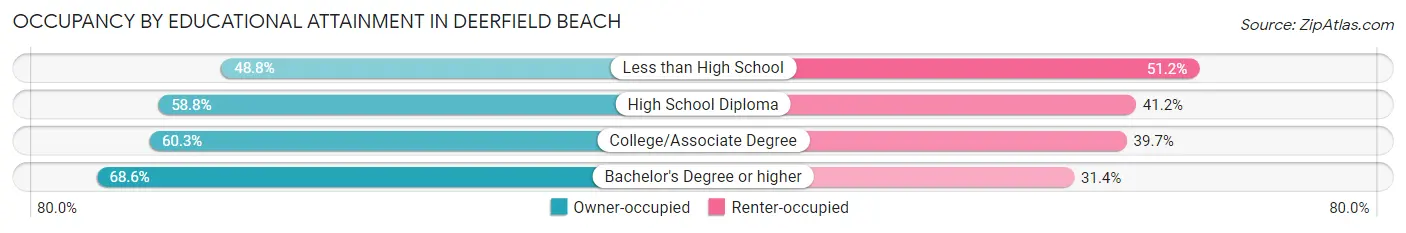
| Household Size | Owner-occupied | Renter-occupied |
| Less than High School | 2,012 (48.8%) | 2,111 (51.2%) |
| High School Diploma | 5,568 (58.8%) | 3,902 (41.2%) |
| College/Associate Degree | 7,082 (60.3%) | 4,668 (39.7%) |
| Bachelor's Degree or higher | 7,461 (68.6%) | 3,415 (31.4%) |
Occupancy by Age of Householder in Deerfield Beach
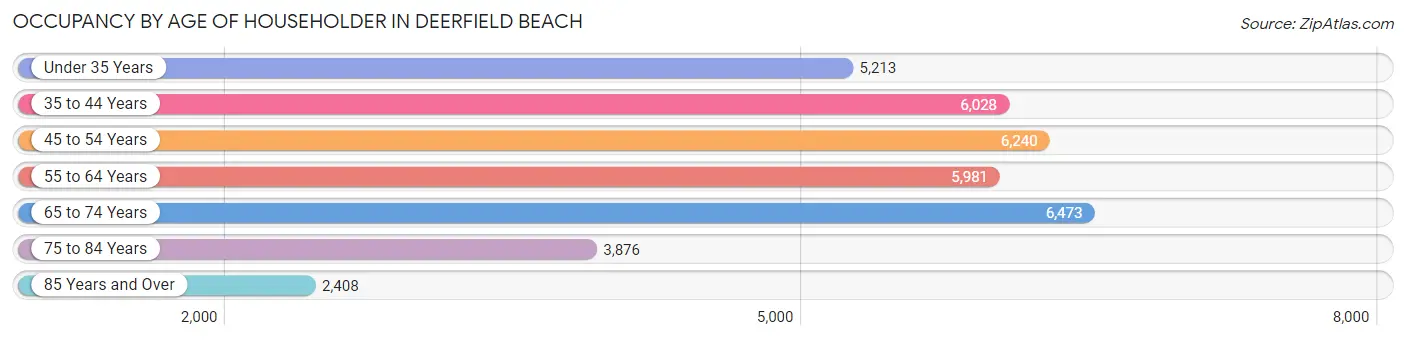
| Age Bracket | # Households | % Households |
| Under 35 Years | 5,213 | 14.4% |
| 35 to 44 Years | 6,028 | 16.6% |
| 45 to 54 Years | 6,240 | 17.2% |
| 55 to 64 Years | 5,981 | 16.5% |
| 65 to 74 Years | 6,473 | 17.9% |
| 75 to 84 Years | 3,876 | 10.7% |
| 85 Years and Over | 2,408 | 6.7% |
| Total | 36,219 | 100.0% |
Housing Finances in Deerfield Beach
Median Income by Occupancy in Deerfield Beach
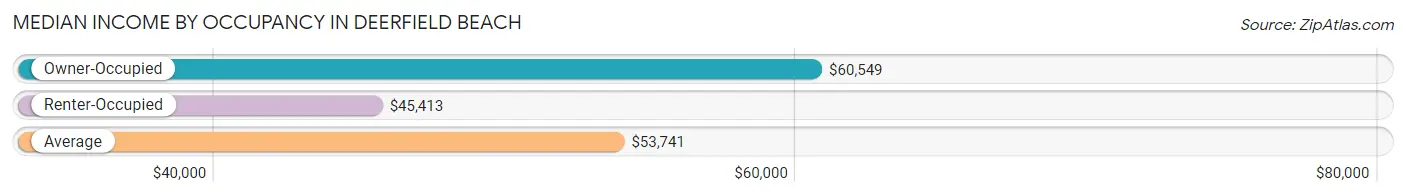
| Occupancy Type | # Households | Median Income |
| Owner-Occupied | 22,123 (61.1%) | $60,549 |
| Renter-Occupied | 14,096 (38.9%) | $45,413 |
| Average | 36,219 (100.0%) | $53,741 |
Occupancy by Householder Income Bracket in Deerfield Beach
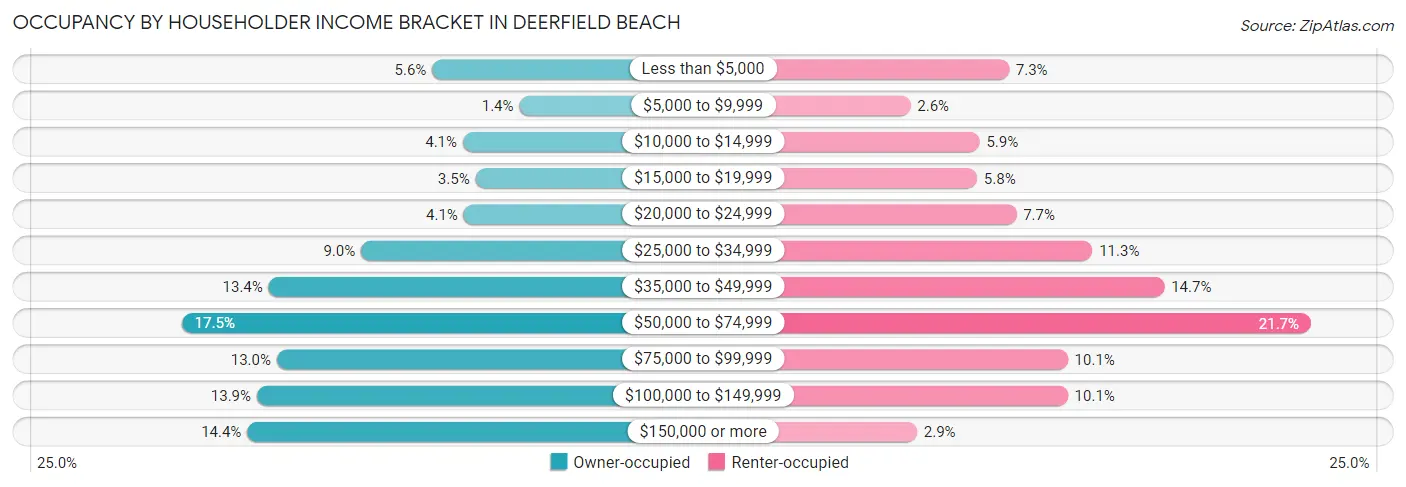
| Income Bracket | Owner-occupied | Renter-occupied |
| Less than $5,000 | 1,237 (5.6%) | 1,029 (7.3%) |
| $5,000 to $9,999 | 318 (1.4%) | 368 (2.6%) |
| $10,000 to $14,999 | 914 (4.1%) | 831 (5.9%) |
| $15,000 to $19,999 | 782 (3.5%) | 815 (5.8%) |
| $20,000 to $24,999 | 905 (4.1%) | 1,078 (7.6%) |
| $25,000 to $34,999 | 1,986 (9.0%) | 1,588 (11.3%) |
| $35,000 to $49,999 | 2,961 (13.4%) | 2,072 (14.7%) |
| $50,000 to $74,999 | 3,876 (17.5%) | 3,056 (21.7%) |
| $75,000 to $99,999 | 2,874 (13.0%) | 1,423 (10.1%) |
| $100,000 to $149,999 | 3,084 (13.9%) | 1,424 (10.1%) |
| $150,000 or more | 3,186 (14.4%) | 412 (2.9%) |
| Total | 22,123 (100.0%) | 14,096 (100.0%) |
Monthly Housing Cost Tiers in Deerfield Beach
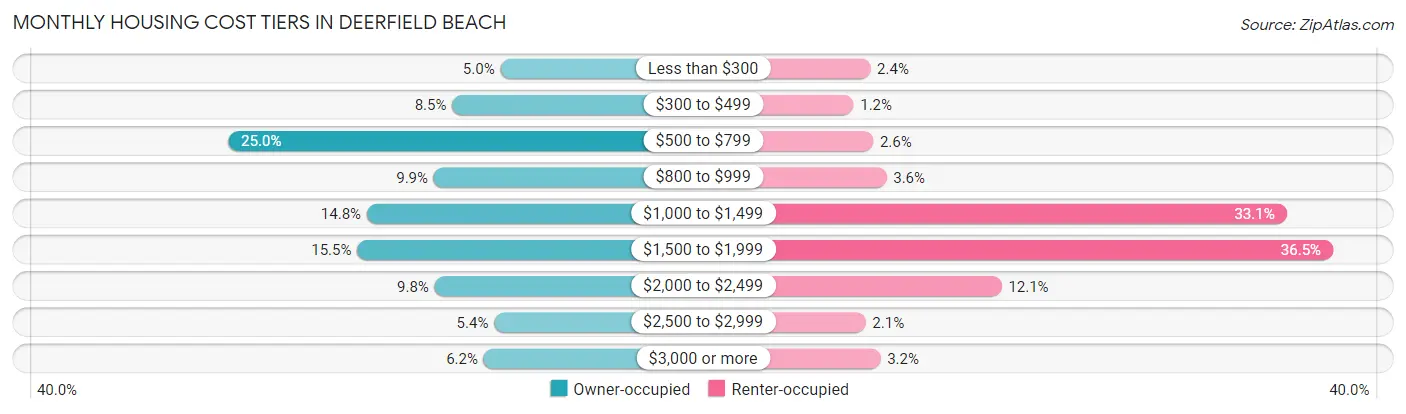
| Monthly Cost | Owner-occupied | Renter-occupied |
| Less than $300 | 1,095 (5.0%) | 340 (2.4%) |
| $300 to $499 | 1,880 (8.5%) | 165 (1.2%) |
| $500 to $799 | 5,534 (25.0%) | 370 (2.6%) |
| $800 to $999 | 2,182 (9.9%) | 508 (3.6%) |
| $1,000 to $1,499 | 3,272 (14.8%) | 4,662 (33.1%) |
| $1,500 to $1,999 | 3,428 (15.5%) | 5,143 (36.5%) |
| $2,000 to $2,499 | 2,168 (9.8%) | 1,703 (12.1%) |
| $2,500 to $2,999 | 1,197 (5.4%) | 291 (2.1%) |
| $3,000 or more | 1,367 (6.2%) | 444 (3.2%) |
| Total | 22,123 (100.0%) | 14,096 (100.0%) |
Physical Housing Characteristics in Deerfield Beach
Housing Structures in Deerfield Beach
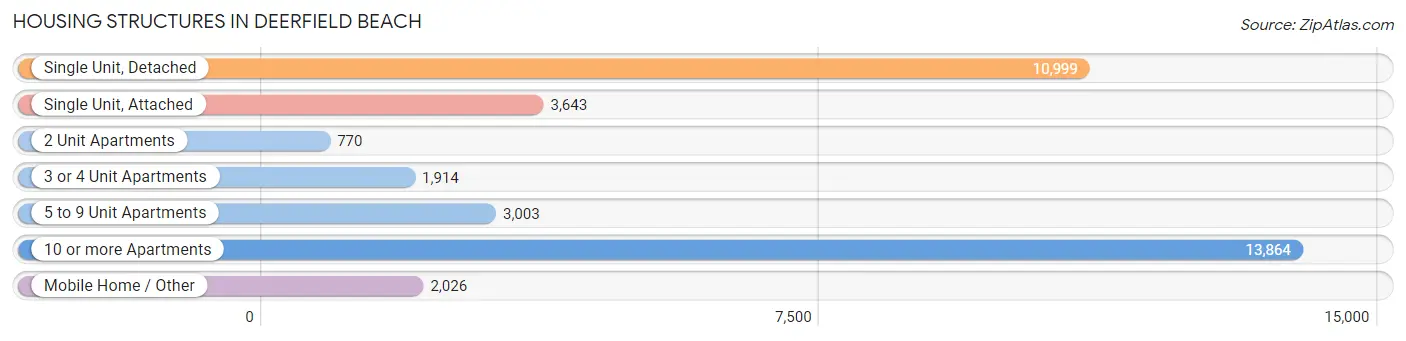
| Structure Type | # Housing Units | % Housing Units |
| Single Unit, Detached | 10,999 | 30.4% |
| Single Unit, Attached | 3,643 | 10.1% |
| 2 Unit Apartments | 770 | 2.1% |
| 3 or 4 Unit Apartments | 1,914 | 5.3% |
| 5 to 9 Unit Apartments | 3,003 | 8.3% |
| 10 or more Apartments | 13,864 | 38.3% |
| Mobile Home / Other | 2,026 | 5.6% |
| Total | 36,219 | 100.0% |
Housing Structures by Occupancy in Deerfield Beach
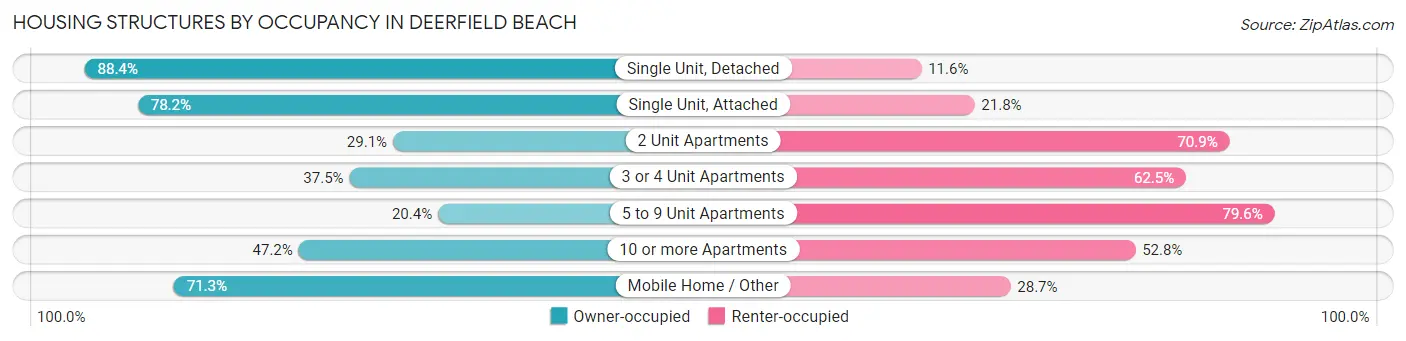
| Structure Type | Owner-occupied | Renter-occupied |
| Single Unit, Detached | 9,727 (88.4%) | 1,272 (11.6%) |
| Single Unit, Attached | 2,849 (78.2%) | 794 (21.8%) |
| 2 Unit Apartments | 224 (29.1%) | 546 (70.9%) |
| 3 or 4 Unit Apartments | 717 (37.5%) | 1,197 (62.5%) |
| 5 to 9 Unit Apartments | 613 (20.4%) | 2,390 (79.6%) |
| 10 or more Apartments | 6,549 (47.2%) | 7,315 (52.8%) |
| Mobile Home / Other | 1,444 (71.3%) | 582 (28.7%) |
| Total | 22,123 (61.1%) | 14,096 (38.9%) |
Housing Structures by Number of Rooms in Deerfield Beach
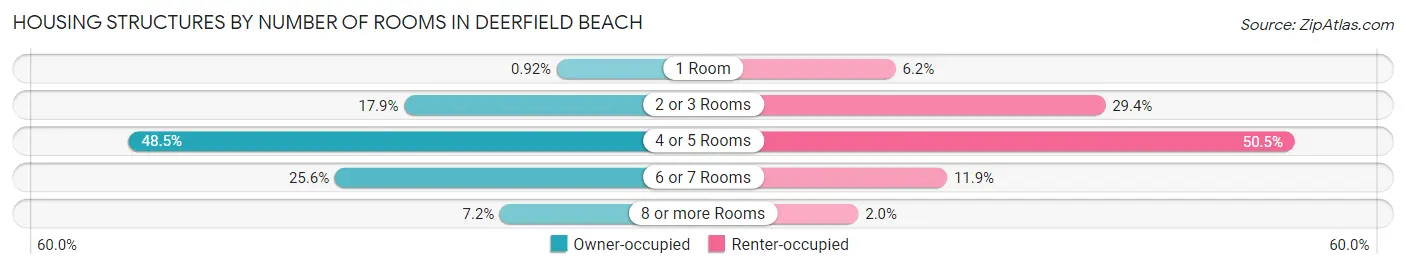
| Number of Rooms | Owner-occupied | Renter-occupied |
| 1 Room | 204 (0.9%) | 870 (6.2%) |
| 2 or 3 Rooms | 3,951 (17.9%) | 4,150 (29.4%) |
| 4 or 5 Rooms | 10,718 (48.4%) | 7,115 (50.5%) |
| 6 or 7 Rooms | 5,653 (25.6%) | 1,674 (11.9%) |
| 8 or more Rooms | 1,597 (7.2%) | 287 (2.0%) |
| Total | 22,123 (100.0%) | 14,096 (100.0%) |
Housing Structure by Heating Type in Deerfield Beach
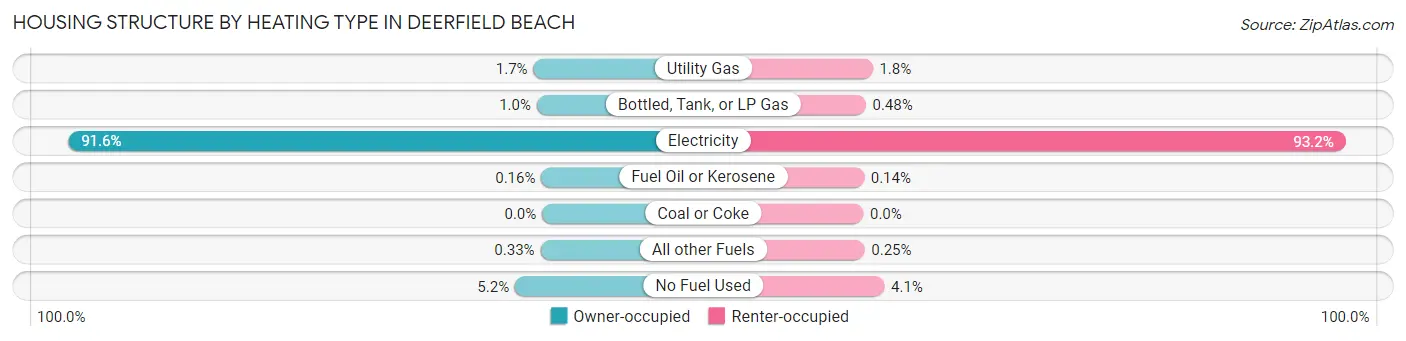
| Heating Type | Owner-occupied | Renter-occupied |
| Utility Gas | 371 (1.7%) | 257 (1.8%) |
| Bottled, Tank, or LP Gas | 226 (1.0%) | 68 (0.5%) |
| Electricity | 20,258 (91.6%) | 13,142 (93.2%) |
| Fuel Oil or Kerosene | 36 (0.2%) | 20 (0.1%) |
| Coal or Coke | 0 (0.0%) | 0 (0.0%) |
| All other Fuels | 73 (0.3%) | 35 (0.3%) |
| No Fuel Used | 1,159 (5.2%) | 574 (4.1%) |
| Total | 22,123 (100.0%) | 14,096 (100.0%) |
Household Vehicle Usage in Deerfield Beach
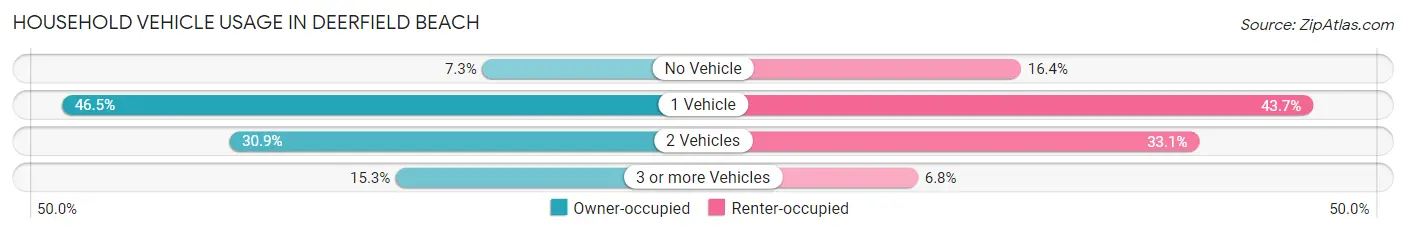
| Vehicles per Household | Owner-occupied | Renter-occupied |
| No Vehicle | 1,604 (7.2%) | 2,315 (16.4%) |
| 1 Vehicle | 10,294 (46.5%) | 6,161 (43.7%) |
| 2 Vehicles | 6,836 (30.9%) | 4,662 (33.1%) |
| 3 or more Vehicles | 3,389 (15.3%) | 958 (6.8%) |
| Total | 22,123 (100.0%) | 14,096 (100.0%) |
Real Estate & Mortgages in Deerfield Beach
Real Estate and Mortgage Overview in Deerfield Beach
| Characteristic | Without Mortgage | With Mortgage |
| Housing Units | 11,506 | 10,617 |
| Median Property Value | $154,800 | $296,900 |
| Median Household Income | $43,050 | $2,233 |
| Monthly Housing Costs | $642 | $1,319 |
| Real Estate Taxes | $1,513 | $637 |
Property Value by Mortgage Status in Deerfield Beach
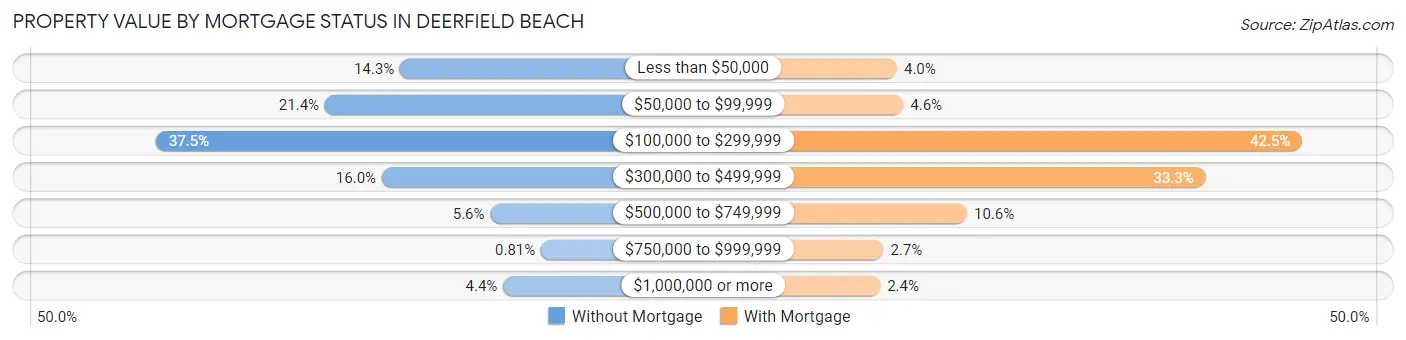
| Property Value | Without Mortgage | With Mortgage |
| Less than $50,000 | 1,640 (14.2%) | 419 (4.0%) |
| $50,000 to $99,999 | 2,462 (21.4%) | 483 (4.5%) |
| $100,000 to $299,999 | 4,315 (37.5%) | 4,517 (42.5%) |
| $300,000 to $499,999 | 1,838 (16.0%) | 3,539 (33.3%) |
| $500,000 to $749,999 | 649 (5.6%) | 1,128 (10.6%) |
| $750,000 to $999,999 | 93 (0.8%) | 282 (2.7%) |
| $1,000,000 or more | 509 (4.4%) | 249 (2.4%) |
| Total | 11,506 (100.0%) | 10,617 (100.0%) |
Household Income by Mortgage Status in Deerfield Beach
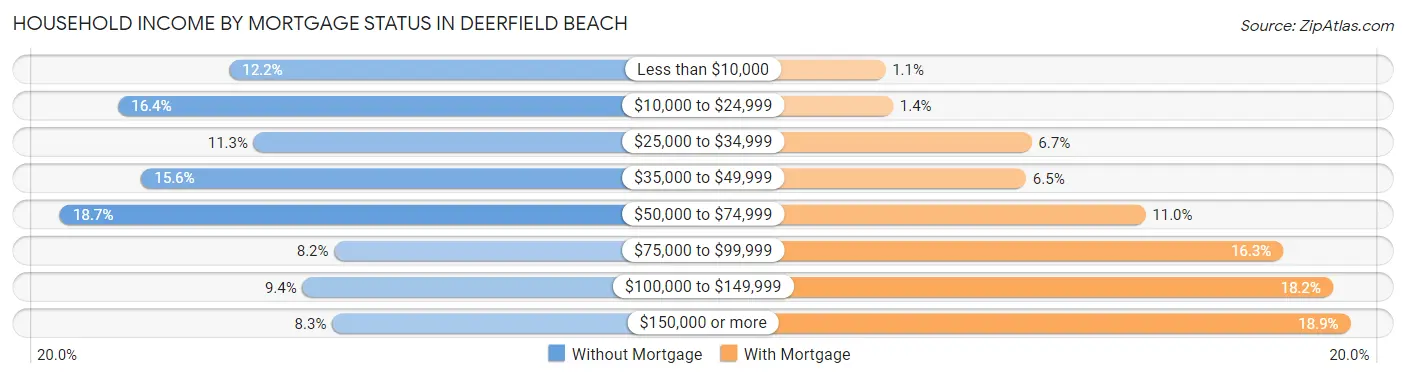
| Household Income | Without Mortgage | With Mortgage |
| Less than $10,000 | 1,404 (12.2%) | 120 (1.1%) |
| $10,000 to $24,999 | 1,890 (16.4%) | 151 (1.4%) |
| $25,000 to $34,999 | 1,297 (11.3%) | 711 (6.7%) |
| $35,000 to $49,999 | 1,789 (15.5%) | 689 (6.5%) |
| $50,000 to $74,999 | 2,146 (18.6%) | 1,172 (11.0%) |
| $75,000 to $99,999 | 944 (8.2%) | 1,730 (16.3%) |
| $100,000 to $149,999 | 1,083 (9.4%) | 1,930 (18.2%) |
| $150,000 or more | 953 (8.3%) | 2,001 (18.9%) |
| Total | 11,506 (100.0%) | 10,617 (100.0%) |
Property Value to Household Income Ratio in Deerfield Beach
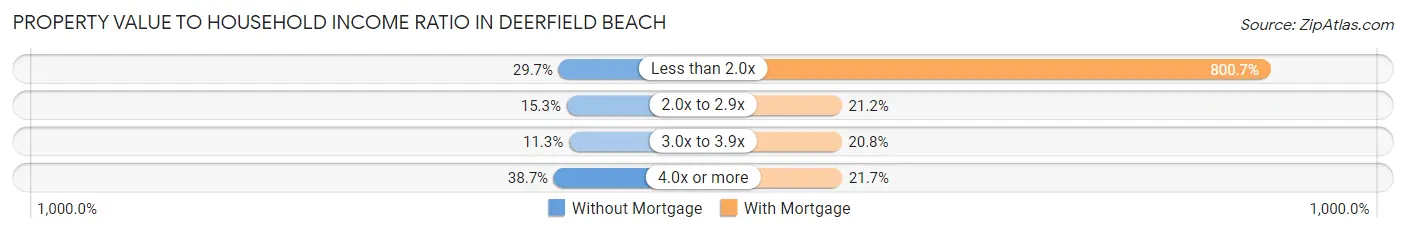
| Value-to-Income Ratio | Without Mortgage | With Mortgage |
| Less than 2.0x | 3,417 (29.7%) | 85,014 (800.7%) |
| 2.0x to 2.9x | 1,765 (15.3%) | 2,250 (21.2%) |
| 3.0x to 3.9x | 1,295 (11.3%) | 2,207 (20.8%) |
| 4.0x or more | 4,453 (38.7%) | 2,306 (21.7%) |
| Total | 11,506 (100.0%) | 10,617 (100.0%) |
Real Estate Taxes by Mortgage Status in Deerfield Beach
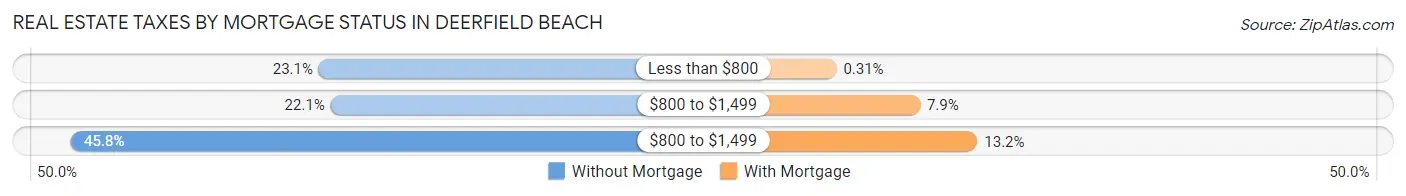
| Property Taxes | Without Mortgage | With Mortgage |
| Less than $800 | 2,661 (23.1%) | 33 (0.3%) |
| $800 to $1,499 | 2,537 (22.1%) | 843 (7.9%) |
| $800 to $1,499 | 5,265 (45.8%) | 1,399 (13.2%) |
| Total | 11,506 (100.0%) | 10,617 (100.0%) |
Health & Disability in Deerfield Beach
Health Insurance Coverage by Age in Deerfield Beach
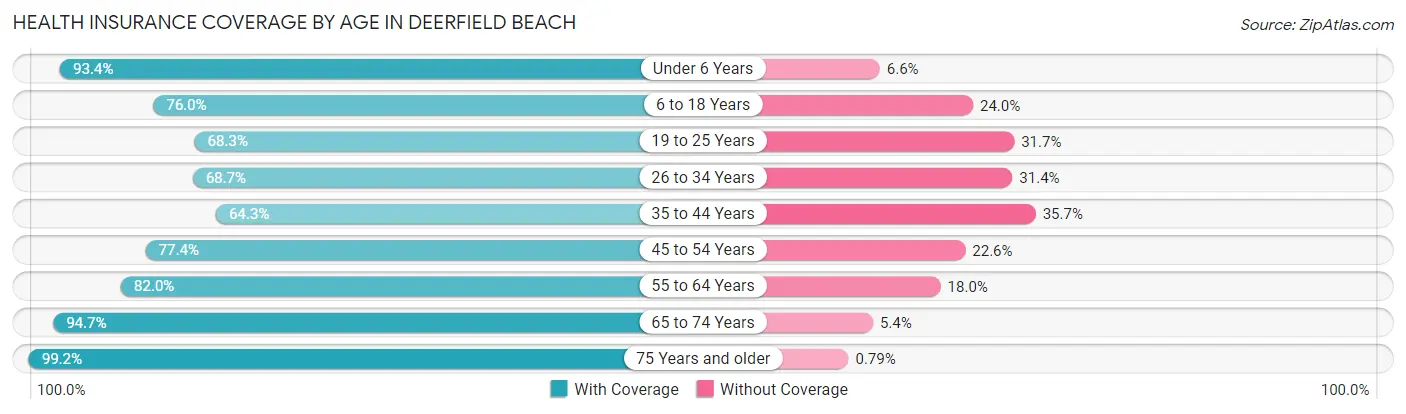
| Age Bracket | With Coverage | Without Coverage |
| Under 6 Years | 5,039 (93.4%) | 358 (6.6%) |
| 6 to 18 Years | 7,787 (76.0%) | 2,461 (24.0%) |
| 19 to 25 Years | 4,463 (68.3%) | 2,070 (31.7%) |
| 26 to 34 Years | 7,225 (68.6%) | 3,300 (31.4%) |
| 35 to 44 Years | 7,329 (64.3%) | 4,070 (35.7%) |
| 45 to 54 Years | 8,290 (77.4%) | 2,418 (22.6%) |
| 55 to 64 Years | 8,823 (82.0%) | 1,933 (18.0%) |
| 65 to 74 Years | 9,432 (94.7%) | 533 (5.3%) |
| 75 Years and older | 9,490 (99.2%) | 76 (0.8%) |
| Total | 67,878 (79.8%) | 17,219 (20.2%) |
Health Insurance Coverage by Citizenship Status in Deerfield Beach
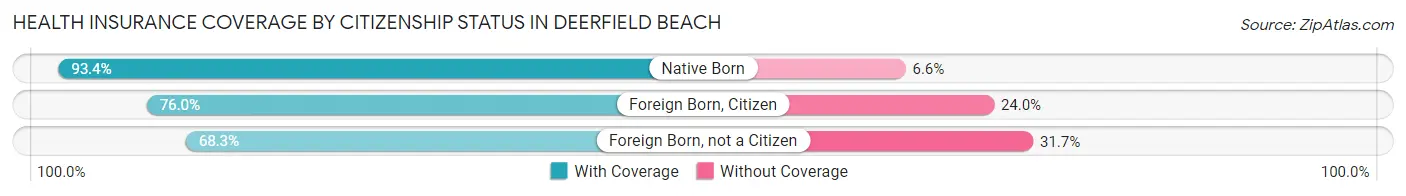
| Citizenship Status | With Coverage | Without Coverage |
| Native Born | 5,039 (93.4%) | 358 (6.6%) |
| Foreign Born, Citizen | 7,787 (76.0%) | 2,461 (24.0%) |
| Foreign Born, not a Citizen | 4,463 (68.3%) | 2,070 (31.7%) |
Health Insurance Coverage by Household Income in Deerfield Beach
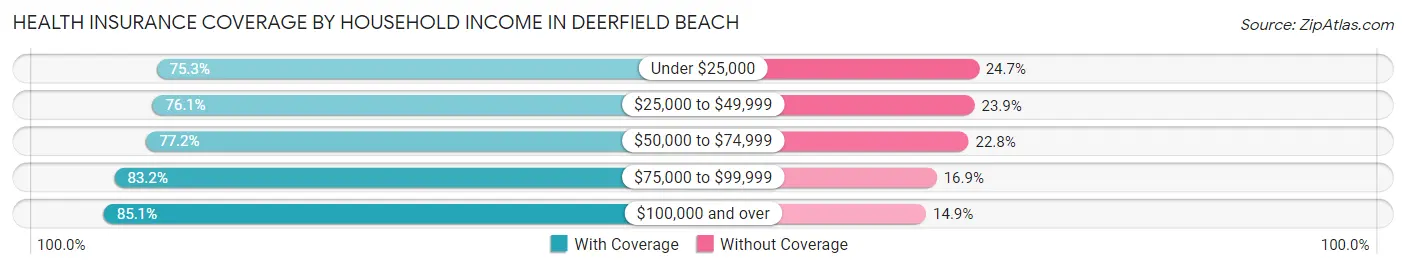
| Household Income | With Coverage | Without Coverage |
| Under $25,000 | 9,540 (75.3%) | 3,133 (24.7%) |
| $25,000 to $49,999 | 14,307 (76.1%) | 4,502 (23.9%) |
| $50,000 to $74,999 | 13,543 (77.2%) | 4,003 (22.8%) |
| $75,000 to $99,999 | 9,161 (83.2%) | 1,856 (16.9%) |
| $100,000 and over | 21,084 (85.1%) | 3,679 (14.9%) |
Public vs Private Health Insurance Coverage by Age in Deerfield Beach
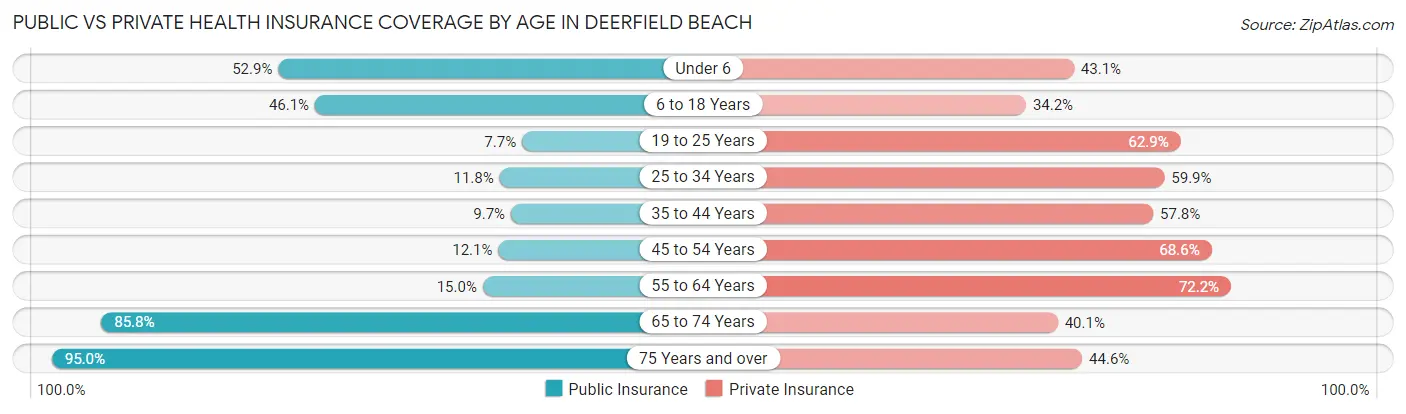
| Age Bracket | Public Insurance | Private Insurance |
| Under 6 | 2,856 (52.9%) | 2,325 (43.1%) |
| 6 to 18 Years | 4,725 (46.1%) | 3,503 (34.2%) |
| 19 to 25 Years | 502 (7.7%) | 4,107 (62.9%) |
| 25 to 34 Years | 1,246 (11.8%) | 6,301 (59.9%) |
| 35 to 44 Years | 1,109 (9.7%) | 6,586 (57.8%) |
| 45 to 54 Years | 1,294 (12.1%) | 7,347 (68.6%) |
| 55 to 64 Years | 1,609 (15.0%) | 7,769 (72.2%) |
| 65 to 74 Years | 8,545 (85.8%) | 3,994 (40.1%) |
| 75 Years and over | 9,083 (95.0%) | 4,268 (44.6%) |
| Total | 30,969 (36.4%) | 46,200 (54.3%) |
Disability Status by Sex by Age in Deerfield Beach
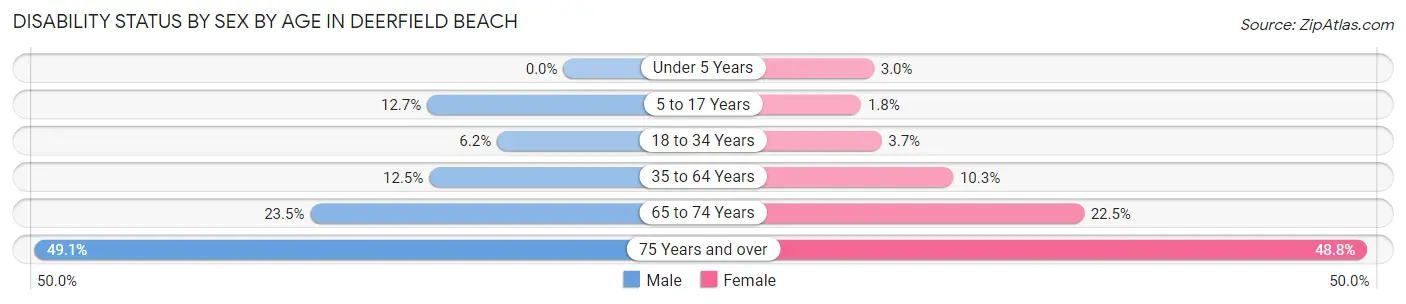
| Age Bracket | Male | Female |
| Under 5 Years | 0 (0.0%) | 66 (3.0%) |
| 5 to 17 Years | 723 (12.7%) | 83 (1.8%) |
| 18 to 34 Years | 480 (6.2%) | 361 (3.7%) |
| 35 to 64 Years | 1,969 (12.5%) | 1,761 (10.3%) |
| 65 to 74 Years | 1,080 (23.5%) | 1,205 (22.5%) |
| 75 Years and over | 1,576 (49.1%) | 3,100 (48.8%) |
Disability Class by Sex by Age in Deerfield Beach
Disability Class: Hearing Difficulty
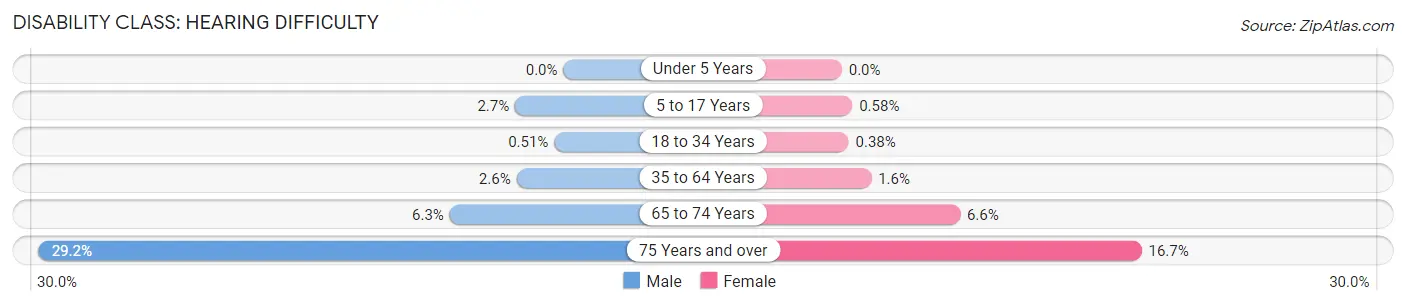
| Age Bracket | Male | Female |
| Under 5 Years | 0 (0.0%) | 0 (0.0%) |
| 5 to 17 Years | 154 (2.7%) | 27 (0.6%) |
| 18 to 34 Years | 40 (0.5%) | 37 (0.4%) |
| 35 to 64 Years | 413 (2.6%) | 280 (1.6%) |
| 65 to 74 Years | 291 (6.3%) | 353 (6.6%) |
| 75 Years and over | 937 (29.2%) | 1,061 (16.7%) |
Disability Class: Vision Difficulty
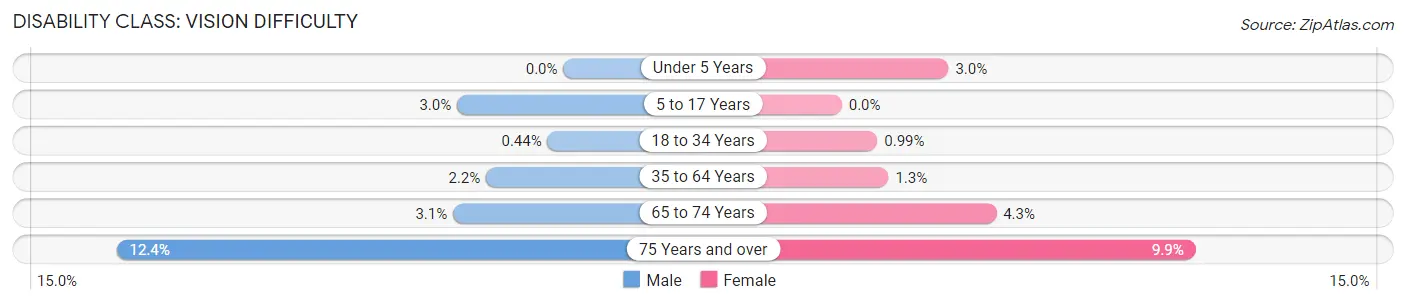
| Age Bracket | Male | Female |
| Under 5 Years | 0 (0.0%) | 66 (3.0%) |
| 5 to 17 Years | 169 (3.0%) | 0 (0.0%) |
| 18 to 34 Years | 34 (0.4%) | 97 (1.0%) |
| 35 to 64 Years | 340 (2.1%) | 222 (1.3%) |
| 65 to 74 Years | 141 (3.1%) | 231 (4.3%) |
| 75 Years and over | 399 (12.4%) | 626 (9.9%) |
Disability Class: Cognitive Difficulty
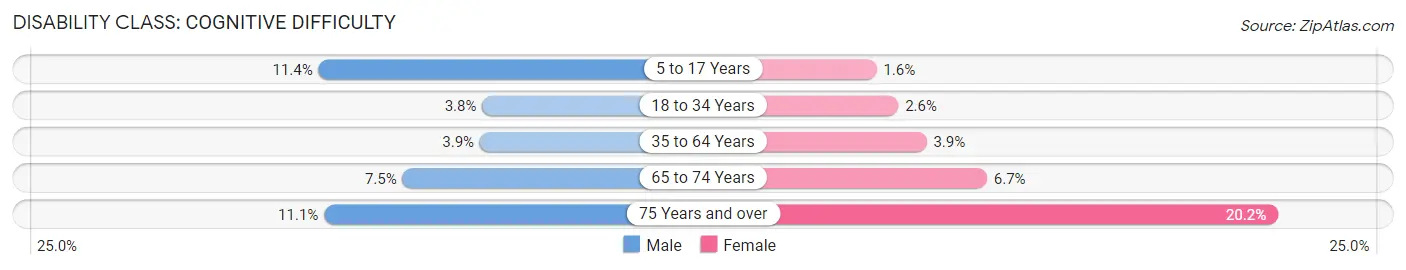
| Age Bracket | Male | Female |
| 5 to 17 Years | 649 (11.4%) | 75 (1.6%) |
| 18 to 34 Years | 293 (3.8%) | 258 (2.6%) |
| 35 to 64 Years | 611 (3.9%) | 670 (3.9%) |
| 65 to 74 Years | 343 (7.5%) | 361 (6.7%) |
| 75 Years and over | 356 (11.1%) | 1,287 (20.2%) |
Disability Class: Ambulatory Difficulty
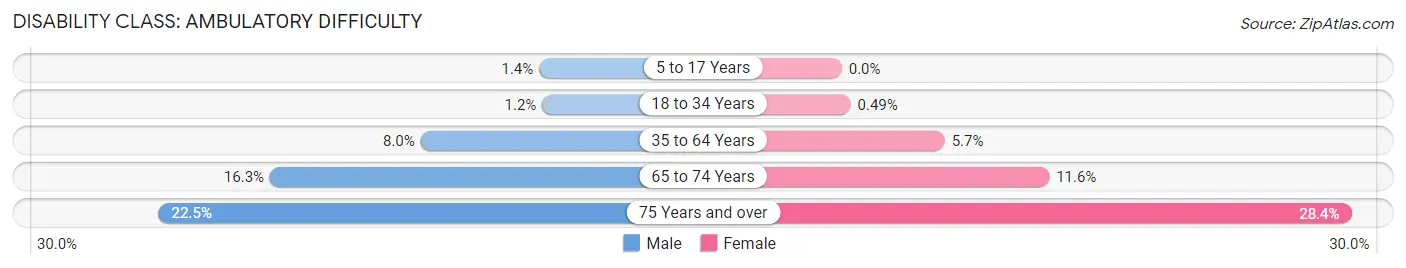
| Age Bracket | Male | Female |
| 5 to 17 Years | 77 (1.3%) | 0 (0.0%) |
| 18 to 34 Years | 92 (1.2%) | 48 (0.5%) |
| 35 to 64 Years | 1,256 (8.0%) | 977 (5.7%) |
| 65 to 74 Years | 751 (16.3%) | 620 (11.6%) |
| 75 Years and over | 723 (22.5%) | 1,804 (28.4%) |
Disability Class: Self-Care Difficulty
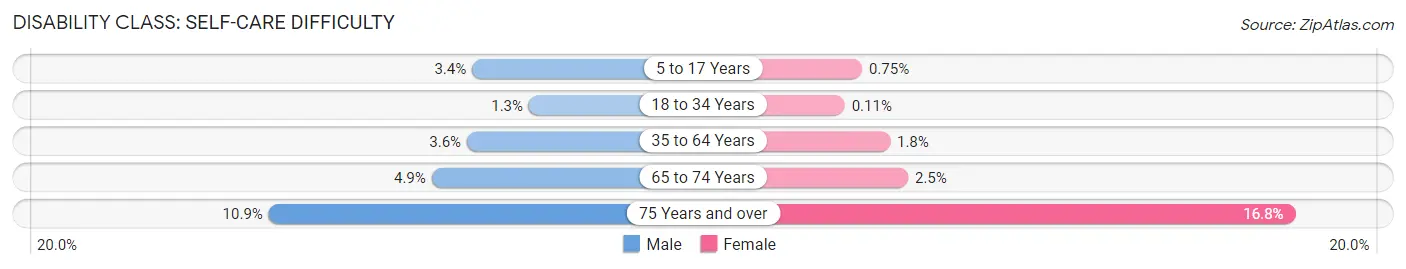
| Age Bracket | Male | Female |
| 5 to 17 Years | 194 (3.4%) | 35 (0.7%) |
| 18 to 34 Years | 100 (1.3%) | 11 (0.1%) |
| 35 to 64 Years | 566 (3.6%) | 305 (1.8%) |
| 65 to 74 Years | 225 (4.9%) | 132 (2.5%) |
| 75 Years and over | 351 (10.9%) | 1,071 (16.8%) |
Technology Access in Deerfield Beach
Computing Device Access in Deerfield Beach
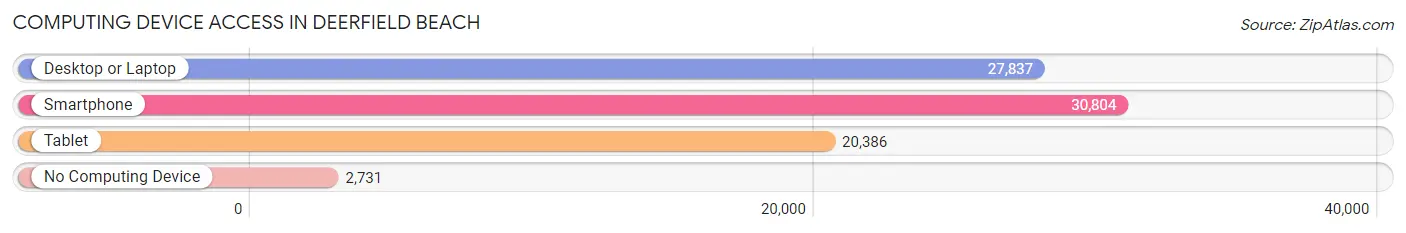
| Device Type | # Households | % Households |
| Desktop or Laptop | 27,837 | 76.9% |
| Smartphone | 30,804 | 85.1% |
| Tablet | 20,386 | 56.3% |
| No Computing Device | 2,731 | 7.5% |
| Total | 36,219 | 100.0% |
Internet Access in Deerfield Beach
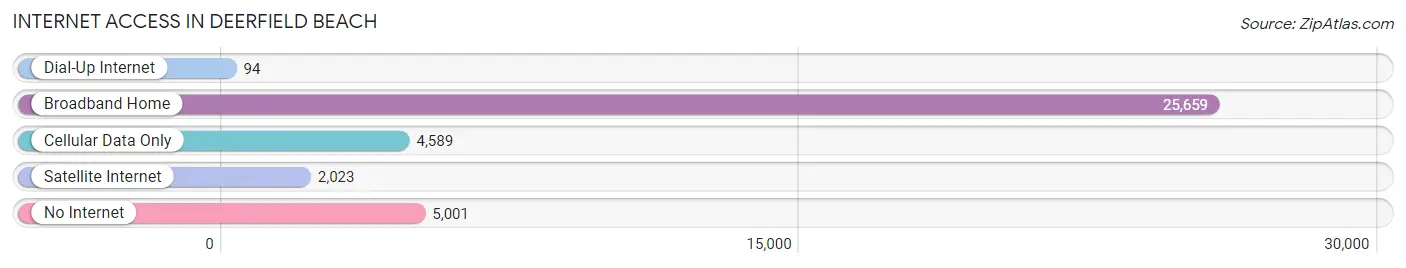
| Internet Type | # Households | % Households |
| Dial-Up Internet | 94 | 0.3% |
| Broadband Home | 25,659 | 70.8% |
| Cellular Data Only | 4,589 | 12.7% |
| Satellite Internet | 2,023 | 5.6% |
| No Internet | 5,001 | 13.8% |
| Total | 36,219 | 100.0% |
Deerfield Beach Summary
Deerfield Beach is a city located in Broward County, Florida, United States. It is part of the Miami metropolitan area, which was home to an estimated 6,012,331 people in 2015. The city is situated on the Atlantic Ocean, about 20 miles north of Fort Lauderdale. As of the 2010 census, the city had a population of 75,018. It is a principal city of the Miami metropolitan area, which was home to an estimated 6,012,331 people in 2015.
History
Deerfield Beach was originally known as Hillsboro Beach, and was incorporated in 1925. The city was named after the numerous deer that roamed the area. The city was originally a farming community, but it quickly grew into a popular tourist destination. In the 1950s, the city began to develop into a residential community, and by the 1970s, it had become a popular retirement destination.
Geography
Deerfield Beach is located at 26°18'N 80°06'W (26.30, -80.10). According to the United States Census Bureau, the city has a total area of 16.3 square miles (42.2 km2), of which 15.3 square miles (39.6 km2) is land and 1.0 square mile (2.6 km2) (6.17%) is water.
Economy
Deerfield Beach is a major tourist destination, and the city's economy is largely based on tourism and hospitality. The city is home to several resorts, hotels, and restaurants, as well as a variety of shopping and entertainment venues. The city also has a thriving business community, with many corporate headquarters located in the city.
Demographics
As of the 2010 census, there were 75,018 people, 33,845 households, and 19,945 families residing in the city. The population density was 4,919.3 people per square mile (1,902.2/km2). There were 37,945 housing units at an average density of 2,478.2 per square mile (957.2/km2). The racial makeup of the city was 74.2% White, 14.3% African American, 0.3% Native American, 2.2% Asian, 0.1% Pacific Islander, 5.7% from other races, and 3.4% from two or more races. Hispanic or Latino of any race were 22.2% of the population.
In terms of education, the city has a high school graduation rate of 87.3%, and a college graduation rate of 28.3%. The median household income in the city was $45,945, and the median family income was $54,945. The per capita income for the city was $25,945. About 8.7% of families and 11.2% of the population were below the poverty line, including 15.2% of those under age 18 and 8.2% of those age 65 or over.
Common Questions
What is Per Capita Income in Deerfield Beach?
Per Capita income in Deerfield Beach is $31,878.
What is the Median Family Income in Deerfield Beach?
Median Family Income in Deerfield Beach is $66,934.
What is the Median Household income in Deerfield Beach?
Median Household Income in Deerfield Beach is $53,741.
What is Income or Wage Gap in Deerfield Beach?
Income or Wage Gap in Deerfield Beach is 17.9%.
Women in Deerfield Beach earn 82.1 cents for every dollar earned by a man.
What is Family Income Deficit in Deerfield Beach?
Family Income Deficit in Deerfield Beach is $9,644.
Families that are below poverty line in Deerfield Beach earn $9,644 less on average than the poverty threshold level.
What is Inequality or Gini Index in Deerfield Beach?
Inequality or Gini Index in Deerfield Beach is 0.48.
What is the Total Population of Deerfield Beach?
Total Population of Deerfield Beach is 86,455.
What is the Total Male Population of Deerfield Beach?
Total Male Population of Deerfield Beach is 40,391.
What is the Total Female Population of Deerfield Beach?
Total Female Population of Deerfield Beach is 46,064.
What is the Ratio of Males per 100 Females in Deerfield Beach?
There are 87.68 Males per 100 Females in Deerfield Beach.
What is the Ratio of Females per 100 Males in Deerfield Beach?
There are 114.05 Females per 100 Males in Deerfield Beach.
What is the Median Population Age in Deerfield Beach?
Median Population Age in Deerfield Beach is 43.5 Years.
What is the Average Family Size in Deerfield Beach
Average Family Size in Deerfield Beach is 3.1 People.
What is the Average Household Size in Deerfield Beach
Average Household Size in Deerfield Beach is 2.3 People.
How Large is the Labor Force in Deerfield Beach?
There are 44,611 People in the Labor Forcein in Deerfield Beach.
What is the Percentage of People in the Labor Force in Deerfield Beach?
61.4% of People are in the Labor Force in Deerfield Beach.
What is the Unemployment Rate in Deerfield Beach?
Unemployment Rate in Deerfield Beach is 6.3%.