Springfield, VA Map & Demographics
Springfield Map
Springfield Overview
$49,457
PER CAPITA INCOME
$127,516
AVG FAMILY INCOME
$117,598
AVG HOUSEHOLD INCOME
30.1%
WAGE / INCOME GAP [ % ]
69.9¢/ $1
WAGE / INCOME GAP [ $ ]
$12,334
FAMILY INCOME DEFICIT
0.41
INEQUALITY / GINI INDEX
31,022
TOTAL POPULATION
15,349
MALE POPULATION
15,673
FEMALE POPULATION
97.93
MALES / 100 FEMALES
102.11
FEMALES / 100 MALES
41.8
MEDIAN AGE
3.6
AVG FAMILY SIZE
2.9
AVG HOUSEHOLD SIZE
16,342
LABOR FORCE [ PEOPLE ]
63.5%
PERCENT IN LABOR FORCE
6.2%
UNEMPLOYMENT RATE
Income in Springfield
Income Overview in Springfield
Per Capita Income in Springfield is $49,457, while median incomes of families and households are $127,516 and $117,598 respectively.
| Characteristic | Number | Measure |
| Per Capita Income | 31,022 | $49,457 |
| Median Family Income | 7,109 | $127,516 |
| Mean Family Income | 7,109 | $145,413 |
| Median Household Income | 10,567 | $117,598 |
| Mean Household Income | 10,567 | $139,742 |
| Income Deficit | 7,109 | $12,334 |
| Wage / Income Gap (%) | 31,022 | 30.06% |
| Wage / Income Gap ($) | 31,022 | 69.94¢ per $1 |
| Gini / Inequality Index | 31,022 | 0.41 |
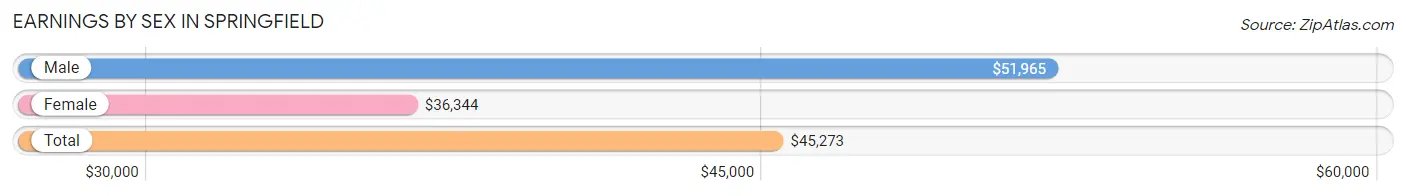
Earnings by Sex in Springfield
Average Earnings in Springfield are $45,273, $51,965 for men and $36,344 for women, a difference of 30.1%.
| Sex | Number | Average Earnings |
| Male | 9,542 (57.3%) | $51,965 |
| Female | 7,123 (42.7%) | $36,344 |
| Total | 16,665 (100.0%) | $45,273 |
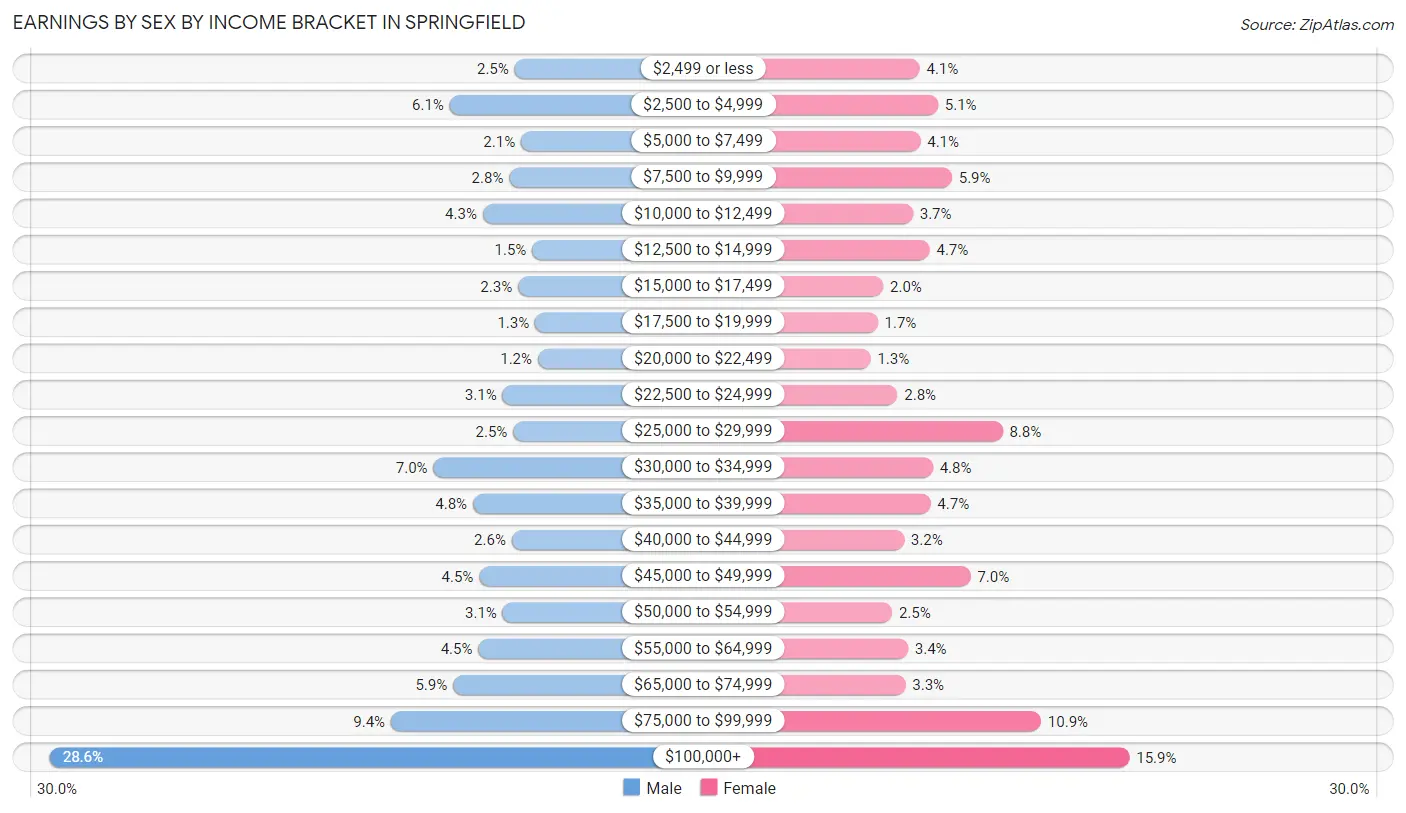
Earnings by Sex by Income Bracket in Springfield
The most common earnings brackets in Springfield are $100,000+ for men (2,727 | 28.6%) and $100,000+ for women (1,131 | 15.9%).
| Income | Male | Female |
| $2,499 or less | 235 (2.5%) | 291 (4.1%) |
| $2,500 to $4,999 | 583 (6.1%) | 365 (5.1%) |
| $5,000 to $7,499 | 200 (2.1%) | 294 (4.1%) |
| $7,500 to $9,999 | 263 (2.8%) | 420 (5.9%) |
| $10,000 to $12,499 | 406 (4.3%) | 264 (3.7%) |
| $12,500 to $14,999 | 140 (1.5%) | 331 (4.6%) |
| $15,000 to $17,499 | 217 (2.3%) | 145 (2.0%) |
| $17,500 to $19,999 | 125 (1.3%) | 123 (1.7%) |
| $20,000 to $22,499 | 110 (1.1%) | 95 (1.3%) |
| $22,500 to $24,999 | 300 (3.1%) | 202 (2.8%) |
| $25,000 to $29,999 | 242 (2.5%) | 623 (8.7%) |
| $30,000 to $34,999 | 670 (7.0%) | 344 (4.8%) |
| $35,000 to $39,999 | 458 (4.8%) | 335 (4.7%) |
| $40,000 to $44,999 | 250 (2.6%) | 229 (3.2%) |
| $45,000 to $49,999 | 425 (4.4%) | 495 (7.0%) |
| $50,000 to $54,999 | 299 (3.1%) | 181 (2.5%) |
| $55,000 to $64,999 | 429 (4.5%) | 244 (3.4%) |
| $65,000 to $74,999 | 565 (5.9%) | 234 (3.3%) |
| $75,000 to $99,999 | 898 (9.4%) | 777 (10.9%) |
| $100,000+ | 2,727 (28.6%) | 1,131 (15.9%) |
| Total | 9,542 (100.0%) | 7,123 (100.0%) |
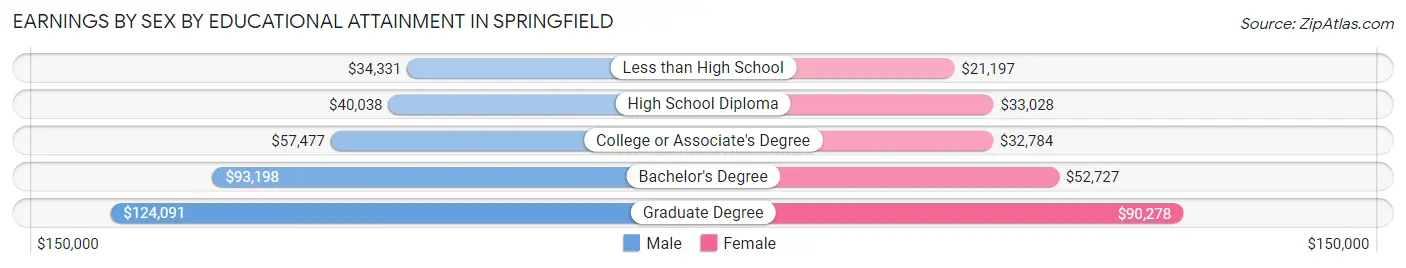
Earnings by Sex by Educational Attainment in Springfield
Average earnings in Springfield are $64,682 for men and $41,702 for women, a difference of 35.5%. Men with an educational attainment of graduate degree enjoy the highest average annual earnings of $124,091, while those with less than high school education earn the least with $34,331. Women with an educational attainment of graduate degree earn the most with the average annual earnings of $90,278, while those with less than high school education have the smallest earnings of $21,197.
| Educational Attainment | Male Income | Female Income |
| Less than High School | $34,331 | $21,197 |
| High School Diploma | $40,038 | $33,028 |
| College or Associate's Degree | $57,477 | $32,784 |
| Bachelor's Degree | $93,198 | $52,727 |
| Graduate Degree | $124,091 | $90,278 |
| Total | $64,682 | $41,702 |
Family Income in Springfield
Family Income Brackets in Springfield
According to the Springfield family income data, there are 1,834 families falling into the $200,000+ income range, which is the most common income bracket and makes up 25.8% of all families. Conversely, the $10,000 to $14,999 income bracket is the least frequent group with only 78 families (1.1%) belonging to this category.
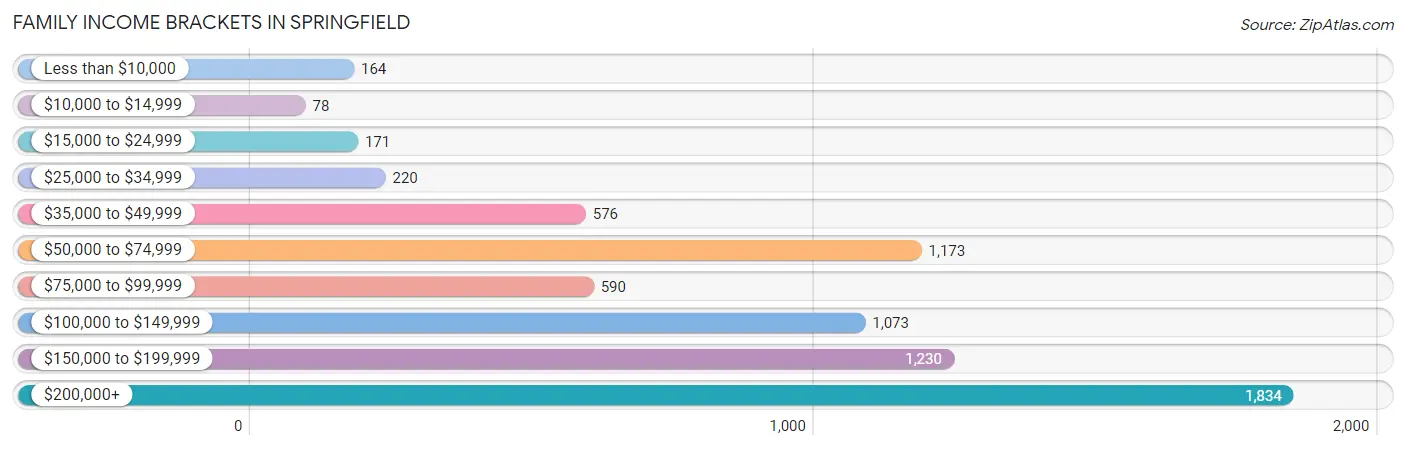
| Income Bracket | # Families | % Families |
| Less than $10,000 | 164 | 2.3% |
| $10,000 to $14,999 | 78 | 1.1% |
| $15,000 to $24,999 | 171 | 2.4% |
| $25,000 to $34,999 | 220 | 3.1% |
| $35,000 to $49,999 | 576 | 8.1% |
| $50,000 to $74,999 | 1,173 | 16.5% |
| $75,000 to $99,999 | 590 | 8.3% |
| $100,000 to $149,999 | 1,073 | 15.1% |
| $150,000 to $199,999 | 1,230 | 17.3% |
| $200,000+ | 1,834 | 25.8% |
Family Income by Famaliy Size in Springfield
7+ person families (232 | 3.3%) account for the highest median family income in Springfield with $163,696 per family, while 2-person families (2,885 | 40.6%) have the highest median income of $55,170 per family member.
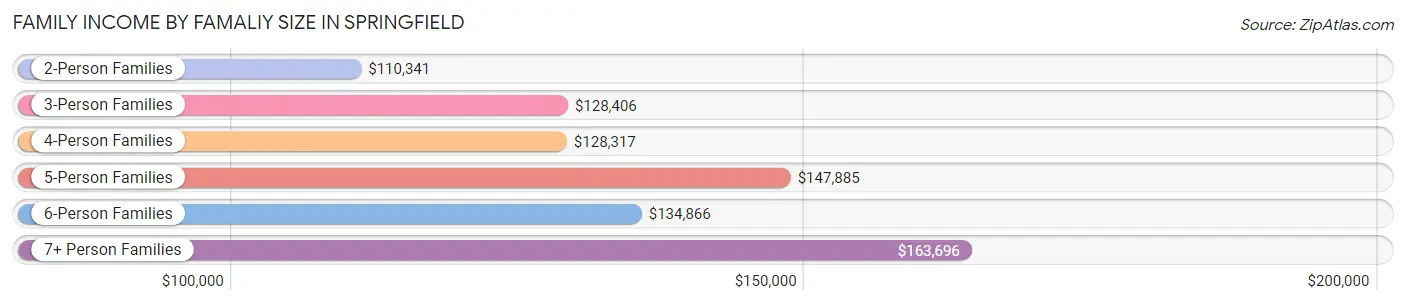
| Income Bracket | # Families | Median Income |
| 2-Person Families | 2,885 (40.6%) | $110,341 |
| 3-Person Families | 1,567 (22.0%) | $128,406 |
| 4-Person Families | 1,317 (18.5%) | $128,317 |
| 5-Person Families | 662 (9.3%) | $147,885 |
| 6-Person Families | 446 (6.3%) | $134,866 |
| 7+ Person Families | 232 (3.3%) | $163,696 |
| Total | 7,109 (100.0%) | $127,516 |
Family Income by Number of Earners in Springfield
The median family income in Springfield is $127,516, with families comprising 3+ earners (1,307) having the highest median family income of $175,029, while families with no earners (967) have the lowest median family income of $69,992, accounting for 18.4% and 13.6% of families, respectively.
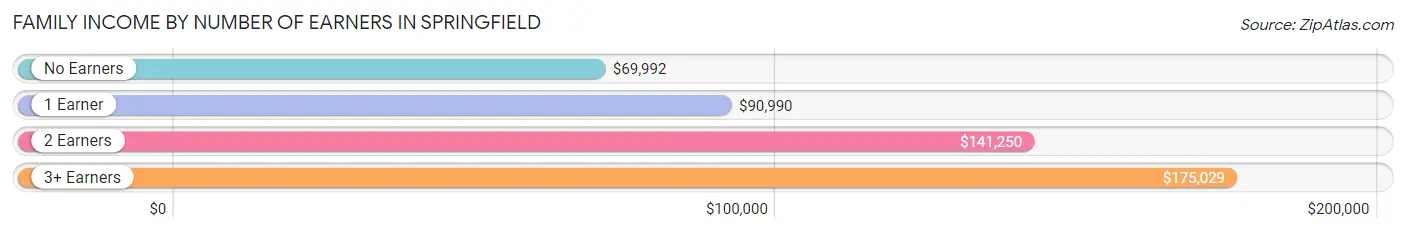
| Number of Earners | # Families | Median Income |
| No Earners | 967 (13.6%) | $69,992 |
| 1 Earner | 1,537 (21.6%) | $90,990 |
| 2 Earners | 3,298 (46.4%) | $141,250 |
| 3+ Earners | 1,307 (18.4%) | $175,029 |
| Total | 7,109 (100.0%) | $127,516 |
Household Income in Springfield
Household Income Brackets in Springfield
With 2,304 households falling in the category, the $200,000+ income range is the most frequent in Springfield, accounting for 21.8% of all households. In contrast, only 127 households (1.2%) fall into the less than $10,000 income bracket, making it the least populous group.
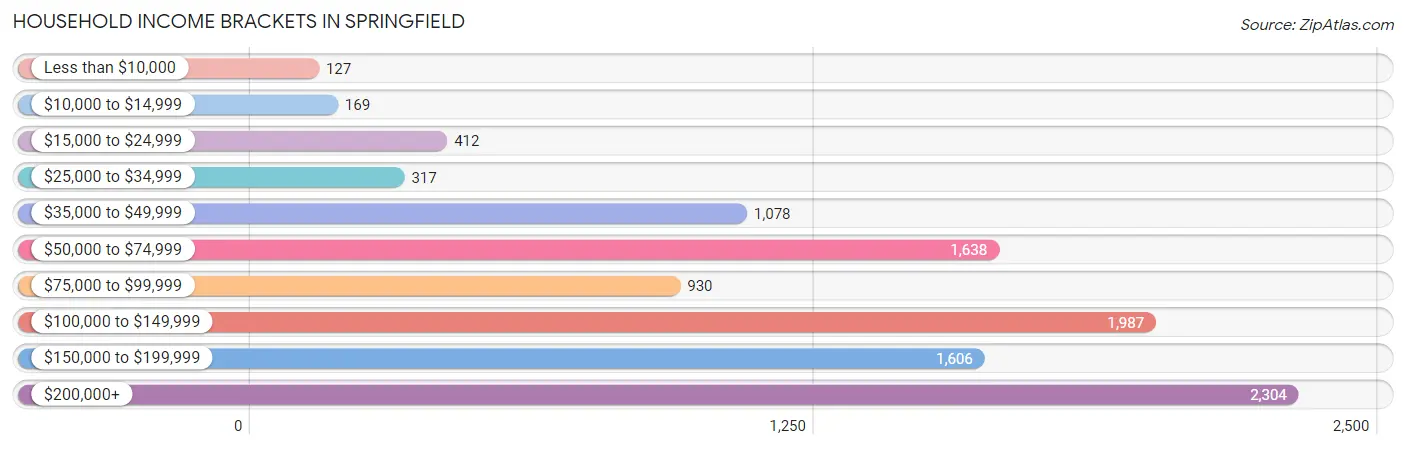
| Income Bracket | # Households | % Households |
| Less than $10,000 | 127 | 1.2% |
| $10,000 to $14,999 | 169 | 1.6% |
| $15,000 to $24,999 | 412 | 3.9% |
| $25,000 to $34,999 | 317 | 3.0% |
| $35,000 to $49,999 | 1,078 | 10.2% |
| $50,000 to $74,999 | 1,638 | 15.5% |
| $75,000 to $99,999 | 930 | 8.8% |
| $100,000 to $149,999 | 1,987 | 18.8% |
| $150,000 to $199,999 | 1,606 | 15.2% |
| $200,000+ | 2,304 | 21.8% |
Household Income by Householder Age in Springfield
The median household income in Springfield is $117,598, with the highest median household income of $140,281 found in the 45 to 64 years age bracket for the primary householder. A total of 3,971 households (37.6%) fall into this category. Meanwhile, the 65+ years age bracket for the primary householder has the lowest median household income of $81,667, with 3,814 households (36.1%) in this group.
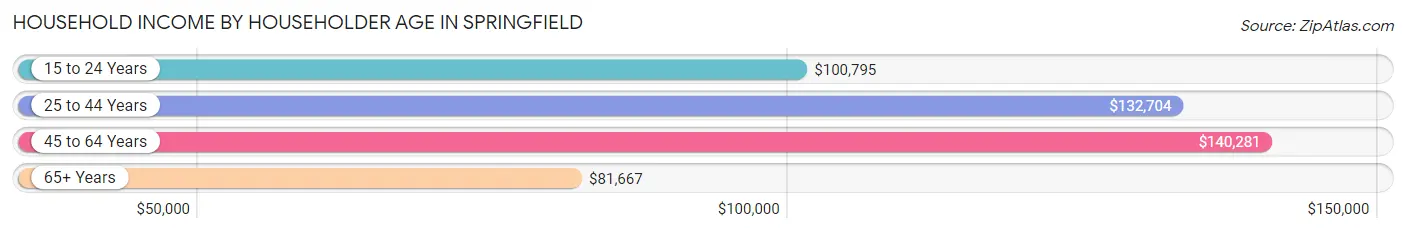
| Income Bracket | # Households | Median Income |
| 15 to 24 Years | 46 (0.4%) | $100,795 |
| 25 to 44 Years | 2,736 (25.9%) | $132,704 |
| 45 to 64 Years | 3,971 (37.6%) | $140,281 |
| 65+ Years | 3,814 (36.1%) | $81,667 |
| Total | 10,567 (100.0%) | $117,598 |
Poverty in Springfield
Income Below Poverty by Sex and Age in Springfield
With 5.8% poverty level for males and 8.5% for females among the residents of Springfield, 12 to 14 year old males and 12 to 14 year old females are the most vulnerable to poverty, with 103 males (20.6%) and 110 females (22.9%) in their respective age groups living below the poverty level.
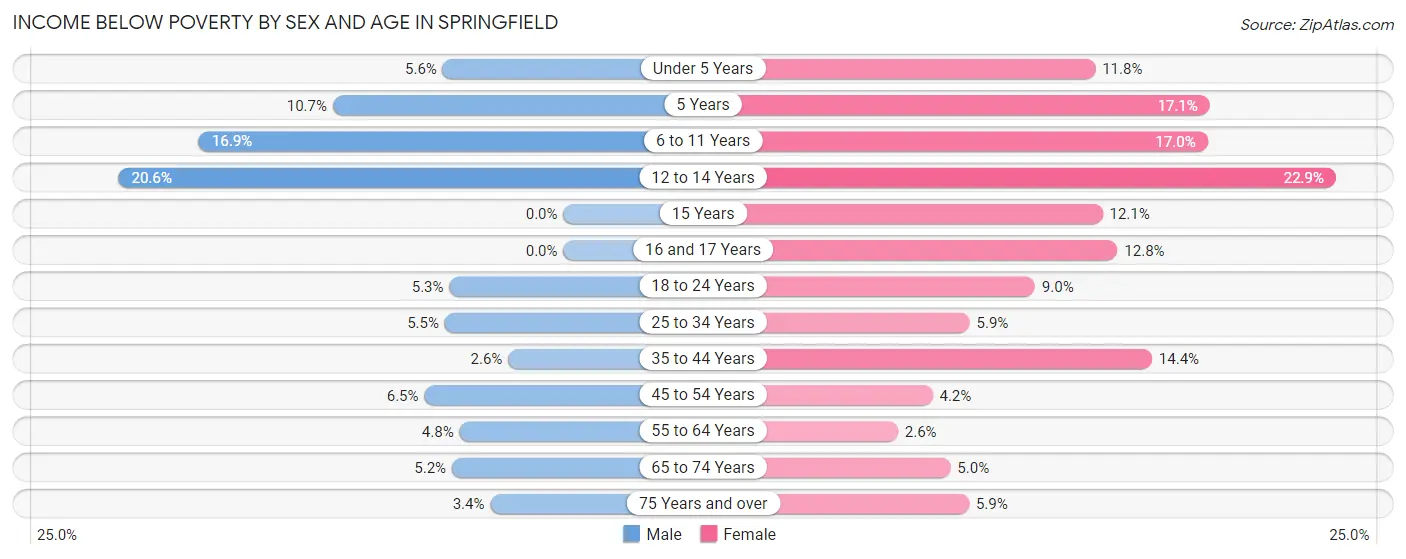
| Age Bracket | Male | Female |
| Under 5 Years | 55 (5.6%) | 104 (11.8%) |
| 5 Years | 20 (10.7%) | 28 (17.1%) |
| 6 to 11 Years | 105 (16.9%) | 168 (17.0%) |
| 12 to 14 Years | 103 (20.6%) | 110 (22.9%) |
| 15 Years | 0 (0.0%) | 19 (12.1%) |
| 16 and 17 Years | 0 (0.0%) | 55 (12.8%) |
| 18 to 24 Years | 86 (5.3%) | 140 (9.0%) |
| 25 to 34 Years | 110 (5.5%) | 101 (5.9%) |
| 35 to 44 Years | 49 (2.6%) | 266 (14.4%) |
| 45 to 54 Years | 138 (6.5%) | 73 (4.2%) |
| 55 to 64 Years | 98 (4.8%) | 51 (2.6%) |
| 65 to 74 Years | 87 (5.2%) | 80 (5.0%) |
| 75 Years and over | 37 (3.4%) | 115 (5.9%) |
| Total | 888 (5.8%) | 1,310 (8.5%) |
Income Above Poverty by Sex and Age in Springfield
According to the poverty statistics in Springfield, males aged 15 years and females aged 55 to 64 years are the age groups that are most secure financially, with 100.0% of males and 97.4% of females in these age groups living above the poverty line.
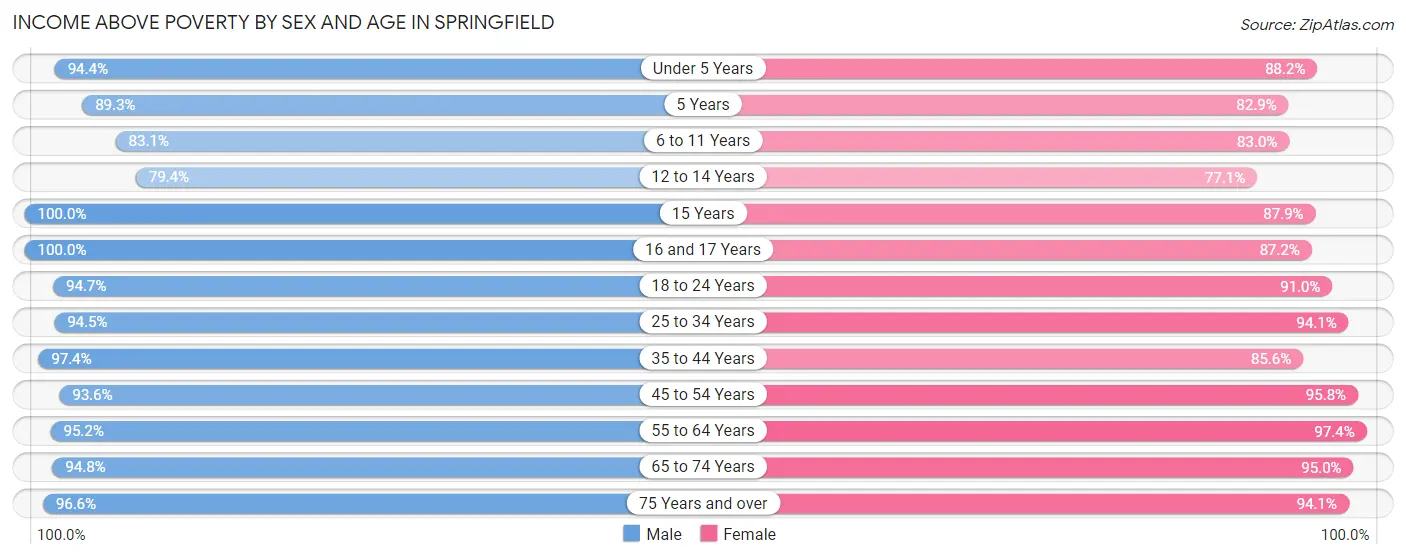
| Age Bracket | Male | Female |
| Under 5 Years | 928 (94.4%) | 780 (88.2%) |
| 5 Years | 167 (89.3%) | 136 (82.9%) |
| 6 to 11 Years | 516 (83.1%) | 822 (83.0%) |
| 12 to 14 Years | 396 (79.4%) | 370 (77.1%) |
| 15 Years | 228 (100.0%) | 138 (87.9%) |
| 16 and 17 Years | 227 (100.0%) | 375 (87.2%) |
| 18 to 24 Years | 1,540 (94.7%) | 1,423 (91.0%) |
| 25 to 34 Years | 1,890 (94.5%) | 1,603 (94.1%) |
| 35 to 44 Years | 1,865 (97.4%) | 1,583 (85.6%) |
| 45 to 54 Years | 2,000 (93.5%) | 1,659 (95.8%) |
| 55 to 64 Years | 1,935 (95.2%) | 1,914 (97.4%) |
| 65 to 74 Years | 1,596 (94.8%) | 1,506 (95.0%) |
| 75 Years and over | 1,053 (96.6%) | 1,833 (94.1%) |
| Total | 14,341 (94.2%) | 14,142 (91.5%) |
Income Below Poverty Among Married-Couple Families in Springfield
The poverty statistics for married-couple families in Springfield show that 2.3% or 128 of the total 5,641 families live below the poverty line. Families with 3 or 4 children have the highest poverty rate of 5.1%, comprising of 26 families. On the other hand, families with 5 or more children have the lowest poverty rate of 0.0%, which includes 0 families.
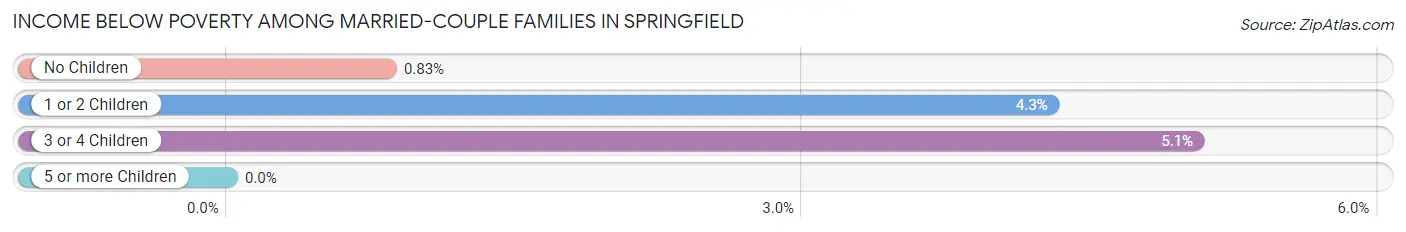
| Children | Above Poverty | Below Poverty |
| No Children | 3,352 (99.2%) | 28 (0.8%) |
| 1 or 2 Children | 1,649 (95.7%) | 74 (4.3%) |
| 3 or 4 Children | 489 (95.0%) | 26 (5.1%) |
| 5 or more Children | 23 (100.0%) | 0 (0.0%) |
| Total | 5,513 (97.7%) | 128 (2.3%) |
Income Below Poverty Among Single-Parent Households in Springfield
According to the poverty data in Springfield, 10.0% or 57 single-father households and 25.0% or 224 single-mother households are living below the poverty line. Among single-father households, those with 1 or 2 children have the highest poverty rate, with 33 households (20.1%) experiencing poverty. Likewise, among single-mother households, those with 3 or 4 children have the highest poverty rate, with 53 households (85.5%) falling below the poverty line.
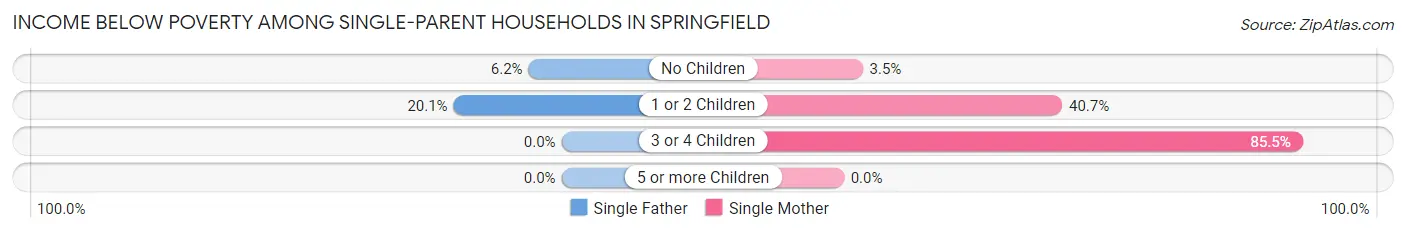
| Children | Single Father | Single Mother |
| No Children | 24 (6.1%) | 16 (3.5%) |
| 1 or 2 Children | 33 (20.1%) | 155 (40.7%) |
| 3 or 4 Children | 0 (0.0%) | 53 (85.5%) |
| 5 or more Children | 0 (0.0%) | 0 (0.0%) |
| Total | 57 (10.0%) | 224 (25.0%) |
Income Below Poverty Among Married-Couple vs Single-Parent Households in Springfield
The poverty data for Springfield shows that 128 of the married-couple family households (2.3%) and 281 of the single-parent households (19.1%) are living below the poverty level. Within the married-couple family households, those with 3 or 4 children have the highest poverty rate, with 26 households (5.1%) falling below the poverty line. Among the single-parent households, those with 3 or 4 children have the highest poverty rate, with 53 household (67.1%) living below poverty.
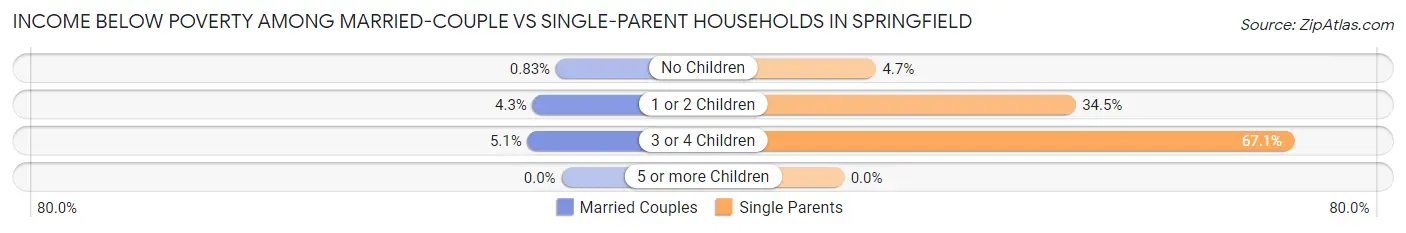
| Children | Married-Couple Families | Single-Parent Households |
| No Children | 28 (0.8%) | 40 (4.7%) |
| 1 or 2 Children | 74 (4.3%) | 188 (34.5%) |
| 3 or 4 Children | 26 (5.1%) | 53 (67.1%) |
| 5 or more Children | 0 (0.0%) | 0 (0.0%) |
| Total | 128 (2.3%) | 281 (19.1%) |
Race in Springfield
The most populous races in Springfield are White / Caucasian (13,116 | 42.3%), Asian (9,406 | 30.3%), and Hispanic or Latino (5,714 | 18.4%).
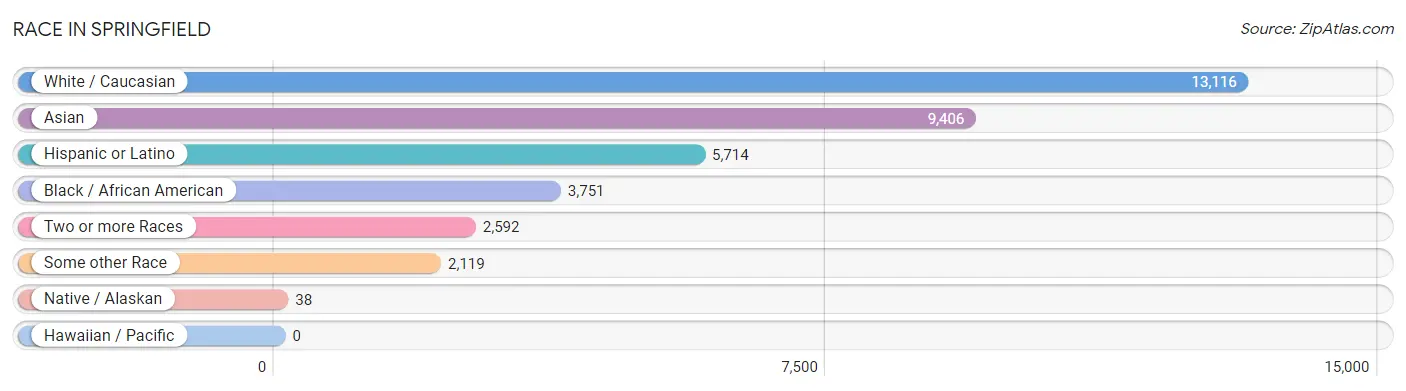
| Race | # Population | % Population |
| Asian | 9,406 | 30.3% |
| Black / African American | 3,751 | 12.1% |
| Hawaiian / Pacific | 0 | 0.0% |
| Hispanic or Latino | 5,714 | 18.4% |
| Native / Alaskan | 38 | 0.1% |
| White / Caucasian | 13,116 | 42.3% |
| Two or more Races | 2,592 | 8.4% |
| Some other Race | 2,119 | 6.8% |
| Total | 31,022 | 100.0% |
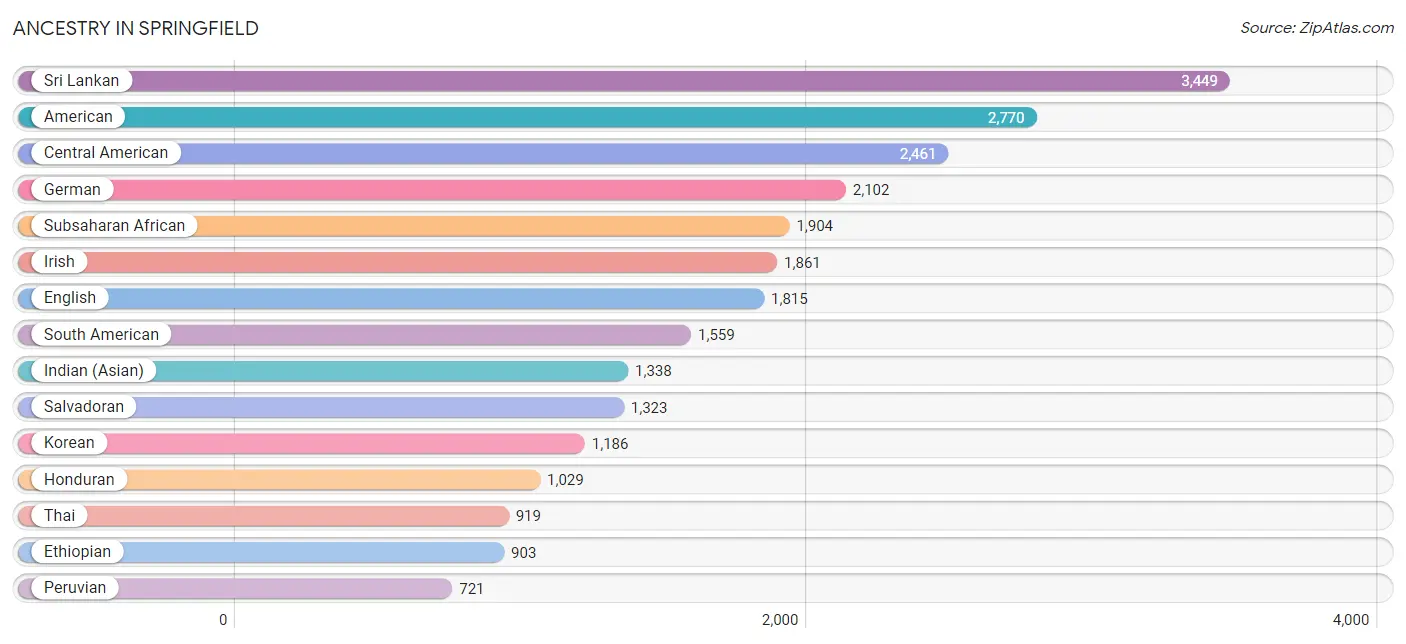
Ancestry in Springfield
The most populous ancestries reported in Springfield are Sri Lankan (3,449 | 11.1%), American (2,770 | 8.9%), Central American (2,461 | 7.9%), German (2,102 | 6.8%), and Subsaharan African (1,904 | 6.1%), together accounting for 40.9% of all Springfield residents.
| Ancestry | # Population | % Population |
| Afghan | 232 | 0.7% |
| African | 335 | 1.1% |
| Albanian | 25 | 0.1% |
| American | 2,770 | 8.9% |
| Arab | 686 | 2.2% |
| Argentinean | 169 | 0.5% |
| Austrian | 61 | 0.2% |
| Belgian | 14 | 0.1% |
| Bhutanese | 141 | 0.4% |
| Bolivian | 600 | 1.9% |
| Brazilian | 60 | 0.2% |
| British | 154 | 0.5% |
| Bulgarian | 83 | 0.3% |
| Burmese | 415 | 1.3% |
| Cajun | 8 | 0.0% |
| Canadian | 37 | 0.1% |
| Central American | 2,461 | 7.9% |
| Central American Indian | 8 | 0.0% |
| Cherokee | 10 | 0.0% |
| Cuban | 81 | 0.3% |
| Czech | 265 | 0.9% |
| Czechoslovakian | 5 | 0.0% |
| Danish | 54 | 0.2% |
| Dutch | 222 | 0.7% |
| Eastern European | 71 | 0.2% |
| Ecuadorian | 58 | 0.2% |
| Egyptian | 170 | 0.5% |
| English | 1,815 | 5.9% |
| Ethiopian | 903 | 2.9% |
| European | 302 | 1.0% |
| Filipino | 48 | 0.2% |
| Finnish | 55 | 0.2% |
| French | 275 | 0.9% |
| French Canadian | 33 | 0.1% |
| German | 2,102 | 6.8% |
| Ghanaian | 277 | 0.9% |
| Greek | 168 | 0.5% |
| Guatemalan | 91 | 0.3% |
| Haitian | 65 | 0.2% |
| Honduran | 1,029 | 3.3% |
| Hungarian | 90 | 0.3% |
| Indian (Asian) | 1,338 | 4.3% |
| Iranian | 21 | 0.1% |
| Iraqi | 45 | 0.2% |
| Irish | 1,861 | 6.0% |
| Iroquois | 8 | 0.0% |
| Italian | 660 | 2.1% |
| Jamaican | 36 | 0.1% |
| Japanese | 133 | 0.4% |
| Jordanian | 17 | 0.1% |
| Korean | 1,186 | 3.8% |
| Laotian | 89 | 0.3% |
| Lebanese | 69 | 0.2% |
| Lithuanian | 46 | 0.2% |
| Lumbee | 33 | 0.1% |
| Luxembourger | 10 | 0.0% |
| Malaysian | 22 | 0.1% |
| Mexican | 335 | 1.1% |
| Moroccan | 187 | 0.6% |
| Northern European | 22 | 0.1% |
| Norwegian | 148 | 0.5% |
| Pakistani | 228 | 0.7% |
| Palestinian | 38 | 0.1% |
| Panamanian | 18 | 0.1% |
| Pennsylvania German | 16 | 0.1% |
| Peruvian | 721 | 2.3% |
| Polish | 485 | 1.6% |
| Portuguese | 18 | 0.1% |
| Puerto Rican | 498 | 1.6% |
| Romanian | 156 | 0.5% |
| Russian | 118 | 0.4% |
| Salvadoran | 1,323 | 4.3% |
| Scandinavian | 32 | 0.1% |
| Scotch-Irish | 222 | 0.7% |
| Scottish | 268 | 0.9% |
| Sierra Leonean | 20 | 0.1% |
| Slavic | 5 | 0.0% |
| Slovak | 51 | 0.2% |
| South African | 30 | 0.1% |
| South American | 1,559 | 5.0% |
| South American Indian | 92 | 0.3% |
| Spaniard | 15 | 0.1% |
| Spanish | 62 | 0.2% |
| Sri Lankan | 3,449 | 11.1% |
| Subsaharan African | 1,904 | 6.1% |
| Sudanese | 23 | 0.1% |
| Swedish | 205 | 0.7% |
| Swiss | 54 | 0.2% |
| Syrian | 25 | 0.1% |
| Thai | 919 | 3.0% |
| Turkish | 64 | 0.2% |
| Ukrainian | 96 | 0.3% |
| Venezuelan | 11 | 0.0% |
| Vietnamese | 285 | 0.9% |
| Welsh | 68 | 0.2% | View All 95 Rows |
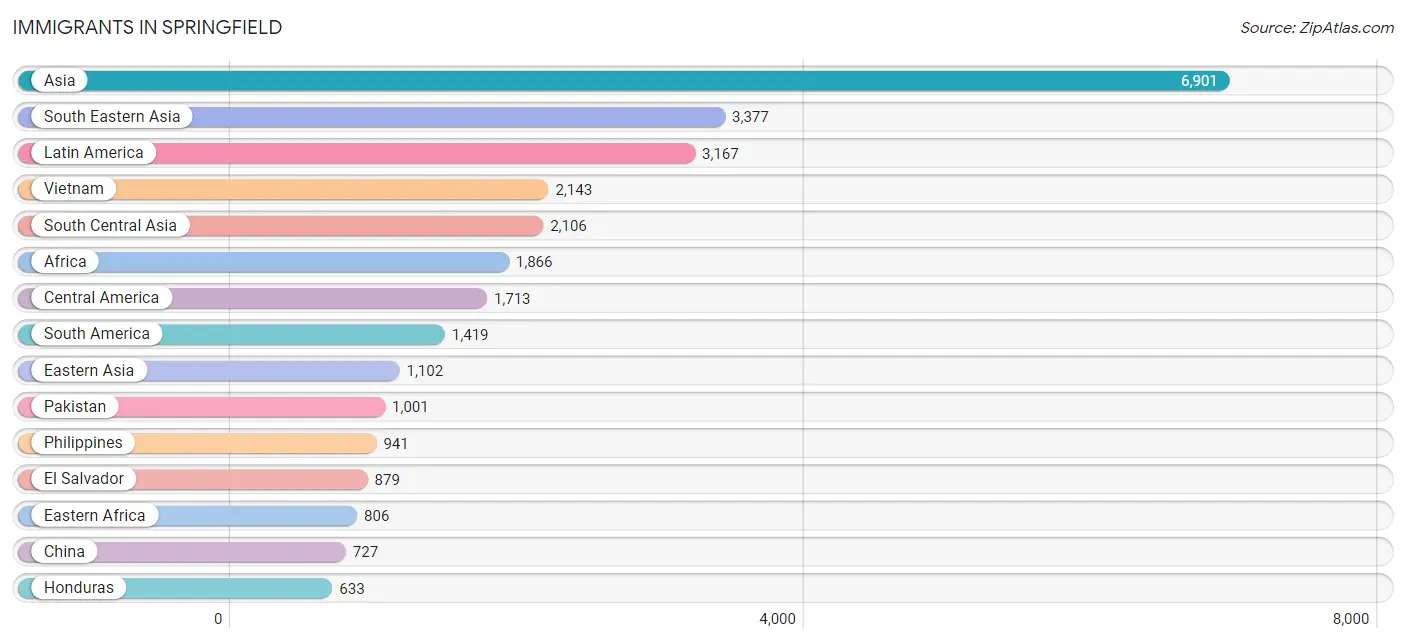
Immigrants in Springfield
The most numerous immigrant groups reported in Springfield came from Asia (6,901 | 22.3%), South Eastern Asia (3,377 | 10.9%), Latin America (3,167 | 10.2%), Vietnam (2,143 | 6.9%), and South Central Asia (2,106 | 6.8%), together accounting for 57.0% of all Springfield residents.
| Immigration Origin | # Population | % Population |
| Afghanistan | 209 | 0.7% |
| Africa | 1,866 | 6.0% |
| Argentina | 99 | 0.3% |
| Asia | 6,901 | 22.3% |
| Bangladesh | 408 | 1.3% |
| Belgium | 5 | 0.0% |
| Bolivia | 603 | 1.9% |
| Brazil | 60 | 0.2% |
| Bulgaria | 40 | 0.1% |
| Cambodia | 109 | 0.4% |
| Canada | 31 | 0.1% |
| Caribbean | 35 | 0.1% |
| Central America | 1,713 | 5.5% |
| China | 727 | 2.3% |
| Colombia | 50 | 0.2% |
| Czechoslovakia | 23 | 0.1% |
| Eastern Africa | 806 | 2.6% |
| Eastern Asia | 1,102 | 3.5% |
| Eastern Europe | 270 | 0.9% |
| Ecuador | 73 | 0.2% |
| Egypt | 165 | 0.5% |
| El Salvador | 879 | 2.8% |
| England | 41 | 0.1% |
| Eritrea | 251 | 0.8% |
| Ethiopia | 455 | 1.5% |
| Europe | 619 | 2.0% |
| Fiji | 8 | 0.0% |
| France | 72 | 0.2% |
| Germany | 140 | 0.4% |
| Ghana | 41 | 0.1% |
| Greece | 36 | 0.1% |
| Guatemala | 70 | 0.2% |
| Guyana | 35 | 0.1% |
| Honduras | 633 | 2.0% |
| Hong Kong | 51 | 0.2% |
| India | 320 | 1.0% |
| Indonesia | 22 | 0.1% |
| Iran | 14 | 0.1% |
| Iraq | 195 | 0.6% |
| Italy | 21 | 0.1% |
| Jamaica | 11 | 0.0% |
| Japan | 19 | 0.1% |
| Jordan | 5 | 0.0% |
| Kazakhstan | 6 | 0.0% |
| Kenya | 87 | 0.3% |
| Korea | 356 | 1.1% |
| Laos | 25 | 0.1% |
| Latin America | 3,167 | 10.2% |
| Lebanon | 46 | 0.2% |
| Mexico | 77 | 0.3% |
| Middle Africa | 199 | 0.6% |
| Moldova | 78 | 0.3% |
| Morocco | 201 | 0.6% |
| Nepal | 148 | 0.5% |
| Nicaragua | 10 | 0.0% |
| Nigeria | 8 | 0.0% |
| Northern Africa | 450 | 1.5% |
| Northern Europe | 60 | 0.2% |
| Oceania | 8 | 0.0% |
| Pakistan | 1,001 | 3.2% |
| Panama | 44 | 0.1% |
| Peru | 488 | 1.6% |
| Philippines | 941 | 3.0% |
| Poland | 29 | 0.1% |
| Romania | 20 | 0.1% |
| Russia | 20 | 0.1% |
| Saudi Arabia | 6 | 0.0% |
| Sierra Leone | 55 | 0.2% |
| South Africa | 36 | 0.1% |
| South America | 1,419 | 4.6% |
| South Central Asia | 2,106 | 6.8% |
| South Eastern Asia | 3,377 | 10.9% |
| Southern Europe | 72 | 0.2% |
| Spain | 15 | 0.1% |
| Sudan | 84 | 0.3% |
| Syria | 17 | 0.1% |
| Taiwan | 48 | 0.2% |
| Thailand | 137 | 0.4% |
| Turkey | 47 | 0.2% |
| Ukraine | 60 | 0.2% |
| Venezuela | 11 | 0.0% |
| Vietnam | 2,143 | 6.9% |
| Western Africa | 114 | 0.4% |
| Western Asia | 316 | 1.0% |
| Western Europe | 217 | 0.7% |
| Zimbabwe | 4 | 0.0% | View All 86 Rows |
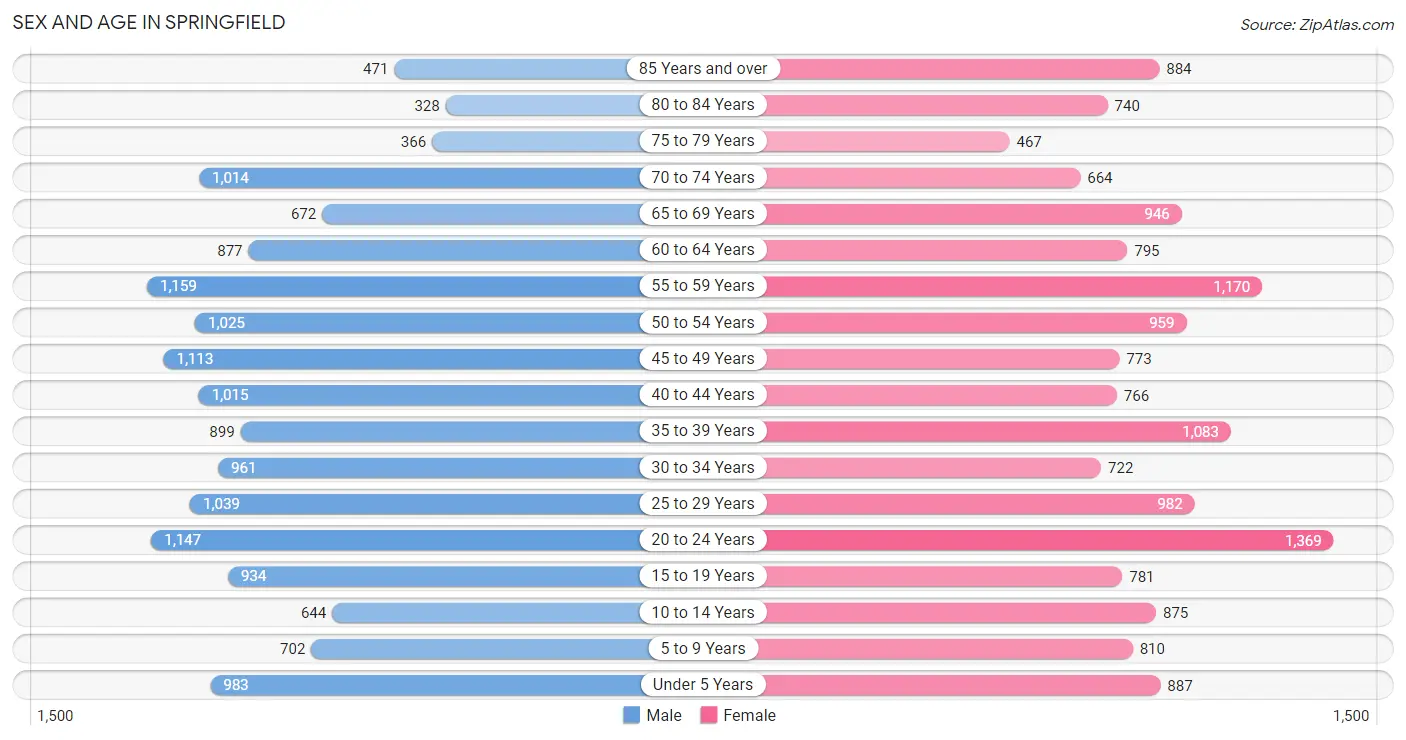
Sex and Age in Springfield
Sex and Age in Springfield
The most populous age groups in Springfield are 55 to 59 Years (1,159 | 7.5%) for men and 20 to 24 Years (1,369 | 8.7%) for women.
| Age Bracket | Male | Female |
| Under 5 Years | 983 (6.4%) | 887 (5.7%) |
| 5 to 9 Years | 702 (4.6%) | 810 (5.2%) |
| 10 to 14 Years | 644 (4.2%) | 875 (5.6%) |
| 15 to 19 Years | 934 (6.1%) | 781 (5.0%) |
| 20 to 24 Years | 1,147 (7.5%) | 1,369 (8.7%) |
| 25 to 29 Years | 1,039 (6.8%) | 982 (6.3%) |
| 30 to 34 Years | 961 (6.3%) | 722 (4.6%) |
| 35 to 39 Years | 899 (5.9%) | 1,083 (6.9%) |
| 40 to 44 Years | 1,015 (6.6%) | 766 (4.9%) |
| 45 to 49 Years | 1,113 (7.2%) | 773 (4.9%) |
| 50 to 54 Years | 1,025 (6.7%) | 959 (6.1%) |
| 55 to 59 Years | 1,159 (7.5%) | 1,170 (7.5%) |
| 60 to 64 Years | 877 (5.7%) | 795 (5.1%) |
| 65 to 69 Years | 672 (4.4%) | 946 (6.0%) |
| 70 to 74 Years | 1,014 (6.6%) | 664 (4.2%) |
| 75 to 79 Years | 366 (2.4%) | 467 (3.0%) |
| 80 to 84 Years | 328 (2.1%) | 740 (4.7%) |
| 85 Years and over | 471 (3.1%) | 884 (5.6%) |
| Total | 15,349 (100.0%) | 15,673 (100.0%) |
Families and Households in Springfield
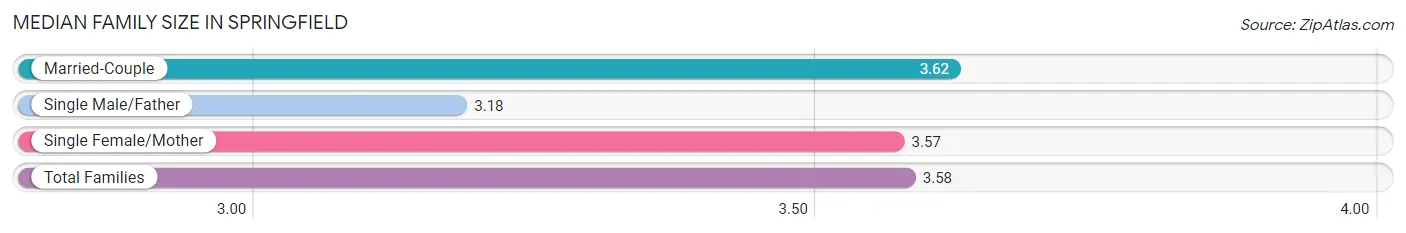
Median Family Size in Springfield
The median family size in Springfield is 3.58 persons per family, with married-couple families (5,641 | 79.3%) accounting for the largest median family size of 3.62 persons per family. On the other hand, single male/father families (571 | 8.0%) represent the smallest median family size with 3.18 persons per family.
| Family Type | # Families | Family Size |
| Married-Couple | 5,641 (79.3%) | 3.62 |
| Single Male/Father | 571 (8.0%) | 3.18 |
| Single Female/Mother | 897 (12.6%) | 3.57 |
| Total Families | 7,109 (100.0%) | 3.58 |
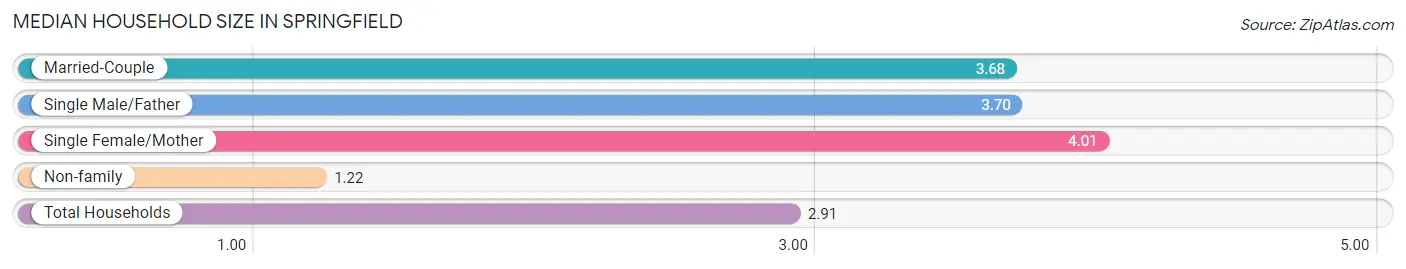
Median Household Size in Springfield
The median household size in Springfield is 2.91 persons per household, with single female/mother households (897 | 8.5%) accounting for the largest median household size of 4.01 persons per household. non-family households (3,458 | 32.7%) represent the smallest median household size with 1.22 persons per household.
| Household Type | # Households | Household Size |
| Married-Couple | 5,641 (53.4%) | 3.68 |
| Single Male/Father | 571 (5.4%) | 3.70 |
| Single Female/Mother | 897 (8.5%) | 4.01 |
| Non-family | 3,458 (32.7%) | 1.22 |
| Total Households | 10,567 (100.0%) | 2.91 |
Household Size by Marriage Status in Springfield
Out of a total of 10,567 households in Springfield, 7,109 (67.3%) are family households, while 3,458 (32.7%) are nonfamily households. The most numerous type of family households are 2-person households, comprising 2,675, and the most common type of nonfamily households are 1-person households, comprising 3,135.
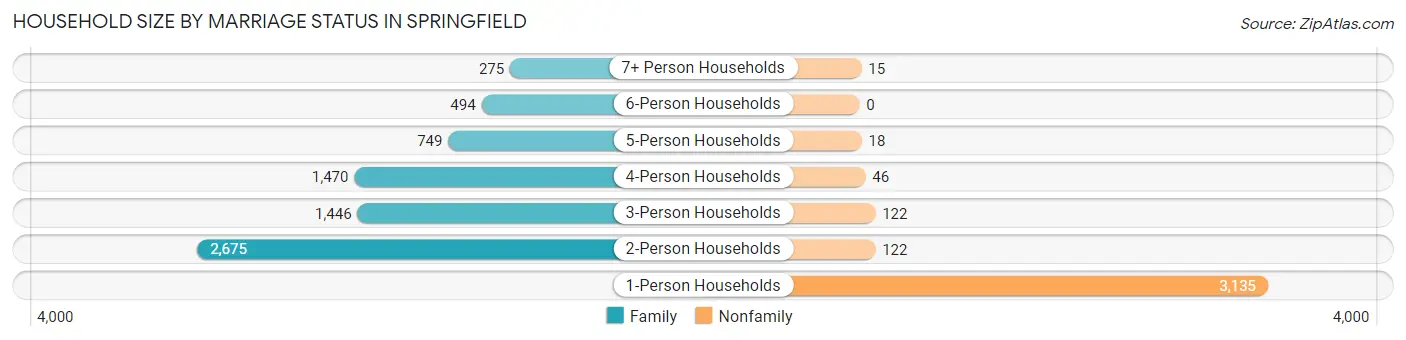
| Household Size | Family Households | Nonfamily Households |
| 1-Person Households | - | 3,135 (29.7%) |
| 2-Person Households | 2,675 (25.3%) | 122 (1.1%) |
| 3-Person Households | 1,446 (13.7%) | 122 (1.1%) |
| 4-Person Households | 1,470 (13.9%) | 46 (0.4%) |
| 5-Person Households | 749 (7.1%) | 18 (0.2%) |
| 6-Person Households | 494 (4.7%) | 0 (0.0%) |
| 7+ Person Households | 275 (2.6%) | 15 (0.1%) |
| Total | 7,109 (67.3%) | 3,458 (32.7%) |
Female Fertility in Springfield
Fertility by Age in Springfield
Average fertility rate in Springfield is 59.0 births per 1,000 women. Women in the age bracket of 20 to 34 years have the highest fertility rate with 92.0 births per 1,000 women. Women in the age bracket of 20 to 34 years acount for 72.5% of all women with births.
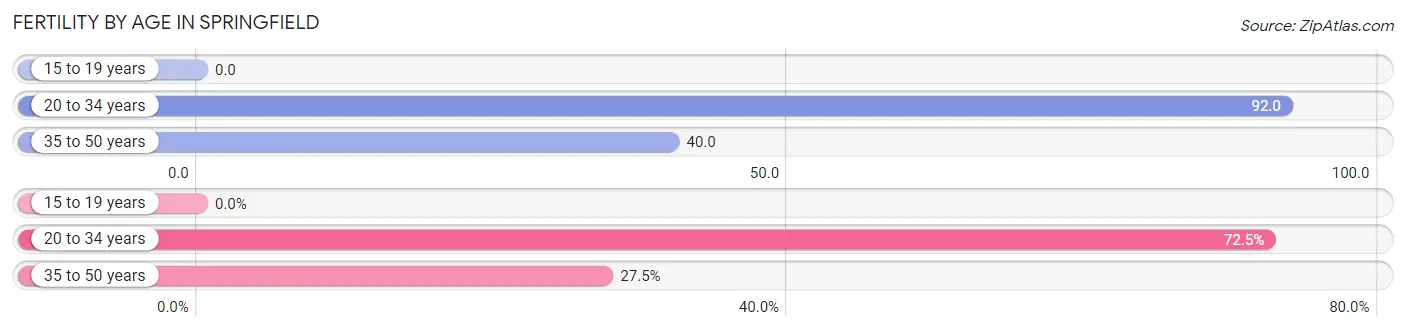
| Age Bracket | Women with Births | Births / 1,000 Women |
| 15 to 19 years | 0 (0.0%) | 0.0 |
| 20 to 34 years | 282 (72.5%) | 92.0 |
| 35 to 50 years | 107 (27.5%) | 40.0 |
| Total | 389 (100.0%) | 59.0 |
Fertility by Age by Marriage Status in Springfield
73.8% of women with births (389) in Springfield are married. The highest percentage of unmarried women with births falls into 20 to 34 years age bracket with 26.6% of them unmarried at the time of birth, while the lowest percentage of unmarried women with births belong to 35 to 50 years age bracket with 25.2% of them unmarried.
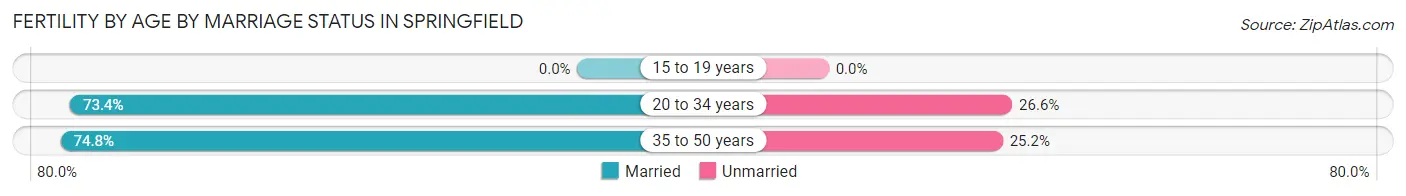
| Age Bracket | Married | Unmarried |
| 15 to 19 years | 0 (0.0%) | 0 (0.0%) |
| 20 to 34 years | 207 (73.4%) | 75 (26.6%) |
| 35 to 50 years | 80 (74.8%) | 27 (25.2%) |
| Total | 287 (73.8%) | 102 (26.2%) |
Fertility by Education in Springfield
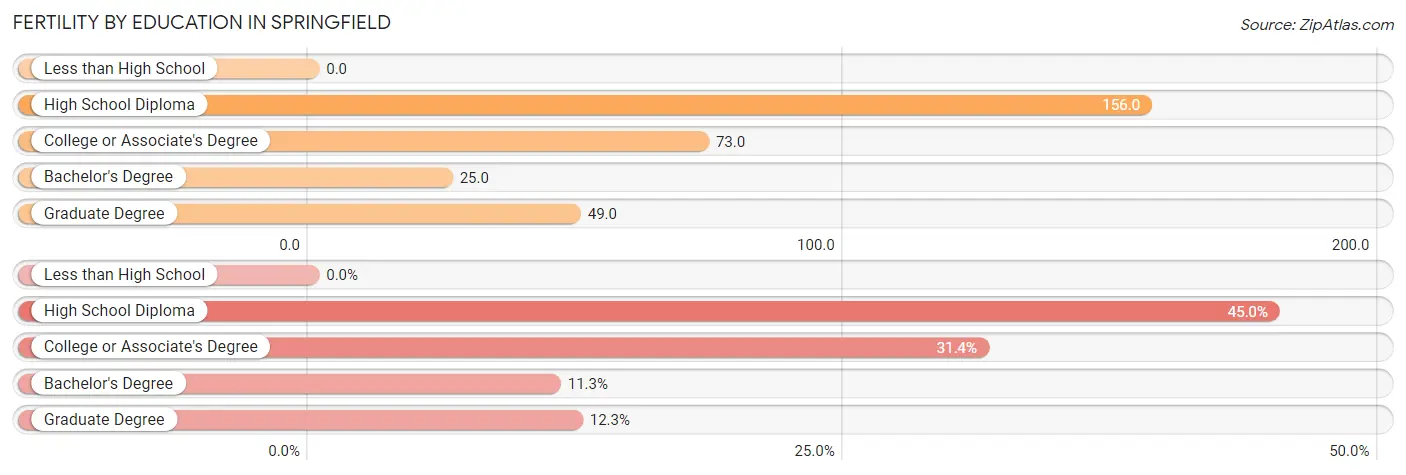
| Educational Attainment | Women with Births | Births / 1,000 Women |
| Less than High School | 0 (0.0%) | 0.0 |
| High School Diploma | 175 (45.0%) | 156.0 |
| College or Associate's Degree | 122 (31.4%) | 73.0 |
| Bachelor's Degree | 44 (11.3%) | 25.0 |
| Graduate Degree | 48 (12.3%) | 49.0 |
| Total | 389 (100.0%) | 59.0 |
Fertility by Education by Marriage Status in Springfield
26.2% of women with births in Springfield are unmarried. Women with the educational attainment of college or associate's degree are most likely to be married with 100.0% of them married at childbirth, while women with the educational attainment of high school diploma are least likely to be married with 58.3% of them unmarried at childbirth.
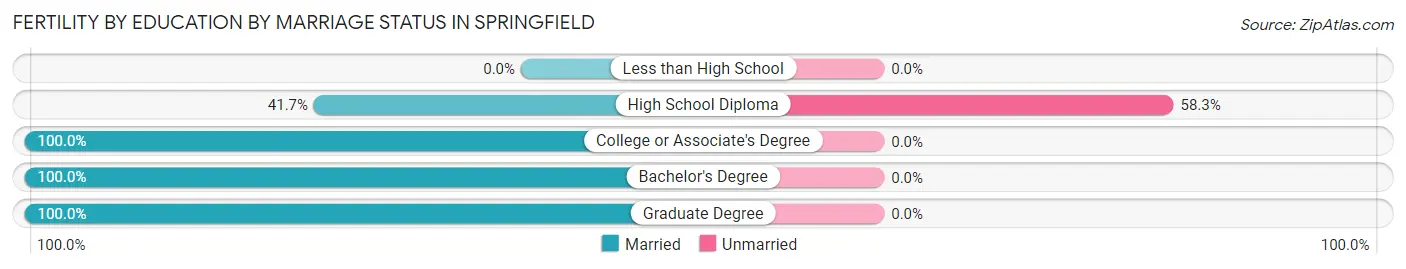
| Educational Attainment | Married | Unmarried |
| Less than High School | 0 (0.0%) | 0 (0.0%) |
| High School Diploma | 73 (41.7%) | 102 (58.3%) |
| College or Associate's Degree | 122 (100.0%) | 0 (0.0%) |
| Bachelor's Degree | 44 (100.0%) | 0 (0.0%) |
| Graduate Degree | 48 (100.0%) | 0 (0.0%) |
| Total | 287 (73.8%) | 102 (26.2%) |
Employment Characteristics in Springfield
Employment by Class of Employer in Springfield
Among the 15,076 employed individuals in Springfield, private company employees (9,102 | 60.4%), federal government employees (2,367 | 15.7%), and not-for-profit organizations (1,117 | 7.4%) make up the most common classes of employment.
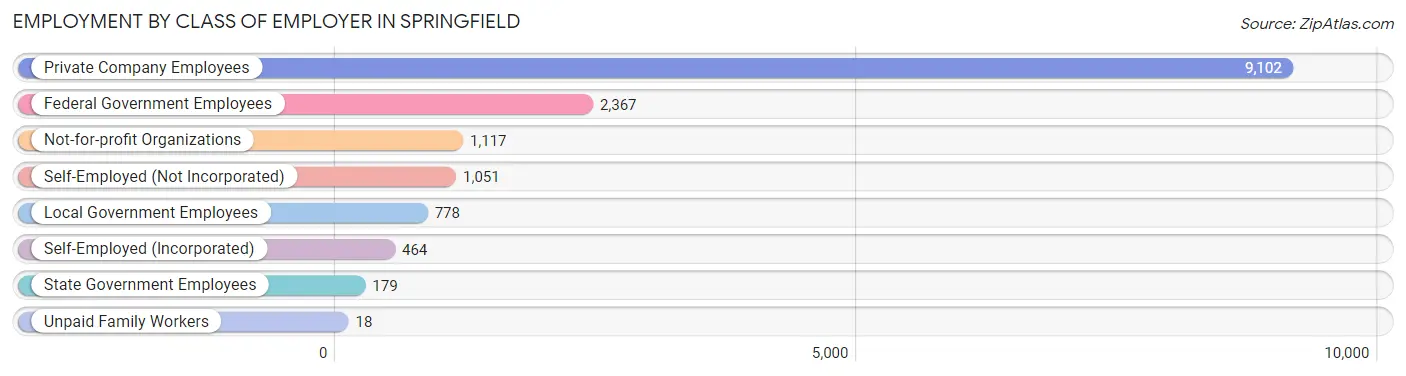
| Employer Class | # Employees | % Employees |
| Private Company Employees | 9,102 | 60.4% |
| Self-Employed (Incorporated) | 464 | 3.1% |
| Self-Employed (Not Incorporated) | 1,051 | 7.0% |
| Not-for-profit Organizations | 1,117 | 7.4% |
| Local Government Employees | 778 | 5.2% |
| State Government Employees | 179 | 1.2% |
| Federal Government Employees | 2,367 | 15.7% |
| Unpaid Family Workers | 18 | 0.1% |
| Total | 15,076 | 100.0% |
Employment Status by Age in Springfield
According to the labor force statistics for Springfield, out of the total population over 16 years of age (25,736), 63.5% or 16,342 individuals are in the labor force, with 6.2% or 1,013 of them unemployed. The age group with the highest labor force participation rate is 45 to 54 years, with 91.8% or 3,553 individuals in the labor force. Within the labor force, the 16 to 19 years age range has the highest percentage of unemployed individuals, with 27.0% or 120 of them being unemployed.
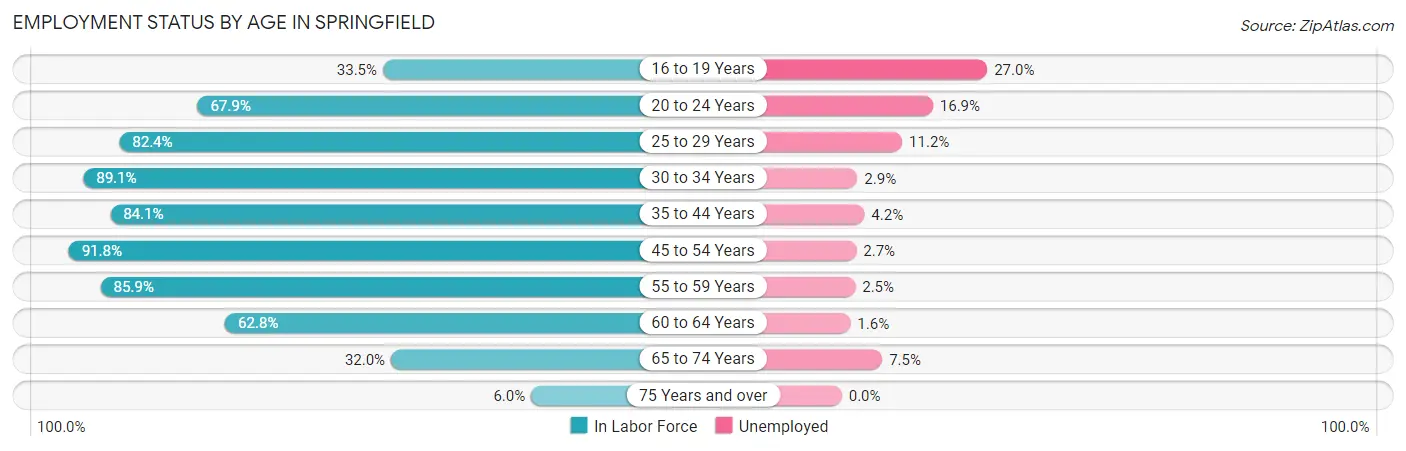
| Age Bracket | In Labor Force | Unemployed |
| 16 to 19 Years | 446 (33.5%) | 120 (27.0%) |
| 20 to 24 Years | 1,708 (67.9%) | 289 (16.9%) |
| 25 to 29 Years | 1,665 (82.4%) | 186 (11.2%) |
| 30 to 34 Years | 1,500 (89.1%) | 44 (2.9%) |
| 35 to 44 Years | 3,165 (84.1%) | 133 (4.2%) |
| 45 to 54 Years | 3,553 (91.8%) | 96 (2.7%) |
| 55 to 59 Years | 2,001 (85.9%) | 50 (2.5%) |
| 60 to 64 Years | 1,050 (62.8%) | 17 (1.6%) |
| 65 to 74 Years | 1,055 (32.0%) | 79 (7.5%) |
| 75 Years and over | 195 (6.0%) | 0 (0.0%) |
| Total | 16,342 (63.5%) | 1,013 (6.2%) |
Employment Status by Educational Attainment in Springfield
According to labor force statistics for Springfield, 84.3% of individuals (12,930) out of the total population between 25 and 64 years of age (15,338) are in the labor force, with 4.1% or 530 of them being unemployed. The group with the highest labor force participation rate are those with the educational attainment of bachelor's degree or higher, with 87.5% or 6,156 individuals in the labor force. Within the labor force, individuals with less than high school education have the highest percentage of unemployment, with 8.1% or 106 of them being unemployed.
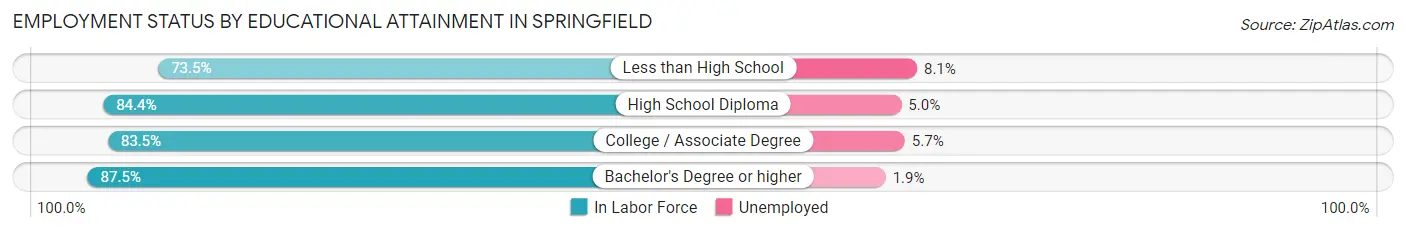
| Educational Attainment | In Labor Force | Unemployed |
| Less than High School | 1,314 (73.5%) | 145 (8.1%) |
| High School Diploma | 2,512 (84.4%) | 149 (5.0%) |
| College / Associate Degree | 2,955 (83.5%) | 202 (5.7%) |
| Bachelor's Degree or higher | 6,156 (87.5%) | 134 (1.9%) |
| Total | 12,930 (84.3%) | 629 (4.1%) |
Employment Occupations by Sex in Springfield
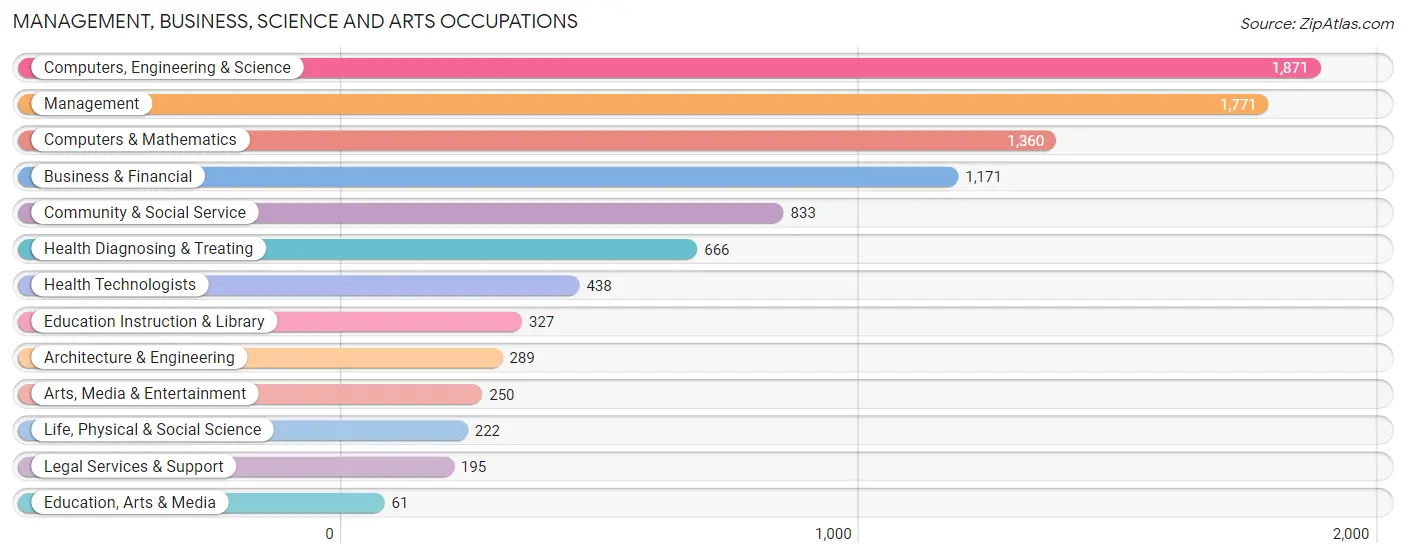
Management, Business, Science and Arts Occupations
The most common Management, Business, Science and Arts occupations in Springfield are Computers, Engineering & Science (1,871 | 12.4%), Management (1,771 | 11.8%), Computers & Mathematics (1,360 | 9.0%), Business & Financial (1,171 | 7.8%), and Community & Social Service (833 | 5.5%).
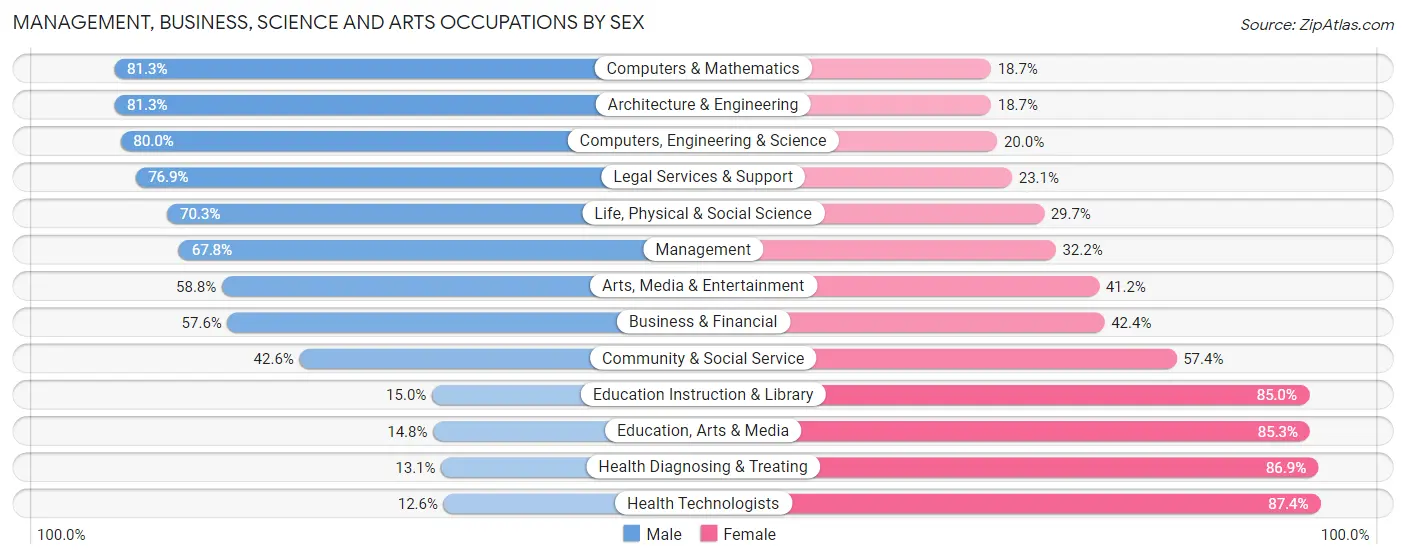
Management, Business, Science and Arts Occupations by Sex
Within the Management, Business, Science and Arts occupations in Springfield, the most male-oriented occupations are Computers & Mathematics (81.3%), Architecture & Engineering (81.3%), and Computers, Engineering & Science (80.0%), while the most female-oriented occupations are Health Technologists (87.4%), Health Diagnosing & Treating (86.9%), and Education, Arts & Media (85.3%).
| Occupation | Male | Female |
| Management | 1,201 (67.8%) | 570 (32.2%) |
| Business & Financial | 675 (57.6%) | 496 (42.4%) |
| Computers, Engineering & Science | 1,497 (80.0%) | 374 (20.0%) |
| Computers & Mathematics | 1,106 (81.3%) | 254 (18.7%) |
| Architecture & Engineering | 235 (81.3%) | 54 (18.7%) |
| Life, Physical & Social Science | 156 (70.3%) | 66 (29.7%) |
| Community & Social Service | 355 (42.6%) | 478 (57.4%) |
| Education, Arts & Media | 9 (14.7%) | 52 (85.3%) |
| Legal Services & Support | 150 (76.9%) | 45 (23.1%) |
| Education Instruction & Library | 49 (15.0%) | 278 (85.0%) |
| Arts, Media & Entertainment | 147 (58.8%) | 103 (41.2%) |
| Health Diagnosing & Treating | 87 (13.1%) | 579 (86.9%) |
| Health Technologists | 55 (12.6%) | 383 (87.4%) |
| Total (Category) | 3,815 (60.4%) | 2,497 (39.6%) |
| Total (Overall) | 8,523 (56.7%) | 6,523 (43.3%) |
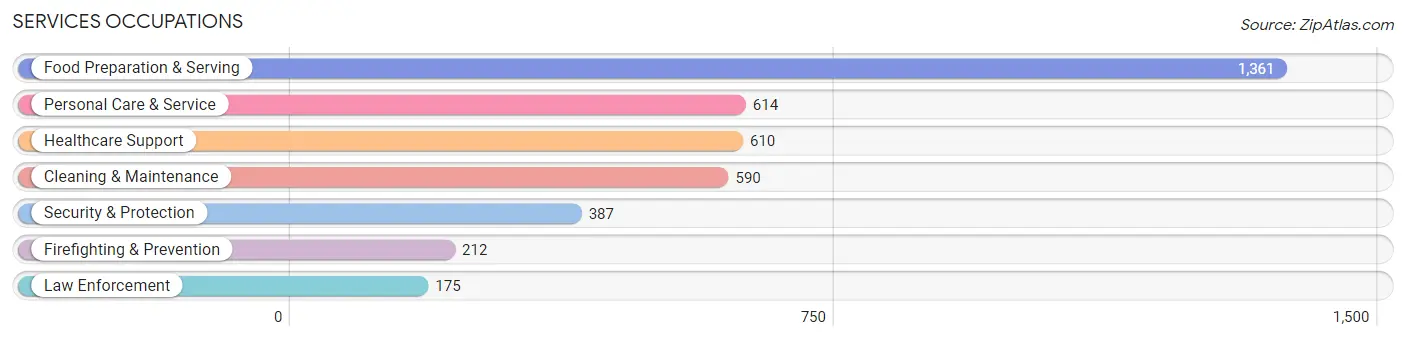
Services Occupations
The most common Services occupations in Springfield are Food Preparation & Serving (1,361 | 9.0%), Personal Care & Service (614 | 4.1%), Healthcare Support (610 | 4.1%), Cleaning & Maintenance (590 | 3.9%), and Security & Protection (387 | 2.6%).
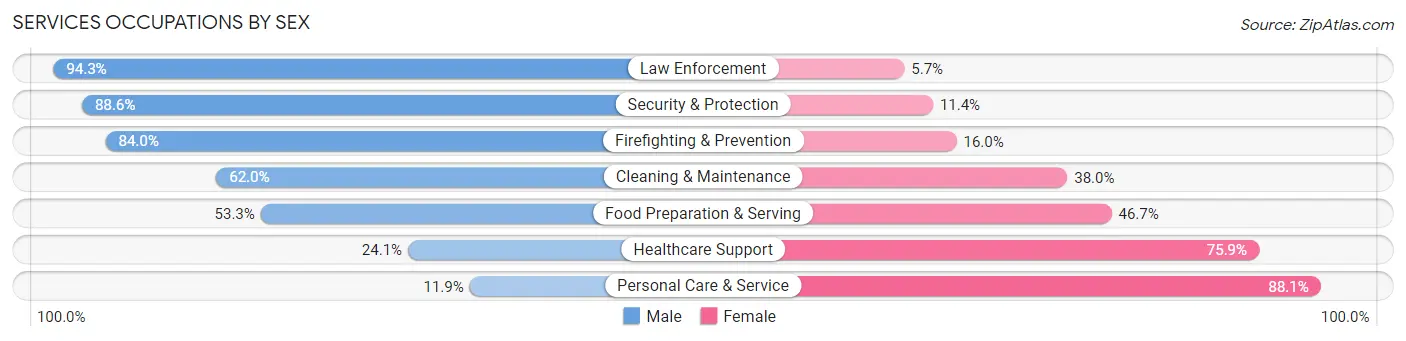
Services Occupations by Sex
Within the Services occupations in Springfield, the most male-oriented occupations are Law Enforcement (94.3%), Security & Protection (88.6%), and Firefighting & Prevention (84.0%), while the most female-oriented occupations are Personal Care & Service (88.1%), Healthcare Support (75.9%), and Food Preparation & Serving (46.7%).
| Occupation | Male | Female |
| Healthcare Support | 147 (24.1%) | 463 (75.9%) |
| Security & Protection | 343 (88.6%) | 44 (11.4%) |
| Firefighting & Prevention | 178 (84.0%) | 34 (16.0%) |
| Law Enforcement | 165 (94.3%) | 10 (5.7%) |
| Food Preparation & Serving | 725 (53.3%) | 636 (46.7%) |
| Cleaning & Maintenance | 366 (62.0%) | 224 (38.0%) |
| Personal Care & Service | 73 (11.9%) | 541 (88.1%) |
| Total (Category) | 1,654 (46.4%) | 1,908 (53.6%) |
| Total (Overall) | 8,523 (56.7%) | 6,523 (43.3%) |
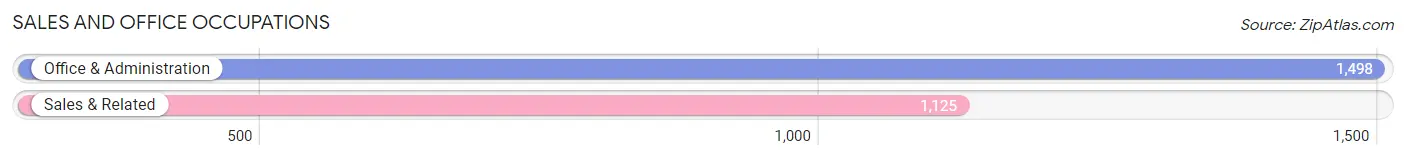
Sales and Office Occupations
The most common Sales and Office occupations in Springfield are Office & Administration (1,498 | 10.0%), and Sales & Related (1,125 | 7.5%).
Sales and Office Occupations by Sex
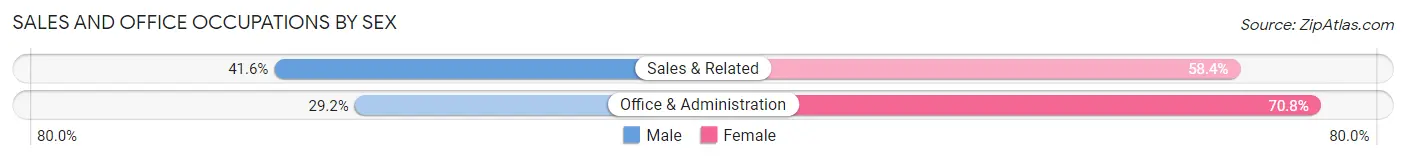
| Occupation | Male | Female |
| Sales & Related | 468 (41.6%) | 657 (58.4%) |
| Office & Administration | 438 (29.2%) | 1,060 (70.8%) |
| Total (Category) | 906 (34.5%) | 1,717 (65.5%) |
| Total (Overall) | 8,523 (56.7%) | 6,523 (43.3%) |
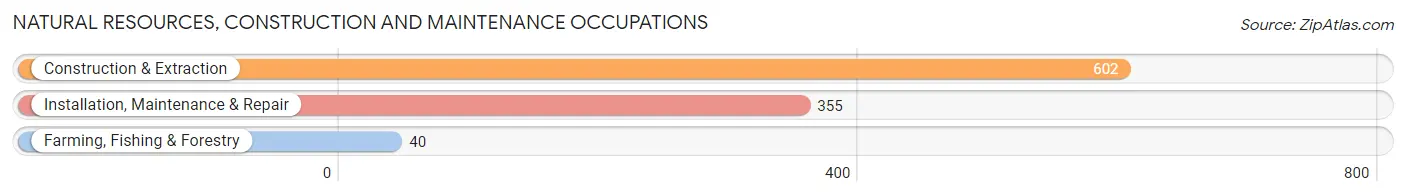
Natural Resources, Construction and Maintenance Occupations
The most common Natural Resources, Construction and Maintenance occupations in Springfield are Construction & Extraction (602 | 4.0%), Installation, Maintenance & Repair (355 | 2.4%), and Farming, Fishing & Forestry (40 | 0.3%).
Natural Resources, Construction and Maintenance Occupations by Sex
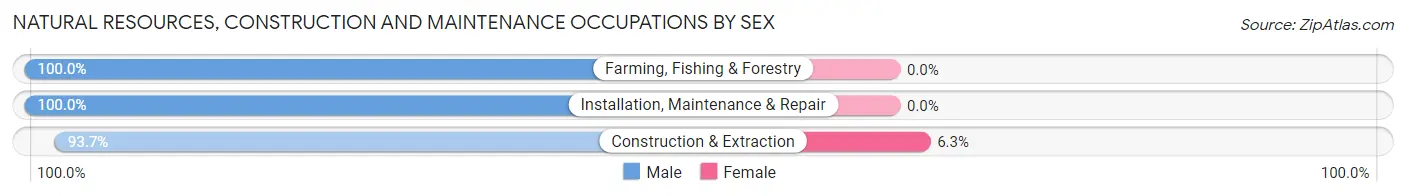
| Occupation | Male | Female |
| Farming, Fishing & Forestry | 40 (100.0%) | 0 (0.0%) |
| Construction & Extraction | 564 (93.7%) | 38 (6.3%) |
| Installation, Maintenance & Repair | 355 (100.0%) | 0 (0.0%) |
| Total (Category) | 959 (96.2%) | 38 (3.8%) |
| Total (Overall) | 8,523 (56.7%) | 6,523 (43.3%) |
Production, Transportation and Moving Occupations
The most common Production, Transportation and Moving occupations in Springfield are Transportation (856 | 5.7%), Production (498 | 3.3%), and Material Moving (198 | 1.3%).
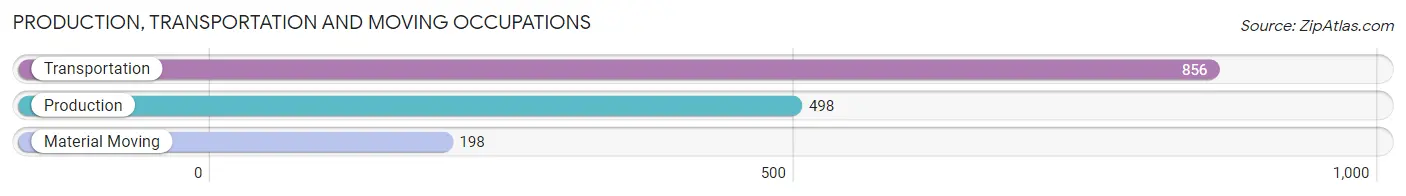
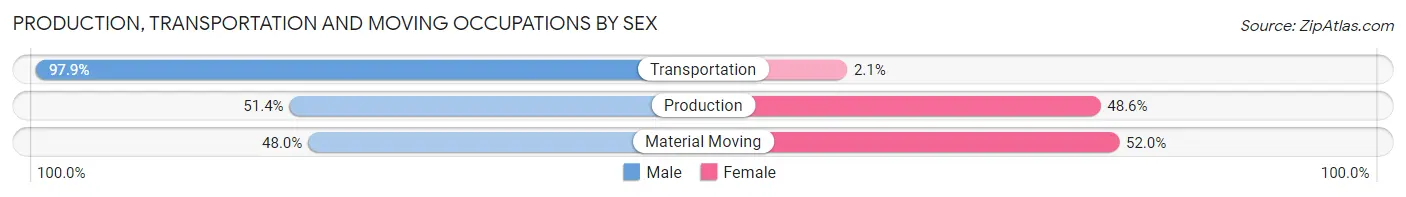
Production, Transportation and Moving Occupations by Sex
| Occupation | Male | Female |
| Production | 256 (51.4%) | 242 (48.6%) |
| Transportation | 838 (97.9%) | 18 (2.1%) |
| Material Moving | 95 (48.0%) | 103 (52.0%) |
| Total (Category) | 1,189 (76.6%) | 363 (23.4%) |
| Total (Overall) | 8,523 (56.7%) | 6,523 (43.3%) |
Employment Industries by Sex in Springfield
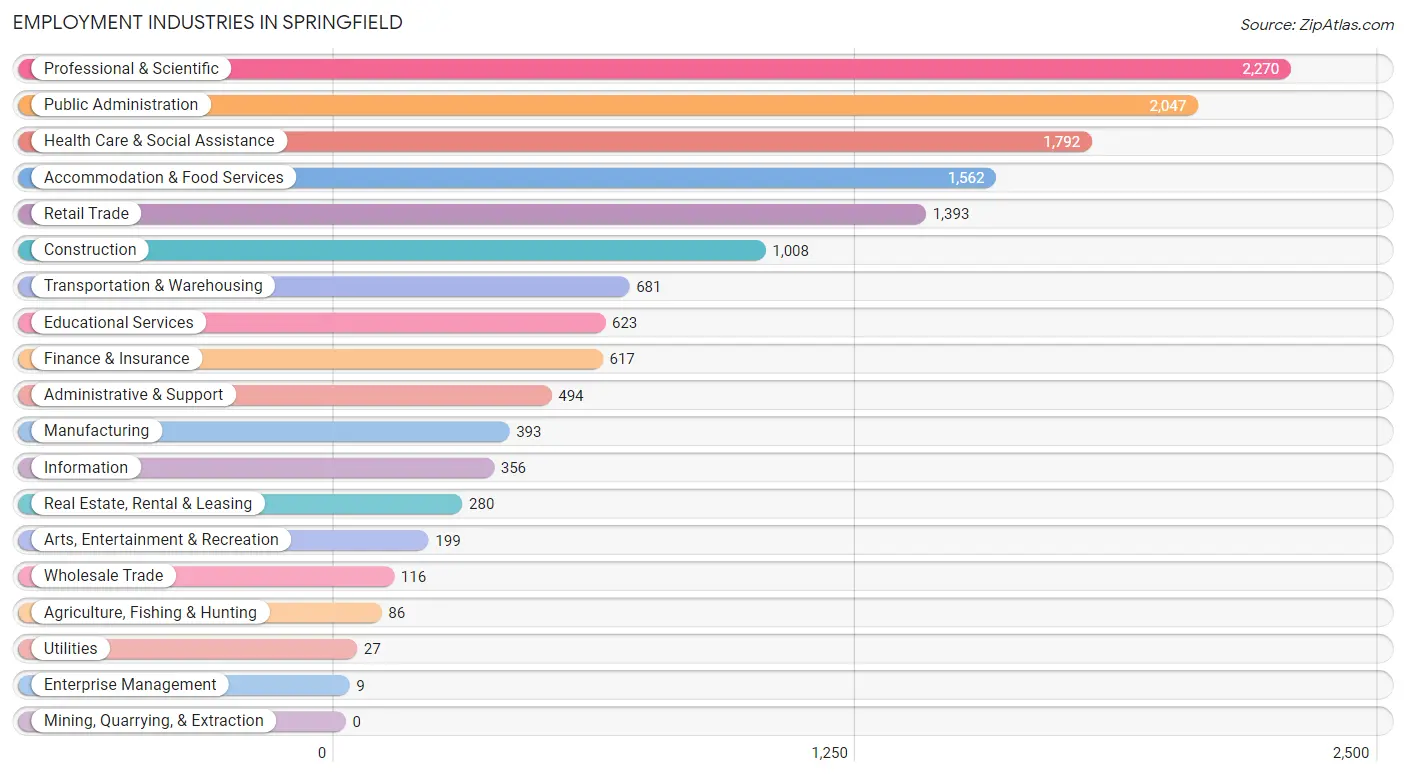
Employment Industries in Springfield
The major employment industries in Springfield include Professional & Scientific (2,270 | 15.1%), Public Administration (2,047 | 13.6%), Health Care & Social Assistance (1,792 | 11.9%), Accommodation & Food Services (1,562 | 10.4%), and Retail Trade (1,393 | 9.3%).
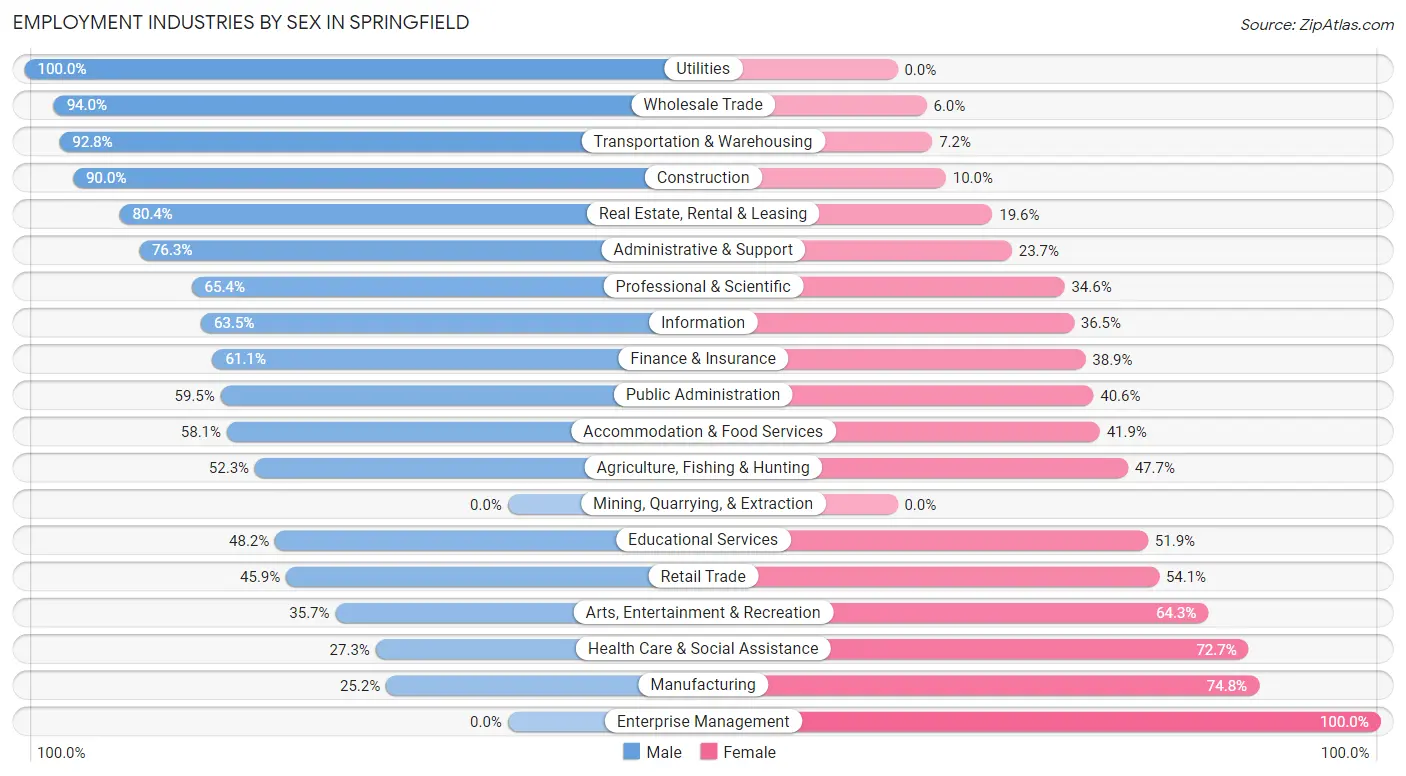
Employment Industries by Sex in Springfield
The Springfield industries that see more men than women are Utilities (100.0%), Wholesale Trade (94.0%), and Transportation & Warehousing (92.8%), whereas the industries that tend to have a higher number of women are Enterprise Management (100.0%), Manufacturing (74.8%), and Health Care & Social Assistance (72.7%).
| Industry | Male | Female |
| Agriculture, Fishing & Hunting | 45 (52.3%) | 41 (47.7%) |
| Mining, Quarrying, & Extraction | 0 (0.0%) | 0 (0.0%) |
| Construction | 907 (90.0%) | 101 (10.0%) |
| Manufacturing | 99 (25.2%) | 294 (74.8%) |
| Wholesale Trade | 109 (94.0%) | 7 (6.0%) |
| Retail Trade | 639 (45.9%) | 754 (54.1%) |
| Transportation & Warehousing | 632 (92.8%) | 49 (7.2%) |
| Utilities | 27 (100.0%) | 0 (0.0%) |
| Information | 226 (63.5%) | 130 (36.5%) |
| Finance & Insurance | 377 (61.1%) | 240 (38.9%) |
| Real Estate, Rental & Leasing | 225 (80.4%) | 55 (19.6%) |
| Professional & Scientific | 1,485 (65.4%) | 785 (34.6%) |
| Enterprise Management | 0 (0.0%) | 9 (100.0%) |
| Administrative & Support | 377 (76.3%) | 117 (23.7%) |
| Educational Services | 300 (48.1%) | 323 (51.8%) |
| Health Care & Social Assistance | 490 (27.3%) | 1,302 (72.7%) |
| Arts, Entertainment & Recreation | 71 (35.7%) | 128 (64.3%) |
| Accommodation & Food Services | 908 (58.1%) | 654 (41.9%) |
| Public Administration | 1,217 (59.5%) | 830 (40.6%) |
| Total | 8,523 (56.7%) | 6,523 (43.3%) |
Education in Springfield
School Enrollment in Springfield
The most common levels of schooling among the 6,809 students in Springfield are college / undergraduate (1,980 | 29.1%), high school (1,572 | 23.1%), and middle school (1,100 | 16.2%).
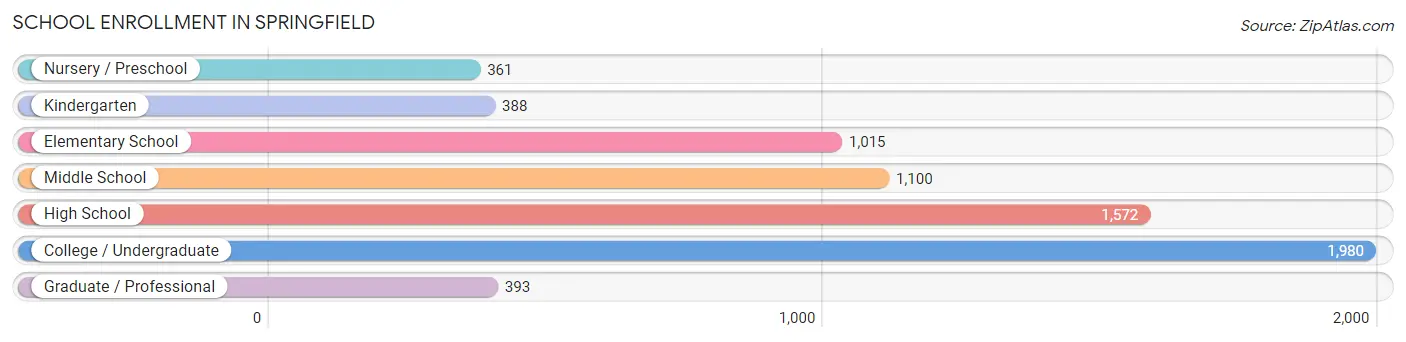
| School Level | # Students | % Students |
| Nursery / Preschool | 361 | 5.3% |
| Kindergarten | 388 | 5.7% |
| Elementary School | 1,015 | 14.9% |
| Middle School | 1,100 | 16.2% |
| High School | 1,572 | 23.1% |
| College / Undergraduate | 1,980 | 29.1% |
| Graduate / Professional | 393 | 5.8% |
| Total | 6,809 | 100.0% |
School Enrollment by Age by Funding Source in Springfield
Out of a total of 6,809 students who are enrolled in schools in Springfield, 1,423 (20.9%) attend a private institution, while the remaining 5,386 (79.1%) are enrolled in public schools. The age group of 3 to 4 year olds has the highest likelihood of being enrolled in private schools, with 166 (42.2% in the age bracket) enrolled. Conversely, the age group of 18 to 19 year olds has the lowest likelihood of being enrolled in a private school, with 358 (98.9% in the age bracket) attending a public institution.
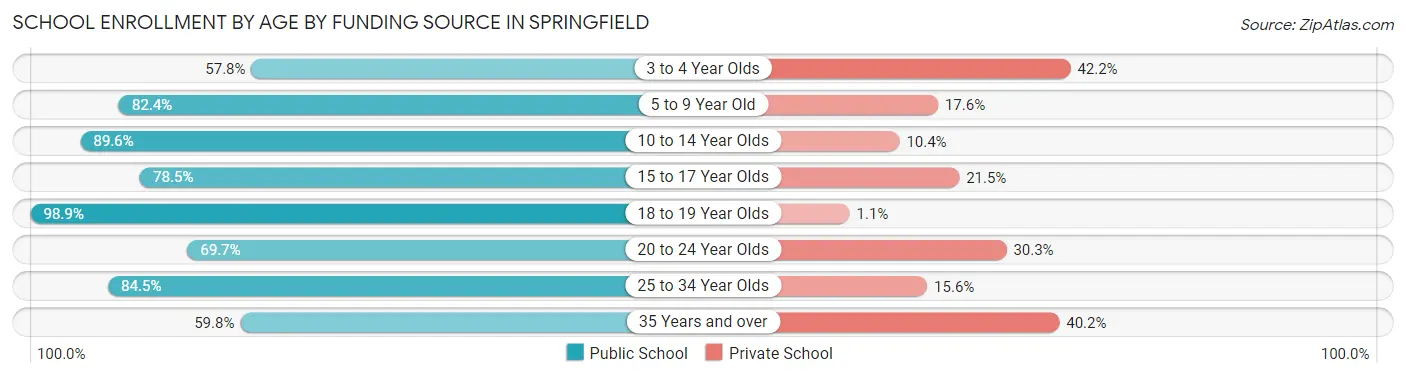
| Age Bracket | Public School | Private School |
| 3 to 4 Year Olds | 227 (57.8%) | 166 (42.2%) |
| 5 to 9 Year Old | 1,051 (82.4%) | 224 (17.6%) |
| 10 to 14 Year Olds | 1,354 (89.6%) | 157 (10.4%) |
| 15 to 17 Year Olds | 795 (78.5%) | 218 (21.5%) |
| 18 to 19 Year Olds | 358 (98.9%) | 4 (1.1%) |
| 20 to 24 Year Olds | 832 (69.7%) | 362 (30.3%) |
| 25 to 34 Year Olds | 467 (84.5%) | 86 (15.5%) |
| 35 Years and over | 304 (59.8%) | 204 (40.2%) |
| Total | 5,386 (79.1%) | 1,423 (20.9%) |
Educational Attainment by Field of Study in Springfield
Business (2,436 | 22.4%), social sciences (1,203 | 11.1%), computers & mathematics (1,191 | 11.0%), engineering (1,133 | 10.4%), and liberal arts & history (849 | 7.8%) are the most common fields of study among 10,872 individuals in Springfield who have obtained a bachelor's degree or higher.
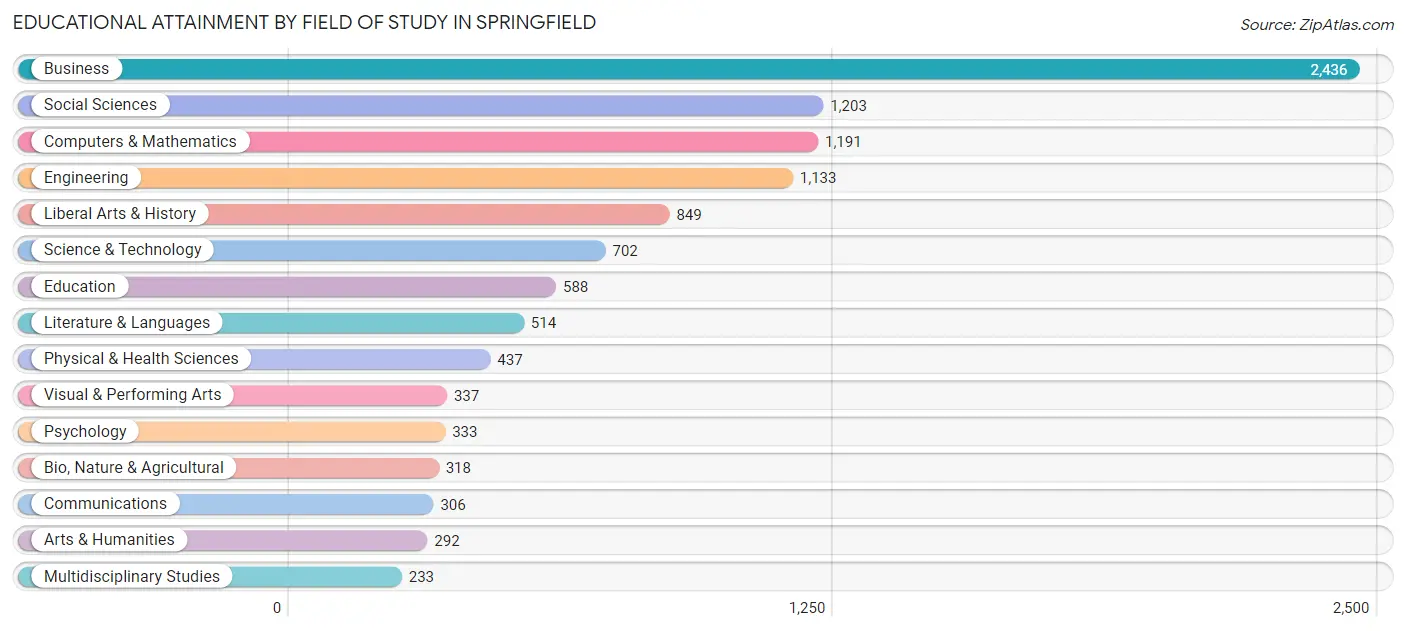
| Field of Study | # Graduates | % Graduates |
| Computers & Mathematics | 1,191 | 11.0% |
| Bio, Nature & Agricultural | 318 | 2.9% |
| Physical & Health Sciences | 437 | 4.0% |
| Psychology | 333 | 3.1% |
| Social Sciences | 1,203 | 11.1% |
| Engineering | 1,133 | 10.4% |
| Multidisciplinary Studies | 233 | 2.1% |
| Science & Technology | 702 | 6.5% |
| Business | 2,436 | 22.4% |
| Education | 588 | 5.4% |
| Literature & Languages | 514 | 4.7% |
| Liberal Arts & History | 849 | 7.8% |
| Visual & Performing Arts | 337 | 3.1% |
| Communications | 306 | 2.8% |
| Arts & Humanities | 292 | 2.7% |
| Total | 10,872 | 100.0% |
Transportation & Commute in Springfield
Vehicle Availability by Sex in Springfield
The most prevalent vehicle ownership categories in Springfield are males with 2 vehicles (3,319, accounting for 38.4%) and females with 2 vehicles (2,458, making up 51.6%).
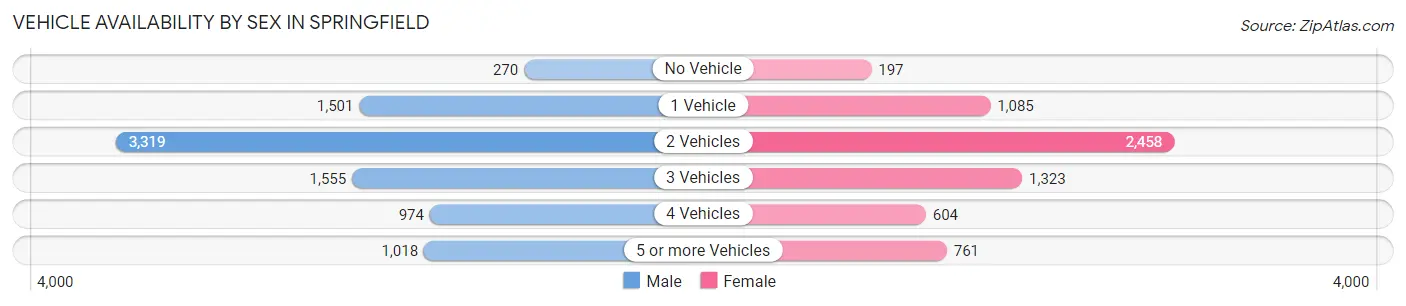
| Vehicles Available | Male | Female |
| No Vehicle | 270 (3.1%) | 197 (3.1%) |
| 1 Vehicle | 1,501 (17.4%) | 1,085 (16.9%) |
| 2 Vehicles | 3,319 (38.4%) | 2,458 (38.2%) |
| 3 Vehicles | 1,555 (18.0%) | 1,323 (20.6%) |
| 4 Vehicles | 974 (11.3%) | 604 (9.4%) |
| 5 or more Vehicles | 1,018 (11.8%) | 761 (11.8%) |
| Total | 8,637 (100.0%) | 6,428 (100.0%) |
Commute Time in Springfield
The most frequently occuring commute durations in Springfield are 30 to 34 minutes (3,092 commuters, 23.6%), 20 to 24 minutes (1,887 commuters, 14.4%), and 15 to 19 minutes (1,550 commuters, 11.8%).
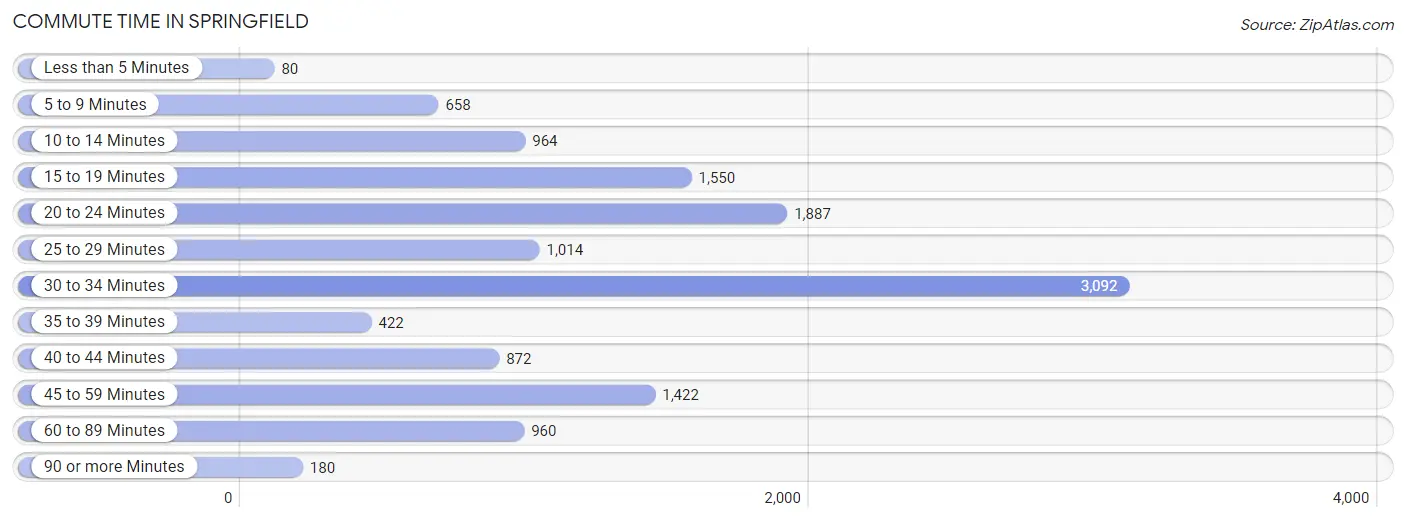
| Commute Time | # Commuters | % Commuters |
| Less than 5 Minutes | 80 | 0.6% |
| 5 to 9 Minutes | 658 | 5.0% |
| 10 to 14 Minutes | 964 | 7.4% |
| 15 to 19 Minutes | 1,550 | 11.8% |
| 20 to 24 Minutes | 1,887 | 14.4% |
| 25 to 29 Minutes | 1,014 | 7.7% |
| 30 to 34 Minutes | 3,092 | 23.6% |
| 35 to 39 Minutes | 422 | 3.2% |
| 40 to 44 Minutes | 872 | 6.7% |
| 45 to 59 Minutes | 1,422 | 10.8% |
| 60 to 89 Minutes | 960 | 7.3% |
| 90 or more Minutes | 180 | 1.4% |
Commute Time by Sex in Springfield
The most common commute times in Springfield are 30 to 34 minutes (1,685 commuters, 22.9%) for males and 30 to 34 minutes (1,407 commuters, 24.5%) for females.
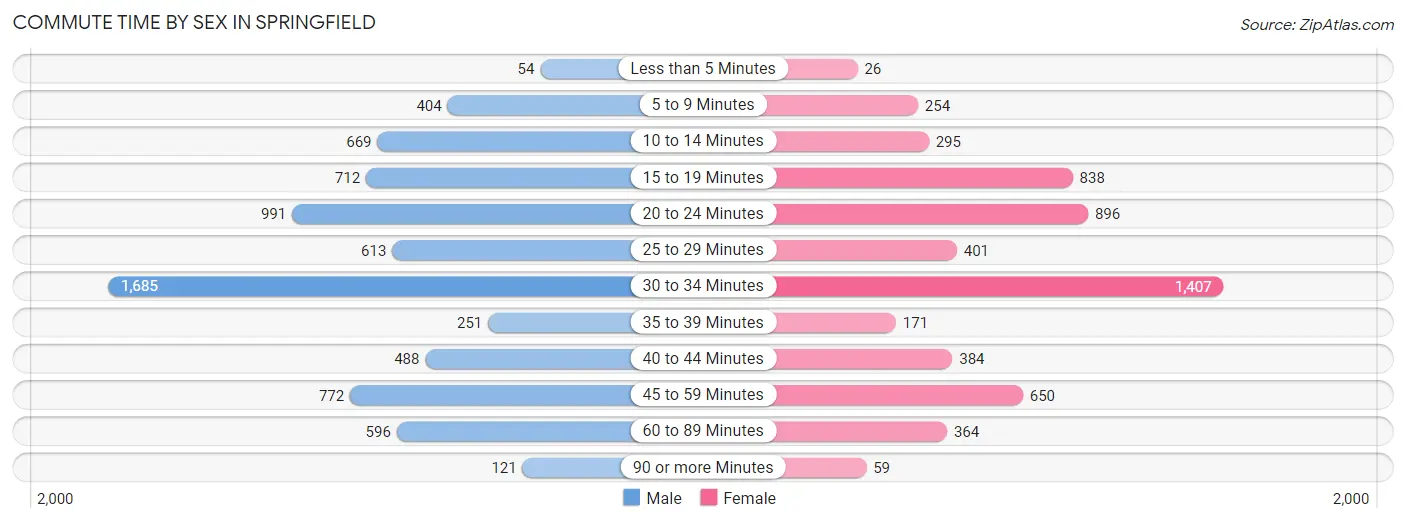
| Commute Time | Male | Female |
| Less than 5 Minutes | 54 (0.7%) | 26 (0.4%) |
| 5 to 9 Minutes | 404 (5.5%) | 254 (4.4%) |
| 10 to 14 Minutes | 669 (9.1%) | 295 (5.1%) |
| 15 to 19 Minutes | 712 (9.7%) | 838 (14.6%) |
| 20 to 24 Minutes | 991 (13.5%) | 896 (15.6%) |
| 25 to 29 Minutes | 613 (8.3%) | 401 (7.0%) |
| 30 to 34 Minutes | 1,685 (22.9%) | 1,407 (24.5%) |
| 35 to 39 Minutes | 251 (3.4%) | 171 (3.0%) |
| 40 to 44 Minutes | 488 (6.6%) | 384 (6.7%) |
| 45 to 59 Minutes | 772 (10.5%) | 650 (11.3%) |
| 60 to 89 Minutes | 596 (8.1%) | 364 (6.3%) |
| 90 or more Minutes | 121 (1.6%) | 59 (1.0%) |
Time of Departure to Work by Sex in Springfield
The most frequent times of departure to work in Springfield are 7:00 AM to 7:29 AM (1,106, 15.0%) for males and 8:00 AM to 8:29 AM (892, 15.5%) for females.
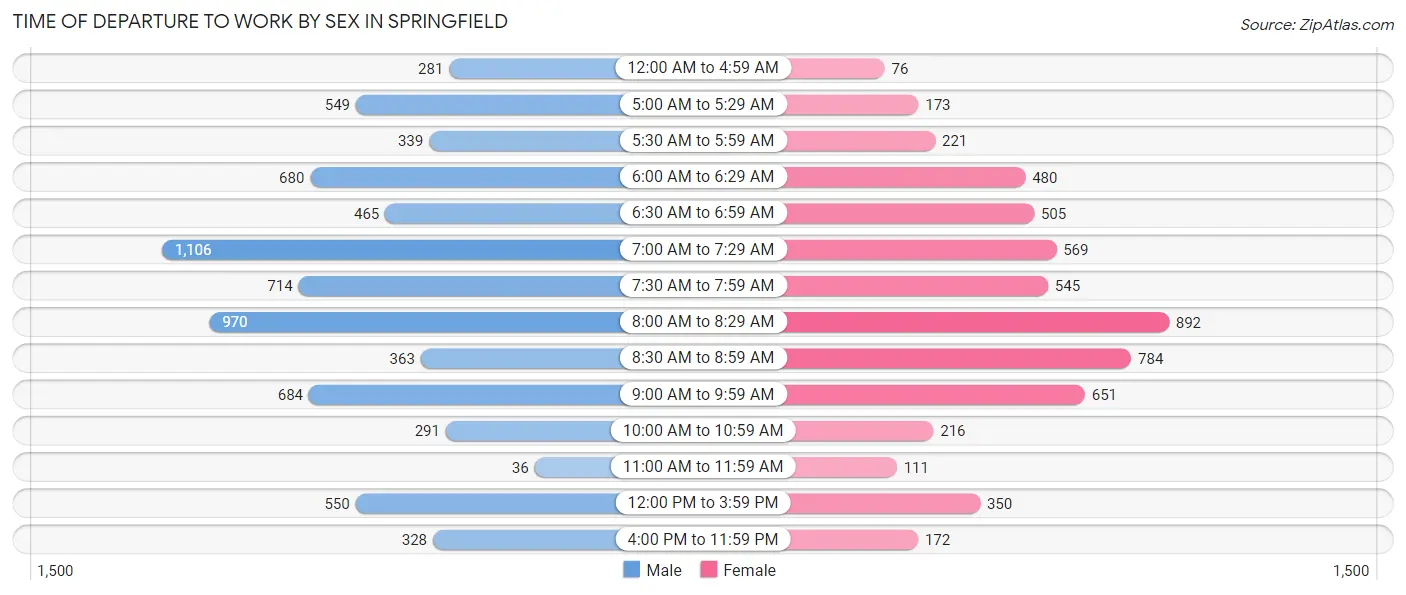
| Time of Departure | Male | Female |
| 12:00 AM to 4:59 AM | 281 (3.8%) | 76 (1.3%) |
| 5:00 AM to 5:29 AM | 549 (7.5%) | 173 (3.0%) |
| 5:30 AM to 5:59 AM | 339 (4.6%) | 221 (3.8%) |
| 6:00 AM to 6:29 AM | 680 (9.2%) | 480 (8.4%) |
| 6:30 AM to 6:59 AM | 465 (6.3%) | 505 (8.8%) |
| 7:00 AM to 7:29 AM | 1,106 (15.0%) | 569 (9.9%) |
| 7:30 AM to 7:59 AM | 714 (9.7%) | 545 (9.5%) |
| 8:00 AM to 8:29 AM | 970 (13.2%) | 892 (15.5%) |
| 8:30 AM to 8:59 AM | 363 (4.9%) | 784 (13.7%) |
| 9:00 AM to 9:59 AM | 684 (9.3%) | 651 (11.3%) |
| 10:00 AM to 10:59 AM | 291 (4.0%) | 216 (3.8%) |
| 11:00 AM to 11:59 AM | 36 (0.5%) | 111 (1.9%) |
| 12:00 PM to 3:59 PM | 550 (7.5%) | 350 (6.1%) |
| 4:00 PM to 11:59 PM | 328 (4.5%) | 172 (3.0%) |
| Total | 7,356 (100.0%) | 5,745 (100.0%) |
Housing Occupancy in Springfield
Occupancy by Ownership in Springfield
Of the total 10,567 dwellings in Springfield, owner-occupied units account for 6,985 (66.1%), while renter-occupied units make up 3,582 (33.9%).
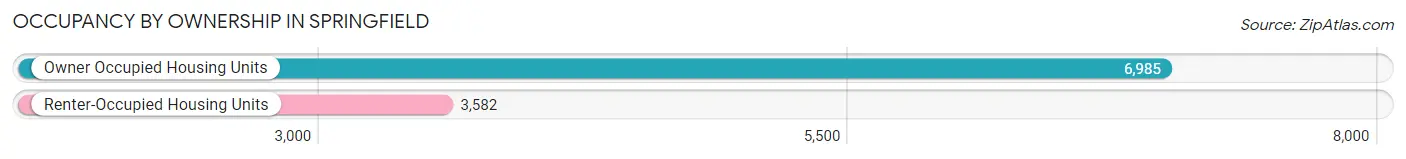
| Occupancy | # Housing Units | % Housing Units |
| Owner Occupied Housing Units | 6,985 | 66.1% |
| Renter-Occupied Housing Units | 3,582 | 33.9% |
| Total Occupied Housing Units | 10,567 | 100.0% |
Occupancy by Household Size in Springfield
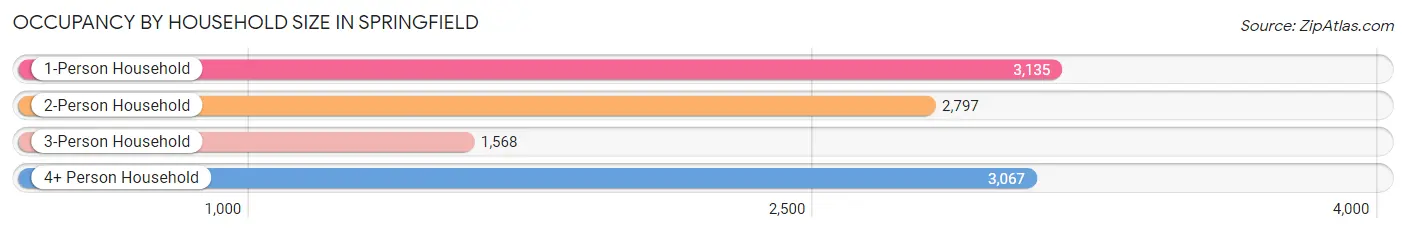
| Household Size | # Housing Units | % Housing Units |
| 1-Person Household | 3,135 | 29.7% |
| 2-Person Household | 2,797 | 26.5% |
| 3-Person Household | 1,568 | 14.8% |
| 4+ Person Household | 3,067 | 29.0% |
| Total Housing Units | 10,567 | 100.0% |
Occupancy by Ownership by Household Size in Springfield
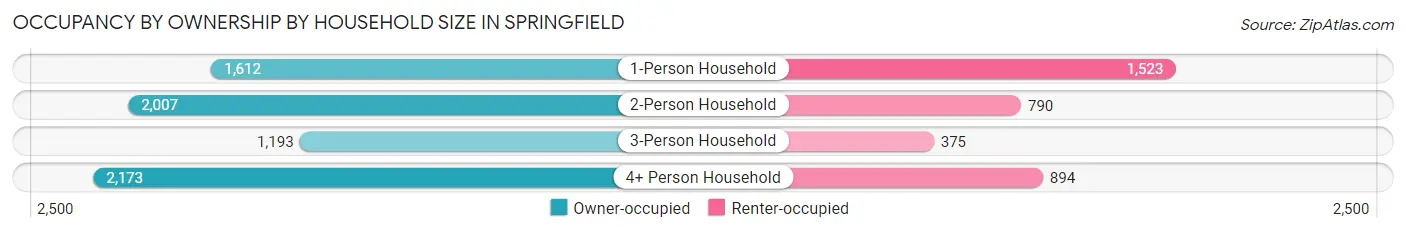
| Household Size | Owner-occupied | Renter-occupied |
| 1-Person Household | 1,612 (51.4%) | 1,523 (48.6%) |
| 2-Person Household | 2,007 (71.8%) | 790 (28.2%) |
| 3-Person Household | 1,193 (76.1%) | 375 (23.9%) |
| 4+ Person Household | 2,173 (70.9%) | 894 (29.1%) |
| Total Housing Units | 6,985 (66.1%) | 3,582 (33.9%) |
Occupancy by Educational Attainment in Springfield
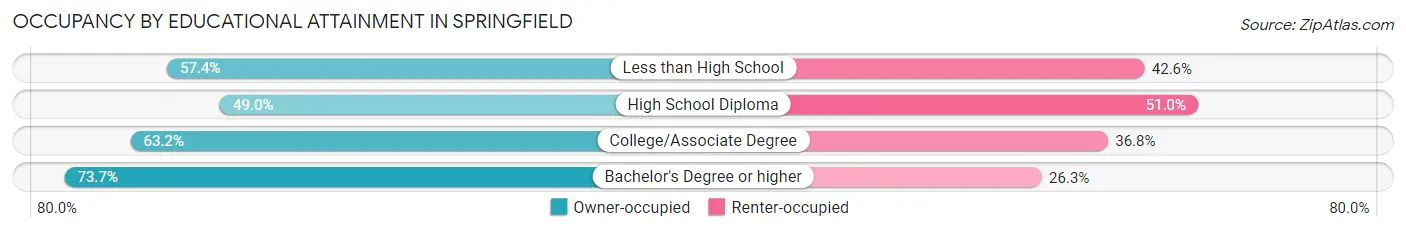
| Household Size | Owner-occupied | Renter-occupied |
| Less than High School | 630 (57.4%) | 468 (42.6%) |
| High School Diploma | 722 (49.0%) | 752 (51.0%) |
| College/Associate Degree | 1,548 (63.2%) | 902 (36.8%) |
| Bachelor's Degree or higher | 4,085 (73.7%) | 1,460 (26.3%) |
Occupancy by Age of Householder in Springfield
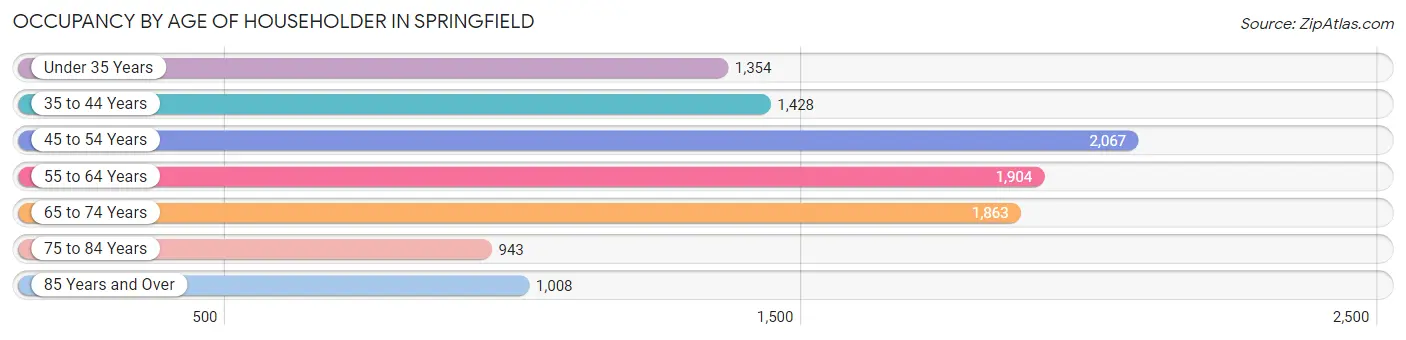
| Age Bracket | # Households | % Households |
| Under 35 Years | 1,354 | 12.8% |
| 35 to 44 Years | 1,428 | 13.5% |
| 45 to 54 Years | 2,067 | 19.6% |
| 55 to 64 Years | 1,904 | 18.0% |
| 65 to 74 Years | 1,863 | 17.6% |
| 75 to 84 Years | 943 | 8.9% |
| 85 Years and Over | 1,008 | 9.5% |
| Total | 10,567 | 100.0% |
Housing Finances in Springfield
Median Income by Occupancy in Springfield
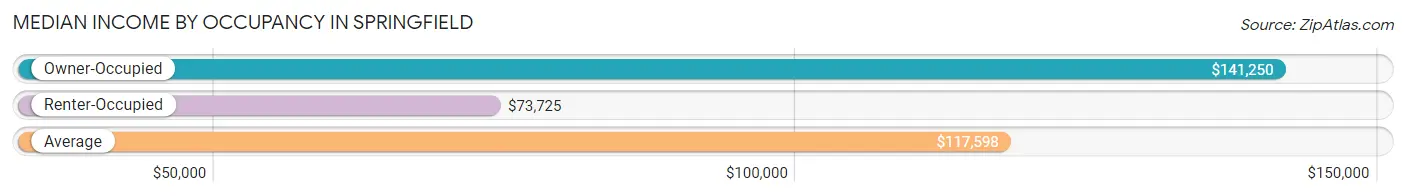
| Occupancy Type | # Households | Median Income |
| Owner-Occupied | 6,985 (66.1%) | $141,250 |
| Renter-Occupied | 3,582 (33.9%) | $73,725 |
| Average | 10,567 (100.0%) | $117,598 |
Occupancy by Householder Income Bracket in Springfield
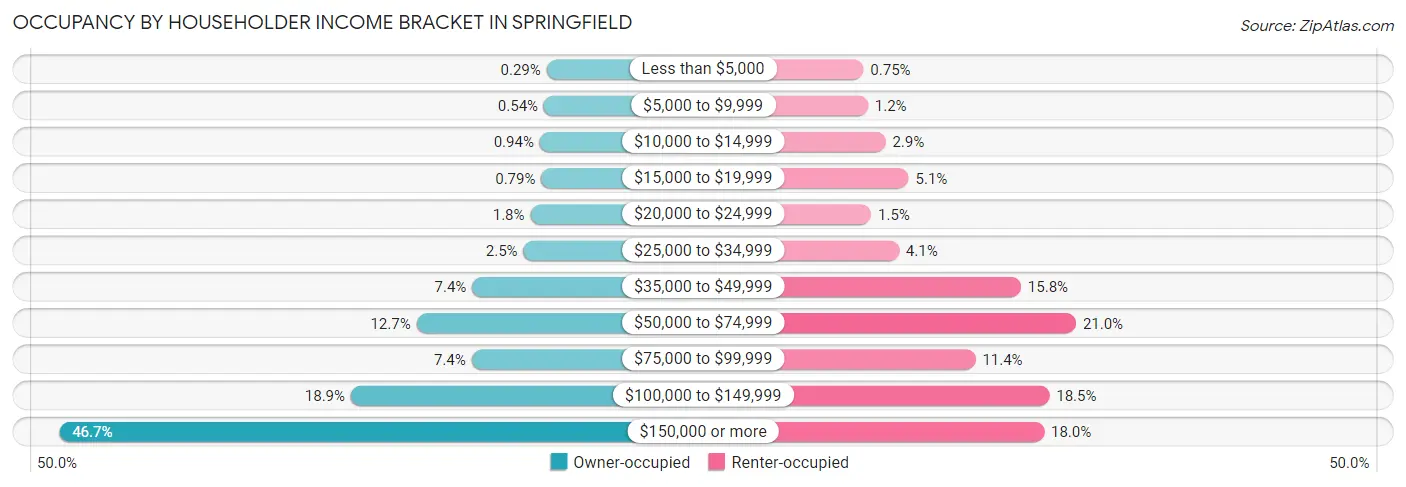
| Income Bracket | Owner-occupied | Renter-occupied |
| Less than $5,000 | 20 (0.3%) | 27 (0.7%) |
| $5,000 to $9,999 | 38 (0.5%) | 42 (1.2%) |
| $10,000 to $14,999 | 66 (0.9%) | 102 (2.9%) |
| $15,000 to $19,999 | 55 (0.8%) | 181 (5.1%) |
| $20,000 to $24,999 | 128 (1.8%) | 53 (1.5%) |
| $25,000 to $34,999 | 174 (2.5%) | 148 (4.1%) |
| $35,000 to $49,999 | 515 (7.4%) | 564 (15.8%) |
| $50,000 to $74,999 | 886 (12.7%) | 752 (21.0%) |
| $75,000 to $99,999 | 519 (7.4%) | 409 (11.4%) |
| $100,000 to $149,999 | 1,322 (18.9%) | 661 (18.4%) |
| $150,000 or more | 3,262 (46.7%) | 643 (17.9%) |
| Total | 6,985 (100.0%) | 3,582 (100.0%) |
Monthly Housing Cost Tiers in Springfield
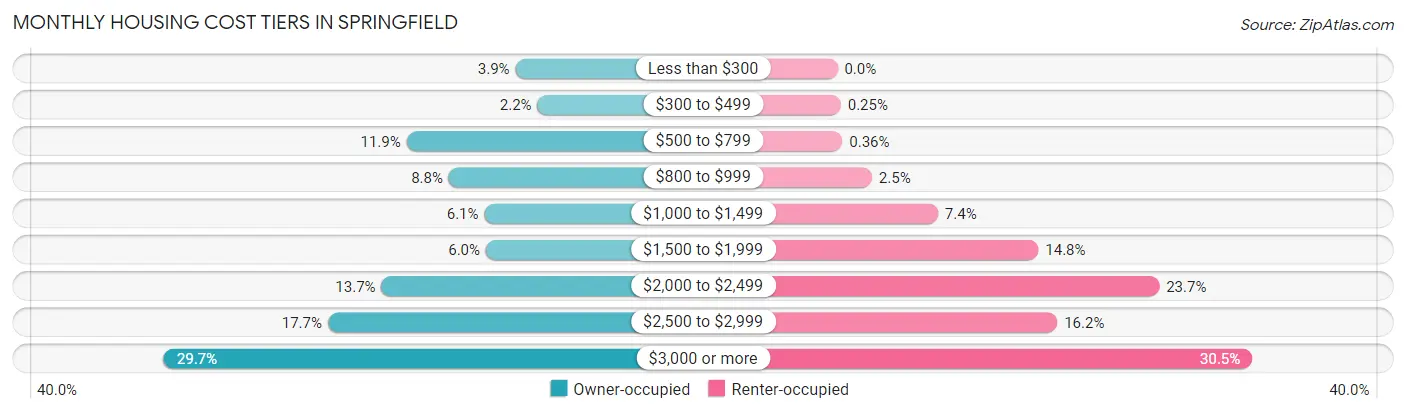
| Monthly Cost | Owner-occupied | Renter-occupied |
| Less than $300 | 269 (3.8%) | 0 (0.0%) |
| $300 to $499 | 156 (2.2%) | 9 (0.3%) |
| $500 to $799 | 829 (11.9%) | 13 (0.4%) |
| $800 to $999 | 612 (8.8%) | 91 (2.5%) |
| $1,000 to $1,499 | 429 (6.1%) | 265 (7.4%) |
| $1,500 to $1,999 | 421 (6.0%) | 530 (14.8%) |
| $2,000 to $2,499 | 958 (13.7%) | 849 (23.7%) |
| $2,500 to $2,999 | 1,234 (17.7%) | 580 (16.2%) |
| $3,000 or more | 2,077 (29.7%) | 1,094 (30.5%) |
| Total | 6,985 (100.0%) | 3,582 (100.0%) |
Physical Housing Characteristics in Springfield
Housing Structures in Springfield
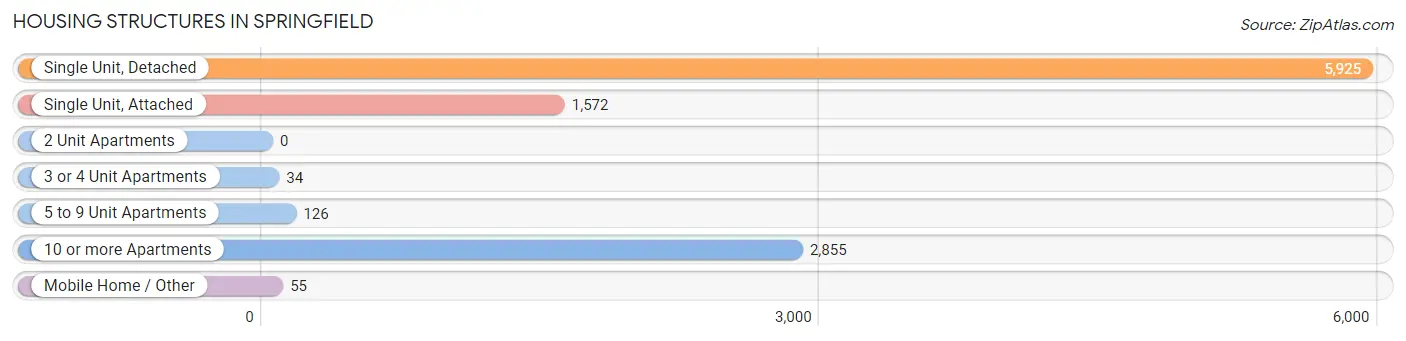
| Structure Type | # Housing Units | % Housing Units |
| Single Unit, Detached | 5,925 | 56.1% |
| Single Unit, Attached | 1,572 | 14.9% |
| 2 Unit Apartments | 0 | 0.0% |
| 3 or 4 Unit Apartments | 34 | 0.3% |
| 5 to 9 Unit Apartments | 126 | 1.2% |
| 10 or more Apartments | 2,855 | 27.0% |
| Mobile Home / Other | 55 | 0.5% |
| Total | 10,567 | 100.0% |
Housing Structures by Occupancy in Springfield
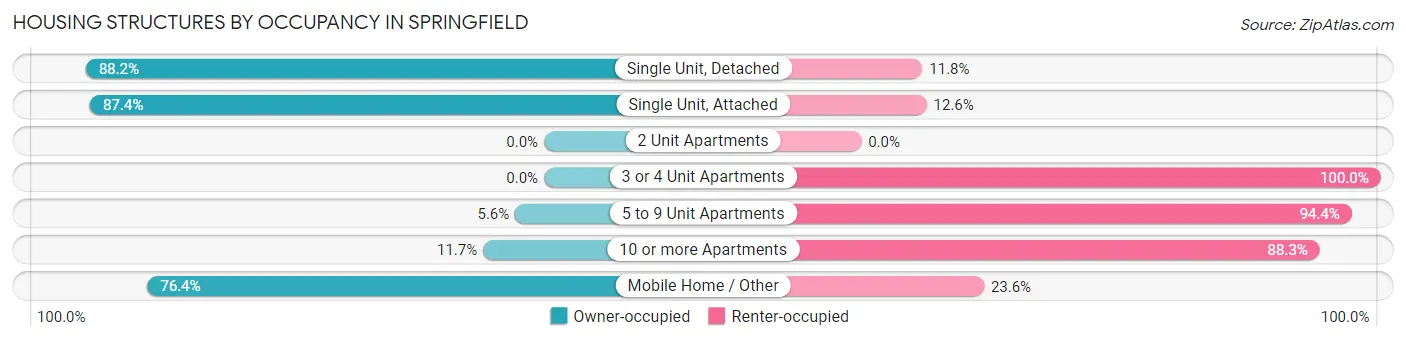
| Structure Type | Owner-occupied | Renter-occupied |
| Single Unit, Detached | 5,227 (88.2%) | 698 (11.8%) |
| Single Unit, Attached | 1,374 (87.4%) | 198 (12.6%) |
| 2 Unit Apartments | 0 (0.0%) | 0 (0.0%) |
| 3 or 4 Unit Apartments | 0 (0.0%) | 34 (100.0%) |
| 5 to 9 Unit Apartments | 7 (5.6%) | 119 (94.4%) |
| 10 or more Apartments | 335 (11.7%) | 2,520 (88.3%) |
| Mobile Home / Other | 42 (76.4%) | 13 (23.6%) |
| Total | 6,985 (66.1%) | 3,582 (33.9%) |
Housing Structures by Number of Rooms in Springfield
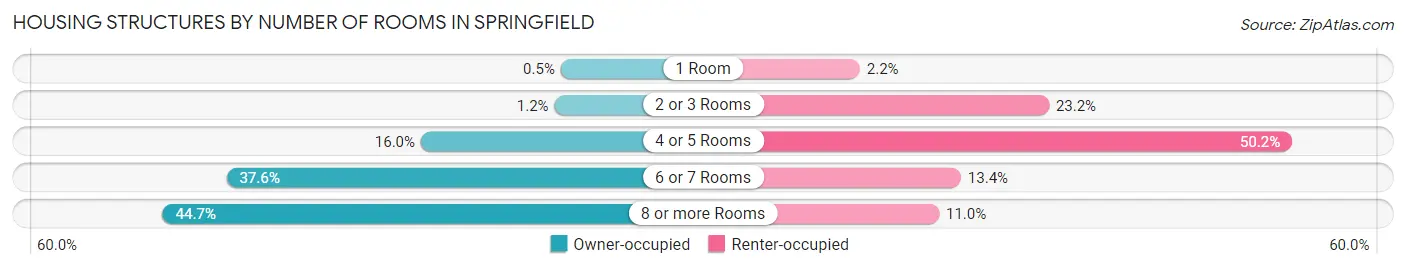
| Number of Rooms | Owner-occupied | Renter-occupied |
| 1 Room | 35 (0.5%) | 79 (2.2%) |
| 2 or 3 Rooms | 84 (1.2%) | 831 (23.2%) |
| 4 or 5 Rooms | 1,119 (16.0%) | 1,797 (50.2%) |
| 6 or 7 Rooms | 2,626 (37.6%) | 481 (13.4%) |
| 8 or more Rooms | 3,121 (44.7%) | 394 (11.0%) |
| Total | 6,985 (100.0%) | 3,582 (100.0%) |
Housing Structure by Heating Type in Springfield
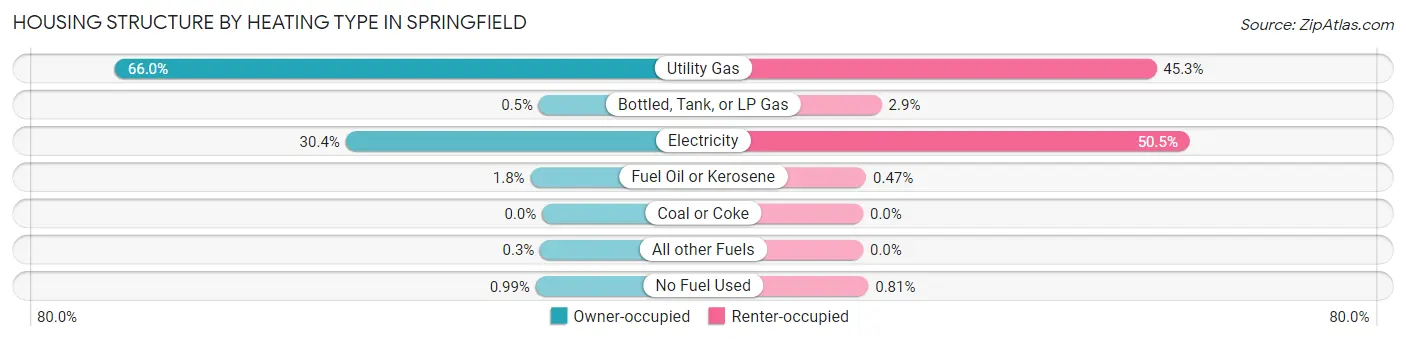
| Heating Type | Owner-occupied | Renter-occupied |
| Utility Gas | 4,613 (66.0%) | 1,624 (45.3%) |
| Bottled, Tank, or LP Gas | 35 (0.5%) | 103 (2.9%) |
| Electricity | 2,121 (30.4%) | 1,809 (50.5%) |
| Fuel Oil or Kerosene | 126 (1.8%) | 17 (0.5%) |
| Coal or Coke | 0 (0.0%) | 0 (0.0%) |
| All other Fuels | 21 (0.3%) | 0 (0.0%) |
| No Fuel Used | 69 (1.0%) | 29 (0.8%) |
| Total | 6,985 (100.0%) | 3,582 (100.0%) |
Household Vehicle Usage in Springfield
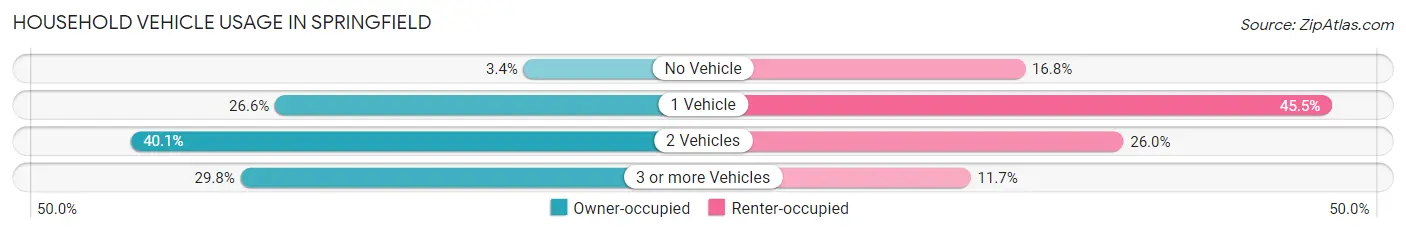
| Vehicles per Household | Owner-occupied | Renter-occupied |
| No Vehicle | 238 (3.4%) | 602 (16.8%) |
| 1 Vehicle | 1,859 (26.6%) | 1,629 (45.5%) |
| 2 Vehicles | 2,804 (40.1%) | 931 (26.0%) |
| 3 or more Vehicles | 2,084 (29.8%) | 420 (11.7%) |
| Total | 6,985 (100.0%) | 3,582 (100.0%) |
Real Estate & Mortgages in Springfield
Real Estate and Mortgage Overview in Springfield
| Characteristic | Without Mortgage | With Mortgage |
| Housing Units | 2,220 | 4,765 |
| Median Property Value | $573,100 | $603,600 |
| Median Household Income | $114,118 | $2,464 |
| Monthly Housing Costs | $782 | $2,023 |
| Real Estate Taxes | $6,064 | $49 |
Property Value by Mortgage Status in Springfield
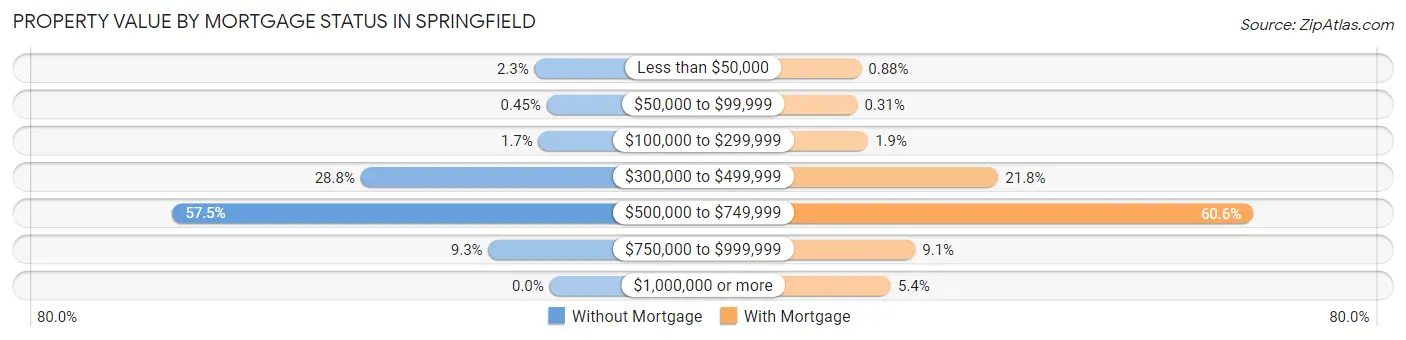
| Property Value | Without Mortgage | With Mortgage |
| Less than $50,000 | 51 (2.3%) | 42 (0.9%) |
| $50,000 to $99,999 | 10 (0.4%) | 15 (0.3%) |
| $100,000 to $299,999 | 37 (1.7%) | 92 (1.9%) |
| $300,000 to $499,999 | 639 (28.8%) | 1,037 (21.8%) |
| $500,000 to $749,999 | 1,276 (57.5%) | 2,887 (60.6%) |
| $750,000 to $999,999 | 207 (9.3%) | 434 (9.1%) |
| $1,000,000 or more | 0 (0.0%) | 258 (5.4%) |
| Total | 2,220 (100.0%) | 4,765 (100.0%) |
Household Income by Mortgage Status in Springfield
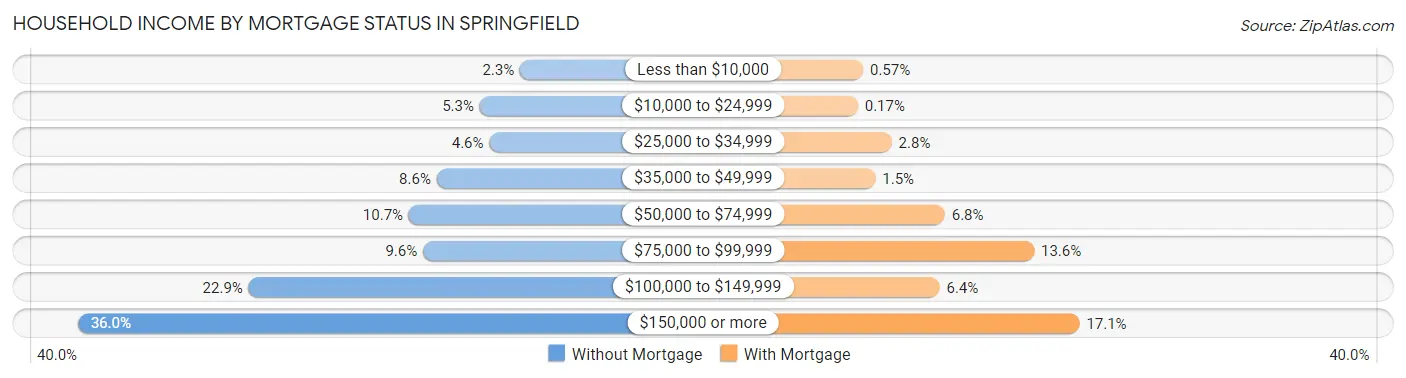
| Household Income | Without Mortgage | With Mortgage |
| Less than $10,000 | 50 (2.2%) | 27 (0.6%) |
| $10,000 to $24,999 | 118 (5.3%) | 8 (0.2%) |
| $25,000 to $34,999 | 102 (4.6%) | 131 (2.8%) |
| $35,000 to $49,999 | 191 (8.6%) | 72 (1.5%) |
| $50,000 to $74,999 | 238 (10.7%) | 324 (6.8%) |
| $75,000 to $99,999 | 214 (9.6%) | 648 (13.6%) |
| $100,000 to $149,999 | 509 (22.9%) | 305 (6.4%) |
| $150,000 or more | 798 (35.9%) | 813 (17.1%) |
| Total | 2,220 (100.0%) | 4,765 (100.0%) |
Property Value to Household Income Ratio in Springfield
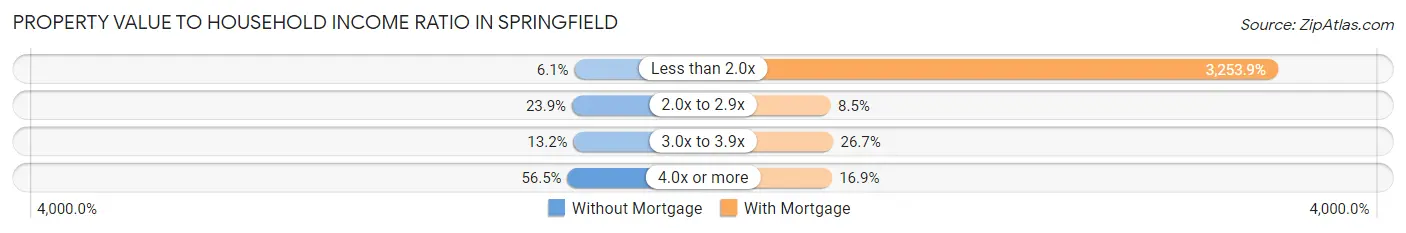
| Value-to-Income Ratio | Without Mortgage | With Mortgage |
| Less than 2.0x | 135 (6.1%) | 155,046 (3,253.8%) |
| 2.0x to 2.9x | 530 (23.9%) | 406 (8.5%) |
| 3.0x to 3.9x | 293 (13.2%) | 1,271 (26.7%) |
| 4.0x or more | 1,254 (56.5%) | 803 (16.9%) |
| Total | 2,220 (100.0%) | 4,765 (100.0%) |
Real Estate Taxes by Mortgage Status in Springfield
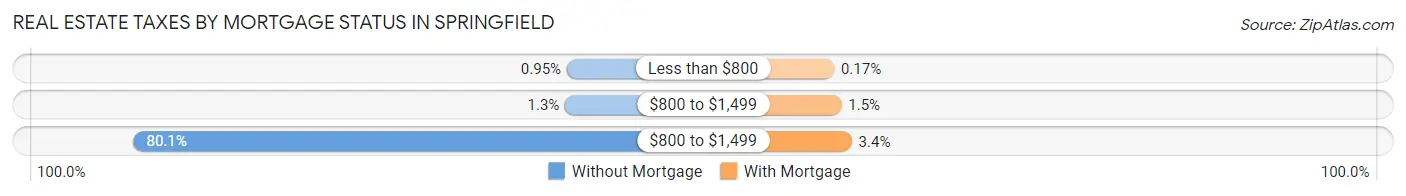
| Property Taxes | Without Mortgage | With Mortgage |
| Less than $800 | 21 (0.9%) | 8 (0.2%) |
| $800 to $1,499 | 28 (1.3%) | 72 (1.5%) |
| $800 to $1,499 | 1,778 (80.1%) | 162 (3.4%) |
| Total | 2,220 (100.0%) | 4,765 (100.0%) |
Health & Disability in Springfield
Health Insurance Coverage by Age in Springfield
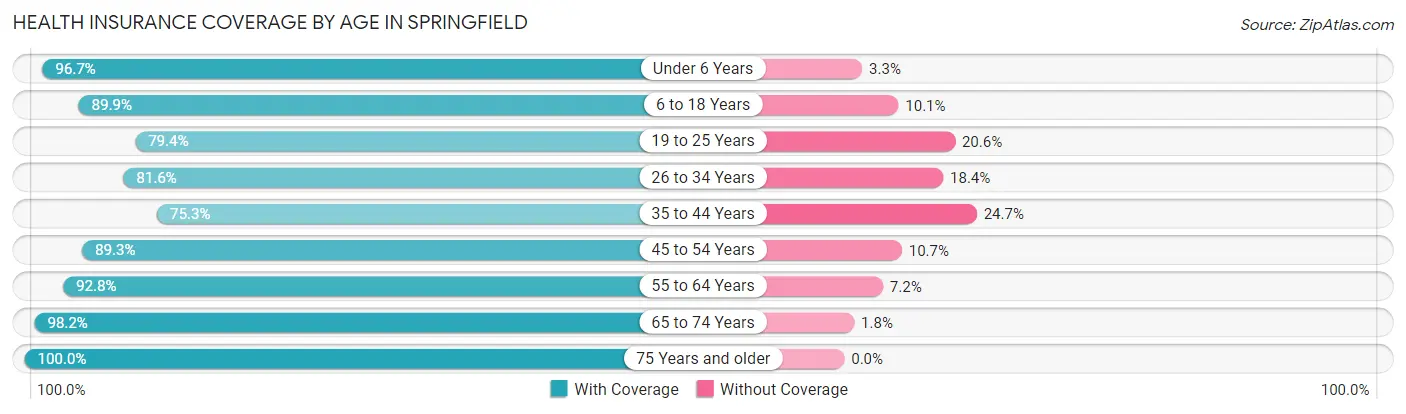
| Age Bracket | With Coverage | Without Coverage |
| Under 6 Years | 2,147 (96.7%) | 74 (3.3%) |
| 6 to 18 Years | 3,727 (89.9%) | 418 (10.1%) |
| 19 to 25 Years | 2,510 (79.4%) | 653 (20.6%) |
| 26 to 34 Years | 2,549 (81.6%) | 576 (18.4%) |
| 35 to 44 Years | 2,750 (75.3%) | 902 (24.7%) |
| 45 to 54 Years | 3,455 (89.3%) | 415 (10.7%) |
| 55 to 64 Years | 3,710 (92.8%) | 288 (7.2%) |
| 65 to 74 Years | 3,209 (98.2%) | 60 (1.8%) |
| 75 Years and older | 3,038 (100.0%) | 0 (0.0%) |
| Total | 27,095 (88.9%) | 3,386 (11.1%) |
Health Insurance Coverage by Citizenship Status in Springfield
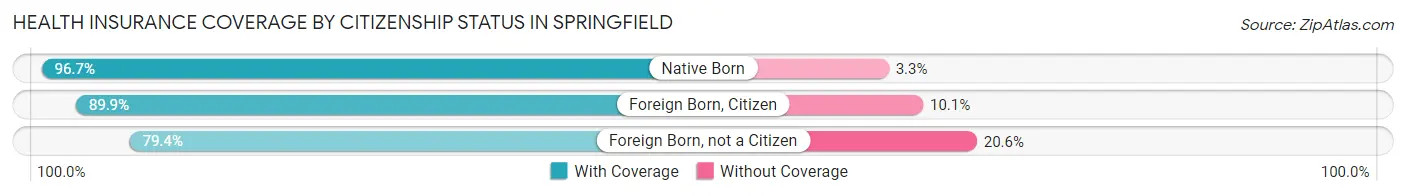
| Citizenship Status | With Coverage | Without Coverage |
| Native Born | 2,147 (96.7%) | 74 (3.3%) |
| Foreign Born, Citizen | 3,727 (89.9%) | 418 (10.1%) |
| Foreign Born, not a Citizen | 2,510 (79.4%) | 653 (20.6%) |
Health Insurance Coverage by Household Income in Springfield
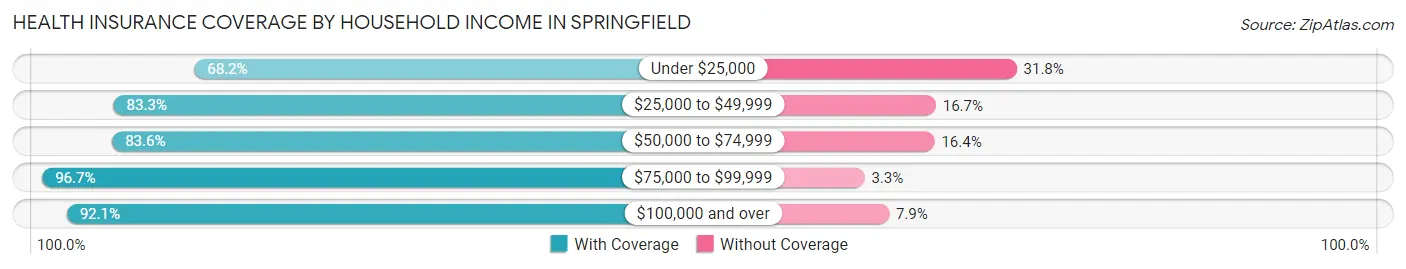
| Household Income | With Coverage | Without Coverage |
| Under $25,000 | 1,162 (68.2%) | 542 (31.8%) |
| $25,000 to $49,999 | 2,702 (83.3%) | 541 (16.7%) |
| $50,000 to $74,999 | 3,826 (83.6%) | 752 (16.4%) |
| $75,000 to $99,999 | 2,073 (96.7%) | 71 (3.3%) |
| $100,000 and over | 17,265 (92.1%) | 1,480 (7.9%) |
Public vs Private Health Insurance Coverage by Age in Springfield
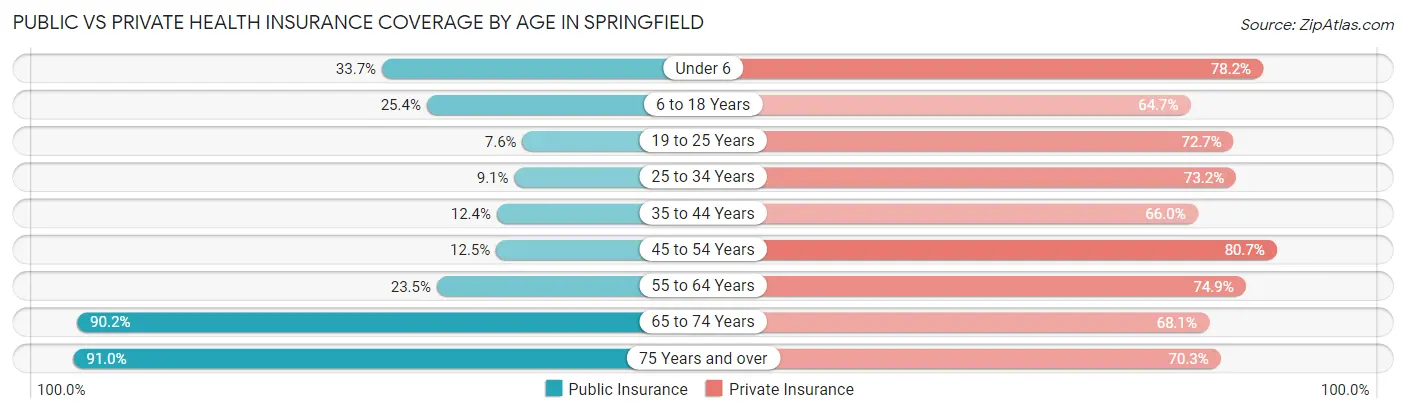
| Age Bracket | Public Insurance | Private Insurance |
| Under 6 | 748 (33.7%) | 1,736 (78.2%) |
| 6 to 18 Years | 1,051 (25.4%) | 2,681 (64.7%) |
| 19 to 25 Years | 240 (7.6%) | 2,300 (72.7%) |
| 25 to 34 Years | 284 (9.1%) | 2,287 (73.2%) |
| 35 to 44 Years | 451 (12.3%) | 2,411 (66.0%) |
| 45 to 54 Years | 483 (12.5%) | 3,124 (80.7%) |
| 55 to 64 Years | 939 (23.5%) | 2,996 (74.9%) |
| 65 to 74 Years | 2,950 (90.2%) | 2,227 (68.1%) |
| 75 Years and over | 2,763 (90.9%) | 2,136 (70.3%) |
| Total | 9,909 (32.5%) | 21,898 (71.8%) |
Disability Status by Sex by Age in Springfield
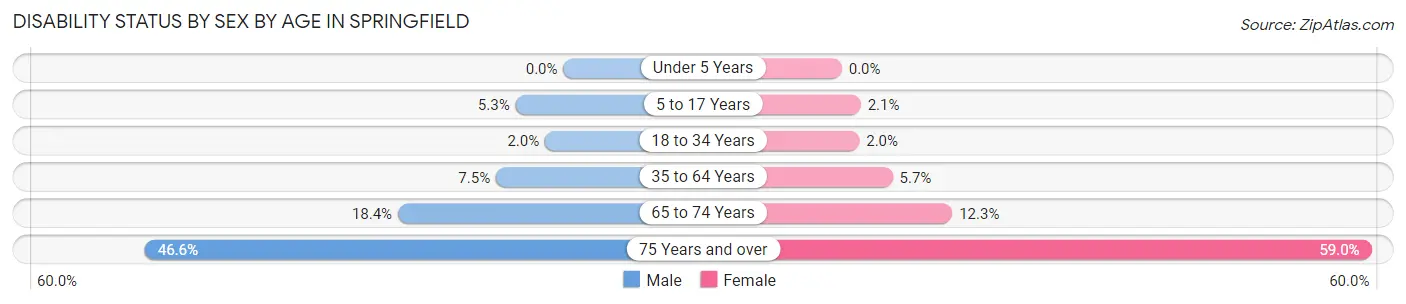
| Age Bracket | Male | Female |
| Under 5 Years | 0 (0.0%) | 0 (0.0%) |
| 5 to 17 Years | 96 (5.3%) | 48 (2.1%) |
| 18 to 34 Years | 71 (2.0%) | 63 (1.9%) |
| 35 to 64 Years | 449 (7.5%) | 313 (5.7%) |
| 65 to 74 Years | 310 (18.4%) | 195 (12.3%) |
| 75 Years and over | 508 (46.6%) | 1,149 (59.0%) |
Disability Class by Sex by Age in Springfield
Disability Class: Hearing Difficulty
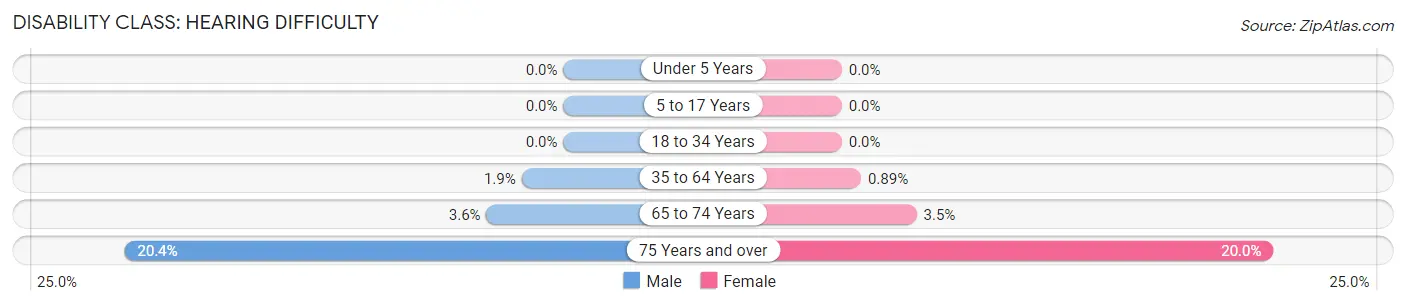
| Age Bracket | Male | Female |
| Under 5 Years | 0 (0.0%) | 0 (0.0%) |
| 5 to 17 Years | 0 (0.0%) | 0 (0.0%) |
| 18 to 34 Years | 0 (0.0%) | 0 (0.0%) |
| 35 to 64 Years | 116 (1.9%) | 49 (0.9%) |
| 65 to 74 Years | 60 (3.6%) | 55 (3.5%) |
| 75 Years and over | 222 (20.4%) | 390 (20.0%) |
Disability Class: Vision Difficulty
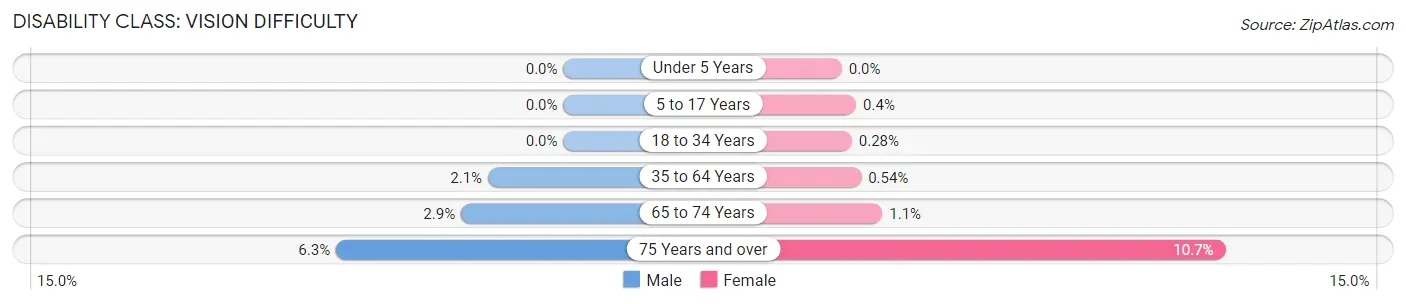
| Age Bracket | Male | Female |
| Under 5 Years | 0 (0.0%) | 0 (0.0%) |
| 5 to 17 Years | 0 (0.0%) | 9 (0.4%) |
| 18 to 34 Years | 0 (0.0%) | 9 (0.3%) |
| 35 to 64 Years | 126 (2.1%) | 30 (0.5%) |
| 65 to 74 Years | 48 (2.9%) | 18 (1.1%) |
| 75 Years and over | 69 (6.3%) | 208 (10.7%) |
Disability Class: Cognitive Difficulty
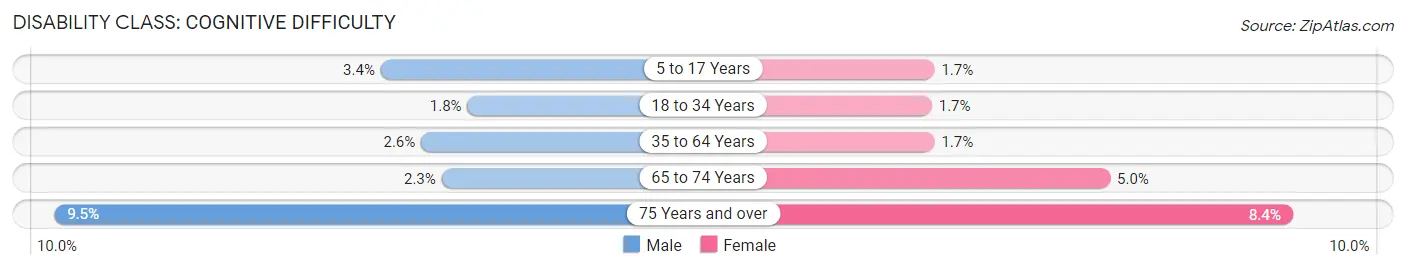
| Age Bracket | Male | Female |
| 5 to 17 Years | 61 (3.4%) | 39 (1.7%) |
| 18 to 34 Years | 62 (1.8%) | 54 (1.7%) |
| 35 to 64 Years | 158 (2.6%) | 95 (1.7%) |
| 65 to 74 Years | 38 (2.3%) | 79 (5.0%) |
| 75 Years and over | 103 (9.5%) | 163 (8.4%) |
Disability Class: Ambulatory Difficulty
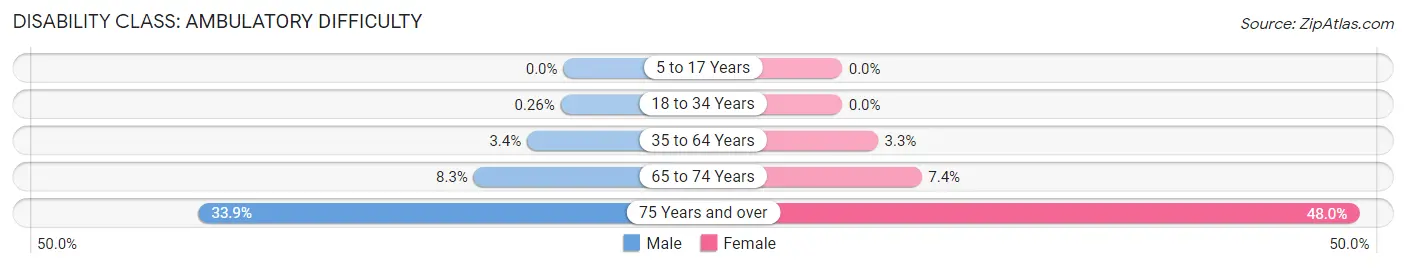
| Age Bracket | Male | Female |
| 5 to 17 Years | 0 (0.0%) | 0 (0.0%) |
| 18 to 34 Years | 9 (0.3%) | 0 (0.0%) |
| 35 to 64 Years | 202 (3.4%) | 184 (3.3%) |
| 65 to 74 Years | 140 (8.3%) | 117 (7.4%) |
| 75 Years and over | 369 (33.9%) | 935 (48.0%) |
Disability Class: Self-Care Difficulty
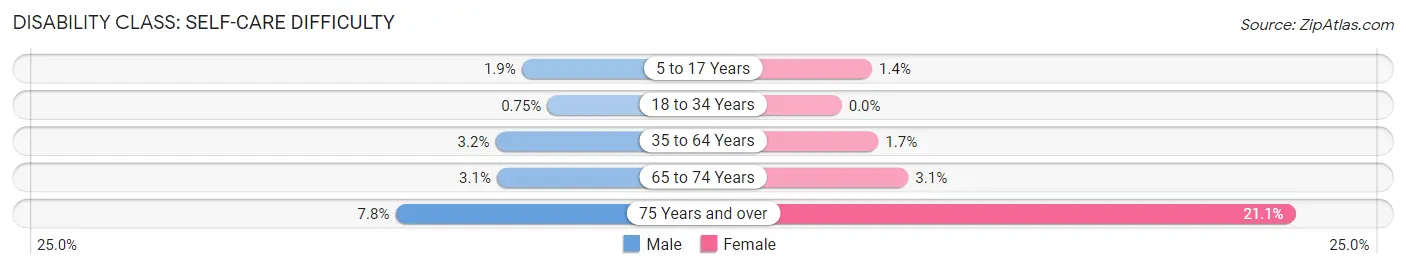
| Age Bracket | Male | Female |
| 5 to 17 Years | 35 (1.9%) | 32 (1.4%) |
| 18 to 34 Years | 26 (0.7%) | 0 (0.0%) |
| 35 to 64 Years | 189 (3.2%) | 94 (1.7%) |
| 65 to 74 Years | 52 (3.1%) | 49 (3.1%) |
| 75 Years and over | 85 (7.8%) | 410 (21.0%) |
Technology Access in Springfield
Computing Device Access in Springfield
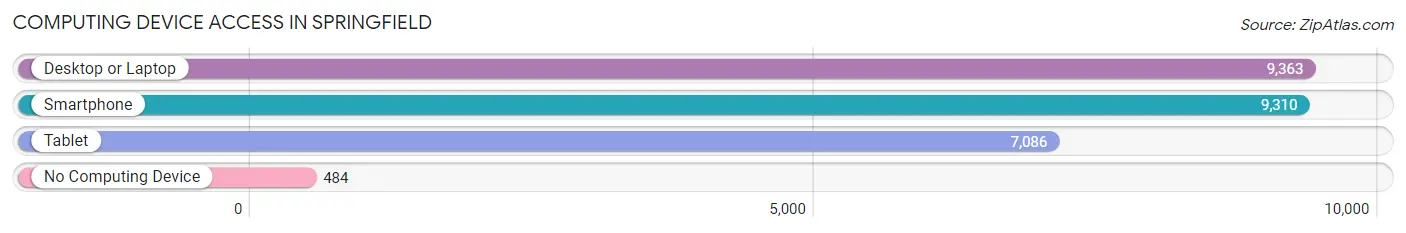
| Device Type | # Households | % Households |
| Desktop or Laptop | 9,363 | 88.6% |
| Smartphone | 9,310 | 88.1% |
| Tablet | 7,086 | 67.1% |
| No Computing Device | 484 | 4.6% |
| Total | 10,567 | 100.0% |
Internet Access in Springfield
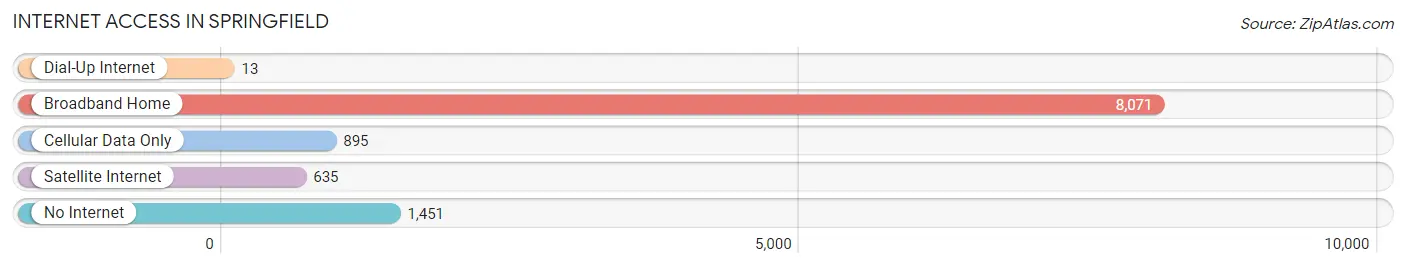
| Internet Type | # Households | % Households |
| Dial-Up Internet | 13 | 0.1% |
| Broadband Home | 8,071 | 76.4% |
| Cellular Data Only | 895 | 8.5% |
| Satellite Internet | 635 | 6.0% |
| No Internet | 1,451 | 13.7% |
| Total | 10,567 | 100.0% |
Springfield Summary
Springfield, Virginia is a census-designated place (CDP) located in Fairfax County, Virginia. It is a suburb of Washington, D.C., located approximately 16 miles southwest of the city. As of the 2010 census, the population of Springfield was 30,484.
History
The area that is now Springfield was first settled in the early 1700s by English colonists. The area was originally known as “Springfield Plantation” and was owned by the prominent Fairfax family. The plantation was divided into smaller parcels of land in the late 1700s and early 1800s. The area was known as “Springfield Village” by the mid-1800s.
In 1847, the Orange and Alexandria Railroad was built through the area, connecting it to Washington, D.C. and other nearby towns. This led to the development of the area as a residential suburb of Washington, D.C. In the late 1800s, the area was known as “Springfield Station” and was home to a number of small businesses.
In the early 1900s, the area was annexed by Fairfax County and the name was changed to “Springfield.” The area continued to grow and develop throughout the 20th century, becoming a major suburb of Washington, D.C.
Geography
Springfield is located in northern Fairfax County, Virginia. It is bordered to the north by Burke, to the east by Franconia, to the south by Lorton, and to the west by Newington. The CDP has a total area of 8.3 square miles, all of which is land.
The area is located in the Piedmont region of Virginia, with rolling hills and valleys. The area is drained by Accotink Creek, which flows through the center of the CDP. The climate is humid subtropical, with hot, humid summers and mild winters.
Economy
The economy of Springfield is largely based on government and defense-related industries. The area is home to several government agencies, including the National Geospatial-Intelligence Agency, the Defense Intelligence Agency, and the National Reconnaissance Office. The area is also home to several defense contractors, including Northrop Grumman and General Dynamics.
The area is also home to several retail and commercial businesses, including the Springfield Mall and the Springfield Town Center. The area is also home to several medical facilities, including Inova Fairfax Hospital and the Fairfax County Government Center.
Demographics
As of the 2010 census, the population of Springfield was 30,484. The racial makeup of the CDP was 68.2% White, 13.3% African American, 0.3% Native American, 11.2% Asian, 0.1% Pacific Islander, 3.2% from other races, and 3.7% from two or more races. Hispanic or Latino of any race were 8.7% of the population.
The median income for a household in the CDP was $87,813, and the median income for a family was $97,917. The per capita income for the CDP was $37,945. About 4.2% of families and 5.7% of the population were below the poverty line, including 6.7% of those under age 18 and 4.2% of those age 65 or over.
Common Questions
What is Per Capita Income in Springfield?
Per Capita income in Springfield is $49,457.
What is the Median Family Income in Springfield?
Median Family Income in Springfield is $127,516.
What is the Median Household income in Springfield?
Median Household Income in Springfield is $117,598.
What is Income or Wage Gap in Springfield?
Income or Wage Gap in Springfield is 30.1%.
Women in Springfield earn 69.9 cents for every dollar earned by a man.
What is Family Income Deficit in Springfield?
Family Income Deficit in Springfield is $12,334.
Families that are below poverty line in Springfield earn $12,334 less on average than the poverty threshold level.
What is Inequality or Gini Index in Springfield?
Inequality or Gini Index in Springfield is 0.41.
What is the Total Population of Springfield?
Total Population of Springfield is 31,022.
What is the Total Male Population of Springfield?
Total Male Population of Springfield is 15,349.
What is the Total Female Population of Springfield?
Total Female Population of Springfield is 15,673.
What is the Ratio of Males per 100 Females in Springfield?
There are 97.93 Males per 100 Females in Springfield.
What is the Ratio of Females per 100 Males in Springfield?
There are 102.11 Females per 100 Males in Springfield.
What is the Median Population Age in Springfield?
Median Population Age in Springfield is 41.8 Years.
What is the Average Family Size in Springfield
Average Family Size in Springfield is 3.6 People.
What is the Average Household Size in Springfield
Average Household Size in Springfield is 2.9 People.
How Large is the Labor Force in Springfield?
There are 16,342 People in the Labor Forcein in Springfield.
What is the Percentage of People in the Labor Force in Springfield?
63.5% of People are in the Labor Force in Springfield.
What is the Unemployment Rate in Springfield?
Unemployment Rate in Springfield is 6.2%.