Dale City, VA Map & Demographics
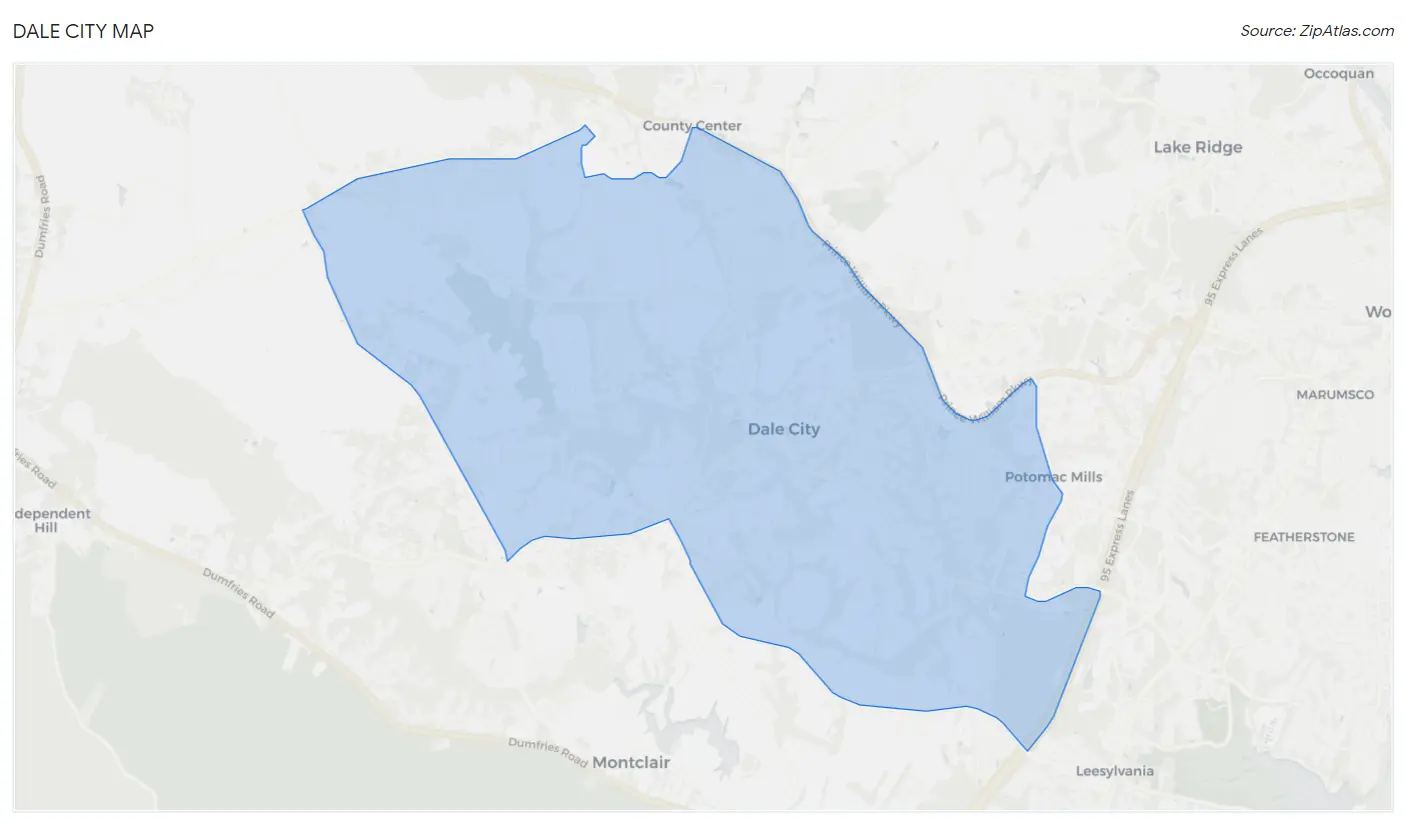
Dale City Map
Dale City Overview
$41,818
PER CAPITA INCOME
$117,534
AVG FAMILY INCOME
$109,558
AVG HOUSEHOLD INCOME
31.9%
WAGE / INCOME GAP [ % ]
68.1¢/ $1
WAGE / INCOME GAP [ $ ]
$13,196
FAMILY INCOME DEFICIT
0.40
INEQUALITY / GINI INDEX
73,928
TOTAL POPULATION
37,235
MALE POPULATION
36,693
FEMALE POPULATION
101.48
MALES / 100 FEMALES
98.54
FEMALES / 100 MALES
35.1
MEDIAN AGE
3.8
AVG FAMILY SIZE
3.4
AVG HOUSEHOLD SIZE
40,783
LABOR FORCE [ PEOPLE ]
73.0%
PERCENT IN LABOR FORCE
4.6%
UNEMPLOYMENT RATE
Income in Dale City
Income Overview in Dale City
Per Capita Income in Dale City is $41,818, while median incomes of families and households are $117,534 and $109,558 respectively.
| Characteristic | Number | Measure |
| Per Capita Income | 73,928 | $41,818 |
| Median Family Income | 16,960 | $117,534 |
| Mean Family Income | 16,960 | $146,266 |
| Median Household Income | 21,768 | $109,558 |
| Mean Household Income | 21,768 | $136,923 |
| Income Deficit | 16,960 | $13,196 |
| Wage / Income Gap (%) | 73,928 | 31.95% |
| Wage / Income Gap ($) | 73,928 | 68.05¢ per $1 |
| Gini / Inequality Index | 73,928 | 0.40 |
Earnings by Sex in Dale City
Average Earnings in Dale City are $48,246, $56,389 for men and $38,375 for women, a difference of 32.0%.
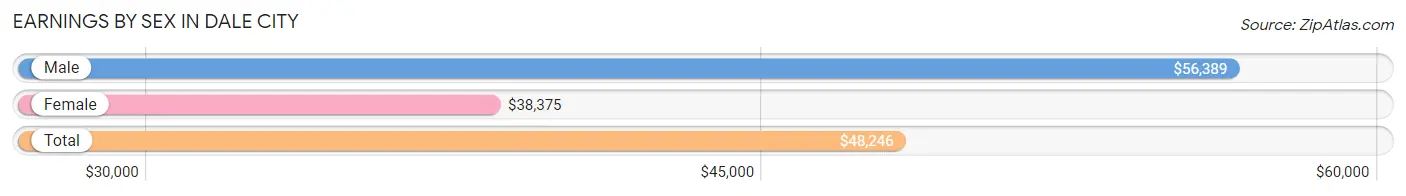
| Sex | Number | Average Earnings |
| Male | 22,312 (54.2%) | $56,389 |
| Female | 18,828 (45.8%) | $38,375 |
| Total | 41,140 (100.0%) | $48,246 |
Earnings by Sex by Income Bracket in Dale City
The most common earnings brackets in Dale City are $100,000+ for men (5,121 | 23.0%) and $100,000+ for women (2,543 | 13.5%).
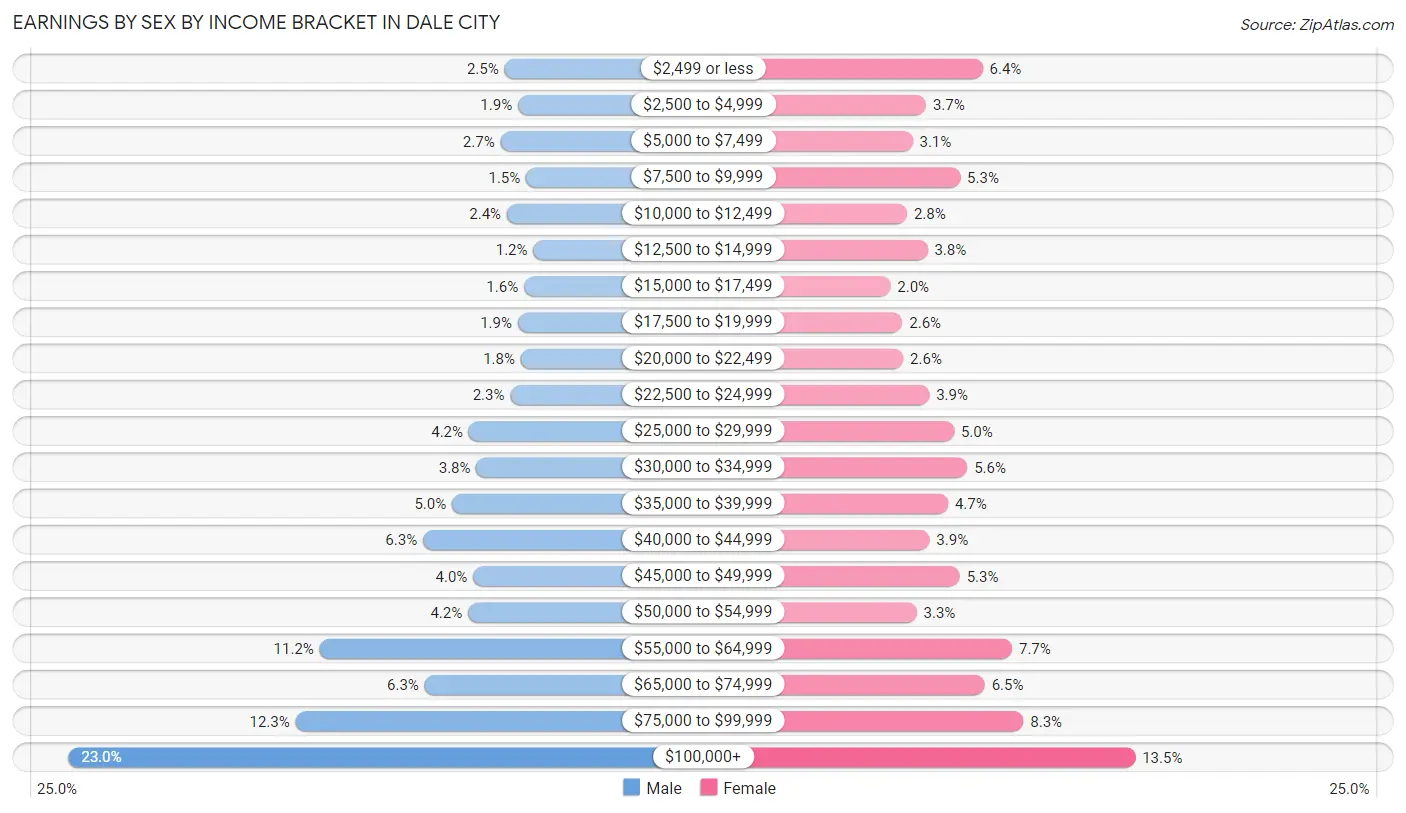
| Income | Male | Female |
| $2,499 or less | 562 (2.5%) | 1,197 (6.4%) |
| $2,500 to $4,999 | 422 (1.9%) | 698 (3.7%) |
| $5,000 to $7,499 | 604 (2.7%) | 580 (3.1%) |
| $7,500 to $9,999 | 338 (1.5%) | 999 (5.3%) |
| $10,000 to $12,499 | 537 (2.4%) | 531 (2.8%) |
| $12,500 to $14,999 | 260 (1.2%) | 711 (3.8%) |
| $15,000 to $17,499 | 360 (1.6%) | 385 (2.0%) |
| $17,500 to $19,999 | 425 (1.9%) | 490 (2.6%) |
| $20,000 to $22,499 | 393 (1.8%) | 497 (2.6%) |
| $22,500 to $24,999 | 502 (2.2%) | 727 (3.9%) |
| $25,000 to $29,999 | 934 (4.2%) | 946 (5.0%) |
| $30,000 to $34,999 | 856 (3.8%) | 1,061 (5.6%) |
| $35,000 to $39,999 | 1,111 (5.0%) | 893 (4.7%) |
| $40,000 to $44,999 | 1,415 (6.3%) | 729 (3.9%) |
| $45,000 to $49,999 | 891 (4.0%) | 996 (5.3%) |
| $50,000 to $54,999 | 943 (4.2%) | 615 (3.3%) |
| $55,000 to $64,999 | 2,494 (11.2%) | 1,457 (7.7%) |
| $65,000 to $74,999 | 1,397 (6.3%) | 1,216 (6.5%) |
| $75,000 to $99,999 | 2,747 (12.3%) | 1,557 (8.3%) |
| $100,000+ | 5,121 (23.0%) | 2,543 (13.5%) |
| Total | 22,312 (100.0%) | 18,828 (100.0%) |
Earnings by Sex by Educational Attainment in Dale City
Average earnings in Dale City are $60,955 for men and $45,742 for women, a difference of 25.0%. Men with an educational attainment of graduate degree enjoy the highest average annual earnings of $104,965, while those with high school diploma education earn the least with $50,875. Women with an educational attainment of graduate degree earn the most with the average annual earnings of $91,823, while those with less than high school education have the smallest earnings of $23,902.
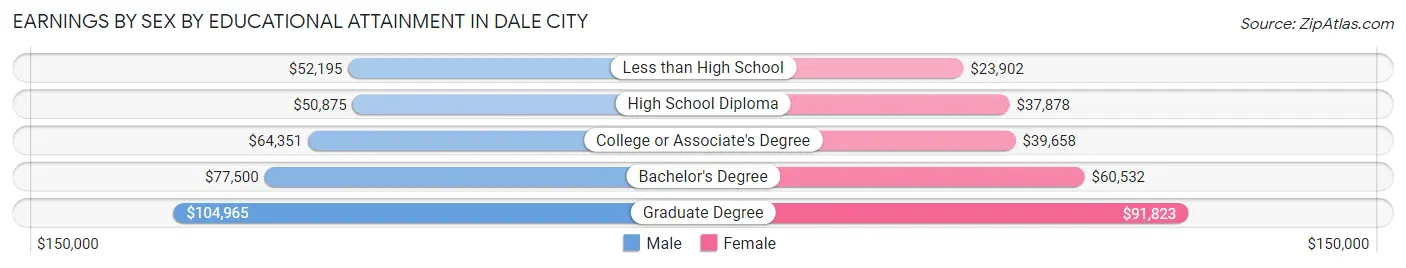
| Educational Attainment | Male Income | Female Income |
| Less than High School | $52,195 | $23,902 |
| High School Diploma | $50,875 | $37,878 |
| College or Associate's Degree | $64,351 | $39,658 |
| Bachelor's Degree | $77,500 | $60,532 |
| Graduate Degree | $104,965 | $91,823 |
| Total | $60,955 | $45,742 |
Family Income in Dale City
Family Income Brackets in Dale City
According to the Dale City family income data, there are 4,376 families falling into the $100,000 to $149,999 income range, which is the most common income bracket and makes up 25.8% of all families. Conversely, the $10,000 to $14,999 income bracket is the least frequent group with only 187 families (1.1%) belonging to this category.
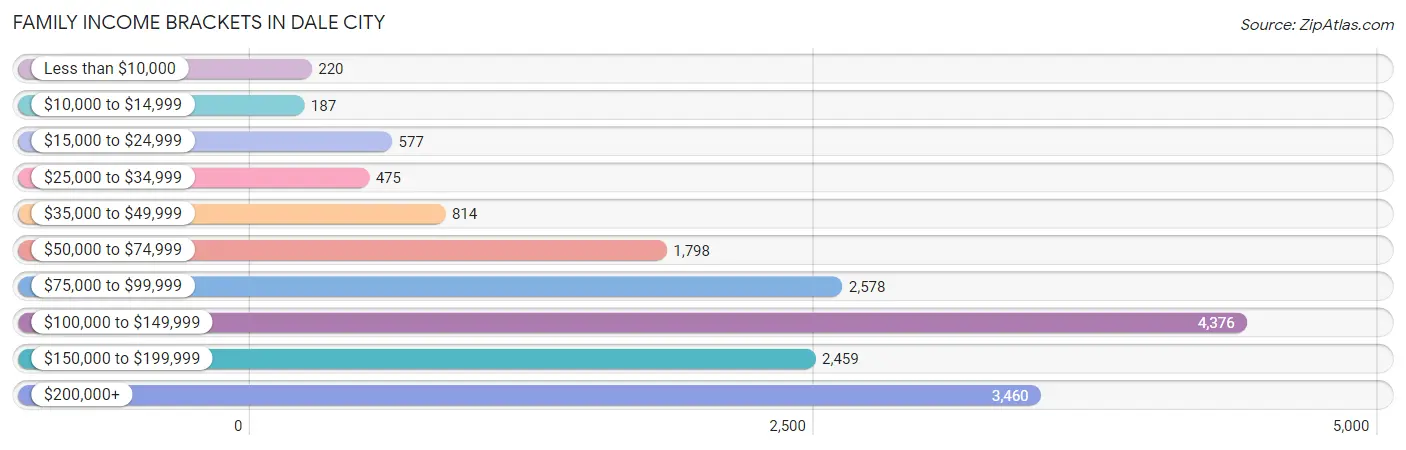
| Income Bracket | # Families | % Families |
| Less than $10,000 | 220 | 1.3% |
| $10,000 to $14,999 | 187 | 1.1% |
| $15,000 to $24,999 | 577 | 3.4% |
| $25,000 to $34,999 | 475 | 2.8% |
| $35,000 to $49,999 | 814 | 4.8% |
| $50,000 to $74,999 | 1,798 | 10.6% |
| $75,000 to $99,999 | 2,578 | 15.2% |
| $100,000 to $149,999 | 4,376 | 25.8% |
| $150,000 to $199,999 | 2,459 | 14.5% |
| $200,000+ | 3,460 | 20.4% |
Family Income by Famaliy Size in Dale City
7+ person families (1,122 | 6.6%) account for the highest median family income in Dale City with $156,083 per family, while 2-person families (5,483 | 32.3%) have the highest median income of $58,007 per family member.
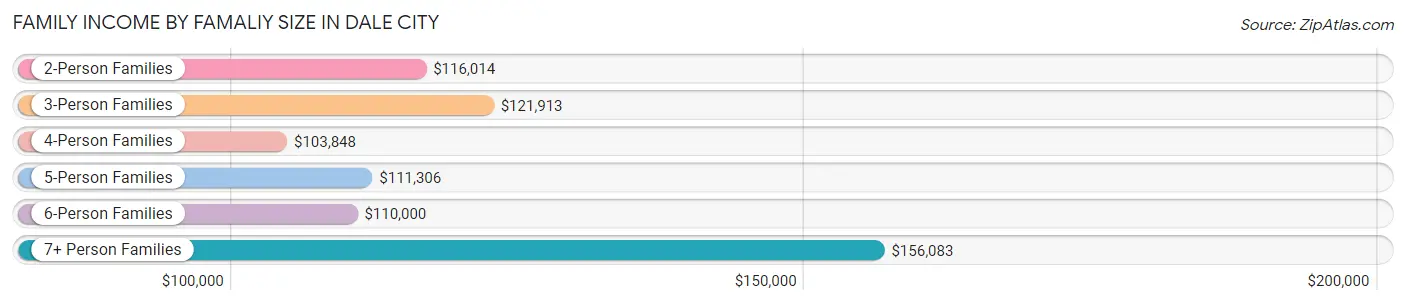
| Income Bracket | # Families | Median Income |
| 2-Person Families | 5,483 (32.3%) | $116,014 |
| 3-Person Families | 3,545 (20.9%) | $121,913 |
| 4-Person Families | 3,415 (20.1%) | $103,848 |
| 5-Person Families | 2,311 (13.6%) | $111,306 |
| 6-Person Families | 1,084 (6.4%) | $110,000 |
| 7+ Person Families | 1,122 (6.6%) | $156,083 |
| Total | 16,960 (100.0%) | $117,534 |
Family Income by Number of Earners in Dale City
The median family income in Dale City is $117,534, with families comprising 3+ earners (3,684) having the highest median family income of $150,291, while families with no earners (1,178) have the lowest median family income of $75,100, accounting for 21.7% and 7.0% of families, respectively.
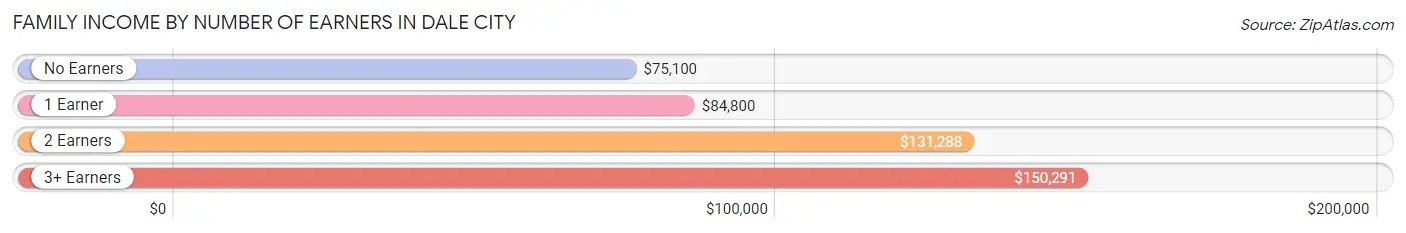
| Number of Earners | # Families | Median Income |
| No Earners | 1,178 (7.0%) | $75,100 |
| 1 Earner | 4,133 (24.4%) | $84,800 |
| 2 Earners | 7,965 (47.0%) | $131,288 |
| 3+ Earners | 3,684 (21.7%) | $150,291 |
| Total | 16,960 (100.0%) | $117,534 |
Household Income in Dale City
Household Income Brackets in Dale City
With 5,268 households falling in the category, the $100,000 to $149,999 income range is the most frequent in Dale City, accounting for 24.2% of all households. In contrast, only 218 households (1.0%) fall into the $10,000 to $14,999 income bracket, making it the least populous group.
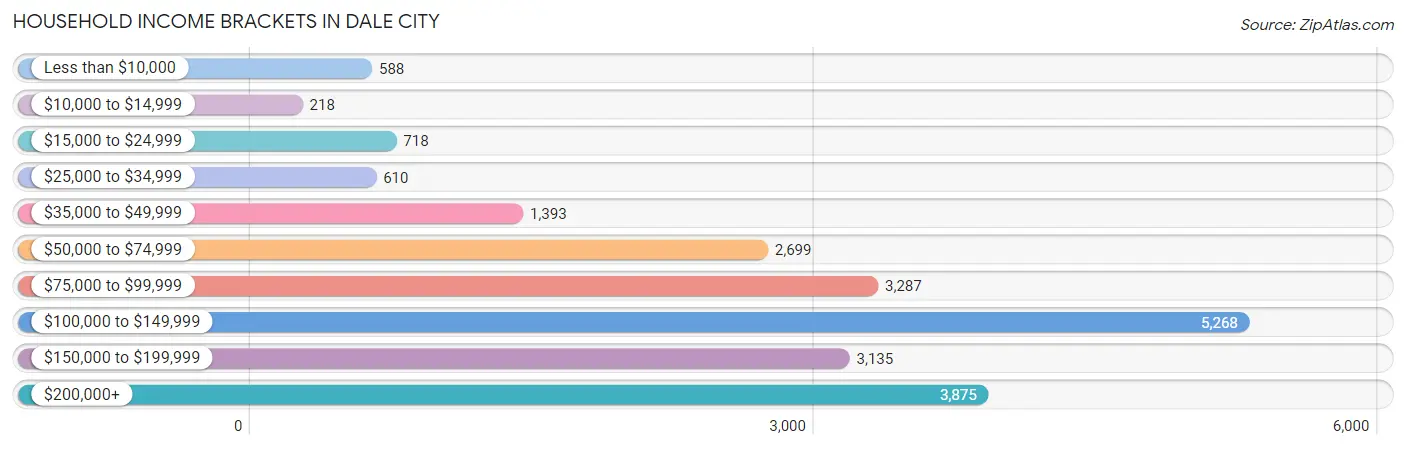
| Income Bracket | # Households | % Households |
| Less than $10,000 | 588 | 2.7% |
| $10,000 to $14,999 | 218 | 1.0% |
| $15,000 to $24,999 | 718 | 3.3% |
| $25,000 to $34,999 | 610 | 2.8% |
| $35,000 to $49,999 | 1,393 | 6.4% |
| $50,000 to $74,999 | 2,699 | 12.4% |
| $75,000 to $99,999 | 3,287 | 15.1% |
| $100,000 to $149,999 | 5,268 | 24.2% |
| $150,000 to $199,999 | 3,135 | 14.4% |
| $200,000+ | 3,875 | 17.8% |
Household Income by Householder Age in Dale City
The median household income in Dale City is $109,558, with the highest median household income of $122,459 found in the 45 to 64 years age bracket for the primary householder. A total of 9,678 households (44.5%) fall into this category. Meanwhile, the 65+ years age bracket for the primary householder has the lowest median household income of $83,627, with 3,812 households (17.5%) in this group.
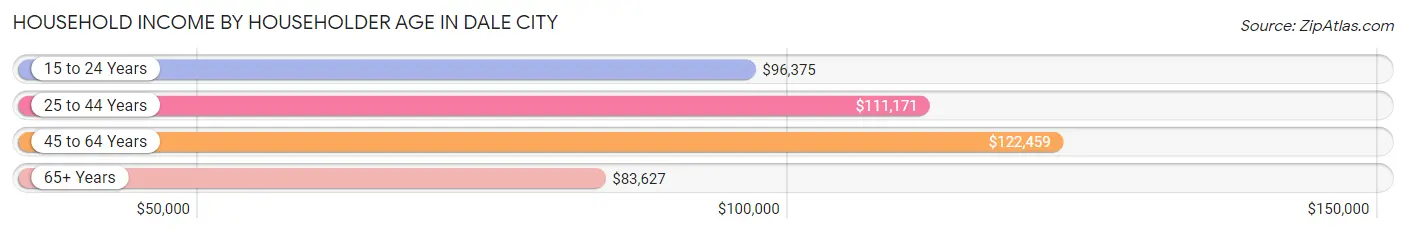
| Income Bracket | # Households | Median Income |
| 15 to 24 Years | 139 (0.6%) | $96,375 |
| 25 to 44 Years | 8,139 (37.4%) | $111,171 |
| 45 to 64 Years | 9,678 (44.5%) | $122,459 |
| 65+ Years | 3,812 (17.5%) | $83,627 |
| Total | 21,768 (100.0%) | $109,558 |
Poverty in Dale City
Income Below Poverty by Sex and Age in Dale City
With 6.4% poverty level for males and 7.9% for females among the residents of Dale City, 5 year old males and 5 year old females are the most vulnerable to poverty, with 97 males (24.1%) and 127 females (16.4%) in their respective age groups living below the poverty level.
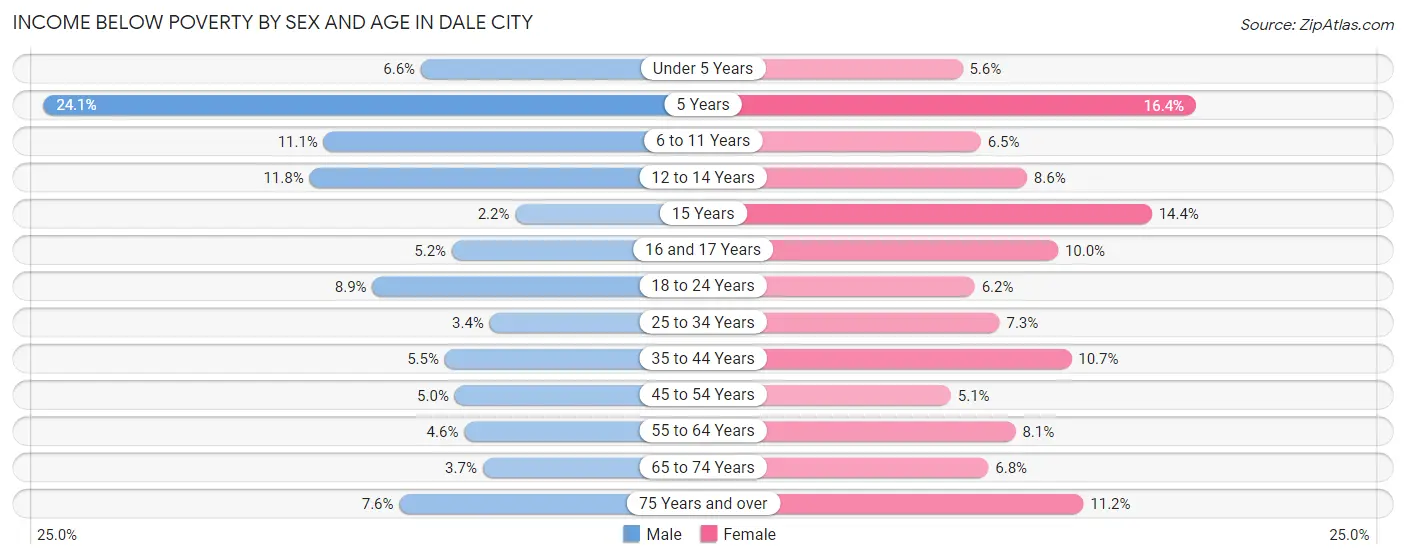
| Age Bracket | Male | Female |
| Under 5 Years | 196 (6.6%) | 163 (5.6%) |
| 5 Years | 97 (24.1%) | 127 (16.4%) |
| 6 to 11 Years | 358 (11.1%) | 172 (6.5%) |
| 12 to 14 Years | 233 (11.8%) | 170 (8.6%) |
| 15 Years | 10 (2.2%) | 84 (14.4%) |
| 16 and 17 Years | 51 (5.2%) | 117 (10.0%) |
| 18 to 24 Years | 327 (8.9%) | 184 (6.2%) |
| 25 to 34 Years | 170 (3.4%) | 359 (7.3%) |
| 35 to 44 Years | 318 (5.5%) | 606 (10.6%) |
| 45 to 54 Years | 251 (5.0%) | 234 (5.1%) |
| 55 to 64 Years | 201 (4.6%) | 373 (8.1%) |
| 65 to 74 Years | 95 (3.7%) | 154 (6.8%) |
| 75 Years and over | 64 (7.6%) | 161 (11.2%) |
| Total | 2,371 (6.4%) | 2,904 (7.9%) |
Income Above Poverty by Sex and Age in Dale City
According to the poverty statistics in Dale City, males aged 15 years and females aged 45 to 54 years are the age groups that are most secure financially, with 97.8% of males and 94.9% of females in these age groups living above the poverty line.
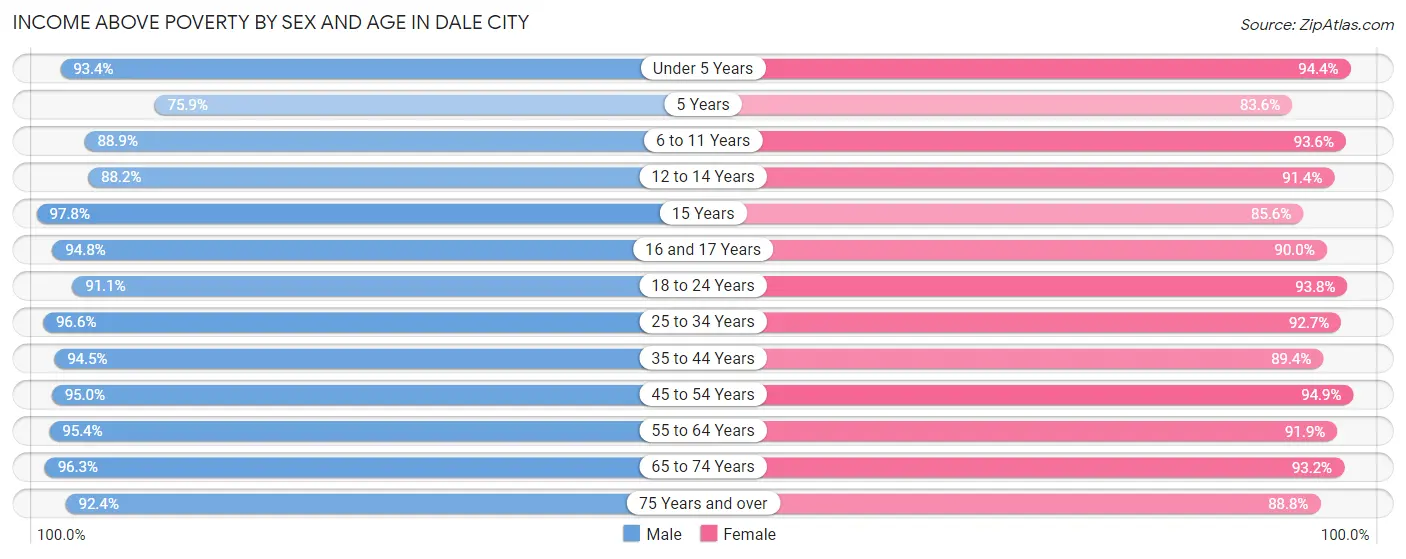
| Age Bracket | Male | Female |
| Under 5 Years | 2,770 (93.4%) | 2,747 (94.4%) |
| 5 Years | 305 (75.9%) | 646 (83.6%) |
| 6 to 11 Years | 2,861 (88.9%) | 2,494 (93.5%) |
| 12 to 14 Years | 1,745 (88.2%) | 1,809 (91.4%) |
| 15 Years | 438 (97.8%) | 500 (85.6%) |
| 16 and 17 Years | 936 (94.8%) | 1,049 (90.0%) |
| 18 to 24 Years | 3,365 (91.1%) | 2,798 (93.8%) |
| 25 to 34 Years | 4,802 (96.6%) | 4,548 (92.7%) |
| 35 to 44 Years | 5,461 (94.5%) | 5,084 (89.3%) |
| 45 to 54 Years | 4,734 (95.0%) | 4,395 (94.9%) |
| 55 to 64 Years | 4,169 (95.4%) | 4,252 (91.9%) |
| 65 to 74 Years | 2,445 (96.3%) | 2,111 (93.2%) |
| 75 Years and over | 777 (92.4%) | 1,275 (88.8%) |
| Total | 34,808 (93.6%) | 33,708 (92.1%) |
Income Below Poverty Among Married-Couple Families in Dale City
The poverty statistics for married-couple families in Dale City show that 3.7% or 487 of the total 12,992 families live below the poverty line. Families with 5 or more children have the highest poverty rate of 22.5%, comprising of 58 families. On the other hand, families with no children have the lowest poverty rate of 2.9%, which includes 171 families.
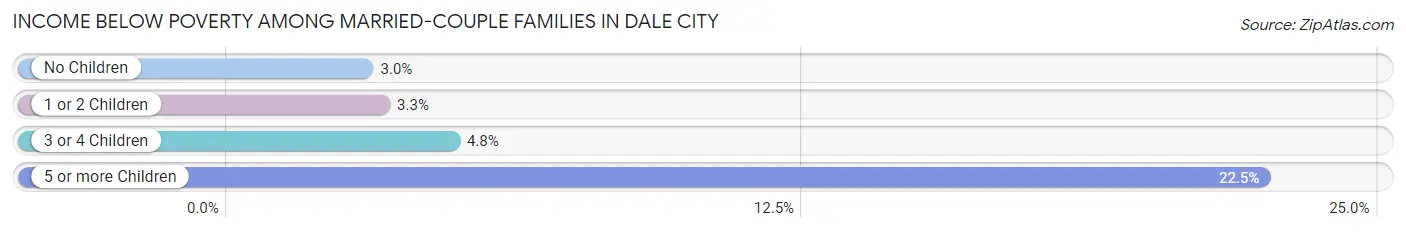
| Children | Above Poverty | Below Poverty |
| No Children | 5,621 (97.1%) | 171 (2.9%) |
| 1 or 2 Children | 4,931 (96.7%) | 169 (3.3%) |
| 3 or 4 Children | 1,753 (95.2%) | 89 (4.8%) |
| 5 or more Children | 200 (77.5%) | 58 (22.5%) |
| Total | 12,505 (96.3%) | 487 (3.7%) |
Income Below Poverty Among Single-Parent Households in Dale City
According to the poverty data in Dale City, 7.4% or 103 single-father households and 12.1% or 314 single-mother households are living below the poverty line. Among single-father households, those with 1 or 2 children have the highest poverty rate, with 103 households (12.1%) experiencing poverty. Likewise, among single-mother households, those with 3 or 4 children have the highest poverty rate, with 166 households (28.0%) falling below the poverty line.
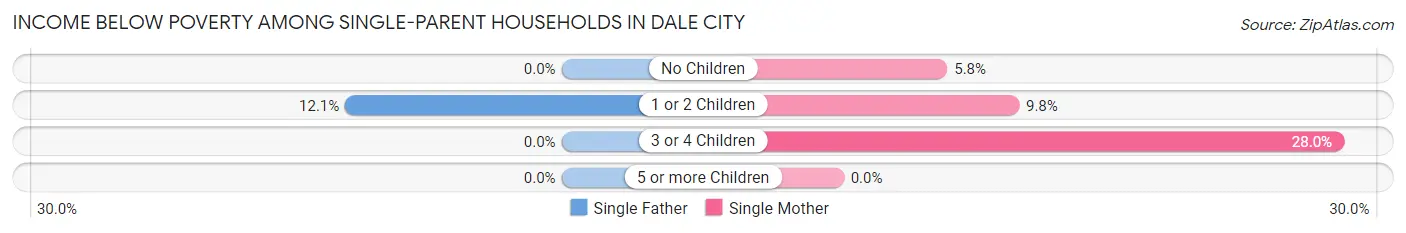
| Children | Single Father | Single Mother |
| No Children | 0 (0.0%) | 68 (5.8%) |
| 1 or 2 Children | 103 (12.1%) | 80 (9.8%) |
| 3 or 4 Children | 0 (0.0%) | 166 (28.0%) |
| 5 or more Children | 0 (0.0%) | 0 (0.0%) |
| Total | 103 (7.4%) | 314 (12.1%) |
Income Below Poverty Among Married-Couple vs Single-Parent Households in Dale City
The poverty data for Dale City shows that 487 of the married-couple family households (3.7%) and 417 of the single-parent households (10.5%) are living below the poverty level. Within the married-couple family households, those with 5 or more children have the highest poverty rate, with 58 households (22.5%) falling below the poverty line. Among the single-parent households, those with 3 or 4 children have the highest poverty rate, with 166 household (25.5%) living below poverty.
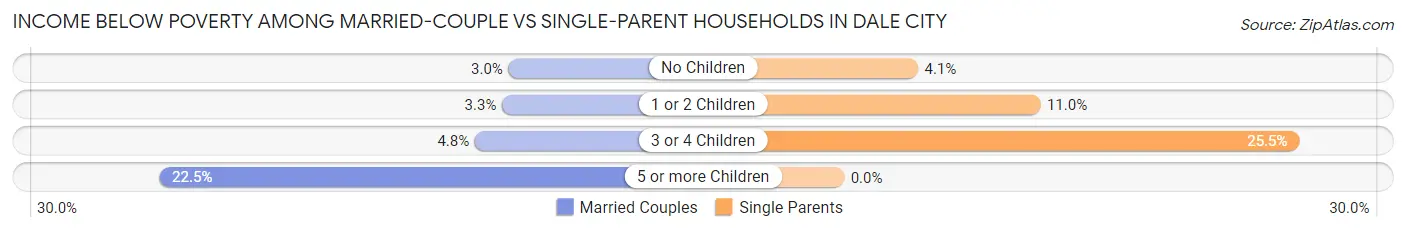
| Children | Married-Couple Families | Single-Parent Households |
| No Children | 171 (2.9%) | 68 (4.1%) |
| 1 or 2 Children | 169 (3.3%) | 183 (11.0%) |
| 3 or 4 Children | 89 (4.8%) | 166 (25.5%) |
| 5 or more Children | 58 (22.5%) | 0 (0.0%) |
| Total | 487 (3.7%) | 417 (10.5%) |
Race in Dale City
The most populous races in Dale City are White / Caucasian (26,790 | 36.2%), Hispanic or Latino (25,830 | 34.9%), and Black / African American (17,634 | 23.8%).
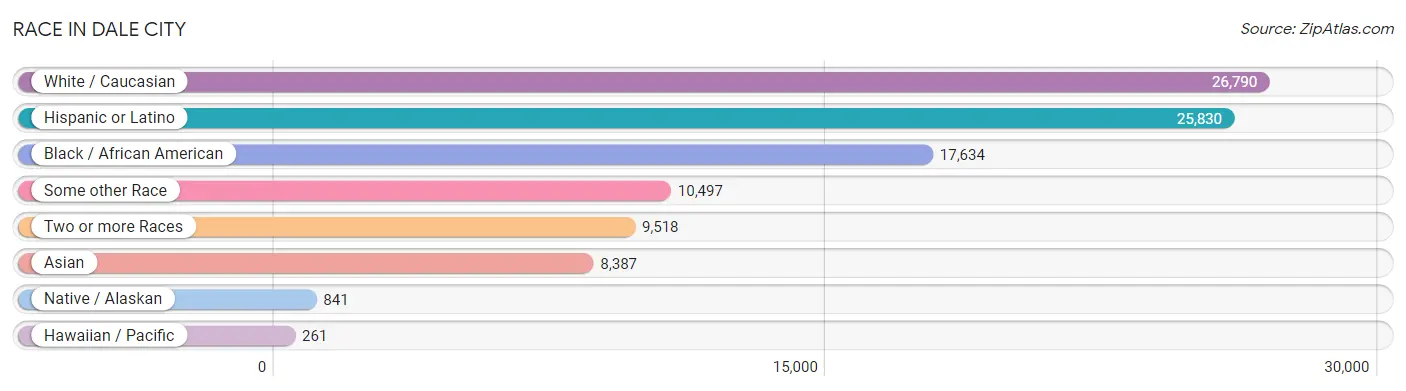
| Race | # Population | % Population |
| Asian | 8,387 | 11.3% |
| Black / African American | 17,634 | 23.8% |
| Hawaiian / Pacific | 261 | 0.4% |
| Hispanic or Latino | 25,830 | 34.9% |
| Native / Alaskan | 841 | 1.1% |
| White / Caucasian | 26,790 | 36.2% |
| Two or more Races | 9,518 | 12.9% |
| Some other Race | 10,497 | 14.2% |
| Total | 73,928 | 100.0% |
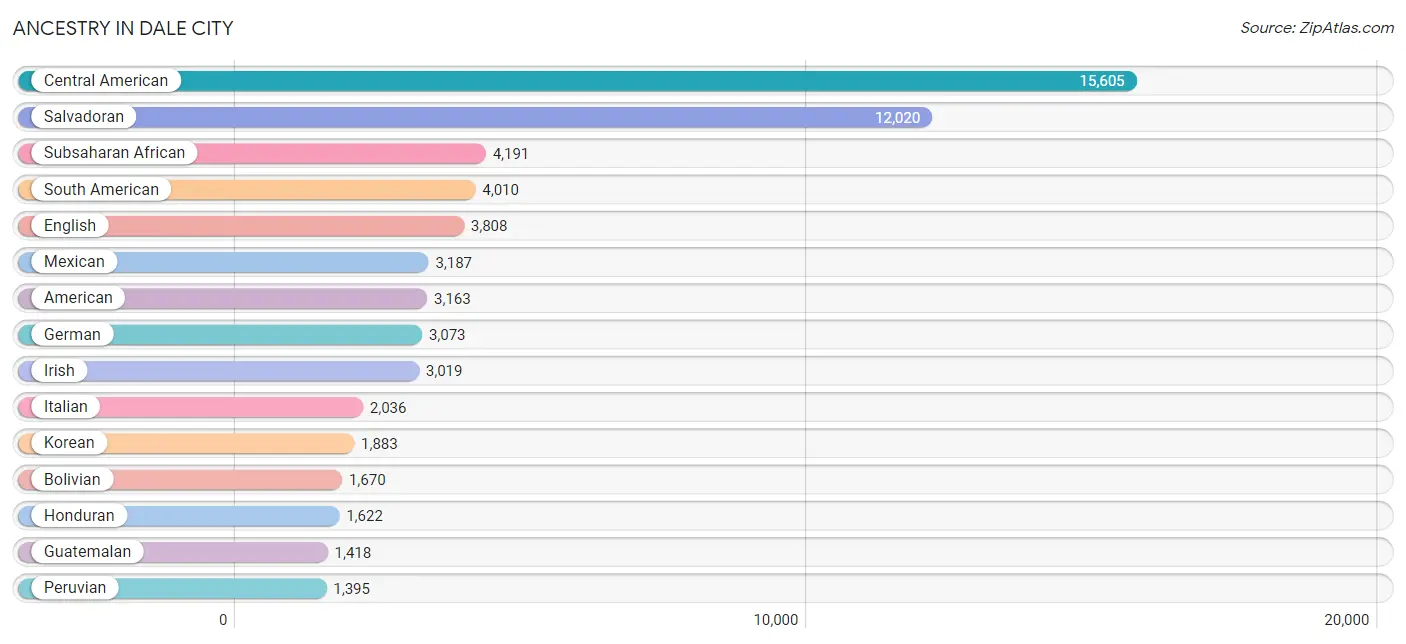
Ancestry in Dale City
The most populous ancestries reported in Dale City are Central American (15,605 | 21.1%), Salvadoran (12,020 | 16.3%), Subsaharan African (4,191 | 5.7%), South American (4,010 | 5.4%), and English (3,808 | 5.1%), together accounting for 53.6% of all Dale City residents.
| Ancestry | # Population | % Population |
| Afghan | 703 | 0.9% |
| African | 915 | 1.2% |
| American | 3,163 | 4.3% |
| Arab | 527 | 0.7% |
| Argentinean | 185 | 0.3% |
| Barbadian | 37 | 0.1% |
| Belgian | 16 | 0.0% |
| Bermudan | 8 | 0.0% |
| Bhutanese | 198 | 0.3% |
| Bolivian | 1,670 | 2.3% |
| Brazilian | 71 | 0.1% |
| British | 258 | 0.4% |
| British West Indian | 27 | 0.0% |
| Bulgarian | 31 | 0.0% |
| Burmese | 838 | 1.1% |
| Cambodian | 7 | 0.0% |
| Canadian | 23 | 0.0% |
| Cape Verdean | 12 | 0.0% |
| Central American | 15,605 | 21.1% |
| Central American Indian | 343 | 0.5% |
| Cherokee | 91 | 0.1% |
| Chickasaw | 9 | 0.0% |
| Chilean | 6 | 0.0% |
| Chippewa | 26 | 0.0% |
| Choctaw | 72 | 0.1% |
| Colombian | 474 | 0.6% |
| Costa Rican | 21 | 0.0% |
| Creek | 46 | 0.1% |
| Croatian | 23 | 0.0% |
| Cuban | 119 | 0.2% |
| Czech | 101 | 0.1% |
| Czechoslovakian | 9 | 0.0% |
| Danish | 193 | 0.3% |
| Dominican | 445 | 0.6% |
| Dutch | 133 | 0.2% |
| Eastern European | 99 | 0.1% |
| Ecuadorian | 90 | 0.1% |
| Egyptian | 177 | 0.2% |
| English | 3,808 | 5.1% |
| Ethiopian | 750 | 1.0% |
| European | 781 | 1.1% |
| Finnish | 60 | 0.1% |
| French | 725 | 1.0% |
| French Canadian | 119 | 0.2% |
| German | 3,073 | 4.2% |
| Ghanaian | 1,385 | 1.9% |
| Greek | 39 | 0.1% |
| Guamanian / Chamorro | 237 | 0.3% |
| Guatemalan | 1,418 | 1.9% |
| Guyanese | 21 | 0.0% |
| Haitian | 51 | 0.1% |
| Honduran | 1,622 | 2.2% |
| Hungarian | 146 | 0.2% |
| Indian (Asian) | 468 | 0.6% |
| Indonesian | 25 | 0.0% |
| Inupiat | 37 | 0.1% |
| Iranian | 137 | 0.2% |
| Iraqi | 54 | 0.1% |
| Irish | 3,019 | 4.1% |
| Iroquois | 15 | 0.0% |
| Israeli | 14 | 0.0% |
| Italian | 2,036 | 2.8% |
| Jamaican | 247 | 0.3% |
| Japanese | 451 | 0.6% |
| Jordanian | 5 | 0.0% |
| Korean | 1,883 | 2.5% |
| Laotian | 86 | 0.1% |
| Liberian | 54 | 0.1% |
| Lithuanian | 19 | 0.0% |
| Macedonian | 41 | 0.1% |
| Malaysian | 82 | 0.1% |
| Mexican | 3,187 | 4.3% |
| Mexican American Indian | 159 | 0.2% |
| Moroccan | 173 | 0.2% |
| Native Hawaiian | 80 | 0.1% |
| Nicaraguan | 306 | 0.4% |
| Nigerian | 333 | 0.4% |
| Northern European | 188 | 0.3% |
| Norwegian | 210 | 0.3% |
| Pakistani | 90 | 0.1% |
| Palestinian | 23 | 0.0% |
| Panamanian | 205 | 0.3% |
| Peruvian | 1,395 | 1.9% |
| Polish | 598 | 0.8% |
| Portuguese | 298 | 0.4% |
| Puerto Rican | 958 | 1.3% |
| Romanian | 118 | 0.2% |
| Russian | 96 | 0.1% |
| Salvadoran | 12,020 | 16.3% |
| Samoan | 53 | 0.1% |
| Scandinavian | 84 | 0.1% |
| Scotch-Irish | 277 | 0.4% |
| Scottish | 569 | 0.8% |
| Sierra Leonean | 329 | 0.4% |
| Sioux | 14 | 0.0% |
| Slavic | 23 | 0.0% |
| Slovak | 80 | 0.1% |
| Slovene | 12 | 0.0% |
| Somali | 52 | 0.1% |
| South American | 4,010 | 5.4% |
| South American Indian | 44 | 0.1% |
| Spaniard | 113 | 0.2% |
| Spanish | 168 | 0.2% |
| Sri Lankan | 959 | 1.3% |
| Subsaharan African | 4,191 | 5.7% |
| Sudanese | 202 | 0.3% |
| Swedish | 110 | 0.2% |
| Swiss | 74 | 0.1% |
| Syrian | 14 | 0.0% |
| Thai | 626 | 0.9% |
| Tongan | 8 | 0.0% |
| Trinidadian and Tobagonian | 289 | 0.4% |
| Turkish | 28 | 0.0% |
| U.S. Virgin Islander | 87 | 0.1% |
| Ugandan | 28 | 0.0% |
| Ukrainian | 10 | 0.0% |
| Uruguayan | 65 | 0.1% |
| Venezuelan | 89 | 0.1% |
| Vietnamese | 345 | 0.5% |
| Welsh | 927 | 1.3% |
| West Indian | 25 | 0.0% |
| Yugoslavian | 26 | 0.0% | View All 122 Rows |
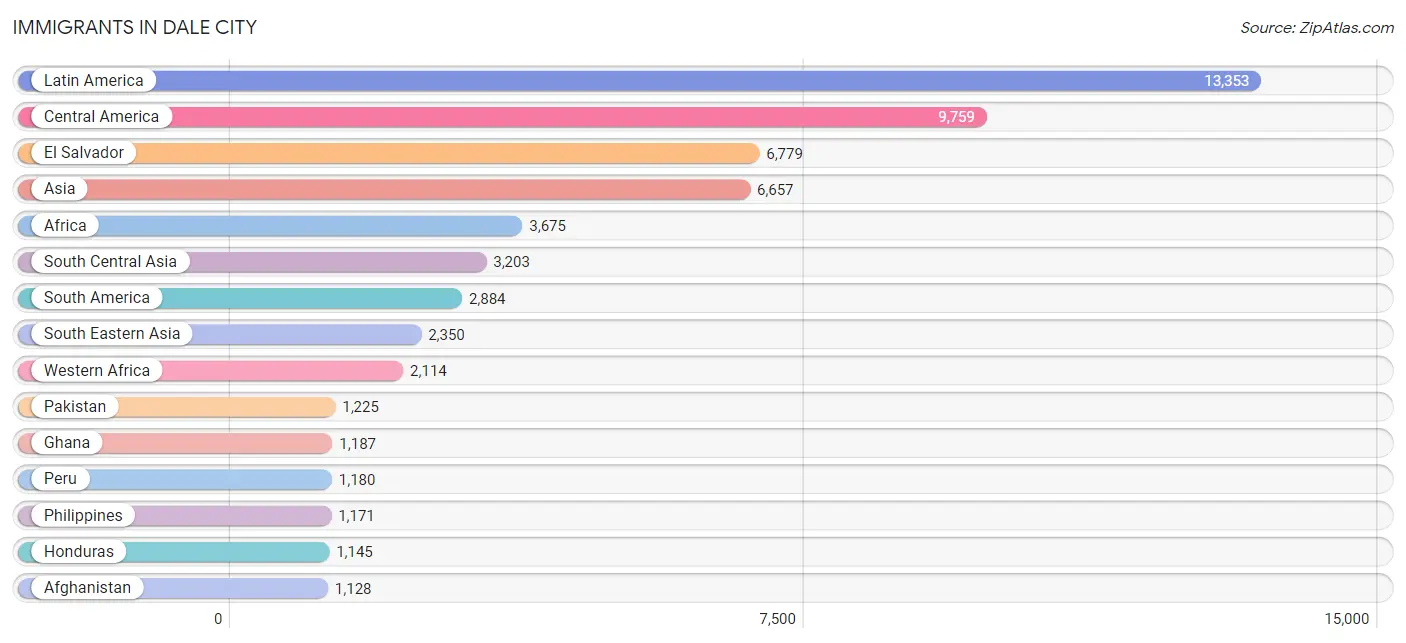
Immigrants in Dale City
The most numerous immigrant groups reported in Dale City came from Latin America (13,353 | 18.1%), Central America (9,759 | 13.2%), El Salvador (6,779 | 9.2%), Asia (6,657 | 9.0%), and Africa (3,675 | 5.0%), together accounting for 54.4% of all Dale City residents.
| Immigration Origin | # Population | % Population |
| Afghanistan | 1,128 | 1.5% |
| Africa | 3,675 | 5.0% |
| Argentina | 123 | 0.2% |
| Asia | 6,657 | 9.0% |
| Australia | 16 | 0.0% |
| Bangladesh | 282 | 0.4% |
| Barbados | 10 | 0.0% |
| Bolivia | 1,121 | 1.5% |
| Bosnia and Herzegovina | 26 | 0.0% |
| Brazil | 123 | 0.2% |
| Bulgaria | 31 | 0.0% |
| Cambodia | 273 | 0.4% |
| Cameroon | 159 | 0.2% |
| Canada | 52 | 0.1% |
| Caribbean | 710 | 1.0% |
| Central America | 9,759 | 13.2% |
| Chile | 6 | 0.0% |
| China | 112 | 0.2% |
| Colombia | 151 | 0.2% |
| Congo | 45 | 0.1% |
| Costa Rica | 14 | 0.0% |
| Cuba | 34 | 0.1% |
| Dominican Republic | 277 | 0.4% |
| Eastern Africa | 832 | 1.1% |
| Eastern Asia | 852 | 1.1% |
| Eastern Europe | 184 | 0.3% |
| Ecuador | 64 | 0.1% |
| Egypt | 153 | 0.2% |
| El Salvador | 6,779 | 9.2% |
| England | 53 | 0.1% |
| Ethiopia | 563 | 0.8% |
| Europe | 582 | 0.8% |
| France | 19 | 0.0% |
| Germany | 208 | 0.3% |
| Ghana | 1,187 | 1.6% |
| Guatemala | 627 | 0.9% |
| Guyana | 30 | 0.0% |
| Haiti | 31 | 0.0% |
| Honduras | 1,145 | 1.5% |
| Hungary | 8 | 0.0% |
| India | 260 | 0.4% |
| Indonesia | 29 | 0.0% |
| Iran | 28 | 0.0% |
| Iraq | 132 | 0.2% |
| Ireland | 10 | 0.0% |
| Israel | 14 | 0.0% |
| Italy | 42 | 0.1% |
| Jamaica | 218 | 0.3% |
| Japan | 37 | 0.1% |
| Jordan | 5 | 0.0% |
| Kenya | 4 | 0.0% |
| Korea | 696 | 0.9% |
| Laos | 43 | 0.1% |
| Latin America | 13,353 | 18.1% |
| Liberia | 21 | 0.0% |
| Mexico | 1,093 | 1.5% |
| Middle Africa | 242 | 0.3% |
| Moldova | 12 | 0.0% |
| Morocco | 89 | 0.1% |
| Nepal | 243 | 0.3% |
| Nicaragua | 31 | 0.0% |
| Nigeria | 230 | 0.3% |
| North Macedonia | 25 | 0.0% |
| Northern Africa | 487 | 0.7% |
| Northern Europe | 76 | 0.1% |
| Oceania | 16 | 0.0% |
| Pakistan | 1,225 | 1.7% |
| Panama | 57 | 0.1% |
| Peru | 1,180 | 1.6% |
| Philippines | 1,171 | 1.6% |
| Poland | 8 | 0.0% |
| Portugal | 20 | 0.0% |
| Romania | 46 | 0.1% |
| Russia | 28 | 0.0% |
| Sierra Leone | 605 | 0.8% |
| Somalia | 84 | 0.1% |
| South America | 2,884 | 3.9% |
| South Central Asia | 3,203 | 4.3% |
| South Eastern Asia | 2,350 | 3.2% |
| Southern Europe | 85 | 0.1% |
| Spain | 23 | 0.0% |
| Sudan | 213 | 0.3% |
| Sweden | 6 | 0.0% |
| Switzerland | 10 | 0.0% |
| Syria | 13 | 0.0% |
| Thailand | 59 | 0.1% |
| Trinidad and Tobago | 127 | 0.2% |
| Uganda | 28 | 0.0% |
| Uruguay | 27 | 0.0% |
| Venezuela | 59 | 0.1% |
| Vietnam | 750 | 1.0% |
| Western Africa | 2,114 | 2.9% |
| Western Asia | 252 | 0.3% |
| Western Europe | 237 | 0.3% |
| Zaire | 29 | 0.0% | View All 95 Rows |
Sex and Age in Dale City
Sex and Age in Dale City
The most populous age groups in Dale City are 35 to 39 Years (3,171 | 8.5%) for men and 35 to 39 Years (3,012 | 8.2%) for women.
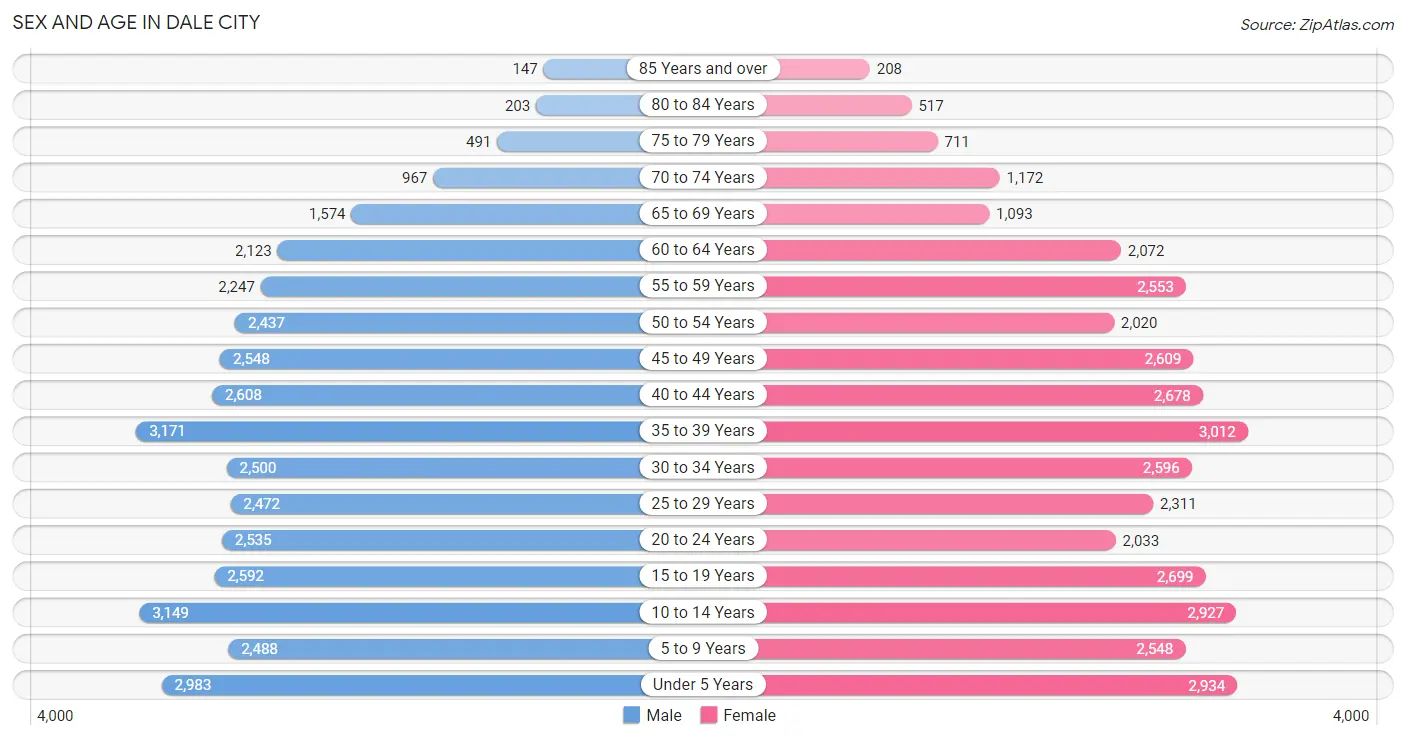
| Age Bracket | Male | Female |
| Under 5 Years | 2,983 (8.0%) | 2,934 (8.0%) |
| 5 to 9 Years | 2,488 (6.7%) | 2,548 (6.9%) |
| 10 to 14 Years | 3,149 (8.5%) | 2,927 (8.0%) |
| 15 to 19 Years | 2,592 (7.0%) | 2,699 (7.4%) |
| 20 to 24 Years | 2,535 (6.8%) | 2,033 (5.5%) |
| 25 to 29 Years | 2,472 (6.6%) | 2,311 (6.3%) |
| 30 to 34 Years | 2,500 (6.7%) | 2,596 (7.1%) |
| 35 to 39 Years | 3,171 (8.5%) | 3,012 (8.2%) |
| 40 to 44 Years | 2,608 (7.0%) | 2,678 (7.3%) |
| 45 to 49 Years | 2,548 (6.8%) | 2,609 (7.1%) |
| 50 to 54 Years | 2,437 (6.5%) | 2,020 (5.5%) |
| 55 to 59 Years | 2,247 (6.0%) | 2,553 (7.0%) |
| 60 to 64 Years | 2,123 (5.7%) | 2,072 (5.7%) |
| 65 to 69 Years | 1,574 (4.2%) | 1,093 (3.0%) |
| 70 to 74 Years | 967 (2.6%) | 1,172 (3.2%) |
| 75 to 79 Years | 491 (1.3%) | 711 (1.9%) |
| 80 to 84 Years | 203 (0.5%) | 517 (1.4%) |
| 85 Years and over | 147 (0.4%) | 208 (0.6%) |
| Total | 37,235 (100.0%) | 36,693 (100.0%) |
Families and Households in Dale City
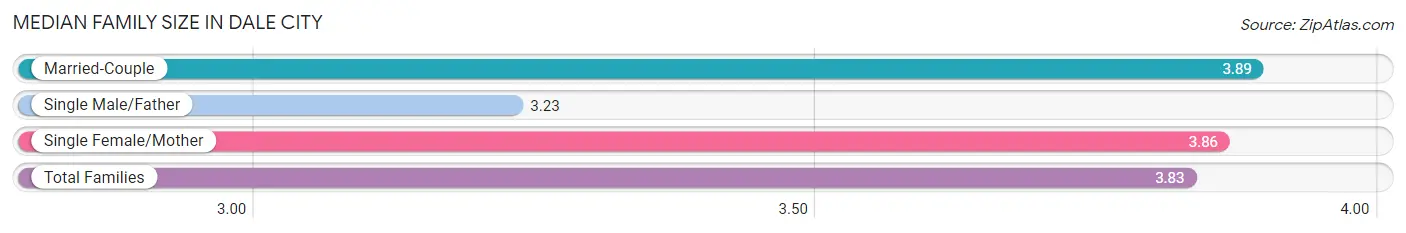
Median Family Size in Dale City
The median family size in Dale City is 3.83 persons per family, with married-couple families (12,992 | 76.6%) accounting for the largest median family size of 3.89 persons per family. On the other hand, single male/father families (1,384 | 8.2%) represent the smallest median family size with 3.23 persons per family.
| Family Type | # Families | Family Size |
| Married-Couple | 12,992 (76.6%) | 3.89 |
| Single Male/Father | 1,384 (8.2%) | 3.23 |
| Single Female/Mother | 2,584 (15.2%) | 3.86 |
| Total Families | 16,960 (100.0%) | 3.83 |
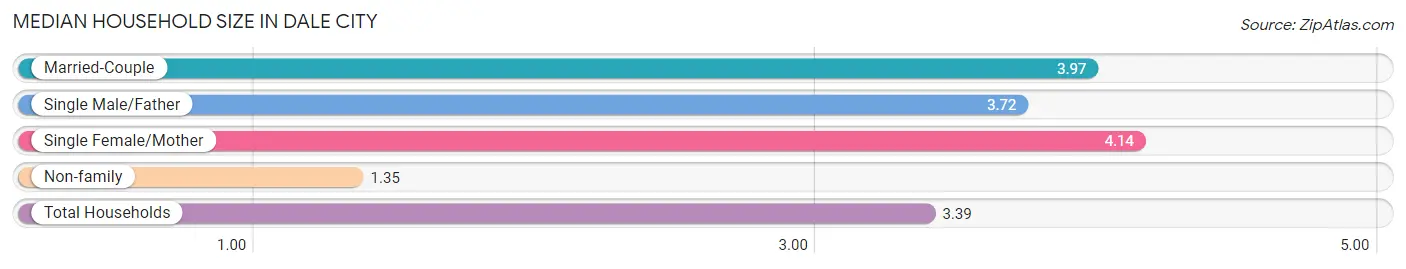
Median Household Size in Dale City
The median household size in Dale City is 3.39 persons per household, with single female/mother households (2,584 | 11.9%) accounting for the largest median household size of 4.14 persons per household. non-family households (4,808 | 22.1%) represent the smallest median household size with 1.35 persons per household.
| Household Type | # Households | Household Size |
| Married-Couple | 12,992 (59.7%) | 3.97 |
| Single Male/Father | 1,384 (6.4%) | 3.72 |
| Single Female/Mother | 2,584 (11.9%) | 4.14 |
| Non-family | 4,808 (22.1%) | 1.35 |
| Total Households | 21,768 (100.0%) | 3.39 |
Household Size by Marriage Status in Dale City
Out of a total of 21,768 households in Dale City, 16,960 (77.9%) are family households, while 4,808 (22.1%) are nonfamily households. The most numerous type of family households are 2-person households, comprising 5,007, and the most common type of nonfamily households are 1-person households, comprising 3,774.
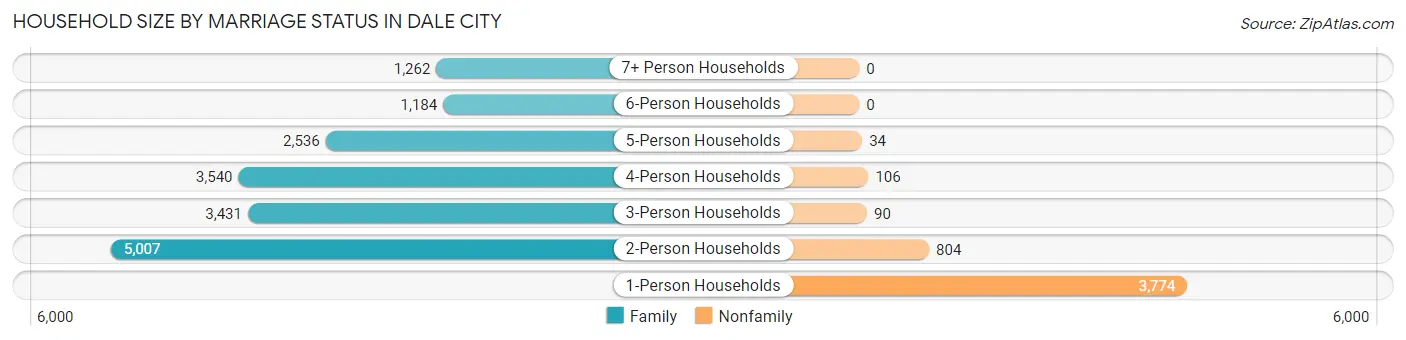
| Household Size | Family Households | Nonfamily Households |
| 1-Person Households | - | 3,774 (17.3%) |
| 2-Person Households | 5,007 (23.0%) | 804 (3.7%) |
| 3-Person Households | 3,431 (15.8%) | 90 (0.4%) |
| 4-Person Households | 3,540 (16.3%) | 106 (0.5%) |
| 5-Person Households | 2,536 (11.7%) | 34 (0.2%) |
| 6-Person Households | 1,184 (5.4%) | 0 (0.0%) |
| 7+ Person Households | 1,262 (5.8%) | 0 (0.0%) |
| Total | 16,960 (77.9%) | 4,808 (22.1%) |
Female Fertility in Dale City
Fertility by Age in Dale City
Average fertility rate in Dale City is 60.0 births per 1,000 women. Women in the age bracket of 20 to 34 years have the highest fertility rate with 101.0 births per 1,000 women. Women in the age bracket of 20 to 34 years acount for 63.9% of all women with births.
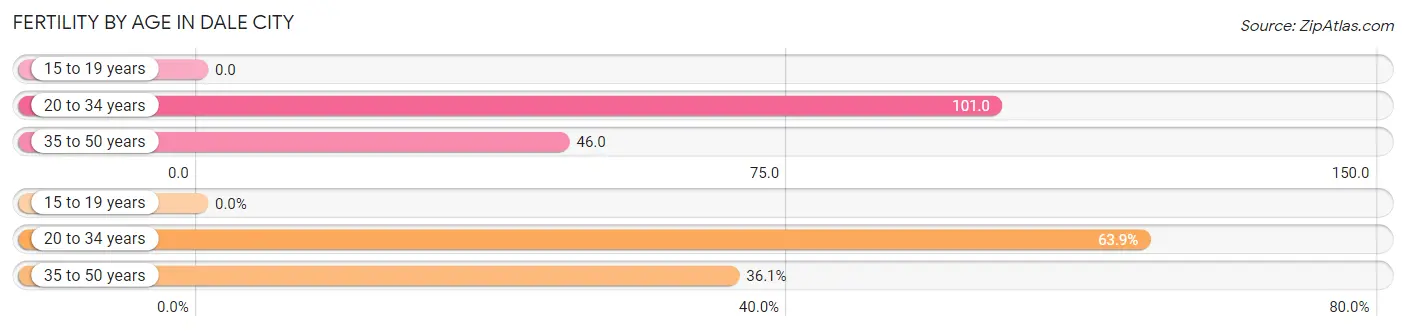
| Age Bracket | Women with Births | Births / 1,000 Women |
| 15 to 19 years | 0 (0.0%) | 0.0 |
| 20 to 34 years | 704 (63.9%) | 101.0 |
| 35 to 50 years | 397 (36.1%) | 46.0 |
| Total | 1,101 (100.0%) | 60.0 |
Fertility by Age by Marriage Status in Dale City
74.8% of women with births (1,101) in Dale City are married. The highest percentage of unmarried women with births falls into 20 to 34 years age bracket with 26.1% of them unmarried at the time of birth, while the lowest percentage of unmarried women with births belong to 35 to 50 years age bracket with 23.7% of them unmarried.
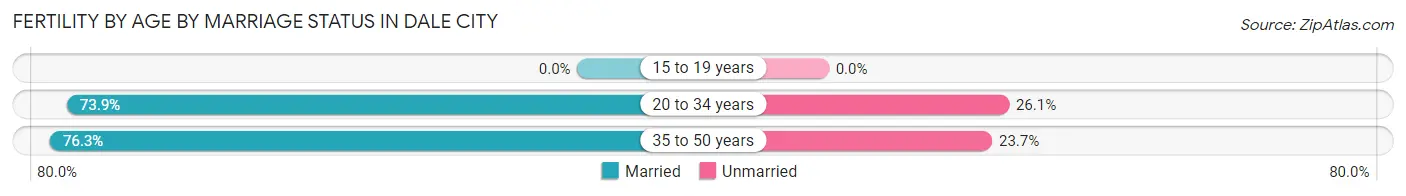
| Age Bracket | Married | Unmarried |
| 15 to 19 years | 0 (0.0%) | 0 (0.0%) |
| 20 to 34 years | 520 (73.9%) | 184 (26.1%) |
| 35 to 50 years | 303 (76.3%) | 94 (23.7%) |
| Total | 824 (74.8%) | 277 (25.2%) |
Fertility by Education in Dale City
Average fertility rate in Dale City is 60.0 births per 1,000 women. Women with the education attainment of college or associate's degree have the highest fertility rate of 83.0 births per 1,000 women, while women with the education attainment of less than high school have the lowest fertility at 16.0 births per 1,000 women. Women with the education attainment of college or associate's degree represent 41.8% of all women with births.
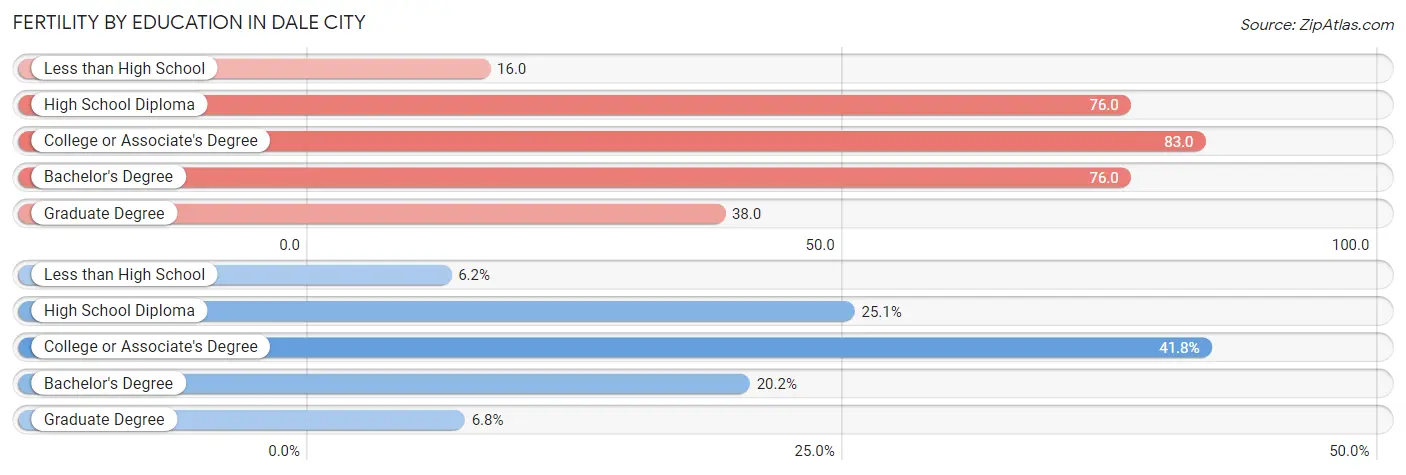
| Educational Attainment | Women with Births | Births / 1,000 Women |
| Less than High School | 68 (6.2%) | 16.0 |
| High School Diploma | 276 (25.1%) | 76.0 |
| College or Associate's Degree | 460 (41.8%) | 83.0 |
| Bachelor's Degree | 222 (20.2%) | 76.0 |
| Graduate Degree | 75 (6.8%) | 38.0 |
| Total | 1,101 (100.0%) | 60.0 |
Fertility by Education by Marriage Status in Dale City
25.2% of women with births in Dale City are unmarried. Women with the educational attainment of graduate degree are most likely to be married with 100.0% of them married at childbirth, while women with the educational attainment of high school diploma are least likely to be married with 38.4% of them unmarried at childbirth.
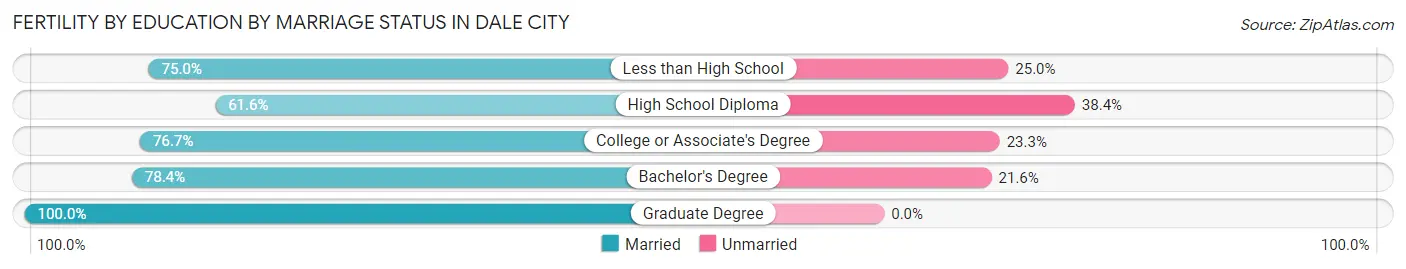
| Educational Attainment | Married | Unmarried |
| Less than High School | 51 (75.0%) | 17 (25.0%) |
| High School Diploma | 170 (61.6%) | 106 (38.4%) |
| College or Associate's Degree | 353 (76.7%) | 107 (23.3%) |
| Bachelor's Degree | 174 (78.4%) | 48 (21.6%) |
| Graduate Degree | 75 (100.0%) | 0 (0.0%) |
| Total | 824 (74.8%) | 277 (25.2%) |
Employment Characteristics in Dale City
Employment by Class of Employer in Dale City
Among the 38,215 employed individuals in Dale City, private company employees (22,957 | 60.1%), federal government employees (5,066 | 13.3%), and not-for-profit organizations (3,198 | 8.4%) make up the most common classes of employment.
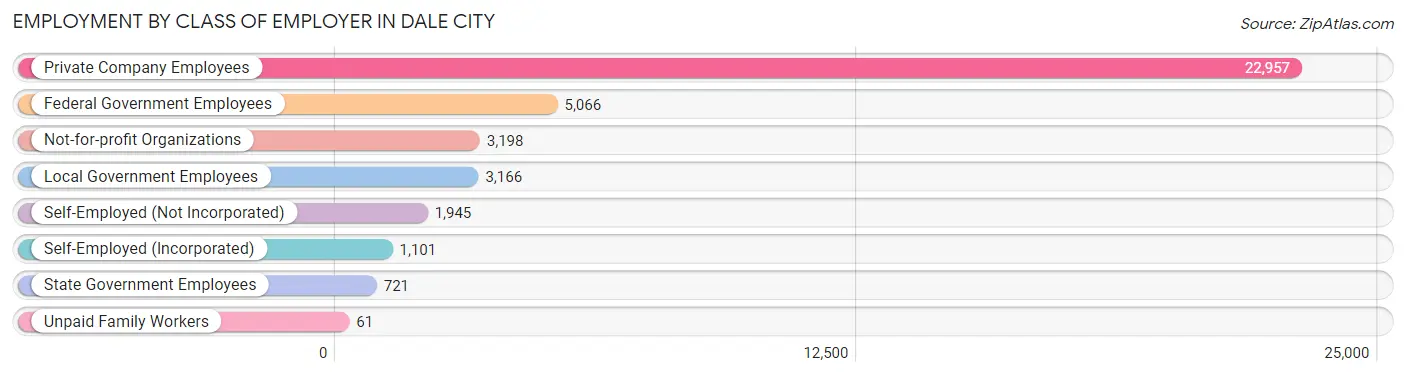
| Employer Class | # Employees | % Employees |
| Private Company Employees | 22,957 | 60.1% |
| Self-Employed (Incorporated) | 1,101 | 2.9% |
| Self-Employed (Not Incorporated) | 1,945 | 5.1% |
| Not-for-profit Organizations | 3,198 | 8.4% |
| Local Government Employees | 3,166 | 8.3% |
| State Government Employees | 721 | 1.9% |
| Federal Government Employees | 5,066 | 13.3% |
| Unpaid Family Workers | 61 | 0.2% |
| Total | 38,215 | 100.0% |
Employment Status by Age in Dale City
According to the labor force statistics for Dale City, out of the total population over 16 years of age (55,867), 73.0% or 40,783 individuals are in the labor force, with 4.6% or 1,876 of them unemployed. The age group with the highest labor force participation rate is 30 to 34 years, with 91.6% or 4,668 individuals in the labor force. Within the labor force, the 16 to 19 years age range has the highest percentage of unemployed individuals, with 11.7% or 185 of them being unemployed.
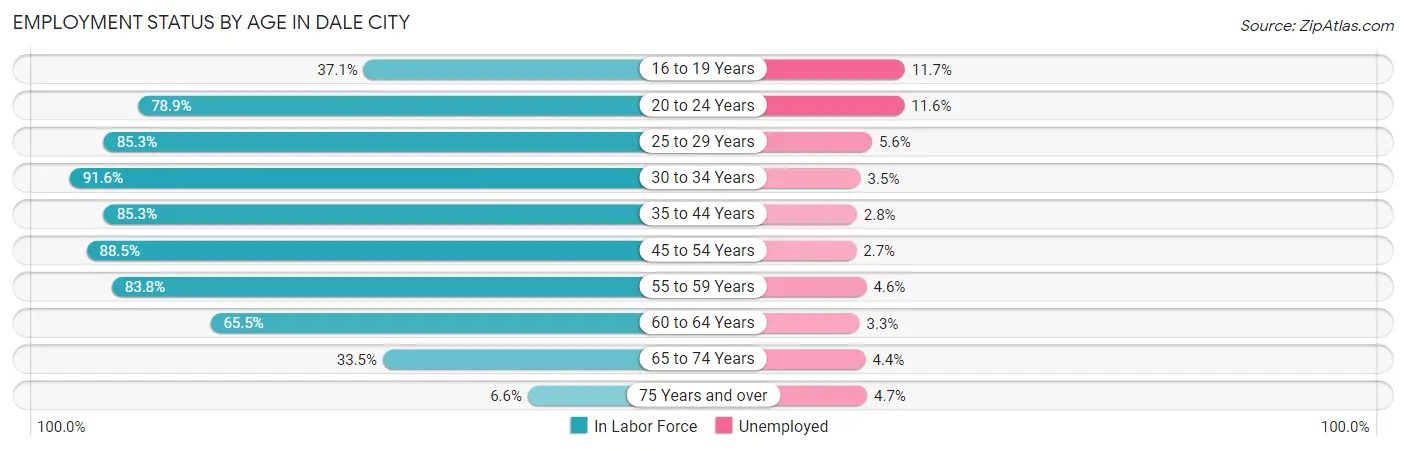
| Age Bracket | In Labor Force | Unemployed |
| 16 to 19 Years | 1,580 (37.1%) | 185 (11.7%) |
| 20 to 24 Years | 3,604 (78.9%) | 418 (11.6%) |
| 25 to 29 Years | 4,080 (85.3%) | 228 (5.6%) |
| 30 to 34 Years | 4,668 (91.6%) | 163 (3.5%) |
| 35 to 44 Years | 9,783 (85.3%) | 274 (2.8%) |
| 45 to 54 Years | 8,508 (88.5%) | 230 (2.7%) |
| 55 to 59 Years | 4,022 (83.8%) | 185 (4.6%) |
| 60 to 64 Years | 2,748 (65.5%) | 91 (3.3%) |
| 65 to 74 Years | 1,610 (33.5%) | 71 (4.4%) |
| 75 Years and over | 150 (6.6%) | 7 (4.7%) |
| Total | 40,783 (73.0%) | 1,876 (4.6%) |
Employment Status by Educational Attainment in Dale City
According to labor force statistics for Dale City, 84.6% of individuals (33,804) out of the total population between 25 and 64 years of age (39,957) are in the labor force, with 3.5% or 1,183 of them being unemployed. The group with the highest labor force participation rate are those with the educational attainment of bachelor's degree or higher, with 88.9% or 11,607 individuals in the labor force. Within the labor force, individuals with high school diploma education have the highest percentage of unemployment, with 5.2% or 416 of them being unemployed.
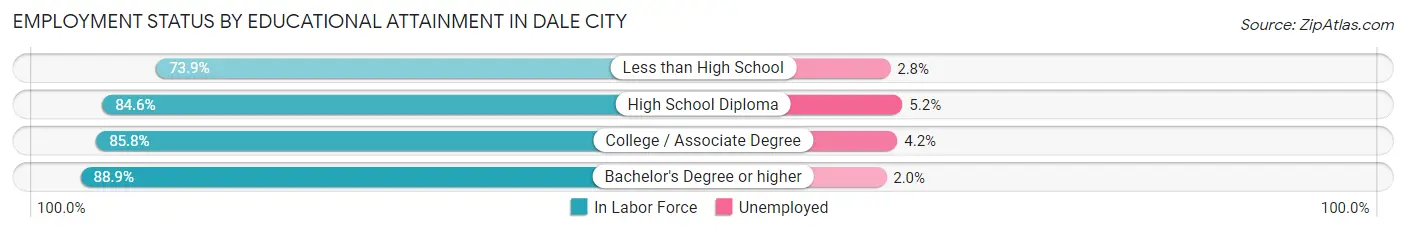
| Educational Attainment | In Labor Force | Unemployed |
| Less than High School | 4,744 (73.9%) | 180 (2.8%) |
| High School Diploma | 7,995 (84.6%) | 491 (5.2%) |
| College / Associate Degree | 9,465 (85.8%) | 463 (4.2%) |
| Bachelor's Degree or higher | 11,607 (88.9%) | 261 (2.0%) |
| Total | 33,804 (84.6%) | 1,398 (3.5%) |
Employment Occupations by Sex in Dale City
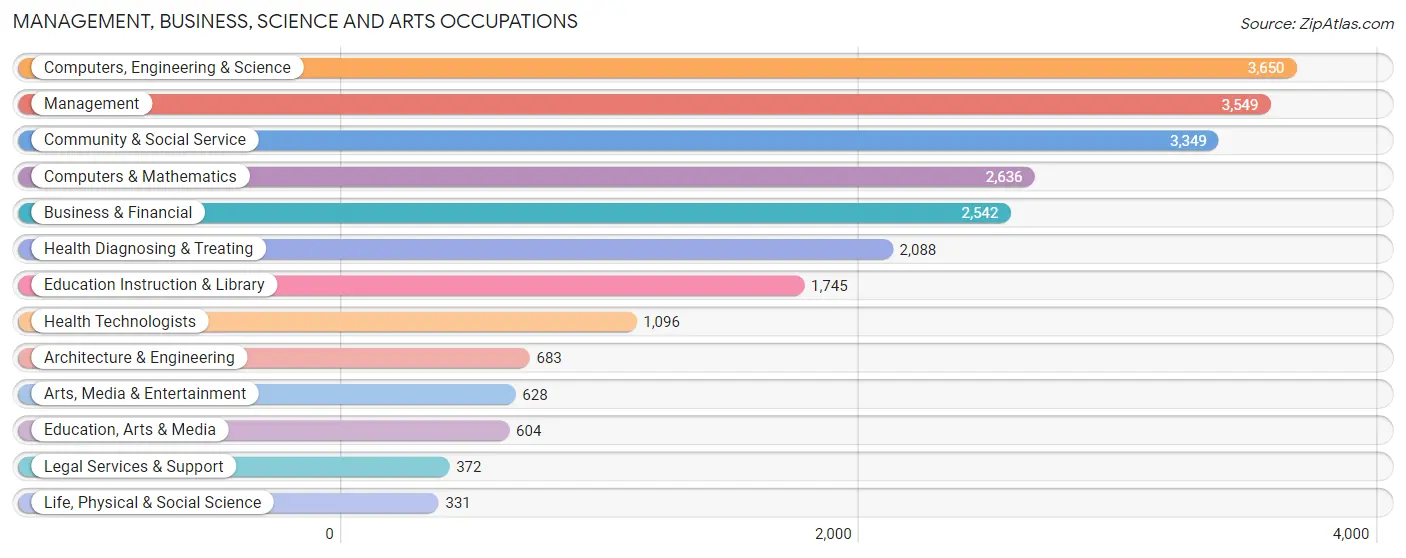
Management, Business, Science and Arts Occupations
The most common Management, Business, Science and Arts occupations in Dale City are Computers, Engineering & Science (3,650 | 9.5%), Management (3,549 | 9.2%), Community & Social Service (3,349 | 8.7%), Computers & Mathematics (2,636 | 6.8%), and Business & Financial (2,542 | 6.6%).
Management, Business, Science and Arts Occupations by Sex
Within the Management, Business, Science and Arts occupations in Dale City, the most male-oriented occupations are Architecture & Engineering (81.1%), Computers & Mathematics (73.0%), and Computers, Engineering & Science (72.1%), while the most female-oriented occupations are Health Technologists (82.3%), Education Instruction & Library (80.7%), and Health Diagnosing & Treating (71.3%).
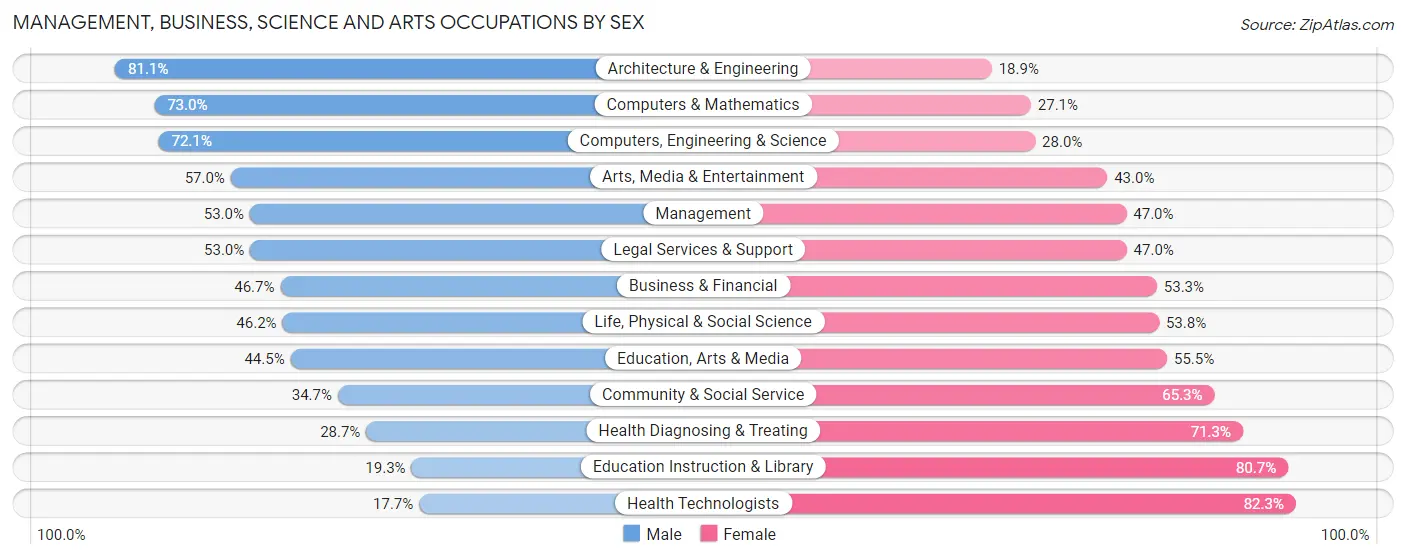
| Occupation | Male | Female |
| Management | 1,882 (53.0%) | 1,667 (47.0%) |
| Business & Financial | 1,186 (46.7%) | 1,356 (53.3%) |
| Computers, Engineering & Science | 2,630 (72.1%) | 1,020 (28.0%) |
| Computers & Mathematics | 1,923 (73.0%) | 713 (27.1%) |
| Architecture & Engineering | 554 (81.1%) | 129 (18.9%) |
| Life, Physical & Social Science | 153 (46.2%) | 178 (53.8%) |
| Community & Social Service | 1,161 (34.7%) | 2,188 (65.3%) |
| Education, Arts & Media | 269 (44.5%) | 335 (55.5%) |
| Legal Services & Support | 197 (53.0%) | 175 (47.0%) |
| Education Instruction & Library | 337 (19.3%) | 1,408 (80.7%) |
| Arts, Media & Entertainment | 358 (57.0%) | 270 (43.0%) |
| Health Diagnosing & Treating | 600 (28.7%) | 1,488 (71.3%) |
| Health Technologists | 194 (17.7%) | 902 (82.3%) |
| Total (Category) | 7,459 (49.1%) | 7,719 (50.9%) |
| Total (Overall) | 20,851 (54.1%) | 17,683 (45.9%) |
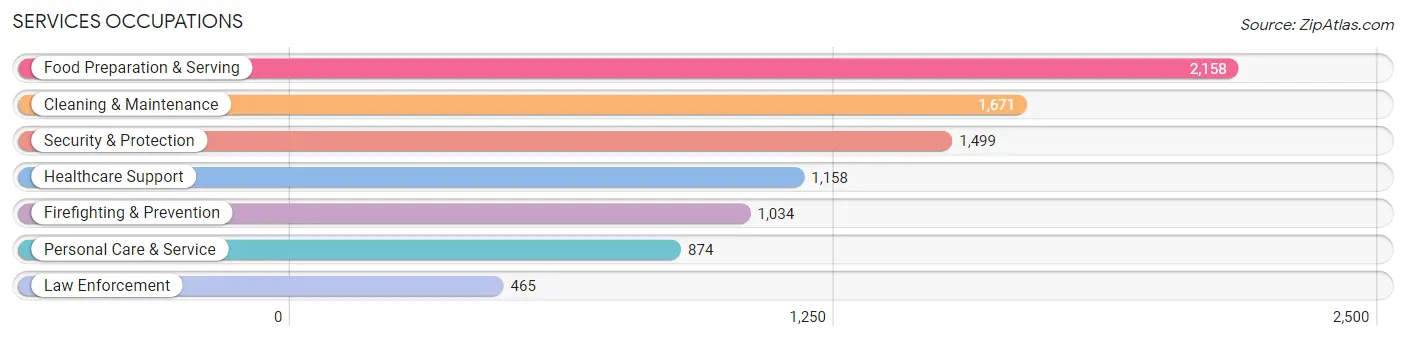
Services Occupations
The most common Services occupations in Dale City are Food Preparation & Serving (2,158 | 5.6%), Cleaning & Maintenance (1,671 | 4.3%), Security & Protection (1,499 | 3.9%), Healthcare Support (1,158 | 3.0%), and Firefighting & Prevention (1,034 | 2.7%).
Services Occupations by Sex
Within the Services occupations in Dale City, the most male-oriented occupations are Law Enforcement (74.0%), Security & Protection (65.6%), and Firefighting & Prevention (61.9%), while the most female-oriented occupations are Healthcare Support (87.1%), Personal Care & Service (83.0%), and Food Preparation & Serving (62.8%).
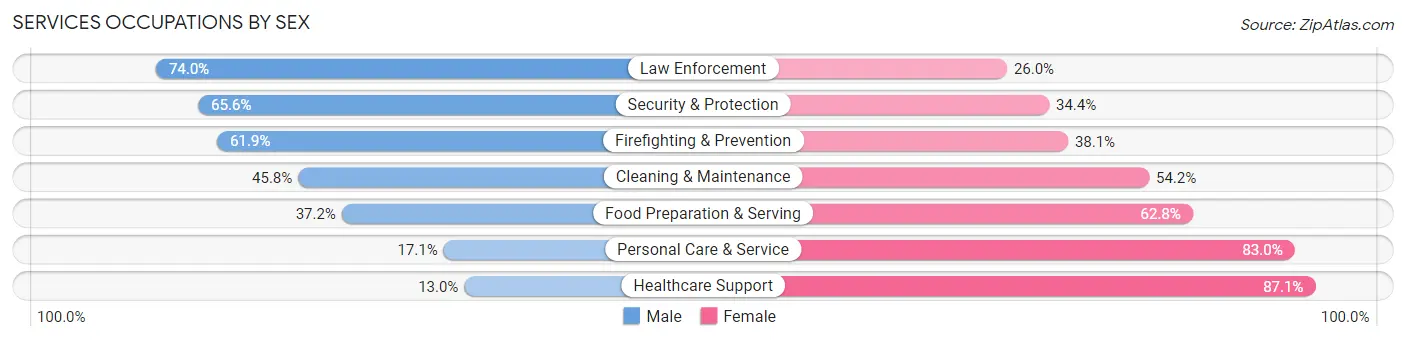
| Occupation | Male | Female |
| Healthcare Support | 150 (13.0%) | 1,008 (87.1%) |
| Security & Protection | 984 (65.6%) | 515 (34.4%) |
| Firefighting & Prevention | 640 (61.9%) | 394 (38.1%) |
| Law Enforcement | 344 (74.0%) | 121 (26.0%) |
| Food Preparation & Serving | 803 (37.2%) | 1,355 (62.8%) |
| Cleaning & Maintenance | 766 (45.8%) | 905 (54.2%) |
| Personal Care & Service | 149 (17.1%) | 725 (83.0%) |
| Total (Category) | 2,852 (38.8%) | 4,508 (61.3%) |
| Total (Overall) | 20,851 (54.1%) | 17,683 (45.9%) |
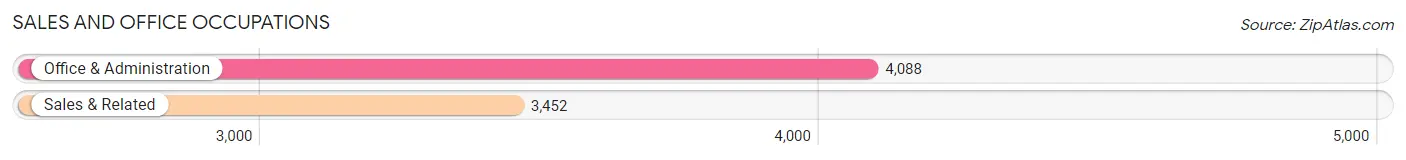
Sales and Office Occupations
The most common Sales and Office occupations in Dale City are Office & Administration (4,088 | 10.6%), and Sales & Related (3,452 | 9.0%).
Sales and Office Occupations by Sex
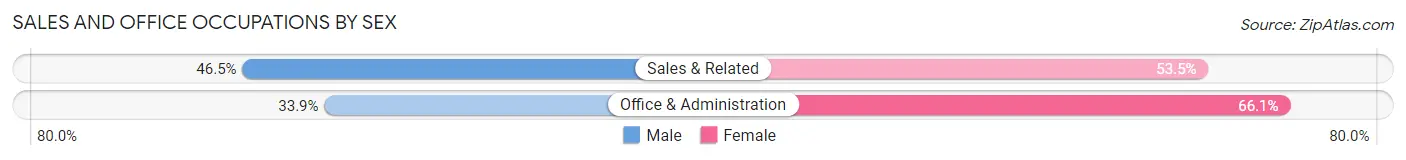
| Occupation | Male | Female |
| Sales & Related | 1,605 (46.5%) | 1,847 (53.5%) |
| Office & Administration | 1,385 (33.9%) | 2,703 (66.1%) |
| Total (Category) | 2,990 (39.7%) | 4,550 (60.3%) |
| Total (Overall) | 20,851 (54.1%) | 17,683 (45.9%) |
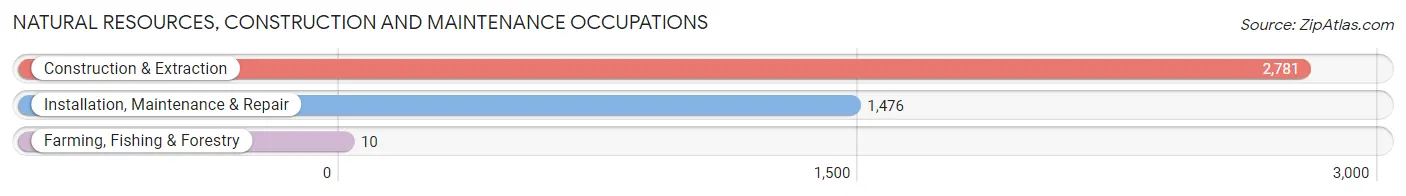
Natural Resources, Construction and Maintenance Occupations
The most common Natural Resources, Construction and Maintenance occupations in Dale City are Construction & Extraction (2,781 | 7.2%), Installation, Maintenance & Repair (1,476 | 3.8%), and Farming, Fishing & Forestry (10 | 0.0%).
Natural Resources, Construction and Maintenance Occupations by Sex
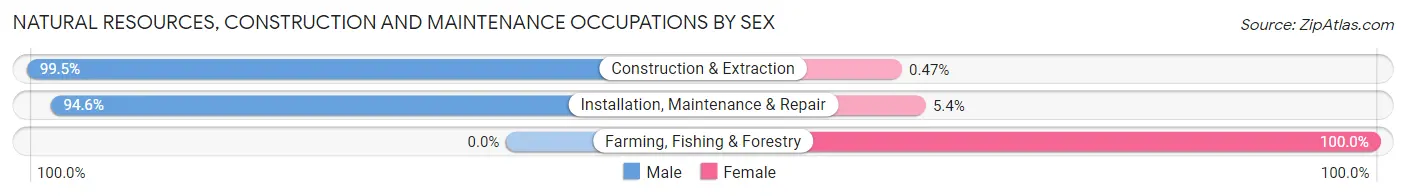
| Occupation | Male | Female |
| Farming, Fishing & Forestry | 0 (0.0%) | 10 (100.0%) |
| Construction & Extraction | 2,768 (99.5%) | 13 (0.5%) |
| Installation, Maintenance & Repair | 1,396 (94.6%) | 80 (5.4%) |
| Total (Category) | 4,164 (97.6%) | 103 (2.4%) |
| Total (Overall) | 20,851 (54.1%) | 17,683 (45.9%) |
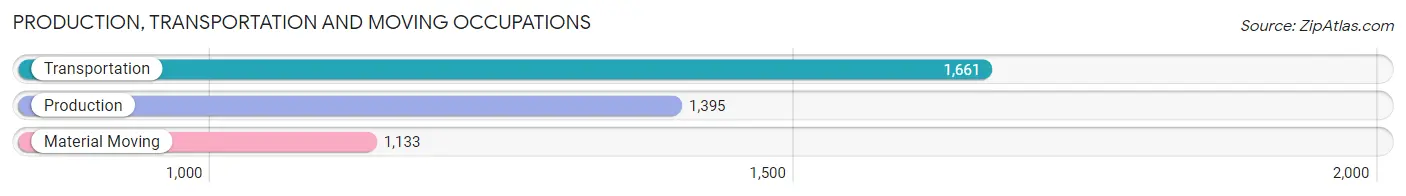
Production, Transportation and Moving Occupations
The most common Production, Transportation and Moving occupations in Dale City are Transportation (1,661 | 4.3%), Production (1,395 | 3.6%), and Material Moving (1,133 | 2.9%).
Production, Transportation and Moving Occupations by Sex
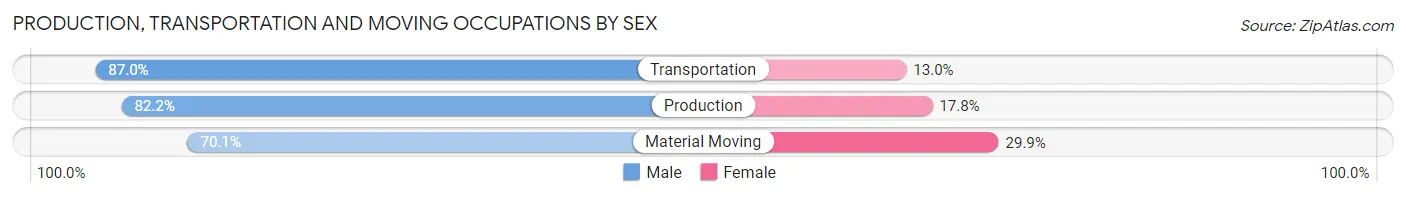
| Occupation | Male | Female |
| Production | 1,147 (82.2%) | 248 (17.8%) |
| Transportation | 1,445 (87.0%) | 216 (13.0%) |
| Material Moving | 794 (70.1%) | 339 (29.9%) |
| Total (Category) | 3,386 (80.8%) | 803 (19.2%) |
| Total (Overall) | 20,851 (54.1%) | 17,683 (45.9%) |
Employment Industries by Sex in Dale City
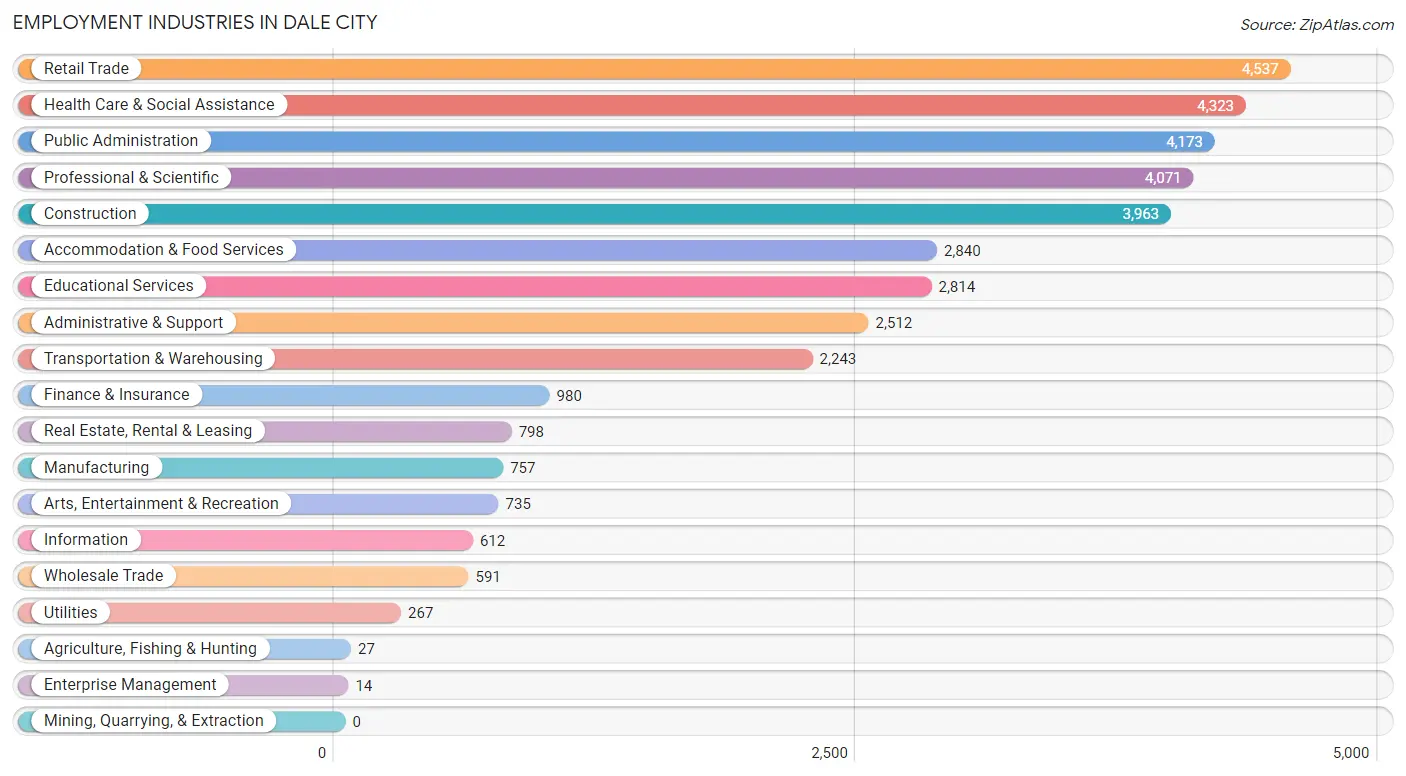
Employment Industries in Dale City
The major employment industries in Dale City include Retail Trade (4,537 | 11.8%), Health Care & Social Assistance (4,323 | 11.2%), Public Administration (4,173 | 10.8%), Professional & Scientific (4,071 | 10.6%), and Construction (3,963 | 10.3%).
Employment Industries by Sex in Dale City
The Dale City industries that see more men than women are Construction (91.7%), Utilities (88.4%), and Transportation & Warehousing (80.7%), whereas the industries that tend to have a higher number of women are Agriculture, Fishing & Hunting (100.0%), Enterprise Management (100.0%), and Health Care & Social Assistance (77.9%).
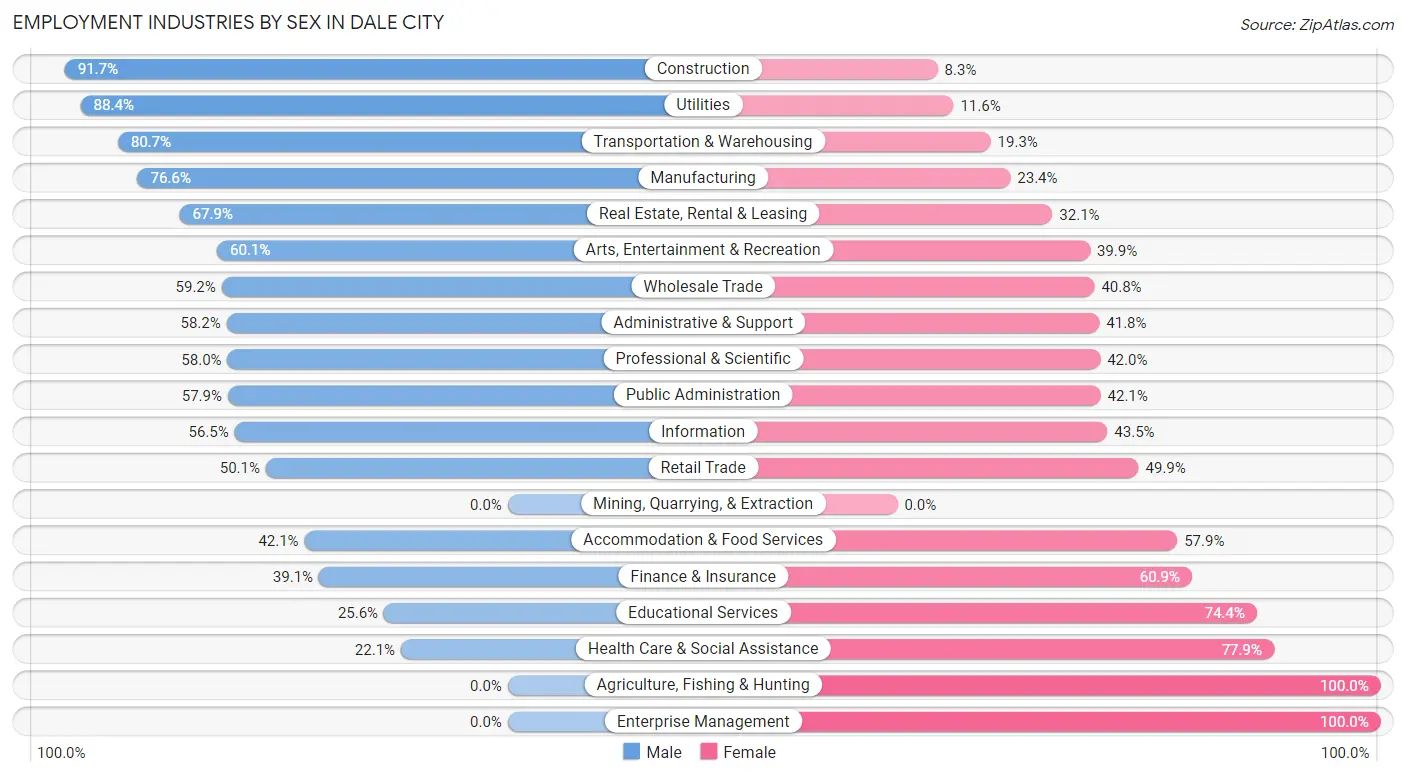
| Industry | Male | Female |
| Agriculture, Fishing & Hunting | 0 (0.0%) | 27 (100.0%) |
| Mining, Quarrying, & Extraction | 0 (0.0%) | 0 (0.0%) |
| Construction | 3,633 (91.7%) | 330 (8.3%) |
| Manufacturing | 580 (76.6%) | 177 (23.4%) |
| Wholesale Trade | 350 (59.2%) | 241 (40.8%) |
| Retail Trade | 2,272 (50.1%) | 2,265 (49.9%) |
| Transportation & Warehousing | 1,810 (80.7%) | 433 (19.3%) |
| Utilities | 236 (88.4%) | 31 (11.6%) |
| Information | 346 (56.5%) | 266 (43.5%) |
| Finance & Insurance | 383 (39.1%) | 597 (60.9%) |
| Real Estate, Rental & Leasing | 542 (67.9%) | 256 (32.1%) |
| Professional & Scientific | 2,362 (58.0%) | 1,709 (42.0%) |
| Enterprise Management | 0 (0.0%) | 14 (100.0%) |
| Administrative & Support | 1,462 (58.2%) | 1,050 (41.8%) |
| Educational Services | 721 (25.6%) | 2,093 (74.4%) |
| Health Care & Social Assistance | 956 (22.1%) | 3,367 (77.9%) |
| Arts, Entertainment & Recreation | 442 (60.1%) | 293 (39.9%) |
| Accommodation & Food Services | 1,195 (42.1%) | 1,645 (57.9%) |
| Public Administration | 2,418 (57.9%) | 1,755 (42.1%) |
| Total | 20,851 (54.1%) | 17,683 (45.9%) |
Education in Dale City
School Enrollment in Dale City
The most common levels of schooling among the 20,255 students in Dale City are high school (5,118 | 25.3%), middle school (4,793 | 23.7%), and college / undergraduate (3,851 | 19.0%).
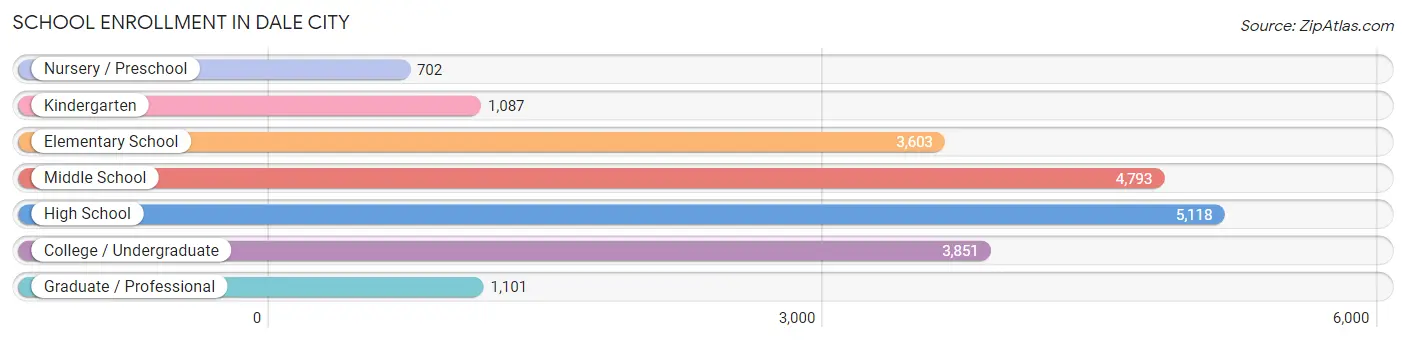
| School Level | # Students | % Students |
| Nursery / Preschool | 702 | 3.5% |
| Kindergarten | 1,087 | 5.4% |
| Elementary School | 3,603 | 17.8% |
| Middle School | 4,793 | 23.7% |
| High School | 5,118 | 25.3% |
| College / Undergraduate | 3,851 | 19.0% |
| Graduate / Professional | 1,101 | 5.4% |
| Total | 20,255 | 100.0% |
School Enrollment by Age by Funding Source in Dale City
Out of a total of 20,255 students who are enrolled in schools in Dale City, 2,350 (11.6%) attend a private institution, while the remaining 17,905 (88.4%) are enrolled in public schools. The age group of 3 to 4 year olds has the highest likelihood of being enrolled in private schools, with 252 (56.5% in the age bracket) enrolled. Conversely, the age group of 15 to 17 year olds has the lowest likelihood of being enrolled in a private school, with 3,067 (96.8% in the age bracket) attending a public institution.
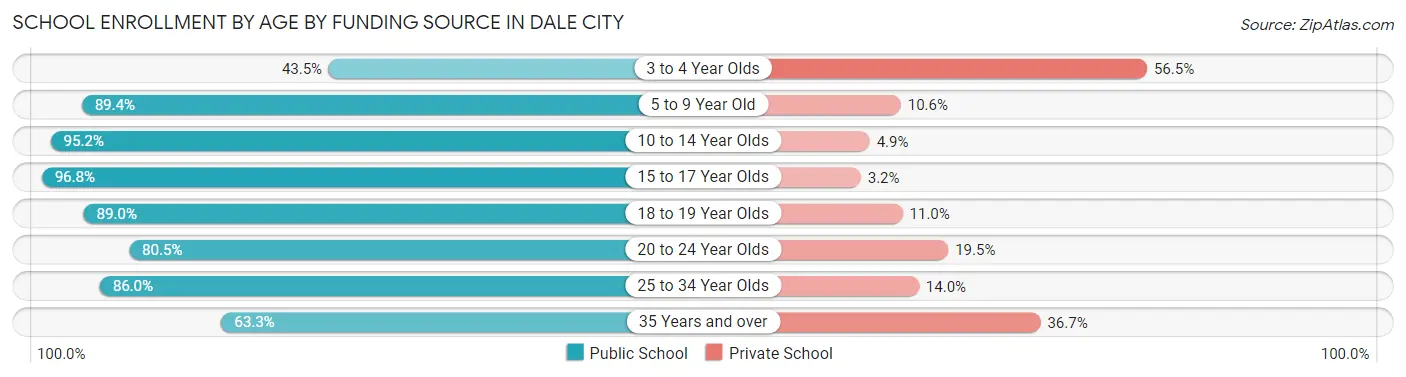
| Age Bracket | Public School | Private School |
| 3 to 4 Year Olds | 194 (43.5%) | 252 (56.5%) |
| 5 to 9 Year Old | 4,097 (89.4%) | 488 (10.6%) |
| 10 to 14 Year Olds | 5,507 (95.2%) | 281 (4.9%) |
| 15 to 17 Year Olds | 3,067 (96.8%) | 101 (3.2%) |
| 18 to 19 Year Olds | 1,484 (89.0%) | 183 (11.0%) |
| 20 to 24 Year Olds | 1,463 (80.5%) | 354 (19.5%) |
| 25 to 34 Year Olds | 1,221 (86.0%) | 199 (14.0%) |
| 35 Years and over | 864 (63.3%) | 500 (36.7%) |
| Total | 17,905 (88.4%) | 2,350 (11.6%) |
Educational Attainment by Field of Study in Dale City
Business (3,544 | 22.0%), social sciences (1,651 | 10.2%), computers & mathematics (1,644 | 10.2%), education (1,409 | 8.7%), and science & technology (1,256 | 7.8%) are the most common fields of study among 16,141 individuals in Dale City who have obtained a bachelor's degree or higher.
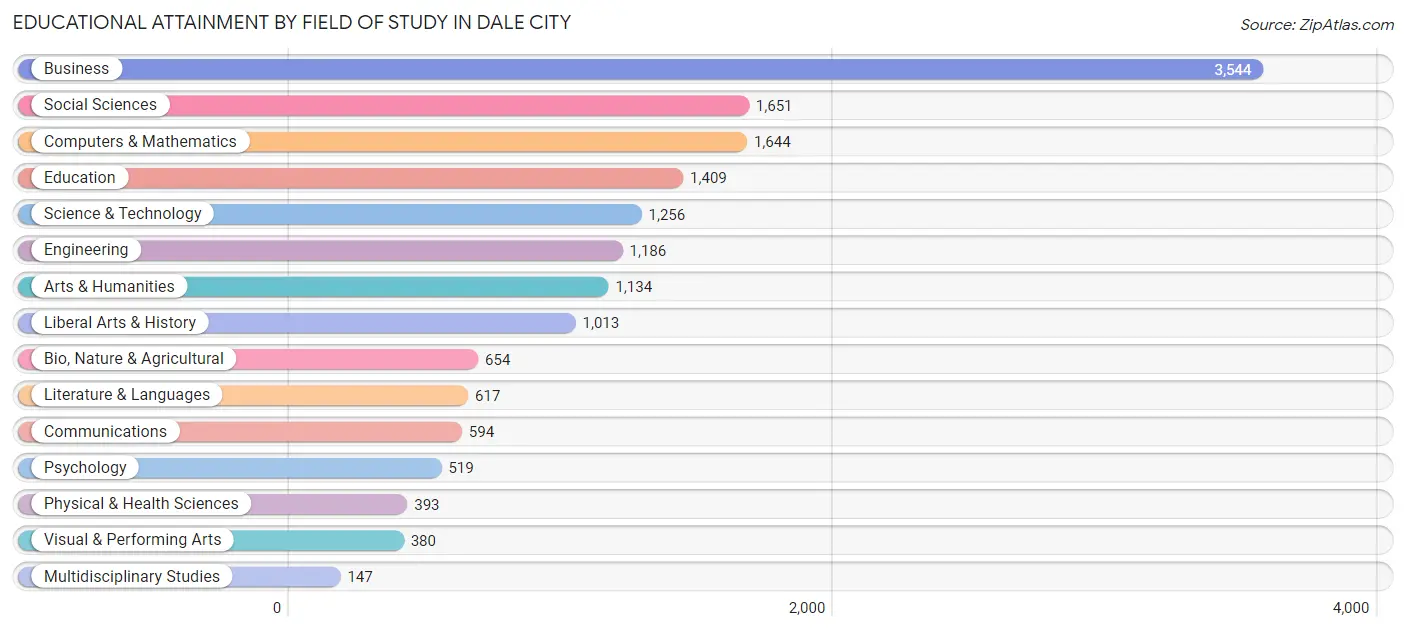
| Field of Study | # Graduates | % Graduates |
| Computers & Mathematics | 1,644 | 10.2% |
| Bio, Nature & Agricultural | 654 | 4.1% |
| Physical & Health Sciences | 393 | 2.4% |
| Psychology | 519 | 3.2% |
| Social Sciences | 1,651 | 10.2% |
| Engineering | 1,186 | 7.3% |
| Multidisciplinary Studies | 147 | 0.9% |
| Science & Technology | 1,256 | 7.8% |
| Business | 3,544 | 22.0% |
| Education | 1,409 | 8.7% |
| Literature & Languages | 617 | 3.8% |
| Liberal Arts & History | 1,013 | 6.3% |
| Visual & Performing Arts | 380 | 2.4% |
| Communications | 594 | 3.7% |
| Arts & Humanities | 1,134 | 7.0% |
| Total | 16,141 | 100.0% |
Transportation & Commute in Dale City
Vehicle Availability by Sex in Dale City
The most prevalent vehicle ownership categories in Dale City are males with 2 vehicles (7,745, accounting for 37.0%) and females with 2 vehicles (6,314, making up 44.8%).
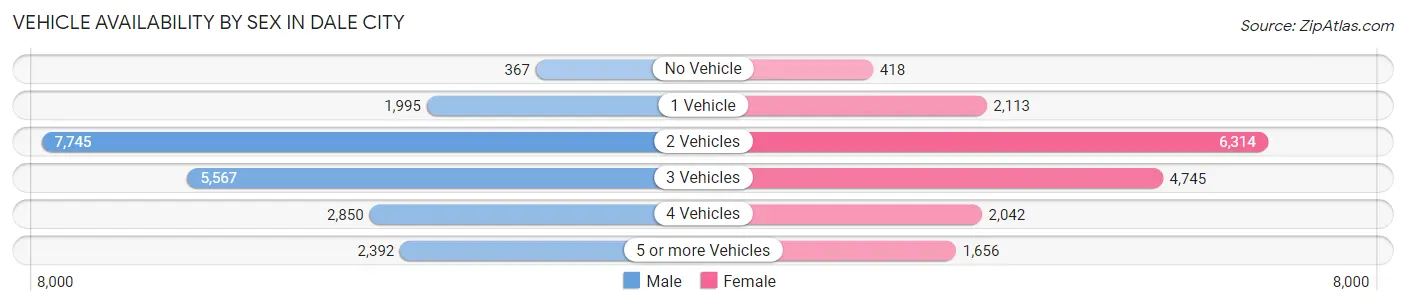
| Vehicles Available | Male | Female |
| No Vehicle | 367 (1.8%) | 418 (2.4%) |
| 1 Vehicle | 1,995 (9.5%) | 2,113 (12.2%) |
| 2 Vehicles | 7,745 (37.0%) | 6,314 (36.5%) |
| 3 Vehicles | 5,567 (26.6%) | 4,745 (27.5%) |
| 4 Vehicles | 2,850 (13.6%) | 2,042 (11.8%) |
| 5 or more Vehicles | 2,392 (11.4%) | 1,656 (9.6%) |
| Total | 20,916 (100.0%) | 17,288 (100.0%) |
Commute Time in Dale City
The most frequently occuring commute durations in Dale City are 45 to 59 minutes (6,883 commuters, 20.3%), 60 to 89 minutes (5,881 commuters, 17.4%), and 30 to 34 minutes (5,863 commuters, 17.3%).
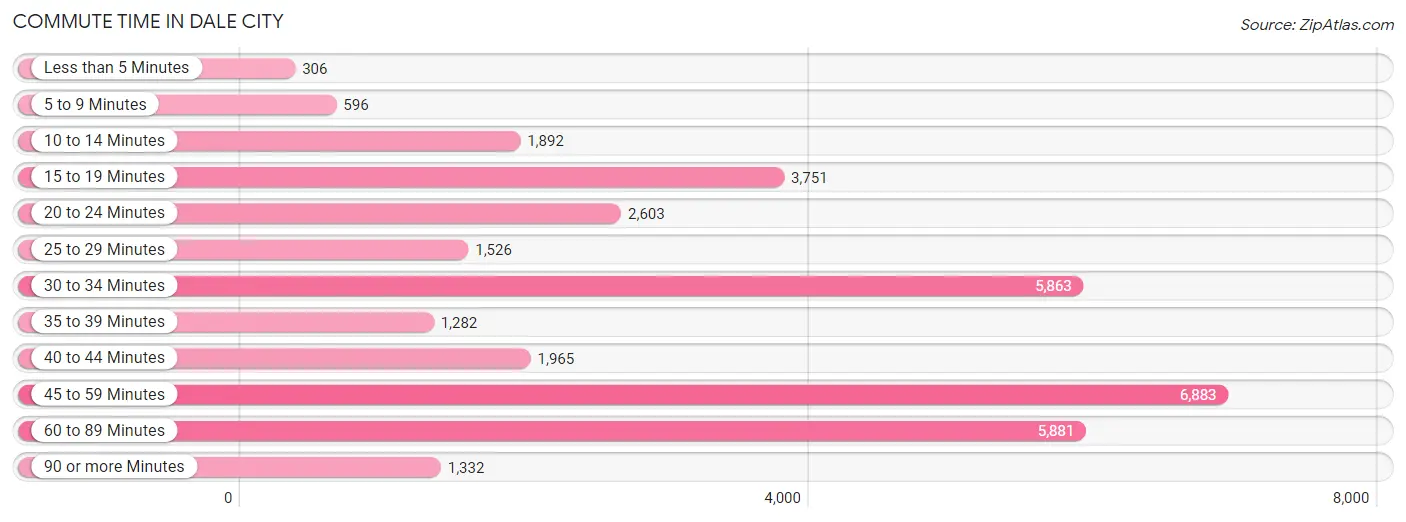
| Commute Time | # Commuters | % Commuters |
| Less than 5 Minutes | 306 | 0.9% |
| 5 to 9 Minutes | 596 | 1.8% |
| 10 to 14 Minutes | 1,892 | 5.6% |
| 15 to 19 Minutes | 3,751 | 11.1% |
| 20 to 24 Minutes | 2,603 | 7.7% |
| 25 to 29 Minutes | 1,526 | 4.5% |
| 30 to 34 Minutes | 5,863 | 17.3% |
| 35 to 39 Minutes | 1,282 | 3.8% |
| 40 to 44 Minutes | 1,965 | 5.8% |
| 45 to 59 Minutes | 6,883 | 20.3% |
| 60 to 89 Minutes | 5,881 | 17.4% |
| 90 or more Minutes | 1,332 | 3.9% |
Commute Time by Sex in Dale City
The most common commute times in Dale City are 45 to 59 minutes (4,168 commuters, 21.8%) for males and 45 to 59 minutes (2,715 commuters, 18.3%) for females.
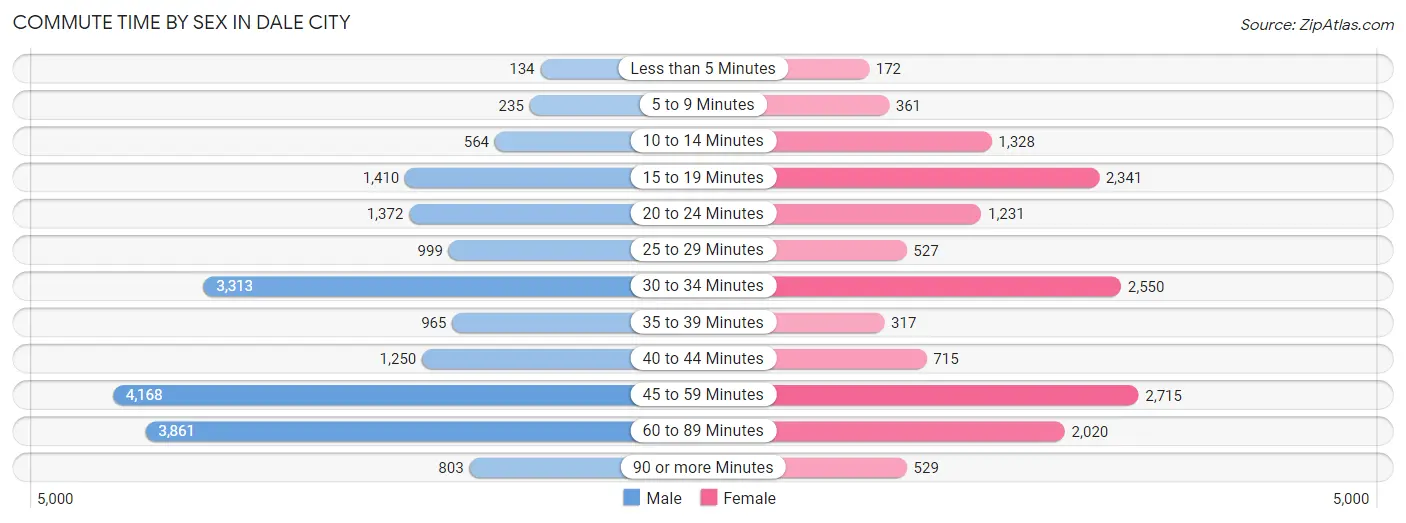
| Commute Time | Male | Female |
| Less than 5 Minutes | 134 (0.7%) | 172 (1.2%) |
| 5 to 9 Minutes | 235 (1.2%) | 361 (2.4%) |
| 10 to 14 Minutes | 564 (3.0%) | 1,328 (9.0%) |
| 15 to 19 Minutes | 1,410 (7.4%) | 2,341 (15.8%) |
| 20 to 24 Minutes | 1,372 (7.2%) | 1,231 (8.3%) |
| 25 to 29 Minutes | 999 (5.2%) | 527 (3.6%) |
| 30 to 34 Minutes | 3,313 (17.4%) | 2,550 (17.2%) |
| 35 to 39 Minutes | 965 (5.1%) | 317 (2.1%) |
| 40 to 44 Minutes | 1,250 (6.6%) | 715 (4.8%) |
| 45 to 59 Minutes | 4,168 (21.8%) | 2,715 (18.3%) |
| 60 to 89 Minutes | 3,861 (20.2%) | 2,020 (13.6%) |
| 90 or more Minutes | 803 (4.2%) | 529 (3.6%) |
Time of Departure to Work by Sex in Dale City
The most frequent times of departure to work in Dale City are 12:00 AM to 4:59 AM (2,476, 13.0%) for males and 7:00 AM to 7:29 AM (2,145, 14.5%) for females.
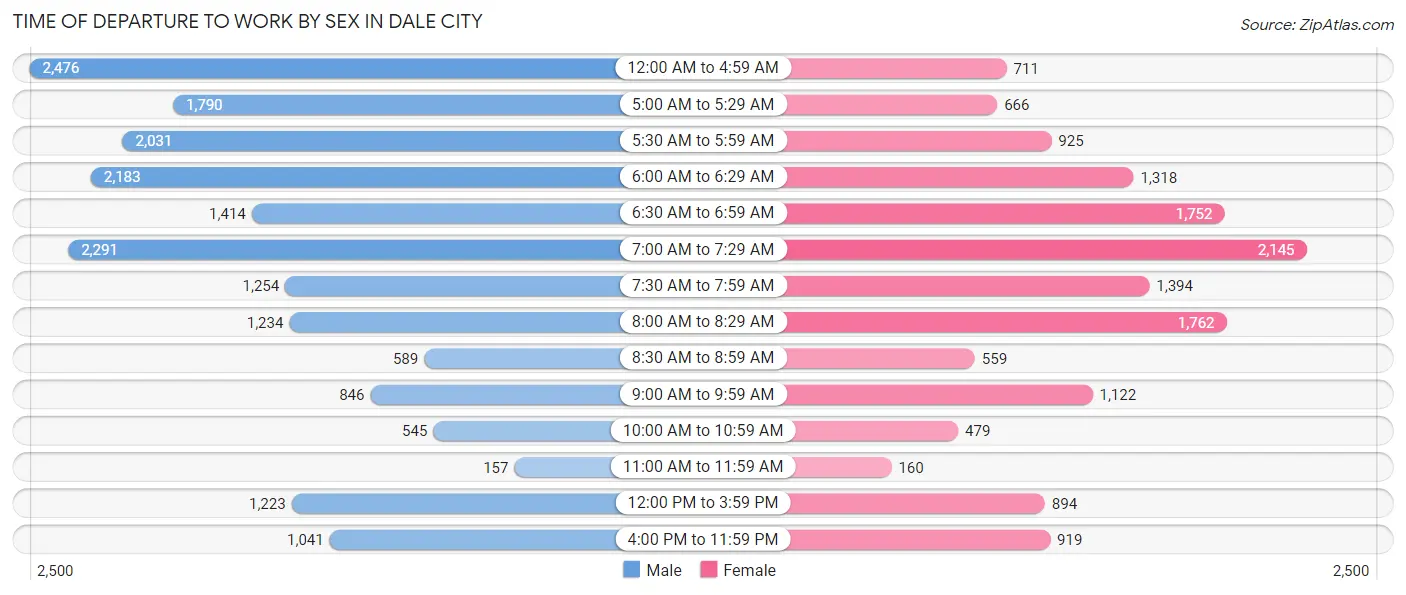
| Time of Departure | Male | Female |
| 12:00 AM to 4:59 AM | 2,476 (13.0%) | 711 (4.8%) |
| 5:00 AM to 5:29 AM | 1,790 (9.4%) | 666 (4.5%) |
| 5:30 AM to 5:59 AM | 2,031 (10.6%) | 925 (6.2%) |
| 6:00 AM to 6:29 AM | 2,183 (11.4%) | 1,318 (8.9%) |
| 6:30 AM to 6:59 AM | 1,414 (7.4%) | 1,752 (11.8%) |
| 7:00 AM to 7:29 AM | 2,291 (12.0%) | 2,145 (14.5%) |
| 7:30 AM to 7:59 AM | 1,254 (6.6%) | 1,394 (9.4%) |
| 8:00 AM to 8:29 AM | 1,234 (6.5%) | 1,762 (11.9%) |
| 8:30 AM to 8:59 AM | 589 (3.1%) | 559 (3.8%) |
| 9:00 AM to 9:59 AM | 846 (4.4%) | 1,122 (7.6%) |
| 10:00 AM to 10:59 AM | 545 (2.9%) | 479 (3.2%) |
| 11:00 AM to 11:59 AM | 157 (0.8%) | 160 (1.1%) |
| 12:00 PM to 3:59 PM | 1,223 (6.4%) | 894 (6.0%) |
| 4:00 PM to 11:59 PM | 1,041 (5.5%) | 919 (6.2%) |
| Total | 19,074 (100.0%) | 14,806 (100.0%) |
Housing Occupancy in Dale City
Occupancy by Ownership in Dale City
Of the total 21,768 dwellings in Dale City, owner-occupied units account for 17,036 (78.3%), while renter-occupied units make up 4,732 (21.7%).
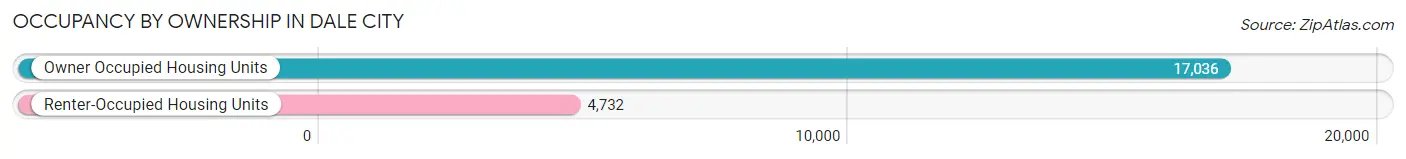
| Occupancy | # Housing Units | % Housing Units |
| Owner Occupied Housing Units | 17,036 | 78.3% |
| Renter-Occupied Housing Units | 4,732 | 21.7% |
| Total Occupied Housing Units | 21,768 | 100.0% |
Occupancy by Household Size in Dale City
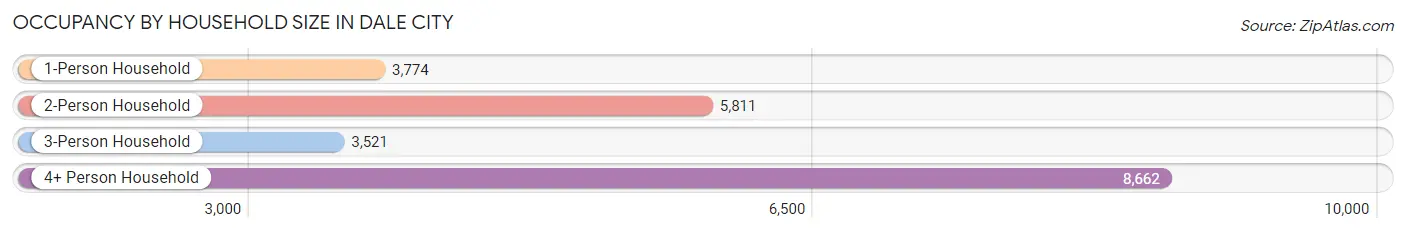
| Household Size | # Housing Units | % Housing Units |
| 1-Person Household | 3,774 | 17.3% |
| 2-Person Household | 5,811 | 26.7% |
| 3-Person Household | 3,521 | 16.2% |
| 4+ Person Household | 8,662 | 39.8% |
| Total Housing Units | 21,768 | 100.0% |
Occupancy by Ownership by Household Size in Dale City
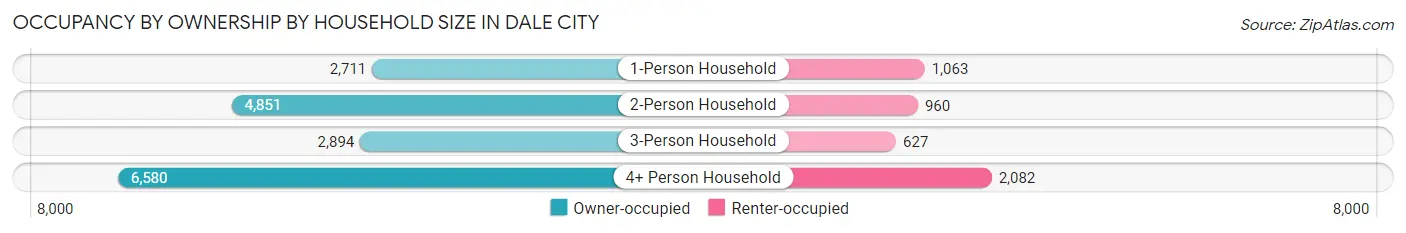
| Household Size | Owner-occupied | Renter-occupied |
| 1-Person Household | 2,711 (71.8%) | 1,063 (28.2%) |
| 2-Person Household | 4,851 (83.5%) | 960 (16.5%) |
| 3-Person Household | 2,894 (82.2%) | 627 (17.8%) |
| 4+ Person Household | 6,580 (76.0%) | 2,082 (24.0%) |
| Total Housing Units | 17,036 (78.3%) | 4,732 (21.7%) |
Occupancy by Educational Attainment in Dale City
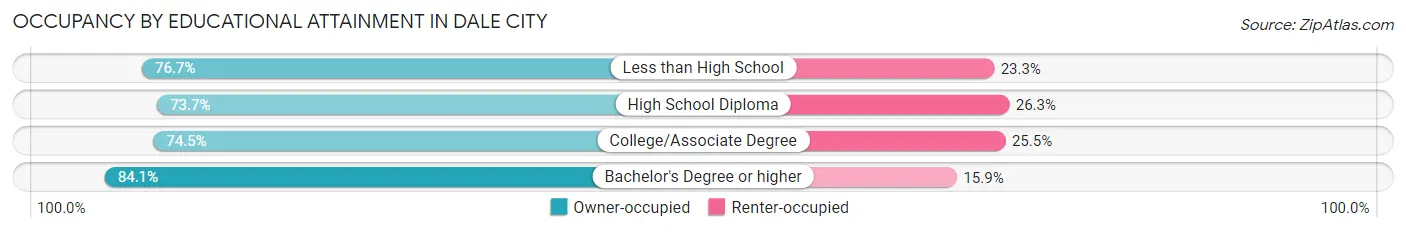
| Household Size | Owner-occupied | Renter-occupied |
| Less than High School | 2,005 (76.7%) | 609 (23.3%) |
| High School Diploma | 3,463 (73.7%) | 1,236 (26.3%) |
| College/Associate Degree | 4,537 (74.5%) | 1,556 (25.5%) |
| Bachelor's Degree or higher | 7,031 (84.1%) | 1,331 (15.9%) |
Occupancy by Age of Householder in Dale City
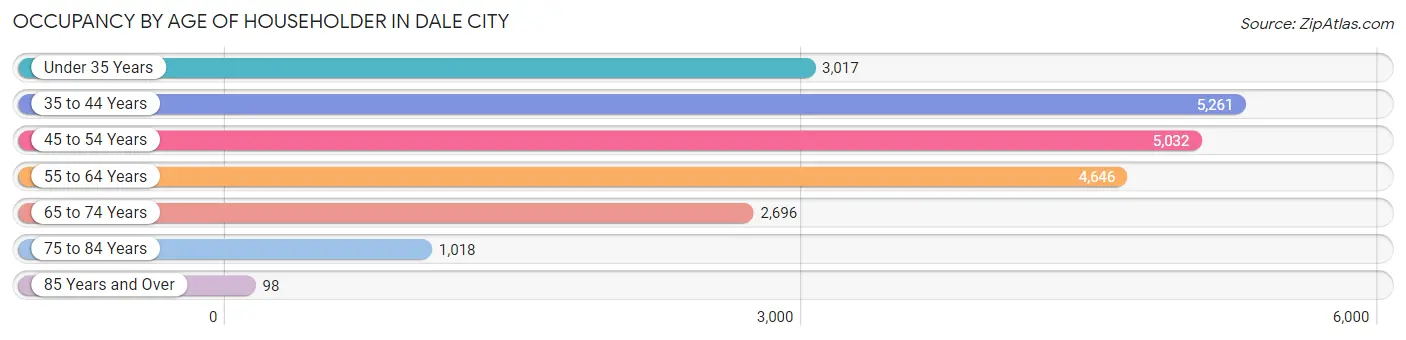
| Age Bracket | # Households | % Households |
| Under 35 Years | 3,017 | 13.9% |
| 35 to 44 Years | 5,261 | 24.2% |
| 45 to 54 Years | 5,032 | 23.1% |
| 55 to 64 Years | 4,646 | 21.3% |
| 65 to 74 Years | 2,696 | 12.4% |
| 75 to 84 Years | 1,018 | 4.7% |
| 85 Years and Over | 98 | 0.4% |
| Total | 21,768 | 100.0% |
Housing Finances in Dale City
Median Income by Occupancy in Dale City
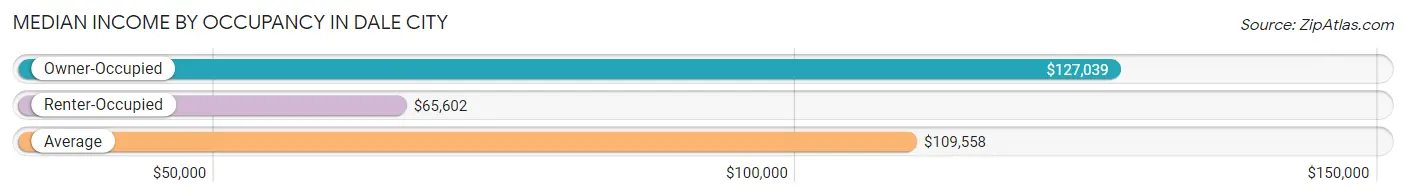
| Occupancy Type | # Households | Median Income |
| Owner-Occupied | 17,036 (78.3%) | $127,039 |
| Renter-Occupied | 4,732 (21.7%) | $65,602 |
| Average | 21,768 (100.0%) | $109,558 |
Occupancy by Householder Income Bracket in Dale City

| Income Bracket | Owner-occupied | Renter-occupied |
| Less than $5,000 | 145 (0.9%) | 285 (6.0%) |
| $5,000 to $9,999 | 117 (0.7%) | 44 (0.9%) |
| $10,000 to $14,999 | 121 (0.7%) | 86 (1.8%) |
| $15,000 to $19,999 | 130 (0.8%) | 75 (1.6%) |
| $20,000 to $24,999 | 323 (1.9%) | 183 (3.9%) |
| $25,000 to $34,999 | 314 (1.8%) | 301 (6.4%) |
| $35,000 to $49,999 | 484 (2.8%) | 910 (19.2%) |
| $50,000 to $74,999 | 1,876 (11.0%) | 821 (17.3%) |
| $75,000 to $99,999 | 2,582 (15.2%) | 695 (14.7%) |
| $100,000 to $149,999 | 4,360 (25.6%) | 908 (19.2%) |
| $150,000 or more | 6,584 (38.7%) | 424 (9.0%) |
| Total | 17,036 (100.0%) | 4,732 (100.0%) |
Monthly Housing Cost Tiers in Dale City
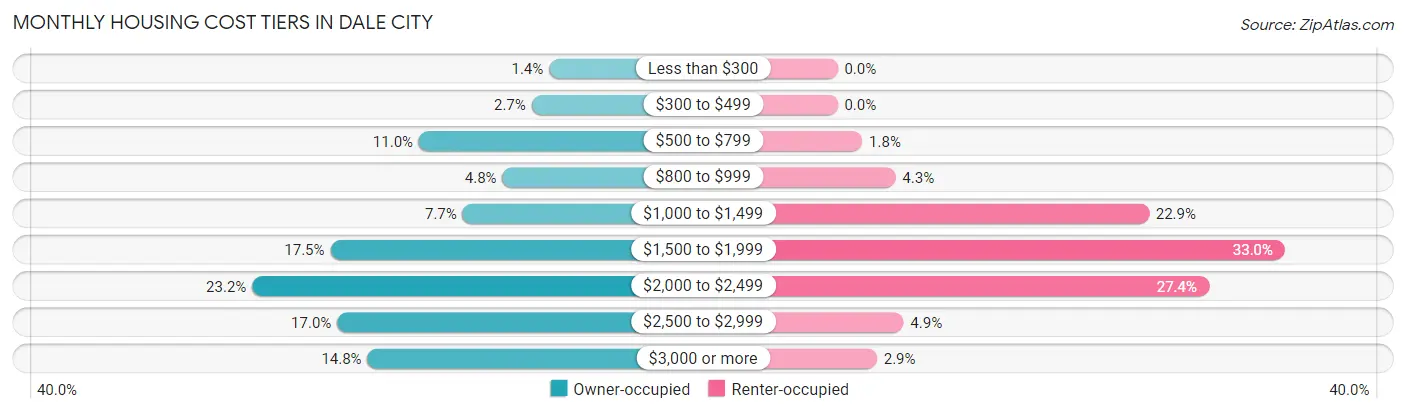
| Monthly Cost | Owner-occupied | Renter-occupied |
| Less than $300 | 233 (1.4%) | 0 (0.0%) |
| $300 to $499 | 454 (2.7%) | 0 (0.0%) |
| $500 to $799 | 1,867 (11.0%) | 86 (1.8%) |
| $800 to $999 | 820 (4.8%) | 202 (4.3%) |
| $1,000 to $1,499 | 1,319 (7.7%) | 1,085 (22.9%) |
| $1,500 to $1,999 | 2,978 (17.5%) | 1,559 (33.0%) |
| $2,000 to $2,499 | 3,959 (23.2%) | 1,294 (27.4%) |
| $2,500 to $2,999 | 2,893 (17.0%) | 230 (4.9%) |
| $3,000 or more | 2,513 (14.7%) | 137 (2.9%) |
| Total | 17,036 (100.0%) | 4,732 (100.0%) |
Physical Housing Characteristics in Dale City
Housing Structures in Dale City
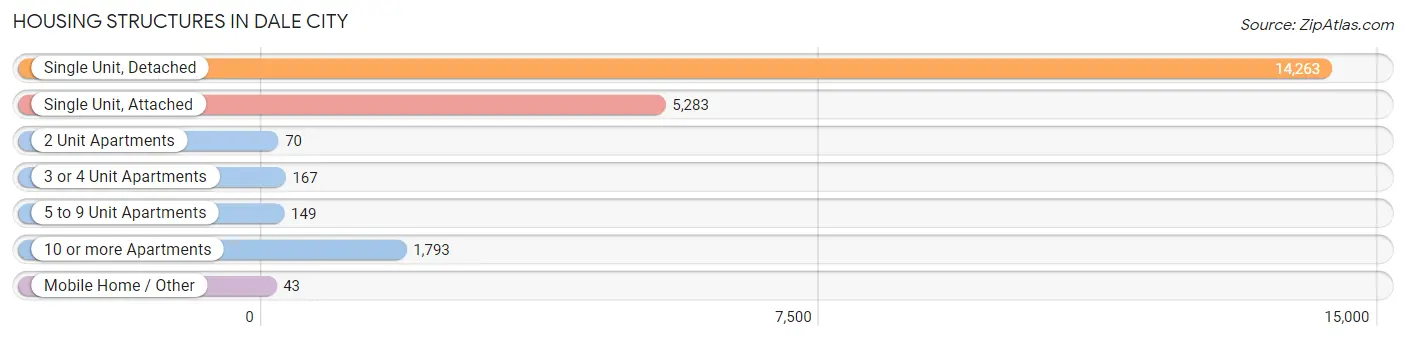
| Structure Type | # Housing Units | % Housing Units |
| Single Unit, Detached | 14,263 | 65.5% |
| Single Unit, Attached | 5,283 | 24.3% |
| 2 Unit Apartments | 70 | 0.3% |
| 3 or 4 Unit Apartments | 167 | 0.8% |
| 5 to 9 Unit Apartments | 149 | 0.7% |
| 10 or more Apartments | 1,793 | 8.2% |
| Mobile Home / Other | 43 | 0.2% |
| Total | 21,768 | 100.0% |
Housing Structures by Occupancy in Dale City
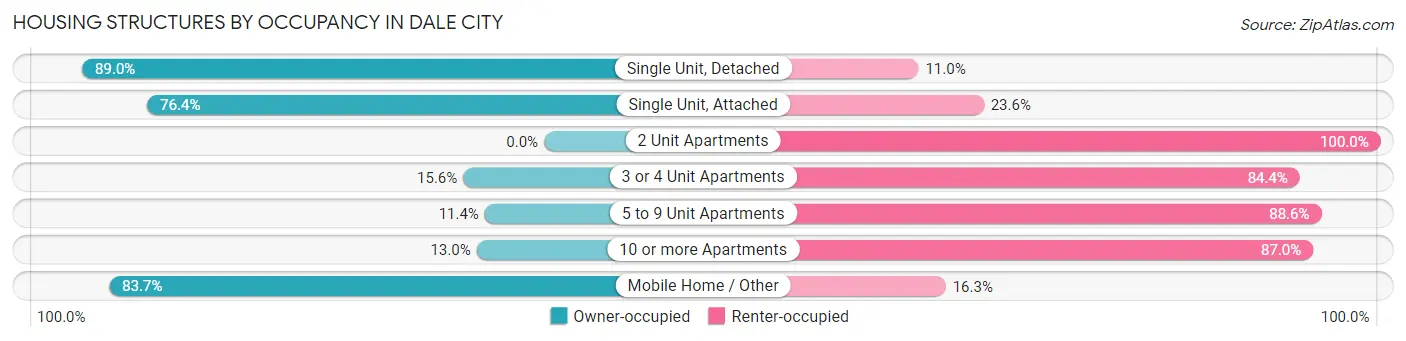
| Structure Type | Owner-occupied | Renter-occupied |
| Single Unit, Detached | 12,688 (89.0%) | 1,575 (11.0%) |
| Single Unit, Attached | 4,036 (76.4%) | 1,247 (23.6%) |
| 2 Unit Apartments | 0 (0.0%) | 70 (100.0%) |
| 3 or 4 Unit Apartments | 26 (15.6%) | 141 (84.4%) |
| 5 to 9 Unit Apartments | 17 (11.4%) | 132 (88.6%) |
| 10 or more Apartments | 233 (13.0%) | 1,560 (87.0%) |
| Mobile Home / Other | 36 (83.7%) | 7 (16.3%) |
| Total | 17,036 (78.3%) | 4,732 (21.7%) |
Housing Structures by Number of Rooms in Dale City
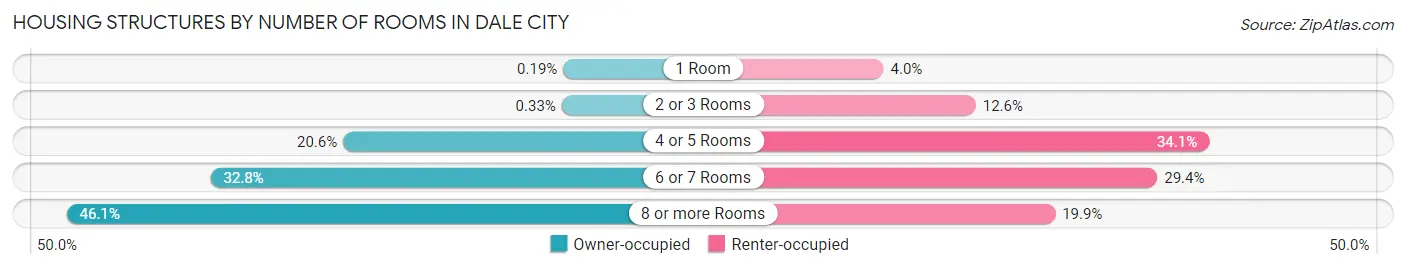
| Number of Rooms | Owner-occupied | Renter-occupied |
| 1 Room | 33 (0.2%) | 191 (4.0%) |
| 2 or 3 Rooms | 57 (0.3%) | 595 (12.6%) |
| 4 or 5 Rooms | 3,501 (20.5%) | 1,615 (34.1%) |
| 6 or 7 Rooms | 5,590 (32.8%) | 1,389 (29.3%) |
| 8 or more Rooms | 7,855 (46.1%) | 942 (19.9%) |
| Total | 17,036 (100.0%) | 4,732 (100.0%) |
Housing Structure by Heating Type in Dale City
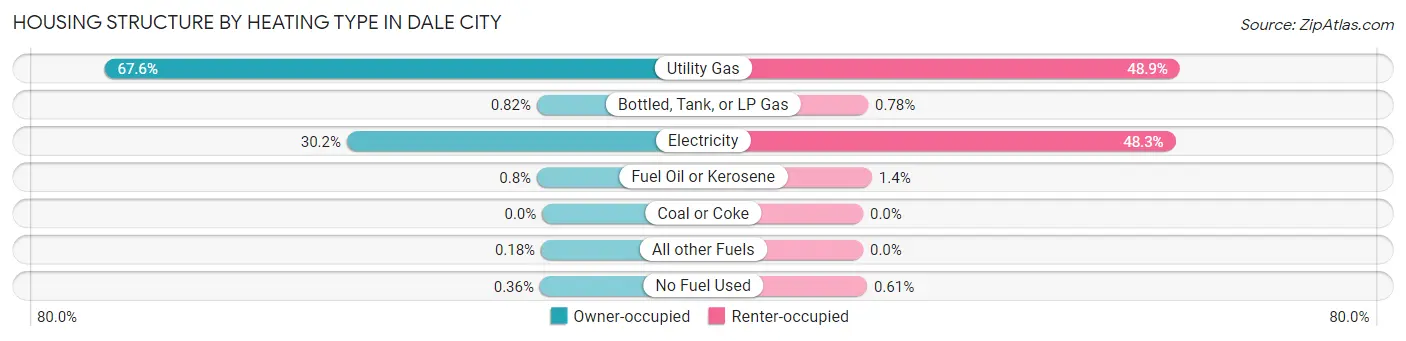
| Heating Type | Owner-occupied | Renter-occupied |
| Utility Gas | 11,524 (67.6%) | 2,316 (48.9%) |
| Bottled, Tank, or LP Gas | 140 (0.8%) | 37 (0.8%) |
| Electricity | 5,143 (30.2%) | 2,285 (48.3%) |
| Fuel Oil or Kerosene | 136 (0.8%) | 65 (1.4%) |
| Coal or Coke | 0 (0.0%) | 0 (0.0%) |
| All other Fuels | 31 (0.2%) | 0 (0.0%) |
| No Fuel Used | 62 (0.4%) | 29 (0.6%) |
| Total | 17,036 (100.0%) | 4,732 (100.0%) |
Household Vehicle Usage in Dale City
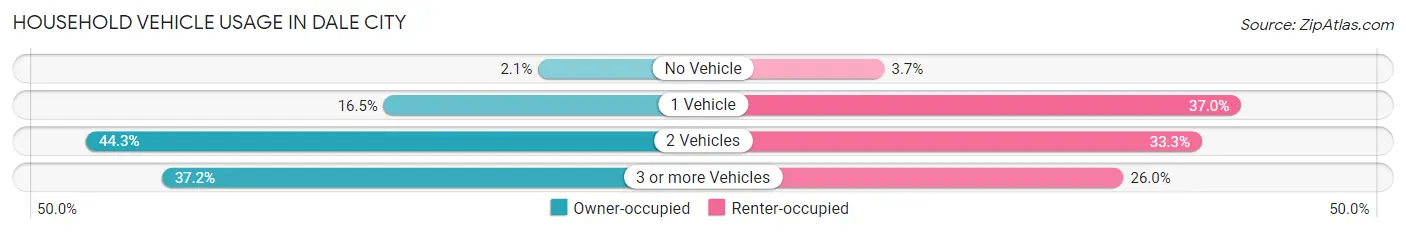
| Vehicles per Household | Owner-occupied | Renter-occupied |
| No Vehicle | 353 (2.1%) | 175 (3.7%) |
| 1 Vehicle | 2,808 (16.5%) | 1,750 (37.0%) |
| 2 Vehicles | 7,538 (44.3%) | 1,576 (33.3%) |
| 3 or more Vehicles | 6,337 (37.2%) | 1,231 (26.0%) |
| Total | 17,036 (100.0%) | 4,732 (100.0%) |
Real Estate & Mortgages in Dale City
Real Estate and Mortgage Overview in Dale City
| Characteristic | Without Mortgage | With Mortgage |
| Housing Units | 3,185 | 13,851 |
| Median Property Value | $362,700 | $381,100 |
| Median Household Income | $97,465 | $5,793 |
| Monthly Housing Costs | $662 | $2,497 |
| Real Estate Taxes | $4,015 | $732 |
Property Value by Mortgage Status in Dale City
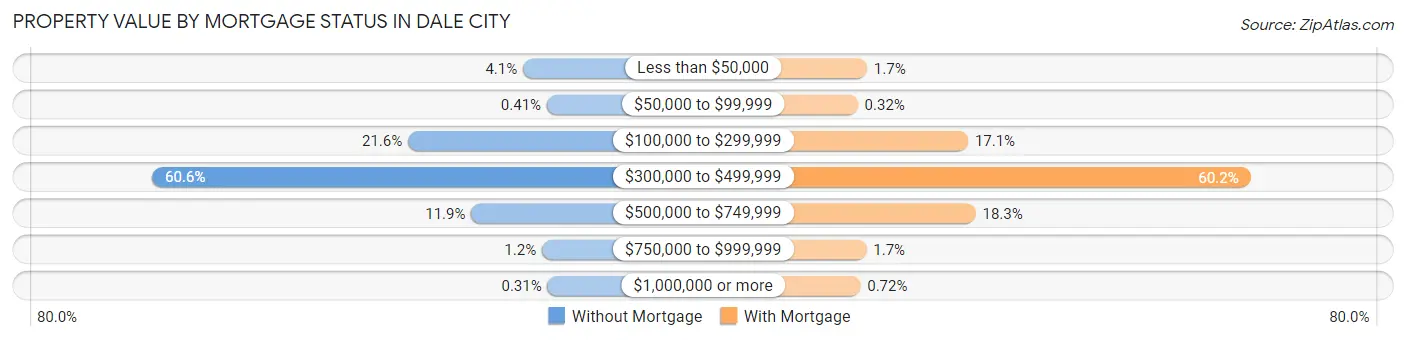
| Property Value | Without Mortgage | With Mortgage |
| Less than $50,000 | 129 (4.1%) | 239 (1.7%) |
| $50,000 to $99,999 | 13 (0.4%) | 44 (0.3%) |
| $100,000 to $299,999 | 687 (21.6%) | 2,373 (17.1%) |
| $300,000 to $499,999 | 1,929 (60.6%) | 8,335 (60.2%) |
| $500,000 to $749,999 | 380 (11.9%) | 2,532 (18.3%) |
| $750,000 to $999,999 | 37 (1.2%) | 228 (1.7%) |
| $1,000,000 or more | 10 (0.3%) | 100 (0.7%) |
| Total | 3,185 (100.0%) | 13,851 (100.0%) |
Household Income by Mortgage Status in Dale City
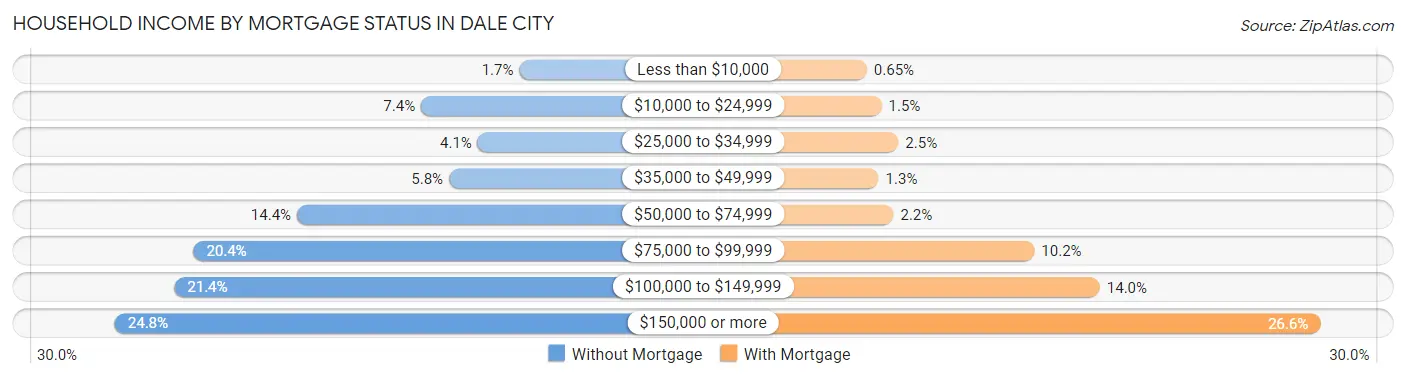
| Household Income | Without Mortgage | With Mortgage |
| Less than $10,000 | 55 (1.7%) | 90 (0.6%) |
| $10,000 to $24,999 | 234 (7.3%) | 207 (1.5%) |
| $25,000 to $34,999 | 131 (4.1%) | 340 (2.5%) |
| $35,000 to $49,999 | 183 (5.8%) | 183 (1.3%) |
| $50,000 to $74,999 | 460 (14.4%) | 301 (2.2%) |
| $75,000 to $99,999 | 648 (20.3%) | 1,416 (10.2%) |
| $100,000 to $149,999 | 683 (21.4%) | 1,934 (14.0%) |
| $150,000 or more | 791 (24.8%) | 3,677 (26.6%) |
| Total | 3,185 (100.0%) | 13,851 (100.0%) |
Property Value to Household Income Ratio in Dale City
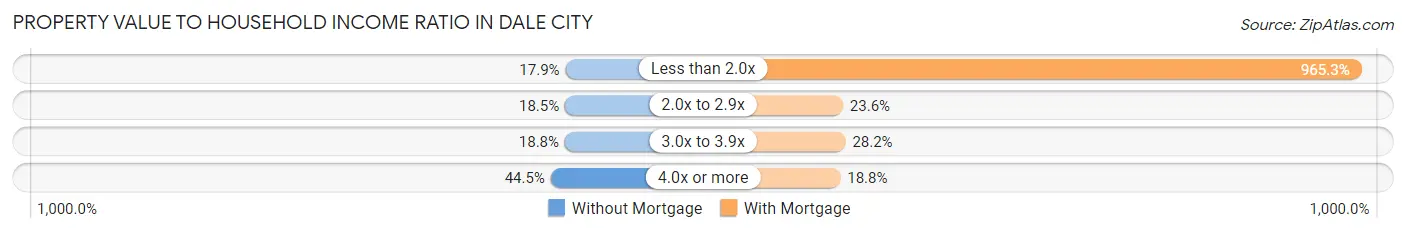
| Value-to-Income Ratio | Without Mortgage | With Mortgage |
| Less than 2.0x | 569 (17.9%) | 133,701 (965.3%) |
| 2.0x to 2.9x | 588 (18.5%) | 3,269 (23.6%) |
| 3.0x to 3.9x | 599 (18.8%) | 3,905 (28.2%) |
| 4.0x or more | 1,418 (44.5%) | 2,604 (18.8%) |
| Total | 3,185 (100.0%) | 13,851 (100.0%) |
Real Estate Taxes by Mortgage Status in Dale City
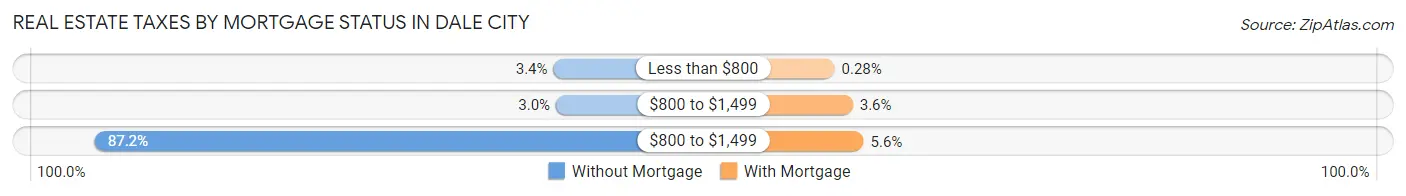
| Property Taxes | Without Mortgage | With Mortgage |
| Less than $800 | 109 (3.4%) | 39 (0.3%) |
| $800 to $1,499 | 94 (2.9%) | 500 (3.6%) |
| $800 to $1,499 | 2,776 (87.2%) | 773 (5.6%) |
| Total | 3,185 (100.0%) | 13,851 (100.0%) |
Health & Disability in Dale City
Health Insurance Coverage by Age in Dale City
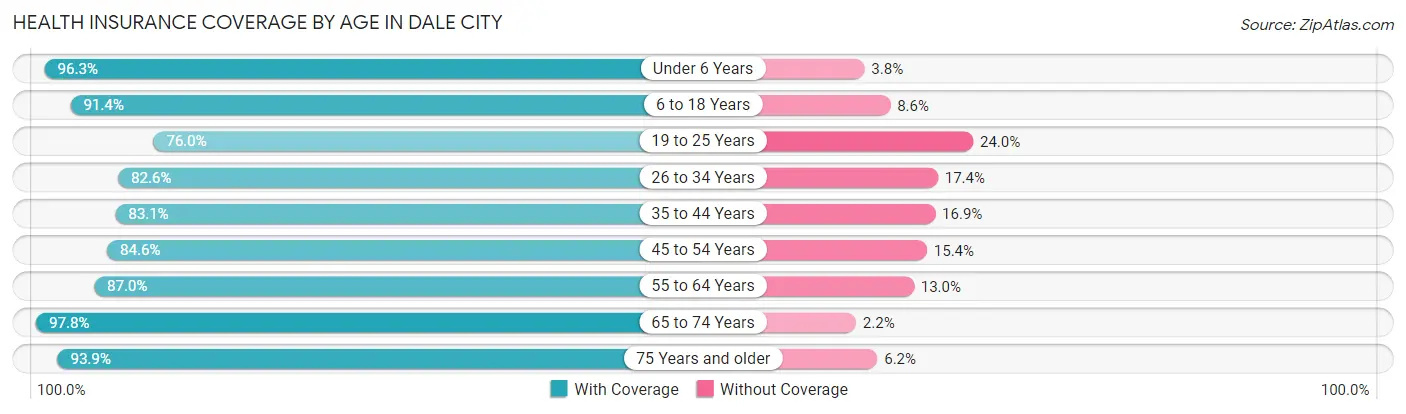
| Age Bracket | With Coverage | Without Coverage |
| Under 6 Years | 6,848 (96.3%) | 267 (3.7%) |
| 6 to 18 Years | 13,092 (91.4%) | 1,226 (8.6%) |
| 19 to 25 Years | 5,024 (76.0%) | 1,587 (24.0%) |
| 26 to 34 Years | 7,051 (82.6%) | 1,488 (17.4%) |
| 35 to 44 Years | 9,426 (83.1%) | 1,922 (16.9%) |
| 45 to 54 Years | 8,070 (84.6%) | 1,469 (15.4%) |
| 55 to 64 Years | 7,829 (87.0%) | 1,166 (13.0%) |
| 65 to 74 Years | 4,701 (97.8%) | 104 (2.2%) |
| 75 Years and older | 2,137 (93.9%) | 140 (6.1%) |
| Total | 64,178 (87.3%) | 9,369 (12.7%) |
Health Insurance Coverage by Citizenship Status in Dale City
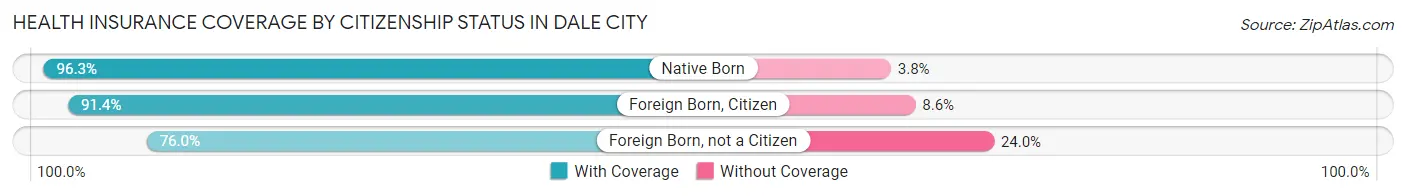
| Citizenship Status | With Coverage | Without Coverage |
| Native Born | 6,848 (96.3%) | 267 (3.7%) |
| Foreign Born, Citizen | 13,092 (91.4%) | 1,226 (8.6%) |
| Foreign Born, not a Citizen | 5,024 (76.0%) | 1,587 (24.0%) |
Health Insurance Coverage by Household Income in Dale City
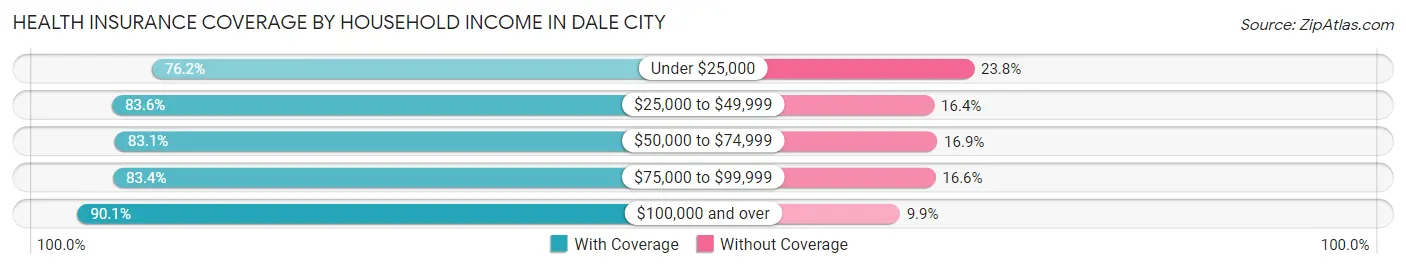
| Household Income | With Coverage | Without Coverage |
| Under $25,000 | 2,412 (76.2%) | 755 (23.8%) |
| $25,000 to $49,999 | 4,286 (83.6%) | 839 (16.4%) |
| $50,000 to $74,999 | 6,827 (83.1%) | 1,391 (16.9%) |
| $75,000 to $99,999 | 9,113 (83.4%) | 1,813 (16.6%) |
| $100,000 and over | 41,512 (90.1%) | 4,569 (9.9%) |
Public vs Private Health Insurance Coverage by Age in Dale City
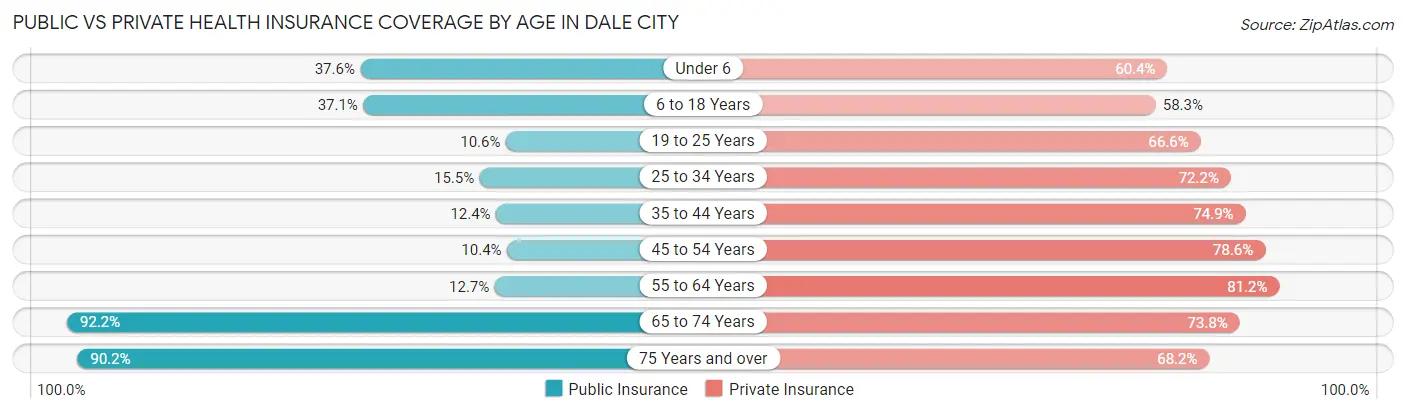
| Age Bracket | Public Insurance | Private Insurance |
| Under 6 | 2,676 (37.6%) | 4,300 (60.4%) |
| 6 to 18 Years | 5,306 (37.1%) | 8,346 (58.3%) |
| 19 to 25 Years | 700 (10.6%) | 4,403 (66.6%) |
| 25 to 34 Years | 1,320 (15.5%) | 6,164 (72.2%) |
| 35 to 44 Years | 1,409 (12.4%) | 8,502 (74.9%) |
| 45 to 54 Years | 990 (10.4%) | 7,495 (78.6%) |
| 55 to 64 Years | 1,140 (12.7%) | 7,305 (81.2%) |
| 65 to 74 Years | 4,428 (92.1%) | 3,548 (73.8%) |
| 75 Years and over | 2,054 (90.2%) | 1,553 (68.2%) |
| Total | 20,023 (27.2%) | 51,616 (70.2%) |
Disability Status by Sex by Age in Dale City
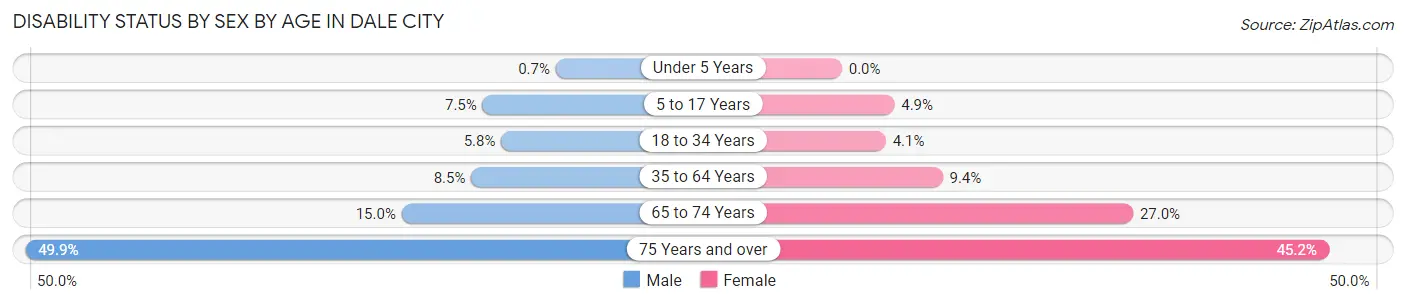
| Age Bracket | Male | Female |
| Under 5 Years | 21 (0.7%) | 0 (0.0%) |
| 5 to 17 Years | 530 (7.5%) | 352 (4.9%) |
| 18 to 34 Years | 491 (5.8%) | 320 (4.1%) |
| 35 to 64 Years | 1,278 (8.5%) | 1,395 (9.3%) |
| 65 to 74 Years | 381 (15.0%) | 612 (27.0%) |
| 75 Years and over | 420 (49.9%) | 649 (45.2%) |
Disability Class by Sex by Age in Dale City
Disability Class: Hearing Difficulty
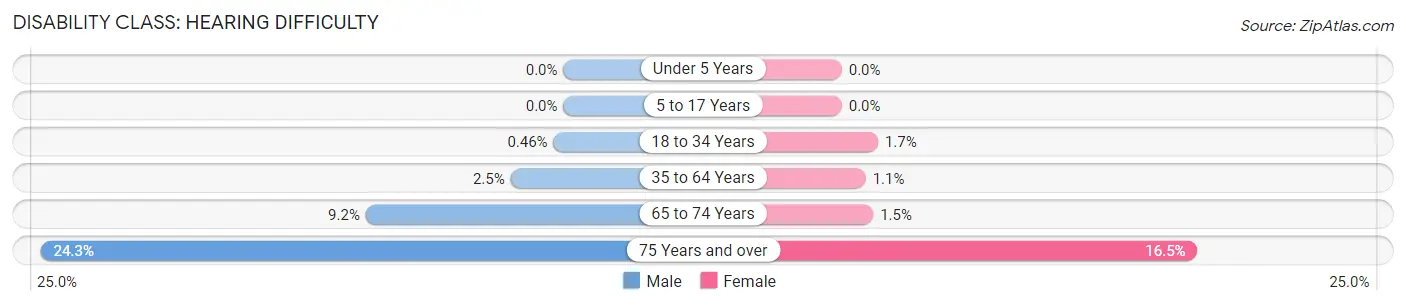
| Age Bracket | Male | Female |
| Under 5 Years | 0 (0.0%) | 0 (0.0%) |
| 5 to 17 Years | 0 (0.0%) | 0 (0.0%) |
| 18 to 34 Years | 39 (0.5%) | 132 (1.7%) |
| 35 to 64 Years | 366 (2.5%) | 166 (1.1%) |
| 65 to 74 Years | 233 (9.2%) | 33 (1.5%) |
| 75 Years and over | 204 (24.3%) | 237 (16.5%) |
Disability Class: Vision Difficulty
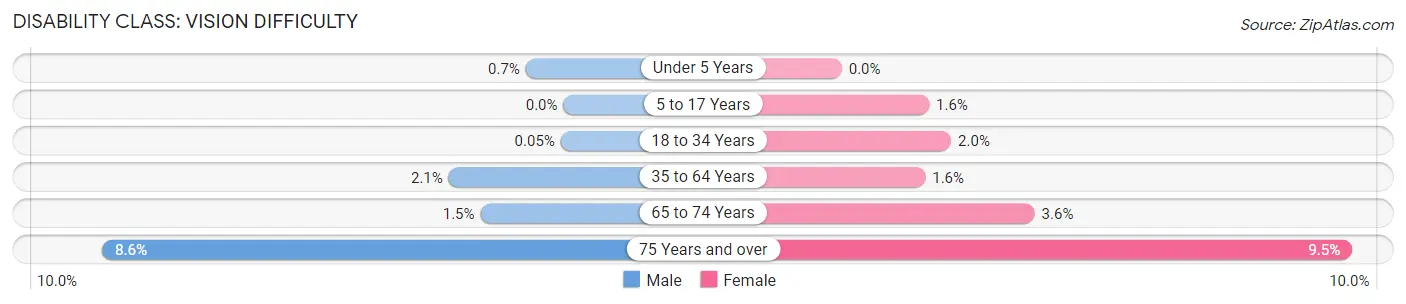
| Age Bracket | Male | Female |
| Under 5 Years | 21 (0.7%) | 0 (0.0%) |
| 5 to 17 Years | 0 (0.0%) | 117 (1.6%) |
| 18 to 34 Years | 4 (0.1%) | 159 (2.0%) |
| 35 to 64 Years | 318 (2.1%) | 232 (1.5%) |
| 65 to 74 Years | 39 (1.5%) | 81 (3.6%) |
| 75 Years and over | 72 (8.6%) | 136 (9.5%) |
Disability Class: Cognitive Difficulty
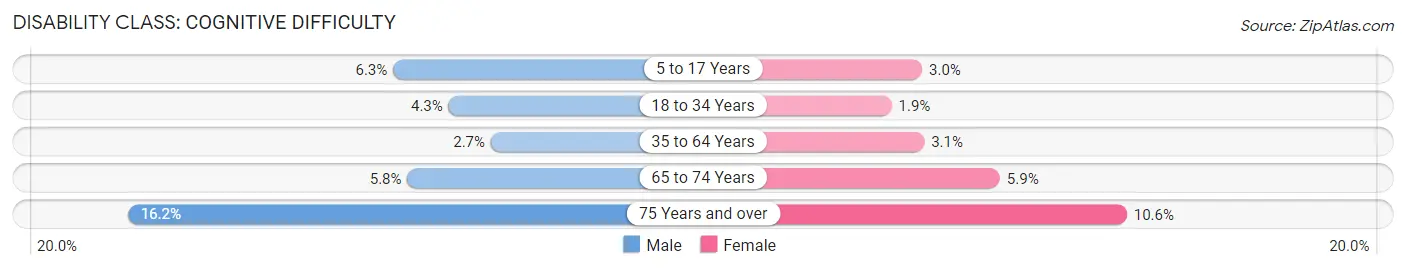
| Age Bracket | Male | Female |
| 5 to 17 Years | 447 (6.3%) | 215 (3.0%) |
| 18 to 34 Years | 363 (4.3%) | 145 (1.8%) |
| 35 to 64 Years | 403 (2.7%) | 456 (3.1%) |
| 65 to 74 Years | 147 (5.8%) | 133 (5.9%) |
| 75 Years and over | 136 (16.2%) | 152 (10.6%) |
Disability Class: Ambulatory Difficulty
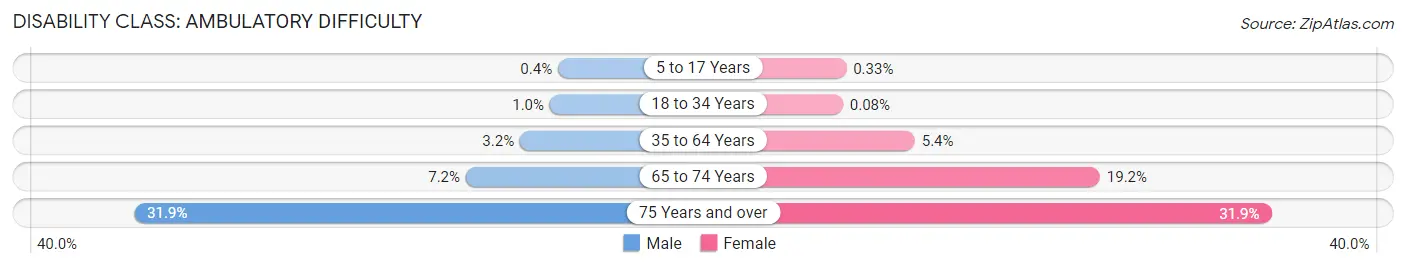
| Age Bracket | Male | Female |
| 5 to 17 Years | 28 (0.4%) | 24 (0.3%) |
| 18 to 34 Years | 85 (1.0%) | 6 (0.1%) |
| 35 to 64 Years | 481 (3.2%) | 809 (5.4%) |
| 65 to 74 Years | 184 (7.2%) | 434 (19.2%) |
| 75 Years and over | 268 (31.9%) | 458 (31.9%) |
Disability Class: Self-Care Difficulty
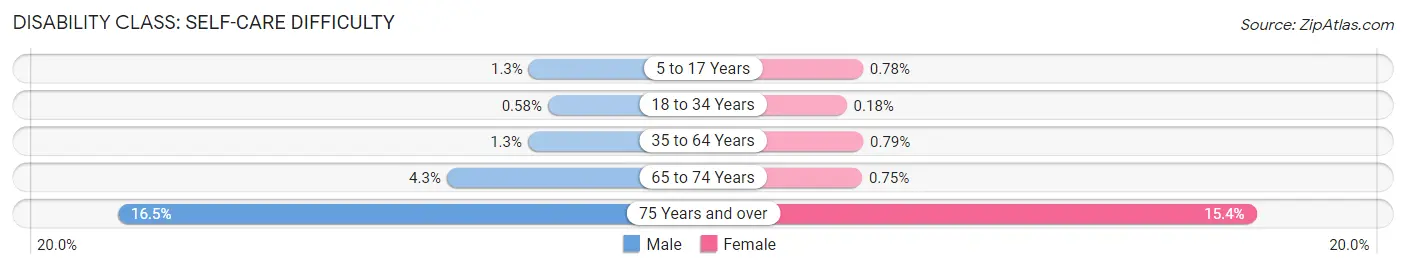
| Age Bracket | Male | Female |
| 5 to 17 Years | 91 (1.3%) | 56 (0.8%) |
| 18 to 34 Years | 49 (0.6%) | 14 (0.2%) |
| 35 to 64 Years | 197 (1.3%) | 118 (0.8%) |
| 65 to 74 Years | 110 (4.3%) | 17 (0.7%) |
| 75 Years and over | 139 (16.5%) | 221 (15.4%) |
Technology Access in Dale City
Computing Device Access in Dale City
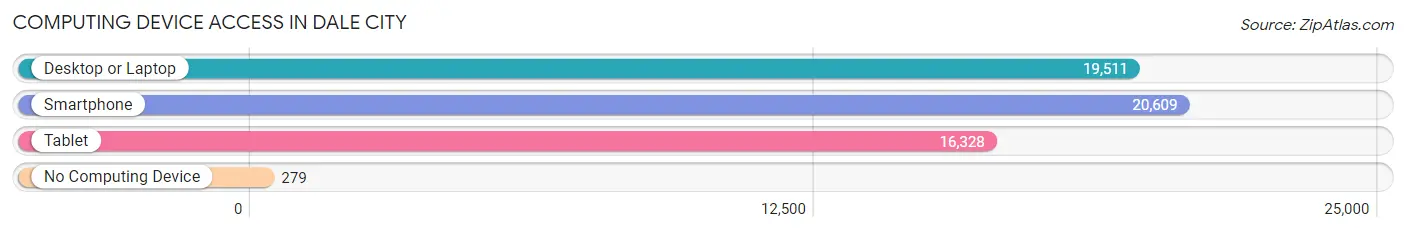
| Device Type | # Households | % Households |
| Desktop or Laptop | 19,511 | 89.6% |
| Smartphone | 20,609 | 94.7% |
| Tablet | 16,328 | 75.0% |
| No Computing Device | 279 | 1.3% |
| Total | 21,768 | 100.0% |
Internet Access in Dale City
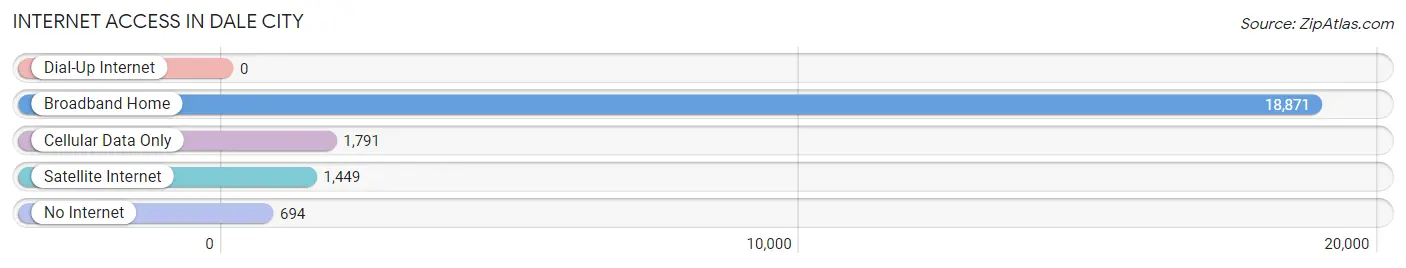
| Internet Type | # Households | % Households |
| Dial-Up Internet | 0 | 0.0% |
| Broadband Home | 18,871 | 86.7% |
| Cellular Data Only | 1,791 | 8.2% |
| Satellite Internet | 1,449 | 6.7% |
| No Internet | 694 | 3.2% |
| Total | 21,768 | 100.0% |
Dale City Summary
Dale City is an unincorporated community located in Prince William County, Virginia, United States. It is located approximately 25 miles southwest of Washington, D.C. and is part of the Washington metropolitan area. The population of Dale City was estimated to be 72,817 in 2019.
History
Dale City was originally known as “Dale City Station” when it was founded in the late 19th century. The area was named after the Dale family, who owned a large farm in the area. The Dale family was one of the first settlers in the area and their farm was located near the intersection of what is now Dale Boulevard and Minnieville Road.
In the early 20th century, the area began to develop as a residential community. The first homes were built in the 1920s and 1930s. The area was officially incorporated as the Town of Dale City in 1975.
Geography
Dale City is located in Prince William County, Virginia, approximately 25 miles southwest of Washington, D.C. It is bordered by the cities of Manassas and Woodbridge to the north, Lake Ridge to the east, and Dumfries to the south. The community is situated on the banks of the Occoquan River and is part of the Washington metropolitan area.
The terrain of Dale City is mostly flat, with some rolling hills. The area is mostly wooded, with some open fields and wetlands. The climate is humid subtropical, with hot, humid summers and mild winters.
Economy
Dale City is home to a variety of businesses, including retail stores, restaurants, and professional services. The area is also home to several large employers, including the U.S. Department of Defense, the U.S. Department of Homeland Security, and the U.S. Department of Veterans Affairs.
The area is also home to several shopping centers, including Potomac Mills, Dale City Shopping Center, and Dale City Town Center. The area is also home to several parks, including Veterans Park, Dale City Park, and Lake Ridge Park.
Demographics
As of 2019, the population of Dale City was estimated to be 72,817. The racial makeup of the area was 57.3% White, 22.2% African American, 11.2% Asian, and 8.3% Hispanic or Latino. The median household income was $90,945, and the median home value was $346,000.
Conclusion
Dale City is an unincorporated community located in Prince William County, Virginia, approximately 25 miles southwest of Washington, D.C. It is part of the Washington metropolitan area and has a population of 72,817. The area has a diverse economy, with several large employers and shopping centers. The racial makeup of the area is 57.3% White, 22.2% African American, 11.2% Asian, and 8.3% Hispanic or Latino. The median household income is $90,945, and the median home value is $346,000.
Common Questions
What is Per Capita Income in Dale City?
Per Capita income in Dale City is $41,818.
What is the Median Family Income in Dale City?
Median Family Income in Dale City is $117,534.
What is the Median Household income in Dale City?
Median Household Income in Dale City is $109,558.
What is Income or Wage Gap in Dale City?
Income or Wage Gap in Dale City is 31.9%.
Women in Dale City earn 68.1 cents for every dollar earned by a man.
What is Family Income Deficit in Dale City?
Family Income Deficit in Dale City is $13,196.
Families that are below poverty line in Dale City earn $13,196 less on average than the poverty threshold level.
What is Inequality or Gini Index in Dale City?
Inequality or Gini Index in Dale City is 0.40.
What is the Total Population of Dale City?
Total Population of Dale City is 73,928.
What is the Total Male Population of Dale City?
Total Male Population of Dale City is 37,235.
What is the Total Female Population of Dale City?
Total Female Population of Dale City is 36,693.
What is the Ratio of Males per 100 Females in Dale City?
There are 101.48 Males per 100 Females in Dale City.
What is the Ratio of Females per 100 Males in Dale City?
There are 98.54 Females per 100 Males in Dale City.
What is the Median Population Age in Dale City?
Median Population Age in Dale City is 35.1 Years.
What is the Average Family Size in Dale City
Average Family Size in Dale City is 3.8 People.
What is the Average Household Size in Dale City
Average Household Size in Dale City is 3.4 People.
How Large is the Labor Force in Dale City?
There are 40,783 People in the Labor Forcein in Dale City.
What is the Percentage of People in the Labor Force in Dale City?
73.0% of People are in the Labor Force in Dale City.
What is the Unemployment Rate in Dale City?
Unemployment Rate in Dale City is 4.6%.