Warren, MI Map & Demographics
Warren Map
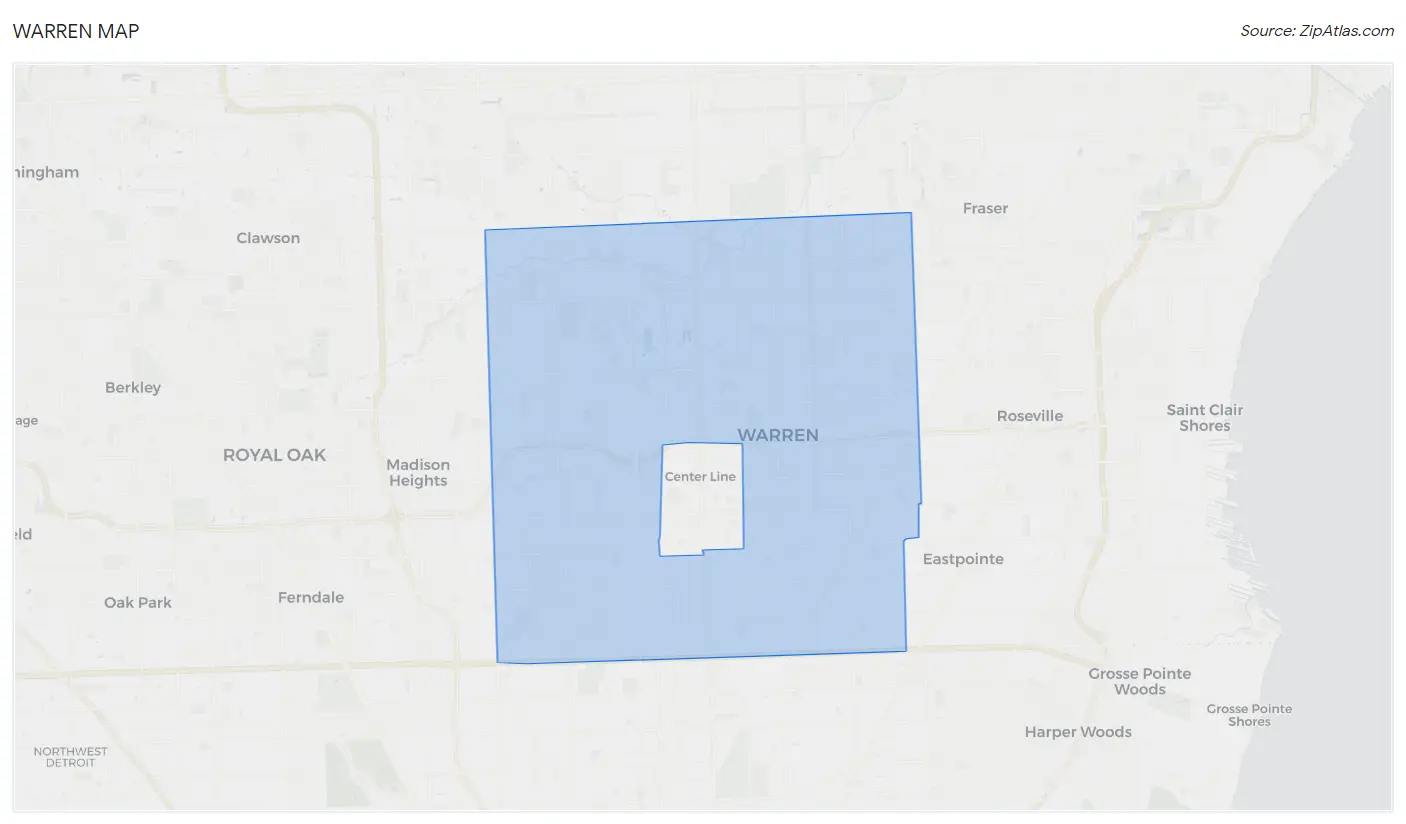
Warren Overview
$31,080
PER CAPITA INCOME
$73,931
AVG FAMILY INCOME
$61,633
AVG HOUSEHOLD INCOME
28.0%
WAGE / INCOME GAP [ % ]
72.0¢/ $1
WAGE / INCOME GAP [ $ ]
$10,418
FAMILY INCOME DEFICIT
0.42
INEQUALITY / GINI INDEX
138,588
TOTAL POPULATION
68,155
MALE POPULATION
70,433
FEMALE POPULATION
96.77
MALES / 100 FEMALES
103.34
FEMALES / 100 MALES
38.5
MEDIAN AGE
3.2
AVG FAMILY SIZE
2.5
AVG HOUSEHOLD SIZE
71,754
LABOR FORCE [ PEOPLE ]
63.7%
PERCENT IN LABOR FORCE
7.4%
UNEMPLOYMENT RATE
Warren Area Codes
Income in Warren
Income Overview in Warren
Per Capita Income in Warren is $31,080, while median incomes of families and households are $73,931 and $61,633 respectively.
| Characteristic | Number | Measure |
| Per Capita Income | 138,588 | $31,080 |
| Median Family Income | 33,737 | $73,931 |
| Mean Family Income | 33,737 | $88,354 |
| Median Household Income | 54,483 | $61,633 |
| Mean Household Income | 54,483 | $77,181 |
| Income Deficit | 33,737 | $10,418 |
| Wage / Income Gap (%) | 138,588 | 28.02% |
| Wage / Income Gap ($) | 138,588 | 71.98¢ per $1 |
| Gini / Inequality Index | 138,588 | 0.42 |
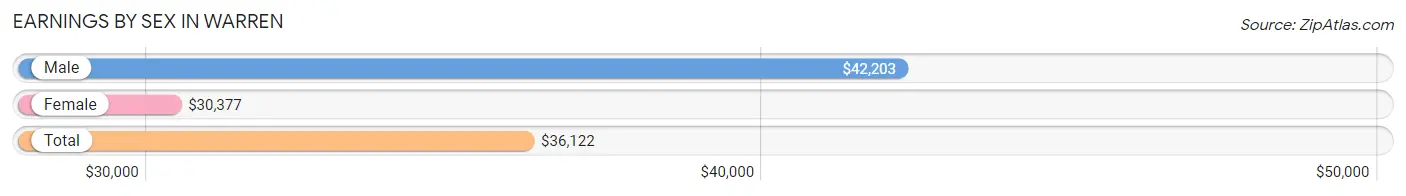
Earnings by Sex in Warren
Average Earnings in Warren are $36,122, $42,203 for men and $30,377 for women, a difference of 28.0%.
| Sex | Number | Average Earnings |
| Male | 38,783 (53.0%) | $42,203 |
| Female | 34,339 (47.0%) | $30,377 |
| Total | 73,122 (100.0%) | $36,122 |
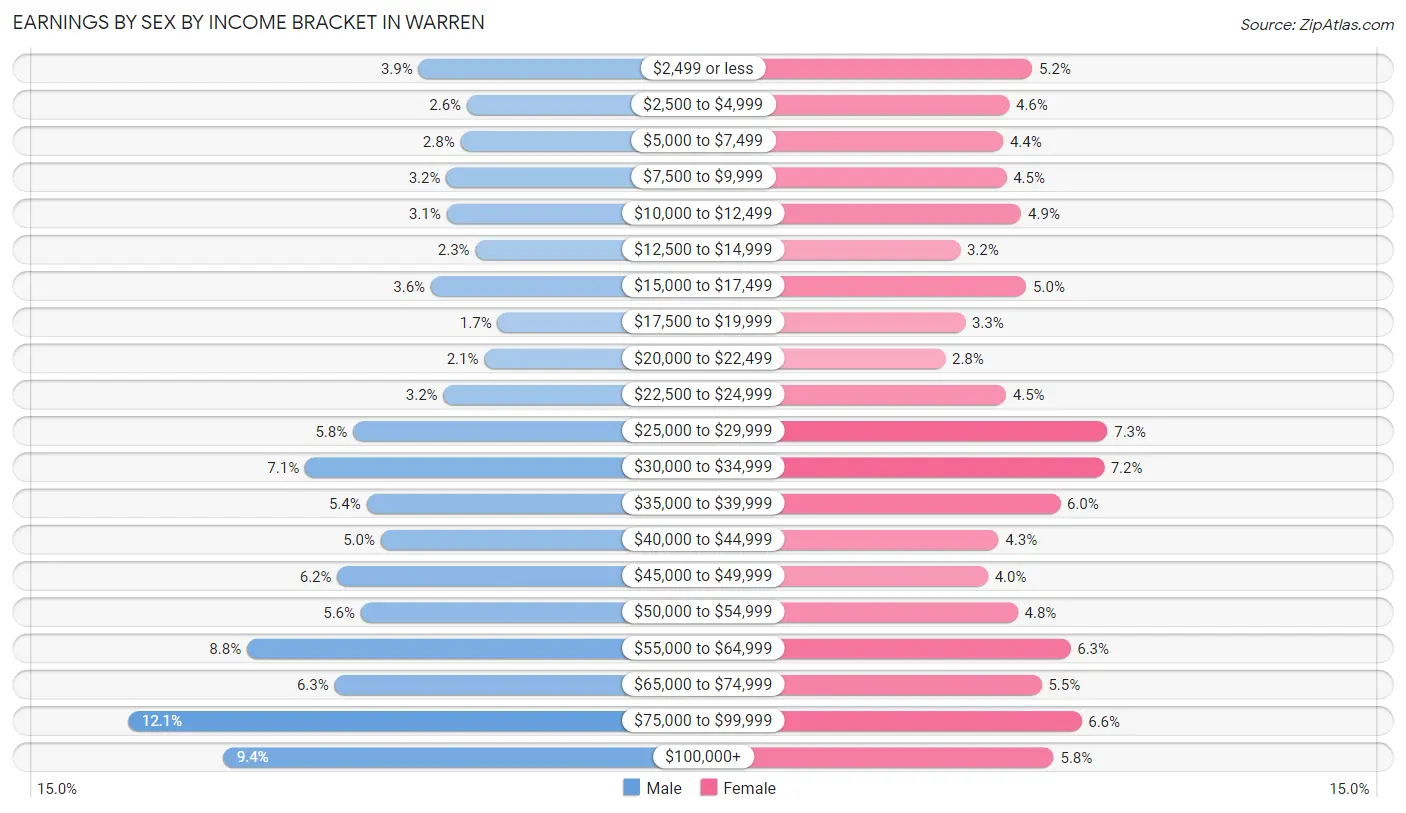
Earnings by Sex by Income Bracket in Warren
The most common earnings brackets in Warren are $75,000 to $99,999 for men (4,680 | 12.1%) and $25,000 to $29,999 for women (2,512 | 7.3%).
| Income | Male | Female |
| $2,499 or less | 1,524 (3.9%) | 1,788 (5.2%) |
| $2,500 to $4,999 | 998 (2.6%) | 1,566 (4.6%) |
| $5,000 to $7,499 | 1,066 (2.8%) | 1,506 (4.4%) |
| $7,500 to $9,999 | 1,220 (3.2%) | 1,537 (4.5%) |
| $10,000 to $12,499 | 1,219 (3.1%) | 1,683 (4.9%) |
| $12,500 to $14,999 | 902 (2.3%) | 1,093 (3.2%) |
| $15,000 to $17,499 | 1,387 (3.6%) | 1,729 (5.0%) |
| $17,500 to $19,999 | 664 (1.7%) | 1,140 (3.3%) |
| $20,000 to $22,499 | 808 (2.1%) | 948 (2.8%) |
| $22,500 to $24,999 | 1,252 (3.2%) | 1,535 (4.5%) |
| $25,000 to $29,999 | 2,236 (5.8%) | 2,512 (7.3%) |
| $30,000 to $34,999 | 2,761 (7.1%) | 2,480 (7.2%) |
| $35,000 to $39,999 | 2,089 (5.4%) | 2,057 (6.0%) |
| $40,000 to $44,999 | 1,937 (5.0%) | 1,462 (4.3%) |
| $45,000 to $49,999 | 2,409 (6.2%) | 1,360 (4.0%) |
| $50,000 to $54,999 | 2,152 (5.6%) | 1,649 (4.8%) |
| $55,000 to $64,999 | 3,393 (8.7%) | 2,157 (6.3%) |
| $65,000 to $74,999 | 2,441 (6.3%) | 1,879 (5.5%) |
| $75,000 to $99,999 | 4,680 (12.1%) | 2,263 (6.6%) |
| $100,000+ | 3,645 (9.4%) | 1,995 (5.8%) |
| Total | 38,783 (100.0%) | 34,339 (100.0%) |
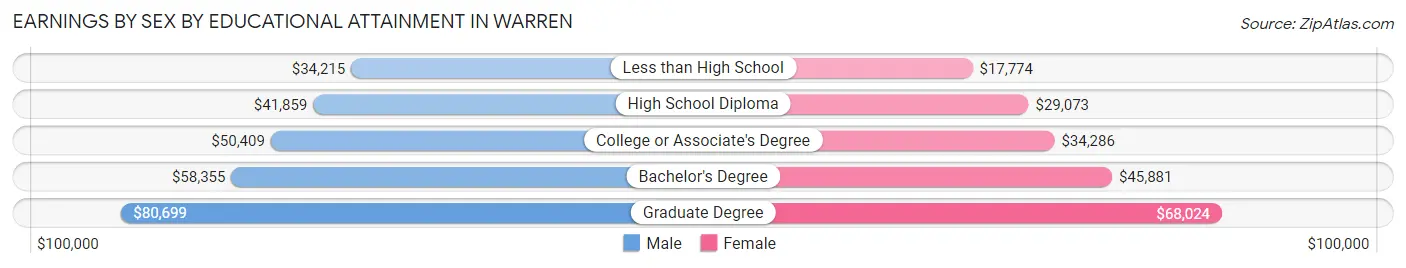
Earnings by Sex by Educational Attainment in Warren
Average earnings in Warren are $47,537 for men and $34,858 for women, a difference of 26.7%. Men with an educational attainment of graduate degree enjoy the highest average annual earnings of $80,699, while those with less than high school education earn the least with $34,215. Women with an educational attainment of graduate degree earn the most with the average annual earnings of $68,024, while those with less than high school education have the smallest earnings of $17,774.
| Educational Attainment | Male Income | Female Income |
| Less than High School | $34,215 | $17,774 |
| High School Diploma | $41,859 | $29,073 |
| College or Associate's Degree | $50,409 | $34,286 |
| Bachelor's Degree | $58,355 | $45,881 |
| Graduate Degree | $80,699 | $68,024 |
| Total | $47,537 | $34,858 |
Family Income in Warren
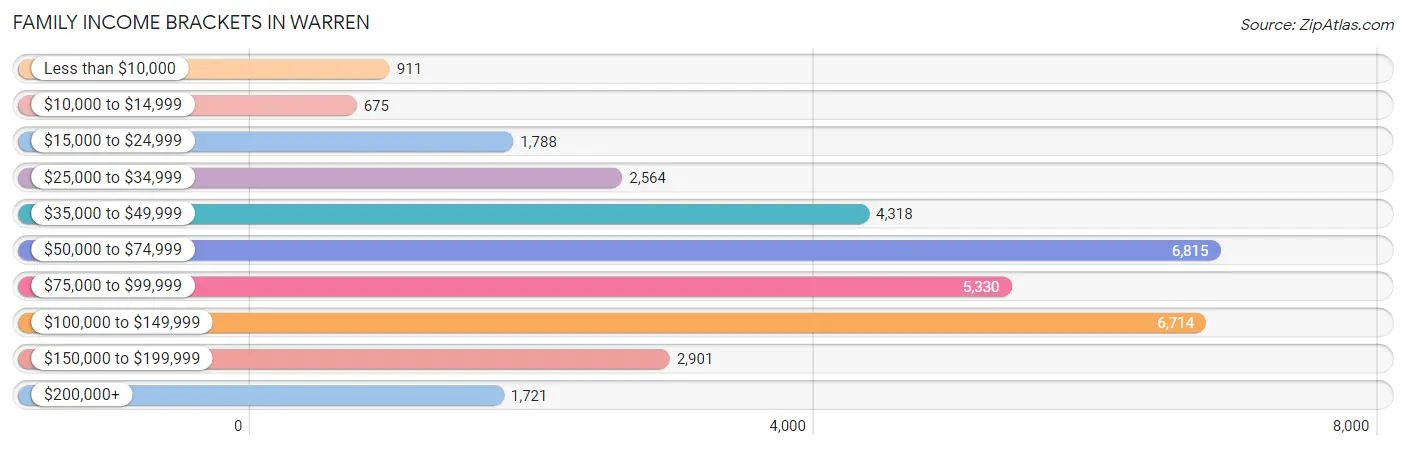
Family Income Brackets in Warren
According to the Warren family income data, there are 6,815 families falling into the $50,000 to $74,999 income range, which is the most common income bracket and makes up 20.2% of all families. Conversely, the $10,000 to $14,999 income bracket is the least frequent group with only 675 families (2.0%) belonging to this category.
| Income Bracket | # Families | % Families |
| Less than $10,000 | 911 | 2.7% |
| $10,000 to $14,999 | 675 | 2.0% |
| $15,000 to $24,999 | 1,788 | 5.3% |
| $25,000 to $34,999 | 2,564 | 7.6% |
| $35,000 to $49,999 | 4,318 | 12.8% |
| $50,000 to $74,999 | 6,815 | 20.2% |
| $75,000 to $99,999 | 5,330 | 15.8% |
| $100,000 to $149,999 | 6,714 | 19.9% |
| $150,000 to $199,999 | 2,901 | 8.6% |
| $200,000+ | 1,721 | 5.1% |
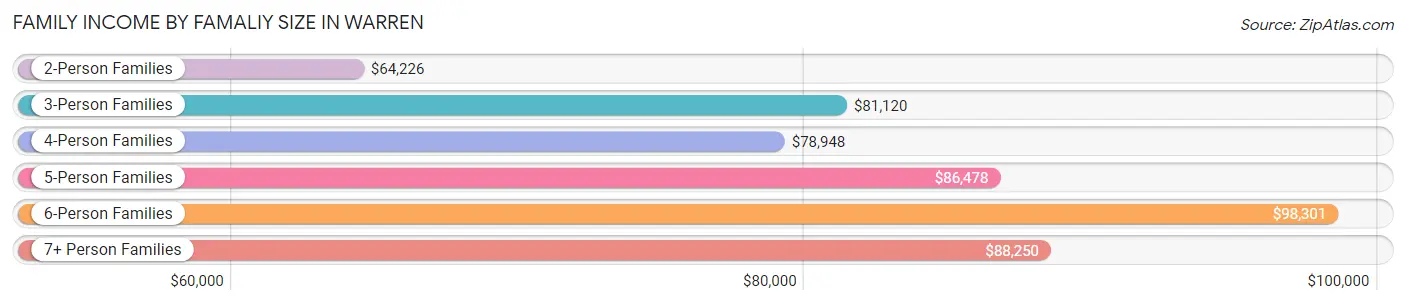
Family Income by Famaliy Size in Warren
6-person families (1,271 | 3.8%) account for the highest median family income in Warren with $98,301 per family, while 2-person families (15,217 | 45.1%) have the highest median income of $32,113 per family member.
| Income Bracket | # Families | Median Income |
| 2-Person Families | 15,217 (45.1%) | $64,226 |
| 3-Person Families | 8,097 (24.0%) | $81,120 |
| 4-Person Families | 5,165 (15.3%) | $78,948 |
| 5-Person Families | 3,304 (9.8%) | $86,478 |
| 6-Person Families | 1,271 (3.8%) | $98,301 |
| 7+ Person Families | 683 (2.0%) | $88,250 |
| Total | 33,737 (100.0%) | $73,931 |
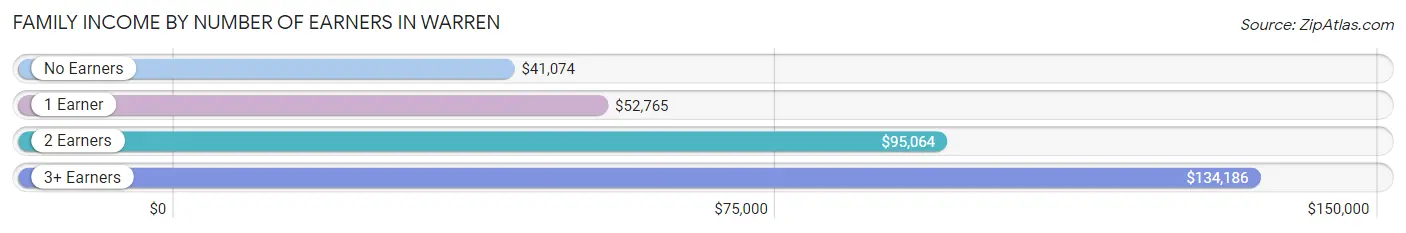
Family Income by Number of Earners in Warren
The median family income in Warren is $73,931, with families comprising 3+ earners (5,108) having the highest median family income of $134,186, while families with no earners (4,529) have the lowest median family income of $41,074, accounting for 15.1% and 13.4% of families, respectively.
| Number of Earners | # Families | Median Income |
| No Earners | 4,529 (13.4%) | $41,074 |
| 1 Earner | 11,799 (35.0%) | $52,765 |
| 2 Earners | 12,301 (36.5%) | $95,064 |
| 3+ Earners | 5,108 (15.1%) | $134,186 |
| Total | 33,737 (100.0%) | $73,931 |
Household Income in Warren
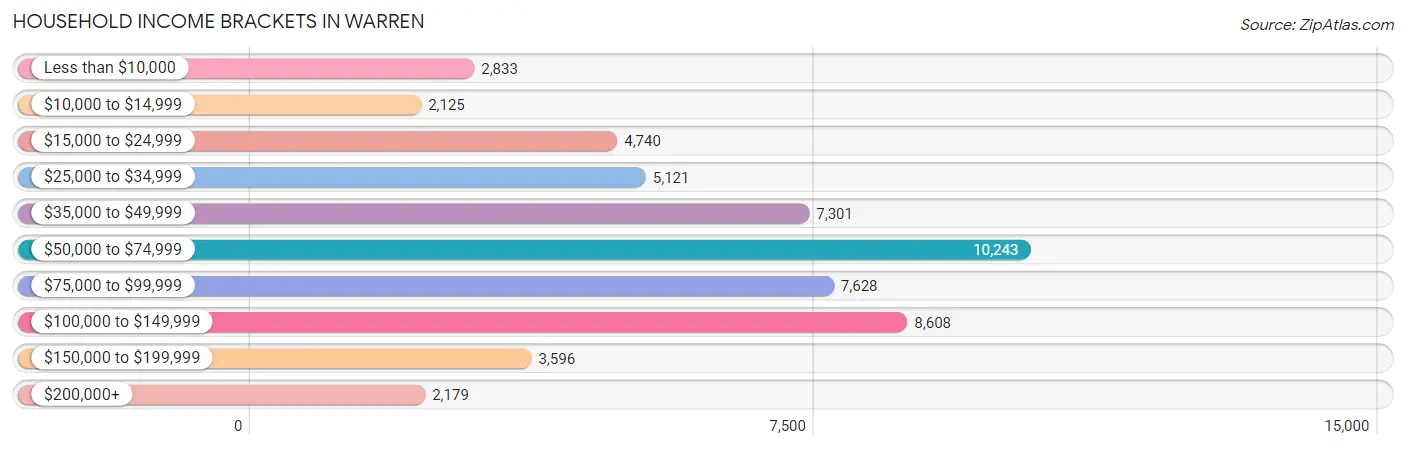
Household Income Brackets in Warren
With 10,243 households falling in the category, the $50,000 to $74,999 income range is the most frequent in Warren, accounting for 18.8% of all households. In contrast, only 2,125 households (3.9%) fall into the $10,000 to $14,999 income bracket, making it the least populous group.
| Income Bracket | # Households | % Households |
| Less than $10,000 | 2,833 | 5.2% |
| $10,000 to $14,999 | 2,125 | 3.9% |
| $15,000 to $24,999 | 4,740 | 8.7% |
| $25,000 to $34,999 | 5,121 | 9.4% |
| $35,000 to $49,999 | 7,301 | 13.4% |
| $50,000 to $74,999 | 10,243 | 18.8% |
| $75,000 to $99,999 | 7,628 | 14.0% |
| $100,000 to $149,999 | 8,608 | 15.8% |
| $150,000 to $199,999 | 3,596 | 6.6% |
| $200,000+ | 2,179 | 4.0% |
Household Income by Householder Age in Warren
The median household income in Warren is $61,633, with the highest median household income of $73,319 found in the 45 to 64 years age bracket for the primary householder. A total of 21,138 households (38.8%) fall into this category. Meanwhile, the 15 to 24 years age bracket for the primary householder has the lowest median household income of $41,582, with 1,122 households (2.1%) in this group.
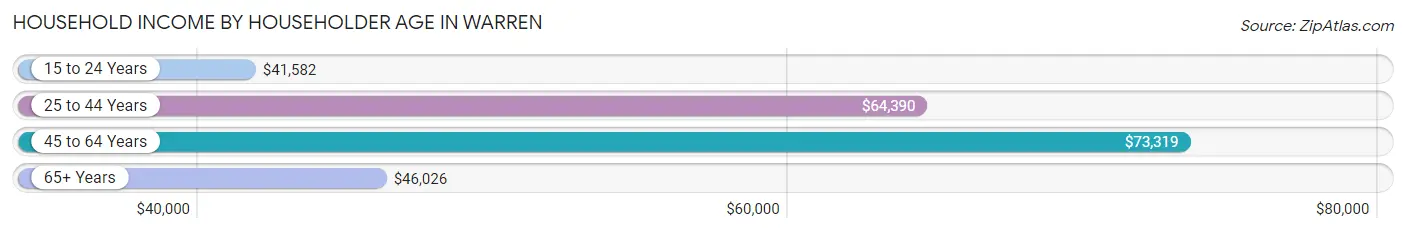
| Income Bracket | # Households | Median Income |
| 15 to 24 Years | 1,122 (2.1%) | $41,582 |
| 25 to 44 Years | 18,223 (33.5%) | $64,390 |
| 45 to 64 Years | 21,138 (38.8%) | $73,319 |
| 65+ Years | 14,000 (25.7%) | $46,026 |
| Total | 54,483 (100.0%) | $61,633 |
Poverty in Warren
Income Below Poverty by Sex and Age in Warren
With 12.7% poverty level for males and 14.3% for females among the residents of Warren, 12 to 14 year old males and 12 to 14 year old females are the most vulnerable to poverty, with 674 males (24.7%) and 497 females (22.3%) in their respective age groups living below the poverty level.
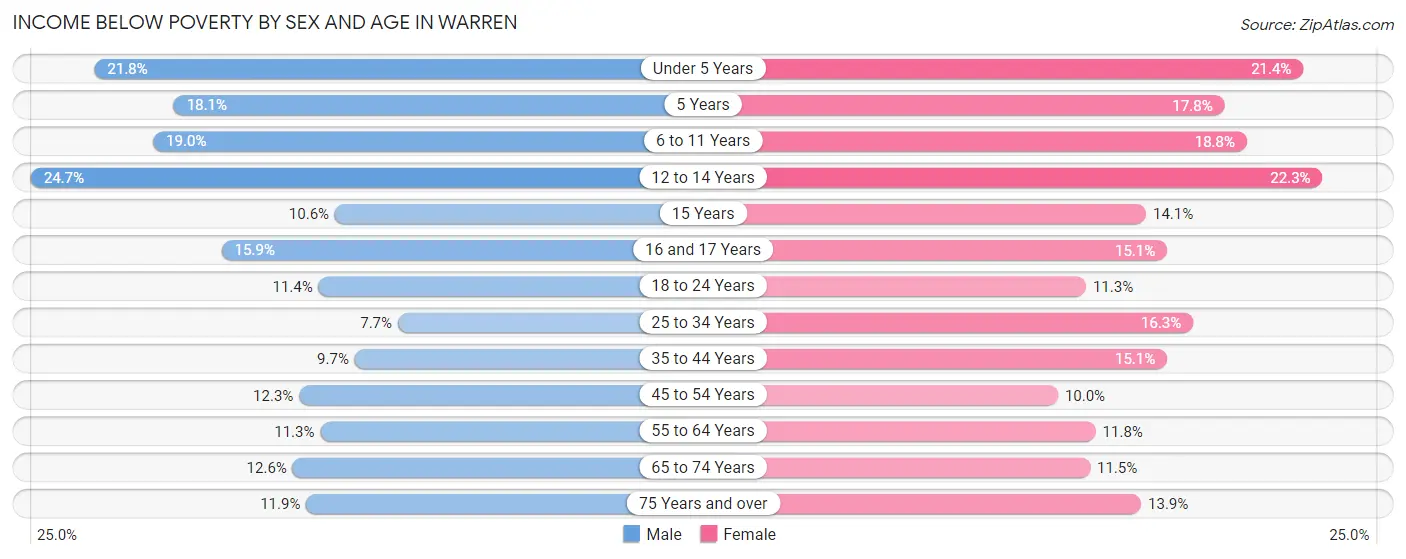
| Age Bracket | Male | Female |
| Under 5 Years | 953 (21.8%) | 816 (21.4%) |
| 5 Years | 141 (18.1%) | 127 (17.8%) |
| 6 to 11 Years | 905 (19.0%) | 885 (18.8%) |
| 12 to 14 Years | 674 (24.7%) | 497 (22.3%) |
| 15 Years | 79 (10.6%) | 122 (14.1%) |
| 16 and 17 Years | 291 (15.9%) | 223 (15.1%) |
| 18 to 24 Years | 632 (11.4%) | 642 (11.3%) |
| 25 to 34 Years | 815 (7.7%) | 1,871 (16.3%) |
| 35 to 44 Years | 905 (9.7%) | 1,224 (15.1%) |
| 45 to 54 Years | 971 (12.3%) | 891 (10.0%) |
| 55 to 64 Years | 1,097 (11.3%) | 1,107 (11.8%) |
| 65 to 74 Years | 727 (12.6%) | 755 (11.5%) |
| 75 Years and over | 416 (11.9%) | 800 (13.9%) |
| Total | 8,606 (12.7%) | 9,960 (14.3%) |
Income Above Poverty by Sex and Age in Warren
According to the poverty statistics in Warren, males aged 25 to 34 years and females aged 45 to 54 years are the age groups that are most secure financially, with 92.3% of males and 90.0% of females in these age groups living above the poverty line.
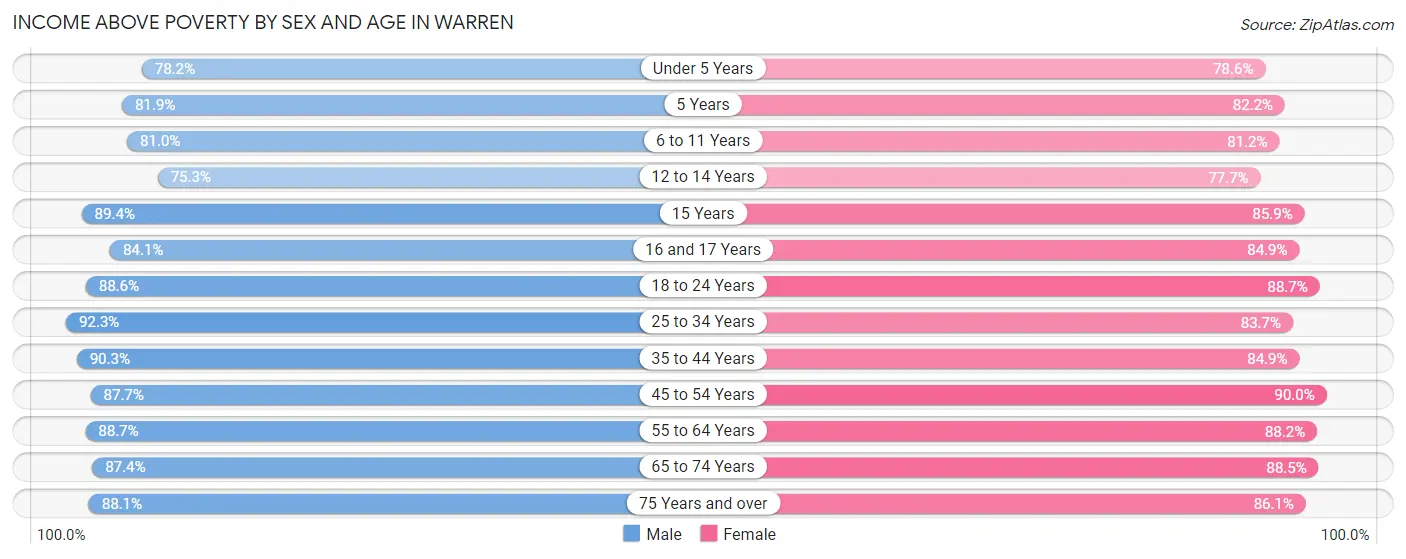
| Age Bracket | Male | Female |
| Under 5 Years | 3,427 (78.2%) | 2,996 (78.6%) |
| 5 Years | 639 (81.9%) | 588 (82.2%) |
| 6 to 11 Years | 3,848 (81.0%) | 3,824 (81.2%) |
| 12 to 14 Years | 2,054 (75.3%) | 1,732 (77.7%) |
| 15 Years | 666 (89.4%) | 742 (85.9%) |
| 16 and 17 Years | 1,544 (84.1%) | 1,255 (84.9%) |
| 18 to 24 Years | 4,933 (88.6%) | 5,023 (88.7%) |
| 25 to 34 Years | 9,796 (92.3%) | 9,607 (83.7%) |
| 35 to 44 Years | 8,442 (90.3%) | 6,885 (84.9%) |
| 45 to 54 Years | 6,949 (87.7%) | 7,992 (90.0%) |
| 55 to 64 Years | 8,627 (88.7%) | 8,287 (88.2%) |
| 65 to 74 Years | 5,060 (87.4%) | 5,800 (88.5%) |
| 75 Years and over | 3,070 (88.1%) | 4,959 (86.1%) |
| Total | 59,055 (87.3%) | 59,690 (85.7%) |
Income Below Poverty Among Married-Couple Families in Warren
The poverty statistics for married-couple families in Warren show that 6.5% or 1,439 of the total 22,023 families live below the poverty line. Families with 5 or more children have the highest poverty rate of 30.2%, comprising of 29 families. On the other hand, families with no children have the lowest poverty rate of 4.1%, which includes 515 families.
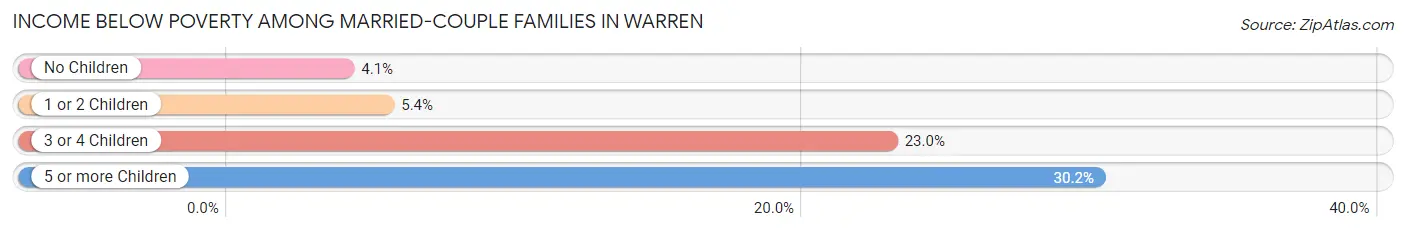
| Children | Above Poverty | Below Poverty |
| No Children | 12,194 (96.0%) | 515 (4.1%) |
| 1 or 2 Children | 6,593 (94.6%) | 379 (5.4%) |
| 3 or 4 Children | 1,730 (77.0%) | 516 (23.0%) |
| 5 or more Children | 67 (69.8%) | 29 (30.2%) |
| Total | 20,584 (93.5%) | 1,439 (6.5%) |
Income Below Poverty Among Single-Parent Households in Warren
According to the poverty data in Warren, 8.1% or 278 single-father households and 18.1% or 1,502 single-mother households are living below the poverty line. Among single-father households, those with 1 or 2 children have the highest poverty rate, with 200 households (15.5%) experiencing poverty. Likewise, among single-mother households, those with 3 or 4 children have the highest poverty rate, with 318 households (52.0%) falling below the poverty line.
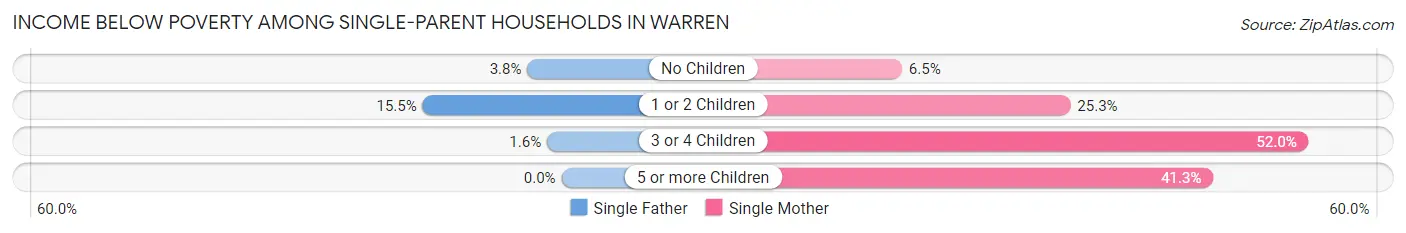
| Children | Single Father | Single Mother |
| No Children | 75 (3.8%) | 265 (6.5%) |
| 1 or 2 Children | 200 (15.5%) | 900 (25.3%) |
| 3 or 4 Children | 3 (1.6%) | 318 (52.0%) |
| 5 or more Children | 0 (0.0%) | 19 (41.3%) |
| Total | 278 (8.1%) | 1,502 (18.1%) |
Income Below Poverty Among Married-Couple vs Single-Parent Households in Warren
The poverty data for Warren shows that 1,439 of the married-couple family households (6.5%) and 1,780 of the single-parent households (15.2%) are living below the poverty level. Within the married-couple family households, those with 5 or more children have the highest poverty rate, with 29 households (30.2%) falling below the poverty line. Among the single-parent households, those with 5 or more children have the highest poverty rate, with 19 household (41.3%) living below poverty.
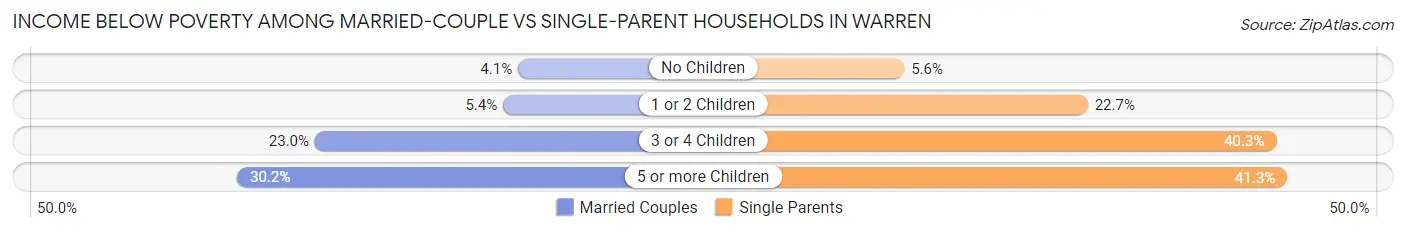
| Children | Married-Couple Families | Single-Parent Households |
| No Children | 515 (4.1%) | 340 (5.6%) |
| 1 or 2 Children | 379 (5.4%) | 1,100 (22.7%) |
| 3 or 4 Children | 516 (23.0%) | 321 (40.3%) |
| 5 or more Children | 29 (30.2%) | 19 (41.3%) |
| Total | 1,439 (6.5%) | 1,780 (15.2%) |
Race in Warren
The most populous races in Warren are White / Caucasian (88,311 | 63.7%), Black / African American (27,510 | 19.9%), and Asian (14,805 | 10.7%).
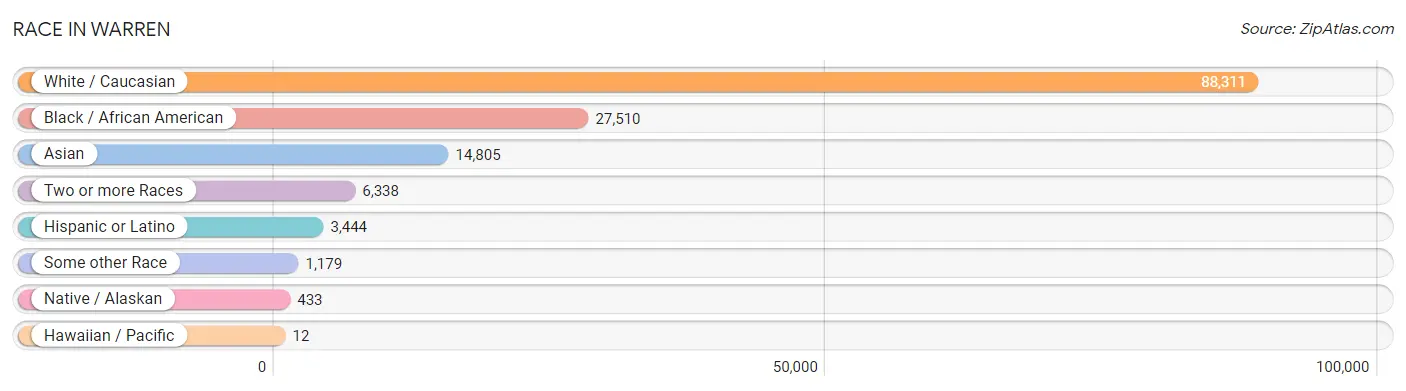
| Race | # Population | % Population |
| Asian | 14,805 | 10.7% |
| Black / African American | 27,510 | 19.9% |
| Hawaiian / Pacific | 12 | 0.0% |
| Hispanic or Latino | 3,444 | 2.5% |
| Native / Alaskan | 433 | 0.3% |
| White / Caucasian | 88,311 | 63.7% |
| Two or more Races | 6,338 | 4.6% |
| Some other Race | 1,179 | 0.9% |
| Total | 138,588 | 100.0% |
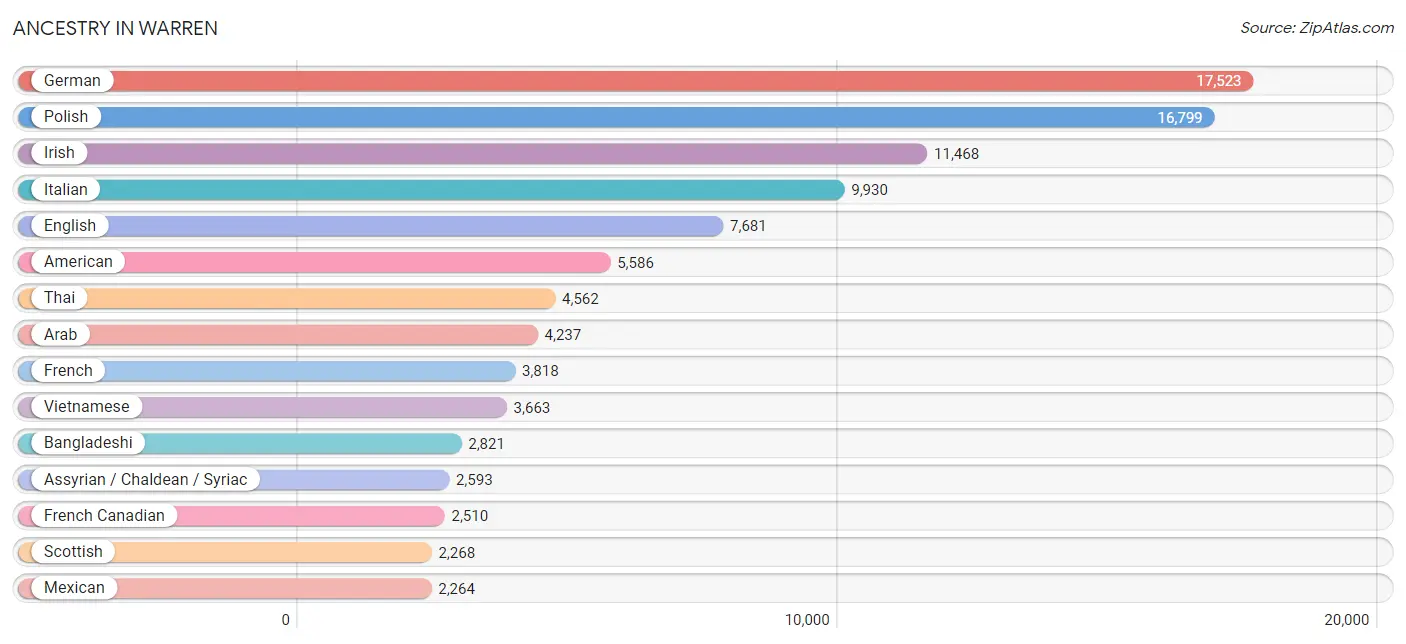
Ancestry in Warren
The most populous ancestries reported in Warren are German (17,523 | 12.6%), Polish (16,799 | 12.1%), Irish (11,468 | 8.3%), Italian (9,930 | 7.2%), and English (7,681 | 5.5%), together accounting for 45.7% of all Warren residents.
| Ancestry | # Population | % Population |
| Afghan | 26 | 0.0% |
| African | 516 | 0.4% |
| Albanian | 476 | 0.3% |
| American | 5,586 | 4.0% |
| Apache | 23 | 0.0% |
| Arab | 4,237 | 3.1% |
| Armenian | 185 | 0.1% |
| Assyrian / Chaldean / Syriac | 2,593 | 1.9% |
| Austrian | 139 | 0.1% |
| Bangladeshi | 2,821 | 2.0% |
| Barbadian | 18 | 0.0% |
| Belgian | 820 | 0.6% |
| Bhutanese | 260 | 0.2% |
| Blackfeet | 126 | 0.1% |
| Brazilian | 14 | 0.0% |
| British | 349 | 0.3% |
| Bulgarian | 9 | 0.0% |
| Burmese | 291 | 0.2% |
| Canadian | 380 | 0.3% |
| Central American | 129 | 0.1% |
| Cherokee | 426 | 0.3% |
| Chickasaw | 11 | 0.0% |
| Chippewa | 220 | 0.2% |
| Colombian | 75 | 0.1% |
| Costa Rican | 12 | 0.0% |
| Creek | 198 | 0.1% |
| Croatian | 294 | 0.2% |
| Cuban | 33 | 0.0% |
| Czech | 164 | 0.1% |
| Czechoslovakian | 87 | 0.1% |
| Danish | 148 | 0.1% |
| Dominican | 18 | 0.0% |
| Dutch | 781 | 0.6% |
| Dutch West Indian | 43 | 0.0% |
| Eastern European | 219 | 0.2% |
| Egyptian | 8 | 0.0% |
| English | 7,681 | 5.5% |
| European | 900 | 0.6% |
| Filipino | 95 | 0.1% |
| Finnish | 550 | 0.4% |
| French | 3,818 | 2.8% |
| French American Indian | 7 | 0.0% |
| French Canadian | 2,510 | 1.8% |
| German | 17,523 | 12.6% |
| Greek | 510 | 0.4% |
| Guatemalan | 27 | 0.0% |
| Guyanese | 11 | 0.0% |
| Haitian | 32 | 0.0% |
| Honduran | 41 | 0.0% |
| Hungarian | 768 | 0.5% |
| Indian (Asian) | 597 | 0.4% |
| Iranian | 86 | 0.1% |
| Iraqi | 2,061 | 1.5% |
| Irish | 11,468 | 8.3% |
| Iroquois | 53 | 0.0% |
| Israeli | 9 | 0.0% |
| Italian | 9,930 | 7.2% |
| Jamaican | 152 | 0.1% |
| Japanese | 47 | 0.0% |
| Jordanian | 60 | 0.0% |
| Kenyan | 98 | 0.1% |
| Korean | 1,495 | 1.1% |
| Laotian | 8 | 0.0% |
| Lebanese | 803 | 0.6% |
| Lithuanian | 287 | 0.2% |
| Lumbee | 26 | 0.0% |
| Macedonian | 299 | 0.2% |
| Malaysian | 127 | 0.1% |
| Maltese | 130 | 0.1% |
| Mexican | 2,264 | 1.6% |
| Mexican American Indian | 27 | 0.0% |
| Moroccan | 23 | 0.0% |
| Native Hawaiian | 80 | 0.1% |
| Navajo | 18 | 0.0% |
| Nigerian | 127 | 0.1% |
| Northern European | 48 | 0.0% |
| Norwegian | 561 | 0.4% |
| Ottawa | 3 | 0.0% |
| Pakistani | 156 | 0.1% |
| Palestinian | 18 | 0.0% |
| Panamanian | 49 | 0.0% |
| Pennsylvania German | 31 | 0.0% |
| Polish | 16,799 | 12.1% |
| Portuguese | 17 | 0.0% |
| Potawatomi | 42 | 0.0% |
| Puerto Rican | 485 | 0.4% |
| Romanian | 572 | 0.4% |
| Russian | 518 | 0.4% |
| Samoan | 11 | 0.0% |
| Scandinavian | 133 | 0.1% |
| Scotch-Irish | 576 | 0.4% |
| Scottish | 2,268 | 1.6% |
| Serbian | 173 | 0.1% |
| Sioux | 27 | 0.0% |
| Slavic | 26 | 0.0% |
| Slovak | 258 | 0.2% |
| Slovene | 54 | 0.0% |
| South African | 22 | 0.0% |
| South American | 83 | 0.1% |
| Spaniard | 128 | 0.1% |
| Spanish | 40 | 0.0% |
| Sri Lankan | 1,036 | 0.7% |
| Subsaharan African | 798 | 0.6% |
| Swedish | 560 | 0.4% |
| Swiss | 12 | 0.0% |
| Syrian | 118 | 0.1% |
| Thai | 4,562 | 3.3% |
| Turkish | 67 | 0.1% |
| Ukrainian | 1,129 | 0.8% |
| Venezuelan | 8 | 0.0% |
| Vietnamese | 3,663 | 2.6% |
| Welsh | 413 | 0.3% |
| West Indian | 7 | 0.0% |
| Yaqui | 6 | 0.0% |
| Yugoslavian | 607 | 0.4% | View All 115 Rows |
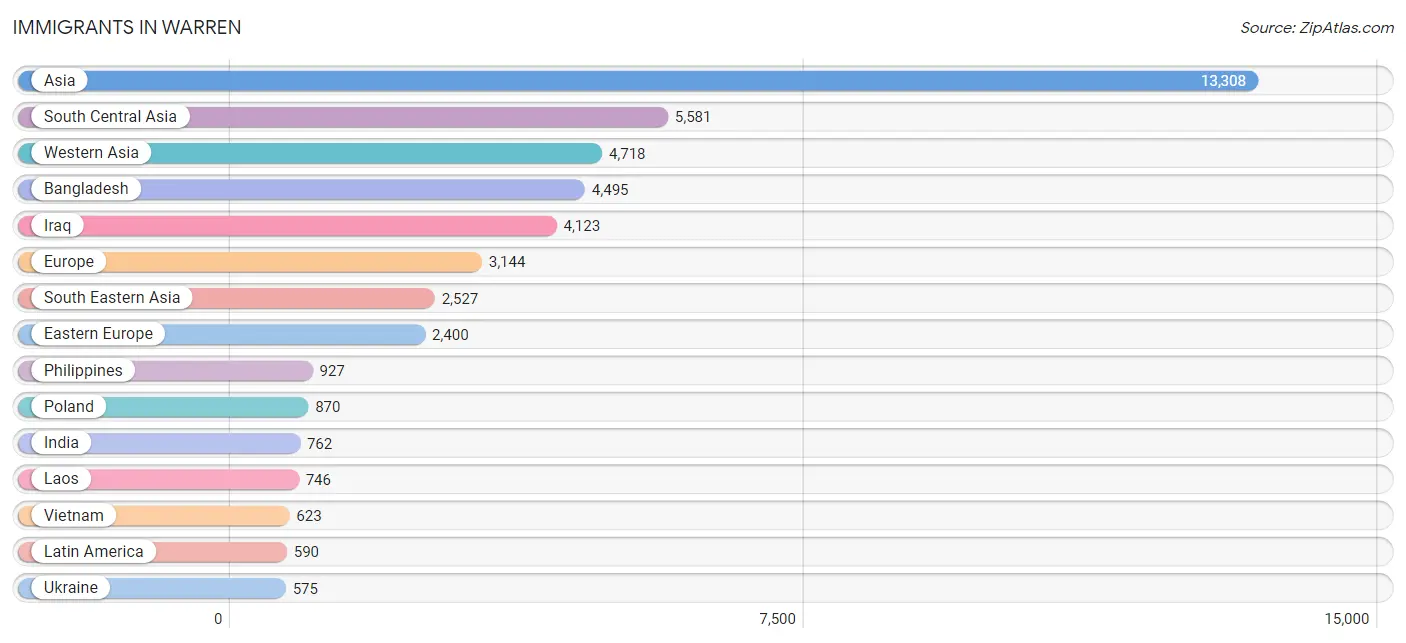
Immigrants in Warren
The most numerous immigrant groups reported in Warren came from Asia (13,308 | 9.6%), South Central Asia (5,581 | 4.0%), Western Asia (4,718 | 3.4%), Bangladesh (4,495 | 3.2%), and Iraq (4,123 | 3.0%), together accounting for 23.2% of all Warren residents.
| Immigration Origin | # Population | % Population |
| Africa | 201 | 0.2% |
| Albania | 75 | 0.1% |
| Argentina | 8 | 0.0% |
| Asia | 13,308 | 9.6% |
| Australia | 8 | 0.0% |
| Austria | 3 | 0.0% |
| Bangladesh | 4,495 | 3.2% |
| Belgium | 9 | 0.0% |
| Bosnia and Herzegovina | 306 | 0.2% |
| Cameroon | 16 | 0.0% |
| Canada | 490 | 0.4% |
| Caribbean | 85 | 0.1% |
| Central America | 451 | 0.3% |
| China | 355 | 0.3% |
| Colombia | 32 | 0.0% |
| Costa Rica | 12 | 0.0% |
| Cuba | 2 | 0.0% |
| Czechoslovakia | 22 | 0.0% |
| Eastern Africa | 88 | 0.1% |
| Eastern Asia | 482 | 0.4% |
| Eastern Europe | 2,400 | 1.7% |
| Egypt | 14 | 0.0% |
| England | 75 | 0.1% |
| Europe | 3,144 | 2.3% |
| Germany | 287 | 0.2% |
| Greece | 60 | 0.0% |
| Guatemala | 18 | 0.0% |
| Honduras | 6 | 0.0% |
| Hong Kong | 60 | 0.0% |
| Hungary | 16 | 0.0% |
| India | 762 | 0.5% |
| Indonesia | 8 | 0.0% |
| Iran | 86 | 0.1% |
| Iraq | 4,123 | 3.0% |
| Ireland | 8 | 0.0% |
| Italy | 225 | 0.2% |
| Jamaica | 54 | 0.0% |
| Japan | 7 | 0.0% |
| Jordan | 26 | 0.0% |
| Kenya | 88 | 0.1% |
| Korea | 105 | 0.1% |
| Kuwait | 119 | 0.1% |
| Laos | 746 | 0.5% |
| Latin America | 590 | 0.4% |
| Latvia | 11 | 0.0% |
| Lebanon | 271 | 0.2% |
| Malaysia | 15 | 0.0% |
| Mexico | 348 | 0.3% |
| Middle Africa | 32 | 0.0% |
| Moldova | 6 | 0.0% |
| Morocco | 11 | 0.0% |
| Netherlands | 7 | 0.0% |
| Nicaragua | 67 | 0.1% |
| Nigeria | 33 | 0.0% |
| North Macedonia | 65 | 0.1% |
| Northern Africa | 29 | 0.0% |
| Northern Europe | 148 | 0.1% |
| Oceania | 8 | 0.0% |
| Pakistan | 238 | 0.2% |
| Philippines | 927 | 0.7% |
| Poland | 870 | 0.6% |
| Romania | 180 | 0.1% |
| Scotland | 23 | 0.0% |
| Senegal | 19 | 0.0% |
| Serbia | 49 | 0.0% |
| Singapore | 14 | 0.0% |
| South America | 54 | 0.0% |
| South Central Asia | 5,581 | 4.0% |
| South Eastern Asia | 2,527 | 1.8% |
| Southern Europe | 290 | 0.2% |
| Spain | 5 | 0.0% |
| Sudan | 4 | 0.0% |
| Syria | 161 | 0.1% |
| Taiwan | 25 | 0.0% |
| Thailand | 194 | 0.1% |
| Trinidad and Tobago | 29 | 0.0% |
| Turkey | 8 | 0.0% |
| Ukraine | 575 | 0.4% |
| Venezuela | 14 | 0.0% |
| Vietnam | 623 | 0.4% |
| Western Africa | 52 | 0.0% |
| Western Asia | 4,718 | 3.4% |
| Western Europe | 306 | 0.2% |
| Yemen | 10 | 0.0% | View All 84 Rows |
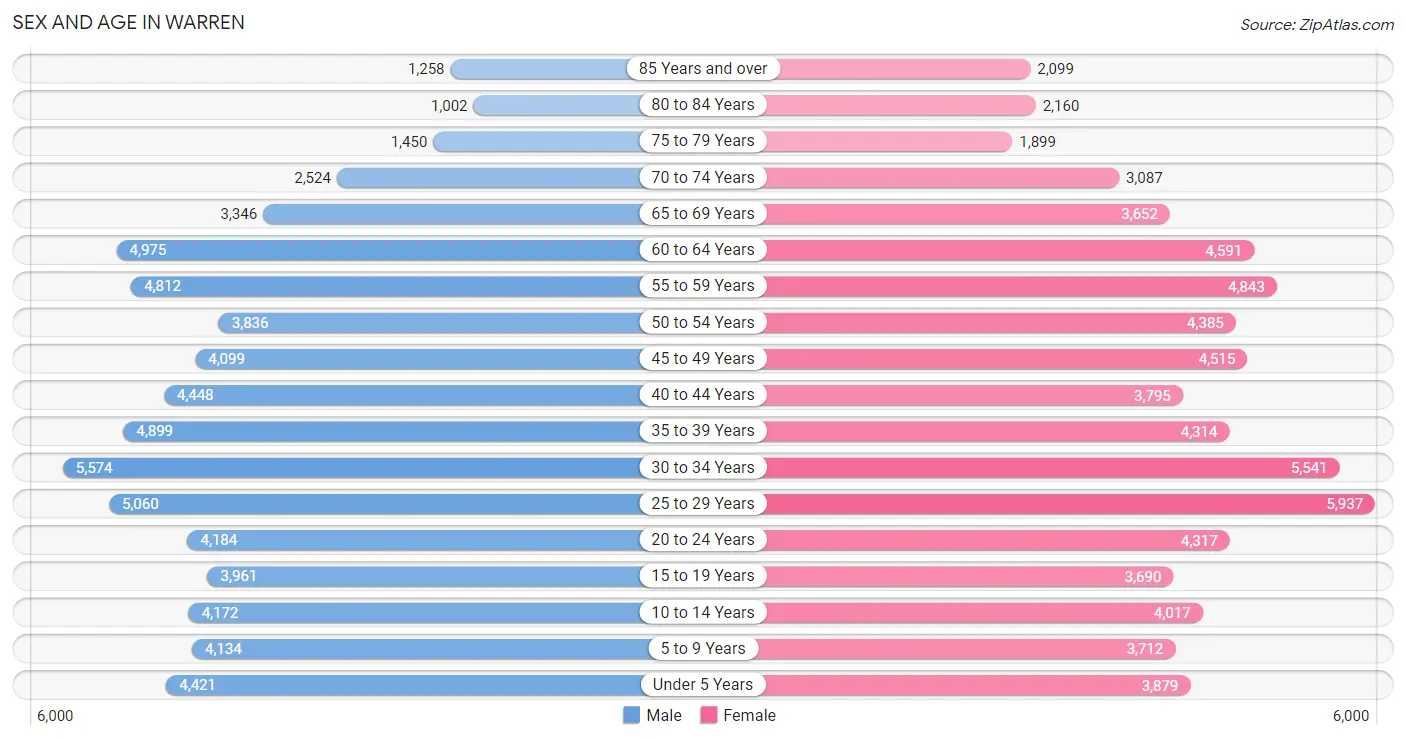
Sex and Age in Warren
Sex and Age in Warren
The most populous age groups in Warren are 30 to 34 Years (5,574 | 8.2%) for men and 25 to 29 Years (5,937 | 8.4%) for women.
| Age Bracket | Male | Female |
| Under 5 Years | 4,421 (6.5%) | 3,879 (5.5%) |
| 5 to 9 Years | 4,134 (6.1%) | 3,712 (5.3%) |
| 10 to 14 Years | 4,172 (6.1%) | 4,017 (5.7%) |
| 15 to 19 Years | 3,961 (5.8%) | 3,690 (5.2%) |
| 20 to 24 Years | 4,184 (6.1%) | 4,317 (6.1%) |
| 25 to 29 Years | 5,060 (7.4%) | 5,937 (8.4%) |
| 30 to 34 Years | 5,574 (8.2%) | 5,541 (7.9%) |
| 35 to 39 Years | 4,899 (7.2%) | 4,314 (6.1%) |
| 40 to 44 Years | 4,448 (6.5%) | 3,795 (5.4%) |
| 45 to 49 Years | 4,099 (6.0%) | 4,515 (6.4%) |
| 50 to 54 Years | 3,836 (5.6%) | 4,385 (6.2%) |
| 55 to 59 Years | 4,812 (7.1%) | 4,843 (6.9%) |
| 60 to 64 Years | 4,975 (7.3%) | 4,591 (6.5%) |
| 65 to 69 Years | 3,346 (4.9%) | 3,652 (5.2%) |
| 70 to 74 Years | 2,524 (3.7%) | 3,087 (4.4%) |
| 75 to 79 Years | 1,450 (2.1%) | 1,899 (2.7%) |
| 80 to 84 Years | 1,002 (1.5%) | 2,160 (3.1%) |
| 85 Years and over | 1,258 (1.8%) | 2,099 (3.0%) |
| Total | 68,155 (100.0%) | 70,433 (100.0%) |
Families and Households in Warren
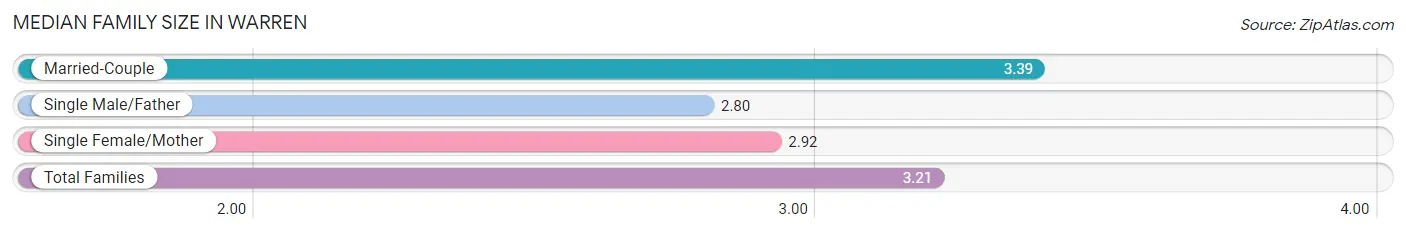
Median Family Size in Warren
The median family size in Warren is 3.21 persons per family, with married-couple families (22,023 | 65.3%) accounting for the largest median family size of 3.39 persons per family. On the other hand, single male/father families (3,435 | 10.2%) represent the smallest median family size with 2.80 persons per family.
| Family Type | # Families | Family Size |
| Married-Couple | 22,023 (65.3%) | 3.39 |
| Single Male/Father | 3,435 (10.2%) | 2.80 |
| Single Female/Mother | 8,279 (24.5%) | 2.92 |
| Total Families | 33,737 (100.0%) | 3.21 |
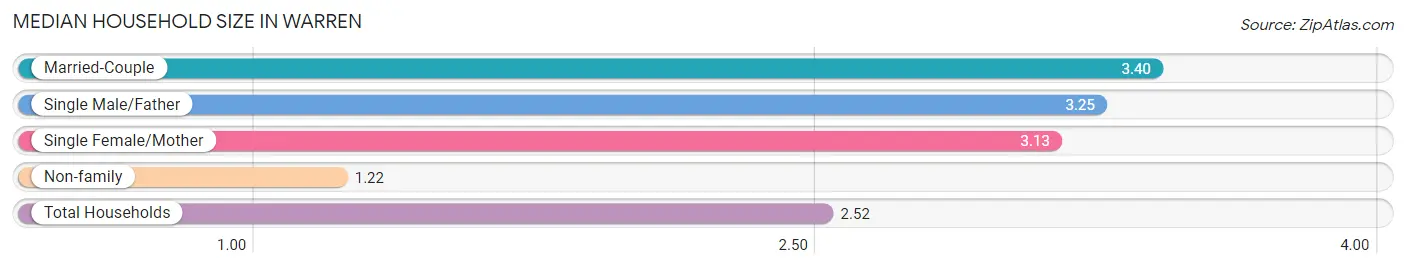
Median Household Size in Warren
The median household size in Warren is 2.52 persons per household, with married-couple households (22,023 | 40.4%) accounting for the largest median household size of 3.4 persons per household. non-family households (20,746 | 38.1%) represent the smallest median household size with 1.22 persons per household.
| Household Type | # Households | Household Size |
| Married-Couple | 22,023 (40.4%) | 3.40 |
| Single Male/Father | 3,435 (6.3%) | 3.25 |
| Single Female/Mother | 8,279 (15.2%) | 3.13 |
| Non-family | 20,746 (38.1%) | 1.22 |
| Total Households | 54,483 (100.0%) | 2.52 |
Household Size by Marriage Status in Warren
Out of a total of 54,483 households in Warren, 33,737 (61.9%) are family households, while 20,746 (38.1%) are nonfamily households. The most numerous type of family households are 2-person households, comprising 13,530, and the most common type of nonfamily households are 1-person households, comprising 17,148.
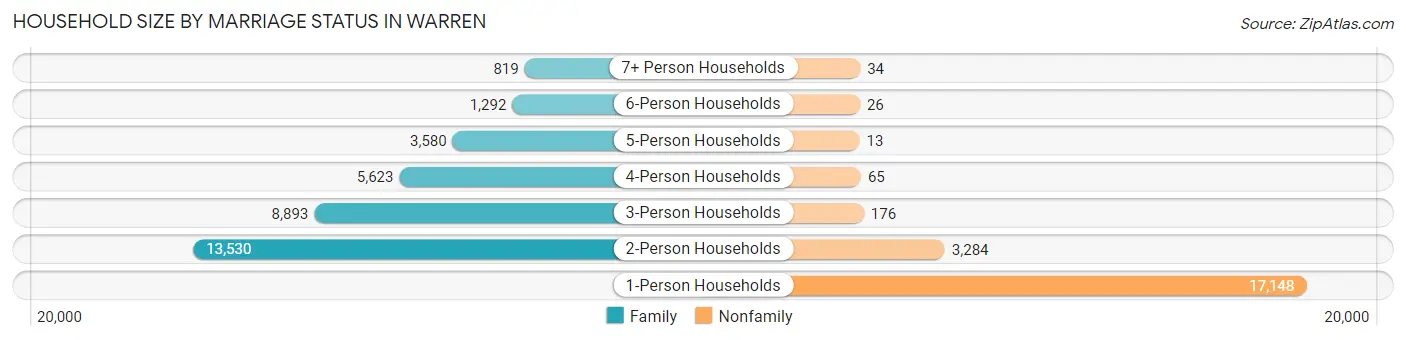
| Household Size | Family Households | Nonfamily Households |
| 1-Person Households | - | 17,148 (31.5%) |
| 2-Person Households | 13,530 (24.8%) | 3,284 (6.0%) |
| 3-Person Households | 8,893 (16.3%) | 176 (0.3%) |
| 4-Person Households | 5,623 (10.3%) | 65 (0.1%) |
| 5-Person Households | 3,580 (6.6%) | 13 (0.0%) |
| 6-Person Households | 1,292 (2.4%) | 26 (0.1%) |
| 7+ Person Households | 819 (1.5%) | 34 (0.1%) |
| Total | 33,737 (61.9%) | 20,746 (38.1%) |
Female Fertility in Warren
Fertility by Age in Warren
Average fertility rate in Warren is 59.0 births per 1,000 women. Women in the age bracket of 20 to 34 years have the highest fertility rate with 105.0 births per 1,000 women. Women in the age bracket of 20 to 34 years acount for 85.3% of all women with births.
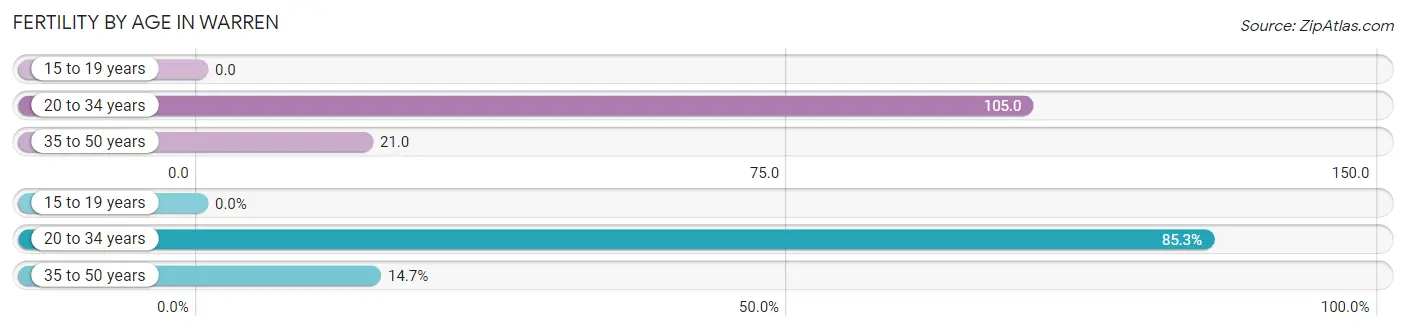
| Age Bracket | Women with Births | Births / 1,000 Women |
| 15 to 19 years | 0 (0.0%) | 0.0 |
| 20 to 34 years | 1,651 (85.3%) | 105.0 |
| 35 to 50 years | 284 (14.7%) | 21.0 |
| Total | 1,935 (100.0%) | 59.0 |
Fertility by Age by Marriage Status in Warren
66.4% of women with births (1,935) in Warren are married. The highest percentage of unmarried women with births falls into 20 to 34 years age bracket with 37.3% of them unmarried at the time of birth, while the lowest percentage of unmarried women with births belong to 35 to 50 years age bracket with 12.3% of them unmarried.
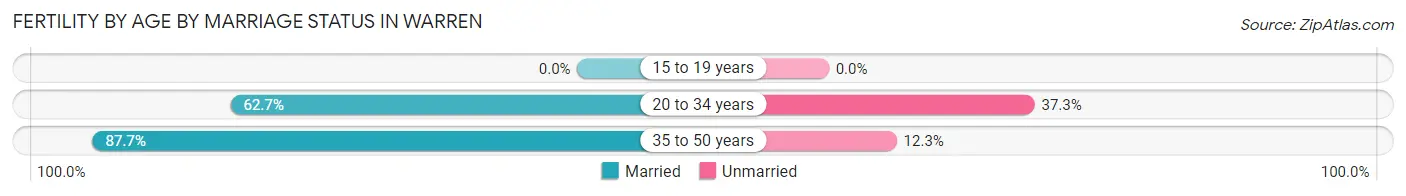
| Age Bracket | Married | Unmarried |
| 15 to 19 years | 0 (0.0%) | 0 (0.0%) |
| 20 to 34 years | 1,035 (62.7%) | 616 (37.3%) |
| 35 to 50 years | 249 (87.7%) | 35 (12.3%) |
| Total | 1,285 (66.4%) | 650 (33.6%) |
Fertility by Education in Warren
Average fertility rate in Warren is 59.0 births per 1,000 women. Women with the education attainment of bachelor's degree have the highest fertility rate of 68.0 births per 1,000 women, while women with the education attainment of graduate degree have the lowest fertility at 46.0 births per 1,000 women. Women with the education attainment of college or associate's degree represent 36.7% of all women with births.
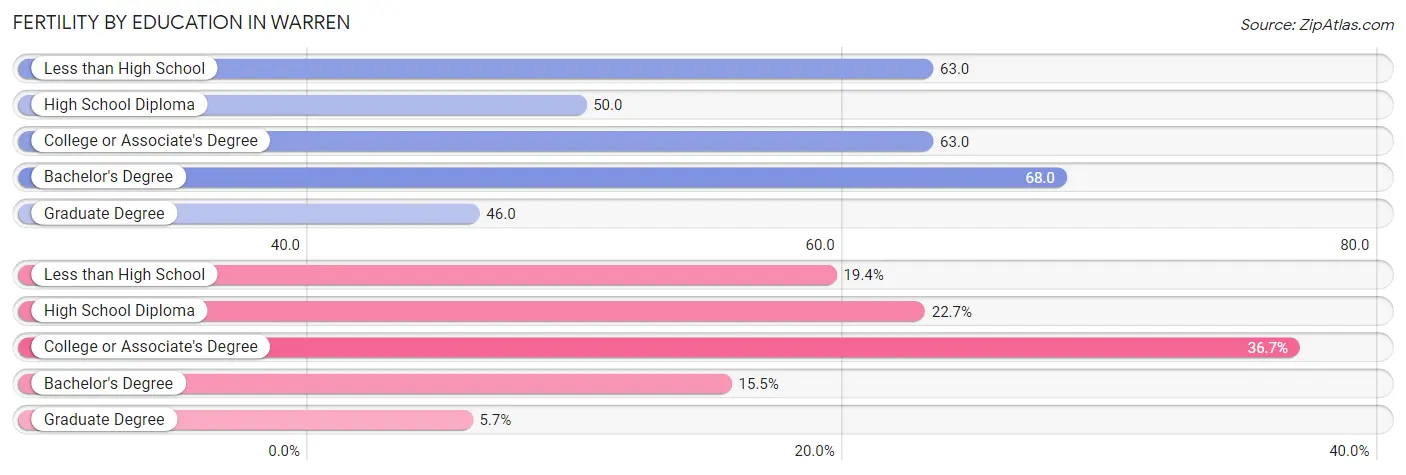
| Educational Attainment | Women with Births | Births / 1,000 Women |
| Less than High School | 375 (19.4%) | 63.0 |
| High School Diploma | 439 (22.7%) | 50.0 |
| College or Associate's Degree | 711 (36.7%) | 63.0 |
| Bachelor's Degree | 299 (15.4%) | 68.0 |
| Graduate Degree | 111 (5.7%) | 46.0 |
| Total | 1,935 (100.0%) | 59.0 |
Fertility by Education by Marriage Status in Warren
33.6% of women with births in Warren are unmarried. Women with the educational attainment of graduate degree are most likely to be married with 84.7% of them married at childbirth, while women with the educational attainment of high school diploma are least likely to be married with 65.6% of them unmarried at childbirth.
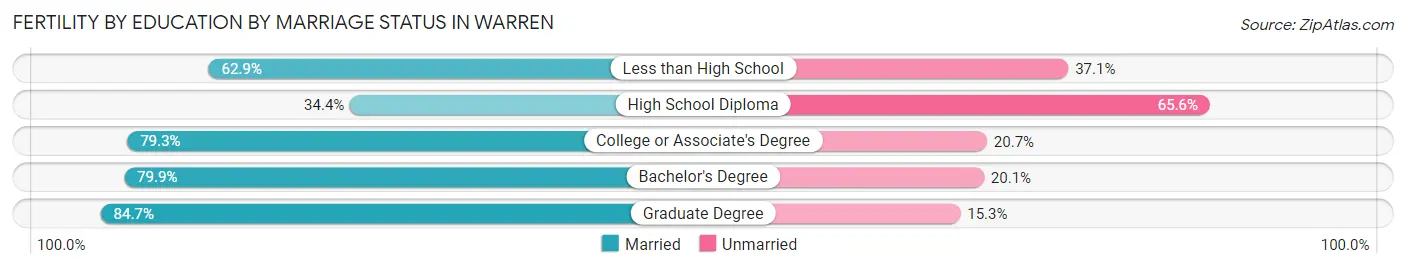
| Educational Attainment | Married | Unmarried |
| Less than High School | 236 (62.9%) | 139 (37.1%) |
| High School Diploma | 151 (34.4%) | 288 (65.6%) |
| College or Associate's Degree | 564 (79.3%) | 147 (20.7%) |
| Bachelor's Degree | 239 (79.9%) | 60 (20.1%) |
| Graduate Degree | 94 (84.7%) | 17 (15.3%) |
| Total | 1,285 (66.4%) | 650 (33.6%) |
Employment Characteristics in Warren
Employment by Class of Employer in Warren
Among the 64,986 employed individuals in Warren, private company employees (51,183 | 78.8%), not-for-profit organizations (4,604 | 7.1%), and local government employees (2,873 | 4.4%) make up the most common classes of employment.
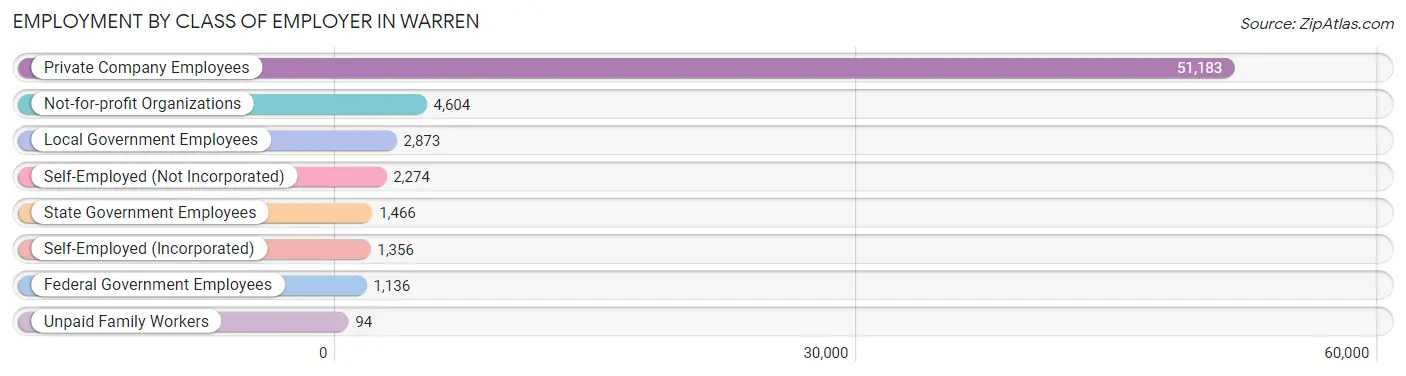
| Employer Class | # Employees | % Employees |
| Private Company Employees | 51,183 | 78.8% |
| Self-Employed (Incorporated) | 1,356 | 2.1% |
| Self-Employed (Not Incorporated) | 2,274 | 3.5% |
| Not-for-profit Organizations | 4,604 | 7.1% |
| Local Government Employees | 2,873 | 4.4% |
| State Government Employees | 1,466 | 2.3% |
| Federal Government Employees | 1,136 | 1.8% |
| Unpaid Family Workers | 94 | 0.1% |
| Total | 64,986 | 100.0% |
Employment Status by Age in Warren
According to the labor force statistics for Warren, out of the total population over 16 years of age (112,644), 63.7% or 71,754 individuals are in the labor force, with 7.4% or 5,310 of them unemployed. The age group with the highest labor force participation rate is 20 to 24 years, with 87.7% or 7,455 individuals in the labor force. Within the labor force, the 16 to 19 years age range has the highest percentage of unemployed individuals, with 23.6% or 700 of them being unemployed.
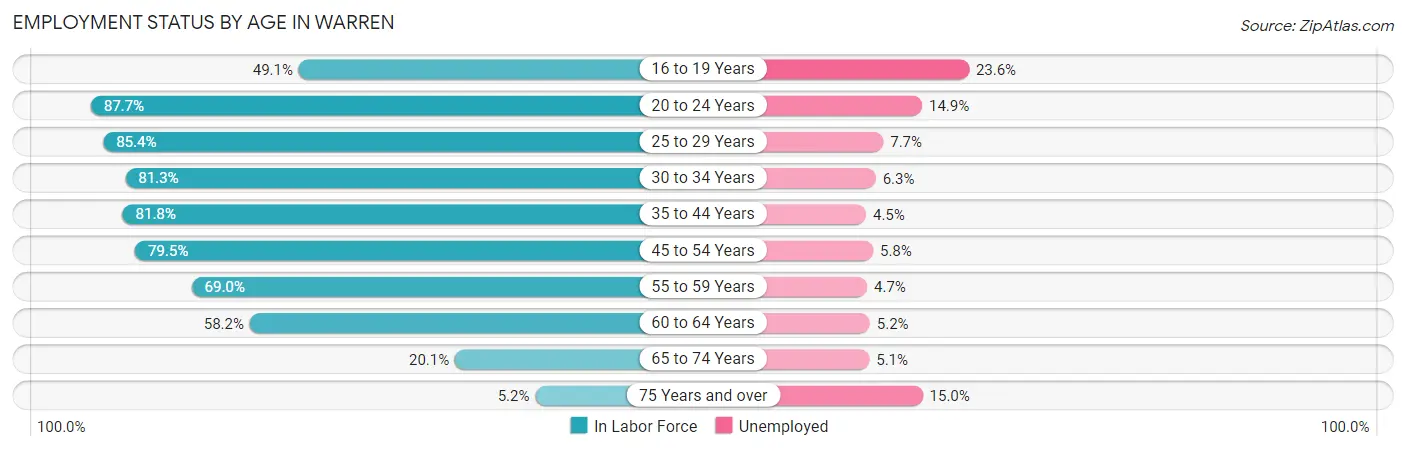
| Age Bracket | In Labor Force | Unemployed |
| 16 to 19 Years | 2,967 (49.1%) | 700 (23.6%) |
| 20 to 24 Years | 7,455 (87.7%) | 1,111 (14.9%) |
| 25 to 29 Years | 9,391 (85.4%) | 723 (7.7%) |
| 30 to 34 Years | 9,036 (81.3%) | 569 (6.3%) |
| 35 to 44 Years | 14,279 (81.8%) | 643 (4.5%) |
| 45 to 54 Years | 13,384 (79.5%) | 776 (5.8%) |
| 55 to 59 Years | 6,662 (69.0%) | 313 (4.7%) |
| 60 to 64 Years | 5,567 (58.2%) | 289 (5.2%) |
| 65 to 74 Years | 2,534 (20.1%) | 129 (5.1%) |
| 75 Years and over | 513 (5.2%) | 77 (15.0%) |
| Total | 71,754 (63.7%) | 5,310 (7.4%) |
Employment Status by Educational Attainment in Warren
According to labor force statistics for Warren, 77.1% of individuals (58,306) out of the total population between 25 and 64 years of age (75,624) are in the labor force, with 5.7% or 3,323 of them being unemployed. The group with the highest labor force participation rate are those with the educational attainment of bachelor's degree or higher, with 87.5% or 14,137 individuals in the labor force. Within the labor force, individuals with less than high school education have the highest percentage of unemployment, with 10.9% or 628 of them being unemployed.
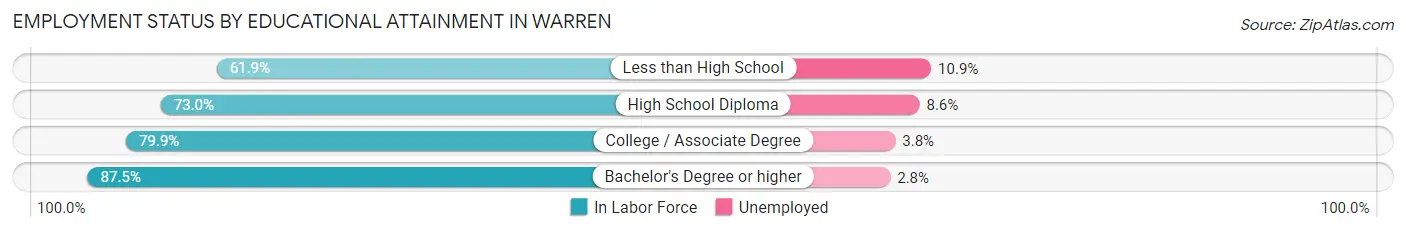
| Educational Attainment | In Labor Force | Unemployed |
| Less than High School | 5,763 (61.9%) | 1,015 (10.9%) |
| High School Diploma | 17,405 (73.0%) | 2,050 (8.6%) |
| College / Associate Degree | 21,026 (79.9%) | 1,000 (3.8%) |
| Bachelor's Degree or higher | 14,137 (87.5%) | 452 (2.8%) |
| Total | 58,306 (77.1%) | 4,311 (5.7%) |
Employment Occupations by Sex in Warren
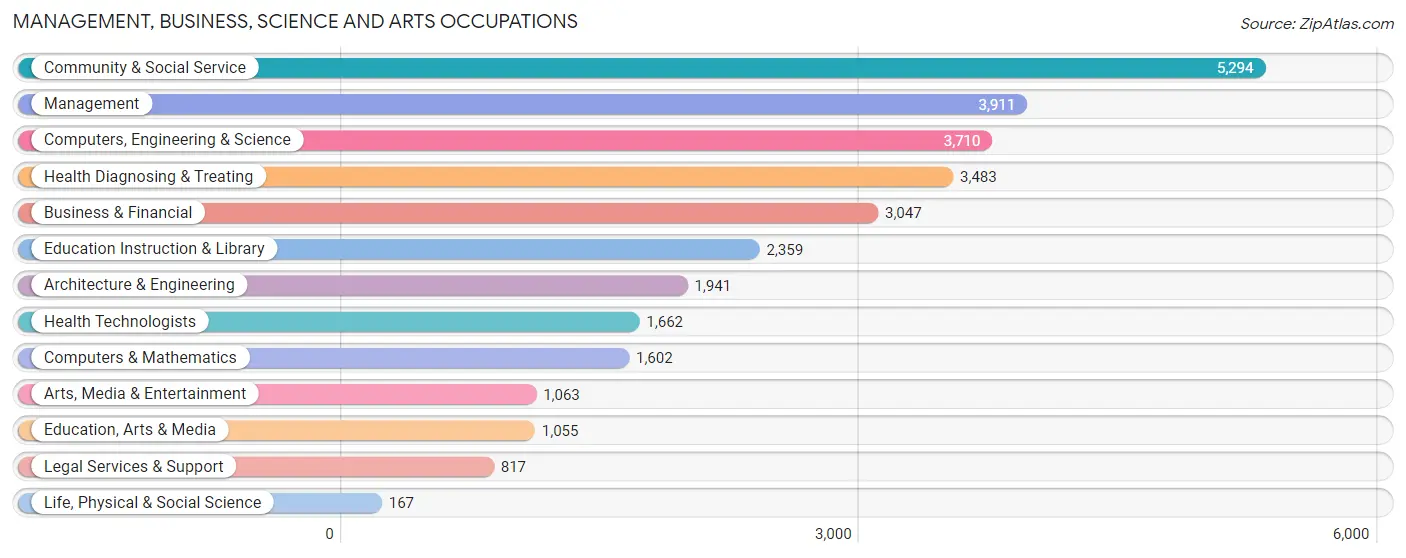
Management, Business, Science and Arts Occupations
The most common Management, Business, Science and Arts occupations in Warren are Community & Social Service (5,294 | 8.0%), Management (3,911 | 5.9%), Computers, Engineering & Science (3,710 | 5.6%), Health Diagnosing & Treating (3,483 | 5.2%), and Business & Financial (3,047 | 4.6%).
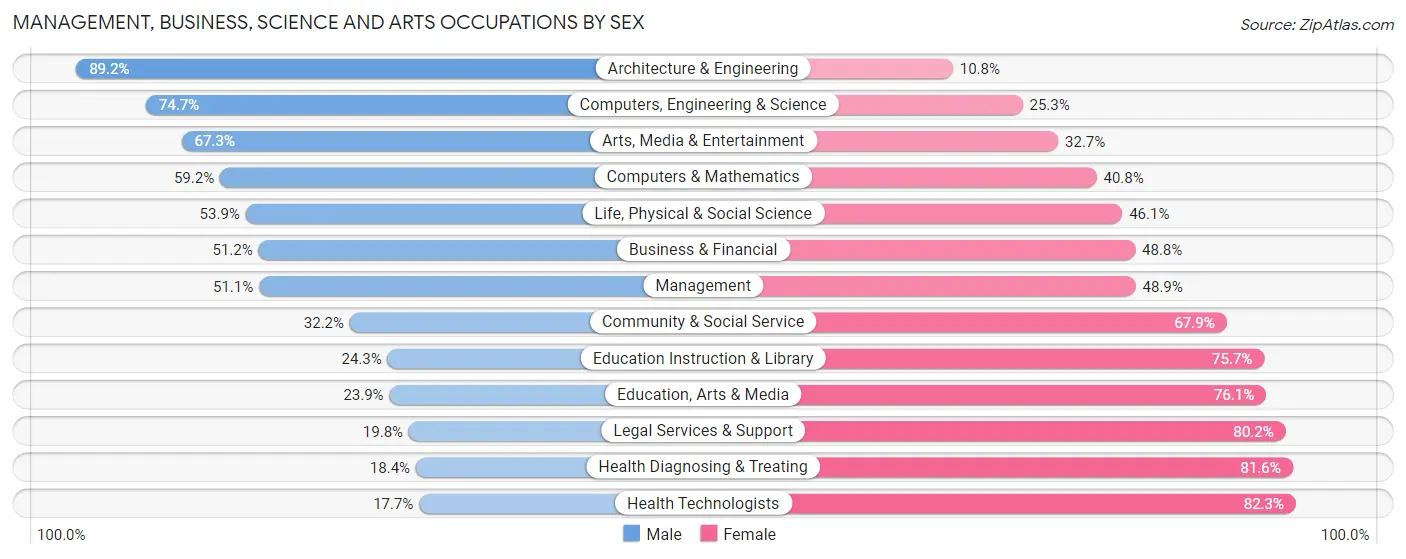
Management, Business, Science and Arts Occupations by Sex
Within the Management, Business, Science and Arts occupations in Warren, the most male-oriented occupations are Architecture & Engineering (89.2%), Computers, Engineering & Science (74.7%), and Arts, Media & Entertainment (67.3%), while the most female-oriented occupations are Health Technologists (82.3%), Health Diagnosing & Treating (81.6%), and Legal Services & Support (80.2%).
| Occupation | Male | Female |
| Management | 1,998 (51.1%) | 1,913 (48.9%) |
| Business & Financial | 1,560 (51.2%) | 1,487 (48.8%) |
| Computers, Engineering & Science | 2,771 (74.7%) | 939 (25.3%) |
| Computers & Mathematics | 949 (59.2%) | 653 (40.8%) |
| Architecture & Engineering | 1,732 (89.2%) | 209 (10.8%) |
| Life, Physical & Social Science | 90 (53.9%) | 77 (46.1%) |
| Community & Social Service | 1,702 (32.2%) | 3,592 (67.8%) |
| Education, Arts & Media | 252 (23.9%) | 803 (76.1%) |
| Legal Services & Support | 162 (19.8%) | 655 (80.2%) |
| Education Instruction & Library | 573 (24.3%) | 1,786 (75.7%) |
| Arts, Media & Entertainment | 715 (67.3%) | 348 (32.7%) |
| Health Diagnosing & Treating | 640 (18.4%) | 2,843 (81.6%) |
| Health Technologists | 294 (17.7%) | 1,368 (82.3%) |
| Total (Category) | 8,671 (44.6%) | 10,774 (55.4%) |
| Total (Overall) | 35,423 (53.3%) | 30,996 (46.7%) |
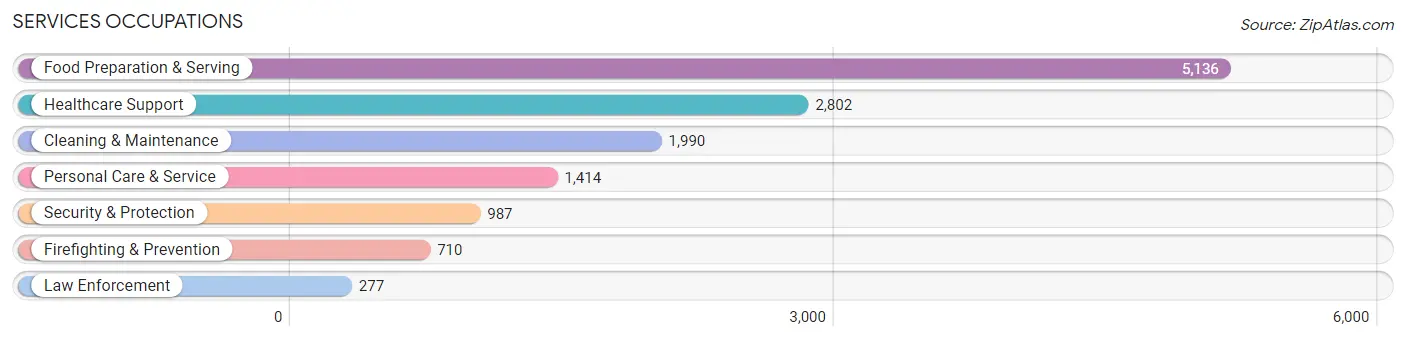
Services Occupations
The most common Services occupations in Warren are Food Preparation & Serving (5,136 | 7.7%), Healthcare Support (2,802 | 4.2%), Cleaning & Maintenance (1,990 | 3.0%), Personal Care & Service (1,414 | 2.1%), and Security & Protection (987 | 1.5%).
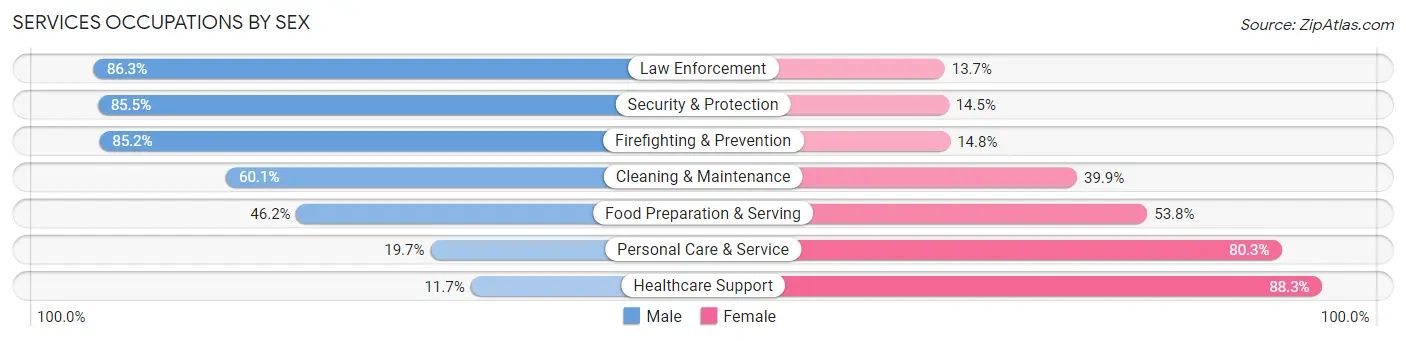
Services Occupations by Sex
Within the Services occupations in Warren, the most male-oriented occupations are Law Enforcement (86.3%), Security & Protection (85.5%), and Firefighting & Prevention (85.2%), while the most female-oriented occupations are Healthcare Support (88.3%), Personal Care & Service (80.3%), and Food Preparation & Serving (53.8%).
| Occupation | Male | Female |
| Healthcare Support | 328 (11.7%) | 2,474 (88.3%) |
| Security & Protection | 844 (85.5%) | 143 (14.5%) |
| Firefighting & Prevention | 605 (85.2%) | 105 (14.8%) |
| Law Enforcement | 239 (86.3%) | 38 (13.7%) |
| Food Preparation & Serving | 2,372 (46.2%) | 2,764 (53.8%) |
| Cleaning & Maintenance | 1,196 (60.1%) | 794 (39.9%) |
| Personal Care & Service | 278 (19.7%) | 1,136 (80.3%) |
| Total (Category) | 5,018 (40.7%) | 7,311 (59.3%) |
| Total (Overall) | 35,423 (53.3%) | 30,996 (46.7%) |
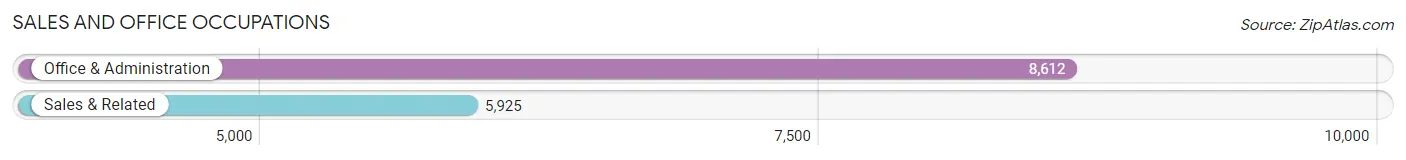
Sales and Office Occupations
The most common Sales and Office occupations in Warren are Office & Administration (8,612 | 13.0%), and Sales & Related (5,925 | 8.9%).
Sales and Office Occupations by Sex
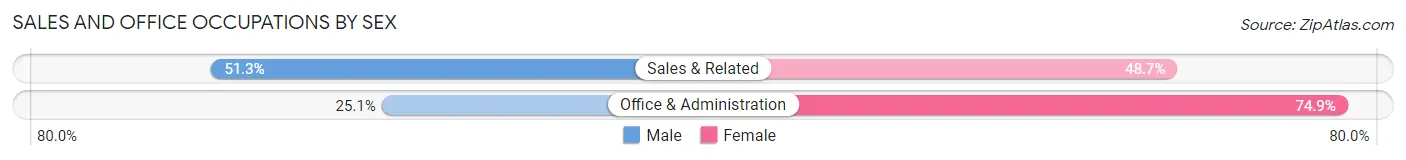
| Occupation | Male | Female |
| Sales & Related | 3,038 (51.3%) | 2,887 (48.7%) |
| Office & Administration | 2,159 (25.1%) | 6,453 (74.9%) |
| Total (Category) | 5,197 (35.7%) | 9,340 (64.2%) |
| Total (Overall) | 35,423 (53.3%) | 30,996 (46.7%) |
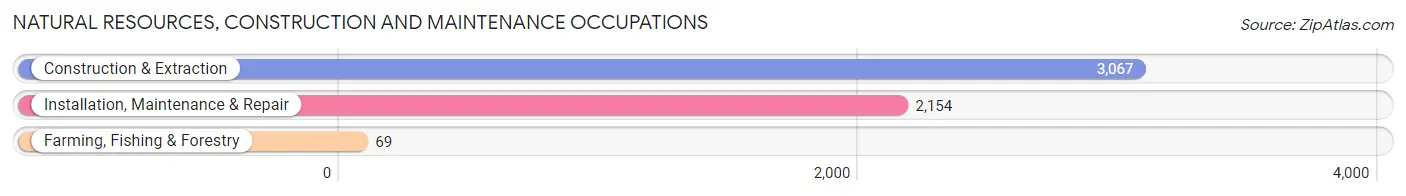
Natural Resources, Construction and Maintenance Occupations
The most common Natural Resources, Construction and Maintenance occupations in Warren are Construction & Extraction (3,067 | 4.6%), Installation, Maintenance & Repair (2,154 | 3.2%), and Farming, Fishing & Forestry (69 | 0.1%).
Natural Resources, Construction and Maintenance Occupations by Sex
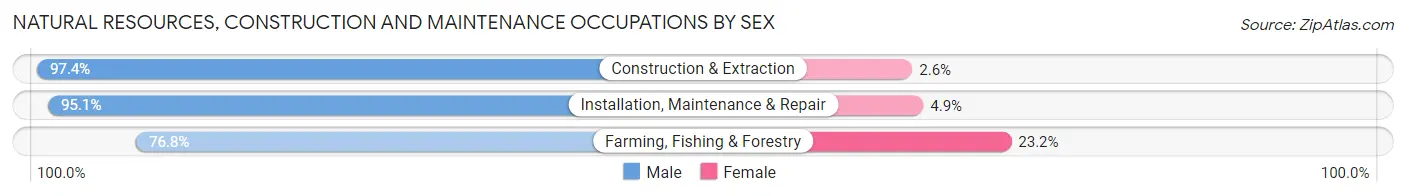
| Occupation | Male | Female |
| Farming, Fishing & Forestry | 53 (76.8%) | 16 (23.2%) |
| Construction & Extraction | 2,988 (97.4%) | 79 (2.6%) |
| Installation, Maintenance & Repair | 2,049 (95.1%) | 105 (4.9%) |
| Total (Category) | 5,090 (96.2%) | 200 (3.8%) |
| Total (Overall) | 35,423 (53.3%) | 30,996 (46.7%) |
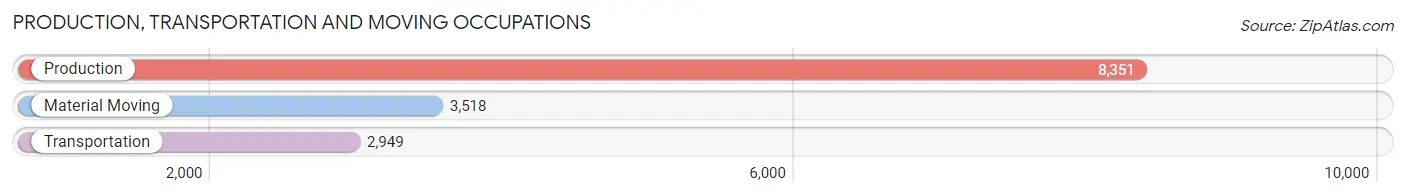
Production, Transportation and Moving Occupations
The most common Production, Transportation and Moving occupations in Warren are Production (8,351 | 12.6%), Material Moving (3,518 | 5.3%), and Transportation (2,949 | 4.4%).
Production, Transportation and Moving Occupations by Sex
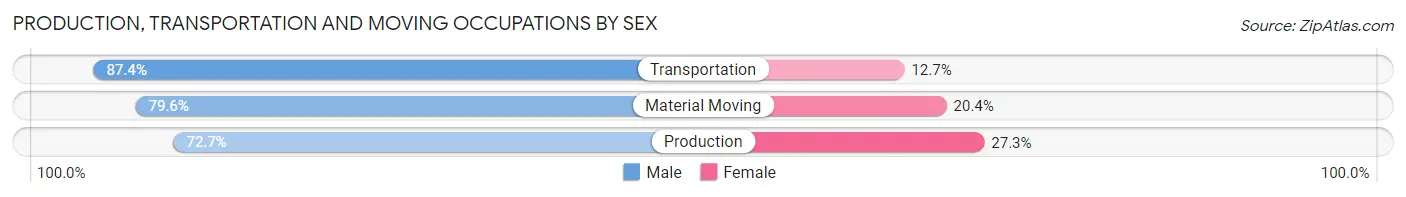
| Occupation | Male | Female |
| Production | 6,070 (72.7%) | 2,281 (27.3%) |
| Transportation | 2,576 (87.4%) | 373 (12.7%) |
| Material Moving | 2,801 (79.6%) | 717 (20.4%) |
| Total (Category) | 11,447 (77.2%) | 3,371 (22.8%) |
| Total (Overall) | 35,423 (53.3%) | 30,996 (46.7%) |
Employment Industries by Sex in Warren
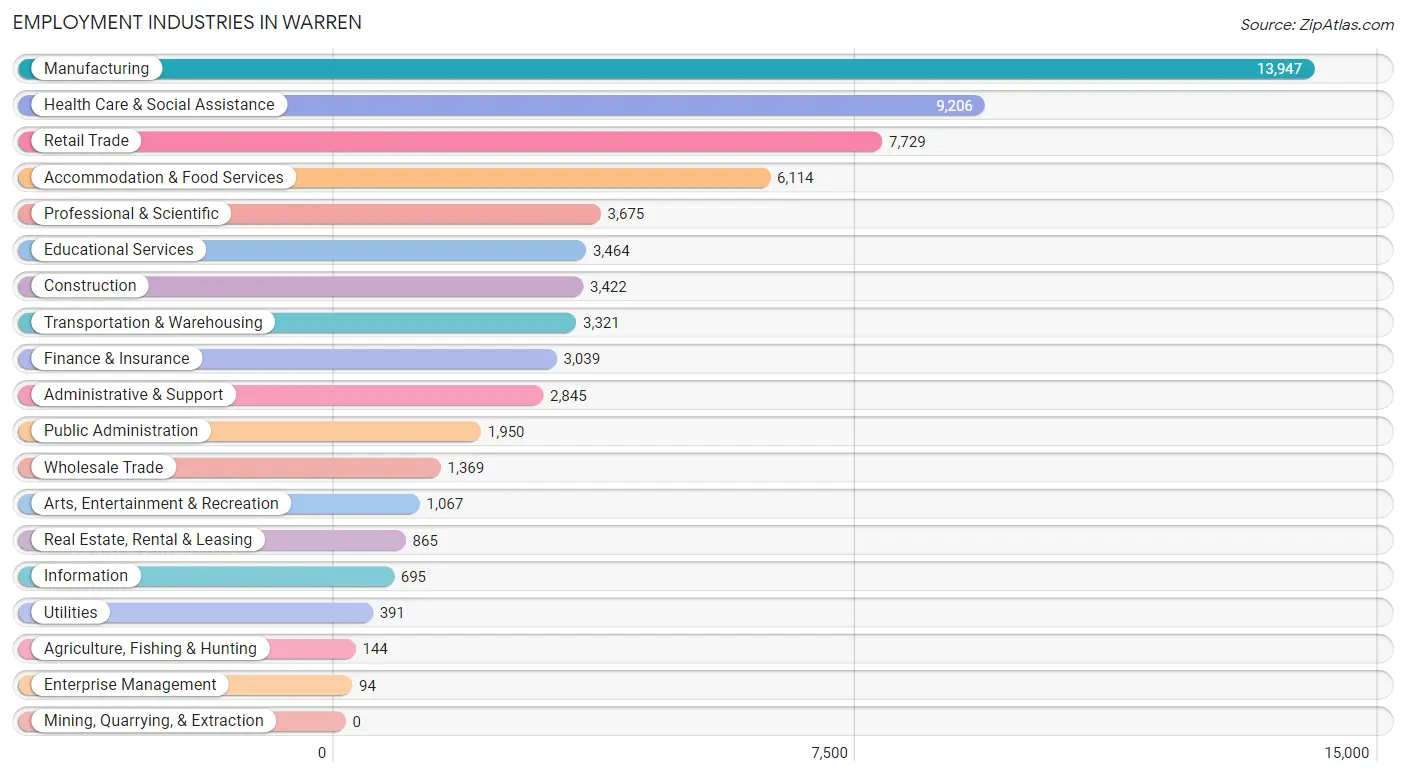
Employment Industries in Warren
The major employment industries in Warren include Manufacturing (13,947 | 21.0%), Health Care & Social Assistance (9,206 | 13.9%), Retail Trade (7,729 | 11.6%), Accommodation & Food Services (6,114 | 9.2%), and Professional & Scientific (3,675 | 5.5%).
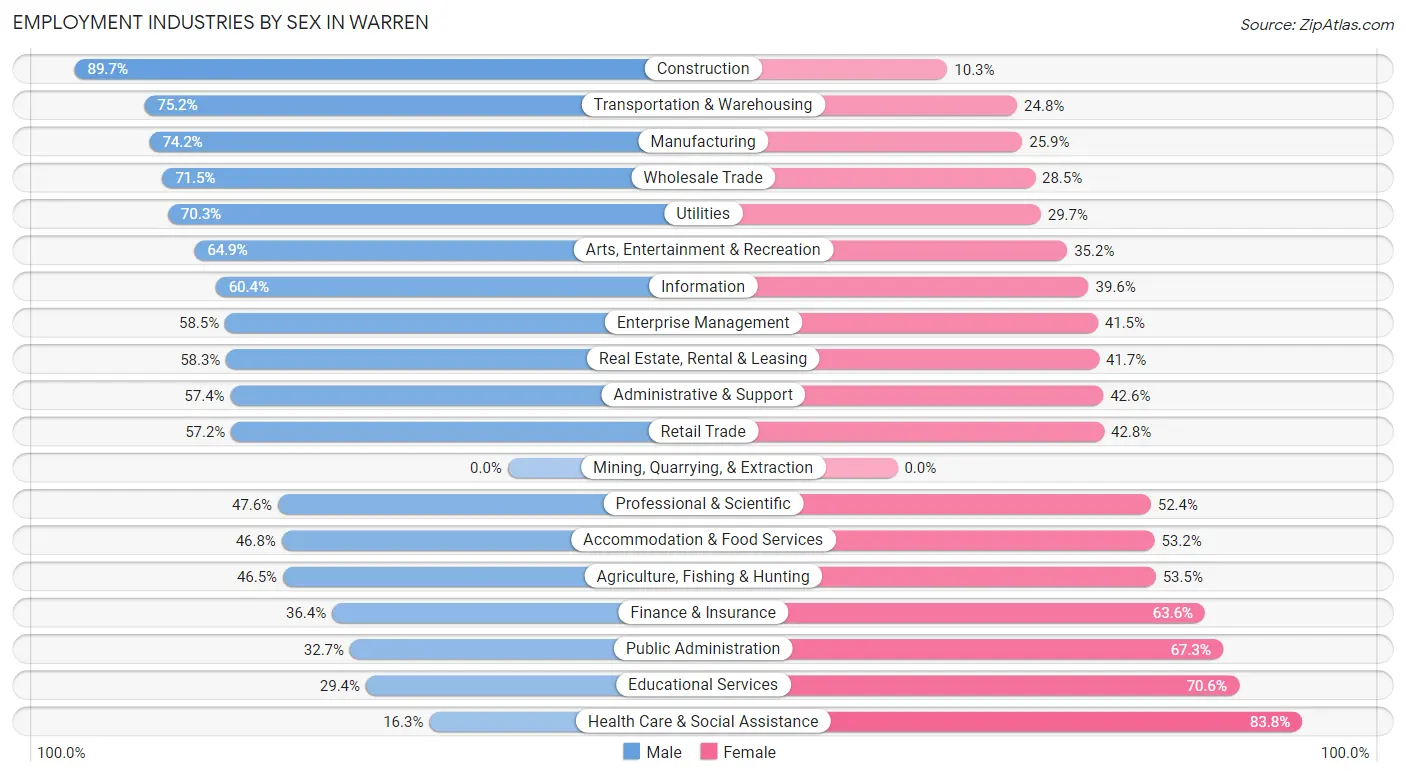
Employment Industries by Sex in Warren
The Warren industries that see more men than women are Construction (89.7%), Transportation & Warehousing (75.2%), and Manufacturing (74.2%), whereas the industries that tend to have a higher number of women are Health Care & Social Assistance (83.8%), Educational Services (70.6%), and Public Administration (67.3%).
| Industry | Male | Female |
| Agriculture, Fishing & Hunting | 67 (46.5%) | 77 (53.5%) |
| Mining, Quarrying, & Extraction | 0 (0.0%) | 0 (0.0%) |
| Construction | 3,068 (89.7%) | 354 (10.3%) |
| Manufacturing | 10,342 (74.2%) | 3,605 (25.9%) |
| Wholesale Trade | 979 (71.5%) | 390 (28.5%) |
| Retail Trade | 4,424 (57.2%) | 3,305 (42.8%) |
| Transportation & Warehousing | 2,498 (75.2%) | 823 (24.8%) |
| Utilities | 275 (70.3%) | 116 (29.7%) |
| Information | 420 (60.4%) | 275 (39.6%) |
| Finance & Insurance | 1,105 (36.4%) | 1,934 (63.6%) |
| Real Estate, Rental & Leasing | 504 (58.3%) | 361 (41.7%) |
| Professional & Scientific | 1,748 (47.6%) | 1,927 (52.4%) |
| Enterprise Management | 55 (58.5%) | 39 (41.5%) |
| Administrative & Support | 1,633 (57.4%) | 1,212 (42.6%) |
| Educational Services | 1,017 (29.4%) | 2,447 (70.6%) |
| Health Care & Social Assistance | 1,496 (16.3%) | 7,710 (83.8%) |
| Arts, Entertainment & Recreation | 692 (64.8%) | 375 (35.1%) |
| Accommodation & Food Services | 2,861 (46.8%) | 3,253 (53.2%) |
| Public Administration | 637 (32.7%) | 1,313 (67.3%) |
| Total | 35,423 (53.3%) | 30,996 (46.7%) |
Education in Warren
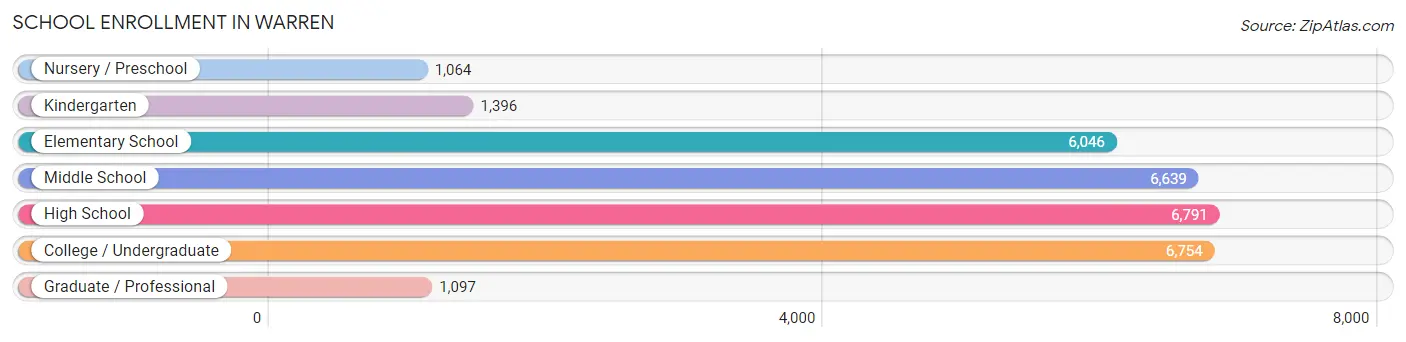
School Enrollment in Warren
The most common levels of schooling among the 29,787 students in Warren are high school (6,791 | 22.8%), college / undergraduate (6,754 | 22.7%), and middle school (6,639 | 22.3%).
| School Level | # Students | % Students |
| Nursery / Preschool | 1,064 | 3.6% |
| Kindergarten | 1,396 | 4.7% |
| Elementary School | 6,046 | 20.3% |
| Middle School | 6,639 | 22.3% |
| High School | 6,791 | 22.8% |
| College / Undergraduate | 6,754 | 22.7% |
| Graduate / Professional | 1,097 | 3.7% |
| Total | 29,787 | 100.0% |
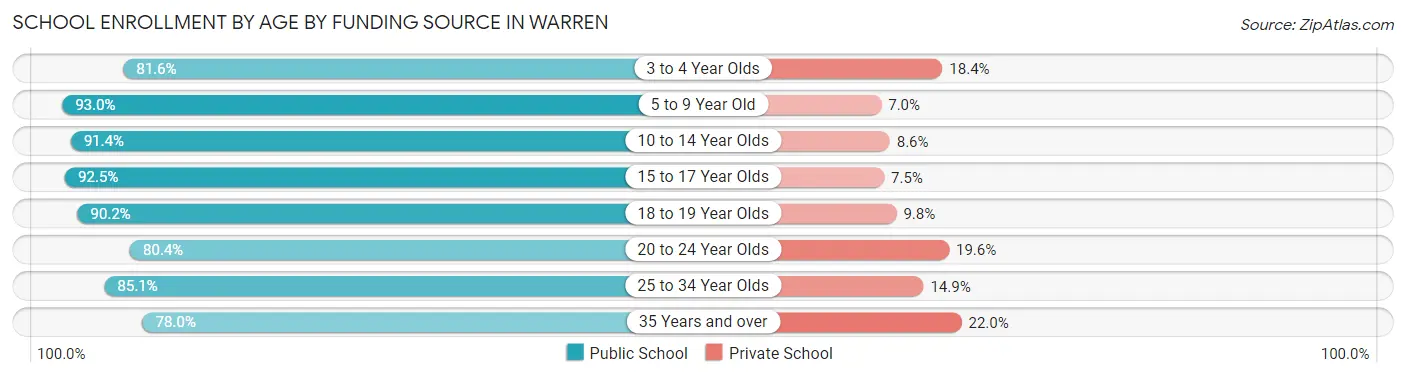
School Enrollment by Age by Funding Source in Warren
Out of a total of 29,787 students who are enrolled in schools in Warren, 3,157 (10.6%) attend a private institution, while the remaining 26,630 (89.4%) are enrolled in public schools. The age group of 35 years and over has the highest likelihood of being enrolled in private schools, with 329 (22.0% in the age bracket) enrolled. Conversely, the age group of 5 to 9 year old has the lowest likelihood of being enrolled in a private school, with 6,821 (93.0% in the age bracket) attending a public institution.
| Age Bracket | Public School | Private School |
| 3 to 4 Year Olds | 657 (81.6%) | 148 (18.4%) |
| 5 to 9 Year Old | 6,821 (93.0%) | 514 (7.0%) |
| 10 to 14 Year Olds | 7,234 (91.4%) | 680 (8.6%) |
| 15 to 17 Year Olds | 4,457 (92.5%) | 363 (7.5%) |
| 18 to 19 Year Olds | 1,814 (90.2%) | 198 (9.8%) |
| 20 to 24 Year Olds | 2,094 (80.4%) | 511 (19.6%) |
| 25 to 34 Year Olds | 2,382 (85.1%) | 416 (14.9%) |
| 35 Years and over | 1,169 (78.0%) | 329 (22.0%) |
| Total | 26,630 (89.4%) | 3,157 (10.6%) |
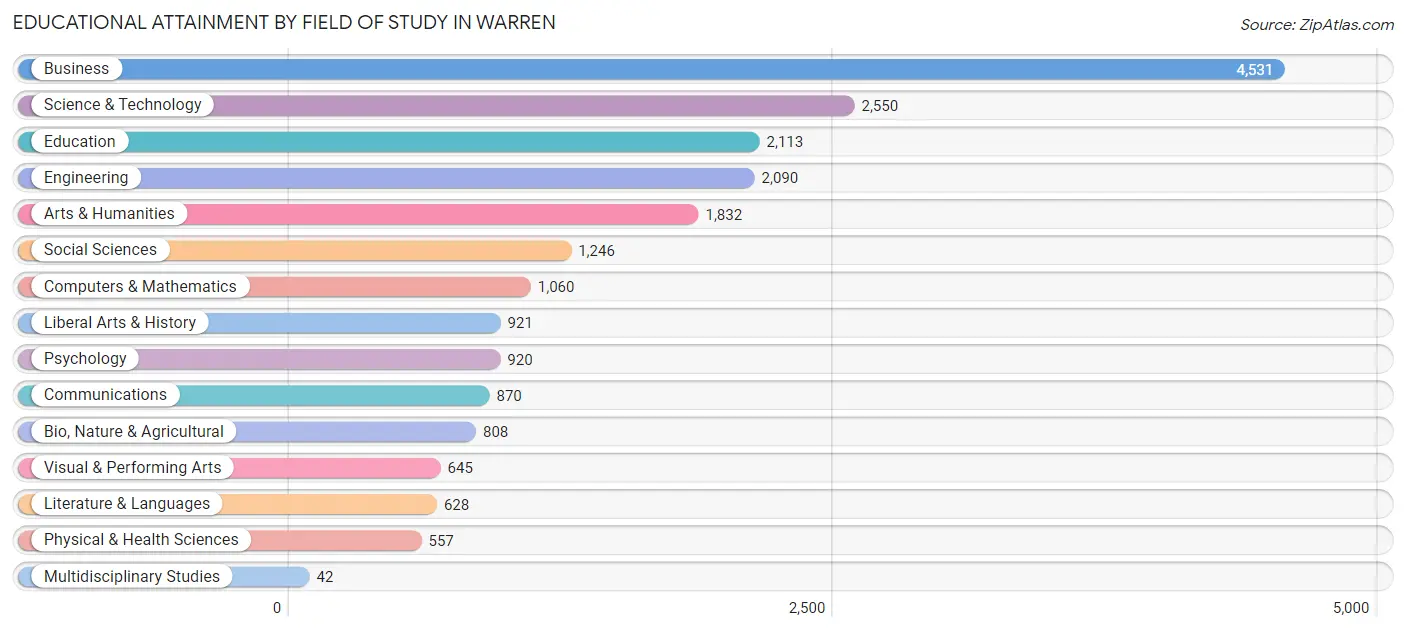
Educational Attainment by Field of Study in Warren
Business (4,531 | 21.8%), science & technology (2,550 | 12.2%), education (2,113 | 10.2%), engineering (2,090 | 10.0%), and arts & humanities (1,832 | 8.8%) are the most common fields of study among 20,813 individuals in Warren who have obtained a bachelor's degree or higher.
| Field of Study | # Graduates | % Graduates |
| Computers & Mathematics | 1,060 | 5.1% |
| Bio, Nature & Agricultural | 808 | 3.9% |
| Physical & Health Sciences | 557 | 2.7% |
| Psychology | 920 | 4.4% |
| Social Sciences | 1,246 | 6.0% |
| Engineering | 2,090 | 10.0% |
| Multidisciplinary Studies | 42 | 0.2% |
| Science & Technology | 2,550 | 12.2% |
| Business | 4,531 | 21.8% |
| Education | 2,113 | 10.2% |
| Literature & Languages | 628 | 3.0% |
| Liberal Arts & History | 921 | 4.4% |
| Visual & Performing Arts | 645 | 3.1% |
| Communications | 870 | 4.2% |
| Arts & Humanities | 1,832 | 8.8% |
| Total | 20,813 | 100.0% |
Transportation & Commute in Warren
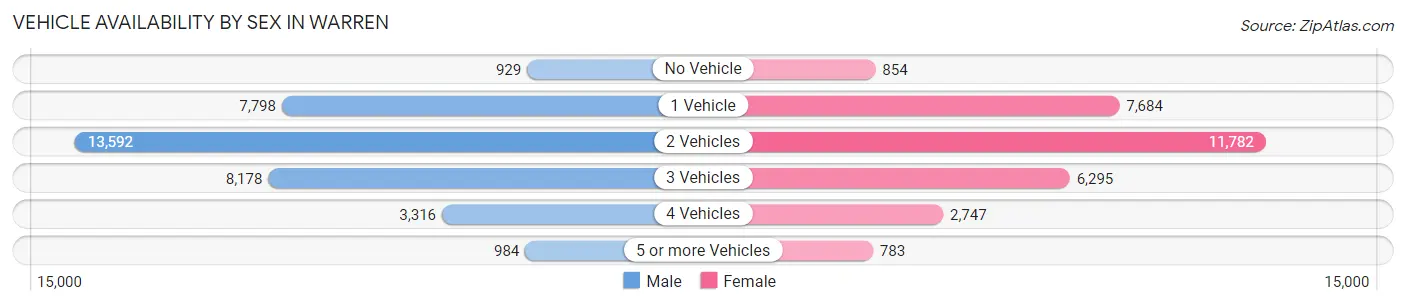
Vehicle Availability by Sex in Warren
The most prevalent vehicle ownership categories in Warren are males with 2 vehicles (13,592, accounting for 39.1%) and females with 2 vehicles (11,782, making up 45.1%).
| Vehicles Available | Male | Female |
| No Vehicle | 929 (2.7%) | 854 (2.8%) |
| 1 Vehicle | 7,798 (22.4%) | 7,684 (25.5%) |
| 2 Vehicles | 13,592 (39.1%) | 11,782 (39.1%) |
| 3 Vehicles | 8,178 (23.5%) | 6,295 (20.9%) |
| 4 Vehicles | 3,316 (9.5%) | 2,747 (9.1%) |
| 5 or more Vehicles | 984 (2.8%) | 783 (2.6%) |
| Total | 34,797 (100.0%) | 30,145 (100.0%) |
Commute Time in Warren
The most frequently occuring commute durations in Warren are 20 to 24 minutes (11,386 commuters, 19.1%), 30 to 34 minutes (9,937 commuters, 16.7%), and 15 to 19 minutes (9,364 commuters, 15.7%).
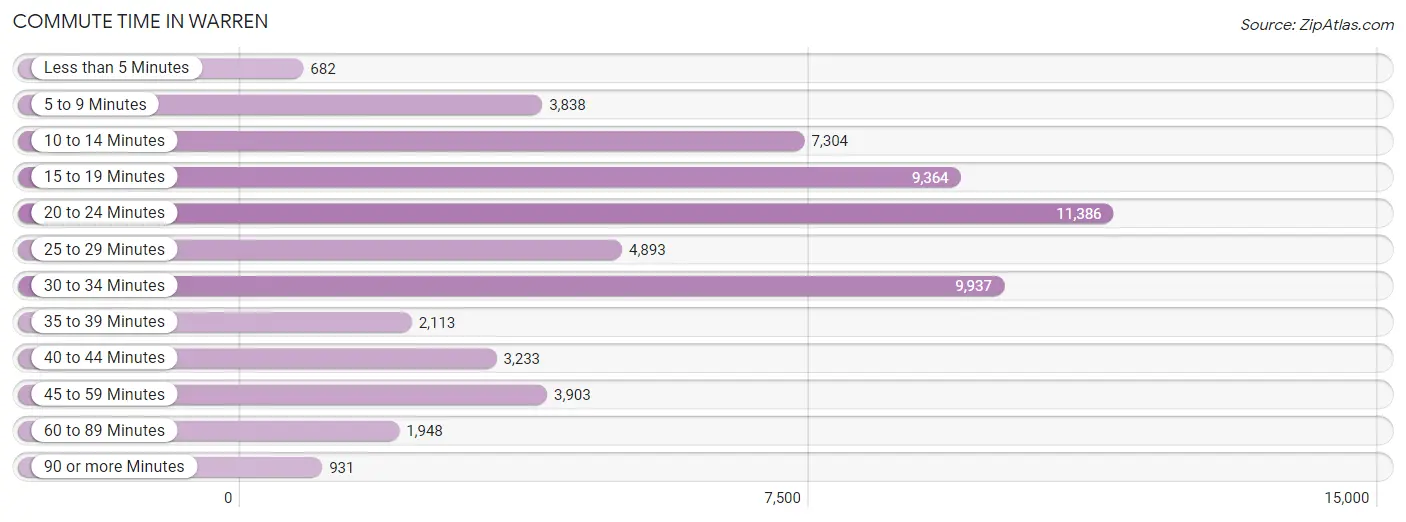
| Commute Time | # Commuters | % Commuters |
| Less than 5 Minutes | 682 | 1.1% |
| 5 to 9 Minutes | 3,838 | 6.5% |
| 10 to 14 Minutes | 7,304 | 12.3% |
| 15 to 19 Minutes | 9,364 | 15.7% |
| 20 to 24 Minutes | 11,386 | 19.1% |
| 25 to 29 Minutes | 4,893 | 8.2% |
| 30 to 34 Minutes | 9,937 | 16.7% |
| 35 to 39 Minutes | 2,113 | 3.5% |
| 40 to 44 Minutes | 3,233 | 5.4% |
| 45 to 59 Minutes | 3,903 | 6.6% |
| 60 to 89 Minutes | 1,948 | 3.3% |
| 90 or more Minutes | 931 | 1.6% |
Commute Time by Sex in Warren
The most common commute times in Warren are 20 to 24 minutes (6,189 commuters, 19.1%) for males and 20 to 24 minutes (5,197 commuters, 19.1%) for females.
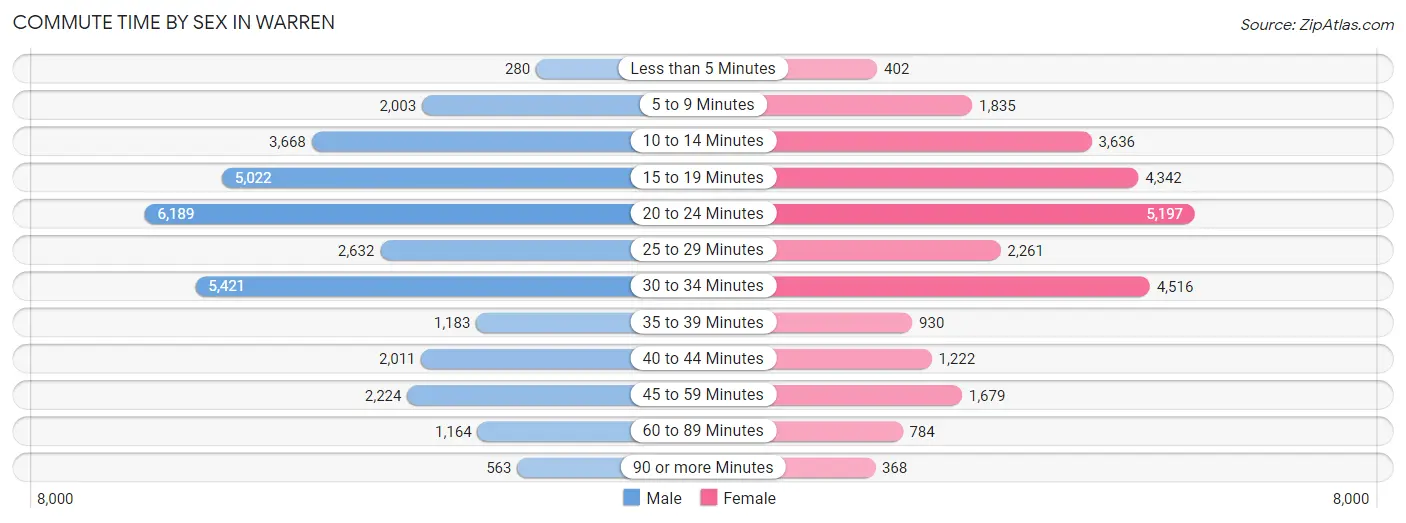
| Commute Time | Male | Female |
| Less than 5 Minutes | 280 (0.9%) | 402 (1.5%) |
| 5 to 9 Minutes | 2,003 (6.2%) | 1,835 (6.8%) |
| 10 to 14 Minutes | 3,668 (11.3%) | 3,636 (13.4%) |
| 15 to 19 Minutes | 5,022 (15.5%) | 4,342 (16.0%) |
| 20 to 24 Minutes | 6,189 (19.1%) | 5,197 (19.1%) |
| 25 to 29 Minutes | 2,632 (8.1%) | 2,261 (8.3%) |
| 30 to 34 Minutes | 5,421 (16.8%) | 4,516 (16.6%) |
| 35 to 39 Minutes | 1,183 (3.7%) | 930 (3.4%) |
| 40 to 44 Minutes | 2,011 (6.2%) | 1,222 (4.5%) |
| 45 to 59 Minutes | 2,224 (6.9%) | 1,679 (6.2%) |
| 60 to 89 Minutes | 1,164 (3.6%) | 784 (2.9%) |
| 90 or more Minutes | 563 (1.7%) | 368 (1.3%) |
Time of Departure to Work by Sex in Warren
The most frequent times of departure to work in Warren are 12:00 PM to 3:59 PM (3,221, 10.0%) for males and 7:00 AM to 7:29 AM (4,239, 15.6%) for females.
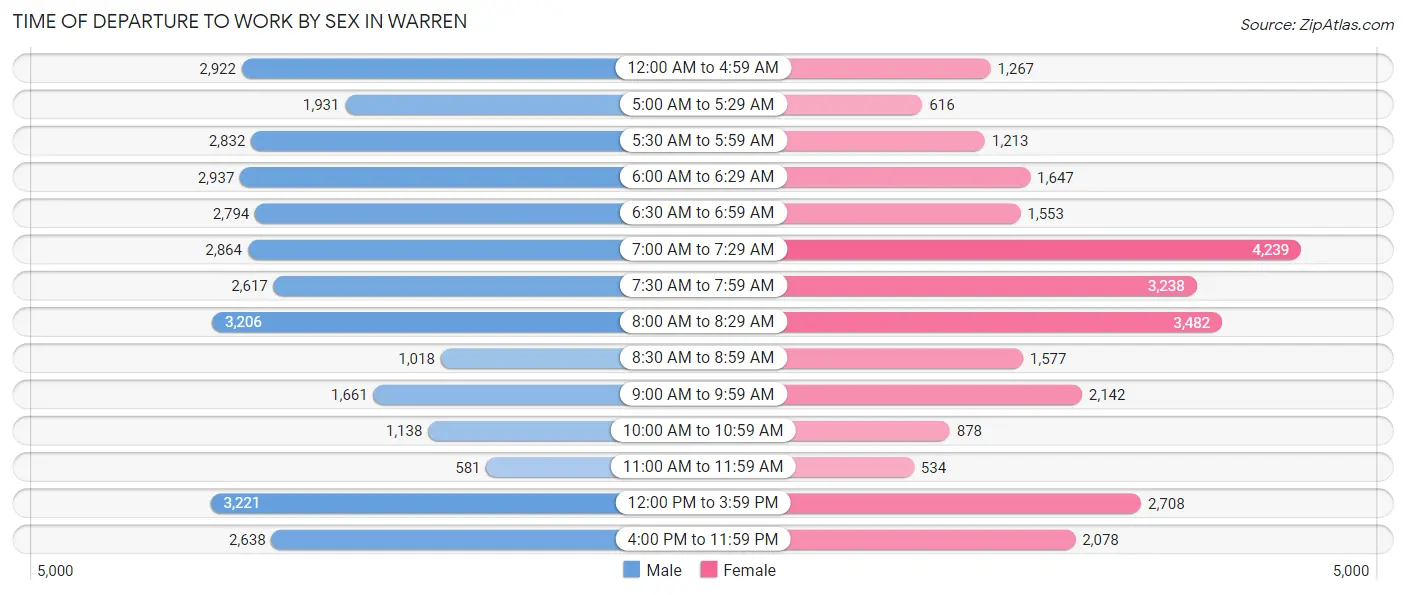
| Time of Departure | Male | Female |
| 12:00 AM to 4:59 AM | 2,922 (9.0%) | 1,267 (4.7%) |
| 5:00 AM to 5:29 AM | 1,931 (6.0%) | 616 (2.3%) |
| 5:30 AM to 5:59 AM | 2,832 (8.7%) | 1,213 (4.5%) |
| 6:00 AM to 6:29 AM | 2,937 (9.1%) | 1,647 (6.1%) |
| 6:30 AM to 6:59 AM | 2,794 (8.6%) | 1,553 (5.7%) |
| 7:00 AM to 7:29 AM | 2,864 (8.8%) | 4,239 (15.6%) |
| 7:30 AM to 7:59 AM | 2,617 (8.1%) | 3,238 (11.9%) |
| 8:00 AM to 8:29 AM | 3,206 (9.9%) | 3,482 (12.8%) |
| 8:30 AM to 8:59 AM | 1,018 (3.2%) | 1,577 (5.8%) |
| 9:00 AM to 9:59 AM | 1,661 (5.1%) | 2,142 (7.9%) |
| 10:00 AM to 10:59 AM | 1,138 (3.5%) | 878 (3.2%) |
| 11:00 AM to 11:59 AM | 581 (1.8%) | 534 (2.0%) |
| 12:00 PM to 3:59 PM | 3,221 (10.0%) | 2,708 (10.0%) |
| 4:00 PM to 11:59 PM | 2,638 (8.2%) | 2,078 (7.6%) |
| Total | 32,360 (100.0%) | 27,172 (100.0%) |
Housing Occupancy in Warren
Occupancy by Ownership in Warren
Of the total 54,483 dwellings in Warren, owner-occupied units account for 38,734 (71.1%), while renter-occupied units make up 15,749 (28.9%).
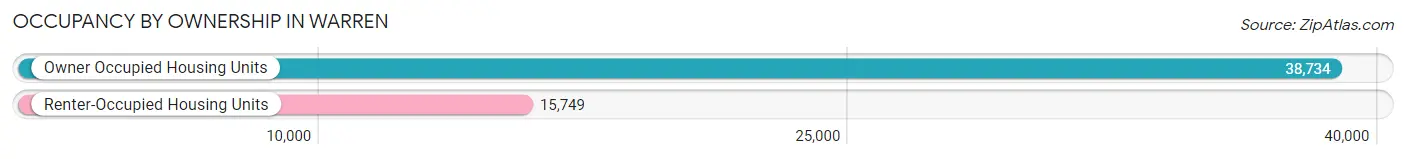
| Occupancy | # Housing Units | % Housing Units |
| Owner Occupied Housing Units | 38,734 | 71.1% |
| Renter-Occupied Housing Units | 15,749 | 28.9% |
| Total Occupied Housing Units | 54,483 | 100.0% |
Occupancy by Household Size in Warren
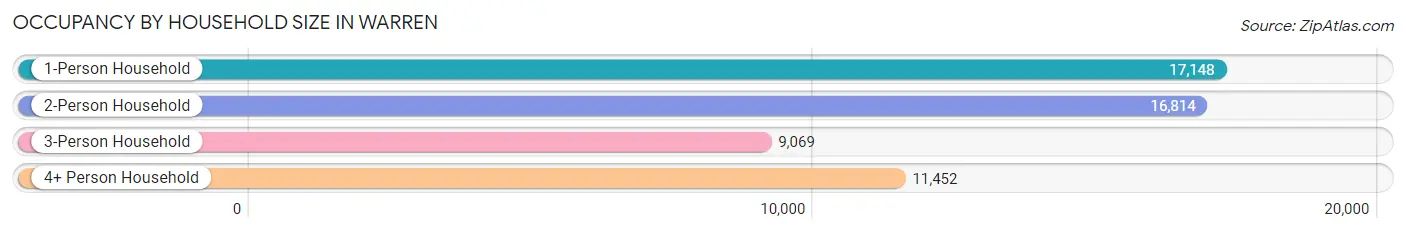
| Household Size | # Housing Units | % Housing Units |
| 1-Person Household | 17,148 | 31.5% |
| 2-Person Household | 16,814 | 30.9% |
| 3-Person Household | 9,069 | 16.7% |
| 4+ Person Household | 11,452 | 21.0% |
| Total Housing Units | 54,483 | 100.0% |
Occupancy by Ownership by Household Size in Warren
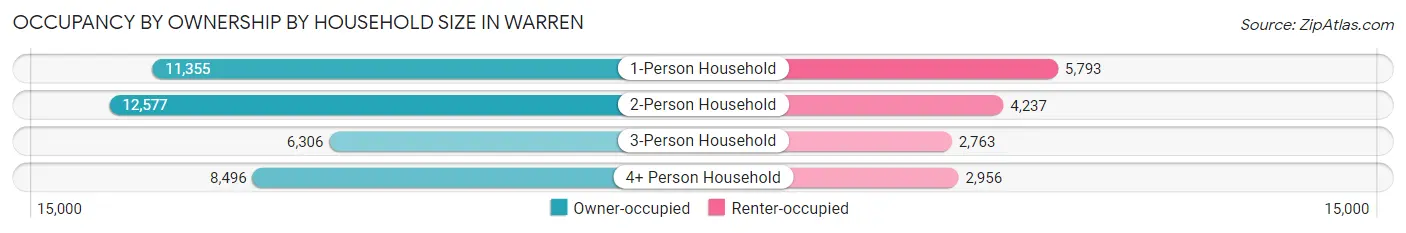
| Household Size | Owner-occupied | Renter-occupied |
| 1-Person Household | 11,355 (66.2%) | 5,793 (33.8%) |
| 2-Person Household | 12,577 (74.8%) | 4,237 (25.2%) |
| 3-Person Household | 6,306 (69.5%) | 2,763 (30.5%) |
| 4+ Person Household | 8,496 (74.2%) | 2,956 (25.8%) |
| Total Housing Units | 38,734 (71.1%) | 15,749 (28.9%) |
Occupancy by Educational Attainment in Warren
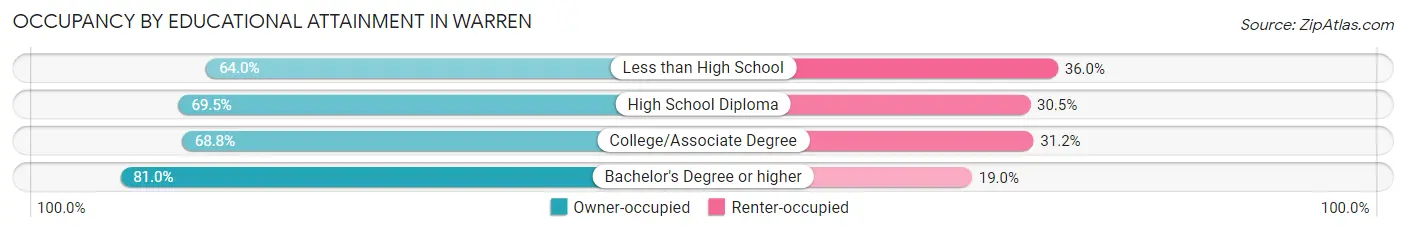
| Household Size | Owner-occupied | Renter-occupied |
| Less than High School | 3,816 (64.0%) | 2,147 (36.0%) |
| High School Diploma | 11,654 (69.5%) | 5,116 (30.5%) |
| College/Associate Degree | 13,902 (68.8%) | 6,296 (31.2%) |
| Bachelor's Degree or higher | 9,362 (81.0%) | 2,190 (19.0%) |
Occupancy by Age of Householder in Warren
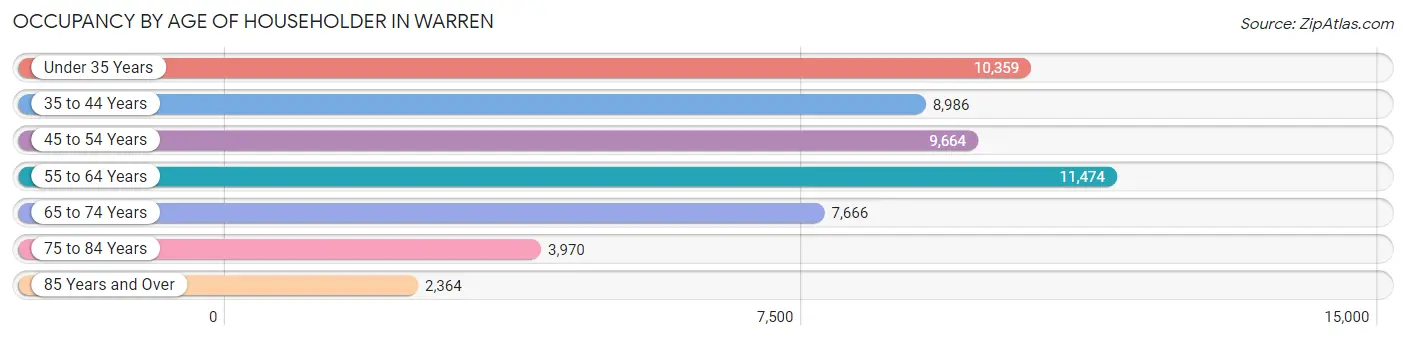
| Age Bracket | # Households | % Households |
| Under 35 Years | 10,359 | 19.0% |
| 35 to 44 Years | 8,986 | 16.5% |
| 45 to 54 Years | 9,664 | 17.7% |
| 55 to 64 Years | 11,474 | 21.1% |
| 65 to 74 Years | 7,666 | 14.1% |
| 75 to 84 Years | 3,970 | 7.3% |
| 85 Years and Over | 2,364 | 4.3% |
| Total | 54,483 | 100.0% |
Housing Finances in Warren
Median Income by Occupancy in Warren
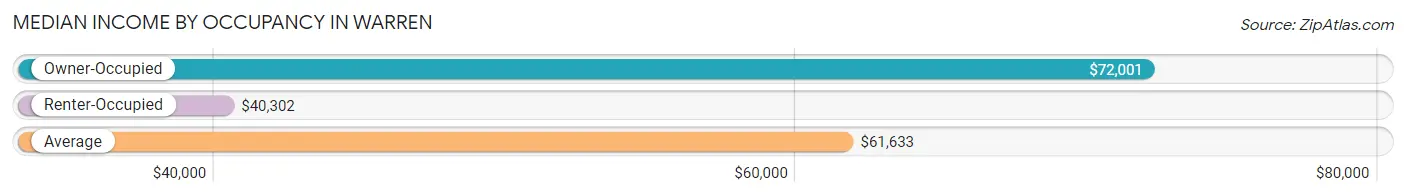
| Occupancy Type | # Households | Median Income |
| Owner-Occupied | 38,734 (71.1%) | $72,001 |
| Renter-Occupied | 15,749 (28.9%) | $40,302 |
| Average | 54,483 (100.0%) | $61,633 |
Occupancy by Householder Income Bracket in Warren
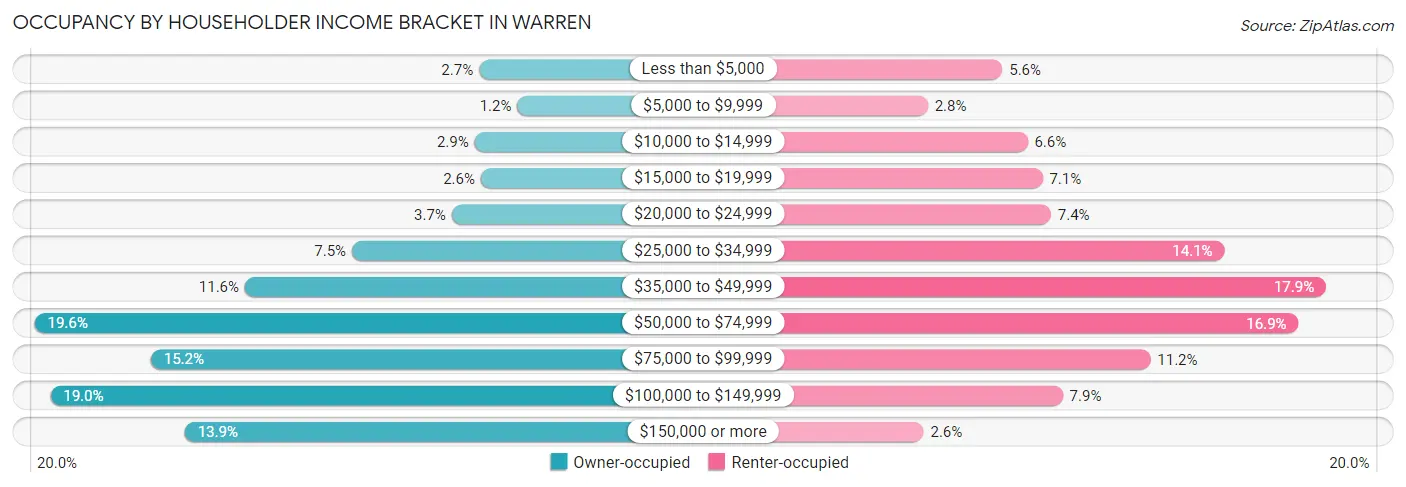
| Income Bracket | Owner-occupied | Renter-occupied |
| Less than $5,000 | 1,043 (2.7%) | 880 (5.6%) |
| $5,000 to $9,999 | 475 (1.2%) | 433 (2.8%) |
| $10,000 to $14,999 | 1,109 (2.9%) | 1,031 (6.6%) |
| $15,000 to $19,999 | 1,015 (2.6%) | 1,122 (7.1%) |
| $20,000 to $24,999 | 1,445 (3.7%) | 1,172 (7.4%) |
| $25,000 to $34,999 | 2,917 (7.5%) | 2,213 (14.1%) |
| $35,000 to $49,999 | 4,496 (11.6%) | 2,822 (17.9%) |
| $50,000 to $74,999 | 7,600 (19.6%) | 2,657 (16.9%) |
| $75,000 to $99,999 | 5,883 (15.2%) | 1,769 (11.2%) |
| $100,000 to $149,999 | 7,368 (19.0%) | 1,242 (7.9%) |
| $150,000 or more | 5,383 (13.9%) | 408 (2.6%) |
| Total | 38,734 (100.0%) | 15,749 (100.0%) |
Monthly Housing Cost Tiers in Warren
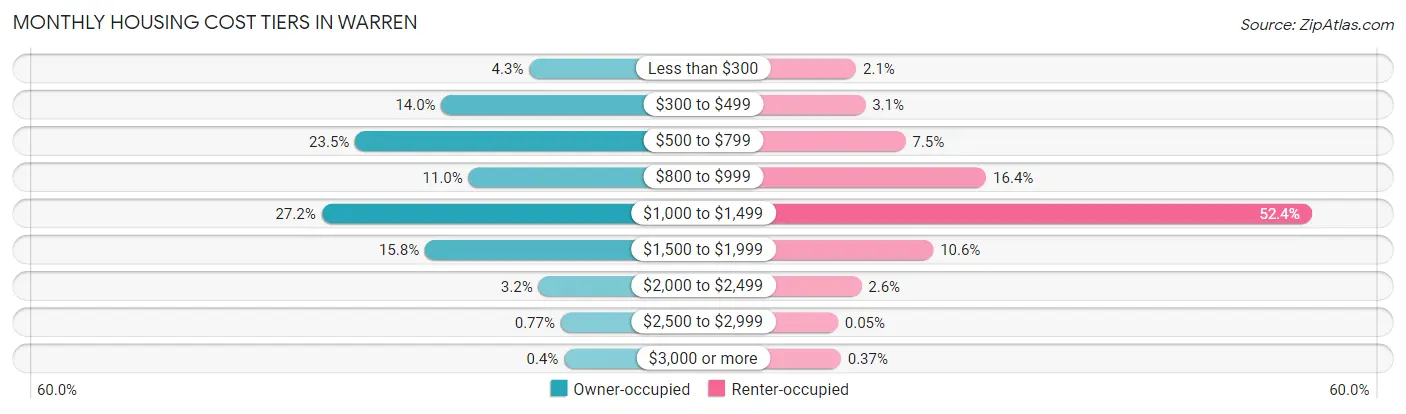
| Monthly Cost | Owner-occupied | Renter-occupied |
| Less than $300 | 1,646 (4.3%) | 324 (2.1%) |
| $300 to $499 | 5,403 (14.0%) | 483 (3.1%) |
| $500 to $799 | 9,095 (23.5%) | 1,182 (7.5%) |
| $800 to $999 | 4,241 (11.0%) | 2,587 (16.4%) |
| $1,000 to $1,499 | 10,536 (27.2%) | 8,247 (52.4%) |
| $1,500 to $1,999 | 6,108 (15.8%) | 1,666 (10.6%) |
| $2,000 to $2,499 | 1,252 (3.2%) | 415 (2.6%) |
| $2,500 to $2,999 | 297 (0.8%) | 8 (0.1%) |
| $3,000 or more | 156 (0.4%) | 58 (0.4%) |
| Total | 38,734 (100.0%) | 15,749 (100.0%) |
Physical Housing Characteristics in Warren
Housing Structures in Warren
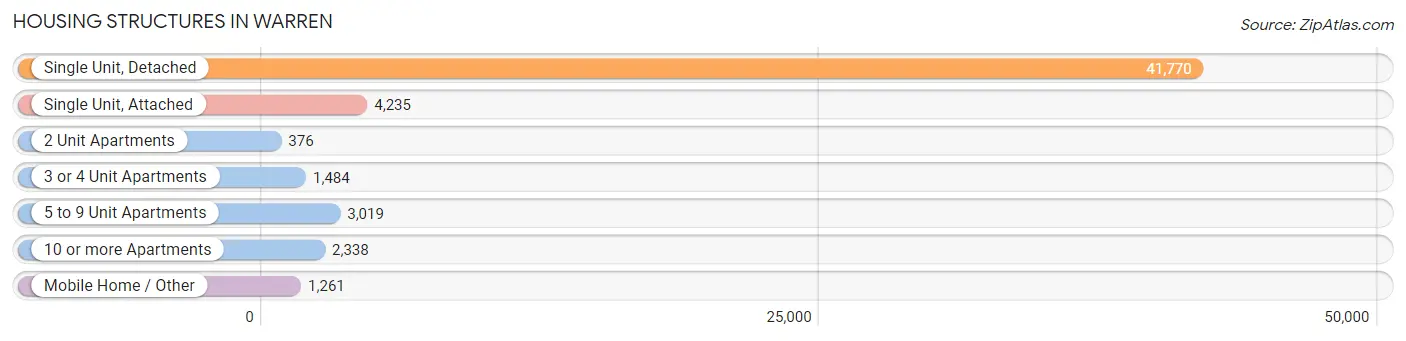
| Structure Type | # Housing Units | % Housing Units |
| Single Unit, Detached | 41,770 | 76.7% |
| Single Unit, Attached | 4,235 | 7.8% |
| 2 Unit Apartments | 376 | 0.7% |
| 3 or 4 Unit Apartments | 1,484 | 2.7% |
| 5 to 9 Unit Apartments | 3,019 | 5.5% |
| 10 or more Apartments | 2,338 | 4.3% |
| Mobile Home / Other | 1,261 | 2.3% |
| Total | 54,483 | 100.0% |
Housing Structures by Occupancy in Warren
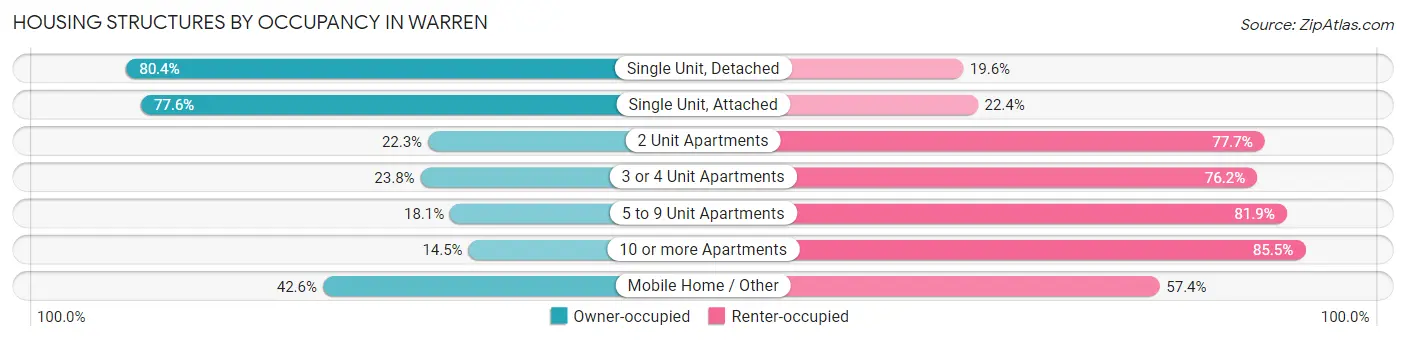
| Structure Type | Owner-occupied | Renter-occupied |
| Single Unit, Detached | 33,588 (80.4%) | 8,182 (19.6%) |
| Single Unit, Attached | 3,286 (77.6%) | 949 (22.4%) |
| 2 Unit Apartments | 84 (22.3%) | 292 (77.7%) |
| 3 or 4 Unit Apartments | 353 (23.8%) | 1,131 (76.2%) |
| 5 to 9 Unit Apartments | 546 (18.1%) | 2,473 (81.9%) |
| 10 or more Apartments | 340 (14.5%) | 1,998 (85.5%) |
| Mobile Home / Other | 537 (42.6%) | 724 (57.4%) |
| Total | 38,734 (71.1%) | 15,749 (28.9%) |
Housing Structures by Number of Rooms in Warren
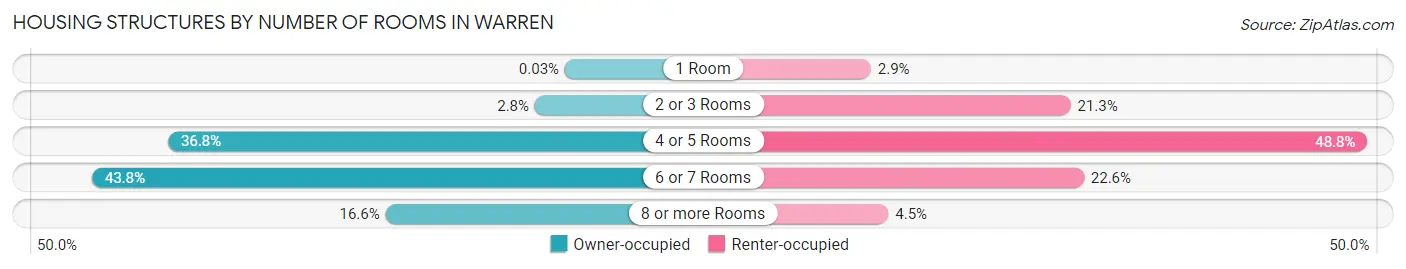
| Number of Rooms | Owner-occupied | Renter-occupied |
| 1 Room | 11 (0.0%) | 450 (2.9%) |
| 2 or 3 Rooms | 1,090 (2.8%) | 3,360 (21.3%) |
| 4 or 5 Rooms | 14,236 (36.7%) | 7,681 (48.8%) |
| 6 or 7 Rooms | 16,958 (43.8%) | 3,553 (22.6%) |
| 8 or more Rooms | 6,439 (16.6%) | 705 (4.5%) |
| Total | 38,734 (100.0%) | 15,749 (100.0%) |
Housing Structure by Heating Type in Warren
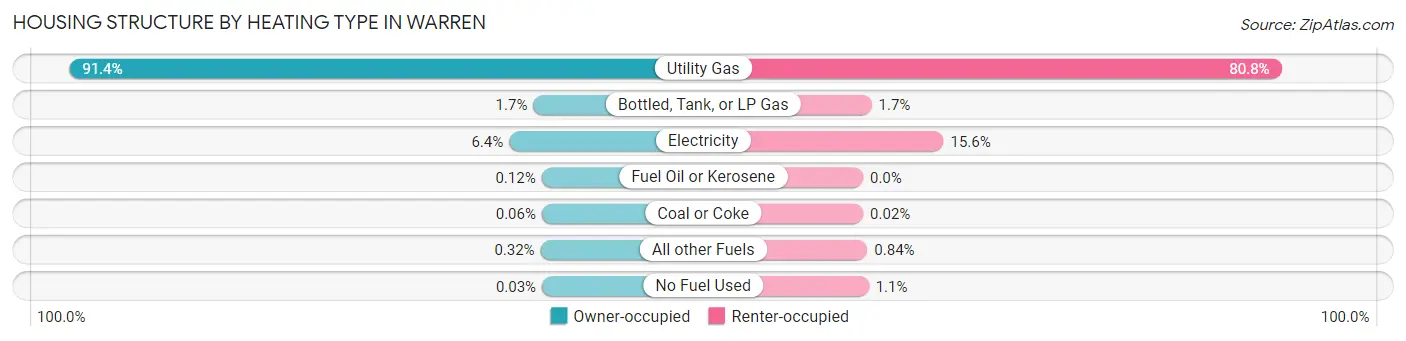
| Heating Type | Owner-occupied | Renter-occupied |
| Utility Gas | 35,383 (91.3%) | 12,731 (80.8%) |
| Bottled, Tank, or LP Gas | 663 (1.7%) | 260 (1.7%) |
| Electricity | 2,477 (6.4%) | 2,451 (15.6%) |
| Fuel Oil or Kerosene | 48 (0.1%) | 0 (0.0%) |
| Coal or Coke | 25 (0.1%) | 3 (0.0%) |
| All other Fuels | 125 (0.3%) | 133 (0.8%) |
| No Fuel Used | 13 (0.0%) | 171 (1.1%) |
| Total | 38,734 (100.0%) | 15,749 (100.0%) |
Household Vehicle Usage in Warren
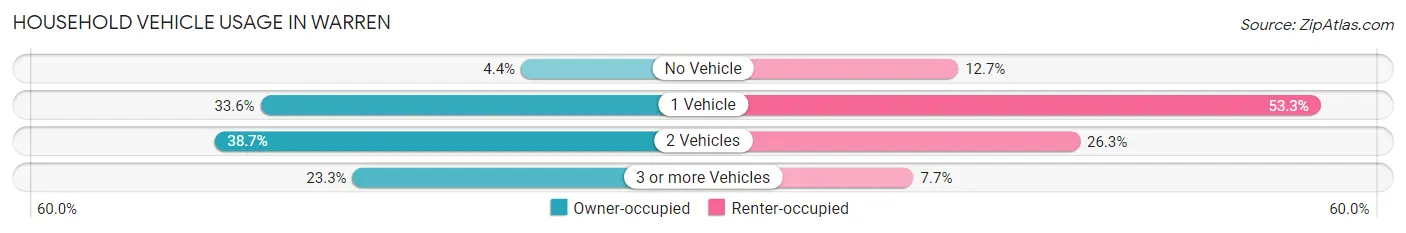
| Vehicles per Household | Owner-occupied | Renter-occupied |
| No Vehicle | 1,704 (4.4%) | 1,998 (12.7%) |
| 1 Vehicle | 13,005 (33.6%) | 8,391 (53.3%) |
| 2 Vehicles | 15,007 (38.7%) | 4,148 (26.3%) |
| 3 or more Vehicles | 9,018 (23.3%) | 1,212 (7.7%) |
| Total | 38,734 (100.0%) | 15,749 (100.0%) |
Real Estate & Mortgages in Warren
Real Estate and Mortgage Overview in Warren
| Characteristic | Without Mortgage | With Mortgage |
| Housing Units | 16,116 | 22,618 |
| Median Property Value | $154,600 | $178,500 |
| Median Household Income | $56,341 | $3,907 |
| Monthly Housing Costs | $533 | $131 |
| Real Estate Taxes | $2,579 | $631 |
Property Value by Mortgage Status in Warren
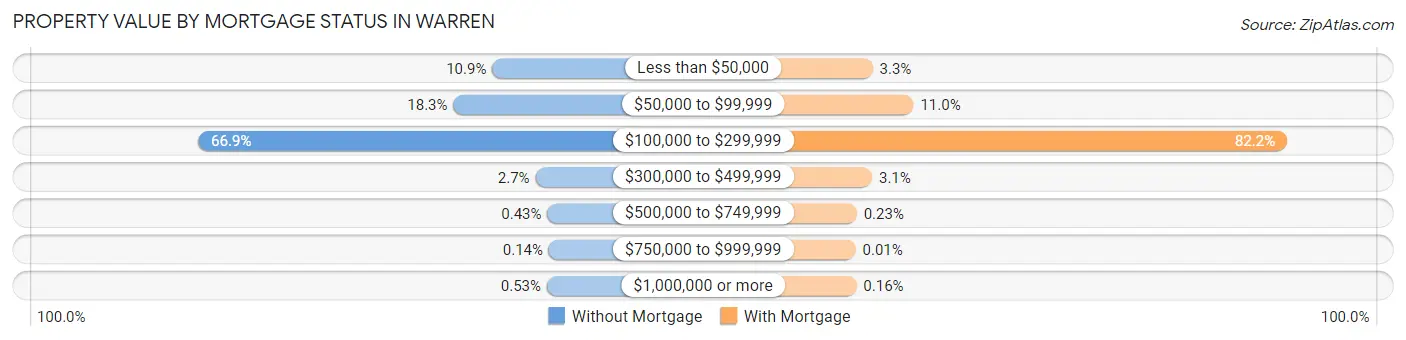
| Property Value | Without Mortgage | With Mortgage |
| Less than $50,000 | 1,761 (10.9%) | 734 (3.3%) |
| $50,000 to $99,999 | 2,954 (18.3%) | 2,496 (11.0%) |
| $100,000 to $299,999 | 10,788 (66.9%) | 18,587 (82.2%) |
| $300,000 to $499,999 | 435 (2.7%) | 710 (3.1%) |
| $500,000 to $749,999 | 69 (0.4%) | 53 (0.2%) |
| $750,000 to $999,999 | 23 (0.1%) | 2 (0.0%) |
| $1,000,000 or more | 86 (0.5%) | 36 (0.2%) |
| Total | 16,116 (100.0%) | 22,618 (100.0%) |
Household Income by Mortgage Status in Warren
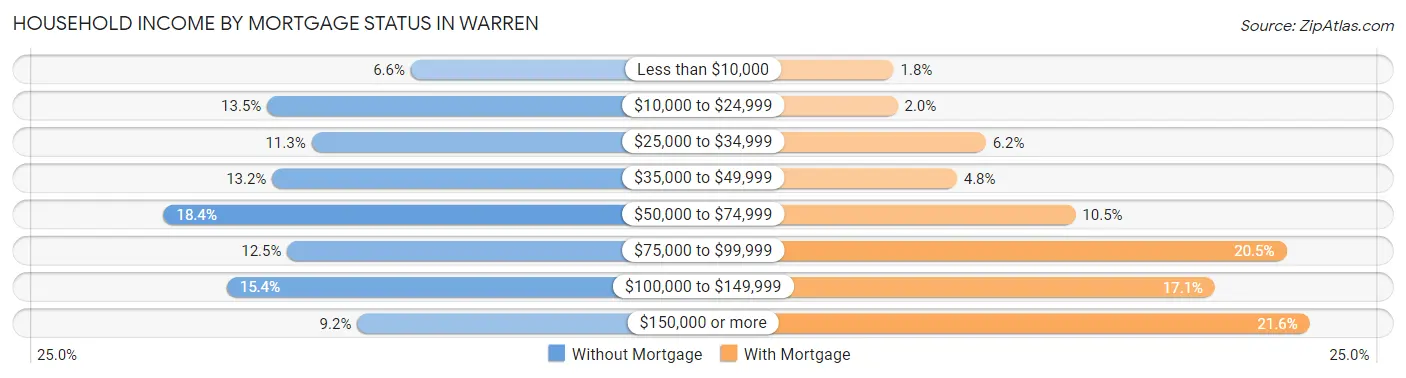
| Household Income | Without Mortgage | With Mortgage |
| Less than $10,000 | 1,065 (6.6%) | 409 (1.8%) |
| $10,000 to $24,999 | 2,167 (13.5%) | 453 (2.0%) |
| $25,000 to $34,999 | 1,827 (11.3%) | 1,402 (6.2%) |
| $35,000 to $49,999 | 2,129 (13.2%) | 1,090 (4.8%) |
| $50,000 to $74,999 | 2,962 (18.4%) | 2,367 (10.5%) |
| $75,000 to $99,999 | 2,013 (12.5%) | 4,638 (20.5%) |
| $100,000 to $149,999 | 2,477 (15.4%) | 3,870 (17.1%) |
| $150,000 or more | 1,476 (9.2%) | 4,891 (21.6%) |
| Total | 16,116 (100.0%) | 22,618 (100.0%) |
Property Value to Household Income Ratio in Warren
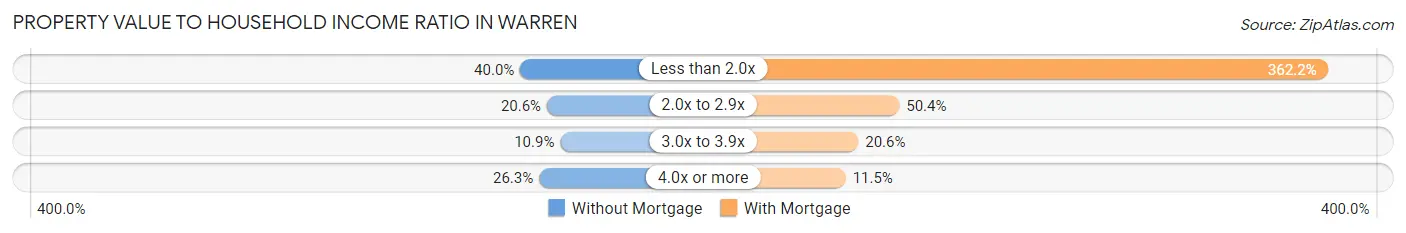
| Value-to-Income Ratio | Without Mortgage | With Mortgage |
| Less than 2.0x | 6,444 (40.0%) | 81,917 (362.2%) |
| 2.0x to 2.9x | 3,312 (20.5%) | 11,401 (50.4%) |
| 3.0x to 3.9x | 1,759 (10.9%) | 4,669 (20.6%) |
| 4.0x or more | 4,233 (26.3%) | 2,591 (11.5%) |
| Total | 16,116 (100.0%) | 22,618 (100.0%) |
Real Estate Taxes by Mortgage Status in Warren
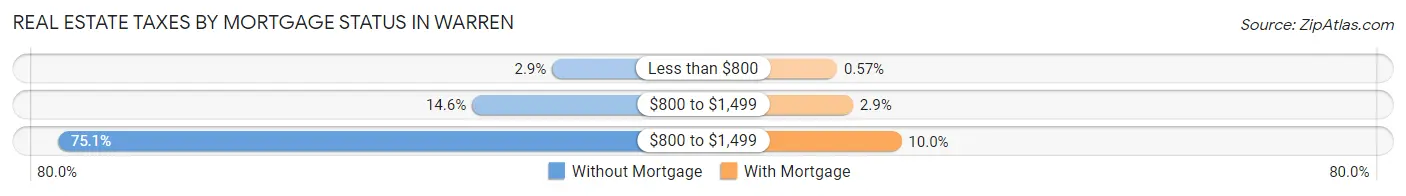
| Property Taxes | Without Mortgage | With Mortgage |
| Less than $800 | 471 (2.9%) | 128 (0.6%) |
| $800 to $1,499 | 2,357 (14.6%) | 656 (2.9%) |
| $800 to $1,499 | 12,110 (75.1%) | 2,260 (10.0%) |
| Total | 16,116 (100.0%) | 22,618 (100.0%) |
Health & Disability in Warren
Health Insurance Coverage by Age in Warren
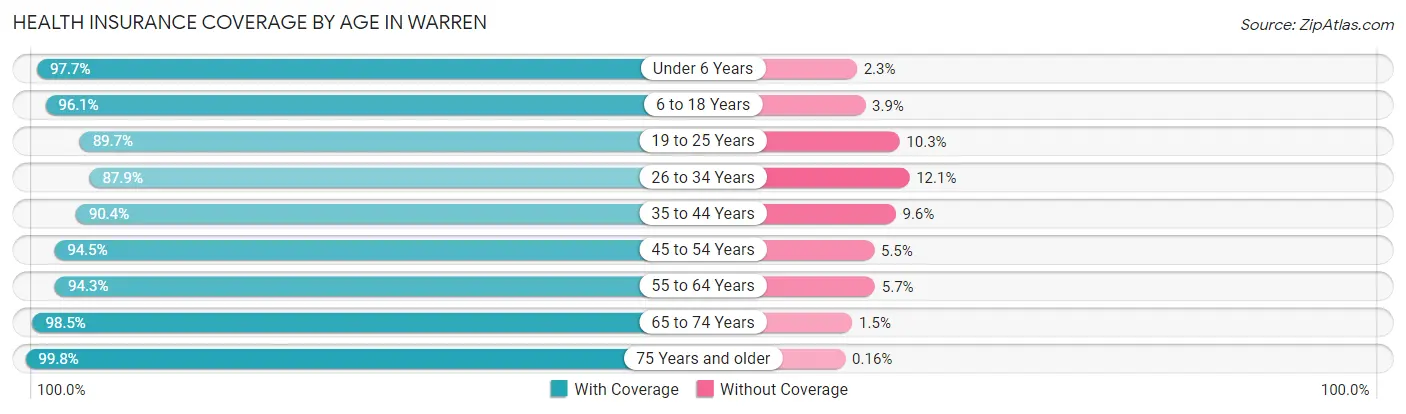
| Age Bracket | With Coverage | Without Coverage |
| Under 6 Years | 9,568 (97.7%) | 227 (2.3%) |
| 6 to 18 Years | 20,319 (96.1%) | 821 (3.9%) |
| 19 to 25 Years | 10,592 (89.7%) | 1,213 (10.3%) |
| 26 to 34 Years | 17,398 (87.9%) | 2,398 (12.1%) |
| 35 to 44 Years | 15,788 (90.4%) | 1,668 (9.6%) |
| 45 to 54 Years | 15,861 (94.5%) | 930 (5.5%) |
| 55 to 64 Years | 18,028 (94.3%) | 1,090 (5.7%) |
| 65 to 74 Years | 12,160 (98.5%) | 182 (1.5%) |
| 75 Years and older | 9,230 (99.8%) | 15 (0.2%) |
| Total | 128,944 (93.8%) | 8,544 (6.2%) |
Health Insurance Coverage by Citizenship Status in Warren
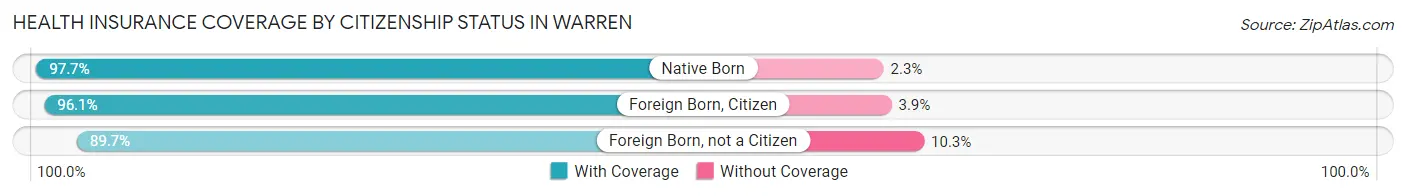
| Citizenship Status | With Coverage | Without Coverage |
| Native Born | 9,568 (97.7%) | 227 (2.3%) |
| Foreign Born, Citizen | 20,319 (96.1%) | 821 (3.9%) |
| Foreign Born, not a Citizen | 10,592 (89.7%) | 1,213 (10.3%) |
Health Insurance Coverage by Household Income in Warren
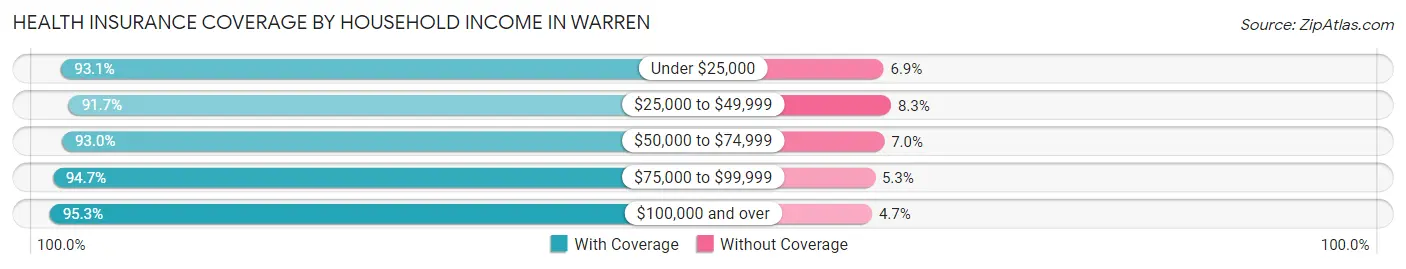
| Household Income | With Coverage | Without Coverage |
| Under $25,000 | 15,704 (93.1%) | 1,161 (6.9%) |
| $25,000 to $49,999 | 24,414 (91.7%) | 2,204 (8.3%) |
| $50,000 to $74,999 | 24,095 (93.0%) | 1,815 (7.0%) |
| $75,000 to $99,999 | 20,186 (94.7%) | 1,125 (5.3%) |
| $100,000 and over | 44,370 (95.3%) | 2,199 (4.7%) |
Public vs Private Health Insurance Coverage by Age in Warren
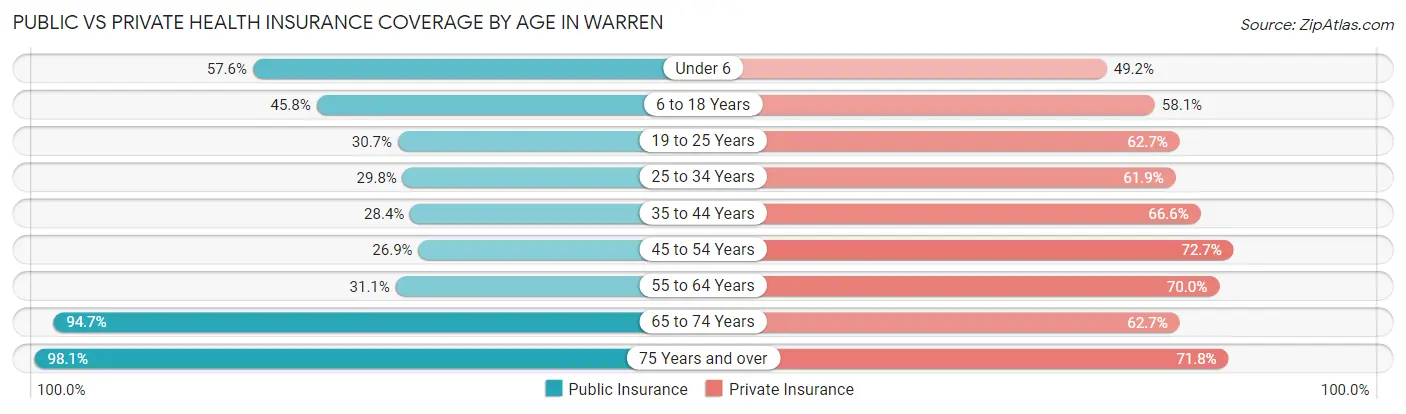
| Age Bracket | Public Insurance | Private Insurance |
| Under 6 | 5,646 (57.6%) | 4,818 (49.2%) |
| 6 to 18 Years | 9,685 (45.8%) | 12,286 (58.1%) |
| 19 to 25 Years | 3,627 (30.7%) | 7,403 (62.7%) |
| 25 to 34 Years | 5,906 (29.8%) | 12,260 (61.9%) |
| 35 to 44 Years | 4,963 (28.4%) | 11,623 (66.6%) |
| 45 to 54 Years | 4,517 (26.9%) | 12,208 (72.7%) |
| 55 to 64 Years | 5,953 (31.1%) | 13,384 (70.0%) |
| 65 to 74 Years | 11,683 (94.7%) | 7,737 (62.7%) |
| 75 Years and over | 9,073 (98.1%) | 6,634 (71.8%) |
| Total | 61,053 (44.4%) | 88,353 (64.3%) |
Disability Status by Sex by Age in Warren
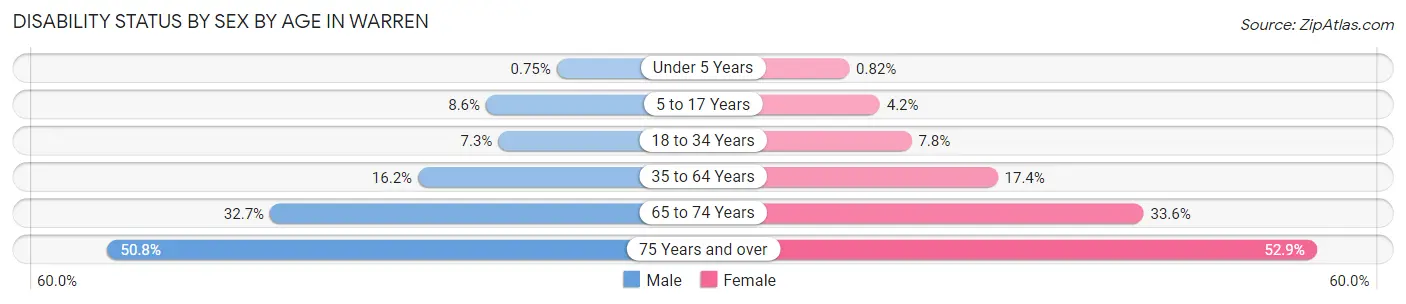
| Age Bracket | Male | Female |
| Under 5 Years | 33 (0.7%) | 32 (0.8%) |
| 5 to 17 Years | 939 (8.6%) | 426 (4.2%) |
| 18 to 34 Years | 1,172 (7.3%) | 1,330 (7.8%) |
| 35 to 64 Years | 4,370 (16.2%) | 4,579 (17.3%) |
| 65 to 74 Years | 1,891 (32.7%) | 2,203 (33.6%) |
| 75 Years and over | 1,769 (50.7%) | 3,045 (52.9%) |
Disability Class by Sex by Age in Warren
Disability Class: Hearing Difficulty
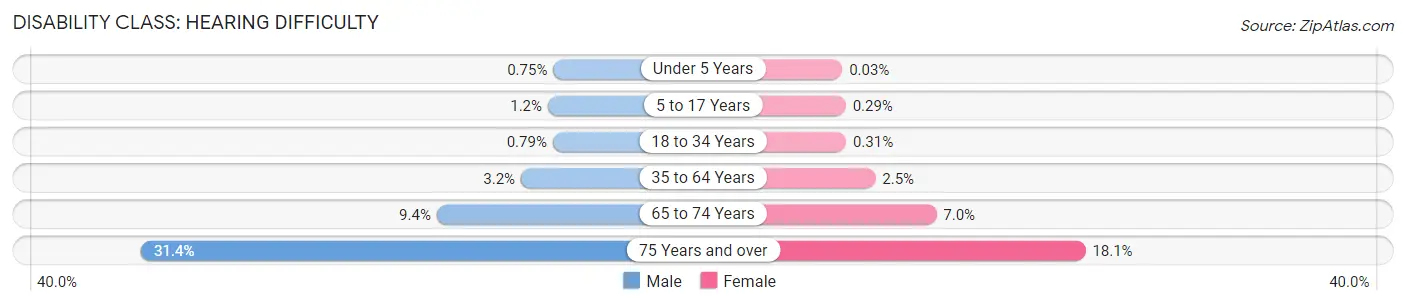
| Age Bracket | Male | Female |
| Under 5 Years | 33 (0.7%) | 1 (0.0%) |
| 5 to 17 Years | 125 (1.1%) | 29 (0.3%) |
| 18 to 34 Years | 128 (0.8%) | 54 (0.3%) |
| 35 to 64 Years | 849 (3.2%) | 657 (2.5%) |
| 65 to 74 Years | 544 (9.4%) | 460 (7.0%) |
| 75 Years and over | 1,093 (31.4%) | 1,042 (18.1%) |
Disability Class: Vision Difficulty
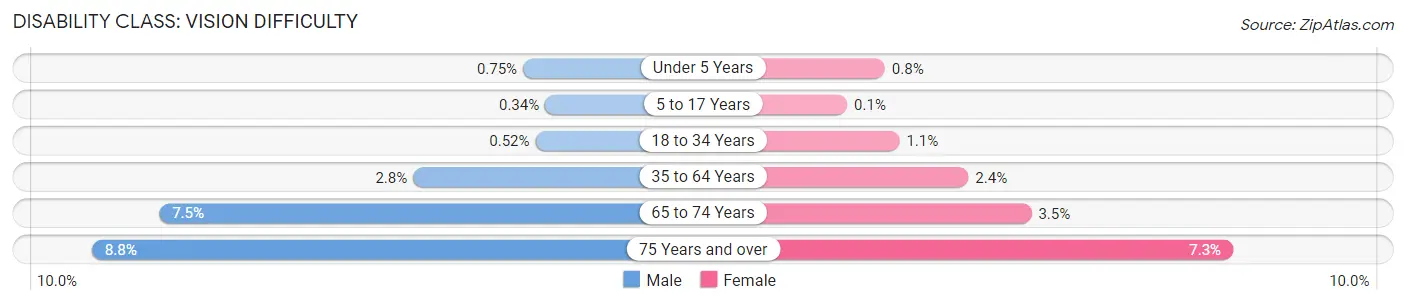
| Age Bracket | Male | Female |
| Under 5 Years | 33 (0.7%) | 31 (0.8%) |
| 5 to 17 Years | 37 (0.3%) | 10 (0.1%) |
| 18 to 34 Years | 84 (0.5%) | 184 (1.1%) |
| 35 to 64 Years | 752 (2.8%) | 620 (2.4%) |
| 65 to 74 Years | 434 (7.5%) | 231 (3.5%) |
| 75 Years and over | 305 (8.7%) | 418 (7.3%) |
Disability Class: Cognitive Difficulty
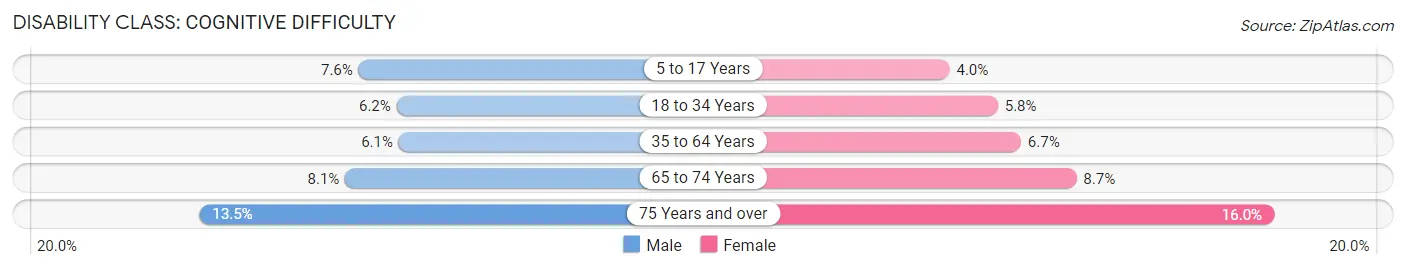
| Age Bracket | Male | Female |
| 5 to 17 Years | 827 (7.6%) | 403 (4.0%) |
| 18 to 34 Years | 999 (6.2%) | 993 (5.8%) |
| 35 to 64 Years | 1,649 (6.1%) | 1,754 (6.7%) |
| 65 to 74 Years | 469 (8.1%) | 571 (8.7%) |
| 75 Years and over | 471 (13.5%) | 924 (16.0%) |
Disability Class: Ambulatory Difficulty
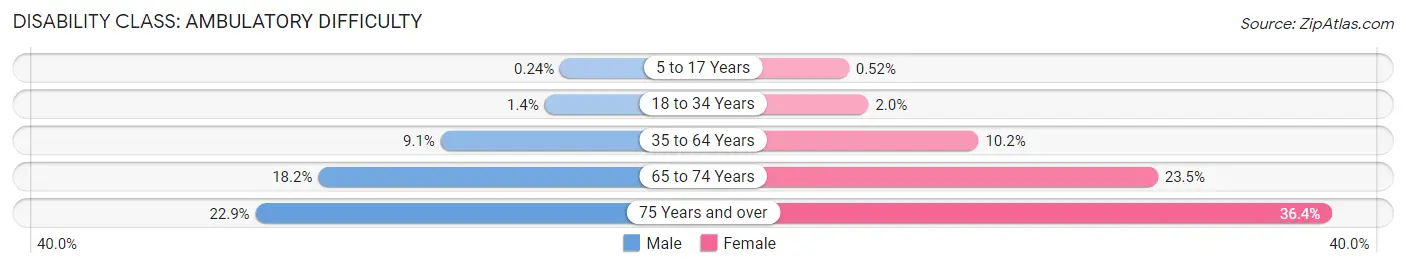
| Age Bracket | Male | Female |
| 5 to 17 Years | 26 (0.2%) | 52 (0.5%) |
| 18 to 34 Years | 224 (1.4%) | 340 (2.0%) |
| 35 to 64 Years | 2,457 (9.1%) | 2,677 (10.2%) |
| 65 to 74 Years | 1,053 (18.2%) | 1,538 (23.5%) |
| 75 Years and over | 797 (22.9%) | 2,096 (36.4%) |
Disability Class: Self-Care Difficulty
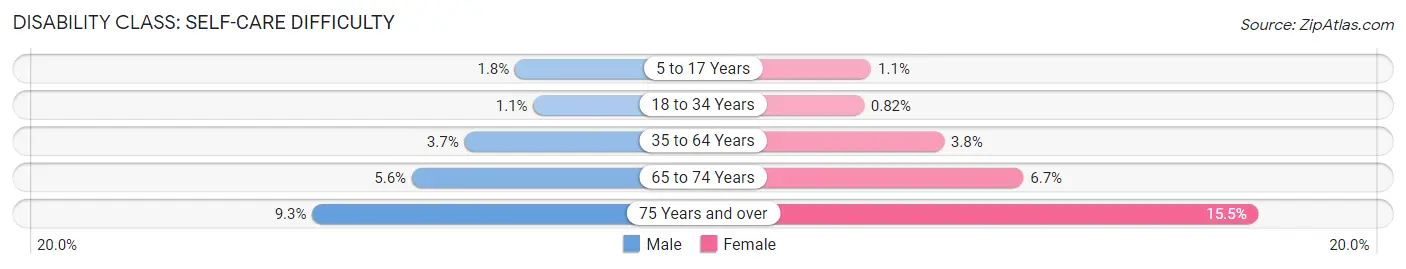
| Age Bracket | Male | Female |
| 5 to 17 Years | 195 (1.8%) | 110 (1.1%) |
| 18 to 34 Years | 179 (1.1%) | 140 (0.8%) |
| 35 to 64 Years | 990 (3.7%) | 999 (3.8%) |
| 65 to 74 Years | 325 (5.6%) | 442 (6.7%) |
| 75 Years and over | 325 (9.3%) | 891 (15.5%) |
Technology Access in Warren
Computing Device Access in Warren
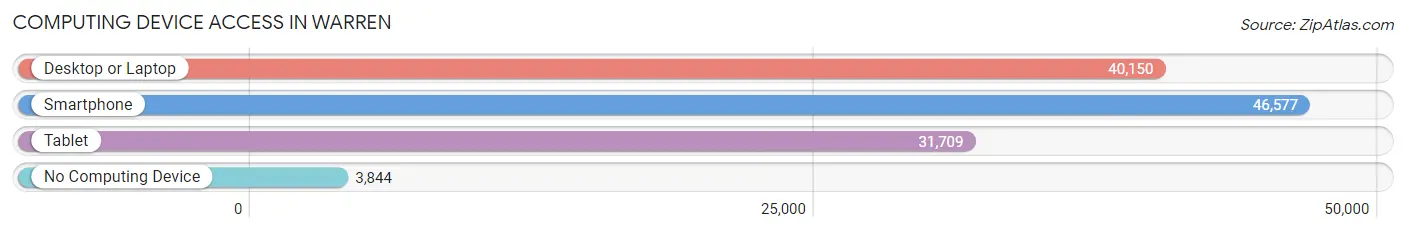
| Device Type | # Households | % Households |
| Desktop or Laptop | 40,150 | 73.7% |
| Smartphone | 46,577 | 85.5% |
| Tablet | 31,709 | 58.2% |
| No Computing Device | 3,844 | 7.1% |
| Total | 54,483 | 100.0% |
Internet Access in Warren
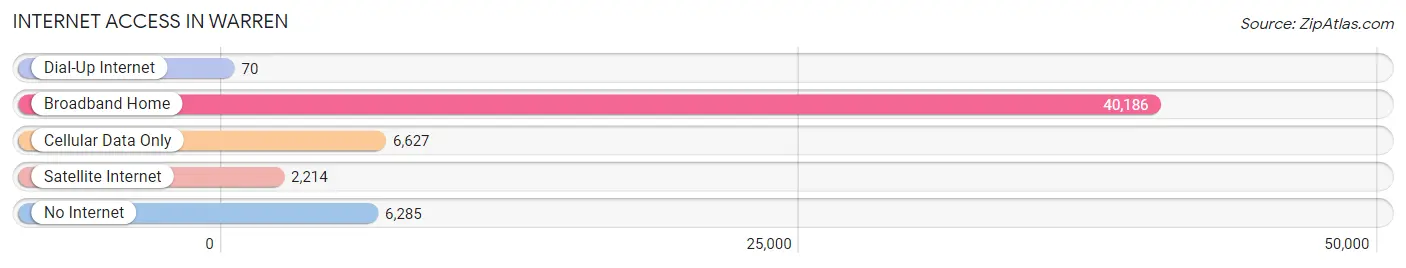
| Internet Type | # Households | % Households |
| Dial-Up Internet | 70 | 0.1% |
| Broadband Home | 40,186 | 73.8% |
| Cellular Data Only | 6,627 | 12.2% |
| Satellite Internet | 2,214 | 4.1% |
| No Internet | 6,285 | 11.5% |
| Total | 54,483 | 100.0% |
Warren Summary
Warren, Michigan is a city located in Macomb County, Michigan, United States. It is a suburb of Detroit and is the largest city in Macomb County. The city is home to a population of 134,056 people as of the 2020 census.
History
The area that is now Warren was first settled in 1817 by Abel Warren, a veteran of the War of 1812. He purchased land in the area and built a log cabin. The area was known as the "Warren Settlement" and was the first permanent settlement in Macomb County.
In 1837, the area was incorporated as the village of Warren. The village was named after Abel Warren and was the first village to be incorporated in Macomb County.
In 1893, the village of Warren was incorporated as a city. The city was named after Abel Warren and was the first city to be incorporated in Macomb County.
Geography
Warren is located in Macomb County, Michigan, United States. It is a suburb of Detroit and is the largest city in Macomb County. The city is located at 42°31'N, 83°7'W.
The city has a total area of 34.2 square miles, of which 33.9 square miles is land and 0.3 square miles is water. The city is located in the Detroit metropolitan area and is bordered by the cities of Sterling Heights, Troy, and Center Line.
Economy
Warren is home to a variety of businesses and industries. The city is home to the headquarters of General Motors, which is the largest employer in the city. Other major employers in the city include St. John Providence Health System, Macomb Community College, and the Warren Consolidated Schools.
The city is also home to a variety of retail and entertainment establishments. The city is home to the Warren Community Center, which is a popular destination for shopping, dining, and entertainment. The city is also home to the Warren Civic Center, which is a popular destination for concerts, sporting events, and other entertainment.
Demographics
As of the 2020 census, Warren had a population of 134,056 people. The racial makeup of the city was 79.2% White, 14.2% African American, 0.7% Native American, 2.2% Asian, 0.1% Pacific Islander, 1.3% from other races, and 2.5% from two or more races. Hispanic or Latino of any race were 4.2% of the population.
The median household income in Warren was $54,945 and the median family income was $63,945. The per capita income in Warren was $25,945. About 11.2% of the population was below the poverty line.
Common Questions
What is Per Capita Income in Warren?
Per Capita income in Warren is $31,080.
What is the Median Family Income in Warren?
Median Family Income in Warren is $73,931.
What is the Median Household income in Warren?
Median Household Income in Warren is $61,633.
What is Income or Wage Gap in Warren?
Income or Wage Gap in Warren is 28.0%.
Women in Warren earn 72.0 cents for every dollar earned by a man.
What is Family Income Deficit in Warren?
Family Income Deficit in Warren is $10,418.
Families that are below poverty line in Warren earn $10,418 less on average than the poverty threshold level.
What is Inequality or Gini Index in Warren?
Inequality or Gini Index in Warren is 0.42.
What is the Total Population of Warren?
Total Population of Warren is 138,588.
What is the Total Male Population of Warren?
Total Male Population of Warren is 68,155.
What is the Total Female Population of Warren?
Total Female Population of Warren is 70,433.
What is the Ratio of Males per 100 Females in Warren?
There are 96.77 Males per 100 Females in Warren.
What is the Ratio of Females per 100 Males in Warren?
There are 103.34 Females per 100 Males in Warren.
What is the Median Population Age in Warren?
Median Population Age in Warren is 38.5 Years.
What is the Average Family Size in Warren
Average Family Size in Warren is 3.2 People.
What is the Average Household Size in Warren
Average Household Size in Warren is 2.5 People.
How Large is the Labor Force in Warren?
There are 71,754 People in the Labor Forcein in Warren.
What is the Percentage of People in the Labor Force in Warren?
63.7% of People are in the Labor Force in Warren.
What is the Unemployment Rate in Warren?
Unemployment Rate in Warren is 7.4%.