Germantown, MD Map & Demographics
Germantown Map
Germantown Overview
$47,975
PER CAPITA INCOME
$119,433
AVG FAMILY INCOME
$109,268
AVG HOUSEHOLD INCOME
26.4%
WAGE / INCOME GAP [ % ]
73.6¢/ $1
WAGE / INCOME GAP [ $ ]
$12,590
FAMILY INCOME DEFICIT
0.40
INEQUALITY / GINI INDEX
90,210
TOTAL POPULATION
44,325
MALE POPULATION
45,885
FEMALE POPULATION
96.60
MALES / 100 FEMALES
103.52
FEMALES / 100 MALES
36.9
MEDIAN AGE
3.4
AVG FAMILY SIZE
2.9
AVG HOUSEHOLD SIZE
53,015
LABOR FORCE [ PEOPLE ]
74.3%
PERCENT IN LABOR FORCE
5.2%
UNEMPLOYMENT RATE
Germantown Area Codes
Income in Germantown
Income Overview in Germantown
Per Capita Income in Germantown is $47,975, while median incomes of families and households are $119,433 and $109,268 respectively.
| Characteristic | Number | Measure |
| Per Capita Income | 90,210 | $47,975 |
| Median Family Income | 22,832 | $119,433 |
| Mean Family Income | 22,832 | $142,103 |
| Median Household Income | 31,628 | $109,268 |
| Mean Household Income | 31,628 | $134,281 |
| Income Deficit | 22,832 | $12,590 |
| Wage / Income Gap (%) | 90,210 | 26.39% |
| Wage / Income Gap ($) | 90,210 | 73.61¢ per $1 |
| Gini / Inequality Index | 90,210 | 0.40 |
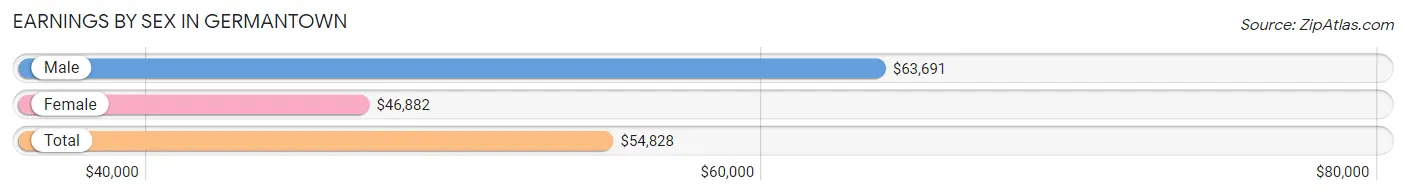
Earnings by Sex in Germantown
Average Earnings in Germantown are $54,828, $63,691 for men and $46,882 for women, a difference of 26.4%.
| Sex | Number | Average Earnings |
| Male | 27,490 (50.9%) | $63,691 |
| Female | 26,480 (49.1%) | $46,882 |
| Total | 53,970 (100.0%) | $54,828 |
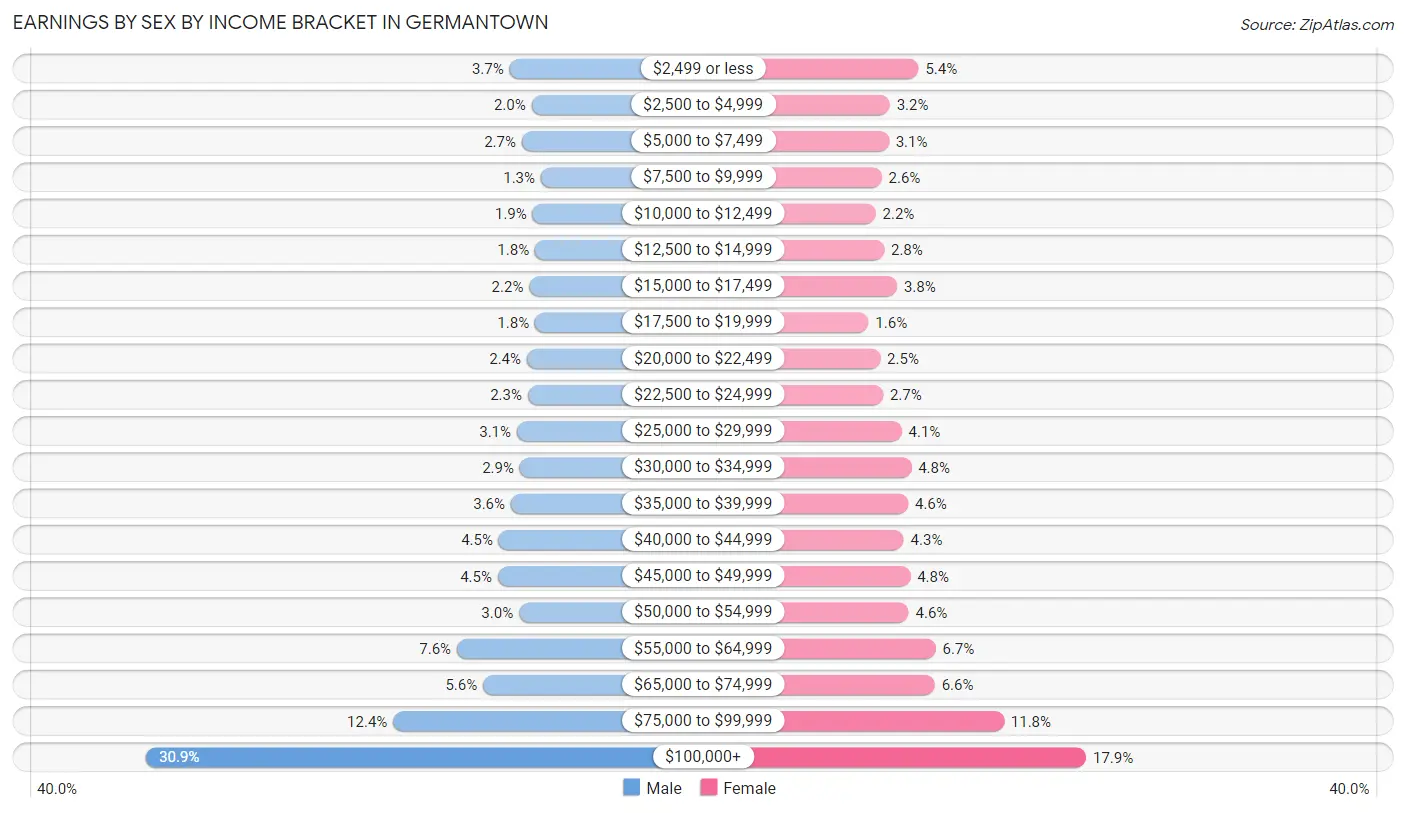
Earnings by Sex by Income Bracket in Germantown
The most common earnings brackets in Germantown are $100,000+ for men (8,491 | 30.9%) and $100,000+ for women (4,749 | 17.9%).
| Income | Male | Female |
| $2,499 or less | 1,005 (3.7%) | 1,423 (5.4%) |
| $2,500 to $4,999 | 553 (2.0%) | 853 (3.2%) |
| $5,000 to $7,499 | 754 (2.7%) | 831 (3.1%) |
| $7,500 to $9,999 | 361 (1.3%) | 690 (2.6%) |
| $10,000 to $12,499 | 531 (1.9%) | 573 (2.2%) |
| $12,500 to $14,999 | 480 (1.8%) | 738 (2.8%) |
| $15,000 to $17,499 | 600 (2.2%) | 995 (3.8%) |
| $17,500 to $19,999 | 480 (1.8%) | 429 (1.6%) |
| $20,000 to $22,499 | 648 (2.4%) | 663 (2.5%) |
| $22,500 to $24,999 | 629 (2.3%) | 717 (2.7%) |
| $25,000 to $29,999 | 855 (3.1%) | 1,089 (4.1%) |
| $30,000 to $34,999 | 795 (2.9%) | 1,279 (4.8%) |
| $35,000 to $39,999 | 980 (3.6%) | 1,215 (4.6%) |
| $40,000 to $44,999 | 1,225 (4.5%) | 1,127 (4.3%) |
| $45,000 to $49,999 | 1,249 (4.5%) | 1,258 (4.8%) |
| $50,000 to $54,999 | 810 (2.9%) | 1,227 (4.6%) |
| $55,000 to $64,999 | 2,090 (7.6%) | 1,761 (6.7%) |
| $65,000 to $74,999 | 1,550 (5.6%) | 1,745 (6.6%) |
| $75,000 to $99,999 | 3,404 (12.4%) | 3,118 (11.8%) |
| $100,000+ | 8,491 (30.9%) | 4,749 (17.9%) |
| Total | 27,490 (100.0%) | 26,480 (100.0%) |
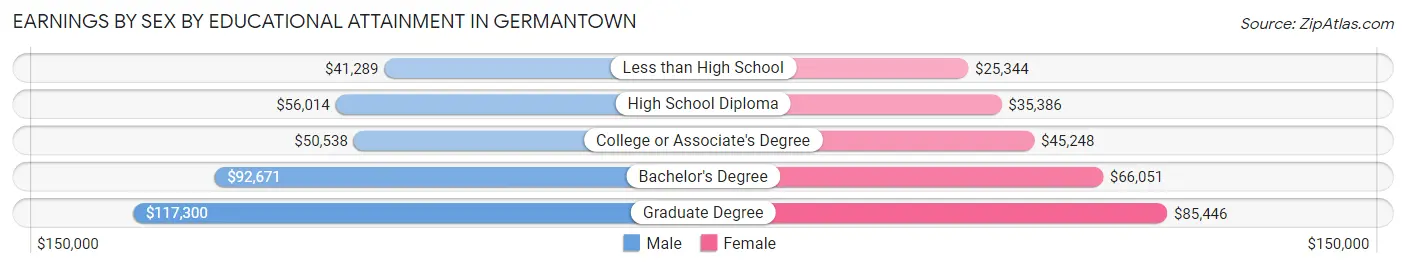
Earnings by Sex by Educational Attainment in Germantown
Average earnings in Germantown are $71,626 for men and $52,835 for women, a difference of 26.2%. Men with an educational attainment of graduate degree enjoy the highest average annual earnings of $117,300, while those with less than high school education earn the least with $41,289. Women with an educational attainment of graduate degree earn the most with the average annual earnings of $85,446, while those with less than high school education have the smallest earnings of $25,344.
| Educational Attainment | Male Income | Female Income |
| Less than High School | $41,289 | $25,344 |
| High School Diploma | $56,014 | $35,386 |
| College or Associate's Degree | $50,538 | $45,248 |
| Bachelor's Degree | $92,671 | $66,051 |
| Graduate Degree | $117,300 | $85,446 |
| Total | $71,626 | $52,835 |
Family Income in Germantown
Family Income Brackets in Germantown
According to the Germantown family income data, there are 5,274 families falling into the $200,000+ income range, which is the most common income bracket and makes up 23.1% of all families. Conversely, the $10,000 to $14,999 income bracket is the least frequent group with only 205 families (0.9%) belonging to this category.
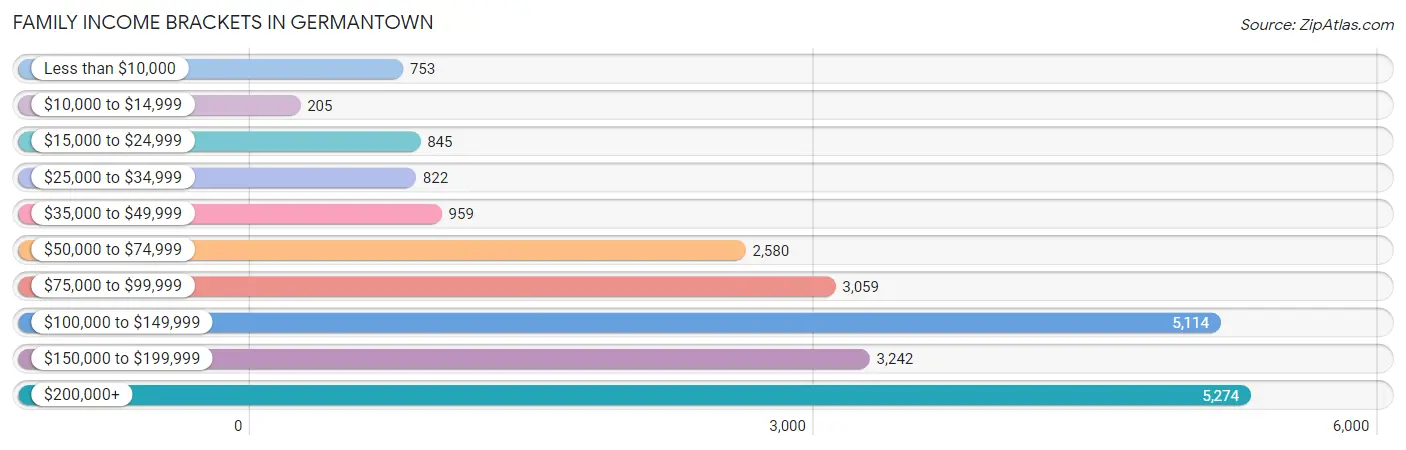
| Income Bracket | # Families | % Families |
| Less than $10,000 | 753 | 3.3% |
| $10,000 to $14,999 | 205 | 0.9% |
| $15,000 to $24,999 | 845 | 3.7% |
| $25,000 to $34,999 | 822 | 3.6% |
| $35,000 to $49,999 | 959 | 4.2% |
| $50,000 to $74,999 | 2,580 | 11.3% |
| $75,000 to $99,999 | 3,059 | 13.4% |
| $100,000 to $149,999 | 5,114 | 22.4% |
| $150,000 to $199,999 | 3,242 | 14.2% |
| $200,000+ | 5,274 | 23.1% |
Family Income by Famaliy Size in Germantown
4-person families (5,036 | 22.1%) account for the highest median family income in Germantown with $133,604 per family, while 2-person families (8,160 | 35.7%) have the highest median income of $50,014 per family member.
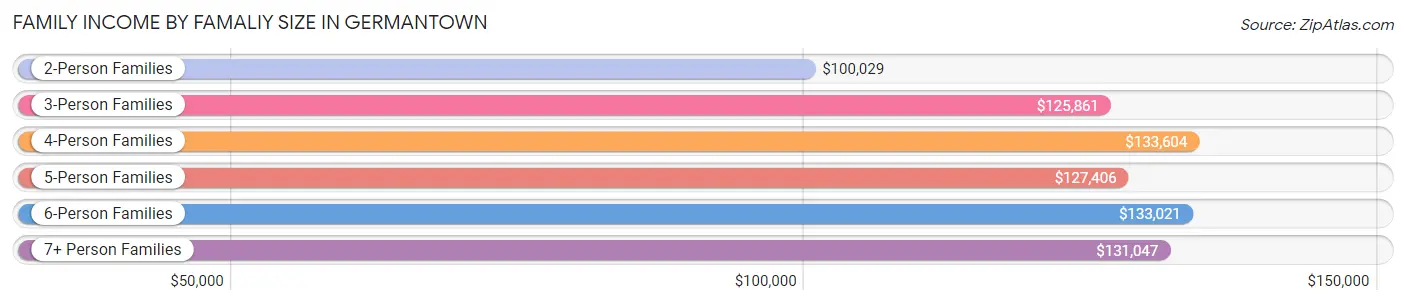
| Income Bracket | # Families | Median Income |
| 2-Person Families | 8,160 (35.7%) | $100,029 |
| 3-Person Families | 6,065 (26.6%) | $125,861 |
| 4-Person Families | 5,036 (22.1%) | $133,604 |
| 5-Person Families | 2,258 (9.9%) | $127,406 |
| 6-Person Families | 907 (4.0%) | $133,021 |
| 7+ Person Families | 406 (1.8%) | $131,047 |
| Total | 22,832 (100.0%) | $119,433 |
Family Income by Number of Earners in Germantown
The median family income in Germantown is $119,433, with families comprising 3+ earners (4,418) having the highest median family income of $164,583, while families with no earners (1,237) have the lowest median family income of $31,250, accounting for 19.4% and 5.4% of families, respectively.
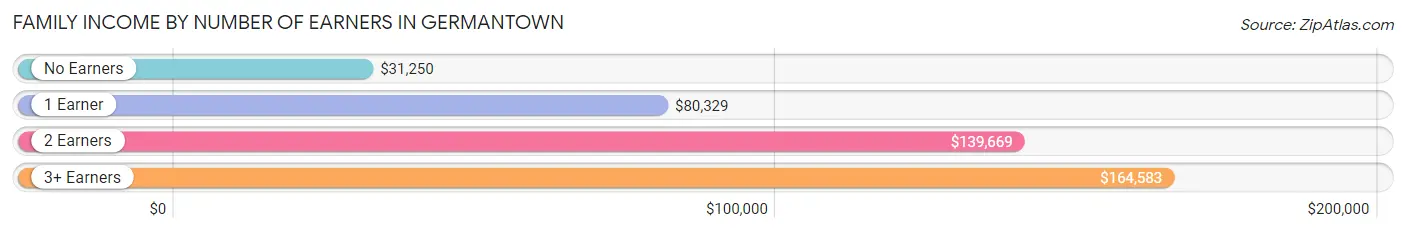
| Number of Earners | # Families | Median Income |
| No Earners | 1,237 (5.4%) | $31,250 |
| 1 Earner | 7,072 (31.0%) | $80,329 |
| 2 Earners | 10,105 (44.3%) | $139,669 |
| 3+ Earners | 4,418 (19.4%) | $164,583 |
| Total | 22,832 (100.0%) | $119,433 |
Household Income in Germantown
Household Income Brackets in Germantown
With 6,768 households falling in the category, the $100,000 to $149,999 income range is the most frequent in Germantown, accounting for 21.4% of all households. In contrast, only 411 households (1.3%) fall into the $10,000 to $14,999 income bracket, making it the least populous group.
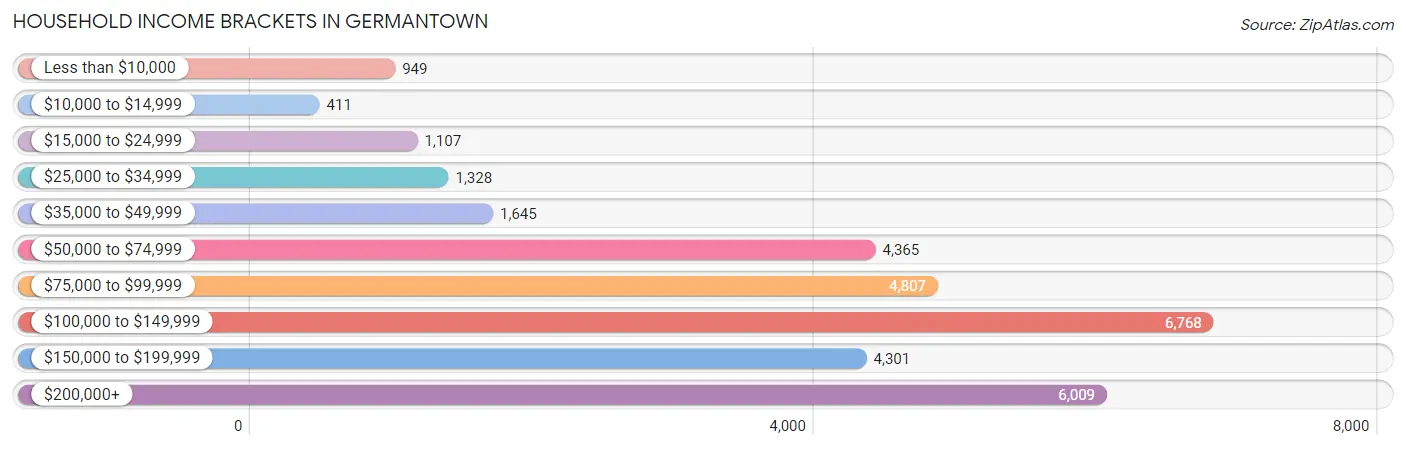
| Income Bracket | # Households | % Households |
| Less than $10,000 | 949 | 3.0% |
| $10,000 to $14,999 | 411 | 1.3% |
| $15,000 to $24,999 | 1,107 | 3.5% |
| $25,000 to $34,999 | 1,328 | 4.2% |
| $35,000 to $49,999 | 1,645 | 5.2% |
| $50,000 to $74,999 | 4,365 | 13.8% |
| $75,000 to $99,999 | 4,807 | 15.2% |
| $100,000 to $149,999 | 6,768 | 21.4% |
| $150,000 to $199,999 | 4,301 | 13.6% |
| $200,000+ | 6,009 | 19.0% |
Household Income by Householder Age in Germantown
The median household income in Germantown is $109,268, with the highest median household income of $125,801 found in the 45 to 64 years age bracket for the primary householder. A total of 14,786 households (46.8%) fall into this category. Meanwhile, the 15 to 24 years age bracket for the primary householder has the lowest median household income of $64,792, with 461 households (1.5%) in this group.
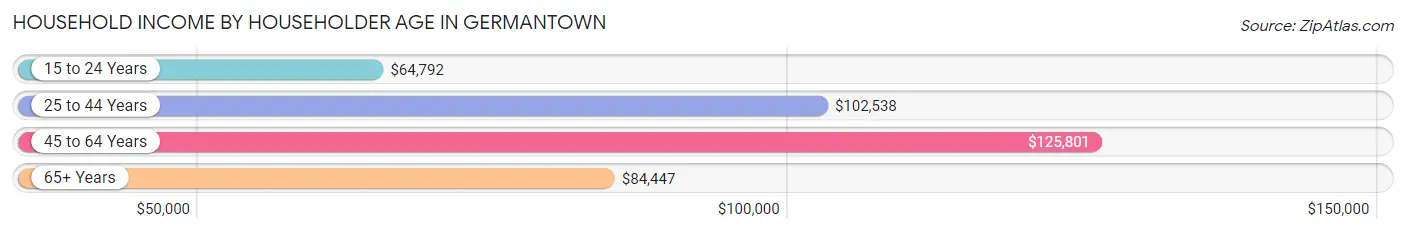
| Income Bracket | # Households | Median Income |
| 15 to 24 Years | 461 (1.5%) | $64,792 |
| 25 to 44 Years | 11,482 (36.3%) | $102,538 |
| 45 to 64 Years | 14,786 (46.8%) | $125,801 |
| 65+ Years | 4,899 (15.5%) | $84,447 |
| Total | 31,628 (100.0%) | $109,268 |
Poverty in Germantown
Income Below Poverty by Sex and Age in Germantown
With 8.0% poverty level for males and 9.7% for females among the residents of Germantown, 18 to 24 year old males and 15 year old females are the most vulnerable to poverty, with 754 males (15.8%) and 132 females (19.6%) in their respective age groups living below the poverty level.
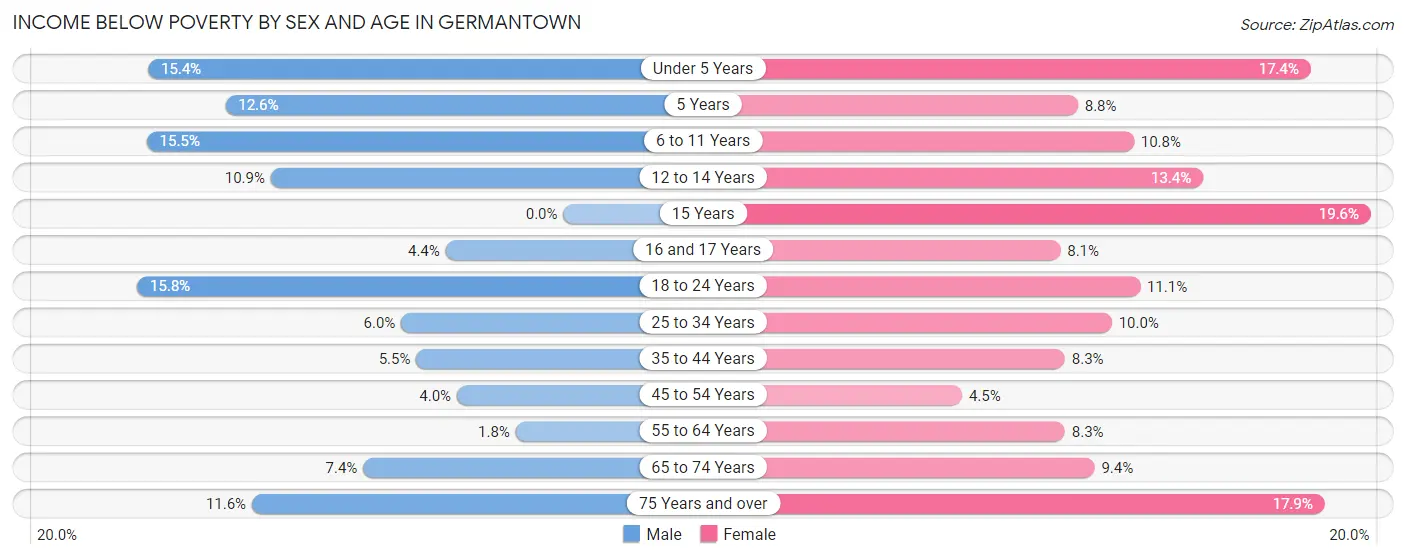
| Age Bracket | Male | Female |
| Under 5 Years | 411 (15.4%) | 509 (17.4%) |
| 5 Years | 90 (12.6%) | 31 (8.8%) |
| 6 to 11 Years | 558 (15.5%) | 387 (10.8%) |
| 12 to 14 Years | 211 (10.9%) | 257 (13.4%) |
| 15 Years | 0 (0.0%) | 132 (19.6%) |
| 16 and 17 Years | 62 (4.4%) | 130 (8.1%) |
| 18 to 24 Years | 754 (15.8%) | 369 (11.1%) |
| 25 to 34 Years | 377 (6.0%) | 643 (10.0%) |
| 35 to 44 Years | 332 (5.5%) | 569 (8.3%) |
| 45 to 54 Years | 244 (4.0%) | 327 (4.5%) |
| 55 to 64 Years | 100 (1.8%) | 482 (8.3%) |
| 65 to 74 Years | 218 (7.4%) | 338 (9.4%) |
| 75 Years and over | 188 (11.6%) | 261 (17.9%) |
| Total | 3,545 (8.0%) | 4,435 (9.7%) |
Income Above Poverty by Sex and Age in Germantown
According to the poverty statistics in Germantown, males aged 15 years and females aged 45 to 54 years are the age groups that are most secure financially, with 100.0% of males and 95.5% of females in these age groups living above the poverty line.
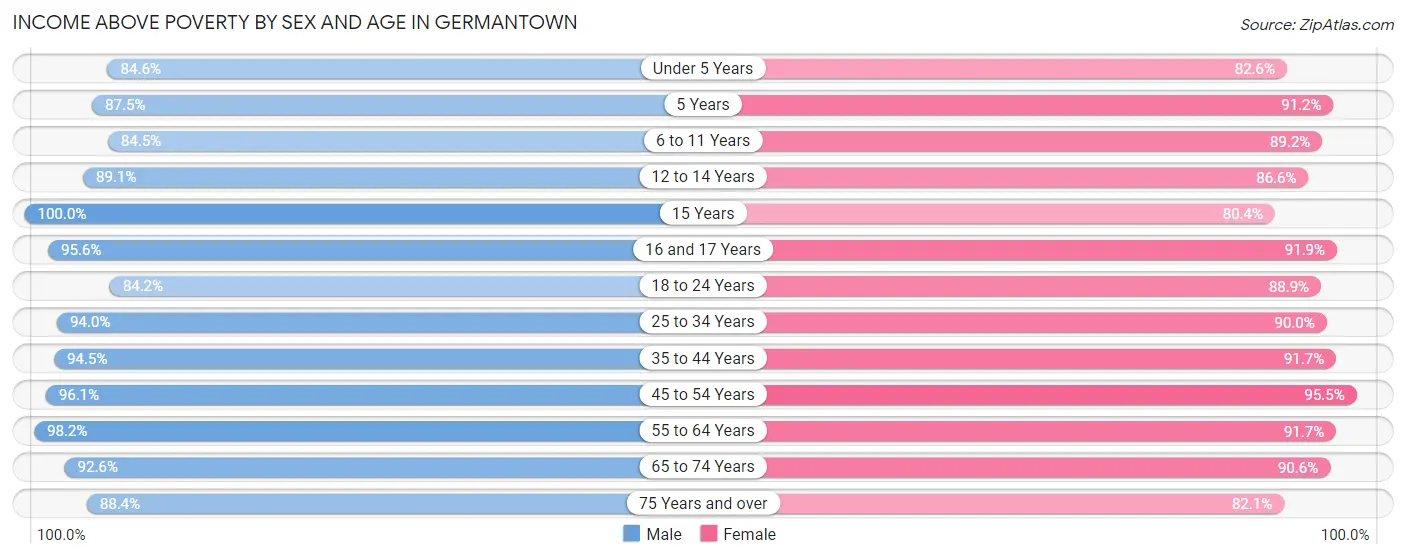
| Age Bracket | Male | Female |
| Under 5 Years | 2,254 (84.6%) | 2,414 (82.6%) |
| 5 Years | 627 (87.5%) | 323 (91.2%) |
| 6 to 11 Years | 3,050 (84.5%) | 3,184 (89.2%) |
| 12 to 14 Years | 1,732 (89.1%) | 1,659 (86.6%) |
| 15 Years | 320 (100.0%) | 540 (80.4%) |
| 16 and 17 Years | 1,358 (95.6%) | 1,472 (91.9%) |
| 18 to 24 Years | 4,008 (84.2%) | 2,963 (88.9%) |
| 25 to 34 Years | 5,887 (94.0%) | 5,774 (90.0%) |
| 35 to 44 Years | 5,747 (94.5%) | 6,302 (91.7%) |
| 45 to 54 Years | 5,927 (96.1%) | 7,001 (95.5%) |
| 55 to 64 Years | 5,564 (98.2%) | 5,341 (91.7%) |
| 65 to 74 Years | 2,715 (92.6%) | 3,264 (90.6%) |
| 75 Years and over | 1,438 (88.4%) | 1,195 (82.1%) |
| Total | 40,627 (92.0%) | 41,432 (90.3%) |
Income Below Poverty Among Married-Couple Families in Germantown
The poverty statistics for married-couple families in Germantown show that 3.5% or 570 of the total 16,269 families live below the poverty line. Families with 5 or more children have the highest poverty rate of 17.2%, comprising of 10 families. On the other hand, families with 1 or 2 children have the lowest poverty rate of 3.2%, which includes 214 families.
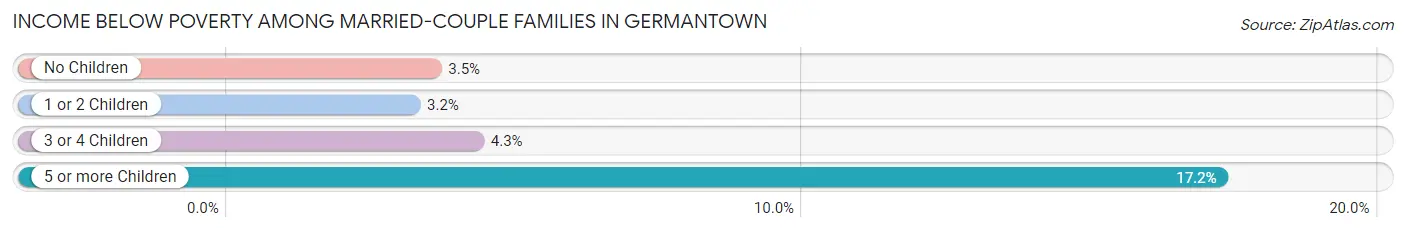
| Children | Above Poverty | Below Poverty |
| No Children | 7,608 (96.5%) | 279 (3.5%) |
| 1 or 2 Children | 6,543 (96.8%) | 214 (3.2%) |
| 3 or 4 Children | 1,500 (95.7%) | 67 (4.3%) |
| 5 or more Children | 48 (82.8%) | 10 (17.2%) |
| Total | 15,699 (96.5%) | 570 (3.5%) |
Income Below Poverty Among Single-Parent Households in Germantown
According to the poverty data in Germantown, 15.6% or 228 single-father households and 17.5% or 891 single-mother households are living below the poverty line. Among single-father households, those with no children have the highest poverty rate, with 118 households (17.0%) experiencing poverty. Likewise, among single-mother households, those with 3 or 4 children have the highest poverty rate, with 227 households (53.8%) falling below the poverty line.
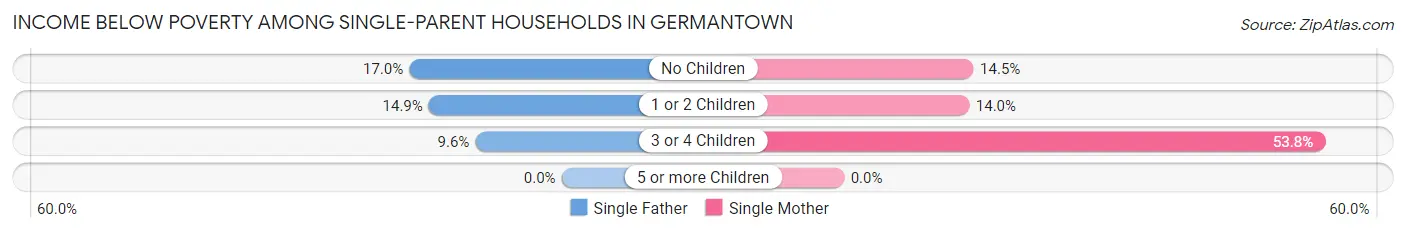
| Children | Single Father | Single Mother |
| No Children | 118 (17.0%) | 288 (14.5%) |
| 1 or 2 Children | 102 (14.8%) | 376 (14.0%) |
| 3 or 4 Children | 8 (9.6%) | 227 (53.8%) |
| 5 or more Children | 0 (0.0%) | 0 (0.0%) |
| Total | 228 (15.6%) | 891 (17.5%) |
Income Below Poverty Among Married-Couple vs Single-Parent Households in Germantown
The poverty data for Germantown shows that 570 of the married-couple family households (3.5%) and 1,119 of the single-parent households (17.1%) are living below the poverty level. Within the married-couple family households, those with 5 or more children have the highest poverty rate, with 10 households (17.2%) falling below the poverty line. Among the single-parent households, those with 3 or 4 children have the highest poverty rate, with 235 household (46.5%) living below poverty.
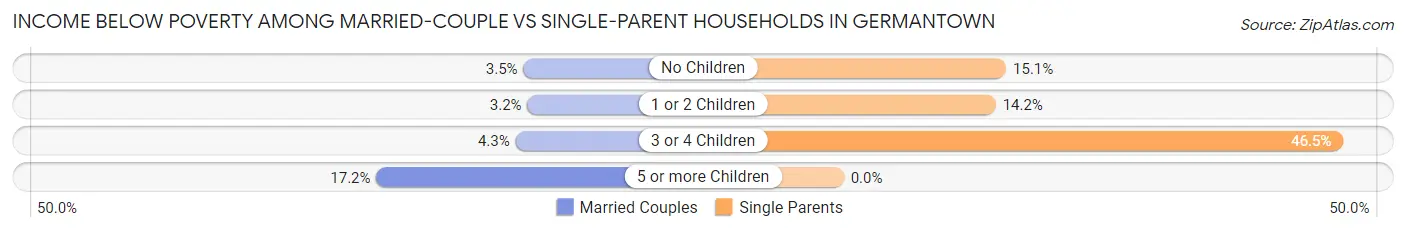
| Children | Married-Couple Families | Single-Parent Households |
| No Children | 279 (3.5%) | 406 (15.1%) |
| 1 or 2 Children | 214 (3.2%) | 478 (14.2%) |
| 3 or 4 Children | 67 (4.3%) | 235 (46.5%) |
| 5 or more Children | 10 (17.2%) | 0 (0.0%) |
| Total | 570 (3.5%) | 1,119 (17.1%) |
Race in Germantown
The most populous races in Germantown are White / Caucasian (30,437 | 33.7%), Black / African American (22,730 | 25.2%), and Hispanic or Latino (21,765 | 24.1%).
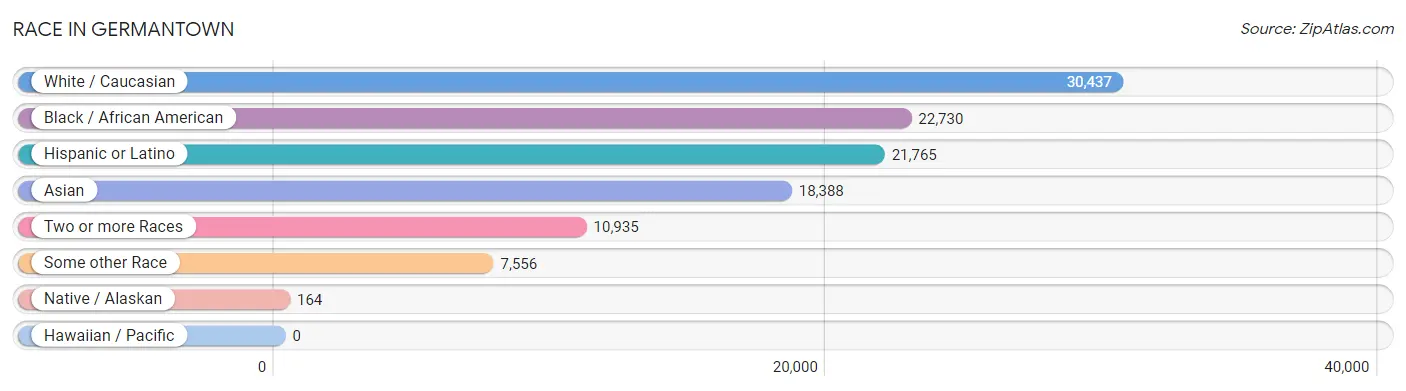
| Race | # Population | % Population |
| Asian | 18,388 | 20.4% |
| Black / African American | 22,730 | 25.2% |
| Hawaiian / Pacific | 0 | 0.0% |
| Hispanic or Latino | 21,765 | 24.1% |
| Native / Alaskan | 164 | 0.2% |
| White / Caucasian | 30,437 | 33.7% |
| Two or more Races | 10,935 | 12.1% |
| Some other Race | 7,556 | 8.4% |
| Total | 90,210 | 100.0% |
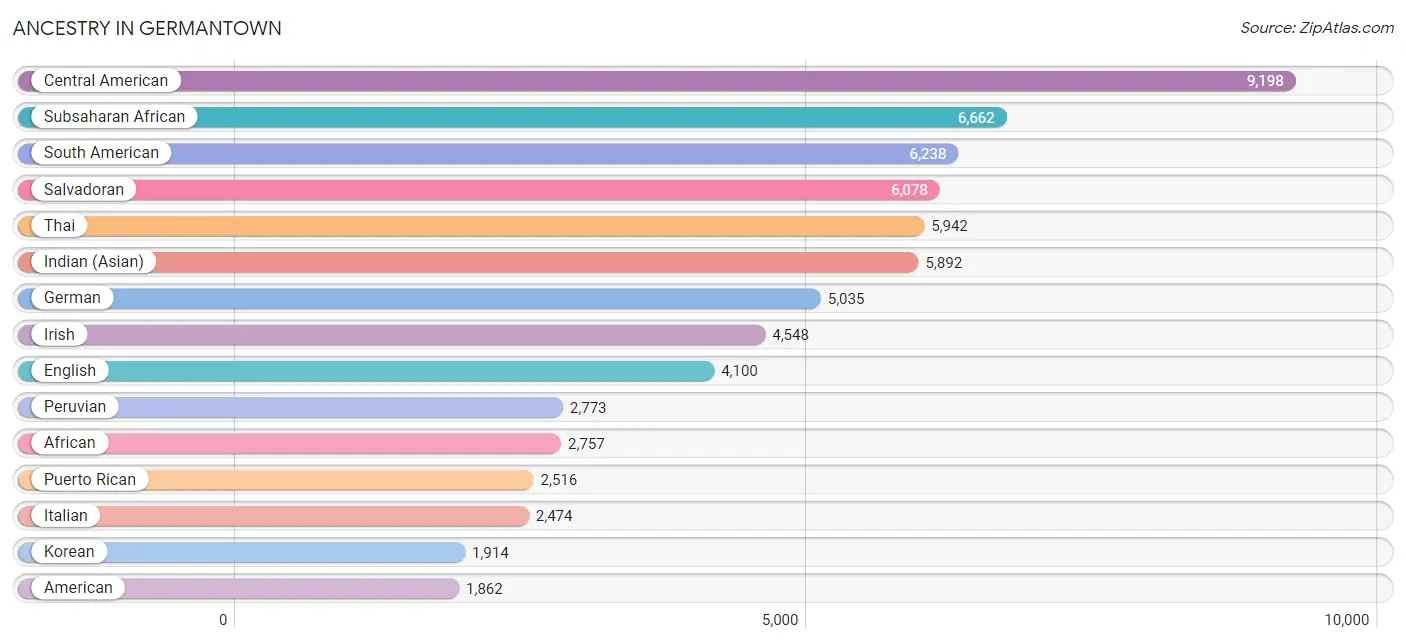
Ancestry in Germantown
The most populous ancestries reported in Germantown are Central American (9,198 | 10.2%), Subsaharan African (6,662 | 7.4%), South American (6,238 | 6.9%), Salvadoran (6,078 | 6.7%), and Thai (5,942 | 6.6%), together accounting for 37.8% of all Germantown residents.
| Ancestry | # Population | % Population |
| Afghan | 6 | 0.0% |
| African | 2,757 | 3.1% |
| Albanian | 424 | 0.5% |
| American | 1,862 | 2.1% |
| Arab | 891 | 1.0% |
| Argentinean | 188 | 0.2% |
| Armenian | 64 | 0.1% |
| Assyrian / Chaldean / Syriac | 19 | 0.0% |
| Australian | 12 | 0.0% |
| Austrian | 130 | 0.1% |
| Bangladeshi | 71 | 0.1% |
| Barbadian | 48 | 0.1% |
| Belgian | 18 | 0.0% |
| Bhutanese | 264 | 0.3% |
| Bolivian | 1,401 | 1.5% |
| Brazilian | 391 | 0.4% |
| British | 559 | 0.6% |
| British West Indian | 64 | 0.1% |
| Bulgarian | 22 | 0.0% |
| Burmese | 1,613 | 1.8% |
| Cajun | 112 | 0.1% |
| Cambodian | 65 | 0.1% |
| Canadian | 3 | 0.0% |
| Central American | 9,198 | 10.2% |
| Central American Indian | 407 | 0.4% |
| Cherokee | 67 | 0.1% |
| Chilean | 682 | 0.8% |
| Colombian | 564 | 0.6% |
| Costa Rican | 13 | 0.0% |
| Croatian | 10 | 0.0% |
| Cuban | 332 | 0.4% |
| Czech | 198 | 0.2% |
| Czechoslovakian | 82 | 0.1% |
| Danish | 140 | 0.2% |
| Delaware | 24 | 0.0% |
| Dominican | 545 | 0.6% |
| Dutch | 362 | 0.4% |
| Eastern European | 267 | 0.3% |
| Ecuadorian | 456 | 0.5% |
| Egyptian | 94 | 0.1% |
| English | 4,100 | 4.5% |
| Ethiopian | 520 | 0.6% |
| European | 1,128 | 1.3% |
| Filipino | 73 | 0.1% |
| Finnish | 15 | 0.0% |
| French | 1,044 | 1.2% |
| French Canadian | 174 | 0.2% |
| German | 5,035 | 5.6% |
| Ghanaian | 780 | 0.9% |
| Greek | 204 | 0.2% |
| Guatemalan | 1,263 | 1.4% |
| Guyanese | 247 | 0.3% |
| Haitian | 170 | 0.2% |
| Honduran | 1,187 | 1.3% |
| Hungarian | 292 | 0.3% |
| Indian (Asian) | 5,892 | 6.5% |
| Indonesian | 246 | 0.3% |
| Iranian | 682 | 0.8% |
| Iraqi | 242 | 0.3% |
| Irish | 4,548 | 5.0% |
| Iroquois | 31 | 0.0% |
| Israeli | 27 | 0.0% |
| Italian | 2,474 | 2.7% |
| Jamaican | 1,739 | 1.9% |
| Japanese | 37 | 0.0% |
| Jordanian | 29 | 0.0% |
| Kenyan | 85 | 0.1% |
| Korean | 1,914 | 2.1% |
| Laotian | 86 | 0.1% |
| Lebanese | 148 | 0.2% |
| Lithuanian | 56 | 0.1% |
| Lumbee | 15 | 0.0% |
| Malaysian | 17 | 0.0% |
| Mexican | 1,487 | 1.7% |
| Mongolian | 65 | 0.1% |
| Nicaraguan | 446 | 0.5% |
| Nigerian | 918 | 1.0% |
| Northern European | 148 | 0.2% |
| Norwegian | 238 | 0.3% |
| Pakistani | 131 | 0.2% |
| Palestinian | 131 | 0.2% |
| Panamanian | 211 | 0.2% |
| Paraguayan | 32 | 0.0% |
| Pennsylvania German | 36 | 0.0% |
| Peruvian | 2,773 | 3.1% |
| Polish | 1,187 | 1.3% |
| Portuguese | 70 | 0.1% |
| Puerto Rican | 2,516 | 2.8% |
| Romanian | 27 | 0.0% |
| Russian | 913 | 1.0% |
| Salvadoran | 6,078 | 6.7% |
| Scandinavian | 196 | 0.2% |
| Scotch-Irish | 282 | 0.3% |
| Scottish | 726 | 0.8% |
| Senegalese | 22 | 0.0% |
| Serbian | 83 | 0.1% |
| Sierra Leonean | 173 | 0.2% |
| Sioux | 16 | 0.0% |
| Slovak | 129 | 0.1% |
| Slovene | 9 | 0.0% |
| South American | 6,238 | 6.9% |
| South American Indian | 26 | 0.0% |
| Spaniard | 149 | 0.2% |
| Spanish | 17 | 0.0% |
| Sri Lankan | 1,279 | 1.4% |
| Subsaharan African | 6,662 | 7.4% |
| Swedish | 315 | 0.4% |
| Swiss | 65 | 0.1% |
| Syrian | 68 | 0.1% |
| Thai | 5,942 | 6.6% |
| Trinidadian and Tobagonian | 225 | 0.3% |
| Turkish | 152 | 0.2% |
| U.S. Virgin Islander | 4 | 0.0% |
| Ugandan | 17 | 0.0% |
| Ukrainian | 144 | 0.2% |
| Uruguayan | 14 | 0.0% |
| Venezuelan | 128 | 0.1% |
| Vietnamese | 40 | 0.0% |
| Welsh | 152 | 0.2% |
| West Indian | 601 | 0.7% |
| Yugoslavian | 66 | 0.1% |
| Zimbabwean | 12 | 0.0% | View All 122 Rows |
Immigrants in Germantown
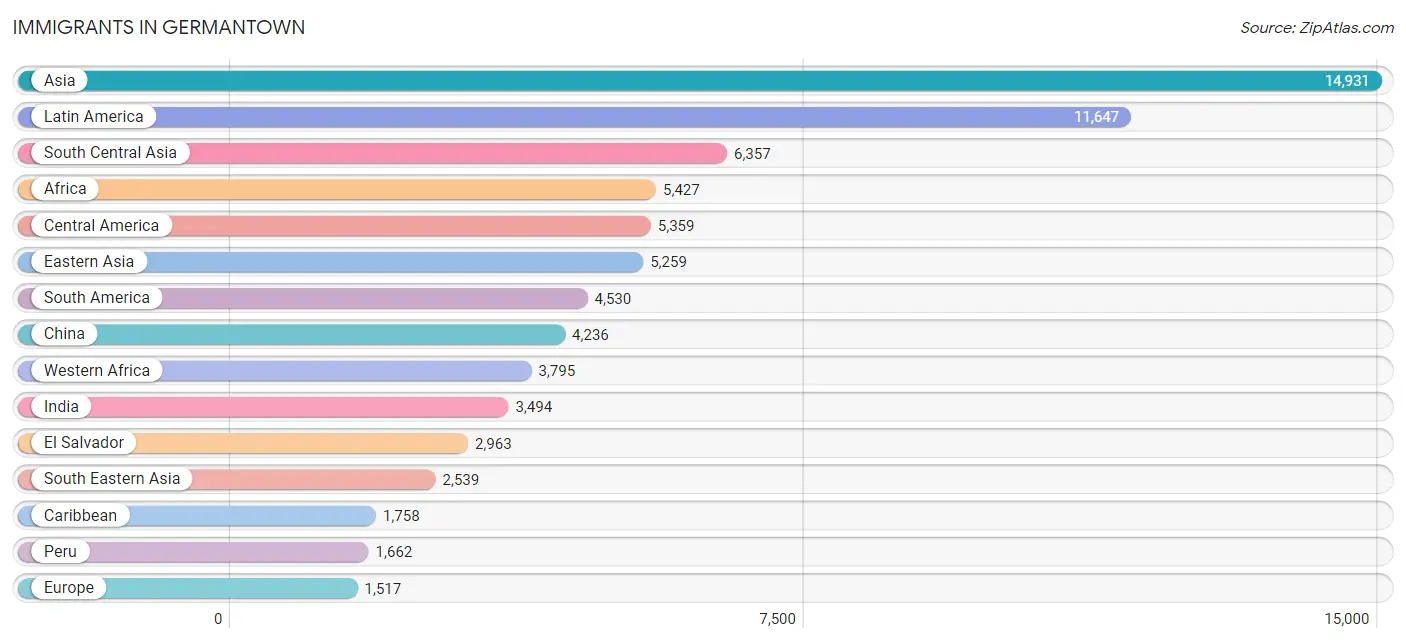
The most numerous immigrant groups reported in Germantown came from Asia (14,931 | 16.6%), Latin America (11,647 | 12.9%), South Central Asia (6,357 | 7.0%), Africa (5,427 | 6.0%), and Central America (5,359 | 5.9%), together accounting for 48.5% of all Germantown residents.
| Immigration Origin | # Population | % Population |
| Afghanistan | 6 | 0.0% |
| Africa | 5,427 | 6.0% |
| Albania | 65 | 0.1% |
| Argentina | 181 | 0.2% |
| Asia | 14,931 | 16.6% |
| Australia | 81 | 0.1% |
| Austria | 11 | 0.0% |
| Bangladesh | 368 | 0.4% |
| Barbados | 24 | 0.0% |
| Belarus | 20 | 0.0% |
| Bolivia | 881 | 1.0% |
| Bosnia and Herzegovina | 47 | 0.1% |
| Brazil | 436 | 0.5% |
| Bulgaria | 22 | 0.0% |
| Cambodia | 32 | 0.0% |
| Cameroon | 543 | 0.6% |
| Canada | 99 | 0.1% |
| Caribbean | 1,758 | 1.9% |
| Central America | 5,359 | 5.9% |
| Chile | 233 | 0.3% |
| China | 4,236 | 4.7% |
| Colombia | 397 | 0.4% |
| Congo | 34 | 0.0% |
| Cuba | 88 | 0.1% |
| Czechoslovakia | 71 | 0.1% |
| Dominican Republic | 151 | 0.2% |
| Eastern Africa | 793 | 0.9% |
| Eastern Asia | 5,259 | 5.8% |
| Eastern Europe | 777 | 0.9% |
| Ecuador | 318 | 0.4% |
| Egypt | 26 | 0.0% |
| El Salvador | 2,963 | 3.3% |
| England | 45 | 0.1% |
| Eritrea | 171 | 0.2% |
| Ethiopia | 233 | 0.3% |
| Europe | 1,517 | 1.7% |
| France | 22 | 0.0% |
| Germany | 170 | 0.2% |
| Ghana | 1,030 | 1.1% |
| Guatemala | 672 | 0.7% |
| Guyana | 280 | 0.3% |
| Haiti | 202 | 0.2% |
| Honduras | 691 | 0.8% |
| Hong Kong | 598 | 0.7% |
| India | 3,494 | 3.9% |
| Indonesia | 82 | 0.1% |
| Iran | 547 | 0.6% |
| Iraq | 278 | 0.3% |
| Israel | 25 | 0.0% |
| Italy | 25 | 0.0% |
| Jamaica | 964 | 1.1% |
| Japan | 173 | 0.2% |
| Jordan | 39 | 0.0% |
| Kazakhstan | 56 | 0.1% |
| Kenya | 209 | 0.2% |
| Korea | 850 | 0.9% |
| Kuwait | 13 | 0.0% |
| Laos | 128 | 0.1% |
| Latin America | 11,647 | 12.9% |
| Lebanon | 102 | 0.1% |
| Liberia | 289 | 0.3% |
| Malaysia | 64 | 0.1% |
| Mexico | 594 | 0.7% |
| Middle Africa | 647 | 0.7% |
| Nepal | 551 | 0.6% |
| Netherlands | 44 | 0.1% |
| Nicaragua | 327 | 0.4% |
| Nigeria | 525 | 0.6% |
| Northern Africa | 123 | 0.1% |
| Northern Europe | 173 | 0.2% |
| Oceania | 114 | 0.1% |
| Pakistan | 1,169 | 1.3% |
| Panama | 112 | 0.1% |
| Peru | 1,662 | 1.8% |
| Philippines | 1,083 | 1.2% |
| Portugal | 21 | 0.0% |
| Romania | 7 | 0.0% |
| Russia | 202 | 0.2% |
| Saudi Arabia | 8 | 0.0% |
| Senegal | 362 | 0.4% |
| Sierra Leone | 136 | 0.2% |
| Singapore | 9 | 0.0% |
| South America | 4,530 | 5.0% |
| South Central Asia | 6,357 | 7.0% |
| South Eastern Asia | 2,539 | 2.8% |
| Southern Europe | 303 | 0.3% |
| Spain | 257 | 0.3% |
| Sri Lanka | 119 | 0.1% |
| St. Vincent and the Grenadines | 59 | 0.1% |
| Sudan | 59 | 0.1% |
| Syria | 18 | 0.0% |
| Taiwan | 335 | 0.4% |
| Thailand | 119 | 0.1% |
| Trinidad and Tobago | 212 | 0.2% |
| Turkey | 10 | 0.0% |
| Uganda | 81 | 0.1% |
| Ukraine | 101 | 0.1% |
| Uruguay | 14 | 0.0% |
| Uzbekistan | 19 | 0.0% |
| Venezuela | 47 | 0.1% |
| Vietnam | 751 | 0.8% |
| West Indies | 47 | 0.1% |
| Western Africa | 3,795 | 4.2% |
| Western Asia | 725 | 0.8% |
| Western Europe | 247 | 0.3% |
| Zaire | 70 | 0.1% |
| Zimbabwe | 12 | 0.0% | View All 107 Rows |
Sex and Age in Germantown
Sex and Age in Germantown
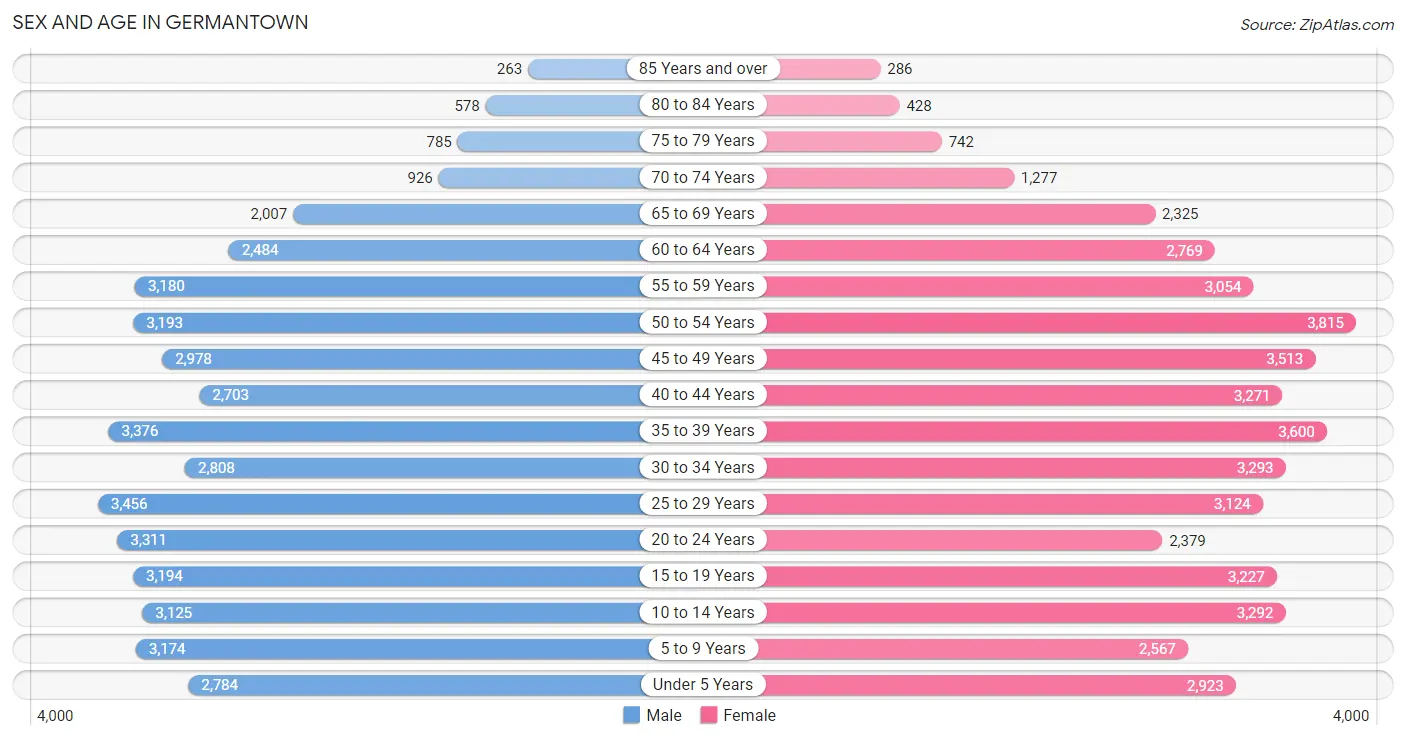
The most populous age groups in Germantown are 25 to 29 Years (3,456 | 7.8%) for men and 50 to 54 Years (3,815 | 8.3%) for women.
| Age Bracket | Male | Female |
| Under 5 Years | 2,784 (6.3%) | 2,923 (6.4%) |
| 5 to 9 Years | 3,174 (7.2%) | 2,567 (5.6%) |
| 10 to 14 Years | 3,125 (7.0%) | 3,292 (7.2%) |
| 15 to 19 Years | 3,194 (7.2%) | 3,227 (7.0%) |
| 20 to 24 Years | 3,311 (7.5%) | 2,379 (5.2%) |
| 25 to 29 Years | 3,456 (7.8%) | 3,124 (6.8%) |
| 30 to 34 Years | 2,808 (6.3%) | 3,293 (7.2%) |
| 35 to 39 Years | 3,376 (7.6%) | 3,600 (7.9%) |
| 40 to 44 Years | 2,703 (6.1%) | 3,271 (7.1%) |
| 45 to 49 Years | 2,978 (6.7%) | 3,513 (7.7%) |
| 50 to 54 Years | 3,193 (7.2%) | 3,815 (8.3%) |
| 55 to 59 Years | 3,180 (7.2%) | 3,054 (6.7%) |
| 60 to 64 Years | 2,484 (5.6%) | 2,769 (6.0%) |
| 65 to 69 Years | 2,007 (4.5%) | 2,325 (5.1%) |
| 70 to 74 Years | 926 (2.1%) | 1,277 (2.8%) |
| 75 to 79 Years | 785 (1.8%) | 742 (1.6%) |
| 80 to 84 Years | 578 (1.3%) | 428 (0.9%) |
| 85 Years and over | 263 (0.6%) | 286 (0.6%) |
| Total | 44,325 (100.0%) | 45,885 (100.0%) |
Families and Households in Germantown
Median Family Size in Germantown
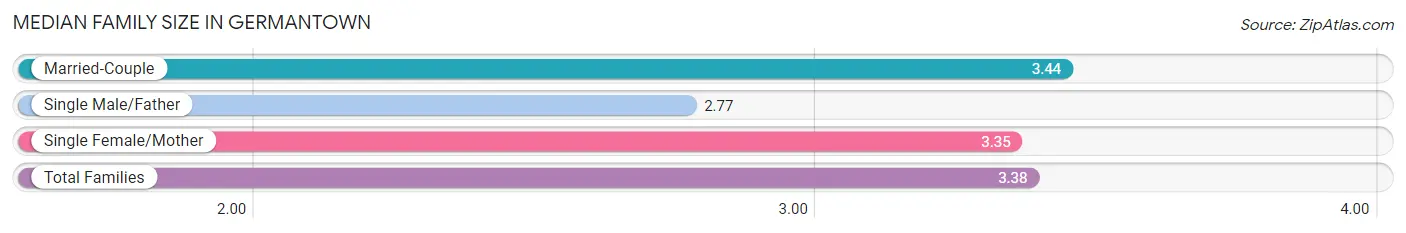
The median family size in Germantown is 3.38 persons per family, with married-couple families (16,269 | 71.3%) accounting for the largest median family size of 3.44 persons per family. On the other hand, single male/father families (1,463 | 6.4%) represent the smallest median family size with 2.77 persons per family.
| Family Type | # Families | Family Size |
| Married-Couple | 16,269 (71.3%) | 3.44 |
| Single Male/Father | 1,463 (6.4%) | 2.77 |
| Single Female/Mother | 5,100 (22.3%) | 3.35 |
| Total Families | 22,832 (100.0%) | 3.38 |
Median Household Size in Germantown
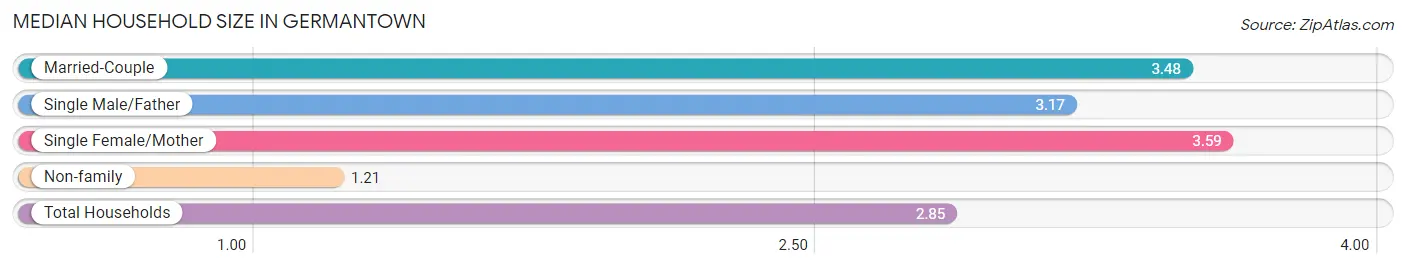
The median household size in Germantown is 2.85 persons per household, with single female/mother households (5,100 | 16.1%) accounting for the largest median household size of 3.59 persons per household. non-family households (8,796 | 27.8%) represent the smallest median household size with 1.21 persons per household.
| Household Type | # Households | Household Size |
| Married-Couple | 16,269 (51.4%) | 3.48 |
| Single Male/Father | 1,463 (4.6%) | 3.17 |
| Single Female/Mother | 5,100 (16.1%) | 3.59 |
| Non-family | 8,796 (27.8%) | 1.21 |
| Total Households | 31,628 (100.0%) | 2.85 |
Household Size by Marriage Status in Germantown
Out of a total of 31,628 households in Germantown, 22,832 (72.2%) are family households, while 8,796 (27.8%) are nonfamily households. The most numerous type of family households are 2-person households, comprising 7,670, and the most common type of nonfamily households are 1-person households, comprising 7,501.
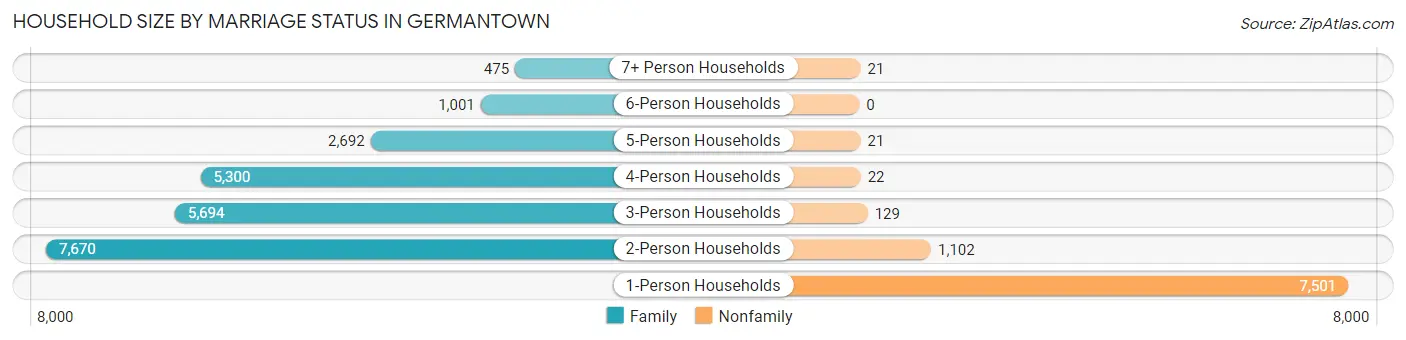
| Household Size | Family Households | Nonfamily Households |
| 1-Person Households | - | 7,501 (23.7%) |
| 2-Person Households | 7,670 (24.2%) | 1,102 (3.5%) |
| 3-Person Households | 5,694 (18.0%) | 129 (0.4%) |
| 4-Person Households | 5,300 (16.8%) | 22 (0.1%) |
| 5-Person Households | 2,692 (8.5%) | 21 (0.1%) |
| 6-Person Households | 1,001 (3.2%) | 0 (0.0%) |
| 7+ Person Households | 475 (1.5%) | 21 (0.1%) |
| Total | 22,832 (72.2%) | 8,796 (27.8%) |
Female Fertility in Germantown
Fertility by Age in Germantown
Average fertility rate in Germantown is 45.0 births per 1,000 women. Women in the age bracket of 20 to 34 years have the highest fertility rate with 73.0 births per 1,000 women. Women in the age bracket of 20 to 34 years acount for 61.5% of all women with births.
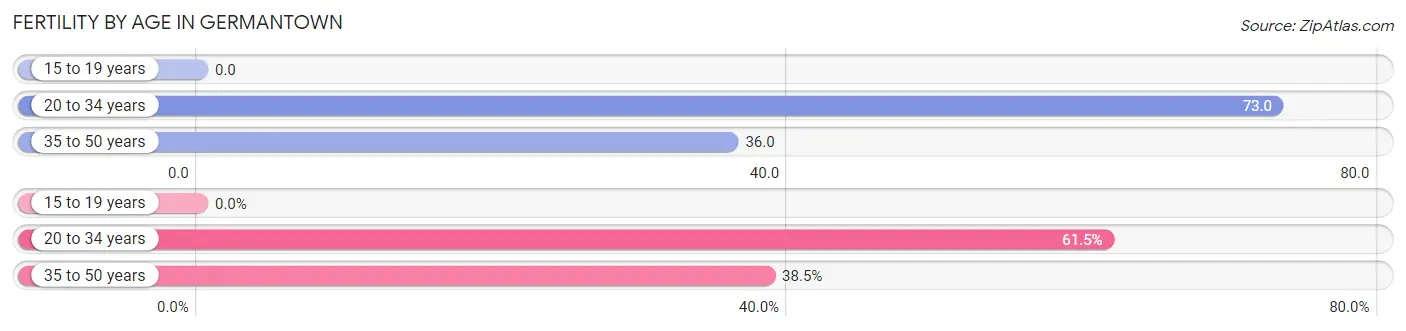
| Age Bracket | Women with Births | Births / 1,000 Women |
| 15 to 19 years | 0 (0.0%) | 0.0 |
| 20 to 34 years | 644 (61.5%) | 73.0 |
| 35 to 50 years | 403 (38.5%) | 36.0 |
| Total | 1,047 (100.0%) | 45.0 |
Fertility by Age by Marriage Status in Germantown
73.8% of women with births (1,047) in Germantown are married. The highest percentage of unmarried women with births falls into 20 to 34 years age bracket with 26.7% of them unmarried at the time of birth, while the lowest percentage of unmarried women with births belong to 35 to 50 years age bracket with 25.3% of them unmarried.
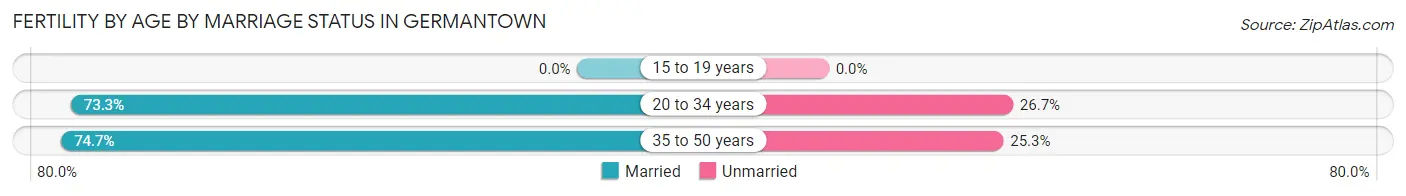
| Age Bracket | Married | Unmarried |
| 15 to 19 years | 0 (0.0%) | 0 (0.0%) |
| 20 to 34 years | 472 (73.3%) | 172 (26.7%) |
| 35 to 50 years | 301 (74.7%) | 102 (25.3%) |
| Total | 773 (73.8%) | 274 (26.2%) |
Fertility by Education in Germantown
Average fertility rate in Germantown is 45.0 births per 1,000 women. Women with the education attainment of bachelor's degree have the highest fertility rate of 54.0 births per 1,000 women, while women with the education attainment of less than high school have the lowest fertility at 36.0 births per 1,000 women. Women with the education attainment of bachelor's degree represent 28.6% of all women with births.
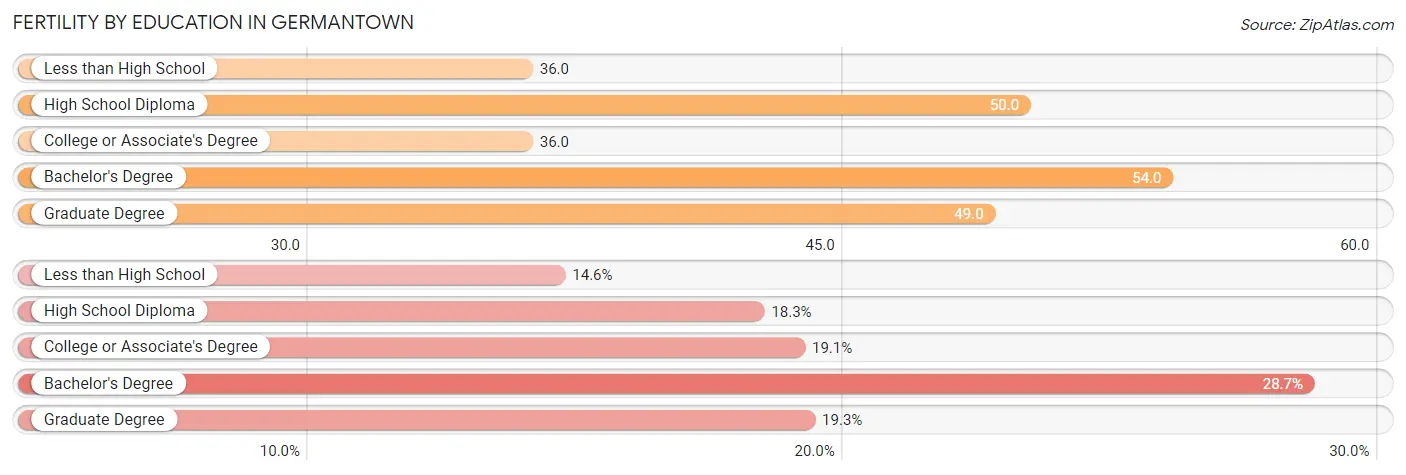
| Educational Attainment | Women with Births | Births / 1,000 Women |
| Less than High School | 153 (14.6%) | 36.0 |
| High School Diploma | 192 (18.3%) | 50.0 |
| College or Associate's Degree | 200 (19.1%) | 36.0 |
| Bachelor's Degree | 300 (28.6%) | 54.0 |
| Graduate Degree | 202 (19.3%) | 49.0 |
| Total | 1,047 (100.0%) | 45.0 |
Fertility by Education by Marriage Status in Germantown
26.2% of women with births in Germantown are unmarried. Women with the educational attainment of graduate degree are most likely to be married with 100.0% of them married at childbirth, while women with the educational attainment of college or associate's degree are least likely to be married with 59.0% of them unmarried at childbirth.
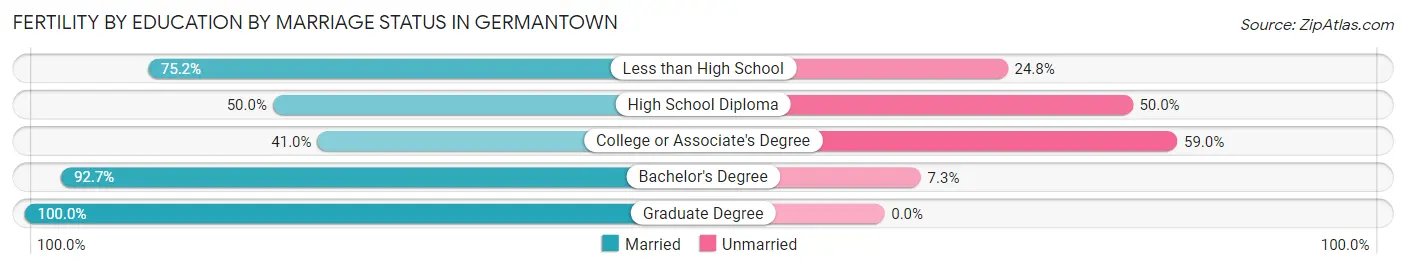
| Educational Attainment | Married | Unmarried |
| Less than High School | 115 (75.2%) | 38 (24.8%) |
| High School Diploma | 96 (50.0%) | 96 (50.0%) |
| College or Associate's Degree | 82 (41.0%) | 118 (59.0%) |
| Bachelor's Degree | 278 (92.7%) | 22 (7.3%) |
| Graduate Degree | 202 (100.0%) | 0 (0.0%) |
| Total | 773 (73.8%) | 274 (26.2%) |
Employment Characteristics in Germantown
Employment by Class of Employer in Germantown
Among the 49,076 employed individuals in Germantown, private company employees (30,744 | 62.6%), federal government employees (5,673 | 11.6%), and not-for-profit organizations (4,189 | 8.5%) make up the most common classes of employment.
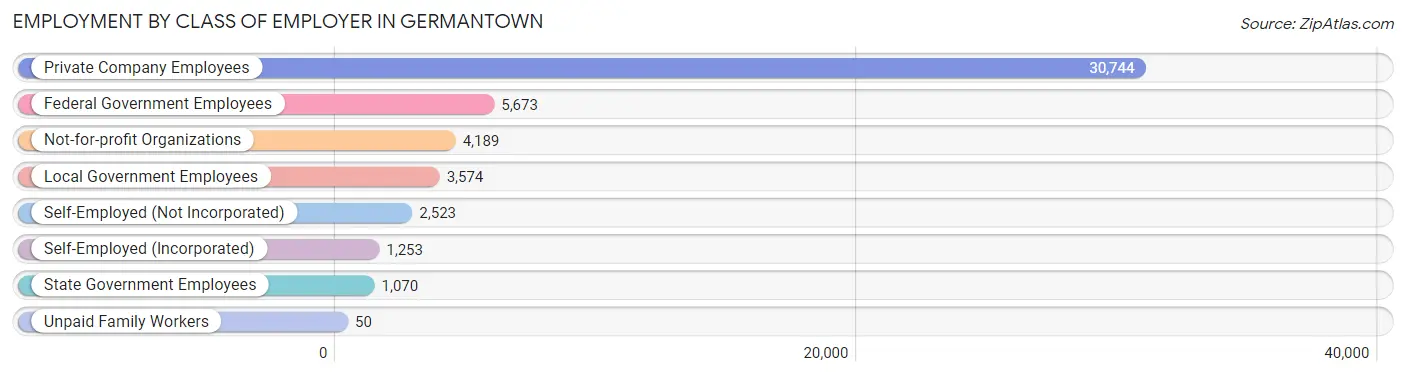
| Employer Class | # Employees | % Employees |
| Private Company Employees | 30,744 | 62.6% |
| Self-Employed (Incorporated) | 1,253 | 2.5% |
| Self-Employed (Not Incorporated) | 2,523 | 5.1% |
| Not-for-profit Organizations | 4,189 | 8.5% |
| Local Government Employees | 3,574 | 7.3% |
| State Government Employees | 1,070 | 2.2% |
| Federal Government Employees | 5,673 | 11.6% |
| Unpaid Family Workers | 50 | 0.1% |
| Total | 49,076 | 100.0% |
Employment Status by Age in Germantown
According to the labor force statistics for Germantown, out of the total population over 16 years of age (71,353), 74.3% or 53,015 individuals are in the labor force, with 5.2% or 2,757 of them unemployed. The age group with the highest labor force participation rate is 35 to 44 years, with 87.7% or 11,357 individuals in the labor force. Within the labor force, the 16 to 19 years age range has the highest percentage of unemployed individuals, with 17.5% or 302 of them being unemployed.
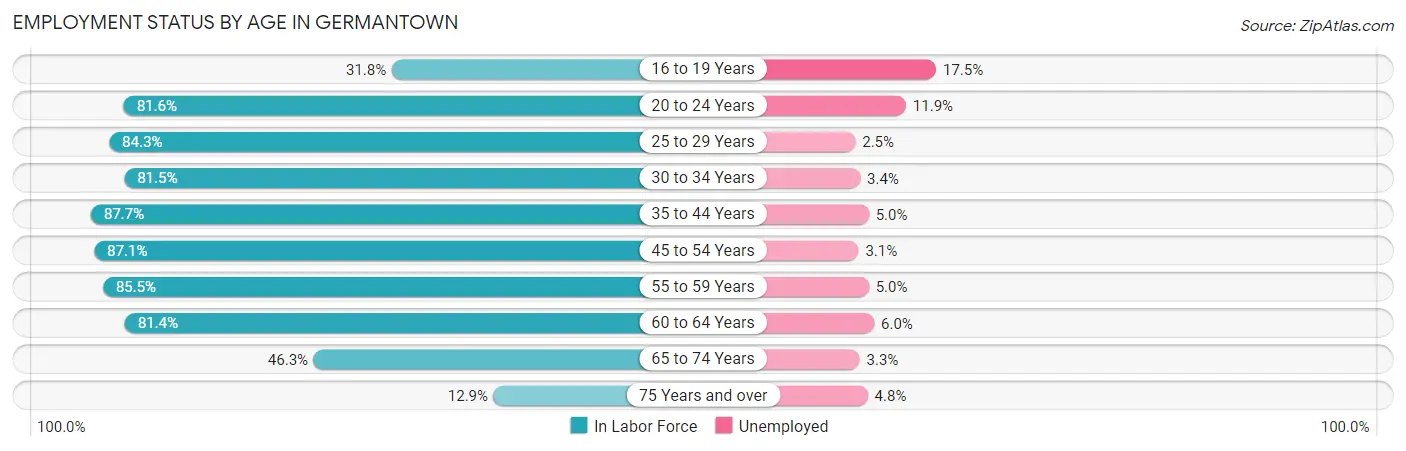
| Age Bracket | In Labor Force | Unemployed |
| 16 to 19 Years | 1,726 (31.8%) | 302 (17.5%) |
| 20 to 24 Years | 4,643 (81.6%) | 553 (11.9%) |
| 25 to 29 Years | 5,547 (84.3%) | 139 (2.5%) |
| 30 to 34 Years | 4,972 (81.5%) | 169 (3.4%) |
| 35 to 44 Years | 11,357 (87.7%) | 568 (5.0%) |
| 45 to 54 Years | 11,758 (87.1%) | 364 (3.1%) |
| 55 to 59 Years | 5,330 (85.5%) | 266 (5.0%) |
| 60 to 64 Years | 4,276 (81.4%) | 257 (6.0%) |
| 65 to 74 Years | 3,026 (46.3%) | 100 (3.3%) |
| 75 Years and over | 398 (12.9%) | 19 (4.8%) |
| Total | 53,015 (74.3%) | 2,757 (5.2%) |
Employment Status by Educational Attainment in Germantown
According to labor force statistics for Germantown, 85.4% of individuals (43,227) out of the total population between 25 and 64 years of age (50,617) are in the labor force, with 4.1% or 1,772 of them being unemployed. The group with the highest labor force participation rate are those with the educational attainment of bachelor's degree or higher, with 90.6% or 22,998 individuals in the labor force. Within the labor force, individuals with college / associate degree education have the highest percentage of unemployment, with 5.6% or 599 of them being unemployed.
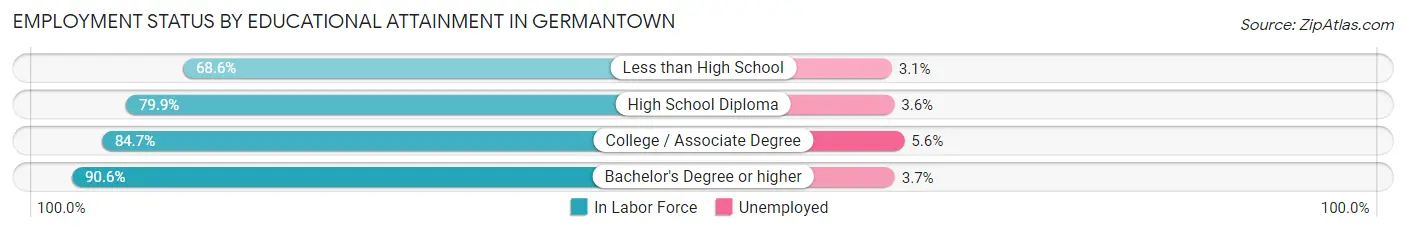
| Educational Attainment | In Labor Force | Unemployed |
| Less than High School | 3,093 (68.6%) | 140 (3.1%) |
| High School Diploma | 6,470 (79.9%) | 292 (3.6%) |
| College / Associate Degree | 10,694 (84.7%) | 707 (5.6%) |
| Bachelor's Degree or higher | 22,998 (90.6%) | 939 (3.7%) |
| Total | 43,227 (85.4%) | 2,075 (4.1%) |
Employment Occupations by Sex in Germantown
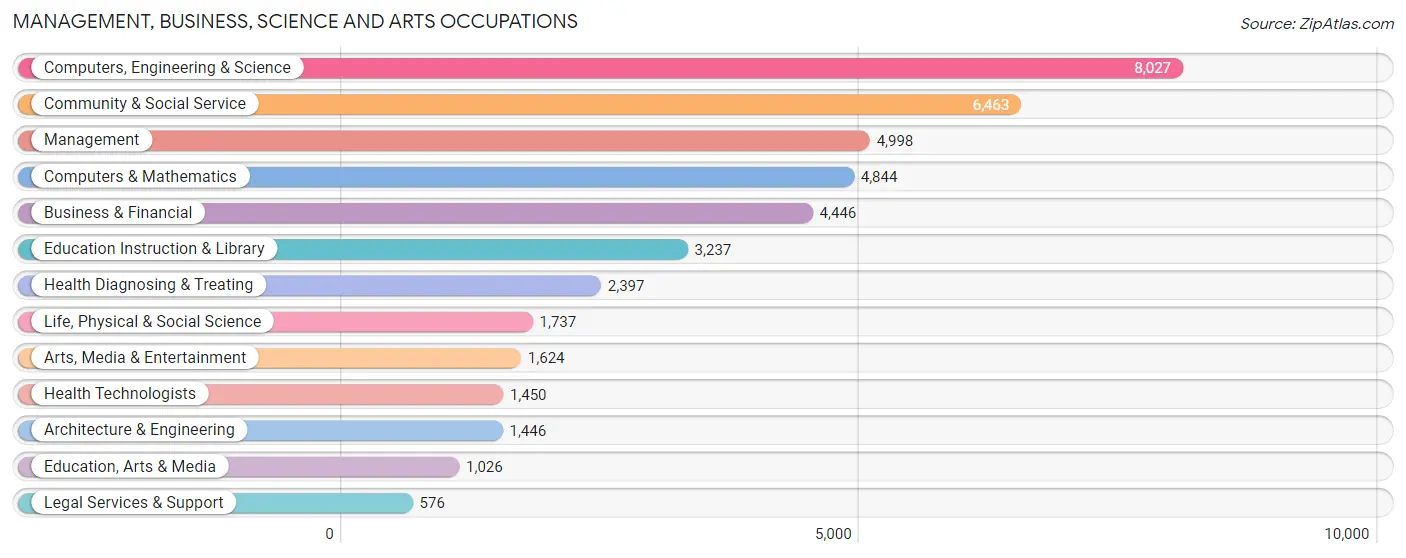
Management, Business, Science and Arts Occupations
The most common Management, Business, Science and Arts occupations in Germantown are Computers, Engineering & Science (8,027 | 16.1%), Community & Social Service (6,463 | 12.9%), Management (4,998 | 10.0%), Computers & Mathematics (4,844 | 9.7%), and Business & Financial (4,446 | 8.9%).
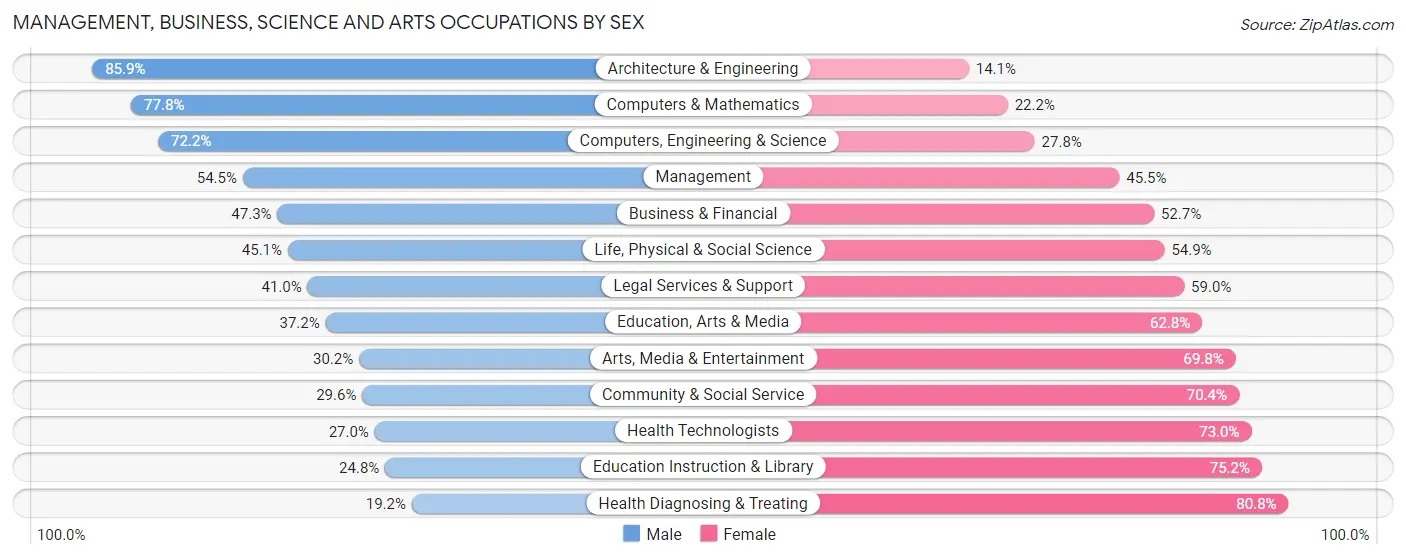
Management, Business, Science and Arts Occupations by Sex
Within the Management, Business, Science and Arts occupations in Germantown, the most male-oriented occupations are Architecture & Engineering (85.9%), Computers & Mathematics (77.8%), and Computers, Engineering & Science (72.2%), while the most female-oriented occupations are Health Diagnosing & Treating (80.8%), Education Instruction & Library (75.2%), and Health Technologists (73.0%).
| Occupation | Male | Female |
| Management | 2,723 (54.5%) | 2,275 (45.5%) |
| Business & Financial | 2,101 (47.3%) | 2,345 (52.7%) |
| Computers, Engineering & Science | 5,792 (72.2%) | 2,235 (27.8%) |
| Computers & Mathematics | 3,767 (77.8%) | 1,077 (22.2%) |
| Architecture & Engineering | 1,242 (85.9%) | 204 (14.1%) |
| Life, Physical & Social Science | 783 (45.1%) | 954 (54.9%) |
| Community & Social Service | 1,911 (29.6%) | 4,552 (70.4%) |
| Education, Arts & Media | 382 (37.2%) | 644 (62.8%) |
| Legal Services & Support | 236 (41.0%) | 340 (59.0%) |
| Education Instruction & Library | 802 (24.8%) | 2,435 (75.2%) |
| Arts, Media & Entertainment | 491 (30.2%) | 1,133 (69.8%) |
| Health Diagnosing & Treating | 461 (19.2%) | 1,936 (80.8%) |
| Health Technologists | 391 (27.0%) | 1,059 (73.0%) |
| Total (Category) | 12,988 (49.3%) | 13,343 (50.7%) |
| Total (Overall) | 25,271 (50.5%) | 24,755 (49.5%) |
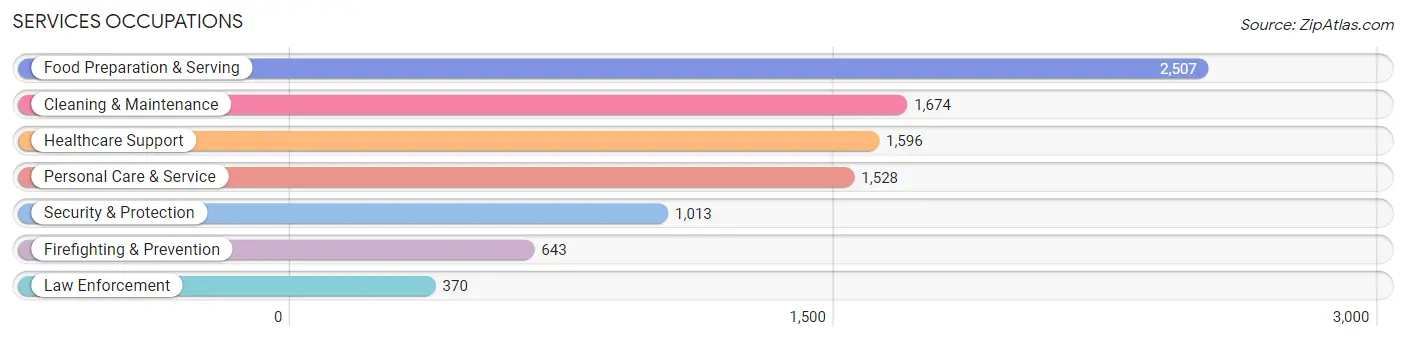
Services Occupations
The most common Services occupations in Germantown are Food Preparation & Serving (2,507 | 5.0%), Cleaning & Maintenance (1,674 | 3.4%), Healthcare Support (1,596 | 3.2%), Personal Care & Service (1,528 | 3.0%), and Security & Protection (1,013 | 2.0%).
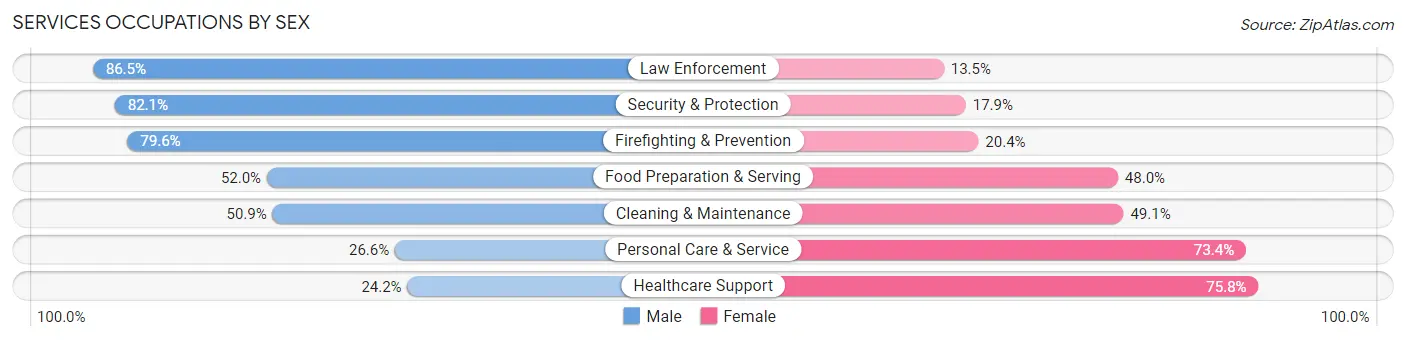
Services Occupations by Sex
Within the Services occupations in Germantown, the most male-oriented occupations are Law Enforcement (86.5%), Security & Protection (82.1%), and Firefighting & Prevention (79.6%), while the most female-oriented occupations are Healthcare Support (75.8%), Personal Care & Service (73.4%), and Cleaning & Maintenance (49.1%).
| Occupation | Male | Female |
| Healthcare Support | 386 (24.2%) | 1,210 (75.8%) |
| Security & Protection | 832 (82.1%) | 181 (17.9%) |
| Firefighting & Prevention | 512 (79.6%) | 131 (20.4%) |
| Law Enforcement | 320 (86.5%) | 50 (13.5%) |
| Food Preparation & Serving | 1,304 (52.0%) | 1,203 (48.0%) |
| Cleaning & Maintenance | 852 (50.9%) | 822 (49.1%) |
| Personal Care & Service | 407 (26.6%) | 1,121 (73.4%) |
| Total (Category) | 3,781 (45.5%) | 4,537 (54.5%) |
| Total (Overall) | 25,271 (50.5%) | 24,755 (49.5%) |
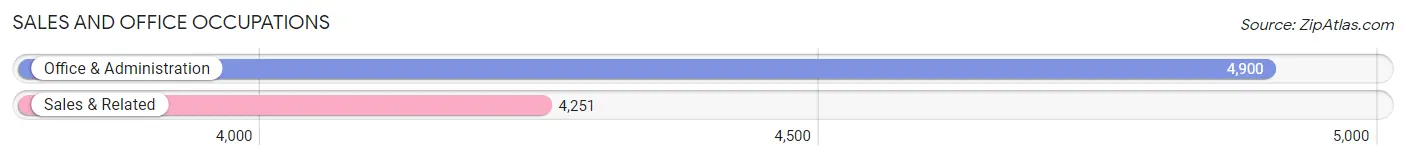
Sales and Office Occupations
The most common Sales and Office occupations in Germantown are Office & Administration (4,900 | 9.8%), and Sales & Related (4,251 | 8.5%).
Sales and Office Occupations by Sex
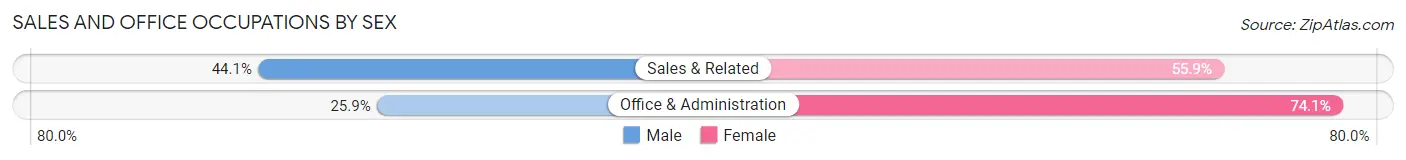
| Occupation | Male | Female |
| Sales & Related | 1,876 (44.1%) | 2,375 (55.9%) |
| Office & Administration | 1,267 (25.9%) | 3,633 (74.1%) |
| Total (Category) | 3,143 (34.4%) | 6,008 (65.6%) |
| Total (Overall) | 25,271 (50.5%) | 24,755 (49.5%) |
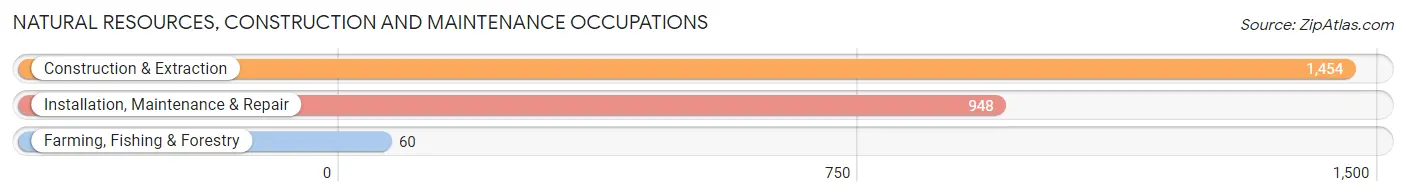
Natural Resources, Construction and Maintenance Occupations
The most common Natural Resources, Construction and Maintenance occupations in Germantown are Construction & Extraction (1,454 | 2.9%), Installation, Maintenance & Repair (948 | 1.9%), and Farming, Fishing & Forestry (60 | 0.1%).
Natural Resources, Construction and Maintenance Occupations by Sex
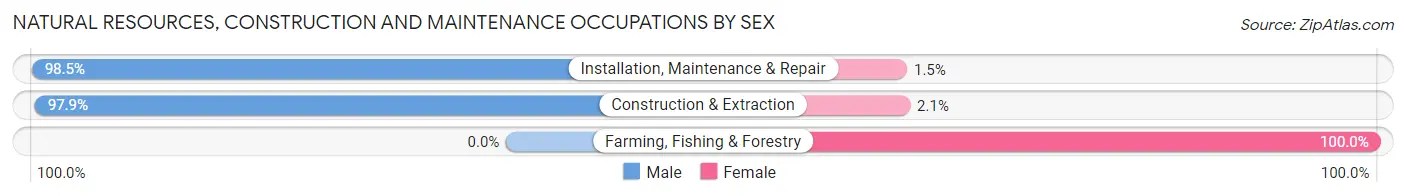
| Occupation | Male | Female |
| Farming, Fishing & Forestry | 0 (0.0%) | 60 (100.0%) |
| Construction & Extraction | 1,423 (97.9%) | 31 (2.1%) |
| Installation, Maintenance & Repair | 934 (98.5%) | 14 (1.5%) |
| Total (Category) | 2,357 (95.7%) | 105 (4.3%) |
| Total (Overall) | 25,271 (50.5%) | 24,755 (49.5%) |
Production, Transportation and Moving Occupations
The most common Production, Transportation and Moving occupations in Germantown are Material Moving (1,303 | 2.6%), Transportation (1,231 | 2.5%), and Production (1,230 | 2.5%).
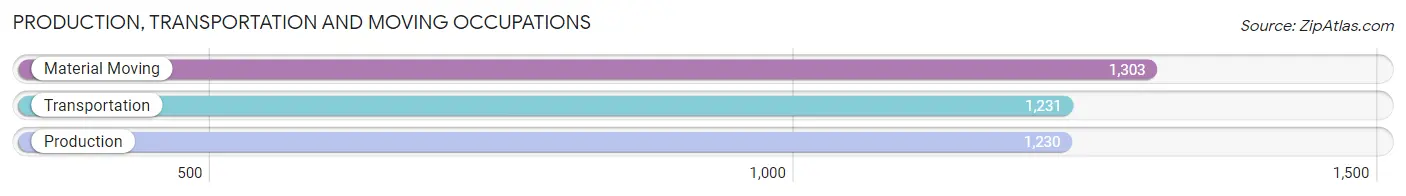
Production, Transportation and Moving Occupations by Sex
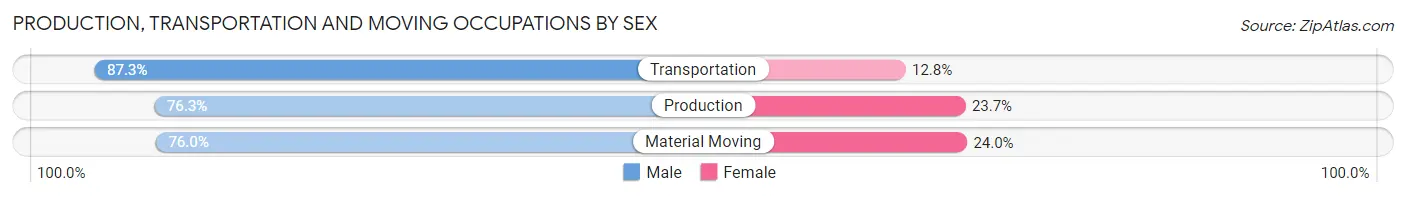
| Occupation | Male | Female |
| Production | 938 (76.3%) | 292 (23.7%) |
| Transportation | 1,074 (87.3%) | 157 (12.8%) |
| Material Moving | 990 (76.0%) | 313 (24.0%) |
| Total (Category) | 3,002 (79.8%) | 762 (20.2%) |
| Total (Overall) | 25,271 (50.5%) | 24,755 (49.5%) |
Employment Industries by Sex in Germantown
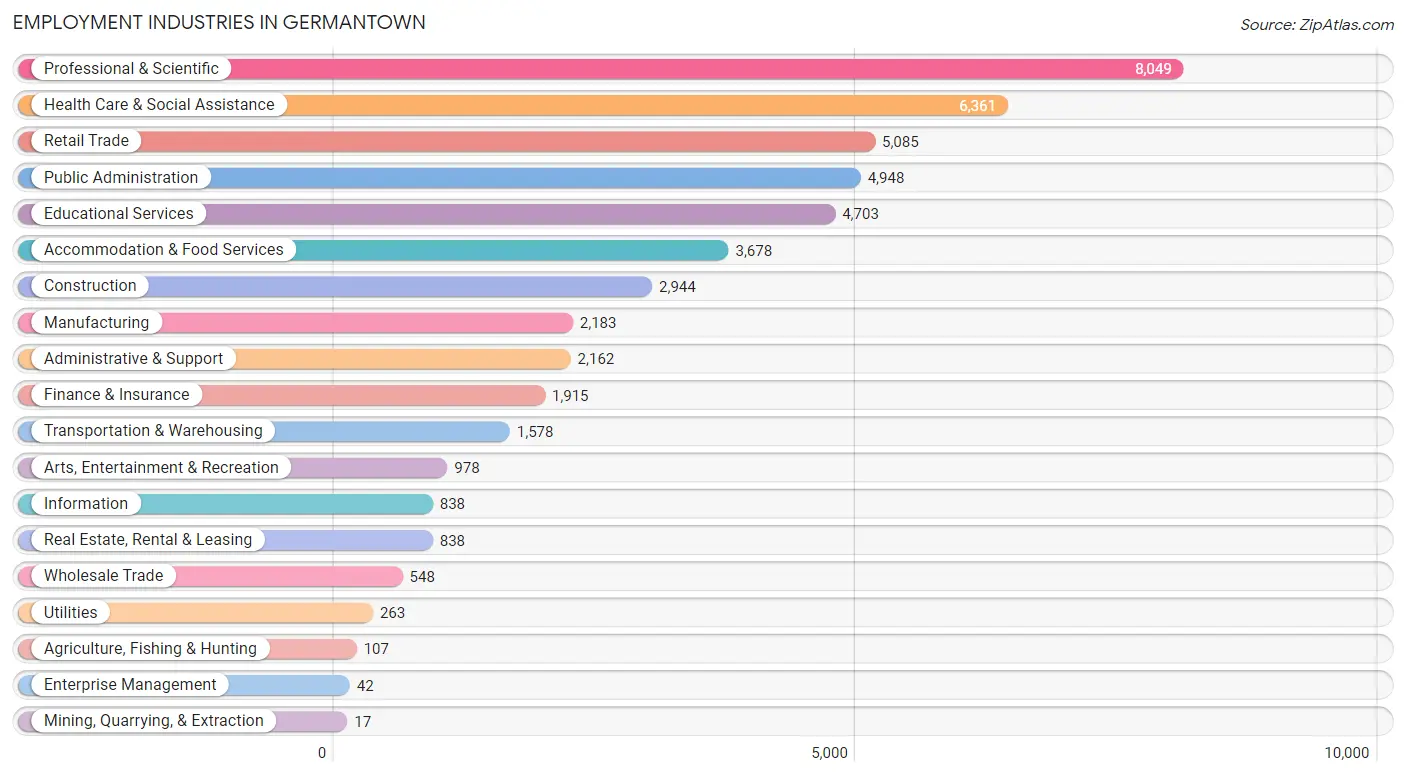
Employment Industries in Germantown
The major employment industries in Germantown include Professional & Scientific (8,049 | 16.1%), Health Care & Social Assistance (6,361 | 12.7%), Retail Trade (5,085 | 10.2%), Public Administration (4,948 | 9.9%), and Educational Services (4,703 | 9.4%).
Employment Industries by Sex in Germantown
The Germantown industries that see more men than women are Mining, Quarrying, & Extraction (100.0%), Transportation & Warehousing (84.9%), and Construction (80.3%), whereas the industries that tend to have a higher number of women are Enterprise Management (100.0%), Health Care & Social Assistance (78.1%), and Educational Services (64.8%).
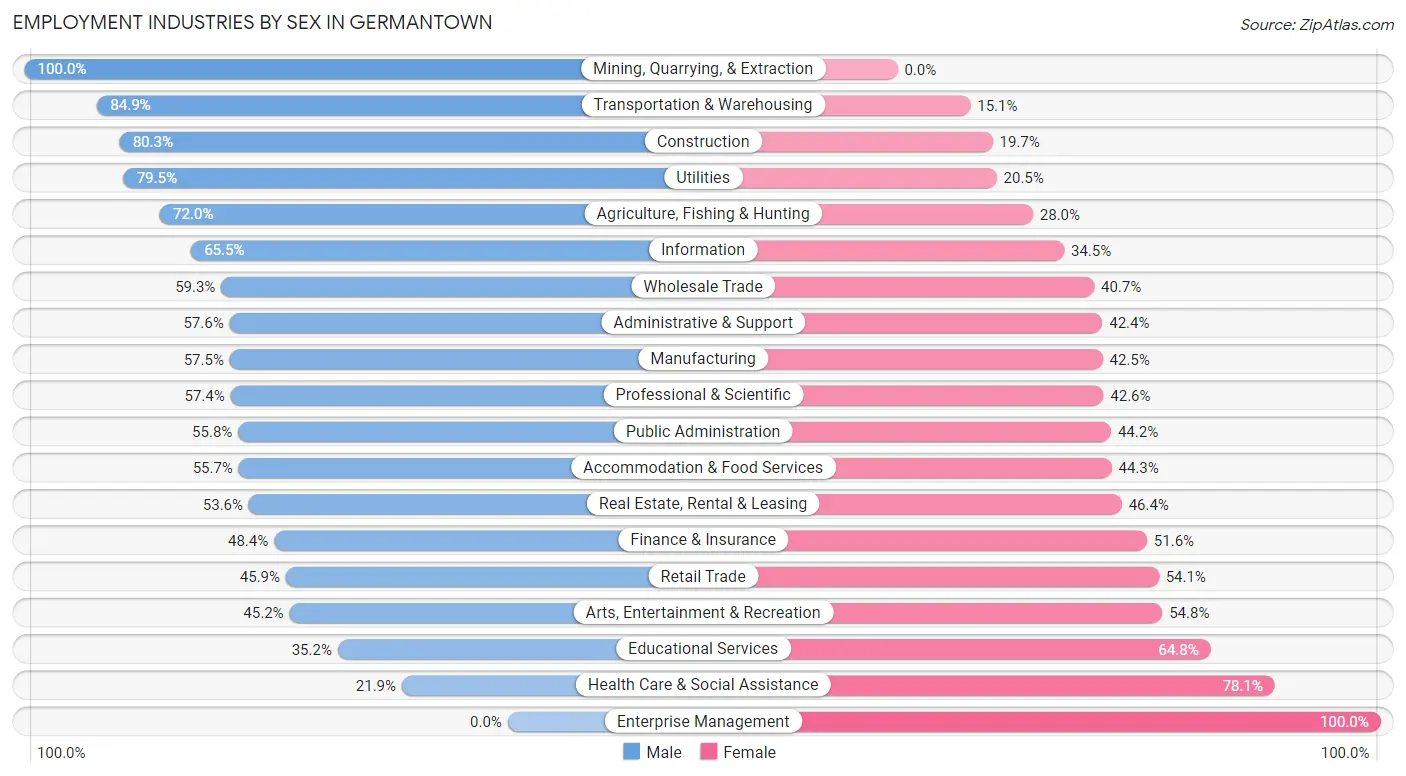
| Industry | Male | Female |
| Agriculture, Fishing & Hunting | 77 (72.0%) | 30 (28.0%) |
| Mining, Quarrying, & Extraction | 17 (100.0%) | 0 (0.0%) |
| Construction | 2,364 (80.3%) | 580 (19.7%) |
| Manufacturing | 1,256 (57.5%) | 927 (42.5%) |
| Wholesale Trade | 325 (59.3%) | 223 (40.7%) |
| Retail Trade | 2,335 (45.9%) | 2,750 (54.1%) |
| Transportation & Warehousing | 1,340 (84.9%) | 238 (15.1%) |
| Utilities | 209 (79.5%) | 54 (20.5%) |
| Information | 549 (65.5%) | 289 (34.5%) |
| Finance & Insurance | 926 (48.4%) | 989 (51.6%) |
| Real Estate, Rental & Leasing | 449 (53.6%) | 389 (46.4%) |
| Professional & Scientific | 4,618 (57.4%) | 3,431 (42.6%) |
| Enterprise Management | 0 (0.0%) | 42 (100.0%) |
| Administrative & Support | 1,245 (57.6%) | 917 (42.4%) |
| Educational Services | 1,655 (35.2%) | 3,048 (64.8%) |
| Health Care & Social Assistance | 1,394 (21.9%) | 4,967 (78.1%) |
| Arts, Entertainment & Recreation | 442 (45.2%) | 536 (54.8%) |
| Accommodation & Food Services | 2,048 (55.7%) | 1,630 (44.3%) |
| Public Administration | 2,761 (55.8%) | 2,187 (44.2%) |
| Total | 25,271 (50.5%) | 24,755 (49.5%) |
Education in Germantown
School Enrollment in Germantown
The most common levels of schooling among the 24,033 students in Germantown are high school (5,446 | 22.7%), college / undergraduate (5,192 | 21.6%), and middle school (5,125 | 21.3%).
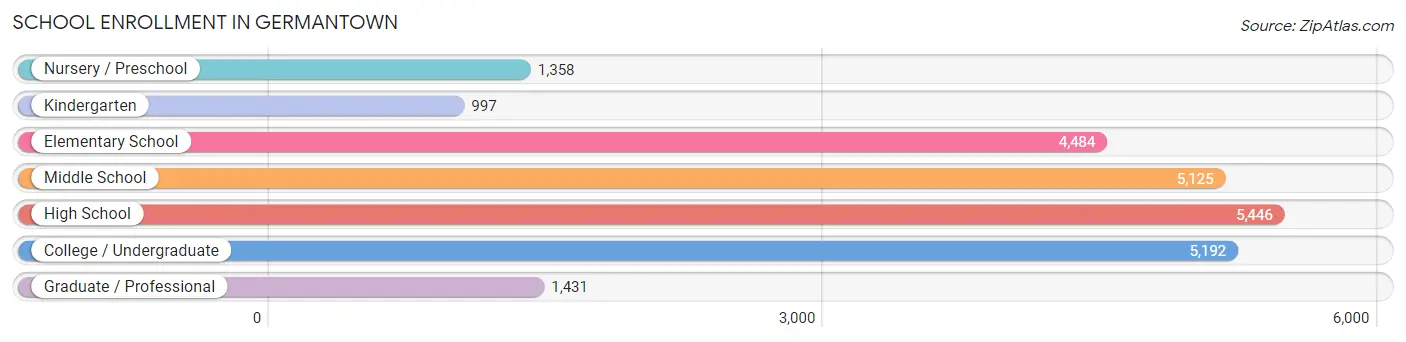
| School Level | # Students | % Students |
| Nursery / Preschool | 1,358 | 5.7% |
| Kindergarten | 997 | 4.2% |
| Elementary School | 4,484 | 18.7% |
| Middle School | 5,125 | 21.3% |
| High School | 5,446 | 22.7% |
| College / Undergraduate | 5,192 | 21.6% |
| Graduate / Professional | 1,431 | 5.9% |
| Total | 24,033 | 100.0% |
School Enrollment by Age by Funding Source in Germantown
Out of a total of 24,033 students who are enrolled in schools in Germantown, 3,220 (13.4%) attend a private institution, while the remaining 20,813 (86.6%) are enrolled in public schools. The age group of 3 to 4 year olds has the highest likelihood of being enrolled in private schools, with 387 (47.8% in the age bracket) enrolled. Conversely, the age group of 15 to 17 year olds has the lowest likelihood of being enrolled in a private school, with 3,762 (96.1% in the age bracket) attending a public institution.
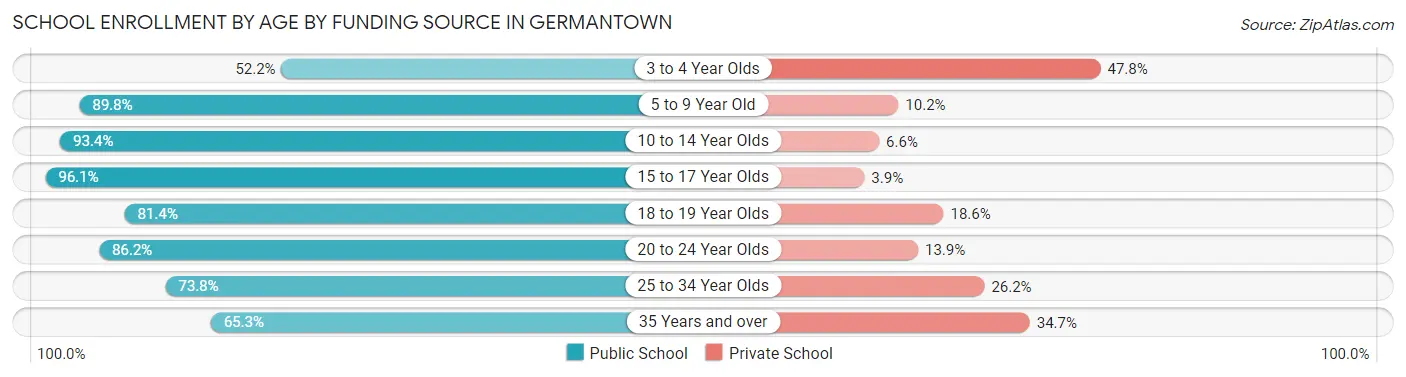
| Age Bracket | Public School | Private School |
| 3 to 4 Year Olds | 422 (52.2%) | 387 (47.8%) |
| 5 to 9 Year Old | 4,900 (89.8%) | 556 (10.2%) |
| 10 to 14 Year Olds | 5,849 (93.4%) | 414 (6.6%) |
| 15 to 17 Year Olds | 3,762 (96.1%) | 151 (3.9%) |
| 18 to 19 Year Olds | 1,579 (81.4%) | 361 (18.6%) |
| 20 to 24 Year Olds | 1,916 (86.2%) | 308 (13.9%) |
| 25 to 34 Year Olds | 1,297 (73.8%) | 461 (26.2%) |
| 35 Years and over | 1,091 (65.3%) | 579 (34.7%) |
| Total | 20,813 (86.6%) | 3,220 (13.4%) |
Educational Attainment by Field of Study in Germantown
Business (5,374 | 17.0%), engineering (3,564 | 11.3%), computers & mathematics (3,558 | 11.2%), bio, nature & agricultural (2,837 | 9.0%), and science & technology (2,768 | 8.7%) are the most common fields of study among 31,648 individuals in Germantown who have obtained a bachelor's degree or higher.
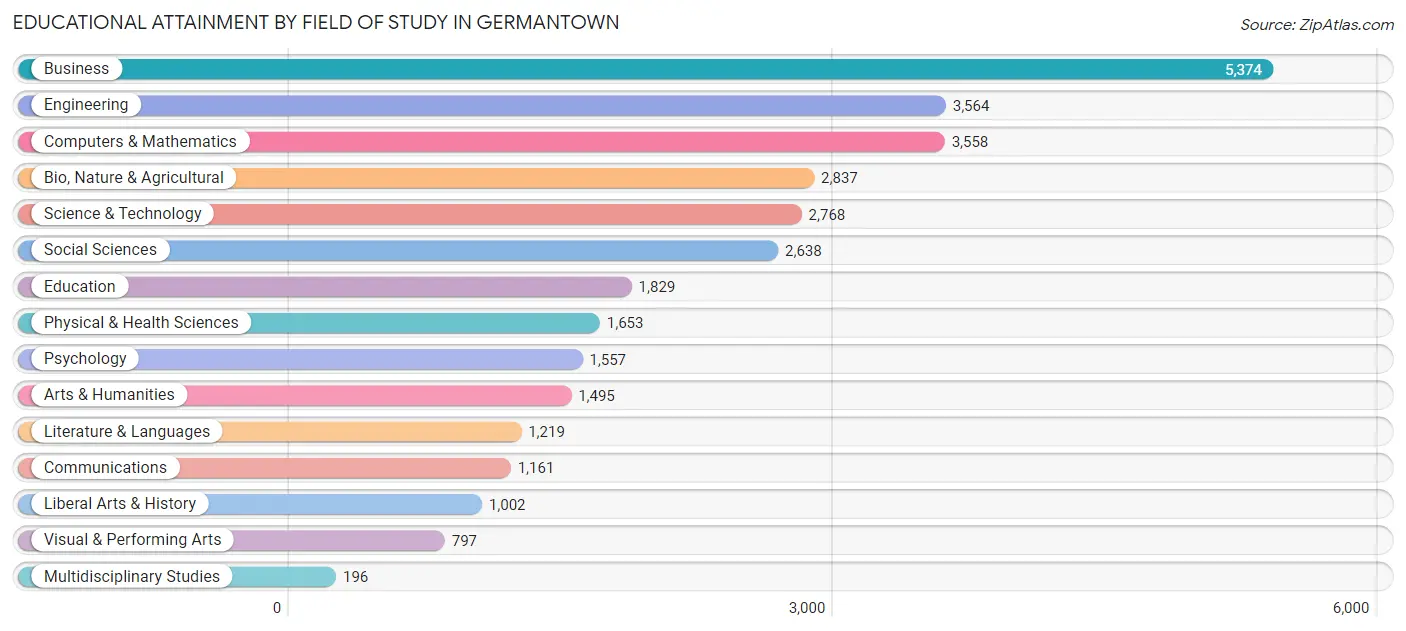
| Field of Study | # Graduates | % Graduates |
| Computers & Mathematics | 3,558 | 11.2% |
| Bio, Nature & Agricultural | 2,837 | 9.0% |
| Physical & Health Sciences | 1,653 | 5.2% |
| Psychology | 1,557 | 4.9% |
| Social Sciences | 2,638 | 8.3% |
| Engineering | 3,564 | 11.3% |
| Multidisciplinary Studies | 196 | 0.6% |
| Science & Technology | 2,768 | 8.7% |
| Business | 5,374 | 17.0% |
| Education | 1,829 | 5.8% |
| Literature & Languages | 1,219 | 3.8% |
| Liberal Arts & History | 1,002 | 3.2% |
| Visual & Performing Arts | 797 | 2.5% |
| Communications | 1,161 | 3.7% |
| Arts & Humanities | 1,495 | 4.7% |
| Total | 31,648 | 100.0% |
Transportation & Commute in Germantown
Vehicle Availability by Sex in Germantown
The most prevalent vehicle ownership categories in Germantown are males with 2 vehicles (11,712, accounting for 46.8%) and females with 2 vehicles (10,384, making up 48.7%).
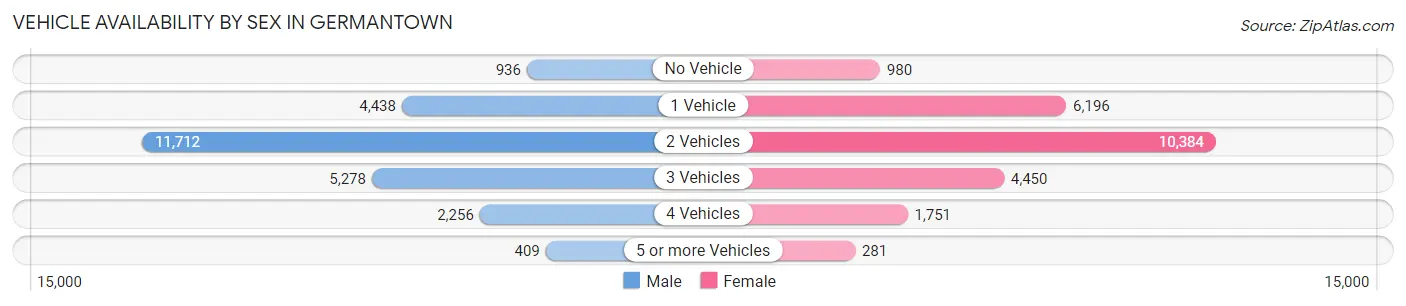
| Vehicles Available | Male | Female |
| No Vehicle | 936 (3.7%) | 980 (4.1%) |
| 1 Vehicle | 4,438 (17.7%) | 6,196 (25.8%) |
| 2 Vehicles | 11,712 (46.8%) | 10,384 (43.2%) |
| 3 Vehicles | 5,278 (21.1%) | 4,450 (18.5%) |
| 4 Vehicles | 2,256 (9.0%) | 1,751 (7.3%) |
| 5 or more Vehicles | 409 (1.6%) | 281 (1.2%) |
| Total | 25,029 (100.0%) | 24,042 (100.0%) |
Commute Time in Germantown
The most frequently occuring commute durations in Germantown are 30 to 34 minutes (6,823 commuters, 16.7%), 15 to 19 minutes (5,286 commuters, 12.9%), and 60 to 89 minutes (5,210 commuters, 12.7%).
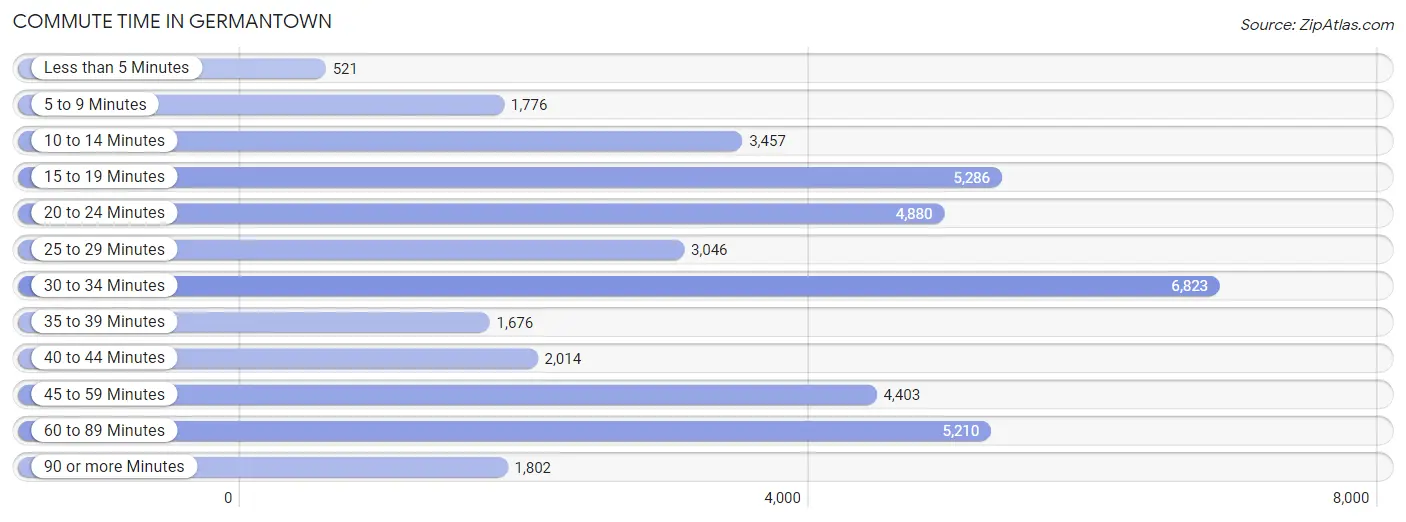
| Commute Time | # Commuters | % Commuters |
| Less than 5 Minutes | 521 | 1.3% |
| 5 to 9 Minutes | 1,776 | 4.3% |
| 10 to 14 Minutes | 3,457 | 8.5% |
| 15 to 19 Minutes | 5,286 | 12.9% |
| 20 to 24 Minutes | 4,880 | 11.9% |
| 25 to 29 Minutes | 3,046 | 7.4% |
| 30 to 34 Minutes | 6,823 | 16.7% |
| 35 to 39 Minutes | 1,676 | 4.1% |
| 40 to 44 Minutes | 2,014 | 4.9% |
| 45 to 59 Minutes | 4,403 | 10.8% |
| 60 to 89 Minutes | 5,210 | 12.7% |
| 90 or more Minutes | 1,802 | 4.4% |
Commute Time by Sex in Germantown
The most common commute times in Germantown are 60 to 89 minutes (3,261 commuters, 15.5%) for males and 30 to 34 minutes (3,613 commuters, 18.2%) for females.
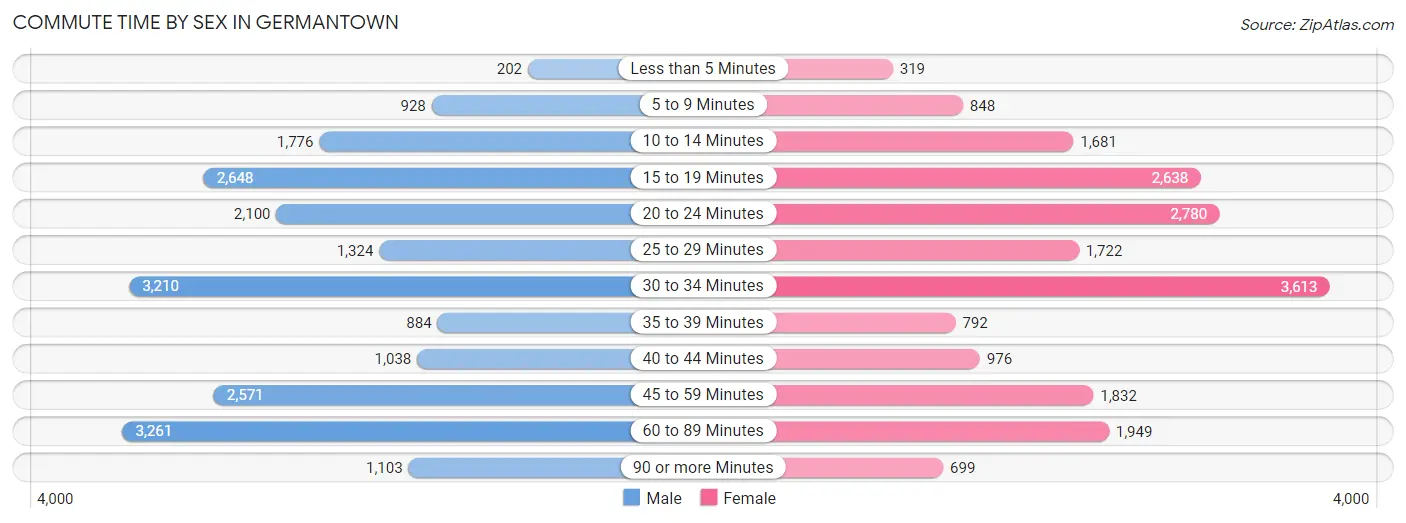
| Commute Time | Male | Female |
| Less than 5 Minutes | 202 (1.0%) | 319 (1.6%) |
| 5 to 9 Minutes | 928 (4.4%) | 848 (4.3%) |
| 10 to 14 Minutes | 1,776 (8.4%) | 1,681 (8.5%) |
| 15 to 19 Minutes | 2,648 (12.6%) | 2,638 (13.3%) |
| 20 to 24 Minutes | 2,100 (10.0%) | 2,780 (14.0%) |
| 25 to 29 Minutes | 1,324 (6.3%) | 1,722 (8.7%) |
| 30 to 34 Minutes | 3,210 (15.2%) | 3,613 (18.2%) |
| 35 to 39 Minutes | 884 (4.2%) | 792 (4.0%) |
| 40 to 44 Minutes | 1,038 (4.9%) | 976 (4.9%) |
| 45 to 59 Minutes | 2,571 (12.2%) | 1,832 (9.2%) |
| 60 to 89 Minutes | 3,261 (15.5%) | 1,949 (9.8%) |
| 90 or more Minutes | 1,103 (5.2%) | 699 (3.5%) |
Time of Departure to Work by Sex in Germantown
The most frequent times of departure to work in Germantown are 7:30 AM to 7:59 AM (2,504, 11.9%) for males and 8:00 AM to 8:29 AM (2,875, 14.5%) for females.
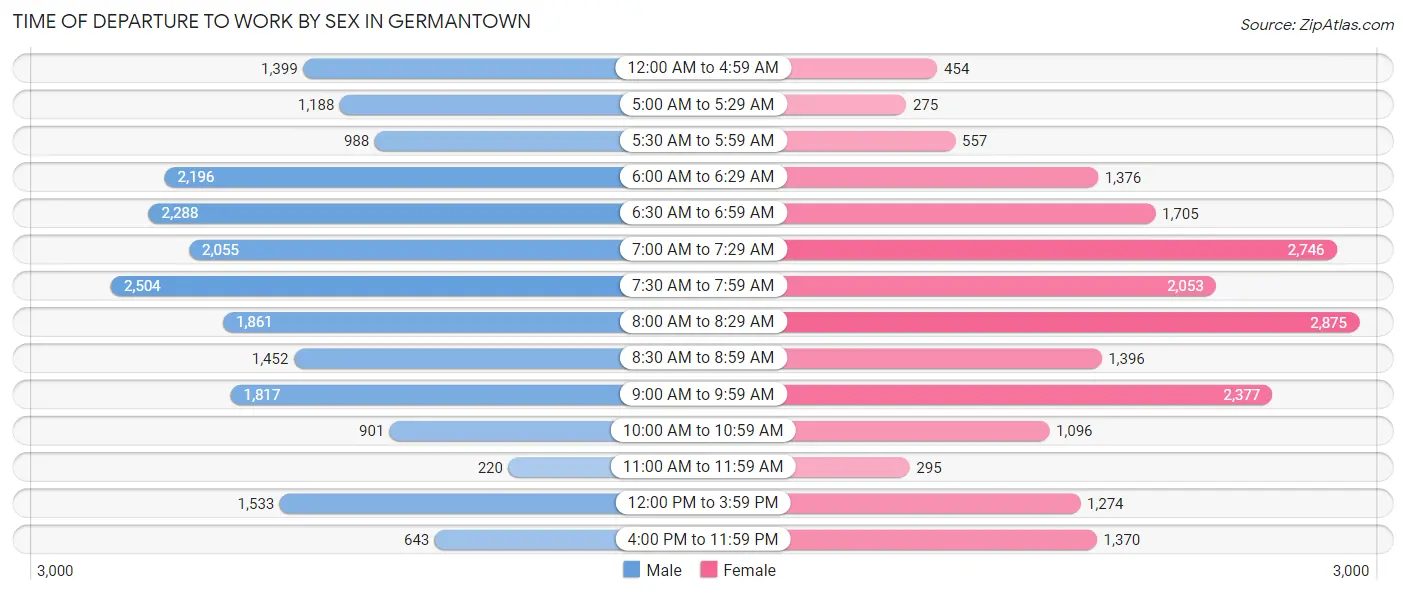
| Time of Departure | Male | Female |
| 12:00 AM to 4:59 AM | 1,399 (6.7%) | 454 (2.3%) |
| 5:00 AM to 5:29 AM | 1,188 (5.7%) | 275 (1.4%) |
| 5:30 AM to 5:59 AM | 988 (4.7%) | 557 (2.8%) |
| 6:00 AM to 6:29 AM | 2,196 (10.4%) | 1,376 (6.9%) |
| 6:30 AM to 6:59 AM | 2,288 (10.9%) | 1,705 (8.6%) |
| 7:00 AM to 7:29 AM | 2,055 (9.8%) | 2,746 (13.8%) |
| 7:30 AM to 7:59 AM | 2,504 (11.9%) | 2,053 (10.3%) |
| 8:00 AM to 8:29 AM | 1,861 (8.8%) | 2,875 (14.5%) |
| 8:30 AM to 8:59 AM | 1,452 (6.9%) | 1,396 (7.0%) |
| 9:00 AM to 9:59 AM | 1,817 (8.6%) | 2,377 (12.0%) |
| 10:00 AM to 10:59 AM | 901 (4.3%) | 1,096 (5.5%) |
| 11:00 AM to 11:59 AM | 220 (1.1%) | 295 (1.5%) |
| 12:00 PM to 3:59 PM | 1,533 (7.3%) | 1,274 (6.4%) |
| 4:00 PM to 11:59 PM | 643 (3.1%) | 1,370 (6.9%) |
| Total | 21,045 (100.0%) | 19,849 (100.0%) |
Housing Occupancy in Germantown
Occupancy by Ownership in Germantown
Of the total 31,628 dwellings in Germantown, owner-occupied units account for 20,833 (65.9%), while renter-occupied units make up 10,795 (34.1%).
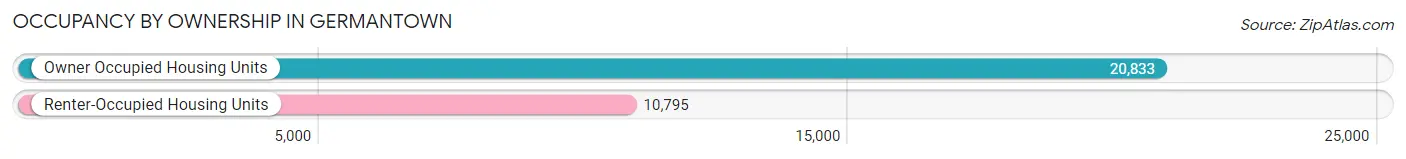
| Occupancy | # Housing Units | % Housing Units |
| Owner Occupied Housing Units | 20,833 | 65.9% |
| Renter-Occupied Housing Units | 10,795 | 34.1% |
| Total Occupied Housing Units | 31,628 | 100.0% |
Occupancy by Household Size in Germantown
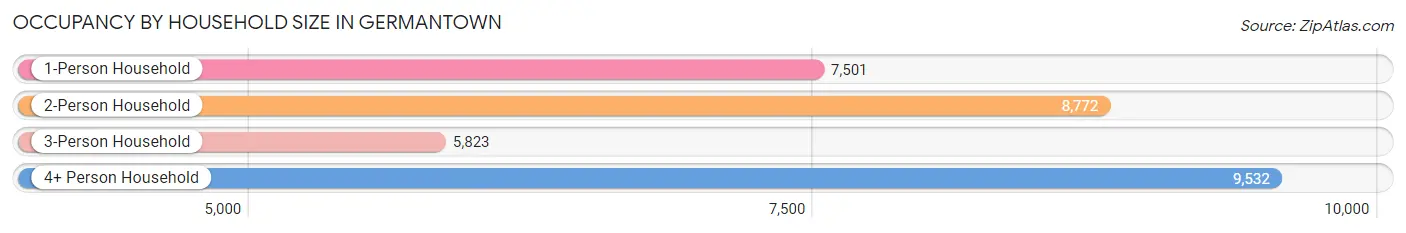
| Household Size | # Housing Units | % Housing Units |
| 1-Person Household | 7,501 | 23.7% |
| 2-Person Household | 8,772 | 27.7% |
| 3-Person Household | 5,823 | 18.4% |
| 4+ Person Household | 9,532 | 30.1% |
| Total Housing Units | 31,628 | 100.0% |
Occupancy by Ownership by Household Size in Germantown
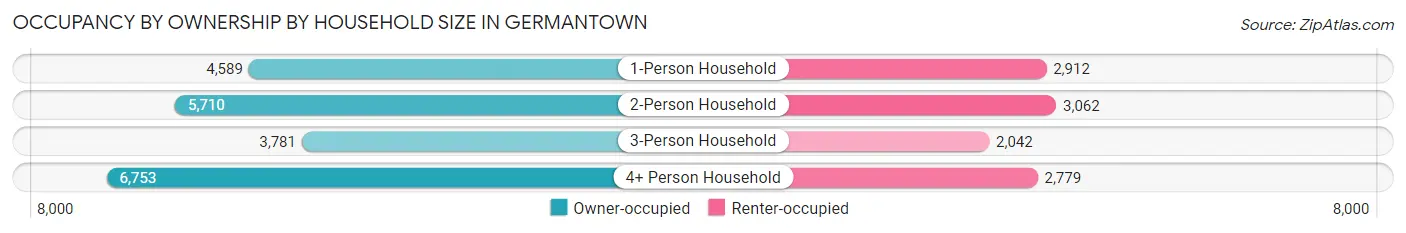
| Household Size | Owner-occupied | Renter-occupied |
| 1-Person Household | 4,589 (61.2%) | 2,912 (38.8%) |
| 2-Person Household | 5,710 (65.1%) | 3,062 (34.9%) |
| 3-Person Household | 3,781 (64.9%) | 2,042 (35.1%) |
| 4+ Person Household | 6,753 (70.9%) | 2,779 (29.1%) |
| Total Housing Units | 20,833 (65.9%) | 10,795 (34.1%) |
Occupancy by Educational Attainment in Germantown
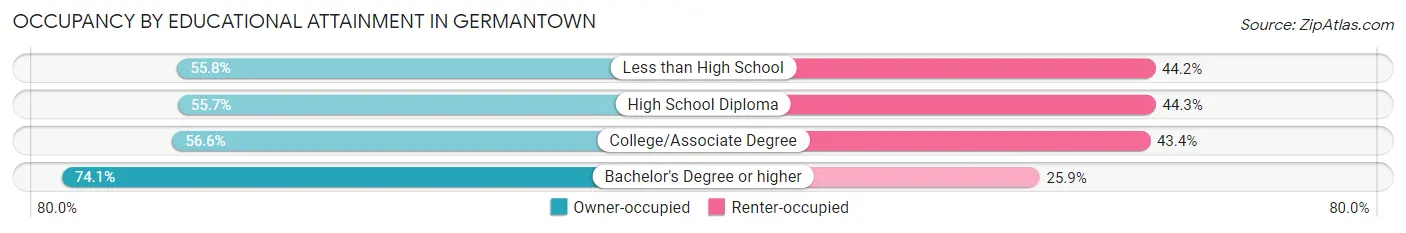
| Household Size | Owner-occupied | Renter-occupied |
| Less than High School | 1,227 (55.8%) | 973 (44.2%) |
| High School Diploma | 2,449 (55.7%) | 1,949 (44.3%) |
| College/Associate Degree | 4,480 (56.6%) | 3,440 (43.4%) |
| Bachelor's Degree or higher | 12,677 (74.1%) | 4,433 (25.9%) |
Occupancy by Age of Householder in Germantown
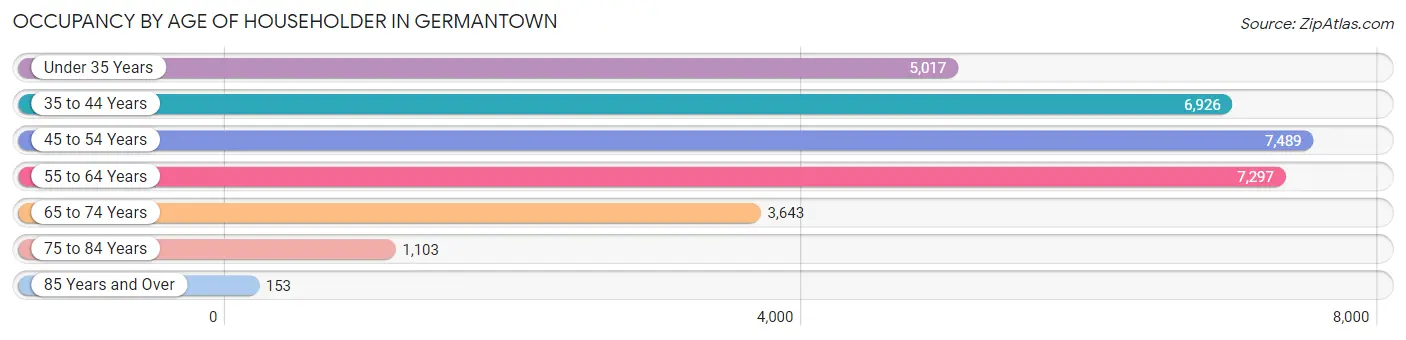
| Age Bracket | # Households | % Households |
| Under 35 Years | 5,017 | 15.9% |
| 35 to 44 Years | 6,926 | 21.9% |
| 45 to 54 Years | 7,489 | 23.7% |
| 55 to 64 Years | 7,297 | 23.1% |
| 65 to 74 Years | 3,643 | 11.5% |
| 75 to 84 Years | 1,103 | 3.5% |
| 85 Years and Over | 153 | 0.5% |
| Total | 31,628 | 100.0% |
Housing Finances in Germantown
Median Income by Occupancy in Germantown
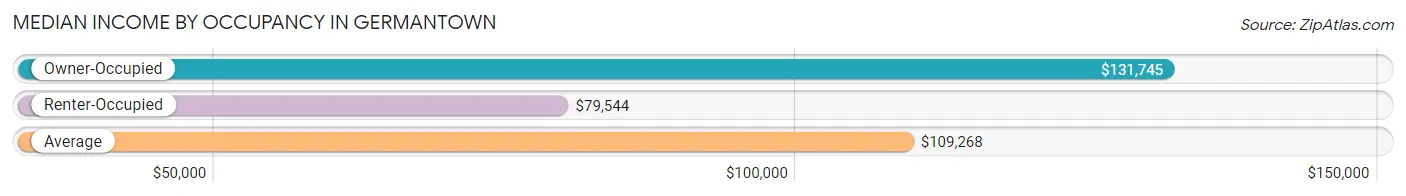
| Occupancy Type | # Households | Median Income |
| Owner-Occupied | 20,833 (65.9%) | $131,745 |
| Renter-Occupied | 10,795 (34.1%) | $79,544 |
| Average | 31,628 (100.0%) | $109,268 |
Occupancy by Householder Income Bracket in Germantown
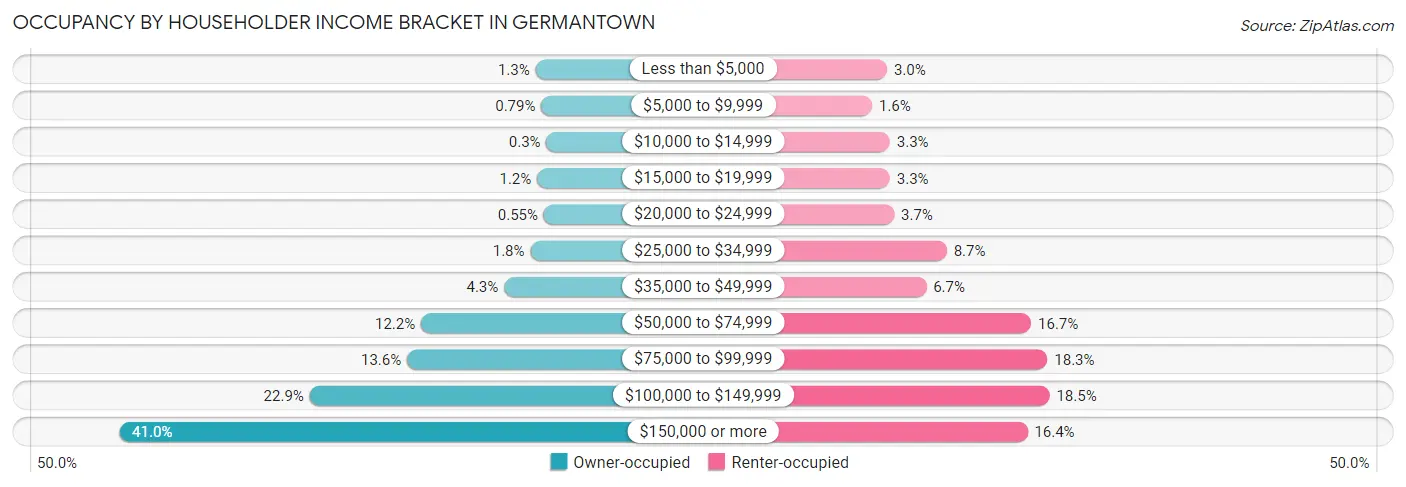
| Income Bracket | Owner-occupied | Renter-occupied |
| Less than $5,000 | 280 (1.3%) | 323 (3.0%) |
| $5,000 to $9,999 | 164 (0.8%) | 169 (1.6%) |
| $10,000 to $14,999 | 62 (0.3%) | 353 (3.3%) |
| $15,000 to $19,999 | 248 (1.2%) | 353 (3.3%) |
| $20,000 to $24,999 | 114 (0.5%) | 396 (3.7%) |
| $25,000 to $34,999 | 382 (1.8%) | 937 (8.7%) |
| $35,000 to $49,999 | 903 (4.3%) | 726 (6.7%) |
| $50,000 to $74,999 | 2,549 (12.2%) | 1,805 (16.7%) |
| $75,000 to $99,999 | 2,830 (13.6%) | 1,972 (18.3%) |
| $100,000 to $149,999 | 4,761 (22.9%) | 1,994 (18.5%) |
| $150,000 or more | 8,540 (41.0%) | 1,767 (16.4%) |
| Total | 20,833 (100.0%) | 10,795 (100.0%) |
Monthly Housing Cost Tiers in Germantown
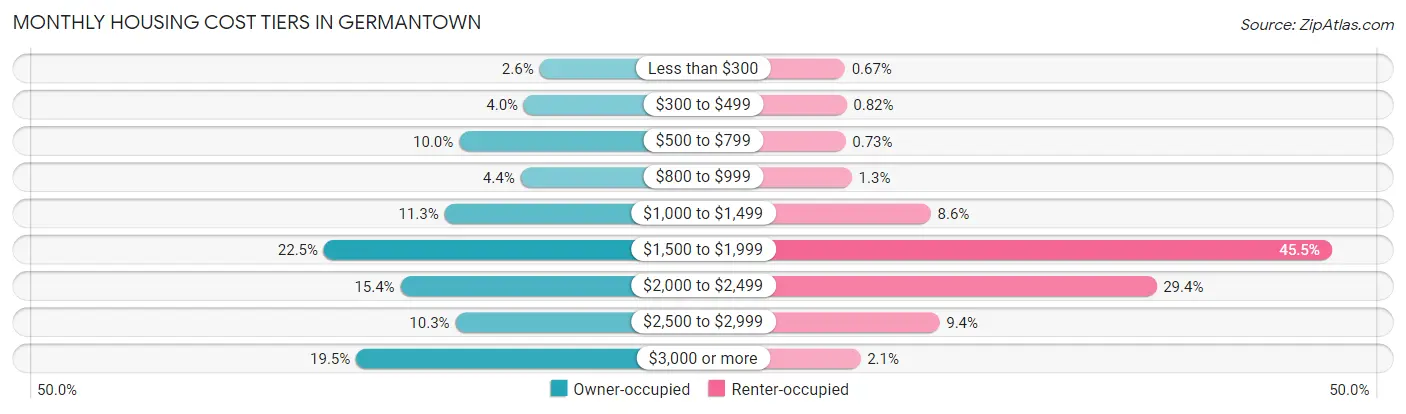
| Monthly Cost | Owner-occupied | Renter-occupied |
| Less than $300 | 542 (2.6%) | 72 (0.7%) |
| $300 to $499 | 839 (4.0%) | 88 (0.8%) |
| $500 to $799 | 2,084 (10.0%) | 79 (0.7%) |
| $800 to $999 | 907 (4.3%) | 141 (1.3%) |
| $1,000 to $1,499 | 2,362 (11.3%) | 926 (8.6%) |
| $1,500 to $1,999 | 4,677 (22.5%) | 4,911 (45.5%) |
| $2,000 to $2,499 | 3,209 (15.4%) | 3,168 (29.3%) |
| $2,500 to $2,999 | 2,155 (10.3%) | 1,013 (9.4%) |
| $3,000 or more | 4,058 (19.5%) | 227 (2.1%) |
| Total | 20,833 (100.0%) | 10,795 (100.0%) |
Physical Housing Characteristics in Germantown
Housing Structures in Germantown
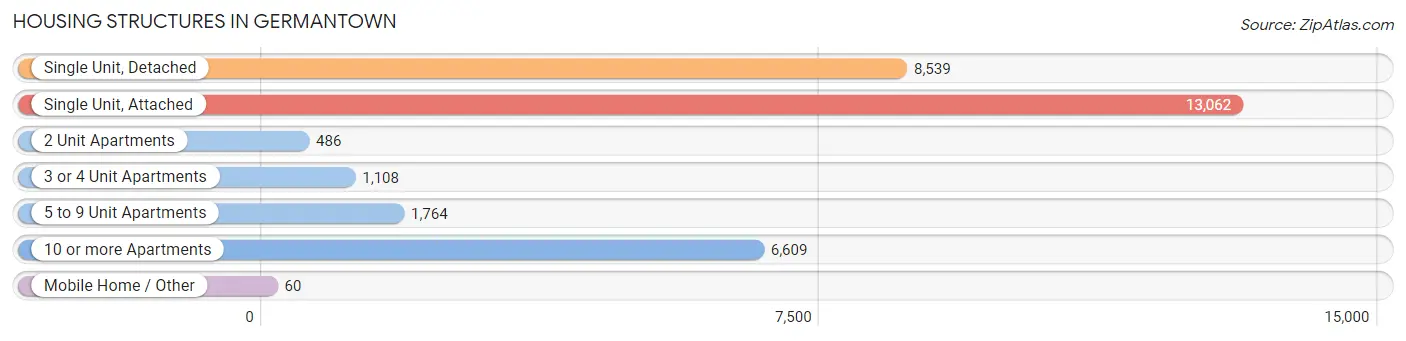
| Structure Type | # Housing Units | % Housing Units |
| Single Unit, Detached | 8,539 | 27.0% |
| Single Unit, Attached | 13,062 | 41.3% |
| 2 Unit Apartments | 486 | 1.5% |
| 3 or 4 Unit Apartments | 1,108 | 3.5% |
| 5 to 9 Unit Apartments | 1,764 | 5.6% |
| 10 or more Apartments | 6,609 | 20.9% |
| Mobile Home / Other | 60 | 0.2% |
| Total | 31,628 | 100.0% |
Housing Structures by Occupancy in Germantown
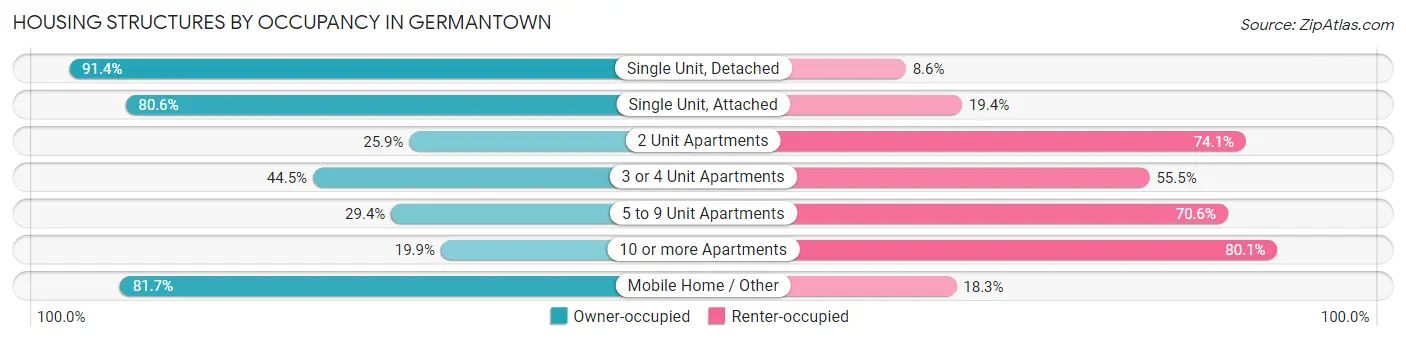
| Structure Type | Owner-occupied | Renter-occupied |
| Single Unit, Detached | 7,806 (91.4%) | 733 (8.6%) |
| Single Unit, Attached | 10,527 (80.6%) | 2,535 (19.4%) |
| 2 Unit Apartments | 126 (25.9%) | 360 (74.1%) |
| 3 or 4 Unit Apartments | 493 (44.5%) | 615 (55.5%) |
| 5 to 9 Unit Apartments | 519 (29.4%) | 1,245 (70.6%) |
| 10 or more Apartments | 1,313 (19.9%) | 5,296 (80.1%) |
| Mobile Home / Other | 49 (81.7%) | 11 (18.3%) |
| Total | 20,833 (65.9%) | 10,795 (34.1%) |
Housing Structures by Number of Rooms in Germantown
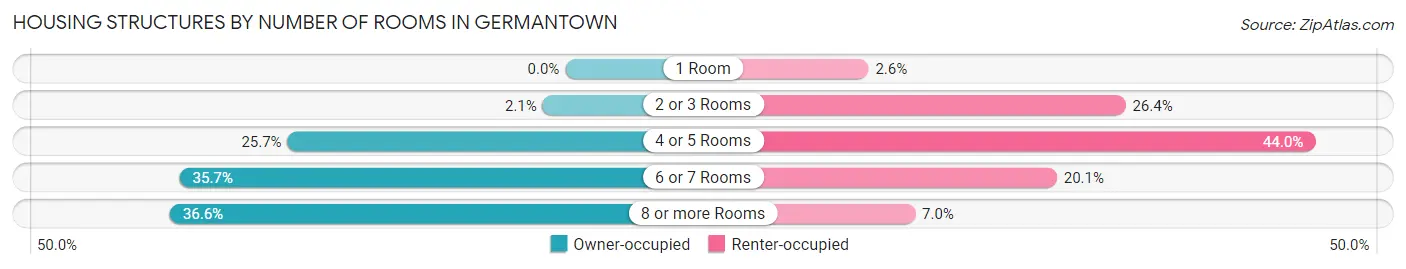
| Number of Rooms | Owner-occupied | Renter-occupied |
| 1 Room | 0 (0.0%) | 285 (2.6%) |
| 2 or 3 Rooms | 436 (2.1%) | 2,851 (26.4%) |
| 4 or 5 Rooms | 5,352 (25.7%) | 4,744 (44.0%) |
| 6 or 7 Rooms | 7,429 (35.7%) | 2,165 (20.1%) |
| 8 or more Rooms | 7,616 (36.6%) | 750 (7.0%) |
| Total | 20,833 (100.0%) | 10,795 (100.0%) |
Housing Structure by Heating Type in Germantown
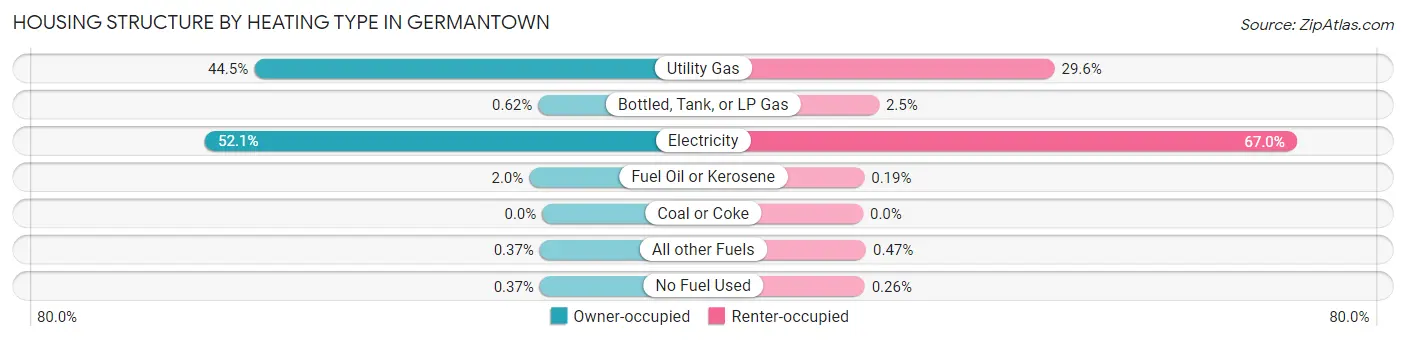
| Heating Type | Owner-occupied | Renter-occupied |
| Utility Gas | 9,277 (44.5%) | 3,195 (29.6%) |
| Bottled, Tank, or LP Gas | 130 (0.6%) | 266 (2.5%) |
| Electricity | 10,851 (52.1%) | 7,235 (67.0%) |
| Fuel Oil or Kerosene | 419 (2.0%) | 20 (0.2%) |
| Coal or Coke | 0 (0.0%) | 0 (0.0%) |
| All other Fuels | 78 (0.4%) | 51 (0.5%) |
| No Fuel Used | 78 (0.4%) | 28 (0.3%) |
| Total | 20,833 (100.0%) | 10,795 (100.0%) |
Household Vehicle Usage in Germantown
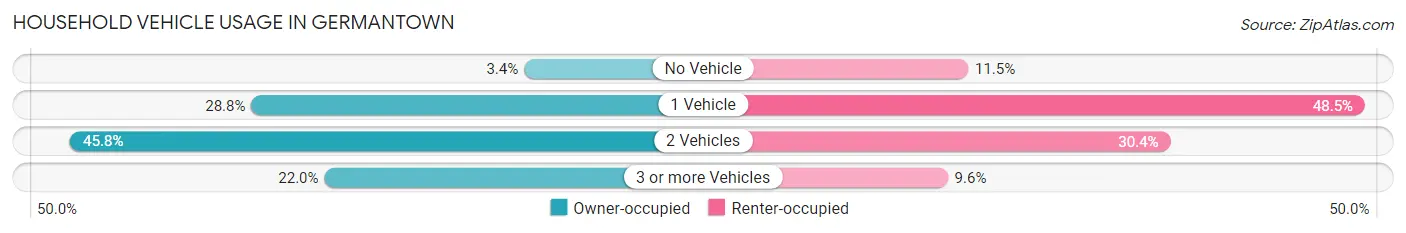
| Vehicles per Household | Owner-occupied | Renter-occupied |
| No Vehicle | 705 (3.4%) | 1,240 (11.5%) |
| 1 Vehicle | 6,008 (28.8%) | 5,240 (48.5%) |
| 2 Vehicles | 9,532 (45.8%) | 3,280 (30.4%) |
| 3 or more Vehicles | 4,588 (22.0%) | 1,035 (9.6%) |
| Total | 20,833 (100.0%) | 10,795 (100.0%) |
Real Estate & Mortgages in Germantown
Real Estate and Mortgage Overview in Germantown
| Characteristic | Without Mortgage | With Mortgage |
| Housing Units | 4,530 | 16,303 |
| Median Property Value | $398,100 | $392,700 |
| Median Household Income | $119,911 | $6,832 |
| Monthly Housing Costs | $648 | $4,058 |
| Real Estate Taxes | $3,435 | $285 |
Property Value by Mortgage Status in Germantown
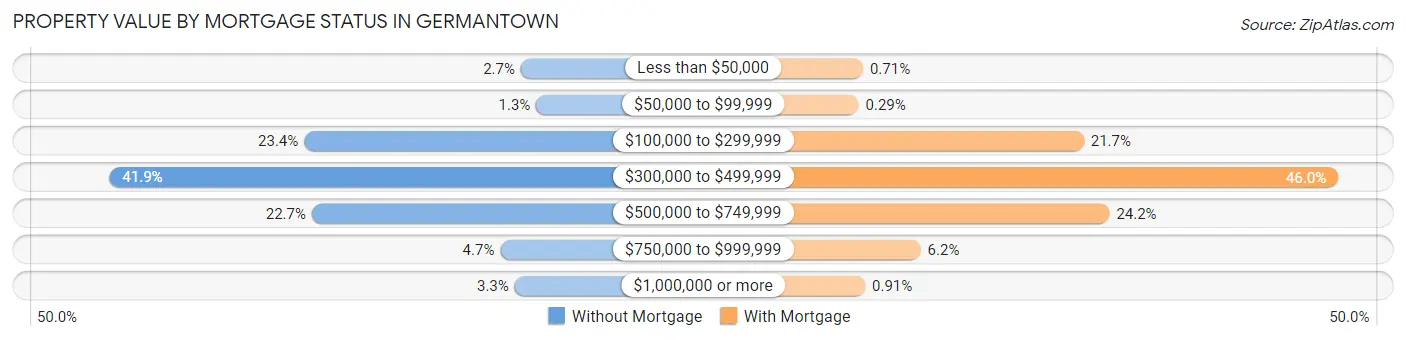
| Property Value | Without Mortgage | With Mortgage |
| Less than $50,000 | 124 (2.7%) | 115 (0.7%) |
| $50,000 to $99,999 | 58 (1.3%) | 48 (0.3%) |
| $100,000 to $299,999 | 1,059 (23.4%) | 3,545 (21.7%) |
| $300,000 to $499,999 | 1,899 (41.9%) | 7,493 (46.0%) |
| $500,000 to $749,999 | 1,026 (22.7%) | 3,942 (24.2%) |
| $750,000 to $999,999 | 213 (4.7%) | 1,011 (6.2%) |
| $1,000,000 or more | 151 (3.3%) | 149 (0.9%) |
| Total | 4,530 (100.0%) | 16,303 (100.0%) |
Household Income by Mortgage Status in Germantown
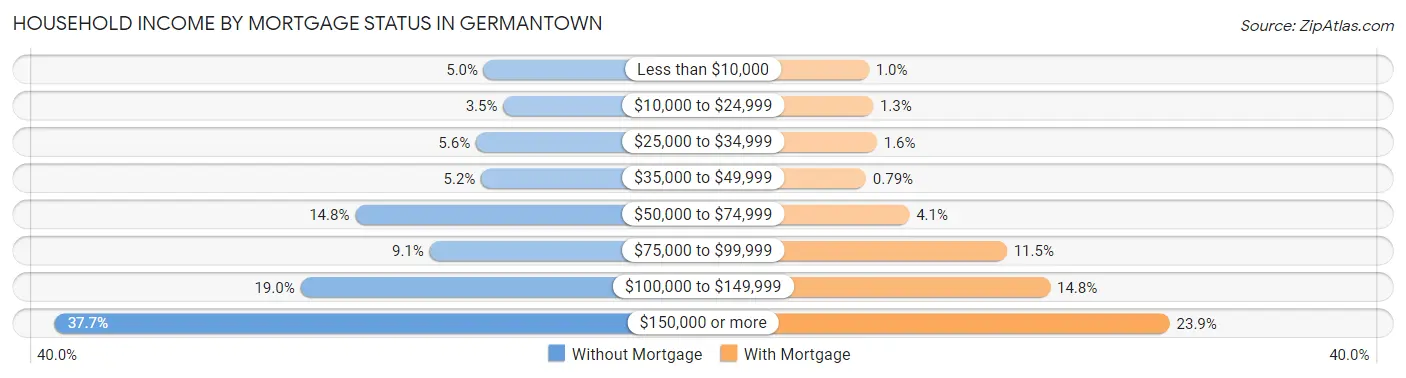
| Household Income | Without Mortgage | With Mortgage |
| Less than $10,000 | 227 (5.0%) | 164 (1.0%) |
| $10,000 to $24,999 | 160 (3.5%) | 217 (1.3%) |
| $25,000 to $34,999 | 254 (5.6%) | 264 (1.6%) |
| $35,000 to $49,999 | 236 (5.2%) | 128 (0.8%) |
| $50,000 to $74,999 | 671 (14.8%) | 667 (4.1%) |
| $75,000 to $99,999 | 414 (9.1%) | 1,878 (11.5%) |
| $100,000 to $149,999 | 860 (19.0%) | 2,416 (14.8%) |
| $150,000 or more | 1,708 (37.7%) | 3,901 (23.9%) |
| Total | 4,530 (100.0%) | 16,303 (100.0%) |
Property Value to Household Income Ratio in Germantown
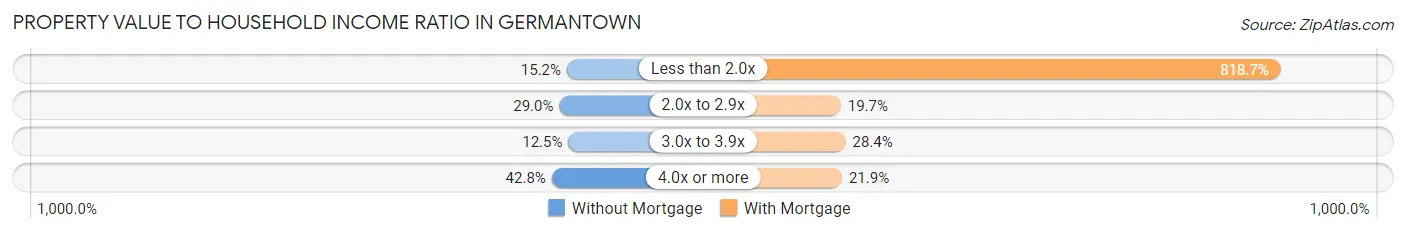
| Value-to-Income Ratio | Without Mortgage | With Mortgage |
| Less than 2.0x | 689 (15.2%) | 133,470 (818.7%) |
| 2.0x to 2.9x | 1,312 (29.0%) | 3,210 (19.7%) |
| 3.0x to 3.9x | 568 (12.5%) | 4,627 (28.4%) |
| 4.0x or more | 1,938 (42.8%) | 3,570 (21.9%) |
| Total | 4,530 (100.0%) | 16,303 (100.0%) |
Real Estate Taxes by Mortgage Status in Germantown
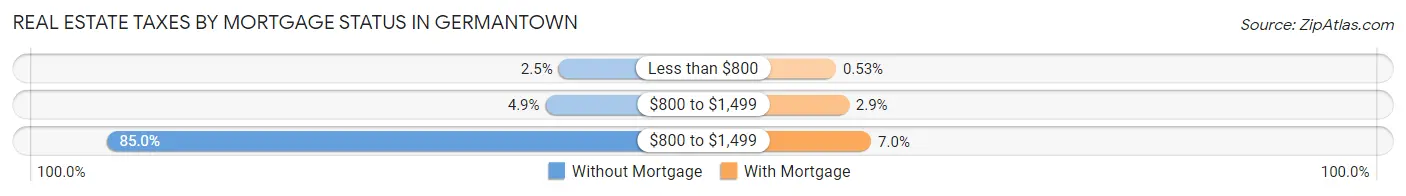
| Property Taxes | Without Mortgage | With Mortgage |
| Less than $800 | 113 (2.5%) | 86 (0.5%) |
| $800 to $1,499 | 221 (4.9%) | 469 (2.9%) |
| $800 to $1,499 | 3,851 (85.0%) | 1,134 (7.0%) |
| Total | 4,530 (100.0%) | 16,303 (100.0%) |
Health & Disability in Germantown
Health Insurance Coverage by Age in Germantown
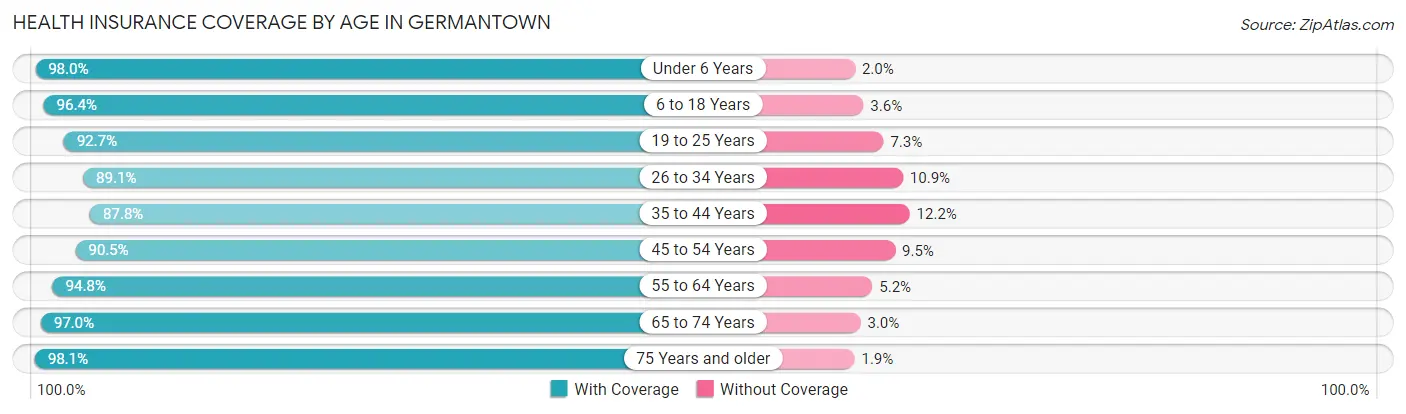
| Age Bracket | With Coverage | Without Coverage |
| Under 6 Years | 6,643 (98.0%) | 135 (2.0%) |
| 6 to 18 Years | 15,841 (96.4%) | 585 (3.6%) |
| 19 to 25 Years | 7,071 (92.7%) | 557 (7.3%) |
| 26 to 34 Years | 10,435 (89.1%) | 1,281 (10.9%) |
| 35 to 44 Years | 11,270 (87.8%) | 1,564 (12.2%) |
| 45 to 54 Years | 12,210 (90.5%) | 1,277 (9.5%) |
| 55 to 64 Years | 10,828 (94.8%) | 598 (5.2%) |
| 65 to 74 Years | 6,337 (97.0%) | 198 (3.0%) |
| 75 Years and older | 3,023 (98.1%) | 59 (1.9%) |
| Total | 83,658 (93.0%) | 6,254 (7.0%) |
Health Insurance Coverage by Citizenship Status in Germantown
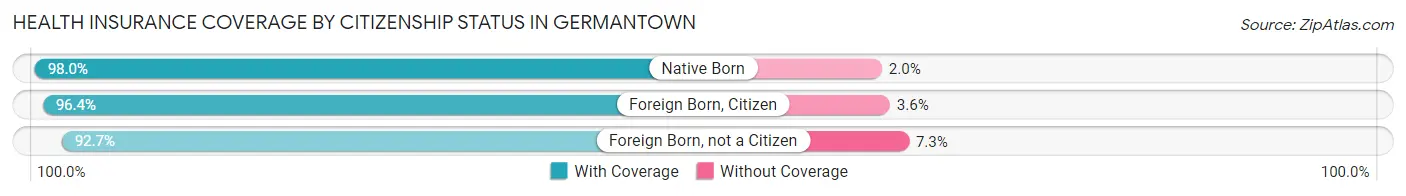
| Citizenship Status | With Coverage | Without Coverage |
| Native Born | 6,643 (98.0%) | 135 (2.0%) |
| Foreign Born, Citizen | 15,841 (96.4%) | 585 (3.6%) |
| Foreign Born, not a Citizen | 7,071 (92.7%) | 557 (7.3%) |
Health Insurance Coverage by Household Income in Germantown
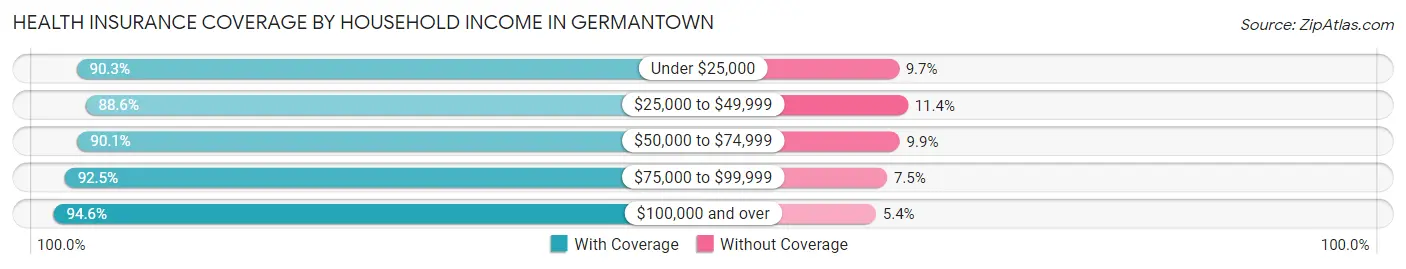
| Household Income | With Coverage | Without Coverage |
| Under $25,000 | 5,401 (90.3%) | 582 (9.7%) |
| $25,000 to $49,999 | 6,048 (88.6%) | 780 (11.4%) |
| $50,000 to $74,999 | 8,882 (90.1%) | 976 (9.9%) |
| $75,000 to $99,999 | 11,447 (92.5%) | 932 (7.5%) |
| $100,000 and over | 51,816 (94.6%) | 2,979 (5.4%) |
Public vs Private Health Insurance Coverage by Age in Germantown
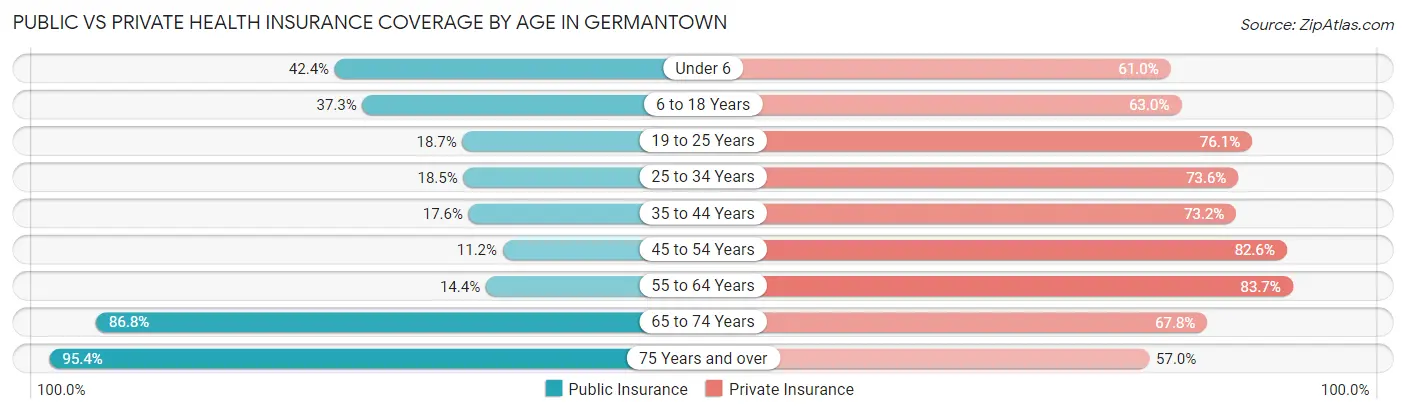
| Age Bracket | Public Insurance | Private Insurance |
| Under 6 | 2,874 (42.4%) | 4,135 (61.0%) |
| 6 to 18 Years | 6,122 (37.3%) | 10,349 (63.0%) |
| 19 to 25 Years | 1,427 (18.7%) | 5,808 (76.1%) |
| 25 to 34 Years | 2,171 (18.5%) | 8,620 (73.6%) |
| 35 to 44 Years | 2,253 (17.5%) | 9,394 (73.2%) |
| 45 to 54 Years | 1,515 (11.2%) | 11,138 (82.6%) |
| 55 to 64 Years | 1,641 (14.4%) | 9,560 (83.7%) |
| 65 to 74 Years | 5,670 (86.8%) | 4,432 (67.8%) |
| 75 Years and over | 2,940 (95.4%) | 1,758 (57.0%) |
| Total | 26,613 (29.6%) | 65,194 (72.5%) |
Disability Status by Sex by Age in Germantown
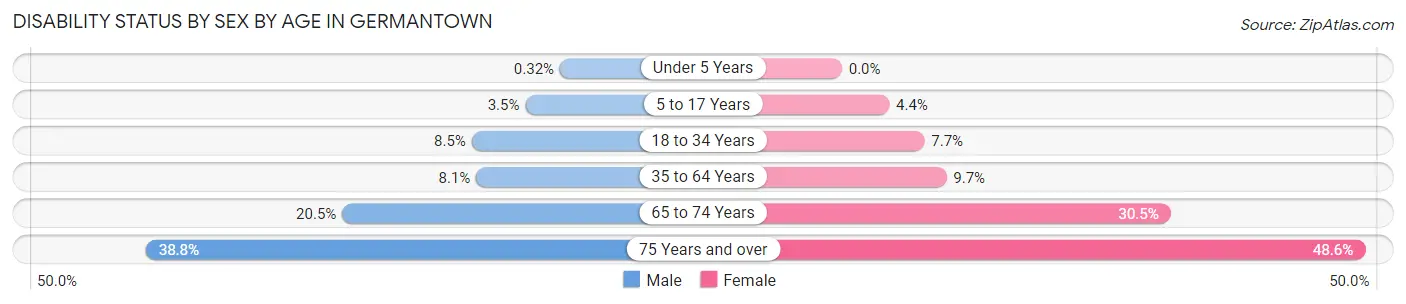
| Age Bracket | Male | Female |
| Under 5 Years | 9 (0.3%) | 0 (0.0%) |
| 5 to 17 Years | 284 (3.5%) | 357 (4.4%) |
| 18 to 34 Years | 932 (8.5%) | 745 (7.7%) |
| 35 to 64 Years | 1,437 (8.1%) | 1,938 (9.7%) |
| 65 to 74 Years | 602 (20.5%) | 1,099 (30.5%) |
| 75 Years and over | 630 (38.8%) | 707 (48.6%) |
Disability Class by Sex by Age in Germantown
Disability Class: Hearing Difficulty
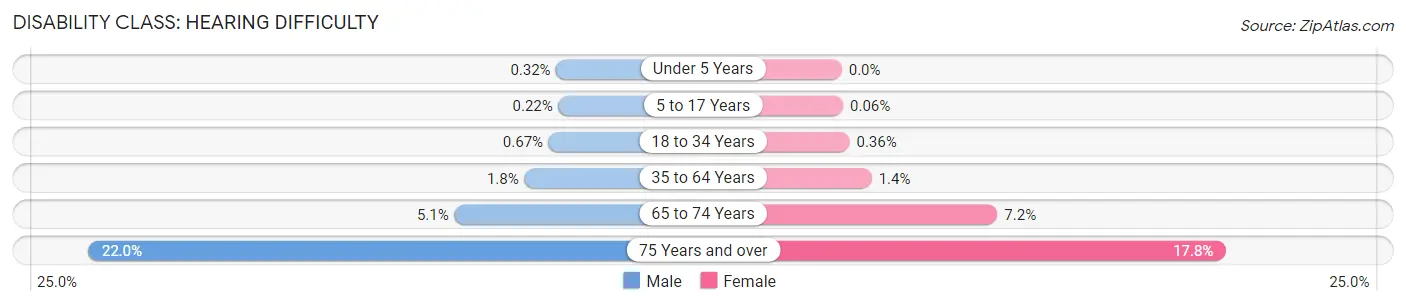
| Age Bracket | Male | Female |
| Under 5 Years | 9 (0.3%) | 0 (0.0%) |
| 5 to 17 Years | 18 (0.2%) | 5 (0.1%) |
| 18 to 34 Years | 73 (0.7%) | 35 (0.4%) |
| 35 to 64 Years | 319 (1.8%) | 277 (1.4%) |
| 65 to 74 Years | 148 (5.1%) | 260 (7.2%) |
| 75 Years and over | 358 (22.0%) | 259 (17.8%) |
Disability Class: Vision Difficulty
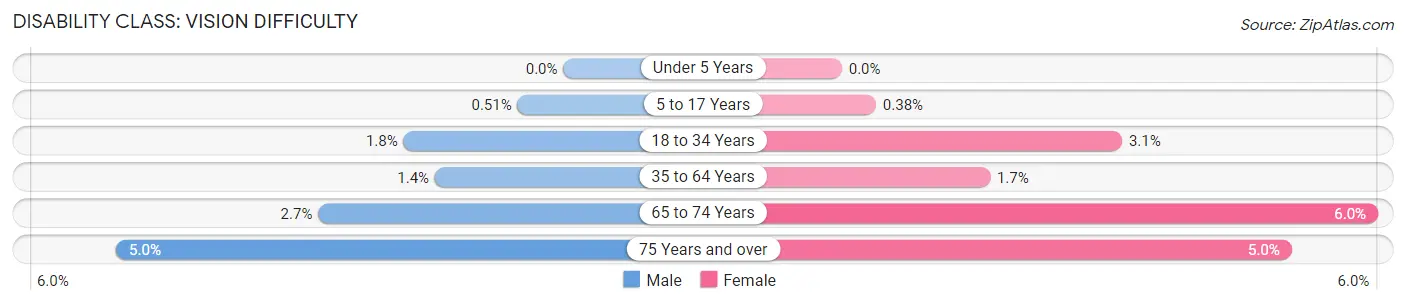
| Age Bracket | Male | Female |
| Under 5 Years | 0 (0.0%) | 0 (0.0%) |
| 5 to 17 Years | 41 (0.5%) | 31 (0.4%) |
| 18 to 34 Years | 195 (1.8%) | 303 (3.1%) |
| 35 to 64 Years | 254 (1.4%) | 329 (1.7%) |
| 65 to 74 Years | 80 (2.7%) | 215 (6.0%) |
| 75 Years and over | 81 (5.0%) | 73 (5.0%) |
Disability Class: Cognitive Difficulty
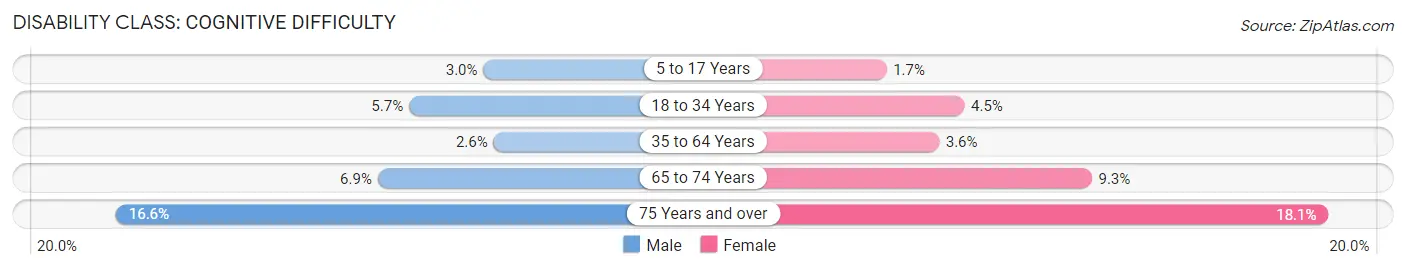
| Age Bracket | Male | Female |
| 5 to 17 Years | 239 (3.0%) | 134 (1.7%) |
| 18 to 34 Years | 627 (5.7%) | 441 (4.5%) |
| 35 to 64 Years | 460 (2.6%) | 719 (3.6%) |
| 65 to 74 Years | 202 (6.9%) | 334 (9.3%) |
| 75 Years and over | 270 (16.6%) | 263 (18.1%) |
Disability Class: Ambulatory Difficulty
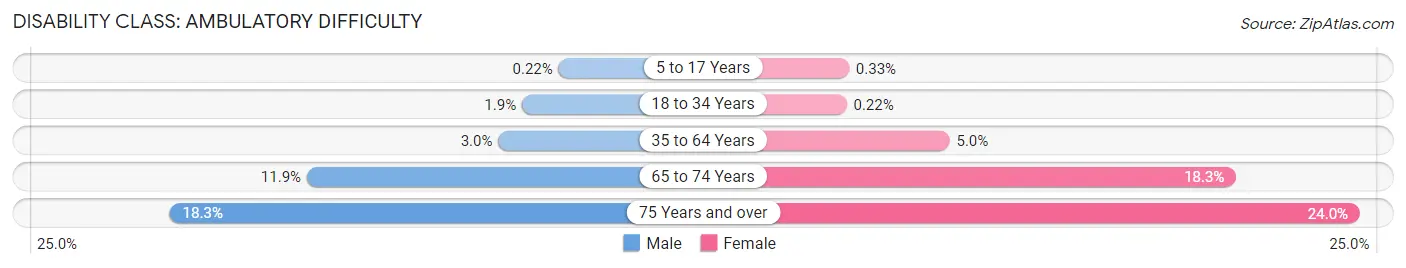
| Age Bracket | Male | Female |
| 5 to 17 Years | 18 (0.2%) | 27 (0.3%) |
| 18 to 34 Years | 210 (1.9%) | 21 (0.2%) |
| 35 to 64 Years | 536 (3.0%) | 999 (5.0%) |
| 65 to 74 Years | 349 (11.9%) | 659 (18.3%) |
| 75 Years and over | 297 (18.3%) | 350 (24.0%) |
Disability Class: Self-Care Difficulty
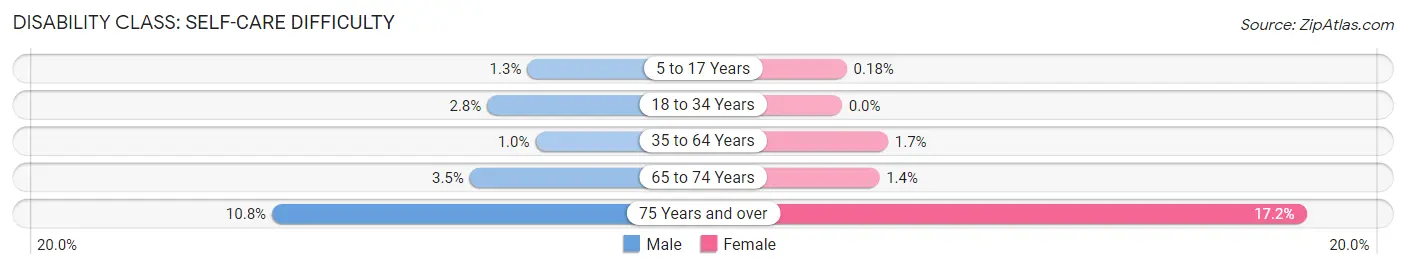
| Age Bracket | Male | Female |
| 5 to 17 Years | 108 (1.3%) | 15 (0.2%) |
| 18 to 34 Years | 310 (2.8%) | 0 (0.0%) |
| 35 to 64 Years | 184 (1.0%) | 341 (1.7%) |
| 65 to 74 Years | 102 (3.5%) | 50 (1.4%) |
| 75 Years and over | 176 (10.8%) | 251 (17.2%) |
Technology Access in Germantown
Computing Device Access in Germantown
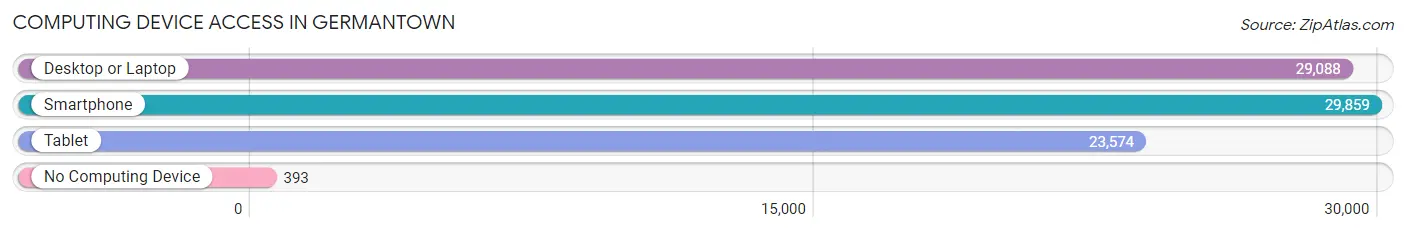
| Device Type | # Households | % Households |
| Desktop or Laptop | 29,088 | 92.0% |
| Smartphone | 29,859 | 94.4% |
| Tablet | 23,574 | 74.5% |
| No Computing Device | 393 | 1.2% |
| Total | 31,628 | 100.0% |
Internet Access in Germantown
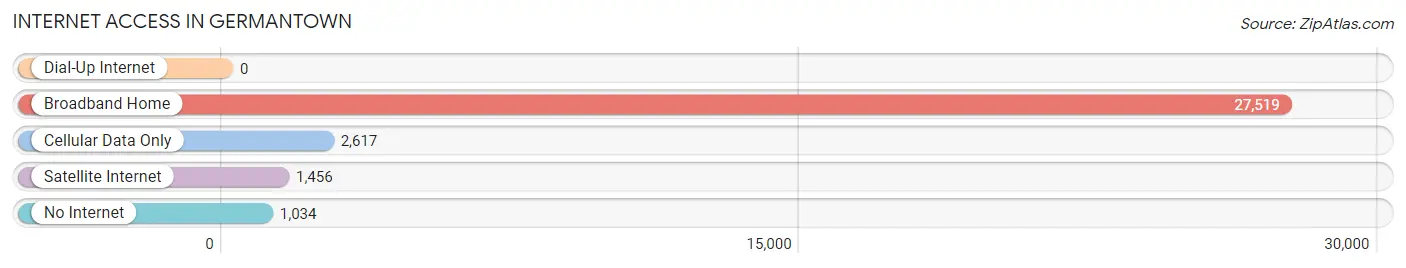
| Internet Type | # Households | % Households |
| Dial-Up Internet | 0 | 0.0% |
| Broadband Home | 27,519 | 87.0% |
| Cellular Data Only | 2,617 | 8.3% |
| Satellite Internet | 1,456 | 4.6% |
| No Internet | 1,034 | 3.3% |
| Total | 31,628 | 100.0% |
Germantown Summary
Germantown is a census-designated place (CDP) located in Montgomery County, Maryland, United States. It is a suburb of Washington, D.C., and is located approximately 25 miles northwest of the city. As of the 2010 census, Germantown had a population of 86,395, making it the third most populous place in Maryland, after Baltimore and Columbia.
History
Germantown was founded in 1683 by German settlers, who named it after their homeland. The area was originally part of Frederick County, but was annexed by Montgomery County in 1776. The town was incorporated in 1871 and was the first incorporated town in Montgomery County.
Germantown was a major center of the Civil War, with several battles taking place in the area. The Battle of South Mountain was fought in the area in 1862, and the Battle of Monocacy was fought nearby in 1864.
Geography
Germantown is located at 39°10′N 77°13′W (39.17, -77.22). According to the United States Census Bureau, the CDP has a total area of 24.2 square miles (62.7 km2), of which 24.1 square miles (62.4 km2) is land and 0.1 square miles (0.3 km2) (0.41%) is water.
Germantown is located in the Piedmont region of Maryland, and is situated in the foothills of the Catoctin Mountains. The area is characterized by rolling hills and valleys, with the highest point in the CDP being the summit of Germantown Road, at an elevation of 810 feet (247 m).
Economy
Germantown is a major economic center in Montgomery County, with a diverse range of businesses and industries. The largest employers in the area are Montgomery College, the Montgomery County Public Schools, and the Montgomery County Government. Other major employers include Lockheed Martin, IBM, and the National Institutes of Health.
Germantown is also home to several shopping centers, including Milestone Shopping Center, Germantown Town Center, and the Germantown Commons.
Demographics
As of the 2010 census, there were 86,395 people, 32,945 households, and 21,945 families residing in the CDP. The population density was 3,567.3 people per square mile (1,380.2/km2). There were 34,845 housing units at an average density of 1,445.3 per square mile (559.7/km2). The racial makeup of the CDP was 57.2% White, 22.2% African American, 0.3% Native American, 11.7% Asian, 0.1% Pacific Islander, 5.2% from other races, and 3.4% from two or more races. Hispanic or Latino of any race were 11.3% of the population.
There were 32,945 households, out of which 36.2% had children under the age of 18 living with them, 51.2% were married couples living together, 12.7% had a female householder with no husband present, and 31.2% were non-families. 24.3% of all households were made up of individuals, and 6.2% had someone living alone who was 65 years of age or older. The average household size was 2.62 and the average family size was 3.14.
In the CDP, the population was spread out, with 25.7% under the age of 18, 8.2% from 18 to 24, 33.2% from 25 to 44, 22.7% from 45 to 64, and 10.2% who were 65 years of age or older. The median age was 35 years. For every 100 females, there were 93.2 males. For every 100 females age 18 and over, there were 89.7 males.
The median income for a household in the CDP was $71,945, and the median income for a family was $81,945. Males had a median income of $51,945 versus $41,945 for females. The per capita income for the CDP was $30,945. About 4.2% of families and 6.2% of the population were below the poverty line, including 8.2% of those under age 18 and 5.2% of those age 65 or over.
Common Questions
What is Per Capita Income in Germantown?
Per Capita income in Germantown is $47,975.
What is the Median Family Income in Germantown?
Median Family Income in Germantown is $119,433.
What is the Median Household income in Germantown?
Median Household Income in Germantown is $109,268.
What is Income or Wage Gap in Germantown?
Income or Wage Gap in Germantown is 26.4%.
Women in Germantown earn 73.6 cents for every dollar earned by a man.
What is Family Income Deficit in Germantown?
Family Income Deficit in Germantown is $12,590.
Families that are below poverty line in Germantown earn $12,590 less on average than the poverty threshold level.
What is Inequality or Gini Index in Germantown?
Inequality or Gini Index in Germantown is 0.40.
What is the Total Population of Germantown?
Total Population of Germantown is 90,210.
What is the Total Male Population of Germantown?
Total Male Population of Germantown is 44,325.
What is the Total Female Population of Germantown?
Total Female Population of Germantown is 45,885.
What is the Ratio of Males per 100 Females in Germantown?
There are 96.60 Males per 100 Females in Germantown.
What is the Ratio of Females per 100 Males in Germantown?
There are 103.52 Females per 100 Males in Germantown.
What is the Median Population Age in Germantown?
Median Population Age in Germantown is 36.9 Years.
What is the Average Family Size in Germantown
Average Family Size in Germantown is 3.4 People.
What is the Average Household Size in Germantown
Average Household Size in Germantown is 2.9 People.
How Large is the Labor Force in Germantown?
There are 53,015 People in the Labor Forcein in Germantown.
What is the Percentage of People in the Labor Force in Germantown?
74.3% of People are in the Labor Force in Germantown.
What is the Unemployment Rate in Germantown?
Unemployment Rate in Germantown is 5.2%.