Carrollton, TX Map & Demographics
Carrollton Map
Carrollton Overview
$46,879
PER CAPITA INCOME
$106,205
AVG FAMILY INCOME
$95,380
AVG HOUSEHOLD INCOME
25.8%
WAGE / INCOME GAP [ % ]
74.2¢/ $1
WAGE / INCOME GAP [ $ ]
$11,319
FAMILY INCOME DEFICIT
0.42
INEQUALITY / GINI INDEX
132,284
TOTAL POPULATION
65,549
MALE POPULATION
66,735
FEMALE POPULATION
98.22
MALES / 100 FEMALES
101.81
FEMALES / 100 MALES
38.6
MEDIAN AGE
3.2
AVG FAMILY SIZE
2.6
AVG HOUSEHOLD SIZE
81,157
LABOR FORCE [ PEOPLE ]
74.1%
PERCENT IN LABOR FORCE
3.7%
UNEMPLOYMENT RATE
Income in Carrollton
Income Overview in Carrollton
Per Capita Income in Carrollton is $46,879, while median incomes of families and households are $106,205 and $95,380 respectively.
| Characteristic | Number | Measure |
| Per Capita Income | 132,284 | $46,879 |
| Median Family Income | 34,349 | $106,205 |
| Mean Family Income | 34,349 | $132,777 |
| Median Household Income | 50,369 | $95,380 |
| Mean Household Income | 50,369 | $120,232 |
| Income Deficit | 34,349 | $11,319 |
| Wage / Income Gap (%) | 132,284 | 25.83% |
| Wage / Income Gap ($) | 132,284 | 74.17¢ per $1 |
| Gini / Inequality Index | 132,284 | 0.42 |
Earnings by Sex in Carrollton
Average Earnings in Carrollton are $49,406, $56,388 for men and $41,823 for women, a difference of 25.8%.
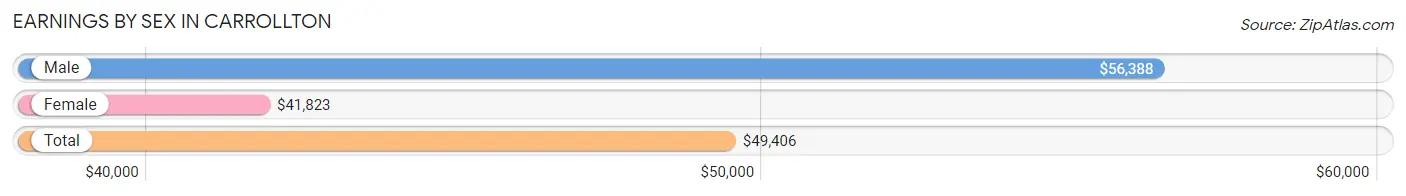
| Sex | Number | Average Earnings |
| Male | 43,355 (52.2%) | $56,388 |
| Female | 39,732 (47.8%) | $41,823 |
| Total | 83,087 (100.0%) | $49,406 |
Earnings by Sex by Income Bracket in Carrollton
The most common earnings brackets in Carrollton are $100,000+ for men (9,249 | 21.3%) and $100,000+ for women (4,673 | 11.8%).
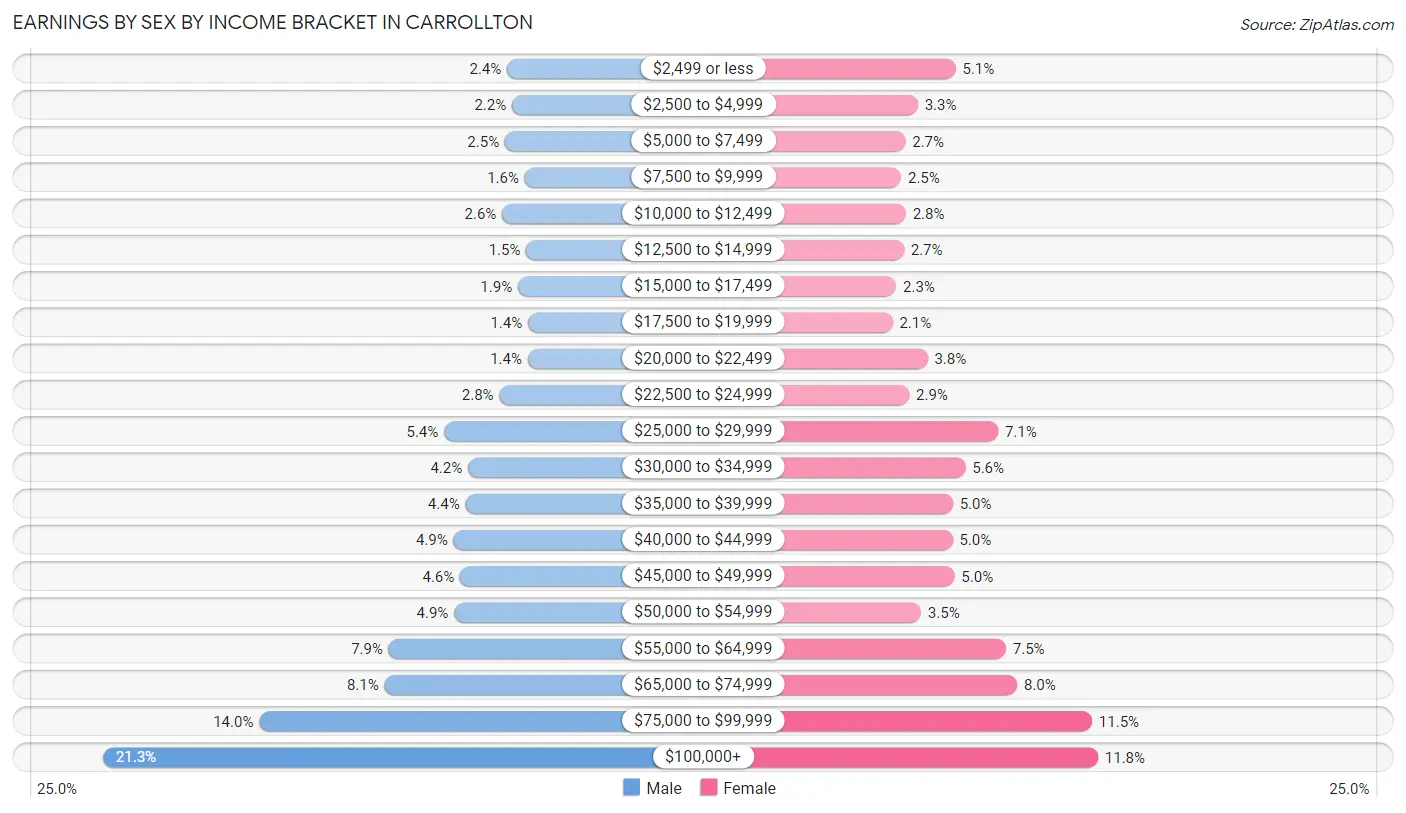
| Income | Male | Female |
| $2,499 or less | 1,039 (2.4%) | 2,022 (5.1%) |
| $2,500 to $4,999 | 940 (2.2%) | 1,319 (3.3%) |
| $5,000 to $7,499 | 1,086 (2.5%) | 1,089 (2.7%) |
| $7,500 to $9,999 | 682 (1.6%) | 1,010 (2.5%) |
| $10,000 to $12,499 | 1,139 (2.6%) | 1,097 (2.8%) |
| $12,500 to $14,999 | 652 (1.5%) | 1,060 (2.7%) |
| $15,000 to $17,499 | 818 (1.9%) | 917 (2.3%) |
| $17,500 to $19,999 | 616 (1.4%) | 852 (2.1%) |
| $20,000 to $22,499 | 620 (1.4%) | 1,502 (3.8%) |
| $22,500 to $24,999 | 1,195 (2.8%) | 1,161 (2.9%) |
| $25,000 to $29,999 | 2,318 (5.3%) | 2,812 (7.1%) |
| $30,000 to $34,999 | 1,835 (4.2%) | 2,207 (5.6%) |
| $35,000 to $39,999 | 1,885 (4.3%) | 1,972 (5.0%) |
| $40,000 to $44,999 | 2,129 (4.9%) | 1,966 (5.0%) |
| $45,000 to $49,999 | 1,994 (4.6%) | 2,003 (5.0%) |
| $50,000 to $54,999 | 2,115 (4.9%) | 1,377 (3.5%) |
| $55,000 to $64,999 | 3,442 (7.9%) | 2,962 (7.4%) |
| $65,000 to $74,999 | 3,529 (8.1%) | 3,168 (8.0%) |
| $75,000 to $99,999 | 6,072 (14.0%) | 4,563 (11.5%) |
| $100,000+ | 9,249 (21.3%) | 4,673 (11.8%) |
| Total | 43,355 (100.0%) | 39,732 (100.0%) |
Earnings by Sex by Educational Attainment in Carrollton
Average earnings in Carrollton are $63,201 for men and $46,043 for women, a difference of 27.2%. Men with an educational attainment of graduate degree enjoy the highest average annual earnings of $90,475, while those with less than high school education earn the least with $41,533. Women with an educational attainment of graduate degree earn the most with the average annual earnings of $74,807, while those with less than high school education have the smallest earnings of $21,944.
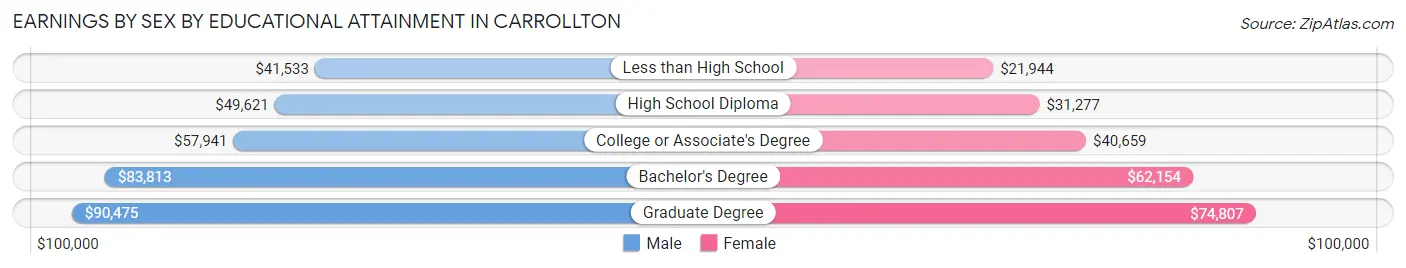
| Educational Attainment | Male Income | Female Income |
| Less than High School | $41,533 | $21,944 |
| High School Diploma | $49,621 | $31,277 |
| College or Associate's Degree | $57,941 | $40,659 |
| Bachelor's Degree | $83,813 | $62,154 |
| Graduate Degree | $90,475 | $74,807 |
| Total | $63,201 | $46,043 |
Family Income in Carrollton
Family Income Brackets in Carrollton
According to the Carrollton family income data, there are 8,003 families falling into the $100,000 to $149,999 income range, which is the most common income bracket and makes up 23.3% of all families. Conversely, the $10,000 to $14,999 income bracket is the least frequent group with only 515 families (1.5%) belonging to this category.
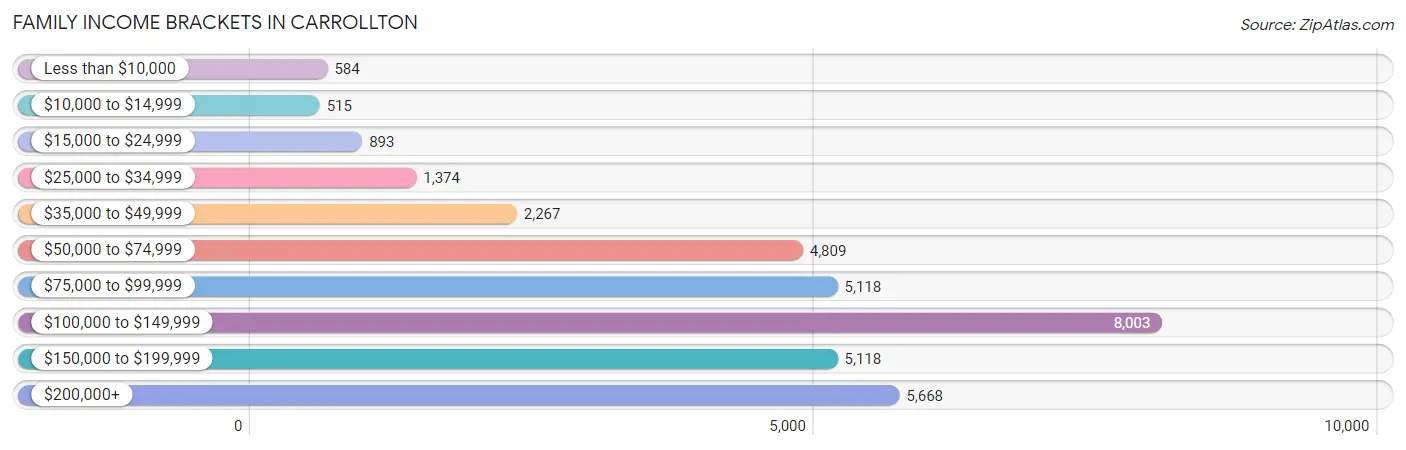
| Income Bracket | # Families | % Families |
| Less than $10,000 | 584 | 1.7% |
| $10,000 to $14,999 | 515 | 1.5% |
| $15,000 to $24,999 | 893 | 2.6% |
| $25,000 to $34,999 | 1,374 | 4.0% |
| $35,000 to $49,999 | 2,267 | 6.6% |
| $50,000 to $74,999 | 4,809 | 14.0% |
| $75,000 to $99,999 | 5,118 | 14.9% |
| $100,000 to $149,999 | 8,003 | 23.3% |
| $150,000 to $199,999 | 5,118 | 14.9% |
| $200,000+ | 5,668 | 16.5% |
Family Income by Famaliy Size in Carrollton
7+ person families (358 | 1.0%) account for the highest median family income in Carrollton with $130,400 per family, while 2-person families (14,985 | 43.6%) have the highest median income of $50,524 per family member.
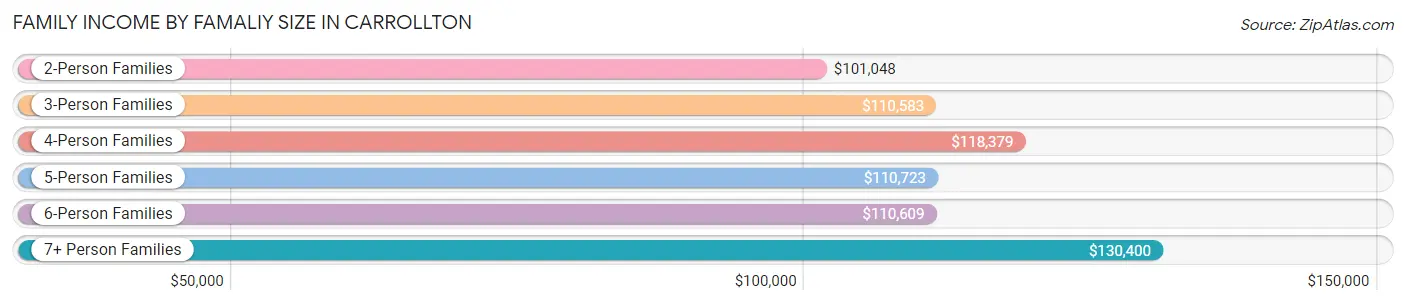
| Income Bracket | # Families | Median Income |
| 2-Person Families | 14,985 (43.6%) | $101,048 |
| 3-Person Families | 8,740 (25.4%) | $110,583 |
| 4-Person Families | 5,944 (17.3%) | $118,379 |
| 5-Person Families | 3,179 (9.3%) | $110,723 |
| 6-Person Families | 1,143 (3.3%) | $110,609 |
| 7+ Person Families | 358 (1.0%) | $130,400 |
| Total | 34,349 (100.0%) | $106,205 |
Family Income by Number of Earners in Carrollton
The median family income in Carrollton is $106,205, with families comprising 3+ earners (5,476) having the highest median family income of $154,591, while families with no earners (2,294) have the lowest median family income of $61,900, accounting for 15.9% and 6.7% of families, respectively.
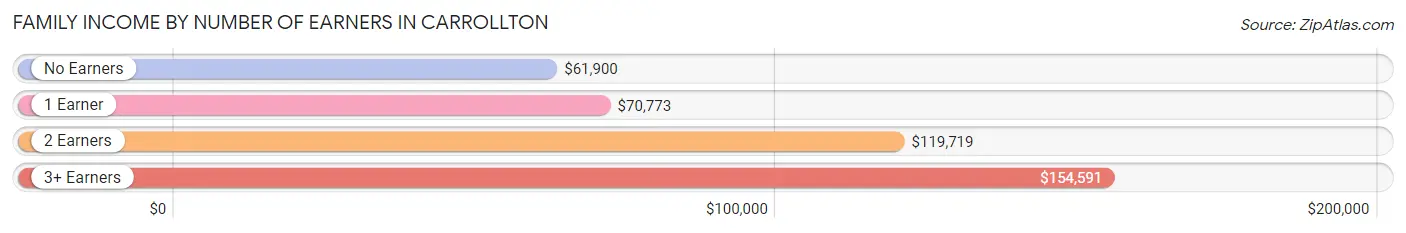
| Number of Earners | # Families | Median Income |
| No Earners | 2,294 (6.7%) | $61,900 |
| 1 Earner | 9,900 (28.8%) | $70,773 |
| 2 Earners | 16,679 (48.6%) | $119,719 |
| 3+ Earners | 5,476 (15.9%) | $154,591 |
| Total | 34,349 (100.0%) | $106,205 |
Household Income in Carrollton
Household Income Brackets in Carrollton
With 10,678 households falling in the category, the $100,000 to $149,999 income range is the most frequent in Carrollton, accounting for 21.2% of all households. In contrast, only 957 households (1.9%) fall into the $10,000 to $14,999 income bracket, making it the least populous group.
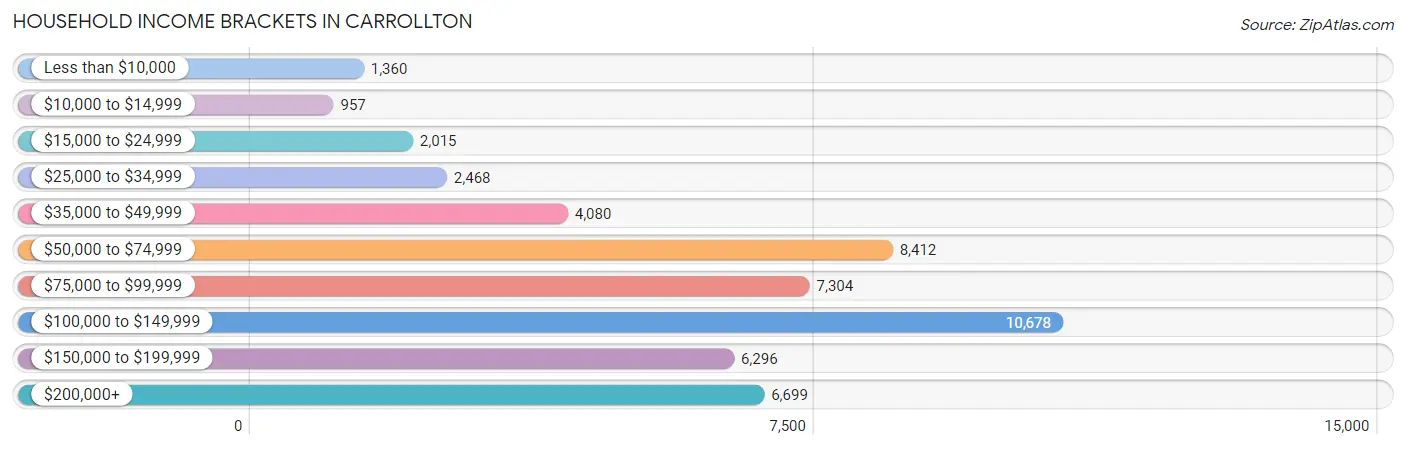
| Income Bracket | # Households | % Households |
| Less than $10,000 | 1,360 | 2.7% |
| $10,000 to $14,999 | 957 | 1.9% |
| $15,000 to $24,999 | 2,015 | 4.0% |
| $25,000 to $34,999 | 2,468 | 4.9% |
| $35,000 to $49,999 | 4,080 | 8.1% |
| $50,000 to $74,999 | 8,412 | 16.7% |
| $75,000 to $99,999 | 7,304 | 14.5% |
| $100,000 to $149,999 | 10,678 | 21.2% |
| $150,000 to $199,999 | 6,296 | 12.5% |
| $200,000+ | 6,699 | 13.3% |
Household Income by Householder Age in Carrollton
The median household income in Carrollton is $95,380, with the highest median household income of $115,097 found in the 45 to 64 years age bracket for the primary householder. A total of 20,586 households (40.9%) fall into this category. Meanwhile, the 65+ years age bracket for the primary householder has the lowest median household income of $65,048, with 9,189 households (18.2%) in this group.
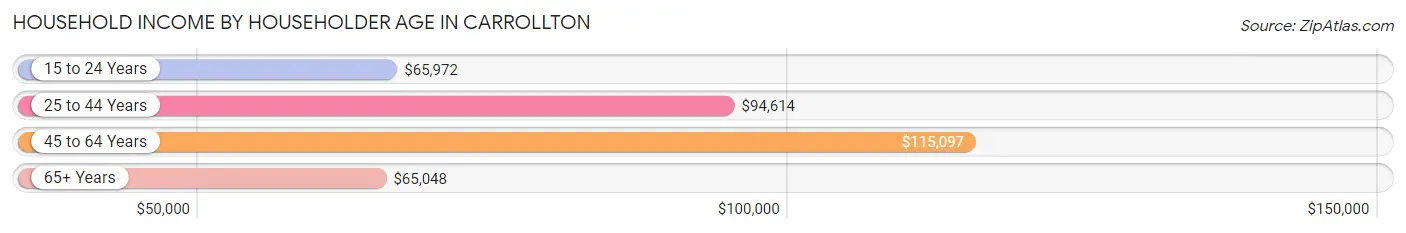
| Income Bracket | # Households | Median Income |
| 15 to 24 Years | 1,672 (3.3%) | $65,972 |
| 25 to 44 Years | 18,922 (37.6%) | $94,614 |
| 45 to 64 Years | 20,586 (40.9%) | $115,097 |
| 65+ Years | 9,189 (18.2%) | $65,048 |
| Total | 50,369 (100.0%) | $95,380 |
Poverty in Carrollton
Income Below Poverty by Sex and Age in Carrollton
With 6.0% poverty level for males and 7.6% for females among the residents of Carrollton, 6 to 11 year old males and 5 year old females are the most vulnerable to poverty, with 420 males (10.8%) and 159 females (16.1%) in their respective age groups living below the poverty level.
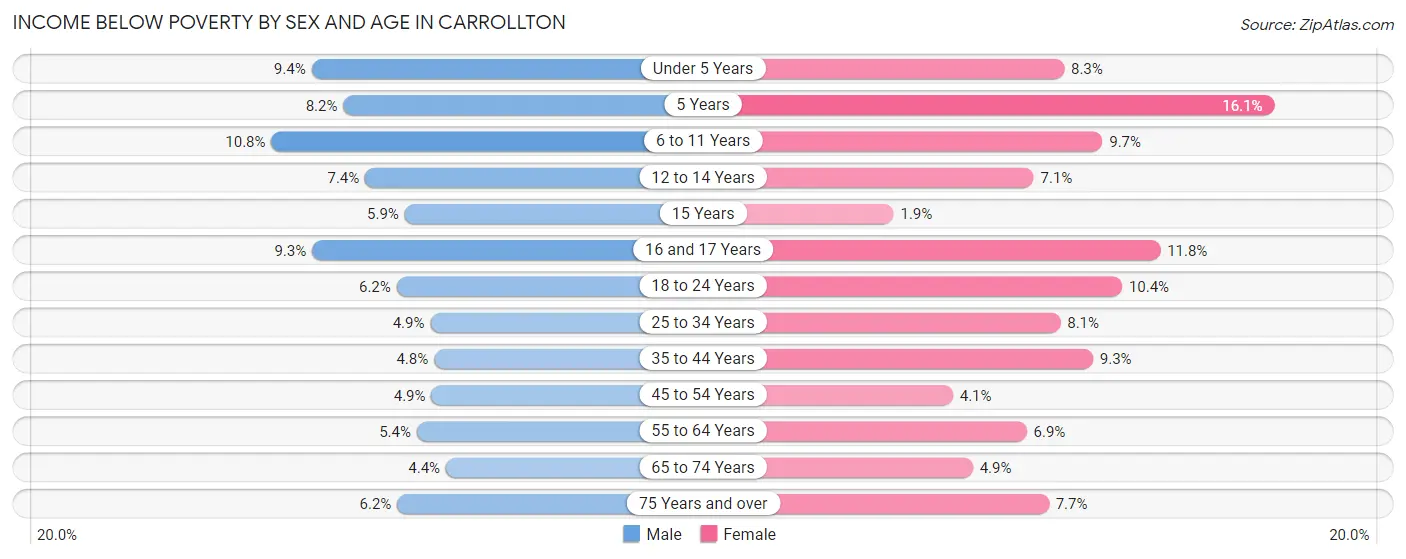
| Age Bracket | Male | Female |
| Under 5 Years | 353 (9.3%) | 251 (8.3%) |
| 5 Years | 46 (8.2%) | 159 (16.1%) |
| 6 to 11 Years | 420 (10.8%) | 366 (9.7%) |
| 12 to 14 Years | 205 (7.4%) | 161 (7.1%) |
| 15 Years | 50 (5.9%) | 15 (1.9%) |
| 16 and 17 Years | 177 (9.3%) | 201 (11.8%) |
| 18 to 24 Years | 370 (6.2%) | 540 (10.4%) |
| 25 to 34 Years | 521 (4.9%) | 815 (8.1%) |
| 35 to 44 Years | 483 (4.8%) | 935 (9.3%) |
| 45 to 54 Years | 448 (4.9%) | 414 (4.1%) |
| 55 to 64 Years | 446 (5.4%) | 648 (6.9%) |
| 65 to 74 Years | 214 (4.4%) | 268 (4.9%) |
| 75 Years and over | 170 (6.2%) | 273 (7.7%) |
| Total | 3,903 (6.0%) | 5,046 (7.6%) |
Income Above Poverty by Sex and Age in Carrollton
According to the poverty statistics in Carrollton, males aged 65 to 74 years and females aged 15 years are the age groups that are most secure financially, with 95.6% of males and 98.1% of females in these age groups living above the poverty line.
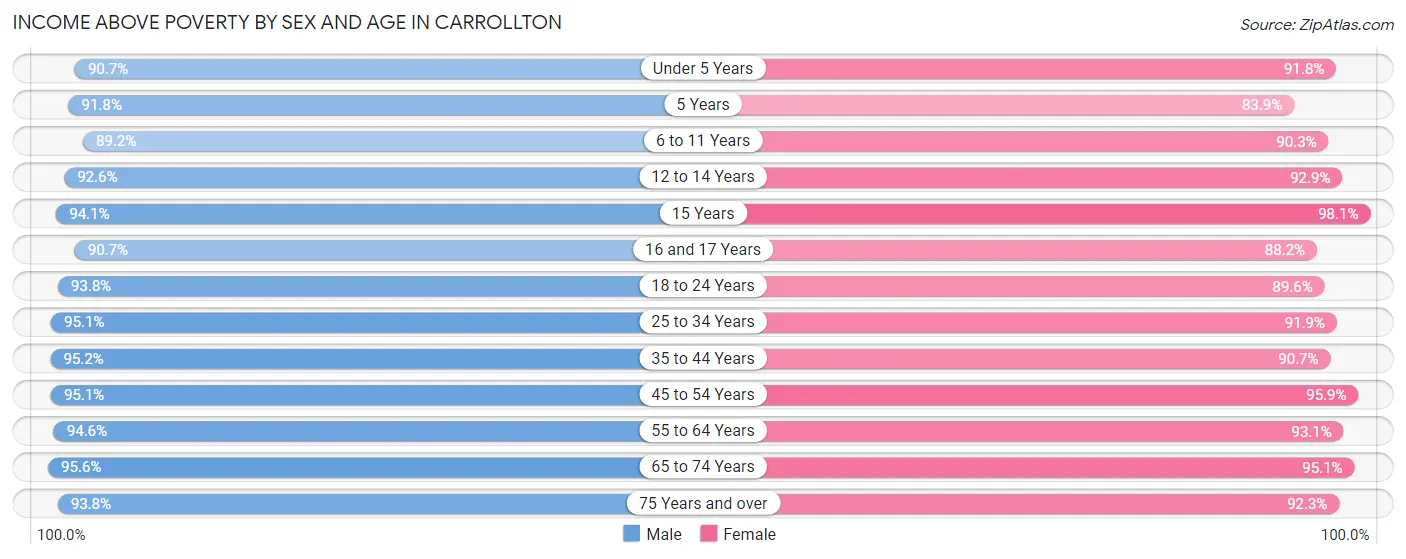
| Age Bracket | Male | Female |
| Under 5 Years | 3,424 (90.6%) | 2,792 (91.7%) |
| 5 Years | 517 (91.8%) | 831 (83.9%) |
| 6 to 11 Years | 3,456 (89.2%) | 3,417 (90.3%) |
| 12 to 14 Years | 2,582 (92.6%) | 2,099 (92.9%) |
| 15 Years | 799 (94.1%) | 767 (98.1%) |
| 16 and 17 Years | 1,721 (90.7%) | 1,499 (88.2%) |
| 18 to 24 Years | 5,605 (93.8%) | 4,654 (89.6%) |
| 25 to 34 Years | 10,035 (95.1%) | 9,229 (91.9%) |
| 35 to 44 Years | 9,587 (95.2%) | 9,093 (90.7%) |
| 45 to 54 Years | 8,688 (95.1%) | 9,639 (95.9%) |
| 55 to 64 Years | 7,756 (94.6%) | 8,803 (93.1%) |
| 65 to 74 Years | 4,697 (95.6%) | 5,245 (95.1%) |
| 75 Years and over | 2,584 (93.8%) | 3,282 (92.3%) |
| Total | 61,451 (94.0%) | 61,350 (92.4%) |
Income Below Poverty Among Married-Couple Families in Carrollton
The poverty statistics for married-couple families in Carrollton show that 3.7% or 998 of the total 26,708 families live below the poverty line. Families with 3 or 4 children have the highest poverty rate of 13.1%, comprising of 239 families. On the other hand, families with 5 or more children have the lowest poverty rate of 0.0%, which includes 0 families.
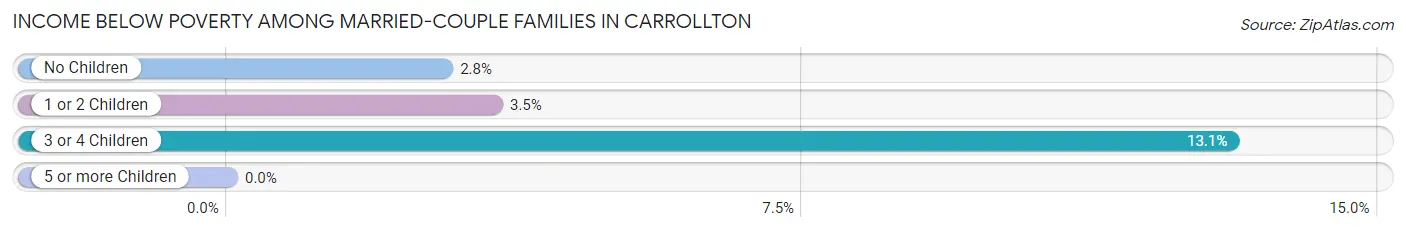
| Children | Above Poverty | Below Poverty |
| No Children | 15,030 (97.2%) | 435 (2.8%) |
| 1 or 2 Children | 9,041 (96.5%) | 324 (3.5%) |
| 3 or 4 Children | 1,589 (86.9%) | 239 (13.1%) |
| 5 or more Children | 50 (100.0%) | 0 (0.0%) |
| Total | 25,710 (96.3%) | 998 (3.7%) |
Income Below Poverty Among Single-Parent Households in Carrollton
According to the poverty data in Carrollton, 6.8% or 151 single-father households and 11.6% or 629 single-mother households are living below the poverty line. Among single-father households, those with 3 or 4 children have the highest poverty rate, with 50 households (25.0%) experiencing poverty. Likewise, among single-mother households, those with 1 or 2 children have the highest poverty rate, with 397 households (16.2%) falling below the poverty line.

| Children | Single Father | Single Mother |
| No Children | 15 (1.0%) | 157 (6.5%) |
| 1 or 2 Children | 86 (14.6%) | 397 (16.2%) |
| 3 or 4 Children | 50 (25.0%) | 75 (14.1%) |
| 5 or more Children | 0 (0.0%) | 0 (0.0%) |
| Total | 151 (6.8%) | 629 (11.6%) |
Income Below Poverty Among Married-Couple vs Single-Parent Households in Carrollton
The poverty data for Carrollton shows that 998 of the married-couple family households (3.7%) and 780 of the single-parent households (10.2%) are living below the poverty level. Within the married-couple family households, those with 3 or 4 children have the highest poverty rate, with 239 households (13.1%) falling below the poverty line. Among the single-parent households, those with 3 or 4 children have the highest poverty rate, with 125 household (17.1%) living below poverty.
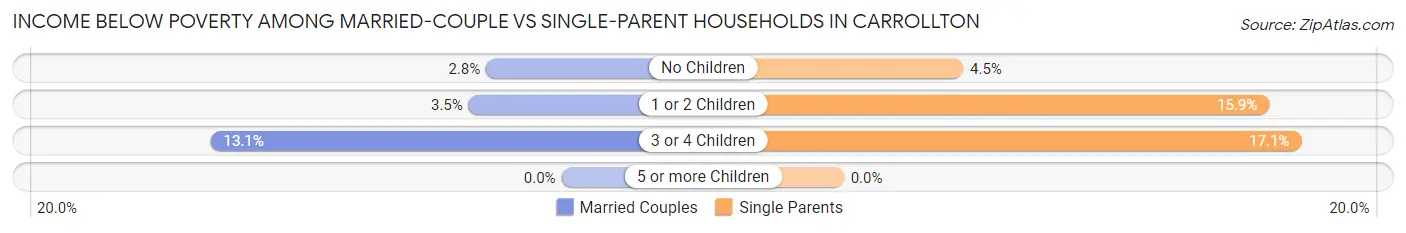
| Children | Married-Couple Families | Single-Parent Households |
| No Children | 435 (2.8%) | 172 (4.4%) |
| 1 or 2 Children | 324 (3.5%) | 483 (15.9%) |
| 3 or 4 Children | 239 (13.1%) | 125 (17.1%) |
| 5 or more Children | 0 (0.0%) | 0 (0.0%) |
| Total | 998 (3.7%) | 780 (10.2%) |
Race in Carrollton
The most populous races in Carrollton are White / Caucasian (75,800 | 57.3%), Hispanic or Latino (42,191 | 31.9%), and Asian (20,473 | 15.5%).
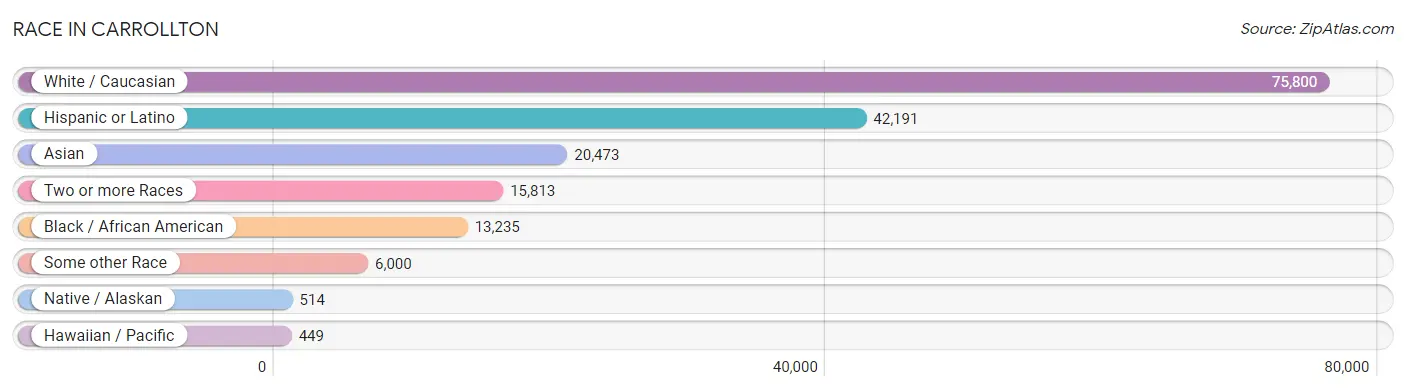
| Race | # Population | % Population |
| Asian | 20,473 | 15.5% |
| Black / African American | 13,235 | 10.0% |
| Hawaiian / Pacific | 449 | 0.3% |
| Hispanic or Latino | 42,191 | 31.9% |
| Native / Alaskan | 514 | 0.4% |
| White / Caucasian | 75,800 | 57.3% |
| Two or more Races | 15,813 | 11.9% |
| Some other Race | 6,000 | 4.5% |
| Total | 132,284 | 100.0% |
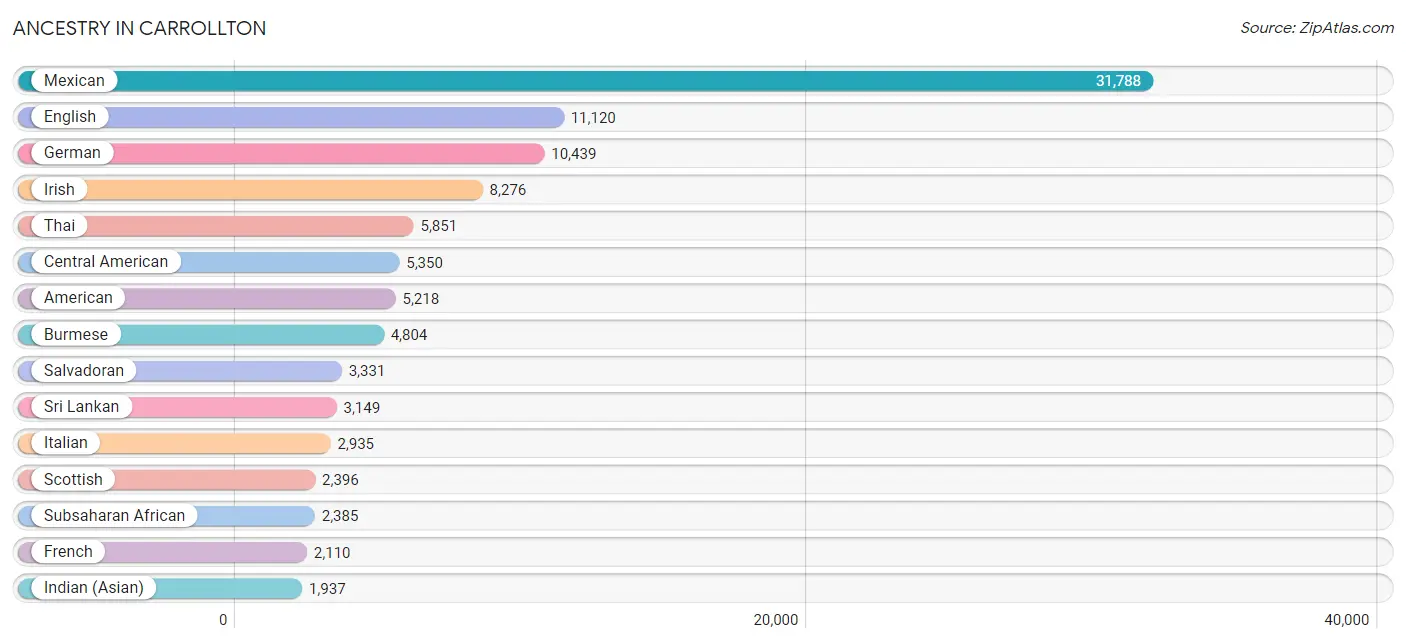
Ancestry in Carrollton
The most populous ancestries reported in Carrollton are Mexican (31,788 | 24.0%), English (11,120 | 8.4%), German (10,439 | 7.9%), Irish (8,276 | 6.3%), and Thai (5,851 | 4.4%), together accounting for 51.0% of all Carrollton residents.
| Ancestry | # Population | % Population |
| Afghan | 47 | 0.0% |
| African | 1,157 | 0.9% |
| Albanian | 11 | 0.0% |
| American | 5,218 | 3.9% |
| Arab | 554 | 0.4% |
| Armenian | 68 | 0.1% |
| Austrian | 201 | 0.2% |
| Basque | 31 | 0.0% |
| Belgian | 34 | 0.0% |
| Belizean | 124 | 0.1% |
| Bhutanese | 192 | 0.2% |
| Blackfeet | 36 | 0.0% |
| Bolivian | 187 | 0.1% |
| Brazilian | 177 | 0.1% |
| British | 1,492 | 1.1% |
| Bulgarian | 50 | 0.0% |
| Burmese | 4,804 | 3.6% |
| Cajun | 12 | 0.0% |
| Cambodian | 19 | 0.0% |
| Canadian | 251 | 0.2% |
| Celtic | 37 | 0.0% |
| Central American | 5,350 | 4.0% |
| Central American Indian | 224 | 0.2% |
| Cherokee | 280 | 0.2% |
| Chickasaw | 114 | 0.1% |
| Chilean | 57 | 0.0% |
| Choctaw | 279 | 0.2% |
| Colombian | 605 | 0.5% |
| Comanche | 6 | 0.0% |
| Costa Rican | 83 | 0.1% |
| Creek | 24 | 0.0% |
| Croatian | 68 | 0.1% |
| Cuban | 1,269 | 1.0% |
| Czech | 687 | 0.5% |
| Czechoslovakian | 67 | 0.1% |
| Danish | 679 | 0.5% |
| Dominican | 41 | 0.0% |
| Dutch | 949 | 0.7% |
| Eastern European | 203 | 0.2% |
| Ecuadorian | 69 | 0.1% |
| Egyptian | 11 | 0.0% |
| English | 11,120 | 8.4% |
| Estonian | 28 | 0.0% |
| Ethiopian | 132 | 0.1% |
| European | 1,717 | 1.3% |
| Filipino | 172 | 0.1% |
| Finnish | 64 | 0.1% |
| French | 2,110 | 1.6% |
| French Canadian | 443 | 0.3% |
| German | 10,439 | 7.9% |
| Ghanaian | 37 | 0.0% |
| Greek | 311 | 0.2% |
| Guatemalan | 673 | 0.5% |
| Guyanese | 10 | 0.0% |
| Honduran | 988 | 0.7% |
| Hungarian | 167 | 0.1% |
| Indian (Asian) | 1,937 | 1.5% |
| Indonesian | 16 | 0.0% |
| Iranian | 166 | 0.1% |
| Iraqi | 20 | 0.0% |
| Irish | 8,276 | 6.3% |
| Italian | 2,935 | 2.2% |
| Jamaican | 86 | 0.1% |
| Japanese | 842 | 0.6% |
| Jordanian | 35 | 0.0% |
| Kenyan | 30 | 0.0% |
| Korean | 872 | 0.7% |
| Laotian | 129 | 0.1% |
| Latvian | 51 | 0.0% |
| Lebanese | 96 | 0.1% |
| Liberian | 212 | 0.2% |
| Lithuanian | 158 | 0.1% |
| Malaysian | 189 | 0.1% |
| Menominee | 6 | 0.0% |
| Mexican | 31,788 | 24.0% |
| Mexican American Indian | 213 | 0.2% |
| Mongolian | 25 | 0.0% |
| Native Hawaiian | 590 | 0.4% |
| Navajo | 59 | 0.0% |
| New Zealander | 6 | 0.0% |
| Nicaraguan | 251 | 0.2% |
| Nigerian | 594 | 0.4% |
| Northern European | 293 | 0.2% |
| Norwegian | 1,082 | 0.8% |
| Pakistani | 202 | 0.2% |
| Palestinian | 214 | 0.2% |
| Panamanian | 24 | 0.0% |
| Peruvian | 272 | 0.2% |
| Polish | 1,511 | 1.1% |
| Portuguese | 187 | 0.1% |
| Potawatomi | 4 | 0.0% |
| Puerto Rican | 676 | 0.5% |
| Romanian | 151 | 0.1% |
| Russian | 400 | 0.3% |
| Salvadoran | 3,331 | 2.5% |
| Samoan | 45 | 0.0% |
| Scandinavian | 563 | 0.4% |
| Scotch-Irish | 1,184 | 0.9% |
| Scottish | 2,396 | 1.8% |
| Serbian | 54 | 0.0% |
| Sierra Leonean | 18 | 0.0% |
| Slavic | 5 | 0.0% |
| Slovak | 88 | 0.1% |
| Slovene | 78 | 0.1% |
| South African | 31 | 0.0% |
| South American | 1,865 | 1.4% |
| Spaniard | 194 | 0.2% |
| Spanish | 120 | 0.1% |
| Spanish American | 8 | 0.0% |
| Sri Lankan | 3,149 | 2.4% |
| Subsaharan African | 2,385 | 1.8% |
| Swedish | 658 | 0.5% |
| Swiss | 127 | 0.1% |
| Syrian | 40 | 0.0% |
| Thai | 5,851 | 4.4% |
| Trinidadian and Tobagonian | 18 | 0.0% |
| Turkish | 87 | 0.1% |
| Ukrainian | 145 | 0.1% |
| Ute | 8 | 0.0% |
| Venezuelan | 673 | 0.5% |
| Vietnamese | 251 | 0.2% |
| Welsh | 505 | 0.4% |
| Yaqui | 78 | 0.1% |
| Yugoslavian | 27 | 0.0% |
| Zimbabwean | 47 | 0.0% | View All 125 Rows |
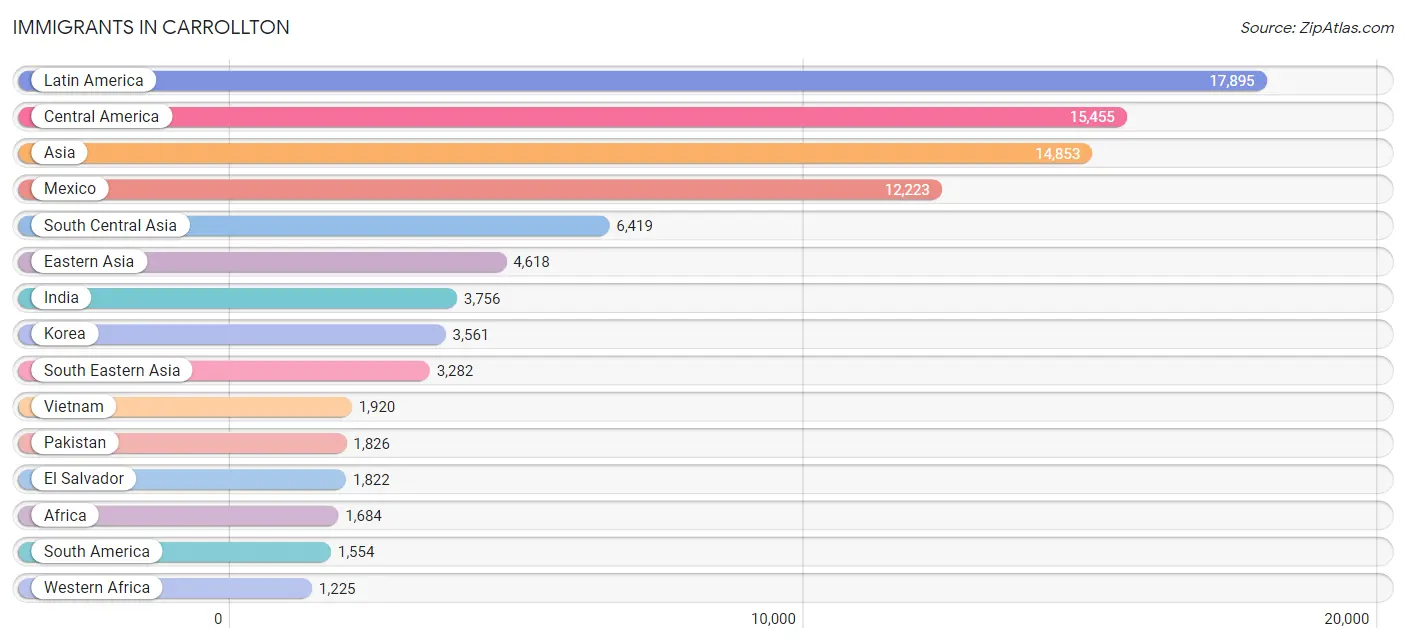
Immigrants in Carrollton
The most numerous immigrant groups reported in Carrollton came from Latin America (17,895 | 13.5%), Central America (15,455 | 11.7%), Asia (14,853 | 11.2%), Mexico (12,223 | 9.2%), and South Central Asia (6,419 | 4.9%), together accounting for 50.5% of all Carrollton residents.
| Immigration Origin | # Population | % Population |
| Afghanistan | 32 | 0.0% |
| Africa | 1,684 | 1.3% |
| Albania | 11 | 0.0% |
| Asia | 14,853 | 11.2% |
| Australia | 37 | 0.0% |
| Bangladesh | 366 | 0.3% |
| Belize | 102 | 0.1% |
| Bolivia | 67 | 0.1% |
| Brazil | 138 | 0.1% |
| Bulgaria | 39 | 0.0% |
| Cambodia | 578 | 0.4% |
| Cameroon | 19 | 0.0% |
| Canada | 635 | 0.5% |
| Caribbean | 886 | 0.7% |
| Central America | 15,455 | 11.7% |
| Chile | 42 | 0.0% |
| China | 1,034 | 0.8% |
| Colombia | 490 | 0.4% |
| Congo | 11 | 0.0% |
| Costa Rica | 72 | 0.1% |
| Cuba | 652 | 0.5% |
| Czechoslovakia | 16 | 0.0% |
| Dominican Republic | 98 | 0.1% |
| Eastern Africa | 313 | 0.2% |
| Eastern Asia | 4,618 | 3.5% |
| Eastern Europe | 509 | 0.4% |
| Ecuador | 17 | 0.0% |
| Egypt | 18 | 0.0% |
| El Salvador | 1,822 | 1.4% |
| England | 25 | 0.0% |
| Eritrea | 20 | 0.0% |
| Ethiopia | 107 | 0.1% |
| Europe | 1,162 | 0.9% |
| France | 138 | 0.1% |
| Germany | 124 | 0.1% |
| Ghana | 216 | 0.2% |
| Greece | 38 | 0.0% |
| Guatemala | 337 | 0.3% |
| Guyana | 36 | 0.0% |
| Honduras | 650 | 0.5% |
| Hong Kong | 72 | 0.1% |
| Hungary | 21 | 0.0% |
| India | 3,756 | 2.8% |
| Indonesia | 40 | 0.0% |
| Iran | 156 | 0.1% |
| Ireland | 46 | 0.0% |
| Italy | 54 | 0.0% |
| Jamaica | 18 | 0.0% |
| Japan | 17 | 0.0% |
| Jordan | 51 | 0.0% |
| Kenya | 123 | 0.1% |
| Korea | 3,561 | 2.7% |
| Kuwait | 23 | 0.0% |
| Laos | 162 | 0.1% |
| Latin America | 17,895 | 13.5% |
| Latvia | 20 | 0.0% |
| Lebanon | 9 | 0.0% |
| Liberia | 151 | 0.1% |
| Malaysia | 34 | 0.0% |
| Mexico | 12,223 | 9.2% |
| Micronesia | 39 | 0.0% |
| Middle Africa | 30 | 0.0% |
| Nepal | 249 | 0.2% |
| Nicaragua | 225 | 0.2% |
| Nigeria | 494 | 0.4% |
| Northern Africa | 39 | 0.0% |
| Northern Europe | 299 | 0.2% |
| Oceania | 120 | 0.1% |
| Pakistan | 1,826 | 1.4% |
| Panama | 24 | 0.0% |
| Peru | 187 | 0.1% |
| Philippines | 429 | 0.3% |
| Poland | 205 | 0.2% |
| Romania | 59 | 0.0% |
| Russia | 86 | 0.1% |
| Saudi Arabia | 194 | 0.2% |
| Scotland | 49 | 0.0% |
| Sierra Leone | 45 | 0.0% |
| South Africa | 77 | 0.1% |
| South America | 1,554 | 1.2% |
| South Central Asia | 6,419 | 4.9% |
| South Eastern Asia | 3,282 | 2.5% |
| Southern Europe | 92 | 0.1% |
| Sri Lanka | 34 | 0.0% |
| Syria | 22 | 0.0% |
| Taiwan | 194 | 0.2% |
| Thailand | 113 | 0.1% |
| Trinidad and Tobago | 12 | 0.0% |
| Turkey | 31 | 0.0% |
| Uganda | 28 | 0.0% |
| Ukraine | 52 | 0.0% |
| Venezuela | 577 | 0.4% |
| Vietnam | 1,920 | 1.5% |
| West Indies | 70 | 0.1% |
| Western Africa | 1,225 | 0.9% |
| Western Asia | 426 | 0.3% |
| Western Europe | 262 | 0.2% |
| Zimbabwe | 18 | 0.0% | View All 98 Rows |
Sex and Age in Carrollton
Sex and Age in Carrollton
The most populous age groups in Carrollton are 25 to 29 Years (5,601 | 8.5%) for men and 35 to 39 Years (5,824 | 8.7%) for women.
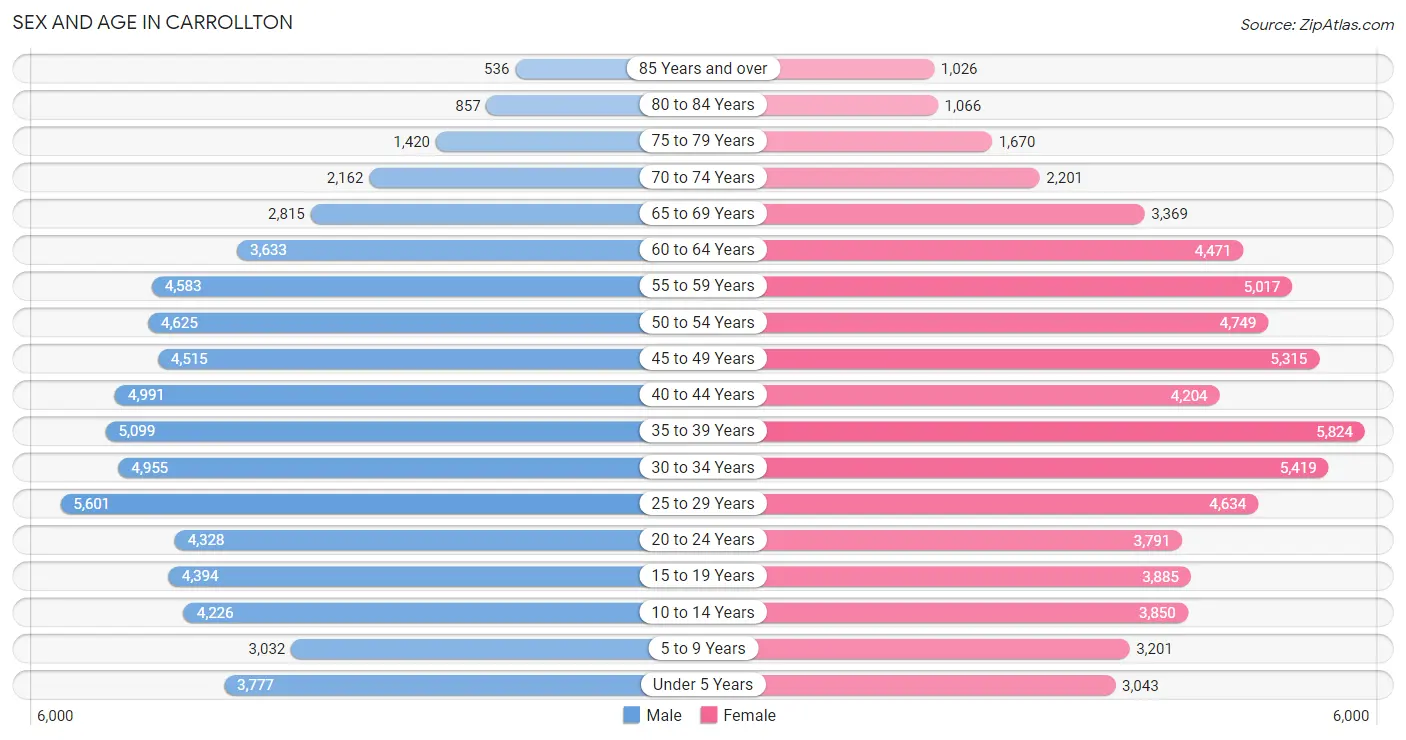
| Age Bracket | Male | Female |
| Under 5 Years | 3,777 (5.8%) | 3,043 (4.6%) |
| 5 to 9 Years | 3,032 (4.6%) | 3,201 (4.8%) |
| 10 to 14 Years | 4,226 (6.5%) | 3,850 (5.8%) |
| 15 to 19 Years | 4,394 (6.7%) | 3,885 (5.8%) |
| 20 to 24 Years | 4,328 (6.6%) | 3,791 (5.7%) |
| 25 to 29 Years | 5,601 (8.5%) | 4,634 (6.9%) |
| 30 to 34 Years | 4,955 (7.6%) | 5,419 (8.1%) |
| 35 to 39 Years | 5,099 (7.8%) | 5,824 (8.7%) |
| 40 to 44 Years | 4,991 (7.6%) | 4,204 (6.3%) |
| 45 to 49 Years | 4,515 (6.9%) | 5,315 (8.0%) |
| 50 to 54 Years | 4,625 (7.1%) | 4,749 (7.1%) |
| 55 to 59 Years | 4,583 (7.0%) | 5,017 (7.5%) |
| 60 to 64 Years | 3,633 (5.5%) | 4,471 (6.7%) |
| 65 to 69 Years | 2,815 (4.3%) | 3,369 (5.1%) |
| 70 to 74 Years | 2,162 (3.3%) | 2,201 (3.3%) |
| 75 to 79 Years | 1,420 (2.2%) | 1,670 (2.5%) |
| 80 to 84 Years | 857 (1.3%) | 1,066 (1.6%) |
| 85 Years and over | 536 (0.8%) | 1,026 (1.5%) |
| Total | 65,549 (100.0%) | 66,735 (100.0%) |
Families and Households in Carrollton
Median Family Size in Carrollton
The median family size in Carrollton is 3.16 persons per family, with married-couple families (26,708 | 77.7%) accounting for the largest median family size of 3.18 persons per family. On the other hand, single male/father families (2,238 | 6.5%) represent the smallest median family size with 2.95 persons per family.
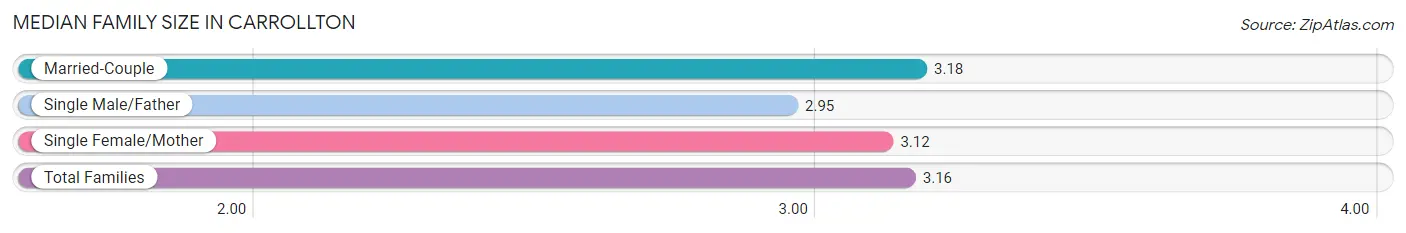
| Family Type | # Families | Family Size |
| Married-Couple | 26,708 (77.7%) | 3.18 |
| Single Male/Father | 2,238 (6.5%) | 2.95 |
| Single Female/Mother | 5,403 (15.7%) | 3.12 |
| Total Families | 34,349 (100.0%) | 3.16 |
Median Household Size in Carrollton
The median household size in Carrollton is 2.61 persons per household, with single female/mother households (5,403 | 10.7%) accounting for the largest median household size of 3.37 persons per household. non-family households (16,020 | 31.8%) represent the smallest median household size with 1.29 persons per household.
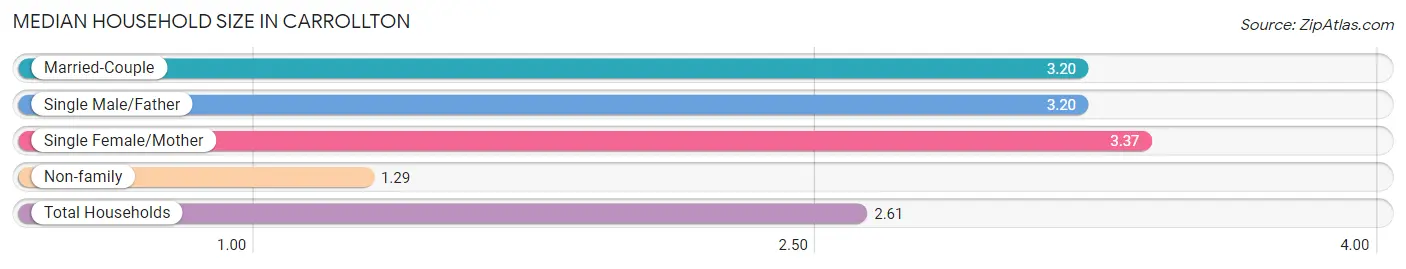
| Household Type | # Households | Household Size |
| Married-Couple | 26,708 (53.0%) | 3.20 |
| Single Male/Father | 2,238 (4.4%) | 3.20 |
| Single Female/Mother | 5,403 (10.7%) | 3.37 |
| Non-family | 16,020 (31.8%) | 1.29 |
| Total Households | 50,369 (100.0%) | 2.61 |
Household Size by Marriage Status in Carrollton
Out of a total of 50,369 households in Carrollton, 34,349 (68.2%) are family households, while 16,020 (31.8%) are nonfamily households. The most numerous type of family households are 2-person households, comprising 14,048, and the most common type of nonfamily households are 1-person households, comprising 12,445.
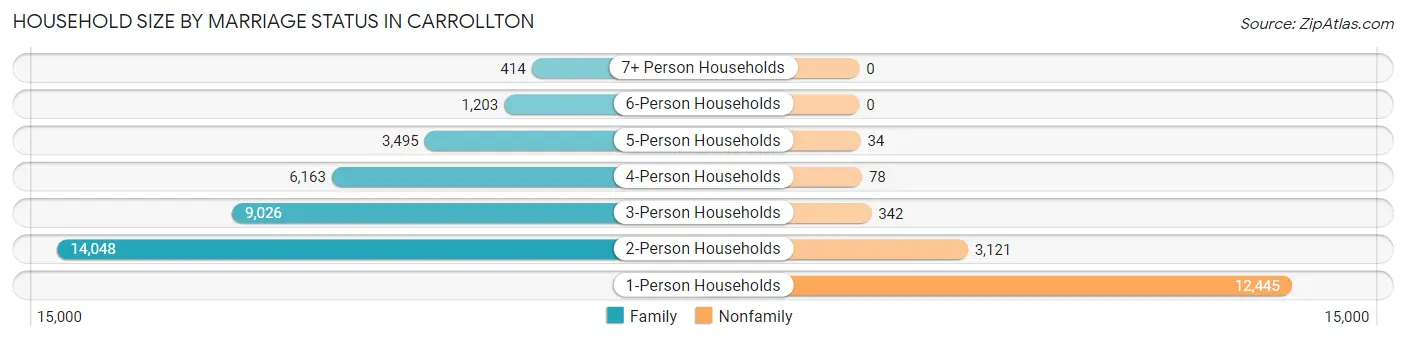
| Household Size | Family Households | Nonfamily Households |
| 1-Person Households | - | 12,445 (24.7%) |
| 2-Person Households | 14,048 (27.9%) | 3,121 (6.2%) |
| 3-Person Households | 9,026 (17.9%) | 342 (0.7%) |
| 4-Person Households | 6,163 (12.2%) | 78 (0.2%) |
| 5-Person Households | 3,495 (6.9%) | 34 (0.1%) |
| 6-Person Households | 1,203 (2.4%) | 0 (0.0%) |
| 7+ Person Households | 414 (0.8%) | 0 (0.0%) |
| Total | 34,349 (68.2%) | 16,020 (31.8%) |
Female Fertility in Carrollton
Fertility by Age in Carrollton
Average fertility rate in Carrollton is 42.0 births per 1,000 women. Women in the age bracket of 20 to 34 years have the highest fertility rate with 73.0 births per 1,000 women. Women in the age bracket of 20 to 34 years acount for 71.3% of all women with births.
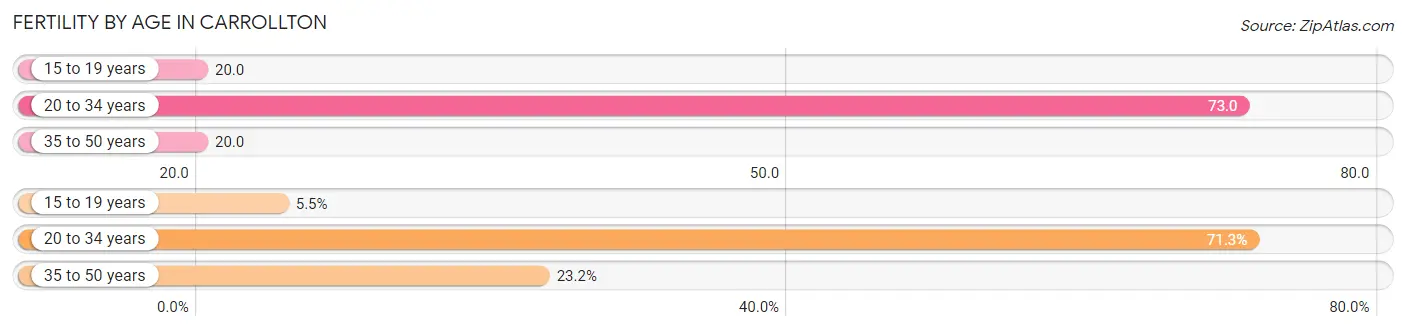
| Age Bracket | Women with Births | Births / 1,000 Women |
| 15 to 19 years | 78 (5.5%) | 20.0 |
| 20 to 34 years | 1,015 (71.3%) | 73.0 |
| 35 to 50 years | 330 (23.2%) | 20.0 |
| Total | 1,423 (100.0%) | 42.0 |
Fertility by Age by Marriage Status in Carrollton
84.3% of women with births (1,423) in Carrollton are married. The highest percentage of unmarried women with births falls into 20 to 34 years age bracket with 19.2% of them unmarried at the time of birth, while the lowest percentage of unmarried women with births belong to 15 to 19 years age bracket with 0.0% of them unmarried.
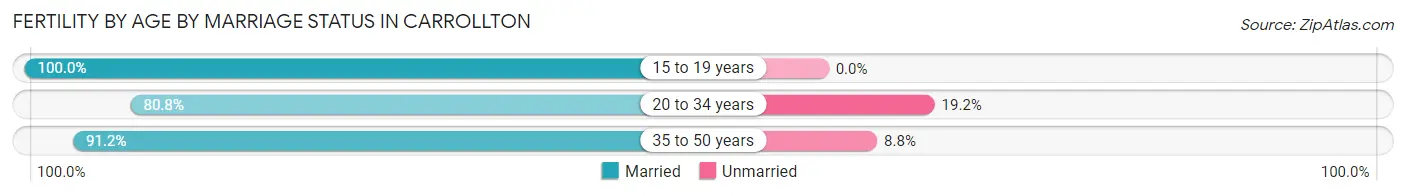
| Age Bracket | Married | Unmarried |
| 15 to 19 years | 78 (100.0%) | 0 (0.0%) |
| 20 to 34 years | 820 (80.8%) | 195 (19.2%) |
| 35 to 50 years | 301 (91.2%) | 29 (8.8%) |
| Total | 1,200 (84.3%) | 223 (15.7%) |
Fertility by Education in Carrollton
Average fertility rate in Carrollton is 42.0 births per 1,000 women. Women with the education attainment of graduate degree have the highest fertility rate of 61.0 births per 1,000 women, while women with the education attainment of less than high school have the lowest fertility at 23.0 births per 1,000 women. Women with the education attainment of bachelor's degree represent 28.2% of all women with births.
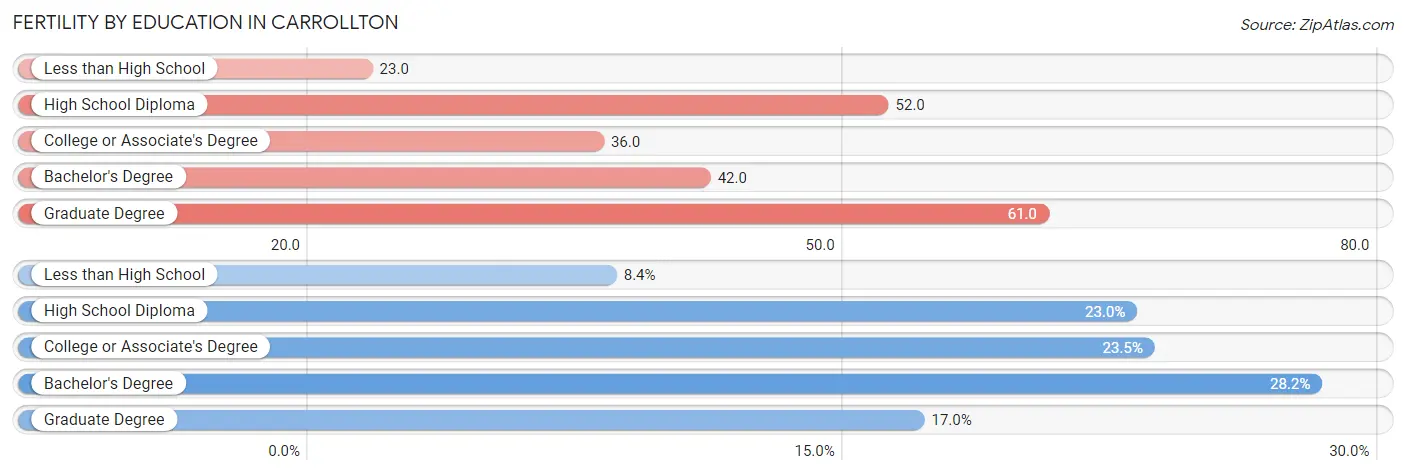
| Educational Attainment | Women with Births | Births / 1,000 Women |
| Less than High School | 119 (8.4%) | 23.0 |
| High School Diploma | 327 (23.0%) | 52.0 |
| College or Associate's Degree | 334 (23.5%) | 36.0 |
| Bachelor's Degree | 401 (28.2%) | 42.0 |
| Graduate Degree | 242 (17.0%) | 61.0 |
| Total | 1,423 (100.0%) | 42.0 |
Fertility by Education by Marriage Status in Carrollton
15.7% of women with births in Carrollton are unmarried. Women with the educational attainment of college or associate's degree are most likely to be married with 98.5% of them married at childbirth, while women with the educational attainment of high school diploma are least likely to be married with 39.1% of them unmarried at childbirth.
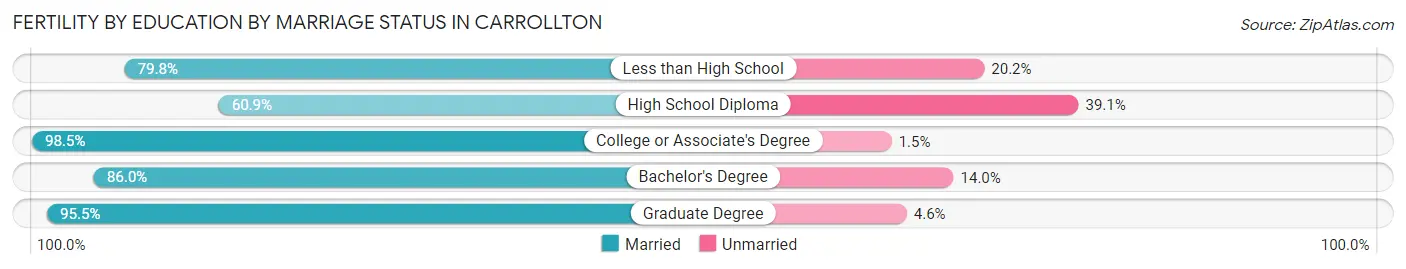
| Educational Attainment | Married | Unmarried |
| Less than High School | 95 (79.8%) | 24 (20.2%) |
| High School Diploma | 199 (60.9%) | 128 (39.1%) |
| College or Associate's Degree | 329 (98.5%) | 5 (1.5%) |
| Bachelor's Degree | 345 (86.0%) | 56 (14.0%) |
| Graduate Degree | 231 (95.5%) | 11 (4.5%) |
| Total | 1,200 (84.3%) | 223 (15.7%) |
Employment Characteristics in Carrollton
Employment by Class of Employer in Carrollton
Among the 76,870 employed individuals in Carrollton, private company employees (58,806 | 76.5%), self-employed (not incorporated) (5,465 | 7.1%), and local government employees (4,026 | 5.2%) make up the most common classes of employment.
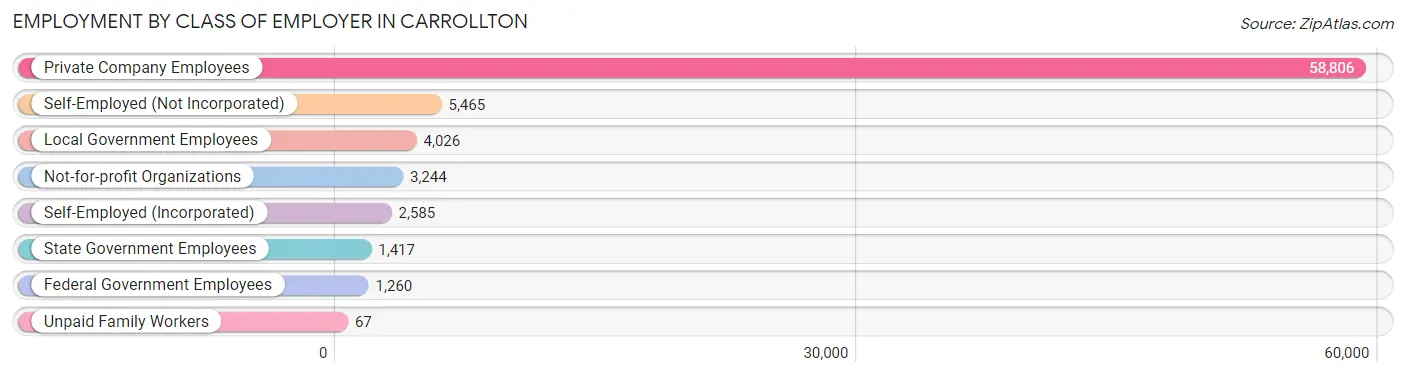
| Employer Class | # Employees | % Employees |
| Private Company Employees | 58,806 | 76.5% |
| Self-Employed (Incorporated) | 2,585 | 3.4% |
| Self-Employed (Not Incorporated) | 5,465 | 7.1% |
| Not-for-profit Organizations | 3,244 | 4.2% |
| Local Government Employees | 4,026 | 5.2% |
| State Government Employees | 1,417 | 1.8% |
| Federal Government Employees | 1,260 | 1.6% |
| Unpaid Family Workers | 67 | 0.1% |
| Total | 76,870 | 100.0% |
Employment Status by Age in Carrollton
According to the labor force statistics for Carrollton, out of the total population over 16 years of age (109,524), 74.1% or 81,157 individuals are in the labor force, with 3.7% or 3,003 of them unemployed. The age group with the highest labor force participation rate is 45 to 54 years, with 89.7% or 17,226 individuals in the labor force. Within the labor force, the 16 to 19 years age range has the highest percentage of unemployed individuals, with 14.2% or 350 of them being unemployed.
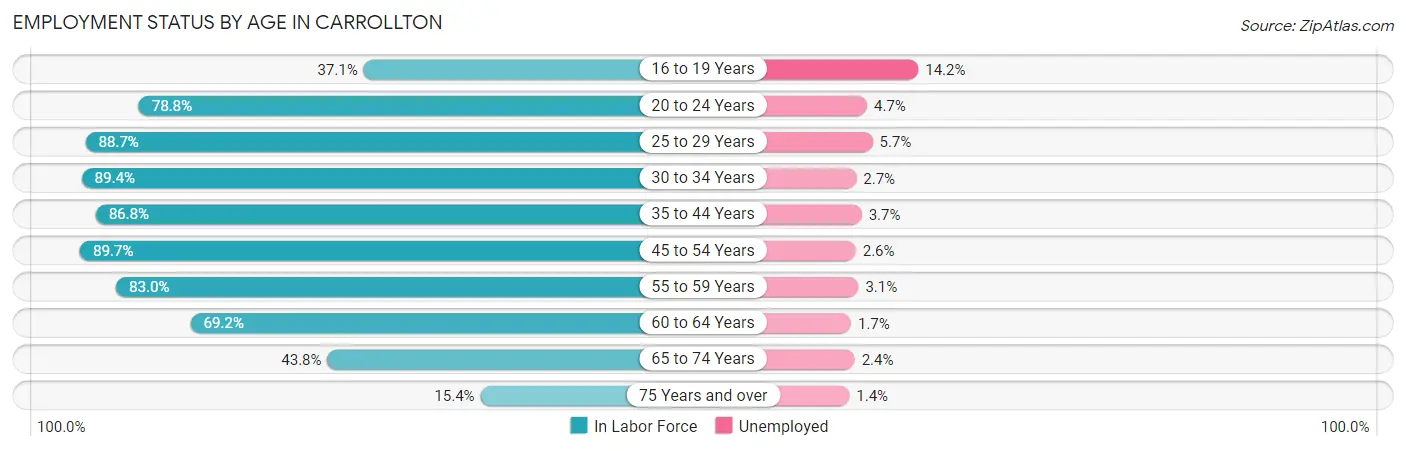
| Age Bracket | In Labor Force | Unemployed |
| 16 to 19 Years | 2,466 (37.1%) | 350 (14.2%) |
| 20 to 24 Years | 6,398 (78.8%) | 301 (4.7%) |
| 25 to 29 Years | 9,078 (88.7%) | 517 (5.7%) |
| 30 to 34 Years | 9,274 (89.4%) | 250 (2.7%) |
| 35 to 44 Years | 17,462 (86.8%) | 646 (3.7%) |
| 45 to 54 Years | 17,226 (89.7%) | 448 (2.6%) |
| 55 to 59 Years | 7,968 (83.0%) | 247 (3.1%) |
| 60 to 64 Years | 5,608 (69.2%) | 95 (1.7%) |
| 65 to 74 Years | 4,620 (43.8%) | 111 (2.4%) |
| 75 Years and over | 1,013 (15.4%) | 14 (1.4%) |
| Total | 81,157 (74.1%) | 3,003 (3.7%) |
Employment Status by Educational Attainment in Carrollton
According to labor force statistics for Carrollton, 85.8% of individuals (66,611) out of the total population between 25 and 64 years of age (77,635) are in the labor force, with 3.3% or 2,198 of them being unemployed. The group with the highest labor force participation rate are those with the educational attainment of bachelor's degree or higher, with 89.6% or 30,198 individuals in the labor force. Within the labor force, individuals with college / associate degree education have the highest percentage of unemployment, with 4.7% or 883 of them being unemployed.
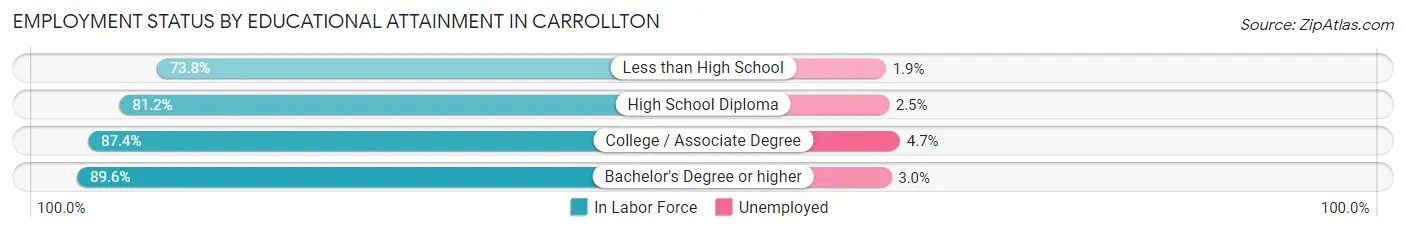
| Educational Attainment | In Labor Force | Unemployed |
| Less than High School | 5,781 (73.8%) | 149 (1.9%) |
| High School Diploma | 11,860 (81.2%) | 365 (2.5%) |
| College / Associate Degree | 18,785 (87.4%) | 1,010 (4.7%) |
| Bachelor's Degree or higher | 30,198 (89.6%) | 1,011 (3.0%) |
| Total | 66,611 (85.8%) | 2,562 (3.3%) |
Employment Occupations by Sex in Carrollton
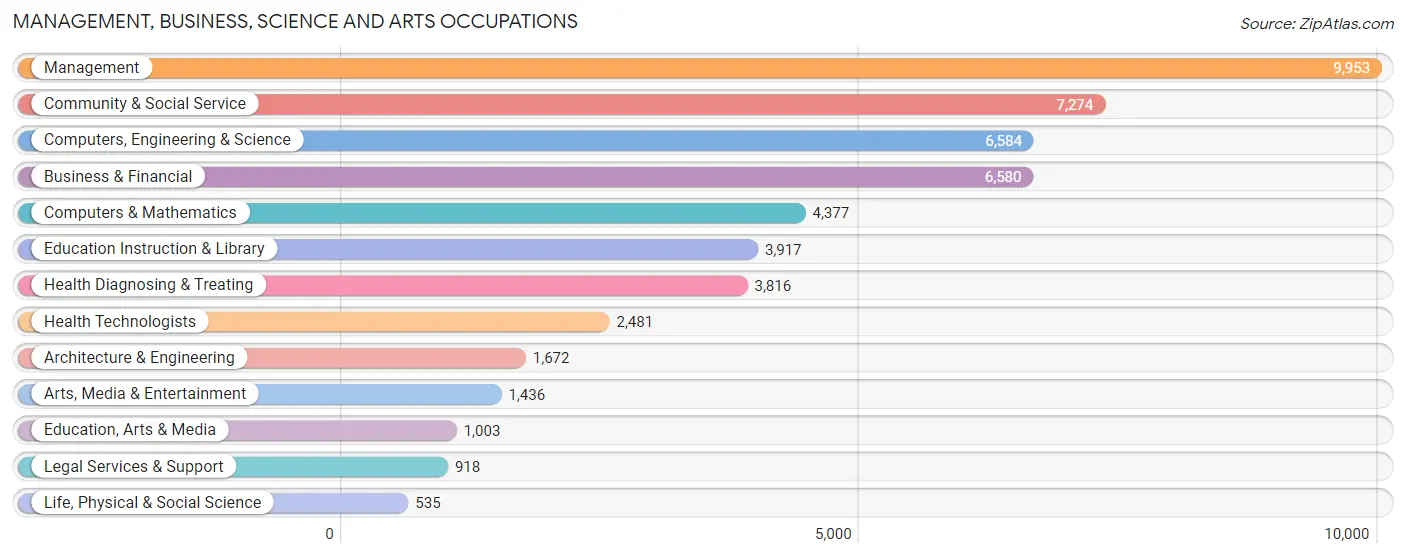
Management, Business, Science and Arts Occupations
The most common Management, Business, Science and Arts occupations in Carrollton are Management (9,953 | 12.7%), Community & Social Service (7,274 | 9.3%), Computers, Engineering & Science (6,584 | 8.4%), Business & Financial (6,580 | 8.4%), and Computers & Mathematics (4,377 | 5.6%).
Management, Business, Science and Arts Occupations by Sex
Within the Management, Business, Science and Arts occupations in Carrollton, the most male-oriented occupations are Architecture & Engineering (86.8%), Computers & Mathematics (77.8%), and Computers, Engineering & Science (76.1%), while the most female-oriented occupations are Health Technologists (81.1%), Education Instruction & Library (78.6%), and Health Diagnosing & Treating (73.9%).
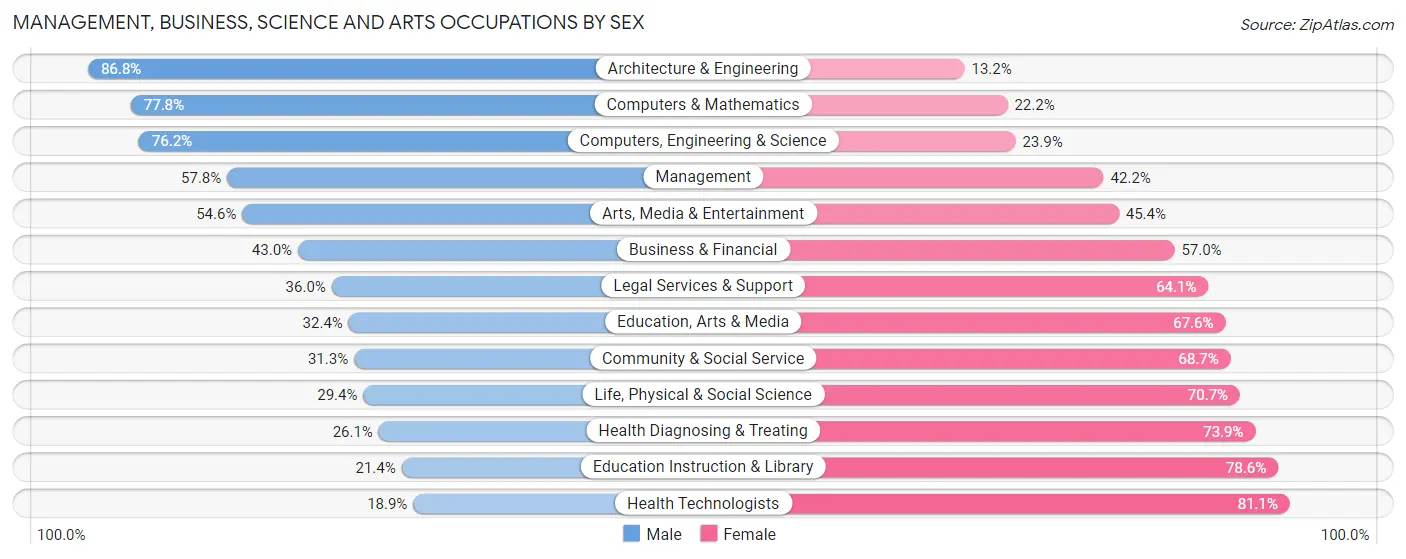
| Occupation | Male | Female |
| Management | 5,749 (57.8%) | 4,204 (42.2%) |
| Business & Financial | 2,829 (43.0%) | 3,751 (57.0%) |
| Computers, Engineering & Science | 5,014 (76.1%) | 1,570 (23.8%) |
| Computers & Mathematics | 3,406 (77.8%) | 971 (22.2%) |
| Architecture & Engineering | 1,451 (86.8%) | 221 (13.2%) |
| Life, Physical & Social Science | 157 (29.3%) | 378 (70.7%) |
| Community & Social Service | 2,276 (31.3%) | 4,998 (68.7%) |
| Education, Arts & Media | 325 (32.4%) | 678 (67.6%) |
| Legal Services & Support | 330 (35.9%) | 588 (64.0%) |
| Education Instruction & Library | 837 (21.4%) | 3,080 (78.6%) |
| Arts, Media & Entertainment | 784 (54.6%) | 652 (45.4%) |
| Health Diagnosing & Treating | 997 (26.1%) | 2,819 (73.9%) |
| Health Technologists | 470 (18.9%) | 2,011 (81.1%) |
| Total (Category) | 16,865 (49.3%) | 17,342 (50.7%) |
| Total (Overall) | 41,130 (52.7%) | 36,966 (47.3%) |
Services Occupations
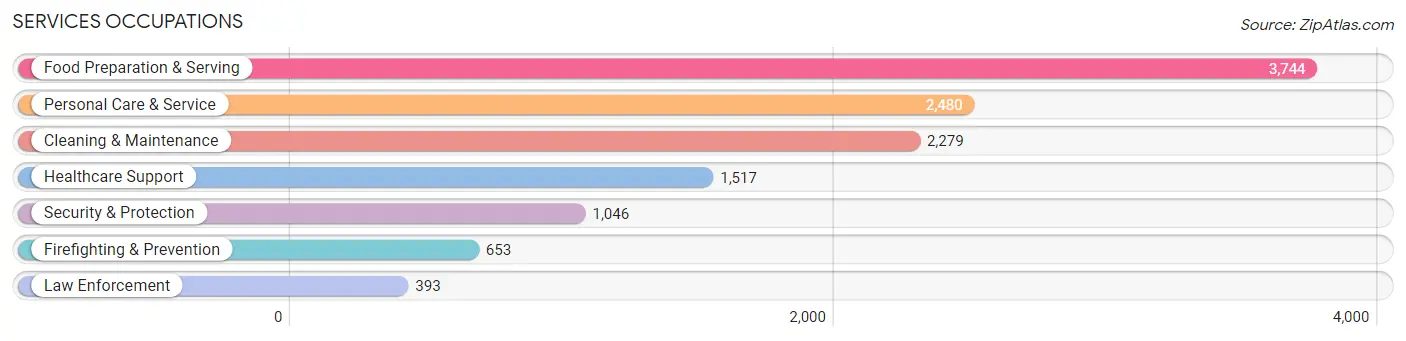
The most common Services occupations in Carrollton are Food Preparation & Serving (3,744 | 4.8%), Personal Care & Service (2,480 | 3.2%), Cleaning & Maintenance (2,279 | 2.9%), Healthcare Support (1,517 | 1.9%), and Security & Protection (1,046 | 1.3%).
Services Occupations by Sex
Within the Services occupations in Carrollton, the most male-oriented occupations are Law Enforcement (84.7%), Security & Protection (84.1%), and Firefighting & Prevention (83.8%), while the most female-oriented occupations are Healthcare Support (90.0%), Personal Care & Service (79.7%), and Cleaning & Maintenance (47.8%).
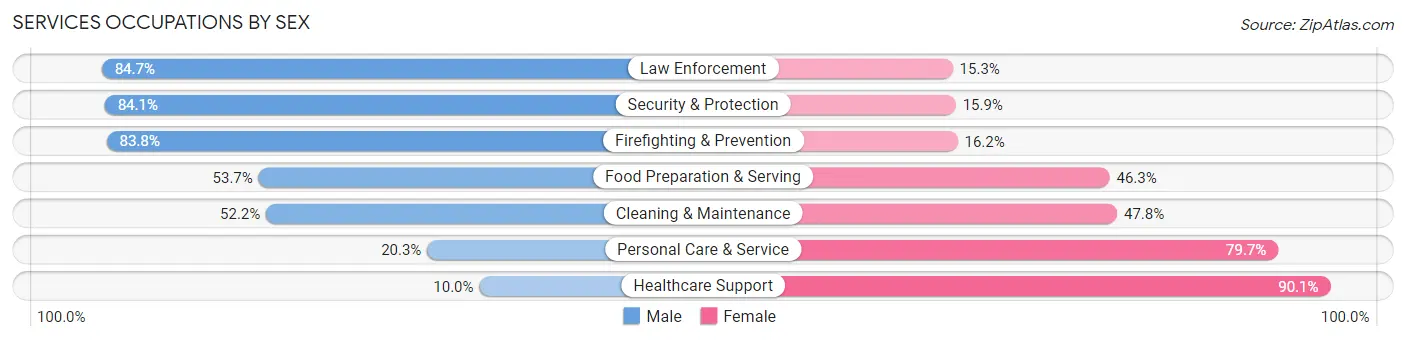
| Occupation | Male | Female |
| Healthcare Support | 151 (10.0%) | 1,366 (90.0%) |
| Security & Protection | 880 (84.1%) | 166 (15.9%) |
| Firefighting & Prevention | 547 (83.8%) | 106 (16.2%) |
| Law Enforcement | 333 (84.7%) | 60 (15.3%) |
| Food Preparation & Serving | 2,009 (53.7%) | 1,735 (46.3%) |
| Cleaning & Maintenance | 1,189 (52.2%) | 1,090 (47.8%) |
| Personal Care & Service | 503 (20.3%) | 1,977 (79.7%) |
| Total (Category) | 4,732 (42.8%) | 6,334 (57.2%) |
| Total (Overall) | 41,130 (52.7%) | 36,966 (47.3%) |
Sales and Office Occupations
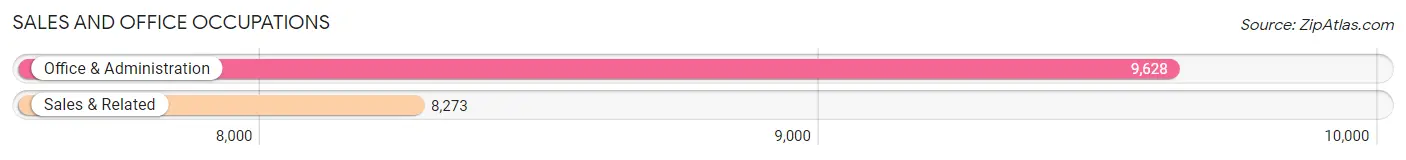
The most common Sales and Office occupations in Carrollton are Office & Administration (9,628 | 12.3%), and Sales & Related (8,273 | 10.6%).
Sales and Office Occupations by Sex
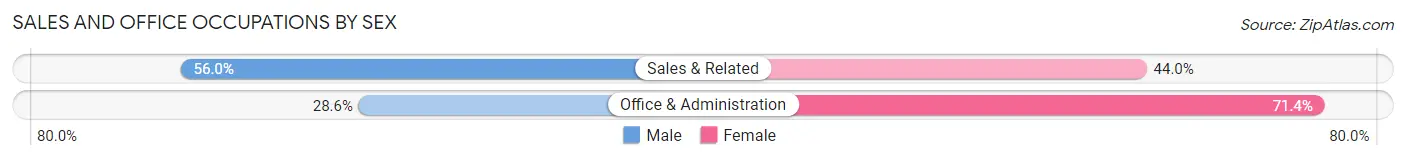
| Occupation | Male | Female |
| Sales & Related | 4,632 (56.0%) | 3,641 (44.0%) |
| Office & Administration | 2,753 (28.6%) | 6,875 (71.4%) |
| Total (Category) | 7,385 (41.2%) | 10,516 (58.8%) |
| Total (Overall) | 41,130 (52.7%) | 36,966 (47.3%) |
Natural Resources, Construction and Maintenance Occupations
The most common Natural Resources, Construction and Maintenance occupations in Carrollton are Construction & Extraction (3,596 | 4.6%), and Installation, Maintenance & Repair (2,473 | 3.2%).
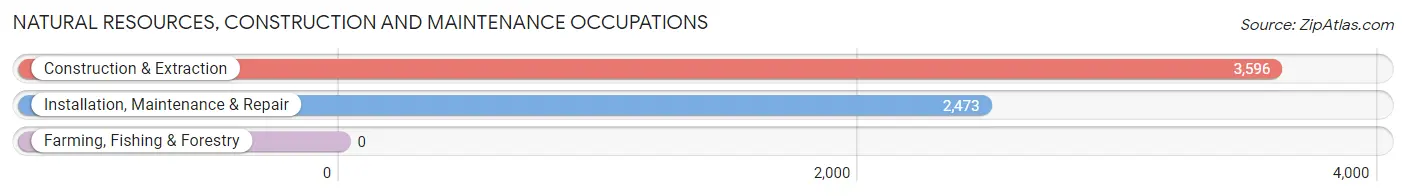
Natural Resources, Construction and Maintenance Occupations by Sex
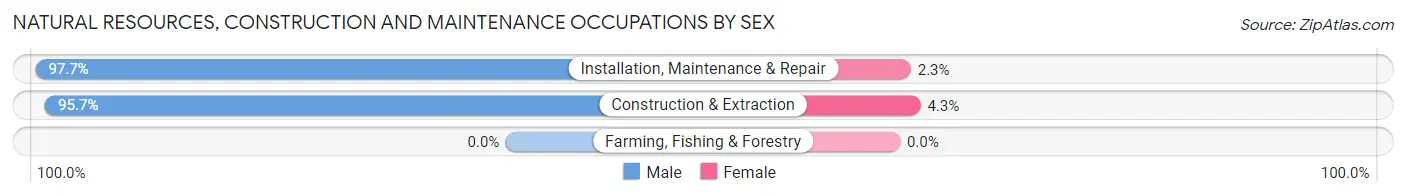
| Occupation | Male | Female |
| Farming, Fishing & Forestry | 0 (0.0%) | 0 (0.0%) |
| Construction & Extraction | 3,442 (95.7%) | 154 (4.3%) |
| Installation, Maintenance & Repair | 2,417 (97.7%) | 56 (2.3%) |
| Total (Category) | 5,859 (96.5%) | 210 (3.5%) |
| Total (Overall) | 41,130 (52.7%) | 36,966 (47.3%) |
Production, Transportation and Moving Occupations
The most common Production, Transportation and Moving occupations in Carrollton are Production (4,252 | 5.4%), Material Moving (2,523 | 3.2%), and Transportation (2,078 | 2.7%).
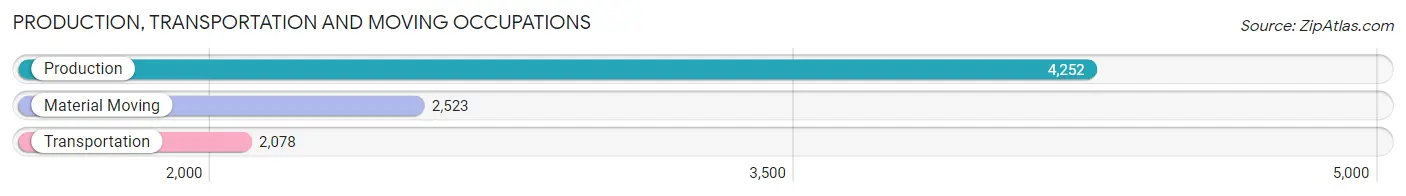
Production, Transportation and Moving Occupations by Sex
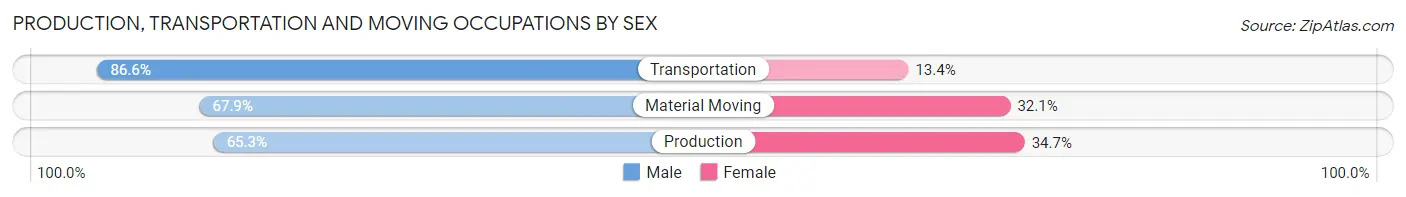
| Occupation | Male | Female |
| Production | 2,776 (65.3%) | 1,476 (34.7%) |
| Transportation | 1,800 (86.6%) | 278 (13.4%) |
| Material Moving | 1,713 (67.9%) | 810 (32.1%) |
| Total (Category) | 6,289 (71.0%) | 2,564 (29.0%) |
| Total (Overall) | 41,130 (52.7%) | 36,966 (47.3%) |
Employment Industries by Sex in Carrollton
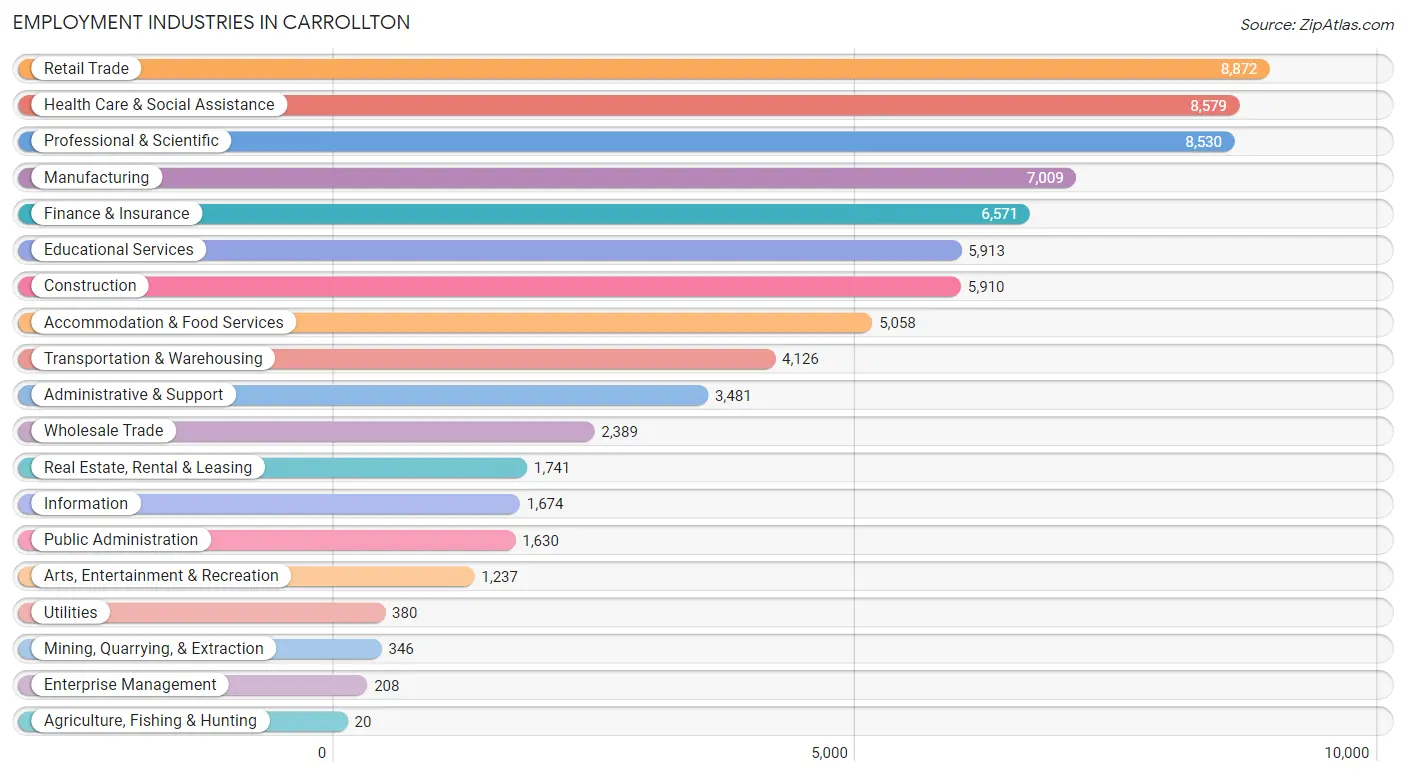
Employment Industries in Carrollton
The major employment industries in Carrollton include Retail Trade (8,872 | 11.4%), Health Care & Social Assistance (8,579 | 11.0%), Professional & Scientific (8,530 | 10.9%), Manufacturing (7,009 | 9.0%), and Finance & Insurance (6,571 | 8.4%).
Employment Industries by Sex in Carrollton
The Carrollton industries that see more men than women are Agriculture, Fishing & Hunting (100.0%), Construction (86.6%), and Transportation & Warehousing (75.8%), whereas the industries that tend to have a higher number of women are Health Care & Social Assistance (78.6%), Educational Services (73.5%), and Finance & Insurance (56.4%).
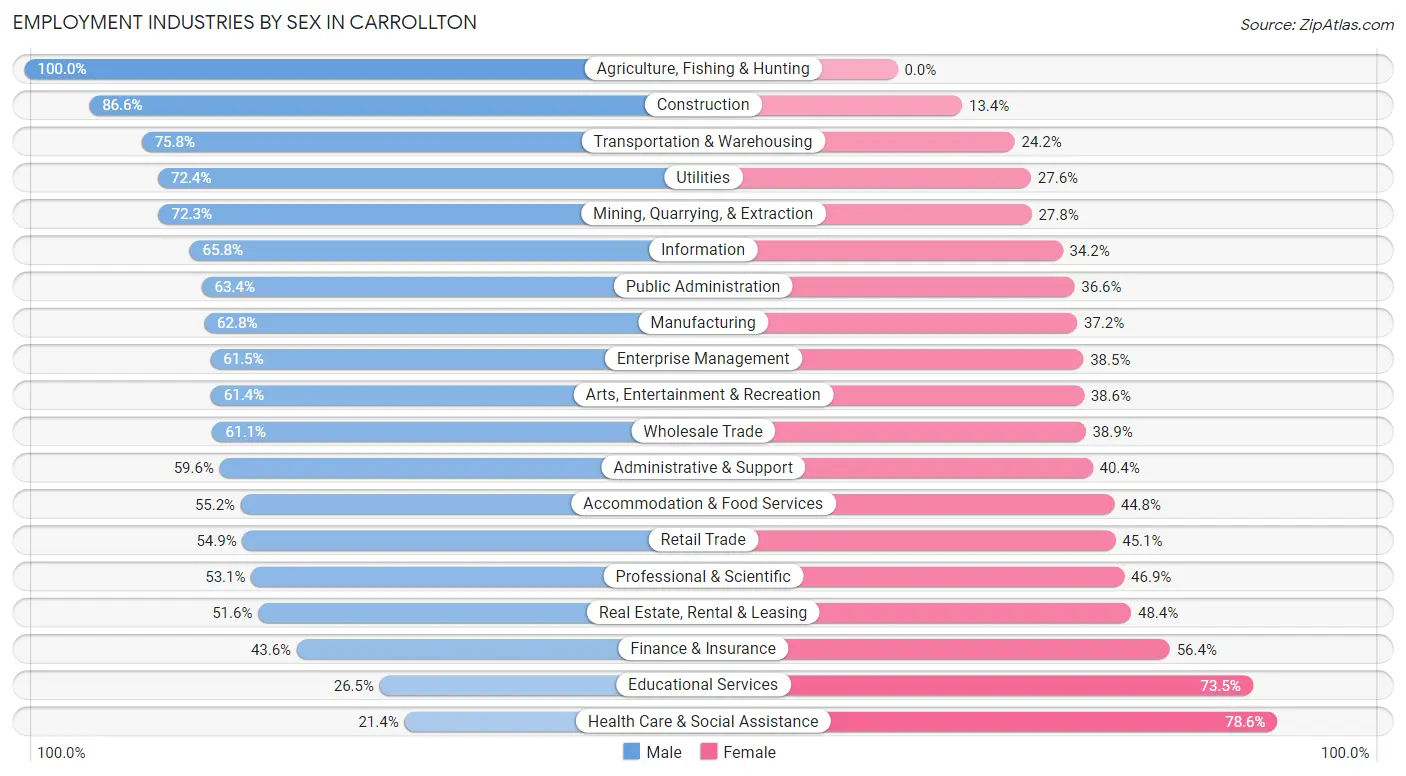
| Industry | Male | Female |
| Agriculture, Fishing & Hunting | 20 (100.0%) | 0 (0.0%) |
| Mining, Quarrying, & Extraction | 250 (72.3%) | 96 (27.8%) |
| Construction | 5,119 (86.6%) | 791 (13.4%) |
| Manufacturing | 4,404 (62.8%) | 2,605 (37.2%) |
| Wholesale Trade | 1,459 (61.1%) | 930 (38.9%) |
| Retail Trade | 4,871 (54.9%) | 4,001 (45.1%) |
| Transportation & Warehousing | 3,126 (75.8%) | 1,000 (24.2%) |
| Utilities | 275 (72.4%) | 105 (27.6%) |
| Information | 1,102 (65.8%) | 572 (34.2%) |
| Finance & Insurance | 2,867 (43.6%) | 3,704 (56.4%) |
| Real Estate, Rental & Leasing | 899 (51.6%) | 842 (48.4%) |
| Professional & Scientific | 4,527 (53.1%) | 4,003 (46.9%) |
| Enterprise Management | 128 (61.5%) | 80 (38.5%) |
| Administrative & Support | 2,075 (59.6%) | 1,406 (40.4%) |
| Educational Services | 1,566 (26.5%) | 4,347 (73.5%) |
| Health Care & Social Assistance | 1,833 (21.4%) | 6,746 (78.6%) |
| Arts, Entertainment & Recreation | 760 (61.4%) | 477 (38.6%) |
| Accommodation & Food Services | 2,793 (55.2%) | 2,265 (44.8%) |
| Public Administration | 1,033 (63.4%) | 597 (36.6%) |
| Total | 41,130 (52.7%) | 36,966 (47.3%) |
Education in Carrollton
School Enrollment in Carrollton
The most common levels of schooling among the 29,663 students in Carrollton are high school (6,901 | 23.3%), middle school (6,565 | 22.1%), and college / undergraduate (6,288 | 21.2%).
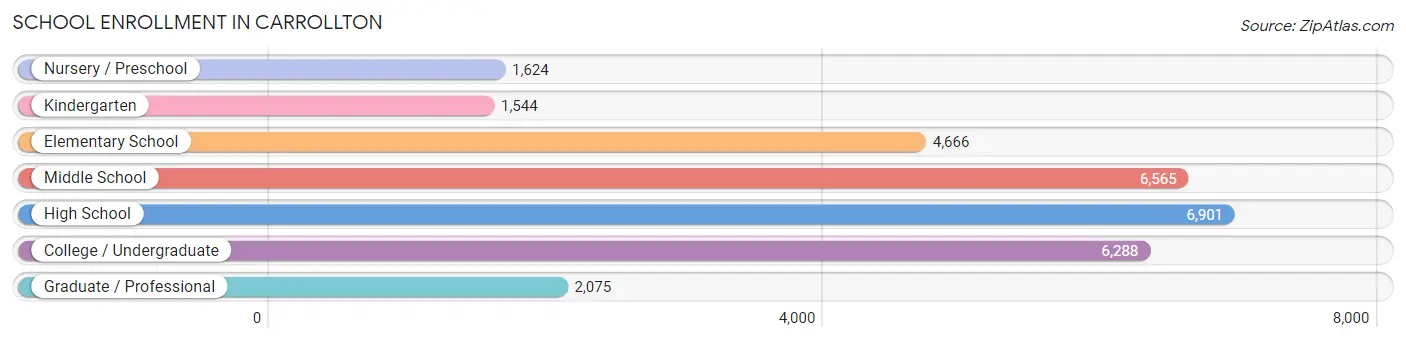
| School Level | # Students | % Students |
| Nursery / Preschool | 1,624 | 5.5% |
| Kindergarten | 1,544 | 5.2% |
| Elementary School | 4,666 | 15.7% |
| Middle School | 6,565 | 22.1% |
| High School | 6,901 | 23.3% |
| College / Undergraduate | 6,288 | 21.2% |
| Graduate / Professional | 2,075 | 7.0% |
| Total | 29,663 | 100.0% |
School Enrollment by Age by Funding Source in Carrollton
Out of a total of 29,663 students who are enrolled in schools in Carrollton, 4,331 (14.6%) attend a private institution, while the remaining 25,332 (85.4%) are enrolled in public schools. The age group of 3 to 4 year olds has the highest likelihood of being enrolled in private schools, with 693 (51.4% in the age bracket) enrolled. Conversely, the age group of 10 to 14 year olds has the lowest likelihood of being enrolled in a private school, with 7,408 (93.8% in the age bracket) attending a public institution.
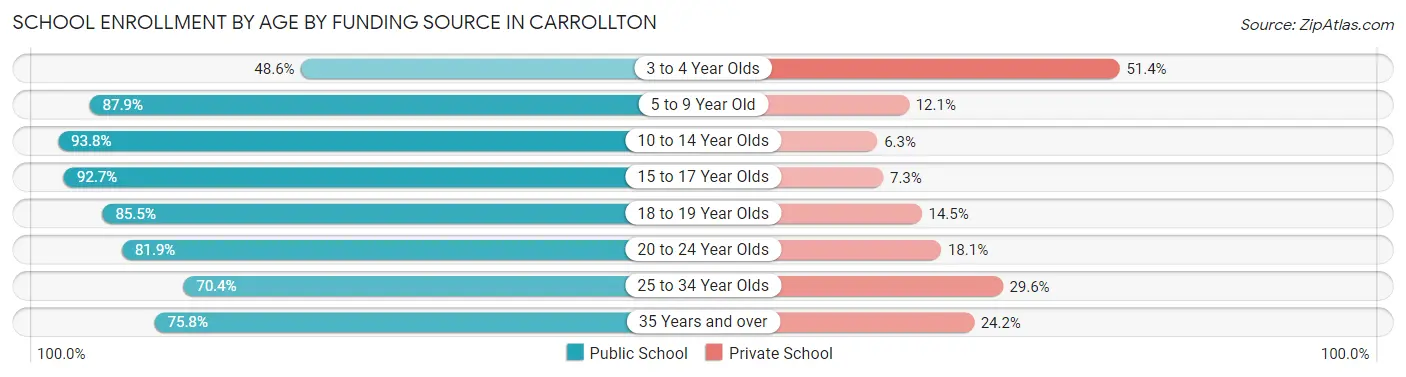
| Age Bracket | Public School | Private School |
| 3 to 4 Year Olds | 656 (48.6%) | 693 (51.4%) |
| 5 to 9 Year Old | 5,153 (87.9%) | 711 (12.1%) |
| 10 to 14 Year Olds | 7,408 (93.8%) | 494 (6.2%) |
| 15 to 17 Year Olds | 4,630 (92.7%) | 366 (7.3%) |
| 18 to 19 Year Olds | 1,974 (85.5%) | 335 (14.5%) |
| 20 to 24 Year Olds | 2,412 (81.9%) | 534 (18.1%) |
| 25 to 34 Year Olds | 1,901 (70.4%) | 798 (29.6%) |
| 35 Years and over | 1,211 (75.8%) | 387 (24.2%) |
| Total | 25,332 (85.4%) | 4,331 (14.6%) |
Educational Attainment by Field of Study in Carrollton
Business (11,634 | 27.3%), science & technology (4,184 | 9.8%), computers & mathematics (3,634 | 8.5%), education (3,426 | 8.1%), and engineering (3,379 | 7.9%) are the most common fields of study among 42,546 individuals in Carrollton who have obtained a bachelor's degree or higher.
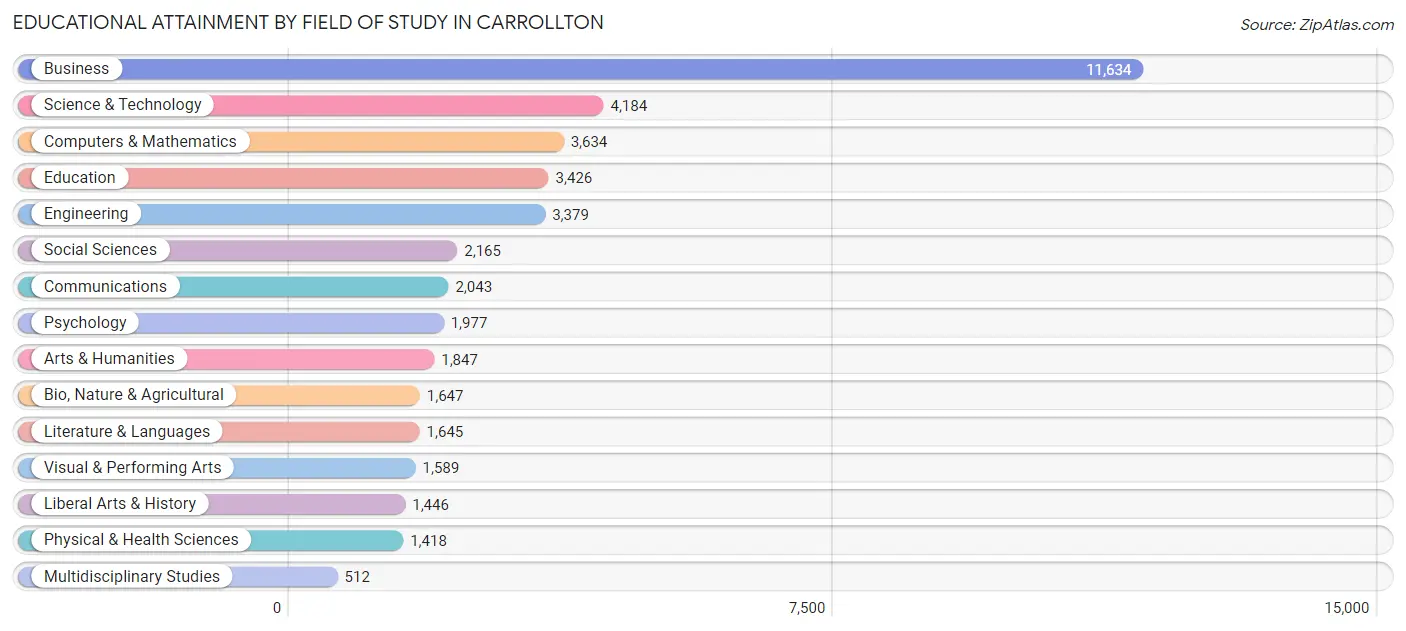
| Field of Study | # Graduates | % Graduates |
| Computers & Mathematics | 3,634 | 8.5% |
| Bio, Nature & Agricultural | 1,647 | 3.9% |
| Physical & Health Sciences | 1,418 | 3.3% |
| Psychology | 1,977 | 4.6% |
| Social Sciences | 2,165 | 5.1% |
| Engineering | 3,379 | 7.9% |
| Multidisciplinary Studies | 512 | 1.2% |
| Science & Technology | 4,184 | 9.8% |
| Business | 11,634 | 27.3% |
| Education | 3,426 | 8.1% |
| Literature & Languages | 1,645 | 3.9% |
| Liberal Arts & History | 1,446 | 3.4% |
| Visual & Performing Arts | 1,589 | 3.7% |
| Communications | 2,043 | 4.8% |
| Arts & Humanities | 1,847 | 4.3% |
| Total | 42,546 | 100.0% |
Transportation & Commute in Carrollton
Vehicle Availability by Sex in Carrollton
The most prevalent vehicle ownership categories in Carrollton are males with 2 vehicles (18,124, accounting for 44.6%) and females with 2 vehicles (15,827, making up 50.2%).
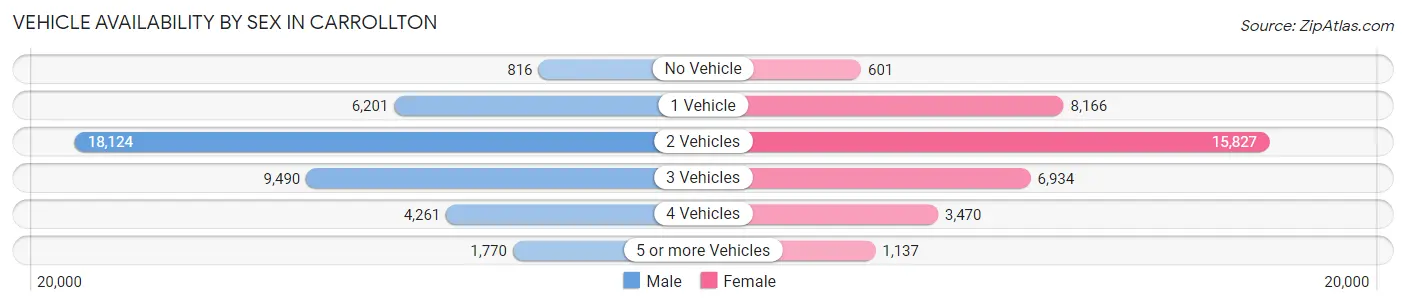
| Vehicles Available | Male | Female |
| No Vehicle | 816 (2.0%) | 601 (1.7%) |
| 1 Vehicle | 6,201 (15.2%) | 8,166 (22.6%) |
| 2 Vehicles | 18,124 (44.6%) | 15,827 (43.8%) |
| 3 Vehicles | 9,490 (23.3%) | 6,934 (19.2%) |
| 4 Vehicles | 4,261 (10.5%) | 3,470 (9.6%) |
| 5 or more Vehicles | 1,770 (4.3%) | 1,137 (3.2%) |
| Total | 40,662 (100.0%) | 36,135 (100.0%) |
Commute Time in Carrollton
The most frequently occuring commute durations in Carrollton are 30 to 34 minutes (12,108 commuters, 19.2%), 20 to 24 minutes (11,735 commuters, 18.6%), and 15 to 19 minutes (10,436 commuters, 16.5%).
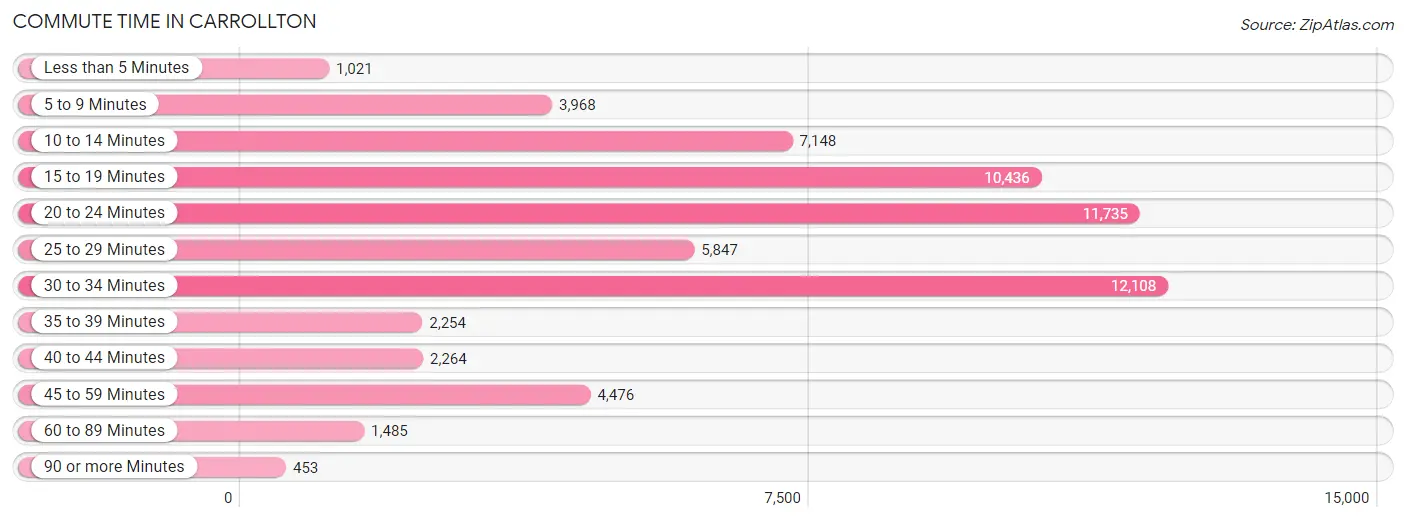
| Commute Time | # Commuters | % Commuters |
| Less than 5 Minutes | 1,021 | 1.6% |
| 5 to 9 Minutes | 3,968 | 6.3% |
| 10 to 14 Minutes | 7,148 | 11.3% |
| 15 to 19 Minutes | 10,436 | 16.5% |
| 20 to 24 Minutes | 11,735 | 18.6% |
| 25 to 29 Minutes | 5,847 | 9.2% |
| 30 to 34 Minutes | 12,108 | 19.2% |
| 35 to 39 Minutes | 2,254 | 3.6% |
| 40 to 44 Minutes | 2,264 | 3.6% |
| 45 to 59 Minutes | 4,476 | 7.1% |
| 60 to 89 Minutes | 1,485 | 2.4% |
| 90 or more Minutes | 453 | 0.7% |
Commute Time by Sex in Carrollton
The most common commute times in Carrollton are 30 to 34 minutes (7,077 commuters, 20.7%) for males and 20 to 24 minutes (5,657 commuters, 19.5%) for females.
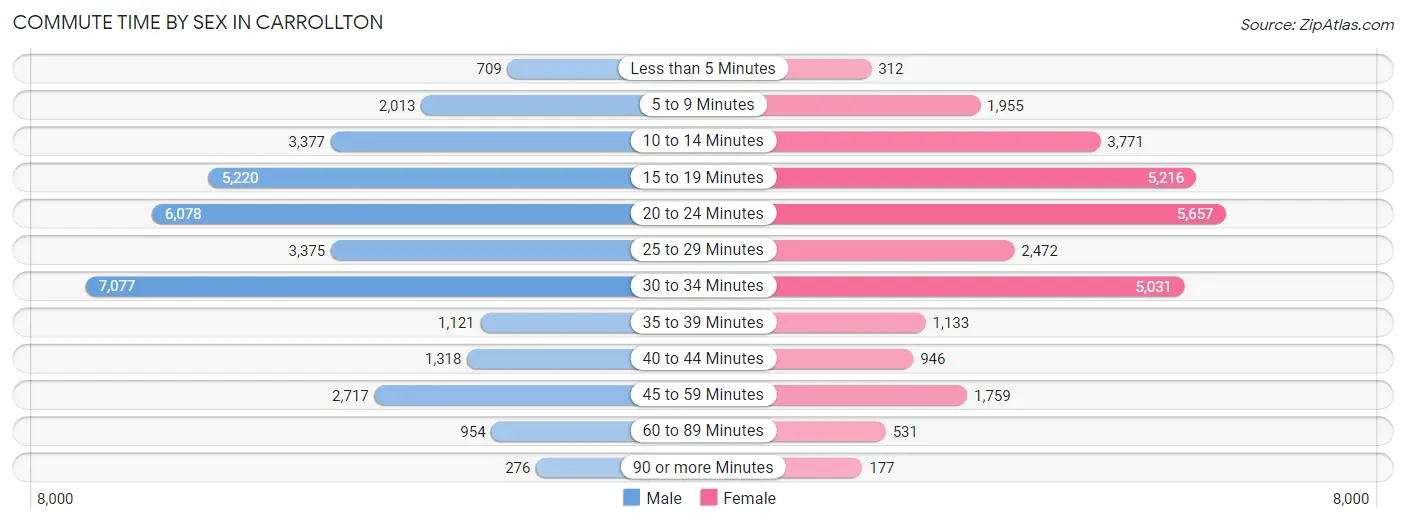
| Commute Time | Male | Female |
| Less than 5 Minutes | 709 (2.1%) | 312 (1.1%) |
| 5 to 9 Minutes | 2,013 (5.9%) | 1,955 (6.8%) |
| 10 to 14 Minutes | 3,377 (9.9%) | 3,771 (13.0%) |
| 15 to 19 Minutes | 5,220 (15.2%) | 5,216 (18.0%) |
| 20 to 24 Minutes | 6,078 (17.7%) | 5,657 (19.5%) |
| 25 to 29 Minutes | 3,375 (9.9%) | 2,472 (8.5%) |
| 30 to 34 Minutes | 7,077 (20.7%) | 5,031 (17.4%) |
| 35 to 39 Minutes | 1,121 (3.3%) | 1,133 (3.9%) |
| 40 to 44 Minutes | 1,318 (3.8%) | 946 (3.3%) |
| 45 to 59 Minutes | 2,717 (7.9%) | 1,759 (6.1%) |
| 60 to 89 Minutes | 954 (2.8%) | 531 (1.8%) |
| 90 or more Minutes | 276 (0.8%) | 177 (0.6%) |
Time of Departure to Work by Sex in Carrollton
The most frequent times of departure to work in Carrollton are 8:00 AM to 8:29 AM (5,764, 16.8%) for males and 8:00 AM to 8:29 AM (4,922, 17.0%) for females.
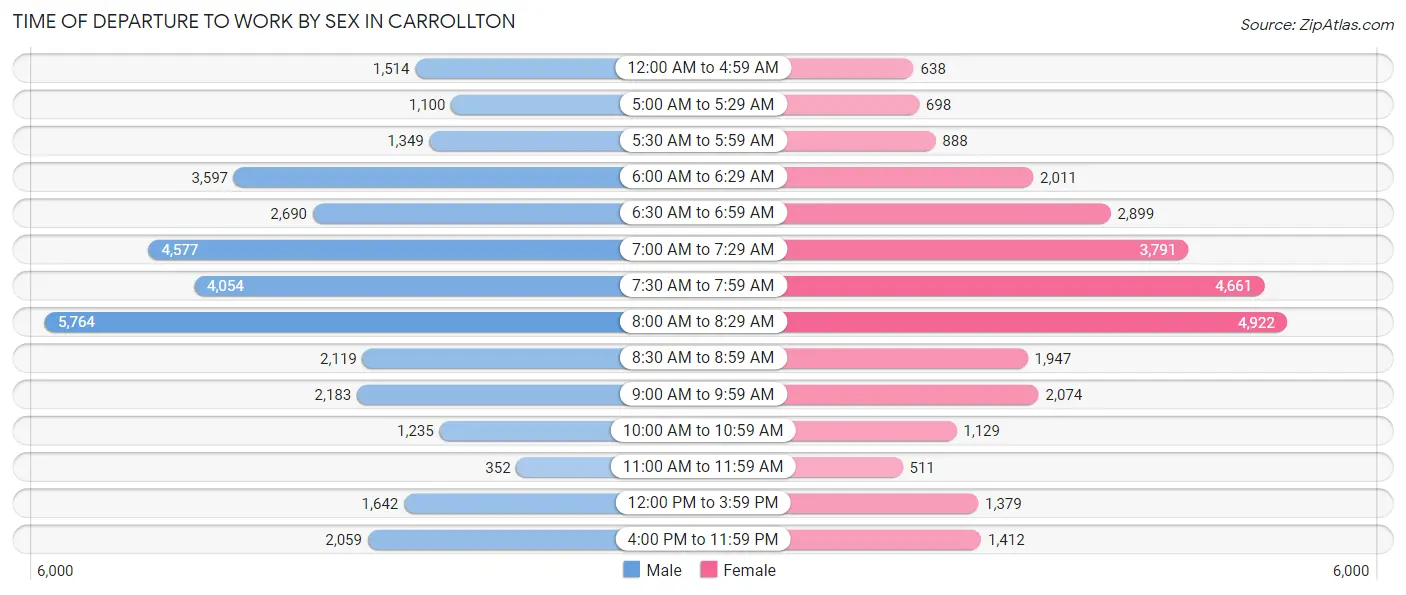
| Time of Departure | Male | Female |
| 12:00 AM to 4:59 AM | 1,514 (4.4%) | 638 (2.2%) |
| 5:00 AM to 5:29 AM | 1,100 (3.2%) | 698 (2.4%) |
| 5:30 AM to 5:59 AM | 1,349 (3.9%) | 888 (3.1%) |
| 6:00 AM to 6:29 AM | 3,597 (10.5%) | 2,011 (6.9%) |
| 6:30 AM to 6:59 AM | 2,690 (7.9%) | 2,899 (10.0%) |
| 7:00 AM to 7:29 AM | 4,577 (13.4%) | 3,791 (13.1%) |
| 7:30 AM to 7:59 AM | 4,054 (11.8%) | 4,661 (16.1%) |
| 8:00 AM to 8:29 AM | 5,764 (16.8%) | 4,922 (17.0%) |
| 8:30 AM to 8:59 AM | 2,119 (6.2%) | 1,947 (6.7%) |
| 9:00 AM to 9:59 AM | 2,183 (6.4%) | 2,074 (7.2%) |
| 10:00 AM to 10:59 AM | 1,235 (3.6%) | 1,129 (3.9%) |
| 11:00 AM to 11:59 AM | 352 (1.0%) | 511 (1.8%) |
| 12:00 PM to 3:59 PM | 1,642 (4.8%) | 1,379 (4.8%) |
| 4:00 PM to 11:59 PM | 2,059 (6.0%) | 1,412 (4.9%) |
| Total | 34,235 (100.0%) | 28,960 (100.0%) |
Housing Occupancy in Carrollton
Occupancy by Ownership in Carrollton
Of the total 50,369 dwellings in Carrollton, owner-occupied units account for 29,357 (58.3%), while renter-occupied units make up 21,012 (41.7%).
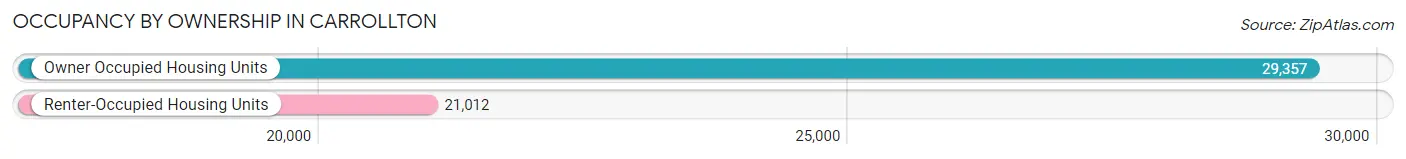
| Occupancy | # Housing Units | % Housing Units |
| Owner Occupied Housing Units | 29,357 | 58.3% |
| Renter-Occupied Housing Units | 21,012 | 41.7% |
| Total Occupied Housing Units | 50,369 | 100.0% |
Occupancy by Household Size in Carrollton
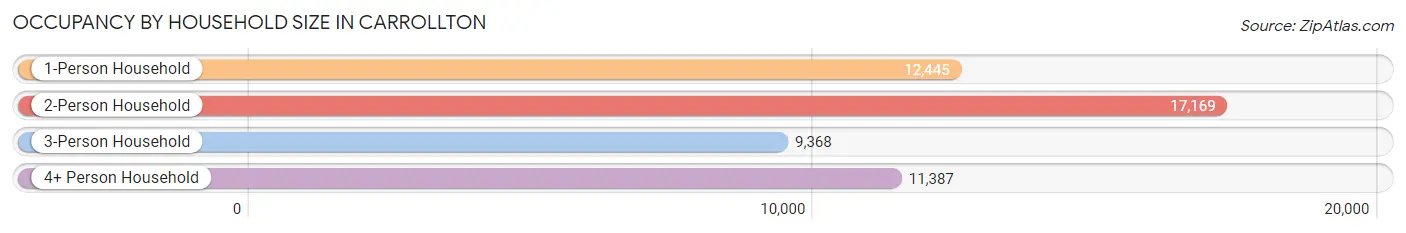
| Household Size | # Housing Units | % Housing Units |
| 1-Person Household | 12,445 | 24.7% |
| 2-Person Household | 17,169 | 34.1% |
| 3-Person Household | 9,368 | 18.6% |
| 4+ Person Household | 11,387 | 22.6% |
| Total Housing Units | 50,369 | 100.0% |
Occupancy by Ownership by Household Size in Carrollton
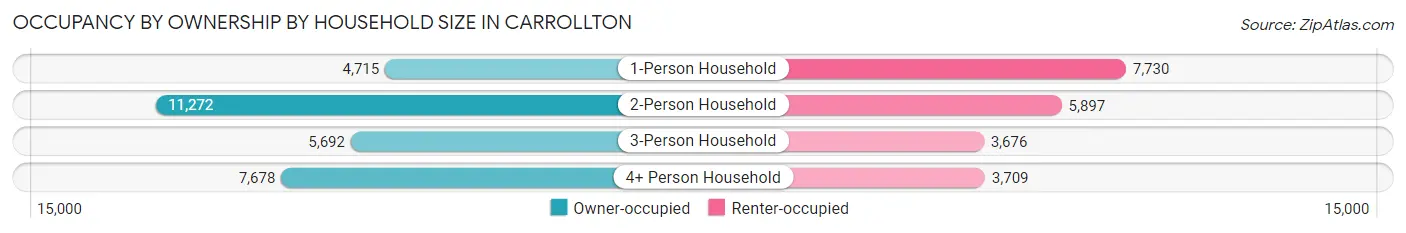
| Household Size | Owner-occupied | Renter-occupied |
| 1-Person Household | 4,715 (37.9%) | 7,730 (62.1%) |
| 2-Person Household | 11,272 (65.6%) | 5,897 (34.4%) |
| 3-Person Household | 5,692 (60.8%) | 3,676 (39.2%) |
| 4+ Person Household | 7,678 (67.4%) | 3,709 (32.6%) |
| Total Housing Units | 29,357 (58.3%) | 21,012 (41.7%) |
Occupancy by Educational Attainment in Carrollton
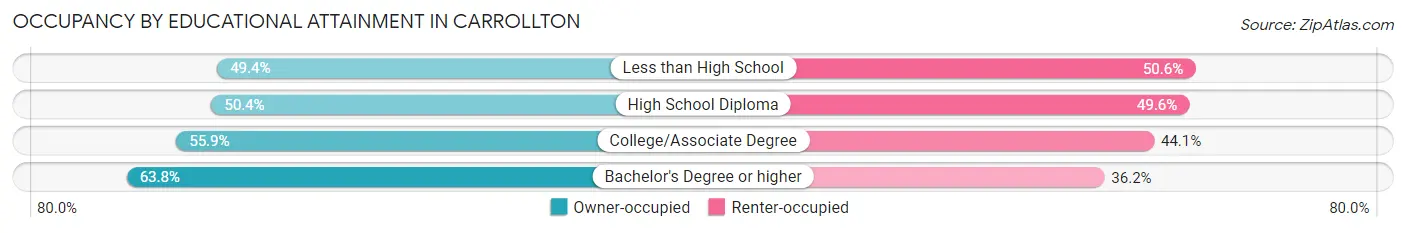
| Household Size | Owner-occupied | Renter-occupied |
| Less than High School | 1,888 (49.4%) | 1,931 (50.6%) |
| High School Diploma | 3,987 (50.4%) | 3,928 (49.6%) |
| College/Associate Degree | 8,291 (55.9%) | 6,533 (44.1%) |
| Bachelor's Degree or higher | 15,191 (63.8%) | 8,620 (36.2%) |
Occupancy by Age of Householder in Carrollton
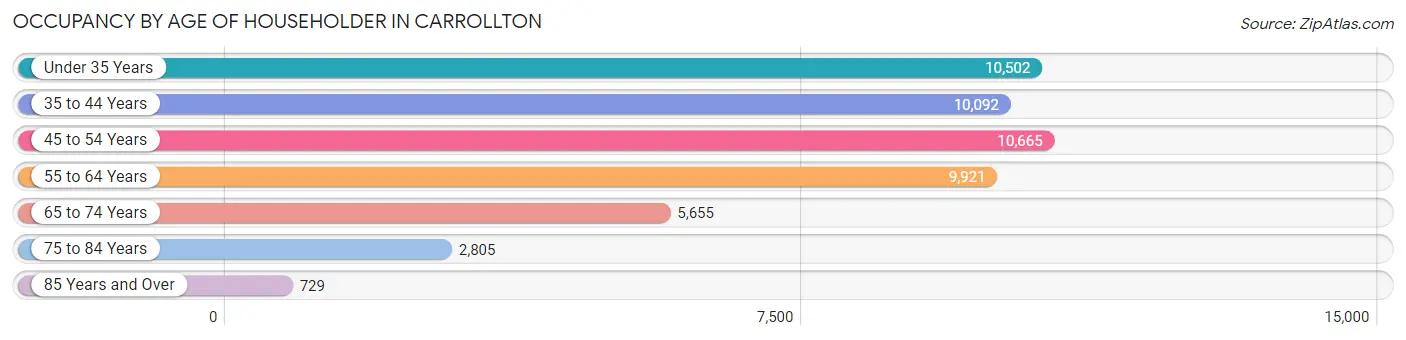
| Age Bracket | # Households | % Households |
| Under 35 Years | 10,502 | 20.8% |
| 35 to 44 Years | 10,092 | 20.0% |
| 45 to 54 Years | 10,665 | 21.2% |
| 55 to 64 Years | 9,921 | 19.7% |
| 65 to 74 Years | 5,655 | 11.2% |
| 75 to 84 Years | 2,805 | 5.6% |
| 85 Years and Over | 729 | 1.5% |
| Total | 50,369 | 100.0% |
Housing Finances in Carrollton
Median Income by Occupancy in Carrollton
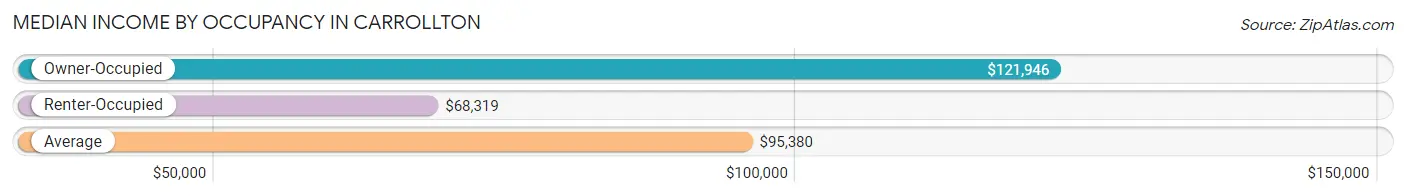
| Occupancy Type | # Households | Median Income |
| Owner-Occupied | 29,357 (58.3%) | $121,946 |
| Renter-Occupied | 21,012 (41.7%) | $68,319 |
| Average | 50,369 (100.0%) | $95,380 |
Occupancy by Householder Income Bracket in Carrollton
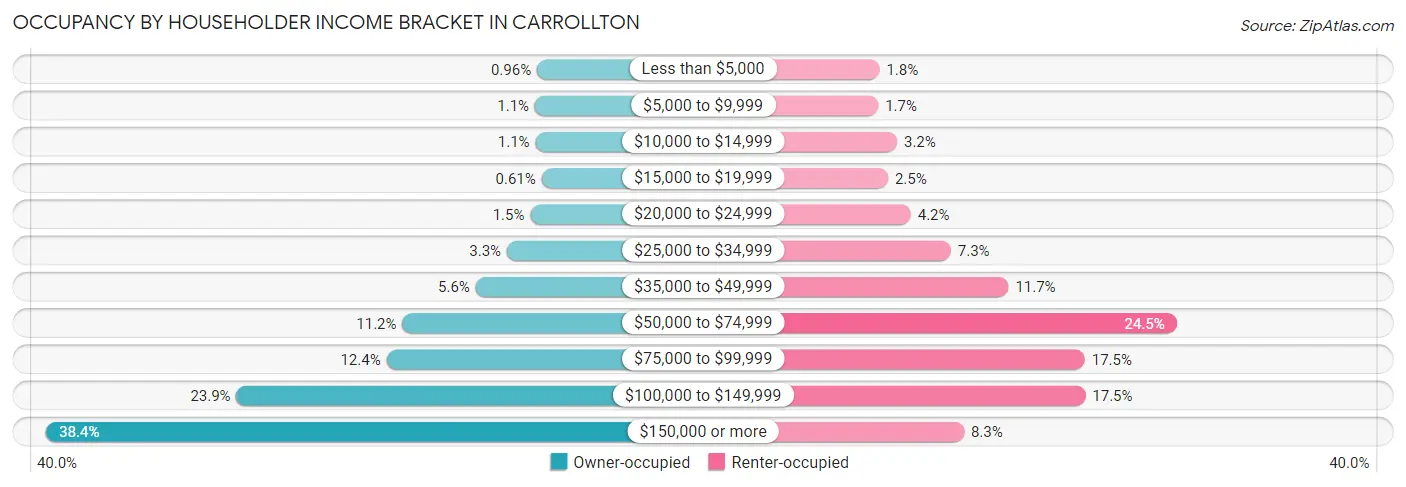
| Income Bracket | Owner-occupied | Renter-occupied |
| Less than $5,000 | 283 (1.0%) | 383 (1.8%) |
| $5,000 to $9,999 | 330 (1.1%) | 364 (1.7%) |
| $10,000 to $14,999 | 316 (1.1%) | 663 (3.2%) |
| $15,000 to $19,999 | 179 (0.6%) | 520 (2.5%) |
| $20,000 to $24,999 | 433 (1.5%) | 885 (4.2%) |
| $25,000 to $34,999 | 954 (3.3%) | 1,525 (7.3%) |
| $35,000 to $49,999 | 1,654 (5.6%) | 2,447 (11.7%) |
| $50,000 to $74,999 | 3,293 (11.2%) | 5,139 (24.5%) |
| $75,000 to $99,999 | 3,649 (12.4%) | 3,671 (17.5%) |
| $100,000 to $149,999 | 7,004 (23.9%) | 3,679 (17.5%) |
| $150,000 or more | 11,262 (38.4%) | 1,736 (8.3%) |
| Total | 29,357 (100.0%) | 21,012 (100.0%) |
Monthly Housing Cost Tiers in Carrollton
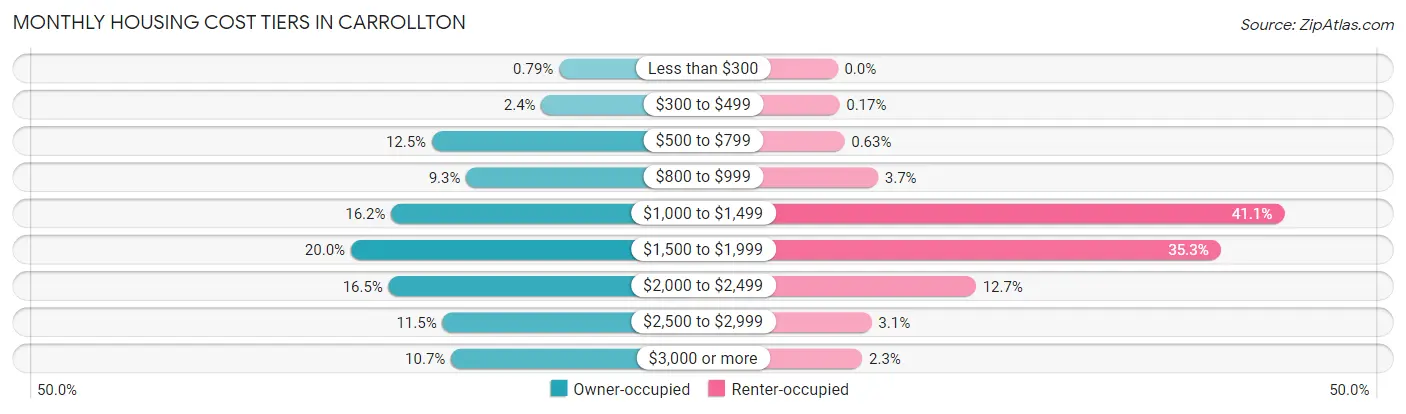
| Monthly Cost | Owner-occupied | Renter-occupied |
| Less than $300 | 232 (0.8%) | 0 (0.0%) |
| $300 to $499 | 711 (2.4%) | 36 (0.2%) |
| $500 to $799 | 3,669 (12.5%) | 133 (0.6%) |
| $800 to $999 | 2,743 (9.3%) | 781 (3.7%) |
| $1,000 to $1,499 | 4,768 (16.2%) | 8,639 (41.1%) |
| $1,500 to $1,999 | 5,860 (20.0%) | 7,408 (35.3%) |
| $2,000 to $2,499 | 4,837 (16.5%) | 2,674 (12.7%) |
| $2,500 to $2,999 | 3,386 (11.5%) | 658 (3.1%) |
| $3,000 or more | 3,151 (10.7%) | 476 (2.3%) |
| Total | 29,357 (100.0%) | 21,012 (100.0%) |
Physical Housing Characteristics in Carrollton
Housing Structures in Carrollton
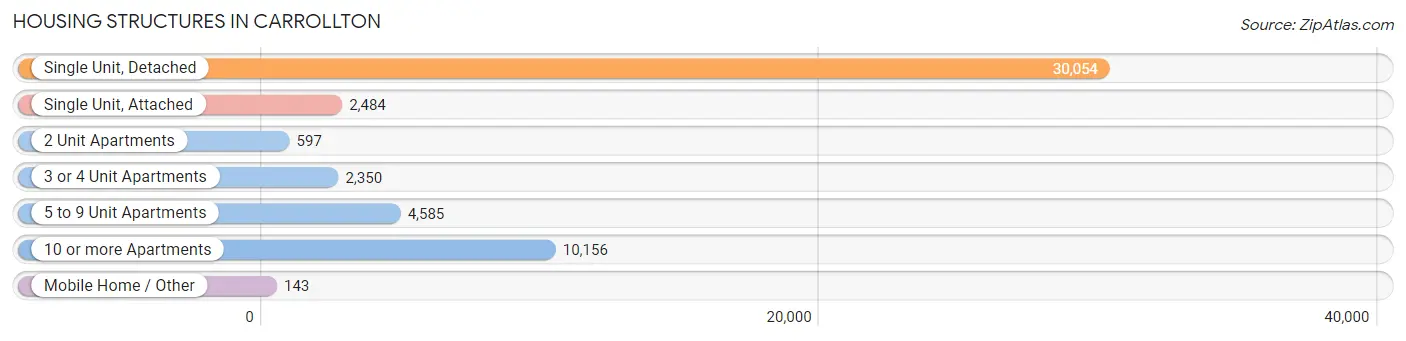
| Structure Type | # Housing Units | % Housing Units |
| Single Unit, Detached | 30,054 | 59.7% |
| Single Unit, Attached | 2,484 | 4.9% |
| 2 Unit Apartments | 597 | 1.2% |
| 3 or 4 Unit Apartments | 2,350 | 4.7% |
| 5 to 9 Unit Apartments | 4,585 | 9.1% |
| 10 or more Apartments | 10,156 | 20.2% |
| Mobile Home / Other | 143 | 0.3% |
| Total | 50,369 | 100.0% |
Housing Structures by Occupancy in Carrollton
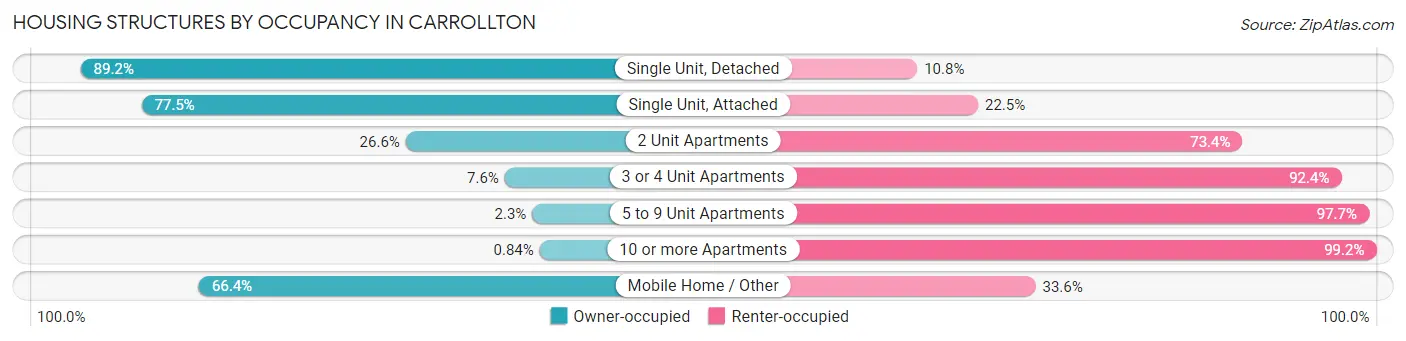
| Structure Type | Owner-occupied | Renter-occupied |
| Single Unit, Detached | 26,811 (89.2%) | 3,243 (10.8%) |
| Single Unit, Attached | 1,925 (77.5%) | 559 (22.5%) |
| 2 Unit Apartments | 159 (26.6%) | 438 (73.4%) |
| 3 or 4 Unit Apartments | 178 (7.6%) | 2,172 (92.4%) |
| 5 to 9 Unit Apartments | 104 (2.3%) | 4,481 (97.7%) |
| 10 or more Apartments | 85 (0.8%) | 10,071 (99.2%) |
| Mobile Home / Other | 95 (66.4%) | 48 (33.6%) |
| Total | 29,357 (58.3%) | 21,012 (41.7%) |
Housing Structures by Number of Rooms in Carrollton
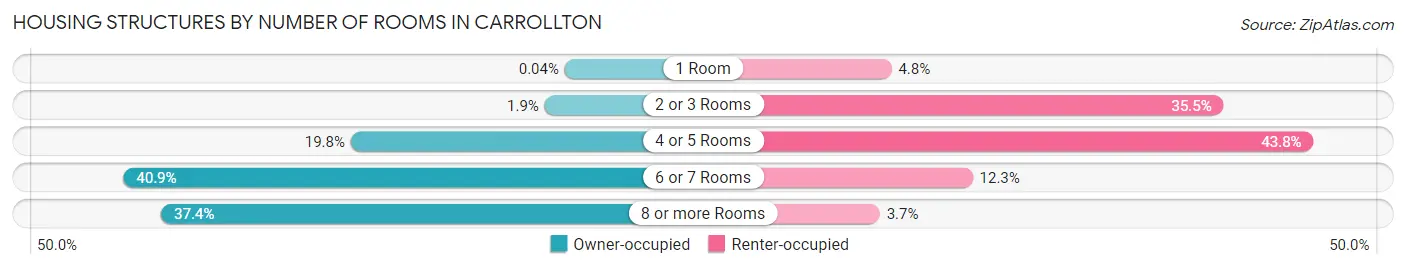
| Number of Rooms | Owner-occupied | Renter-occupied |
| 1 Room | 11 (0.0%) | 1,002 (4.8%) |
| 2 or 3 Rooms | 558 (1.9%) | 7,455 (35.5%) |
| 4 or 5 Rooms | 5,822 (19.8%) | 9,202 (43.8%) |
| 6 or 7 Rooms | 11,995 (40.9%) | 2,579 (12.3%) |
| 8 or more Rooms | 10,971 (37.4%) | 774 (3.7%) |
| Total | 29,357 (100.0%) | 21,012 (100.0%) |
Housing Structure by Heating Type in Carrollton
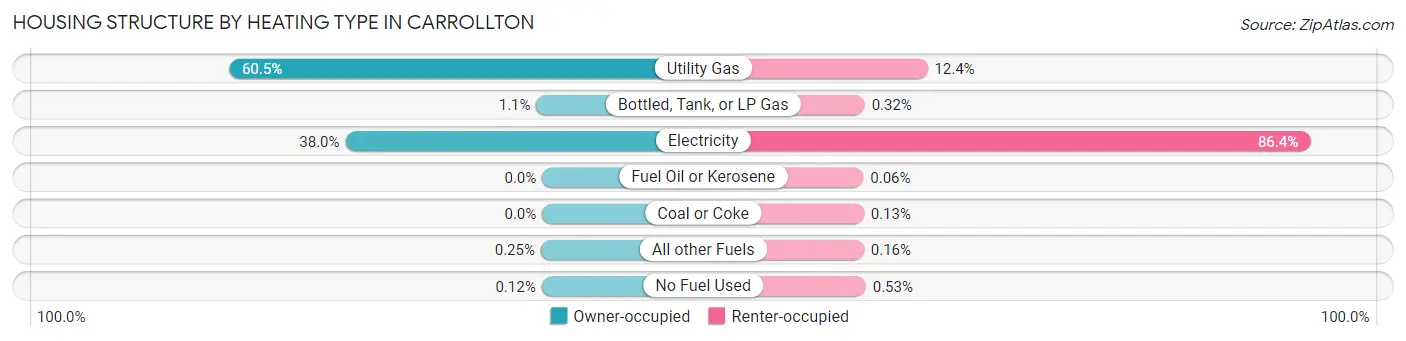
| Heating Type | Owner-occupied | Renter-occupied |
| Utility Gas | 17,761 (60.5%) | 2,614 (12.4%) |
| Bottled, Tank, or LP Gas | 325 (1.1%) | 67 (0.3%) |
| Electricity | 11,161 (38.0%) | 18,147 (86.4%) |
| Fuel Oil or Kerosene | 0 (0.0%) | 13 (0.1%) |
| Coal or Coke | 0 (0.0%) | 27 (0.1%) |
| All other Fuels | 74 (0.3%) | 33 (0.2%) |
| No Fuel Used | 36 (0.1%) | 111 (0.5%) |
| Total | 29,357 (100.0%) | 21,012 (100.0%) |
Household Vehicle Usage in Carrollton
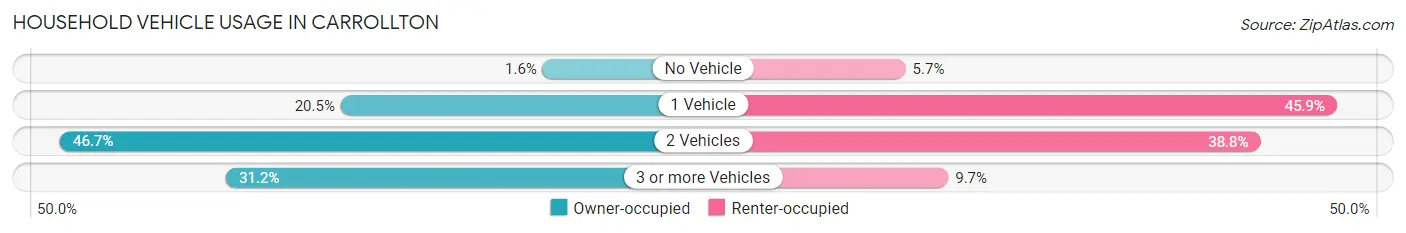
| Vehicles per Household | Owner-occupied | Renter-occupied |
| No Vehicle | 482 (1.6%) | 1,191 (5.7%) |
| 1 Vehicle | 6,014 (20.5%) | 9,647 (45.9%) |
| 2 Vehicles | 13,705 (46.7%) | 8,146 (38.8%) |
| 3 or more Vehicles | 9,156 (31.2%) | 2,028 (9.7%) |
| Total | 29,357 (100.0%) | 21,012 (100.0%) |
Real Estate & Mortgages in Carrollton
Real Estate and Mortgage Overview in Carrollton
| Characteristic | Without Mortgage | With Mortgage |
| Housing Units | 10,049 | 19,308 |
| Median Property Value | $317,000 | $332,400 |
| Median Household Income | $103,499 | $8,102 |
| Monthly Housing Costs | $849 | $3,089 |
| Real Estate Taxes | $4,601 | $154 |
Property Value by Mortgage Status in Carrollton
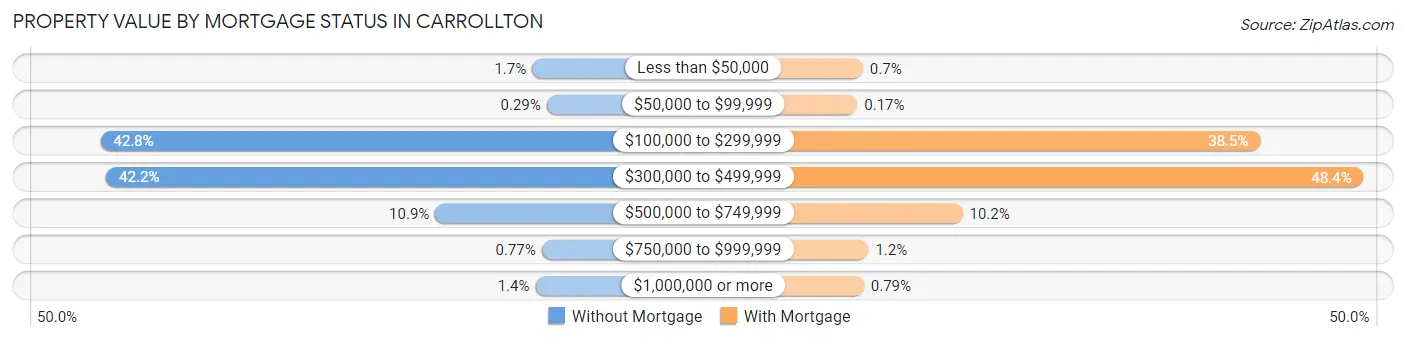
| Property Value | Without Mortgage | With Mortgage |
| Less than $50,000 | 168 (1.7%) | 136 (0.7%) |
| $50,000 to $99,999 | 29 (0.3%) | 32 (0.2%) |
| $100,000 to $299,999 | 4,299 (42.8%) | 7,441 (38.5%) |
| $300,000 to $499,999 | 4,244 (42.2%) | 9,341 (48.4%) |
| $500,000 to $749,999 | 1,095 (10.9%) | 1,968 (10.2%) |
| $750,000 to $999,999 | 77 (0.8%) | 238 (1.2%) |
| $1,000,000 or more | 137 (1.4%) | 152 (0.8%) |
| Total | 10,049 (100.0%) | 19,308 (100.0%) |
Household Income by Mortgage Status in Carrollton
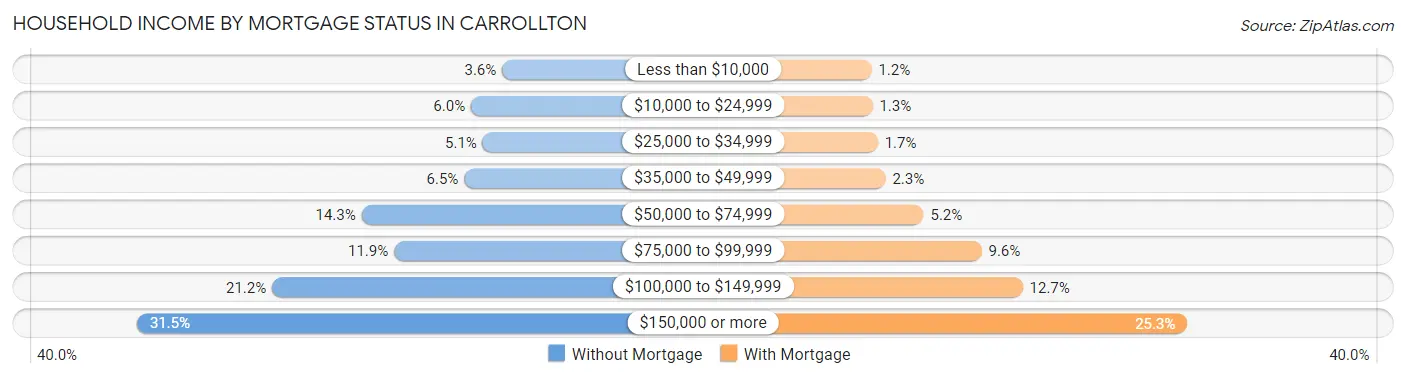
| Household Income | Without Mortgage | With Mortgage |
| Less than $10,000 | 364 (3.6%) | 233 (1.2%) |
| $10,000 to $24,999 | 602 (6.0%) | 249 (1.3%) |
| $25,000 to $34,999 | 513 (5.1%) | 326 (1.7%) |
| $35,000 to $49,999 | 654 (6.5%) | 441 (2.3%) |
| $50,000 to $74,999 | 1,440 (14.3%) | 1,000 (5.2%) |
| $75,000 to $99,999 | 1,191 (11.8%) | 1,853 (9.6%) |
| $100,000 to $149,999 | 2,125 (21.1%) | 2,458 (12.7%) |
| $150,000 or more | 3,160 (31.5%) | 4,879 (25.3%) |
| Total | 10,049 (100.0%) | 19,308 (100.0%) |
Property Value to Household Income Ratio in Carrollton
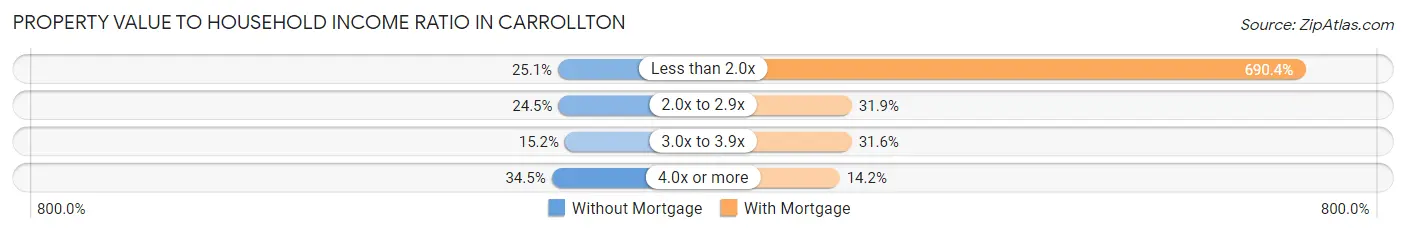
| Value-to-Income Ratio | Without Mortgage | With Mortgage |
| Less than 2.0x | 2,525 (25.1%) | 133,297 (690.4%) |
| 2.0x to 2.9x | 2,464 (24.5%) | 6,153 (31.9%) |
| 3.0x to 3.9x | 1,522 (15.1%) | 6,107 (31.6%) |
| 4.0x or more | 3,464 (34.5%) | 2,745 (14.2%) |
| Total | 10,049 (100.0%) | 19,308 (100.0%) |
Real Estate Taxes by Mortgage Status in Carrollton
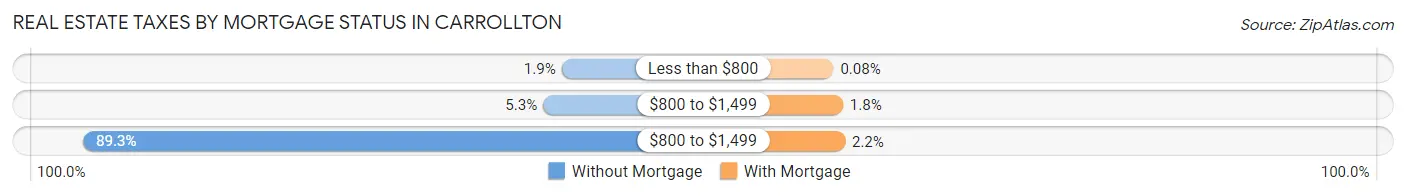
| Property Taxes | Without Mortgage | With Mortgage |
| Less than $800 | 195 (1.9%) | 15 (0.1%) |
| $800 to $1,499 | 535 (5.3%) | 347 (1.8%) |
| $800 to $1,499 | 8,975 (89.3%) | 423 (2.2%) |
| Total | 10,049 (100.0%) | 19,308 (100.0%) |
Health & Disability in Carrollton
Health Insurance Coverage by Age in Carrollton
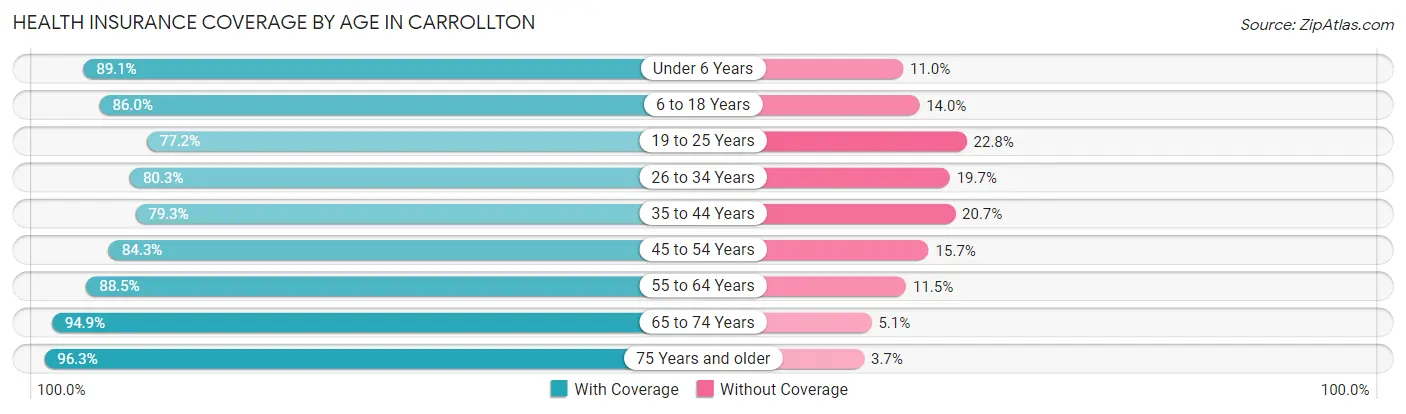
| Age Bracket | With Coverage | Without Coverage |
| Under 6 Years | 7,472 (89.0%) | 919 (11.0%) |
| 6 to 18 Years | 16,896 (86.0%) | 2,743 (14.0%) |
| 19 to 25 Years | 8,881 (77.2%) | 2,624 (22.8%) |
| 26 to 34 Years | 14,901 (80.3%) | 3,646 (19.7%) |
| 35 to 44 Years | 15,946 (79.3%) | 4,152 (20.7%) |
| 45 to 54 Years | 16,170 (84.3%) | 3,019 (15.7%) |
| 55 to 64 Years | 15,619 (88.5%) | 2,034 (11.5%) |
| 65 to 74 Years | 9,895 (94.9%) | 529 (5.1%) |
| 75 Years and older | 6,077 (96.3%) | 232 (3.7%) |
| Total | 111,857 (84.9%) | 19,898 (15.1%) |
Health Insurance Coverage by Citizenship Status in Carrollton
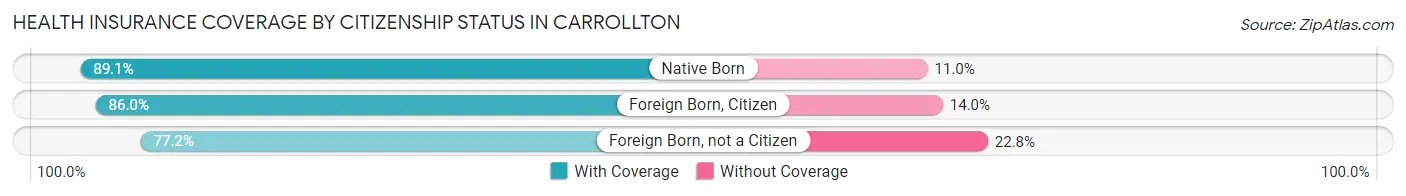
| Citizenship Status | With Coverage | Without Coverage |
| Native Born | 7,472 (89.0%) | 919 (11.0%) |
| Foreign Born, Citizen | 16,896 (86.0%) | 2,743 (14.0%) |
| Foreign Born, not a Citizen | 8,881 (77.2%) | 2,624 (22.8%) |
Health Insurance Coverage by Household Income in Carrollton
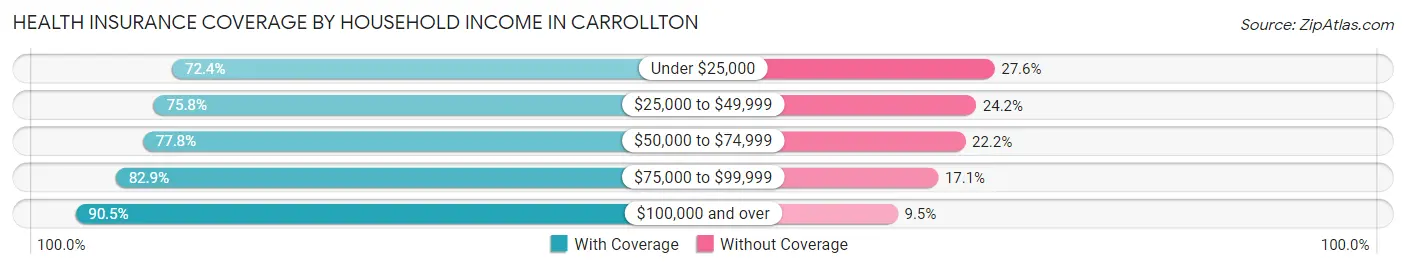
| Household Income | With Coverage | Without Coverage |
| Under $25,000 | 5,843 (72.4%) | 2,231 (27.6%) |
| $25,000 to $49,999 | 10,505 (75.8%) | 3,351 (24.2%) |
| $50,000 to $74,999 | 15,510 (77.8%) | 4,416 (22.2%) |
| $75,000 to $99,999 | 15,010 (82.9%) | 3,091 (17.1%) |
| $100,000 and over | 64,745 (90.5%) | 6,797 (9.5%) |
Public vs Private Health Insurance Coverage by Age in Carrollton
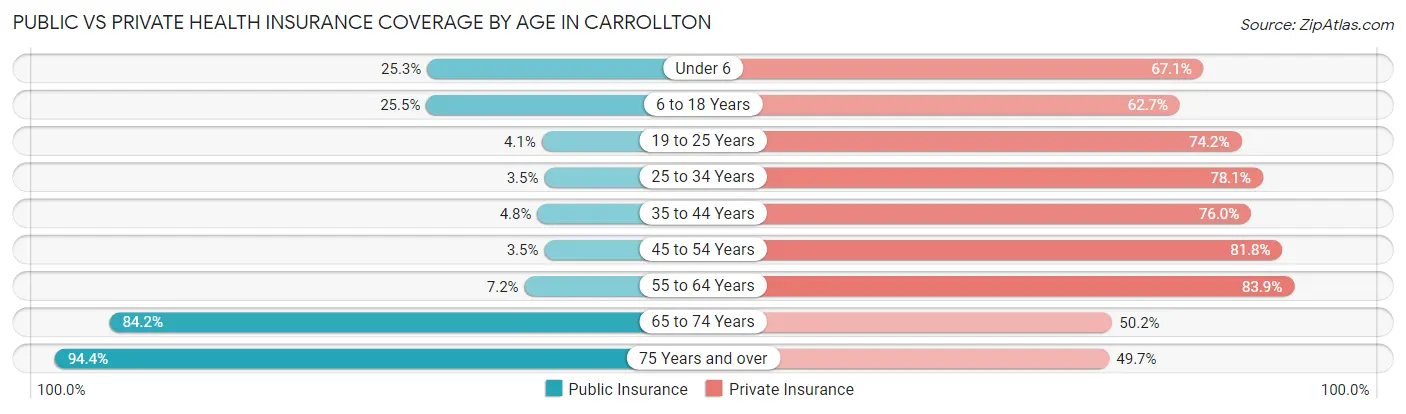
| Age Bracket | Public Insurance | Private Insurance |
| Under 6 | 2,122 (25.3%) | 5,633 (67.1%) |
| 6 to 18 Years | 4,999 (25.5%) | 12,322 (62.7%) |
| 19 to 25 Years | 466 (4.1%) | 8,531 (74.2%) |
| 25 to 34 Years | 656 (3.5%) | 14,484 (78.1%) |
| 35 to 44 Years | 970 (4.8%) | 15,269 (76.0%) |
| 45 to 54 Years | 678 (3.5%) | 15,691 (81.8%) |
| 55 to 64 Years | 1,276 (7.2%) | 14,818 (83.9%) |
| 65 to 74 Years | 8,781 (84.2%) | 5,236 (50.2%) |
| 75 Years and over | 5,956 (94.4%) | 3,133 (49.7%) |
| Total | 25,904 (19.7%) | 95,117 (72.2%) |
Disability Status by Sex by Age in Carrollton
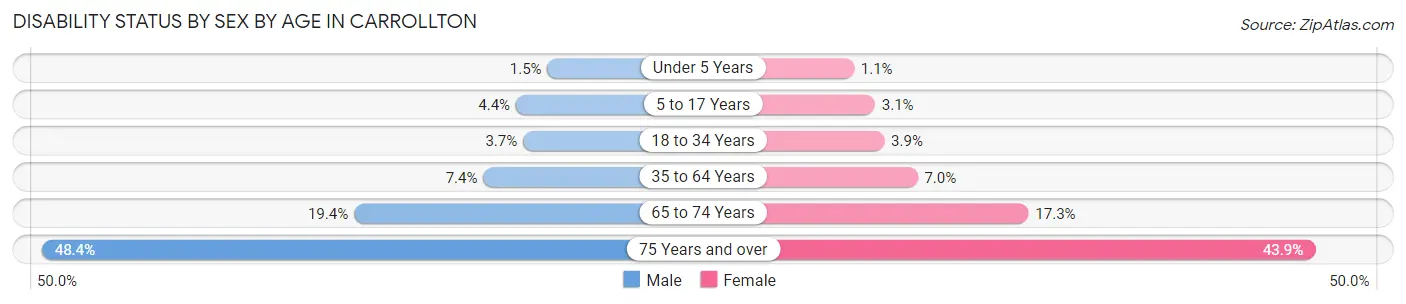
| Age Bracket | Male | Female |
| Under 5 Years | 56 (1.5%) | 34 (1.1%) |
| 5 to 17 Years | 440 (4.4%) | 293 (3.1%) |
| 18 to 34 Years | 617 (3.7%) | 598 (3.9%) |
| 35 to 64 Years | 2,037 (7.4%) | 2,072 (7.0%) |
| 65 to 74 Years | 954 (19.4%) | 955 (17.3%) |
| 75 Years and over | 1,333 (48.4%) | 1,561 (43.9%) |
Disability Class by Sex by Age in Carrollton
Disability Class: Hearing Difficulty
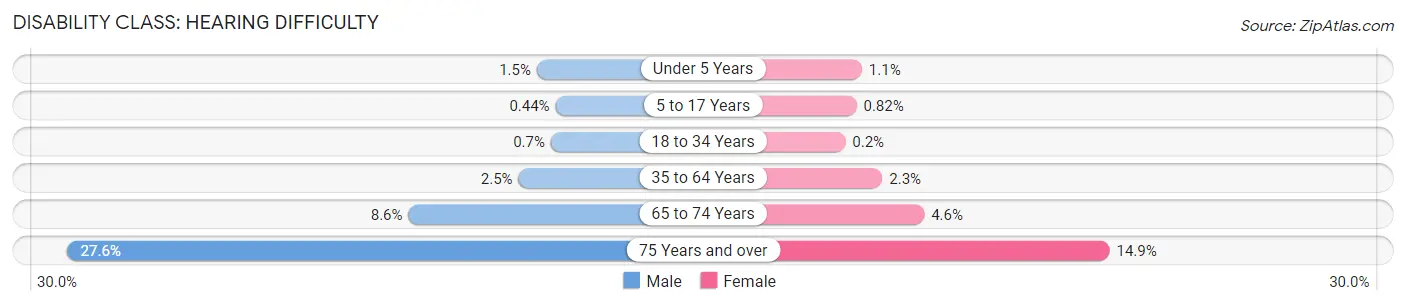
| Age Bracket | Male | Female |
| Under 5 Years | 56 (1.5%) | 34 (1.1%) |
| 5 to 17 Years | 44 (0.4%) | 78 (0.8%) |
| 18 to 34 Years | 116 (0.7%) | 31 (0.2%) |
| 35 to 64 Years | 685 (2.5%) | 667 (2.3%) |
| 65 to 74 Years | 424 (8.6%) | 253 (4.6%) |
| 75 Years and over | 760 (27.6%) | 530 (14.9%) |
Disability Class: Vision Difficulty
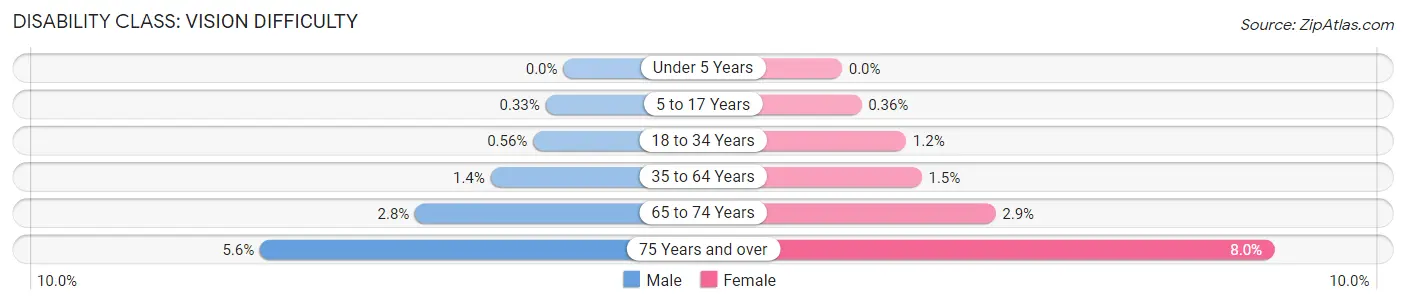
| Age Bracket | Male | Female |
| Under 5 Years | 0 (0.0%) | 0 (0.0%) |
| 5 to 17 Years | 33 (0.3%) | 34 (0.4%) |
| 18 to 34 Years | 92 (0.6%) | 181 (1.2%) |
| 35 to 64 Years | 371 (1.3%) | 436 (1.5%) |
| 65 to 74 Years | 135 (2.8%) | 157 (2.9%) |
| 75 Years and over | 155 (5.6%) | 285 (8.0%) |
Disability Class: Cognitive Difficulty
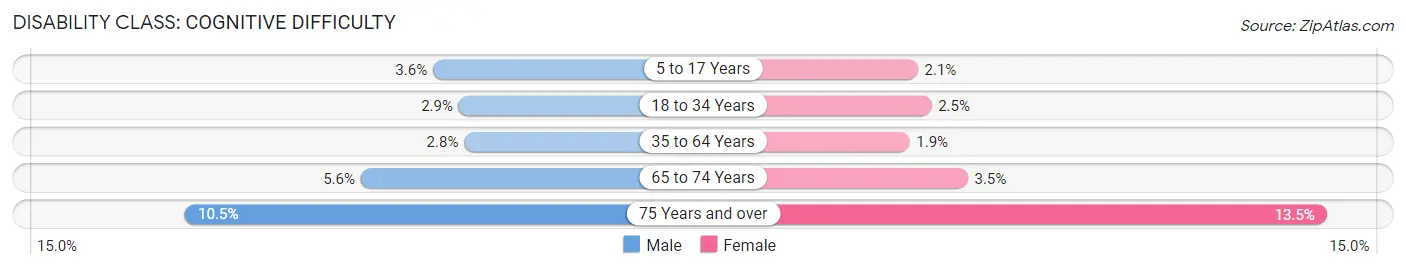
| Age Bracket | Male | Female |
| 5 to 17 Years | 363 (3.6%) | 201 (2.1%) |
| 18 to 34 Years | 481 (2.9%) | 378 (2.5%) |
| 35 to 64 Years | 757 (2.8%) | 555 (1.9%) |
| 65 to 74 Years | 277 (5.6%) | 193 (3.5%) |
| 75 Years and over | 290 (10.5%) | 480 (13.5%) |
Disability Class: Ambulatory Difficulty
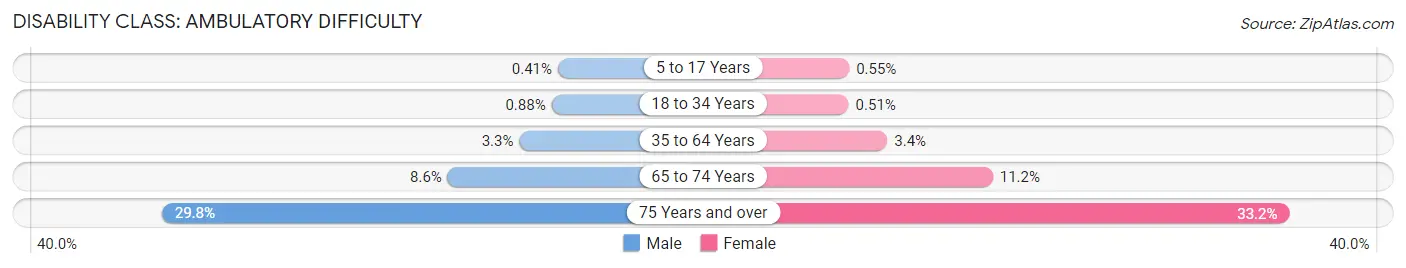
| Age Bracket | Male | Female |
| 5 to 17 Years | 41 (0.4%) | 52 (0.5%) |
| 18 to 34 Years | 146 (0.9%) | 77 (0.5%) |
| 35 to 64 Years | 897 (3.3%) | 997 (3.4%) |
| 65 to 74 Years | 422 (8.6%) | 618 (11.2%) |
| 75 Years and over | 821 (29.8%) | 1,181 (33.2%) |
Disability Class: Self-Care Difficulty
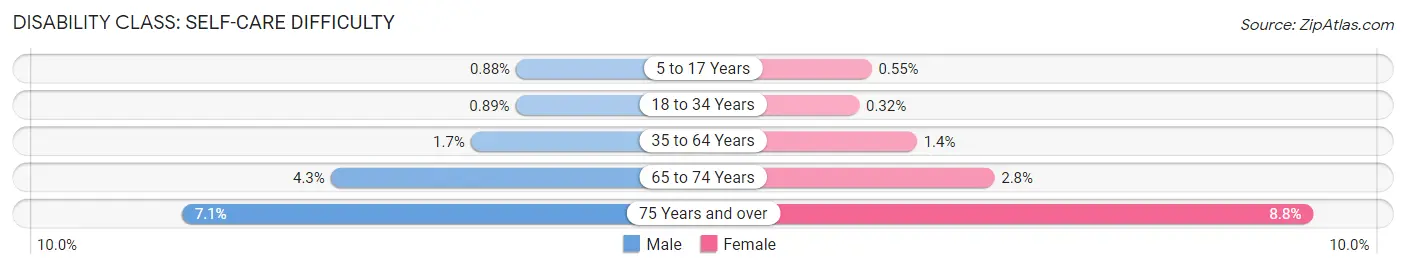
| Age Bracket | Male | Female |
| 5 to 17 Years | 88 (0.9%) | 52 (0.5%) |
| 18 to 34 Years | 147 (0.9%) | 49 (0.3%) |
| 35 to 64 Years | 472 (1.7%) | 410 (1.4%) |
| 65 to 74 Years | 212 (4.3%) | 156 (2.8%) |
| 75 Years and over | 195 (7.1%) | 311 (8.7%) |
Technology Access in Carrollton
Computing Device Access in Carrollton
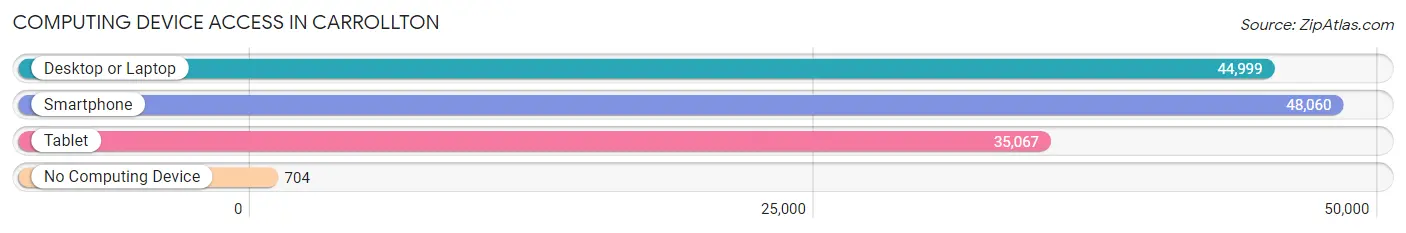
| Device Type | # Households | % Households |
| Desktop or Laptop | 44,999 | 89.3% |
| Smartphone | 48,060 | 95.4% |
| Tablet | 35,067 | 69.6% |
| No Computing Device | 704 | 1.4% |
| Total | 50,369 | 100.0% |
Internet Access in Carrollton
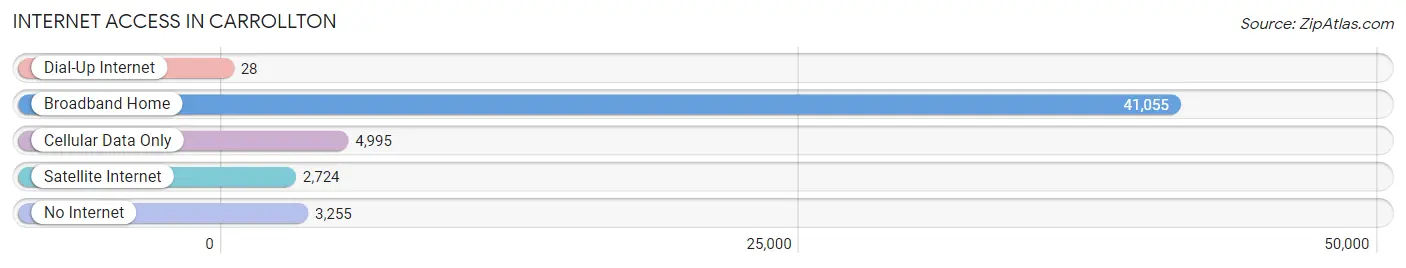
| Internet Type | # Households | % Households |
| Dial-Up Internet | 28 | 0.1% |
| Broadband Home | 41,055 | 81.5% |
| Cellular Data Only | 4,995 | 9.9% |
| Satellite Internet | 2,724 | 5.4% |
| No Internet | 3,255 | 6.5% |
| Total | 50,369 | 100.0% |
Carrollton Summary
Carrollton, Texas is a city located in the northern part of Dallas County, Texas. It is part of the Dallas-Fort Worth-Arlington metropolitan area and is located about 25 miles north of downtown Dallas. The city has a population of approximately 133,000 people, making it the twenty-third largest city in the state of Texas.
History
Carrollton was founded in 1842 by Jared Ford and was named after Carrollton, Illinois. The city was originally a farming community and was known for its cotton production. In the late 1800s, the city began to grow and develop as a railroad town. The city was incorporated in 1913 and was officially recognized as a city in 1925.
In the 1950s, the city began to experience rapid growth due to the development of the Dallas-Fort Worth International Airport. The city was also home to the first shopping mall in the Dallas-Fort Worth area, which opened in 1961.
Geography
Carrollton is located in the northern part of Dallas County, Texas. It is part of the Dallas-Fort Worth-Arlington metropolitan area and is located about 25 miles north of downtown Dallas. The city has a total area of 37.2 square miles, of which 36.9 square miles is land and 0.3 square miles is water.
The city is located in the Blackland Prairie region of Texas and is characterized by flat terrain and rolling hills. The city is also located in the Trinity River watershed and is home to several creeks and streams.
Economy
Carrollton is home to a diverse economy that is driven by a variety of industries. The city is home to several large employers, including the University of Texas at Dallas, Texas Health Resources, and the City of Carrollton. The city is also home to several corporate headquarters, including Frito-Lay, Dr Pepper Snapple Group, and JCPenney.
The city is also home to a thriving retail sector, with several shopping centers and malls located in the city. The city is also home to several restaurants, bars, and entertainment venues.
Demographics
As of the 2010 census, the population of Carrollton was 133,351. The racial makeup of the city was 68.3% White, 11.3% African American, 0.7% Native American, 8.2% Asian, 0.1% Pacific Islander, 8.7% from other races, and 4.1% from two or more races. Hispanic or Latino of any race were 24.3% of the population.
The median household income in Carrollton was $63,945, and the median family income was $76,845. The per capita income for the city was $30,945. About 8.3% of the population was below the poverty line.
Carrollton is a diverse and vibrant city that is home to a variety of people and businesses. The city has a strong economy and is home to several large employers. The city is also home to a thriving retail sector and is a popular destination for shopping, dining, and entertainment.
Common Questions
What is Per Capita Income in Carrollton?
Per Capita income in Carrollton is $46,879.
What is the Median Family Income in Carrollton?
Median Family Income in Carrollton is $106,205.
What is the Median Household income in Carrollton?
Median Household Income in Carrollton is $95,380.
What is Income or Wage Gap in Carrollton?
Income or Wage Gap in Carrollton is 25.8%.
Women in Carrollton earn 74.2 cents for every dollar earned by a man.
What is Family Income Deficit in Carrollton?
Family Income Deficit in Carrollton is $11,319.
Families that are below poverty line in Carrollton earn $11,319 less on average than the poverty threshold level.
What is Inequality or Gini Index in Carrollton?
Inequality or Gini Index in Carrollton is 0.42.
What is the Total Population of Carrollton?
Total Population of Carrollton is 132,284.
What is the Total Male Population of Carrollton?
Total Male Population of Carrollton is 65,549.
What is the Total Female Population of Carrollton?
Total Female Population of Carrollton is 66,735.
What is the Ratio of Males per 100 Females in Carrollton?
There are 98.22 Males per 100 Females in Carrollton.
What is the Ratio of Females per 100 Males in Carrollton?
There are 101.81 Females per 100 Males in Carrollton.
What is the Median Population Age in Carrollton?
Median Population Age in Carrollton is 38.6 Years.
What is the Average Family Size in Carrollton
Average Family Size in Carrollton is 3.2 People.
What is the Average Household Size in Carrollton
Average Household Size in Carrollton is 2.6 People.
How Large is the Labor Force in Carrollton?
There are 81,157 People in the Labor Forcein in Carrollton.
What is the Percentage of People in the Labor Force in Carrollton?
74.1% of People are in the Labor Force in Carrollton.
What is the Unemployment Rate in Carrollton?
Unemployment Rate in Carrollton is 3.7%.