Lawrenceville, GA Map & Demographics
Lawrenceville Map
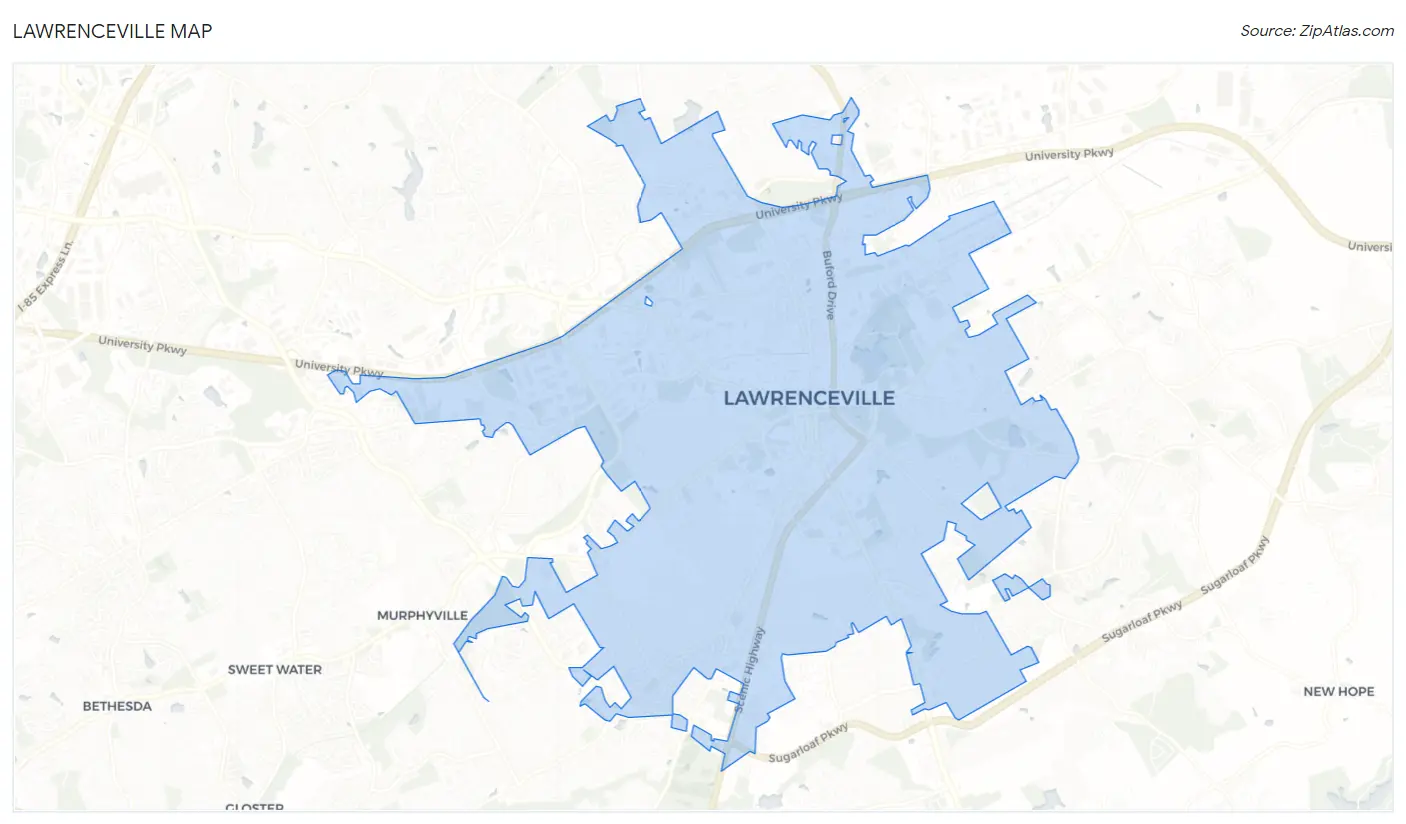
Lawrenceville Overview
$26,860
PER CAPITA INCOME
$66,260
AVG FAMILY INCOME
$55,608
AVG HOUSEHOLD INCOME
25.7%
WAGE / INCOME GAP [ % ]
74.3¢/ $1
WAGE / INCOME GAP [ $ ]
$7,990
FAMILY INCOME DEFICIT
0.41
INEQUALITY / GINI INDEX
30,465
TOTAL POPULATION
13,664
MALE POPULATION
16,801
FEMALE POPULATION
81.33
MALES / 100 FEMALES
122.96
FEMALES / 100 MALES
32.5
MEDIAN AGE
3.4
AVG FAMILY SIZE
2.8
AVG HOUSEHOLD SIZE
15,440
LABOR FORCE [ PEOPLE ]
65.3%
PERCENT IN LABOR FORCE
6.3%
UNEMPLOYMENT RATE
Income in Lawrenceville
Income Overview in Lawrenceville
Per Capita Income in Lawrenceville is $26,860, while median incomes of families and households are $66,260 and $55,608 respectively.
| Characteristic | Number | Measure |
| Per Capita Income | 30,465 | $26,860 |
| Median Family Income | 7,334 | $66,260 |
| Mean Family Income | 7,334 | $79,893 |
| Median Household Income | 10,762 | $55,608 |
| Mean Household Income | 10,762 | $72,421 |
| Income Deficit | 7,334 | $7,990 |
| Wage / Income Gap (%) | 30,465 | 25.73% |
| Wage / Income Gap ($) | 30,465 | 74.27¢ per $1 |
| Gini / Inequality Index | 30,465 | 0.41 |
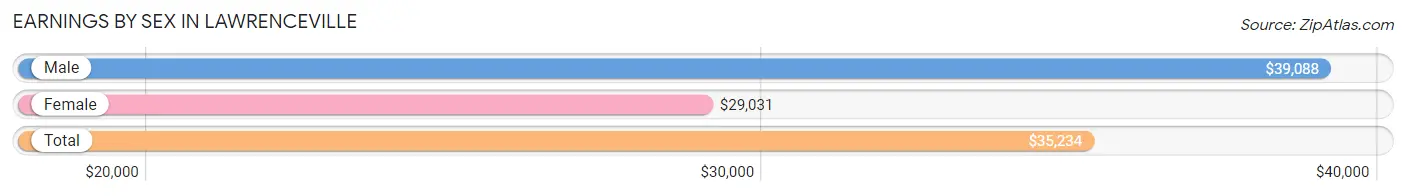
Earnings by Sex in Lawrenceville
Average Earnings in Lawrenceville are $35,234, $39,088 for men and $29,031 for women, a difference of 25.7%.
| Sex | Number | Average Earnings |
| Male | 7,532 (48.0%) | $39,088 |
| Female | 8,168 (52.0%) | $29,031 |
| Total | 15,700 (100.0%) | $35,234 |
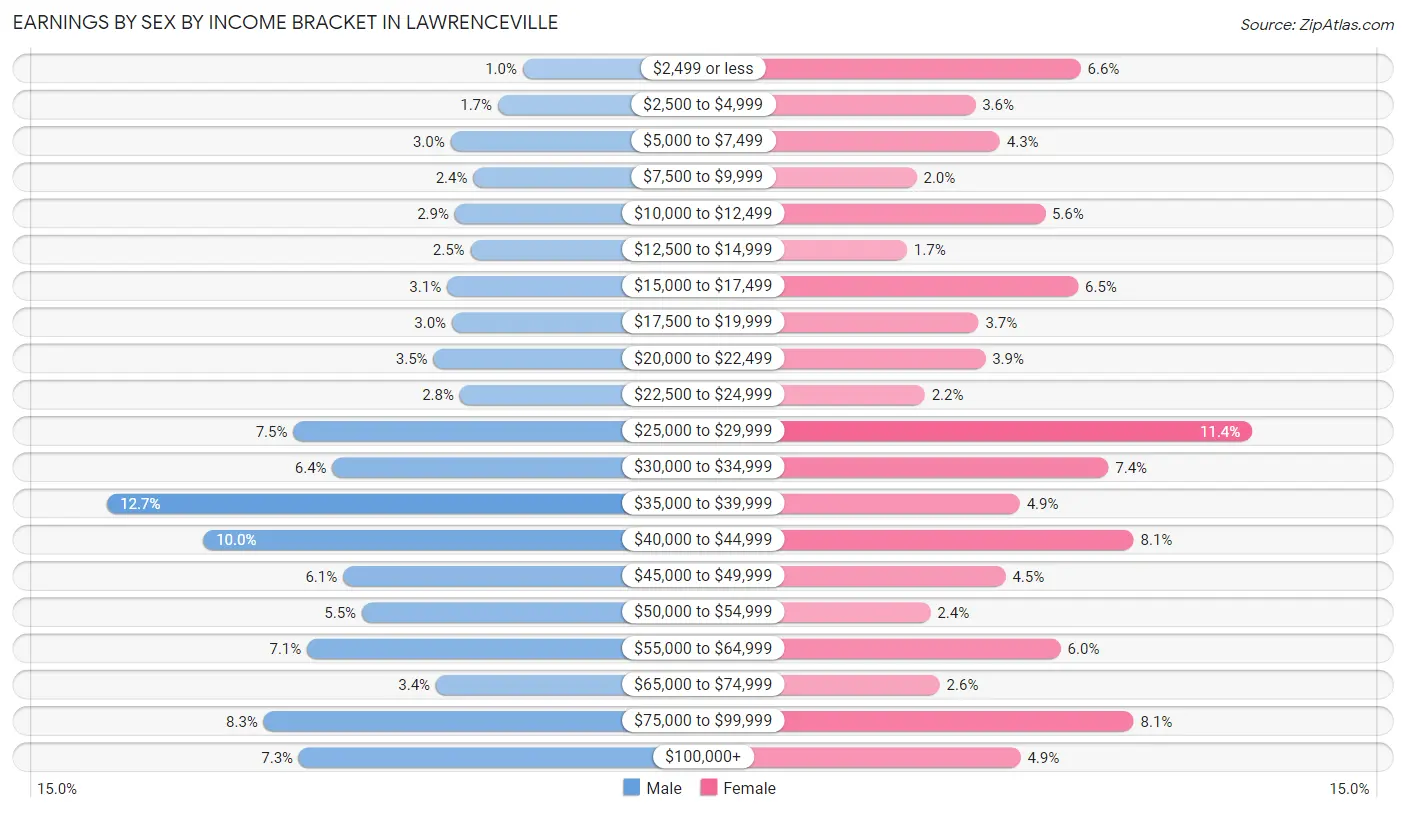
Earnings by Sex by Income Bracket in Lawrenceville
The most common earnings brackets in Lawrenceville are $35,000 to $39,999 for men (955 | 12.7%) and $25,000 to $29,999 for women (930 | 11.4%).
| Income | Male | Female |
| $2,499 or less | 75 (1.0%) | 537 (6.6%) |
| $2,500 to $4,999 | 128 (1.7%) | 295 (3.6%) |
| $5,000 to $7,499 | 228 (3.0%) | 351 (4.3%) |
| $7,500 to $9,999 | 180 (2.4%) | 160 (2.0%) |
| $10,000 to $12,499 | 219 (2.9%) | 455 (5.6%) |
| $12,500 to $14,999 | 186 (2.5%) | 138 (1.7%) |
| $15,000 to $17,499 | 236 (3.1%) | 531 (6.5%) |
| $17,500 to $19,999 | 225 (3.0%) | 302 (3.7%) |
| $20,000 to $22,499 | 264 (3.5%) | 318 (3.9%) |
| $22,500 to $24,999 | 209 (2.8%) | 179 (2.2%) |
| $25,000 to $29,999 | 561 (7.4%) | 930 (11.4%) |
| $30,000 to $34,999 | 478 (6.4%) | 600 (7.3%) |
| $35,000 to $39,999 | 955 (12.7%) | 397 (4.9%) |
| $40,000 to $44,999 | 752 (10.0%) | 658 (8.1%) |
| $45,000 to $49,999 | 456 (6.0%) | 364 (4.5%) |
| $50,000 to $54,999 | 416 (5.5%) | 192 (2.4%) |
| $55,000 to $64,999 | 532 (7.1%) | 491 (6.0%) |
| $65,000 to $74,999 | 259 (3.4%) | 213 (2.6%) |
| $75,000 to $99,999 | 624 (8.3%) | 658 (8.1%) |
| $100,000+ | 549 (7.3%) | 399 (4.9%) |
| Total | 7,532 (100.0%) | 8,168 (100.0%) |
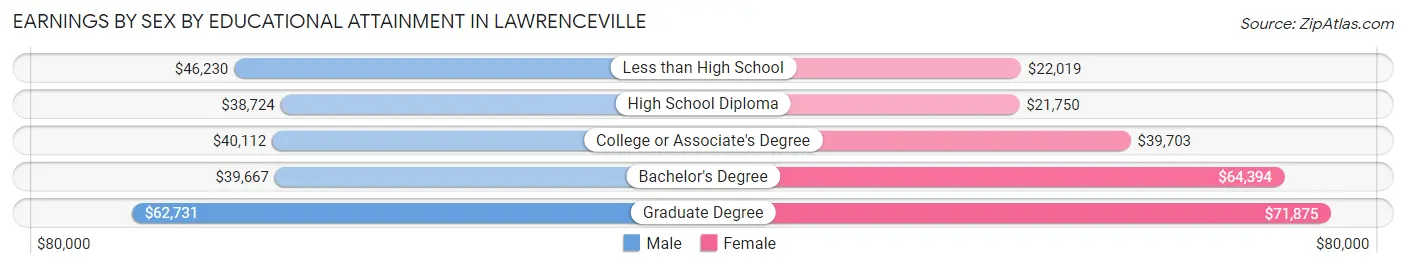
Earnings by Sex by Educational Attainment in Lawrenceville
Average earnings in Lawrenceville are $40,262 for men and $36,014 for women, a difference of 10.5%. Men with an educational attainment of graduate degree enjoy the highest average annual earnings of $62,731, while those with high school diploma education earn the least with $38,724. Women with an educational attainment of graduate degree earn the most with the average annual earnings of $71,875, while those with high school diploma education have the smallest earnings of $21,750.
| Educational Attainment | Male Income | Female Income |
| Less than High School | $46,230 | $22,019 |
| High School Diploma | $38,724 | $21,750 |
| College or Associate's Degree | $40,112 | $39,703 |
| Bachelor's Degree | $39,667 | $64,394 |
| Graduate Degree | $62,731 | $71,875 |
| Total | $40,262 | $36,014 |
Family Income in Lawrenceville
Family Income Brackets in Lawrenceville
According to the Lawrenceville family income data, there are 1,445 families falling into the $100,000 to $149,999 income range, which is the most common income bracket and makes up 19.7% of all families. Conversely, the $10,000 to $14,999 income bracket is the least frequent group with only 264 families (3.6%) belonging to this category.
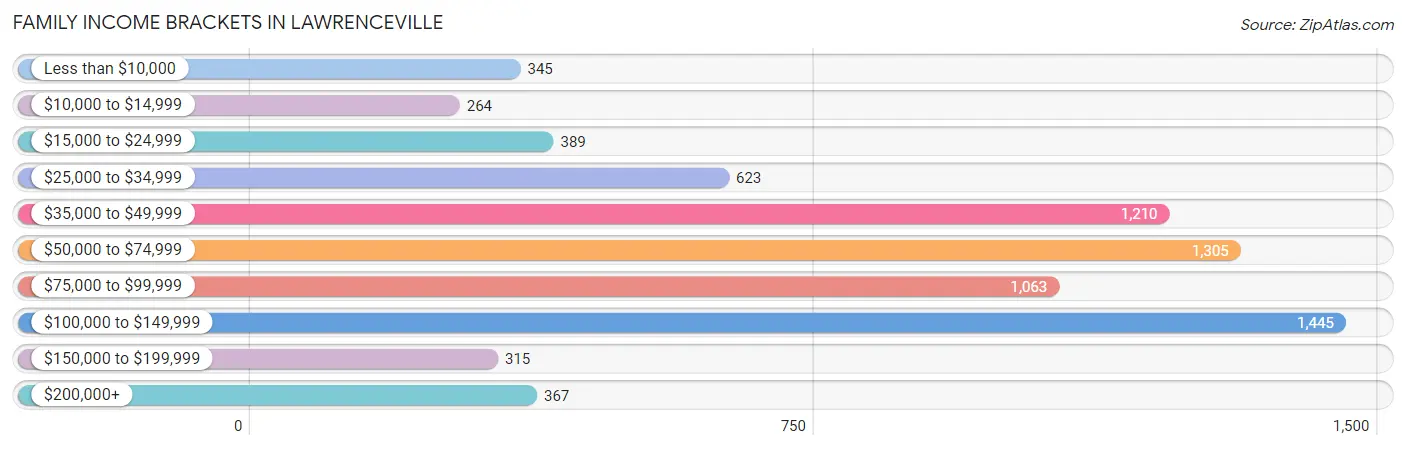
| Income Bracket | # Families | % Families |
| Less than $10,000 | 345 | 4.7% |
| $10,000 to $14,999 | 264 | 3.6% |
| $15,000 to $24,999 | 389 | 5.3% |
| $25,000 to $34,999 | 623 | 8.5% |
| $35,000 to $49,999 | 1,210 | 16.5% |
| $50,000 to $74,999 | 1,305 | 17.8% |
| $75,000 to $99,999 | 1,063 | 14.5% |
| $100,000 to $149,999 | 1,445 | 19.7% |
| $150,000 to $199,999 | 315 | 4.3% |
| $200,000+ | 367 | 5.0% |
Family Income by Famaliy Size in Lawrenceville
4-person families (957 | 13.1%) account for the highest median family income in Lawrenceville with $108,523 per family, while 4-person families (957 | 13.1%) have the highest median income of $27,131 per family member.
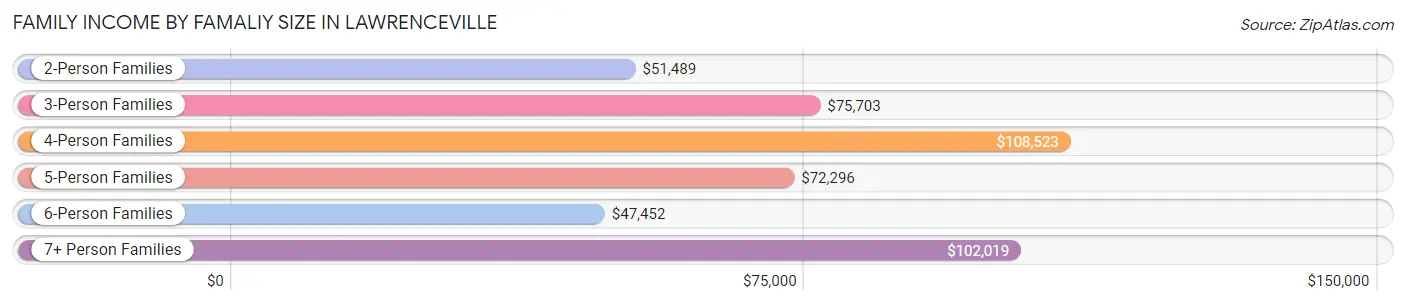
| Income Bracket | # Families | Median Income |
| 2-Person Families | 3,010 (41.0%) | $51,489 |
| 3-Person Families | 2,087 (28.5%) | $75,703 |
| 4-Person Families | 957 (13.1%) | $108,523 |
| 5-Person Families | 804 (11.0%) | $72,296 |
| 6-Person Families | 299 (4.1%) | $47,452 |
| 7+ Person Families | 177 (2.4%) | $102,019 |
| Total | 7,334 (100.0%) | $66,260 |
Family Income by Number of Earners in Lawrenceville
The median family income in Lawrenceville is $66,260, with families comprising 3+ earners (967) having the highest median family income of $109,395, while families with no earners (1,126) have the lowest median family income of $25,708, accounting for 13.2% and 15.3% of families, respectively.
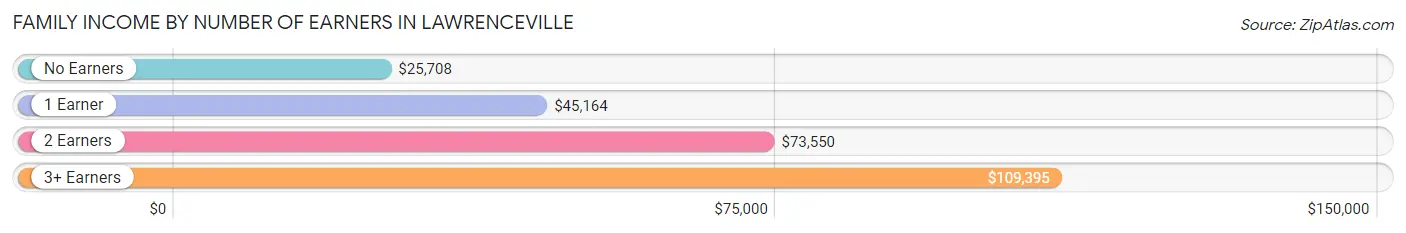
| Number of Earners | # Families | Median Income |
| No Earners | 1,126 (15.3%) | $25,708 |
| 1 Earner | 2,048 (27.9%) | $45,164 |
| 2 Earners | 3,193 (43.5%) | $73,550 |
| 3+ Earners | 967 (13.2%) | $109,395 |
| Total | 7,334 (100.0%) | $66,260 |
Household Income in Lawrenceville
Household Income Brackets in Lawrenceville
With 2,120 households falling in the category, the $35,000 to $49,999 income range is the most frequent in Lawrenceville, accounting for 19.7% of all households. In contrast, only 355 households (3.3%) fall into the $150,000 to $199,999 income bracket, making it the least populous group.
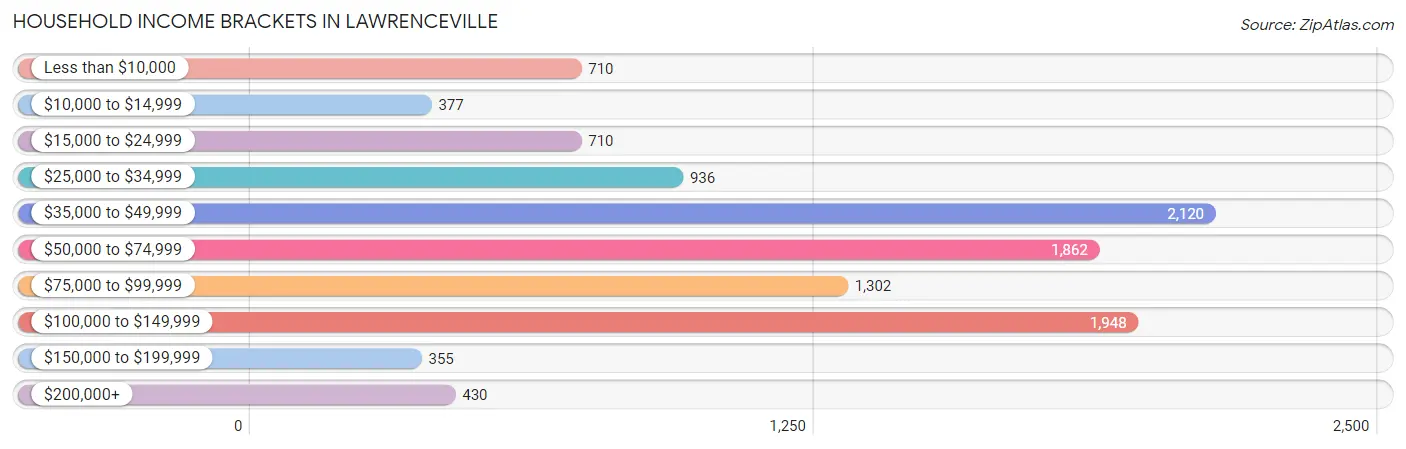
| Income Bracket | # Households | % Households |
| Less than $10,000 | 710 | 6.6% |
| $10,000 to $14,999 | 377 | 3.5% |
| $15,000 to $24,999 | 710 | 6.6% |
| $25,000 to $34,999 | 936 | 8.7% |
| $35,000 to $49,999 | 2,120 | 19.7% |
| $50,000 to $74,999 | 1,862 | 17.3% |
| $75,000 to $99,999 | 1,302 | 12.1% |
| $100,000 to $149,999 | 1,948 | 18.1% |
| $150,000 to $199,999 | 355 | 3.3% |
| $200,000+ | 430 | 4.0% |
Household Income by Householder Age in Lawrenceville
The median household income in Lawrenceville is $55,608, with the highest median household income of $71,510 found in the 25 to 44 years age bracket for the primary householder. A total of 4,007 households (37.2%) fall into this category. Meanwhile, the 65+ years age bracket for the primary householder has the lowest median household income of $40,423, with 2,376 households (22.1%) in this group.
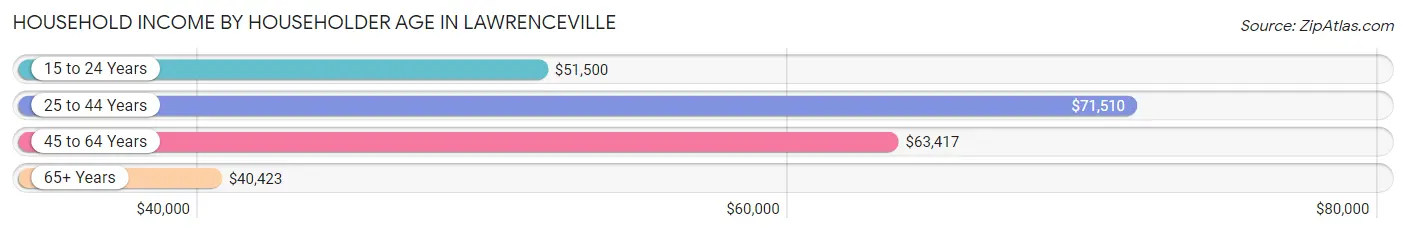
| Income Bracket | # Households | Median Income |
| 15 to 24 Years | 972 (9.0%) | $51,500 |
| 25 to 44 Years | 4,007 (37.2%) | $71,510 |
| 45 to 64 Years | 3,407 (31.7%) | $63,417 |
| 65+ Years | 2,376 (22.1%) | $40,423 |
| Total | 10,762 (100.0%) | $55,608 |
Poverty in Lawrenceville
Income Below Poverty by Sex and Age in Lawrenceville
With 16.3% poverty level for males and 18.0% for females among the residents of Lawrenceville, 15 year old males and under 5 year old females are the most vulnerable to poverty, with 65 males (54.2%) and 329 females (42.6%) in their respective age groups living below the poverty level.
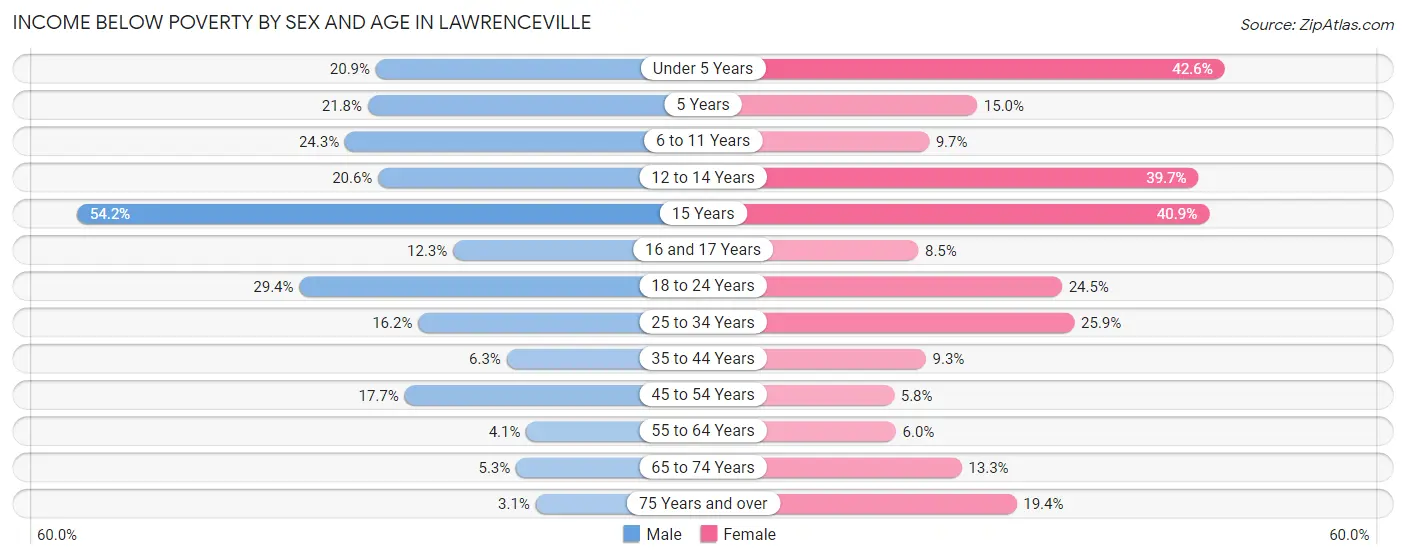
| Age Bracket | Male | Female |
| Under 5 Years | 260 (20.9%) | 329 (42.6%) |
| 5 Years | 86 (21.8%) | 34 (15.0%) |
| 6 to 11 Years | 331 (24.3%) | 101 (9.7%) |
| 12 to 14 Years | 113 (20.6%) | 305 (39.7%) |
| 15 Years | 65 (54.2%) | 128 (40.9%) |
| 16 and 17 Years | 41 (12.3%) | 46 (8.5%) |
| 18 to 24 Years | 449 (29.4%) | 538 (24.5%) |
| 25 to 34 Years | 354 (16.2%) | 695 (25.9%) |
| 35 to 44 Years | 118 (6.3%) | 184 (9.3%) |
| 45 to 54 Years | 274 (17.7%) | 114 (5.8%) |
| 55 to 64 Years | 52 (4.1%) | 100 (6.0%) |
| 65 to 74 Years | 43 (5.3%) | 144 (13.3%) |
| 75 Years and over | 9 (3.1%) | 246 (19.4%) |
| Total | 2,195 (16.3%) | 2,964 (18.0%) |
Income Above Poverty by Sex and Age in Lawrenceville
According to the poverty statistics in Lawrenceville, males aged 75 years and over and females aged 45 to 54 years are the age groups that are most secure financially, with 96.9% of males and 94.2% of females in these age groups living above the poverty line.
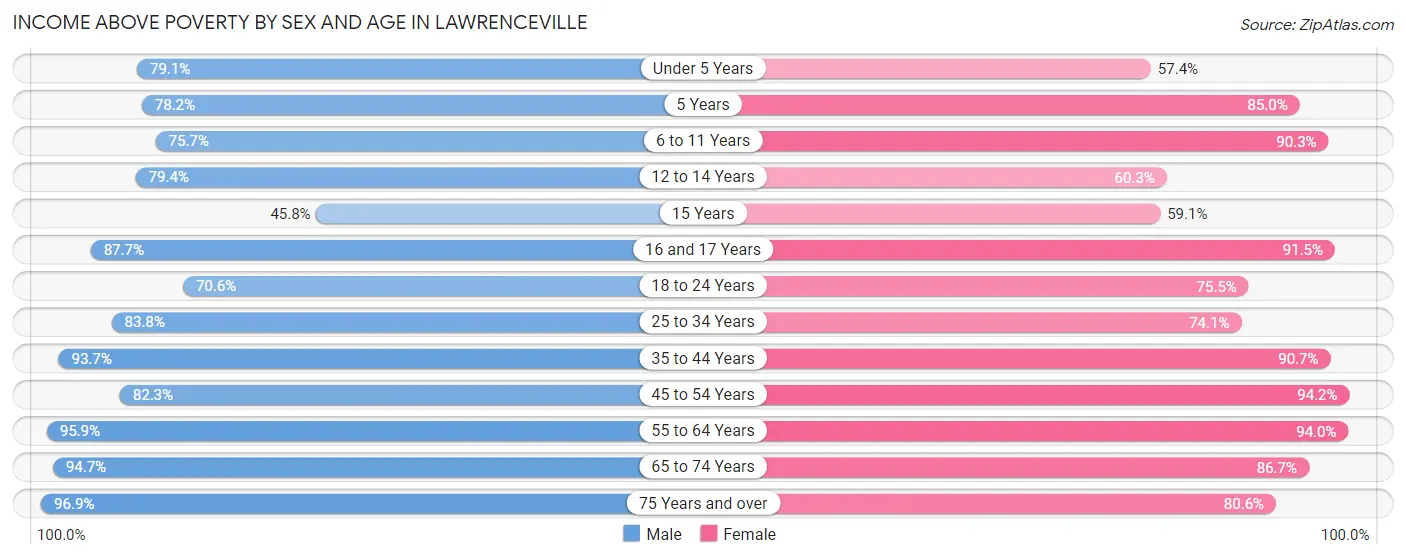
| Age Bracket | Male | Female |
| Under 5 Years | 985 (79.1%) | 443 (57.4%) |
| 5 Years | 309 (78.2%) | 192 (85.0%) |
| 6 to 11 Years | 1,030 (75.7%) | 942 (90.3%) |
| 12 to 14 Years | 435 (79.4%) | 463 (60.3%) |
| 15 Years | 55 (45.8%) | 185 (59.1%) |
| 16 and 17 Years | 293 (87.7%) | 496 (91.5%) |
| 18 to 24 Years | 1,078 (70.6%) | 1,659 (75.5%) |
| 25 to 34 Years | 1,836 (83.8%) | 1,992 (74.1%) |
| 35 to 44 Years | 1,751 (93.7%) | 1,788 (90.7%) |
| 45 to 54 Years | 1,275 (82.3%) | 1,856 (94.2%) |
| 55 to 64 Years | 1,207 (95.9%) | 1,569 (94.0%) |
| 65 to 74 Years | 774 (94.7%) | 937 (86.7%) |
| 75 Years and over | 283 (96.9%) | 1,020 (80.6%) |
| Total | 11,311 (83.8%) | 13,542 (82.0%) |
Income Below Poverty Among Married-Couple Families in Lawrenceville
The poverty statistics for married-couple families in Lawrenceville show that 6.1% or 279 of the total 4,583 families live below the poverty line. Families with 3 or 4 children have the highest poverty rate of 11.9%, comprising of 65 families. On the other hand, families with 5 or more children have the lowest poverty rate of 0.0%, which includes 0 families.
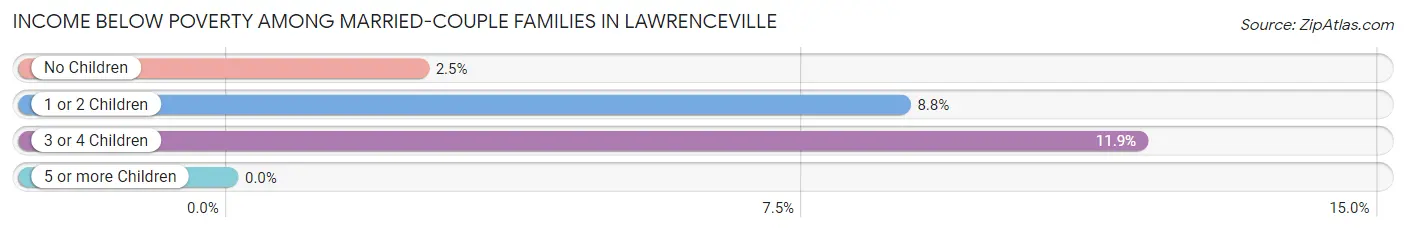
| Children | Above Poverty | Below Poverty |
| No Children | 2,157 (97.5%) | 55 (2.5%) |
| 1 or 2 Children | 1,652 (91.2%) | 159 (8.8%) |
| 3 or 4 Children | 482 (88.1%) | 65 (11.9%) |
| 5 or more Children | 13 (100.0%) | 0 (0.0%) |
| Total | 4,304 (93.9%) | 279 (6.1%) |
Income Below Poverty Among Single-Parent Households in Lawrenceville
According to the poverty data in Lawrenceville, 27.8% or 175 single-father households and 32.9% or 699 single-mother households are living below the poverty line. Among single-father households, those with 5 or more children have the highest poverty rate, with 23 households (100.0%) experiencing poverty. Likewise, among single-mother households, those with 3 or 4 children have the highest poverty rate, with 122 households (73.9%) falling below the poverty line.
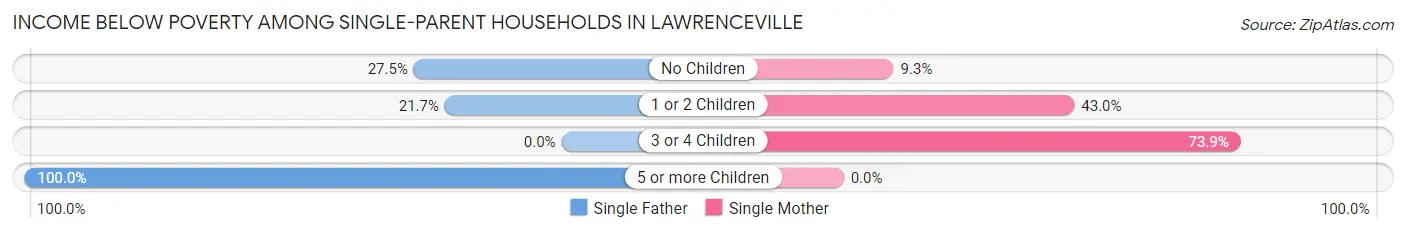
| Children | Single Father | Single Mother |
| No Children | 112 (27.5%) | 73 (9.3%) |
| 1 or 2 Children | 40 (21.7%) | 504 (43.0%) |
| 3 or 4 Children | 0 (0.0%) | 122 (73.9%) |
| 5 or more Children | 23 (100.0%) | 0 (0.0%) |
| Total | 175 (27.8%) | 699 (32.9%) |
Income Below Poverty Among Married-Couple vs Single-Parent Households in Lawrenceville
The poverty data for Lawrenceville shows that 279 of the married-couple family households (6.1%) and 874 of the single-parent households (31.8%) are living below the poverty level. Within the married-couple family households, those with 3 or 4 children have the highest poverty rate, with 65 households (11.9%) falling below the poverty line. Among the single-parent households, those with 5 or more children have the highest poverty rate, with 23 household (100.0%) living below poverty.
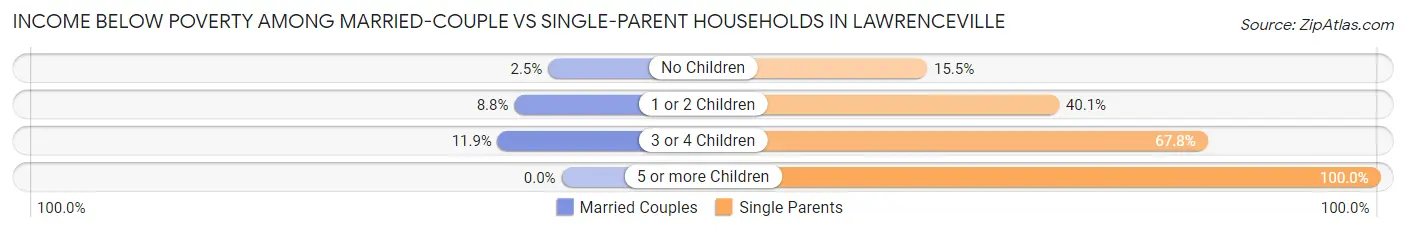
| Children | Married-Couple Families | Single-Parent Households |
| No Children | 55 (2.5%) | 185 (15.5%) |
| 1 or 2 Children | 159 (8.8%) | 544 (40.1%) |
| 3 or 4 Children | 65 (11.9%) | 122 (67.8%) |
| 5 or more Children | 0 (0.0%) | 23 (100.0%) |
| Total | 279 (6.1%) | 874 (31.8%) |
Race in Lawrenceville
The most populous races in Lawrenceville are Black / African American (10,733 | 35.2%), White / Caucasian (10,663 | 35.0%), and Hispanic or Latino (7,135 | 23.4%).
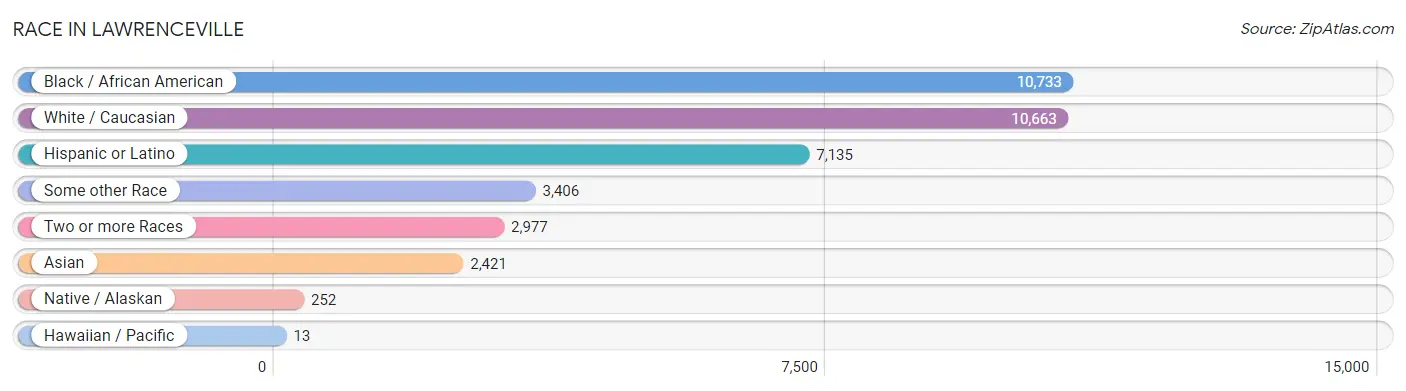
| Race | # Population | % Population |
| Asian | 2,421 | 8.0% |
| Black / African American | 10,733 | 35.2% |
| Hawaiian / Pacific | 13 | 0.0% |
| Hispanic or Latino | 7,135 | 23.4% |
| Native / Alaskan | 252 | 0.8% |
| White / Caucasian | 10,663 | 35.0% |
| Two or more Races | 2,977 | 9.8% |
| Some other Race | 3,406 | 11.2% |
| Total | 30,465 | 100.0% |
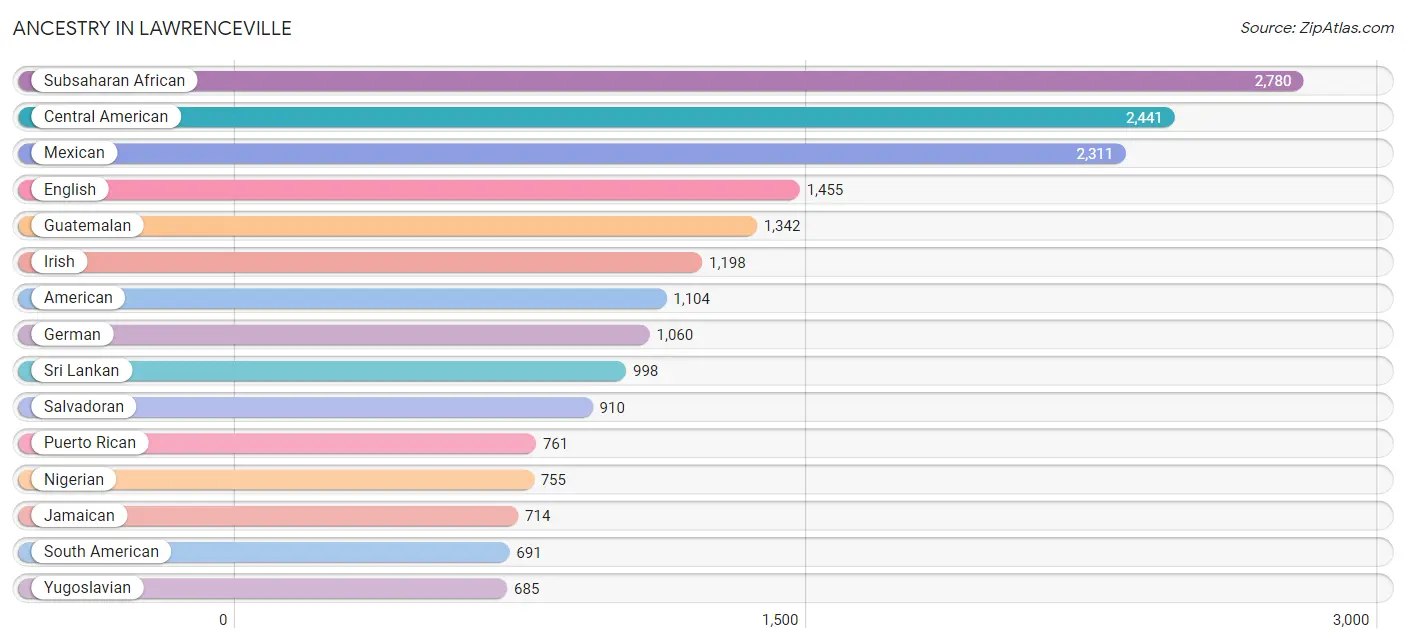
Ancestry in Lawrenceville
The most populous ancestries reported in Lawrenceville are Subsaharan African (2,780 | 9.1%), Central American (2,441 | 8.0%), Mexican (2,311 | 7.6%), English (1,455 | 4.8%), and Guatemalan (1,342 | 4.4%), together accounting for 33.9% of all Lawrenceville residents.
| Ancestry | # Population | % Population |
| African | 388 | 1.3% |
| American | 1,104 | 3.6% |
| Arab | 106 | 0.4% |
| Argentinean | 10 | 0.0% |
| Assyrian / Chaldean / Syriac | 46 | 0.2% |
| Austrian | 54 | 0.2% |
| Barbadian | 71 | 0.2% |
| Belgian | 56 | 0.2% |
| Bhutanese | 14 | 0.1% |
| Blackfeet | 57 | 0.2% |
| British | 75 | 0.3% |
| Burmese | 412 | 1.3% |
| Canadian | 8 | 0.0% |
| Celtic | 9 | 0.0% |
| Central American | 2,441 | 8.0% |
| Central American Indian | 24 | 0.1% |
| Cherokee | 120 | 0.4% |
| Chilean | 16 | 0.1% |
| Chippewa | 6 | 0.0% |
| Colombian | 463 | 1.5% |
| Costa Rican | 9 | 0.0% |
| Creek | 15 | 0.1% |
| Cuban | 537 | 1.8% |
| Czech | 13 | 0.0% |
| Danish | 9 | 0.0% |
| Dominican | 269 | 0.9% |
| Dutch | 98 | 0.3% |
| Eastern European | 12 | 0.0% |
| Ecuadorian | 17 | 0.1% |
| Egyptian | 21 | 0.1% |
| English | 1,455 | 4.8% |
| Ethiopian | 135 | 0.4% |
| European | 219 | 0.7% |
| French | 241 | 0.8% |
| French Canadian | 549 | 1.8% |
| German | 1,060 | 3.5% |
| Ghanaian | 565 | 1.8% |
| Greek | 17 | 0.1% |
| Guamanian / Chamorro | 1 | 0.0% |
| Guatemalan | 1,342 | 4.4% |
| Haitian | 132 | 0.4% |
| Honduran | 154 | 0.5% |
| Hungarian | 87 | 0.3% |
| Indian (Asian) | 234 | 0.8% |
| Iranian | 19 | 0.1% |
| Irish | 1,198 | 3.9% |
| Italian | 296 | 1.0% |
| Jamaican | 714 | 2.3% |
| Japanese | 43 | 0.1% |
| Korean | 131 | 0.4% |
| Laotian | 20 | 0.1% |
| Lebanese | 9 | 0.0% |
| Liberian | 182 | 0.6% |
| Lumbee | 9 | 0.0% |
| Mexican | 2,311 | 7.6% |
| Mexican American Indian | 224 | 0.7% |
| Moroccan | 19 | 0.1% |
| Native Hawaiian | 12 | 0.0% |
| Nicaraguan | 12 | 0.0% |
| Nigerian | 755 | 2.5% |
| Norwegian | 42 | 0.1% |
| Pakistani | 184 | 0.6% |
| Panamanian | 14 | 0.1% |
| Peruvian | 25 | 0.1% |
| Polish | 134 | 0.4% |
| Portuguese | 47 | 0.2% |
| Puerto Rican | 761 | 2.5% |
| Puget Sound Salish | 78 | 0.3% |
| Romanian | 83 | 0.3% |
| Russian | 74 | 0.2% |
| Salvadoran | 910 | 3.0% |
| Samoan | 32 | 0.1% |
| Scandinavian | 52 | 0.2% |
| Scotch-Irish | 226 | 0.7% |
| Scottish | 286 | 0.9% |
| Serbian | 17 | 0.1% |
| Sierra Leonean | 9 | 0.0% |
| Slavic | 16 | 0.1% |
| Somali | 18 | 0.1% |
| South African | 8 | 0.0% |
| South American | 691 | 2.3% |
| Spaniard | 38 | 0.1% |
| Sri Lankan | 998 | 3.3% |
| Subsaharan African | 2,780 | 9.1% |
| Swedish | 92 | 0.3% |
| Swiss | 76 | 0.3% |
| Thai | 352 | 1.2% |
| U.S. Virgin Islander | 10 | 0.0% |
| Uruguayan | 28 | 0.1% |
| Venezuelan | 132 | 0.4% |
| Vietnamese | 260 | 0.9% |
| Welsh | 40 | 0.1% |
| Yugoslavian | 685 | 2.2% |
| Zimbabwean | 14 | 0.1% | View All 94 Rows |
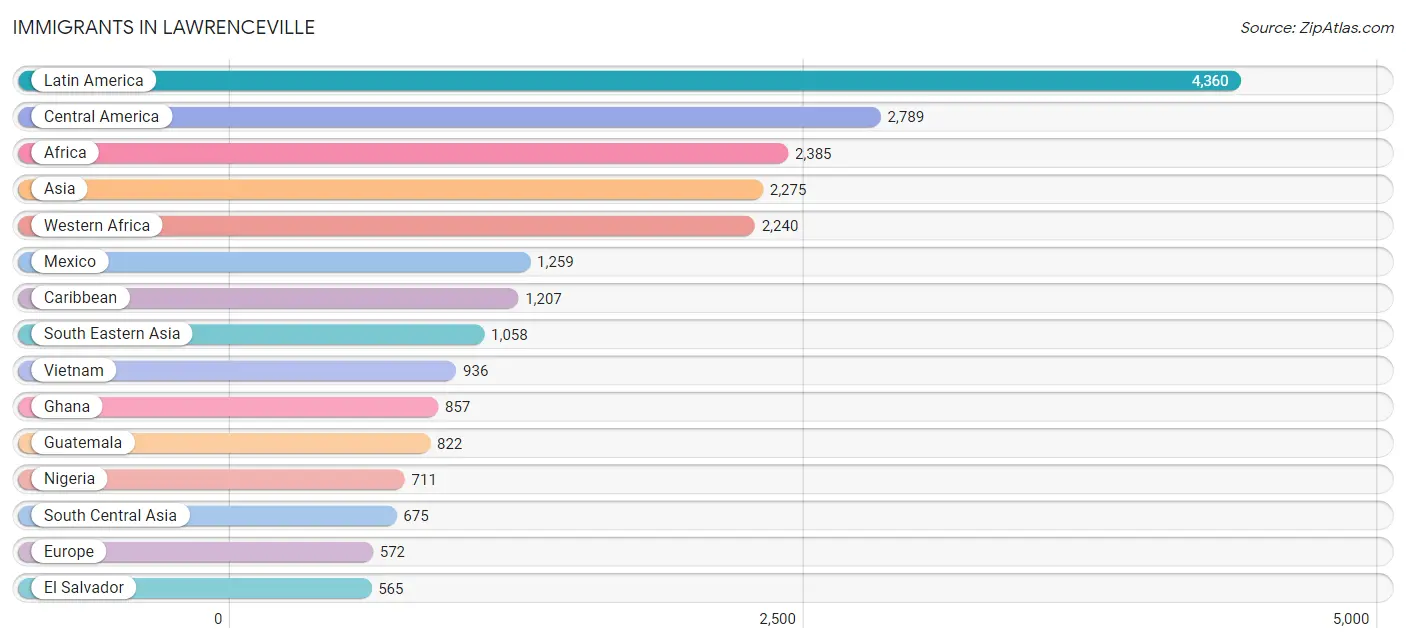
Immigrants in Lawrenceville
The most numerous immigrant groups reported in Lawrenceville came from Latin America (4,360 | 14.3%), Central America (2,789 | 9.1%), Africa (2,385 | 7.8%), Asia (2,275 | 7.5%), and Western Africa (2,240 | 7.3%), together accounting for 46.1% of all Lawrenceville residents.
| Immigration Origin | # Population | % Population |
| Afghanistan | 45 | 0.2% |
| Africa | 2,385 | 7.8% |
| Argentina | 19 | 0.1% |
| Asia | 2,275 | 7.5% |
| Austria | 8 | 0.0% |
| Bangladesh | 301 | 1.0% |
| Belize | 30 | 0.1% |
| Bosnia and Herzegovina | 313 | 1.0% |
| Canada | 148 | 0.5% |
| Caribbean | 1,207 | 4.0% |
| Central America | 2,789 | 9.1% |
| Chile | 16 | 0.1% |
| China | 359 | 1.2% |
| Colombia | 205 | 0.7% |
| Cuba | 504 | 1.7% |
| Czechoslovakia | 13 | 0.0% |
| Dominican Republic | 185 | 0.6% |
| Eastern Africa | 76 | 0.3% |
| Eastern Asia | 461 | 1.5% |
| Eastern Europe | 502 | 1.7% |
| El Salvador | 565 | 1.8% |
| Ethiopia | 58 | 0.2% |
| Europe | 572 | 1.9% |
| Ghana | 857 | 2.8% |
| Guatemala | 822 | 2.7% |
| Haiti | 114 | 0.4% |
| Honduras | 101 | 0.3% |
| India | 61 | 0.2% |
| Indonesia | 29 | 0.1% |
| Iran | 77 | 0.3% |
| Iraq | 72 | 0.2% |
| Jamaica | 404 | 1.3% |
| Korea | 102 | 0.3% |
| Kuwait | 9 | 0.0% |
| Latin America | 4,360 | 14.3% |
| Liberia | 67 | 0.2% |
| Mexico | 1,259 | 4.1% |
| Moldova | 10 | 0.0% |
| Morocco | 19 | 0.1% |
| Netherlands | 21 | 0.1% |
| Nicaragua | 12 | 0.0% |
| Nigeria | 711 | 2.3% |
| Northern Africa | 19 | 0.1% |
| Northern Europe | 41 | 0.1% |
| Pakistan | 164 | 0.5% |
| Peru | 18 | 0.1% |
| Philippines | 50 | 0.2% |
| Poland | 15 | 0.1% |
| Romania | 73 | 0.2% |
| Scotland | 41 | 0.1% |
| Serbia | 7 | 0.0% |
| Sierra Leone | 4 | 0.0% |
| Somalia | 18 | 0.1% |
| South Africa | 8 | 0.0% |
| South America | 364 | 1.2% |
| South Central Asia | 675 | 2.2% |
| South Eastern Asia | 1,058 | 3.5% |
| Sri Lanka | 8 | 0.0% |
| Thailand | 43 | 0.1% |
| Uruguay | 28 | 0.1% |
| Venezuela | 78 | 0.3% |
| Vietnam | 936 | 3.1% |
| Western Africa | 2,240 | 7.3% |
| Western Asia | 81 | 0.3% |
| Western Europe | 29 | 0.1% | View All 65 Rows |
Sex and Age in Lawrenceville
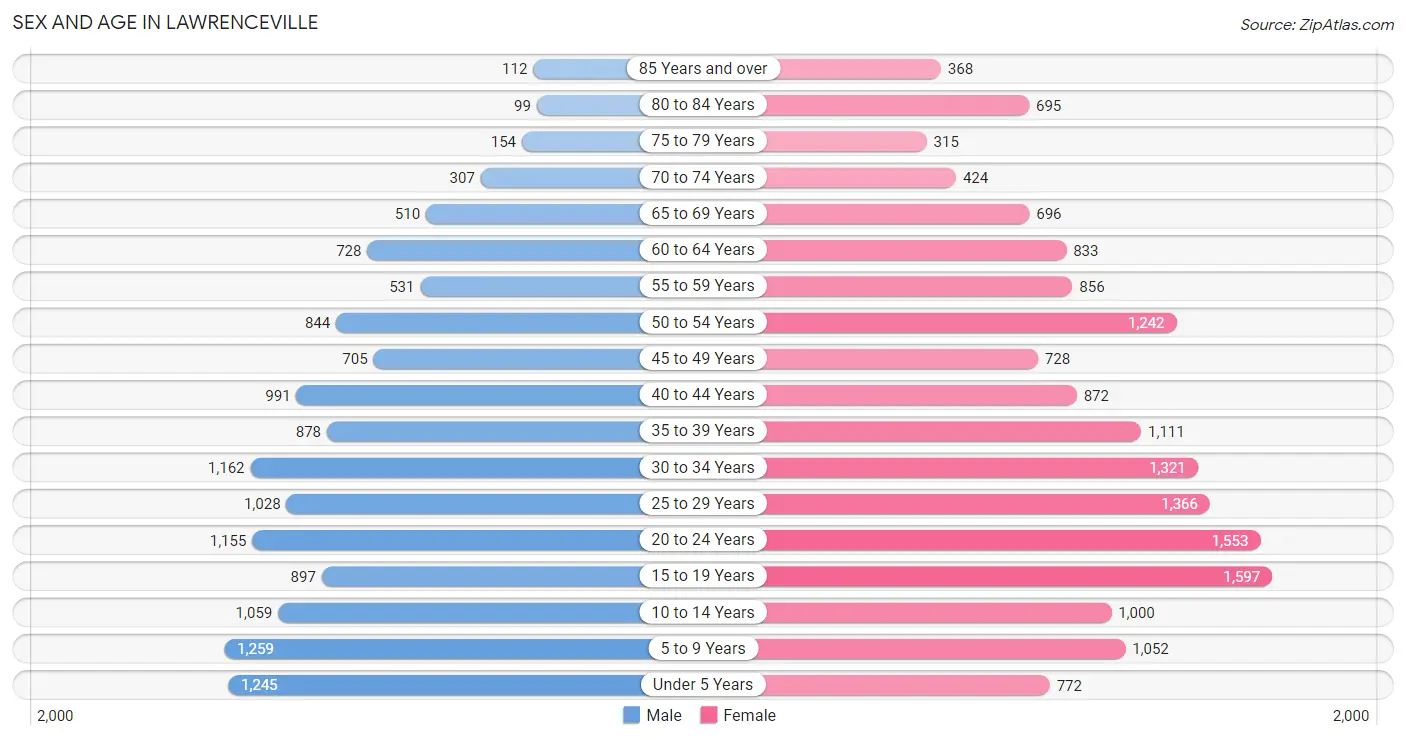
Sex and Age in Lawrenceville
The most populous age groups in Lawrenceville are 5 to 9 Years (1,259 | 9.2%) for men and 15 to 19 Years (1,597 | 9.5%) for women.
| Age Bracket | Male | Female |
| Under 5 Years | 1,245 (9.1%) | 772 (4.6%) |
| 5 to 9 Years | 1,259 (9.2%) | 1,052 (6.3%) |
| 10 to 14 Years | 1,059 (7.7%) | 1,000 (5.9%) |
| 15 to 19 Years | 897 (6.6%) | 1,597 (9.5%) |
| 20 to 24 Years | 1,155 (8.5%) | 1,553 (9.2%) |
| 25 to 29 Years | 1,028 (7.5%) | 1,366 (8.1%) |
| 30 to 34 Years | 1,162 (8.5%) | 1,321 (7.9%) |
| 35 to 39 Years | 878 (6.4%) | 1,111 (6.6%) |
| 40 to 44 Years | 991 (7.2%) | 872 (5.2%) |
| 45 to 49 Years | 705 (5.2%) | 728 (4.3%) |
| 50 to 54 Years | 844 (6.2%) | 1,242 (7.4%) |
| 55 to 59 Years | 531 (3.9%) | 856 (5.1%) |
| 60 to 64 Years | 728 (5.3%) | 833 (5.0%) |
| 65 to 69 Years | 510 (3.7%) | 696 (4.1%) |
| 70 to 74 Years | 307 (2.2%) | 424 (2.5%) |
| 75 to 79 Years | 154 (1.1%) | 315 (1.9%) |
| 80 to 84 Years | 99 (0.7%) | 695 (4.1%) |
| 85 Years and over | 112 (0.8%) | 368 (2.2%) |
| Total | 13,664 (100.0%) | 16,801 (100.0%) |
Families and Households in Lawrenceville
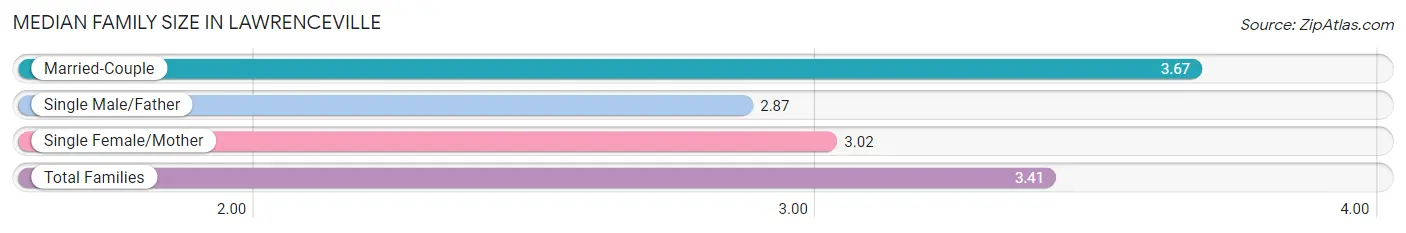
Median Family Size in Lawrenceville
The median family size in Lawrenceville is 3.41 persons per family, with married-couple families (4,583 | 62.5%) accounting for the largest median family size of 3.67 persons per family. On the other hand, single male/father families (629 | 8.6%) represent the smallest median family size with 2.87 persons per family.
| Family Type | # Families | Family Size |
| Married-Couple | 4,583 (62.5%) | 3.67 |
| Single Male/Father | 629 (8.6%) | 2.87 |
| Single Female/Mother | 2,122 (28.9%) | 3.02 |
| Total Families | 7,334 (100.0%) | 3.41 |
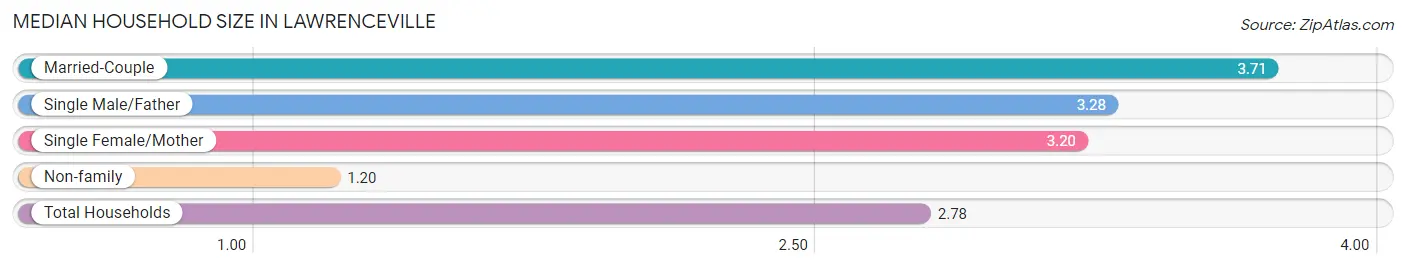
Median Household Size in Lawrenceville
The median household size in Lawrenceville is 2.78 persons per household, with married-couple households (4,583 | 42.6%) accounting for the largest median household size of 3.71 persons per household. non-family households (3,428 | 31.9%) represent the smallest median household size with 1.20 persons per household.
| Household Type | # Households | Household Size |
| Married-Couple | 4,583 (42.6%) | 3.71 |
| Single Male/Father | 629 (5.8%) | 3.28 |
| Single Female/Mother | 2,122 (19.7%) | 3.20 |
| Non-family | 3,428 (31.9%) | 1.20 |
| Total Households | 10,762 (100.0%) | 2.78 |
Household Size by Marriage Status in Lawrenceville
Out of a total of 10,762 households in Lawrenceville, 7,334 (68.1%) are family households, while 3,428 (31.9%) are nonfamily households. The most numerous type of family households are 2-person households, comprising 2,679, and the most common type of nonfamily households are 1-person households, comprising 2,930.
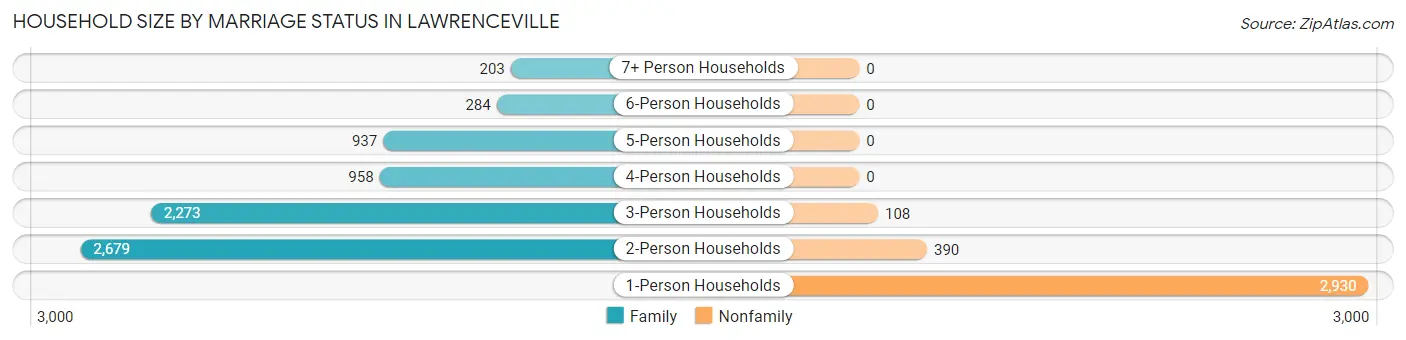
| Household Size | Family Households | Nonfamily Households |
| 1-Person Households | - | 2,930 (27.2%) |
| 2-Person Households | 2,679 (24.9%) | 390 (3.6%) |
| 3-Person Households | 2,273 (21.1%) | 108 (1.0%) |
| 4-Person Households | 958 (8.9%) | 0 (0.0%) |
| 5-Person Households | 937 (8.7%) | 0 (0.0%) |
| 6-Person Households | 284 (2.6%) | 0 (0.0%) |
| 7+ Person Households | 203 (1.9%) | 0 (0.0%) |
| Total | 7,334 (68.1%) | 3,428 (31.9%) |
Female Fertility in Lawrenceville
Fertility by Age in Lawrenceville
Average fertility rate in Lawrenceville is 27.0 births per 1,000 women. Women in the age bracket of 35 to 50 years have the highest fertility rate with 47.0 births per 1,000 women. Women in the age bracket of 35 to 50 years acount for 60.3% of all women with births.
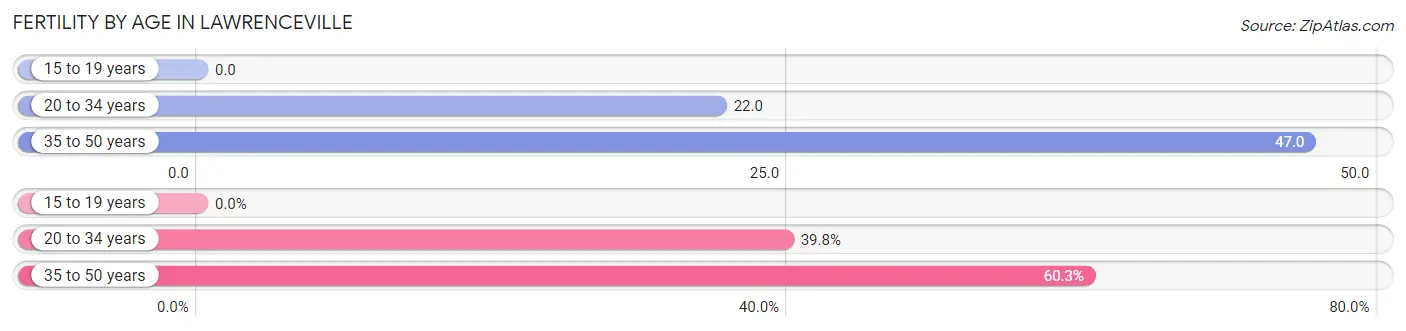
| Age Bracket | Women with Births | Births / 1,000 Women |
| 15 to 19 years | 0 (0.0%) | 0.0 |
| 20 to 34 years | 95 (39.8%) | 22.0 |
| 35 to 50 years | 144 (60.3%) | 47.0 |
| Total | 239 (100.0%) | 27.0 |
Fertility by Age by Marriage Status in Lawrenceville
81.2% of women with births (239) in Lawrenceville are married. The highest percentage of unmarried women with births falls into 20 to 34 years age bracket with 47.4% of them unmarried at the time of birth, while the lowest percentage of unmarried women with births belong to 35 to 50 years age bracket with 0.0% of them unmarried.
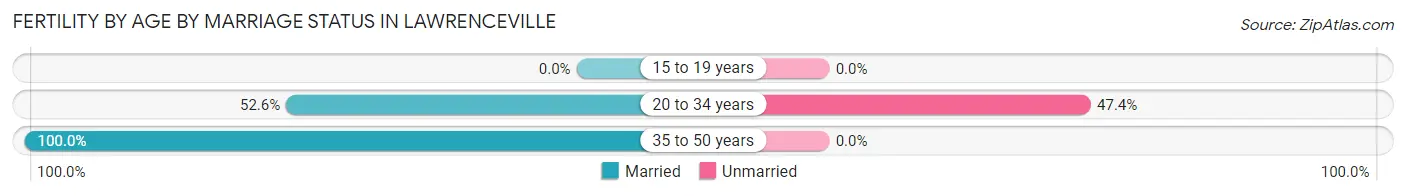
| Age Bracket | Married | Unmarried |
| 15 to 19 years | 0 (0.0%) | 0 (0.0%) |
| 20 to 34 years | 50 (52.6%) | 45 (47.4%) |
| 35 to 50 years | 144 (100.0%) | 0 (0.0%) |
| Total | 194 (81.2%) | 45 (18.8%) |
Fertility by Education in Lawrenceville
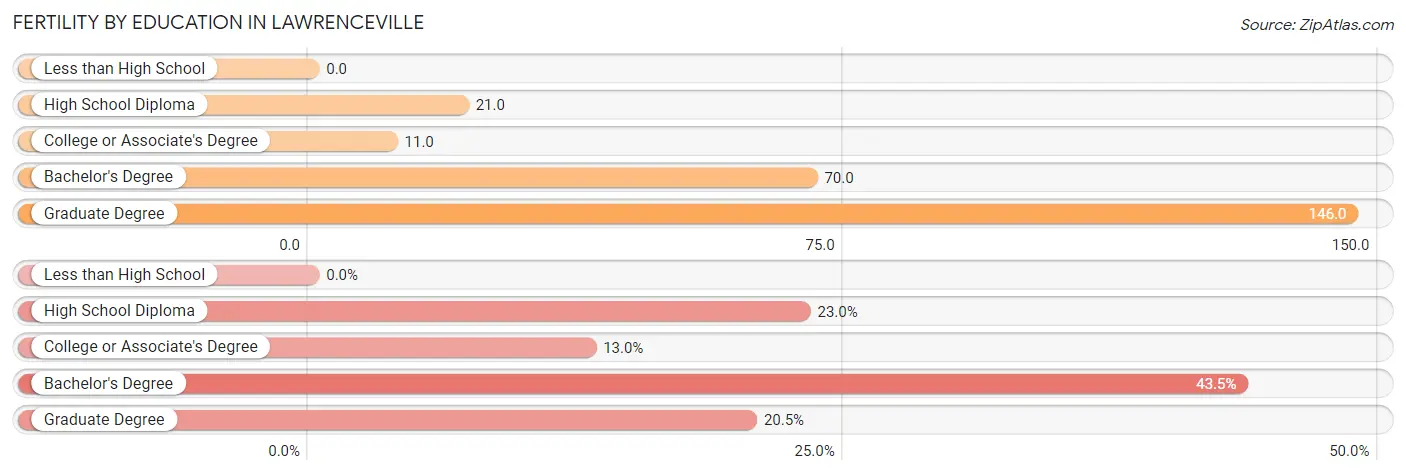
| Educational Attainment | Women with Births | Births / 1,000 Women |
| Less than High School | 0 (0.0%) | 0.0 |
| High School Diploma | 55 (23.0%) | 21.0 |
| College or Associate's Degree | 31 (13.0%) | 11.0 |
| Bachelor's Degree | 104 (43.5%) | 70.0 |
| Graduate Degree | 49 (20.5%) | 146.0 |
| Total | 239 (100.0%) | 27.0 |
Fertility by Education by Marriage Status in Lawrenceville
18.8% of women with births in Lawrenceville are unmarried. Women with the educational attainment of bachelor's degree are most likely to be married with 100.0% of them married at childbirth, while women with the educational attainment of high school diploma are least likely to be married with 61.8% of them unmarried at childbirth.
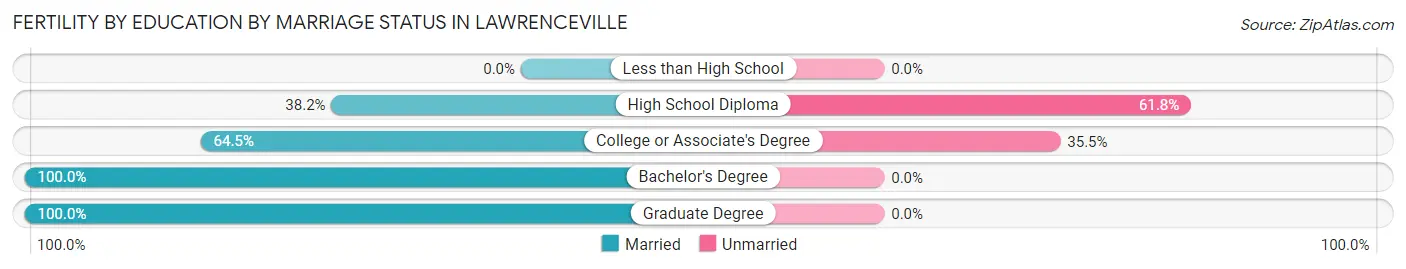
| Educational Attainment | Married | Unmarried |
| Less than High School | 0 (0.0%) | 0 (0.0%) |
| High School Diploma | 21 (38.2%) | 34 (61.8%) |
| College or Associate's Degree | 20 (64.5%) | 11 (35.5%) |
| Bachelor's Degree | 104 (100.0%) | 0 (0.0%) |
| Graduate Degree | 49 (100.0%) | 0 (0.0%) |
| Total | 194 (81.2%) | 45 (18.8%) |
Employment Characteristics in Lawrenceville
Employment by Class of Employer in Lawrenceville
Among the 14,138 employed individuals in Lawrenceville, private company employees (9,778 | 69.2%), local government employees (1,352 | 9.6%), and self-employed (not incorporated) (795 | 5.6%) make up the most common classes of employment.
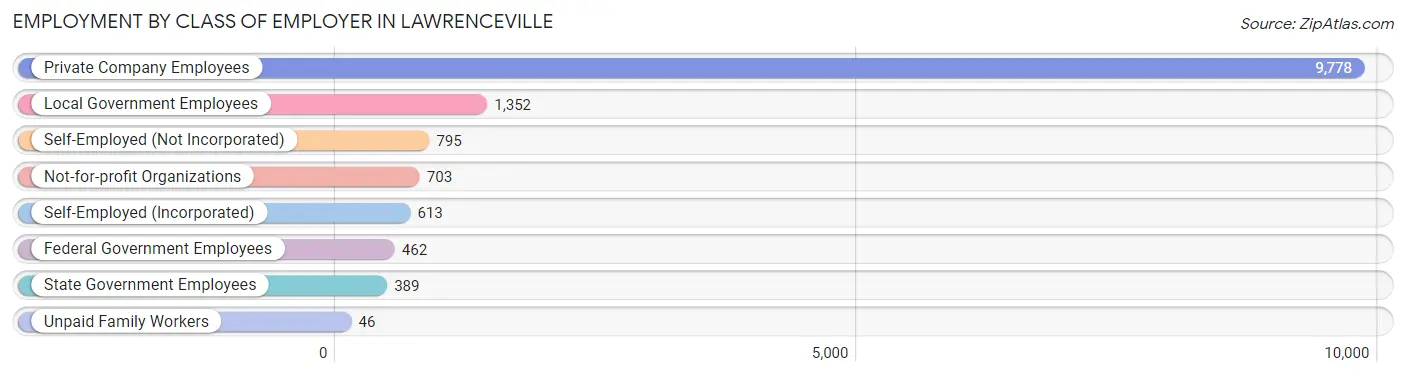
| Employer Class | # Employees | % Employees |
| Private Company Employees | 9,778 | 69.2% |
| Self-Employed (Incorporated) | 613 | 4.3% |
| Self-Employed (Not Incorporated) | 795 | 5.6% |
| Not-for-profit Organizations | 703 | 5.0% |
| Local Government Employees | 1,352 | 9.6% |
| State Government Employees | 389 | 2.8% |
| Federal Government Employees | 462 | 3.3% |
| Unpaid Family Workers | 46 | 0.3% |
| Total | 14,138 | 100.0% |
Employment Status by Age in Lawrenceville
According to the labor force statistics for Lawrenceville, out of the total population over 16 years of age (23,645), 65.3% or 15,440 individuals are in the labor force, with 6.3% or 973 of them unemployed. The age group with the highest labor force participation rate is 55 to 59 years, with 88.6% or 1,229 individuals in the labor force. Within the labor force, the 20 to 24 years age range has the highest percentage of unemployed individuals, with 14.1% or 288 of them being unemployed.
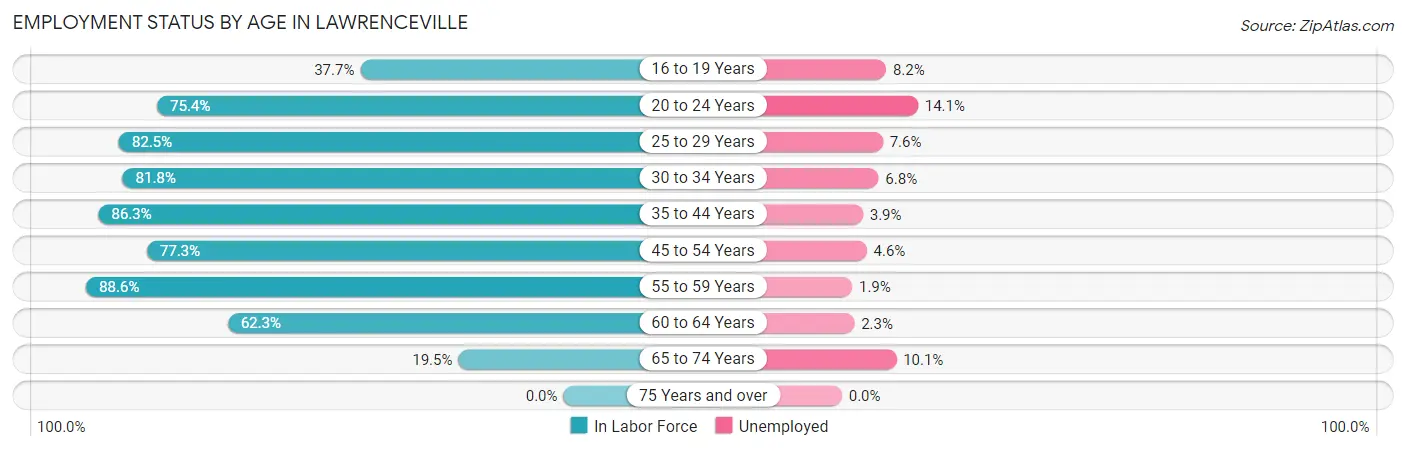
| Age Bracket | In Labor Force | Unemployed |
| 16 to 19 Years | 777 (37.7%) | 64 (8.2%) |
| 20 to 24 Years | 2,042 (75.4%) | 288 (14.1%) |
| 25 to 29 Years | 1,975 (82.5%) | 150 (7.6%) |
| 30 to 34 Years | 2,031 (81.8%) | 138 (6.8%) |
| 35 to 44 Years | 3,324 (86.3%) | 130 (3.9%) |
| 45 to 54 Years | 2,720 (77.3%) | 125 (4.6%) |
| 55 to 59 Years | 1,229 (88.6%) | 23 (1.9%) |
| 60 to 64 Years | 973 (62.3%) | 22 (2.3%) |
| 65 to 74 Years | 378 (19.5%) | 38 (10.1%) |
| 75 Years and over | 0 (0.0%) | 0 (0.0%) |
| Total | 15,440 (65.3%) | 973 (6.3%) |
Employment Status by Educational Attainment in Lawrenceville
According to labor force statistics for Lawrenceville, 80.6% of individuals (12,248) out of the total population between 25 and 64 years of age (15,196) are in the labor force, with 4.8% or 588 of them being unemployed. The group with the highest labor force participation rate are those with the educational attainment of bachelor's degree or higher, with 86.5% or 3,278 individuals in the labor force. Within the labor force, individuals with college / associate degree education have the highest percentage of unemployment, with 6.6% or 267 of them being unemployed.
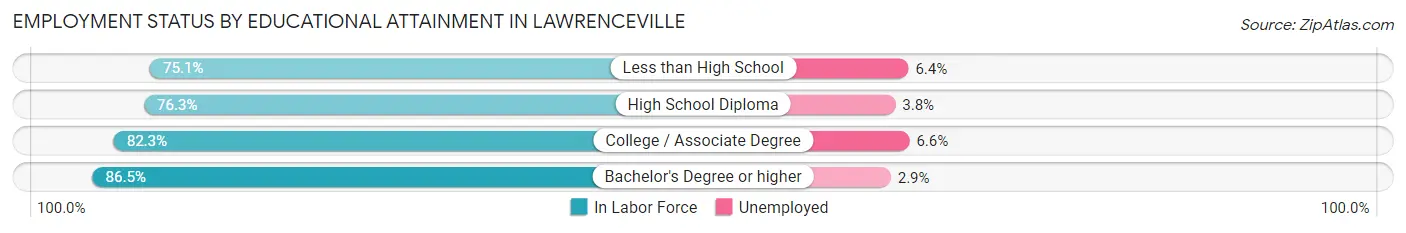
| Educational Attainment | In Labor Force | Unemployed |
| Less than High School | 1,621 (75.1%) | 138 (6.4%) |
| High School Diploma | 3,308 (76.3%) | 165 (3.8%) |
| College / Associate Degree | 4,042 (82.3%) | 324 (6.6%) |
| Bachelor's Degree or higher | 3,278 (86.5%) | 110 (2.9%) |
| Total | 12,248 (80.6%) | 729 (4.8%) |
Employment Occupations by Sex in Lawrenceville
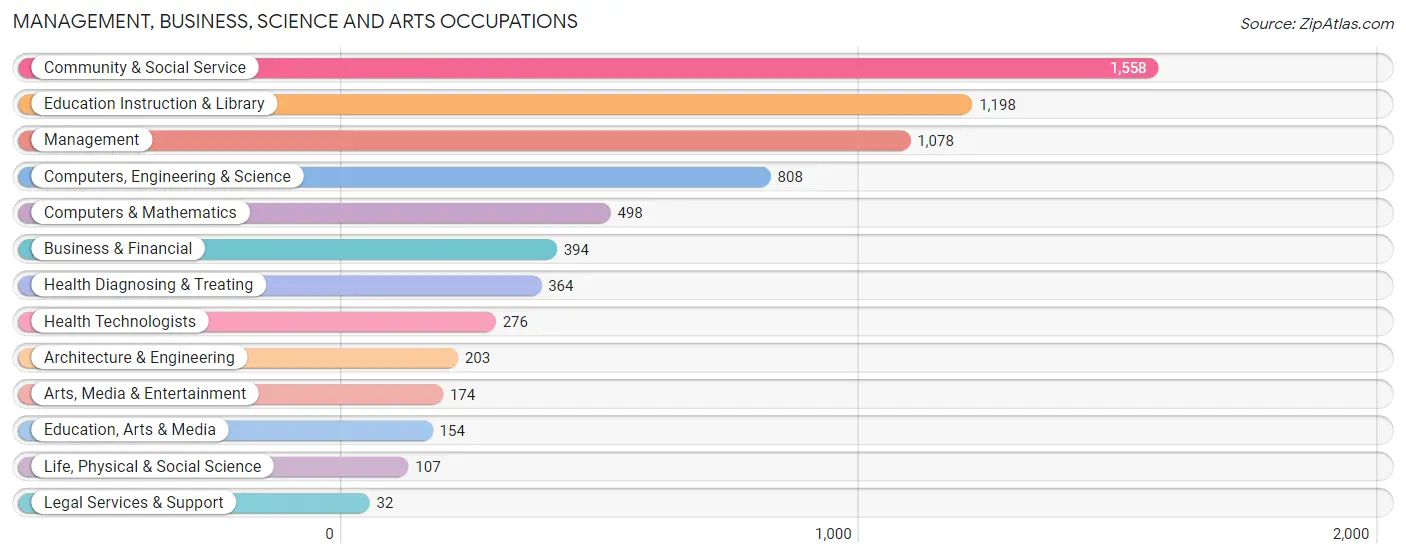
Management, Business, Science and Arts Occupations
The most common Management, Business, Science and Arts occupations in Lawrenceville are Community & Social Service (1,558 | 10.8%), Education Instruction & Library (1,198 | 8.3%), Management (1,078 | 7.4%), Computers, Engineering & Science (808 | 5.6%), and Computers & Mathematics (498 | 3.4%).
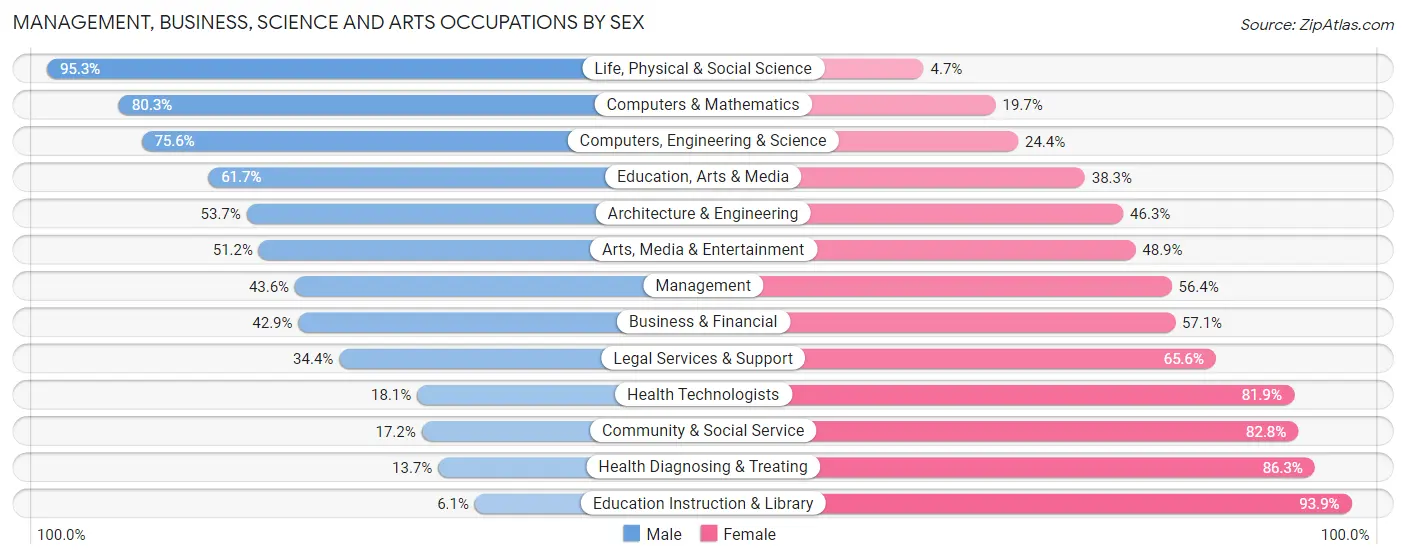
Management, Business, Science and Arts Occupations by Sex
Within the Management, Business, Science and Arts occupations in Lawrenceville, the most male-oriented occupations are Life, Physical & Social Science (95.3%), Computers & Mathematics (80.3%), and Computers, Engineering & Science (75.6%), while the most female-oriented occupations are Education Instruction & Library (93.9%), Health Diagnosing & Treating (86.3%), and Community & Social Service (82.8%).
| Occupation | Male | Female |
| Management | 470 (43.6%) | 608 (56.4%) |
| Business & Financial | 169 (42.9%) | 225 (57.1%) |
| Computers, Engineering & Science | 611 (75.6%) | 197 (24.4%) |
| Computers & Mathematics | 400 (80.3%) | 98 (19.7%) |
| Architecture & Engineering | 109 (53.7%) | 94 (46.3%) |
| Life, Physical & Social Science | 102 (95.3%) | 5 (4.7%) |
| Community & Social Service | 268 (17.2%) | 1,290 (82.8%) |
| Education, Arts & Media | 95 (61.7%) | 59 (38.3%) |
| Legal Services & Support | 11 (34.4%) | 21 (65.6%) |
| Education Instruction & Library | 73 (6.1%) | 1,125 (93.9%) |
| Arts, Media & Entertainment | 89 (51.1%) | 85 (48.8%) |
| Health Diagnosing & Treating | 50 (13.7%) | 314 (86.3%) |
| Health Technologists | 50 (18.1%) | 226 (81.9%) |
| Total (Category) | 1,568 (37.3%) | 2,634 (62.7%) |
| Total (Overall) | 7,047 (48.7%) | 7,421 (51.3%) |
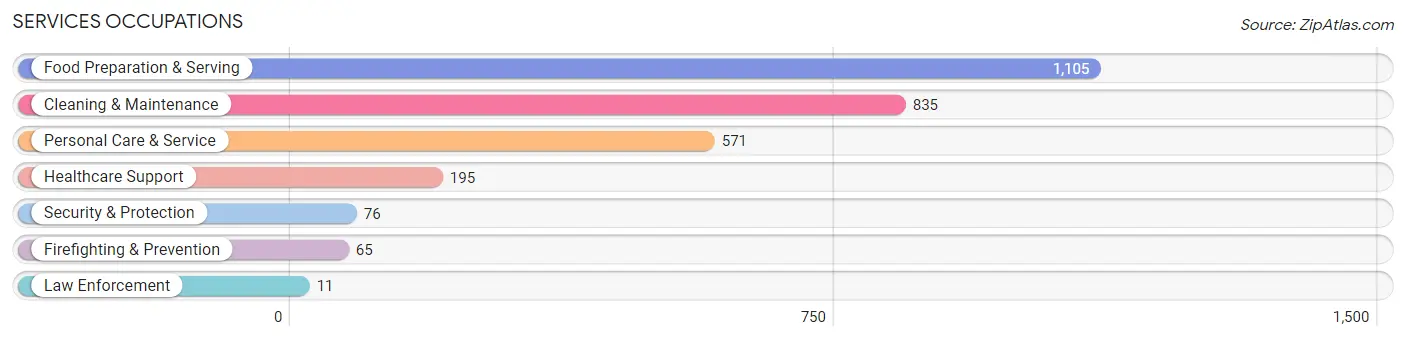
Services Occupations
The most common Services occupations in Lawrenceville are Food Preparation & Serving (1,105 | 7.6%), Cleaning & Maintenance (835 | 5.8%), Personal Care & Service (571 | 4.0%), Healthcare Support (195 | 1.3%), and Security & Protection (76 | 0.5%).
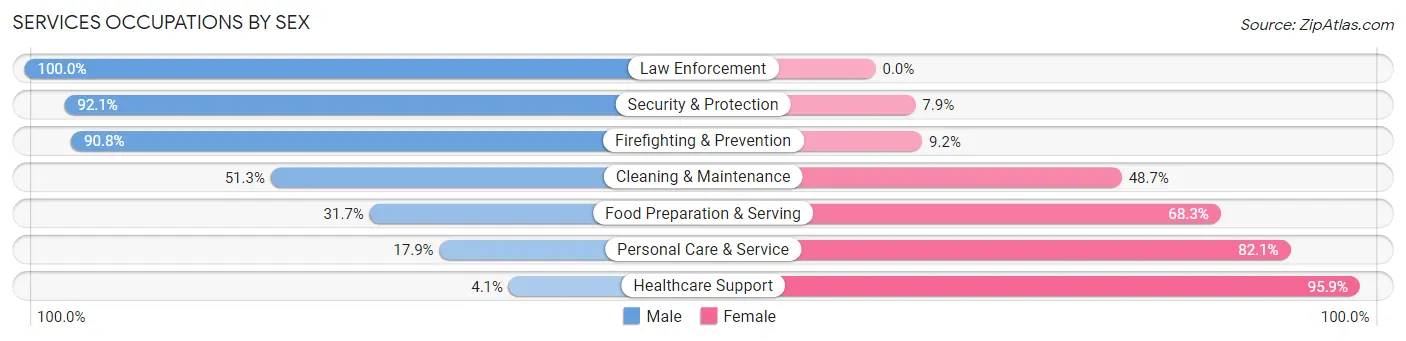
Services Occupations by Sex
Within the Services occupations in Lawrenceville, the most male-oriented occupations are Law Enforcement (100.0%), Security & Protection (92.1%), and Firefighting & Prevention (90.8%), while the most female-oriented occupations are Healthcare Support (95.9%), Personal Care & Service (82.1%), and Food Preparation & Serving (68.3%).
| Occupation | Male | Female |
| Healthcare Support | 8 (4.1%) | 187 (95.9%) |
| Security & Protection | 70 (92.1%) | 6 (7.9%) |
| Firefighting & Prevention | 59 (90.8%) | 6 (9.2%) |
| Law Enforcement | 11 (100.0%) | 0 (0.0%) |
| Food Preparation & Serving | 350 (31.7%) | 755 (68.3%) |
| Cleaning & Maintenance | 428 (51.3%) | 407 (48.7%) |
| Personal Care & Service | 102 (17.9%) | 469 (82.1%) |
| Total (Category) | 958 (34.4%) | 1,824 (65.6%) |
| Total (Overall) | 7,047 (48.7%) | 7,421 (51.3%) |
Sales and Office Occupations
The most common Sales and Office occupations in Lawrenceville are Office & Administration (2,229 | 15.4%), and Sales & Related (1,351 | 9.3%).

Sales and Office Occupations by Sex
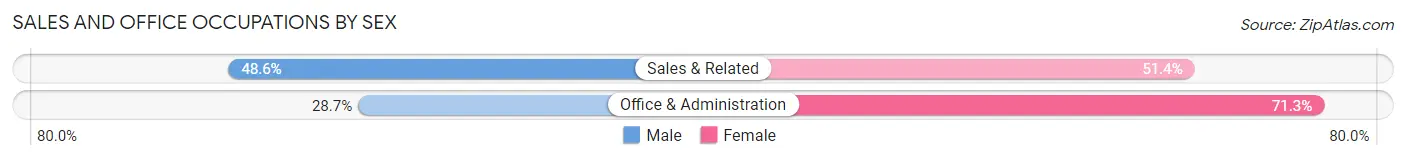
| Occupation | Male | Female |
| Sales & Related | 657 (48.6%) | 694 (51.4%) |
| Office & Administration | 640 (28.7%) | 1,589 (71.3%) |
| Total (Category) | 1,297 (36.2%) | 2,283 (63.8%) |
| Total (Overall) | 7,047 (48.7%) | 7,421 (51.3%) |
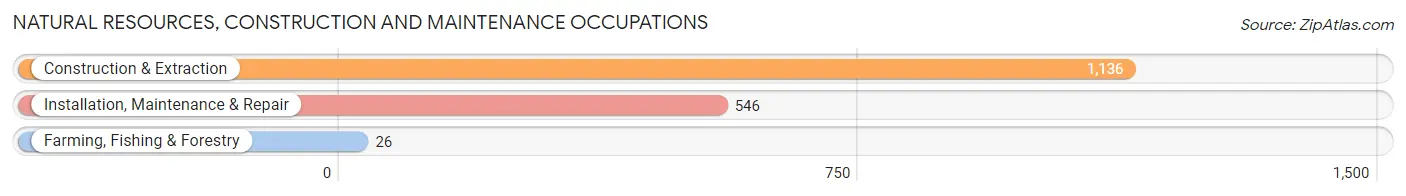
Natural Resources, Construction and Maintenance Occupations
The most common Natural Resources, Construction and Maintenance occupations in Lawrenceville are Construction & Extraction (1,136 | 7.9%), Installation, Maintenance & Repair (546 | 3.8%), and Farming, Fishing & Forestry (26 | 0.2%).
Natural Resources, Construction and Maintenance Occupations by Sex
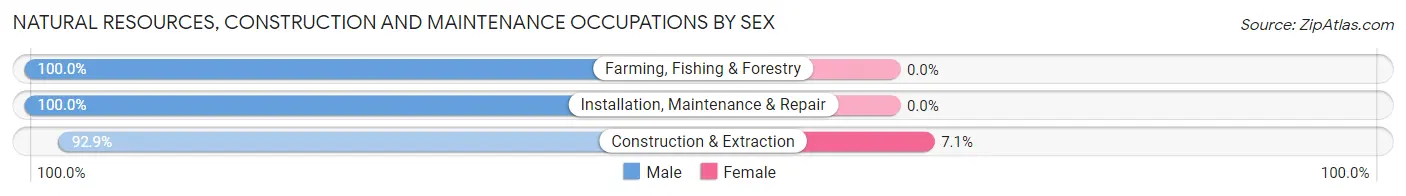
| Occupation | Male | Female |
| Farming, Fishing & Forestry | 26 (100.0%) | 0 (0.0%) |
| Construction & Extraction | 1,055 (92.9%) | 81 (7.1%) |
| Installation, Maintenance & Repair | 546 (100.0%) | 0 (0.0%) |
| Total (Category) | 1,627 (95.3%) | 81 (4.7%) |
| Total (Overall) | 7,047 (48.7%) | 7,421 (51.3%) |
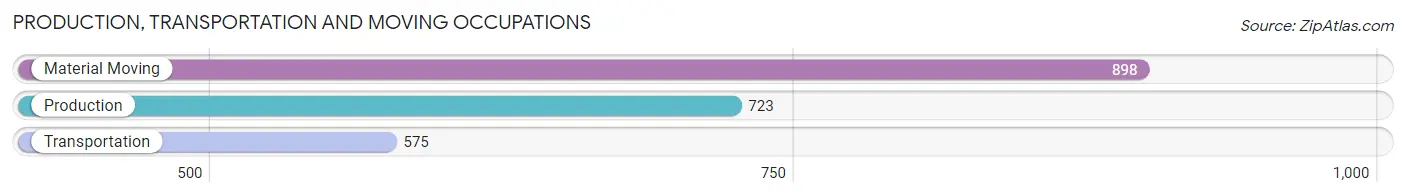
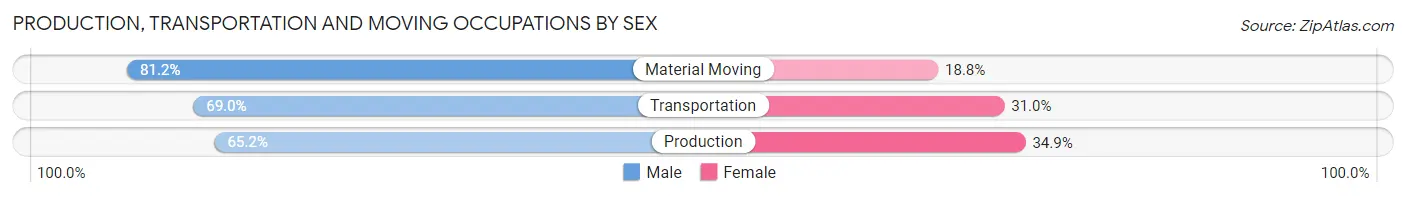
Production, Transportation and Moving Occupations
The most common Production, Transportation and Moving occupations in Lawrenceville are Material Moving (898 | 6.2%), Production (723 | 5.0%), and Transportation (575 | 4.0%).
Production, Transportation and Moving Occupations by Sex
| Occupation | Male | Female |
| Production | 471 (65.1%) | 252 (34.8%) |
| Transportation | 397 (69.0%) | 178 (31.0%) |
| Material Moving | 729 (81.2%) | 169 (18.8%) |
| Total (Category) | 1,597 (72.7%) | 599 (27.3%) |
| Total (Overall) | 7,047 (48.7%) | 7,421 (51.3%) |
Employment Industries by Sex in Lawrenceville
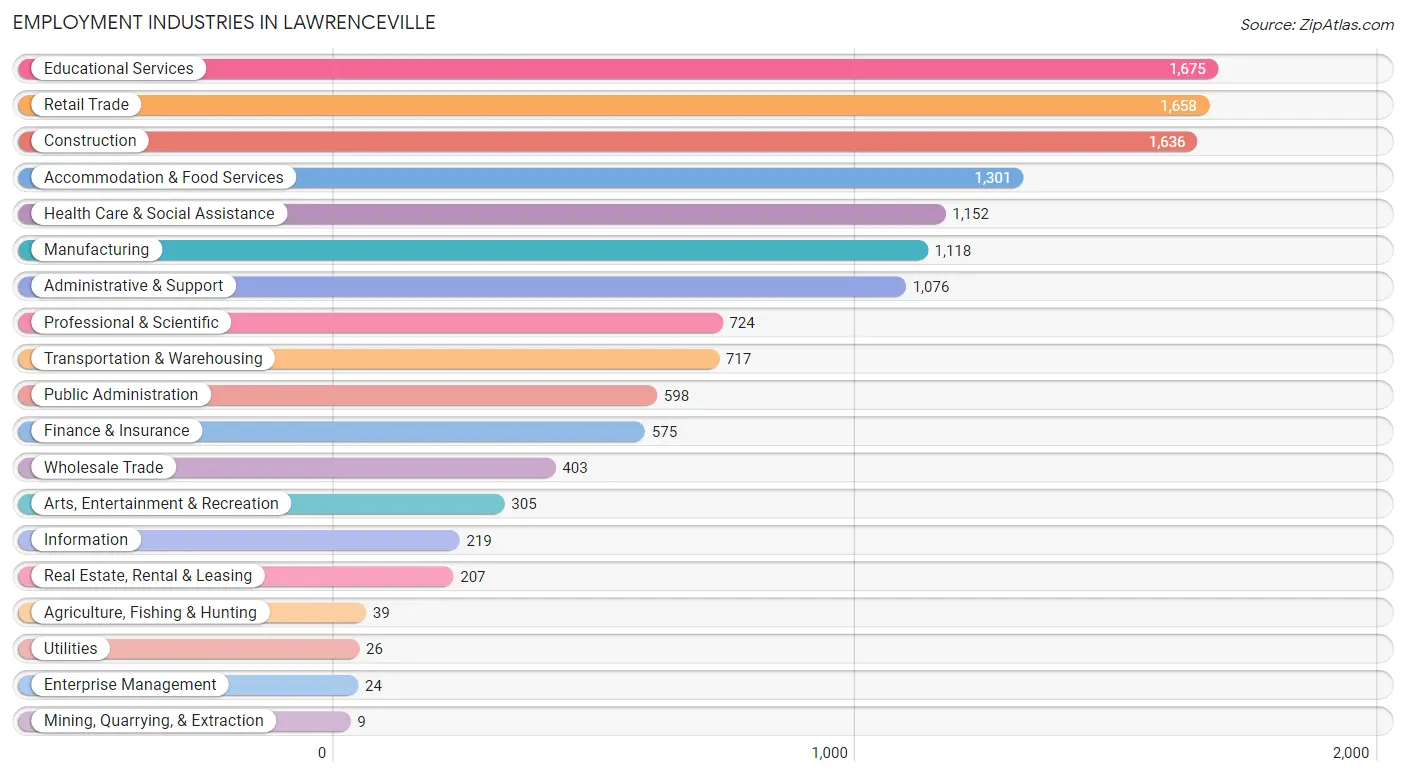
Employment Industries in Lawrenceville
The major employment industries in Lawrenceville include Educational Services (1,675 | 11.6%), Retail Trade (1,658 | 11.5%), Construction (1,636 | 11.3%), Accommodation & Food Services (1,301 | 9.0%), and Health Care & Social Assistance (1,152 | 8.0%).
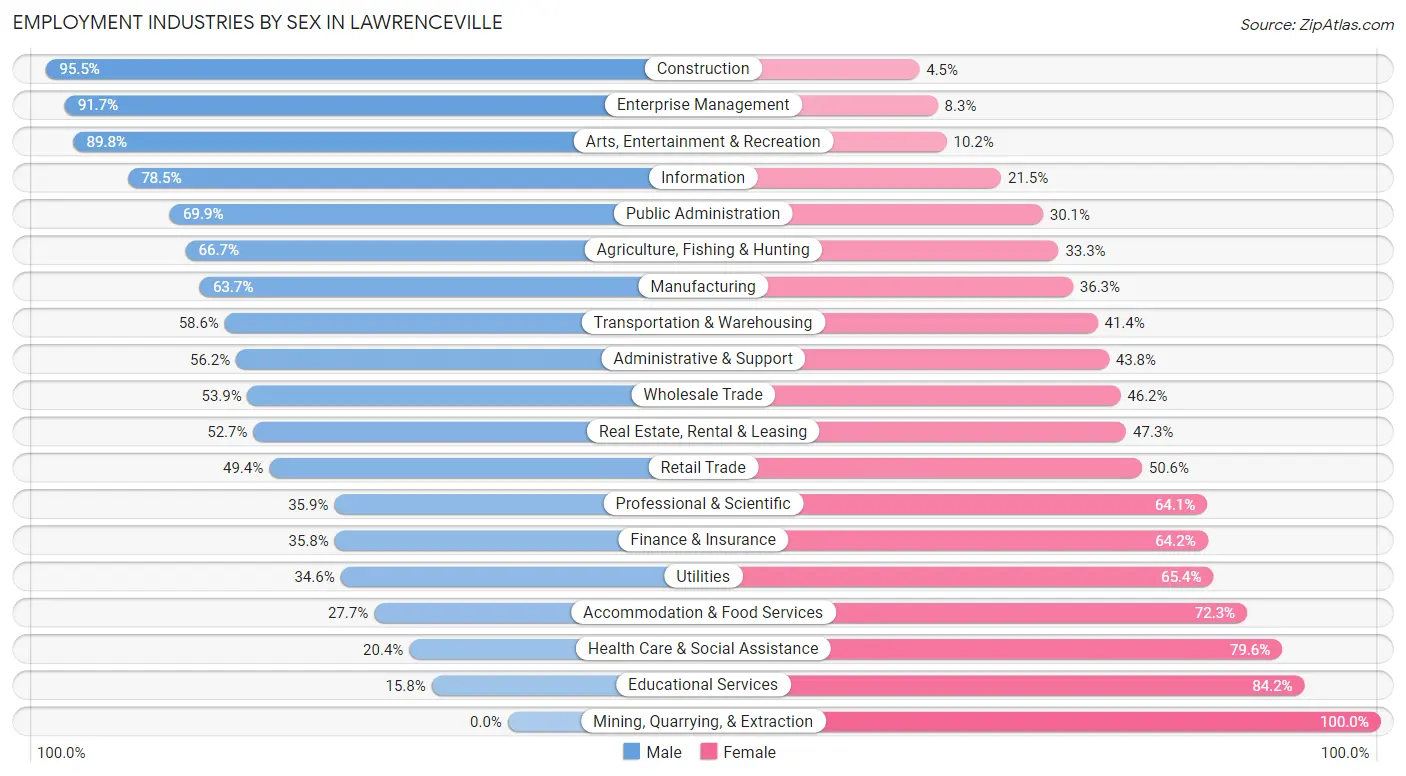
Employment Industries by Sex in Lawrenceville
The Lawrenceville industries that see more men than women are Construction (95.5%), Enterprise Management (91.7%), and Arts, Entertainment & Recreation (89.8%), whereas the industries that tend to have a higher number of women are Mining, Quarrying, & Extraction (100.0%), Educational Services (84.2%), and Health Care & Social Assistance (79.6%).
| Industry | Male | Female |
| Agriculture, Fishing & Hunting | 26 (66.7%) | 13 (33.3%) |
| Mining, Quarrying, & Extraction | 0 (0.0%) | 9 (100.0%) |
| Construction | 1,562 (95.5%) | 74 (4.5%) |
| Manufacturing | 712 (63.7%) | 406 (36.3%) |
| Wholesale Trade | 217 (53.8%) | 186 (46.2%) |
| Retail Trade | 819 (49.4%) | 839 (50.6%) |
| Transportation & Warehousing | 420 (58.6%) | 297 (41.4%) |
| Utilities | 9 (34.6%) | 17 (65.4%) |
| Information | 172 (78.5%) | 47 (21.5%) |
| Finance & Insurance | 206 (35.8%) | 369 (64.2%) |
| Real Estate, Rental & Leasing | 109 (52.7%) | 98 (47.3%) |
| Professional & Scientific | 260 (35.9%) | 464 (64.1%) |
| Enterprise Management | 22 (91.7%) | 2 (8.3%) |
| Administrative & Support | 605 (56.2%) | 471 (43.8%) |
| Educational Services | 264 (15.8%) | 1,411 (84.2%) |
| Health Care & Social Assistance | 235 (20.4%) | 917 (79.6%) |
| Arts, Entertainment & Recreation | 274 (89.8%) | 31 (10.2%) |
| Accommodation & Food Services | 360 (27.7%) | 941 (72.3%) |
| Public Administration | 418 (69.9%) | 180 (30.1%) |
| Total | 7,047 (48.7%) | 7,421 (51.3%) |
Education in Lawrenceville
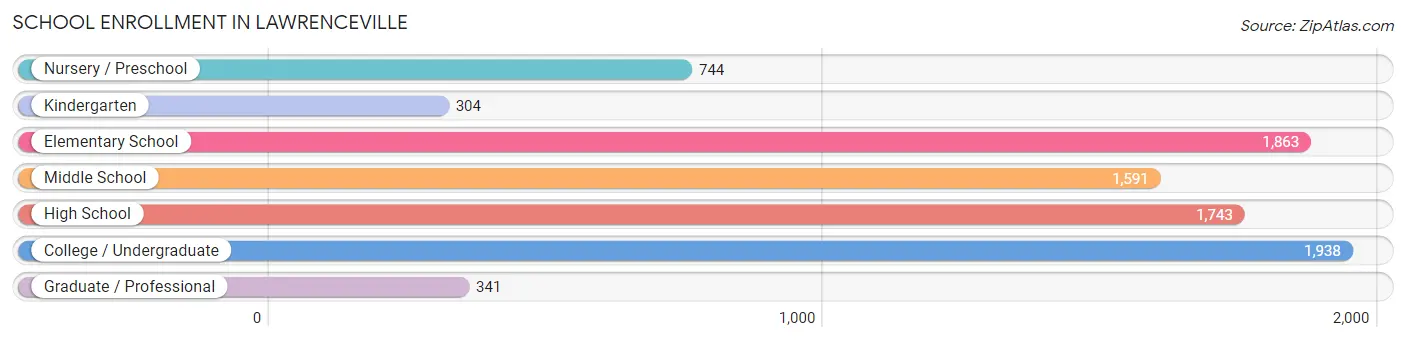
School Enrollment in Lawrenceville
The most common levels of schooling among the 8,524 students in Lawrenceville are college / undergraduate (1,938 | 22.7%), elementary school (1,863 | 21.9%), and high school (1,743 | 20.4%).
| School Level | # Students | % Students |
| Nursery / Preschool | 744 | 8.7% |
| Kindergarten | 304 | 3.6% |
| Elementary School | 1,863 | 21.9% |
| Middle School | 1,591 | 18.7% |
| High School | 1,743 | 20.4% |
| College / Undergraduate | 1,938 | 22.7% |
| Graduate / Professional | 341 | 4.0% |
| Total | 8,524 | 100.0% |
School Enrollment by Age by Funding Source in Lawrenceville
Out of a total of 8,524 students who are enrolled in schools in Lawrenceville, 886 (10.4%) attend a private institution, while the remaining 7,638 (89.6%) are enrolled in public schools. The age group of 3 to 4 year olds has the highest likelihood of being enrolled in private schools, with 168 (41.4% in the age bracket) enrolled. Conversely, the age group of 25 to 34 year olds has the lowest likelihood of being enrolled in a private school, with 447 (100.0% in the age bracket) attending a public institution.
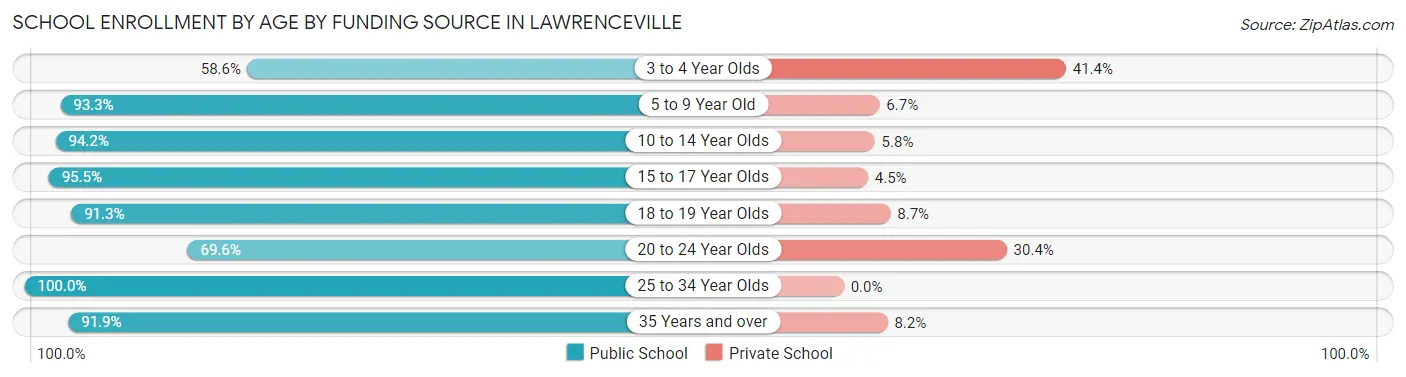
| Age Bracket | Public School | Private School |
| 3 to 4 Year Olds | 238 (58.6%) | 168 (41.4%) |
| 5 to 9 Year Old | 2,047 (93.3%) | 146 (6.7%) |
| 10 to 14 Year Olds | 1,927 (94.2%) | 118 (5.8%) |
| 15 to 17 Year Olds | 1,209 (95.5%) | 57 (4.5%) |
| 18 to 19 Year Olds | 620 (91.3%) | 59 (8.7%) |
| 20 to 24 Year Olds | 686 (69.6%) | 299 (30.4%) |
| 25 to 34 Year Olds | 447 (100.0%) | 0 (0.0%) |
| 35 Years and over | 462 (91.8%) | 41 (8.2%) |
| Total | 7,638 (89.6%) | 886 (10.4%) |
Educational Attainment by Field of Study in Lawrenceville
Business (994 | 19.8%), science & technology (936 | 18.7%), arts & humanities (522 | 10.4%), computers & mathematics (515 | 10.3%), and education (510 | 10.2%) are the most common fields of study among 5,014 individuals in Lawrenceville who have obtained a bachelor's degree or higher.
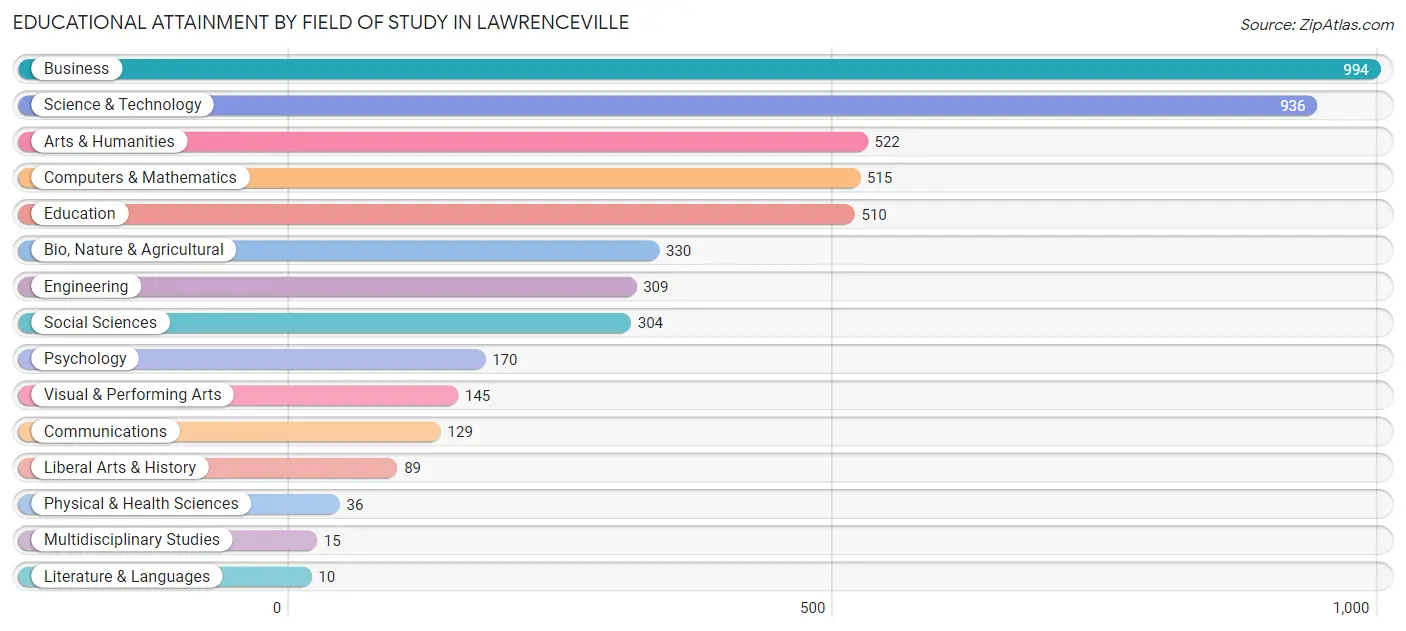
| Field of Study | # Graduates | % Graduates |
| Computers & Mathematics | 515 | 10.3% |
| Bio, Nature & Agricultural | 330 | 6.6% |
| Physical & Health Sciences | 36 | 0.7% |
| Psychology | 170 | 3.4% |
| Social Sciences | 304 | 6.1% |
| Engineering | 309 | 6.2% |
| Multidisciplinary Studies | 15 | 0.3% |
| Science & Technology | 936 | 18.7% |
| Business | 994 | 19.8% |
| Education | 510 | 10.2% |
| Literature & Languages | 10 | 0.2% |
| Liberal Arts & History | 89 | 1.8% |
| Visual & Performing Arts | 145 | 2.9% |
| Communications | 129 | 2.6% |
| Arts & Humanities | 522 | 10.4% |
| Total | 5,014 | 100.0% |
Transportation & Commute in Lawrenceville
Vehicle Availability by Sex in Lawrenceville
The most prevalent vehicle ownership categories in Lawrenceville are males with 2 vehicles (2,710, accounting for 39.2%) and females with 2 vehicles (3,235, making up 38.0%).
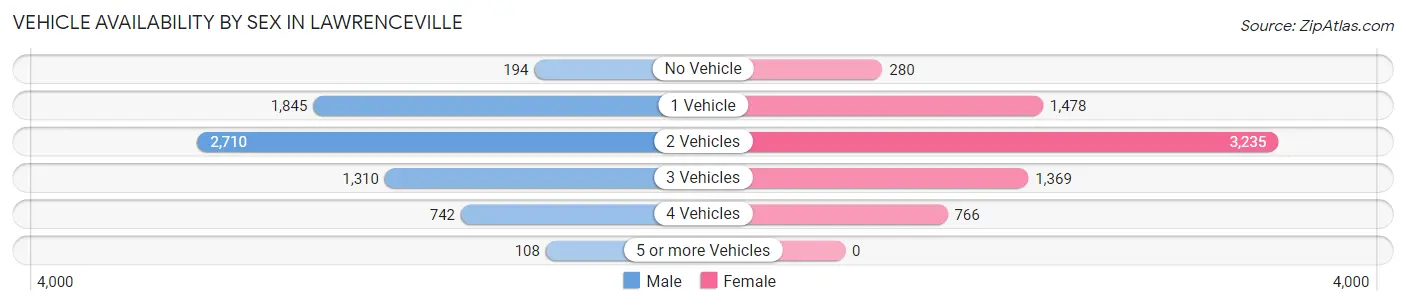
| Vehicles Available | Male | Female |
| No Vehicle | 194 (2.8%) | 280 (3.9%) |
| 1 Vehicle | 1,845 (26.7%) | 1,478 (20.7%) |
| 2 Vehicles | 2,710 (39.2%) | 3,235 (45.4%) |
| 3 Vehicles | 1,310 (19.0%) | 1,369 (19.2%) |
| 4 Vehicles | 742 (10.7%) | 766 (10.7%) |
| 5 or more Vehicles | 108 (1.6%) | 0 (0.0%) |
| Total | 6,909 (100.0%) | 7,128 (100.0%) |
Commute Time in Lawrenceville
The most frequently occuring commute durations in Lawrenceville are 45 to 59 minutes (1,922 commuters, 14.9%), 20 to 24 minutes (1,817 commuters, 14.0%), and 30 to 34 minutes (1,736 commuters, 13.4%).
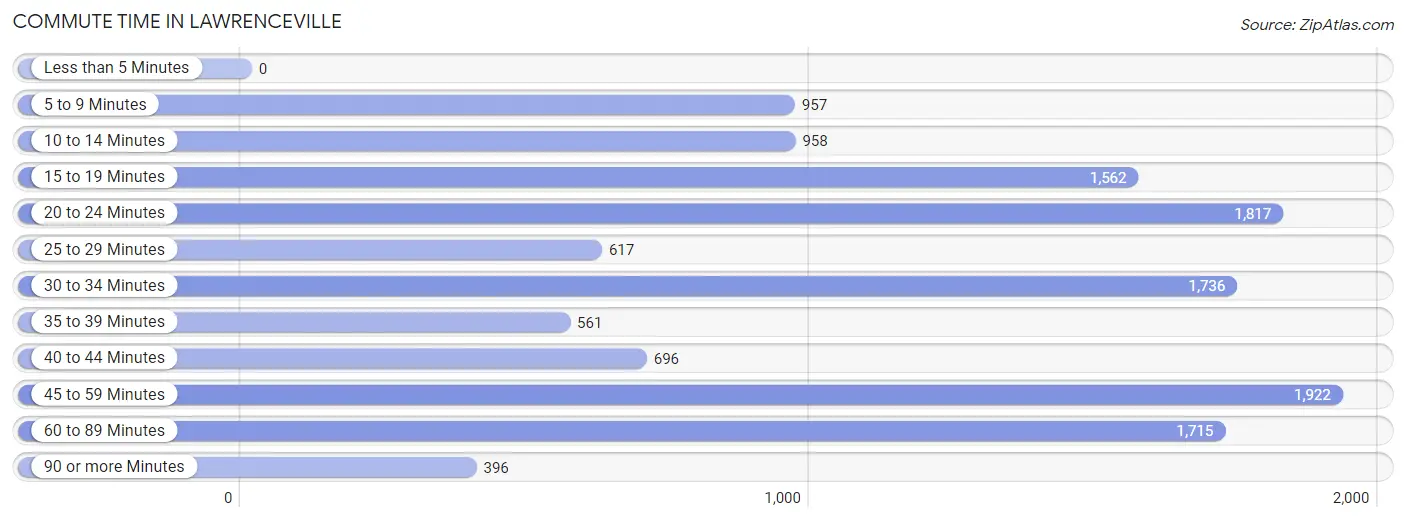
| Commute Time | # Commuters | % Commuters |
| Less than 5 Minutes | 0 | 0.0% |
| 5 to 9 Minutes | 957 | 7.4% |
| 10 to 14 Minutes | 958 | 7.4% |
| 15 to 19 Minutes | 1,562 | 12.1% |
| 20 to 24 Minutes | 1,817 | 14.0% |
| 25 to 29 Minutes | 617 | 4.8% |
| 30 to 34 Minutes | 1,736 | 13.4% |
| 35 to 39 Minutes | 561 | 4.3% |
| 40 to 44 Minutes | 696 | 5.4% |
| 45 to 59 Minutes | 1,922 | 14.9% |
| 60 to 89 Minutes | 1,715 | 13.3% |
| 90 or more Minutes | 396 | 3.1% |
Commute Time by Sex in Lawrenceville
The most common commute times in Lawrenceville are 45 to 59 minutes (1,238 commuters, 19.4%) for males and 20 to 24 minutes (1,004 commuters, 15.3%) for females.
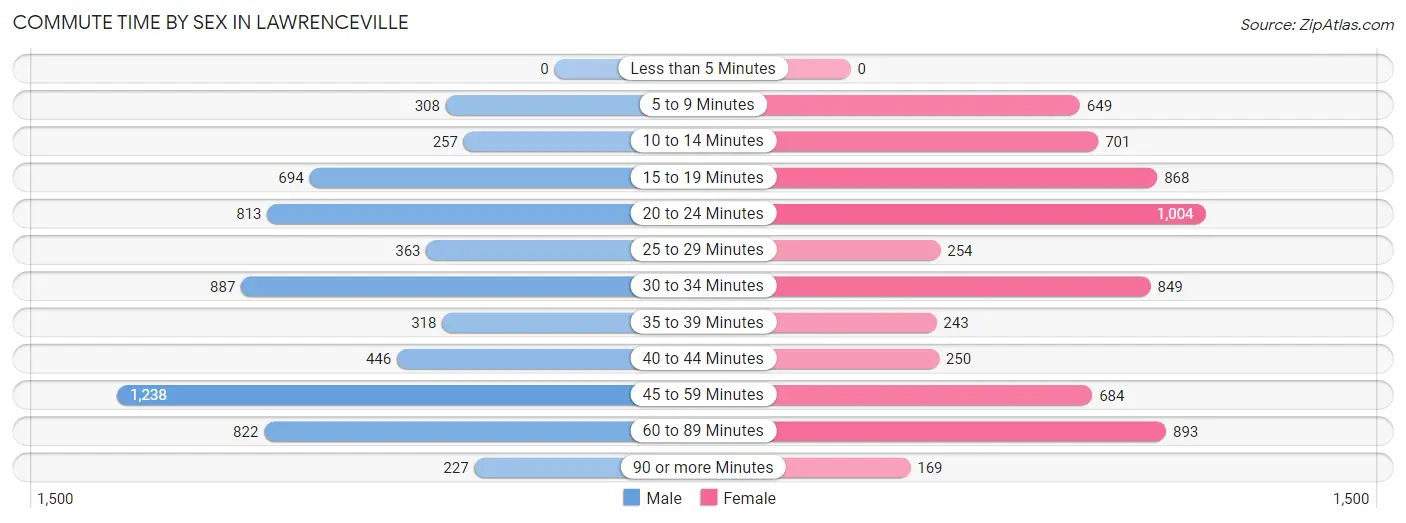
| Commute Time | Male | Female |
| Less than 5 Minutes | 0 (0.0%) | 0 (0.0%) |
| 5 to 9 Minutes | 308 (4.8%) | 649 (9.9%) |
| 10 to 14 Minutes | 257 (4.0%) | 701 (10.7%) |
| 15 to 19 Minutes | 694 (10.9%) | 868 (13.2%) |
| 20 to 24 Minutes | 813 (12.8%) | 1,004 (15.3%) |
| 25 to 29 Minutes | 363 (5.7%) | 254 (3.9%) |
| 30 to 34 Minutes | 887 (13.9%) | 849 (12.9%) |
| 35 to 39 Minutes | 318 (5.0%) | 243 (3.7%) |
| 40 to 44 Minutes | 446 (7.0%) | 250 (3.8%) |
| 45 to 59 Minutes | 1,238 (19.4%) | 684 (10.4%) |
| 60 to 89 Minutes | 822 (12.9%) | 893 (13.6%) |
| 90 or more Minutes | 227 (3.6%) | 169 (2.6%) |
Time of Departure to Work by Sex in Lawrenceville
The most frequent times of departure to work in Lawrenceville are 7:00 AM to 7:29 AM (1,060, 16.6%) for males and 7:00 AM to 7:29 AM (1,054, 16.1%) for females.
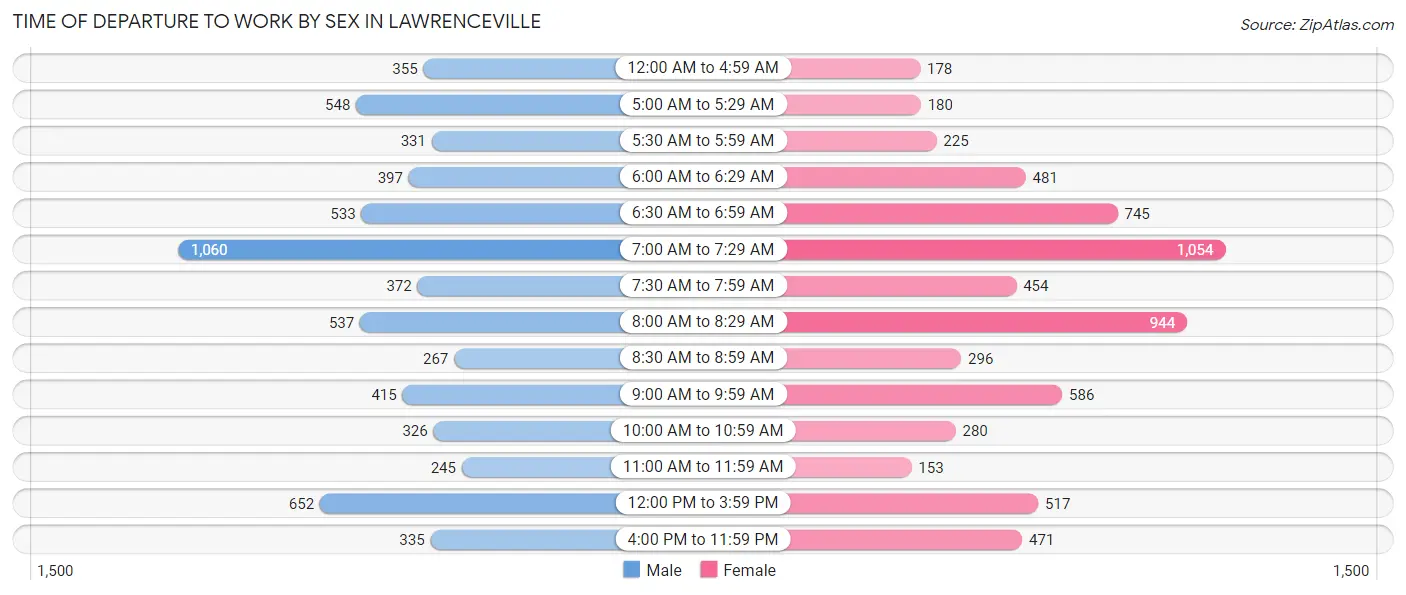
| Time of Departure | Male | Female |
| 12:00 AM to 4:59 AM | 355 (5.6%) | 178 (2.7%) |
| 5:00 AM to 5:29 AM | 548 (8.6%) | 180 (2.7%) |
| 5:30 AM to 5:59 AM | 331 (5.2%) | 225 (3.4%) |
| 6:00 AM to 6:29 AM | 397 (6.2%) | 481 (7.3%) |
| 6:30 AM to 6:59 AM | 533 (8.4%) | 745 (11.4%) |
| 7:00 AM to 7:29 AM | 1,060 (16.6%) | 1,054 (16.1%) |
| 7:30 AM to 7:59 AM | 372 (5.8%) | 454 (6.9%) |
| 8:00 AM to 8:29 AM | 537 (8.4%) | 944 (14.4%) |
| 8:30 AM to 8:59 AM | 267 (4.2%) | 296 (4.5%) |
| 9:00 AM to 9:59 AM | 415 (6.5%) | 586 (8.9%) |
| 10:00 AM to 10:59 AM | 326 (5.1%) | 280 (4.3%) |
| 11:00 AM to 11:59 AM | 245 (3.8%) | 153 (2.3%) |
| 12:00 PM to 3:59 PM | 652 (10.2%) | 517 (7.9%) |
| 4:00 PM to 11:59 PM | 335 (5.3%) | 471 (7.2%) |
| Total | 6,373 (100.0%) | 6,564 (100.0%) |
Housing Occupancy in Lawrenceville
Occupancy by Ownership in Lawrenceville
Of the total 10,762 dwellings in Lawrenceville, owner-occupied units account for 5,141 (47.8%), while renter-occupied units make up 5,621 (52.2%).
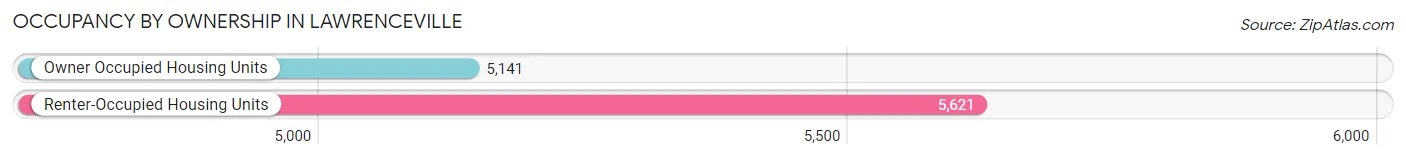
| Occupancy | # Housing Units | % Housing Units |
| Owner Occupied Housing Units | 5,141 | 47.8% |
| Renter-Occupied Housing Units | 5,621 | 52.2% |
| Total Occupied Housing Units | 10,762 | 100.0% |
Occupancy by Household Size in Lawrenceville
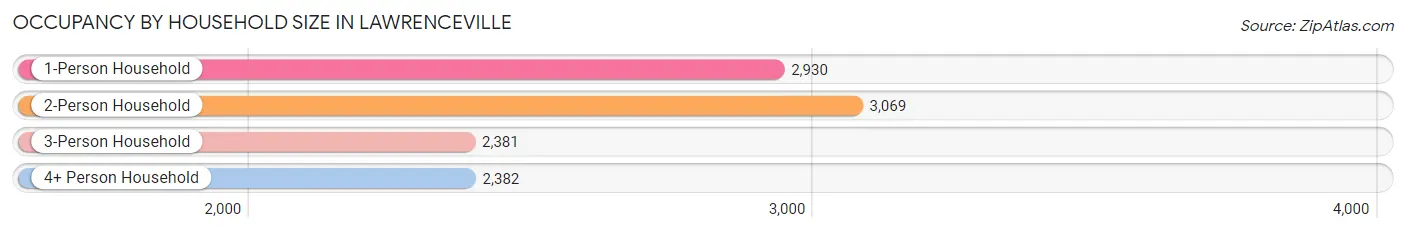
| Household Size | # Housing Units | % Housing Units |
| 1-Person Household | 2,930 | 27.2% |
| 2-Person Household | 3,069 | 28.5% |
| 3-Person Household | 2,381 | 22.1% |
| 4+ Person Household | 2,382 | 22.1% |
| Total Housing Units | 10,762 | 100.0% |
Occupancy by Ownership by Household Size in Lawrenceville
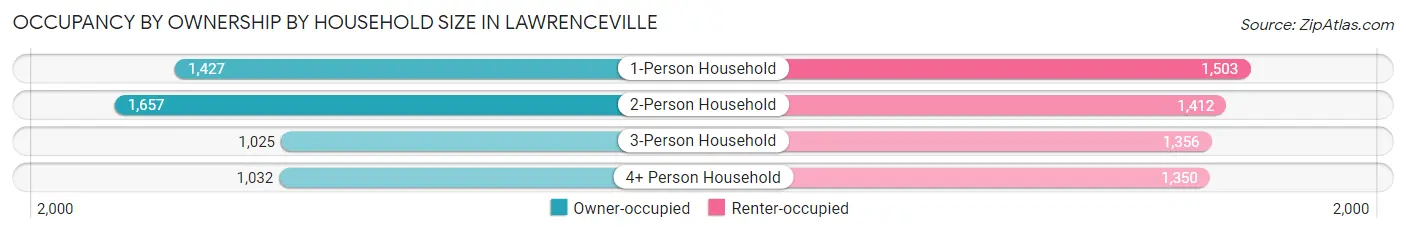
| Household Size | Owner-occupied | Renter-occupied |
| 1-Person Household | 1,427 (48.7%) | 1,503 (51.3%) |
| 2-Person Household | 1,657 (54.0%) | 1,412 (46.0%) |
| 3-Person Household | 1,025 (43.0%) | 1,356 (57.0%) |
| 4+ Person Household | 1,032 (43.3%) | 1,350 (56.7%) |
| Total Housing Units | 5,141 (47.8%) | 5,621 (52.2%) |
Occupancy by Educational Attainment in Lawrenceville
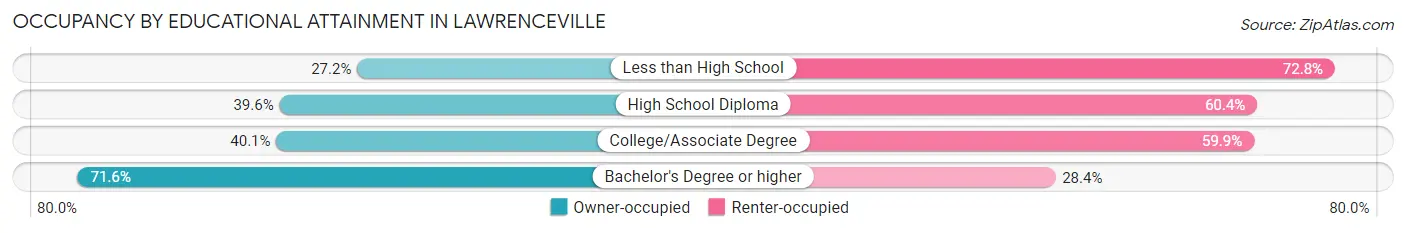
| Household Size | Owner-occupied | Renter-occupied |
| Less than High School | 338 (27.2%) | 903 (72.8%) |
| High School Diploma | 1,066 (39.6%) | 1,628 (60.4%) |
| College/Associate Degree | 1,463 (40.1%) | 2,188 (59.9%) |
| Bachelor's Degree or higher | 2,274 (71.6%) | 902 (28.4%) |
Occupancy by Age of Householder in Lawrenceville
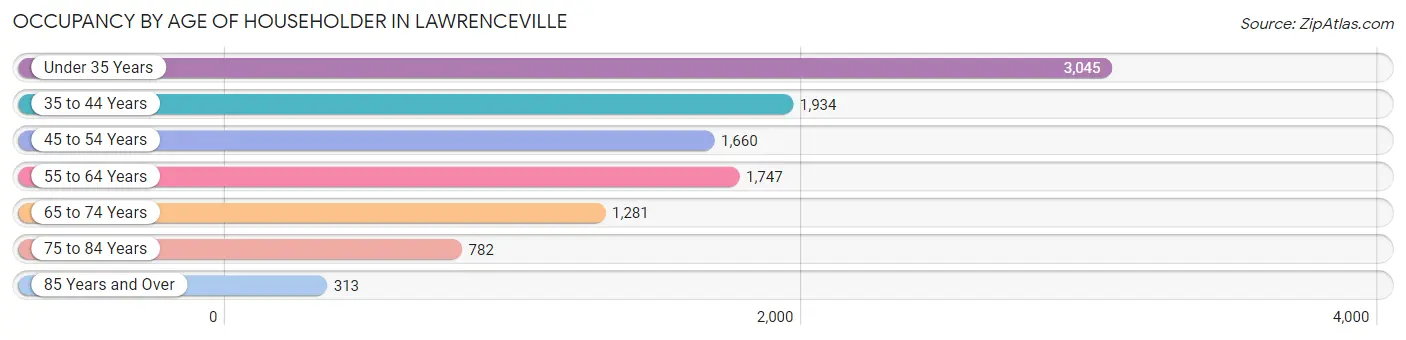
| Age Bracket | # Households | % Households |
| Under 35 Years | 3,045 | 28.3% |
| 35 to 44 Years | 1,934 | 18.0% |
| 45 to 54 Years | 1,660 | 15.4% |
| 55 to 64 Years | 1,747 | 16.2% |
| 65 to 74 Years | 1,281 | 11.9% |
| 75 to 84 Years | 782 | 7.3% |
| 85 Years and Over | 313 | 2.9% |
| Total | 10,762 | 100.0% |
Housing Finances in Lawrenceville
Median Income by Occupancy in Lawrenceville
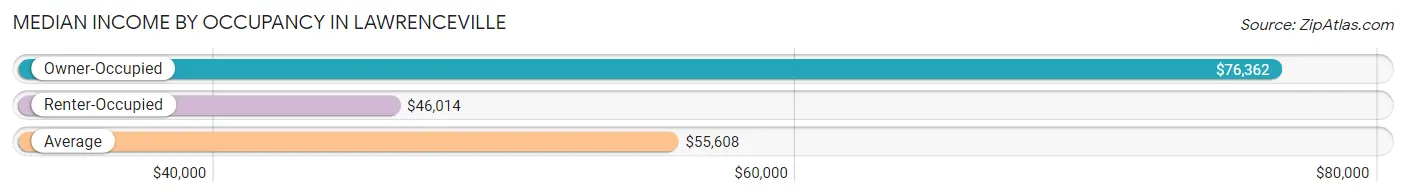
| Occupancy Type | # Households | Median Income |
| Owner-Occupied | 5,141 (47.8%) | $76,362 |
| Renter-Occupied | 5,621 (52.2%) | $46,014 |
| Average | 10,762 (100.0%) | $55,608 |
Occupancy by Householder Income Bracket in Lawrenceville
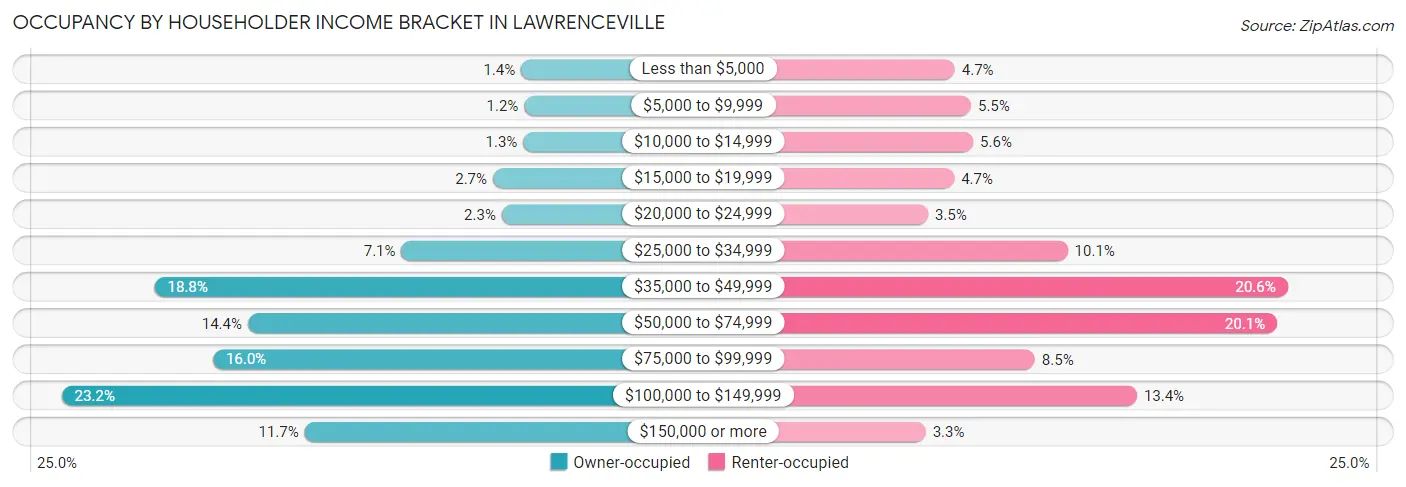
| Income Bracket | Owner-occupied | Renter-occupied |
| Less than $5,000 | 70 (1.4%) | 266 (4.7%) |
| $5,000 to $9,999 | 62 (1.2%) | 309 (5.5%) |
| $10,000 to $14,999 | 65 (1.3%) | 315 (5.6%) |
| $15,000 to $19,999 | 139 (2.7%) | 264 (4.7%) |
| $20,000 to $24,999 | 117 (2.3%) | 194 (3.5%) |
| $25,000 to $34,999 | 363 (7.1%) | 568 (10.1%) |
| $35,000 to $49,999 | 967 (18.8%) | 1,156 (20.6%) |
| $50,000 to $74,999 | 739 (14.4%) | 1,128 (20.1%) |
| $75,000 to $99,999 | 824 (16.0%) | 480 (8.5%) |
| $100,000 to $149,999 | 1,195 (23.2%) | 753 (13.4%) |
| $150,000 or more | 600 (11.7%) | 188 (3.3%) |
| Total | 5,141 (100.0%) | 5,621 (100.0%) |
Monthly Housing Cost Tiers in Lawrenceville
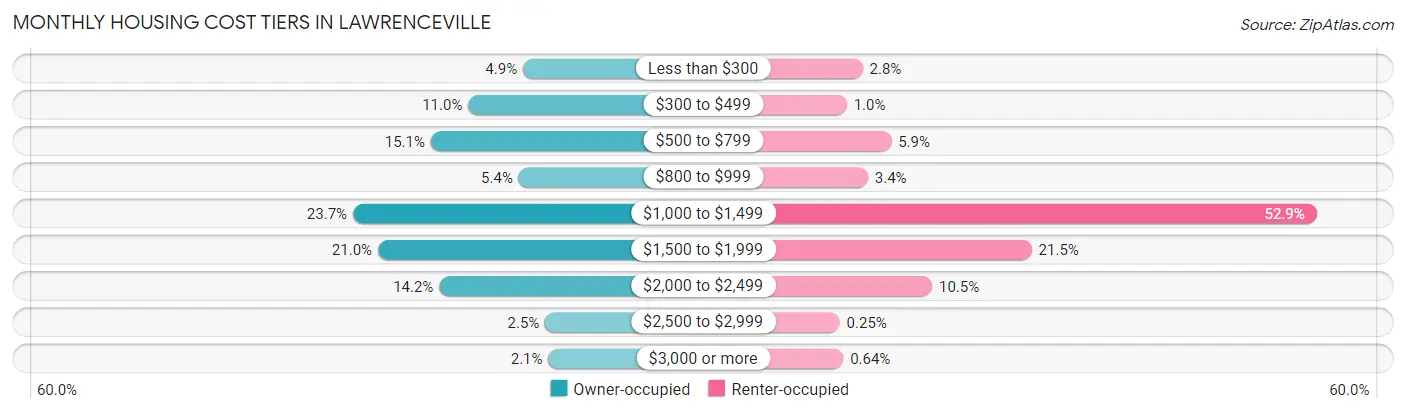
| Monthly Cost | Owner-occupied | Renter-occupied |
| Less than $300 | 254 (4.9%) | 156 (2.8%) |
| $300 to $499 | 565 (11.0%) | 58 (1.0%) |
| $500 to $799 | 778 (15.1%) | 334 (5.9%) |
| $800 to $999 | 278 (5.4%) | 189 (3.4%) |
| $1,000 to $1,499 | 1,220 (23.7%) | 2,975 (52.9%) |
| $1,500 to $1,999 | 1,078 (21.0%) | 1,206 (21.5%) |
| $2,000 to $2,499 | 730 (14.2%) | 588 (10.5%) |
| $2,500 to $2,999 | 128 (2.5%) | 14 (0.3%) |
| $3,000 or more | 110 (2.1%) | 36 (0.6%) |
| Total | 5,141 (100.0%) | 5,621 (100.0%) |
Physical Housing Characteristics in Lawrenceville
Housing Structures in Lawrenceville
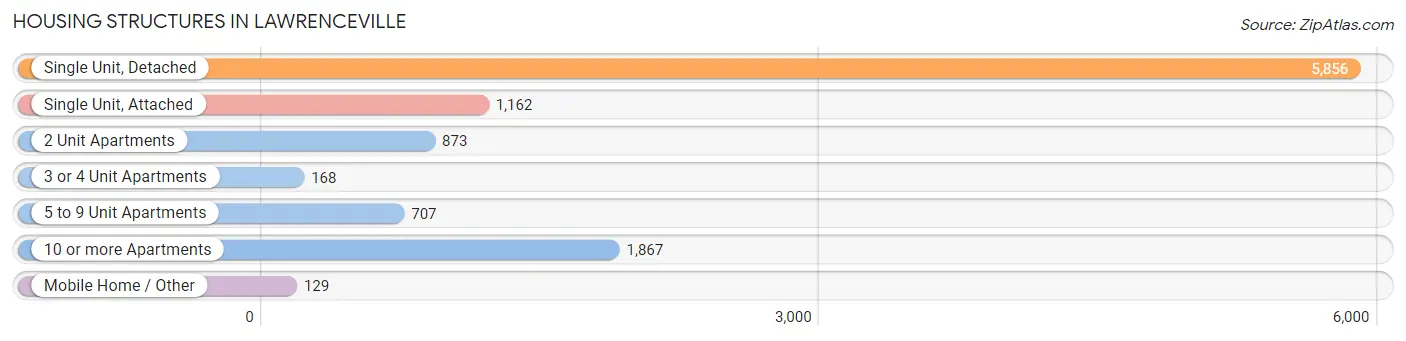
| Structure Type | # Housing Units | % Housing Units |
| Single Unit, Detached | 5,856 | 54.4% |
| Single Unit, Attached | 1,162 | 10.8% |
| 2 Unit Apartments | 873 | 8.1% |
| 3 or 4 Unit Apartments | 168 | 1.6% |
| 5 to 9 Unit Apartments | 707 | 6.6% |
| 10 or more Apartments | 1,867 | 17.3% |
| Mobile Home / Other | 129 | 1.2% |
| Total | 10,762 | 100.0% |
Housing Structures by Occupancy in Lawrenceville
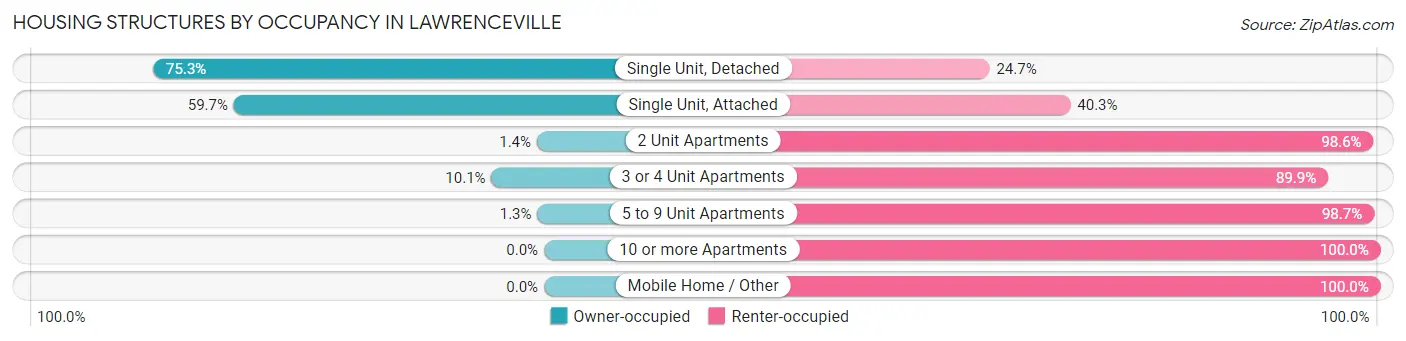
| Structure Type | Owner-occupied | Renter-occupied |
| Single Unit, Detached | 4,409 (75.3%) | 1,447 (24.7%) |
| Single Unit, Attached | 694 (59.7%) | 468 (40.3%) |
| 2 Unit Apartments | 12 (1.4%) | 861 (98.6%) |
| 3 or 4 Unit Apartments | 17 (10.1%) | 151 (89.9%) |
| 5 to 9 Unit Apartments | 9 (1.3%) | 698 (98.7%) |
| 10 or more Apartments | 0 (0.0%) | 1,867 (100.0%) |
| Mobile Home / Other | 0 (0.0%) | 129 (100.0%) |
| Total | 5,141 (47.8%) | 5,621 (52.2%) |
Housing Structures by Number of Rooms in Lawrenceville
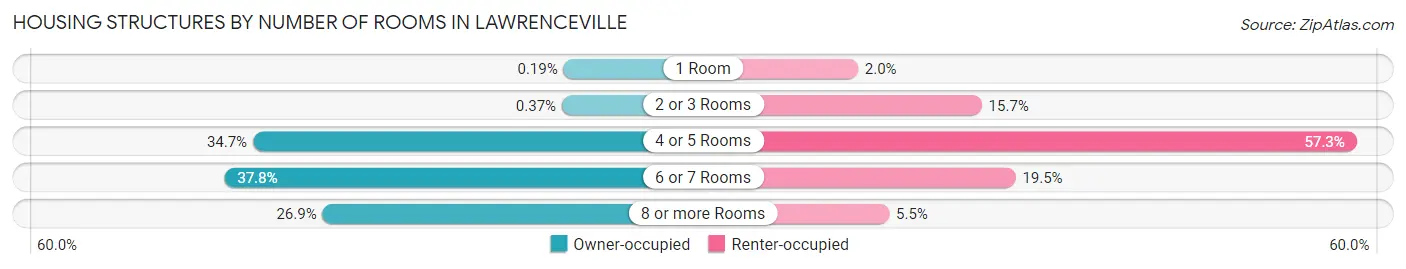
| Number of Rooms | Owner-occupied | Renter-occupied |
| 1 Room | 10 (0.2%) | 112 (2.0%) |
| 2 or 3 Rooms | 19 (0.4%) | 884 (15.7%) |
| 4 or 5 Rooms | 1,782 (34.7%) | 3,223 (57.3%) |
| 6 or 7 Rooms | 1,945 (37.8%) | 1,095 (19.5%) |
| 8 or more Rooms | 1,385 (26.9%) | 307 (5.5%) |
| Total | 5,141 (100.0%) | 5,621 (100.0%) |
Housing Structure by Heating Type in Lawrenceville
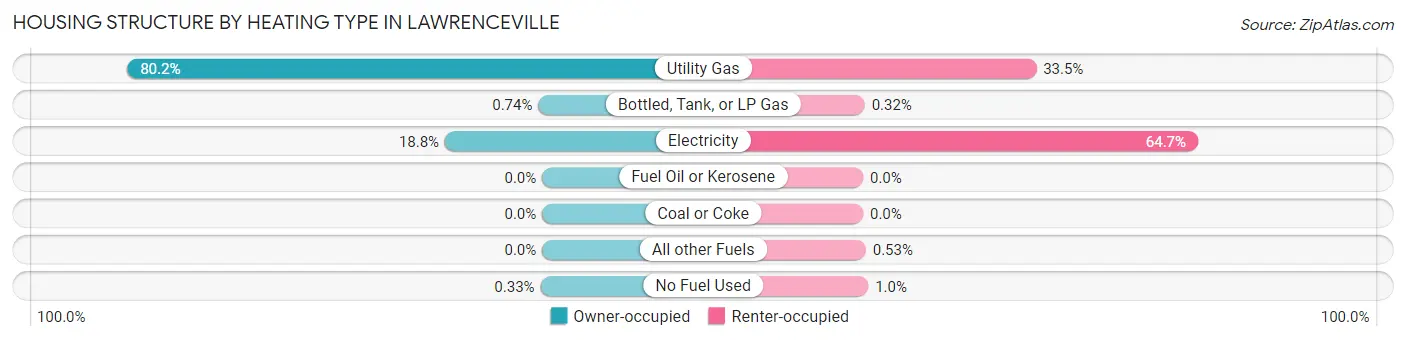
| Heating Type | Owner-occupied | Renter-occupied |
| Utility Gas | 4,121 (80.2%) | 1,881 (33.5%) |
| Bottled, Tank, or LP Gas | 38 (0.7%) | 18 (0.3%) |
| Electricity | 965 (18.8%) | 3,636 (64.7%) |
| Fuel Oil or Kerosene | 0 (0.0%) | 0 (0.0%) |
| Coal or Coke | 0 (0.0%) | 0 (0.0%) |
| All other Fuels | 0 (0.0%) | 30 (0.5%) |
| No Fuel Used | 17 (0.3%) | 56 (1.0%) |
| Total | 5,141 (100.0%) | 5,621 (100.0%) |
Household Vehicle Usage in Lawrenceville
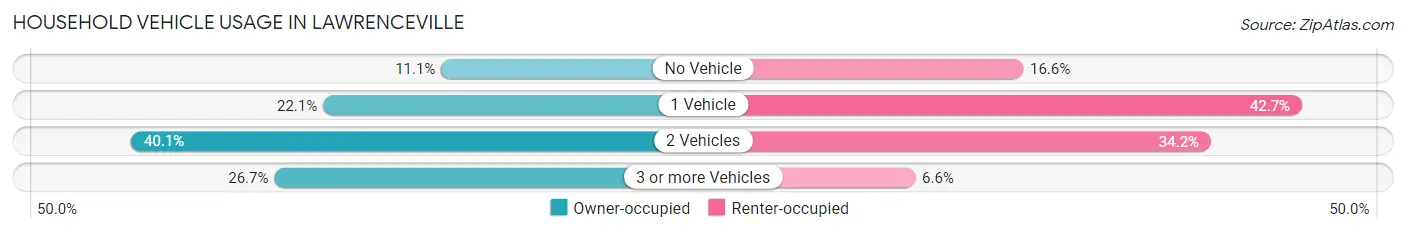
| Vehicles per Household | Owner-occupied | Renter-occupied |
| No Vehicle | 571 (11.1%) | 935 (16.6%) |
| 1 Vehicle | 1,138 (22.1%) | 2,398 (42.7%) |
| 2 Vehicles | 2,060 (40.1%) | 1,920 (34.2%) |
| 3 or more Vehicles | 1,372 (26.7%) | 368 (6.6%) |
| Total | 5,141 (100.0%) | 5,621 (100.0%) |
Real Estate & Mortgages in Lawrenceville
Real Estate and Mortgage Overview in Lawrenceville
| Characteristic | Without Mortgage | With Mortgage |
| Housing Units | 1,727 | 3,414 |
| Median Property Value | $270,900 | $294,400 |
| Median Household Income | $55,679 | $443 |
| Monthly Housing Costs | $526 | $110 |
| Real Estate Taxes | $2,246 | $99 |
Property Value by Mortgage Status in Lawrenceville
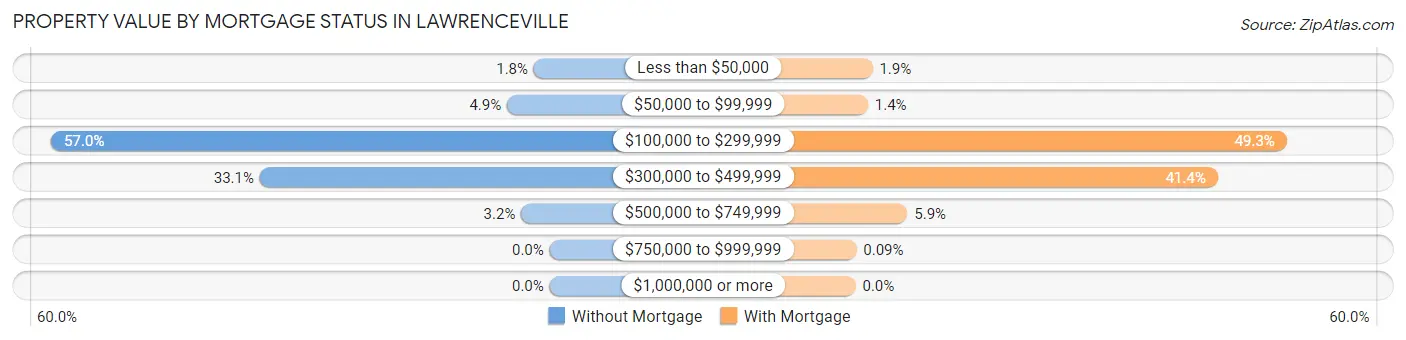
| Property Value | Without Mortgage | With Mortgage |
| Less than $50,000 | 31 (1.8%) | 66 (1.9%) |
| $50,000 to $99,999 | 84 (4.9%) | 48 (1.4%) |
| $100,000 to $299,999 | 984 (57.0%) | 1,682 (49.3%) |
| $300,000 to $499,999 | 572 (33.1%) | 1,413 (41.4%) |
| $500,000 to $749,999 | 56 (3.2%) | 202 (5.9%) |
| $750,000 to $999,999 | 0 (0.0%) | 3 (0.1%) |
| $1,000,000 or more | 0 (0.0%) | 0 (0.0%) |
| Total | 1,727 (100.0%) | 3,414 (100.0%) |
Household Income by Mortgage Status in Lawrenceville
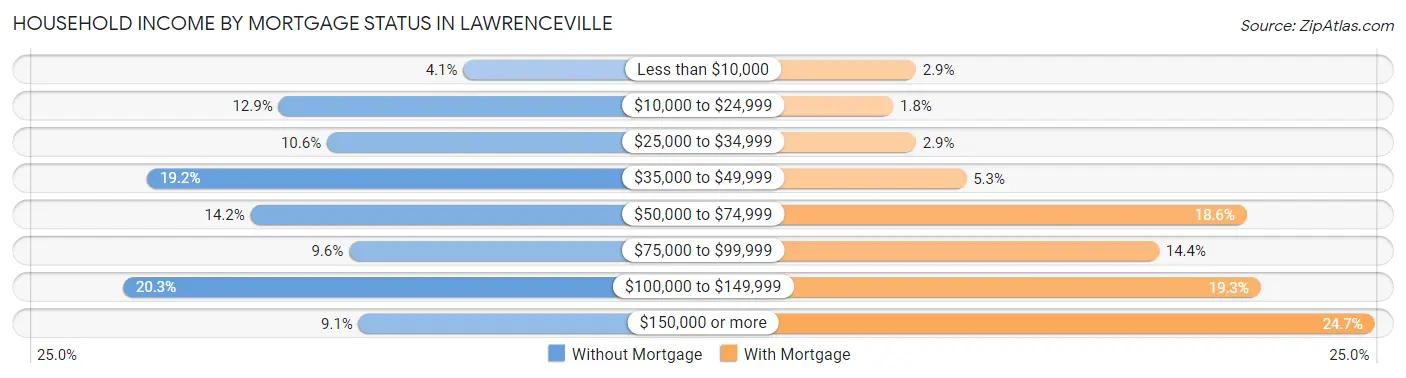
| Household Income | Without Mortgage | With Mortgage |
| Less than $10,000 | 71 (4.1%) | 98 (2.9%) |
| $10,000 to $24,999 | 223 (12.9%) | 61 (1.8%) |
| $25,000 to $34,999 | 183 (10.6%) | 98 (2.9%) |
| $35,000 to $49,999 | 331 (19.2%) | 180 (5.3%) |
| $50,000 to $74,999 | 246 (14.2%) | 636 (18.6%) |
| $75,000 to $99,999 | 165 (9.6%) | 493 (14.4%) |
| $100,000 to $149,999 | 351 (20.3%) | 659 (19.3%) |
| $150,000 or more | 157 (9.1%) | 844 (24.7%) |
| Total | 1,727 (100.0%) | 3,414 (100.0%) |
Property Value to Household Income Ratio in Lawrenceville
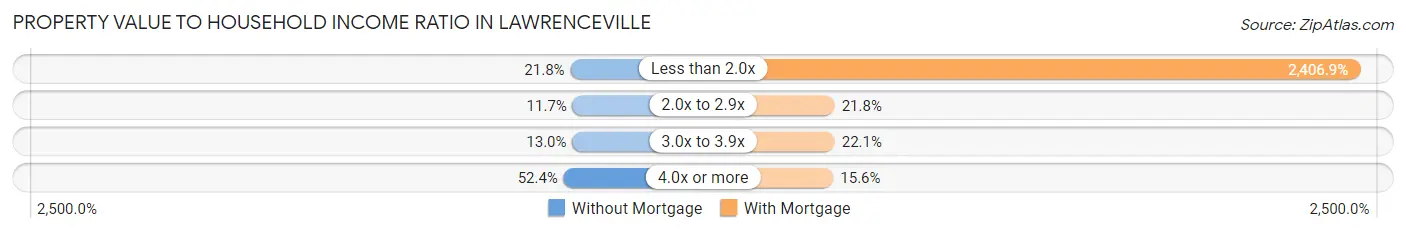
| Value-to-Income Ratio | Without Mortgage | With Mortgage |
| Less than 2.0x | 377 (21.8%) | 82,173 (2,406.9%) |
| 2.0x to 2.9x | 202 (11.7%) | 745 (21.8%) |
| 3.0x to 3.9x | 224 (13.0%) | 754 (22.1%) |
| 4.0x or more | 905 (52.4%) | 534 (15.6%) |
| Total | 1,727 (100.0%) | 3,414 (100.0%) |
Real Estate Taxes by Mortgage Status in Lawrenceville
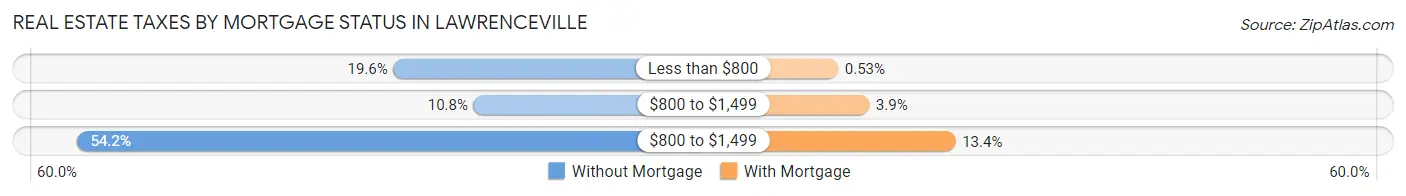
| Property Taxes | Without Mortgage | With Mortgage |
| Less than $800 | 338 (19.6%) | 18 (0.5%) |
| $800 to $1,499 | 186 (10.8%) | 134 (3.9%) |
| $800 to $1,499 | 936 (54.2%) | 457 (13.4%) |
| Total | 1,727 (100.0%) | 3,414 (100.0%) |
Health & Disability in Lawrenceville
Health Insurance Coverage by Age in Lawrenceville
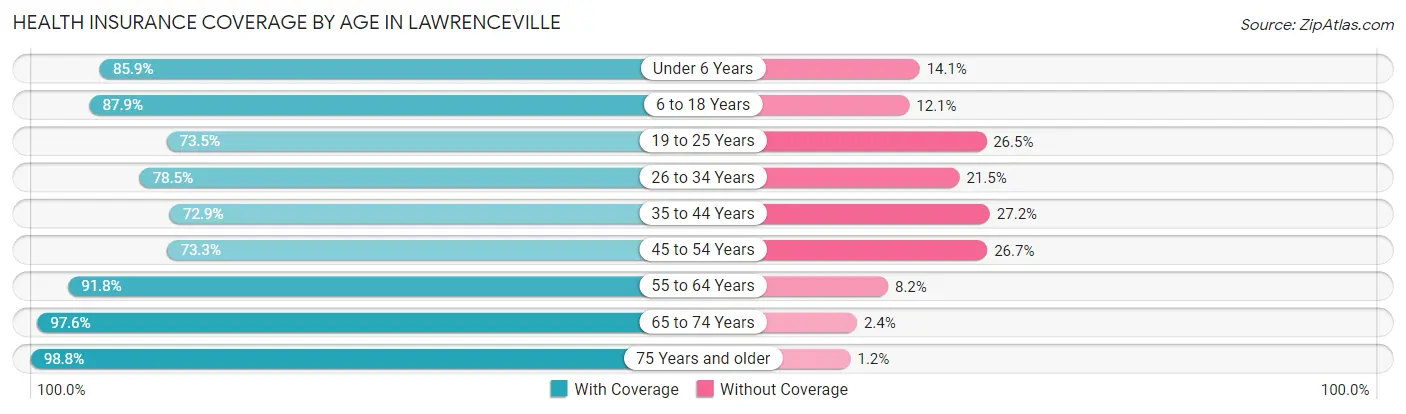
| Age Bracket | With Coverage | Without Coverage |
| Under 6 Years | 2,267 (85.9%) | 371 (14.1%) |
| 6 to 18 Years | 4,913 (87.9%) | 678 (12.1%) |
| 19 to 25 Years | 2,859 (73.5%) | 1,029 (26.5%) |
| 26 to 34 Years | 3,414 (78.5%) | 934 (21.5%) |
| 35 to 44 Years | 2,798 (72.9%) | 1,043 (27.2%) |
| 45 to 54 Years | 2,581 (73.3%) | 938 (26.7%) |
| 55 to 64 Years | 2,689 (91.8%) | 239 (8.2%) |
| 65 to 74 Years | 1,853 (97.6%) | 45 (2.4%) |
| 75 Years and older | 1,540 (98.8%) | 18 (1.2%) |
| Total | 24,914 (82.5%) | 5,295 (17.5%) |
Health Insurance Coverage by Citizenship Status in Lawrenceville
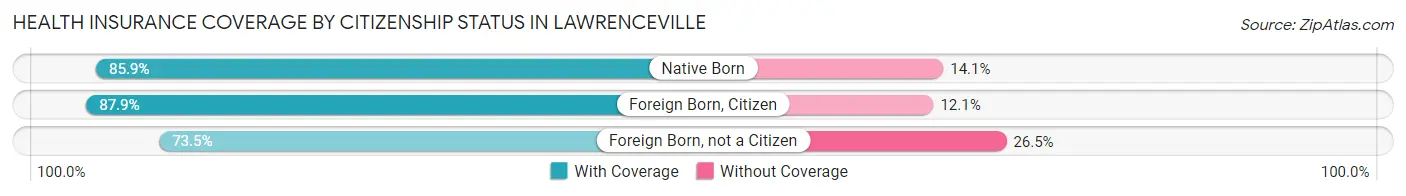
| Citizenship Status | With Coverage | Without Coverage |
| Native Born | 2,267 (85.9%) | 371 (14.1%) |
| Foreign Born, Citizen | 4,913 (87.9%) | 678 (12.1%) |
| Foreign Born, not a Citizen | 2,859 (73.5%) | 1,029 (26.5%) |
Health Insurance Coverage by Household Income in Lawrenceville
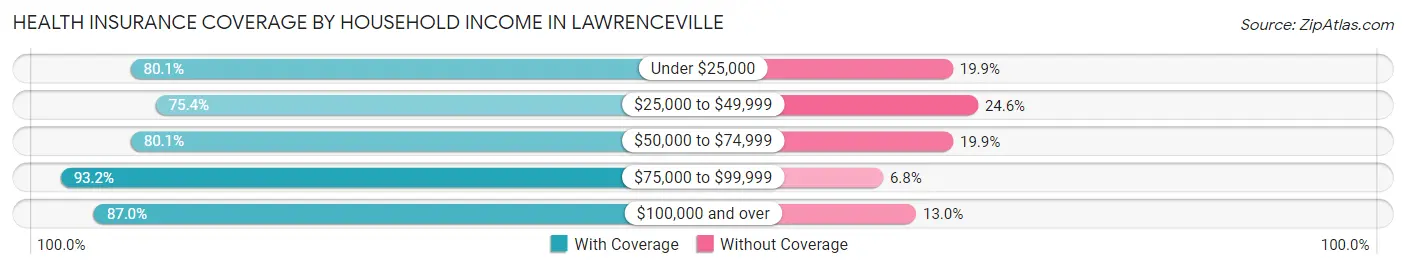
| Household Income | With Coverage | Without Coverage |
| Under $25,000 | 2,543 (80.1%) | 630 (19.9%) |
| $25,000 to $49,999 | 6,165 (75.4%) | 2,008 (24.6%) |
| $50,000 to $74,999 | 4,455 (80.1%) | 1,107 (19.9%) |
| $75,000 to $99,999 | 3,374 (93.2%) | 245 (6.8%) |
| $100,000 and over | 8,200 (87.0%) | 1,223 (13.0%) |
Public vs Private Health Insurance Coverage by Age in Lawrenceville
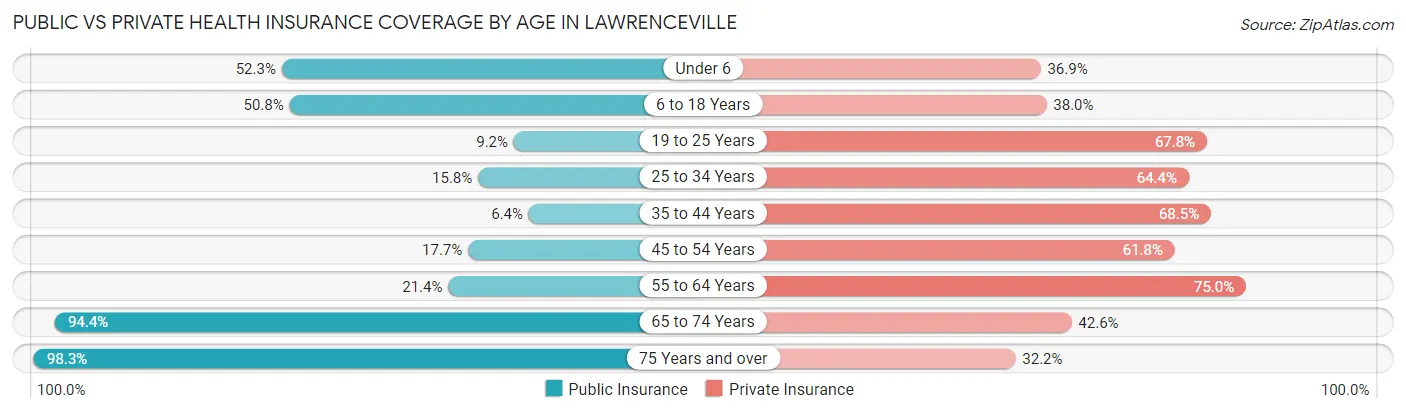
| Age Bracket | Public Insurance | Private Insurance |
| Under 6 | 1,379 (52.3%) | 973 (36.9%) |
| 6 to 18 Years | 2,842 (50.8%) | 2,123 (38.0%) |
| 19 to 25 Years | 357 (9.2%) | 2,635 (67.8%) |
| 25 to 34 Years | 688 (15.8%) | 2,800 (64.4%) |
| 35 to 44 Years | 246 (6.4%) | 2,632 (68.5%) |
| 45 to 54 Years | 622 (17.7%) | 2,175 (61.8%) |
| 55 to 64 Years | 625 (21.3%) | 2,197 (75.0%) |
| 65 to 74 Years | 1,791 (94.4%) | 809 (42.6%) |
| 75 Years and over | 1,531 (98.3%) | 502 (32.2%) |
| Total | 10,081 (33.4%) | 16,846 (55.8%) |
Disability Status by Sex by Age in Lawrenceville
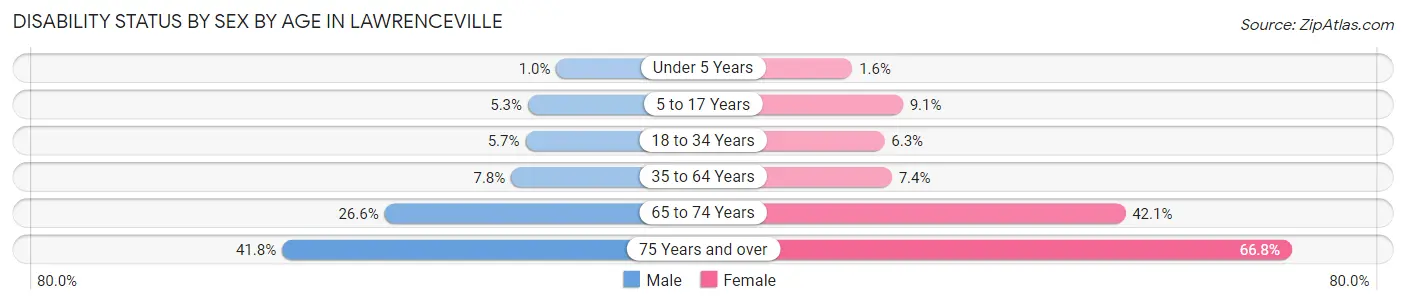
| Age Bracket | Male | Female |
| Under 5 Years | 13 (1.0%) | 12 (1.5%) |
| 5 to 17 Years | 146 (5.3%) | 263 (9.0%) |
| 18 to 34 Years | 214 (5.7%) | 315 (6.3%) |
| 35 to 64 Years | 363 (7.8%) | 416 (7.4%) |
| 65 to 74 Years | 217 (26.6%) | 455 (42.1%) |
| 75 Years and over | 122 (41.8%) | 846 (66.8%) |
Disability Class by Sex by Age in Lawrenceville
Disability Class: Hearing Difficulty
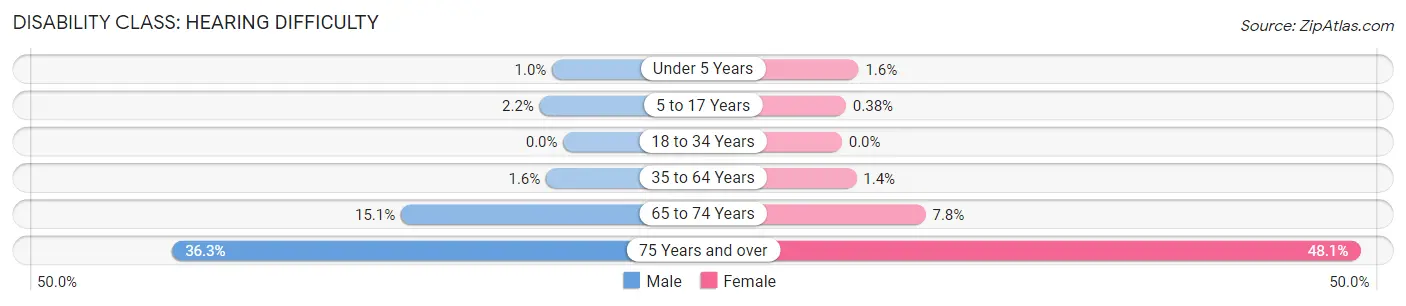
| Age Bracket | Male | Female |
| Under 5 Years | 13 (1.0%) | 12 (1.5%) |
| 5 to 17 Years | 61 (2.2%) | 11 (0.4%) |
| 18 to 34 Years | 0 (0.0%) | 0 (0.0%) |
| 35 to 64 Years | 75 (1.6%) | 76 (1.3%) |
| 65 to 74 Years | 123 (15.1%) | 84 (7.8%) |
| 75 Years and over | 106 (36.3%) | 609 (48.1%) |
Disability Class: Vision Difficulty
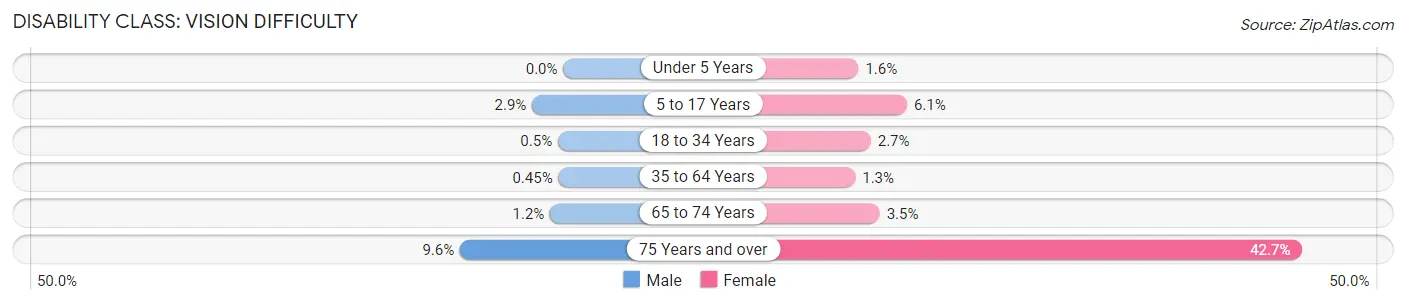
| Age Bracket | Male | Female |
| Under 5 Years | 0 (0.0%) | 12 (1.5%) |
| 5 to 17 Years | 80 (2.9%) | 176 (6.0%) |
| 18 to 34 Years | 19 (0.5%) | 134 (2.7%) |
| 35 to 64 Years | 21 (0.4%) | 70 (1.3%) |
| 65 to 74 Years | 10 (1.2%) | 38 (3.5%) |
| 75 Years and over | 28 (9.6%) | 541 (42.7%) |
Disability Class: Cognitive Difficulty
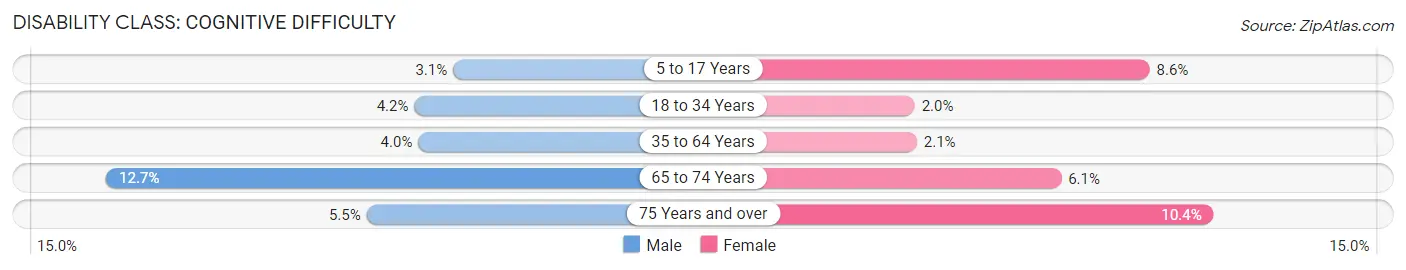
| Age Bracket | Male | Female |
| 5 to 17 Years | 85 (3.1%) | 249 (8.6%) |
| 18 to 34 Years | 157 (4.2%) | 101 (2.0%) |
| 35 to 64 Years | 189 (4.0%) | 117 (2.1%) |
| 65 to 74 Years | 104 (12.7%) | 66 (6.1%) |
| 75 Years and over | 16 (5.5%) | 131 (10.3%) |
Disability Class: Ambulatory Difficulty
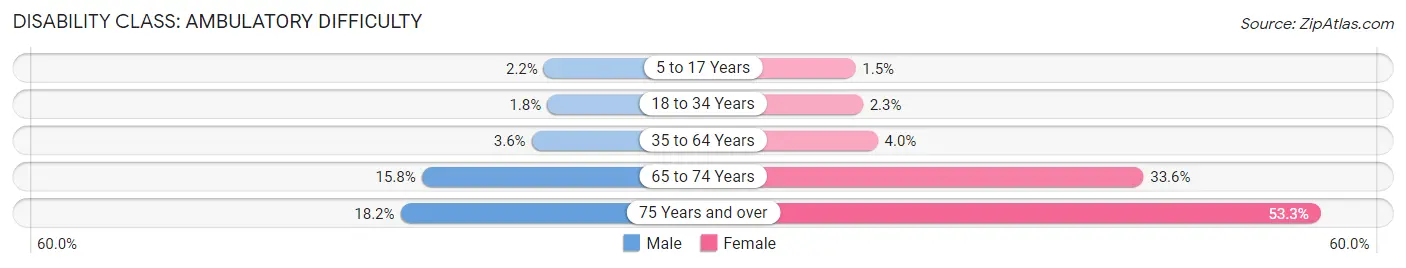
| Age Bracket | Male | Female |
| 5 to 17 Years | 61 (2.2%) | 44 (1.5%) |
| 18 to 34 Years | 69 (1.8%) | 116 (2.3%) |
| 35 to 64 Years | 166 (3.5%) | 224 (4.0%) |
| 65 to 74 Years | 129 (15.8%) | 363 (33.6%) |
| 75 Years and over | 53 (18.1%) | 675 (53.3%) |
Disability Class: Self-Care Difficulty
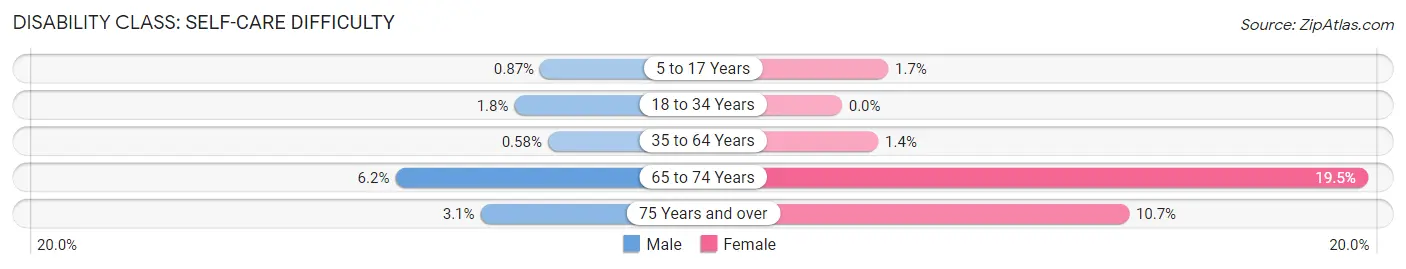
| Age Bracket | Male | Female |
| 5 to 17 Years | 24 (0.9%) | 50 (1.7%) |
| 18 to 34 Years | 69 (1.8%) | 0 (0.0%) |
| 35 to 64 Years | 27 (0.6%) | 76 (1.3%) |
| 65 to 74 Years | 51 (6.2%) | 211 (19.5%) |
| 75 Years and over | 9 (3.1%) | 135 (10.7%) |
Technology Access in Lawrenceville
Computing Device Access in Lawrenceville
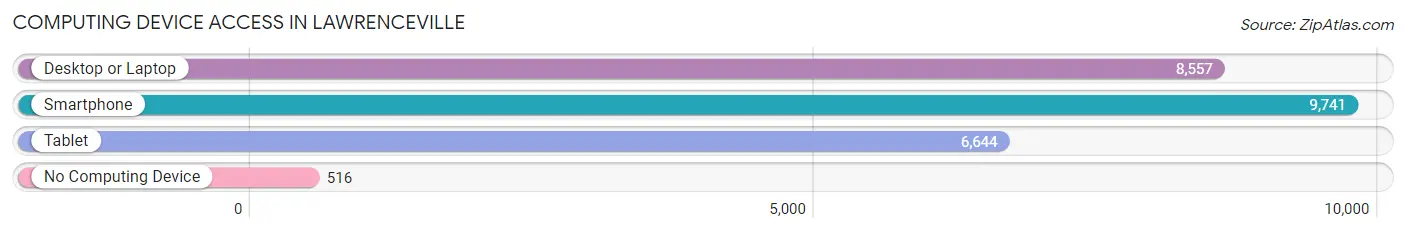
| Device Type | # Households | % Households |
| Desktop or Laptop | 8,557 | 79.5% |
| Smartphone | 9,741 | 90.5% |
| Tablet | 6,644 | 61.7% |
| No Computing Device | 516 | 4.8% |
| Total | 10,762 | 100.0% |
Internet Access in Lawrenceville
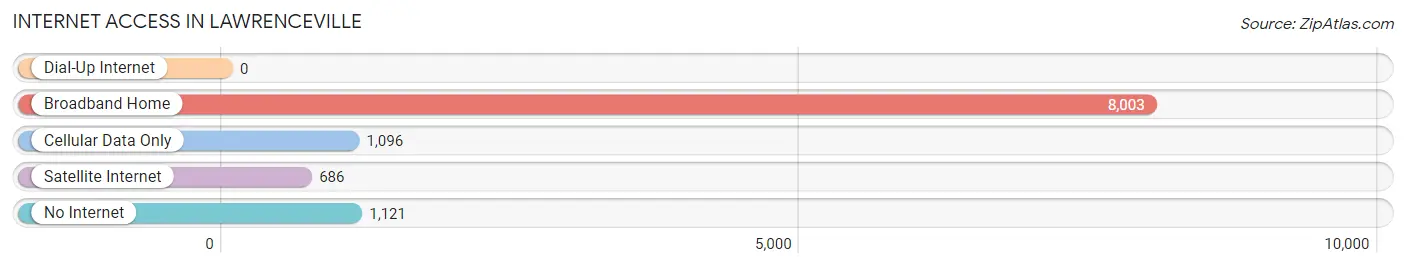
| Internet Type | # Households | % Households |
| Dial-Up Internet | 0 | 0.0% |
| Broadband Home | 8,003 | 74.4% |
| Cellular Data Only | 1,096 | 10.2% |
| Satellite Internet | 686 | 6.4% |
| No Internet | 1,121 | 10.4% |
| Total | 10,762 | 100.0% |
Lawrenceville Summary
Lawrenceville is a city located in Gwinnett County, Georgia, United States. It is a suburb of Atlanta and is part of the Atlanta metropolitan area. As of the 2010 census, the population of Lawrenceville was 28,546.
History
The area now known as Lawrenceville was originally inhabited by the Cherokee Indians. The city was founded in 1821 by Major George Lawrence, a veteran of the War of 1812. Lawrenceville was the first city in Gwinnett County to be incorporated. It was named after Major Lawrence, who was a prominent figure in the area.
In the early 19th century, Lawrenceville was a small farming community. The city grew rapidly in the late 19th century and early 20th century, due to the arrival of the railroad and the growth of the cotton industry. By the 1920s, Lawrenceville had become a bustling town with a population of over 5,000.
Geography
Lawrenceville is located in the Piedmont region of Georgia, approximately 30 miles northeast of Atlanta. The city is situated in the foothills of the Blue Ridge Mountains and is surrounded by rolling hills and forests. The city covers an area of 16.3 square miles and has an elevation of 1,068 feet.
The city is divided into several distinct neighborhoods, including Old Town, Downtown, and the Historic District. The city is also home to several parks, including Tribble Mill Park, Rhodes Jordan Park, and Lawrenceville Greenway.
Economy
Lawrenceville is home to a diverse economy. The city is home to several large employers, including Gwinnett Medical Center, Georgia Gwinnett College, and the Gwinnett County Public Schools. The city is also home to several small businesses, including restaurants, retail stores, and professional services.
Lawrenceville is also home to several industrial parks, including the Lawrenceville Industrial Park and the Gwinnett Technology Park. These parks are home to a variety of businesses, including manufacturing, distribution, and technology companies.
Demographics
As of the 2010 census, the population of Lawrenceville was 28,546. The racial makeup of the city was 57.2% White, 28.3% African American, 0.4% Native American, 4.2% Asian, 0.1% Pacific Islander, 6.7% from other races, and 2.3% from two or more races. Hispanic or Latino of any race were 13.2% of the population.
The median household income in Lawrenceville was $50,945, and the median family income was $60,945. The per capita income for the city was $25,945. About 11.2% of families and 14.3% of the population were below the poverty line, including 19.2% of those under age 18 and 8.2% of those age 65 or over.
Common Questions
What is Per Capita Income in Lawrenceville?
Per Capita income in Lawrenceville is $26,860.
What is the Median Family Income in Lawrenceville?
Median Family Income in Lawrenceville is $66,260.
What is the Median Household income in Lawrenceville?
Median Household Income in Lawrenceville is $55,608.
What is Income or Wage Gap in Lawrenceville?
Income or Wage Gap in Lawrenceville is 25.7%.
Women in Lawrenceville earn 74.3 cents for every dollar earned by a man.
What is Family Income Deficit in Lawrenceville?
Family Income Deficit in Lawrenceville is $7,990.
Families that are below poverty line in Lawrenceville earn $7,990 less on average than the poverty threshold level.
What is Inequality or Gini Index in Lawrenceville?
Inequality or Gini Index in Lawrenceville is 0.41.
What is the Total Population of Lawrenceville?
Total Population of Lawrenceville is 30,465.
What is the Total Male Population of Lawrenceville?
Total Male Population of Lawrenceville is 13,664.
What is the Total Female Population of Lawrenceville?
Total Female Population of Lawrenceville is 16,801.
What is the Ratio of Males per 100 Females in Lawrenceville?
There are 81.33 Males per 100 Females in Lawrenceville.
What is the Ratio of Females per 100 Males in Lawrenceville?
There are 122.96 Females per 100 Males in Lawrenceville.
What is the Median Population Age in Lawrenceville?
Median Population Age in Lawrenceville is 32.5 Years.
What is the Average Family Size in Lawrenceville
Average Family Size in Lawrenceville is 3.4 People.
What is the Average Household Size in Lawrenceville
Average Household Size in Lawrenceville is 2.8 People.
How Large is the Labor Force in Lawrenceville?
There are 15,440 People in the Labor Forcein in Lawrenceville.
What is the Percentage of People in the Labor Force in Lawrenceville?
65.3% of People are in the Labor Force in Lawrenceville.
What is the Unemployment Rate in Lawrenceville?
Unemployment Rate in Lawrenceville is 6.3%.