Gaithersburg, MD Map & Demographics
Gaithersburg Map
Gaithersburg Overview
$52,624
PER CAPITA INCOME
$118,020
AVG FAMILY INCOME
$104,544
AVG HOUSEHOLD INCOME
23.8%
WAGE / INCOME GAP [ % ]
76.2¢/ $1
WAGE / INCOME GAP [ $ ]
0.46
INEQUALITY / GINI INDEX
69,016
TOTAL POPULATION
33,258
MALE POPULATION
35,758
FEMALE POPULATION
93.01
MALES / 100 FEMALES
107.52
FEMALES / 100 MALES
37.4
MEDIAN AGE
3.3
AVG FAMILY SIZE
2.7
AVG HOUSEHOLD SIZE
40,207
LABOR FORCE [ PEOPLE ]
73.2%
PERCENT IN LABOR FORCE
5.5%
UNEMPLOYMENT RATE
Income in Gaithersburg
Income Overview in Gaithersburg
Per Capita Income in Gaithersburg is $52,624, while median incomes of families and households are $118,020 and $104,544 respectively.
| Characteristic | Number | Measure |
| Per Capita Income | 69,016 | $52,624 |
| Median Family Income | 16,975 | $118,020 |
| Mean Family Income | 16,975 | $156,986 |
| Median Household Income | 25,671 | $104,544 |
| Mean Household Income | 25,671 | $138,702 |
| Income Deficit | 16,975 | $0 |
| Wage / Income Gap (%) | 69,016 | 23.79% |
| Wage / Income Gap ($) | 69,016 | 76.21¢ per $1 |
| Gini / Inequality Index | 69,016 | 0.46 |
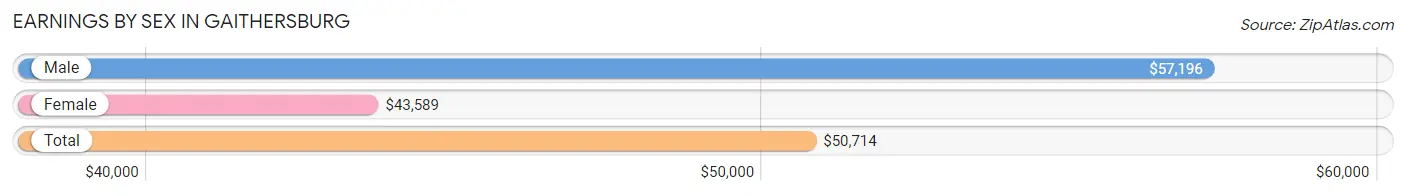
Earnings by Sex in Gaithersburg
Average Earnings in Gaithersburg are $50,714, $57,196 for men and $43,589 for women, a difference of 23.8%.
| Sex | Number | Average Earnings |
| Male | 20,795 (50.6%) | $57,196 |
| Female | 20,334 (49.4%) | $43,589 |
| Total | 41,129 (100.0%) | $50,714 |
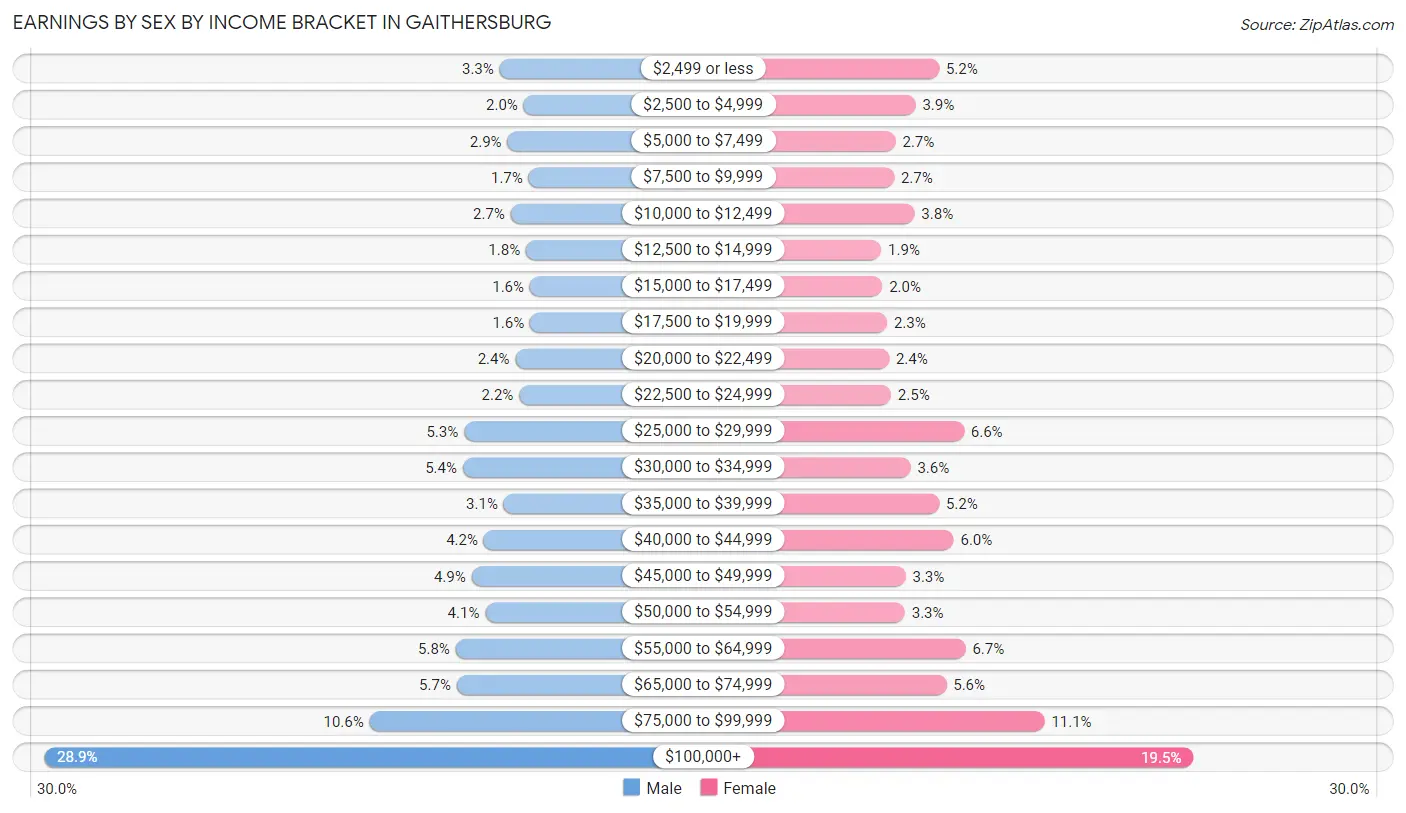
Earnings by Sex by Income Bracket in Gaithersburg
The most common earnings brackets in Gaithersburg are $100,000+ for men (6,009 | 28.9%) and $100,000+ for women (3,959 | 19.5%).
| Income | Male | Female |
| $2,499 or less | 687 (3.3%) | 1,053 (5.2%) |
| $2,500 to $4,999 | 406 (1.9%) | 785 (3.9%) |
| $5,000 to $7,499 | 595 (2.9%) | 558 (2.7%) |
| $7,500 to $9,999 | 348 (1.7%) | 539 (2.6%) |
| $10,000 to $12,499 | 557 (2.7%) | 773 (3.8%) |
| $12,500 to $14,999 | 379 (1.8%) | 392 (1.9%) |
| $15,000 to $17,499 | 332 (1.6%) | 405 (2.0%) |
| $17,500 to $19,999 | 331 (1.6%) | 459 (2.3%) |
| $20,000 to $22,499 | 503 (2.4%) | 481 (2.4%) |
| $22,500 to $24,999 | 458 (2.2%) | 504 (2.5%) |
| $25,000 to $29,999 | 1,102 (5.3%) | 1,338 (6.6%) |
| $30,000 to $34,999 | 1,116 (5.4%) | 728 (3.6%) |
| $35,000 to $39,999 | 638 (3.1%) | 1,054 (5.2%) |
| $40,000 to $44,999 | 871 (4.2%) | 1,221 (6.0%) |
| $45,000 to $49,999 | 1,015 (4.9%) | 671 (3.3%) |
| $50,000 to $54,999 | 854 (4.1%) | 662 (3.3%) |
| $55,000 to $64,999 | 1,200 (5.8%) | 1,356 (6.7%) |
| $65,000 to $74,999 | 1,188 (5.7%) | 1,137 (5.6%) |
| $75,000 to $99,999 | 2,206 (10.6%) | 2,259 (11.1%) |
| $100,000+ | 6,009 (28.9%) | 3,959 (19.5%) |
| Total | 20,795 (100.0%) | 20,334 (100.0%) |
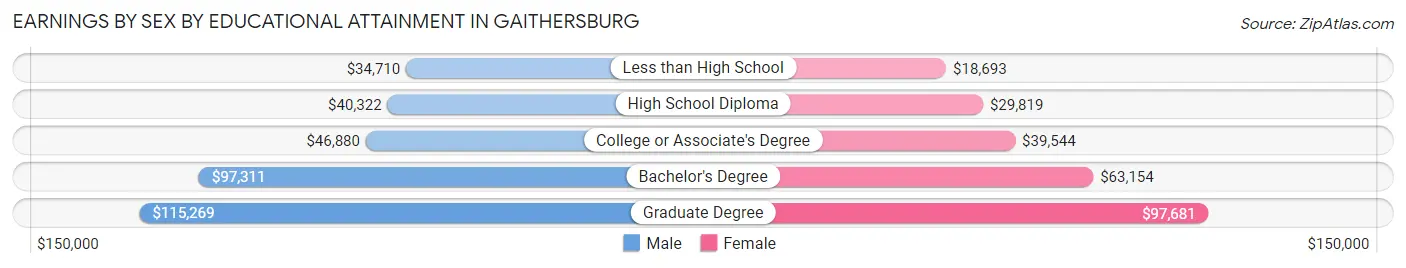
Earnings by Sex by Educational Attainment in Gaithersburg
Average earnings in Gaithersburg are $63,948 for men and $52,158 for women, a difference of 18.4%. Men with an educational attainment of graduate degree enjoy the highest average annual earnings of $115,269, while those with less than high school education earn the least with $34,710. Women with an educational attainment of graduate degree earn the most with the average annual earnings of $97,681, while those with less than high school education have the smallest earnings of $18,693.
| Educational Attainment | Male Income | Female Income |
| Less than High School | $34,710 | $18,693 |
| High School Diploma | $40,322 | $29,819 |
| College or Associate's Degree | $46,880 | $39,544 |
| Bachelor's Degree | $97,311 | $63,154 |
| Graduate Degree | $115,269 | $97,681 |
| Total | $63,948 | $52,158 |
Family Income in Gaithersburg
Family Income Brackets in Gaithersburg
According to the Gaithersburg family income data, there are 4,176 families falling into the $200,000+ income range, which is the most common income bracket and makes up 24.6% of all families. Conversely, the $10,000 to $14,999 income bracket is the least frequent group with only 153 families (0.9%) belonging to this category.
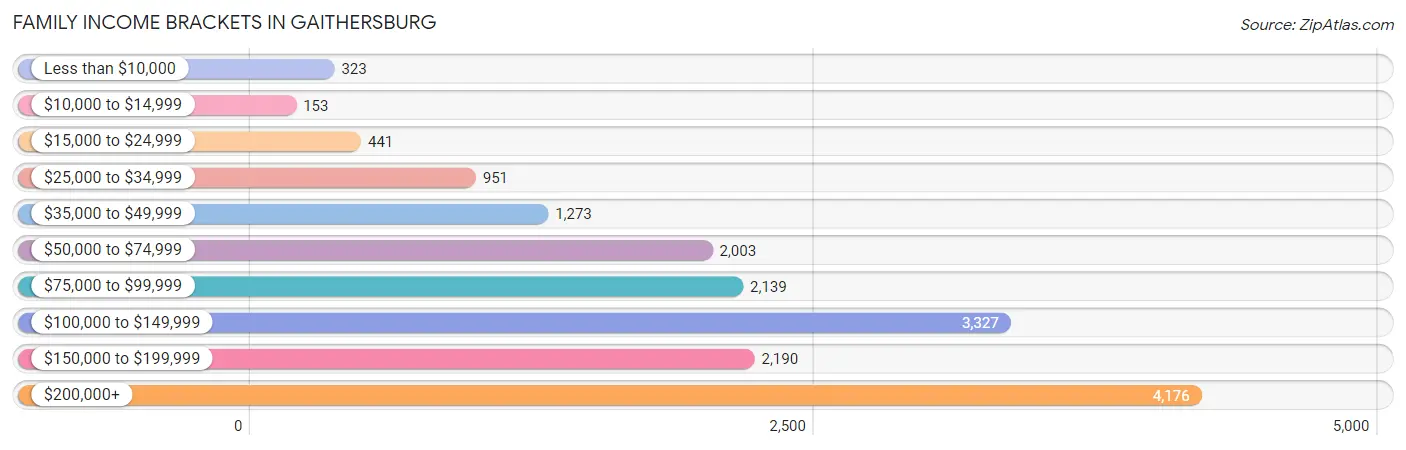
| Income Bracket | # Families | % Families |
| Less than $10,000 | 323 | 1.9% |
| $10,000 to $14,999 | 153 | 0.9% |
| $15,000 to $24,999 | 441 | 2.6% |
| $25,000 to $34,999 | 951 | 5.6% |
| $35,000 to $49,999 | 1,273 | 7.5% |
| $50,000 to $74,999 | 2,003 | 11.8% |
| $75,000 to $99,999 | 2,139 | 12.6% |
| $100,000 to $149,999 | 3,327 | 19.6% |
| $150,000 to $199,999 | 2,190 | 12.9% |
| $200,000+ | 4,176 | 24.6% |
Family Income by Famaliy Size in Gaithersburg
5-person families (1,295 | 7.6%) account for the highest median family income in Gaithersburg with $125,635 per family, while 2-person families (6,916 | 40.7%) have the highest median income of $60,737 per family member.
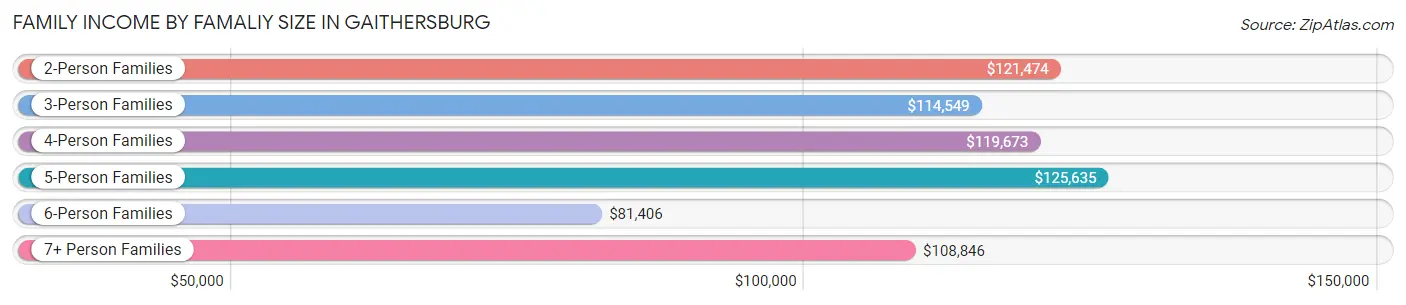
| Income Bracket | # Families | Median Income |
| 2-Person Families | 6,916 (40.7%) | $121,474 |
| 3-Person Families | 4,213 (24.8%) | $114,549 |
| 4-Person Families | 3,407 (20.1%) | $119,673 |
| 5-Person Families | 1,295 (7.6%) | $125,635 |
| 6-Person Families | 690 (4.1%) | $81,406 |
| 7+ Person Families | 454 (2.7%) | $108,846 |
| Total | 16,975 (100.0%) | $118,020 |
Family Income by Number of Earners in Gaithersburg
The median family income in Gaithersburg is $118,020, with families comprising 2 earners (8,029) having the highest median family income of $137,472, while families with no earners (1,333) have the lowest median family income of $72,596, accounting for 47.3% and 7.9% of families, respectively.
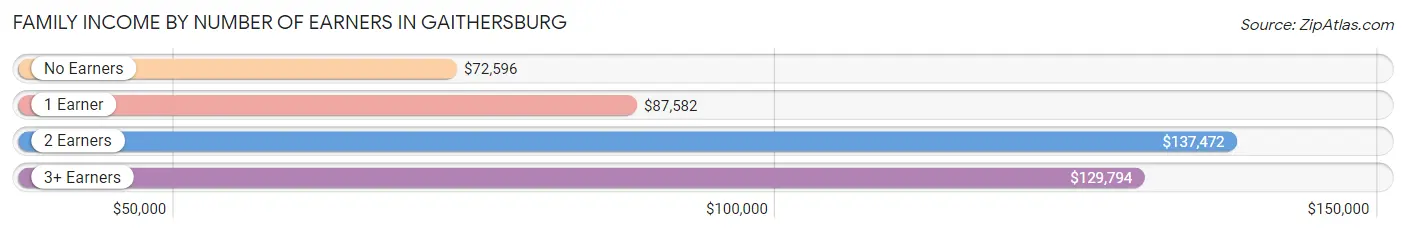
| Number of Earners | # Families | Median Income |
| No Earners | 1,333 (7.9%) | $72,596 |
| 1 Earner | 4,692 (27.6%) | $87,582 |
| 2 Earners | 8,029 (47.3%) | $137,472 |
| 3+ Earners | 2,921 (17.2%) | $129,794 |
| Total | 16,975 (100.0%) | $118,020 |
Household Income in Gaithersburg
Household Income Brackets in Gaithersburg
With 5,263 households falling in the category, the $100,000 to $149,999 income range is the most frequent in Gaithersburg, accounting for 20.5% of all households. In contrast, only 488 households (1.9%) fall into the $10,000 to $14,999 income bracket, making it the least populous group.
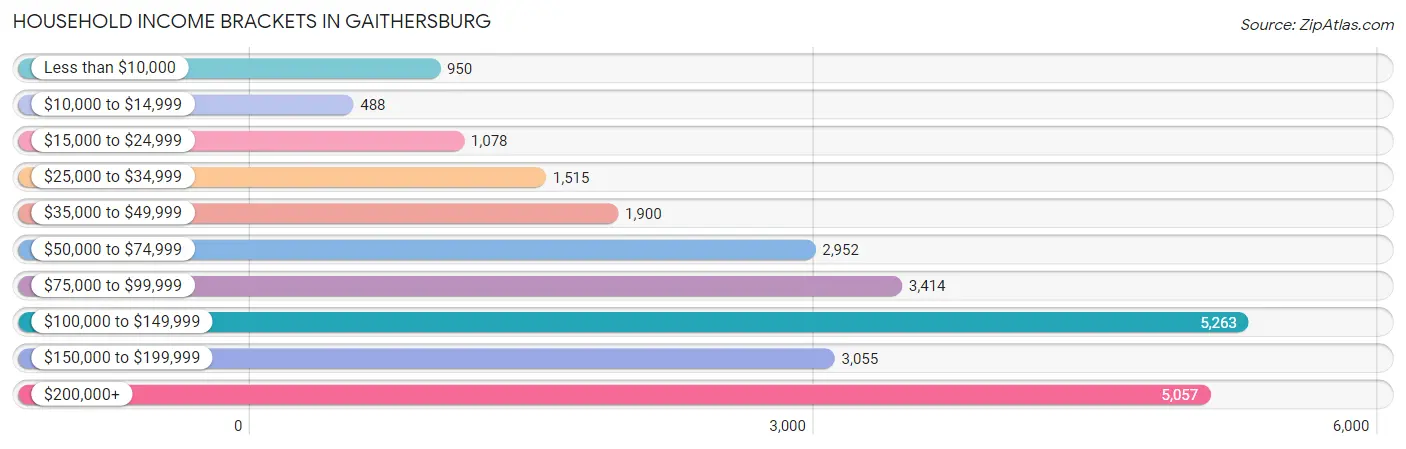
| Income Bracket | # Households | % Households |
| Less than $10,000 | 950 | 3.7% |
| $10,000 to $14,999 | 488 | 1.9% |
| $15,000 to $24,999 | 1,078 | 4.2% |
| $25,000 to $34,999 | 1,515 | 5.9% |
| $35,000 to $49,999 | 1,900 | 7.4% |
| $50,000 to $74,999 | 2,952 | 11.5% |
| $75,000 to $99,999 | 3,414 | 13.3% |
| $100,000 to $149,999 | 5,263 | 20.5% |
| $150,000 to $199,999 | 3,055 | 11.9% |
| $200,000+ | 5,057 | 19.7% |
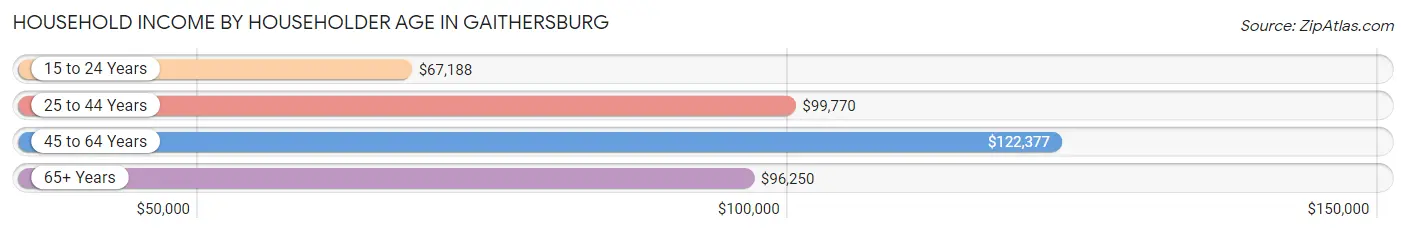
Household Income by Householder Age in Gaithersburg
The median household income in Gaithersburg is $104,544, with the highest median household income of $122,377 found in the 45 to 64 years age bracket for the primary householder. A total of 10,353 households (40.3%) fall into this category. Meanwhile, the 15 to 24 years age bracket for the primary householder has the lowest median household income of $67,188, with 663 households (2.6%) in this group.
| Income Bracket | # Households | Median Income |
| 15 to 24 Years | 663 (2.6%) | $67,188 |
| 25 to 44 Years | 9,870 (38.5%) | $99,770 |
| 45 to 64 Years | 10,353 (40.3%) | $122,377 |
| 65+ Years | 4,785 (18.6%) | $96,250 |
| Total | 25,671 (100.0%) | $104,544 |
Poverty in Gaithersburg
Income Below Poverty by Sex and Age in Gaithersburg
With 8.8% poverty level for males and 10.4% for females among the residents of Gaithersburg, 6 to 11 year old males and 15 year old females are the most vulnerable to poverty, with 460 males (15.1%) and 74 females (23.1%) in their respective age groups living below the poverty level.
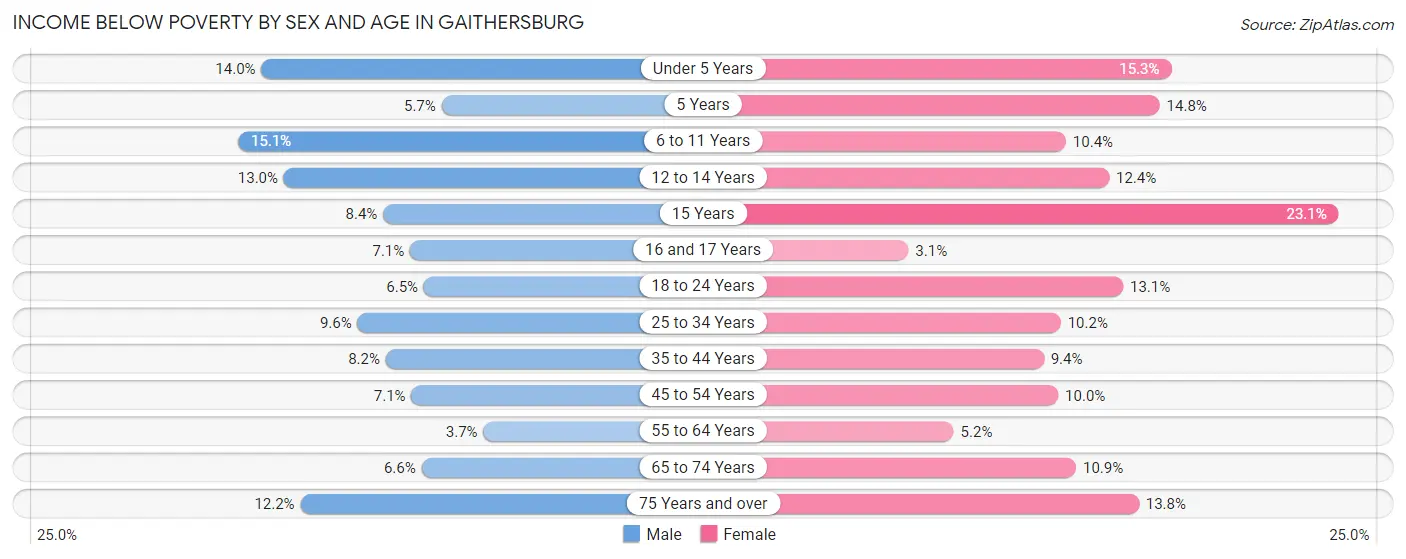
| Age Bracket | Male | Female |
| Under 5 Years | 320 (14.0%) | 377 (15.3%) |
| 5 Years | 23 (5.7%) | 54 (14.7%) |
| 6 to 11 Years | 460 (15.1%) | 194 (10.4%) |
| 12 to 14 Years | 135 (13.0%) | 173 (12.4%) |
| 15 Years | 48 (8.4%) | 74 (23.1%) |
| 16 and 17 Years | 48 (7.1%) | 23 (3.1%) |
| 18 to 24 Years | 188 (6.5%) | 423 (13.1%) |
| 25 to 34 Years | 451 (9.6%) | 481 (10.2%) |
| 35 to 44 Years | 472 (8.2%) | 532 (9.4%) |
| 45 to 54 Years | 289 (7.0%) | 516 (10.0%) |
| 55 to 64 Years | 140 (3.7%) | 222 (5.2%) |
| 65 to 74 Years | 144 (6.6%) | 312 (10.9%) |
| 75 Years and over | 195 (12.2%) | 321 (13.8%) |
| Total | 2,913 (8.8%) | 3,702 (10.4%) |
Income Above Poverty by Sex and Age in Gaithersburg
According to the poverty statistics in Gaithersburg, males aged 55 to 64 years and females aged 16 and 17 years are the age groups that are most secure financially, with 96.3% of males and 96.9% of females in these age groups living above the poverty line.
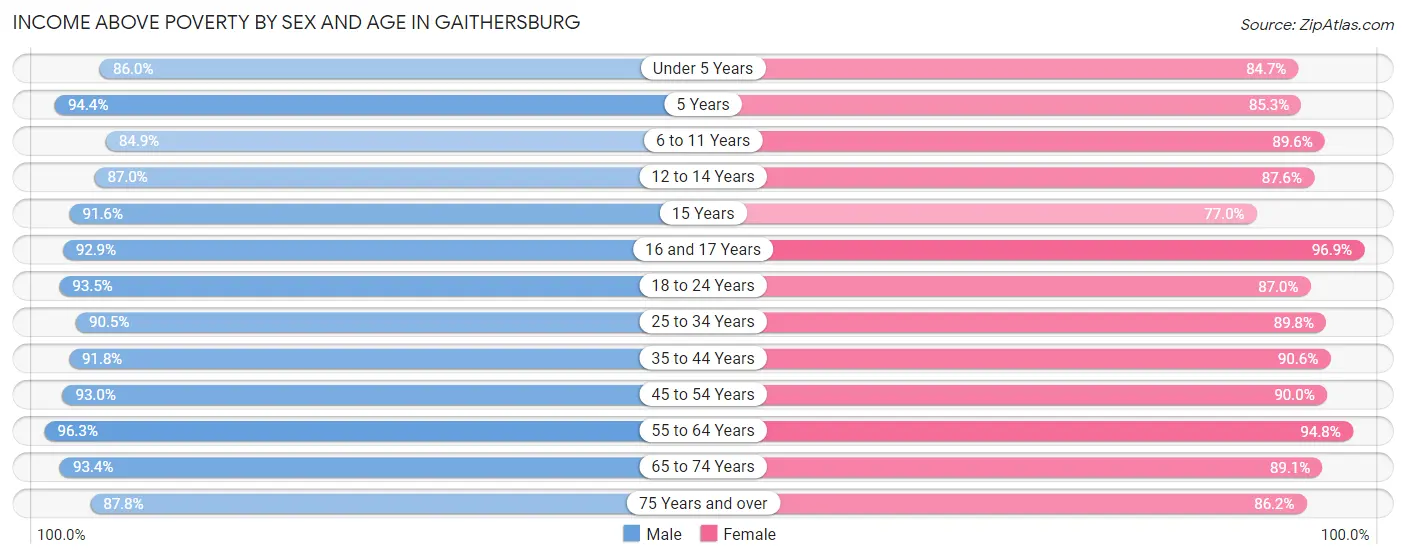
| Age Bracket | Male | Female |
| Under 5 Years | 1,964 (86.0%) | 2,089 (84.7%) |
| 5 Years | 384 (94.4%) | 312 (85.3%) |
| 6 to 11 Years | 2,587 (84.9%) | 1,672 (89.6%) |
| 12 to 14 Years | 906 (87.0%) | 1,222 (87.6%) |
| 15 Years | 526 (91.6%) | 247 (76.9%) |
| 16 and 17 Years | 627 (92.9%) | 721 (96.9%) |
| 18 to 24 Years | 2,718 (93.5%) | 2,818 (87.0%) |
| 25 to 34 Years | 4,272 (90.4%) | 4,252 (89.8%) |
| 35 to 44 Years | 5,258 (91.8%) | 5,143 (90.6%) |
| 45 to 54 Years | 3,812 (92.9%) | 4,624 (90.0%) |
| 55 to 64 Years | 3,629 (96.3%) | 4,058 (94.8%) |
| 65 to 74 Years | 2,045 (93.4%) | 2,557 (89.1%) |
| 75 Years and over | 1,404 (87.8%) | 2,008 (86.2%) |
| Total | 30,132 (91.2%) | 31,723 (89.5%) |
Income Below Poverty Among Married-Couple Families in Gaithersburg
The poverty statistics for married-couple families in Gaithersburg show that 5.9% or 773 of the total 13,006 families live below the poverty line. Families with 3 or 4 children have the highest poverty rate of 16.0%, comprising of 143 families. On the other hand, families with no children have the lowest poverty rate of 5.1%, which includes 329 families.
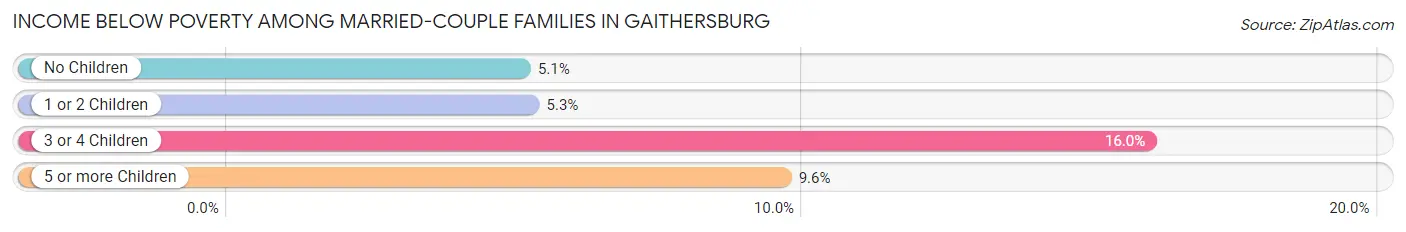
| Children | Above Poverty | Below Poverty |
| No Children | 6,123 (94.9%) | 329 (5.1%) |
| 1 or 2 Children | 5,284 (94.8%) | 293 (5.2%) |
| 3 or 4 Children | 751 (84.0%) | 143 (16.0%) |
| 5 or more Children | 75 (90.4%) | 8 (9.6%) |
| Total | 12,233 (94.1%) | 773 (5.9%) |
Income Below Poverty Among Single-Parent Households in Gaithersburg
According to the poverty data in Gaithersburg, 4.5% or 43 single-father households and 9.7% or 291 single-mother households are living below the poverty line. Among single-father households, those with no children have the highest poverty rate, with 38 households (7.2%) experiencing poverty. Likewise, among single-mother households, those with 3 or 4 children have the highest poverty rate, with 112 households (60.5%) falling below the poverty line.
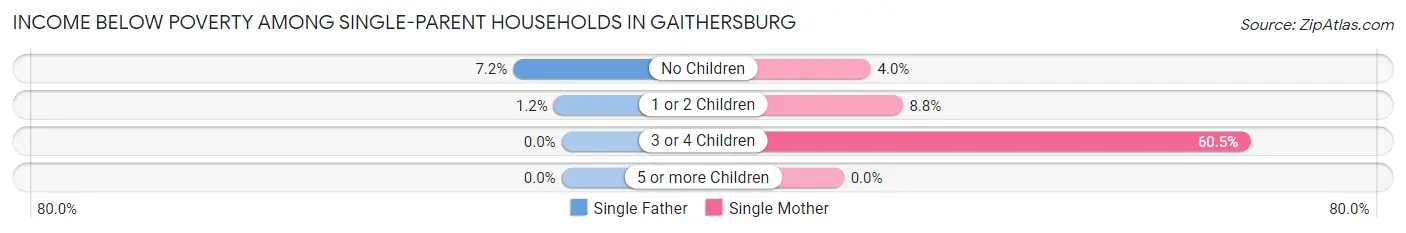
| Children | Single Father | Single Mother |
| No Children | 38 (7.2%) | 58 (4.0%) |
| 1 or 2 Children | 5 (1.2%) | 121 (8.8%) |
| 3 or 4 Children | 0 (0.0%) | 112 (60.5%) |
| 5 or more Children | 0 (0.0%) | 0 (0.0%) |
| Total | 43 (4.5%) | 291 (9.7%) |
Income Below Poverty Among Married-Couple vs Single-Parent Households in Gaithersburg
The poverty data for Gaithersburg shows that 773 of the married-couple family households (5.9%) and 334 of the single-parent households (8.4%) are living below the poverty level. Within the married-couple family households, those with 3 or 4 children have the highest poverty rate, with 143 households (16.0%) falling below the poverty line. Among the single-parent households, those with 3 or 4 children have the highest poverty rate, with 112 household (59.9%) living below poverty.
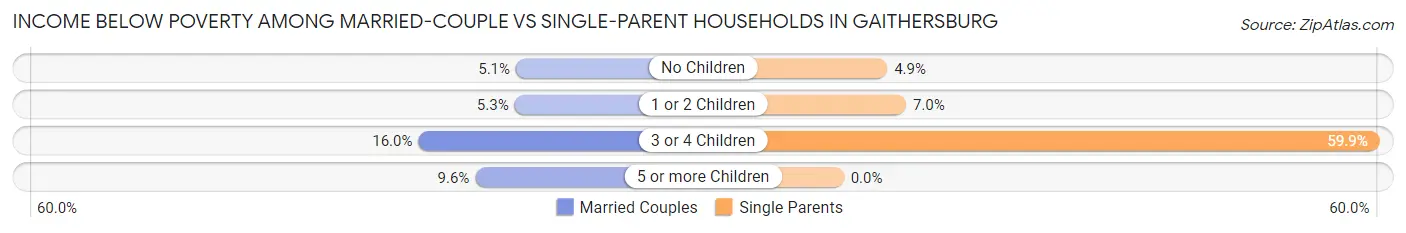
| Children | Married-Couple Families | Single-Parent Households |
| No Children | 329 (5.1%) | 96 (4.9%) |
| 1 or 2 Children | 293 (5.2%) | 126 (7.0%) |
| 3 or 4 Children | 143 (16.0%) | 112 (59.9%) |
| 5 or more Children | 8 (9.6%) | 0 (0.0%) |
| Total | 773 (5.9%) | 334 (8.4%) |
Race in Gaithersburg
The most populous races in Gaithersburg are White / Caucasian (26,696 | 38.7%), Hispanic or Latino (17,923 | 26.0%), and Asian (14,540 | 21.1%).
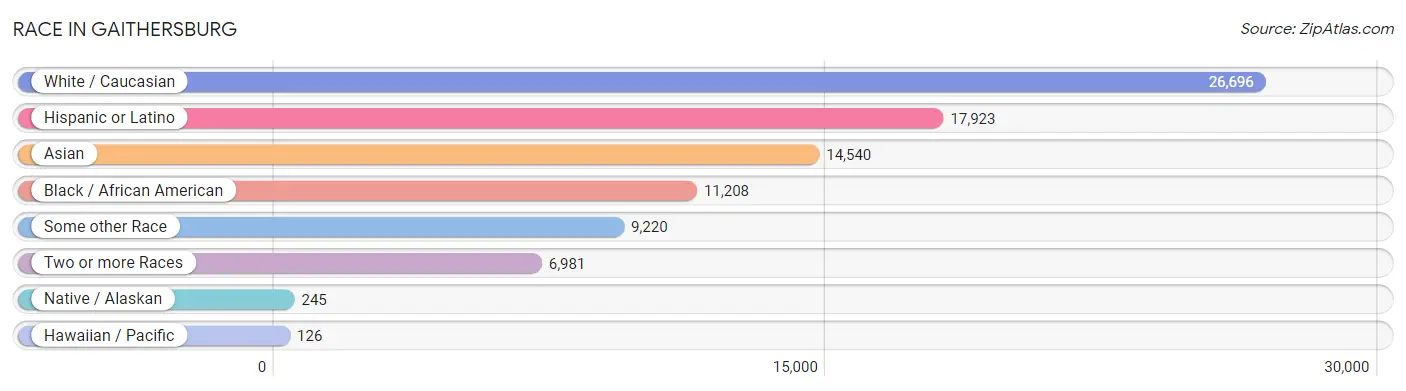
| Race | # Population | % Population |
| Asian | 14,540 | 21.1% |
| Black / African American | 11,208 | 16.2% |
| Hawaiian / Pacific | 126 | 0.2% |
| Hispanic or Latino | 17,923 | 26.0% |
| Native / Alaskan | 245 | 0.4% |
| White / Caucasian | 26,696 | 38.7% |
| Two or more Races | 6,981 | 10.1% |
| Some other Race | 9,220 | 13.4% |
| Total | 69,016 | 100.0% |
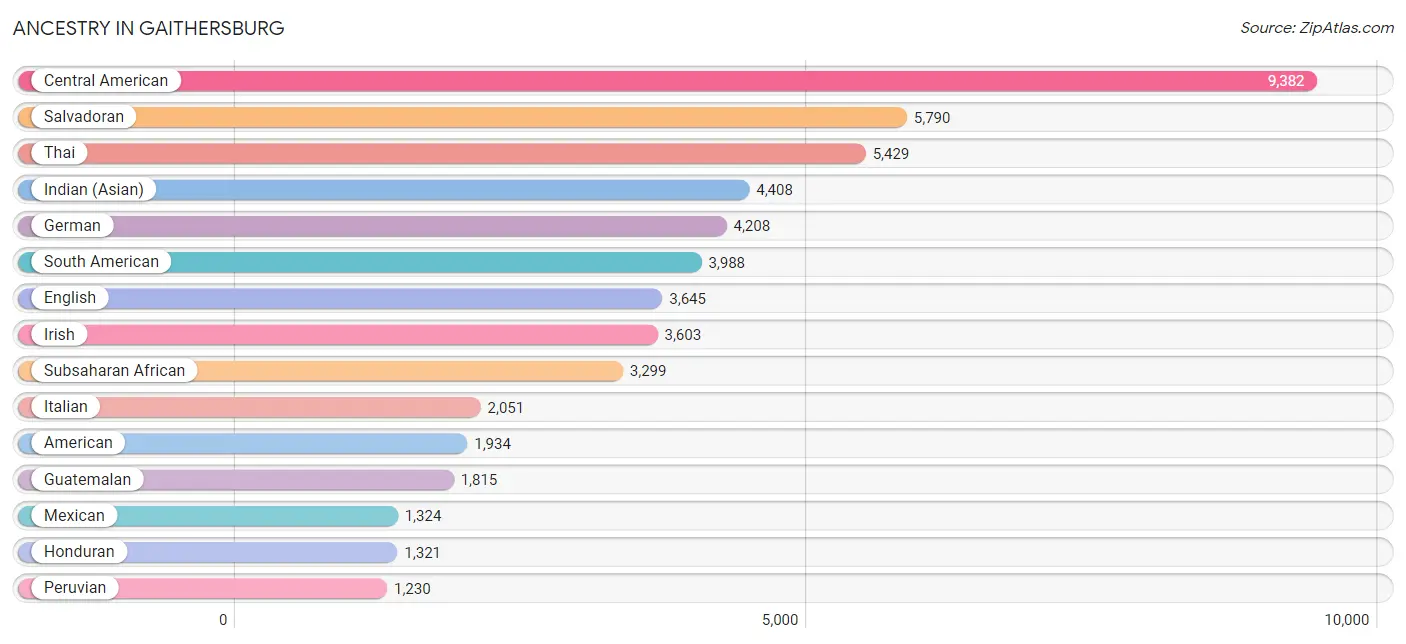
Ancestry in Gaithersburg
The most populous ancestries reported in Gaithersburg are Central American (9,382 | 13.6%), Salvadoran (5,790 | 8.4%), Thai (5,429 | 7.9%), Indian (Asian) (4,408 | 6.4%), and German (4,208 | 6.1%), together accounting for 42.3% of all Gaithersburg residents.
| Ancestry | # Population | % Population |
| Afghan | 43 | 0.1% |
| African | 1,029 | 1.5% |
| Alaska Native | 30 | 0.0% |
| Albanian | 80 | 0.1% |
| American | 1,934 | 2.8% |
| Arab | 444 | 0.6% |
| Argentinean | 65 | 0.1% |
| Armenian | 184 | 0.3% |
| Australian | 79 | 0.1% |
| Austrian | 299 | 0.4% |
| Bahamian | 15 | 0.0% |
| Barbadian | 44 | 0.1% |
| Basque | 2 | 0.0% |
| Belgian | 37 | 0.1% |
| Bhutanese | 520 | 0.7% |
| Bolivian | 655 | 0.9% |
| Brazilian | 1,046 | 1.5% |
| British | 777 | 1.1% |
| British West Indian | 49 | 0.1% |
| Bulgarian | 5 | 0.0% |
| Burmese | 1,196 | 1.7% |
| Cambodian | 230 | 0.3% |
| Canadian | 98 | 0.1% |
| Cape Verdean | 22 | 0.0% |
| Celtic | 8 | 0.0% |
| Central American | 9,382 | 13.6% |
| Central American Indian | 207 | 0.3% |
| Cherokee | 36 | 0.1% |
| Chilean | 94 | 0.1% |
| Choctaw | 19 | 0.0% |
| Colombian | 907 | 1.3% |
| Crow | 2 | 0.0% |
| Cuban | 138 | 0.2% |
| Czech | 210 | 0.3% |
| Czechoslovakian | 31 | 0.0% |
| Danish | 106 | 0.2% |
| Dominican | 446 | 0.6% |
| Dutch | 168 | 0.2% |
| Eastern European | 462 | 0.7% |
| Ecuadorian | 444 | 0.6% |
| Egyptian | 23 | 0.0% |
| English | 3,645 | 5.3% |
| Ethiopian | 233 | 0.3% |
| European | 936 | 1.4% |
| Filipino | 210 | 0.3% |
| Finnish | 20 | 0.0% |
| French | 1,048 | 1.5% |
| French American Indian | 49 | 0.1% |
| French Canadian | 143 | 0.2% |
| German | 4,208 | 6.1% |
| Ghanaian | 332 | 0.5% |
| Greek | 305 | 0.4% |
| Guamanian / Chamorro | 126 | 0.2% |
| Guatemalan | 1,815 | 2.6% |
| Guyanese | 108 | 0.2% |
| Haitian | 155 | 0.2% |
| Honduran | 1,321 | 1.9% |
| Hungarian | 213 | 0.3% |
| Indian (Asian) | 4,408 | 6.4% |
| Indonesian | 132 | 0.2% |
| Iranian | 527 | 0.8% |
| Iraqi | 40 | 0.1% |
| Irish | 3,603 | 5.2% |
| Israeli | 27 | 0.0% |
| Italian | 2,051 | 3.0% |
| Jamaican | 525 | 0.8% |
| Jordanian | 7 | 0.0% |
| Kenyan | 108 | 0.2% |
| Korean | 1,006 | 1.5% |
| Laotian | 67 | 0.1% |
| Latvian | 37 | 0.1% |
| Lebanese | 80 | 0.1% |
| Liberian | 12 | 0.0% |
| Lithuanian | 78 | 0.1% |
| Malaysian | 34 | 0.1% |
| Mexican | 1,324 | 1.9% |
| Mexican American Indian | 40 | 0.1% |
| Mongolian | 16 | 0.0% |
| Moroccan | 74 | 0.1% |
| Native Hawaiian | 146 | 0.2% |
| Nicaraguan | 374 | 0.5% |
| Nigerian | 399 | 0.6% |
| Northern European | 67 | 0.1% |
| Norwegian | 362 | 0.5% |
| Osage | 10 | 0.0% |
| Pakistani | 197 | 0.3% |
| Palestinian | 14 | 0.0% |
| Panamanian | 82 | 0.1% |
| Paraguayan | 1 | 0.0% |
| Peruvian | 1,230 | 1.8% |
| Polish | 1,124 | 1.6% |
| Portuguese | 255 | 0.4% |
| Puerto Rican | 533 | 0.8% |
| Romanian | 397 | 0.6% |
| Russian | 856 | 1.2% |
| Salvadoran | 5,790 | 8.4% |
| Scandinavian | 170 | 0.3% |
| Scotch-Irish | 279 | 0.4% |
| Scottish | 462 | 0.7% |
| Sioux | 1 | 0.0% |
| Slavic | 16 | 0.0% |
| Slovak | 221 | 0.3% |
| Slovene | 31 | 0.0% |
| South African | 11 | 0.0% |
| South American | 3,988 | 5.8% |
| South American Indian | 147 | 0.2% |
| Spaniard | 176 | 0.3% |
| Spanish | 43 | 0.1% |
| Sri Lankan | 942 | 1.4% |
| Subsaharan African | 3,299 | 4.8% |
| Sudanese | 27 | 0.0% |
| Swedish | 313 | 0.4% |
| Swiss | 62 | 0.1% |
| Syrian | 22 | 0.0% |
| Thai | 5,429 | 7.9% |
| Trinidadian and Tobagonian | 185 | 0.3% |
| Turkish | 175 | 0.3% |
| Ugandan | 18 | 0.0% |
| Ukrainian | 422 | 0.6% |
| Uruguayan | 17 | 0.0% |
| Venezuelan | 575 | 0.8% |
| Vietnamese | 123 | 0.2% |
| Welsh | 202 | 0.3% |
| West Indian | 33 | 0.1% |
| Yugoslavian | 48 | 0.1% | View All 125 Rows |
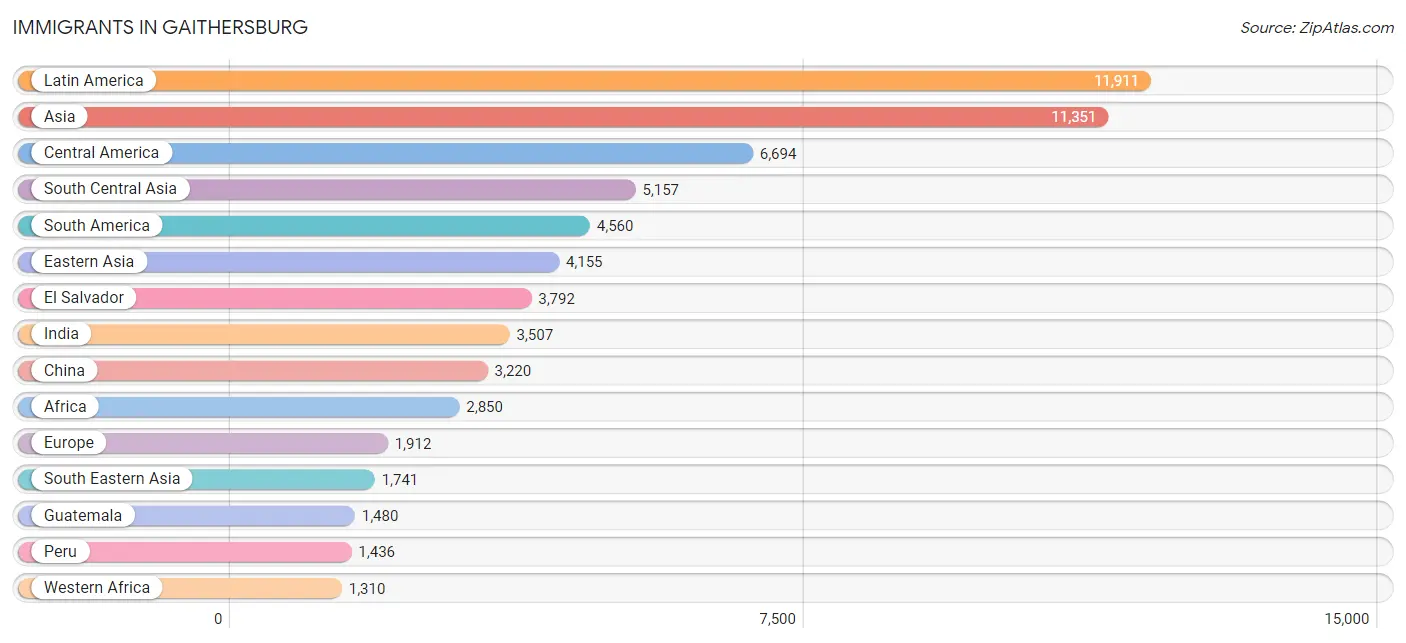
Immigrants in Gaithersburg
The most numerous immigrant groups reported in Gaithersburg came from Latin America (11,911 | 17.3%), Asia (11,351 | 16.5%), Central America (6,694 | 9.7%), South Central Asia (5,157 | 7.5%), and South America (4,560 | 6.6%), together accounting for 57.5% of all Gaithersburg residents.
| Immigration Origin | # Population | % Population |
| Africa | 2,850 | 4.1% |
| Albania | 31 | 0.0% |
| Argentina | 50 | 0.1% |
| Armenia | 42 | 0.1% |
| Asia | 11,351 | 16.5% |
| Australia | 140 | 0.2% |
| Bahamas | 15 | 0.0% |
| Bangladesh | 284 | 0.4% |
| Barbados | 28 | 0.0% |
| Belarus | 91 | 0.1% |
| Belgium | 24 | 0.0% |
| Belize | 5 | 0.0% |
| Bolivia | 356 | 0.5% |
| Bosnia and Herzegovina | 11 | 0.0% |
| Brazil | 885 | 1.3% |
| Bulgaria | 5 | 0.0% |
| Cameroon | 565 | 0.8% |
| Canada | 178 | 0.3% |
| Caribbean | 657 | 0.9% |
| Central America | 6,694 | 9.7% |
| Chile | 88 | 0.1% |
| China | 3,220 | 4.7% |
| Colombia | 719 | 1.0% |
| Congo | 3 | 0.0% |
| Costa Rica | 23 | 0.0% |
| Cuba | 12 | 0.0% |
| Czechoslovakia | 20 | 0.0% |
| Dominica | 25 | 0.0% |
| Dominican Republic | 131 | 0.2% |
| Eastern Africa | 692 | 1.0% |
| Eastern Asia | 4,155 | 6.0% |
| Eastern Europe | 1,146 | 1.7% |
| Ecuador | 364 | 0.5% |
| Egypt | 3 | 0.0% |
| El Salvador | 3,792 | 5.5% |
| England | 81 | 0.1% |
| Eritrea | 7 | 0.0% |
| Ethiopia | 263 | 0.4% |
| Europe | 1,912 | 2.8% |
| Fiji | 7 | 0.0% |
| France | 50 | 0.1% |
| Germany | 180 | 0.3% |
| Ghana | 272 | 0.4% |
| Greece | 9 | 0.0% |
| Grenada | 16 | 0.0% |
| Guatemala | 1,480 | 2.1% |
| Guyana | 50 | 0.1% |
| Haiti | 41 | 0.1% |
| Honduras | 771 | 1.1% |
| Hong Kong | 154 | 0.2% |
| Hungary | 30 | 0.0% |
| India | 3,507 | 5.1% |
| Indonesia | 38 | 0.1% |
| Iran | 434 | 0.6% |
| Iraq | 12 | 0.0% |
| Israel | 44 | 0.1% |
| Italy | 132 | 0.2% |
| Jamaica | 362 | 0.5% |
| Japan | 157 | 0.2% |
| Jordan | 11 | 0.0% |
| Kazakhstan | 60 | 0.1% |
| Kenya | 157 | 0.2% |
| Korea | 689 | 1.0% |
| Laos | 26 | 0.0% |
| Latin America | 11,911 | 17.3% |
| Lebanon | 18 | 0.0% |
| Liberia | 68 | 0.1% |
| Malaysia | 15 | 0.0% |
| Mexico | 486 | 0.7% |
| Middle Africa | 644 | 0.9% |
| Morocco | 59 | 0.1% |
| Nepal | 245 | 0.4% |
| Netherlands | 17 | 0.0% |
| Nicaragua | 117 | 0.2% |
| Nigeria | 200 | 0.3% |
| Northern Africa | 152 | 0.2% |
| Northern Europe | 252 | 0.4% |
| Oceania | 147 | 0.2% |
| Pakistan | 224 | 0.3% |
| Panama | 20 | 0.0% |
| Peru | 1,436 | 2.1% |
| Philippines | 622 | 0.9% |
| Poland | 19 | 0.0% |
| Portugal | 48 | 0.1% |
| Romania | 185 | 0.3% |
| Russia | 430 | 0.6% |
| Senegal | 9 | 0.0% |
| Sierra Leone | 62 | 0.1% |
| Singapore | 6 | 0.0% |
| South Africa | 52 | 0.1% |
| South America | 4,560 | 6.6% |
| South Central Asia | 5,157 | 7.5% |
| South Eastern Asia | 1,741 | 2.5% |
| Southern Europe | 243 | 0.4% |
| Spain | 54 | 0.1% |
| Sri Lanka | 392 | 0.6% |
| Sudan | 27 | 0.0% |
| Sweden | 11 | 0.0% |
| Syria | 6 | 0.0% |
| Taiwan | 431 | 0.6% |
| Thailand | 188 | 0.3% |
| Trinidad and Tobago | 9 | 0.0% |
| Turkey | 86 | 0.1% |
| Uganda | 6 | 0.0% |
| Ukraine | 185 | 0.3% |
| Uruguay | 10 | 0.0% |
| Uzbekistan | 11 | 0.0% |
| Venezuela | 601 | 0.9% |
| Vietnam | 711 | 1.0% |
| Western Africa | 1,310 | 1.9% |
| Western Asia | 261 | 0.4% |
| Western Europe | 271 | 0.4% |
| Zaire | 24 | 0.0% |
| Zimbabwe | 85 | 0.1% | View All 114 Rows |
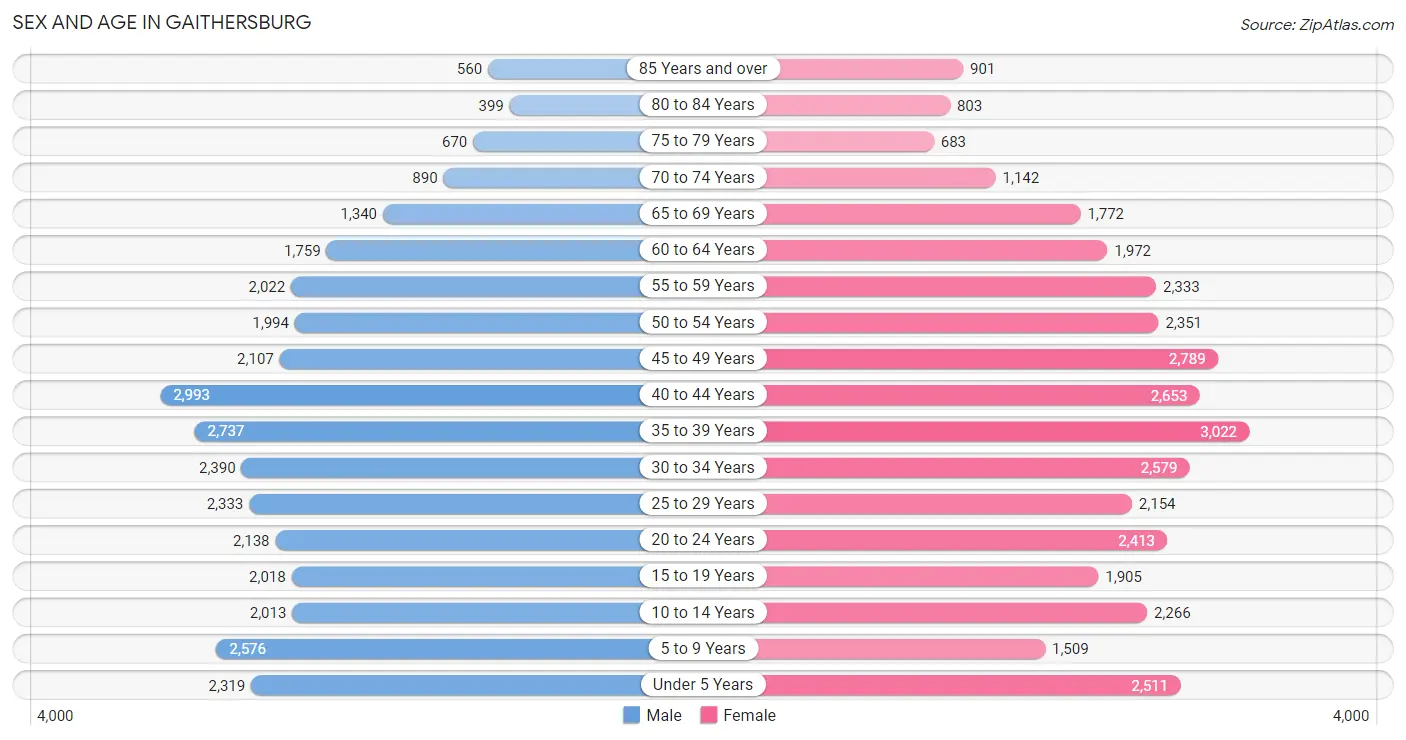
Sex and Age in Gaithersburg
Sex and Age in Gaithersburg
The most populous age groups in Gaithersburg are 40 to 44 Years (2,993 | 9.0%) for men and 35 to 39 Years (3,022 | 8.5%) for women.
| Age Bracket | Male | Female |
| Under 5 Years | 2,319 (7.0%) | 2,511 (7.0%) |
| 5 to 9 Years | 2,576 (7.7%) | 1,509 (4.2%) |
| 10 to 14 Years | 2,013 (6.0%) | 2,266 (6.3%) |
| 15 to 19 Years | 2,018 (6.1%) | 1,905 (5.3%) |
| 20 to 24 Years | 2,138 (6.4%) | 2,413 (6.8%) |
| 25 to 29 Years | 2,333 (7.0%) | 2,154 (6.0%) |
| 30 to 34 Years | 2,390 (7.2%) | 2,579 (7.2%) |
| 35 to 39 Years | 2,737 (8.2%) | 3,022 (8.5%) |
| 40 to 44 Years | 2,993 (9.0%) | 2,653 (7.4%) |
| 45 to 49 Years | 2,107 (6.3%) | 2,789 (7.8%) |
| 50 to 54 Years | 1,994 (6.0%) | 2,351 (6.6%) |
| 55 to 59 Years | 2,022 (6.1%) | 2,333 (6.5%) |
| 60 to 64 Years | 1,759 (5.3%) | 1,972 (5.5%) |
| 65 to 69 Years | 1,340 (4.0%) | 1,772 (5.0%) |
| 70 to 74 Years | 890 (2.7%) | 1,142 (3.2%) |
| 75 to 79 Years | 670 (2.0%) | 683 (1.9%) |
| 80 to 84 Years | 399 (1.2%) | 803 (2.2%) |
| 85 Years and over | 560 (1.7%) | 901 (2.5%) |
| Total | 33,258 (100.0%) | 35,758 (100.0%) |
Families and Households in Gaithersburg
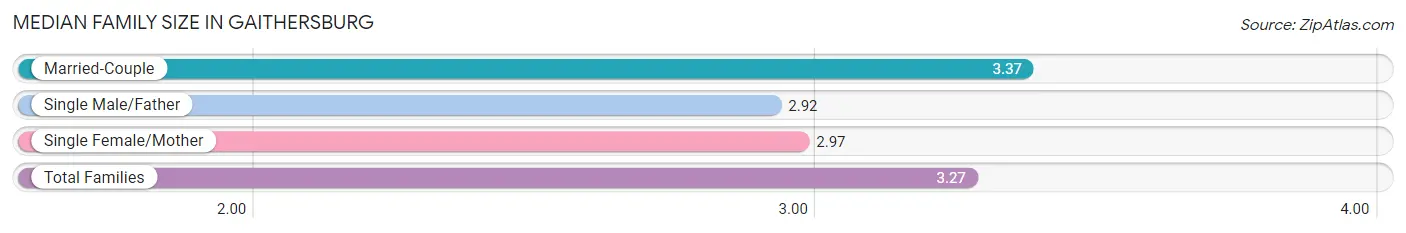
Median Family Size in Gaithersburg
The median family size in Gaithersburg is 3.27 persons per family, with married-couple families (13,006 | 76.6%) accounting for the largest median family size of 3.37 persons per family. On the other hand, single male/father families (957 | 5.6%) represent the smallest median family size with 2.92 persons per family.
| Family Type | # Families | Family Size |
| Married-Couple | 13,006 (76.6%) | 3.37 |
| Single Male/Father | 957 (5.6%) | 2.92 |
| Single Female/Mother | 3,012 (17.7%) | 2.97 |
| Total Families | 16,975 (100.0%) | 3.27 |
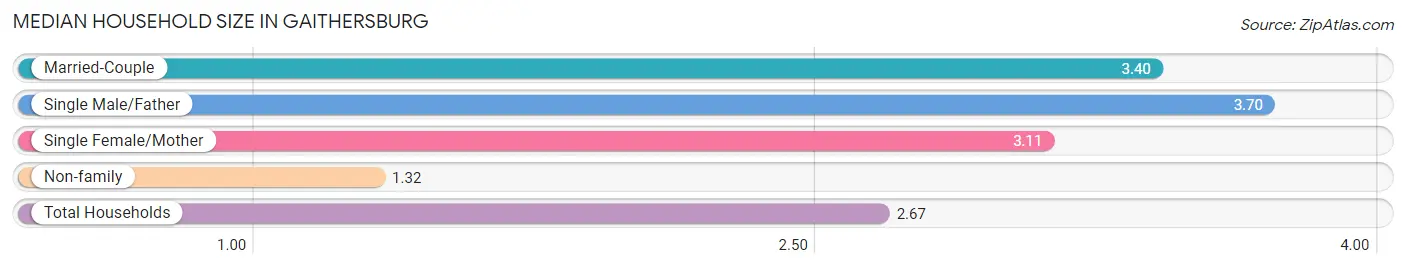
Median Household Size in Gaithersburg
The median household size in Gaithersburg is 2.67 persons per household, with single male/father households (957 | 3.7%) accounting for the largest median household size of 3.7 persons per household. non-family households (8,696 | 33.9%) represent the smallest median household size with 1.32 persons per household.
| Household Type | # Households | Household Size |
| Married-Couple | 13,006 (50.7%) | 3.40 |
| Single Male/Father | 957 (3.7%) | 3.70 |
| Single Female/Mother | 3,012 (11.7%) | 3.11 |
| Non-family | 8,696 (33.9%) | 1.32 |
| Total Households | 25,671 (100.0%) | 2.67 |
Household Size by Marriage Status in Gaithersburg
Out of a total of 25,671 households in Gaithersburg, 16,975 (66.1%) are family households, while 8,696 (33.9%) are nonfamily households. The most numerous type of family households are 2-person households, comprising 6,481, and the most common type of nonfamily households are 1-person households, comprising 6,858.
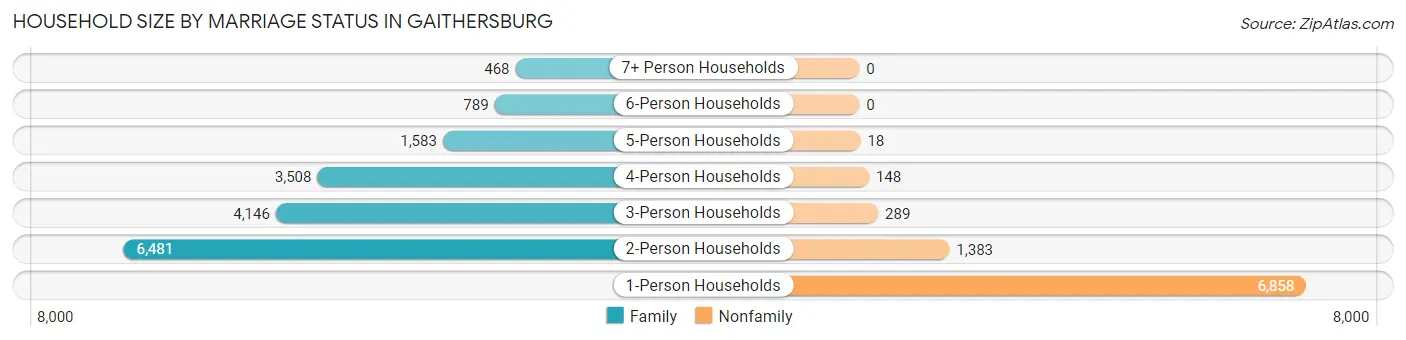
| Household Size | Family Households | Nonfamily Households |
| 1-Person Households | - | 6,858 (26.7%) |
| 2-Person Households | 6,481 (25.3%) | 1,383 (5.4%) |
| 3-Person Households | 4,146 (16.2%) | 289 (1.1%) |
| 4-Person Households | 3,508 (13.7%) | 148 (0.6%) |
| 5-Person Households | 1,583 (6.2%) | 18 (0.1%) |
| 6-Person Households | 789 (3.1%) | 0 (0.0%) |
| 7+ Person Households | 468 (1.8%) | 0 (0.0%) |
| Total | 16,975 (66.1%) | 8,696 (33.9%) |
Female Fertility in Gaithersburg
Fertility by Age in Gaithersburg
Average fertility rate in Gaithersburg is 60.0 births per 1,000 women. Women in the age bracket of 20 to 34 years have the highest fertility rate with 81.0 births per 1,000 women. Women in the age bracket of 20 to 34 years acount for 53.5% of all women with births.
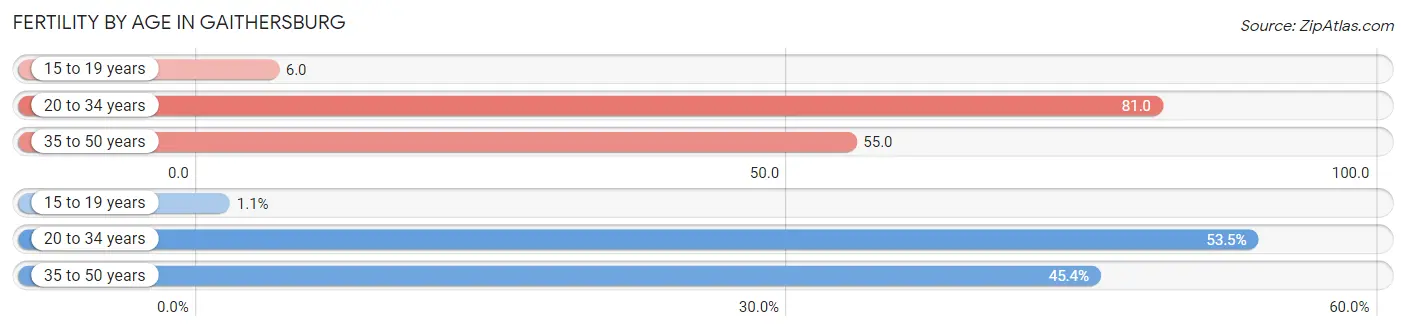
| Age Bracket | Women with Births | Births / 1,000 Women |
| 15 to 19 years | 12 (1.1%) | 6.0 |
| 20 to 34 years | 580 (53.5%) | 81.0 |
| 35 to 50 years | 493 (45.4%) | 55.0 |
| Total | 1,085 (100.0%) | 60.0 |
Fertility by Age by Marriage Status in Gaithersburg
88.1% of women with births (1,085) in Gaithersburg are married. The highest percentage of unmarried women with births falls into 15 to 19 years age bracket with 100.0% of them unmarried at the time of birth, while the lowest percentage of unmarried women with births belong to 35 to 50 years age bracket with 2.8% of them unmarried.
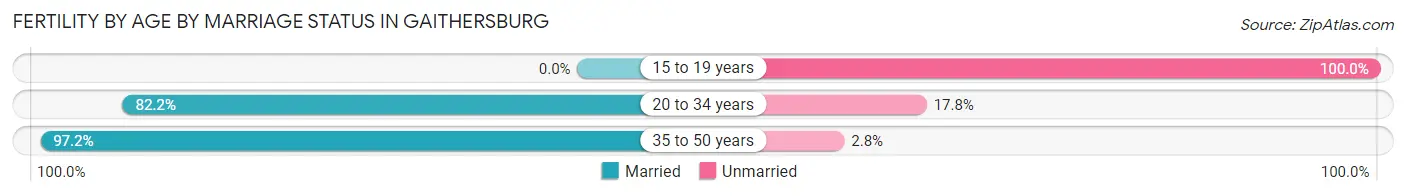
| Age Bracket | Married | Unmarried |
| 15 to 19 years | 0 (0.0%) | 12 (100.0%) |
| 20 to 34 years | 477 (82.2%) | 103 (17.8%) |
| 35 to 50 years | 479 (97.2%) | 14 (2.8%) |
| Total | 956 (88.1%) | 129 (11.9%) |
Fertility by Education in Gaithersburg
Average fertility rate in Gaithersburg is 60.0 births per 1,000 women. Women with the education attainment of graduate degree have the highest fertility rate of 111.0 births per 1,000 women, while women with the education attainment of bachelor's degree have the lowest fertility at 31.0 births per 1,000 women. Women with the education attainment of graduate degree represent 38.9% of all women with births.
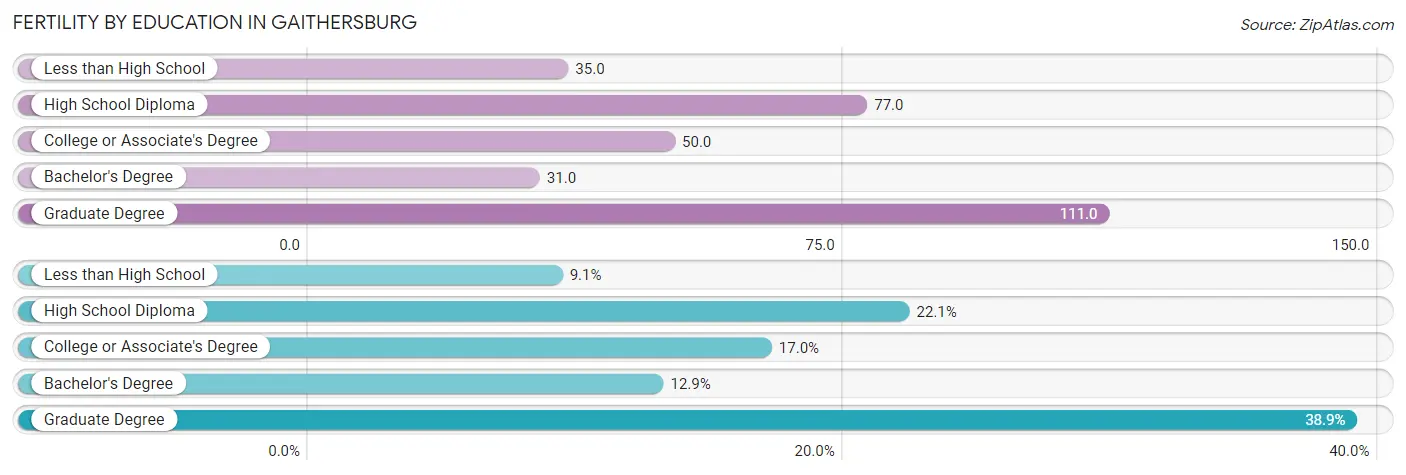
| Educational Attainment | Women with Births | Births / 1,000 Women |
| Less than High School | 99 (9.1%) | 35.0 |
| High School Diploma | 240 (22.1%) | 77.0 |
| College or Associate's Degree | 184 (17.0%) | 50.0 |
| Bachelor's Degree | 140 (12.9%) | 31.0 |
| Graduate Degree | 422 (38.9%) | 111.0 |
| Total | 1,085 (100.0%) | 60.0 |
Fertility by Education by Marriage Status in Gaithersburg
11.9% of women with births in Gaithersburg are unmarried. Women with the educational attainment of less than high school are most likely to be married with 100.0% of them married at childbirth, while women with the educational attainment of high school diploma are least likely to be married with 50.8% of them unmarried at childbirth.
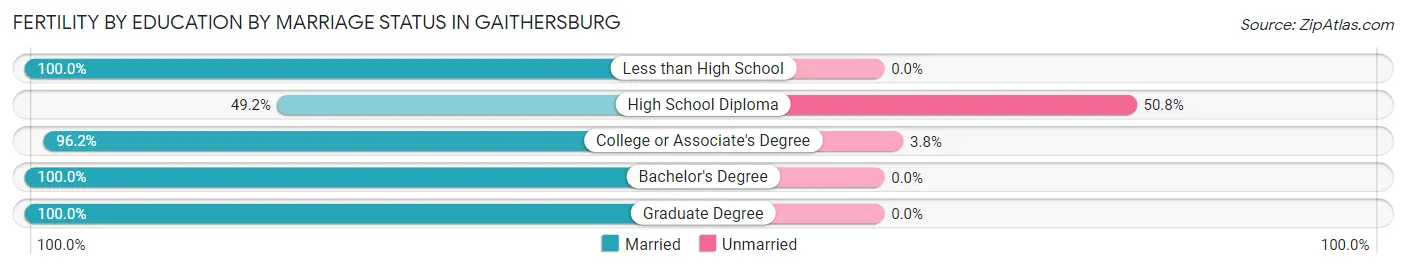
| Educational Attainment | Married | Unmarried |
| Less than High School | 99 (100.0%) | 0 (0.0%) |
| High School Diploma | 118 (49.2%) | 122 (50.8%) |
| College or Associate's Degree | 177 (96.2%) | 7 (3.8%) |
| Bachelor's Degree | 140 (100.0%) | 0 (0.0%) |
| Graduate Degree | 422 (100.0%) | 0 (0.0%) |
| Total | 956 (88.1%) | 129 (11.9%) |
Employment Characteristics in Gaithersburg
Employment by Class of Employer in Gaithersburg
Among the 37,018 employed individuals in Gaithersburg, private company employees (22,712 | 61.4%), federal government employees (4,470 | 12.1%), and not-for-profit organizations (3,314 | 8.9%) make up the most common classes of employment.
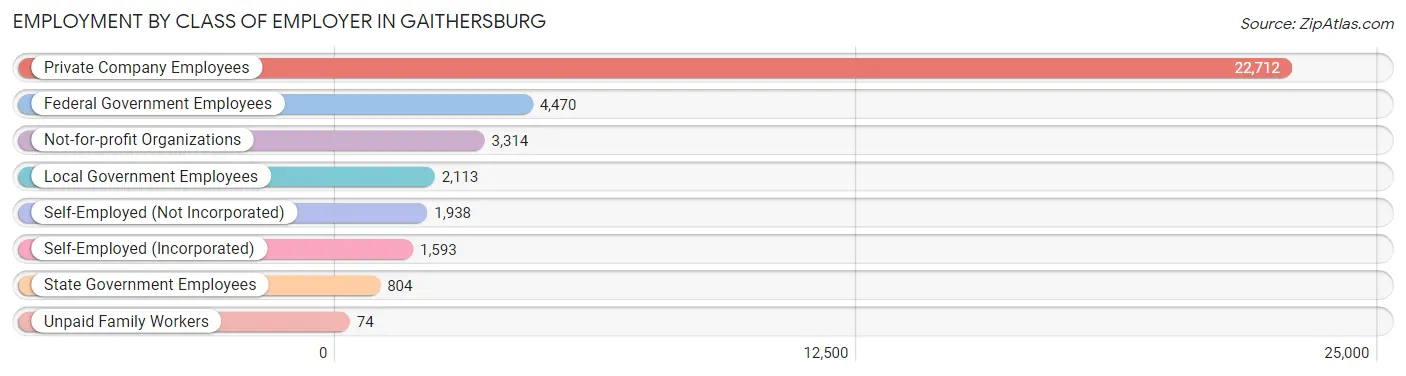
| Employer Class | # Employees | % Employees |
| Private Company Employees | 22,712 | 61.4% |
| Self-Employed (Incorporated) | 1,593 | 4.3% |
| Self-Employed (Not Incorporated) | 1,938 | 5.2% |
| Not-for-profit Organizations | 3,314 | 8.9% |
| Local Government Employees | 2,113 | 5.7% |
| State Government Employees | 804 | 2.2% |
| Federal Government Employees | 4,470 | 12.1% |
| Unpaid Family Workers | 74 | 0.2% |
| Total | 37,018 | 100.0% |
Employment Status by Age in Gaithersburg
According to the labor force statistics for Gaithersburg, out of the total population over 16 years of age (54,927), 73.2% or 40,207 individuals are in the labor force, with 5.5% or 2,211 of them unemployed. The age group with the highest labor force participation rate is 35 to 44 years, with 89.7% or 10,230 individuals in the labor force. Within the labor force, the 16 to 19 years age range has the highest percentage of unemployed individuals, with 15.7% or 195 of them being unemployed.
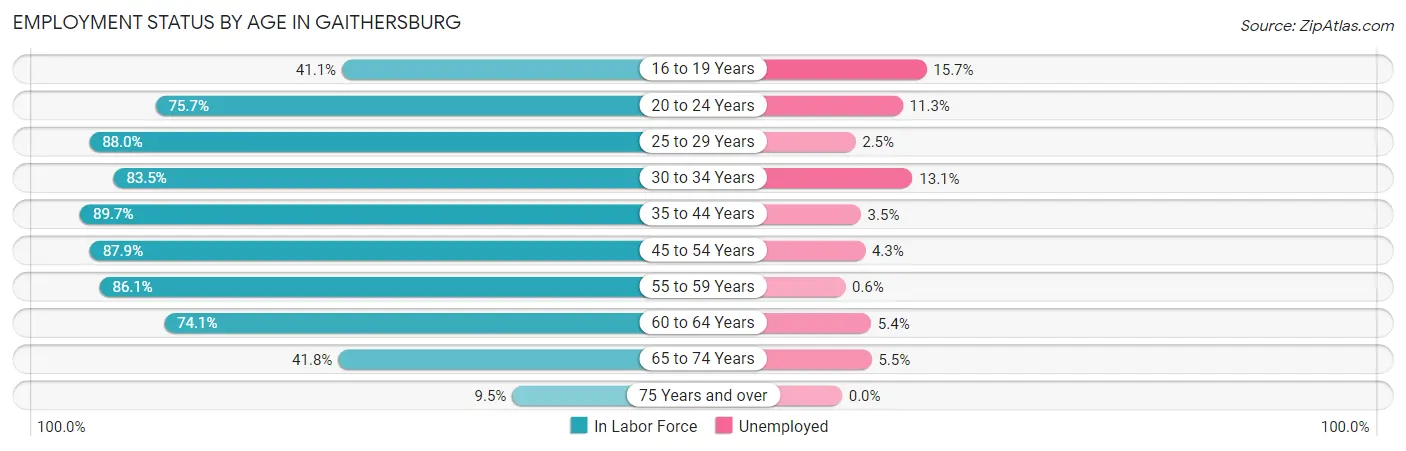
| Age Bracket | In Labor Force | Unemployed |
| 16 to 19 Years | 1,245 (41.1%) | 195 (15.7%) |
| 20 to 24 Years | 3,445 (75.7%) | 389 (11.3%) |
| 25 to 29 Years | 3,949 (88.0%) | 99 (2.5%) |
| 30 to 34 Years | 4,149 (83.5%) | 544 (13.1%) |
| 35 to 44 Years | 10,230 (89.7%) | 358 (3.5%) |
| 45 to 54 Years | 8,123 (87.9%) | 349 (4.3%) |
| 55 to 59 Years | 3,750 (86.1%) | 22 (0.6%) |
| 60 to 64 Years | 2,765 (74.1%) | 149 (5.4%) |
| 65 to 74 Years | 2,150 (41.8%) | 118 (5.5%) |
| 75 Years and over | 382 (9.5%) | 0 (0.0%) |
| Total | 40,207 (73.2%) | 2,211 (5.5%) |
Employment Status by Educational Attainment in Gaithersburg
According to labor force statistics for Gaithersburg, 86.3% of individuals (32,956) out of the total population between 25 and 64 years of age (38,188) are in the labor force, with 4.6% or 1,516 of them being unemployed. The group with the highest labor force participation rate are those with the educational attainment of bachelor's degree or higher, with 90.4% or 18,585 individuals in the labor force. Within the labor force, individuals with college / associate degree education have the highest percentage of unemployment, with 8.3% or 512 of them being unemployed.
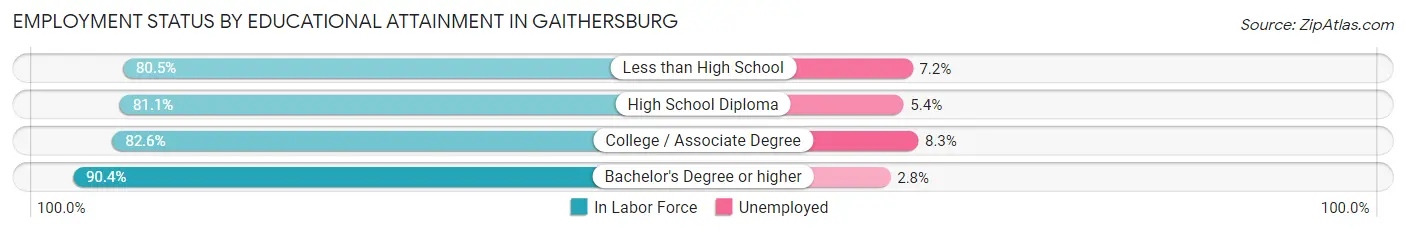
| Educational Attainment | In Labor Force | Unemployed |
| Less than High School | 3,374 (80.5%) | 302 (7.2%) |
| High School Diploma | 4,840 (81.1%) | 322 (5.4%) |
| College / Associate Degree | 6,170 (82.6%) | 620 (8.3%) |
| Bachelor's Degree or higher | 18,585 (90.4%) | 576 (2.8%) |
| Total | 32,956 (86.3%) | 1,757 (4.6%) |
Employment Occupations by Sex in Gaithersburg
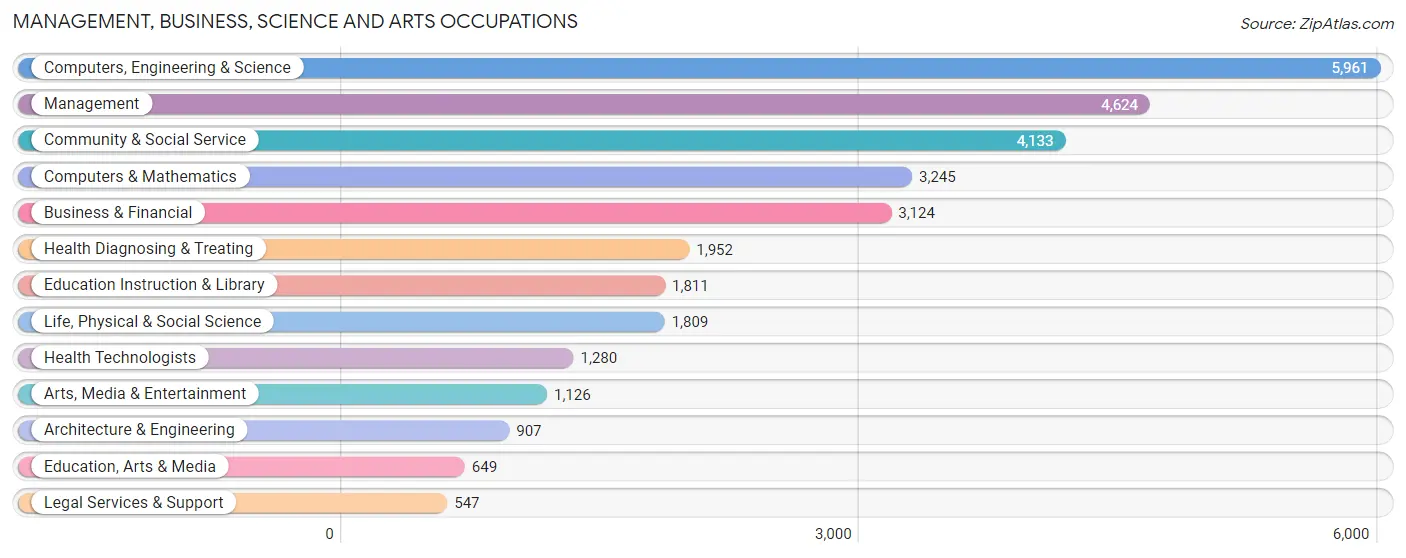
Management, Business, Science and Arts Occupations
The most common Management, Business, Science and Arts occupations in Gaithersburg are Computers, Engineering & Science (5,961 | 15.8%), Management (4,624 | 12.2%), Community & Social Service (4,133 | 10.9%), Computers & Mathematics (3,245 | 8.6%), and Business & Financial (3,124 | 8.3%).
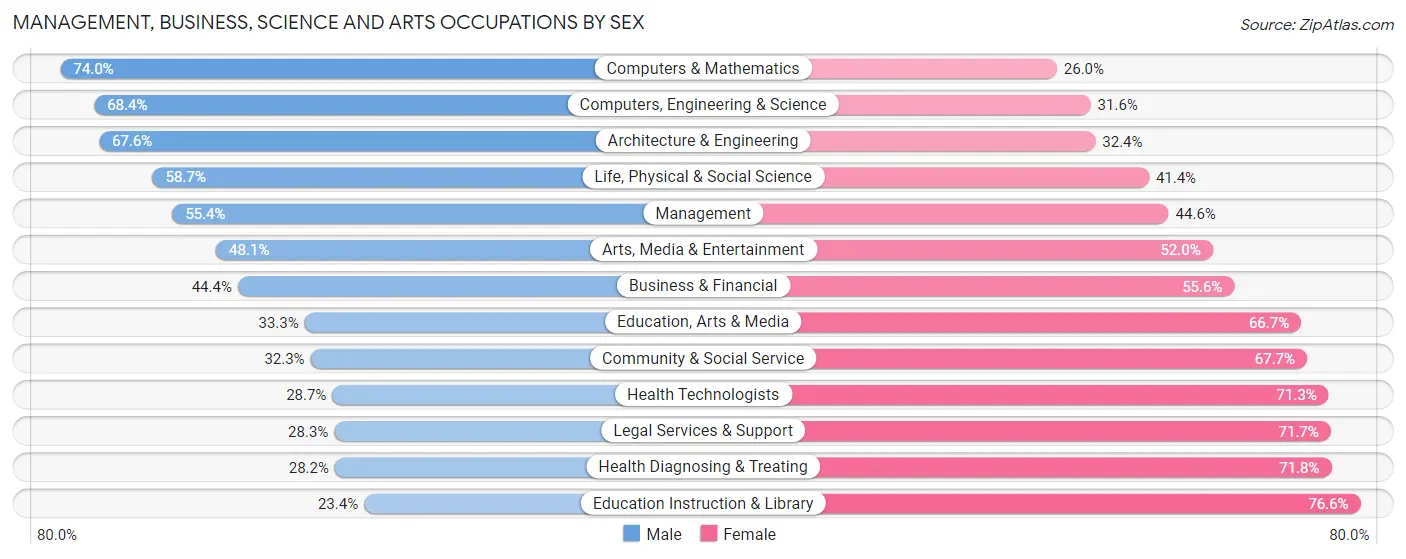
Management, Business, Science and Arts Occupations by Sex
Within the Management, Business, Science and Arts occupations in Gaithersburg, the most male-oriented occupations are Computers & Mathematics (74.0%), Computers, Engineering & Science (68.4%), and Architecture & Engineering (67.6%), while the most female-oriented occupations are Education Instruction & Library (76.6%), Health Diagnosing & Treating (71.8%), and Legal Services & Support (71.7%).
| Occupation | Male | Female |
| Management | 2,560 (55.4%) | 2,064 (44.6%) |
| Business & Financial | 1,388 (44.4%) | 1,736 (55.6%) |
| Computers, Engineering & Science | 4,076 (68.4%) | 1,885 (31.6%) |
| Computers & Mathematics | 2,402 (74.0%) | 843 (26.0%) |
| Architecture & Engineering | 613 (67.6%) | 294 (32.4%) |
| Life, Physical & Social Science | 1,061 (58.7%) | 748 (41.3%) |
| Community & Social Service | 1,335 (32.3%) | 2,798 (67.7%) |
| Education, Arts & Media | 216 (33.3%) | 433 (66.7%) |
| Legal Services & Support | 155 (28.3%) | 392 (71.7%) |
| Education Instruction & Library | 423 (23.4%) | 1,388 (76.6%) |
| Arts, Media & Entertainment | 541 (48.0%) | 585 (51.9%) |
| Health Diagnosing & Treating | 551 (28.2%) | 1,401 (71.8%) |
| Health Technologists | 367 (28.7%) | 913 (71.3%) |
| Total (Category) | 9,910 (50.1%) | 9,884 (49.9%) |
| Total (Overall) | 19,177 (50.8%) | 18,605 (49.2%) |
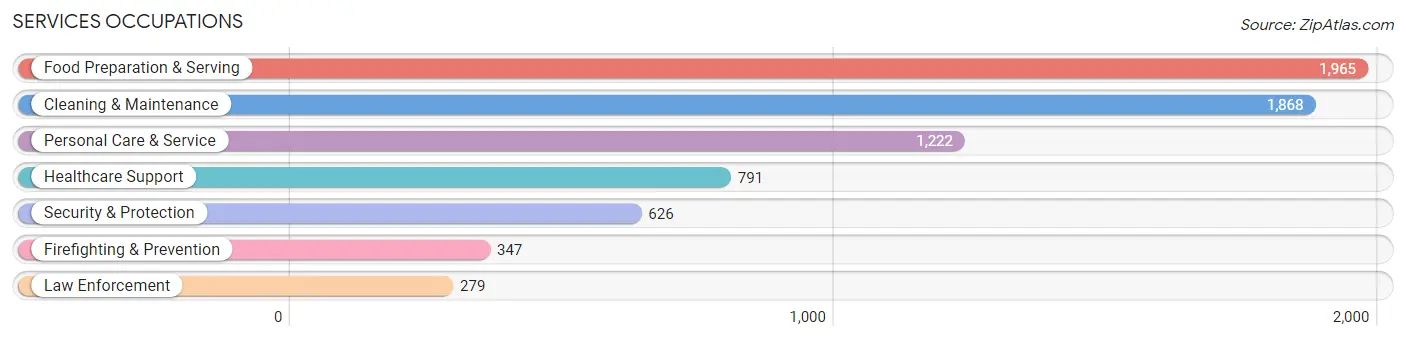
Services Occupations
The most common Services occupations in Gaithersburg are Food Preparation & Serving (1,965 | 5.2%), Cleaning & Maintenance (1,868 | 4.9%), Personal Care & Service (1,222 | 3.2%), Healthcare Support (791 | 2.1%), and Security & Protection (626 | 1.7%).
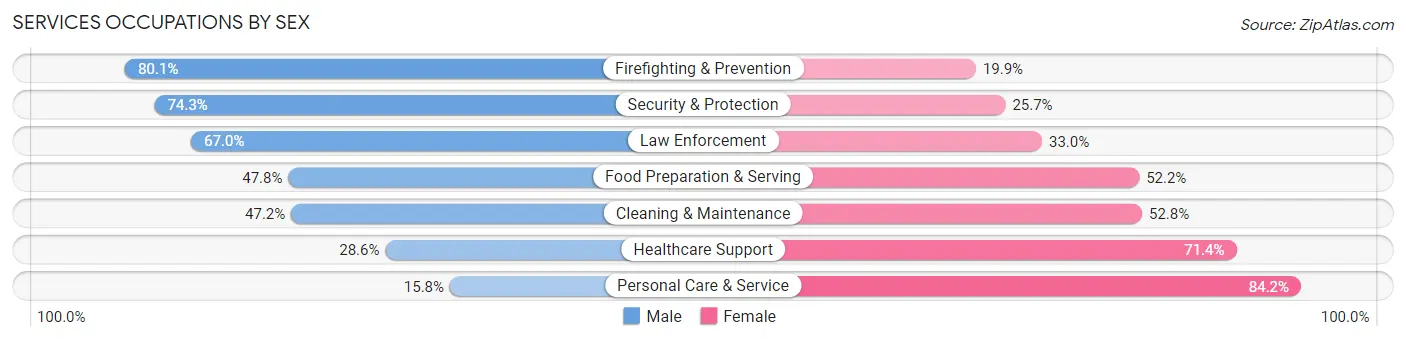
Services Occupations by Sex
Within the Services occupations in Gaithersburg, the most male-oriented occupations are Firefighting & Prevention (80.1%), Security & Protection (74.3%), and Law Enforcement (67.0%), while the most female-oriented occupations are Personal Care & Service (84.2%), Healthcare Support (71.4%), and Cleaning & Maintenance (52.8%).
| Occupation | Male | Female |
| Healthcare Support | 226 (28.6%) | 565 (71.4%) |
| Security & Protection | 465 (74.3%) | 161 (25.7%) |
| Firefighting & Prevention | 278 (80.1%) | 69 (19.9%) |
| Law Enforcement | 187 (67.0%) | 92 (33.0%) |
| Food Preparation & Serving | 939 (47.8%) | 1,026 (52.2%) |
| Cleaning & Maintenance | 882 (47.2%) | 986 (52.8%) |
| Personal Care & Service | 193 (15.8%) | 1,029 (84.2%) |
| Total (Category) | 2,705 (41.8%) | 3,767 (58.2%) |
| Total (Overall) | 19,177 (50.8%) | 18,605 (49.2%) |
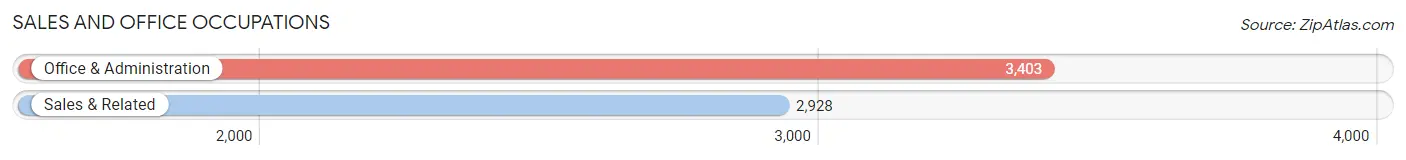
Sales and Office Occupations
The most common Sales and Office occupations in Gaithersburg are Office & Administration (3,403 | 9.0%), and Sales & Related (2,928 | 7.7%).
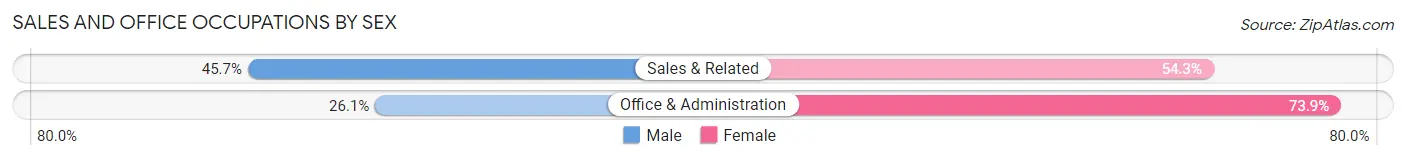
Sales and Office Occupations by Sex
| Occupation | Male | Female |
| Sales & Related | 1,337 (45.7%) | 1,591 (54.3%) |
| Office & Administration | 887 (26.1%) | 2,516 (73.9%) |
| Total (Category) | 2,224 (35.1%) | 4,107 (64.9%) |
| Total (Overall) | 19,177 (50.8%) | 18,605 (49.2%) |
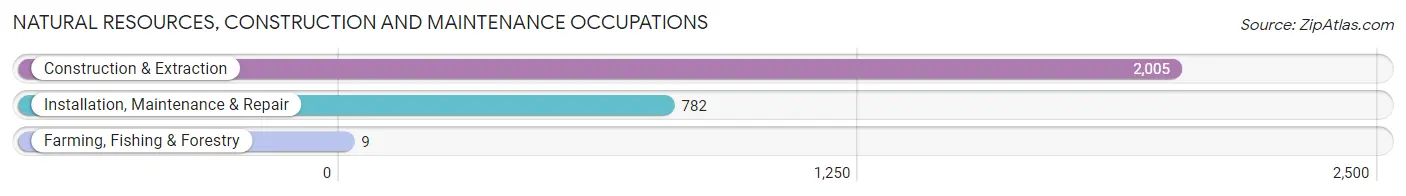
Natural Resources, Construction and Maintenance Occupations
The most common Natural Resources, Construction and Maintenance occupations in Gaithersburg are Construction & Extraction (2,005 | 5.3%), Installation, Maintenance & Repair (782 | 2.1%), and Farming, Fishing & Forestry (9 | 0.0%).
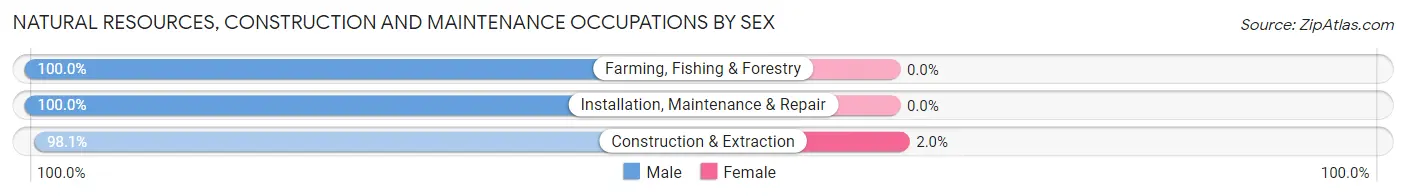
Natural Resources, Construction and Maintenance Occupations by Sex
| Occupation | Male | Female |
| Farming, Fishing & Forestry | 9 (100.0%) | 0 (0.0%) |
| Construction & Extraction | 1,966 (98.1%) | 39 (1.9%) |
| Installation, Maintenance & Repair | 782 (100.0%) | 0 (0.0%) |
| Total (Category) | 2,757 (98.6%) | 39 (1.4%) |
| Total (Overall) | 19,177 (50.8%) | 18,605 (49.2%) |
Production, Transportation and Moving Occupations
The most common Production, Transportation and Moving occupations in Gaithersburg are Production (1,021 | 2.7%), Transportation (971 | 2.6%), and Material Moving (397 | 1.1%).
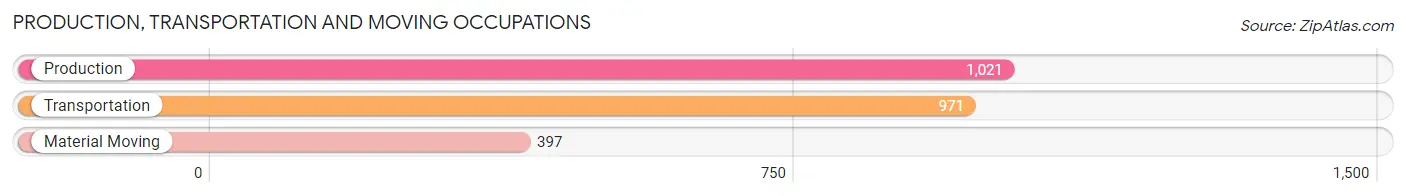
Production, Transportation and Moving Occupations by Sex
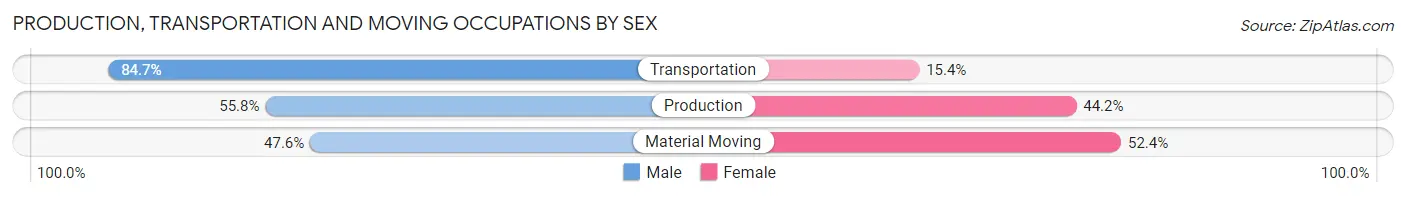
| Occupation | Male | Female |
| Production | 570 (55.8%) | 451 (44.2%) |
| Transportation | 822 (84.7%) | 149 (15.3%) |
| Material Moving | 189 (47.6%) | 208 (52.4%) |
| Total (Category) | 1,581 (66.2%) | 808 (33.8%) |
| Total (Overall) | 19,177 (50.8%) | 18,605 (49.2%) |
Employment Industries by Sex in Gaithersburg
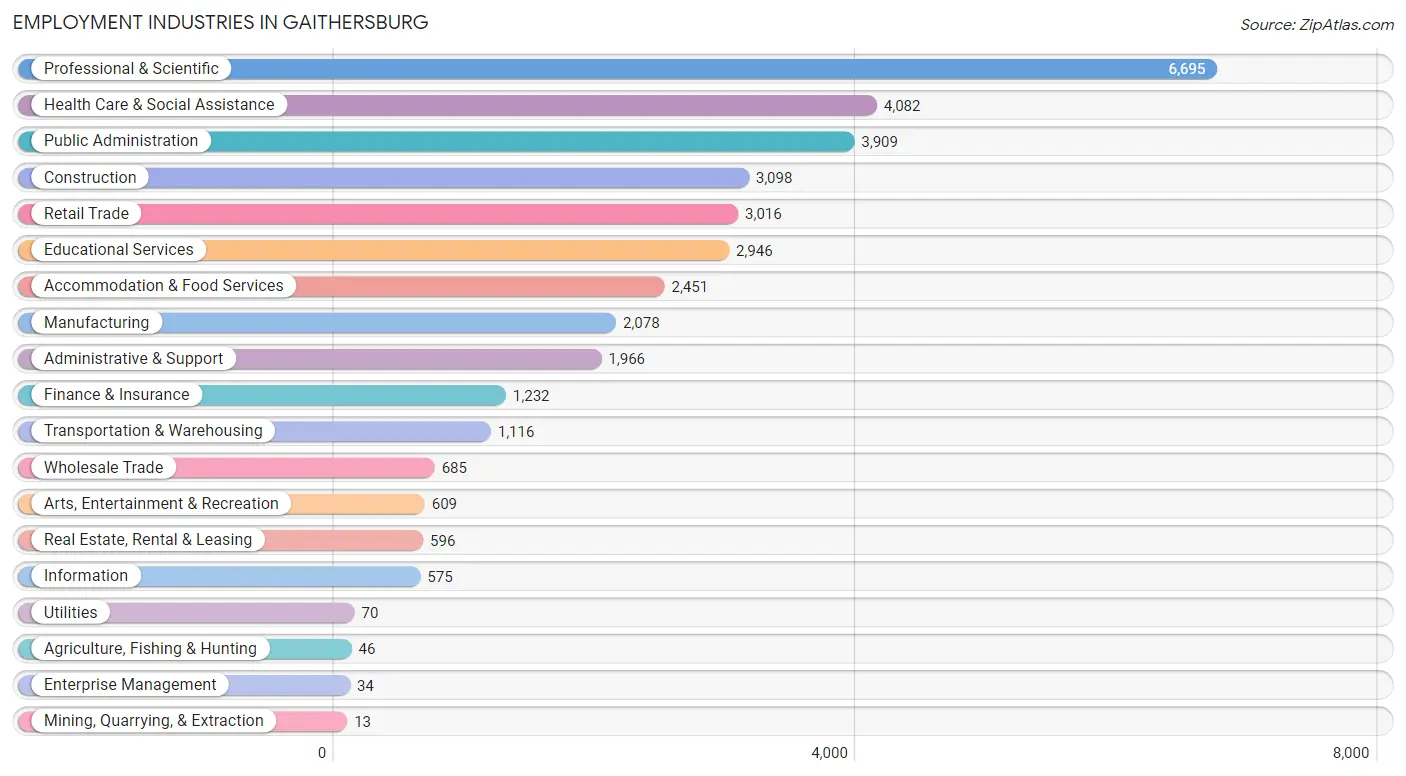
Employment Industries in Gaithersburg
The major employment industries in Gaithersburg include Professional & Scientific (6,695 | 17.7%), Health Care & Social Assistance (4,082 | 10.8%), Public Administration (3,909 | 10.3%), Construction (3,098 | 8.2%), and Retail Trade (3,016 | 8.0%).
Employment Industries by Sex in Gaithersburg
The Gaithersburg industries that see more men than women are Utilities (100.0%), Construction (88.2%), and Wholesale Trade (71.8%), whereas the industries that tend to have a higher number of women are Mining, Quarrying, & Extraction (100.0%), Agriculture, Fishing & Hunting (80.4%), and Health Care & Social Assistance (76.5%).
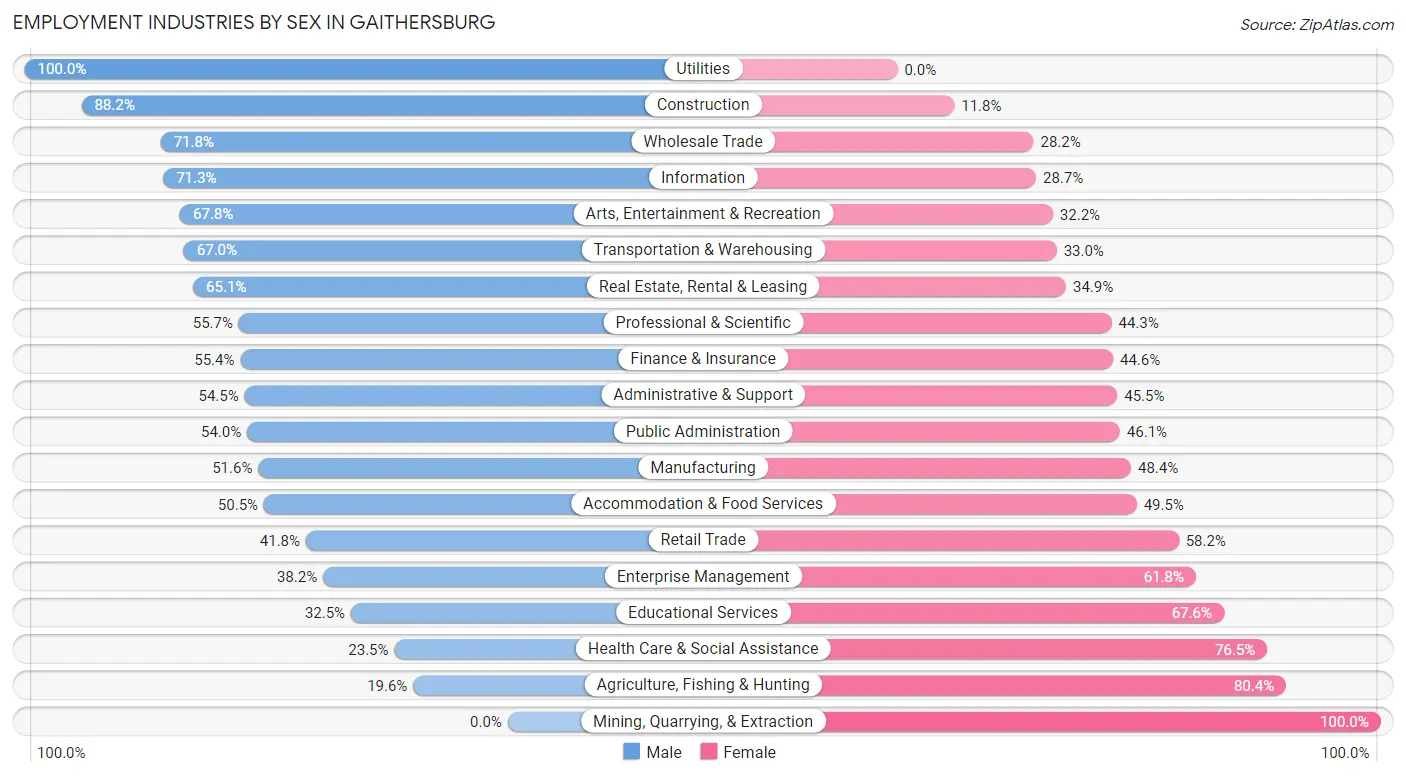
| Industry | Male | Female |
| Agriculture, Fishing & Hunting | 9 (19.6%) | 37 (80.4%) |
| Mining, Quarrying, & Extraction | 0 (0.0%) | 13 (100.0%) |
| Construction | 2,733 (88.2%) | 365 (11.8%) |
| Manufacturing | 1,073 (51.6%) | 1,005 (48.4%) |
| Wholesale Trade | 492 (71.8%) | 193 (28.2%) |
| Retail Trade | 1,260 (41.8%) | 1,756 (58.2%) |
| Transportation & Warehousing | 748 (67.0%) | 368 (33.0%) |
| Utilities | 70 (100.0%) | 0 (0.0%) |
| Information | 410 (71.3%) | 165 (28.7%) |
| Finance & Insurance | 682 (55.4%) | 550 (44.6%) |
| Real Estate, Rental & Leasing | 388 (65.1%) | 208 (34.9%) |
| Professional & Scientific | 3,727 (55.7%) | 2,968 (44.3%) |
| Enterprise Management | 13 (38.2%) | 21 (61.8%) |
| Administrative & Support | 1,071 (54.5%) | 895 (45.5%) |
| Educational Services | 956 (32.5%) | 1,990 (67.5%) |
| Health Care & Social Assistance | 958 (23.5%) | 3,124 (76.5%) |
| Arts, Entertainment & Recreation | 413 (67.8%) | 196 (32.2%) |
| Accommodation & Food Services | 1,237 (50.5%) | 1,214 (49.5%) |
| Public Administration | 2,109 (53.9%) | 1,800 (46.1%) |
| Total | 19,177 (50.8%) | 18,605 (49.2%) |
Education in Gaithersburg
School Enrollment in Gaithersburg
The most common levels of schooling among the 16,275 students in Gaithersburg are college / undergraduate (3,731 | 22.9%), elementary school (3,478 | 21.4%), and high school (3,362 | 20.7%).
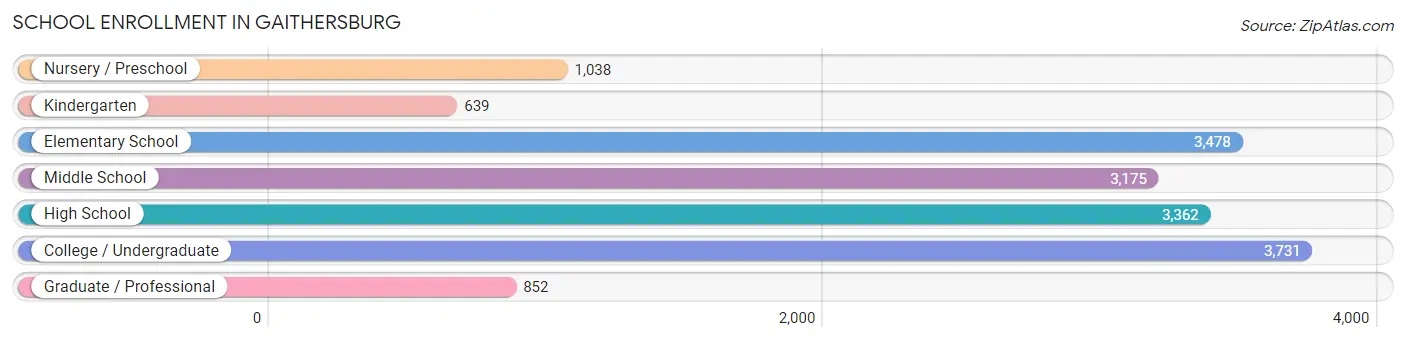
| School Level | # Students | % Students |
| Nursery / Preschool | 1,038 | 6.4% |
| Kindergarten | 639 | 3.9% |
| Elementary School | 3,478 | 21.4% |
| Middle School | 3,175 | 19.5% |
| High School | 3,362 | 20.7% |
| College / Undergraduate | 3,731 | 22.9% |
| Graduate / Professional | 852 | 5.2% |
| Total | 16,275 | 100.0% |
School Enrollment by Age by Funding Source in Gaithersburg
Out of a total of 16,275 students who are enrolled in schools in Gaithersburg, 2,360 (14.5%) attend a private institution, while the remaining 13,915 (85.5%) are enrolled in public schools. The age group of 3 to 4 year olds has the highest likelihood of being enrolled in private schools, with 462 (69.8% in the age bracket) enrolled. Conversely, the age group of 10 to 14 year olds has the lowest likelihood of being enrolled in a private school, with 4,019 (95.4% in the age bracket) attending a public institution.
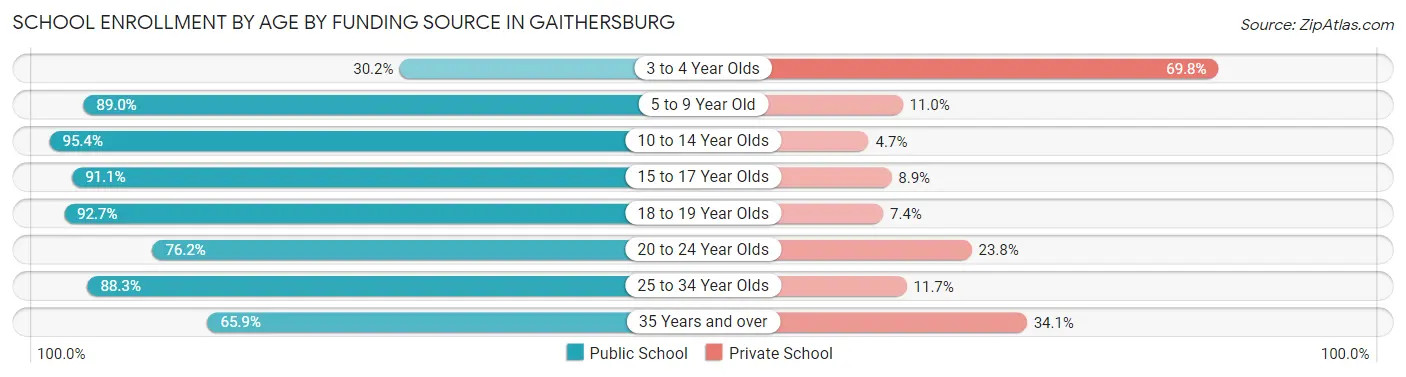
| Age Bracket | Public School | Private School |
| 3 to 4 Year Olds | 200 (30.2%) | 462 (69.8%) |
| 5 to 9 Year Old | 3,453 (89.0%) | 425 (11.0%) |
| 10 to 14 Year Olds | 4,019 (95.4%) | 196 (4.6%) |
| 15 to 17 Year Olds | 2,051 (91.1%) | 200 (8.9%) |
| 18 to 19 Year Olds | 1,047 (92.6%) | 83 (7.3%) |
| 20 to 24 Year Olds | 1,420 (76.2%) | 444 (23.8%) |
| 25 to 34 Year Olds | 874 (88.3%) | 116 (11.7%) |
| 35 Years and over | 847 (65.9%) | 438 (34.1%) |
| Total | 13,915 (85.5%) | 2,360 (14.5%) |
Educational Attainment by Field of Study in Gaithersburg
Business (4,212 | 15.2%), engineering (2,900 | 10.4%), computers & mathematics (2,850 | 10.3%), science & technology (2,541 | 9.1%), and social sciences (2,362 | 8.5%) are the most common fields of study among 27,761 individuals in Gaithersburg who have obtained a bachelor's degree or higher.
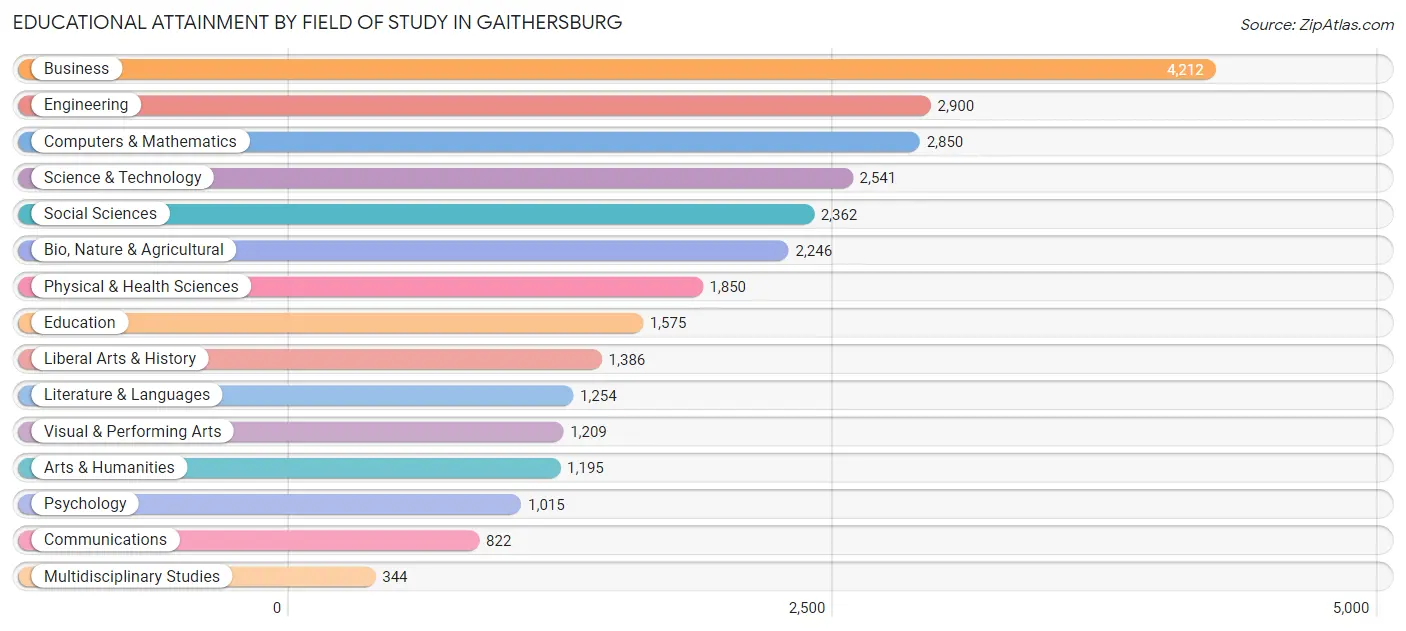
| Field of Study | # Graduates | % Graduates |
| Computers & Mathematics | 2,850 | 10.3% |
| Bio, Nature & Agricultural | 2,246 | 8.1% |
| Physical & Health Sciences | 1,850 | 6.7% |
| Psychology | 1,015 | 3.7% |
| Social Sciences | 2,362 | 8.5% |
| Engineering | 2,900 | 10.4% |
| Multidisciplinary Studies | 344 | 1.2% |
| Science & Technology | 2,541 | 9.1% |
| Business | 4,212 | 15.2% |
| Education | 1,575 | 5.7% |
| Literature & Languages | 1,254 | 4.5% |
| Liberal Arts & History | 1,386 | 5.0% |
| Visual & Performing Arts | 1,209 | 4.4% |
| Communications | 822 | 3.0% |
| Arts & Humanities | 1,195 | 4.3% |
| Total | 27,761 | 100.0% |
Transportation & Commute in Gaithersburg
Vehicle Availability by Sex in Gaithersburg
The most prevalent vehicle ownership categories in Gaithersburg are males with 2 vehicles (8,198, accounting for 43.7%) and females with 2 vehicles (7,706, making up 45.0%).
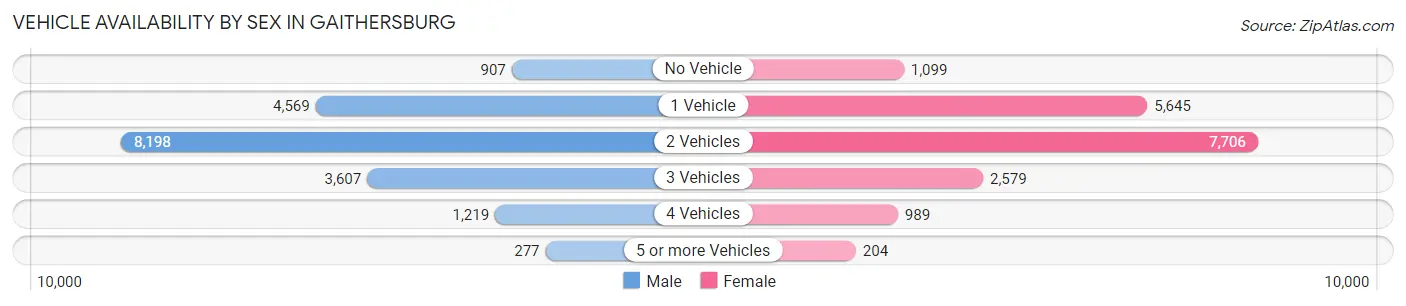
| Vehicles Available | Male | Female |
| No Vehicle | 907 (4.8%) | 1,099 (6.0%) |
| 1 Vehicle | 4,569 (24.3%) | 5,645 (31.0%) |
| 2 Vehicles | 8,198 (43.7%) | 7,706 (42.3%) |
| 3 Vehicles | 3,607 (19.2%) | 2,579 (14.1%) |
| 4 Vehicles | 1,219 (6.5%) | 989 (5.4%) |
| 5 or more Vehicles | 277 (1.5%) | 204 (1.1%) |
| Total | 18,777 (100.0%) | 18,222 (100.0%) |
Commute Time in Gaithersburg
The most frequently occuring commute durations in Gaithersburg are 15 to 19 minutes (4,062 commuters, 13.7%), 30 to 34 minutes (4,016 commuters, 13.5%), and 10 to 14 minutes (3,906 commuters, 13.2%).
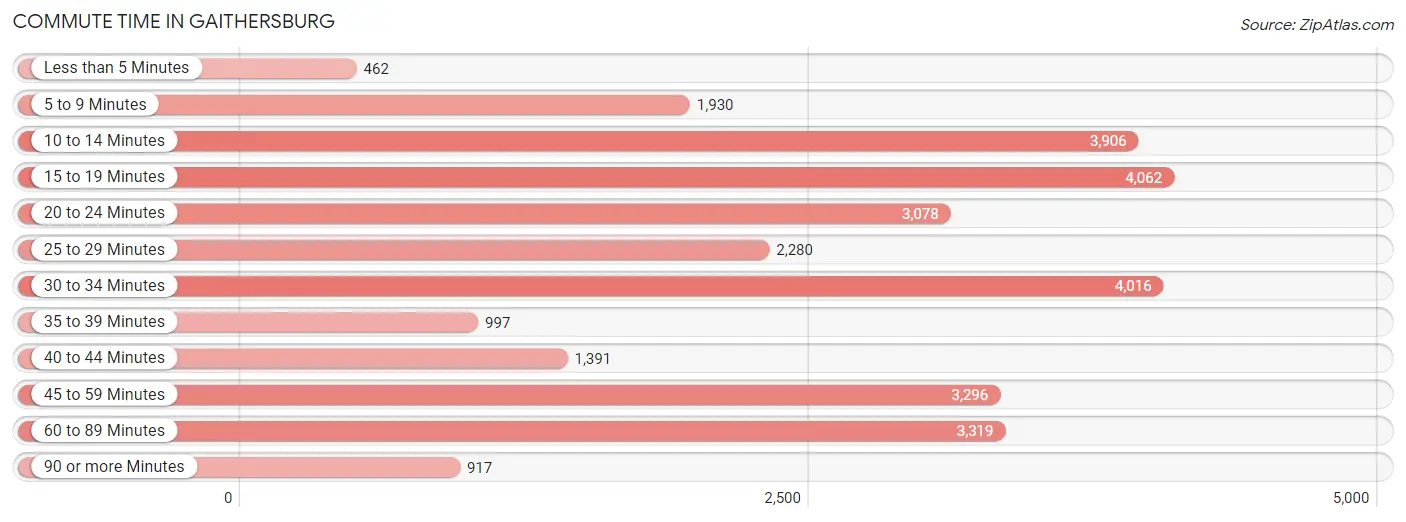
| Commute Time | # Commuters | % Commuters |
| Less than 5 Minutes | 462 | 1.6% |
| 5 to 9 Minutes | 1,930 | 6.5% |
| 10 to 14 Minutes | 3,906 | 13.2% |
| 15 to 19 Minutes | 4,062 | 13.7% |
| 20 to 24 Minutes | 3,078 | 10.4% |
| 25 to 29 Minutes | 2,280 | 7.7% |
| 30 to 34 Minutes | 4,016 | 13.5% |
| 35 to 39 Minutes | 997 | 3.4% |
| 40 to 44 Minutes | 1,391 | 4.7% |
| 45 to 59 Minutes | 3,296 | 11.1% |
| 60 to 89 Minutes | 3,319 | 11.2% |
| 90 or more Minutes | 917 | 3.1% |
Commute Time by Sex in Gaithersburg
The most common commute times in Gaithersburg are 30 to 34 minutes (2,016 commuters, 13.3%) for males and 10 to 14 minutes (2,302 commuters, 15.9%) for females.
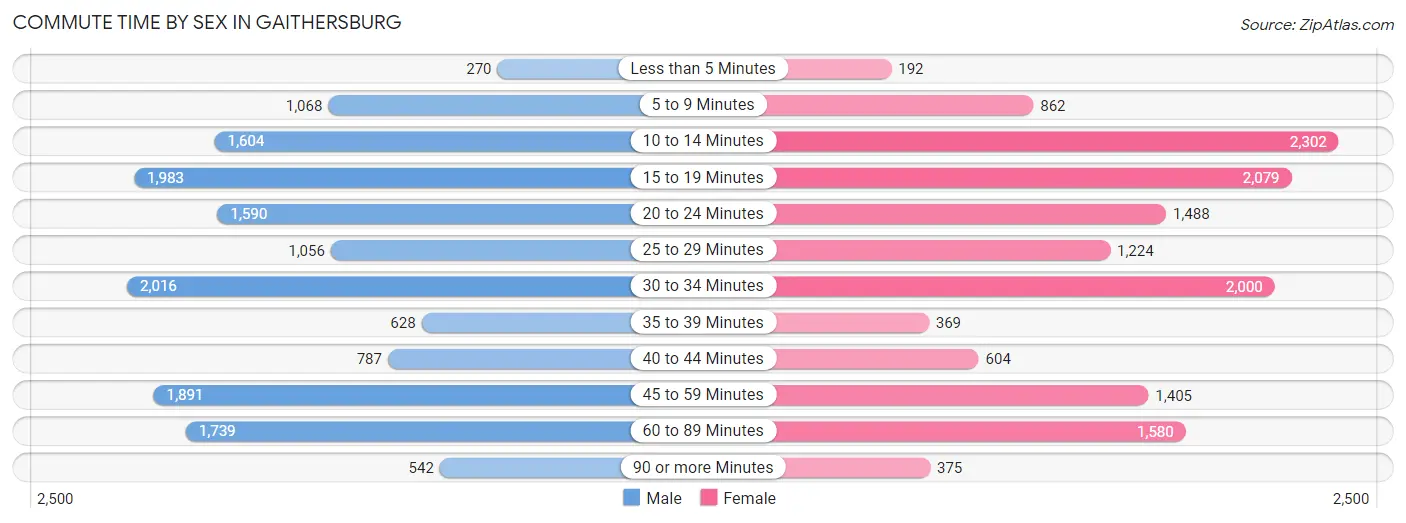
| Commute Time | Male | Female |
| Less than 5 Minutes | 270 (1.8%) | 192 (1.3%) |
| 5 to 9 Minutes | 1,068 (7.0%) | 862 (5.9%) |
| 10 to 14 Minutes | 1,604 (10.6%) | 2,302 (15.9%) |
| 15 to 19 Minutes | 1,983 (13.1%) | 2,079 (14.4%) |
| 20 to 24 Minutes | 1,590 (10.5%) | 1,488 (10.3%) |
| 25 to 29 Minutes | 1,056 (7.0%) | 1,224 (8.5%) |
| 30 to 34 Minutes | 2,016 (13.3%) | 2,000 (13.8%) |
| 35 to 39 Minutes | 628 (4.1%) | 369 (2.5%) |
| 40 to 44 Minutes | 787 (5.2%) | 604 (4.2%) |
| 45 to 59 Minutes | 1,891 (12.5%) | 1,405 (9.7%) |
| 60 to 89 Minutes | 1,739 (11.5%) | 1,580 (10.9%) |
| 90 or more Minutes | 542 (3.6%) | 375 (2.6%) |
Time of Departure to Work by Sex in Gaithersburg
The most frequent times of departure to work in Gaithersburg are 7:00 AM to 7:29 AM (2,188, 14.4%) for males and 7:00 AM to 7:29 AM (2,267, 15.7%) for females.
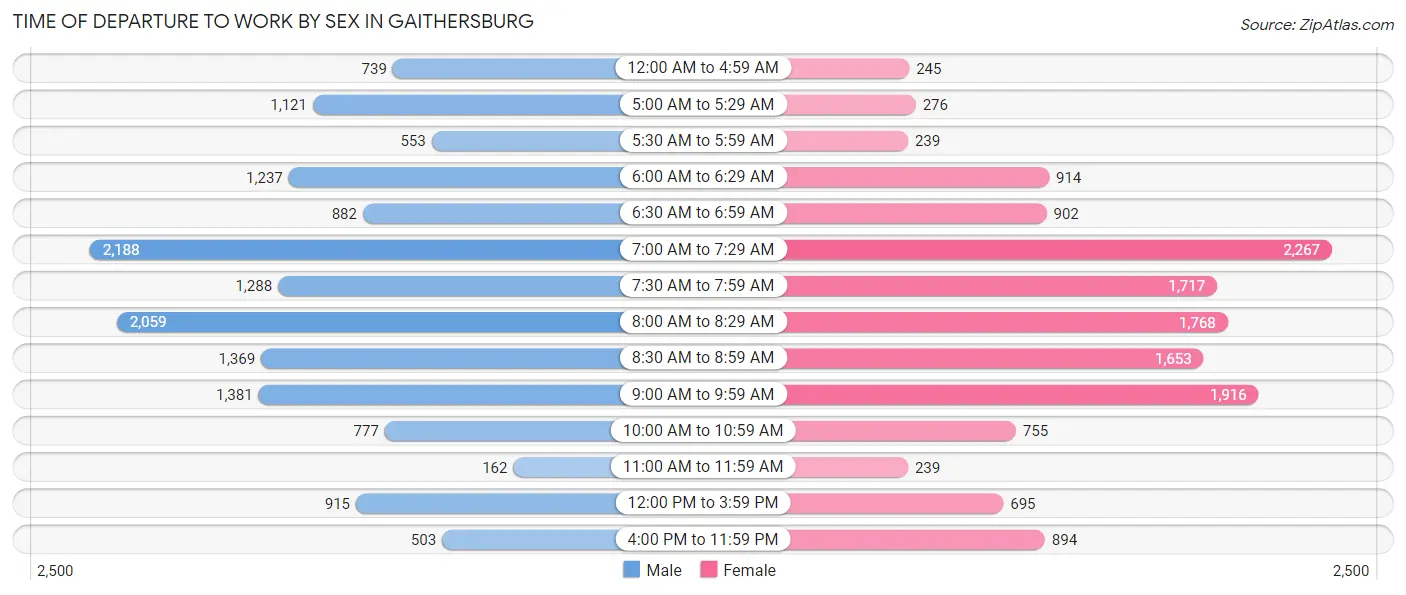
| Time of Departure | Male | Female |
| 12:00 AM to 4:59 AM | 739 (4.9%) | 245 (1.7%) |
| 5:00 AM to 5:29 AM | 1,121 (7.4%) | 276 (1.9%) |
| 5:30 AM to 5:59 AM | 553 (3.6%) | 239 (1.7%) |
| 6:00 AM to 6:29 AM | 1,237 (8.2%) | 914 (6.3%) |
| 6:30 AM to 6:59 AM | 882 (5.8%) | 902 (6.2%) |
| 7:00 AM to 7:29 AM | 2,188 (14.4%) | 2,267 (15.7%) |
| 7:30 AM to 7:59 AM | 1,288 (8.5%) | 1,717 (11.9%) |
| 8:00 AM to 8:29 AM | 2,059 (13.6%) | 1,768 (12.2%) |
| 8:30 AM to 8:59 AM | 1,369 (9.0%) | 1,653 (11.4%) |
| 9:00 AM to 9:59 AM | 1,381 (9.1%) | 1,916 (13.2%) |
| 10:00 AM to 10:59 AM | 777 (5.1%) | 755 (5.2%) |
| 11:00 AM to 11:59 AM | 162 (1.1%) | 239 (1.7%) |
| 12:00 PM to 3:59 PM | 915 (6.0%) | 695 (4.8%) |
| 4:00 PM to 11:59 PM | 503 (3.3%) | 894 (6.2%) |
| Total | 15,174 (100.0%) | 14,480 (100.0%) |
Housing Occupancy in Gaithersburg
Occupancy by Ownership in Gaithersburg
Of the total 25,671 dwellings in Gaithersburg, owner-occupied units account for 13,105 (51.0%), while renter-occupied units make up 12,566 (48.9%).
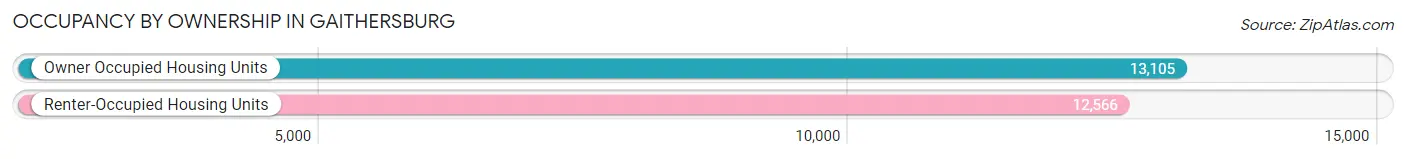
| Occupancy | # Housing Units | % Housing Units |
| Owner Occupied Housing Units | 13,105 | 51.0% |
| Renter-Occupied Housing Units | 12,566 | 48.9% |
| Total Occupied Housing Units | 25,671 | 100.0% |
Occupancy by Household Size in Gaithersburg
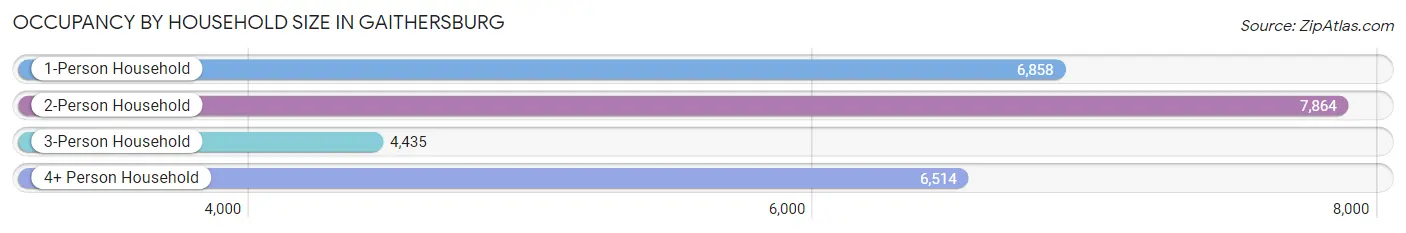
| Household Size | # Housing Units | % Housing Units |
| 1-Person Household | 6,858 | 26.7% |
| 2-Person Household | 7,864 | 30.6% |
| 3-Person Household | 4,435 | 17.3% |
| 4+ Person Household | 6,514 | 25.4% |
| Total Housing Units | 25,671 | 100.0% |
Occupancy by Ownership by Household Size in Gaithersburg
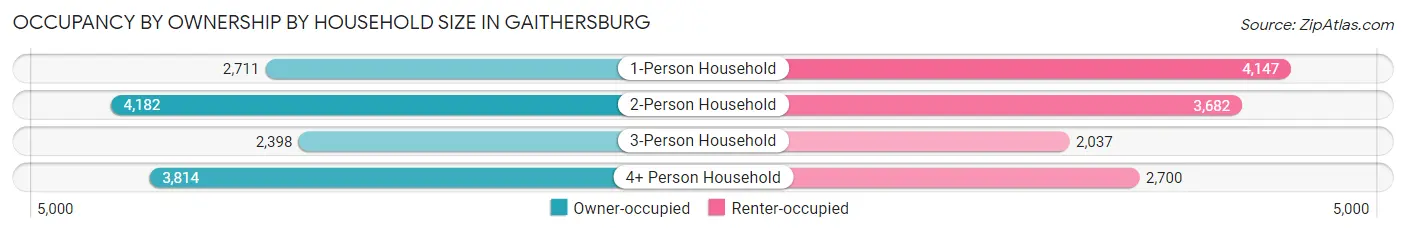
| Household Size | Owner-occupied | Renter-occupied |
| 1-Person Household | 2,711 (39.5%) | 4,147 (60.5%) |
| 2-Person Household | 4,182 (53.2%) | 3,682 (46.8%) |
| 3-Person Household | 2,398 (54.1%) | 2,037 (45.9%) |
| 4+ Person Household | 3,814 (58.6%) | 2,700 (41.4%) |
| Total Housing Units | 13,105 (51.0%) | 12,566 (48.9%) |
Occupancy by Educational Attainment in Gaithersburg
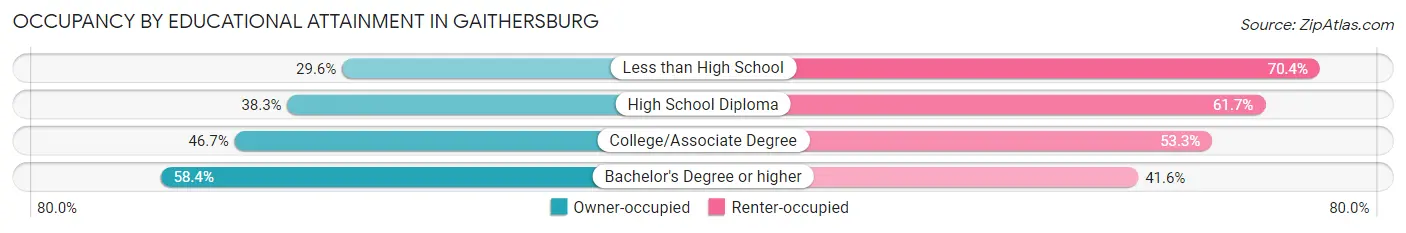
| Household Size | Owner-occupied | Renter-occupied |
| Less than High School | 660 (29.6%) | 1,567 (70.4%) |
| High School Diploma | 1,218 (38.3%) | 1,961 (61.7%) |
| College/Associate Degree | 2,453 (46.7%) | 2,799 (53.3%) |
| Bachelor's Degree or higher | 8,774 (58.4%) | 6,239 (41.6%) |
Occupancy by Age of Householder in Gaithersburg
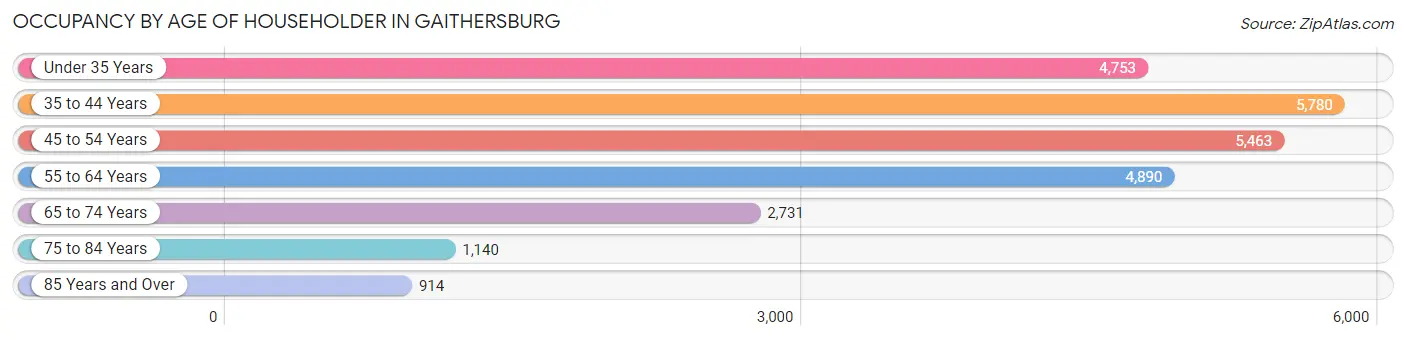
| Age Bracket | # Households | % Households |
| Under 35 Years | 4,753 | 18.5% |
| 35 to 44 Years | 5,780 | 22.5% |
| 45 to 54 Years | 5,463 | 21.3% |
| 55 to 64 Years | 4,890 | 19.1% |
| 65 to 74 Years | 2,731 | 10.6% |
| 75 to 84 Years | 1,140 | 4.4% |
| 85 Years and Over | 914 | 3.6% |
| Total | 25,671 | 100.0% |
Housing Finances in Gaithersburg
Median Income by Occupancy in Gaithersburg
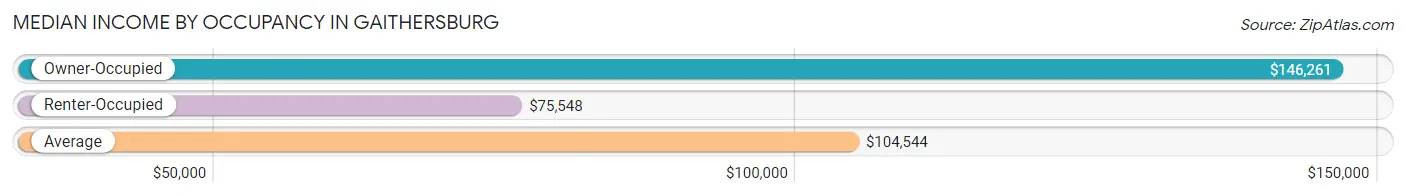
| Occupancy Type | # Households | Median Income |
| Owner-Occupied | 13,105 (51.0%) | $146,261 |
| Renter-Occupied | 12,566 (48.9%) | $75,548 |
| Average | 25,671 (100.0%) | $104,544 |
Occupancy by Householder Income Bracket in Gaithersburg
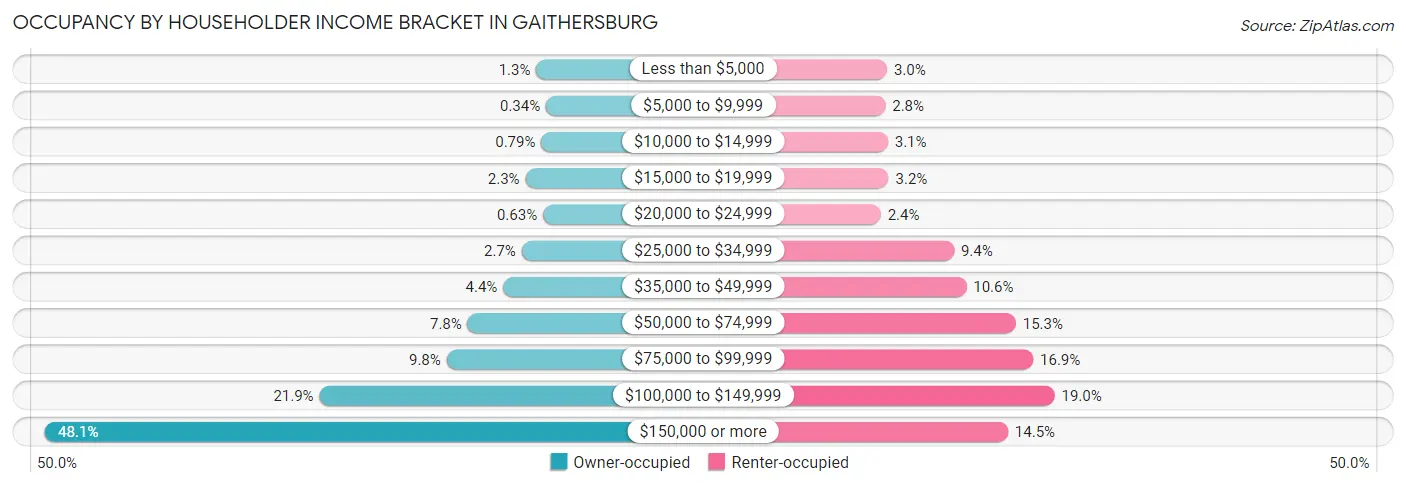
| Income Bracket | Owner-occupied | Renter-occupied |
| Less than $5,000 | 166 (1.3%) | 376 (3.0%) |
| $5,000 to $9,999 | 45 (0.3%) | 356 (2.8%) |
| $10,000 to $14,999 | 104 (0.8%) | 386 (3.1%) |
| $15,000 to $19,999 | 301 (2.3%) | 396 (3.2%) |
| $20,000 to $24,999 | 82 (0.6%) | 302 (2.4%) |
| $25,000 to $34,999 | 349 (2.7%) | 1,177 (9.4%) |
| $35,000 to $49,999 | 579 (4.4%) | 1,326 (10.5%) |
| $50,000 to $74,999 | 1,023 (7.8%) | 1,918 (15.3%) |
| $75,000 to $99,999 | 1,286 (9.8%) | 2,125 (16.9%) |
| $100,000 to $149,999 | 2,873 (21.9%) | 2,381 (19.0%) |
| $150,000 or more | 6,297 (48.0%) | 1,823 (14.5%) |
| Total | 13,105 (100.0%) | 12,566 (100.0%) |
Monthly Housing Cost Tiers in Gaithersburg
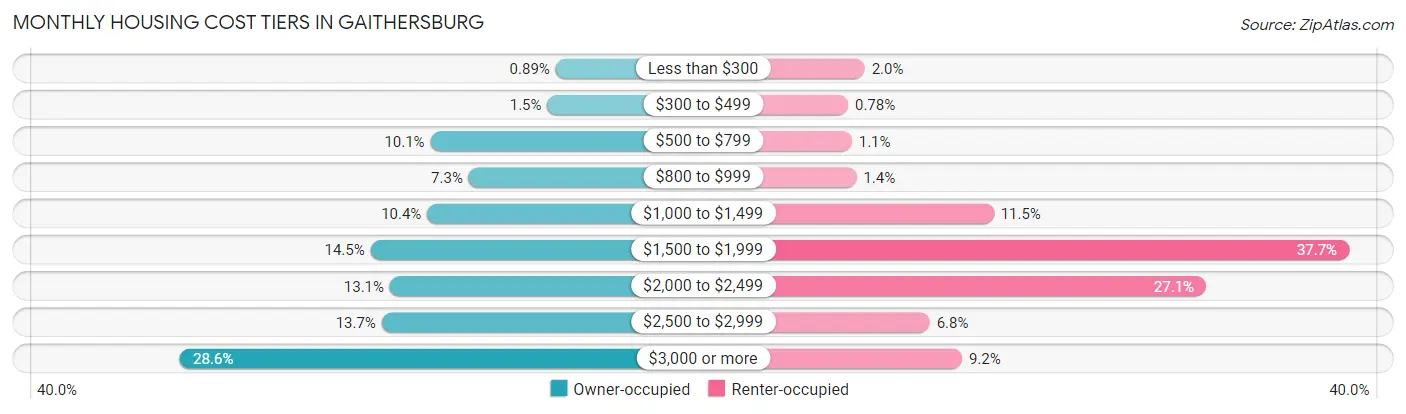
| Monthly Cost | Owner-occupied | Renter-occupied |
| Less than $300 | 116 (0.9%) | 253 (2.0%) |
| $300 to $499 | 196 (1.5%) | 98 (0.8%) |
| $500 to $799 | 1,325 (10.1%) | 133 (1.1%) |
| $800 to $999 | 955 (7.3%) | 176 (1.4%) |
| $1,000 to $1,499 | 1,356 (10.3%) | 1,446 (11.5%) |
| $1,500 to $1,999 | 1,903 (14.5%) | 4,733 (37.7%) |
| $2,000 to $2,499 | 1,717 (13.1%) | 3,410 (27.1%) |
| $2,500 to $2,999 | 1,795 (13.7%) | 854 (6.8%) |
| $3,000 or more | 3,742 (28.5%) | 1,154 (9.2%) |
| Total | 13,105 (100.0%) | 12,566 (100.0%) |
Physical Housing Characteristics in Gaithersburg
Housing Structures in Gaithersburg
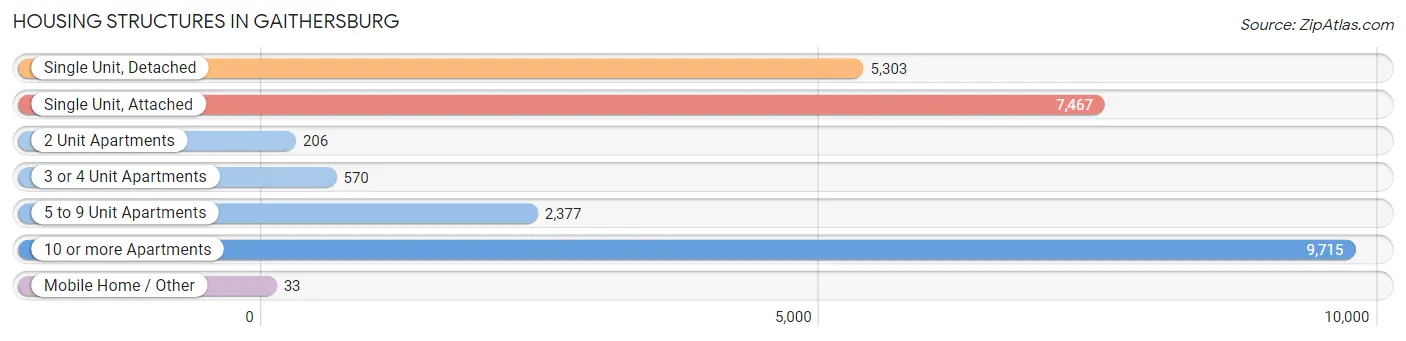
| Structure Type | # Housing Units | % Housing Units |
| Single Unit, Detached | 5,303 | 20.7% |
| Single Unit, Attached | 7,467 | 29.1% |
| 2 Unit Apartments | 206 | 0.8% |
| 3 or 4 Unit Apartments | 570 | 2.2% |
| 5 to 9 Unit Apartments | 2,377 | 9.3% |
| 10 or more Apartments | 9,715 | 37.8% |
| Mobile Home / Other | 33 | 0.1% |
| Total | 25,671 | 100.0% |
Housing Structures by Occupancy in Gaithersburg
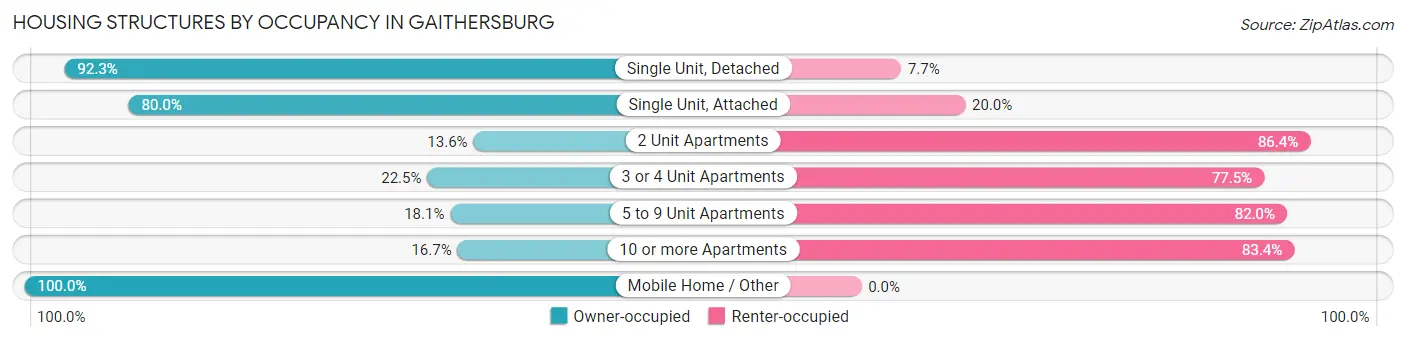
| Structure Type | Owner-occupied | Renter-occupied |
| Single Unit, Detached | 4,896 (92.3%) | 407 (7.7%) |
| Single Unit, Attached | 5,973 (80.0%) | 1,494 (20.0%) |
| 2 Unit Apartments | 28 (13.6%) | 178 (86.4%) |
| 3 or 4 Unit Apartments | 128 (22.5%) | 442 (77.5%) |
| 5 to 9 Unit Apartments | 429 (18.0%) | 1,948 (82.0%) |
| 10 or more Apartments | 1,618 (16.7%) | 8,097 (83.4%) |
| Mobile Home / Other | 33 (100.0%) | 0 (0.0%) |
| Total | 13,105 (51.0%) | 12,566 (48.9%) |
Housing Structures by Number of Rooms in Gaithersburg
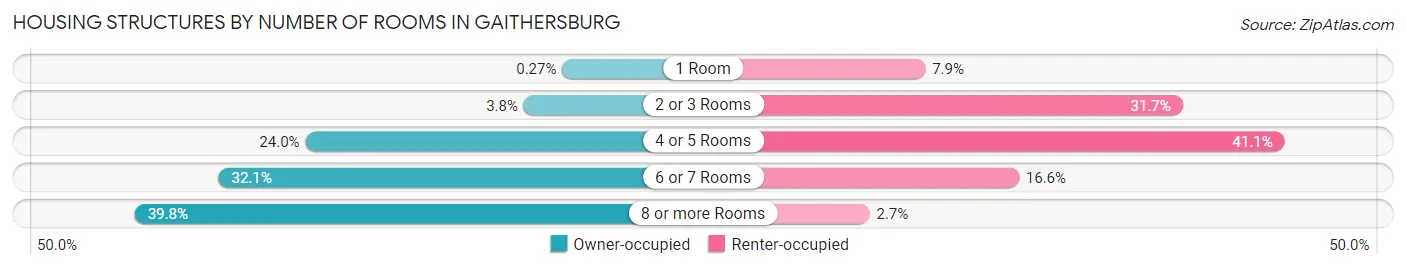
| Number of Rooms | Owner-occupied | Renter-occupied |
| 1 Room | 35 (0.3%) | 991 (7.9%) |
| 2 or 3 Rooms | 502 (3.8%) | 3,982 (31.7%) |
| 4 or 5 Rooms | 3,149 (24.0%) | 5,169 (41.1%) |
| 6 or 7 Rooms | 4,202 (32.1%) | 2,080 (16.6%) |
| 8 or more Rooms | 5,217 (39.8%) | 344 (2.7%) |
| Total | 13,105 (100.0%) | 12,566 (100.0%) |
Housing Structure by Heating Type in Gaithersburg
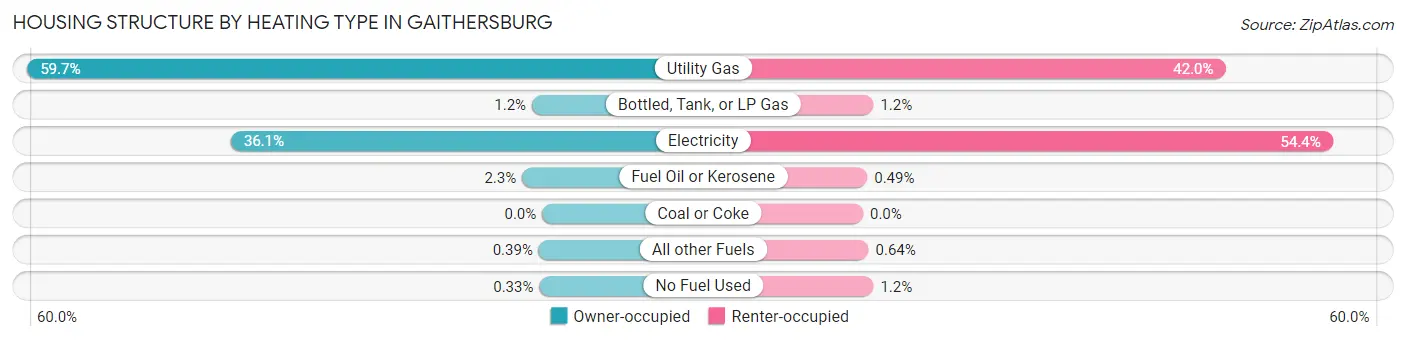
| Heating Type | Owner-occupied | Renter-occupied |
| Utility Gas | 7,822 (59.7%) | 5,278 (42.0%) |
| Bottled, Tank, or LP Gas | 154 (1.2%) | 152 (1.2%) |
| Electricity | 4,729 (36.1%) | 6,841 (54.4%) |
| Fuel Oil or Kerosene | 306 (2.3%) | 62 (0.5%) |
| Coal or Coke | 0 (0.0%) | 0 (0.0%) |
| All other Fuels | 51 (0.4%) | 81 (0.6%) |
| No Fuel Used | 43 (0.3%) | 152 (1.2%) |
| Total | 13,105 (100.0%) | 12,566 (100.0%) |
Household Vehicle Usage in Gaithersburg
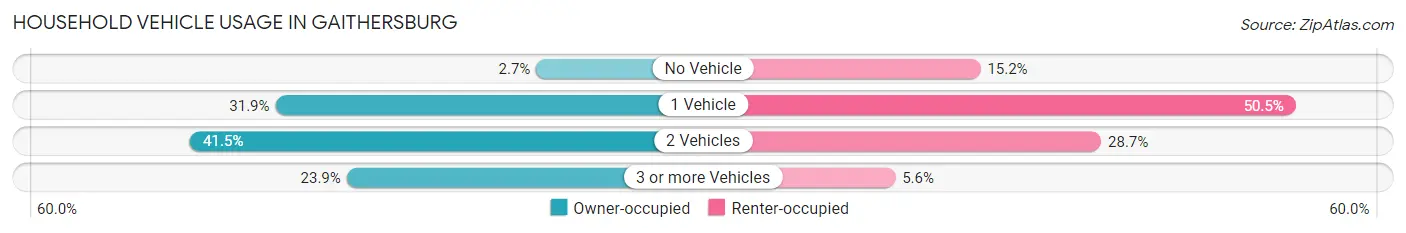
| Vehicles per Household | Owner-occupied | Renter-occupied |
| No Vehicle | 353 (2.7%) | 1,908 (15.2%) |
| 1 Vehicle | 4,182 (31.9%) | 6,345 (50.5%) |
| 2 Vehicles | 5,434 (41.5%) | 3,606 (28.7%) |
| 3 or more Vehicles | 3,136 (23.9%) | 707 (5.6%) |
| Total | 13,105 (100.0%) | 12,566 (100.0%) |
Real Estate & Mortgages in Gaithersburg
Real Estate and Mortgage Overview in Gaithersburg
| Characteristic | Without Mortgage | With Mortgage |
| Housing Units | 3,410 | 9,695 |
| Median Property Value | $450,000 | $480,700 |
| Median Household Income | $113,676 | $5,000 |
| Monthly Housing Costs | $823 | $3,713 |
| Real Estate Taxes | $4,475 | $80 |
Property Value by Mortgage Status in Gaithersburg
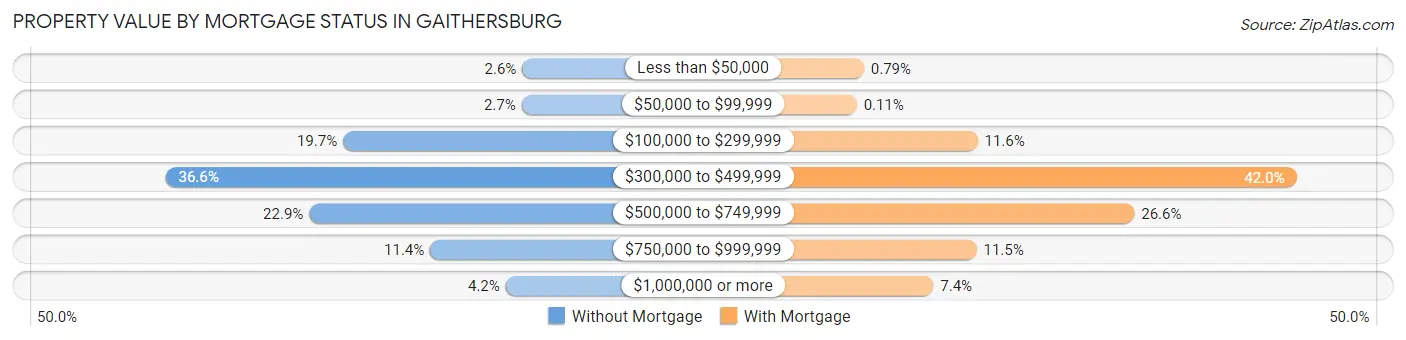
| Property Value | Without Mortgage | With Mortgage |
| Less than $50,000 | 89 (2.6%) | 77 (0.8%) |
| $50,000 to $99,999 | 91 (2.7%) | 11 (0.1%) |
| $100,000 to $299,999 | 671 (19.7%) | 1,127 (11.6%) |
| $300,000 to $499,999 | 1,247 (36.6%) | 4,071 (42.0%) |
| $500,000 to $749,999 | 781 (22.9%) | 2,574 (26.6%) |
| $750,000 to $999,999 | 388 (11.4%) | 1,117 (11.5%) |
| $1,000,000 or more | 143 (4.2%) | 718 (7.4%) |
| Total | 3,410 (100.0%) | 9,695 (100.0%) |
Household Income by Mortgage Status in Gaithersburg
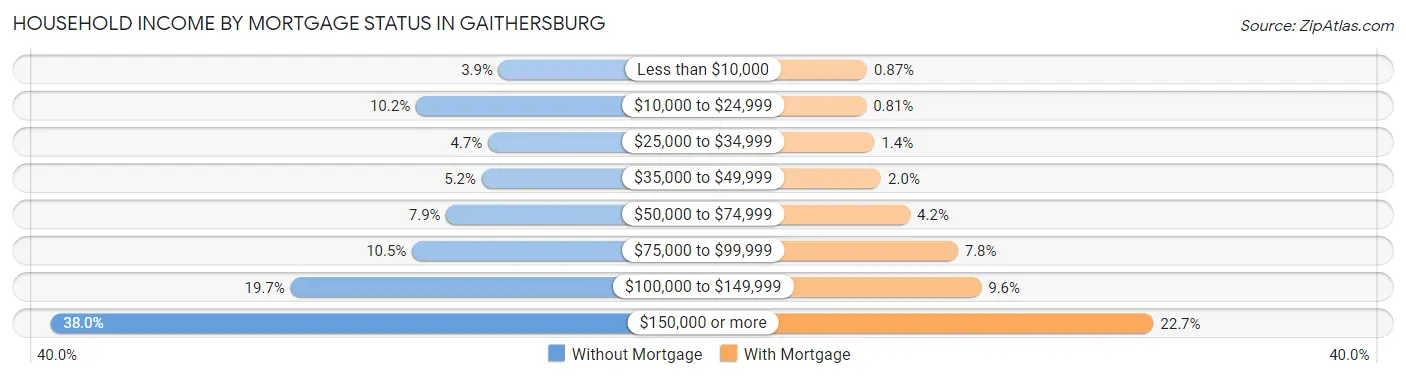
| Household Income | Without Mortgage | With Mortgage |
| Less than $10,000 | 132 (3.9%) | 84 (0.9%) |
| $10,000 to $24,999 | 347 (10.2%) | 79 (0.8%) |
| $25,000 to $34,999 | 160 (4.7%) | 140 (1.4%) |
| $35,000 to $49,999 | 176 (5.2%) | 189 (1.9%) |
| $50,000 to $74,999 | 268 (7.9%) | 403 (4.2%) |
| $75,000 to $99,999 | 357 (10.5%) | 755 (7.8%) |
| $100,000 to $149,999 | 673 (19.7%) | 929 (9.6%) |
| $150,000 or more | 1,297 (38.0%) | 2,200 (22.7%) |
| Total | 3,410 (100.0%) | 9,695 (100.0%) |
Property Value to Household Income Ratio in Gaithersburg
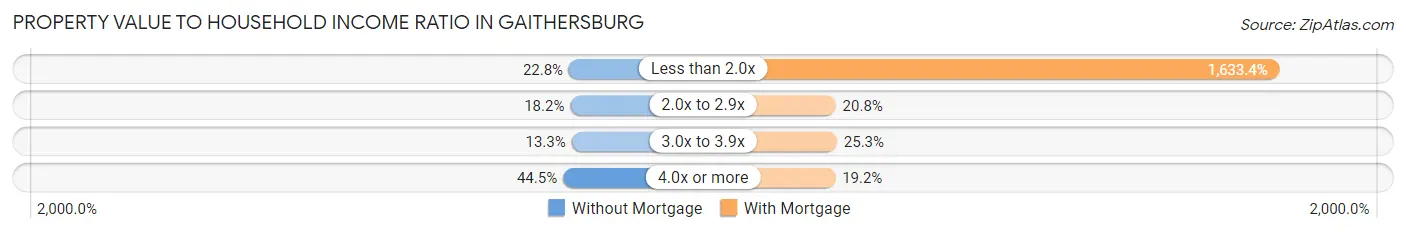
| Value-to-Income Ratio | Without Mortgage | With Mortgage |
| Less than 2.0x | 778 (22.8%) | 158,360 (1,633.4%) |
| 2.0x to 2.9x | 621 (18.2%) | 2,016 (20.8%) |
| 3.0x to 3.9x | 454 (13.3%) | 2,455 (25.3%) |
| 4.0x or more | 1,517 (44.5%) | 1,861 (19.2%) |
| Total | 3,410 (100.0%) | 9,695 (100.0%) |
Real Estate Taxes by Mortgage Status in Gaithersburg
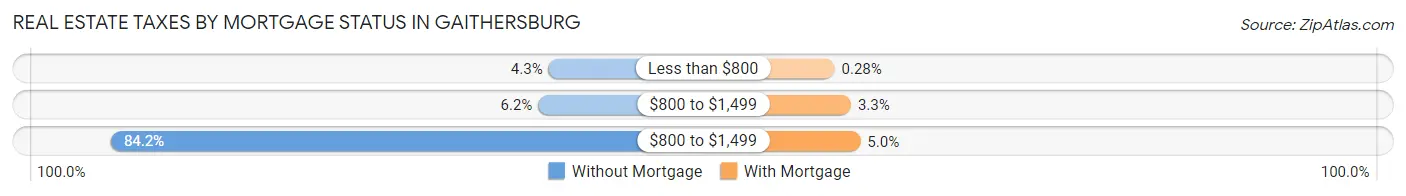
| Property Taxes | Without Mortgage | With Mortgage |
| Less than $800 | 147 (4.3%) | 27 (0.3%) |
| $800 to $1,499 | 211 (6.2%) | 318 (3.3%) |
| $800 to $1,499 | 2,872 (84.2%) | 485 (5.0%) |
| Total | 3,410 (100.0%) | 9,695 (100.0%) |
Health & Disability in Gaithersburg
Health Insurance Coverage by Age in Gaithersburg
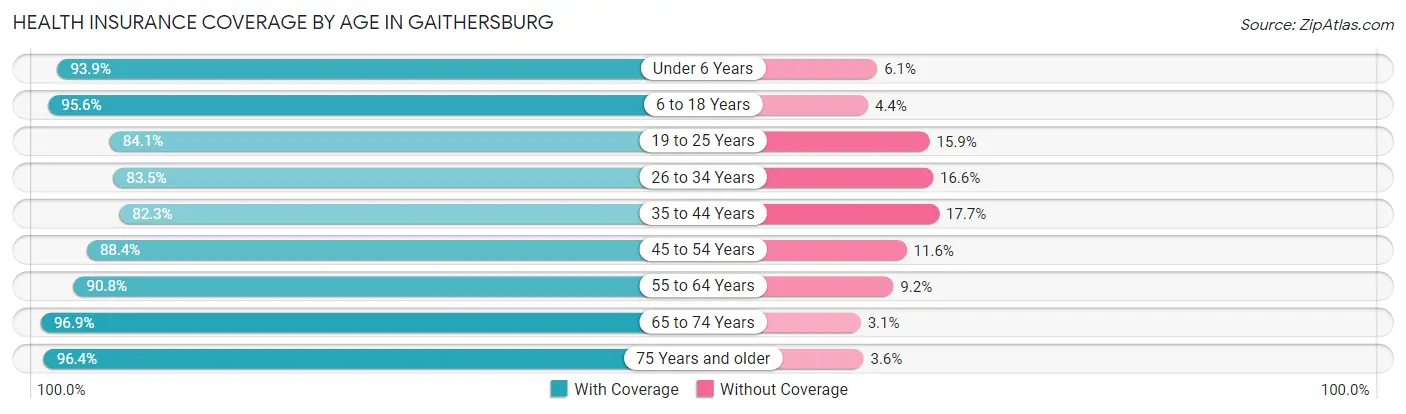
| Age Bracket | With Coverage | Without Coverage |
| Under 6 Years | 5,261 (93.9%) | 344 (6.1%) |
| 6 to 18 Years | 10,064 (95.6%) | 466 (4.4%) |
| 19 to 25 Years | 5,269 (84.1%) | 997 (15.9%) |
| 26 to 34 Years | 7,157 (83.5%) | 1,419 (16.6%) |
| 35 to 44 Years | 9,365 (82.3%) | 2,010 (17.7%) |
| 45 to 54 Years | 8,146 (88.4%) | 1,072 (11.6%) |
| 55 to 64 Years | 7,312 (90.8%) | 737 (9.2%) |
| 65 to 74 Years | 4,903 (96.9%) | 155 (3.1%) |
| 75 Years and older | 3,787 (96.4%) | 141 (3.6%) |
| Total | 61,264 (89.3%) | 7,341 (10.7%) |
Health Insurance Coverage by Citizenship Status in Gaithersburg
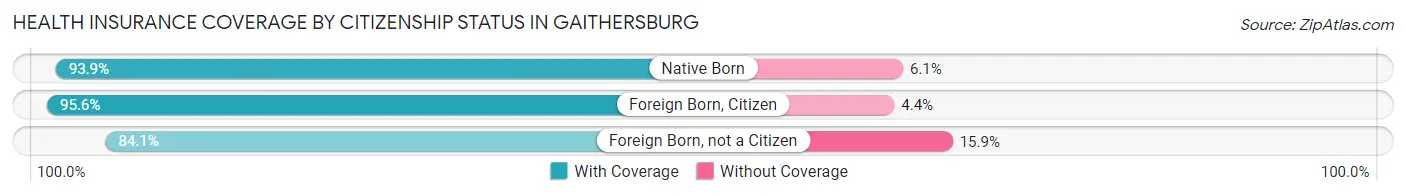
| Citizenship Status | With Coverage | Without Coverage |
| Native Born | 5,261 (93.9%) | 344 (6.1%) |
| Foreign Born, Citizen | 10,064 (95.6%) | 466 (4.4%) |
| Foreign Born, not a Citizen | 5,269 (84.1%) | 997 (15.9%) |
Health Insurance Coverage by Household Income in Gaithersburg
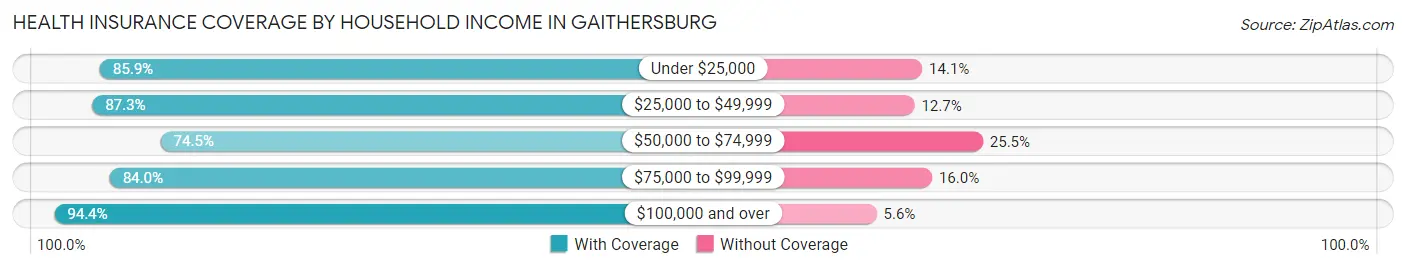
| Household Income | With Coverage | Without Coverage |
| Under $25,000 | 3,954 (85.9%) | 650 (14.1%) |
| $25,000 to $49,999 | 7,479 (87.3%) | 1,086 (12.7%) |
| $50,000 to $74,999 | 6,150 (74.5%) | 2,104 (25.5%) |
| $75,000 to $99,999 | 7,076 (84.0%) | 1,344 (16.0%) |
| $100,000 and over | 36,457 (94.4%) | 2,156 (5.6%) |
Public vs Private Health Insurance Coverage by Age in Gaithersburg
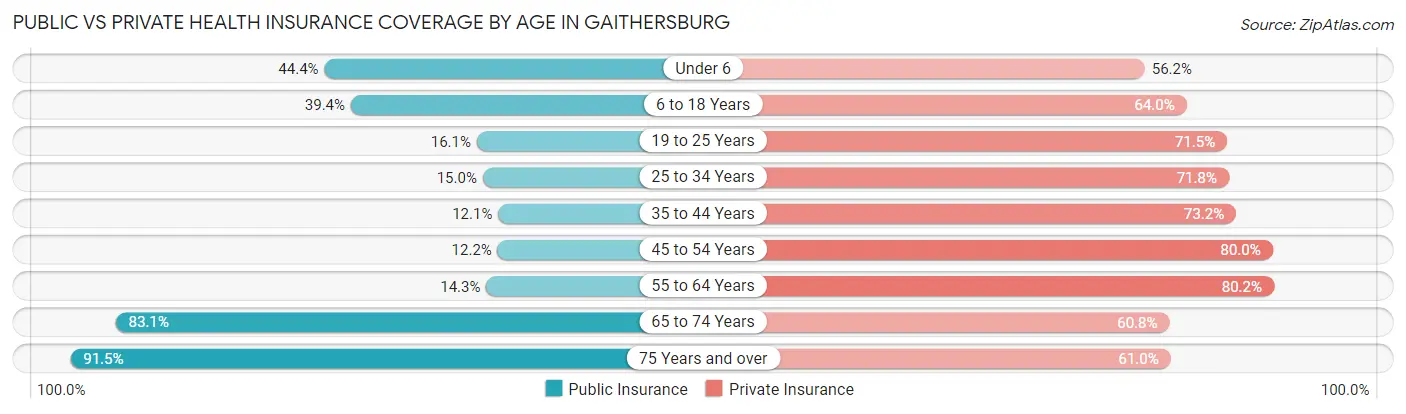
| Age Bracket | Public Insurance | Private Insurance |
| Under 6 | 2,486 (44.4%) | 3,152 (56.2%) |
| 6 to 18 Years | 4,153 (39.4%) | 6,737 (64.0%) |
| 19 to 25 Years | 1,007 (16.1%) | 4,480 (71.5%) |
| 25 to 34 Years | 1,283 (15.0%) | 6,158 (71.8%) |
| 35 to 44 Years | 1,375 (12.1%) | 8,324 (73.2%) |
| 45 to 54 Years | 1,124 (12.2%) | 7,371 (80.0%) |
| 55 to 64 Years | 1,151 (14.3%) | 6,454 (80.2%) |
| 65 to 74 Years | 4,204 (83.1%) | 3,074 (60.8%) |
| 75 Years and over | 3,595 (91.5%) | 2,397 (61.0%) |
| Total | 20,378 (29.7%) | 48,147 (70.2%) |
Disability Status by Sex by Age in Gaithersburg
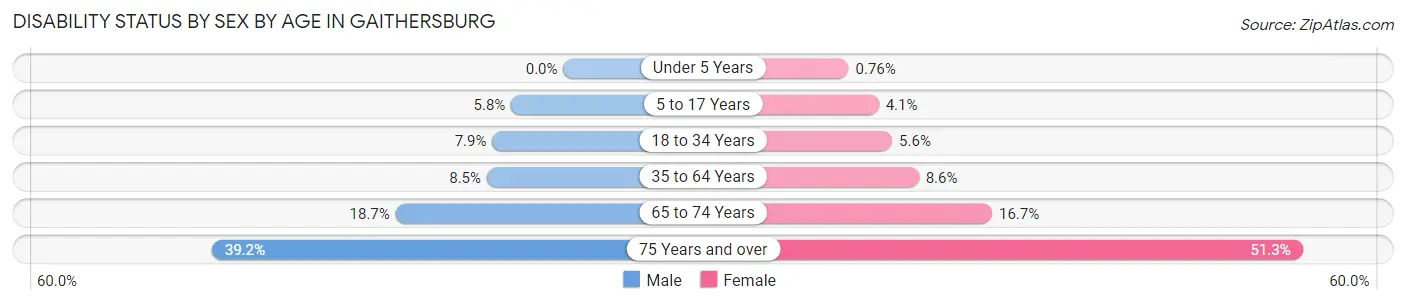
| Age Bracket | Male | Female |
| Under 5 Years | 0 (0.0%) | 19 (0.8%) |
| 5 to 17 Years | 339 (5.8%) | 199 (4.1%) |
| 18 to 34 Years | 600 (7.9%) | 442 (5.6%) |
| 35 to 64 Years | 1,154 (8.5%) | 1,294 (8.6%) |
| 65 to 74 Years | 409 (18.7%) | 480 (16.7%) |
| 75 Years and over | 626 (39.2%) | 1,195 (51.3%) |
Disability Class by Sex by Age in Gaithersburg
Disability Class: Hearing Difficulty
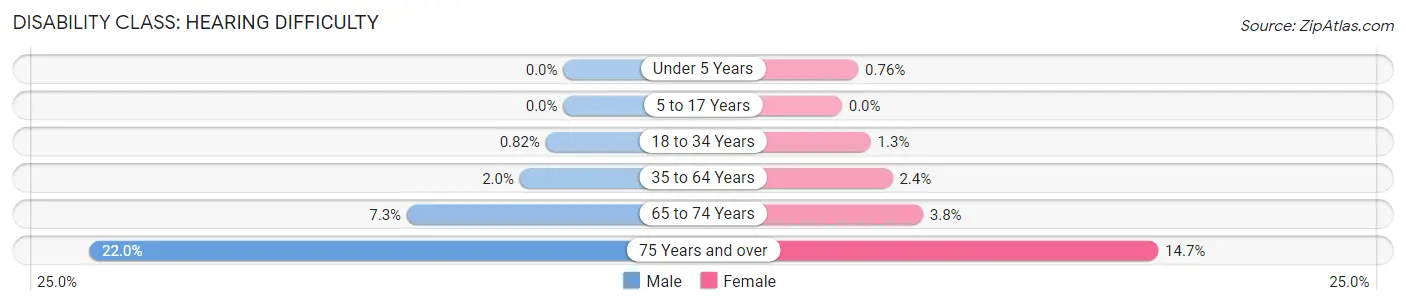
| Age Bracket | Male | Female |
| Under 5 Years | 0 (0.0%) | 19 (0.8%) |
| 5 to 17 Years | 0 (0.0%) | 0 (0.0%) |
| 18 to 34 Years | 62 (0.8%) | 106 (1.3%) |
| 35 to 64 Years | 274 (2.0%) | 354 (2.4%) |
| 65 to 74 Years | 159 (7.3%) | 108 (3.8%) |
| 75 Years and over | 352 (22.0%) | 342 (14.7%) |
Disability Class: Vision Difficulty
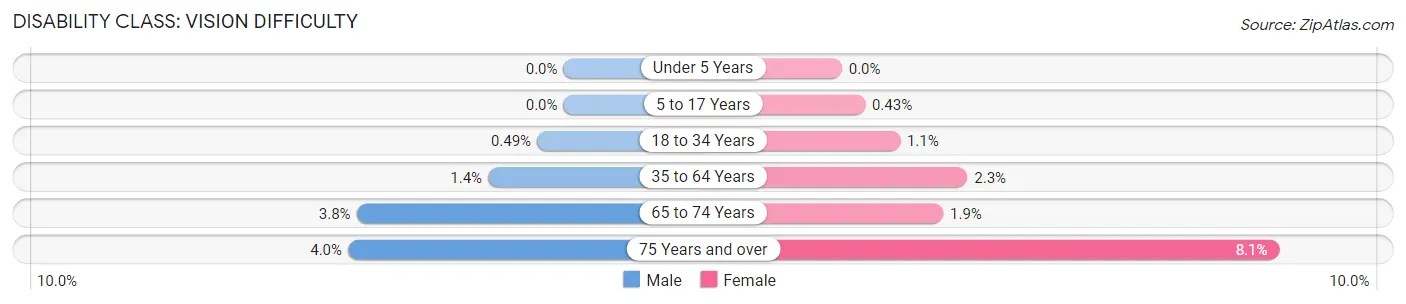
| Age Bracket | Male | Female |
| Under 5 Years | 0 (0.0%) | 0 (0.0%) |
| 5 to 17 Years | 0 (0.0%) | 21 (0.4%) |
| 18 to 34 Years | 37 (0.5%) | 85 (1.1%) |
| 35 to 64 Years | 189 (1.4%) | 352 (2.3%) |
| 65 to 74 Years | 84 (3.8%) | 54 (1.9%) |
| 75 Years and over | 64 (4.0%) | 189 (8.1%) |
Disability Class: Cognitive Difficulty
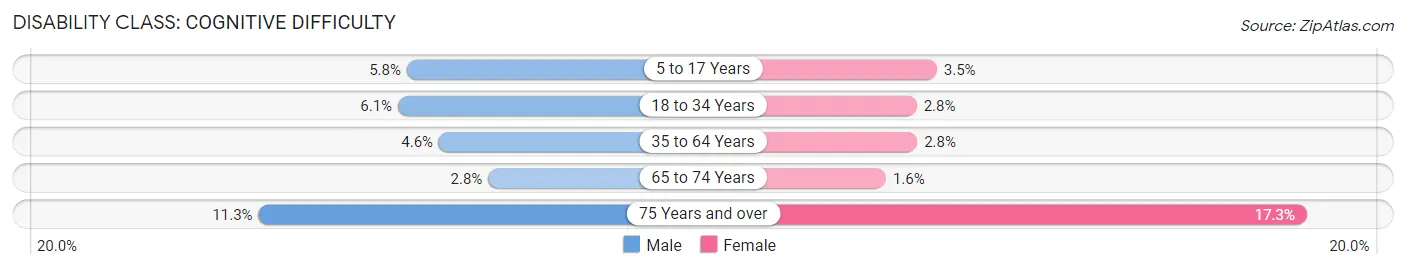
| Age Bracket | Male | Female |
| 5 to 17 Years | 339 (5.8%) | 171 (3.5%) |
| 18 to 34 Years | 466 (6.1%) | 219 (2.8%) |
| 35 to 64 Years | 626 (4.6%) | 422 (2.8%) |
| 65 to 74 Years | 61 (2.8%) | 47 (1.6%) |
| 75 Years and over | 181 (11.3%) | 402 (17.3%) |
Disability Class: Ambulatory Difficulty
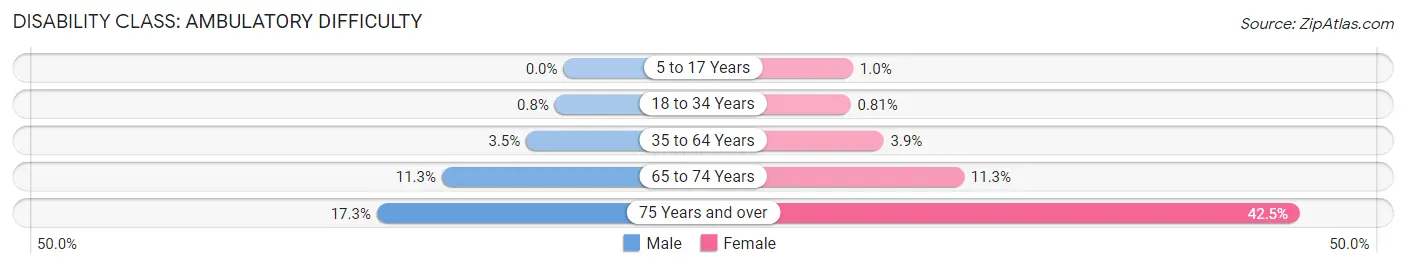
| Age Bracket | Male | Female |
| 5 to 17 Years | 0 (0.0%) | 50 (1.0%) |
| 18 to 34 Years | 61 (0.8%) | 64 (0.8%) |
| 35 to 64 Years | 469 (3.5%) | 585 (3.9%) |
| 65 to 74 Years | 247 (11.3%) | 325 (11.3%) |
| 75 Years and over | 277 (17.3%) | 990 (42.5%) |
Disability Class: Self-Care Difficulty
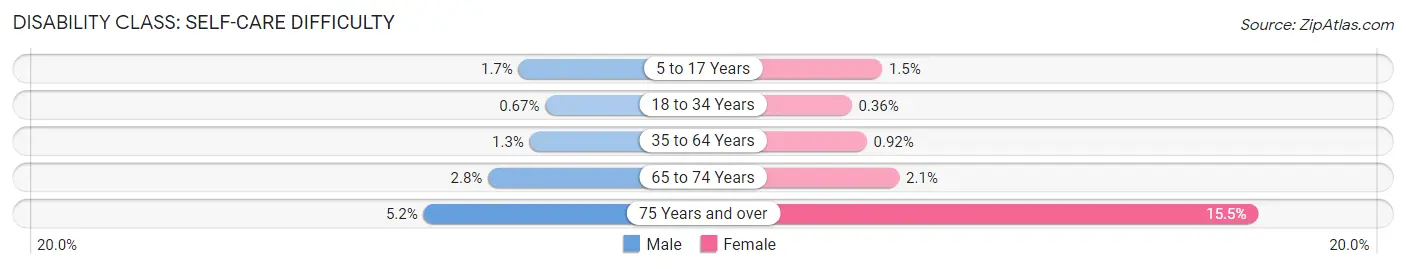
| Age Bracket | Male | Female |
| 5 to 17 Years | 97 (1.7%) | 72 (1.5%) |
| 18 to 34 Years | 51 (0.7%) | 28 (0.4%) |
| 35 to 64 Years | 169 (1.3%) | 139 (0.9%) |
| 65 to 74 Years | 61 (2.8%) | 61 (2.1%) |
| 75 Years and over | 83 (5.2%) | 360 (15.5%) |
Technology Access in Gaithersburg
Computing Device Access in Gaithersburg
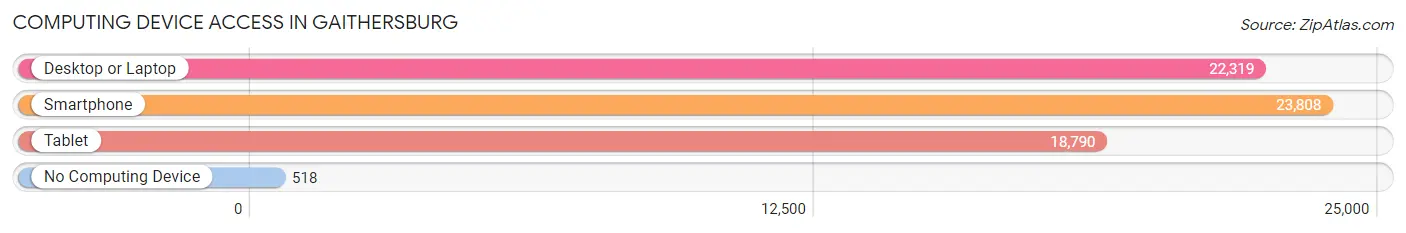
| Device Type | # Households | % Households |
| Desktop or Laptop | 22,319 | 86.9% |
| Smartphone | 23,808 | 92.7% |
| Tablet | 18,790 | 73.2% |
| No Computing Device | 518 | 2.0% |
| Total | 25,671 | 100.0% |
Internet Access in Gaithersburg
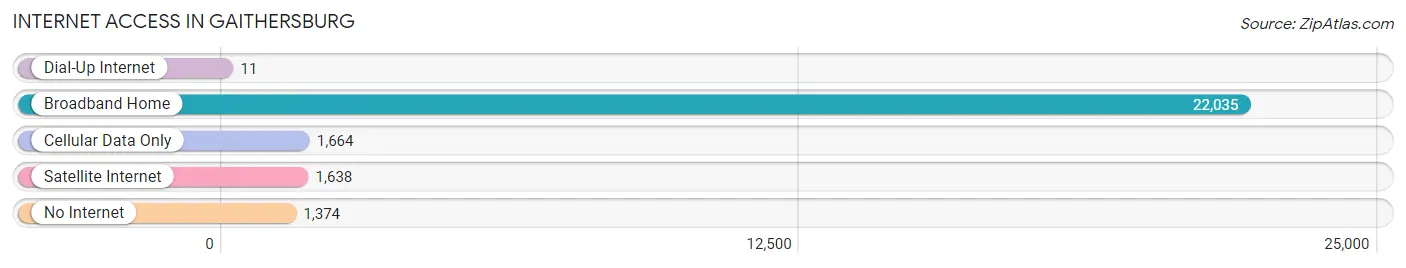
| Internet Type | # Households | % Households |
| Dial-Up Internet | 11 | 0.0% |
| Broadband Home | 22,035 | 85.8% |
| Cellular Data Only | 1,664 | 6.5% |
| Satellite Internet | 1,638 | 6.4% |
| No Internet | 1,374 | 5.3% |
| Total | 25,671 | 100.0% |
Gaithersburg Summary
Gaithersburg, MD is a city located in Montgomery County, Maryland, United States. It is a suburb of Washington, D.C., and is part of the Baltimore-Washington metropolitan area. As of the 2010 census, Gaithersburg had a population of 59,933, making it the fourth largest incorporated city in the state, behind Baltimore, Frederick, and Rockville.
History
Gaithersburg was founded in 1765 as a small agricultural settlement known as Log Town. It was named after its founder, Benjamin Gaither, who was a blacksmith and farmer. The town was incorporated in 1878 and was officially named Gaithersburg in 1894.
Gaithersburg experienced rapid growth in the late 19th and early 20th centuries, due to its proximity to Washington, D.C. and the Baltimore and Ohio Railroad. The city was home to a number of prominent businesses, including the National Bureau of Standards (now the National Institute of Standards and Technology), the National Institutes of Health, and the National Institute of Allergy and Infectious Diseases.
Geography
Gaithersburg is located at 39°08′N 77°13′W (39.13, -77.21). According to the United States Census Bureau, the city has a total area of 17.2 square miles (44.6 km2), of which 17.1 square miles (44.4 km2) is land and 0.1 square miles (0.2 km2) (0.58%) is water.
The city is located in the Piedmont region of Maryland, and is situated in the foothills of the Appalachian Mountains. It is bordered by the cities of Rockville to the north, Germantown to the northwest, and North Potomac to the southwest.
Economy
Gaithersburg is home to a number of major employers, including the National Institute of Standards and Technology, the National Institutes of Health, and the National Institute of Allergy and Infectious Diseases. The city is also home to a number of technology companies, including IBM, Lockheed Martin, and Northrop Grumman.
Gaithersburg is also home to a number of shopping centers, including the Rio Washingtonian Center, the Montgomery Mall, and the Lakeforest Mall. The city is also home to a number of restaurants, bars, and entertainment venues.
Demographics
As of the 2010 census, there were 59,933 people, 22,717 households, and 14,945 families residing in the city. The population density was 3,521.3 people per square mile (1,362.3/km2). There were 24,068 housing units at an average density of 1,406.3 per square mile (542.3/km2). The racial makeup of the city was 57.2% White, 16.3% African American, 0.3% Native American, 16.2% Asian, 0.1% Pacific Islander, 5.2% from other races, and 4.7% from two or more races. Hispanic or Latino of any race were 13.2% of the population.
There were 22,717 households, out of which 33.2% had children under the age of 18 living with them, 48.2% were married couples living together, 11.7% had a female householder with no husband present, and 35.2% were non-families. 28.2% of all households were made up of individuals, and 8.2% had someone living alone who was 65 years of age or older. The average household size was 2.60 and the average family size was 3.22.
In the city, the population was spread out, with 25.2% under the age of 18, 8.2% from 18 to 24, 33.2% from 25 to 44, 22.2% from 45 to 64, and 11.2% who were 65 years of age or older. The median age was 36 years. For every 100 females, there were 93.2 males. For every 100 females age 18 and over, there were 89.7 males.
The median income for a household in the city was $63,945, and the median income for a family was $76,817. Males had a median income of $50,945 versus $41,945 for females. The per capita income for the city was $30,945. About 5.2% of families and 7.3% of the population were below the poverty line, including 8.2% of those under age 18 and 6.2% of those age 65 or over.
Common Questions
What is Per Capita Income in Gaithersburg?
Per Capita income in Gaithersburg is $52,624.
What is the Median Family Income in Gaithersburg?
Median Family Income in Gaithersburg is $118,020.
What is the Median Household income in Gaithersburg?
Median Household Income in Gaithersburg is $104,544.
What is Income or Wage Gap in Gaithersburg?
Income or Wage Gap in Gaithersburg is 23.8%.
Women in Gaithersburg earn 76.2 cents for every dollar earned by a man.
What is Inequality or Gini Index in Gaithersburg?
Inequality or Gini Index in Gaithersburg is 0.46.
What is the Total Population of Gaithersburg?
Total Population of Gaithersburg is 69,016.
What is the Total Male Population of Gaithersburg?
Total Male Population of Gaithersburg is 33,258.
What is the Total Female Population of Gaithersburg?
Total Female Population of Gaithersburg is 35,758.
What is the Ratio of Males per 100 Females in Gaithersburg?
There are 93.01 Males per 100 Females in Gaithersburg.
What is the Ratio of Females per 100 Males in Gaithersburg?
There are 107.52 Females per 100 Males in Gaithersburg.
What is the Median Population Age in Gaithersburg?
Median Population Age in Gaithersburg is 37.4 Years.
What is the Average Family Size in Gaithersburg
Average Family Size in Gaithersburg is 3.3 People.
What is the Average Household Size in Gaithersburg
Average Household Size in Gaithersburg is 2.7 People.
How Large is the Labor Force in Gaithersburg?
There are 40,207 People in the Labor Forcein in Gaithersburg.
What is the Percentage of People in the Labor Force in Gaithersburg?
73.2% of People are in the Labor Force in Gaithersburg.
What is the Unemployment Rate in Gaithersburg?
Unemployment Rate in Gaithersburg is 5.5%.