Norcross, GA Map & Demographics
Norcross Map
Norcross Overview
$36,090
PER CAPITA INCOME
$87,619
AVG FAMILY INCOME
$74,921
AVG HOUSEHOLD INCOME
11.0%
WAGE / INCOME GAP [ % ]
89.0¢/ $1
WAGE / INCOME GAP [ $ ]
0.43
INEQUALITY / GINI INDEX
17,530
TOTAL POPULATION
8,572
MALE POPULATION
8,958
FEMALE POPULATION
95.69
MALES / 100 FEMALES
104.50
FEMALES / 100 MALES
34.2
MEDIAN AGE
3.3
AVG FAMILY SIZE
2.7
AVG HOUSEHOLD SIZE
9,833
LABOR FORCE [ PEOPLE ]
73.6%
PERCENT IN LABOR FORCE
1.8%
UNEMPLOYMENT RATE
Norcross Area Codes
Income in Norcross
Income Overview in Norcross
Per Capita Income in Norcross is $36,090, while median incomes of families and households are $87,619 and $74,921 respectively.
| Characteristic | Number | Measure |
| Per Capita Income | 17,530 | $36,090 |
| Median Family Income | 4,454 | $87,619 |
| Mean Family Income | 4,454 | $108,576 |
| Median Household Income | 6,488 | $74,921 |
| Mean Household Income | 6,488 | $96,586 |
| Income Deficit | 4,454 | $0 |
| Wage / Income Gap (%) | 17,530 | 11.03% |
| Wage / Income Gap ($) | 17,530 | 88.97¢ per $1 |
| Gini / Inequality Index | 17,530 | 0.43 |
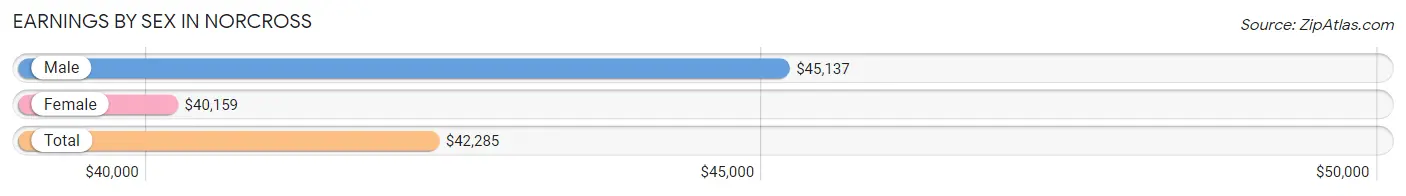
Earnings by Sex in Norcross
Average Earnings in Norcross are $42,285, $45,137 for men and $40,159 for women, a difference of 11.0%.
| Sex | Number | Average Earnings |
| Male | 5,697 (56.1%) | $45,137 |
| Female | 4,454 (43.9%) | $40,159 |
| Total | 10,151 (100.0%) | $42,285 |
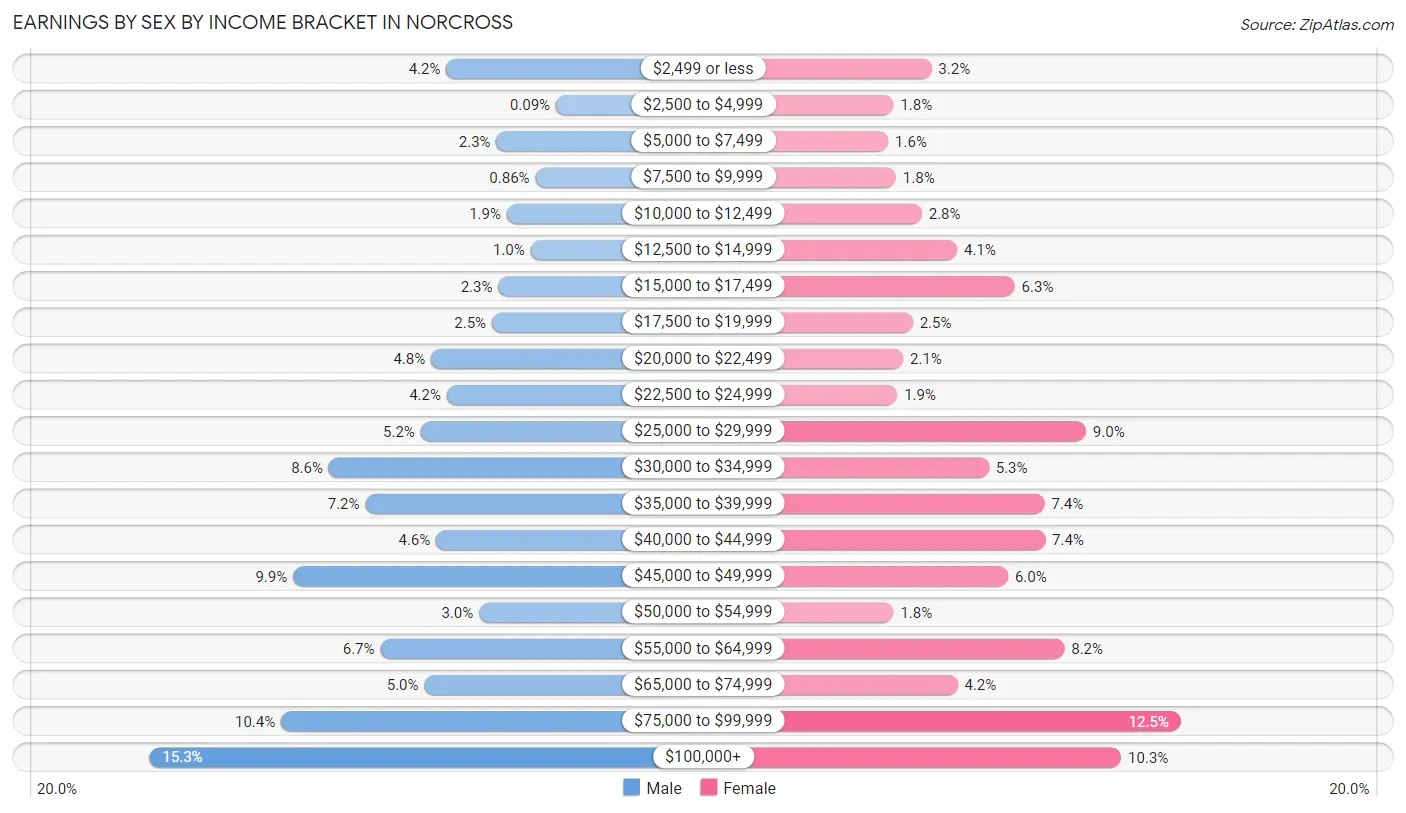
Earnings by Sex by Income Bracket in Norcross
The most common earnings brackets in Norcross are $100,000+ for men (873 | 15.3%) and $75,000 to $99,999 for women (557 | 12.5%).
| Income | Male | Female |
| $2,499 or less | 239 (4.2%) | 141 (3.2%) |
| $2,500 to $4,999 | 5 (0.1%) | 78 (1.8%) |
| $5,000 to $7,499 | 132 (2.3%) | 69 (1.5%) |
| $7,500 to $9,999 | 49 (0.9%) | 82 (1.8%) |
| $10,000 to $12,499 | 110 (1.9%) | 125 (2.8%) |
| $12,500 to $14,999 | 59 (1.0%) | 184 (4.1%) |
| $15,000 to $17,499 | 128 (2.2%) | 280 (6.3%) |
| $17,500 to $19,999 | 142 (2.5%) | 110 (2.5%) |
| $20,000 to $22,499 | 272 (4.8%) | 94 (2.1%) |
| $22,500 to $24,999 | 238 (4.2%) | 84 (1.9%) |
| $25,000 to $29,999 | 294 (5.2%) | 399 (9.0%) |
| $30,000 to $34,999 | 490 (8.6%) | 237 (5.3%) |
| $35,000 to $39,999 | 412 (7.2%) | 330 (7.4%) |
| $40,000 to $44,999 | 261 (4.6%) | 331 (7.4%) |
| $45,000 to $49,999 | 566 (9.9%) | 269 (6.0%) |
| $50,000 to $54,999 | 169 (3.0%) | 78 (1.8%) |
| $55,000 to $64,999 | 380 (6.7%) | 363 (8.2%) |
| $65,000 to $74,999 | 286 (5.0%) | 185 (4.2%) |
| $75,000 to $99,999 | 592 (10.4%) | 557 (12.5%) |
| $100,000+ | 873 (15.3%) | 458 (10.3%) |
| Total | 5,697 (100.0%) | 4,454 (100.0%) |
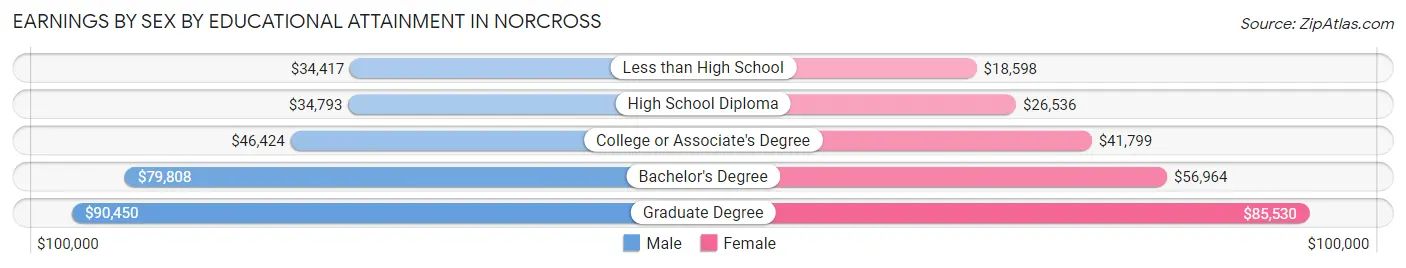
Earnings by Sex by Educational Attainment in Norcross
Average earnings in Norcross are $47,018 for men and $41,182 for women, a difference of 12.4%. Men with an educational attainment of graduate degree enjoy the highest average annual earnings of $90,450, while those with less than high school education earn the least with $34,417. Women with an educational attainment of graduate degree earn the most with the average annual earnings of $85,530, while those with less than high school education have the smallest earnings of $18,598.
| Educational Attainment | Male Income | Female Income |
| Less than High School | $34,417 | $18,598 |
| High School Diploma | $34,793 | $26,536 |
| College or Associate's Degree | $46,424 | $41,799 |
| Bachelor's Degree | $79,808 | $56,964 |
| Graduate Degree | $90,450 | $85,530 |
| Total | $47,018 | $41,182 |
Family Income in Norcross
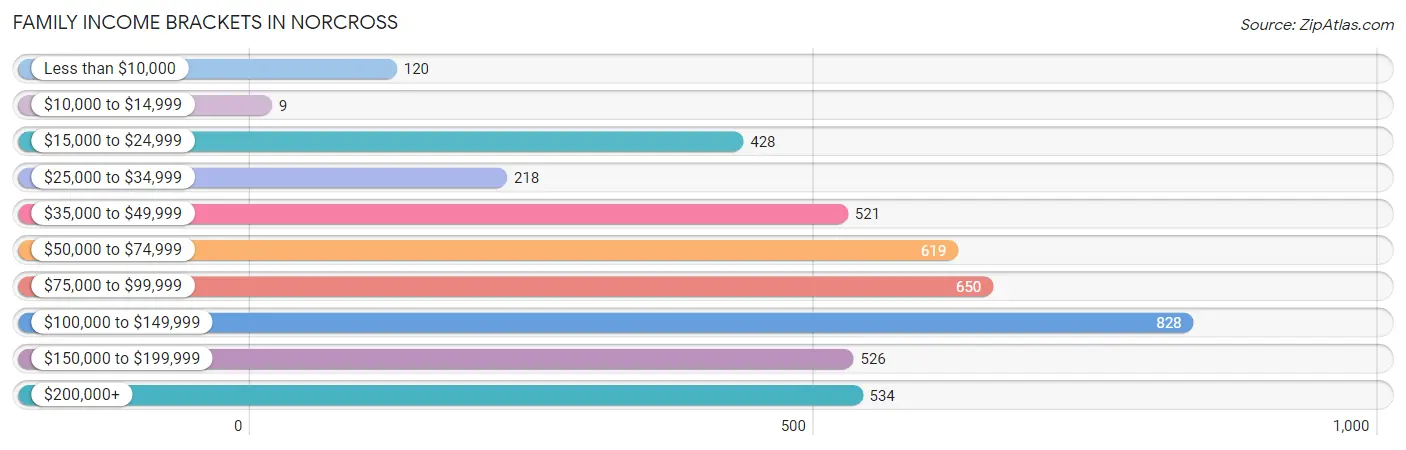
Family Income Brackets in Norcross
According to the Norcross family income data, there are 828 families falling into the $100,000 to $149,999 income range, which is the most common income bracket and makes up 18.6% of all families. Conversely, the $10,000 to $14,999 income bracket is the least frequent group with only 9 families (0.2%) belonging to this category.
| Income Bracket | # Families | % Families |
| Less than $10,000 | 120 | 2.7% |
| $10,000 to $14,999 | 9 | 0.2% |
| $15,000 to $24,999 | 428 | 9.6% |
| $25,000 to $34,999 | 218 | 4.9% |
| $35,000 to $49,999 | 521 | 11.7% |
| $50,000 to $74,999 | 619 | 13.9% |
| $75,000 to $99,999 | 650 | 14.6% |
| $100,000 to $149,999 | 828 | 18.6% |
| $150,000 to $199,999 | 526 | 11.8% |
| $200,000+ | 534 | 12.0% |
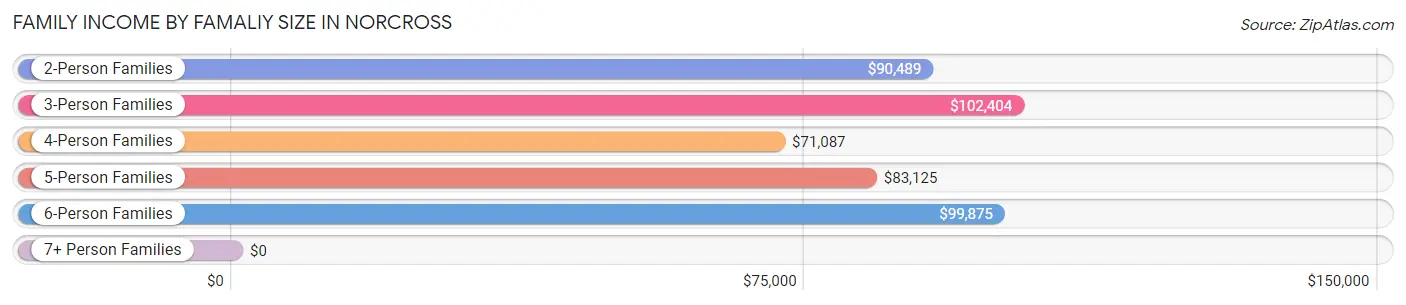
Family Income by Famaliy Size in Norcross
3-person families (1,193 | 26.8%) account for the highest median family income in Norcross with $102,404 per family, while 2-person families (1,638 | 36.8%) have the highest median income of $45,244 per family member.
| Income Bracket | # Families | Median Income |
| 2-Person Families | 1,638 (36.8%) | $90,489 |
| 3-Person Families | 1,193 (26.8%) | $102,404 |
| 4-Person Families | 880 (19.8%) | $71,087 |
| 5-Person Families | 604 (13.6%) | $83,125 |
| 6-Person Families | 73 (1.6%) | $99,875 |
| 7+ Person Families | 66 (1.5%) | $0 |
| Total | 4,454 (100.0%) | $87,619 |
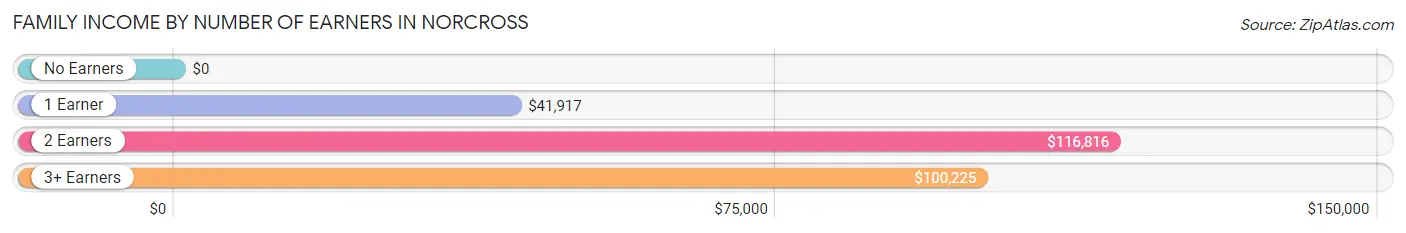
Family Income by Number of Earners in Norcross
| Number of Earners | # Families | Median Income |
| No Earners | 376 (8.4%) | $0 |
| 1 Earner | 1,164 (26.1%) | $41,917 |
| 2 Earners | 2,447 (54.9%) | $116,816 |
| 3+ Earners | 467 (10.5%) | $100,225 |
| Total | 4,454 (100.0%) | $87,619 |
Household Income in Norcross
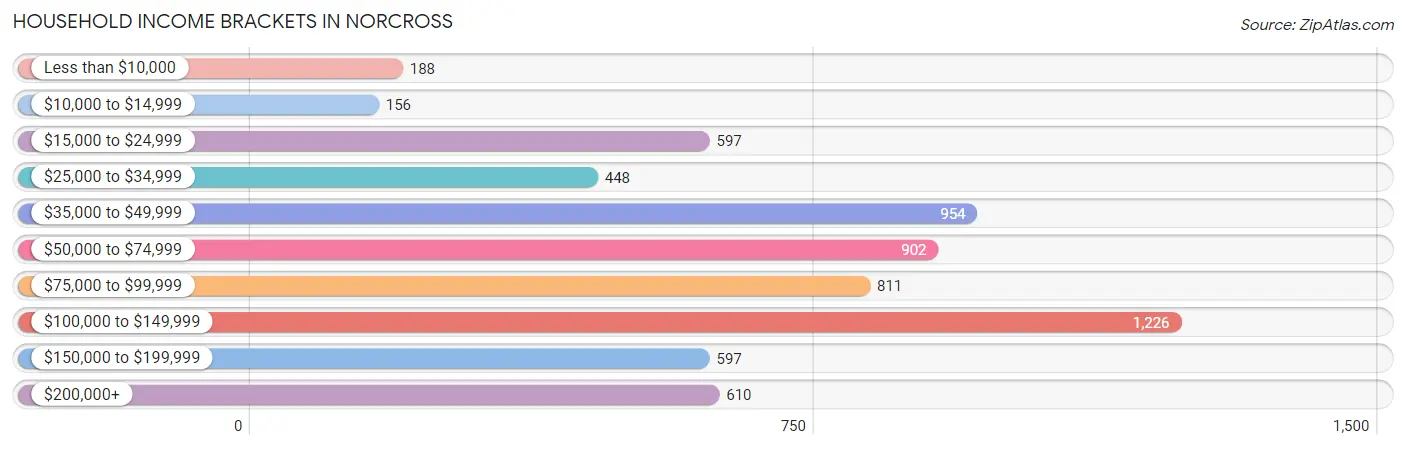
Household Income Brackets in Norcross
With 1,226 households falling in the category, the $100,000 to $149,999 income range is the most frequent in Norcross, accounting for 18.9% of all households. In contrast, only 156 households (2.4%) fall into the $10,000 to $14,999 income bracket, making it the least populous group.
| Income Bracket | # Households | % Households |
| Less than $10,000 | 188 | 2.9% |
| $10,000 to $14,999 | 156 | 2.4% |
| $15,000 to $24,999 | 597 | 9.2% |
| $25,000 to $34,999 | 448 | 6.9% |
| $35,000 to $49,999 | 954 | 14.7% |
| $50,000 to $74,999 | 902 | 13.9% |
| $75,000 to $99,999 | 811 | 12.5% |
| $100,000 to $149,999 | 1,226 | 18.9% |
| $150,000 to $199,999 | 597 | 9.2% |
| $200,000+ | 610 | 9.4% |
Household Income by Householder Age in Norcross
The median household income in Norcross is $74,921, with the highest median household income of $99,647 found in the 45 to 64 years age bracket for the primary householder. A total of 2,320 households (35.8%) fall into this category. Meanwhile, the 65+ years age bracket for the primary householder has the lowest median household income of $49,183, with 771 households (11.9%) in this group.
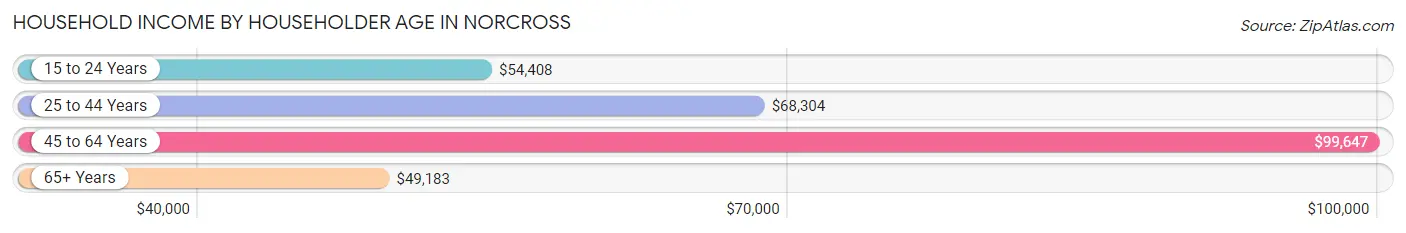
| Income Bracket | # Households | Median Income |
| 15 to 24 Years | 220 (3.4%) | $54,408 |
| 25 to 44 Years | 3,177 (49.0%) | $68,304 |
| 45 to 64 Years | 2,320 (35.8%) | $99,647 |
| 65+ Years | 771 (11.9%) | $49,183 |
| Total | 6,488 (100.0%) | $74,921 |
Poverty in Norcross
Income Below Poverty by Sex and Age in Norcross
With 10.2% poverty level for males and 15.9% for females among the residents of Norcross, 5 year old males and 15 year old females are the most vulnerable to poverty, with 29 males (29.6%) and 51 females (45.1%) in their respective age groups living below the poverty level.
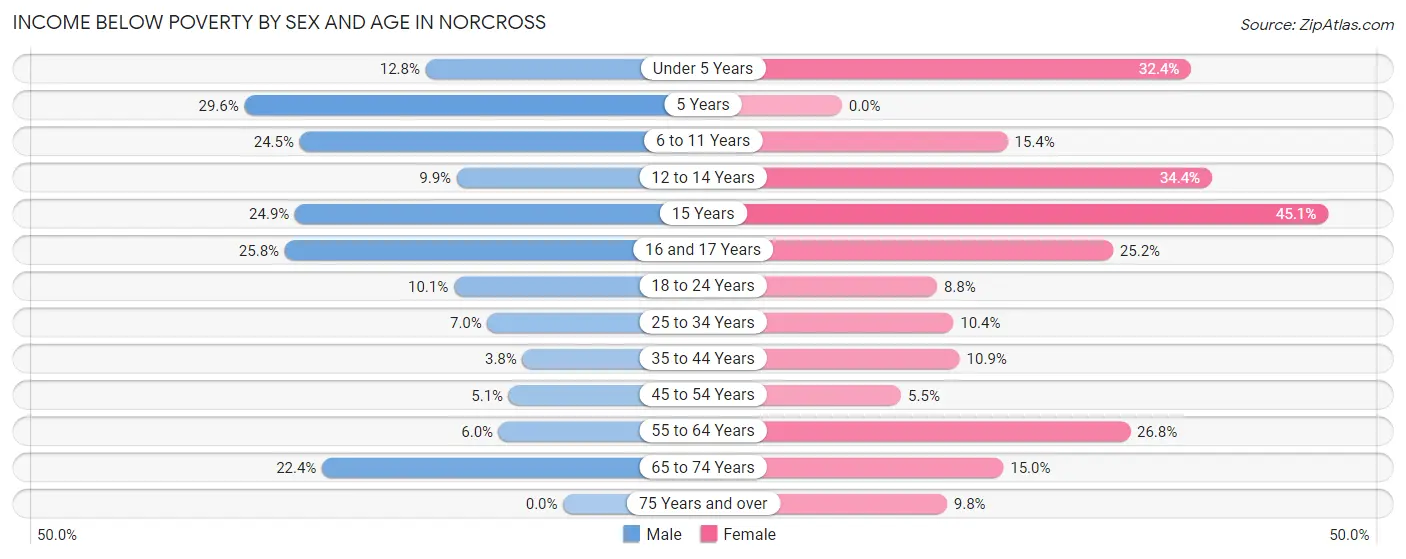
| Age Bracket | Male | Female |
| Under 5 Years | 59 (12.8%) | 224 (32.4%) |
| 5 Years | 29 (29.6%) | 0 (0.0%) |
| 6 to 11 Years | 159 (24.5%) | 135 (15.4%) |
| 12 to 14 Years | 42 (9.9%) | 180 (34.4%) |
| 15 Years | 55 (24.9%) | 51 (45.1%) |
| 16 and 17 Years | 92 (25.8%) | 40 (25.2%) |
| 18 to 24 Years | 70 (10.1%) | 34 (8.8%) |
| 25 to 34 Years | 116 (7.0%) | 182 (10.3%) |
| 35 to 44 Years | 57 (3.8%) | 145 (10.9%) |
| 45 to 54 Years | 66 (5.1%) | 64 (5.5%) |
| 55 to 64 Years | 32 (6.0%) | 241 (26.8%) |
| 65 to 74 Years | 94 (22.4%) | 73 (15.0%) |
| 75 Years and over | 0 (0.0%) | 43 (9.8%) |
| Total | 871 (10.2%) | 1,412 (15.9%) |
Income Above Poverty by Sex and Age in Norcross
According to the poverty statistics in Norcross, males aged 75 years and over and females aged 5 years are the age groups that are most secure financially, with 100.0% of males and 100.0% of females in these age groups living above the poverty line.
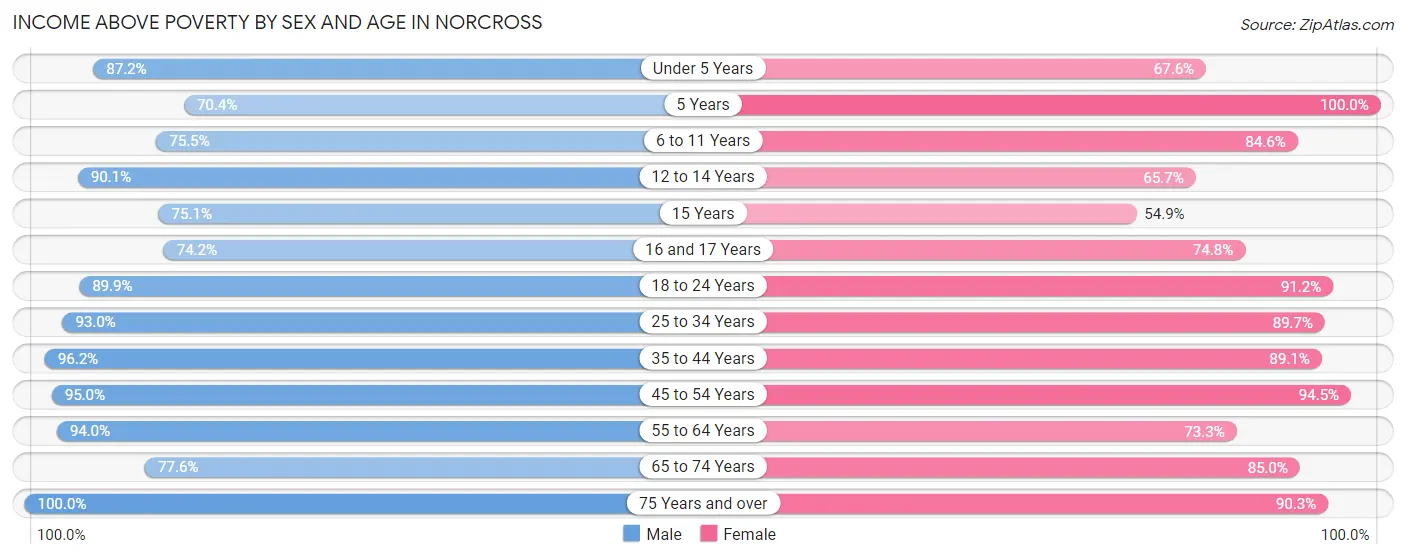
| Age Bracket | Male | Female |
| Under 5 Years | 403 (87.2%) | 467 (67.6%) |
| 5 Years | 69 (70.4%) | 85 (100.0%) |
| 6 to 11 Years | 491 (75.5%) | 742 (84.6%) |
| 12 to 14 Years | 383 (90.1%) | 344 (65.6%) |
| 15 Years | 166 (75.1%) | 62 (54.9%) |
| 16 and 17 Years | 264 (74.2%) | 119 (74.8%) |
| 18 to 24 Years | 620 (89.9%) | 351 (91.2%) |
| 25 to 34 Years | 1,534 (93.0%) | 1,577 (89.6%) |
| 35 to 44 Years | 1,451 (96.2%) | 1,181 (89.1%) |
| 45 to 54 Years | 1,240 (95.0%) | 1,098 (94.5%) |
| 55 to 64 Years | 503 (94.0%) | 660 (73.3%) |
| 65 to 74 Years | 326 (77.6%) | 414 (85.0%) |
| 75 Years and over | 228 (100.0%) | 398 (90.2%) |
| Total | 7,678 (89.8%) | 7,498 (84.2%) |
Income Below Poverty Among Married-Couple Families in Norcross
The poverty statistics for married-couple families in Norcross show that 9.4% or 311 of the total 3,316 families live below the poverty line. Families with 5 or more children have the highest poverty rate of 86.7%, comprising of 39 families. On the other hand, families with 3 or 4 children have the lowest poverty rate of 6.7%, which includes 21 families.
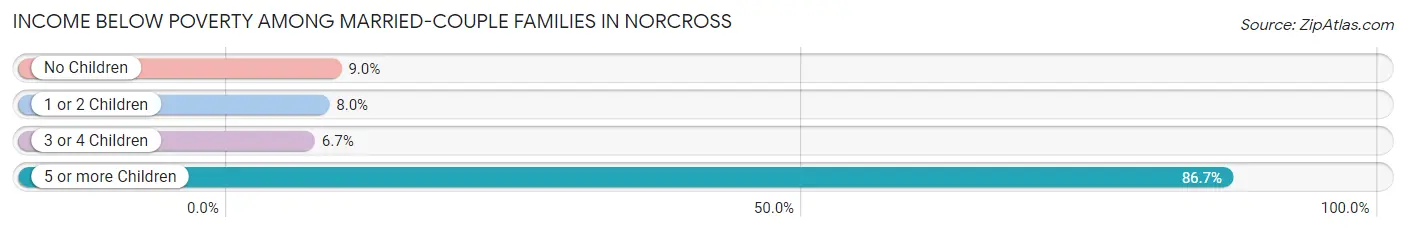
| Children | Above Poverty | Below Poverty |
| No Children | 1,386 (91.0%) | 137 (9.0%) |
| 1 or 2 Children | 1,320 (92.0%) | 114 (8.0%) |
| 3 or 4 Children | 293 (93.3%) | 21 (6.7%) |
| 5 or more Children | 6 (13.3%) | 39 (86.7%) |
| Total | 3,005 (90.6%) | 311 (9.4%) |
Income Below Poverty Among Single-Parent Households in Norcross
According to the poverty data in Norcross, 8.4% or 23 single-father households and 16.2% or 140 single-mother households are living below the poverty line. Among single-father households, those with 1 or 2 children have the highest poverty rate, with 23 households (13.0%) experiencing poverty. Likewise, among single-mother households, those with 3 or 4 children have the highest poverty rate, with 85 households (77.3%) falling below the poverty line.
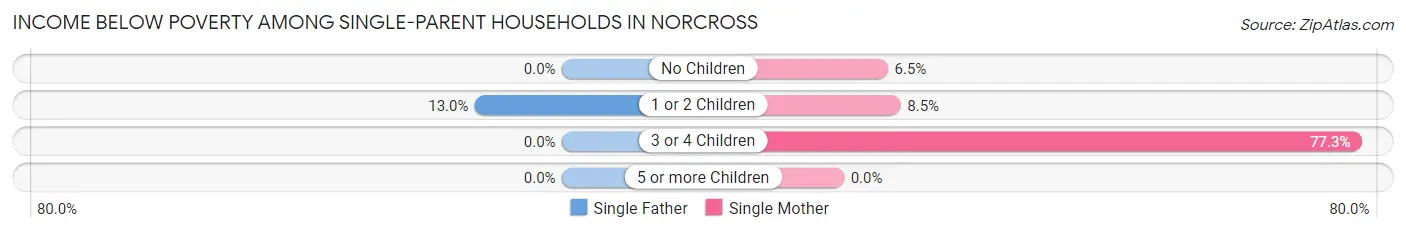
| Children | Single Father | Single Mother |
| No Children | 0 (0.0%) | 30 (6.5%) |
| 1 or 2 Children | 23 (13.0%) | 25 (8.5%) |
| 3 or 4 Children | 0 (0.0%) | 85 (77.3%) |
| 5 or more Children | 0 (0.0%) | 0 (0.0%) |
| Total | 23 (8.4%) | 140 (16.2%) |
Income Below Poverty Among Married-Couple vs Single-Parent Households in Norcross
The poverty data for Norcross shows that 311 of the married-couple family households (9.4%) and 163 of the single-parent households (14.3%) are living below the poverty level. Within the married-couple family households, those with 5 or more children have the highest poverty rate, with 39 households (86.7%) falling below the poverty line. Among the single-parent households, those with 3 or 4 children have the highest poverty rate, with 85 household (77.3%) living below poverty.
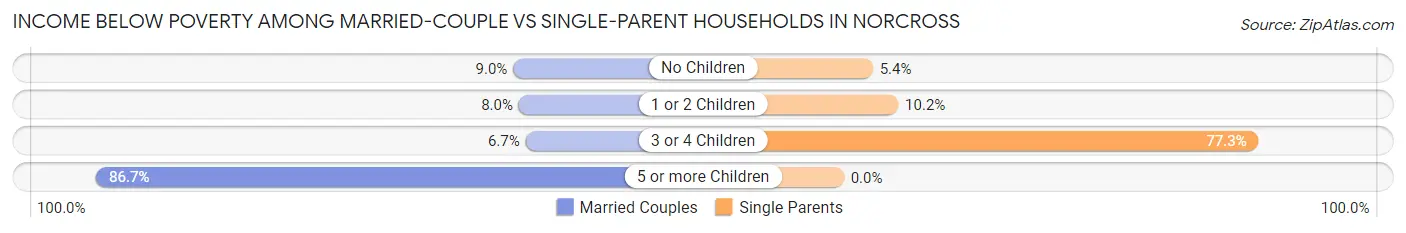
| Children | Married-Couple Families | Single-Parent Households |
| No Children | 137 (9.0%) | 30 (5.4%) |
| 1 or 2 Children | 114 (8.0%) | 48 (10.2%) |
| 3 or 4 Children | 21 (6.7%) | 85 (77.3%) |
| 5 or more Children | 39 (86.7%) | 0 (0.0%) |
| Total | 311 (9.4%) | 163 (14.3%) |
Race in Norcross
The most populous races in Norcross are Hispanic or Latino (6,413 | 36.6%), White / Caucasian (4,891 | 27.9%), and Black / African American (4,823 | 27.5%).
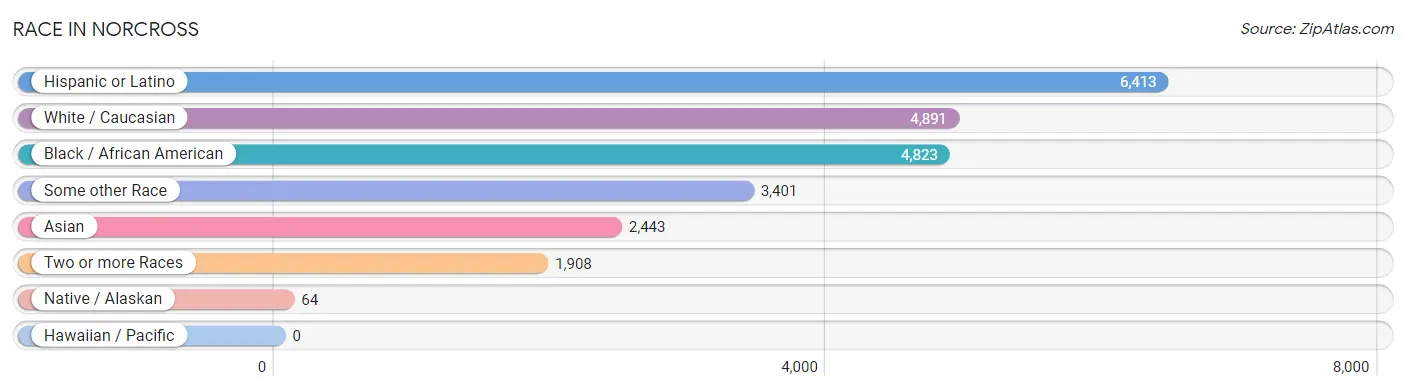
| Race | # Population | % Population |
| Asian | 2,443 | 13.9% |
| Black / African American | 4,823 | 27.5% |
| Hawaiian / Pacific | 0 | 0.0% |
| Hispanic or Latino | 6,413 | 36.6% |
| Native / Alaskan | 64 | 0.4% |
| White / Caucasian | 4,891 | 27.9% |
| Two or more Races | 1,908 | 10.9% |
| Some other Race | 3,401 | 19.4% |
| Total | 17,530 | 100.0% |
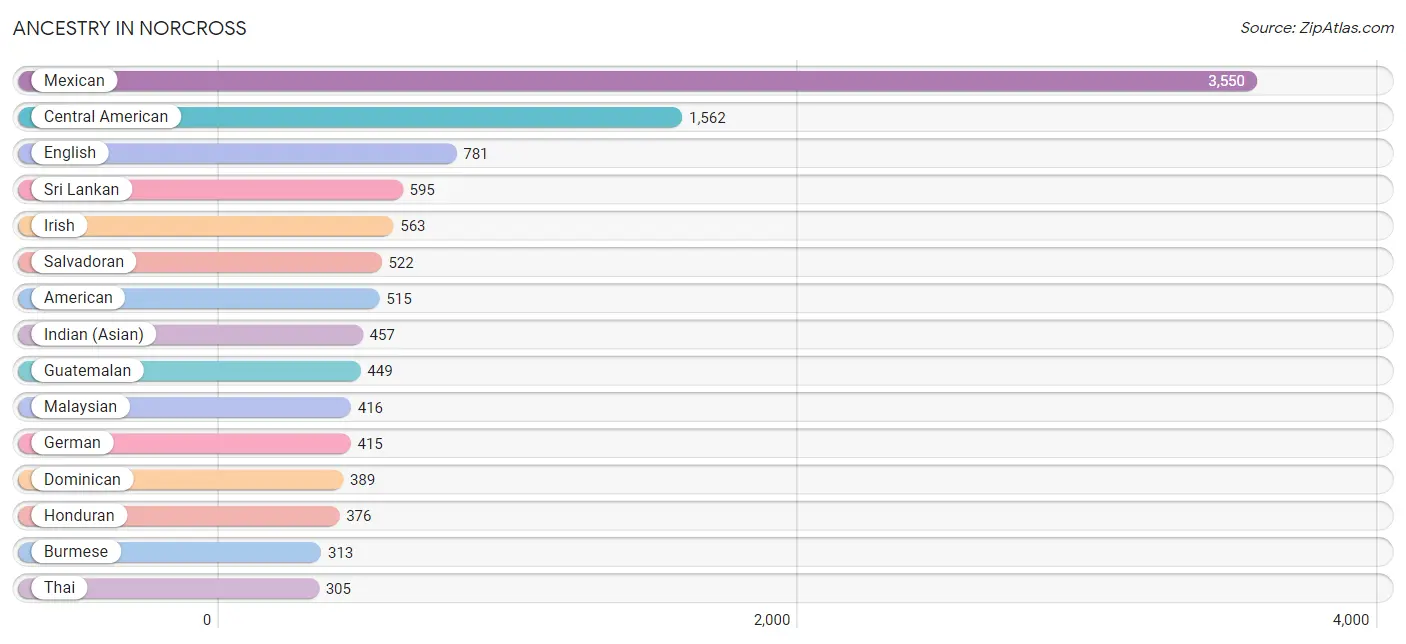
Ancestry in Norcross
The most populous ancestries reported in Norcross are Mexican (3,550 | 20.3%), Central American (1,562 | 8.9%), English (781 | 4.5%), Sri Lankan (595 | 3.4%), and Irish (563 | 3.2%), together accounting for 40.2% of all Norcross residents.
| Ancestry | # Population | % Population |
| Afghan | 47 | 0.3% |
| African | 30 | 0.2% |
| American | 515 | 2.9% |
| Argentinean | 30 | 0.2% |
| Armenian | 13 | 0.1% |
| Australian | 11 | 0.1% |
| Belizean | 119 | 0.7% |
| Bhutanese | 47 | 0.3% |
| British | 7 | 0.0% |
| Burmese | 313 | 1.8% |
| Central American | 1,562 | 8.9% |
| Cherokee | 37 | 0.2% |
| Colombian | 161 | 0.9% |
| Costa Rican | 115 | 0.7% |
| Croatian | 9 | 0.1% |
| Cuban | 220 | 1.3% |
| Danish | 9 | 0.1% |
| Dominican | 389 | 2.2% |
| Ecuadorian | 16 | 0.1% |
| English | 781 | 4.5% |
| Ethiopian | 38 | 0.2% |
| European | 178 | 1.0% |
| Finnish | 7 | 0.0% |
| French | 168 | 1.0% |
| French Canadian | 7 | 0.0% |
| German | 415 | 2.4% |
| Ghanaian | 54 | 0.3% |
| Greek | 10 | 0.1% |
| Guatemalan | 449 | 2.6% |
| Haitian | 132 | 0.7% |
| Honduran | 376 | 2.1% |
| Hungarian | 41 | 0.2% |
| Indian (Asian) | 457 | 2.6% |
| Indonesian | 213 | 1.2% |
| Irish | 563 | 3.2% |
| Italian | 199 | 1.1% |
| Jamaican | 141 | 0.8% |
| Korean | 60 | 0.3% |
| Malaysian | 416 | 2.4% |
| Mexican | 3,550 | 20.3% |
| Mexican American Indian | 23 | 0.1% |
| Mongolian | 54 | 0.3% |
| Nicaraguan | 46 | 0.3% |
| Norwegian | 46 | 0.3% |
| Pakistani | 36 | 0.2% |
| Panamanian | 54 | 0.3% |
| Peruvian | 12 | 0.1% |
| Polish | 46 | 0.3% |
| Portuguese | 16 | 0.1% |
| Puerto Rican | 191 | 1.1% |
| Russian | 24 | 0.1% |
| Salvadoran | 522 | 3.0% |
| Scotch-Irish | 73 | 0.4% |
| Scottish | 198 | 1.1% |
| South African | 28 | 0.2% |
| South American | 276 | 1.6% |
| Spaniard | 77 | 0.4% |
| Spanish | 31 | 0.2% |
| Sri Lankan | 595 | 3.4% |
| Subsaharan African | 181 | 1.0% |
| Swedish | 34 | 0.2% |
| Swiss | 77 | 0.4% |
| Thai | 305 | 1.7% |
| Ukrainian | 9 | 0.1% |
| Venezuelan | 57 | 0.3% |
| Vietnamese | 264 | 1.5% |
| Welsh | 45 | 0.3% |
| West Indian | 10 | 0.1% |
| Yugoslavian | 9 | 0.1% | View All 69 Rows |
Immigrants in Norcross
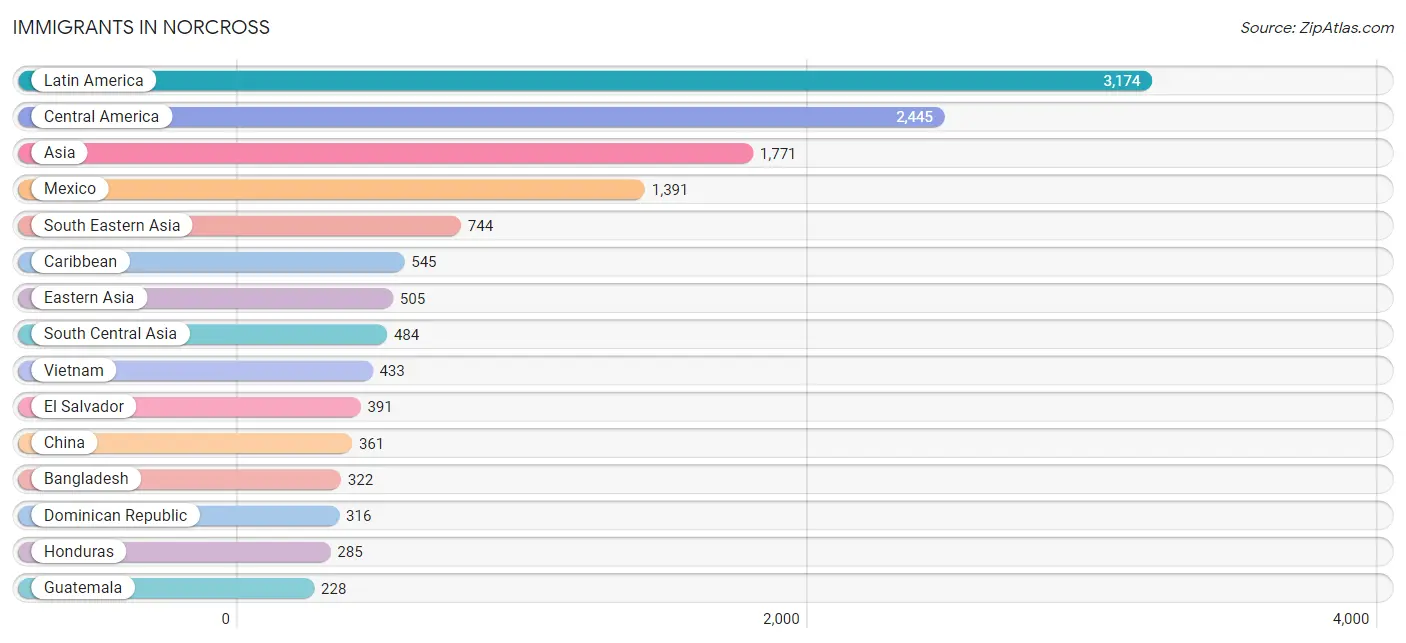
The most numerous immigrant groups reported in Norcross came from Latin America (3,174 | 18.1%), Central America (2,445 | 14.0%), Asia (1,771 | 10.1%), Mexico (1,391 | 7.9%), and South Eastern Asia (744 | 4.2%), together accounting for 54.3% of all Norcross residents.
| Immigration Origin | # Population | % Population |
| Afghanistan | 23 | 0.1% |
| Africa | 156 | 0.9% |
| Argentina | 30 | 0.2% |
| Asia | 1,771 | 10.1% |
| Australia | 8 | 0.1% |
| Bangladesh | 322 | 1.8% |
| Belize | 32 | 0.2% |
| Bosnia and Herzegovina | 9 | 0.1% |
| Canada | 11 | 0.1% |
| Caribbean | 545 | 3.1% |
| Central America | 2,445 | 14.0% |
| China | 361 | 2.1% |
| Colombia | 97 | 0.5% |
| Costa Rica | 55 | 0.3% |
| Croatia | 9 | 0.1% |
| Cuba | 120 | 0.7% |
| Dominican Republic | 316 | 1.8% |
| Eastern Africa | 41 | 0.2% |
| Eastern Asia | 505 | 2.9% |
| Eastern Europe | 31 | 0.2% |
| Ecuador | 16 | 0.1% |
| El Salvador | 391 | 2.2% |
| Ethiopia | 33 | 0.2% |
| Europe | 173 | 1.0% |
| France | 79 | 0.4% |
| Ghana | 54 | 0.3% |
| Guatemala | 228 | 1.3% |
| Haiti | 28 | 0.2% |
| Honduras | 285 | 1.6% |
| Hong Kong | 4 | 0.0% |
| India | 139 | 0.8% |
| Jamaica | 71 | 0.4% |
| Kenya | 8 | 0.1% |
| Korea | 144 | 0.8% |
| Laos | 29 | 0.2% |
| Latin America | 3,174 | 18.1% |
| Lebanon | 38 | 0.2% |
| Malaysia | 61 | 0.4% |
| Mexico | 1,391 | 7.9% |
| Nicaragua | 17 | 0.1% |
| Northern Europe | 11 | 0.1% |
| Oceania | 8 | 0.1% |
| Panama | 46 | 0.3% |
| Peru | 12 | 0.1% |
| Philippines | 7 | 0.0% |
| Russia | 13 | 0.1% |
| South Africa | 24 | 0.1% |
| South America | 184 | 1.1% |
| South Central Asia | 484 | 2.8% |
| South Eastern Asia | 744 | 4.2% |
| Switzerland | 52 | 0.3% |
| Thailand | 44 | 0.3% |
| Venezuela | 29 | 0.2% |
| Vietnam | 433 | 2.5% |
| Western Africa | 91 | 0.5% |
| Western Asia | 38 | 0.2% |
| Western Europe | 131 | 0.7% | View All 57 Rows |
Sex and Age in Norcross
Sex and Age in Norcross
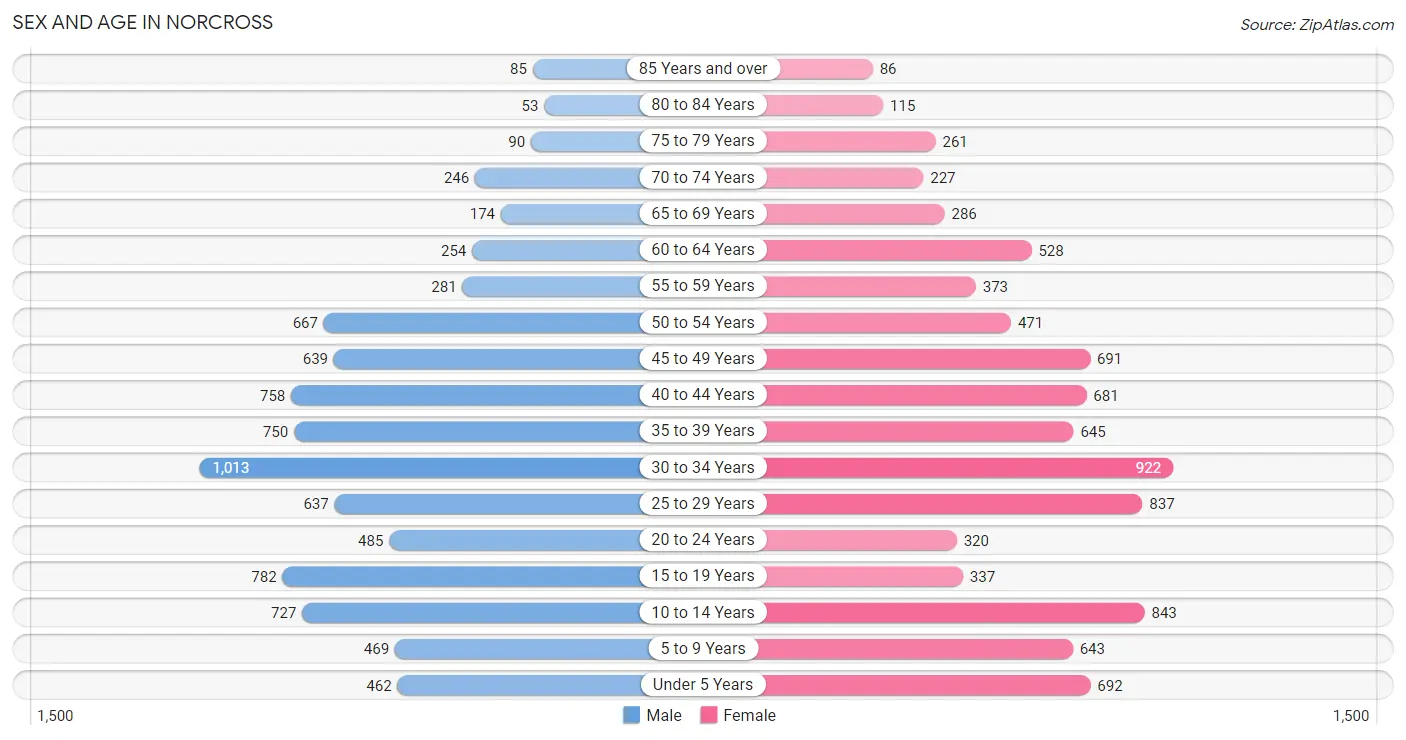
The most populous age groups in Norcross are 30 to 34 Years (1,013 | 11.8%) for men and 30 to 34 Years (922 | 10.3%) for women.
| Age Bracket | Male | Female |
| Under 5 Years | 462 (5.4%) | 692 (7.7%) |
| 5 to 9 Years | 469 (5.5%) | 643 (7.2%) |
| 10 to 14 Years | 727 (8.5%) | 843 (9.4%) |
| 15 to 19 Years | 782 (9.1%) | 337 (3.8%) |
| 20 to 24 Years | 485 (5.7%) | 320 (3.6%) |
| 25 to 29 Years | 637 (7.4%) | 837 (9.3%) |
| 30 to 34 Years | 1,013 (11.8%) | 922 (10.3%) |
| 35 to 39 Years | 750 (8.7%) | 645 (7.2%) |
| 40 to 44 Years | 758 (8.8%) | 681 (7.6%) |
| 45 to 49 Years | 639 (7.4%) | 691 (7.7%) |
| 50 to 54 Years | 667 (7.8%) | 471 (5.3%) |
| 55 to 59 Years | 281 (3.3%) | 373 (4.2%) |
| 60 to 64 Years | 254 (3.0%) | 528 (5.9%) |
| 65 to 69 Years | 174 (2.0%) | 286 (3.2%) |
| 70 to 74 Years | 246 (2.9%) | 227 (2.5%) |
| 75 to 79 Years | 90 (1.1%) | 261 (2.9%) |
| 80 to 84 Years | 53 (0.6%) | 115 (1.3%) |
| 85 Years and over | 85 (1.0%) | 86 (1.0%) |
| Total | 8,572 (100.0%) | 8,958 (100.0%) |
Families and Households in Norcross
Median Family Size in Norcross
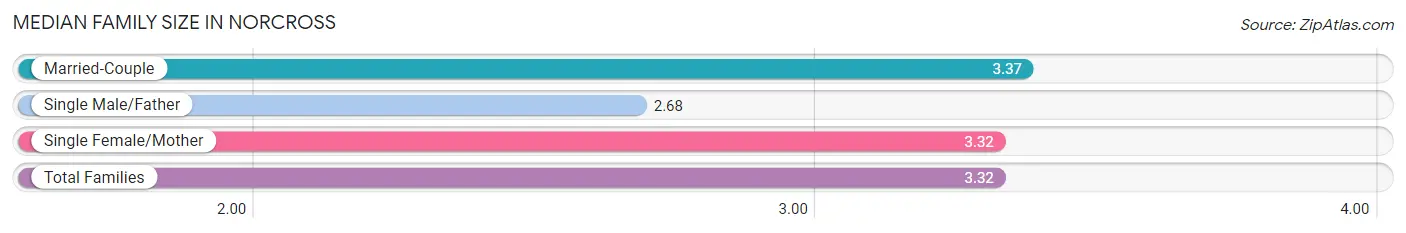
The median family size in Norcross is 3.32 persons per family, with married-couple families (3,316 | 74.5%) accounting for the largest median family size of 3.37 persons per family. On the other hand, single male/father families (273 | 6.1%) represent the smallest median family size with 2.68 persons per family.
| Family Type | # Families | Family Size |
| Married-Couple | 3,316 (74.5%) | 3.37 |
| Single Male/Father | 273 (6.1%) | 2.68 |
| Single Female/Mother | 865 (19.4%) | 3.32 |
| Total Families | 4,454 (100.0%) | 3.32 |
Median Household Size in Norcross
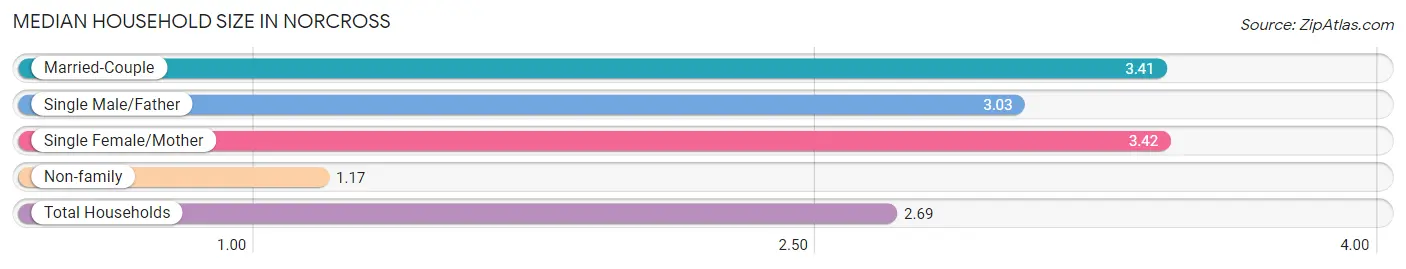
The median household size in Norcross is 2.69 persons per household, with single female/mother households (865 | 13.3%) accounting for the largest median household size of 3.42 persons per household. non-family households (2,034 | 31.4%) represent the smallest median household size with 1.17 persons per household.
| Household Type | # Households | Household Size |
| Married-Couple | 3,316 (51.1%) | 3.41 |
| Single Male/Father | 273 (4.2%) | 3.03 |
| Single Female/Mother | 865 (13.3%) | 3.42 |
| Non-family | 2,034 (31.4%) | 1.17 |
| Total Households | 6,488 (100.0%) | 2.69 |
Household Size by Marriage Status in Norcross
Out of a total of 6,488 households in Norcross, 4,454 (68.6%) are family households, while 2,034 (31.4%) are nonfamily households. The most numerous type of family households are 2-person households, comprising 1,564, and the most common type of nonfamily households are 1-person households, comprising 1,728.
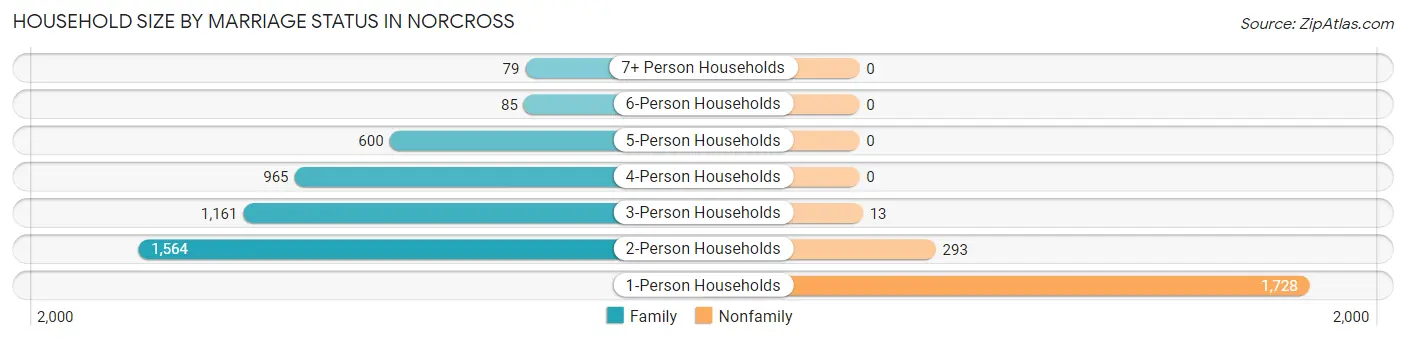
| Household Size | Family Households | Nonfamily Households |
| 1-Person Households | - | 1,728 (26.6%) |
| 2-Person Households | 1,564 (24.1%) | 293 (4.5%) |
| 3-Person Households | 1,161 (17.9%) | 13 (0.2%) |
| 4-Person Households | 965 (14.9%) | 0 (0.0%) |
| 5-Person Households | 600 (9.2%) | 0 (0.0%) |
| 6-Person Households | 85 (1.3%) | 0 (0.0%) |
| 7+ Person Households | 79 (1.2%) | 0 (0.0%) |
| Total | 4,454 (68.6%) | 2,034 (31.4%) |
Female Fertility in Norcross
Fertility by Age in Norcross
Average fertility rate in Norcross is 57.0 births per 1,000 women. Women in the age bracket of 20 to 34 years have the highest fertility rate with 85.0 births per 1,000 women. Women in the age bracket of 20 to 34 years acount for 67.4% of all women with births.
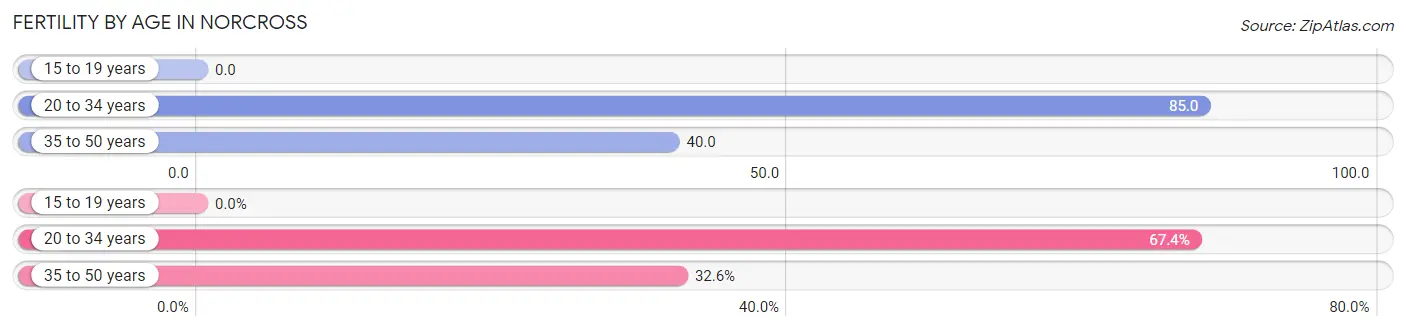
| Age Bracket | Women with Births | Births / 1,000 Women |
| 15 to 19 years | 0 (0.0%) | 0.0 |
| 20 to 34 years | 176 (67.4%) | 85.0 |
| 35 to 50 years | 85 (32.6%) | 40.0 |
| Total | 261 (100.0%) | 57.0 |
Fertility by Age by Marriage Status in Norcross
90.0% of women with births (261) in Norcross are married. The highest percentage of unmarried women with births falls into 20 to 34 years age bracket with 14.8% of them unmarried at the time of birth, while the lowest percentage of unmarried women with births belong to 35 to 50 years age bracket with 0.0% of them unmarried.
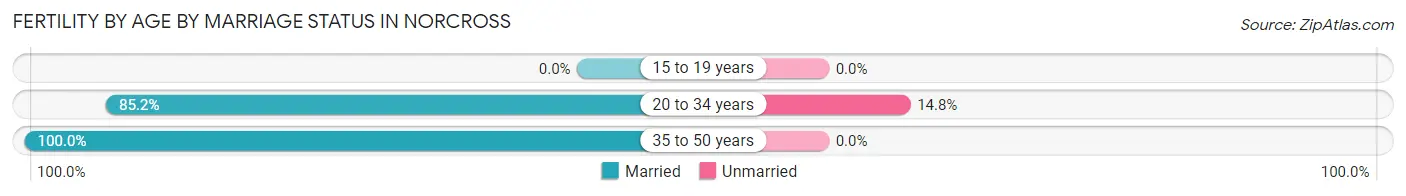
| Age Bracket | Married | Unmarried |
| 15 to 19 years | 0 (0.0%) | 0 (0.0%) |
| 20 to 34 years | 150 (85.2%) | 26 (14.8%) |
| 35 to 50 years | 85 (100.0%) | 0 (0.0%) |
| Total | 235 (90.0%) | 26 (10.0%) |
Fertility by Education in Norcross
Average fertility rate in Norcross is 57.0 births per 1,000 women. Women with the education attainment of college or associate's degree have the highest fertility rate of 108.0 births per 1,000 women, while women with the education attainment of bachelor's degree have the lowest fertility at 29.0 births per 1,000 women. Women with the education attainment of college or associate's degree represent 33.7% of all women with births.
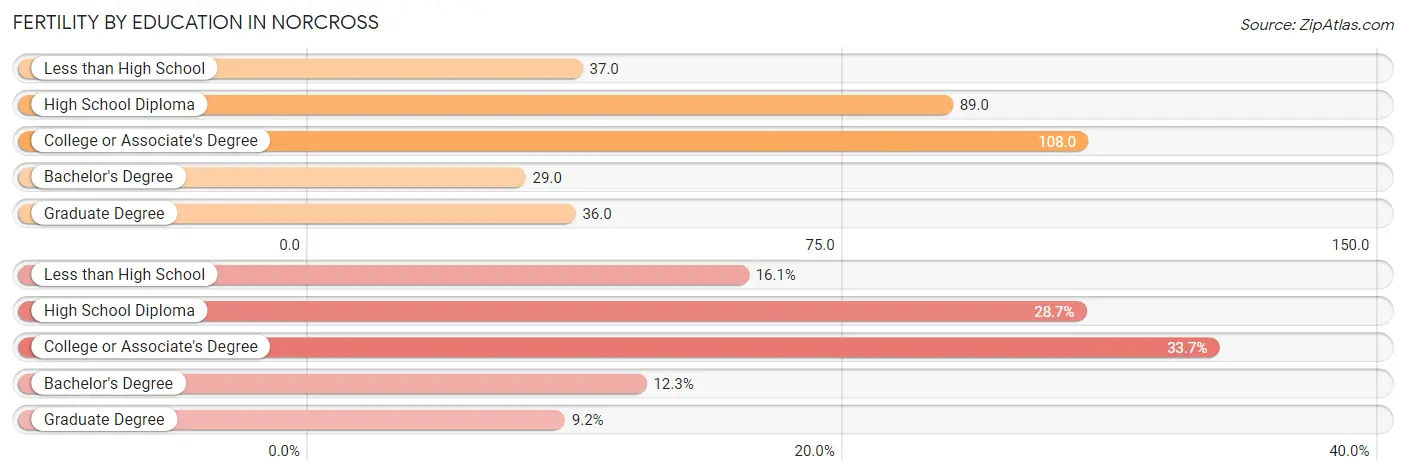
| Educational Attainment | Women with Births | Births / 1,000 Women |
| Less than High School | 42 (16.1%) | 37.0 |
| High School Diploma | 75 (28.7%) | 89.0 |
| College or Associate's Degree | 88 (33.7%) | 108.0 |
| Bachelor's Degree | 32 (12.3%) | 29.0 |
| Graduate Degree | 24 (9.2%) | 36.0 |
| Total | 261 (100.0%) | 57.0 |
Fertility by Education by Marriage Status in Norcross
10.0% of women with births in Norcross are unmarried. Women with the educational attainment of high school diploma are most likely to be married with 100.0% of them married at childbirth, while women with the educational attainment of less than high school are least likely to be married with 33.3% of them unmarried at childbirth.
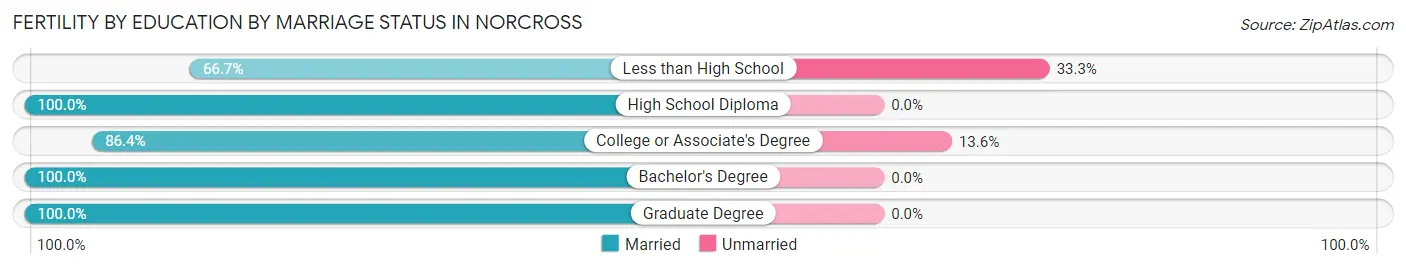
| Educational Attainment | Married | Unmarried |
| Less than High School | 28 (66.7%) | 14 (33.3%) |
| High School Diploma | 75 (100.0%) | 0 (0.0%) |
| College or Associate's Degree | 76 (86.4%) | 12 (13.6%) |
| Bachelor's Degree | 32 (100.0%) | 0 (0.0%) |
| Graduate Degree | 24 (100.0%) | 0 (0.0%) |
| Total | 235 (90.0%) | 26 (10.0%) |
Employment Characteristics in Norcross
Employment by Class of Employer in Norcross
Among the 8,948 employed individuals in Norcross, private company employees (6,886 | 77.0%), self-employed (not incorporated) (461 | 5.1%), and not-for-profit organizations (447 | 5.0%) make up the most common classes of employment.
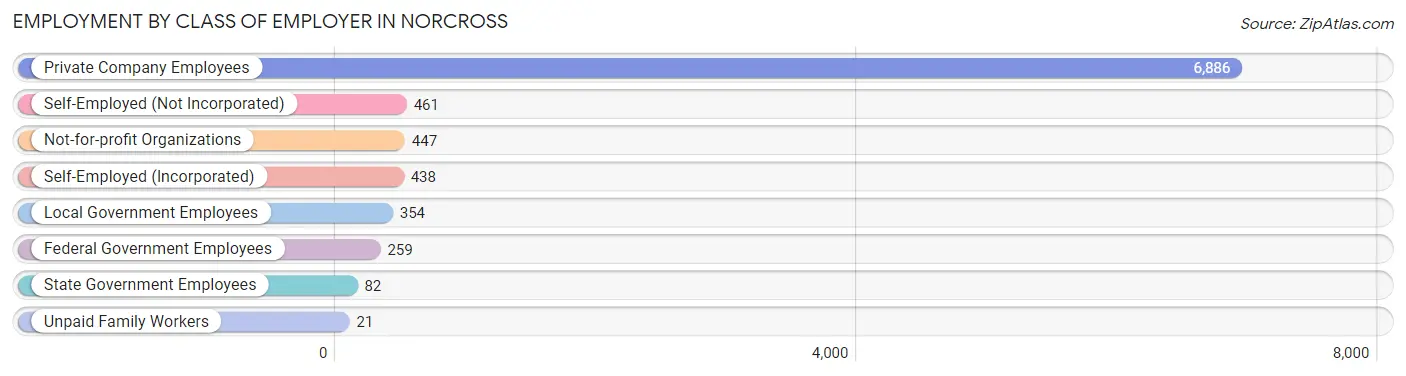
| Employer Class | # Employees | % Employees |
| Private Company Employees | 6,886 | 77.0% |
| Self-Employed (Incorporated) | 438 | 4.9% |
| Self-Employed (Not Incorporated) | 461 | 5.1% |
| Not-for-profit Organizations | 447 | 5.0% |
| Local Government Employees | 354 | 4.0% |
| State Government Employees | 82 | 0.9% |
| Federal Government Employees | 259 | 2.9% |
| Unpaid Family Workers | 21 | 0.2% |
| Total | 8,948 | 100.0% |
Employment Status by Age in Norcross
According to the labor force statistics for Norcross, out of the total population over 16 years of age (13,360), 73.6% or 9,833 individuals are in the labor force, with 1.8% or 177 of them unemployed. The age group with the highest labor force participation rate is 45 to 54 years, with 97.0% or 2,394 individuals in the labor force. Within the labor force, the 65 to 74 years age range has the highest percentage of unemployed individuals, with 19.3% or 36 of them being unemployed.
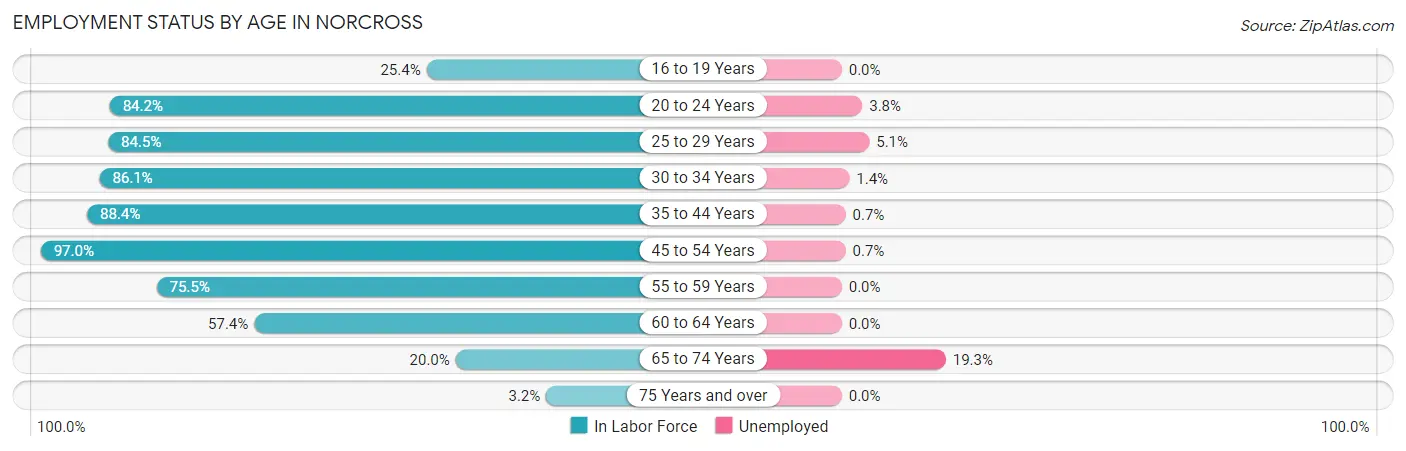
| Age Bracket | In Labor Force | Unemployed |
| 16 to 19 Years | 199 (25.4%) | 0 (0.0%) |
| 20 to 24 Years | 678 (84.2%) | 26 (3.8%) |
| 25 to 29 Years | 1,246 (84.5%) | 64 (5.1%) |
| 30 to 34 Years | 1,666 (86.1%) | 23 (1.4%) |
| 35 to 44 Years | 2,505 (88.4%) | 18 (0.7%) |
| 45 to 54 Years | 2,394 (97.0%) | 17 (0.7%) |
| 55 to 59 Years | 494 (75.5%) | 0 (0.0%) |
| 60 to 64 Years | 449 (57.4%) | 0 (0.0%) |
| 65 to 74 Years | 187 (20.0%) | 36 (19.3%) |
| 75 Years and over | 22 (3.2%) | 0 (0.0%) |
| Total | 9,833 (73.6%) | 177 (1.8%) |
Employment Status by Educational Attainment in Norcross
According to labor force statistics for Norcross, 86.3% of individuals (8,757) out of the total population between 25 and 64 years of age (10,147) are in the labor force, with 1.4% or 123 of them being unemployed. The group with the highest labor force participation rate are those with the educational attainment of bachelor's degree or higher, with 92.9% or 3,656 individuals in the labor force. Within the labor force, individuals with bachelor's degree or higher education have the highest percentage of unemployment, with 1.9% or 69 of them being unemployed.
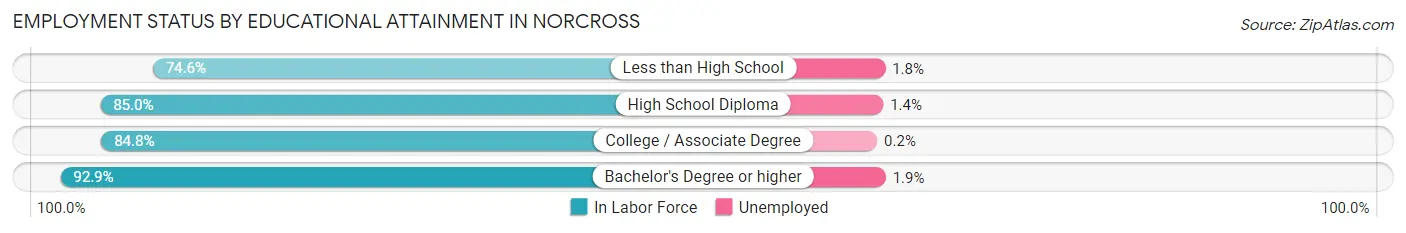
| Educational Attainment | In Labor Force | Unemployed |
| Less than High School | 1,279 (74.6%) | 31 (1.8%) |
| High School Diploma | 1,610 (85.0%) | 27 (1.4%) |
| College / Associate Degree | 2,207 (84.8%) | 5 (0.2%) |
| Bachelor's Degree or higher | 3,656 (92.9%) | 75 (1.9%) |
| Total | 8,757 (86.3%) | 142 (1.4%) |
Employment Occupations by Sex in Norcross
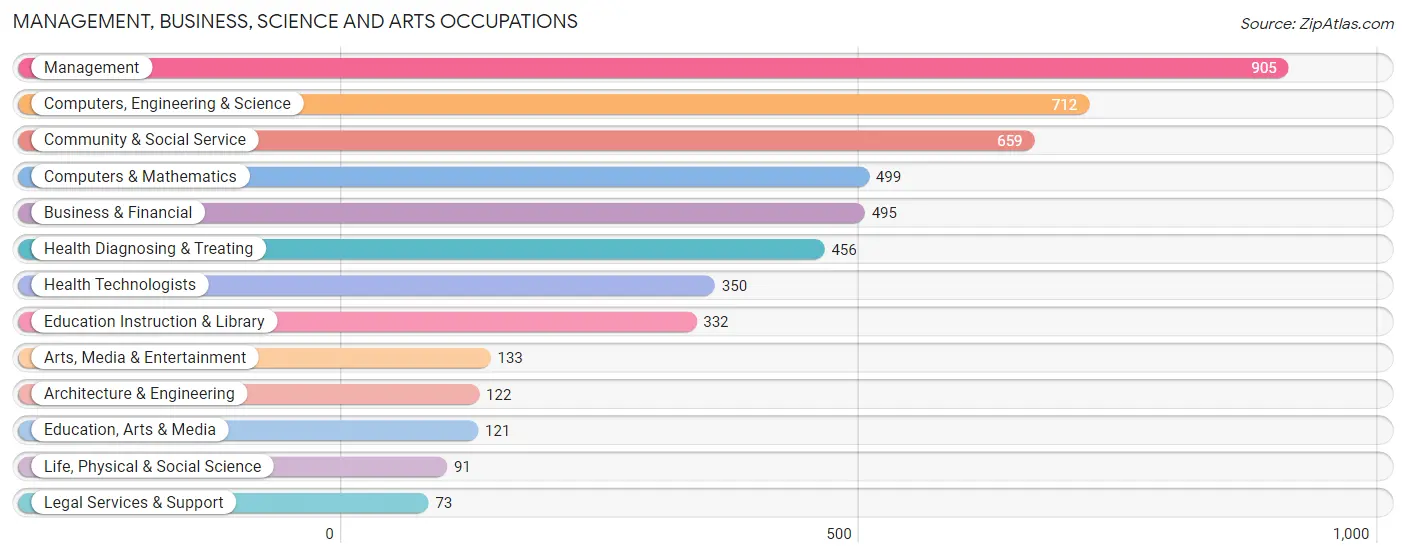
Management, Business, Science and Arts Occupations
The most common Management, Business, Science and Arts occupations in Norcross are Management (905 | 9.4%), Computers, Engineering & Science (712 | 7.4%), Community & Social Service (659 | 6.8%), Computers & Mathematics (499 | 5.2%), and Business & Financial (495 | 5.1%).
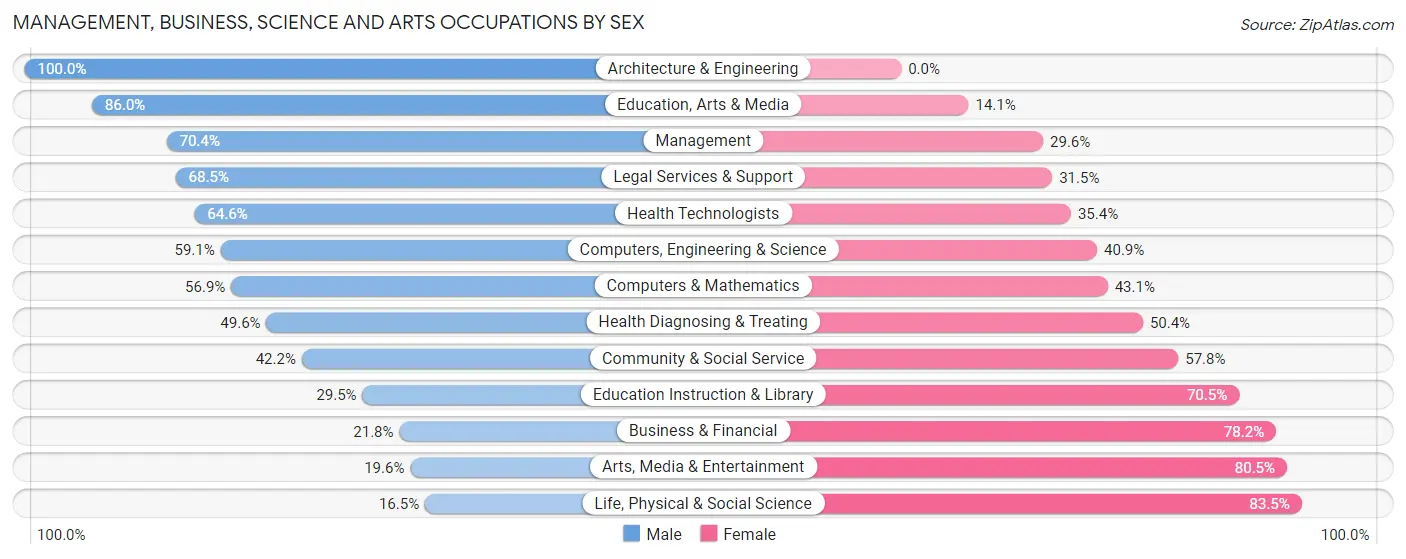
Management, Business, Science and Arts Occupations by Sex
Within the Management, Business, Science and Arts occupations in Norcross, the most male-oriented occupations are Architecture & Engineering (100.0%), Education, Arts & Media (86.0%), and Management (70.4%), while the most female-oriented occupations are Life, Physical & Social Science (83.5%), Arts, Media & Entertainment (80.4%), and Business & Financial (78.2%).
| Occupation | Male | Female |
| Management | 637 (70.4%) | 268 (29.6%) |
| Business & Financial | 108 (21.8%) | 387 (78.2%) |
| Computers, Engineering & Science | 421 (59.1%) | 291 (40.9%) |
| Computers & Mathematics | 284 (56.9%) | 215 (43.1%) |
| Architecture & Engineering | 122 (100.0%) | 0 (0.0%) |
| Life, Physical & Social Science | 15 (16.5%) | 76 (83.5%) |
| Community & Social Service | 278 (42.2%) | 381 (57.8%) |
| Education, Arts & Media | 104 (86.0%) | 17 (14.1%) |
| Legal Services & Support | 50 (68.5%) | 23 (31.5%) |
| Education Instruction & Library | 98 (29.5%) | 234 (70.5%) |
| Arts, Media & Entertainment | 26 (19.6%) | 107 (80.4%) |
| Health Diagnosing & Treating | 226 (49.6%) | 230 (50.4%) |
| Health Technologists | 226 (64.6%) | 124 (35.4%) |
| Total (Category) | 1,670 (51.7%) | 1,557 (48.2%) |
| Total (Overall) | 5,433 (56.3%) | 4,224 (43.7%) |
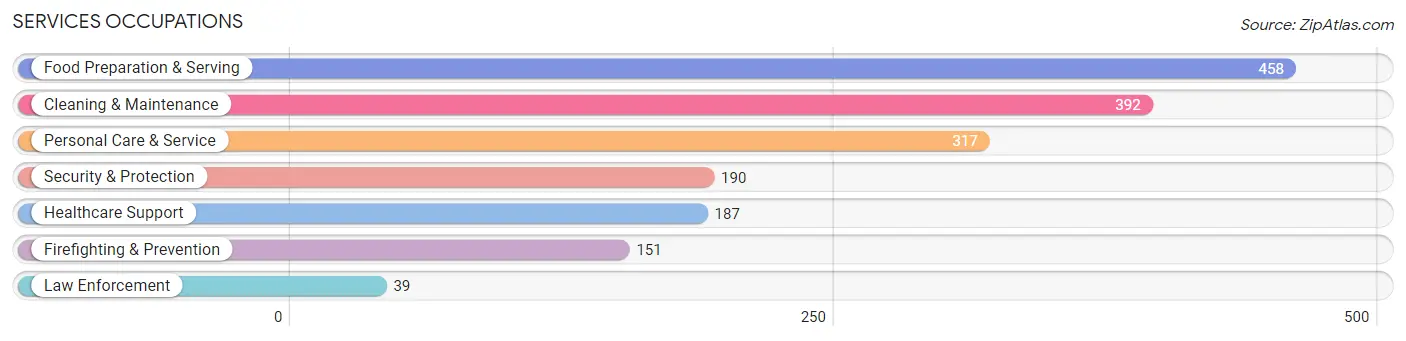
Services Occupations
The most common Services occupations in Norcross are Food Preparation & Serving (458 | 4.7%), Cleaning & Maintenance (392 | 4.1%), Personal Care & Service (317 | 3.3%), Security & Protection (190 | 2.0%), and Healthcare Support (187 | 1.9%).
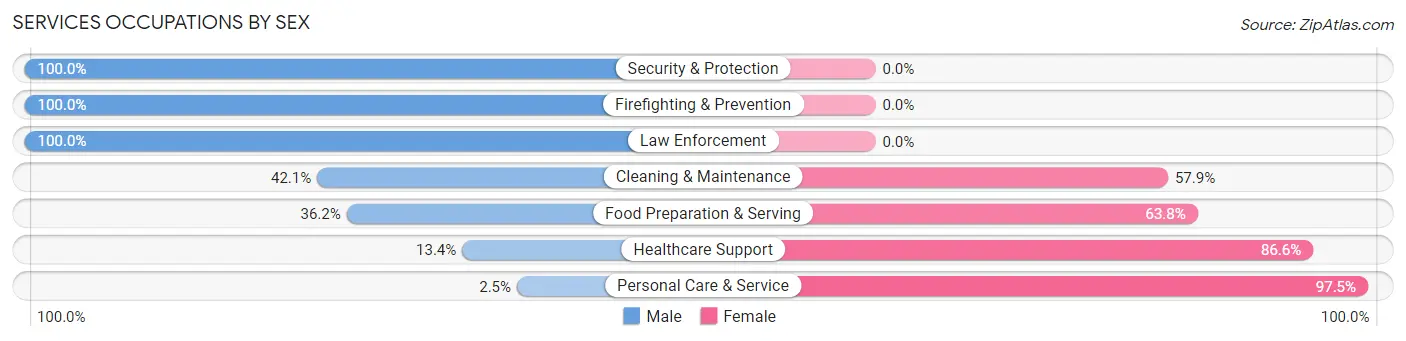
Services Occupations by Sex
Within the Services occupations in Norcross, the most male-oriented occupations are Security & Protection (100.0%), Firefighting & Prevention (100.0%), and Law Enforcement (100.0%), while the most female-oriented occupations are Personal Care & Service (97.5%), Healthcare Support (86.6%), and Food Preparation & Serving (63.8%).
| Occupation | Male | Female |
| Healthcare Support | 25 (13.4%) | 162 (86.6%) |
| Security & Protection | 190 (100.0%) | 0 (0.0%) |
| Firefighting & Prevention | 151 (100.0%) | 0 (0.0%) |
| Law Enforcement | 39 (100.0%) | 0 (0.0%) |
| Food Preparation & Serving | 166 (36.2%) | 292 (63.8%) |
| Cleaning & Maintenance | 165 (42.1%) | 227 (57.9%) |
| Personal Care & Service | 8 (2.5%) | 309 (97.5%) |
| Total (Category) | 554 (35.9%) | 990 (64.1%) |
| Total (Overall) | 5,433 (56.3%) | 4,224 (43.7%) |
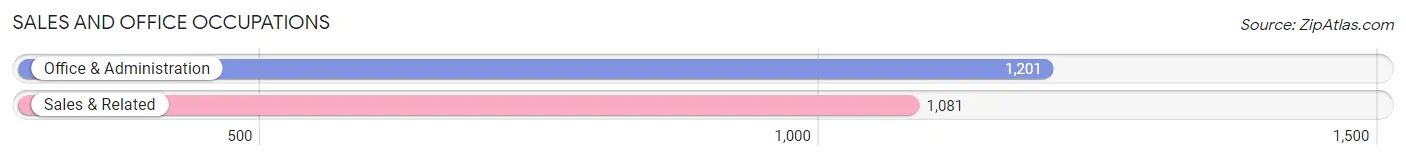
Sales and Office Occupations
The most common Sales and Office occupations in Norcross are Office & Administration (1,201 | 12.4%), and Sales & Related (1,081 | 11.2%).
Sales and Office Occupations by Sex
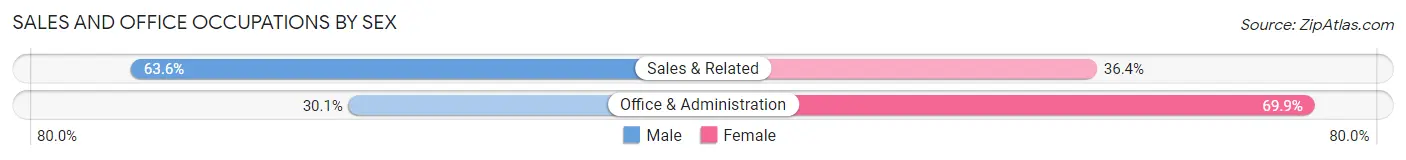
| Occupation | Male | Female |
| Sales & Related | 688 (63.6%) | 393 (36.4%) |
| Office & Administration | 362 (30.1%) | 839 (69.9%) |
| Total (Category) | 1,050 (46.0%) | 1,232 (54.0%) |
| Total (Overall) | 5,433 (56.3%) | 4,224 (43.7%) |
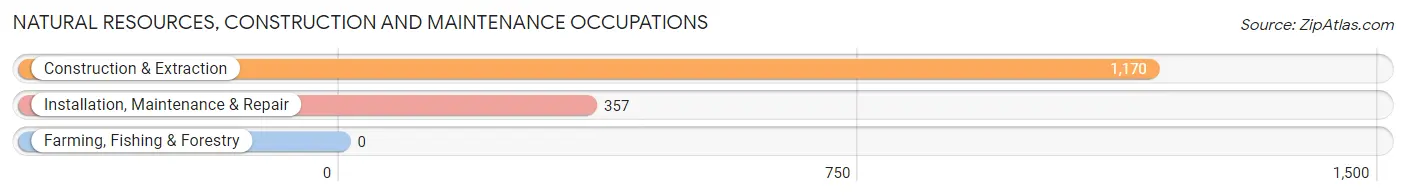
Natural Resources, Construction and Maintenance Occupations
The most common Natural Resources, Construction and Maintenance occupations in Norcross are Construction & Extraction (1,170 | 12.1%), and Installation, Maintenance & Repair (357 | 3.7%).
Natural Resources, Construction and Maintenance Occupations by Sex
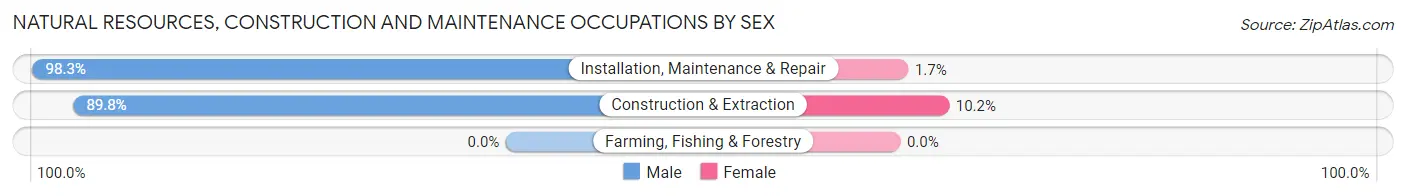
| Occupation | Male | Female |
| Farming, Fishing & Forestry | 0 (0.0%) | 0 (0.0%) |
| Construction & Extraction | 1,051 (89.8%) | 119 (10.2%) |
| Installation, Maintenance & Repair | 351 (98.3%) | 6 (1.7%) |
| Total (Category) | 1,402 (91.8%) | 125 (8.2%) |
| Total (Overall) | 5,433 (56.3%) | 4,224 (43.7%) |
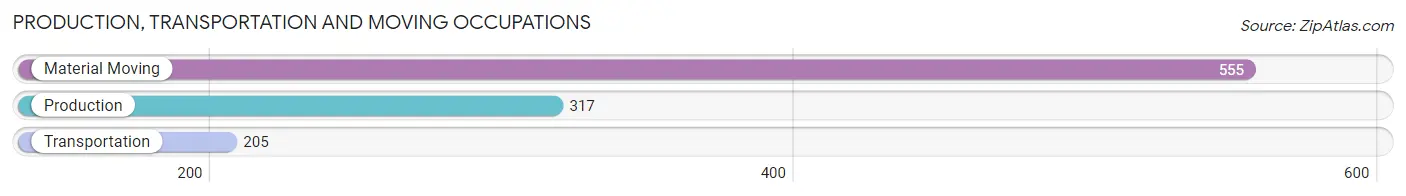
Production, Transportation and Moving Occupations
The most common Production, Transportation and Moving occupations in Norcross are Material Moving (555 | 5.8%), Production (317 | 3.3%), and Transportation (205 | 2.1%).
Production, Transportation and Moving Occupations by Sex
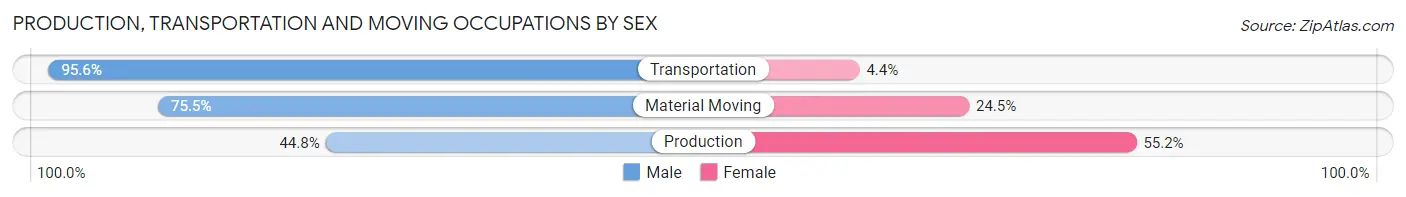
| Occupation | Male | Female |
| Production | 142 (44.8%) | 175 (55.2%) |
| Transportation | 196 (95.6%) | 9 (4.4%) |
| Material Moving | 419 (75.5%) | 136 (24.5%) |
| Total (Category) | 757 (70.3%) | 320 (29.7%) |
| Total (Overall) | 5,433 (56.3%) | 4,224 (43.7%) |
Employment Industries by Sex in Norcross
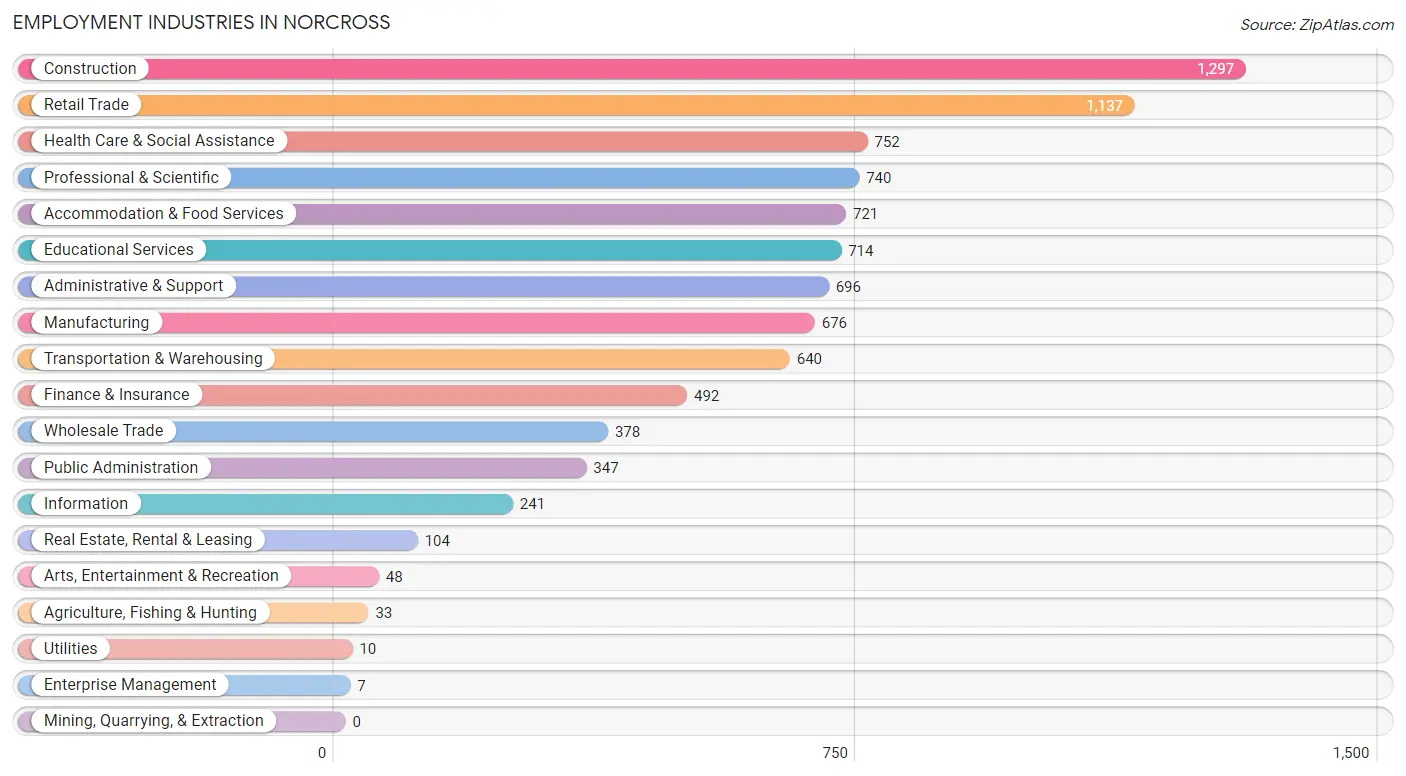
Employment Industries in Norcross
The major employment industries in Norcross include Construction (1,297 | 13.4%), Retail Trade (1,137 | 11.8%), Health Care & Social Assistance (752 | 7.8%), Professional & Scientific (740 | 7.7%), and Accommodation & Food Services (721 | 7.5%).
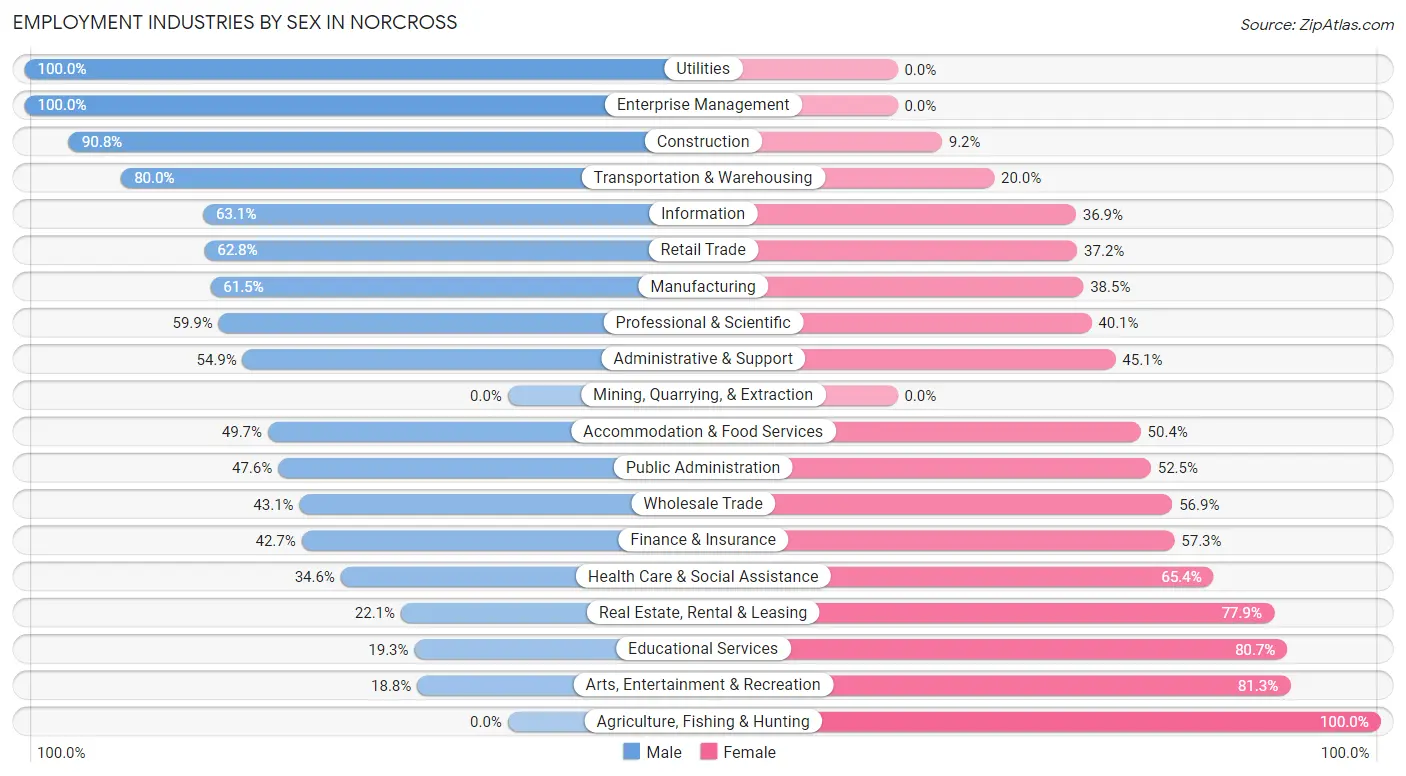
Employment Industries by Sex in Norcross
The Norcross industries that see more men than women are Utilities (100.0%), Enterprise Management (100.0%), and Construction (90.8%), whereas the industries that tend to have a higher number of women are Agriculture, Fishing & Hunting (100.0%), Arts, Entertainment & Recreation (81.2%), and Educational Services (80.7%).
| Industry | Male | Female |
| Agriculture, Fishing & Hunting | 0 (0.0%) | 33 (100.0%) |
| Mining, Quarrying, & Extraction | 0 (0.0%) | 0 (0.0%) |
| Construction | 1,178 (90.8%) | 119 (9.2%) |
| Manufacturing | 416 (61.5%) | 260 (38.5%) |
| Wholesale Trade | 163 (43.1%) | 215 (56.9%) |
| Retail Trade | 714 (62.8%) | 423 (37.2%) |
| Transportation & Warehousing | 512 (80.0%) | 128 (20.0%) |
| Utilities | 10 (100.0%) | 0 (0.0%) |
| Information | 152 (63.1%) | 89 (36.9%) |
| Finance & Insurance | 210 (42.7%) | 282 (57.3%) |
| Real Estate, Rental & Leasing | 23 (22.1%) | 81 (77.9%) |
| Professional & Scientific | 443 (59.9%) | 297 (40.1%) |
| Enterprise Management | 7 (100.0%) | 0 (0.0%) |
| Administrative & Support | 382 (54.9%) | 314 (45.1%) |
| Educational Services | 138 (19.3%) | 576 (80.7%) |
| Health Care & Social Assistance | 260 (34.6%) | 492 (65.4%) |
| Arts, Entertainment & Recreation | 9 (18.8%) | 39 (81.2%) |
| Accommodation & Food Services | 358 (49.6%) | 363 (50.3%) |
| Public Administration | 165 (47.5%) | 182 (52.4%) |
| Total | 5,433 (56.3%) | 4,224 (43.7%) |
Education in Norcross
School Enrollment in Norcross
The most common levels of schooling among the 4,174 students in Norcross are high school (1,173 | 28.1%), middle school (1,124 | 26.9%), and elementary school (1,012 | 24.2%).
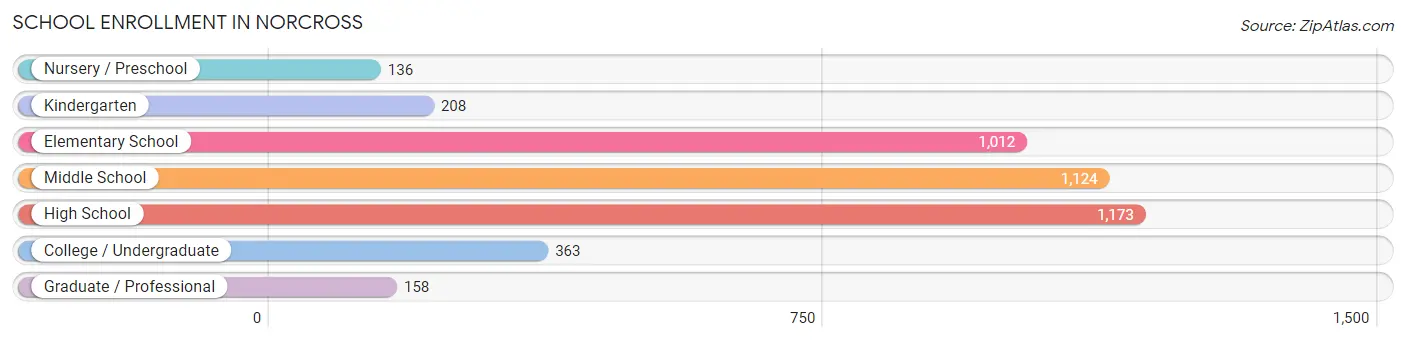
| School Level | # Students | % Students |
| Nursery / Preschool | 136 | 3.3% |
| Kindergarten | 208 | 5.0% |
| Elementary School | 1,012 | 24.2% |
| Middle School | 1,124 | 26.9% |
| High School | 1,173 | 28.1% |
| College / Undergraduate | 363 | 8.7% |
| Graduate / Professional | 158 | 3.8% |
| Total | 4,174 | 100.0% |
School Enrollment by Age by Funding Source in Norcross
Out of a total of 4,174 students who are enrolled in schools in Norcross, 271 (6.5%) attend a private institution, while the remaining 3,903 (93.5%) are enrolled in public schools. The age group of 25 to 34 year olds has the highest likelihood of being enrolled in private schools, with 38 (30.2% in the age bracket) enrolled. Conversely, the age group of 10 to 14 year olds has the lowest likelihood of being enrolled in a private school, with 1,464 (96.0% in the age bracket) attending a public institution.
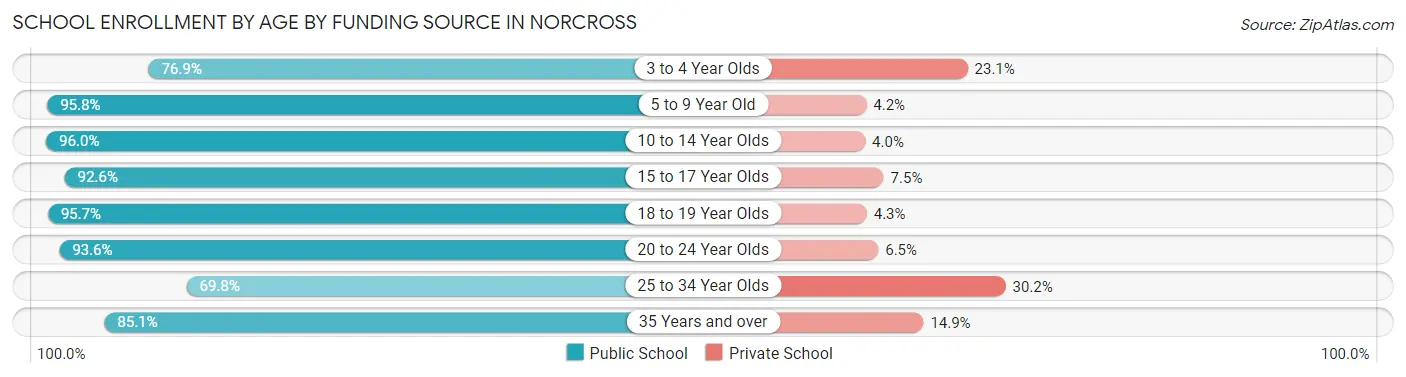
| Age Bracket | Public School | Private School |
| 3 to 4 Year Olds | 90 (76.9%) | 27 (23.1%) |
| 5 to 9 Year Old | 1,021 (95.8%) | 45 (4.2%) |
| 10 to 14 Year Olds | 1,464 (96.0%) | 61 (4.0%) |
| 15 to 17 Year Olds | 745 (92.5%) | 60 (7.4%) |
| 18 to 19 Year Olds | 222 (95.7%) | 10 (4.3%) |
| 20 to 24 Year Olds | 145 (93.5%) | 10 (6.5%) |
| 25 to 34 Year Olds | 88 (69.8%) | 38 (30.2%) |
| 35 Years and over | 126 (85.1%) | 22 (14.9%) |
| Total | 3,903 (93.5%) | 271 (6.5%) |
Educational Attainment by Field of Study in Norcross
Business (1,314 | 29.1%), education (519 | 11.5%), computers & mathematics (463 | 10.2%), bio, nature & agricultural (404 | 8.9%), and science & technology (394 | 8.7%) are the most common fields of study among 4,516 individuals in Norcross who have obtained a bachelor's degree or higher.
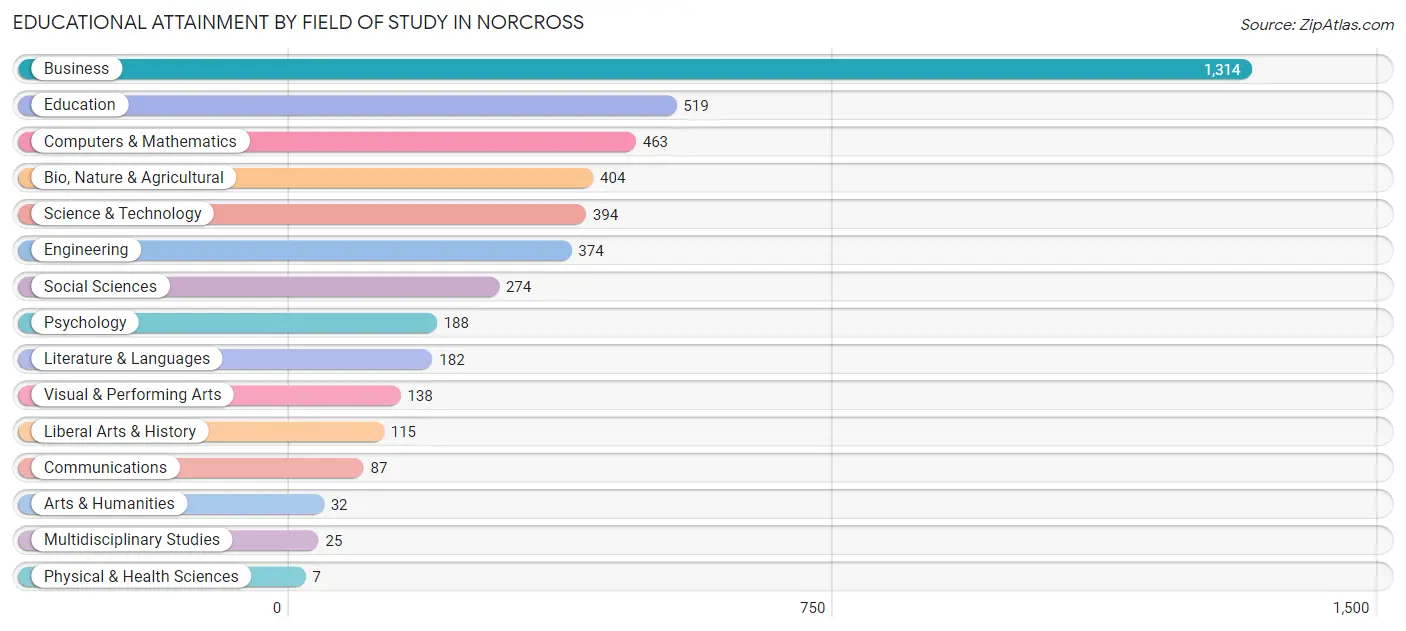
| Field of Study | # Graduates | % Graduates |
| Computers & Mathematics | 463 | 10.2% |
| Bio, Nature & Agricultural | 404 | 8.9% |
| Physical & Health Sciences | 7 | 0.2% |
| Psychology | 188 | 4.2% |
| Social Sciences | 274 | 6.1% |
| Engineering | 374 | 8.3% |
| Multidisciplinary Studies | 25 | 0.5% |
| Science & Technology | 394 | 8.7% |
| Business | 1,314 | 29.1% |
| Education | 519 | 11.5% |
| Literature & Languages | 182 | 4.0% |
| Liberal Arts & History | 115 | 2.5% |
| Visual & Performing Arts | 138 | 3.1% |
| Communications | 87 | 1.9% |
| Arts & Humanities | 32 | 0.7% |
| Total | 4,516 | 100.0% |
Transportation & Commute in Norcross
Vehicle Availability by Sex in Norcross
The most prevalent vehicle ownership categories in Norcross are males with 2 vehicles (2,339, accounting for 46.9%) and females with 2 vehicles (1,923, making up 59.0%).
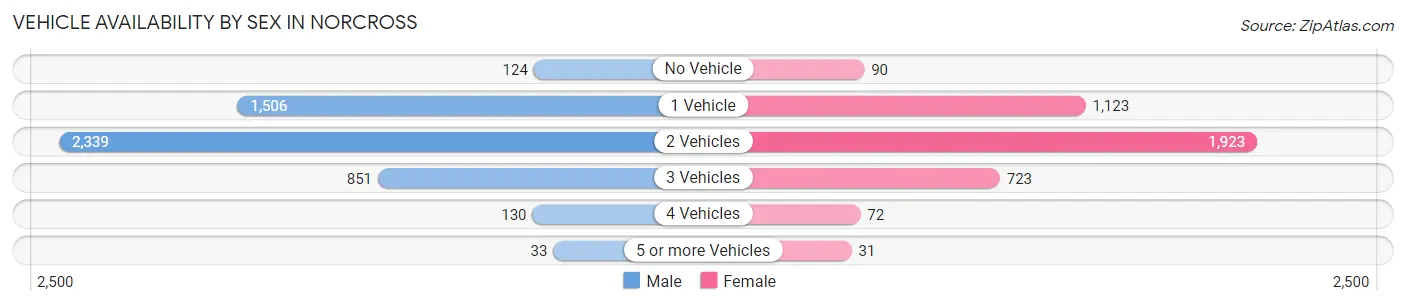
| Vehicles Available | Male | Female |
| No Vehicle | 124 (2.5%) | 90 (2.3%) |
| 1 Vehicle | 1,506 (30.2%) | 1,123 (28.3%) |
| 2 Vehicles | 2,339 (46.9%) | 1,923 (48.5%) |
| 3 Vehicles | 851 (17.1%) | 723 (18.2%) |
| 4 Vehicles | 130 (2.6%) | 72 (1.8%) |
| 5 or more Vehicles | 33 (0.7%) | 31 (0.8%) |
| Total | 4,983 (100.0%) | 3,962 (100.0%) |
Commute Time in Norcross
The most frequently occuring commute durations in Norcross are 10 to 14 minutes (1,271 commuters, 16.9%), 30 to 34 minutes (1,235 commuters, 16.4%), and 15 to 19 minutes (862 commuters, 11.4%).
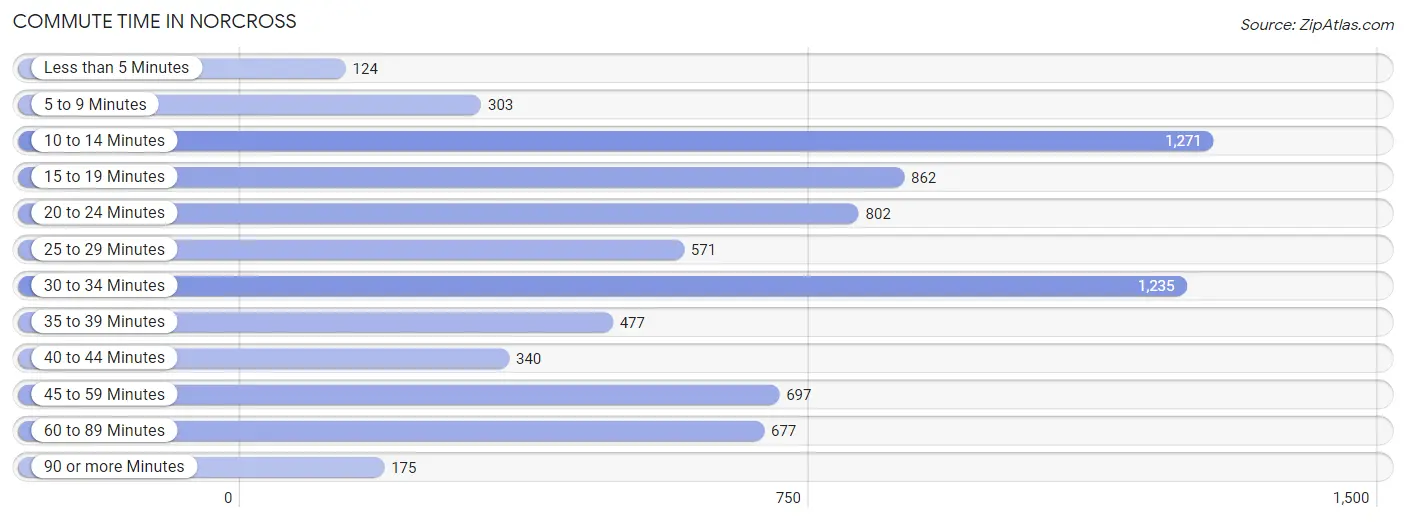
| Commute Time | # Commuters | % Commuters |
| Less than 5 Minutes | 124 | 1.7% |
| 5 to 9 Minutes | 303 | 4.0% |
| 10 to 14 Minutes | 1,271 | 16.9% |
| 15 to 19 Minutes | 862 | 11.4% |
| 20 to 24 Minutes | 802 | 10.6% |
| 25 to 29 Minutes | 571 | 7.6% |
| 30 to 34 Minutes | 1,235 | 16.4% |
| 35 to 39 Minutes | 477 | 6.3% |
| 40 to 44 Minutes | 340 | 4.5% |
| 45 to 59 Minutes | 697 | 9.2% |
| 60 to 89 Minutes | 677 | 9.0% |
| 90 or more Minutes | 175 | 2.3% |
Commute Time by Sex in Norcross
The most common commute times in Norcross are 10 to 14 minutes (872 commuters, 19.7%) for males and 30 to 34 minutes (623 commuters, 20.1%) for females.
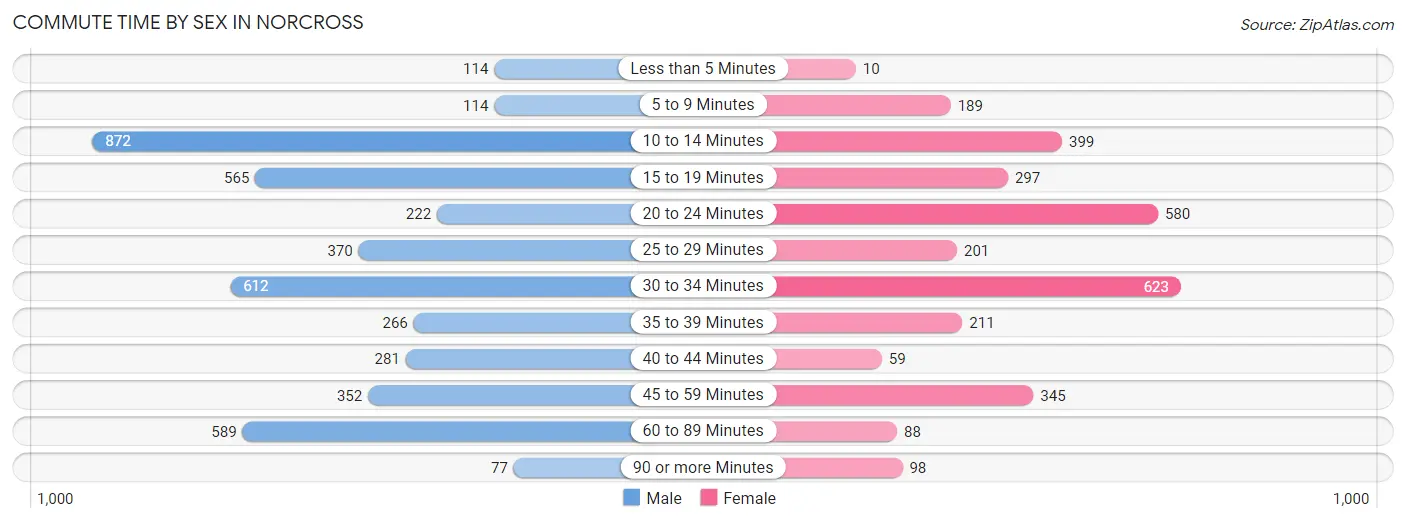
| Commute Time | Male | Female |
| Less than 5 Minutes | 114 (2.6%) | 10 (0.3%) |
| 5 to 9 Minutes | 114 (2.6%) | 189 (6.1%) |
| 10 to 14 Minutes | 872 (19.7%) | 399 (12.9%) |
| 15 to 19 Minutes | 565 (12.7%) | 297 (9.6%) |
| 20 to 24 Minutes | 222 (5.0%) | 580 (18.7%) |
| 25 to 29 Minutes | 370 (8.3%) | 201 (6.5%) |
| 30 to 34 Minutes | 612 (13.8%) | 623 (20.1%) |
| 35 to 39 Minutes | 266 (6.0%) | 211 (6.8%) |
| 40 to 44 Minutes | 281 (6.3%) | 59 (1.9%) |
| 45 to 59 Minutes | 352 (7.9%) | 345 (11.1%) |
| 60 to 89 Minutes | 589 (13.3%) | 88 (2.8%) |
| 90 or more Minutes | 77 (1.7%) | 98 (3.2%) |
Time of Departure to Work by Sex in Norcross
The most frequent times of departure to work in Norcross are 8:00 AM to 8:29 AM (887, 20.0%) for males and 8:00 AM to 8:29 AM (821, 26.5%) for females.
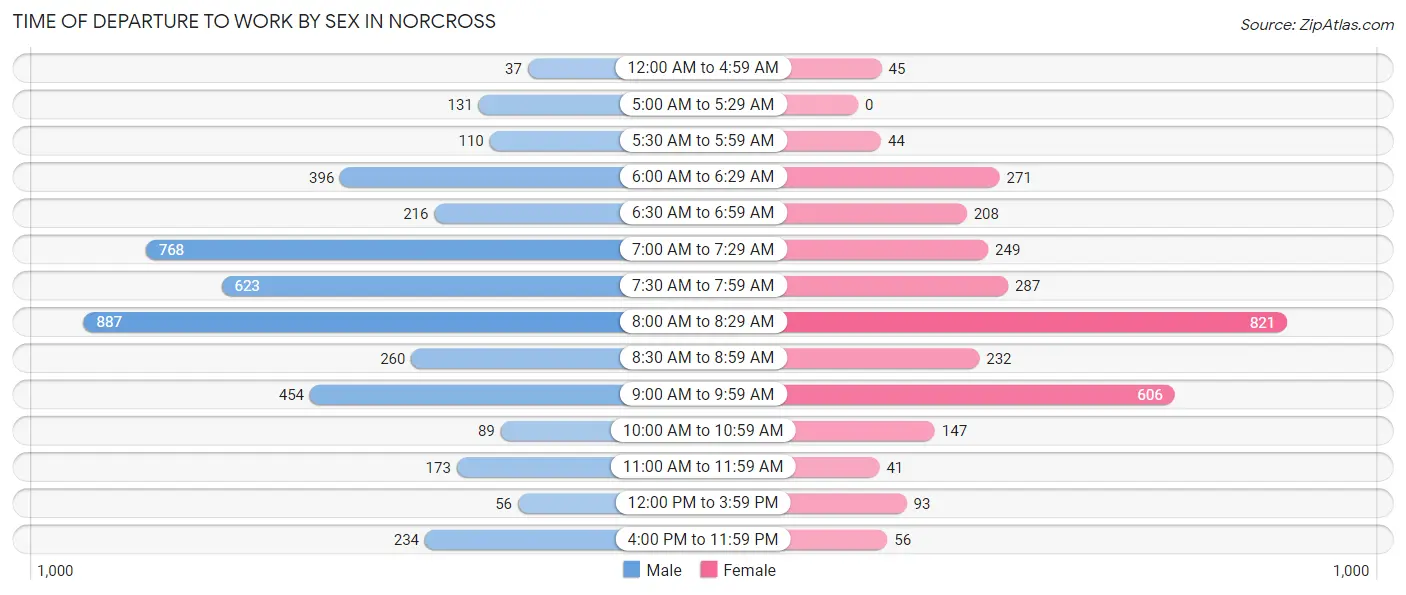
| Time of Departure | Male | Female |
| 12:00 AM to 4:59 AM | 37 (0.8%) | 45 (1.5%) |
| 5:00 AM to 5:29 AM | 131 (2.9%) | 0 (0.0%) |
| 5:30 AM to 5:59 AM | 110 (2.5%) | 44 (1.4%) |
| 6:00 AM to 6:29 AM | 396 (8.9%) | 271 (8.7%) |
| 6:30 AM to 6:59 AM | 216 (4.9%) | 208 (6.7%) |
| 7:00 AM to 7:29 AM | 768 (17.3%) | 249 (8.0%) |
| 7:30 AM to 7:59 AM | 623 (14.1%) | 287 (9.3%) |
| 8:00 AM to 8:29 AM | 887 (20.0%) | 821 (26.5%) |
| 8:30 AM to 8:59 AM | 260 (5.9%) | 232 (7.5%) |
| 9:00 AM to 9:59 AM | 454 (10.2%) | 606 (19.6%) |
| 10:00 AM to 10:59 AM | 89 (2.0%) | 147 (4.7%) |
| 11:00 AM to 11:59 AM | 173 (3.9%) | 41 (1.3%) |
| 12:00 PM to 3:59 PM | 56 (1.3%) | 93 (3.0%) |
| 4:00 PM to 11:59 PM | 234 (5.3%) | 56 (1.8%) |
| Total | 4,434 (100.0%) | 3,100 (100.0%) |
Housing Occupancy in Norcross
Occupancy by Ownership in Norcross
Of the total 6,488 dwellings in Norcross, owner-occupied units account for 3,672 (56.6%), while renter-occupied units make up 2,816 (43.4%).
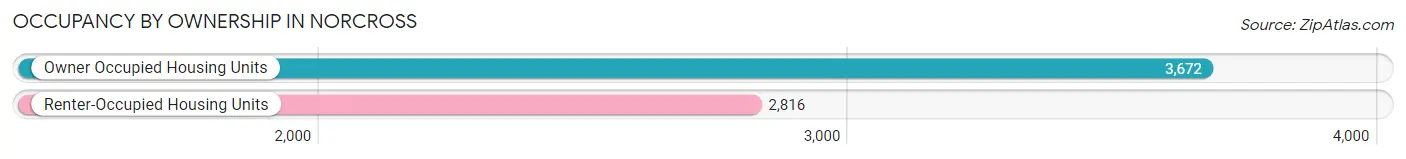
| Occupancy | # Housing Units | % Housing Units |
| Owner Occupied Housing Units | 3,672 | 56.6% |
| Renter-Occupied Housing Units | 2,816 | 43.4% |
| Total Occupied Housing Units | 6,488 | 100.0% |
Occupancy by Household Size in Norcross
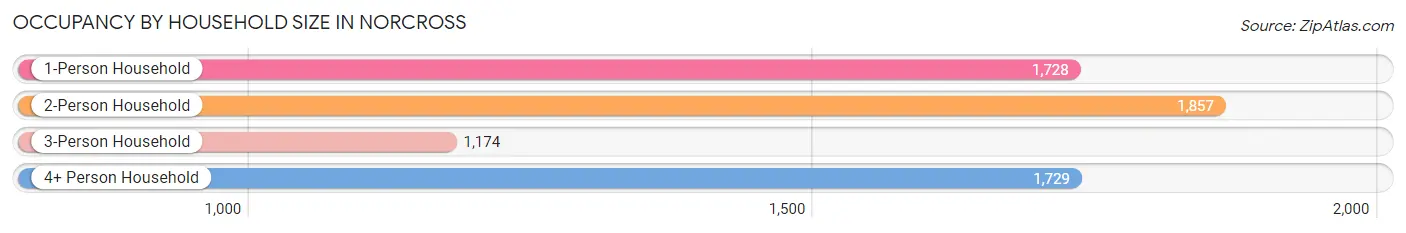
| Household Size | # Housing Units | % Housing Units |
| 1-Person Household | 1,728 | 26.6% |
| 2-Person Household | 1,857 | 28.6% |
| 3-Person Household | 1,174 | 18.1% |
| 4+ Person Household | 1,729 | 26.7% |
| Total Housing Units | 6,488 | 100.0% |
Occupancy by Ownership by Household Size in Norcross
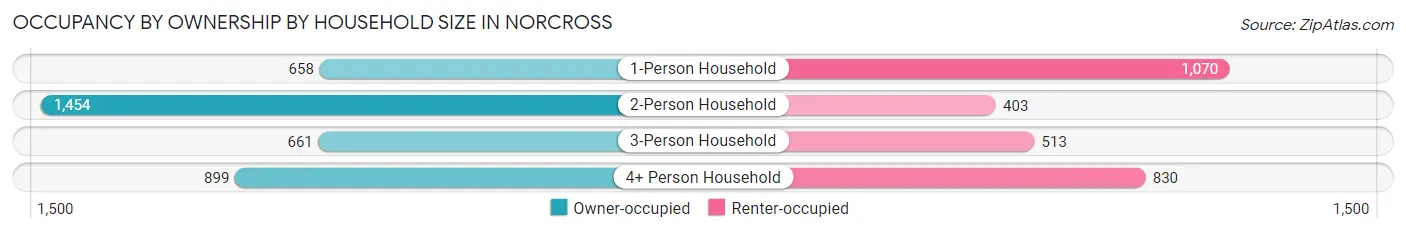
| Household Size | Owner-occupied | Renter-occupied |
| 1-Person Household | 658 (38.1%) | 1,070 (61.9%) |
| 2-Person Household | 1,454 (78.3%) | 403 (21.7%) |
| 3-Person Household | 661 (56.3%) | 513 (43.7%) |
| 4+ Person Household | 899 (52.0%) | 830 (48.0%) |
| Total Housing Units | 3,672 (56.6%) | 2,816 (43.4%) |
Occupancy by Educational Attainment in Norcross
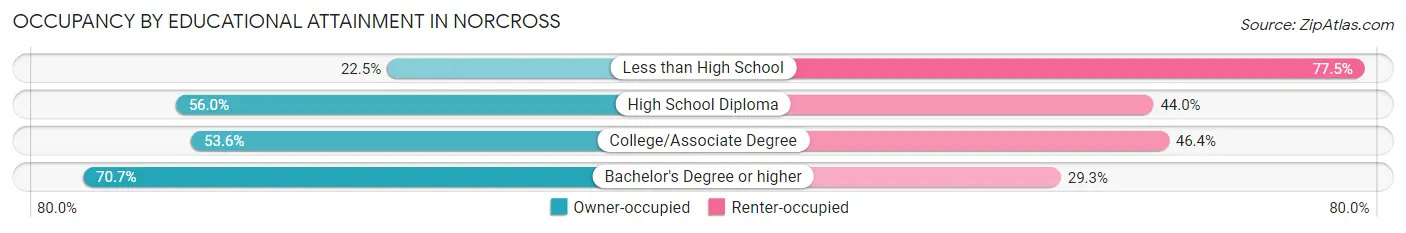
| Household Size | Owner-occupied | Renter-occupied |
| Less than High School | 220 (22.5%) | 757 (77.5%) |
| High School Diploma | 633 (56.0%) | 497 (44.0%) |
| College/Associate Degree | 873 (53.6%) | 756 (46.4%) |
| Bachelor's Degree or higher | 1,946 (70.7%) | 806 (29.3%) |
Occupancy by Age of Householder in Norcross
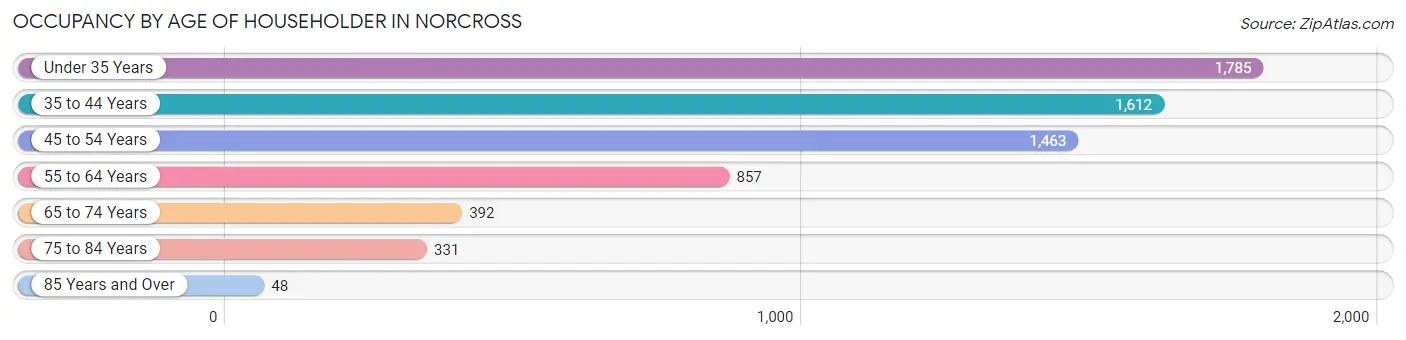
| Age Bracket | # Households | % Households |
| Under 35 Years | 1,785 | 27.5% |
| 35 to 44 Years | 1,612 | 24.8% |
| 45 to 54 Years | 1,463 | 22.6% |
| 55 to 64 Years | 857 | 13.2% |
| 65 to 74 Years | 392 | 6.0% |
| 75 to 84 Years | 331 | 5.1% |
| 85 Years and Over | 48 | 0.7% |
| Total | 6,488 | 100.0% |
Housing Finances in Norcross
Median Income by Occupancy in Norcross
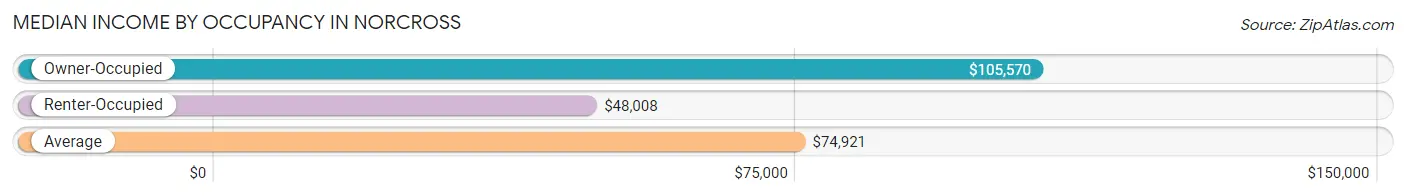
| Occupancy Type | # Households | Median Income |
| Owner-Occupied | 3,672 (56.6%) | $105,570 |
| Renter-Occupied | 2,816 (43.4%) | $48,008 |
| Average | 6,488 (100.0%) | $74,921 |
Occupancy by Householder Income Bracket in Norcross
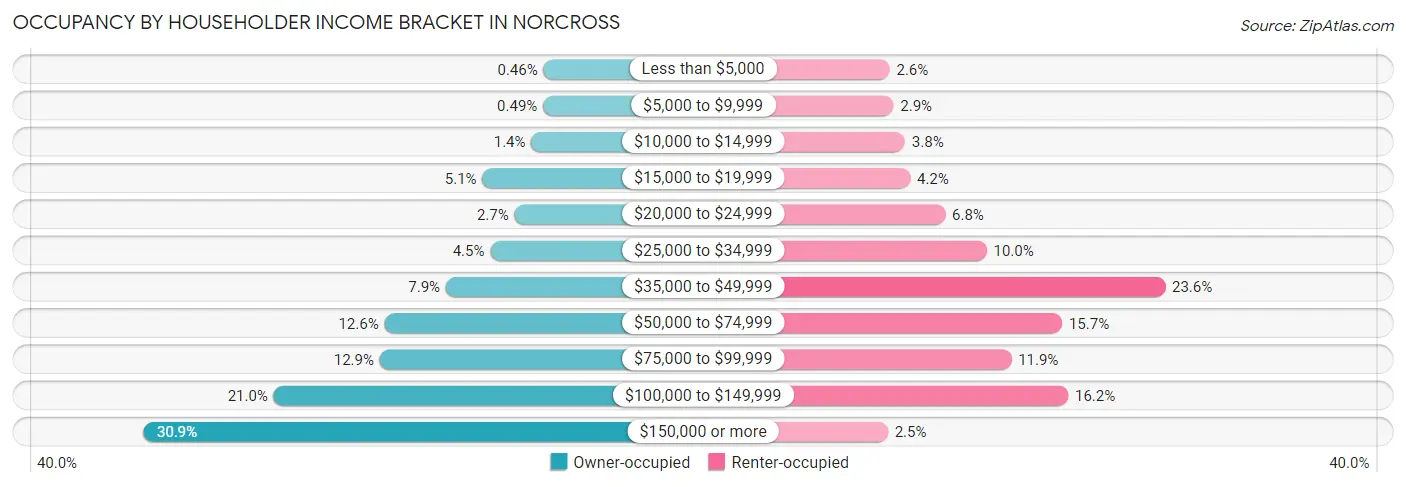
| Income Bracket | Owner-occupied | Renter-occupied |
| Less than $5,000 | 17 (0.5%) | 73 (2.6%) |
| $5,000 to $9,999 | 18 (0.5%) | 81 (2.9%) |
| $10,000 to $14,999 | 51 (1.4%) | 106 (3.8%) |
| $15,000 to $19,999 | 188 (5.1%) | 117 (4.2%) |
| $20,000 to $24,999 | 98 (2.7%) | 192 (6.8%) |
| $25,000 to $34,999 | 166 (4.5%) | 281 (10.0%) |
| $35,000 to $49,999 | 290 (7.9%) | 664 (23.6%) |
| $50,000 to $74,999 | 462 (12.6%) | 443 (15.7%) |
| $75,000 to $99,999 | 475 (12.9%) | 334 (11.9%) |
| $100,000 to $149,999 | 772 (21.0%) | 456 (16.2%) |
| $150,000 or more | 1,135 (30.9%) | 69 (2.5%) |
| Total | 3,672 (100.0%) | 2,816 (100.0%) |
Monthly Housing Cost Tiers in Norcross
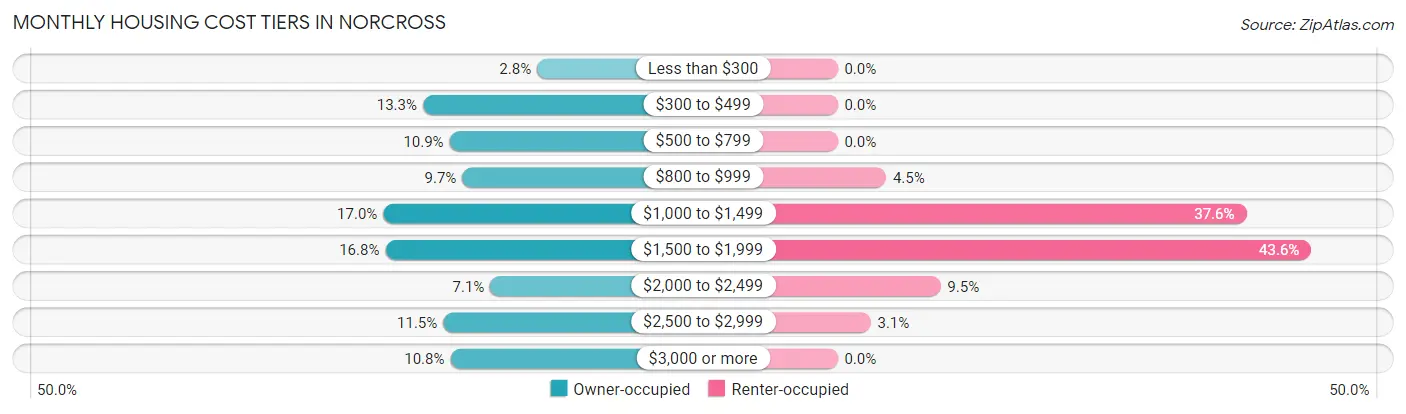
| Monthly Cost | Owner-occupied | Renter-occupied |
| Less than $300 | 104 (2.8%) | 0 (0.0%) |
| $300 to $499 | 490 (13.3%) | 0 (0.0%) |
| $500 to $799 | 400 (10.9%) | 0 (0.0%) |
| $800 to $999 | 357 (9.7%) | 126 (4.5%) |
| $1,000 to $1,499 | 624 (17.0%) | 1,060 (37.6%) |
| $1,500 to $1,999 | 617 (16.8%) | 1,228 (43.6%) |
| $2,000 to $2,499 | 262 (7.1%) | 267 (9.5%) |
| $2,500 to $2,999 | 421 (11.5%) | 86 (3.0%) |
| $3,000 or more | 397 (10.8%) | 0 (0.0%) |
| Total | 3,672 (100.0%) | 2,816 (100.0%) |
Physical Housing Characteristics in Norcross
Housing Structures in Norcross
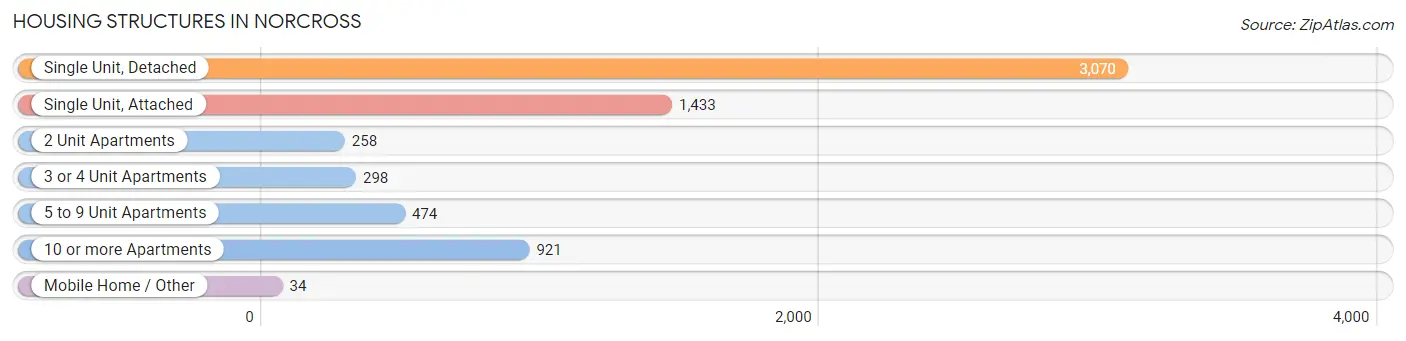
| Structure Type | # Housing Units | % Housing Units |
| Single Unit, Detached | 3,070 | 47.3% |
| Single Unit, Attached | 1,433 | 22.1% |
| 2 Unit Apartments | 258 | 4.0% |
| 3 or 4 Unit Apartments | 298 | 4.6% |
| 5 to 9 Unit Apartments | 474 | 7.3% |
| 10 or more Apartments | 921 | 14.2% |
| Mobile Home / Other | 34 | 0.5% |
| Total | 6,488 | 100.0% |
Housing Structures by Occupancy in Norcross
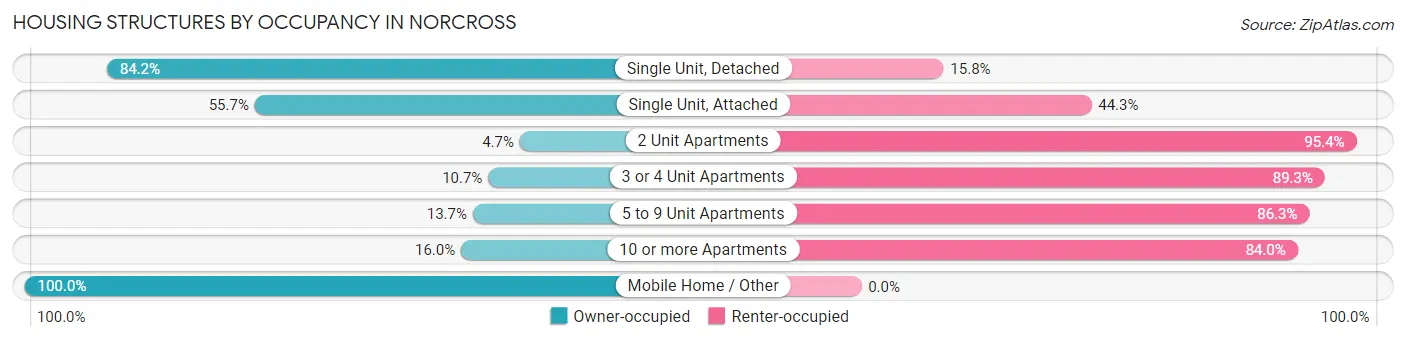
| Structure Type | Owner-occupied | Renter-occupied |
| Single Unit, Detached | 2,584 (84.2%) | 486 (15.8%) |
| Single Unit, Attached | 798 (55.7%) | 635 (44.3%) |
| 2 Unit Apartments | 12 (4.6%) | 246 (95.4%) |
| 3 or 4 Unit Apartments | 32 (10.7%) | 266 (89.3%) |
| 5 to 9 Unit Apartments | 65 (13.7%) | 409 (86.3%) |
| 10 or more Apartments | 147 (16.0%) | 774 (84.0%) |
| Mobile Home / Other | 34 (100.0%) | 0 (0.0%) |
| Total | 3,672 (56.6%) | 2,816 (43.4%) |
Housing Structures by Number of Rooms in Norcross
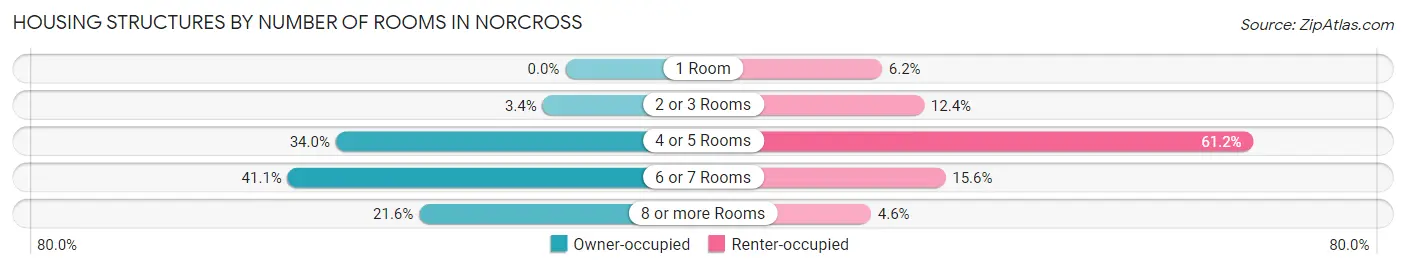
| Number of Rooms | Owner-occupied | Renter-occupied |
| 1 Room | 0 (0.0%) | 175 (6.2%) |
| 2 or 3 Rooms | 123 (3.4%) | 350 (12.4%) |
| 4 or 5 Rooms | 1,247 (34.0%) | 1,723 (61.2%) |
| 6 or 7 Rooms | 1,508 (41.1%) | 439 (15.6%) |
| 8 or more Rooms | 794 (21.6%) | 129 (4.6%) |
| Total | 3,672 (100.0%) | 2,816 (100.0%) |
Housing Structure by Heating Type in Norcross
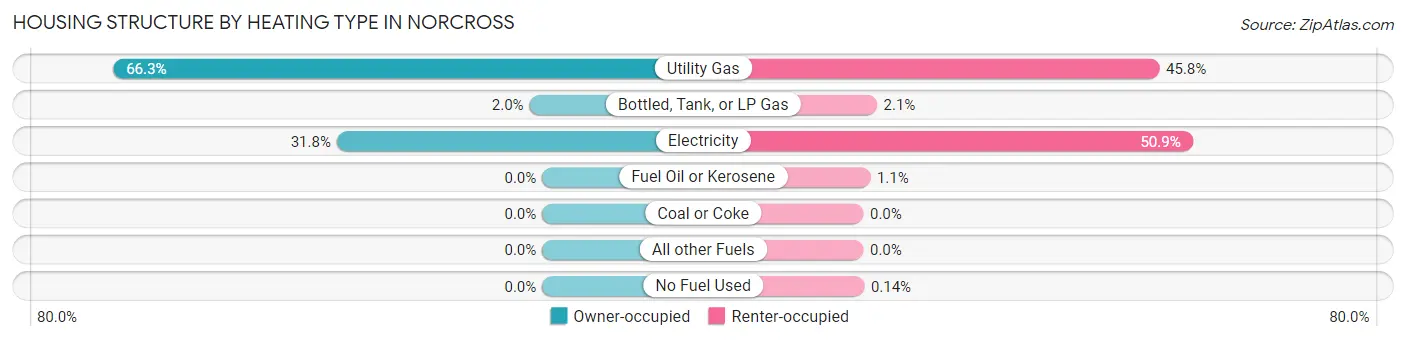
| Heating Type | Owner-occupied | Renter-occupied |
| Utility Gas | 2,434 (66.3%) | 1,289 (45.8%) |
| Bottled, Tank, or LP Gas | 72 (2.0%) | 59 (2.1%) |
| Electricity | 1,166 (31.8%) | 1,434 (50.9%) |
| Fuel Oil or Kerosene | 0 (0.0%) | 30 (1.1%) |
| Coal or Coke | 0 (0.0%) | 0 (0.0%) |
| All other Fuels | 0 (0.0%) | 0 (0.0%) |
| No Fuel Used | 0 (0.0%) | 4 (0.1%) |
| Total | 3,672 (100.0%) | 2,816 (100.0%) |
Household Vehicle Usage in Norcross
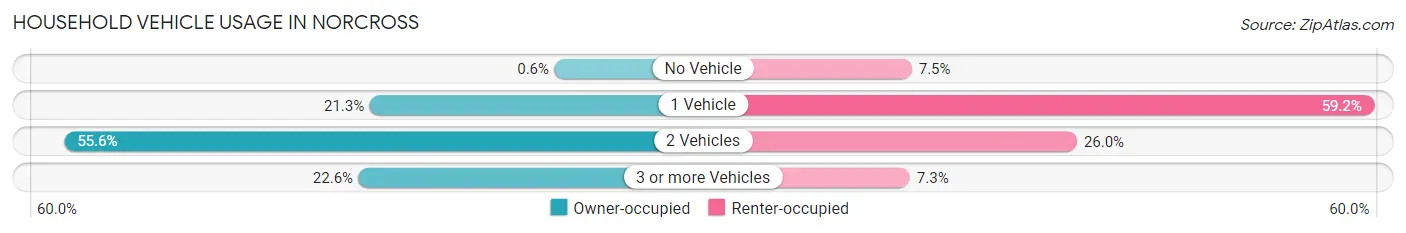
| Vehicles per Household | Owner-occupied | Renter-occupied |
| No Vehicle | 22 (0.6%) | 211 (7.5%) |
| 1 Vehicle | 782 (21.3%) | 1,668 (59.2%) |
| 2 Vehicles | 2,040 (55.6%) | 732 (26.0%) |
| 3 or more Vehicles | 828 (22.6%) | 205 (7.3%) |
| Total | 3,672 (100.0%) | 2,816 (100.0%) |
Real Estate & Mortgages in Norcross
Real Estate and Mortgage Overview in Norcross
| Characteristic | Without Mortgage | With Mortgage |
| Housing Units | 1,273 | 2,399 |
| Median Property Value | $294,500 | $368,200 |
| Median Household Income | $67,639 | $952 |
| Monthly Housing Costs | $529 | $397 |
| Real Estate Taxes | $2,467 | $25 |
Property Value by Mortgage Status in Norcross
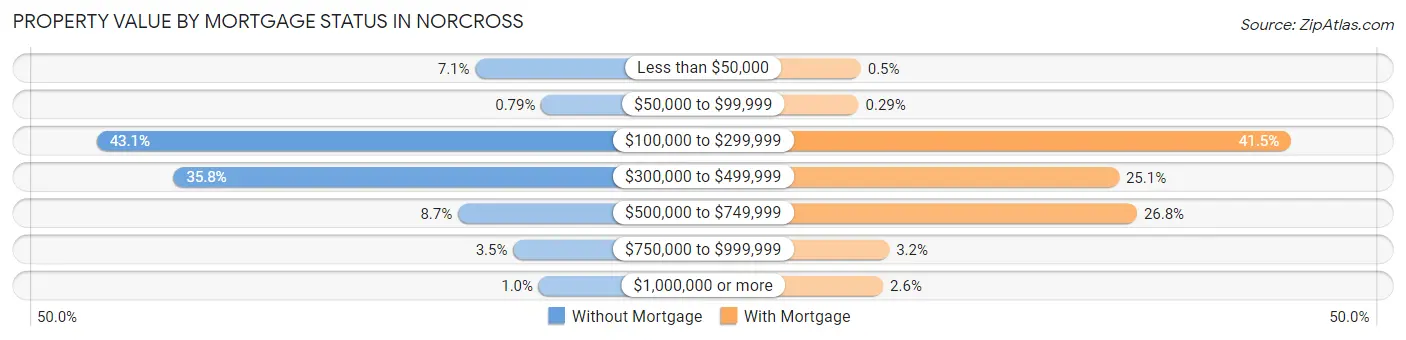
| Property Value | Without Mortgage | With Mortgage |
| Less than $50,000 | 90 (7.1%) | 12 (0.5%) |
| $50,000 to $99,999 | 10 (0.8%) | 7 (0.3%) |
| $100,000 to $299,999 | 549 (43.1%) | 995 (41.5%) |
| $300,000 to $499,999 | 456 (35.8%) | 602 (25.1%) |
| $500,000 to $749,999 | 111 (8.7%) | 643 (26.8%) |
| $750,000 to $999,999 | 44 (3.5%) | 77 (3.2%) |
| $1,000,000 or more | 13 (1.0%) | 63 (2.6%) |
| Total | 1,273 (100.0%) | 2,399 (100.0%) |
Household Income by Mortgage Status in Norcross
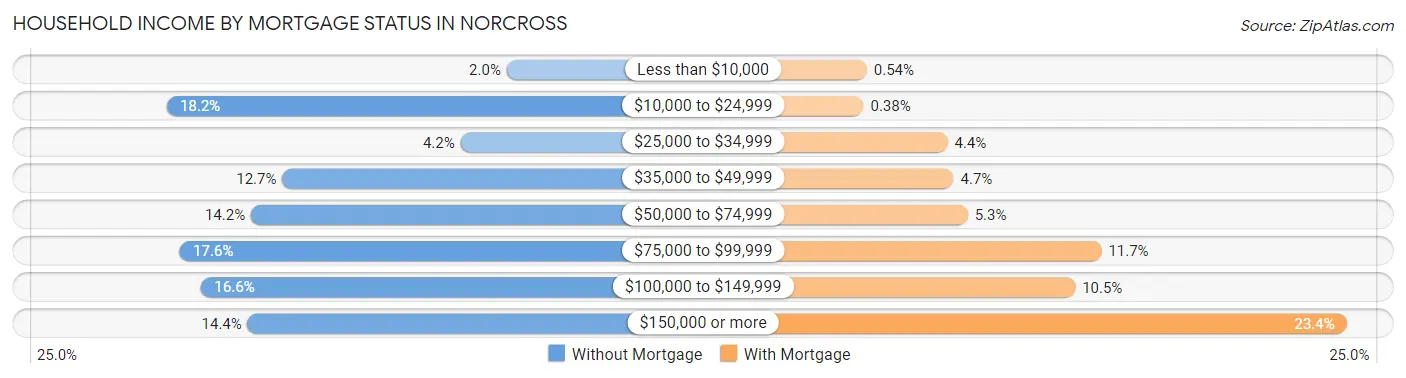
| Household Income | Without Mortgage | With Mortgage |
| Less than $10,000 | 26 (2.0%) | 13 (0.5%) |
| $10,000 to $24,999 | 232 (18.2%) | 9 (0.4%) |
| $25,000 to $34,999 | 54 (4.2%) | 105 (4.4%) |
| $35,000 to $49,999 | 162 (12.7%) | 112 (4.7%) |
| $50,000 to $74,999 | 181 (14.2%) | 128 (5.3%) |
| $75,000 to $99,999 | 224 (17.6%) | 281 (11.7%) |
| $100,000 to $149,999 | 211 (16.6%) | 251 (10.5%) |
| $150,000 or more | 183 (14.4%) | 561 (23.4%) |
| Total | 1,273 (100.0%) | 2,399 (100.0%) |
Property Value to Household Income Ratio in Norcross
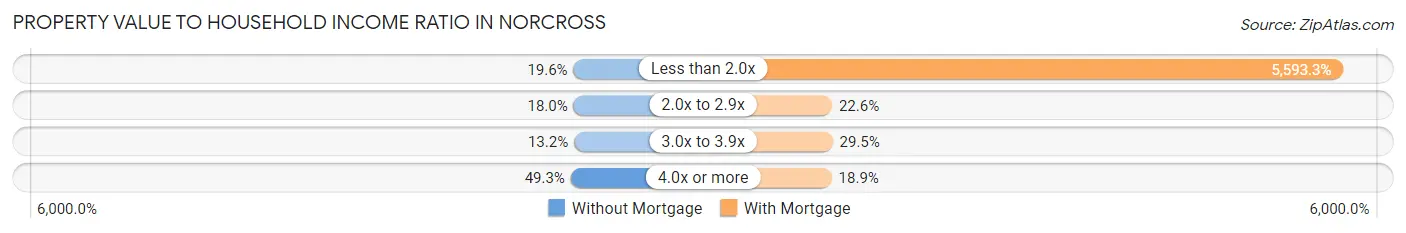
| Value-to-Income Ratio | Without Mortgage | With Mortgage |
| Less than 2.0x | 249 (19.6%) | 134,183 (5,593.3%) |
| 2.0x to 2.9x | 229 (18.0%) | 543 (22.6%) |
| 3.0x to 3.9x | 168 (13.2%) | 707 (29.5%) |
| 4.0x or more | 627 (49.2%) | 453 (18.9%) |
| Total | 1,273 (100.0%) | 2,399 (100.0%) |
Real Estate Taxes by Mortgage Status in Norcross
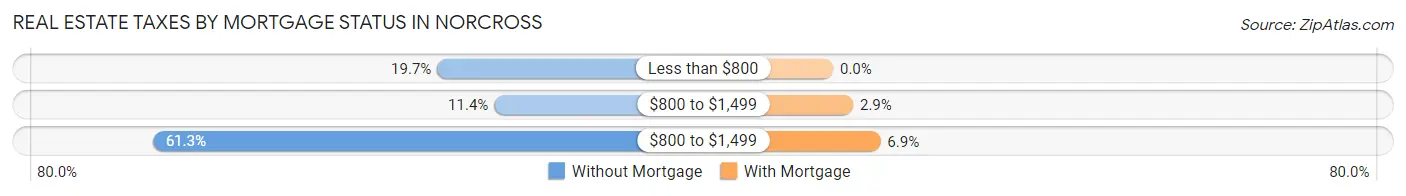
| Property Taxes | Without Mortgage | With Mortgage |
| Less than $800 | 251 (19.7%) | 0 (0.0%) |
| $800 to $1,499 | 145 (11.4%) | 70 (2.9%) |
| $800 to $1,499 | 780 (61.3%) | 166 (6.9%) |
| Total | 1,273 (100.0%) | 2,399 (100.0%) |
Health & Disability in Norcross
Health Insurance Coverage by Age in Norcross
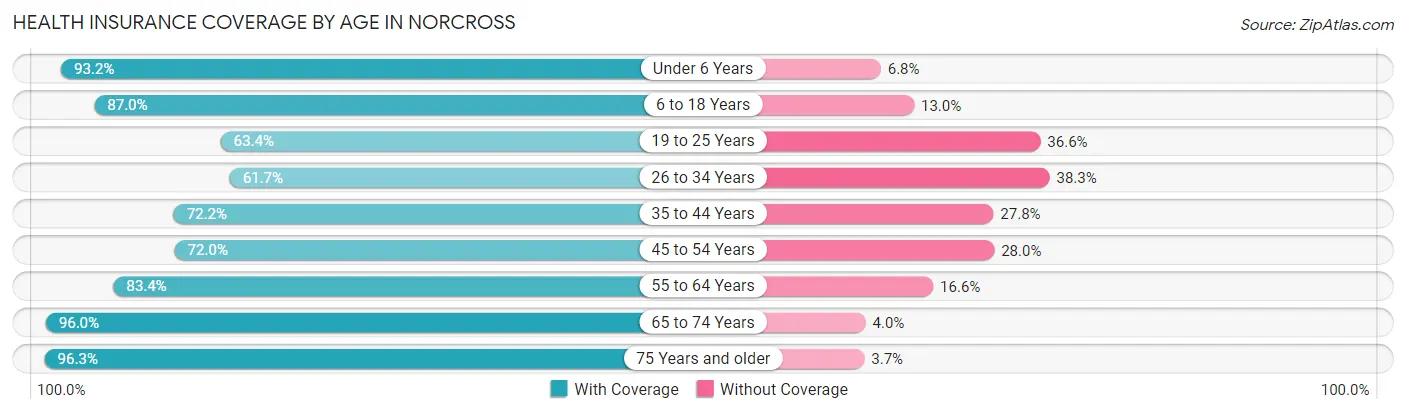
| Age Bracket | With Coverage | Without Coverage |
| Under 6 Years | 1,246 (93.2%) | 91 (6.8%) |
| 6 to 18 Years | 3,069 (87.0%) | 459 (13.0%) |
| 19 to 25 Years | 718 (63.4%) | 414 (36.6%) |
| 26 to 34 Years | 1,958 (61.7%) | 1,214 (38.3%) |
| 35 to 44 Years | 2,046 (72.2%) | 788 (27.8%) |
| 45 to 54 Years | 1,778 (72.0%) | 690 (28.0%) |
| 55 to 64 Years | 1,198 (83.4%) | 238 (16.6%) |
| 65 to 74 Years | 871 (96.0%) | 36 (4.0%) |
| 75 Years and older | 644 (96.3%) | 25 (3.7%) |
| Total | 13,528 (77.4%) | 3,955 (22.6%) |
Health Insurance Coverage by Citizenship Status in Norcross
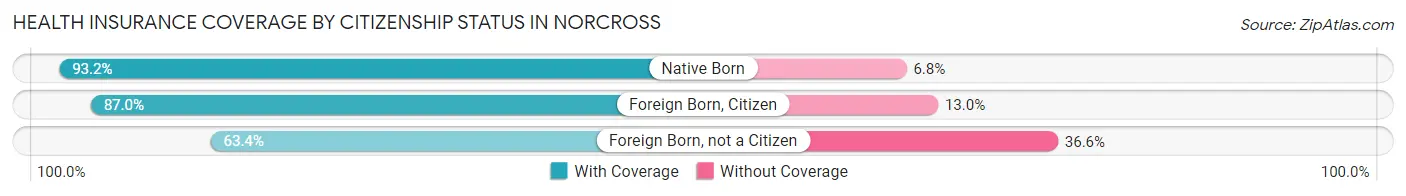
| Citizenship Status | With Coverage | Without Coverage |
| Native Born | 1,246 (93.2%) | 91 (6.8%) |
| Foreign Born, Citizen | 3,069 (87.0%) | 459 (13.0%) |
| Foreign Born, not a Citizen | 718 (63.4%) | 414 (36.6%) |
Health Insurance Coverage by Household Income in Norcross
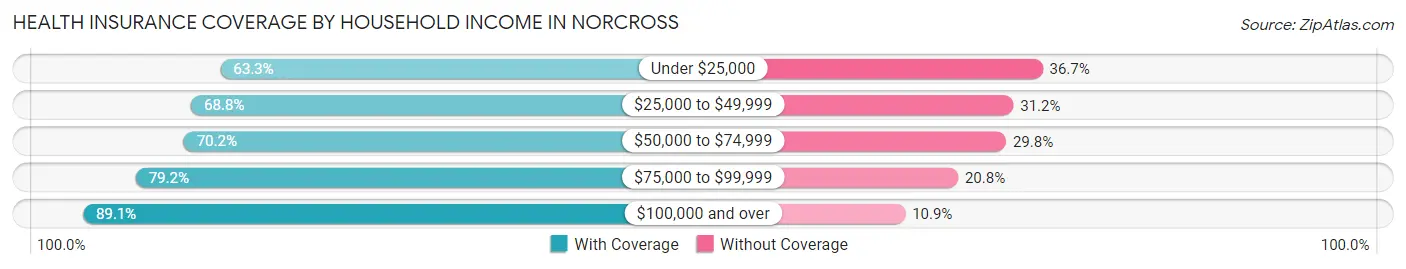
| Household Income | With Coverage | Without Coverage |
| Under $25,000 | 1,462 (63.3%) | 847 (36.7%) |
| $25,000 to $49,999 | 2,188 (68.8%) | 992 (31.2%) |
| $50,000 to $74,999 | 2,064 (70.2%) | 877 (29.8%) |
| $75,000 to $99,999 | 1,973 (79.2%) | 519 (20.8%) |
| $100,000 and over | 5,837 (89.1%) | 717 (10.9%) |
Public vs Private Health Insurance Coverage by Age in Norcross
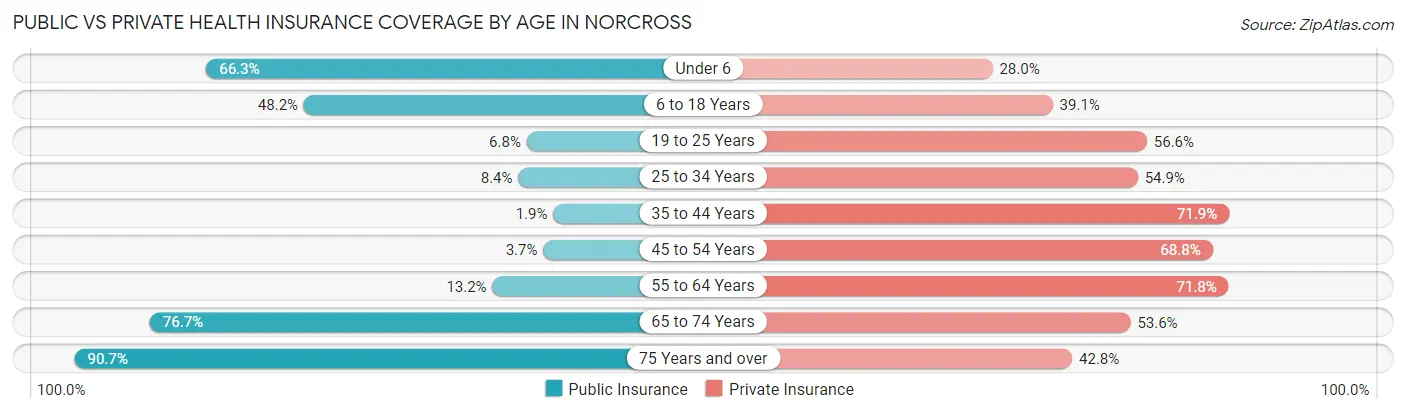
| Age Bracket | Public Insurance | Private Insurance |
| Under 6 | 886 (66.3%) | 374 (28.0%) |
| 6 to 18 Years | 1,699 (48.2%) | 1,381 (39.1%) |
| 19 to 25 Years | 77 (6.8%) | 641 (56.6%) |
| 25 to 34 Years | 265 (8.4%) | 1,742 (54.9%) |
| 35 to 44 Years | 53 (1.9%) | 2,037 (71.9%) |
| 45 to 54 Years | 92 (3.7%) | 1,698 (68.8%) |
| 55 to 64 Years | 189 (13.2%) | 1,031 (71.8%) |
| 65 to 74 Years | 696 (76.7%) | 486 (53.6%) |
| 75 Years and over | 607 (90.7%) | 286 (42.7%) |
| Total | 4,564 (26.1%) | 9,676 (55.3%) |
Disability Status by Sex by Age in Norcross
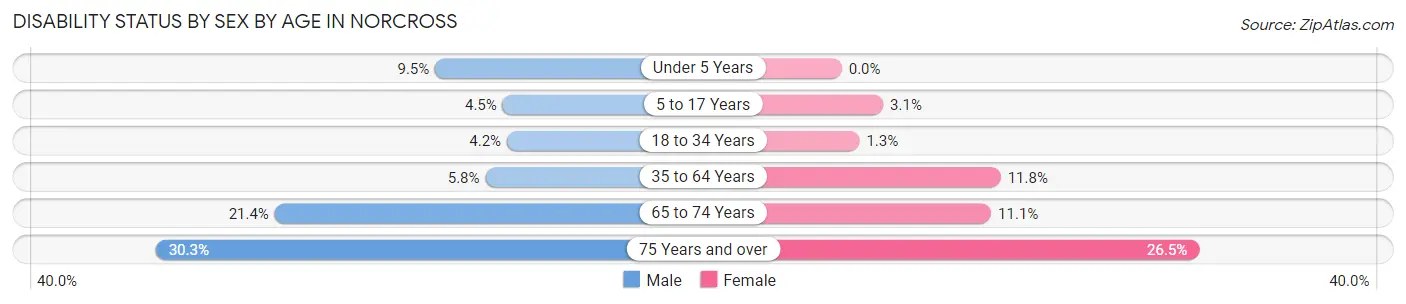
| Age Bracket | Male | Female |
| Under 5 Years | 44 (9.5%) | 0 (0.0%) |
| 5 to 17 Years | 80 (4.5%) | 54 (3.1%) |
| 18 to 34 Years | 98 (4.2%) | 28 (1.3%) |
| 35 to 64 Years | 194 (5.8%) | 400 (11.8%) |
| 65 to 74 Years | 90 (21.4%) | 54 (11.1%) |
| 75 Years and over | 69 (30.3%) | 117 (26.5%) |
Disability Class by Sex by Age in Norcross
Disability Class: Hearing Difficulty
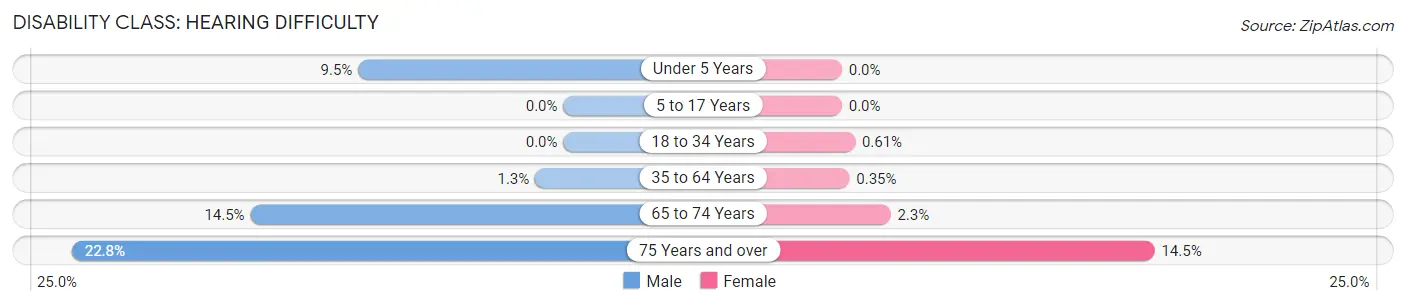
| Age Bracket | Male | Female |
| Under 5 Years | 44 (9.5%) | 0 (0.0%) |
| 5 to 17 Years | 0 (0.0%) | 0 (0.0%) |
| 18 to 34 Years | 0 (0.0%) | 13 (0.6%) |
| 35 to 64 Years | 44 (1.3%) | 12 (0.4%) |
| 65 to 74 Years | 61 (14.5%) | 11 (2.3%) |
| 75 Years and over | 52 (22.8%) | 64 (14.5%) |
Disability Class: Vision Difficulty
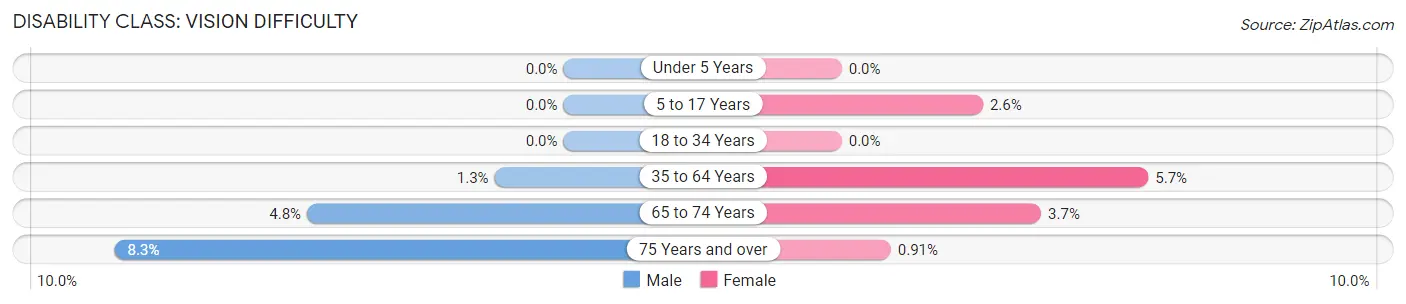
| Age Bracket | Male | Female |
| Under 5 Years | 0 (0.0%) | 0 (0.0%) |
| 5 to 17 Years | 0 (0.0%) | 46 (2.6%) |
| 18 to 34 Years | 0 (0.0%) | 0 (0.0%) |
| 35 to 64 Years | 43 (1.3%) | 193 (5.7%) |
| 65 to 74 Years | 20 (4.8%) | 18 (3.7%) |
| 75 Years and over | 19 (8.3%) | 4 (0.9%) |
Disability Class: Cognitive Difficulty
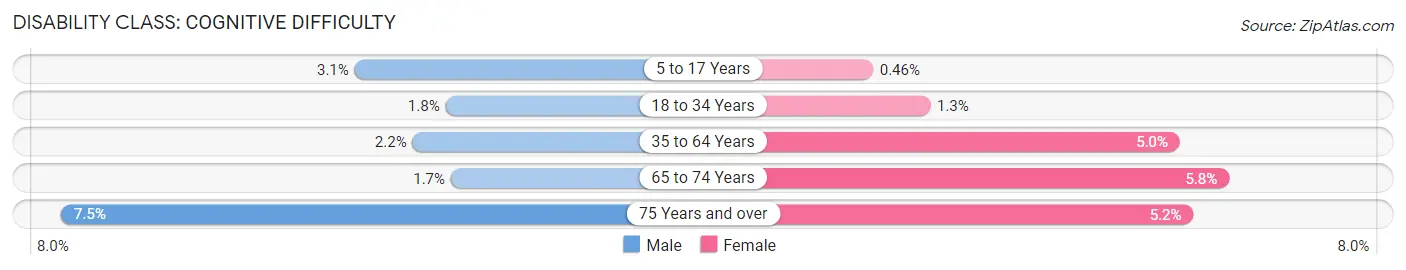
| Age Bracket | Male | Female |
| 5 to 17 Years | 55 (3.1%) | 8 (0.5%) |
| 18 to 34 Years | 41 (1.8%) | 28 (1.3%) |
| 35 to 64 Years | 75 (2.2%) | 170 (5.0%) |
| 65 to 74 Years | 7 (1.7%) | 28 (5.8%) |
| 75 Years and over | 17 (7.5%) | 23 (5.2%) |
Disability Class: Ambulatory Difficulty
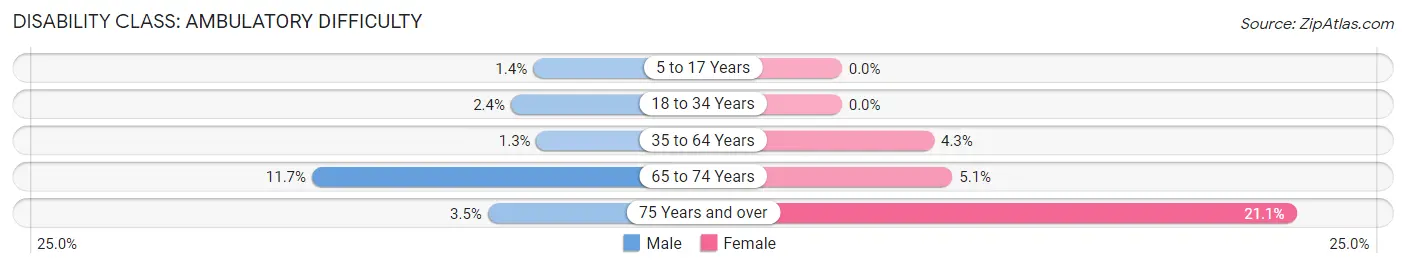
| Age Bracket | Male | Female |
| 5 to 17 Years | 25 (1.4%) | 0 (0.0%) |
| 18 to 34 Years | 57 (2.4%) | 0 (0.0%) |
| 35 to 64 Years | 42 (1.3%) | 145 (4.3%) |
| 65 to 74 Years | 49 (11.7%) | 25 (5.1%) |
| 75 Years and over | 8 (3.5%) | 93 (21.1%) |
Disability Class: Self-Care Difficulty
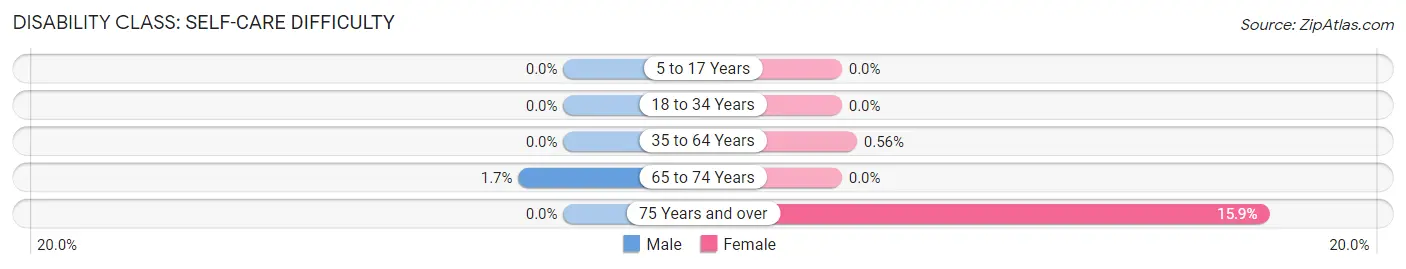
| Age Bracket | Male | Female |
| 5 to 17 Years | 0 (0.0%) | 0 (0.0%) |
| 18 to 34 Years | 0 (0.0%) | 0 (0.0%) |
| 35 to 64 Years | 0 (0.0%) | 19 (0.6%) |
| 65 to 74 Years | 7 (1.7%) | 0 (0.0%) |
| 75 Years and over | 0 (0.0%) | 70 (15.9%) |
Technology Access in Norcross
Computing Device Access in Norcross
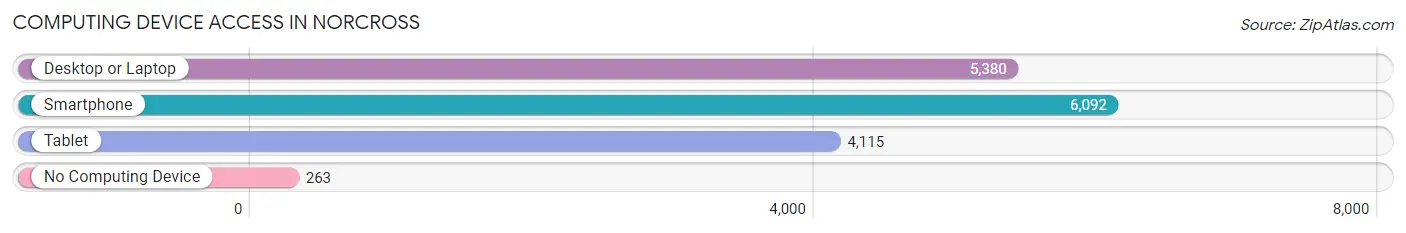
| Device Type | # Households | % Households |
| Desktop or Laptop | 5,380 | 82.9% |
| Smartphone | 6,092 | 93.9% |
| Tablet | 4,115 | 63.4% |
| No Computing Device | 263 | 4.1% |
| Total | 6,488 | 100.0% |
Internet Access in Norcross
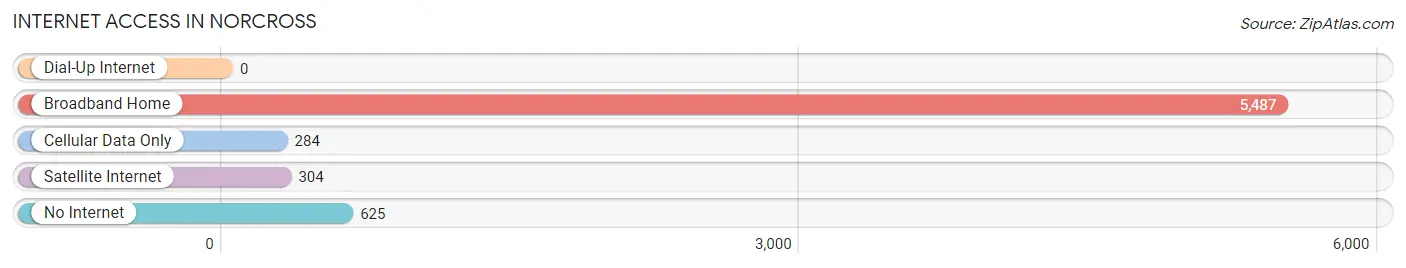
| Internet Type | # Households | % Households |
| Dial-Up Internet | 0 | 0.0% |
| Broadband Home | 5,487 | 84.6% |
| Cellular Data Only | 284 | 4.4% |
| Satellite Internet | 304 | 4.7% |
| No Internet | 625 | 9.6% |
| Total | 6,488 | 100.0% |
Norcross Summary
Norcross is a city located in Gwinnett County, Georgia, United States. It is a suburb of Atlanta, located approximately 30 miles northeast of the city. The population was 9,116 at the 2010 census, and had grown to an estimated 16,633 as of 2019.
History
Norcross was founded in 1870 by Jonathan Norcross, a former mayor of Atlanta. The city was named after him and was incorporated in 1870. The city was originally a farming community, but it quickly grew into a bustling suburb of Atlanta.
In the early 1900s, Norcross was a popular destination for tourists, who came to enjoy the city's natural beauty and its many attractions. The city was home to a number of resorts, including the Norcross Hotel, which was built in 1906 and was one of the largest hotels in the state.
In the 1950s, Norcross began to experience rapid growth as the city became a popular destination for families looking to move out of the city of Atlanta. The city's population grew from 1,500 in 1950 to over 10,000 by the end of the decade.
Geography
Norcross is located in the northern part of Gwinnett County, Georgia, approximately 30 miles northeast of Atlanta. The city is situated in the foothills of the Blue Ridge Mountains and is bordered by the Chattahoochee River to the north.
The city has a total area of 8.2 square miles, of which 8.1 square miles is land and 0.1 square miles is water. The city is located at an elevation of 1,000 feet above sea level.
Economy
Norcross is home to a number of businesses and industries, including manufacturing, retail, and healthcare. The city is also home to a number of corporate headquarters, including the headquarters of the Waffle House restaurant chain.
The city is also home to a number of technology companies, including the software company NCR Corporation and the telecommunications company Windstream Communications.
Demographics
As of the 2010 census, the population of Norcross was 9,116. The racial makeup of the city was 57.2% White, 28.2% African American, 0.3% Native American, 5.2% Asian, 0.1% Pacific Islander, 5.3% from other races, and 3.7% from two or more races. Hispanic or Latino of any race were 13.2% of the population.
The median income for a household in the city was $50,945, and the median income for a family was $60,945. The per capita income for the city was $25,945. About 8.2% of families and 10.2% of the population were below the poverty line, including 14.2% of those under age 18 and 8.2% of those age 65 or over.
Common Questions
What is Per Capita Income in Norcross?
Per Capita income in Norcross is $36,090.
What is the Median Family Income in Norcross?
Median Family Income in Norcross is $87,619.
What is the Median Household income in Norcross?
Median Household Income in Norcross is $74,921.
What is Income or Wage Gap in Norcross?
Income or Wage Gap in Norcross is 11.0%.
Women in Norcross earn 89.0 cents for every dollar earned by a man.
What is Inequality or Gini Index in Norcross?
Inequality or Gini Index in Norcross is 0.43.
What is the Total Population of Norcross?
Total Population of Norcross is 17,530.
What is the Total Male Population of Norcross?
Total Male Population of Norcross is 8,572.
What is the Total Female Population of Norcross?
Total Female Population of Norcross is 8,958.
What is the Ratio of Males per 100 Females in Norcross?
There are 95.69 Males per 100 Females in Norcross.
What is the Ratio of Females per 100 Males in Norcross?
There are 104.50 Females per 100 Males in Norcross.
What is the Median Population Age in Norcross?
Median Population Age in Norcross is 34.2 Years.
What is the Average Family Size in Norcross
Average Family Size in Norcross is 3.3 People.
What is the Average Household Size in Norcross
Average Household Size in Norcross is 2.7 People.
How Large is the Labor Force in Norcross?
There are 9,833 People in the Labor Forcein in Norcross.
What is the Percentage of People in the Labor Force in Norcross?
73.6% of People are in the Labor Force in Norcross.
What is the Unemployment Rate in Norcross?
Unemployment Rate in Norcross is 1.8%.