Roebling, NJ Map & Demographics
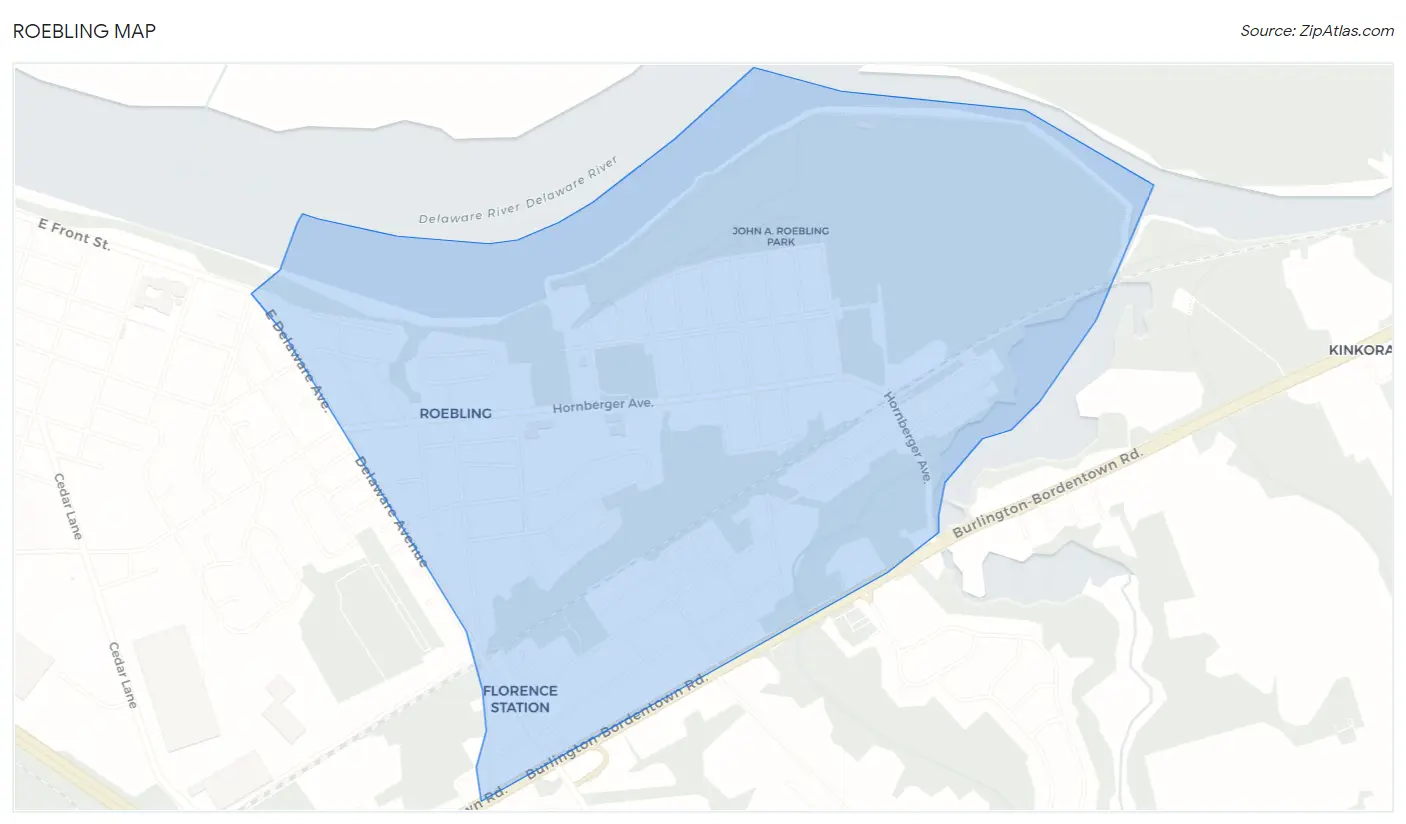
Roebling Map
Roebling Overview
$43,294
PER CAPITA INCOME
$108,333
AVG FAMILY INCOME
$89,917
AVG HOUSEHOLD INCOME
46.8%
WAGE / INCOME GAP [ % ]
53.2¢/ $1
WAGE / INCOME GAP [ $ ]
$6,817
FAMILY INCOME DEFICIT
0.39
INEQUALITY / GINI INDEX
4,146
TOTAL POPULATION
2,128
MALE POPULATION
2,018
FEMALE POPULATION
105.45
MALES / 100 FEMALES
94.83
FEMALES / 100 MALES
38.4
MEDIAN AGE
3.5
AVG FAMILY SIZE
2.7
AVG HOUSEHOLD SIZE
2,331
LABOR FORCE [ PEOPLE ]
72.1%
PERCENT IN LABOR FORCE
3.5%
UNEMPLOYMENT RATE
Roebling Zip Codes
Income in Roebling
Income Overview in Roebling
Per Capita Income in Roebling is $43,294, while median incomes of families and households are $108,333 and $89,917 respectively.
| Characteristic | Number | Measure |
| Per Capita Income | 4,146 | $43,294 |
| Median Family Income | 958 | $108,333 |
| Mean Family Income | 958 | $125,611 |
| Median Household Income | 1,529 | $89,917 |
| Mean Household Income | 1,529 | $114,696 |
| Income Deficit | 958 | $6,817 |
| Wage / Income Gap (%) | 4,146 | 46.80% |
| Wage / Income Gap ($) | 4,146 | 53.20¢ per $1 |
| Gini / Inequality Index | 4,146 | 0.39 |
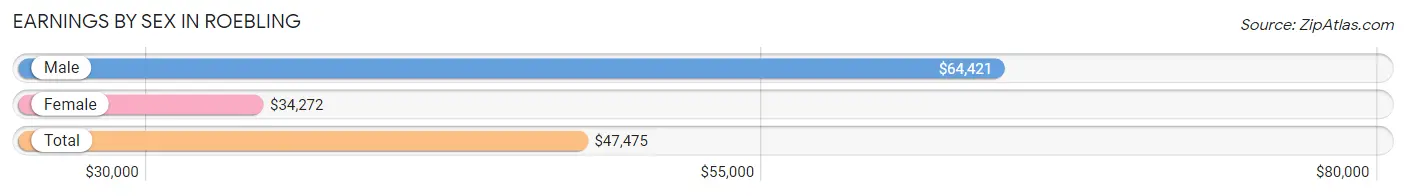
Earnings by Sex in Roebling
Average Earnings in Roebling are $47,475, $64,421 for men and $34,272 for women, a difference of 46.8%.
| Sex | Number | Average Earnings |
| Male | 1,269 (53.4%) | $64,421 |
| Female | 1,108 (46.6%) | $34,272 |
| Total | 2,377 (100.0%) | $47,475 |
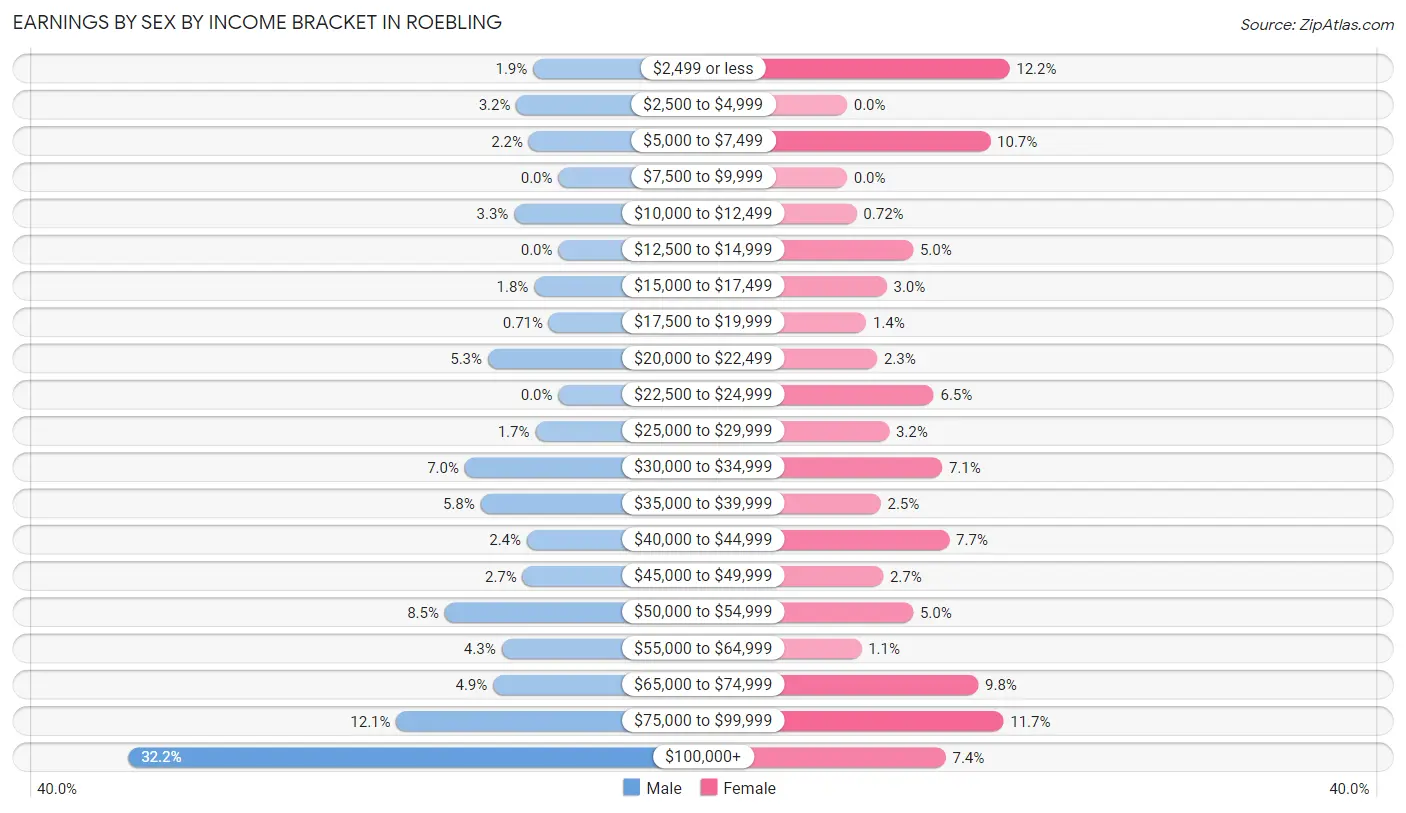
Earnings by Sex by Income Bracket in Roebling
The most common earnings brackets in Roebling are $100,000+ for men (409 | 32.2%) and $2,499 or less for women (135 | 12.2%).
| Income | Male | Female |
| $2,499 or less | 24 (1.9%) | 135 (12.2%) |
| $2,500 to $4,999 | 40 (3.2%) | 0 (0.0%) |
| $5,000 to $7,499 | 28 (2.2%) | 119 (10.7%) |
| $7,500 to $9,999 | 0 (0.0%) | 0 (0.0%) |
| $10,000 to $12,499 | 42 (3.3%) | 8 (0.7%) |
| $12,500 to $14,999 | 0 (0.0%) | 55 (5.0%) |
| $15,000 to $17,499 | 23 (1.8%) | 33 (3.0%) |
| $17,500 to $19,999 | 9 (0.7%) | 16 (1.4%) |
| $20,000 to $22,499 | 67 (5.3%) | 25 (2.3%) |
| $22,500 to $24,999 | 0 (0.0%) | 72 (6.5%) |
| $25,000 to $29,999 | 22 (1.7%) | 35 (3.2%) |
| $30,000 to $34,999 | 89 (7.0%) | 79 (7.1%) |
| $35,000 to $39,999 | 74 (5.8%) | 28 (2.5%) |
| $40,000 to $44,999 | 30 (2.4%) | 85 (7.7%) |
| $45,000 to $49,999 | 34 (2.7%) | 30 (2.7%) |
| $50,000 to $54,999 | 108 (8.5%) | 55 (5.0%) |
| $55,000 to $64,999 | 54 (4.3%) | 12 (1.1%) |
| $65,000 to $74,999 | 62 (4.9%) | 109 (9.8%) |
| $75,000 to $99,999 | 154 (12.1%) | 130 (11.7%) |
| $100,000+ | 409 (32.2%) | 82 (7.4%) |
| Total | 1,269 (100.0%) | 1,108 (100.0%) |
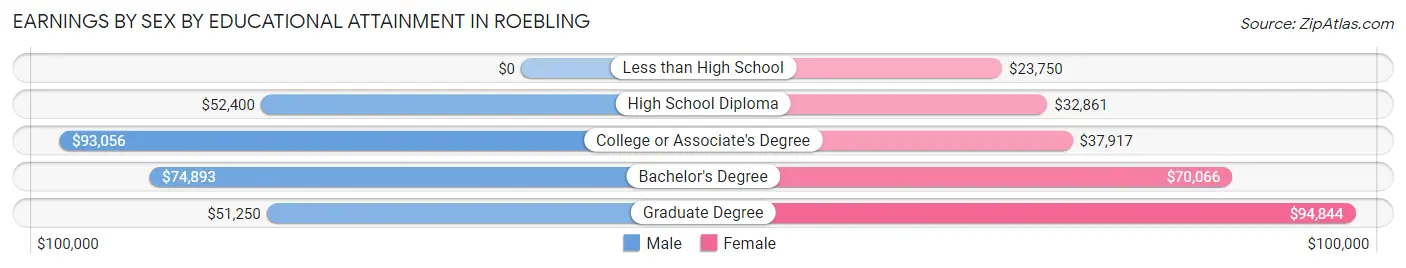
Earnings by Sex by Educational Attainment in Roebling
Average earnings in Roebling are $81,472 for men and $41,950 for women, a difference of 48.5%. Men with an educational attainment of college or associate's degree enjoy the highest average annual earnings of $93,056, while those with graduate degree education earn the least with $51,250. Women with an educational attainment of graduate degree earn the most with the average annual earnings of $94,844, while those with less than high school education have the smallest earnings of $23,750.
| Educational Attainment | Male Income | Female Income |
| Less than High School | - | - |
| High School Diploma | $52,400 | $32,861 |
| College or Associate's Degree | $93,056 | $37,917 |
| Bachelor's Degree | $74,893 | $70,066 |
| Graduate Degree | $51,250 | $94,844 |
| Total | $81,472 | $41,950 |
Family Income in Roebling
Family Income Brackets in Roebling
According to the Roebling family income data, there are 209 families falling into the $100,000 to $149,999 income range, which is the most common income bracket and makes up 21.8% of all families.
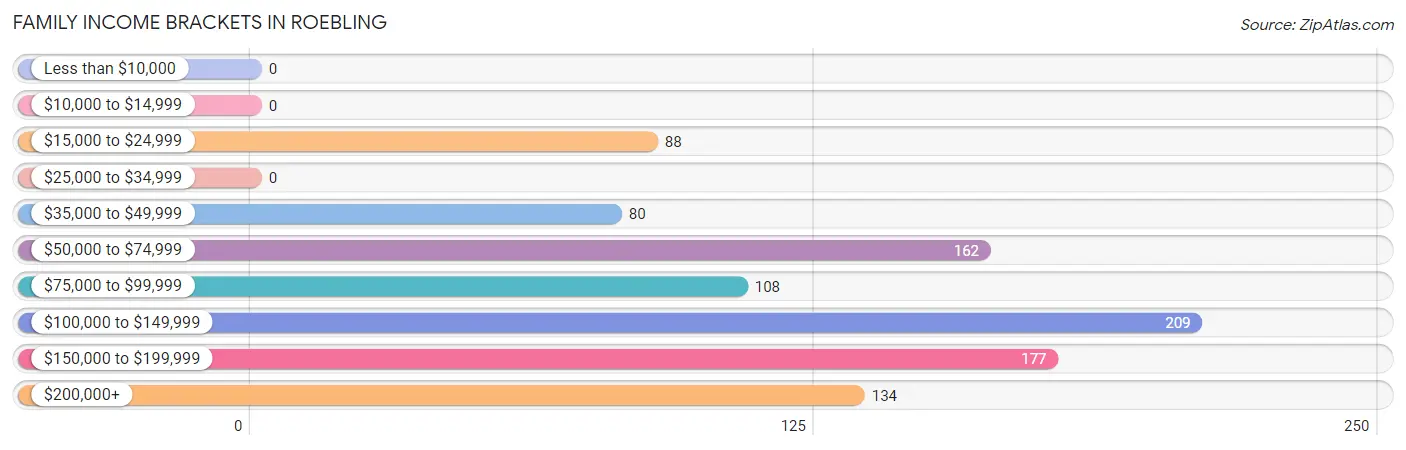
| Income Bracket | # Families | % Families |
| Less than $10,000 | 0 | 0.0% |
| $10,000 to $14,999 | 0 | 0.0% |
| $15,000 to $24,999 | 88 | 9.2% |
| $25,000 to $34,999 | 0 | 0.0% |
| $35,000 to $49,999 | 80 | 8.4% |
| $50,000 to $74,999 | 162 | 16.9% |
| $75,000 to $99,999 | 108 | 11.3% |
| $100,000 to $149,999 | 209 | 21.8% |
| $150,000 to $199,999 | 177 | 18.5% |
| $200,000+ | 134 | 14.0% |
Family Income by Famaliy Size in Roebling
3-person families (176 | 18.4%) account for the highest median family income in Roebling with $162,750 per family, while 3-person families (176 | 18.4%) have the highest median income of $54,250 per family member.
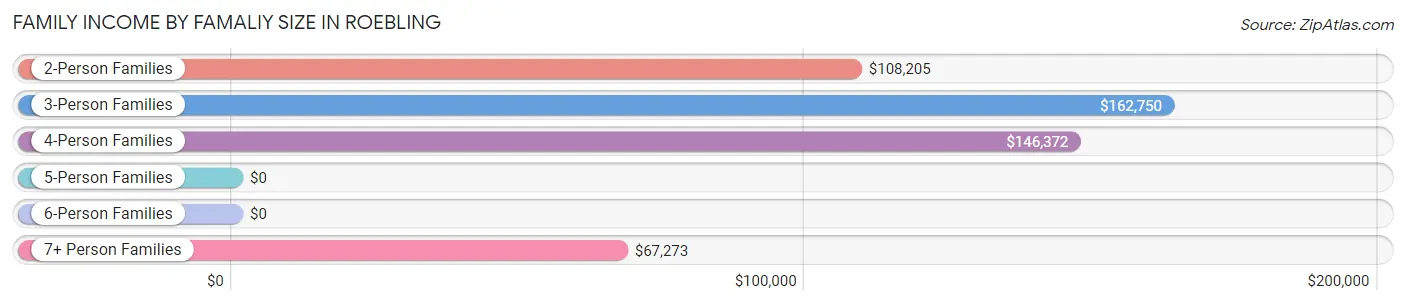
| Income Bracket | # Families | Median Income |
| 2-Person Families | 370 (38.6%) | $108,205 |
| 3-Person Families | 176 (18.4%) | $162,750 |
| 4-Person Families | 233 (24.3%) | $146,372 |
| 5-Person Families | 125 (13.1%) | $0 |
| 6-Person Families | 14 (1.5%) | $0 |
| 7+ Person Families | 40 (4.2%) | $67,273 |
| Total | 958 (100.0%) | $108,333 |
Family Income by Number of Earners in Roebling
The median family income in Roebling is $108,333, with families comprising 3+ earners (196) having the highest median family income of $152,857, while families with no earners (64) have the lowest median family income of $52,917, accounting for 20.5% and 6.7% of families, respectively.
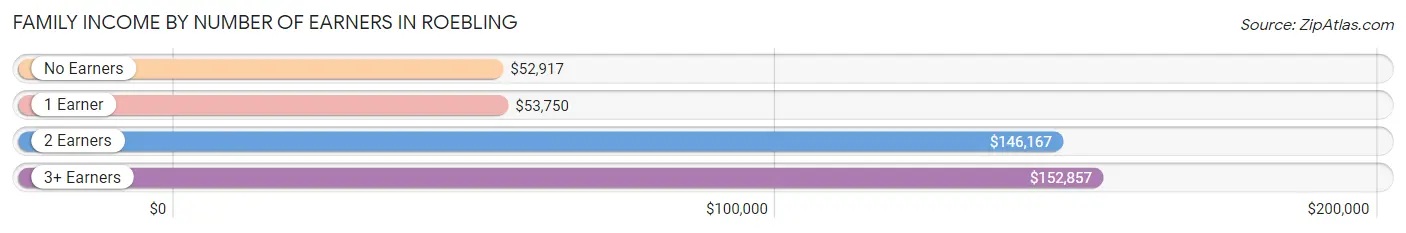
| Number of Earners | # Families | Median Income |
| No Earners | 64 (6.7%) | $52,917 |
| 1 Earner | 294 (30.7%) | $53,750 |
| 2 Earners | 404 (42.2%) | $146,167 |
| 3+ Earners | 196 (20.5%) | $152,857 |
| Total | 958 (100.0%) | $108,333 |
Household Income in Roebling
Household Income Brackets in Roebling
With 297 households falling in the category, the $50,000 to $74,999 income range is the most frequent in Roebling, accounting for 19.4% of all households.
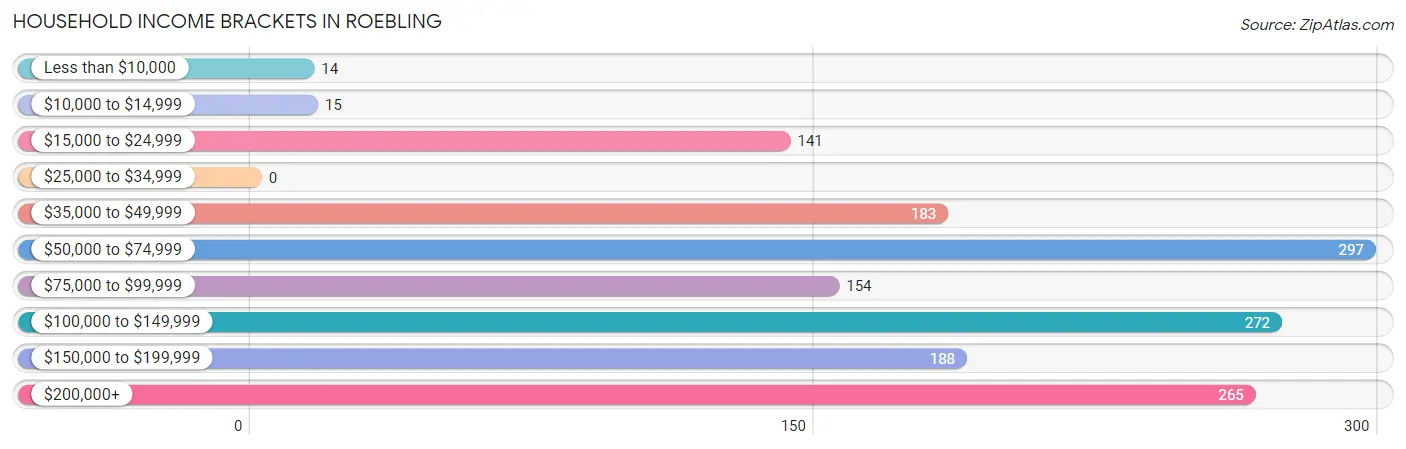
| Income Bracket | # Households | % Households |
| Less than $10,000 | 14 | 0.9% |
| $10,000 to $14,999 | 15 | 1.0% |
| $15,000 to $24,999 | 141 | 9.2% |
| $25,000 to $34,999 | 0 | 0.0% |
| $35,000 to $49,999 | 183 | 12.0% |
| $50,000 to $74,999 | 297 | 19.4% |
| $75,000 to $99,999 | 154 | 10.1% |
| $100,000 to $149,999 | 272 | 17.8% |
| $150,000 to $199,999 | 188 | 12.3% |
| $200,000+ | 265 | 17.3% |
Household Income by Householder Age in Roebling
The median household income in Roebling is $89,917, with the highest median household income of $123,250 found in the 45 to 64 years age bracket for the primary householder. A total of 551 households (36.0%) fall into this category.
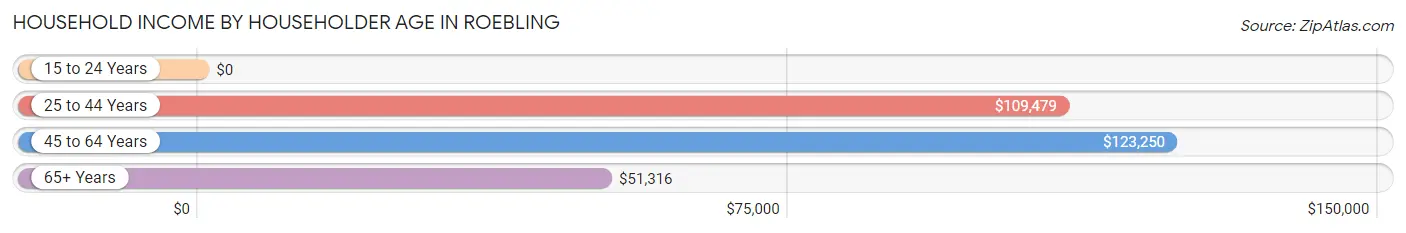
| Income Bracket | # Households | Median Income |
| 15 to 24 Years | 0 (0.0%) | $0 |
| 25 to 44 Years | 574 (37.5%) | $109,479 |
| 45 to 64 Years | 551 (36.0%) | $123,250 |
| 65+ Years | 404 (26.4%) | $51,316 |
| Total | 1,529 (100.0%) | $89,917 |
Poverty in Roebling
Income Below Poverty by Sex and Age in Roebling
With 11.5% poverty level for males and 6.8% for females among the residents of Roebling, under 5 year old males and 5 year old females are the most vulnerable to poverty, with 50 males (82.0%) and 19 females (35.2%) in their respective age groups living below the poverty level.
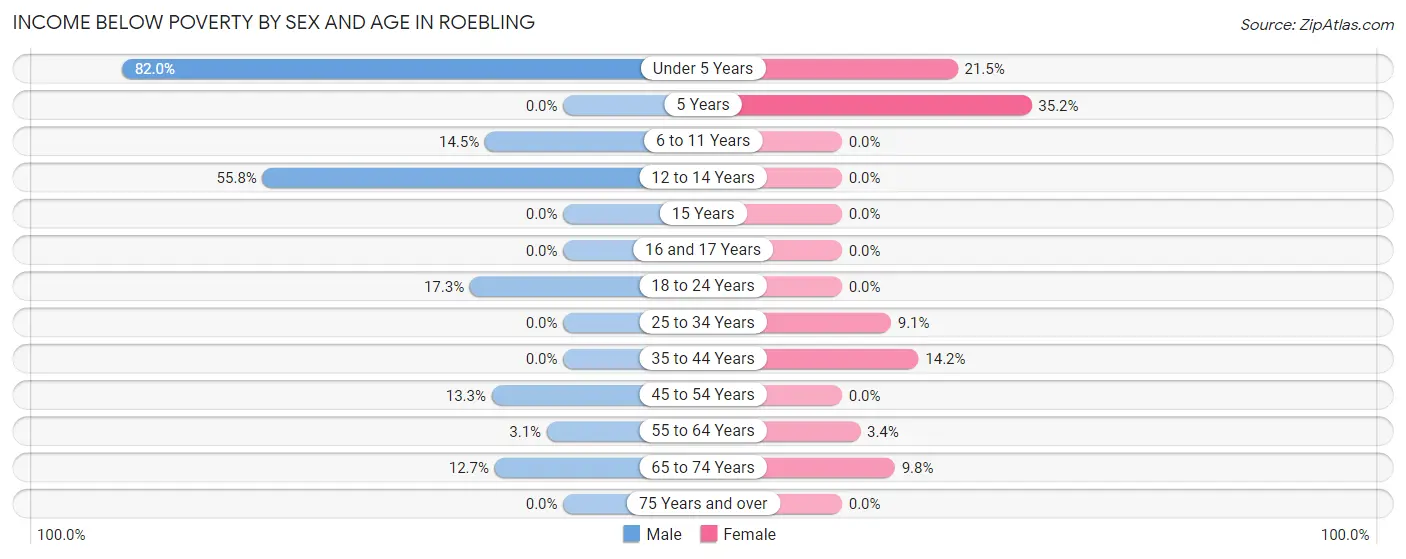
| Age Bracket | Male | Female |
| Under 5 Years | 50 (82.0%) | 26 (21.5%) |
| 5 Years | 0 (0.0%) | 19 (35.2%) |
| 6 to 11 Years | 42 (14.5%) | 0 (0.0%) |
| 12 to 14 Years | 24 (55.8%) | 0 (0.0%) |
| 15 Years | 0 (0.0%) | 0 (0.0%) |
| 16 and 17 Years | 0 (0.0%) | 0 (0.0%) |
| 18 to 24 Years | 48 (17.3%) | 0 (0.0%) |
| 25 to 34 Years | 0 (0.0%) | 14 (9.1%) |
| 35 to 44 Years | 0 (0.0%) | 56 (14.2%) |
| 45 to 54 Years | 51 (13.3%) | 0 (0.0%) |
| 55 to 64 Years | 6 (3.0%) | 7 (3.4%) |
| 65 to 74 Years | 22 (12.7%) | 16 (9.8%) |
| 75 Years and over | 0 (0.0%) | 0 (0.0%) |
| Total | 243 (11.5%) | 138 (6.8%) |
Income Above Poverty by Sex and Age in Roebling
According to the poverty statistics in Roebling, males aged 5 years and females aged 6 to 11 years are the age groups that are most secure financially, with 100.0% of males and 100.0% of females in these age groups living above the poverty line.
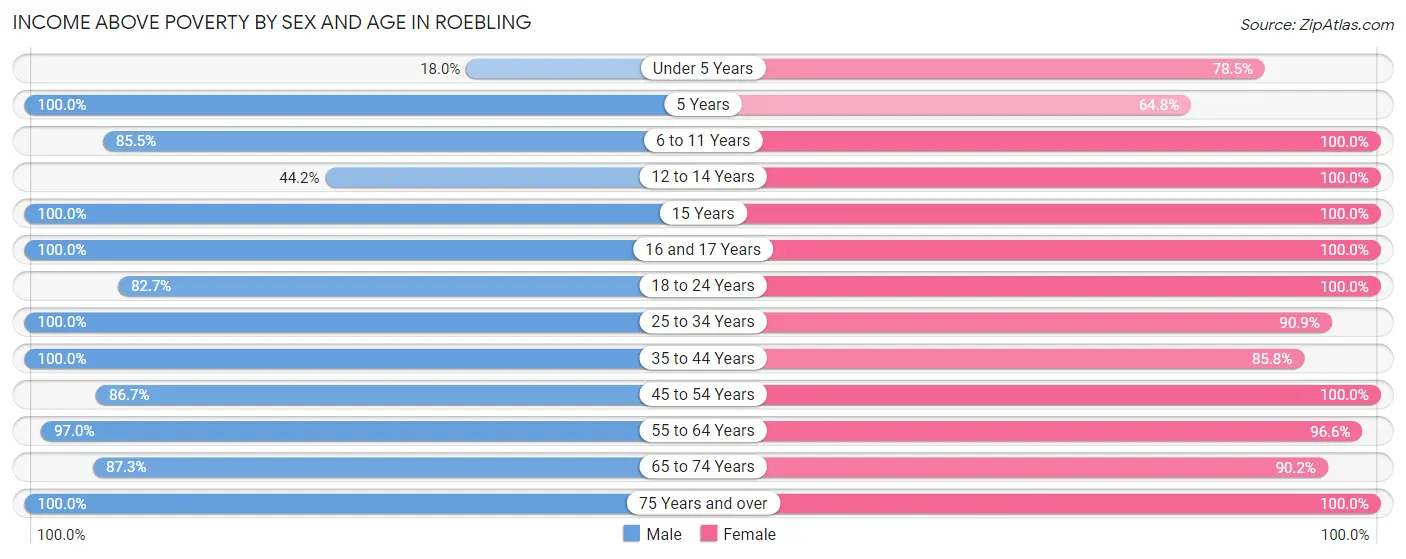
| Age Bracket | Male | Female |
| Under 5 Years | 11 (18.0%) | 95 (78.5%) |
| 5 Years | 48 (100.0%) | 35 (64.8%) |
| 6 to 11 Years | 247 (85.5%) | 117 (100.0%) |
| 12 to 14 Years | 19 (44.2%) | 94 (100.0%) |
| 15 Years | 69 (100.0%) | 9 (100.0%) |
| 16 and 17 Years | 63 (100.0%) | 99 (100.0%) |
| 18 to 24 Years | 229 (82.7%) | 153 (100.0%) |
| 25 to 34 Years | 257 (100.0%) | 140 (90.9%) |
| 35 to 44 Years | 232 (100.0%) | 338 (85.8%) |
| 45 to 54 Years | 333 (86.7%) | 253 (100.0%) |
| 55 to 64 Years | 191 (97.0%) | 200 (96.6%) |
| 65 to 74 Years | 151 (87.3%) | 147 (90.2%) |
| 75 Years and over | 27 (100.0%) | 200 (100.0%) |
| Total | 1,877 (88.5%) | 1,880 (93.2%) |
Income Below Poverty Among Married-Couple Families in Roebling
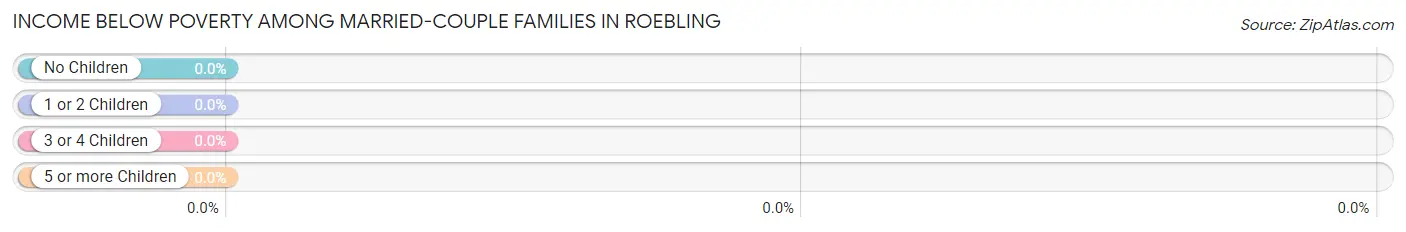
| Children | Above Poverty | Below Poverty |
| No Children | 329 (100.0%) | 0 (0.0%) |
| 1 or 2 Children | 252 (100.0%) | 0 (0.0%) |
| 3 or 4 Children | 40 (100.0%) | 0 (0.0%) |
| 5 or more Children | 8 (100.0%) | 0 (0.0%) |
| Total | 629 (100.0%) | 0 (0.0%) |
Income Below Poverty Among Single-Parent Households in Roebling
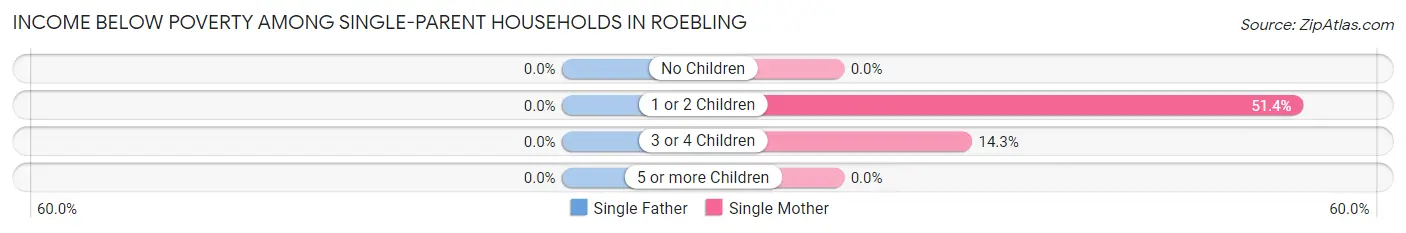
| Children | Single Father | Single Mother |
| No Children | 0 (0.0%) | 0 (0.0%) |
| 1 or 2 Children | 0 (0.0%) | 56 (51.4%) |
| 3 or 4 Children | 0 (0.0%) | 14 (14.3%) |
| 5 or more Children | 0 (0.0%) | 0 (0.0%) |
| Total | 0 (0.0%) | 70 (22.7%) |
Income Below Poverty Among Married-Couple vs Single-Parent Households in Roebling
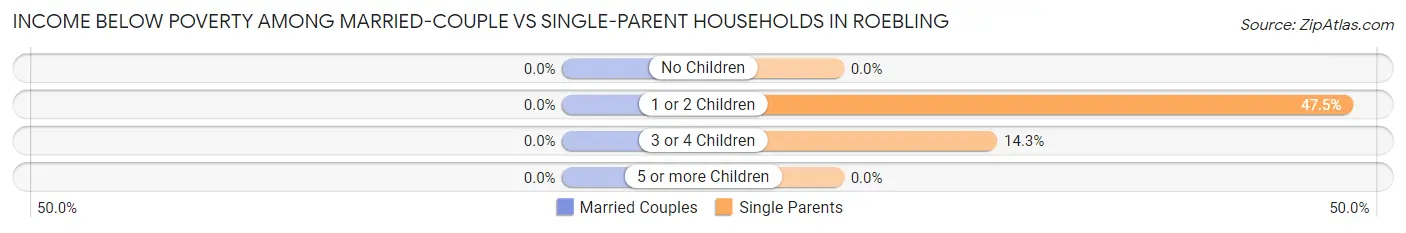
| Children | Married-Couple Families | Single-Parent Households |
| No Children | 0 (0.0%) | 0 (0.0%) |
| 1 or 2 Children | 0 (0.0%) | 56 (47.5%) |
| 3 or 4 Children | 0 (0.0%) | 14 (14.3%) |
| 5 or more Children | 0 (0.0%) | 0 (0.0%) |
| Total | 0 (0.0%) | 70 (21.3%) |
Race in Roebling
The most populous races in Roebling are White / Caucasian (3,191 | 77.0%), Asian (449 | 10.8%), and Hispanic or Latino (305 | 7.4%).
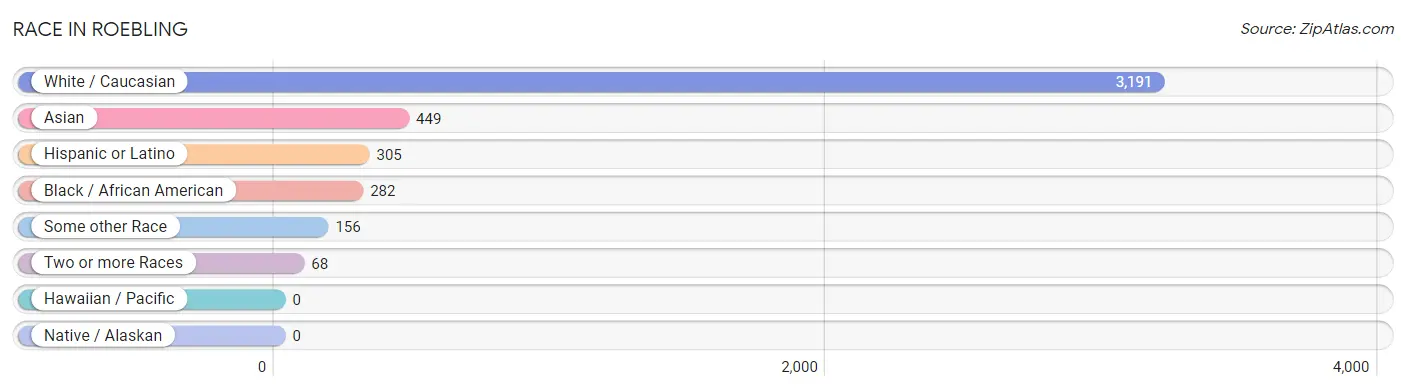
| Race | # Population | % Population |
| Asian | 449 | 10.8% |
| Black / African American | 282 | 6.8% |
| Hawaiian / Pacific | 0 | 0.0% |
| Hispanic or Latino | 305 | 7.4% |
| Native / Alaskan | 0 | 0.0% |
| White / Caucasian | 3,191 | 77.0% |
| Two or more Races | 68 | 1.6% |
| Some other Race | 156 | 3.8% |
| Total | 4,146 | 100.0% |
Ancestry in Roebling
The most populous ancestries reported in Roebling are Irish (955 | 23.0%), German (753 | 18.2%), Polish (684 | 16.5%), Italian (615 | 14.8%), and English (514 | 12.4%), together accounting for 84.9% of all Roebling residents.
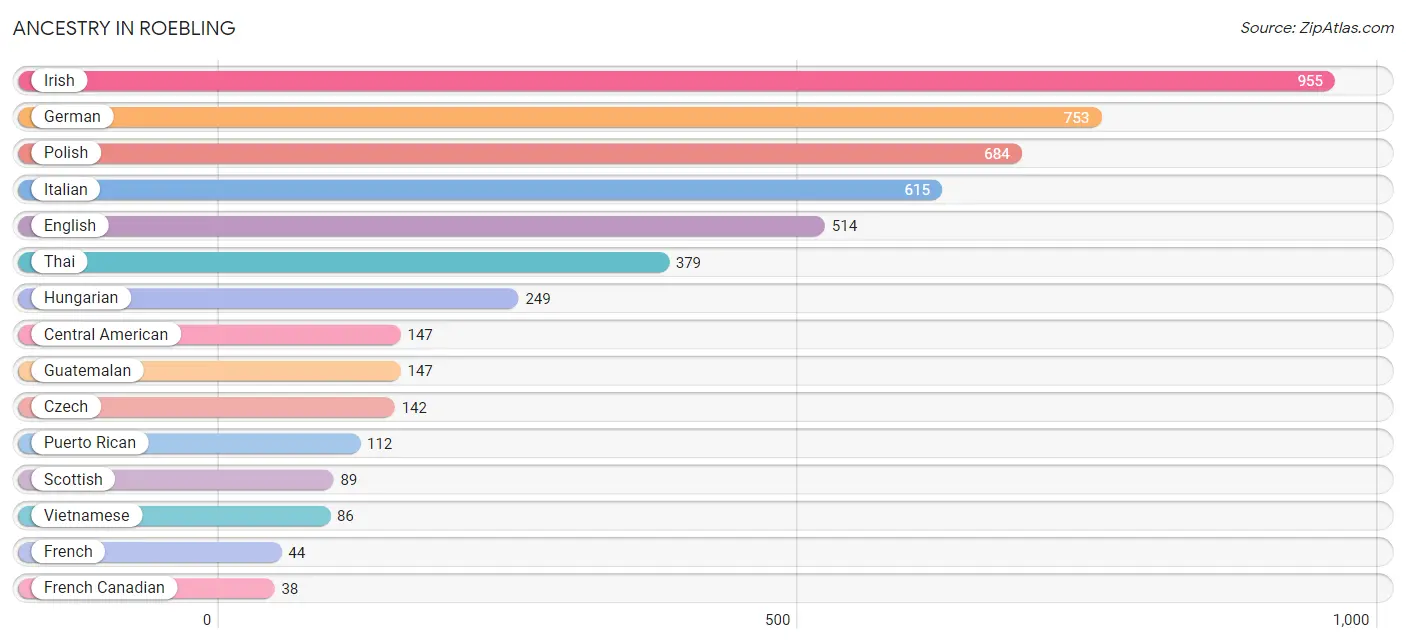
| Ancestry | # Population | % Population |
| African | 11 | 0.3% |
| American | 37 | 0.9% |
| Belgian | 16 | 0.4% |
| Central American | 147 | 3.5% |
| Czech | 142 | 3.4% |
| Czechoslovakian | 26 | 0.6% |
| Danish | 33 | 0.8% |
| Dominican | 33 | 0.8% |
| Dutch | 5 | 0.1% |
| Eastern European | 18 | 0.4% |
| English | 514 | 12.4% |
| European | 17 | 0.4% |
| French | 44 | 1.1% |
| French Canadian | 38 | 0.9% |
| German | 753 | 18.2% |
| Greek | 20 | 0.5% |
| Guatemalan | 147 | 3.5% |
| Hungarian | 249 | 6.0% |
| Irish | 955 | 23.0% |
| Italian | 615 | 14.8% |
| Korean | 16 | 0.4% |
| Lithuanian | 31 | 0.7% |
| Polish | 684 | 16.5% |
| Puerto Rican | 112 | 2.7% |
| Romanian | 10 | 0.2% |
| Russian | 5 | 0.1% |
| Scotch-Irish | 5 | 0.1% |
| Scottish | 89 | 2.1% |
| Shoshone | 1 | 0.0% |
| Slovak | 20 | 0.5% |
| Spanish | 8 | 0.2% |
| Subsaharan African | 11 | 0.3% |
| Thai | 379 | 9.1% |
| Trinidadian and Tobagonian | 5 | 0.1% |
| Ukrainian | 31 | 0.7% |
| Vietnamese | 86 | 2.1% |
| Welsh | 22 | 0.5% | View All 37 Rows |
Immigrants in Roebling
The most numerous immigrant groups reported in Roebling came from Asia (331 | 8.0%), Bangladesh (315 | 7.6%), South Central Asia (315 | 7.6%), Latin America (41 | 1.0%), and Africa (33 | 0.8%), together accounting for 25.0% of all Roebling residents.
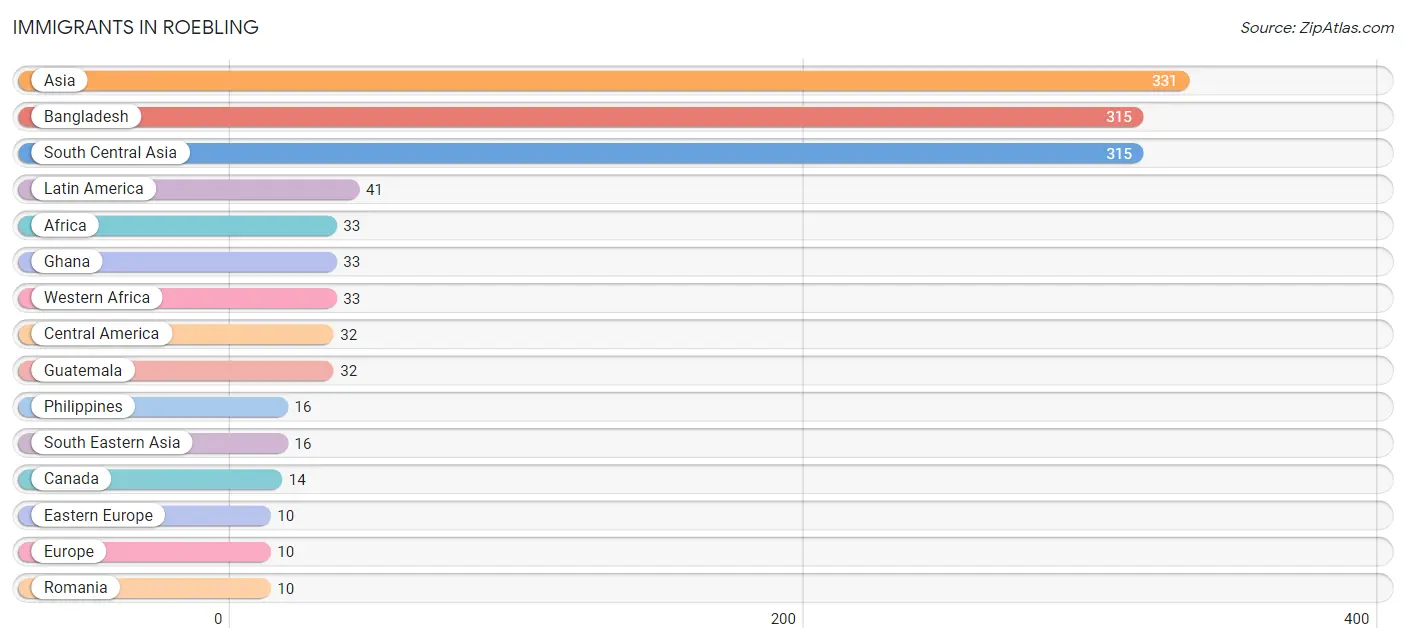
| Immigration Origin | # Population | % Population |
| Africa | 33 | 0.8% |
| Asia | 331 | 8.0% |
| Bangladesh | 315 | 7.6% |
| Canada | 14 | 0.3% |
| Caribbean | 9 | 0.2% |
| Central America | 32 | 0.8% |
| Dominican Republic | 9 | 0.2% |
| Eastern Europe | 10 | 0.2% |
| Europe | 10 | 0.2% |
| Ghana | 33 | 0.8% |
| Guatemala | 32 | 0.8% |
| Latin America | 41 | 1.0% |
| Philippines | 16 | 0.4% |
| Romania | 10 | 0.2% |
| South Central Asia | 315 | 7.6% |
| South Eastern Asia | 16 | 0.4% |
| Western Africa | 33 | 0.8% | View All 17 Rows |
Sex and Age in Roebling
Sex and Age in Roebling
The most populous age groups in Roebling are 45 to 49 Years (270 | 12.7%) for men and 35 to 39 Years (213 | 10.6%) for women.
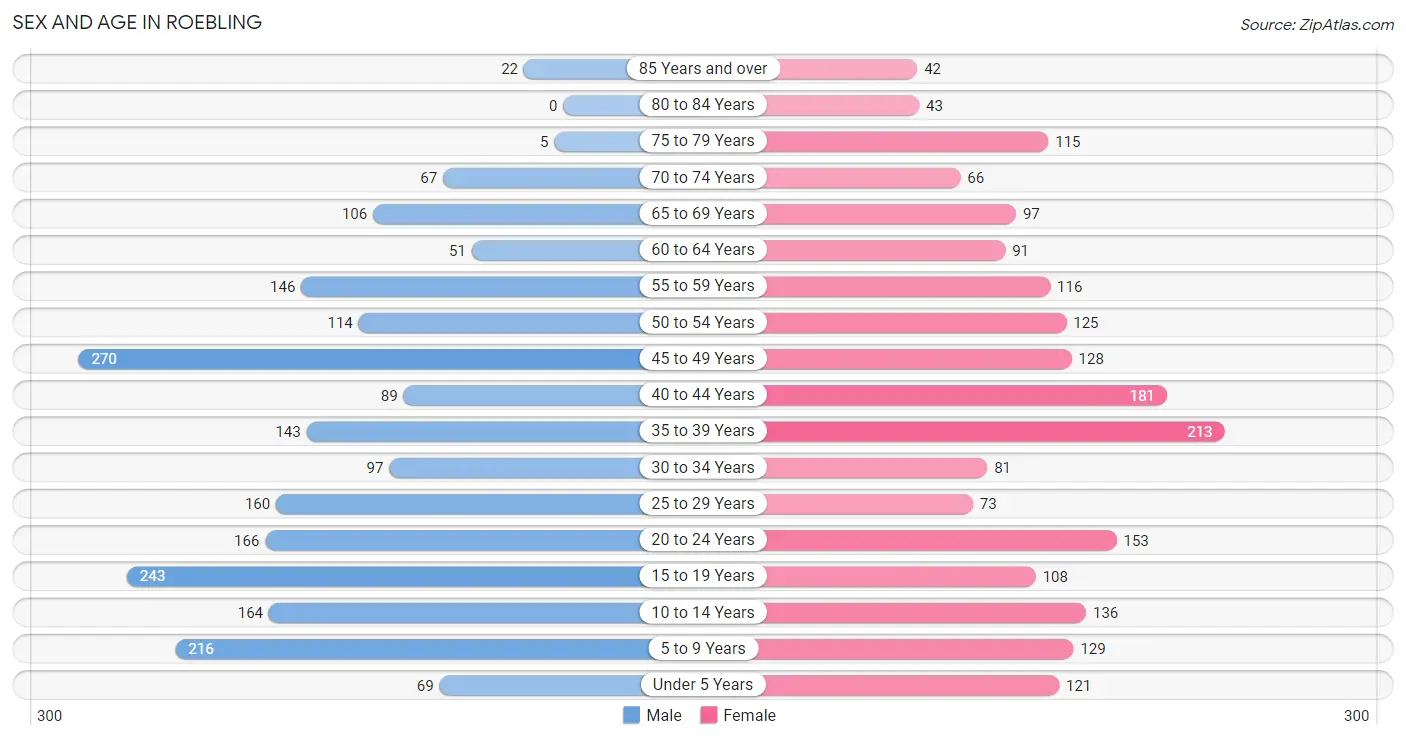
| Age Bracket | Male | Female |
| Under 5 Years | 69 (3.2%) | 121 (6.0%) |
| 5 to 9 Years | 216 (10.2%) | 129 (6.4%) |
| 10 to 14 Years | 164 (7.7%) | 136 (6.7%) |
| 15 to 19 Years | 243 (11.4%) | 108 (5.3%) |
| 20 to 24 Years | 166 (7.8%) | 153 (7.6%) |
| 25 to 29 Years | 160 (7.5%) | 73 (3.6%) |
| 30 to 34 Years | 97 (4.6%) | 81 (4.0%) |
| 35 to 39 Years | 143 (6.7%) | 213 (10.6%) |
| 40 to 44 Years | 89 (4.2%) | 181 (9.0%) |
| 45 to 49 Years | 270 (12.7%) | 128 (6.3%) |
| 50 to 54 Years | 114 (5.4%) | 125 (6.2%) |
| 55 to 59 Years | 146 (6.9%) | 116 (5.8%) |
| 60 to 64 Years | 51 (2.4%) | 91 (4.5%) |
| 65 to 69 Years | 106 (5.0%) | 97 (4.8%) |
| 70 to 74 Years | 67 (3.2%) | 66 (3.3%) |
| 75 to 79 Years | 5 (0.2%) | 115 (5.7%) |
| 80 to 84 Years | 0 (0.0%) | 43 (2.1%) |
| 85 Years and over | 22 (1.0%) | 42 (2.1%) |
| Total | 2,128 (100.0%) | 2,018 (100.0%) |
Families and Households in Roebling
Median Family Size in Roebling
The median family size in Roebling is 3.50 persons per family, with married-couple families (629 | 65.7%) accounting for the largest median family size of 3.68 persons per family. On the other hand, single male/father families (21 | 2.2%) represent the smallest median family size with 2.10 persons per family.
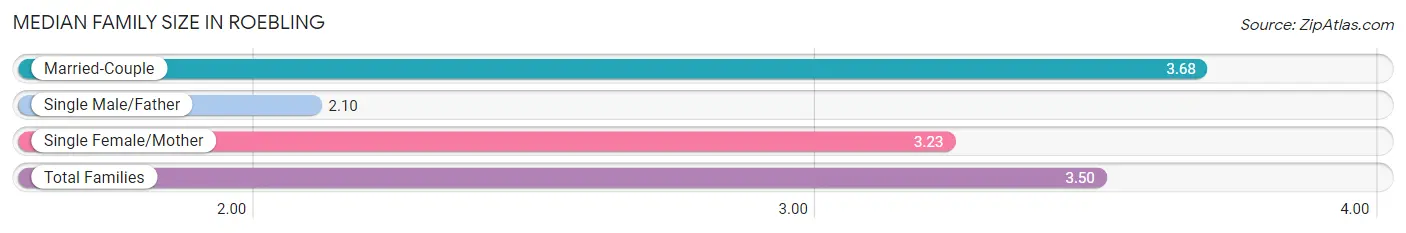
| Family Type | # Families | Family Size |
| Married-Couple | 629 (65.7%) | 3.68 |
| Single Male/Father | 21 (2.2%) | 2.10 |
| Single Female/Mother | 308 (32.2%) | 3.23 |
| Total Families | 958 (100.0%) | 3.50 |
Median Household Size in Roebling
The median household size in Roebling is 2.71 persons per household, with married-couple households (629 | 41.1%) accounting for the largest median household size of 3.68 persons per household. non-family households (571 | 37.3%) represent the smallest median household size with 1.22 persons per household.
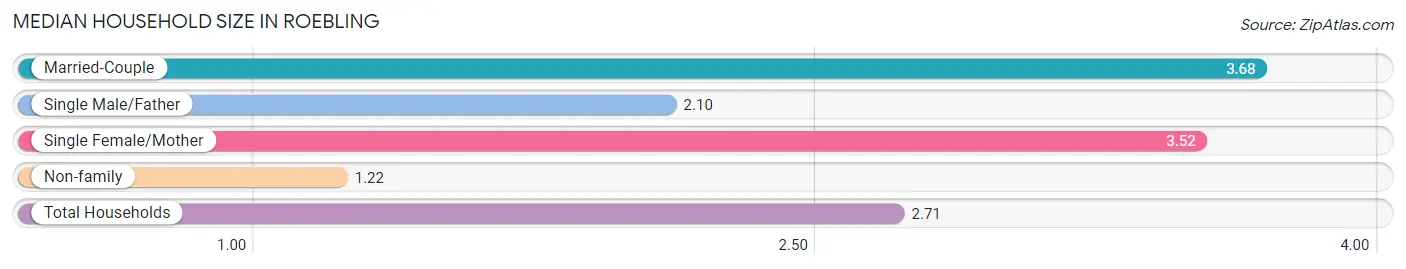
| Household Type | # Households | Household Size |
| Married-Couple | 629 (41.1%) | 3.68 |
| Single Male/Father | 21 (1.4%) | 2.10 |
| Single Female/Mother | 308 (20.1%) | 3.52 |
| Non-family | 571 (37.3%) | 1.22 |
| Total Households | 1,529 (100.0%) | 2.71 |
Household Size by Marriage Status in Roebling
Out of a total of 1,529 households in Roebling, 958 (62.7%) are family households, while 571 (37.3%) are nonfamily households. The most numerous type of family households are 2-person households, comprising 351, and the most common type of nonfamily households are 1-person households, comprising 459.
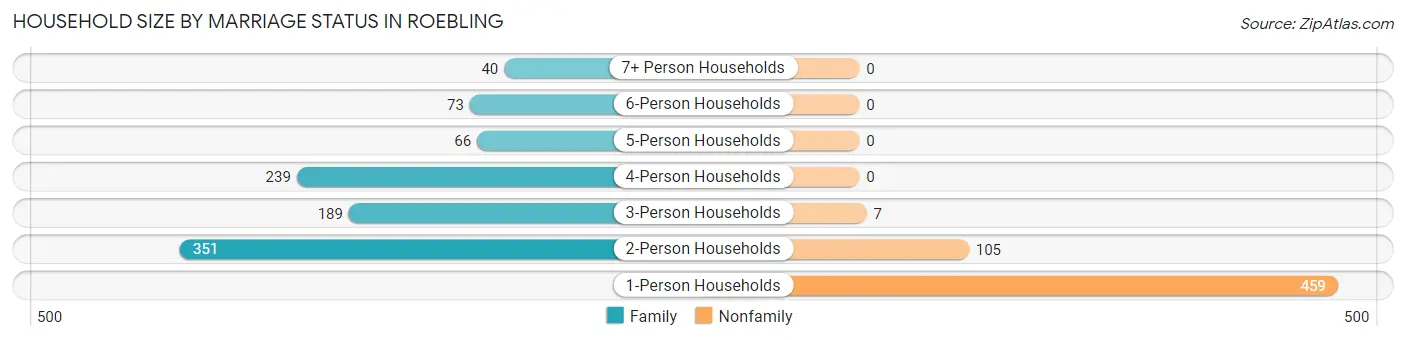
| Household Size | Family Households | Nonfamily Households |
| 1-Person Households | - | 459 (30.0%) |
| 2-Person Households | 351 (23.0%) | 105 (6.9%) |
| 3-Person Households | 189 (12.4%) | 7 (0.5%) |
| 4-Person Households | 239 (15.6%) | 0 (0.0%) |
| 5-Person Households | 66 (4.3%) | 0 (0.0%) |
| 6-Person Households | 73 (4.8%) | 0 (0.0%) |
| 7+ Person Households | 40 (2.6%) | 0 (0.0%) |
| Total | 958 (62.7%) | 571 (37.3%) |
Female Fertility in Roebling
Fertility by Age in Roebling
Average fertility rate in Roebling is 23.0 births per 1,000 women. Women in the age bracket of 20 to 34 years have the highest fertility rate with 72.0 births per 1,000 women. Women in the age bracket of 20 to 34 years acount for 100.0% of all women with births.
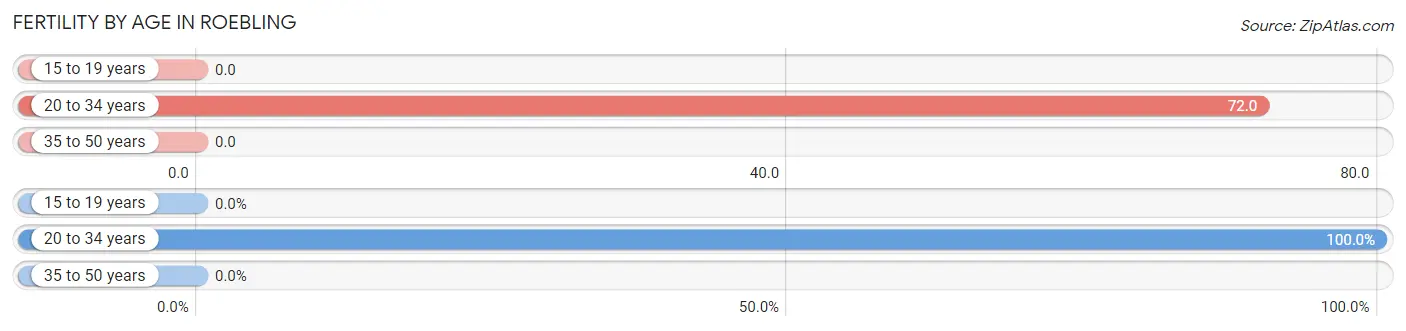
| Age Bracket | Women with Births | Births / 1,000 Women |
| 15 to 19 years | 0 (0.0%) | 0.0 |
| 20 to 34 years | 22 (100.0%) | 72.0 |
| 35 to 50 years | 0 (0.0%) | 0.0 |
| Total | 22 (100.0%) | 23.0 |
Fertility by Age by Marriage Status in Roebling
36.4% of women with births (22) in Roebling are married. The highest percentage of unmarried women with births falls into 20 to 34 years age bracket with 63.6% of them unmarried at the time of birth, while the lowest percentage of unmarried women with births belong to 20 to 34 years age bracket with 63.6% of them unmarried.
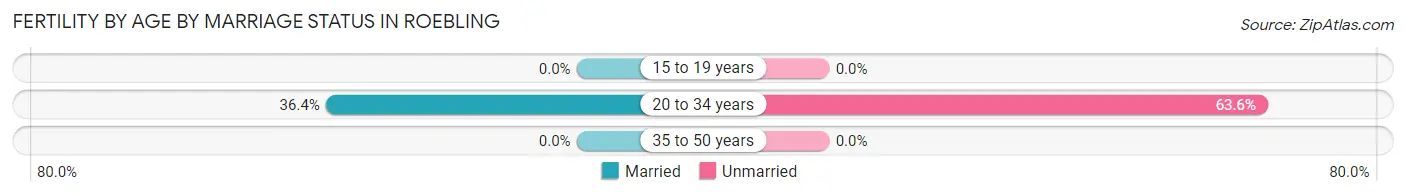
| Age Bracket | Married | Unmarried |
| 15 to 19 years | 0 (0.0%) | 0 (0.0%) |
| 20 to 34 years | 8 (36.4%) | 14 (63.6%) |
| 35 to 50 years | 0 (0.0%) | 0 (0.0%) |
| Total | 8 (36.4%) | 14 (63.6%) |
Fertility by Education in Roebling
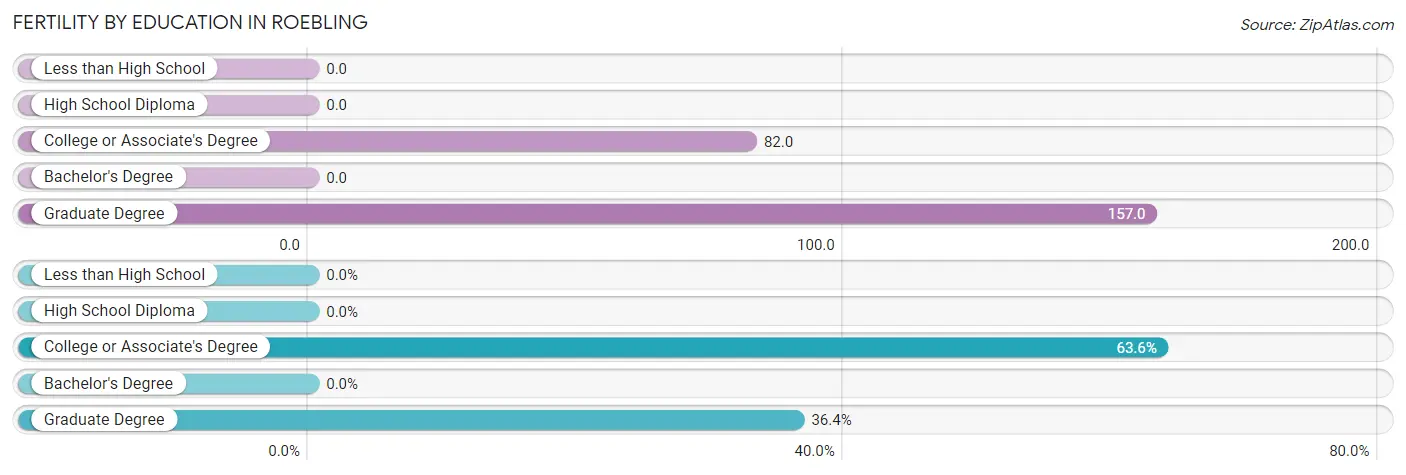
| Educational Attainment | Women with Births | Births / 1,000 Women |
| Less than High School | 0 (0.0%) | 0.0 |
| High School Diploma | 0 (0.0%) | 0.0 |
| College or Associate's Degree | 14 (63.6%) | 82.0 |
| Bachelor's Degree | 0 (0.0%) | 0.0 |
| Graduate Degree | 8 (36.4%) | 157.0 |
| Total | 22 (100.0%) | 23.0 |
Fertility by Education by Marriage Status in Roebling
63.6% of women with births in Roebling are unmarried. Women with the educational attainment of graduate degree are most likely to be married with 100.0% of them married at childbirth, while women with the educational attainment of college or associate's degree are least likely to be married with 100.0% of them unmarried at childbirth.
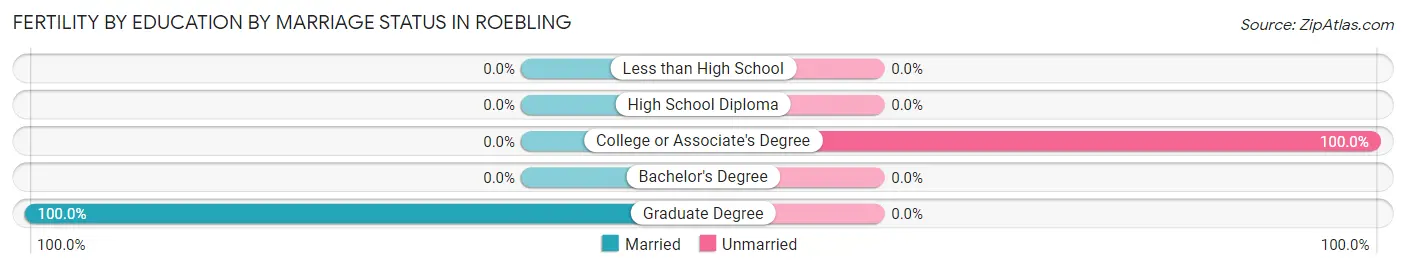
| Educational Attainment | Married | Unmarried |
| Less than High School | 0 (0.0%) | 0 (0.0%) |
| High School Diploma | 0 (0.0%) | 0 (0.0%) |
| College or Associate's Degree | 0 (0.0%) | 14 (100.0%) |
| Bachelor's Degree | 0 (0.0%) | 0 (0.0%) |
| Graduate Degree | 8 (100.0%) | 0 (0.0%) |
| Total | 8 (36.4%) | 14 (63.6%) |
Employment Characteristics in Roebling
Employment by Class of Employer in Roebling
Among the 2,202 employed individuals in Roebling, private company employees (1,566 | 71.1%), local government employees (188 | 8.5%), and state government employees (156 | 7.1%) make up the most common classes of employment.
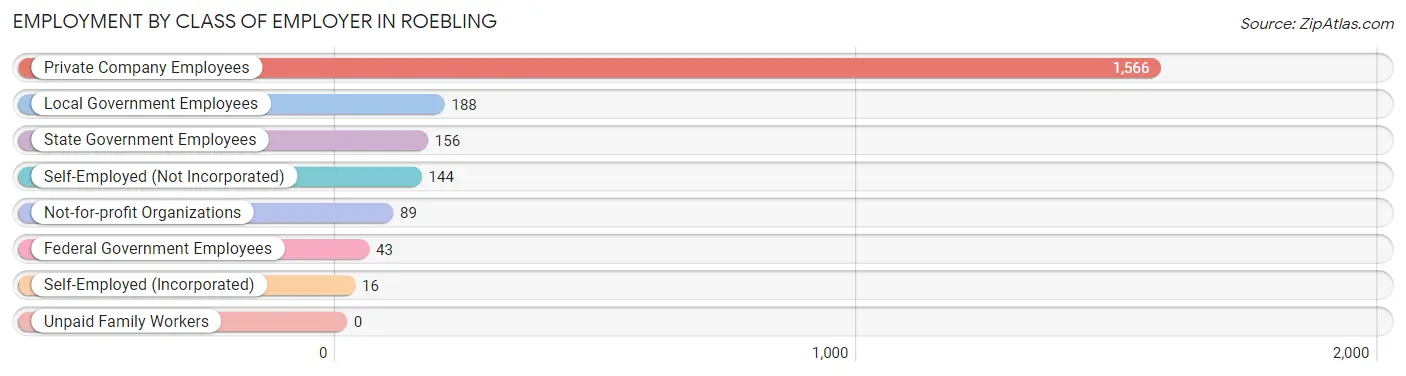
| Employer Class | # Employees | % Employees |
| Private Company Employees | 1,566 | 71.1% |
| Self-Employed (Incorporated) | 16 | 0.7% |
| Self-Employed (Not Incorporated) | 144 | 6.5% |
| Not-for-profit Organizations | 89 | 4.0% |
| Local Government Employees | 188 | 8.5% |
| State Government Employees | 156 | 7.1% |
| Federal Government Employees | 43 | 1.9% |
| Unpaid Family Workers | 0 | 0.0% |
| Total | 2,202 | 100.0% |
Employment Status by Age in Roebling
According to the labor force statistics for Roebling, out of the total population over 16 years of age (3,233), 72.1% or 2,331 individuals are in the labor force, with 3.5% or 82 of them unemployed. The age group with the highest labor force participation rate is 30 to 34 years, with 100.0% or 178 individuals in the labor force. Within the labor force, the 45 to 54 years age range has the highest percentage of unemployed individuals, with 9.7% or 51 of them being unemployed.
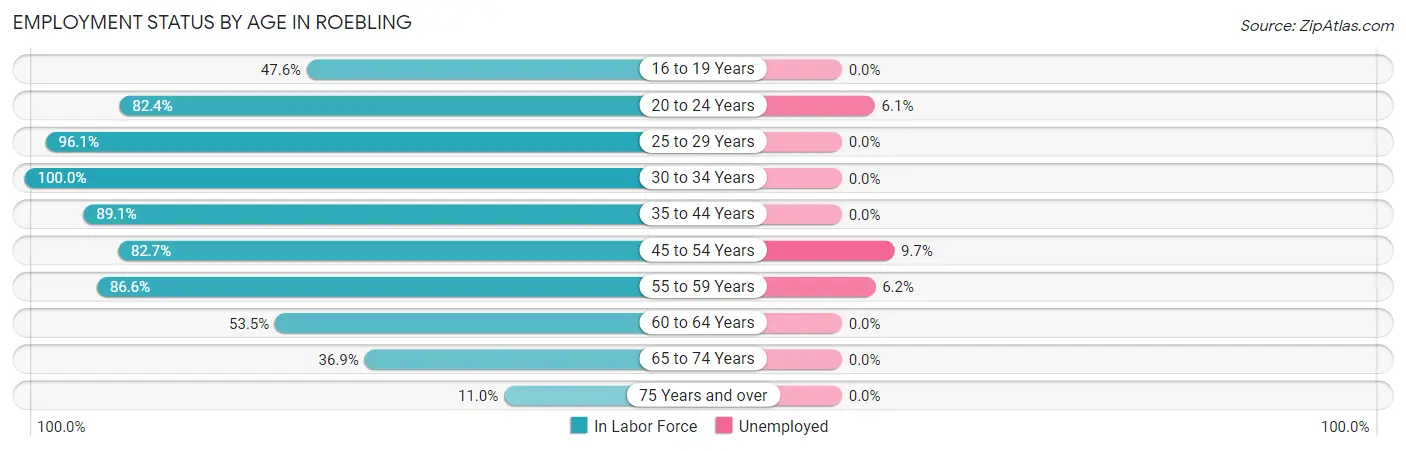
| Age Bracket | In Labor Force | Unemployed |
| 16 to 19 Years | 130 (47.6%) | 0 (0.0%) |
| 20 to 24 Years | 263 (82.4%) | 16 (6.1%) |
| 25 to 29 Years | 224 (96.1%) | 0 (0.0%) |
| 30 to 34 Years | 178 (100.0%) | 0 (0.0%) |
| 35 to 44 Years | 558 (89.1%) | 0 (0.0%) |
| 45 to 54 Years | 527 (82.7%) | 51 (9.7%) |
| 55 to 59 Years | 227 (86.6%) | 14 (6.2%) |
| 60 to 64 Years | 76 (53.5%) | 0 (0.0%) |
| 65 to 74 Years | 124 (36.9%) | 0 (0.0%) |
| 75 Years and over | 25 (11.0%) | 0 (0.0%) |
| Total | 2,331 (72.1%) | 82 (3.5%) |
Employment Status by Educational Attainment in Roebling
According to labor force statistics for Roebling, 86.1% of individuals (1,789) out of the total population between 25 and 64 years of age (2,078) are in the labor force, with 3.7% or 66 of them being unemployed. The group with the highest labor force participation rate are those with the educational attainment of less than high school, with 100.0% or 73 individuals in the labor force. Within the labor force, individuals with less than high school education have the highest percentage of unemployment, with 69.9% or 51 of them being unemployed.
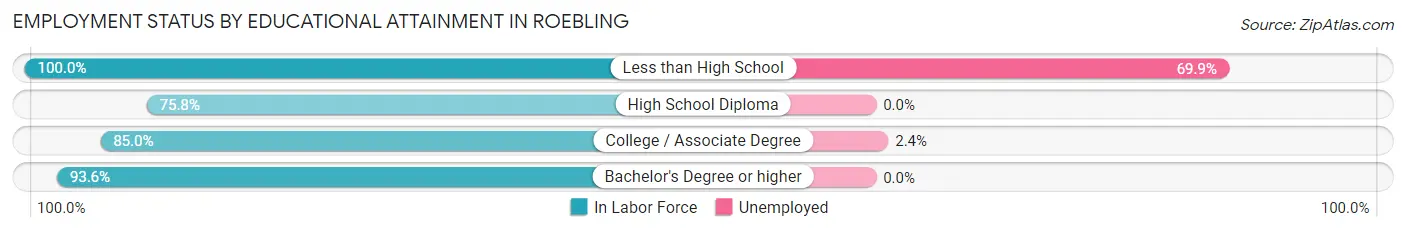
| Educational Attainment | In Labor Force | Unemployed |
| Less than High School | 73 (100.0%) | 51 (69.9%) |
| High School Diploma | 424 (75.8%) | 0 (0.0%) |
| College / Associate Degree | 595 (85.0%) | 17 (2.4%) |
| Bachelor's Degree or higher | 698 (93.6%) | 0 (0.0%) |
| Total | 1,789 (86.1%) | 77 (3.7%) |
Employment Occupations by Sex in Roebling
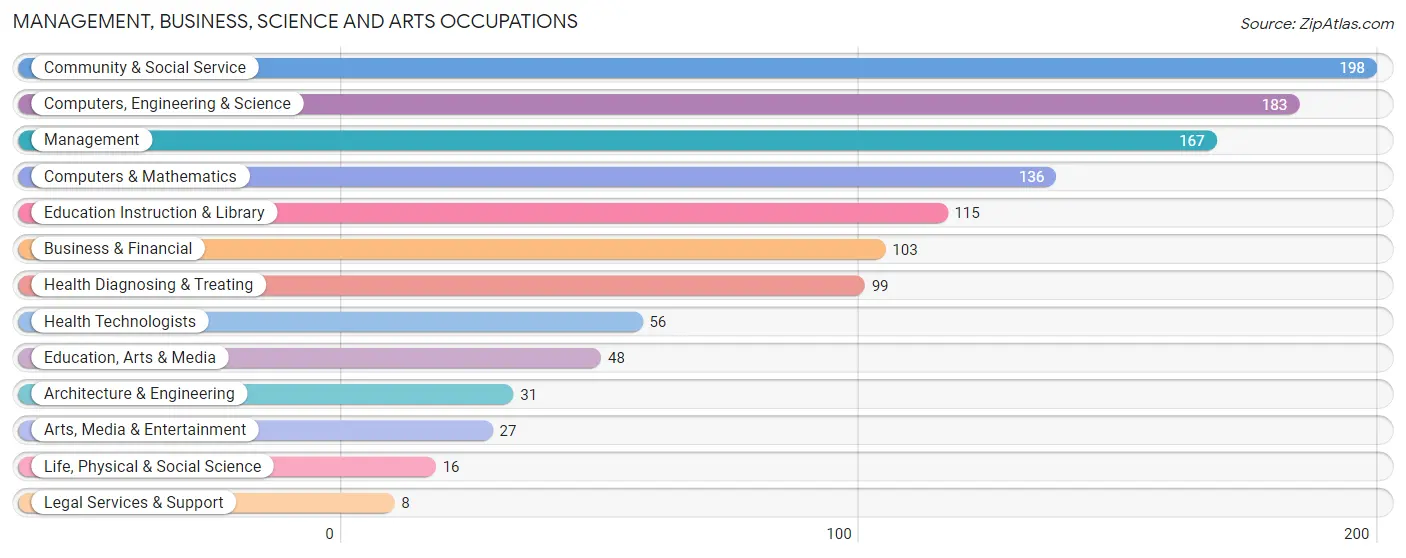
Management, Business, Science and Arts Occupations
The most common Management, Business, Science and Arts occupations in Roebling are Community & Social Service (198 | 8.8%), Computers, Engineering & Science (183 | 8.2%), Management (167 | 7.5%), Computers & Mathematics (136 | 6.1%), and Education Instruction & Library (115 | 5.1%).
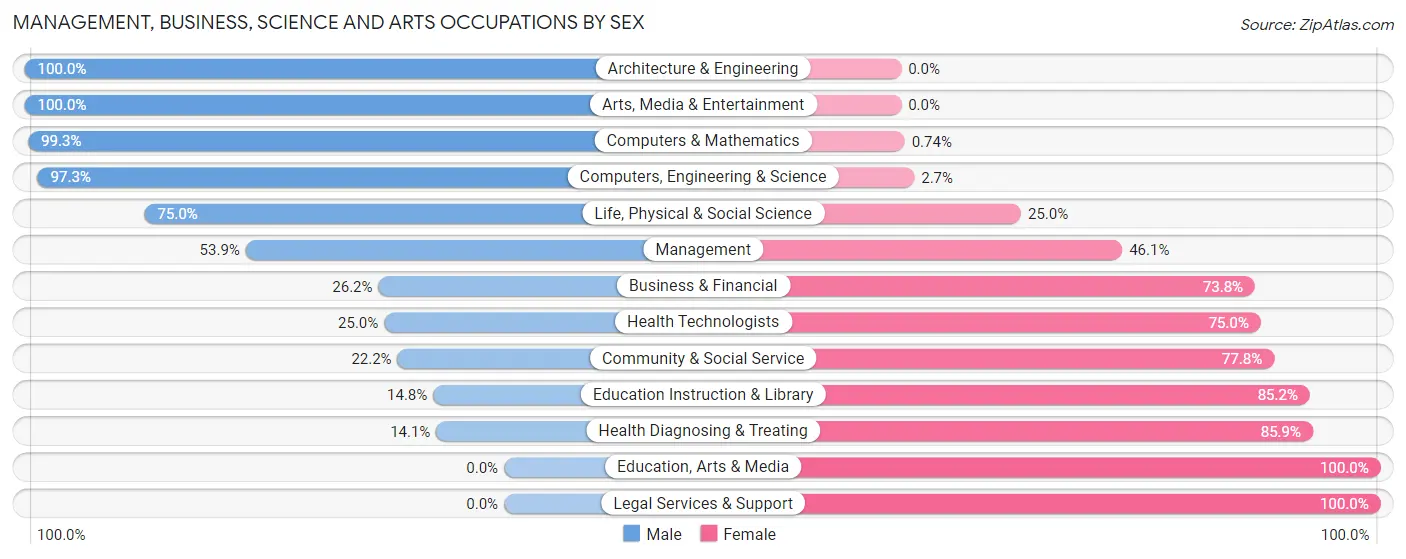
Management, Business, Science and Arts Occupations by Sex
Within the Management, Business, Science and Arts occupations in Roebling, the most male-oriented occupations are Architecture & Engineering (100.0%), Arts, Media & Entertainment (100.0%), and Computers & Mathematics (99.3%), while the most female-oriented occupations are Education, Arts & Media (100.0%), Legal Services & Support (100.0%), and Health Diagnosing & Treating (85.9%).
| Occupation | Male | Female |
| Management | 90 (53.9%) | 77 (46.1%) |
| Business & Financial | 27 (26.2%) | 76 (73.8%) |
| Computers, Engineering & Science | 178 (97.3%) | 5 (2.7%) |
| Computers & Mathematics | 135 (99.3%) | 1 (0.7%) |
| Architecture & Engineering | 31 (100.0%) | 0 (0.0%) |
| Life, Physical & Social Science | 12 (75.0%) | 4 (25.0%) |
| Community & Social Service | 44 (22.2%) | 154 (77.8%) |
| Education, Arts & Media | 0 (0.0%) | 48 (100.0%) |
| Legal Services & Support | 0 (0.0%) | 8 (100.0%) |
| Education Instruction & Library | 17 (14.8%) | 98 (85.2%) |
| Arts, Media & Entertainment | 27 (100.0%) | 0 (0.0%) |
| Health Diagnosing & Treating | 14 (14.1%) | 85 (85.9%) |
| Health Technologists | 14 (25.0%) | 42 (75.0%) |
| Total (Category) | 353 (47.1%) | 397 (52.9%) |
| Total (Overall) | 1,143 (51.0%) | 1,096 (48.9%) |
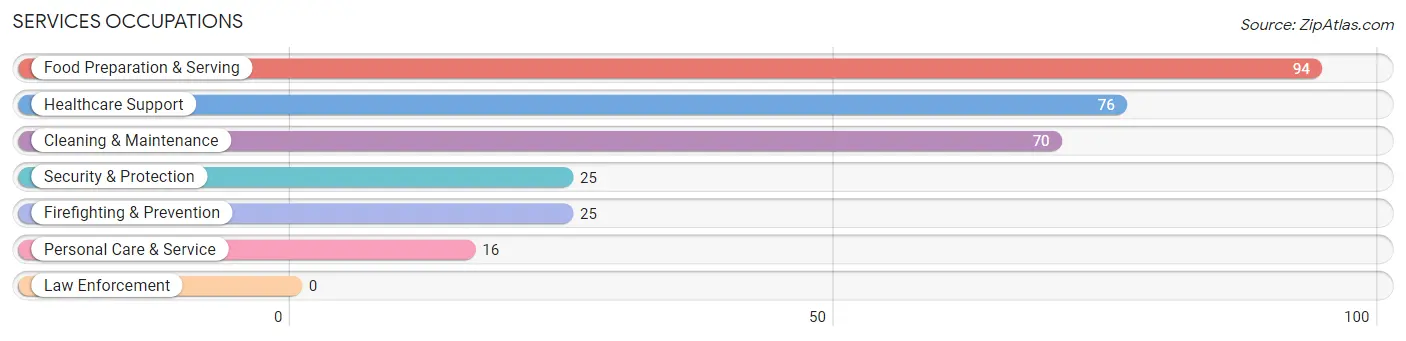
Services Occupations
The most common Services occupations in Roebling are Food Preparation & Serving (94 | 4.2%), Healthcare Support (76 | 3.4%), Cleaning & Maintenance (70 | 3.1%), Security & Protection (25 | 1.1%), and Firefighting & Prevention (25 | 1.1%).
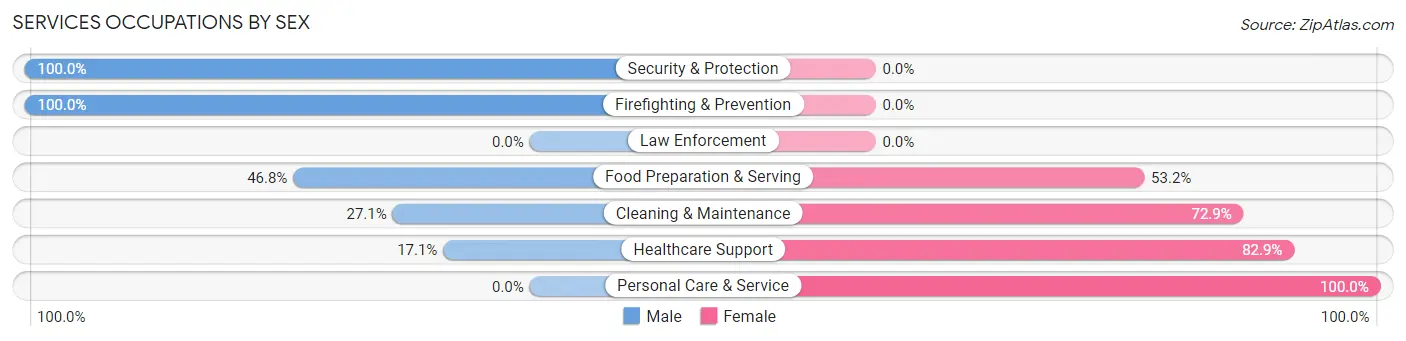
Services Occupations by Sex
Within the Services occupations in Roebling, the most male-oriented occupations are Security & Protection (100.0%), Firefighting & Prevention (100.0%), and Food Preparation & Serving (46.8%), while the most female-oriented occupations are Personal Care & Service (100.0%), Healthcare Support (82.9%), and Cleaning & Maintenance (72.9%).
| Occupation | Male | Female |
| Healthcare Support | 13 (17.1%) | 63 (82.9%) |
| Security & Protection | 25 (100.0%) | 0 (0.0%) |
| Firefighting & Prevention | 25 (100.0%) | 0 (0.0%) |
| Law Enforcement | 0 (0.0%) | 0 (0.0%) |
| Food Preparation & Serving | 44 (46.8%) | 50 (53.2%) |
| Cleaning & Maintenance | 19 (27.1%) | 51 (72.9%) |
| Personal Care & Service | 0 (0.0%) | 16 (100.0%) |
| Total (Category) | 101 (35.9%) | 180 (64.1%) |
| Total (Overall) | 1,143 (51.0%) | 1,096 (48.9%) |
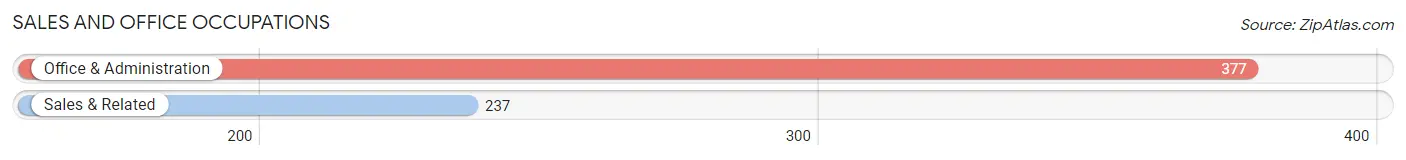
Sales and Office Occupations
The most common Sales and Office occupations in Roebling are Office & Administration (377 | 16.8%), and Sales & Related (237 | 10.6%).
Sales and Office Occupations by Sex
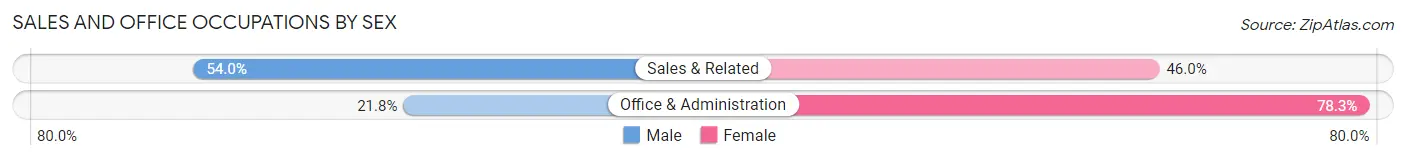
| Occupation | Male | Female |
| Sales & Related | 128 (54.0%) | 109 (46.0%) |
| Office & Administration | 82 (21.7%) | 295 (78.2%) |
| Total (Category) | 210 (34.2%) | 404 (65.8%) |
| Total (Overall) | 1,143 (51.0%) | 1,096 (48.9%) |
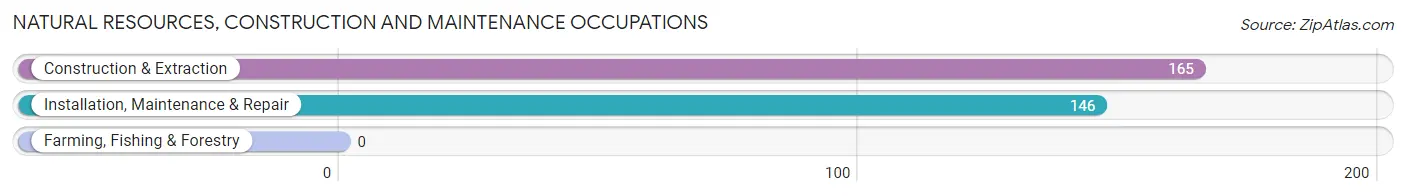
Natural Resources, Construction and Maintenance Occupations
The most common Natural Resources, Construction and Maintenance occupations in Roebling are Construction & Extraction (165 | 7.4%), and Installation, Maintenance & Repair (146 | 6.5%).
Natural Resources, Construction and Maintenance Occupations by Sex
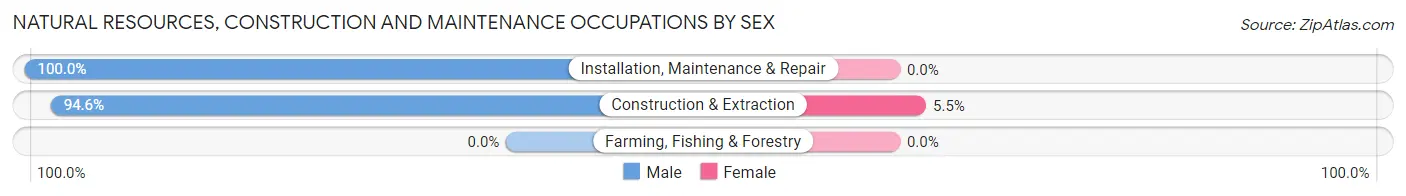
| Occupation | Male | Female |
| Farming, Fishing & Forestry | 0 (0.0%) | 0 (0.0%) |
| Construction & Extraction | 156 (94.6%) | 9 (5.4%) |
| Installation, Maintenance & Repair | 146 (100.0%) | 0 (0.0%) |
| Total (Category) | 302 (97.1%) | 9 (2.9%) |
| Total (Overall) | 1,143 (51.0%) | 1,096 (48.9%) |
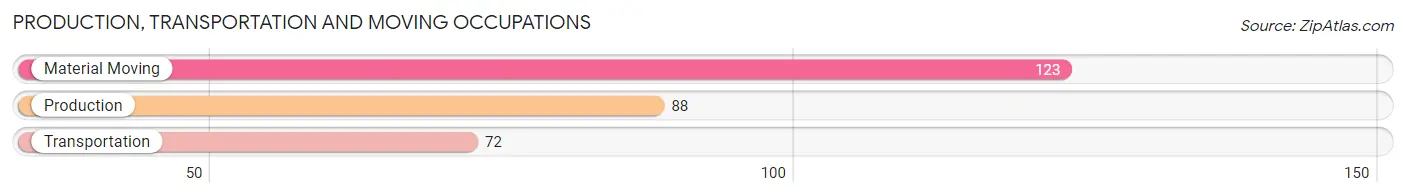
Production, Transportation and Moving Occupations
The most common Production, Transportation and Moving occupations in Roebling are Material Moving (123 | 5.5%), Production (88 | 3.9%), and Transportation (72 | 3.2%).
Production, Transportation and Moving Occupations by Sex
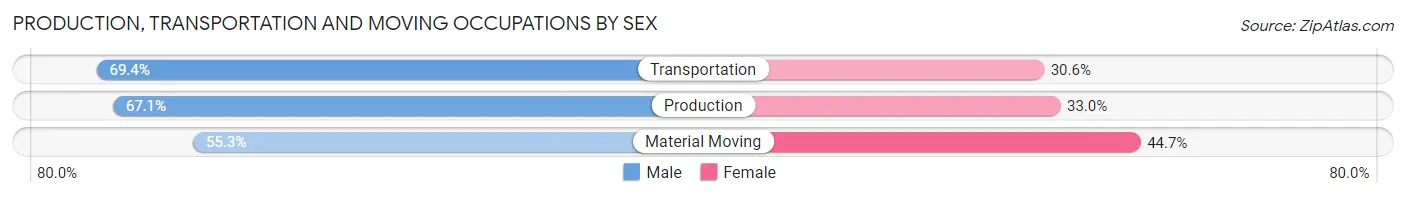
| Occupation | Male | Female |
| Production | 59 (67.0%) | 29 (33.0%) |
| Transportation | 50 (69.4%) | 22 (30.6%) |
| Material Moving | 68 (55.3%) | 55 (44.7%) |
| Total (Category) | 177 (62.5%) | 106 (37.5%) |
| Total (Overall) | 1,143 (51.0%) | 1,096 (48.9%) |
Employment Industries by Sex in Roebling
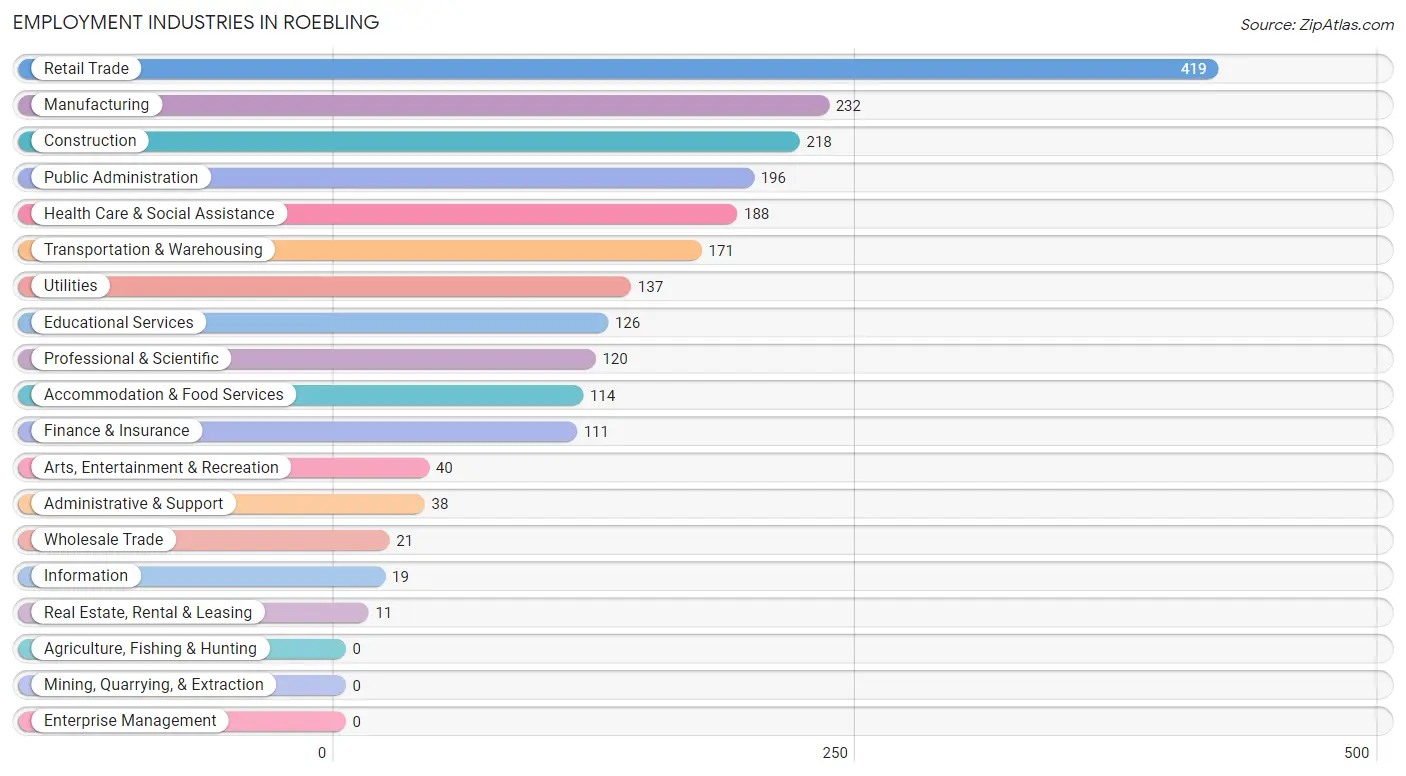
Employment Industries in Roebling
The major employment industries in Roebling include Retail Trade (419 | 18.7%), Manufacturing (232 | 10.4%), Construction (218 | 9.7%), Public Administration (196 | 8.7%), and Health Care & Social Assistance (188 | 8.4%).
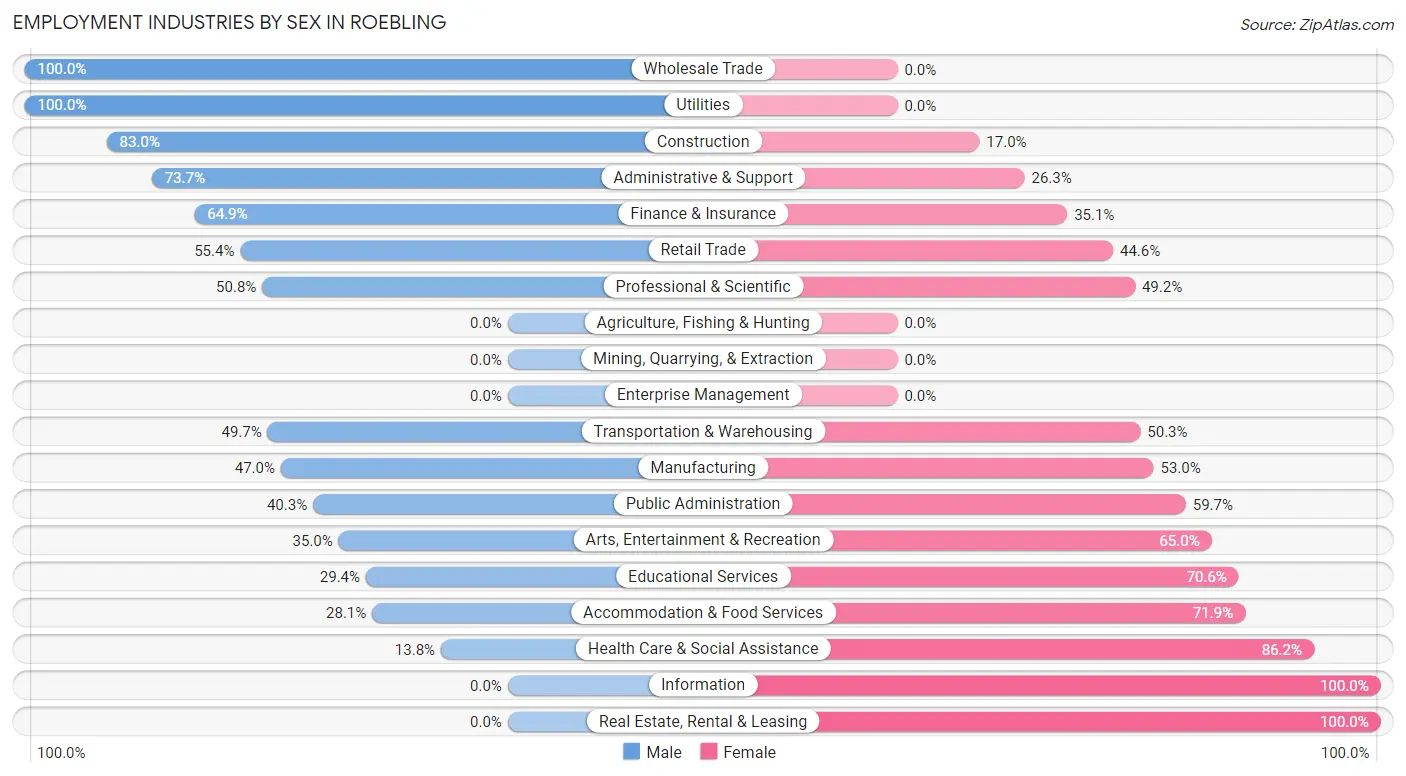
Employment Industries by Sex in Roebling
The Roebling industries that see more men than women are Wholesale Trade (100.0%), Utilities (100.0%), and Construction (83.0%), whereas the industries that tend to have a higher number of women are Information (100.0%), Real Estate, Rental & Leasing (100.0%), and Health Care & Social Assistance (86.2%).
| Industry | Male | Female |
| Agriculture, Fishing & Hunting | 0 (0.0%) | 0 (0.0%) |
| Mining, Quarrying, & Extraction | 0 (0.0%) | 0 (0.0%) |
| Construction | 181 (83.0%) | 37 (17.0%) |
| Manufacturing | 109 (47.0%) | 123 (53.0%) |
| Wholesale Trade | 21 (100.0%) | 0 (0.0%) |
| Retail Trade | 232 (55.4%) | 187 (44.6%) |
| Transportation & Warehousing | 85 (49.7%) | 86 (50.3%) |
| Utilities | 137 (100.0%) | 0 (0.0%) |
| Information | 0 (0.0%) | 19 (100.0%) |
| Finance & Insurance | 72 (64.9%) | 39 (35.1%) |
| Real Estate, Rental & Leasing | 0 (0.0%) | 11 (100.0%) |
| Professional & Scientific | 61 (50.8%) | 59 (49.2%) |
| Enterprise Management | 0 (0.0%) | 0 (0.0%) |
| Administrative & Support | 28 (73.7%) | 10 (26.3%) |
| Educational Services | 37 (29.4%) | 89 (70.6%) |
| Health Care & Social Assistance | 26 (13.8%) | 162 (86.2%) |
| Arts, Entertainment & Recreation | 14 (35.0%) | 26 (65.0%) |
| Accommodation & Food Services | 32 (28.1%) | 82 (71.9%) |
| Public Administration | 79 (40.3%) | 117 (59.7%) |
| Total | 1,143 (51.0%) | 1,096 (48.9%) |
Education in Roebling
School Enrollment in Roebling
The most common levels of schooling among the 1,310 students in Roebling are college / undergraduate (296 | 22.6%), high school (283 | 21.6%), and middle school (261 | 19.9%).
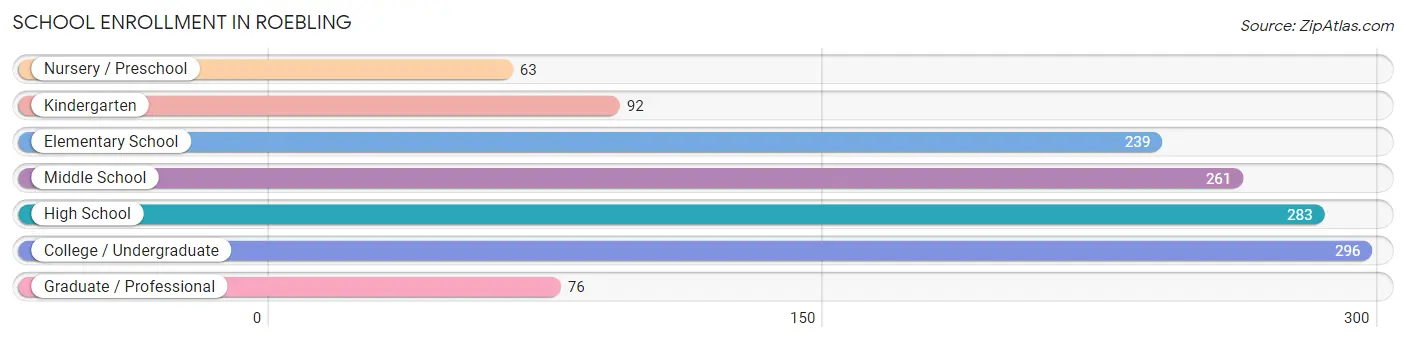
| School Level | # Students | % Students |
| Nursery / Preschool | 63 | 4.8% |
| Kindergarten | 92 | 7.0% |
| Elementary School | 239 | 18.2% |
| Middle School | 261 | 19.9% |
| High School | 283 | 21.6% |
| College / Undergraduate | 296 | 22.6% |
| Graduate / Professional | 76 | 5.8% |
| Total | 1,310 | 100.0% |
School Enrollment by Age by Funding Source in Roebling
Out of a total of 1,310 students who are enrolled in schools in Roebling, 170 (13.0%) attend a private institution, while the remaining 1,140 (87.0%) are enrolled in public schools. The age group of 15 to 17 year olds has the highest likelihood of being enrolled in private schools, with 83 (34.6% in the age bracket) enrolled. Conversely, the age group of 18 to 19 year olds has the lowest likelihood of being enrolled in a private school, with 111 (100.0% in the age bracket) attending a public institution.
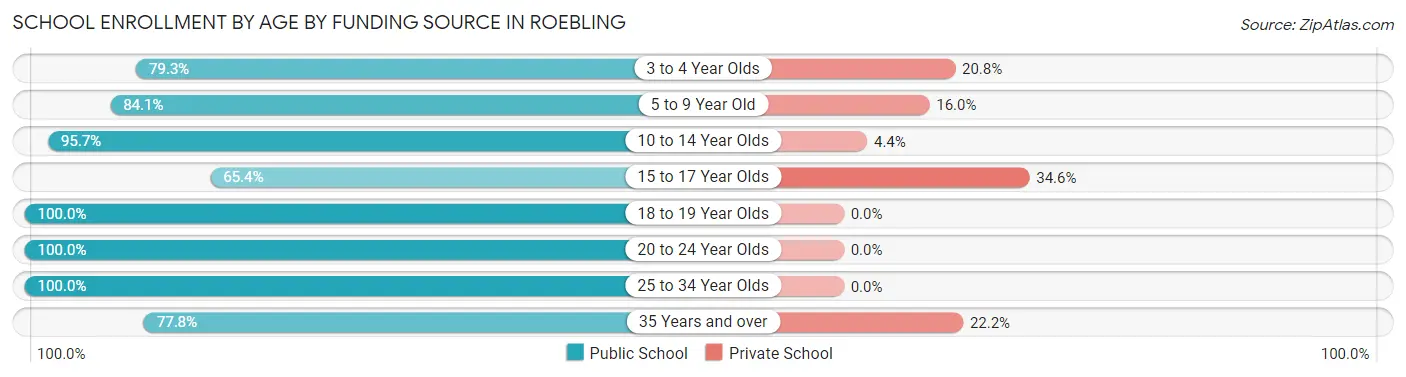
| Age Bracket | Public School | Private School |
| 3 to 4 Year Olds | 42 (79.2%) | 11 (20.7%) |
| 5 to 9 Year Old | 274 (84.1%) | 52 (16.0%) |
| 10 to 14 Year Olds | 264 (95.7%) | 12 (4.3%) |
| 15 to 17 Year Olds | 157 (65.4%) | 83 (34.6%) |
| 18 to 19 Year Olds | 111 (100.0%) | 0 (0.0%) |
| 20 to 24 Year Olds | 238 (100.0%) | 0 (0.0%) |
| 25 to 34 Year Olds | 12 (100.0%) | 0 (0.0%) |
| 35 Years and over | 42 (77.8%) | 12 (22.2%) |
| Total | 1,140 (87.0%) | 170 (13.0%) |
Educational Attainment by Field of Study in Roebling
Business (230 | 28.4%), education (128 | 15.8%), liberal arts & history (69 | 8.5%), bio, nature & agricultural (67 | 8.3%), and computers & mathematics (56 | 6.9%) are the most common fields of study among 810 individuals in Roebling who have obtained a bachelor's degree or higher.
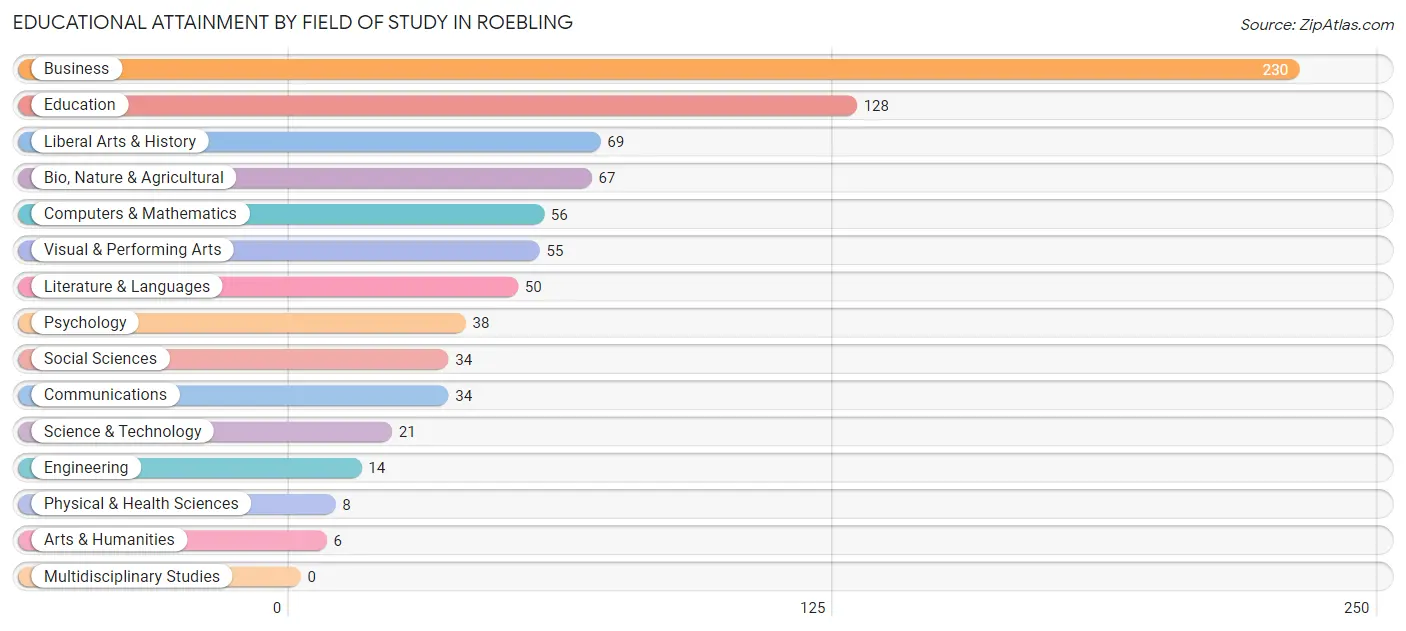
| Field of Study | # Graduates | % Graduates |
| Computers & Mathematics | 56 | 6.9% |
| Bio, Nature & Agricultural | 67 | 8.3% |
| Physical & Health Sciences | 8 | 1.0% |
| Psychology | 38 | 4.7% |
| Social Sciences | 34 | 4.2% |
| Engineering | 14 | 1.7% |
| Multidisciplinary Studies | 0 | 0.0% |
| Science & Technology | 21 | 2.6% |
| Business | 230 | 28.4% |
| Education | 128 | 15.8% |
| Literature & Languages | 50 | 6.2% |
| Liberal Arts & History | 69 | 8.5% |
| Visual & Performing Arts | 55 | 6.8% |
| Communications | 34 | 4.2% |
| Arts & Humanities | 6 | 0.7% |
| Total | 810 | 100.0% |
Transportation & Commute in Roebling
Vehicle Availability by Sex in Roebling
The most prevalent vehicle ownership categories in Roebling are males with 2 vehicles (545, accounting for 48.3%) and females with 2 vehicles (394, making up 50.7%).
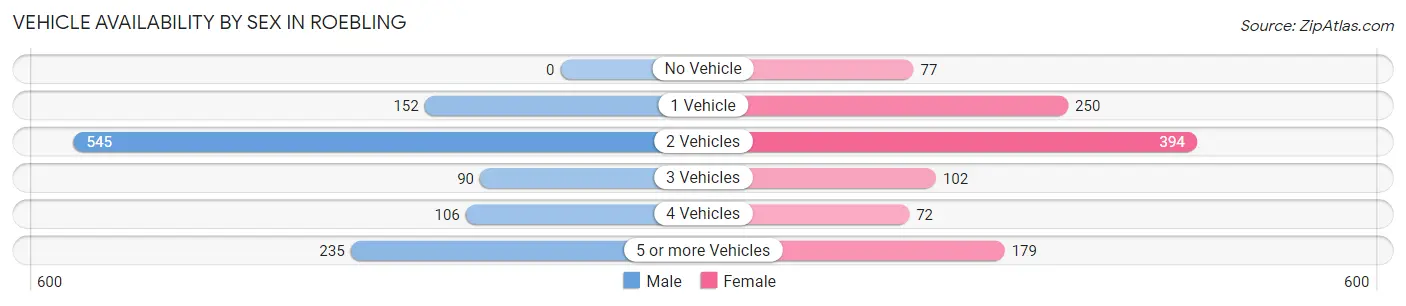
| Vehicles Available | Male | Female |
| No Vehicle | 0 (0.0%) | 77 (7.2%) |
| 1 Vehicle | 152 (13.5%) | 250 (23.3%) |
| 2 Vehicles | 545 (48.3%) | 394 (36.7%) |
| 3 Vehicles | 90 (8.0%) | 102 (9.5%) |
| 4 Vehicles | 106 (9.4%) | 72 (6.7%) |
| 5 or more Vehicles | 235 (20.8%) | 179 (16.7%) |
| Total | 1,128 (100.0%) | 1,074 (100.0%) |
Commute Time in Roebling
The most frequently occuring commute durations in Roebling are 15 to 19 minutes (440 commuters, 22.4%), 30 to 34 minutes (420 commuters, 21.4%), and 20 to 24 minutes (222 commuters, 11.3%).
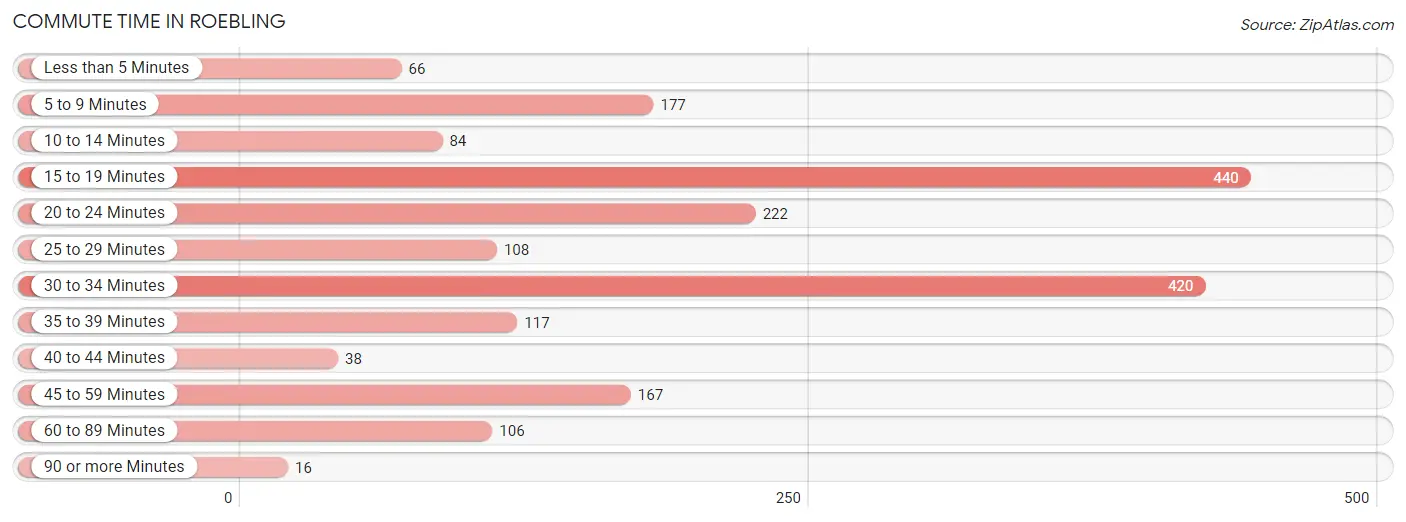
| Commute Time | # Commuters | % Commuters |
| Less than 5 Minutes | 66 | 3.4% |
| 5 to 9 Minutes | 177 | 9.0% |
| 10 to 14 Minutes | 84 | 4.3% |
| 15 to 19 Minutes | 440 | 22.4% |
| 20 to 24 Minutes | 222 | 11.3% |
| 25 to 29 Minutes | 108 | 5.5% |
| 30 to 34 Minutes | 420 | 21.4% |
| 35 to 39 Minutes | 117 | 6.0% |
| 40 to 44 Minutes | 38 | 1.9% |
| 45 to 59 Minutes | 167 | 8.5% |
| 60 to 89 Minutes | 106 | 5.4% |
| 90 or more Minutes | 16 | 0.8% |
Commute Time by Sex in Roebling
The most common commute times in Roebling are 30 to 34 minutes (254 commuters, 25.2%) for males and 15 to 19 minutes (270 commuters, 28.3%) for females.
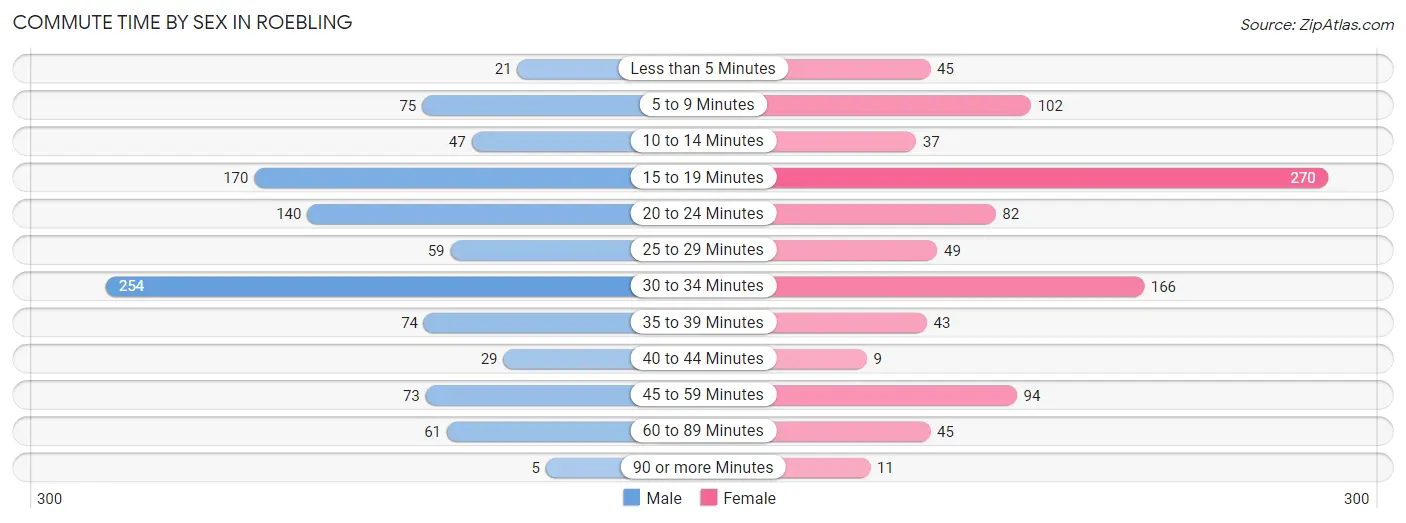
| Commute Time | Male | Female |
| Less than 5 Minutes | 21 (2.1%) | 45 (4.7%) |
| 5 to 9 Minutes | 75 (7.4%) | 102 (10.7%) |
| 10 to 14 Minutes | 47 (4.7%) | 37 (3.9%) |
| 15 to 19 Minutes | 170 (16.9%) | 270 (28.3%) |
| 20 to 24 Minutes | 140 (13.9%) | 82 (8.6%) |
| 25 to 29 Minutes | 59 (5.9%) | 49 (5.1%) |
| 30 to 34 Minutes | 254 (25.2%) | 166 (17.4%) |
| 35 to 39 Minutes | 74 (7.3%) | 43 (4.5%) |
| 40 to 44 Minutes | 29 (2.9%) | 9 (0.9%) |
| 45 to 59 Minutes | 73 (7.2%) | 94 (9.9%) |
| 60 to 89 Minutes | 61 (6.0%) | 45 (4.7%) |
| 90 or more Minutes | 5 (0.5%) | 11 (1.1%) |
Time of Departure to Work by Sex in Roebling
The most frequent times of departure to work in Roebling are 6:00 AM to 6:29 AM (227, 22.5%) for males and 8:00 AM to 8:29 AM (164, 17.2%) for females.
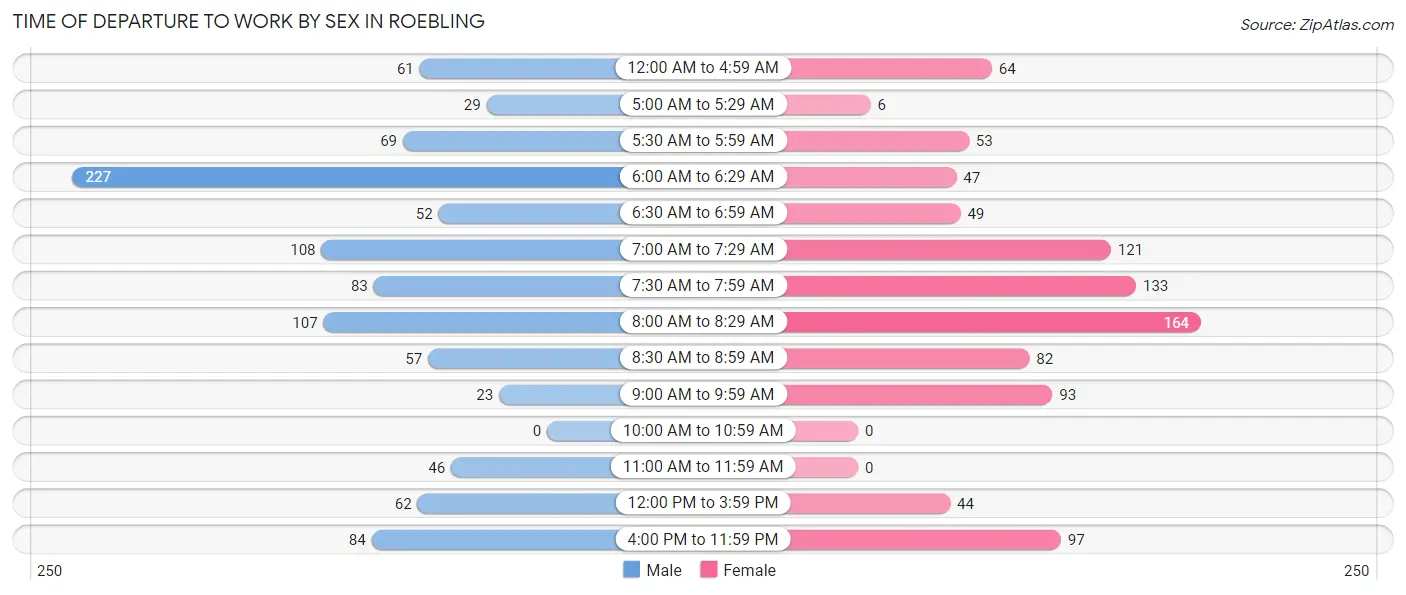
| Time of Departure | Male | Female |
| 12:00 AM to 4:59 AM | 61 (6.0%) | 64 (6.7%) |
| 5:00 AM to 5:29 AM | 29 (2.9%) | 6 (0.6%) |
| 5:30 AM to 5:59 AM | 69 (6.9%) | 53 (5.6%) |
| 6:00 AM to 6:29 AM | 227 (22.5%) | 47 (4.9%) |
| 6:30 AM to 6:59 AM | 52 (5.2%) | 49 (5.1%) |
| 7:00 AM to 7:29 AM | 108 (10.7%) | 121 (12.7%) |
| 7:30 AM to 7:59 AM | 83 (8.2%) | 133 (14.0%) |
| 8:00 AM to 8:29 AM | 107 (10.6%) | 164 (17.2%) |
| 8:30 AM to 8:59 AM | 57 (5.7%) | 82 (8.6%) |
| 9:00 AM to 9:59 AM | 23 (2.3%) | 93 (9.8%) |
| 10:00 AM to 10:59 AM | 0 (0.0%) | 0 (0.0%) |
| 11:00 AM to 11:59 AM | 46 (4.6%) | 0 (0.0%) |
| 12:00 PM to 3:59 PM | 62 (6.1%) | 44 (4.6%) |
| 4:00 PM to 11:59 PM | 84 (8.3%) | 97 (10.2%) |
| Total | 1,008 (100.0%) | 953 (100.0%) |
Housing Occupancy in Roebling
Occupancy by Ownership in Roebling
Of the total 1,529 dwellings in Roebling, owner-occupied units account for 1,331 (87.1%), while renter-occupied units make up 198 (13.0%).
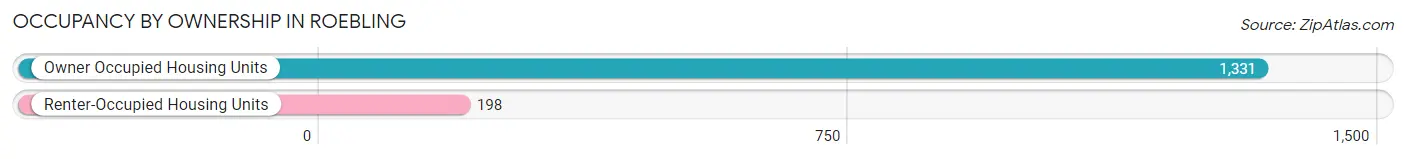
| Occupancy | # Housing Units | % Housing Units |
| Owner Occupied Housing Units | 1,331 | 87.1% |
| Renter-Occupied Housing Units | 198 | 13.0% |
| Total Occupied Housing Units | 1,529 | 100.0% |
Occupancy by Household Size in Roebling
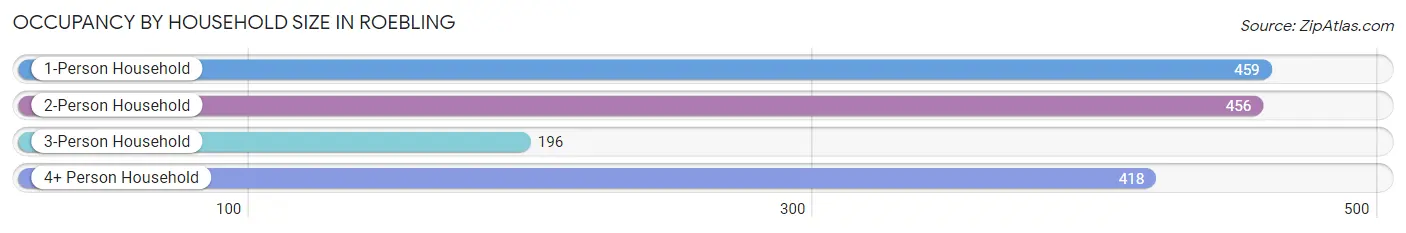
| Household Size | # Housing Units | % Housing Units |
| 1-Person Household | 459 | 30.0% |
| 2-Person Household | 456 | 29.8% |
| 3-Person Household | 196 | 12.8% |
| 4+ Person Household | 418 | 27.3% |
| Total Housing Units | 1,529 | 100.0% |
Occupancy by Ownership by Household Size in Roebling
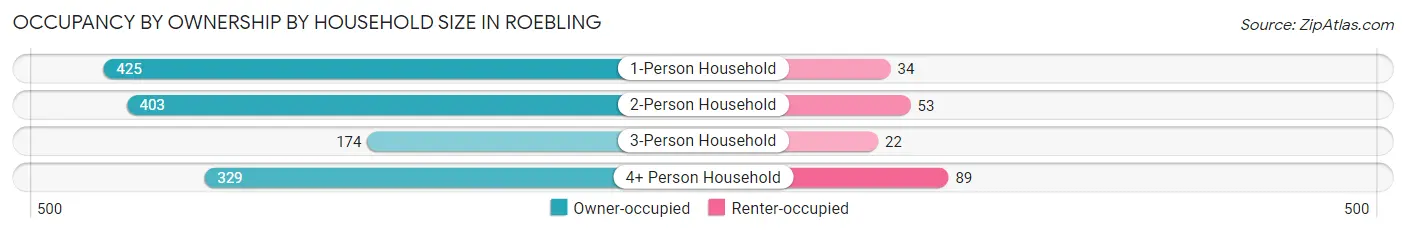
| Household Size | Owner-occupied | Renter-occupied |
| 1-Person Household | 425 (92.6%) | 34 (7.4%) |
| 2-Person Household | 403 (88.4%) | 53 (11.6%) |
| 3-Person Household | 174 (88.8%) | 22 (11.2%) |
| 4+ Person Household | 329 (78.7%) | 89 (21.3%) |
| Total Housing Units | 1,331 (87.1%) | 198 (13.0%) |
Occupancy by Educational Attainment in Roebling
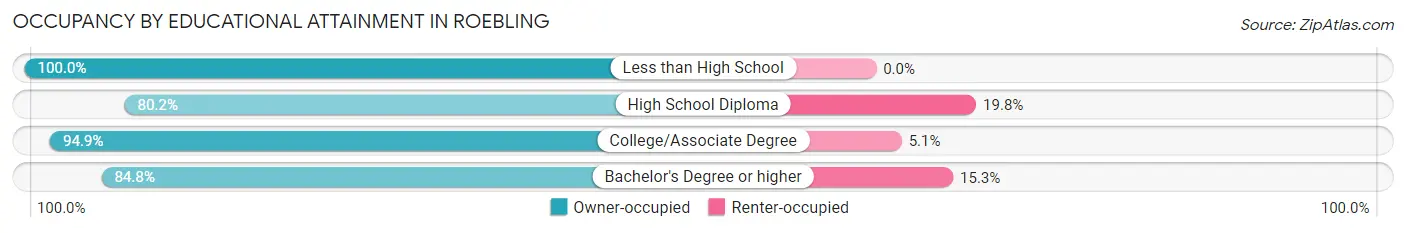
| Household Size | Owner-occupied | Renter-occupied |
| Less than High School | 40 (100.0%) | 0 (0.0%) |
| High School Diploma | 445 (80.2%) | 110 (19.8%) |
| College/Associate Degree | 507 (94.9%) | 27 (5.1%) |
| Bachelor's Degree or higher | 339 (84.8%) | 61 (15.2%) |
Occupancy by Age of Householder in Roebling
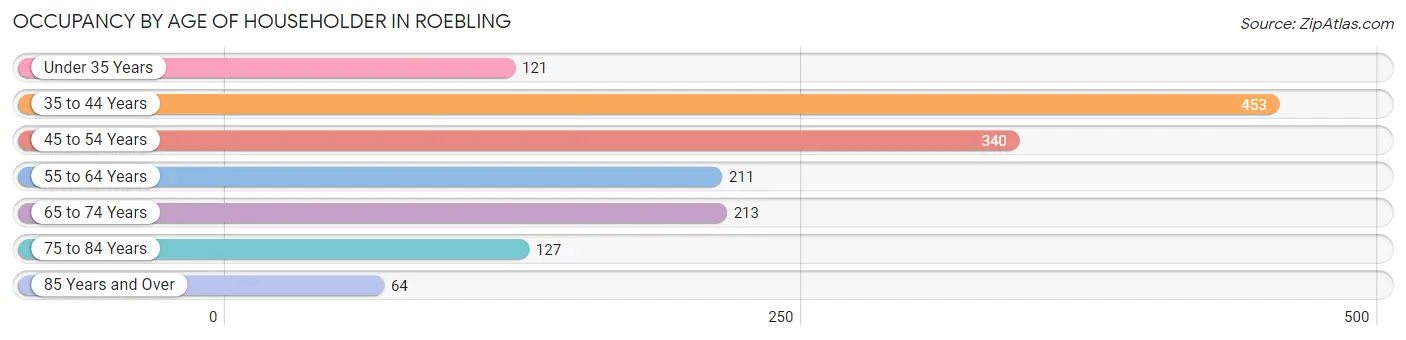
| Age Bracket | # Households | % Households |
| Under 35 Years | 121 | 7.9% |
| 35 to 44 Years | 453 | 29.6% |
| 45 to 54 Years | 340 | 22.2% |
| 55 to 64 Years | 211 | 13.8% |
| 65 to 74 Years | 213 | 13.9% |
| 75 to 84 Years | 127 | 8.3% |
| 85 Years and Over | 64 | 4.2% |
| Total | 1,529 | 100.0% |
Housing Finances in Roebling
Median Income by Occupancy in Roebling
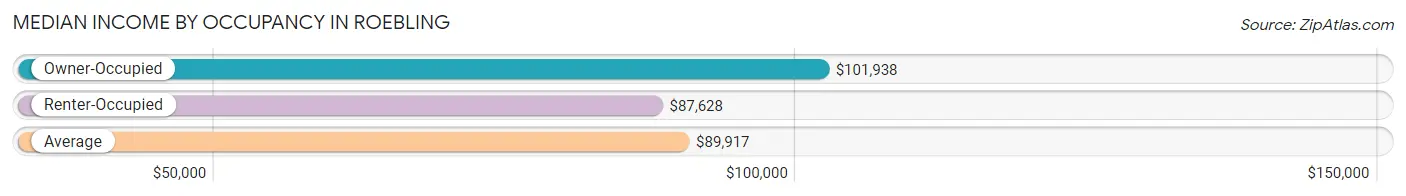
| Occupancy Type | # Households | Median Income |
| Owner-Occupied | 1,331 (87.1%) | $101,938 |
| Renter-Occupied | 198 (13.0%) | $87,628 |
| Average | 1,529 (100.0%) | $89,917 |
Occupancy by Householder Income Bracket in Roebling
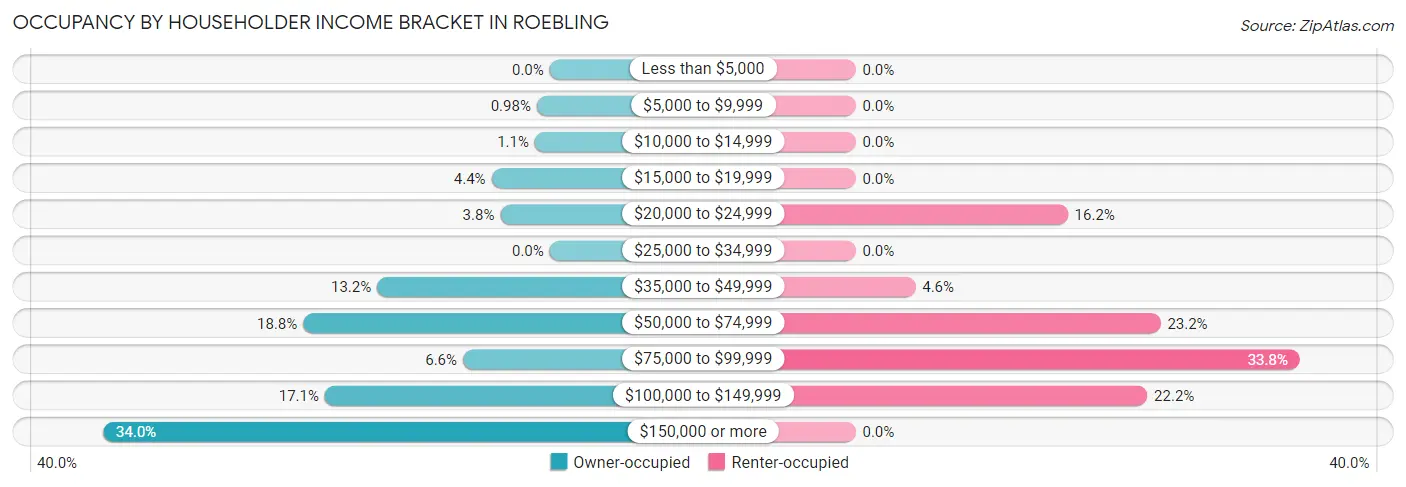
| Income Bracket | Owner-occupied | Renter-occupied |
| Less than $5,000 | 0 (0.0%) | 0 (0.0%) |
| $5,000 to $9,999 | 13 (1.0%) | 0 (0.0%) |
| $10,000 to $14,999 | 15 (1.1%) | 0 (0.0%) |
| $15,000 to $19,999 | 59 (4.4%) | 0 (0.0%) |
| $20,000 to $24,999 | 50 (3.8%) | 32 (16.2%) |
| $25,000 to $34,999 | 0 (0.0%) | 0 (0.0%) |
| $35,000 to $49,999 | 175 (13.2%) | 9 (4.5%) |
| $50,000 to $74,999 | 250 (18.8%) | 46 (23.2%) |
| $75,000 to $99,999 | 88 (6.6%) | 67 (33.8%) |
| $100,000 to $149,999 | 228 (17.1%) | 44 (22.2%) |
| $150,000 or more | 453 (34.0%) | 0 (0.0%) |
| Total | 1,331 (100.0%) | 198 (100.0%) |
Monthly Housing Cost Tiers in Roebling
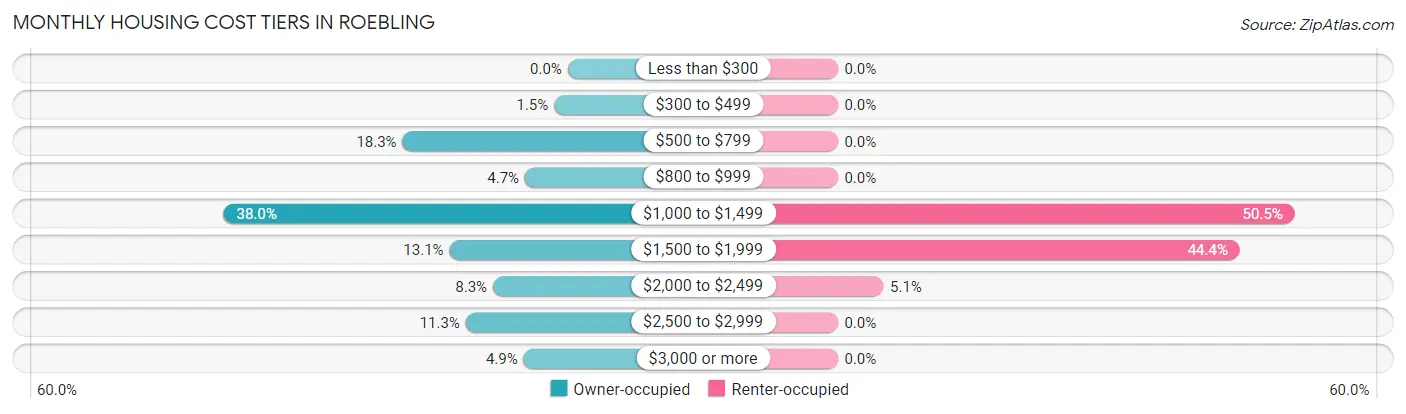
| Monthly Cost | Owner-occupied | Renter-occupied |
| Less than $300 | 0 (0.0%) | 0 (0.0%) |
| $300 to $499 | 20 (1.5%) | 0 (0.0%) |
| $500 to $799 | 243 (18.3%) | 0 (0.0%) |
| $800 to $999 | 63 (4.7%) | 0 (0.0%) |
| $1,000 to $1,499 | 506 (38.0%) | 100 (50.5%) |
| $1,500 to $1,999 | 174 (13.1%) | 88 (44.4%) |
| $2,000 to $2,499 | 110 (8.3%) | 10 (5.1%) |
| $2,500 to $2,999 | 150 (11.3%) | 0 (0.0%) |
| $3,000 or more | 65 (4.9%) | 0 (0.0%) |
| Total | 1,331 (100.0%) | 198 (100.0%) |
Physical Housing Characteristics in Roebling
Housing Structures in Roebling
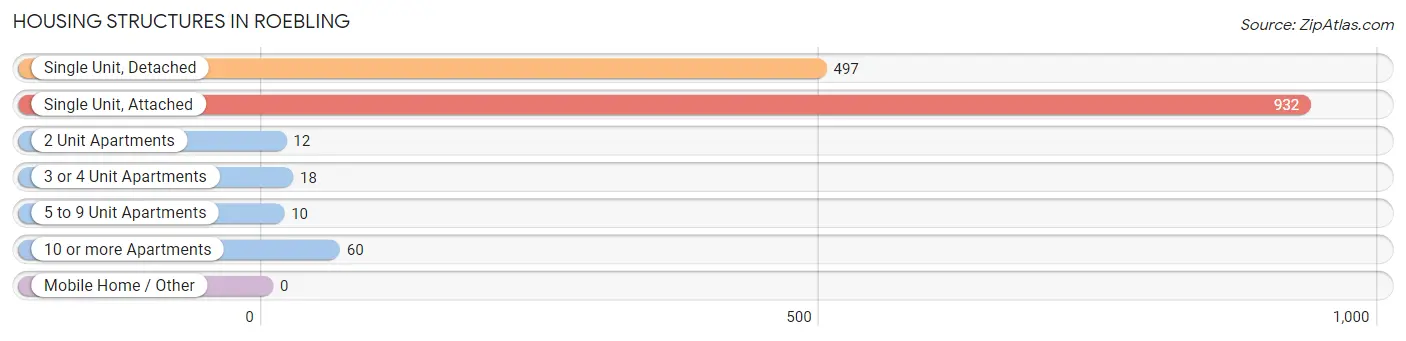
| Structure Type | # Housing Units | % Housing Units |
| Single Unit, Detached | 497 | 32.5% |
| Single Unit, Attached | 932 | 61.0% |
| 2 Unit Apartments | 12 | 0.8% |
| 3 or 4 Unit Apartments | 18 | 1.2% |
| 5 to 9 Unit Apartments | 10 | 0.6% |
| 10 or more Apartments | 60 | 3.9% |
| Mobile Home / Other | 0 | 0.0% |
| Total | 1,529 | 100.0% |
Housing Structures by Occupancy in Roebling
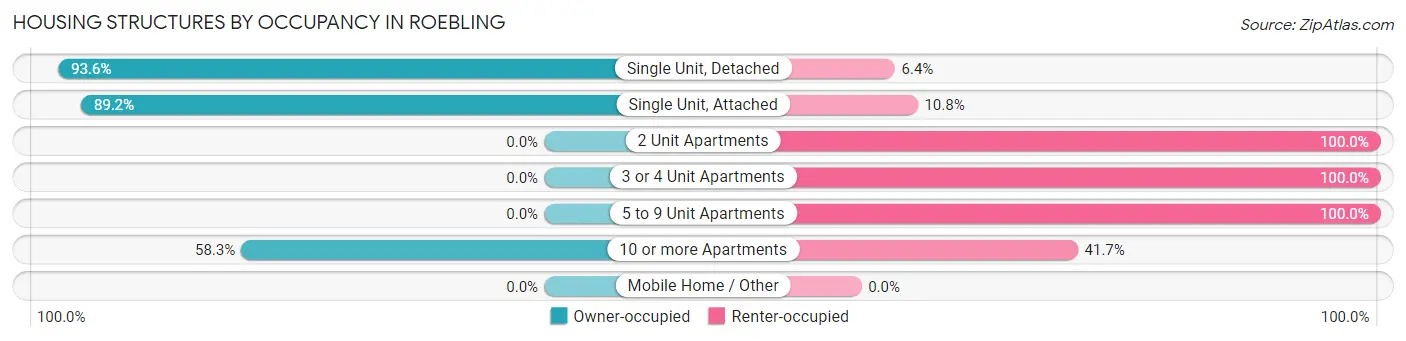
| Structure Type | Owner-occupied | Renter-occupied |
| Single Unit, Detached | 465 (93.6%) | 32 (6.4%) |
| Single Unit, Attached | 831 (89.2%) | 101 (10.8%) |
| 2 Unit Apartments | 0 (0.0%) | 12 (100.0%) |
| 3 or 4 Unit Apartments | 0 (0.0%) | 18 (100.0%) |
| 5 to 9 Unit Apartments | 0 (0.0%) | 10 (100.0%) |
| 10 or more Apartments | 35 (58.3%) | 25 (41.7%) |
| Mobile Home / Other | 0 (0.0%) | 0 (0.0%) |
| Total | 1,331 (87.1%) | 198 (13.0%) |
Housing Structures by Number of Rooms in Roebling
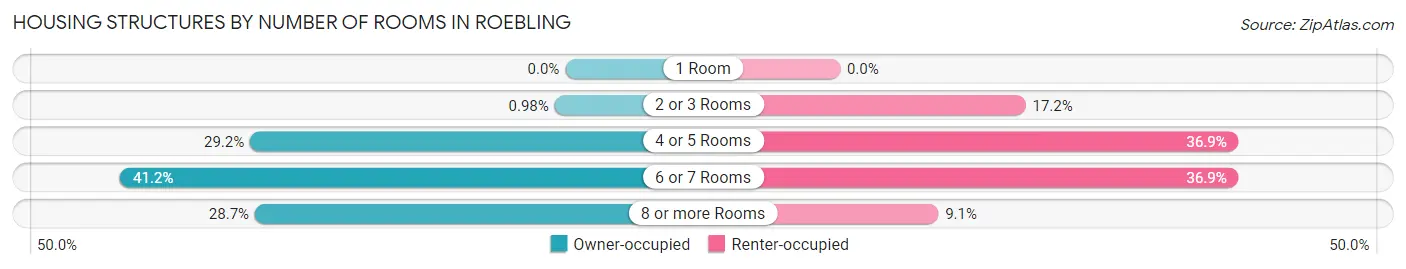
| Number of Rooms | Owner-occupied | Renter-occupied |
| 1 Room | 0 (0.0%) | 0 (0.0%) |
| 2 or 3 Rooms | 13 (1.0%) | 34 (17.2%) |
| 4 or 5 Rooms | 388 (29.1%) | 73 (36.9%) |
| 6 or 7 Rooms | 548 (41.2%) | 73 (36.9%) |
| 8 or more Rooms | 382 (28.7%) | 18 (9.1%) |
| Total | 1,331 (100.0%) | 198 (100.0%) |
Housing Structure by Heating Type in Roebling
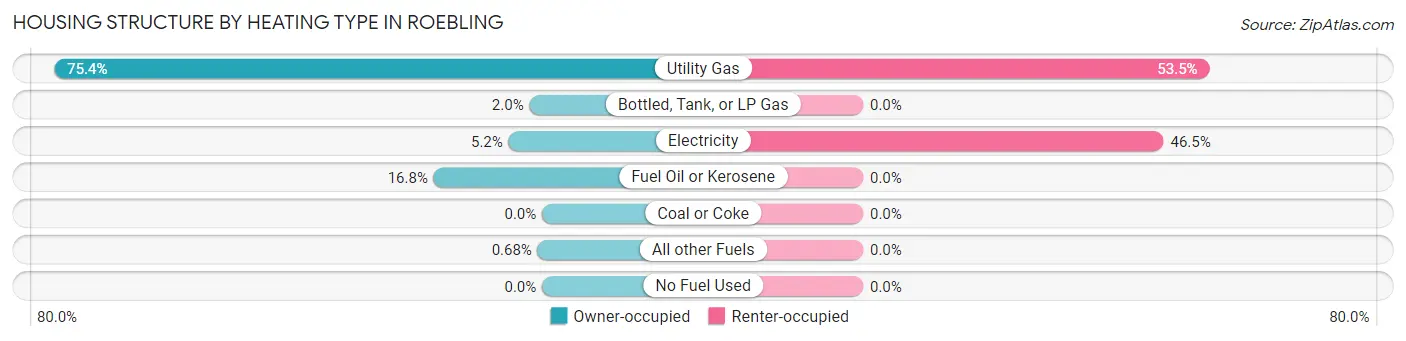
| Heating Type | Owner-occupied | Renter-occupied |
| Utility Gas | 1,004 (75.4%) | 106 (53.5%) |
| Bottled, Tank, or LP Gas | 26 (1.9%) | 0 (0.0%) |
| Electricity | 69 (5.2%) | 92 (46.5%) |
| Fuel Oil or Kerosene | 223 (16.8%) | 0 (0.0%) |
| Coal or Coke | 0 (0.0%) | 0 (0.0%) |
| All other Fuels | 9 (0.7%) | 0 (0.0%) |
| No Fuel Used | 0 (0.0%) | 0 (0.0%) |
| Total | 1,331 (100.0%) | 198 (100.0%) |
Household Vehicle Usage in Roebling
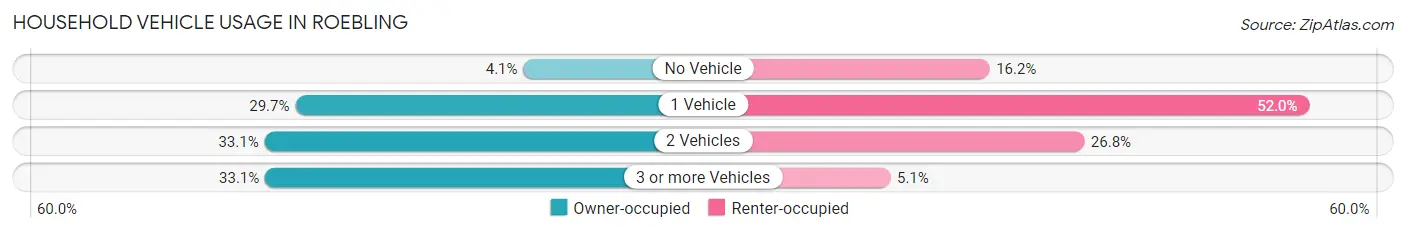
| Vehicles per Household | Owner-occupied | Renter-occupied |
| No Vehicle | 55 (4.1%) | 32 (16.2%) |
| 1 Vehicle | 395 (29.7%) | 103 (52.0%) |
| 2 Vehicles | 441 (33.1%) | 53 (26.8%) |
| 3 or more Vehicles | 440 (33.1%) | 10 (5.1%) |
| Total | 1,331 (100.0%) | 198 (100.0%) |
Real Estate & Mortgages in Roebling
Real Estate and Mortgage Overview in Roebling
| Characteristic | Without Mortgage | With Mortgage |
| Housing Units | 369 | 962 |
| Median Property Value | $181,400 | $191,700 |
| Median Household Income | $50,607 | $440 |
| Monthly Housing Costs | $724 | $65 |
| Real Estate Taxes | $4,149 | $12 |
Property Value by Mortgage Status in Roebling
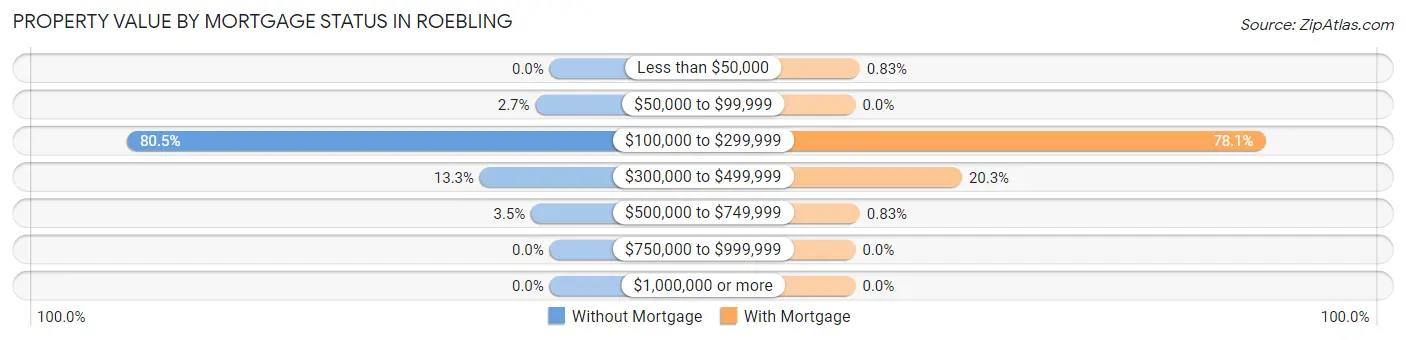
| Property Value | Without Mortgage | With Mortgage |
| Less than $50,000 | 0 (0.0%) | 8 (0.8%) |
| $50,000 to $99,999 | 10 (2.7%) | 0 (0.0%) |
| $100,000 to $299,999 | 297 (80.5%) | 751 (78.1%) |
| $300,000 to $499,999 | 49 (13.3%) | 195 (20.3%) |
| $500,000 to $749,999 | 13 (3.5%) | 8 (0.8%) |
| $750,000 to $999,999 | 0 (0.0%) | 0 (0.0%) |
| $1,000,000 or more | 0 (0.0%) | 0 (0.0%) |
| Total | 369 (100.0%) | 962 (100.0%) |
Household Income by Mortgage Status in Roebling
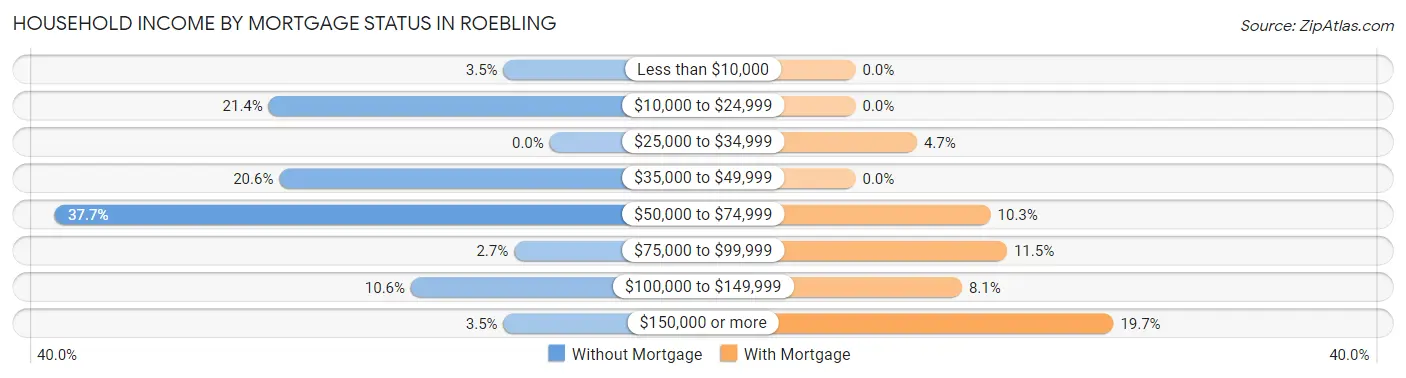
| Household Income | Without Mortgage | With Mortgage |
| Less than $10,000 | 13 (3.5%) | 0 (0.0%) |
| $10,000 to $24,999 | 79 (21.4%) | 0 (0.0%) |
| $25,000 to $34,999 | 0 (0.0%) | 45 (4.7%) |
| $35,000 to $49,999 | 76 (20.6%) | 0 (0.0%) |
| $50,000 to $74,999 | 139 (37.7%) | 99 (10.3%) |
| $75,000 to $99,999 | 10 (2.7%) | 111 (11.5%) |
| $100,000 to $149,999 | 39 (10.6%) | 78 (8.1%) |
| $150,000 or more | 13 (3.5%) | 189 (19.7%) |
| Total | 369 (100.0%) | 962 (100.0%) |
Property Value to Household Income Ratio in Roebling
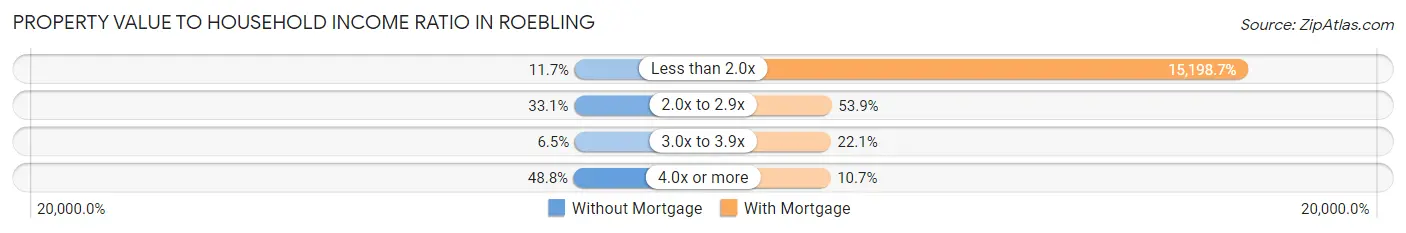
| Value-to-Income Ratio | Without Mortgage | With Mortgage |
| Less than 2.0x | 43 (11.7%) | 146,211 (15,198.7%) |
| 2.0x to 2.9x | 122 (33.1%) | 518 (53.8%) |
| 3.0x to 3.9x | 24 (6.5%) | 213 (22.1%) |
| 4.0x or more | 180 (48.8%) | 103 (10.7%) |
| Total | 369 (100.0%) | 962 (100.0%) |
Real Estate Taxes by Mortgage Status in Roebling
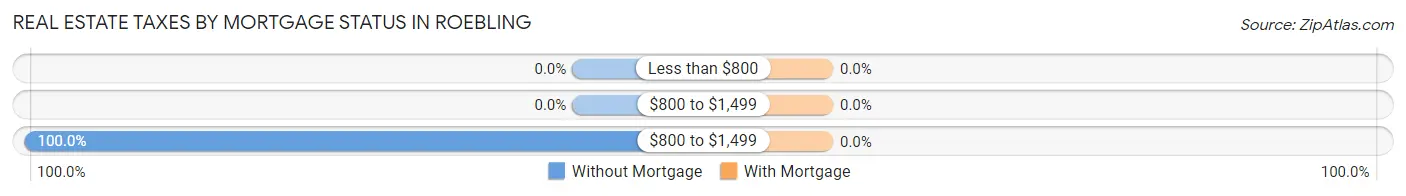
| Property Taxes | Without Mortgage | With Mortgage |
| Less than $800 | 0 (0.0%) | 0 (0.0%) |
| $800 to $1,499 | 0 (0.0%) | 0 (0.0%) |
| $800 to $1,499 | 369 (100.0%) | 0 (0.0%) |
| Total | 369 (100.0%) | 962 (100.0%) |
Health & Disability in Roebling
Health Insurance Coverage by Age in Roebling
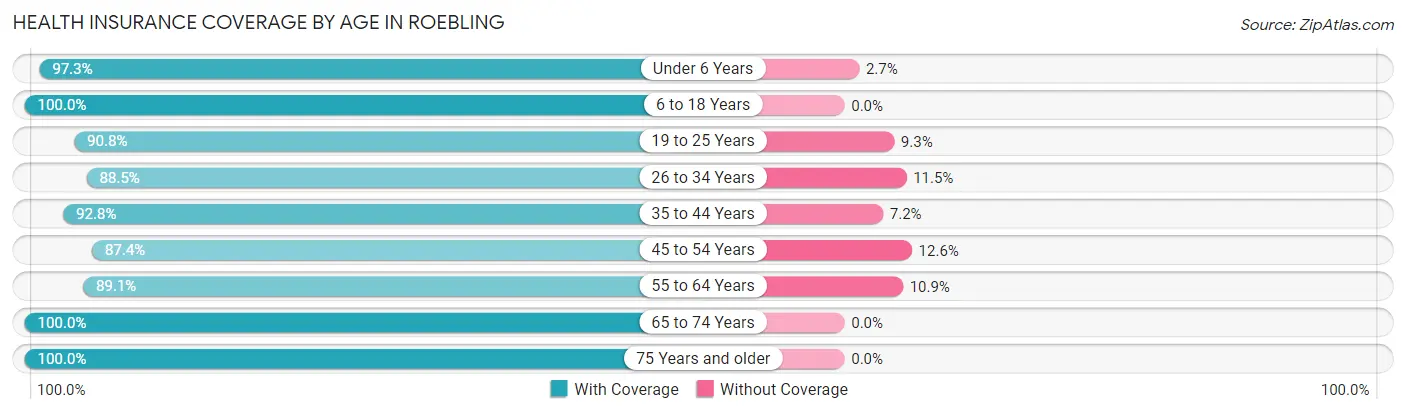
| Age Bracket | With Coverage | Without Coverage |
| Under 6 Years | 284 (97.3%) | 8 (2.7%) |
| 6 to 18 Years | 783 (100.0%) | 0 (0.0%) |
| 19 to 25 Years | 422 (90.7%) | 43 (9.2%) |
| 26 to 34 Years | 322 (88.5%) | 42 (11.5%) |
| 35 to 44 Years | 581 (92.8%) | 45 (7.2%) |
| 45 to 54 Years | 557 (87.4%) | 80 (12.6%) |
| 55 to 64 Years | 360 (89.1%) | 44 (10.9%) |
| 65 to 74 Years | 336 (100.0%) | 0 (0.0%) |
| 75 Years and older | 227 (100.0%) | 0 (0.0%) |
| Total | 3,872 (93.7%) | 262 (6.3%) |
Health Insurance Coverage by Citizenship Status in Roebling
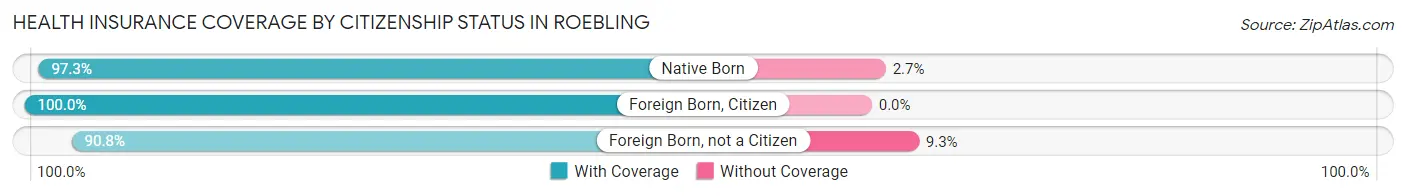
| Citizenship Status | With Coverage | Without Coverage |
| Native Born | 284 (97.3%) | 8 (2.7%) |
| Foreign Born, Citizen | 783 (100.0%) | 0 (0.0%) |
| Foreign Born, not a Citizen | 422 (90.7%) | 43 (9.2%) |
Health Insurance Coverage by Household Income in Roebling
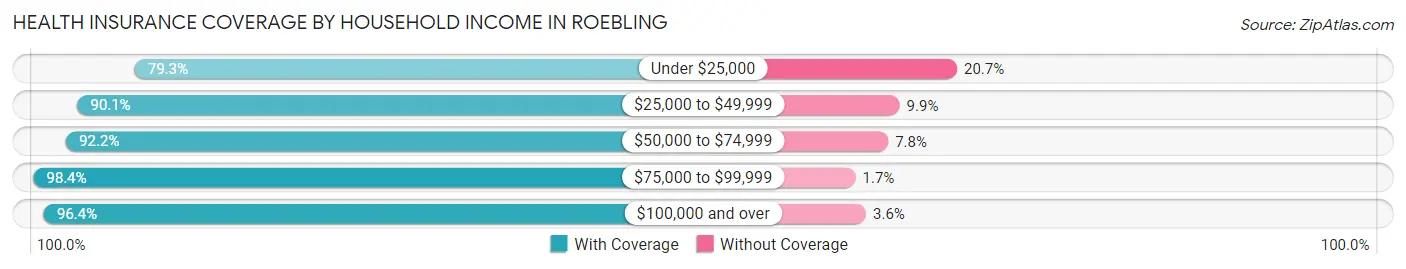
| Household Income | With Coverage | Without Coverage |
| Under $25,000 | 288 (79.3%) | 75 (20.7%) |
| $25,000 to $49,999 | 464 (90.1%) | 51 (9.9%) |
| $50,000 to $74,999 | 678 (92.2%) | 57 (7.8%) |
| $75,000 to $99,999 | 597 (98.4%) | 10 (1.7%) |
| $100,000 and over | 1,840 (96.4%) | 69 (3.6%) |
Public vs Private Health Insurance Coverage by Age in Roebling
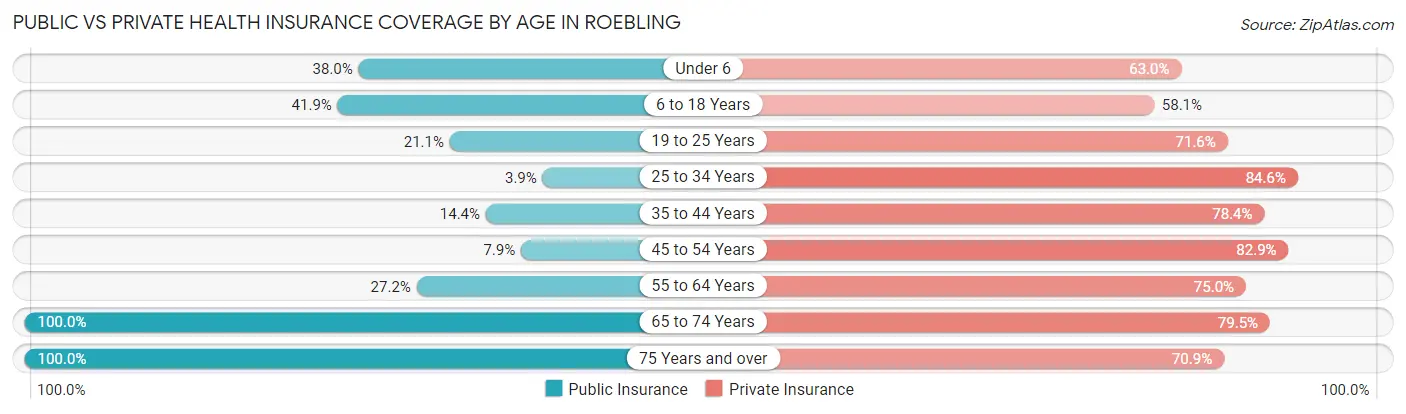
| Age Bracket | Public Insurance | Private Insurance |
| Under 6 | 111 (38.0%) | 184 (63.0%) |
| 6 to 18 Years | 328 (41.9%) | 455 (58.1%) |
| 19 to 25 Years | 98 (21.1%) | 333 (71.6%) |
| 25 to 34 Years | 14 (3.8%) | 308 (84.6%) |
| 35 to 44 Years | 90 (14.4%) | 491 (78.4%) |
| 45 to 54 Years | 50 (7.9%) | 528 (82.9%) |
| 55 to 64 Years | 110 (27.2%) | 303 (75.0%) |
| 65 to 74 Years | 336 (100.0%) | 267 (79.5%) |
| 75 Years and over | 227 (100.0%) | 161 (70.9%) |
| Total | 1,364 (33.0%) | 3,030 (73.3%) |
Disability Status by Sex by Age in Roebling
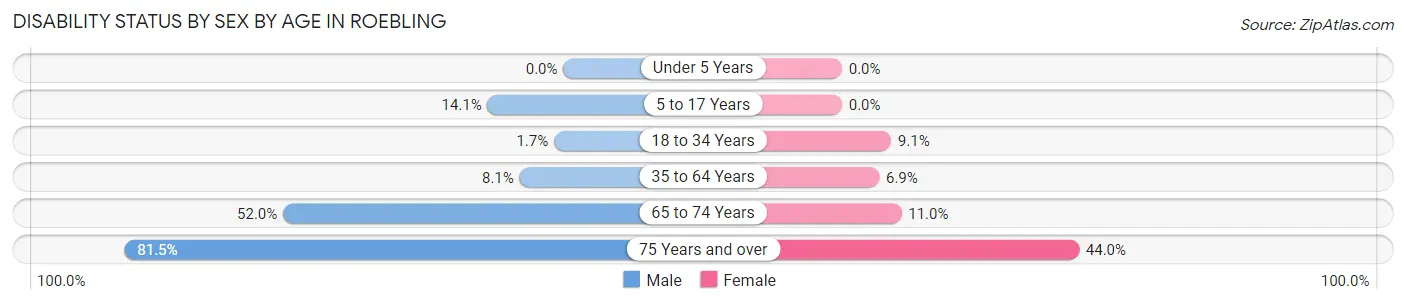
| Age Bracket | Male | Female |
| Under 5 Years | 0 (0.0%) | 0 (0.0%) |
| 5 to 17 Years | 72 (14.1%) | 0 (0.0%) |
| 18 to 34 Years | 9 (1.7%) | 28 (9.1%) |
| 35 to 64 Years | 66 (8.1%) | 59 (6.9%) |
| 65 to 74 Years | 90 (52.0%) | 18 (11.0%) |
| 75 Years and over | 22 (81.5%) | 88 (44.0%) |
Disability Class by Sex by Age in Roebling
Disability Class: Hearing Difficulty
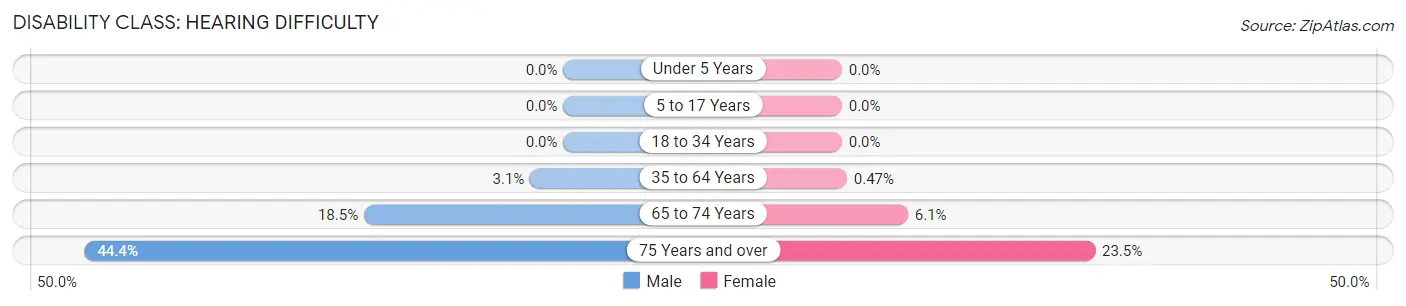
| Age Bracket | Male | Female |
| Under 5 Years | 0 (0.0%) | 0 (0.0%) |
| 5 to 17 Years | 0 (0.0%) | 0 (0.0%) |
| 18 to 34 Years | 0 (0.0%) | 0 (0.0%) |
| 35 to 64 Years | 25 (3.1%) | 4 (0.5%) |
| 65 to 74 Years | 32 (18.5%) | 10 (6.1%) |
| 75 Years and over | 12 (44.4%) | 47 (23.5%) |
Disability Class: Vision Difficulty
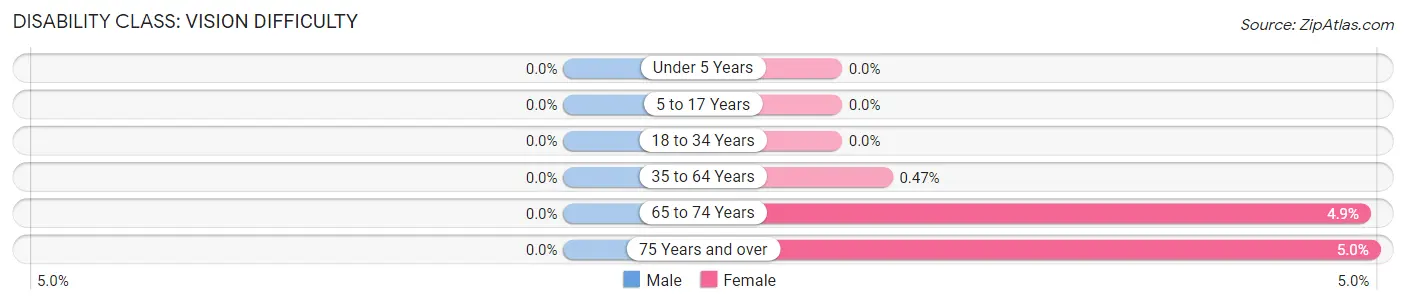
| Age Bracket | Male | Female |
| Under 5 Years | 0 (0.0%) | 0 (0.0%) |
| 5 to 17 Years | 0 (0.0%) | 0 (0.0%) |
| 18 to 34 Years | 0 (0.0%) | 0 (0.0%) |
| 35 to 64 Years | 0 (0.0%) | 4 (0.5%) |
| 65 to 74 Years | 0 (0.0%) | 8 (4.9%) |
| 75 Years and over | 0 (0.0%) | 10 (5.0%) |
Disability Class: Cognitive Difficulty
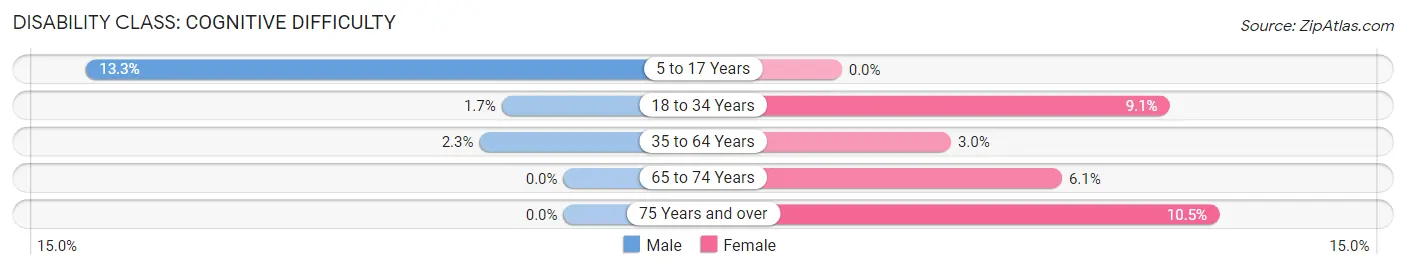
| Age Bracket | Male | Female |
| 5 to 17 Years | 68 (13.3%) | 0 (0.0%) |
| 18 to 34 Years | 9 (1.7%) | 28 (9.1%) |
| 35 to 64 Years | 19 (2.3%) | 26 (3.0%) |
| 65 to 74 Years | 0 (0.0%) | 10 (6.1%) |
| 75 Years and over | 0 (0.0%) | 21 (10.5%) |
Disability Class: Ambulatory Difficulty
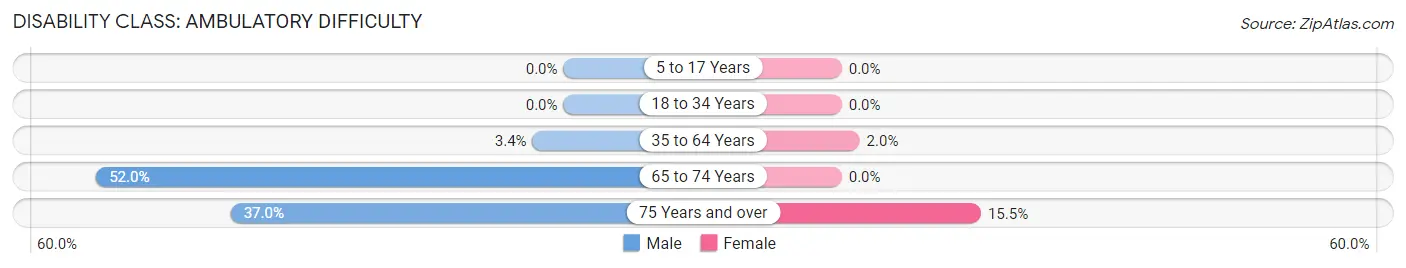
| Age Bracket | Male | Female |
| 5 to 17 Years | 0 (0.0%) | 0 (0.0%) |
| 18 to 34 Years | 0 (0.0%) | 0 (0.0%) |
| 35 to 64 Years | 28 (3.4%) | 17 (2.0%) |
| 65 to 74 Years | 90 (52.0%) | 0 (0.0%) |
| 75 Years and over | 10 (37.0%) | 31 (15.5%) |
Disability Class: Self-Care Difficulty
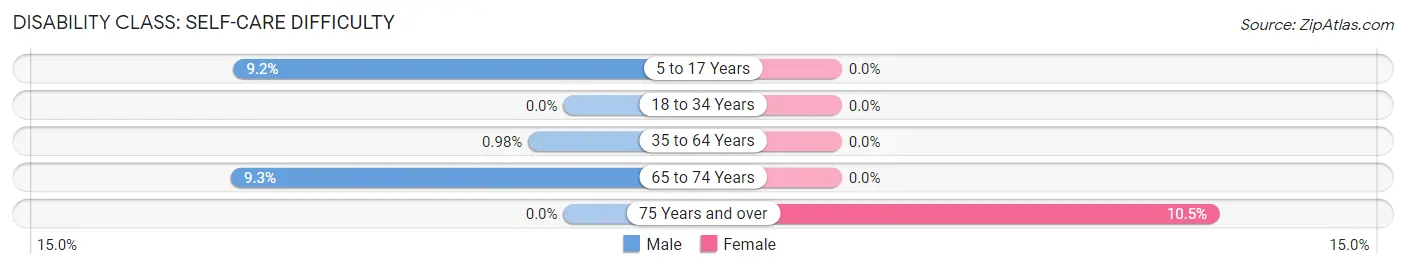
| Age Bracket | Male | Female |
| 5 to 17 Years | 47 (9.2%) | 0 (0.0%) |
| 18 to 34 Years | 0 (0.0%) | 0 (0.0%) |
| 35 to 64 Years | 8 (1.0%) | 0 (0.0%) |
| 65 to 74 Years | 16 (9.2%) | 0 (0.0%) |
| 75 Years and over | 0 (0.0%) | 21 (10.5%) |
Technology Access in Roebling
Computing Device Access in Roebling
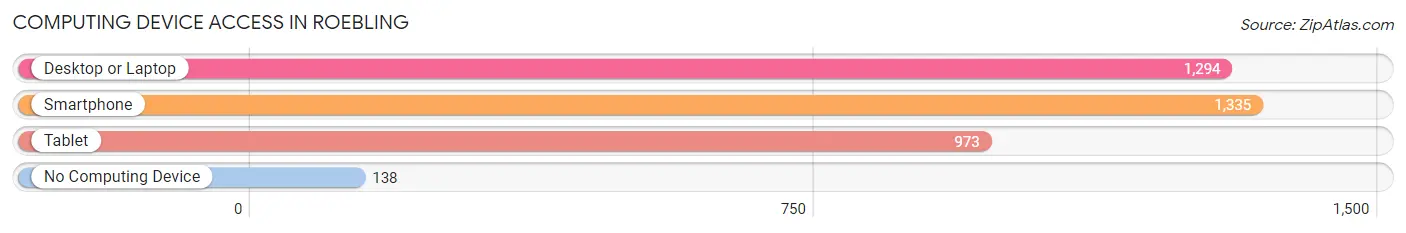
| Device Type | # Households | % Households |
| Desktop or Laptop | 1,294 | 84.6% |
| Smartphone | 1,335 | 87.3% |
| Tablet | 973 | 63.6% |
| No Computing Device | 138 | 9.0% |
| Total | 1,529 | 100.0% |
Internet Access in Roebling
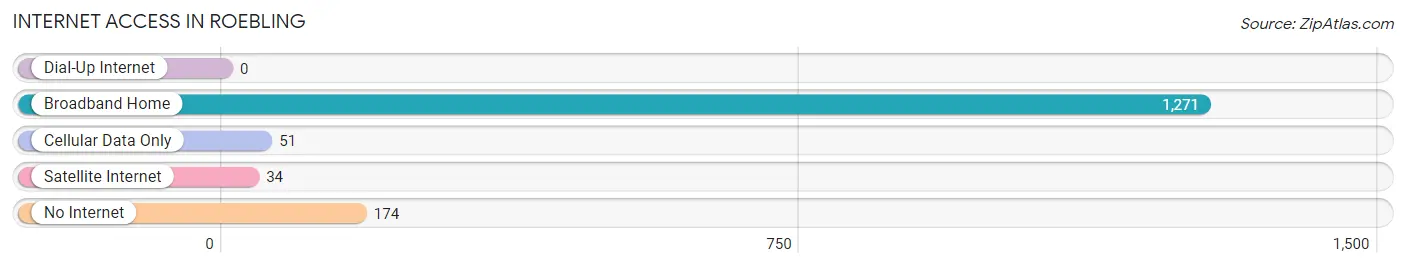
| Internet Type | # Households | % Households |
| Dial-Up Internet | 0 | 0.0% |
| Broadband Home | 1,271 | 83.1% |
| Cellular Data Only | 51 | 3.3% |
| Satellite Internet | 34 | 2.2% |
| No Internet | 174 | 11.4% |
| Total | 1,529 | 100.0% |
Roebling Summary
Roebling, NJ is a small borough located in Burlington County, New Jersey. It is situated on the Delaware River, just north of Trenton, and is part of the larger Trenton-Ewing metropolitan area. The borough was named after John A. Roebling, the engineer who designed the Brooklyn Bridge. Roebling is a small, quiet community with a population of just over 2,000 people.
Geography
Roebling is located in the Delaware Valley, a region of the United States that is known for its rich history and culture. The borough is situated on the Delaware River, just north of Trenton, and is part of the larger Trenton-Ewing metropolitan area. Roebling is bordered by Florence Township to the north, Burlington Township to the east, and the Delaware River to the south and west. The borough covers an area of 1.2 square miles, all of which is land.
The terrain of Roebling is mostly flat, with some rolling hills in the northern part of the borough. The climate is humid subtropical, with hot, humid summers and cold, wet winters. The average annual temperature is around 54°F, and the average annual precipitation is around 44 inches.
Economy
The economy of Roebling is largely based on manufacturing and services. The borough is home to several large manufacturing companies, including Roebling Steel, which produces steel wire and cable products. Other major employers in the area include the Roebling Museum, the Roebling Library, and the Roebling Historical Society.
The borough also has a thriving retail sector, with several small businesses located in the downtown area. These businesses include restaurants, cafes, boutiques, and specialty shops.
Demographics
As of the 2010 census, the population of Roebling was 2,072. The racial makeup of the borough was 94.3% White, 2.2% African American, 0.3% Native American, 0.7% Asian, 0.1% Pacific Islander, and 2.4% from other races. Hispanic or Latino of any race were 4.2% of the population.
The median household income in Roebling was $50,972, and the median family income was $60,972. The per capita income was $25,972. About 8.3% of families and 10.2% of the population were below the poverty line, including 14.2% of those under age 18 and 6.2% of those age 65 or over.
Roebling is a small, quiet community with a rich history and culture. The borough is home to several large manufacturing companies, as well as a thriving retail sector. The population is diverse, with a mix of races and ethnicities. Roebling is a great place to live, work, and raise a family.
Common Questions
What is Per Capita Income in Roebling?
Per Capita income in Roebling is $43,294.
What is the Median Family Income in Roebling?
Median Family Income in Roebling is $108,333.
What is the Median Household income in Roebling?
Median Household Income in Roebling is $89,917.
What is Income or Wage Gap in Roebling?
Income or Wage Gap in Roebling is 46.8%.
Women in Roebling earn 53.2 cents for every dollar earned by a man.
What is Family Income Deficit in Roebling?
Family Income Deficit in Roebling is $6,817.
Families that are below poverty line in Roebling earn $6,817 less on average than the poverty threshold level.
What is Inequality or Gini Index in Roebling?
Inequality or Gini Index in Roebling is 0.39.
What is the Total Population of Roebling?
Total Population of Roebling is 4,146.
What is the Total Male Population of Roebling?
Total Male Population of Roebling is 2,128.
What is the Total Female Population of Roebling?
Total Female Population of Roebling is 2,018.
What is the Ratio of Males per 100 Females in Roebling?
There are 105.45 Males per 100 Females in Roebling.
What is the Ratio of Females per 100 Males in Roebling?
There are 94.83 Females per 100 Males in Roebling.
What is the Median Population Age in Roebling?
Median Population Age in Roebling is 38.4 Years.
What is the Average Family Size in Roebling
Average Family Size in Roebling is 3.5 People.
What is the Average Household Size in Roebling
Average Household Size in Roebling is 2.7 People.
How Large is the Labor Force in Roebling?
There are 2,331 People in the Labor Forcein in Roebling.
What is the Percentage of People in the Labor Force in Roebling?
72.1% of People are in the Labor Force in Roebling.
What is the Unemployment Rate in Roebling?
Unemployment Rate in Roebling is 3.5%.