Troy, MI Map & Demographics
Troy Map
Troy Overview
$54,762
PER CAPITA INCOME
$142,644
AVG FAMILY INCOME
$115,639
AVG HOUSEHOLD INCOME
41.3%
WAGE / INCOME GAP [ % ]
58.7¢/ $1
WAGE / INCOME GAP [ $ ]
$11,787
FAMILY INCOME DEFICIT
0.42
INEQUALITY / GINI INDEX
87,170
TOTAL POPULATION
44,942
MALE POPULATION
42,228
FEMALE POPULATION
106.43
MALES / 100 FEMALES
93.96
FEMALES / 100 MALES
42.1
MEDIAN AGE
3.2
AVG FAMILY SIZE
2.6
AVG HOUSEHOLD SIZE
46,138
LABOR FORCE [ PEOPLE ]
64.5%
PERCENT IN LABOR FORCE
3.9%
UNEMPLOYMENT RATE
Troy Area Codes
Income in Troy
Income Overview in Troy
Per Capita Income in Troy is $54,762, while median incomes of families and households are $142,644 and $115,639 respectively.
| Characteristic | Number | Measure |
| Per Capita Income | 87,170 | $54,762 |
| Median Family Income | 23,441 | $142,644 |
| Mean Family Income | 23,441 | $167,702 |
| Median Household Income | 33,000 | $115,639 |
| Mean Household Income | 33,000 | $142,474 |
| Income Deficit | 23,441 | $11,787 |
| Wage / Income Gap (%) | 87,170 | 41.32% |
| Wage / Income Gap ($) | 87,170 | 58.68¢ per $1 |
| Gini / Inequality Index | 87,170 | 0.42 |
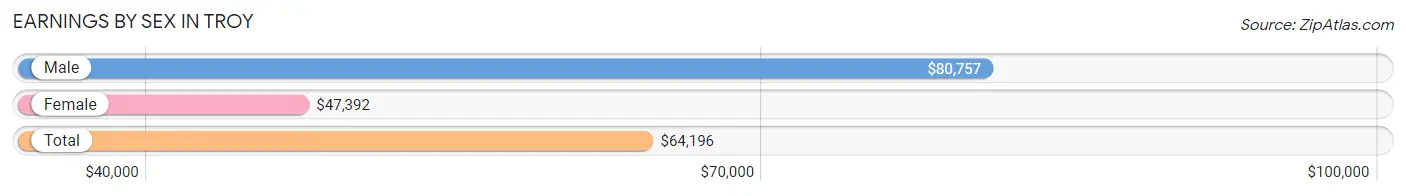
Earnings by Sex in Troy
Average Earnings in Troy are $64,196, $80,757 for men and $47,392 for women, a difference of 41.3%.
| Sex | Number | Average Earnings |
| Male | 27,207 (56.2%) | $80,757 |
| Female | 21,168 (43.8%) | $47,392 |
| Total | 48,375 (100.0%) | $64,196 |
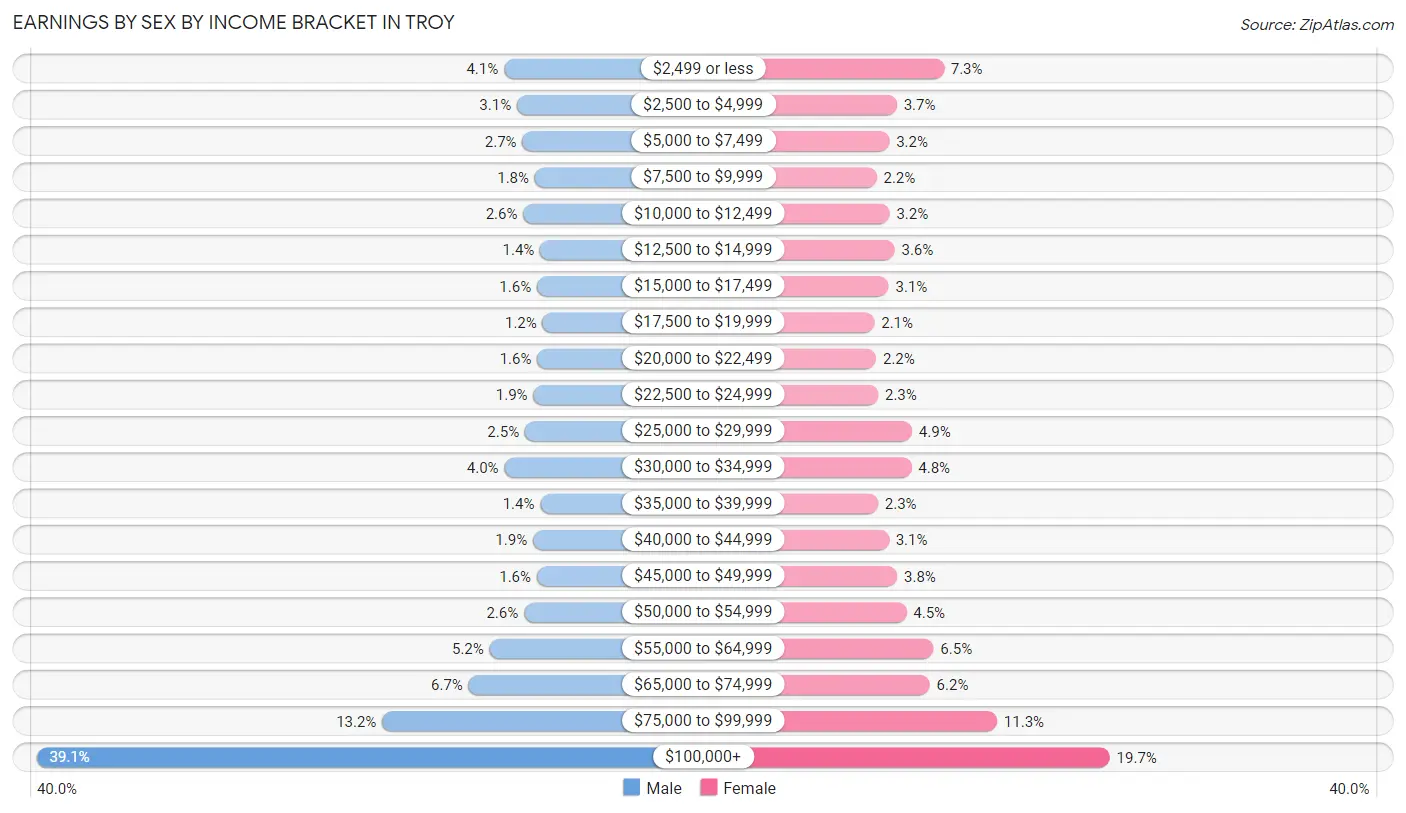
Earnings by Sex by Income Bracket in Troy
The most common earnings brackets in Troy are $100,000+ for men (10,642 | 39.1%) and $100,000+ for women (4,170 | 19.7%).
| Income | Male | Female |
| $2,499 or less | 1,108 (4.1%) | 1,539 (7.3%) |
| $2,500 to $4,999 | 843 (3.1%) | 792 (3.7%) |
| $5,000 to $7,499 | 732 (2.7%) | 674 (3.2%) |
| $7,500 to $9,999 | 479 (1.8%) | 472 (2.2%) |
| $10,000 to $12,499 | 715 (2.6%) | 677 (3.2%) |
| $12,500 to $14,999 | 371 (1.4%) | 757 (3.6%) |
| $15,000 to $17,499 | 435 (1.6%) | 663 (3.1%) |
| $17,500 to $19,999 | 320 (1.2%) | 437 (2.1%) |
| $20,000 to $22,499 | 429 (1.6%) | 463 (2.2%) |
| $22,500 to $24,999 | 509 (1.9%) | 495 (2.3%) |
| $25,000 to $29,999 | 679 (2.5%) | 1,033 (4.9%) |
| $30,000 to $34,999 | 1,100 (4.0%) | 1,025 (4.8%) |
| $35,000 to $39,999 | 368 (1.3%) | 494 (2.3%) |
| $40,000 to $44,999 | 518 (1.9%) | 665 (3.1%) |
| $45,000 to $49,999 | 439 (1.6%) | 798 (3.8%) |
| $50,000 to $54,999 | 699 (2.6%) | 944 (4.5%) |
| $55,000 to $64,999 | 1,402 (5.1%) | 1,373 (6.5%) |
| $65,000 to $74,999 | 1,827 (6.7%) | 1,315 (6.2%) |
| $75,000 to $99,999 | 3,592 (13.2%) | 2,382 (11.3%) |
| $100,000+ | 10,642 (39.1%) | 4,170 (19.7%) |
| Total | 27,207 (100.0%) | 21,168 (100.0%) |
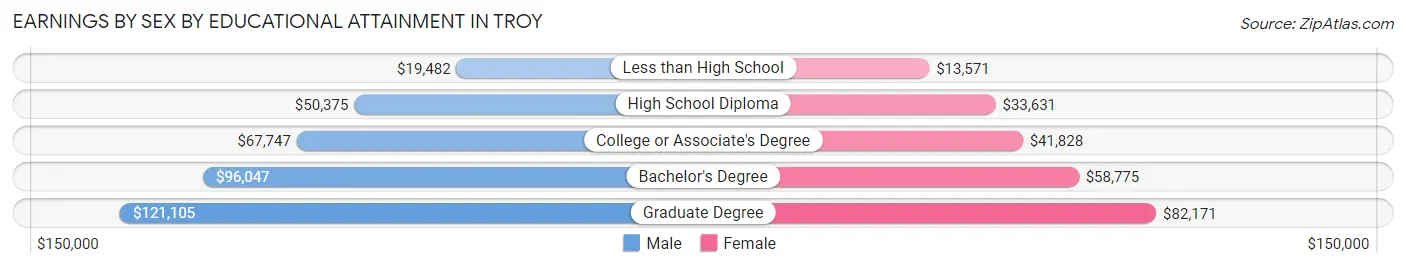
Earnings by Sex by Educational Attainment in Troy
Average earnings in Troy are $93,511 for men and $57,393 for women, a difference of 38.6%. Men with an educational attainment of graduate degree enjoy the highest average annual earnings of $121,105, while those with less than high school education earn the least with $19,482. Women with an educational attainment of graduate degree earn the most with the average annual earnings of $82,171, while those with less than high school education have the smallest earnings of $13,571.
| Educational Attainment | Male Income | Female Income |
| Less than High School | $19,482 | $13,571 |
| High School Diploma | $50,375 | $33,631 |
| College or Associate's Degree | $67,747 | $41,828 |
| Bachelor's Degree | $96,047 | $58,775 |
| Graduate Degree | $121,105 | $82,171 |
| Total | $93,511 | $57,393 |
Family Income in Troy
Family Income Brackets in Troy
According to the Troy family income data, there are 6,563 families falling into the $200,000+ income range, which is the most common income bracket and makes up 28.0% of all families. Conversely, the $10,000 to $14,999 income bracket is the least frequent group with only 117 families (0.5%) belonging to this category.
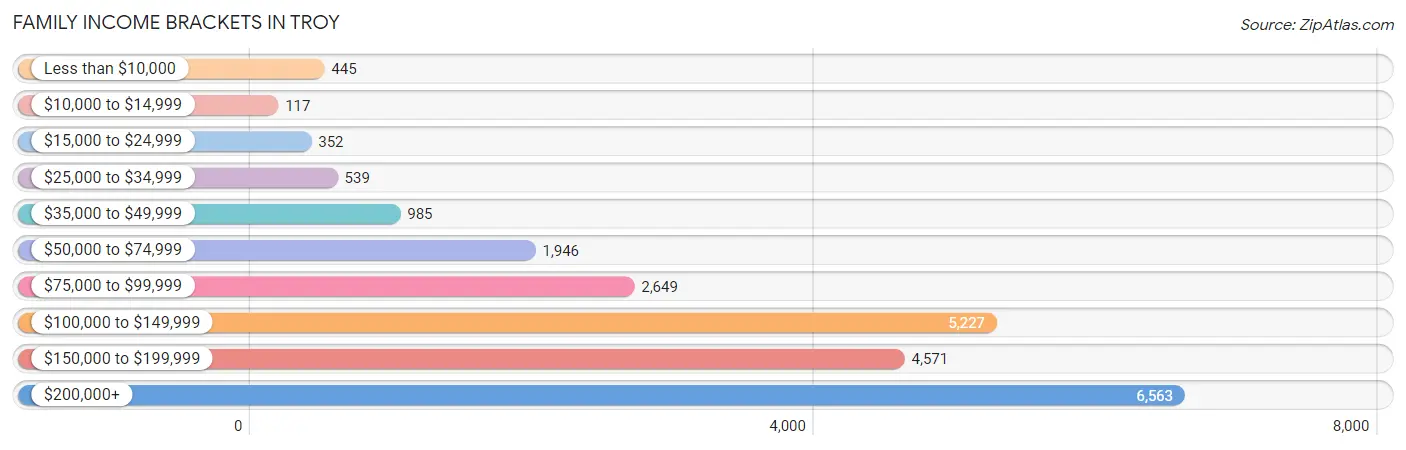
| Income Bracket | # Families | % Families |
| Less than $10,000 | 445 | 1.9% |
| $10,000 to $14,999 | 117 | 0.5% |
| $15,000 to $24,999 | 352 | 1.5% |
| $25,000 to $34,999 | 539 | 2.3% |
| $35,000 to $49,999 | 985 | 4.2% |
| $50,000 to $74,999 | 1,946 | 8.3% |
| $75,000 to $99,999 | 2,649 | 11.3% |
| $100,000 to $149,999 | 5,227 | 22.3% |
| $150,000 to $199,999 | 4,571 | 19.5% |
| $200,000+ | 6,563 | 28.0% |
Family Income by Famaliy Size in Troy
5-person families (2,196 | 9.4%) account for the highest median family income in Troy with $164,891 per family, while 2-person families (9,742 | 41.6%) have the highest median income of $57,551 per family member.
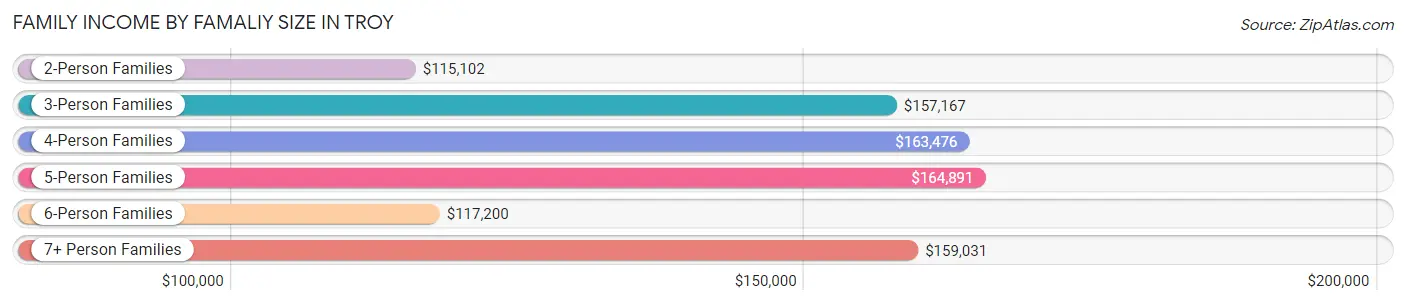
| Income Bracket | # Families | Median Income |
| 2-Person Families | 9,742 (41.6%) | $115,102 |
| 3-Person Families | 4,992 (21.3%) | $157,167 |
| 4-Person Families | 5,644 (24.1%) | $163,476 |
| 5-Person Families | 2,196 (9.4%) | $164,891 |
| 6-Person Families | 554 (2.4%) | $117,200 |
| 7+ Person Families | 313 (1.3%) | $159,031 |
| Total | 23,441 (100.0%) | $142,644 |
Family Income by Number of Earners in Troy
The median family income in Troy is $142,644, with families comprising 3+ earners (3,460) having the highest median family income of $174,530, while families with no earners (3,157) have the lowest median family income of $79,811, accounting for 14.8% and 13.5% of families, respectively.
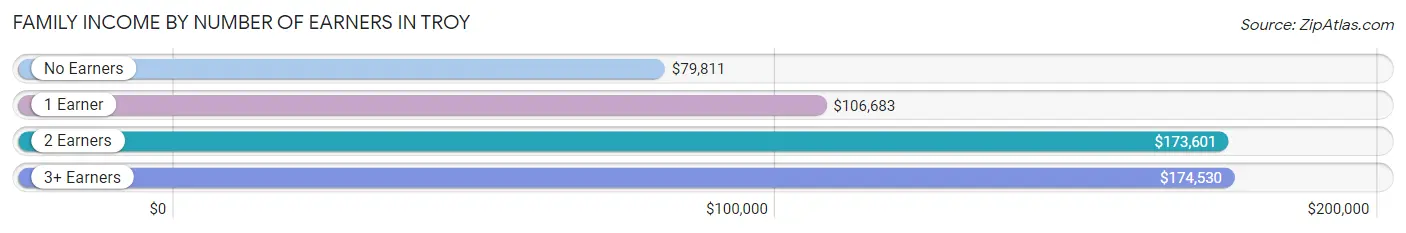
| Number of Earners | # Families | Median Income |
| No Earners | 3,157 (13.5%) | $79,811 |
| 1 Earner | 6,825 (29.1%) | $106,683 |
| 2 Earners | 9,999 (42.7%) | $173,601 |
| 3+ Earners | 3,460 (14.8%) | $174,530 |
| Total | 23,441 (100.0%) | $142,644 |
Household Income in Troy
Household Income Brackets in Troy
With 7,227 households falling in the category, the $200,000+ income range is the most frequent in Troy, accounting for 21.9% of all households. In contrast, only 924 households (2.8%) fall into the $10,000 to $14,999 income bracket, making it the least populous group.
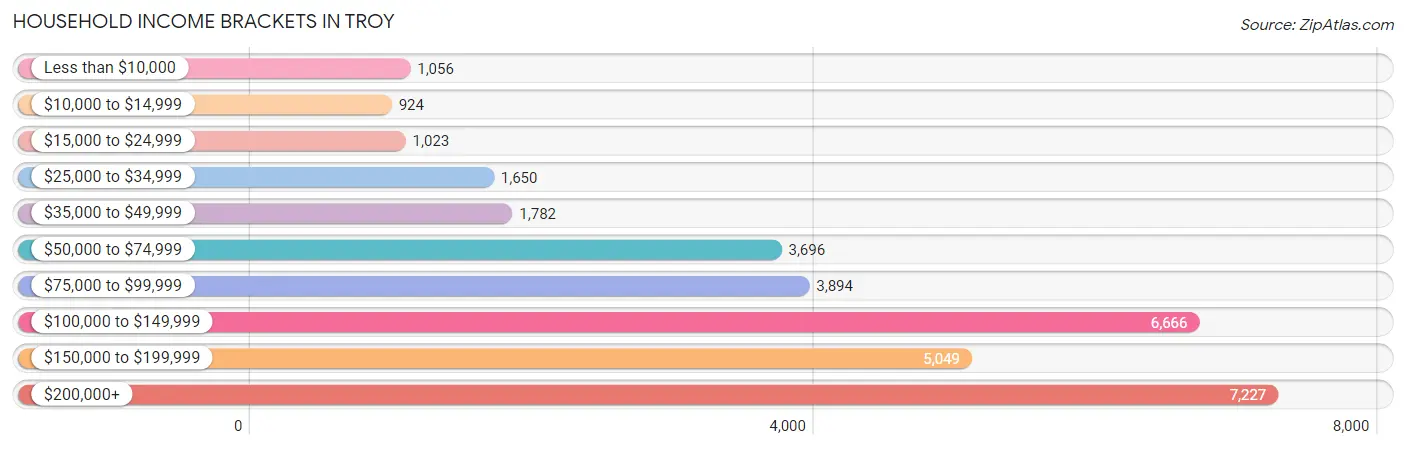
| Income Bracket | # Households | % Households |
| Less than $10,000 | 1,056 | 3.2% |
| $10,000 to $14,999 | 924 | 2.8% |
| $15,000 to $24,999 | 1,023 | 3.1% |
| $25,000 to $34,999 | 1,650 | 5.0% |
| $35,000 to $49,999 | 1,782 | 5.4% |
| $50,000 to $74,999 | 3,696 | 11.2% |
| $75,000 to $99,999 | 3,894 | 11.8% |
| $100,000 to $149,999 | 6,666 | 20.2% |
| $150,000 to $199,999 | 5,049 | 15.3% |
| $200,000+ | 7,227 | 21.9% |
Household Income by Householder Age in Troy
The median household income in Troy is $115,639, with the highest median household income of $154,904 found in the 45 to 64 years age bracket for the primary householder. A total of 13,858 households (42.0%) fall into this category. Meanwhile, the 65+ years age bracket for the primary householder has the lowest median household income of $72,396, with 9,278 households (28.1%) in this group.
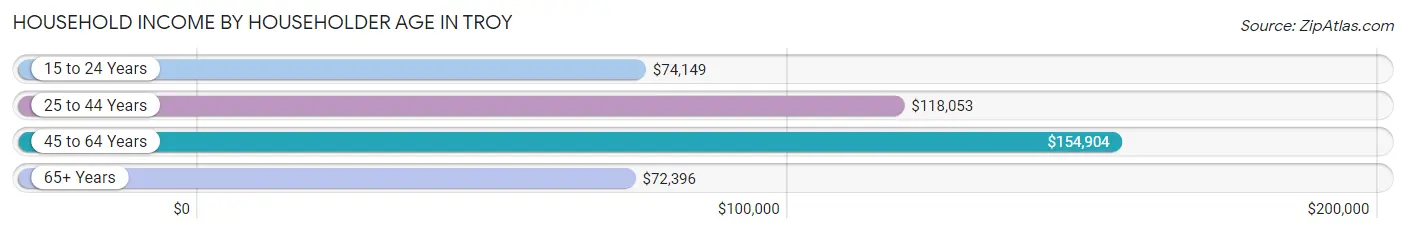
| Income Bracket | # Households | Median Income |
| 15 to 24 Years | 780 (2.4%) | $74,149 |
| 25 to 44 Years | 9,084 (27.5%) | $118,053 |
| 45 to 64 Years | 13,858 (42.0%) | $154,904 |
| 65+ Years | 9,278 (28.1%) | $72,396 |
| Total | 33,000 (100.0%) | $115,639 |
Poverty in Troy
Income Below Poverty by Sex and Age in Troy
With 5.2% poverty level for males and 6.8% for females among the residents of Troy, 75 year old and over males and 15 year old females are the most vulnerable to poverty, with 266 males (9.5%) and 151 females (24.3%) in their respective age groups living below the poverty level.
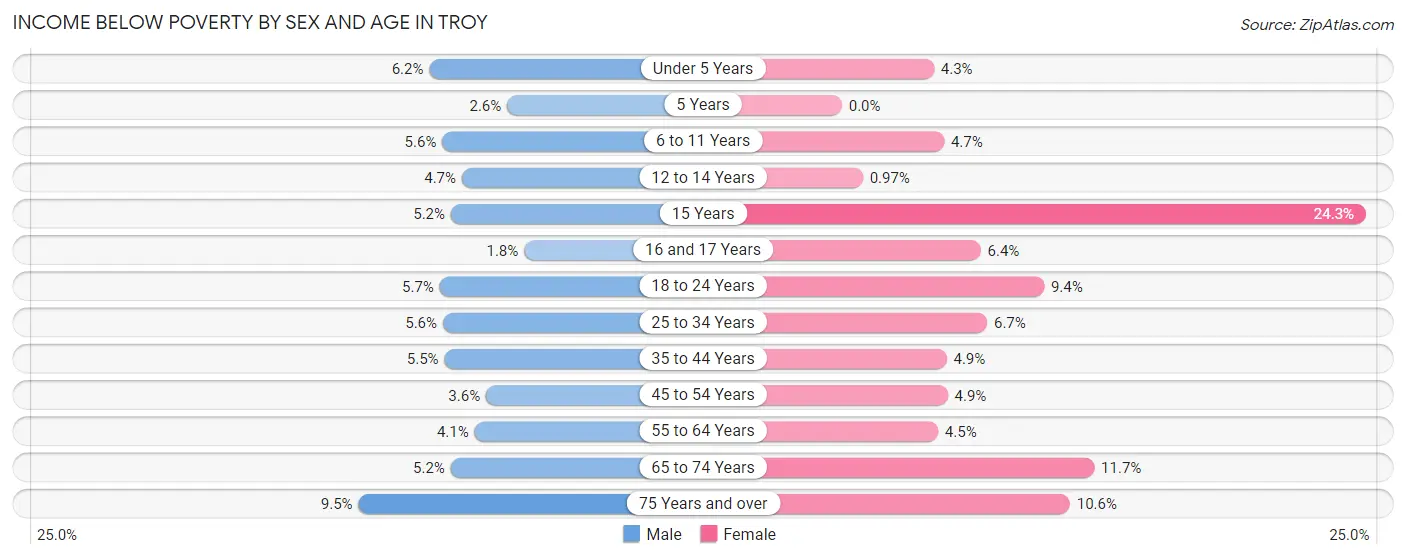
| Age Bracket | Male | Female |
| Under 5 Years | 145 (6.2%) | 74 (4.3%) |
| 5 Years | 13 (2.6%) | 0 (0.0%) |
| 6 to 11 Years | 164 (5.6%) | 121 (4.7%) |
| 12 to 14 Years | 93 (4.7%) | 15 (1.0%) |
| 15 Years | 47 (5.2%) | 151 (24.3%) |
| 16 and 17 Years | 23 (1.8%) | 75 (6.4%) |
| 18 to 24 Years | 281 (5.7%) | 372 (9.4%) |
| 25 to 34 Years | 289 (5.6%) | 269 (6.7%) |
| 35 to 44 Years | 288 (5.5%) | 262 (4.9%) |
| 45 to 54 Years | 223 (3.6%) | 310 (4.9%) |
| 55 to 64 Years | 264 (4.1%) | 275 (4.5%) |
| 65 to 74 Years | 223 (5.2%) | 595 (11.7%) |
| 75 Years and over | 266 (9.5%) | 326 (10.6%) |
| Total | 2,319 (5.2%) | 2,845 (6.8%) |
Income Above Poverty by Sex and Age in Troy
According to the poverty statistics in Troy, males aged 16 and 17 years and females aged 5 years are the age groups that are most secure financially, with 98.2% of males and 100.0% of females in these age groups living above the poverty line.
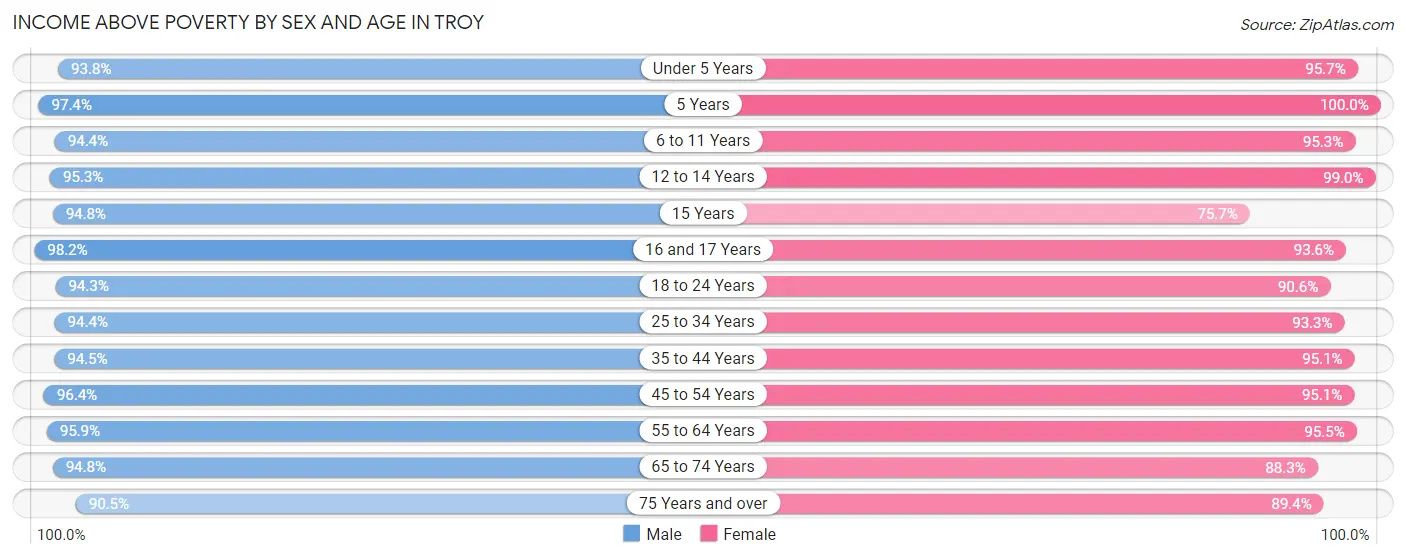
| Age Bracket | Male | Female |
| Under 5 Years | 2,187 (93.8%) | 1,659 (95.7%) |
| 5 Years | 485 (97.4%) | 498 (100.0%) |
| 6 to 11 Years | 2,754 (94.4%) | 2,430 (95.3%) |
| 12 to 14 Years | 1,880 (95.3%) | 1,539 (99.0%) |
| 15 Years | 854 (94.8%) | 470 (75.7%) |
| 16 and 17 Years | 1,239 (98.2%) | 1,089 (93.6%) |
| 18 to 24 Years | 4,614 (94.3%) | 3,594 (90.6%) |
| 25 to 34 Years | 4,885 (94.4%) | 3,724 (93.3%) |
| 35 to 44 Years | 4,926 (94.5%) | 5,125 (95.1%) |
| 45 to 54 Years | 5,996 (96.4%) | 6,009 (95.1%) |
| 55 to 64 Years | 6,148 (95.9%) | 5,897 (95.5%) |
| 65 to 74 Years | 4,038 (94.8%) | 4,487 (88.3%) |
| 75 Years and over | 2,532 (90.5%) | 2,754 (89.4%) |
| Total | 42,538 (94.8%) | 39,275 (93.2%) |
Income Below Poverty Among Married-Couple Families in Troy
The poverty statistics for married-couple families in Troy show that 2.8% or 566 of the total 20,190 families live below the poverty line. Families with 3 or 4 children have the highest poverty rate of 4.4%, comprising of 63 families. On the other hand, families with 5 or more children have the lowest poverty rate of 0.0%, which includes 0 families.
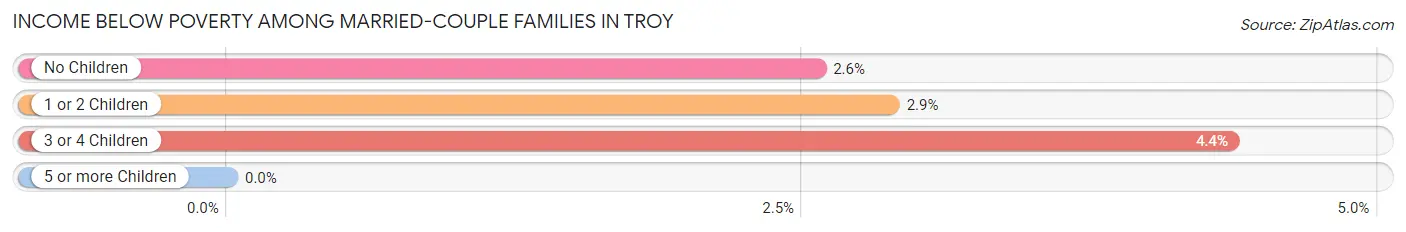
| Children | Above Poverty | Below Poverty |
| No Children | 10,746 (97.4%) | 282 (2.6%) |
| 1 or 2 Children | 7,440 (97.1%) | 221 (2.9%) |
| 3 or 4 Children | 1,383 (95.6%) | 63 (4.4%) |
| 5 or more Children | 55 (100.0%) | 0 (0.0%) |
| Total | 19,624 (97.2%) | 566 (2.8%) |
Income Below Poverty Among Single-Parent Households in Troy
According to the poverty data in Troy, 7.0% or 74 single-father households and 11.2% or 246 single-mother households are living below the poverty line. Among single-father households, those with 1 or 2 children have the highest poverty rate, with 67 households (15.0%) experiencing poverty. Likewise, among single-mother households, those with 1 or 2 children have the highest poverty rate, with 189 households (20.2%) falling below the poverty line.
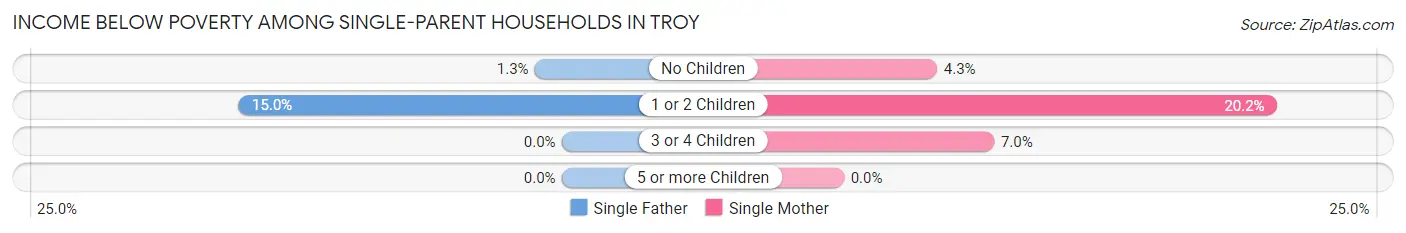
| Children | Single Father | Single Mother |
| No Children | 7 (1.3%) | 50 (4.3%) |
| 1 or 2 Children | 67 (15.0%) | 189 (20.2%) |
| 3 or 4 Children | 0 (0.0%) | 7 (7.0%) |
| 5 or more Children | 0 (0.0%) | 0 (0.0%) |
| Total | 74 (7.0%) | 246 (11.2%) |
Income Below Poverty Among Married-Couple vs Single-Parent Households in Troy
The poverty data for Troy shows that 566 of the married-couple family households (2.8%) and 320 of the single-parent households (9.8%) are living below the poverty level. Within the married-couple family households, those with 3 or 4 children have the highest poverty rate, with 63 households (4.4%) falling below the poverty line. Among the single-parent households, those with 1 or 2 children have the highest poverty rate, with 256 household (18.5%) living below poverty.
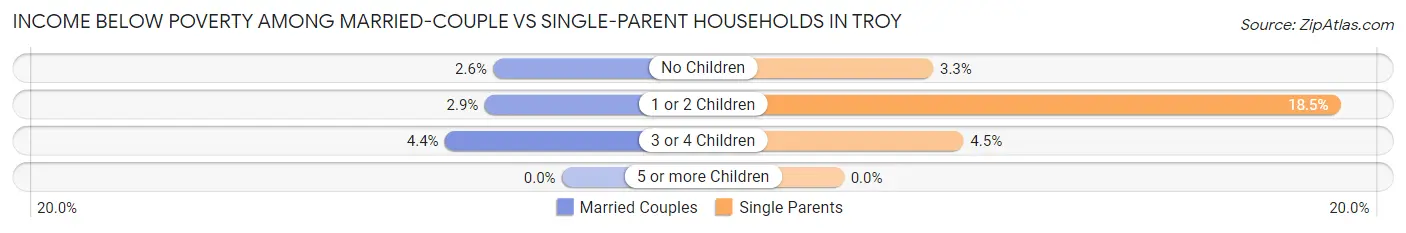
| Children | Married-Couple Families | Single-Parent Households |
| No Children | 282 (2.6%) | 57 (3.3%) |
| 1 or 2 Children | 221 (2.9%) | 256 (18.5%) |
| 3 or 4 Children | 63 (4.4%) | 7 (4.5%) |
| 5 or more Children | 0 (0.0%) | 0 (0.0%) |
| Total | 566 (2.8%) | 320 (9.8%) |
Race in Troy
The most populous races in Troy are White / Caucasian (56,275 | 64.6%), Asian (22,644 | 26.0%), and Two or more Races (3,510 | 4.0%).
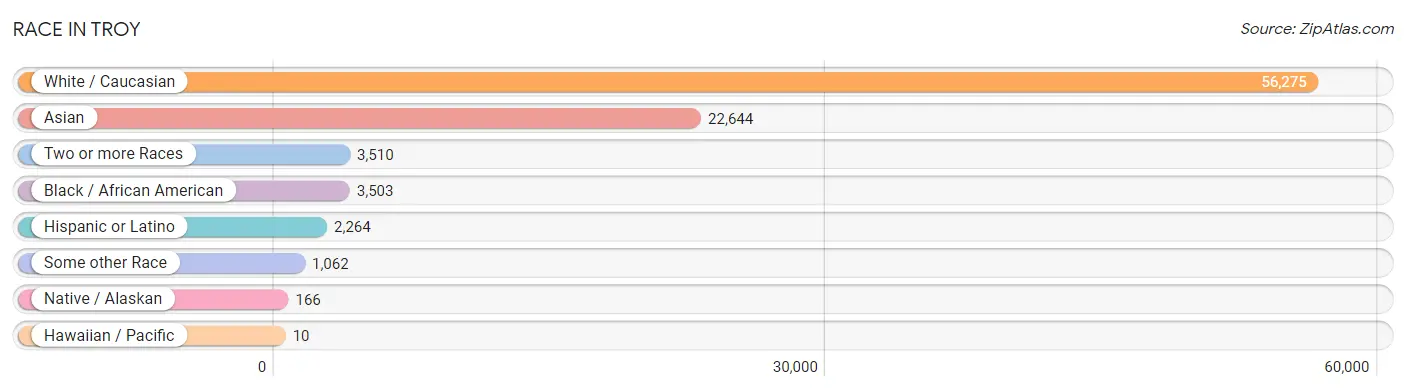
| Race | # Population | % Population |
| Asian | 22,644 | 26.0% |
| Black / African American | 3,503 | 4.0% |
| Hawaiian / Pacific | 10 | 0.0% |
| Hispanic or Latino | 2,264 | 2.6% |
| Native / Alaskan | 166 | 0.2% |
| White / Caucasian | 56,275 | 64.6% |
| Two or more Races | 3,510 | 4.0% |
| Some other Race | 1,062 | 1.2% |
| Total | 87,170 | 100.0% |
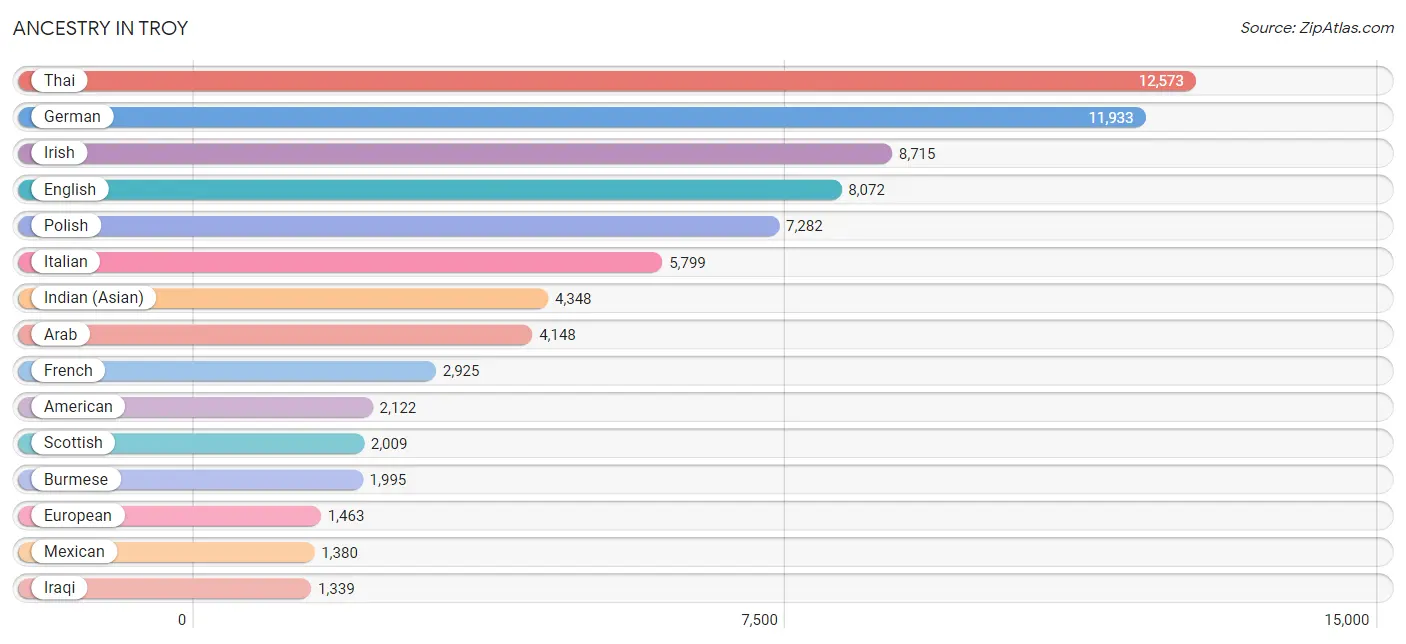
Ancestry in Troy
The most populous ancestries reported in Troy are Thai (12,573 | 14.4%), German (11,933 | 13.7%), Irish (8,715 | 10.0%), English (8,072 | 9.3%), and Polish (7,282 | 8.4%), together accounting for 55.7% of all Troy residents.
| Ancestry | # Population | % Population |
| African | 159 | 0.2% |
| Albanian | 1,071 | 1.2% |
| American | 2,122 | 2.4% |
| Apache | 26 | 0.0% |
| Arab | 4,148 | 4.8% |
| Argentinean | 50 | 0.1% |
| Armenian | 246 | 0.3% |
| Assyrian / Chaldean / Syriac | 714 | 0.8% |
| Australian | 12 | 0.0% |
| Austrian | 244 | 0.3% |
| Bahamian | 11 | 0.0% |
| Bangladeshi | 43 | 0.1% |
| Barbadian | 57 | 0.1% |
| Belgian | 551 | 0.6% |
| Bhutanese | 620 | 0.7% |
| Blackfeet | 34 | 0.0% |
| Brazilian | 266 | 0.3% |
| British | 235 | 0.3% |
| Bulgarian | 25 | 0.0% |
| Burmese | 1,995 | 2.3% |
| Cajun | 11 | 0.0% |
| Cambodian | 16 | 0.0% |
| Canadian | 776 | 0.9% |
| Central American | 273 | 0.3% |
| Cherokee | 93 | 0.1% |
| Chickasaw | 7 | 0.0% |
| Chippewa | 238 | 0.3% |
| Colombian | 65 | 0.1% |
| Costa Rican | 8 | 0.0% |
| Croatian | 148 | 0.2% |
| Cuban | 50 | 0.1% |
| Cypriot | 21 | 0.0% |
| Czech | 266 | 0.3% |
| Czechoslovakian | 90 | 0.1% |
| Danish | 274 | 0.3% |
| Dominican | 48 | 0.1% |
| Dutch | 743 | 0.9% |
| Eastern European | 251 | 0.3% |
| Ecuadorian | 8 | 0.0% |
| Egyptian | 792 | 0.9% |
| English | 8,072 | 9.3% |
| Estonian | 7 | 0.0% |
| European | 1,463 | 1.7% |
| Filipino | 255 | 0.3% |
| Finnish | 376 | 0.4% |
| French | 2,925 | 3.4% |
| French American Indian | 4 | 0.0% |
| French Canadian | 1,191 | 1.4% |
| German | 11,933 | 13.7% |
| Greek | 648 | 0.7% |
| Guamanian / Chamorro | 35 | 0.0% |
| Guatemalan | 12 | 0.0% |
| Haitian | 41 | 0.1% |
| Honduran | 218 | 0.3% |
| Hungarian | 378 | 0.4% |
| Indian (Asian) | 4,348 | 5.0% |
| Iranian | 44 | 0.1% |
| Iraqi | 1,339 | 1.5% |
| Irish | 8,715 | 10.0% |
| Iroquois | 21 | 0.0% |
| Italian | 5,799 | 6.7% |
| Jamaican | 85 | 0.1% |
| Japanese | 90 | 0.1% |
| Jordanian | 47 | 0.1% |
| Korean | 1,154 | 1.3% |
| Latvian | 11 | 0.0% |
| Lebanese | 957 | 1.1% |
| Liberian | 132 | 0.2% |
| Lithuanian | 109 | 0.1% |
| Luxembourger | 29 | 0.0% |
| Macedonian | 324 | 0.4% |
| Maltese | 135 | 0.2% |
| Mexican | 1,380 | 1.6% |
| Mexican American Indian | 26 | 0.0% |
| Mongolian | 79 | 0.1% |
| Native Hawaiian | 32 | 0.0% |
| Nigerian | 19 | 0.0% |
| Northern European | 7 | 0.0% |
| Norwegian | 487 | 0.6% |
| Ottawa | 9 | 0.0% |
| Pakistani | 116 | 0.1% |
| Palestinian | 42 | 0.1% |
| Peruvian | 11 | 0.0% |
| Polish | 7,282 | 8.4% |
| Portuguese | 31 | 0.0% |
| Potawatomi | 4 | 0.0% |
| Puerto Rican | 221 | 0.3% |
| Romanian | 604 | 0.7% |
| Russian | 519 | 0.6% |
| Salvadoran | 35 | 0.0% |
| Scandinavian | 235 | 0.3% |
| Scotch-Irish | 336 | 0.4% |
| Scottish | 2,009 | 2.3% |
| Serbian | 171 | 0.2% |
| Sioux | 22 | 0.0% |
| Slavic | 87 | 0.1% |
| Slovak | 223 | 0.3% |
| Slovene | 40 | 0.1% |
| South African | 18 | 0.0% |
| South American | 154 | 0.2% |
| Soviet Union | 149 | 0.2% |
| Spaniard | 32 | 0.0% |
| Spanish | 27 | 0.0% |
| Spanish American | 1 | 0.0% |
| Sri Lankan | 577 | 0.7% |
| Subsaharan African | 428 | 0.5% |
| Swedish | 655 | 0.7% |
| Swiss | 255 | 0.3% |
| Syrian | 534 | 0.6% |
| Thai | 12,573 | 14.4% |
| Tlingit-Haida | 9 | 0.0% |
| Turkish | 117 | 0.1% |
| Ukrainian | 1,099 | 1.3% |
| Uruguayan | 13 | 0.0% |
| Venezuelan | 7 | 0.0% |
| Vietnamese | 409 | 0.5% |
| Welsh | 188 | 0.2% |
| West Indian | 6 | 0.0% |
| Yugoslavian | 314 | 0.4% | View All 119 Rows |
Immigrants in Troy
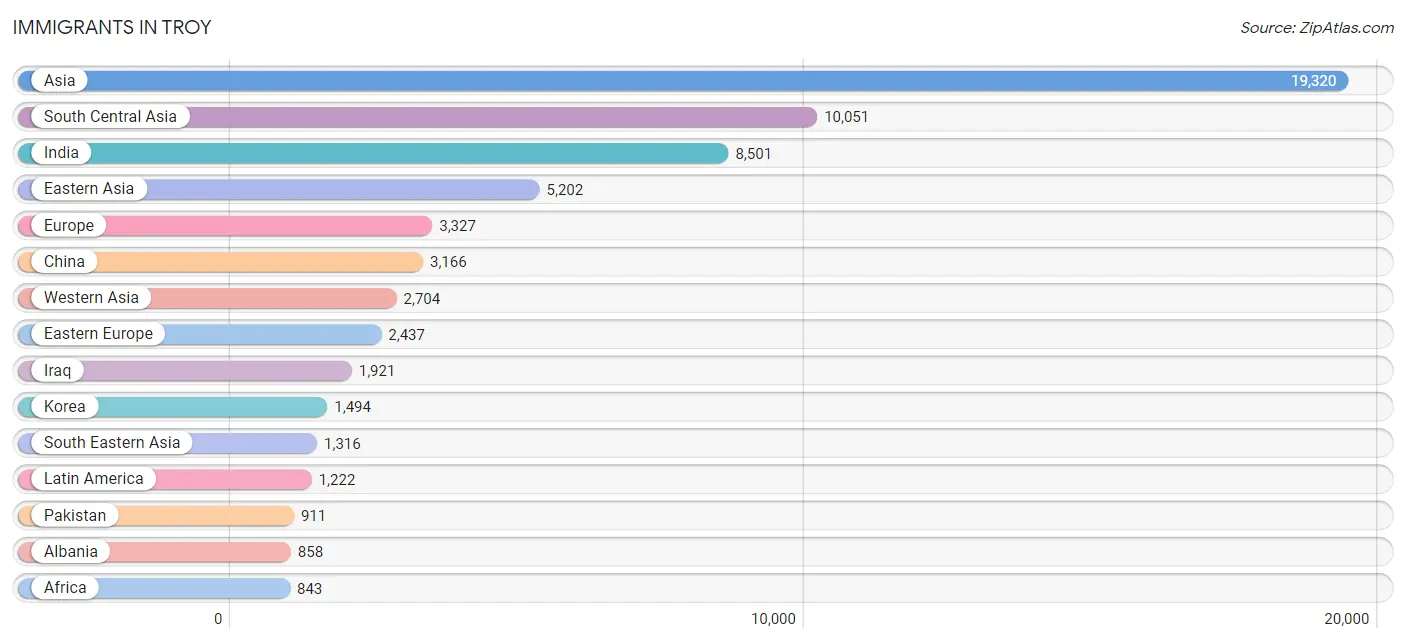
The most numerous immigrant groups reported in Troy came from Asia (19,320 | 22.2%), South Central Asia (10,051 | 11.5%), India (8,501 | 9.8%), Eastern Asia (5,202 | 6.0%), and Europe (3,327 | 3.8%), together accounting for 53.2% of all Troy residents.
| Immigration Origin | # Population | % Population |
| Africa | 843 | 1.0% |
| Albania | 858 | 1.0% |
| Argentina | 16 | 0.0% |
| Asia | 19,320 | 22.2% |
| Australia | 10 | 0.0% |
| Austria | 28 | 0.0% |
| Bahamas | 11 | 0.0% |
| Bangladesh | 475 | 0.5% |
| Belarus | 23 | 0.0% |
| Belgium | 29 | 0.0% |
| Bosnia and Herzegovina | 117 | 0.1% |
| Brazil | 211 | 0.2% |
| Bulgaria | 17 | 0.0% |
| Cambodia | 90 | 0.1% |
| Cameroon | 151 | 0.2% |
| Canada | 780 | 0.9% |
| Caribbean | 121 | 0.1% |
| Central America | 807 | 0.9% |
| China | 3,166 | 3.6% |
| Colombia | 31 | 0.0% |
| Costa Rica | 72 | 0.1% |
| Croatia | 89 | 0.1% |
| Cuba | 10 | 0.0% |
| Czechoslovakia | 4 | 0.0% |
| Dominican Republic | 21 | 0.0% |
| Eastern Africa | 91 | 0.1% |
| Eastern Asia | 5,202 | 6.0% |
| Eastern Europe | 2,437 | 2.8% |
| Ecuador | 8 | 0.0% |
| Egypt | 490 | 0.6% |
| El Salvador | 8 | 0.0% |
| England | 121 | 0.1% |
| Ethiopia | 43 | 0.1% |
| Europe | 3,327 | 3.8% |
| France | 56 | 0.1% |
| Germany | 257 | 0.3% |
| Greece | 52 | 0.1% |
| Guatemala | 12 | 0.0% |
| Haiti | 39 | 0.0% |
| Honduras | 187 | 0.2% |
| Hong Kong | 124 | 0.1% |
| India | 8,501 | 9.8% |
| Indonesia | 9 | 0.0% |
| Iran | 50 | 0.1% |
| Iraq | 1,921 | 2.2% |
| Israel | 20 | 0.0% |
| Italy | 154 | 0.2% |
| Jamaica | 30 | 0.0% |
| Japan | 526 | 0.6% |
| Jordan | 12 | 0.0% |
| Kazakhstan | 18 | 0.0% |
| Kenya | 46 | 0.1% |
| Korea | 1,494 | 1.7% |
| Kuwait | 22 | 0.0% |
| Laos | 12 | 0.0% |
| Latin America | 1,222 | 1.4% |
| Lebanon | 363 | 0.4% |
| Liberia | 16 | 0.0% |
| Malaysia | 89 | 0.1% |
| Mexico | 528 | 0.6% |
| Middle Africa | 151 | 0.2% |
| Morocco | 9 | 0.0% |
| Nepal | 60 | 0.1% |
| Netherlands | 12 | 0.0% |
| Nigeria | 9 | 0.0% |
| North Macedonia | 82 | 0.1% |
| Northern Africa | 506 | 0.6% |
| Northern Europe | 234 | 0.3% |
| Norway | 19 | 0.0% |
| Oceania | 10 | 0.0% |
| Pakistan | 911 | 1.1% |
| Peru | 8 | 0.0% |
| Philippines | 542 | 0.6% |
| Poland | 342 | 0.4% |
| Romania | 350 | 0.4% |
| Russia | 89 | 0.1% |
| Saudi Arabia | 11 | 0.0% |
| Scotland | 10 | 0.0% |
| Senegal | 18 | 0.0% |
| Serbia | 39 | 0.0% |
| Singapore | 18 | 0.0% |
| South Africa | 33 | 0.0% |
| South America | 294 | 0.3% |
| South Central Asia | 10,051 | 11.5% |
| South Eastern Asia | 1,316 | 1.5% |
| Southern Europe | 274 | 0.3% |
| Spain | 10 | 0.0% |
| Sri Lanka | 36 | 0.0% |
| Sweden | 12 | 0.0% |
| Syria | 177 | 0.2% |
| Taiwan | 395 | 0.4% |
| Thailand | 78 | 0.1% |
| Turkey | 101 | 0.1% |
| Uganda | 2 | 0.0% |
| Ukraine | 319 | 0.4% |
| Uruguay | 13 | 0.0% |
| Venezuela | 7 | 0.0% |
| Vietnam | 416 | 0.5% |
| Western Africa | 43 | 0.1% |
| Western Asia | 2,704 | 3.1% |
| Western Europe | 382 | 0.4% | View All 101 Rows |
Sex and Age in Troy
Sex and Age in Troy
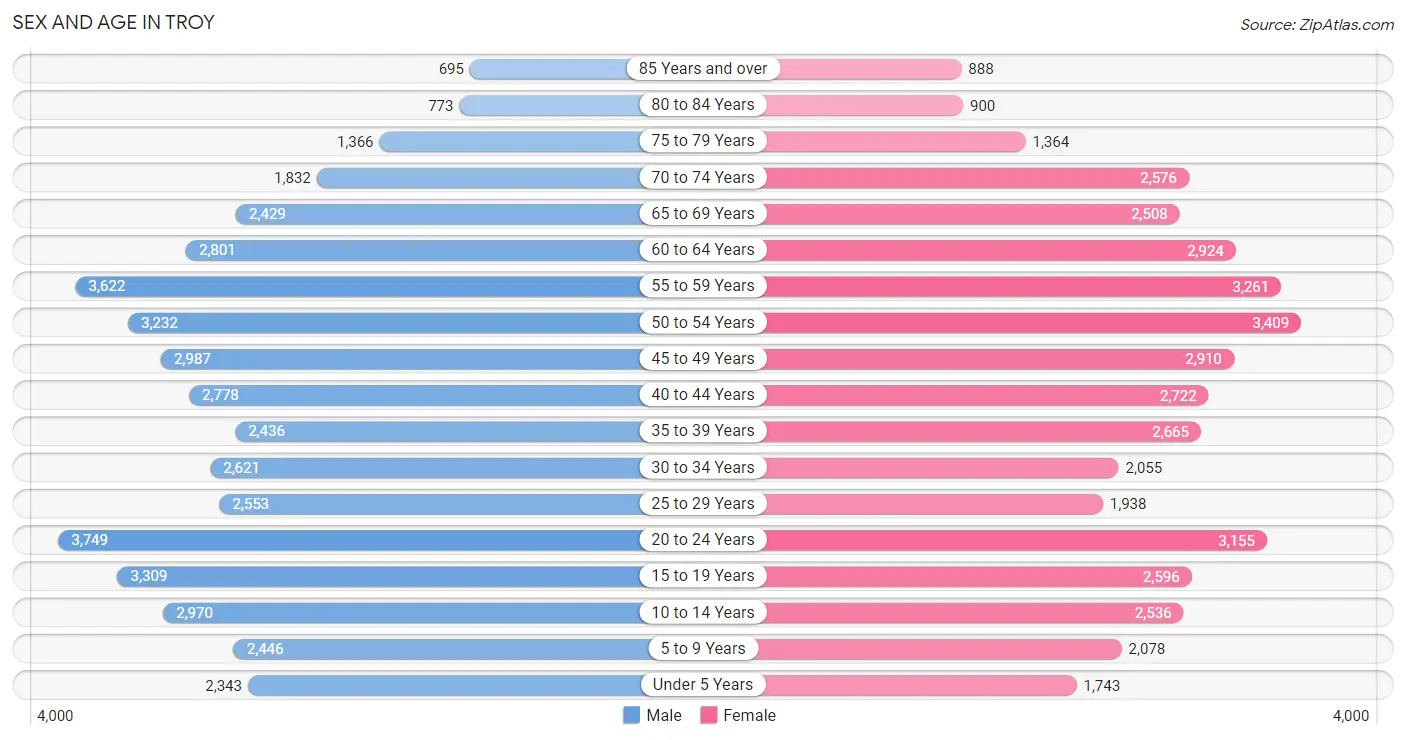
The most populous age groups in Troy are 20 to 24 Years (3,749 | 8.3%) for men and 50 to 54 Years (3,409 | 8.1%) for women.
| Age Bracket | Male | Female |
| Under 5 Years | 2,343 (5.2%) | 1,743 (4.1%) |
| 5 to 9 Years | 2,446 (5.4%) | 2,078 (4.9%) |
| 10 to 14 Years | 2,970 (6.6%) | 2,536 (6.0%) |
| 15 to 19 Years | 3,309 (7.4%) | 2,596 (6.1%) |
| 20 to 24 Years | 3,749 (8.3%) | 3,155 (7.5%) |
| 25 to 29 Years | 2,553 (5.7%) | 1,938 (4.6%) |
| 30 to 34 Years | 2,621 (5.8%) | 2,055 (4.9%) |
| 35 to 39 Years | 2,436 (5.4%) | 2,665 (6.3%) |
| 40 to 44 Years | 2,778 (6.2%) | 2,722 (6.5%) |
| 45 to 49 Years | 2,987 (6.7%) | 2,910 (6.9%) |
| 50 to 54 Years | 3,232 (7.2%) | 3,409 (8.1%) |
| 55 to 59 Years | 3,622 (8.1%) | 3,261 (7.7%) |
| 60 to 64 Years | 2,801 (6.2%) | 2,924 (6.9%) |
| 65 to 69 Years | 2,429 (5.4%) | 2,508 (5.9%) |
| 70 to 74 Years | 1,832 (4.1%) | 2,576 (6.1%) |
| 75 to 79 Years | 1,366 (3.0%) | 1,364 (3.2%) |
| 80 to 84 Years | 773 (1.7%) | 900 (2.1%) |
| 85 Years and over | 695 (1.5%) | 888 (2.1%) |
| Total | 44,942 (100.0%) | 42,228 (100.0%) |
Families and Households in Troy
Median Family Size in Troy
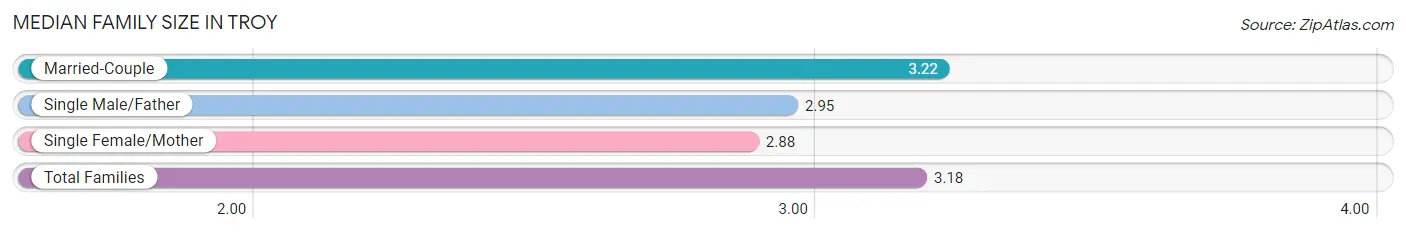
The median family size in Troy is 3.18 persons per family, with married-couple families (20,190 | 86.1%) accounting for the largest median family size of 3.22 persons per family. On the other hand, single female/mother families (2,191 | 9.3%) represent the smallest median family size with 2.88 persons per family.
| Family Type | # Families | Family Size |
| Married-Couple | 20,190 (86.1%) | 3.22 |
| Single Male/Father | 1,060 (4.5%) | 2.95 |
| Single Female/Mother | 2,191 (9.3%) | 2.88 |
| Total Families | 23,441 (100.0%) | 3.18 |
Median Household Size in Troy
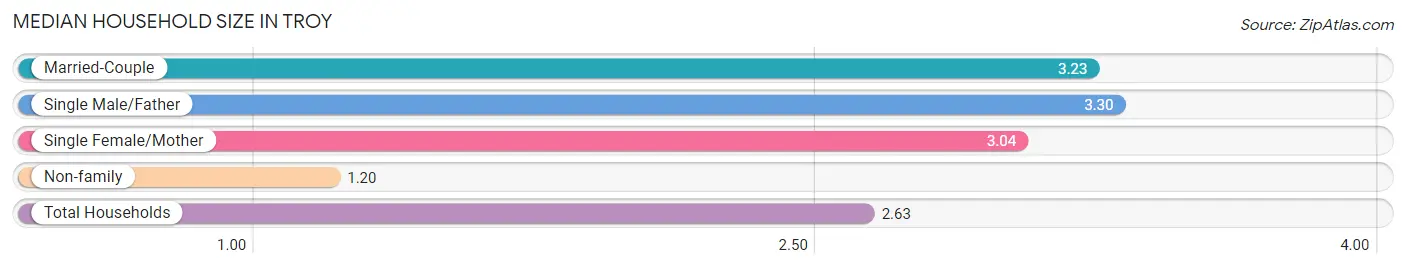
The median household size in Troy is 2.63 persons per household, with single male/father households (1,060 | 3.2%) accounting for the largest median household size of 3.3 persons per household. non-family households (9,559 | 29.0%) represent the smallest median household size with 1.20 persons per household.
| Household Type | # Households | Household Size |
| Married-Couple | 20,190 (61.2%) | 3.23 |
| Single Male/Father | 1,060 (3.2%) | 3.30 |
| Single Female/Mother | 2,191 (6.6%) | 3.04 |
| Non-family | 9,559 (29.0%) | 1.20 |
| Total Households | 33,000 (100.0%) | 2.63 |
Household Size by Marriage Status in Troy
Out of a total of 33,000 households in Troy, 23,441 (71.0%) are family households, while 9,559 (29.0%) are nonfamily households. The most numerous type of family households are 2-person households, comprising 9,451, and the most common type of nonfamily households are 1-person households, comprising 7,981.
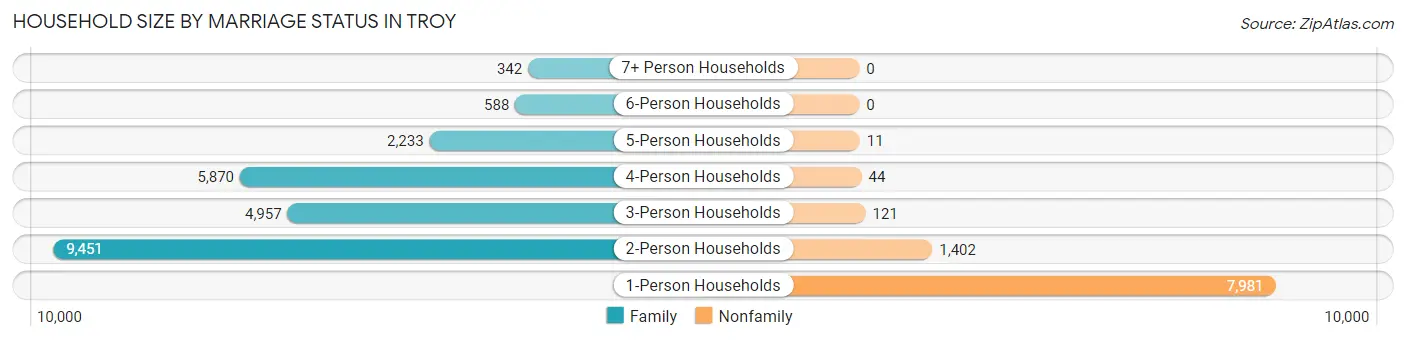
| Household Size | Family Households | Nonfamily Households |
| 1-Person Households | - | 7,981 (24.2%) |
| 2-Person Households | 9,451 (28.6%) | 1,402 (4.3%) |
| 3-Person Households | 4,957 (15.0%) | 121 (0.4%) |
| 4-Person Households | 5,870 (17.8%) | 44 (0.1%) |
| 5-Person Households | 2,233 (6.8%) | 11 (0.0%) |
| 6-Person Households | 588 (1.8%) | 0 (0.0%) |
| 7+ Person Households | 342 (1.0%) | 0 (0.0%) |
| Total | 23,441 (71.0%) | 9,559 (29.0%) |
Female Fertility in Troy
Fertility by Age in Troy
Average fertility rate in Troy is 49.0 births per 1,000 women. Women in the age bracket of 20 to 34 years have the highest fertility rate with 59.0 births per 1,000 women. Women in the age bracket of 35 to 50 years acount for 54.5% of all women with births.
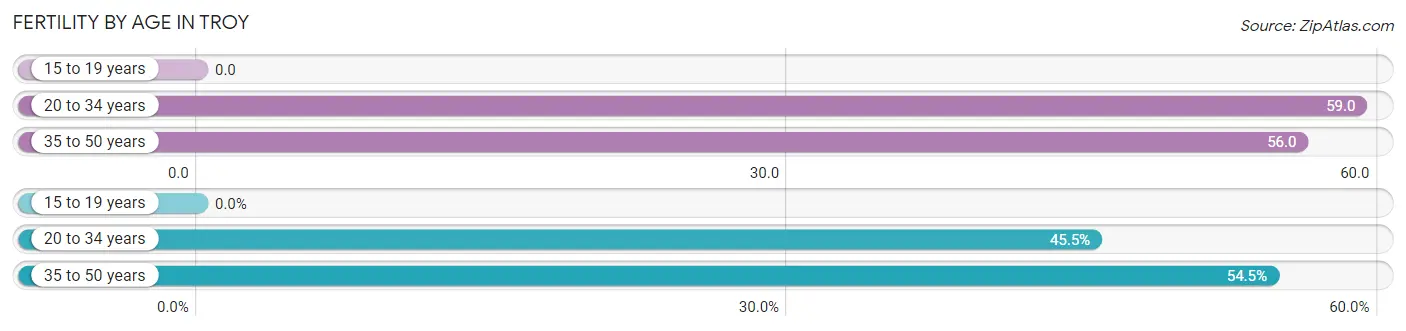
| Age Bracket | Women with Births | Births / 1,000 Women |
| 15 to 19 years | 0 (0.0%) | 0.0 |
| 20 to 34 years | 420 (45.5%) | 59.0 |
| 35 to 50 years | 503 (54.5%) | 56.0 |
| Total | 923 (100.0%) | 49.0 |
Fertility by Age by Marriage Status in Troy
92.3% of women with births (923) in Troy are married. The highest percentage of unmarried women with births falls into 20 to 34 years age bracket with 14.3% of them unmarried at the time of birth, while the lowest percentage of unmarried women with births belong to 35 to 50 years age bracket with 2.2% of them unmarried.
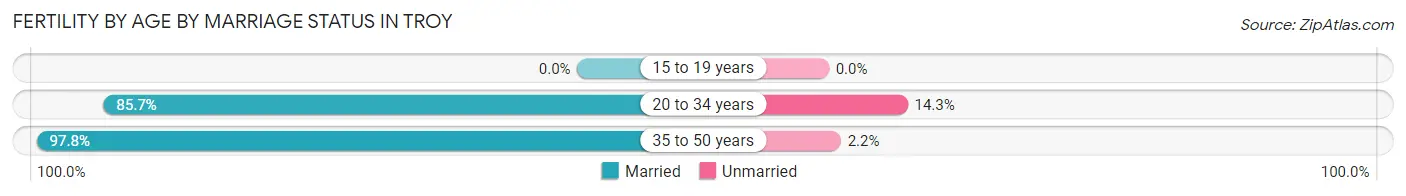
| Age Bracket | Married | Unmarried |
| 15 to 19 years | 0 (0.0%) | 0 (0.0%) |
| 20 to 34 years | 360 (85.7%) | 60 (14.3%) |
| 35 to 50 years | 492 (97.8%) | 11 (2.2%) |
| Total | 852 (92.3%) | 71 (7.7%) |
Fertility by Education in Troy
Average fertility rate in Troy is 49.0 births per 1,000 women. Women with the education attainment of graduate degree have the highest fertility rate of 71.0 births per 1,000 women, while women with the education attainment of less than high school have the lowest fertility at 3.0 births per 1,000 women. Women with the education attainment of graduate degree represent 37.2% of all women with births.
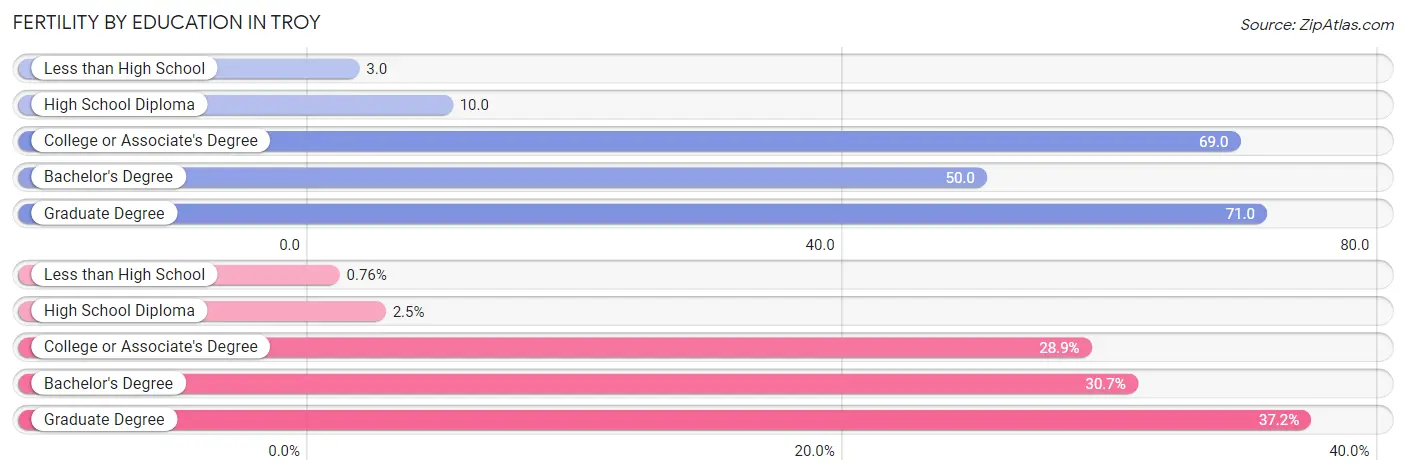
| Educational Attainment | Women with Births | Births / 1,000 Women |
| Less than High School | 7 (0.8%) | 3.0 |
| High School Diploma | 23 (2.5%) | 10.0 |
| College or Associate's Degree | 267 (28.9%) | 69.0 |
| Bachelor's Degree | 283 (30.7%) | 50.0 |
| Graduate Degree | 343 (37.2%) | 71.0 |
| Total | 923 (100.0%) | 49.0 |
Fertility by Education by Marriage Status in Troy
7.7% of women with births in Troy are unmarried. Women with the educational attainment of high school diploma are most likely to be married with 100.0% of them married at childbirth, while women with the educational attainment of less than high school are least likely to be married with 100.0% of them unmarried at childbirth.
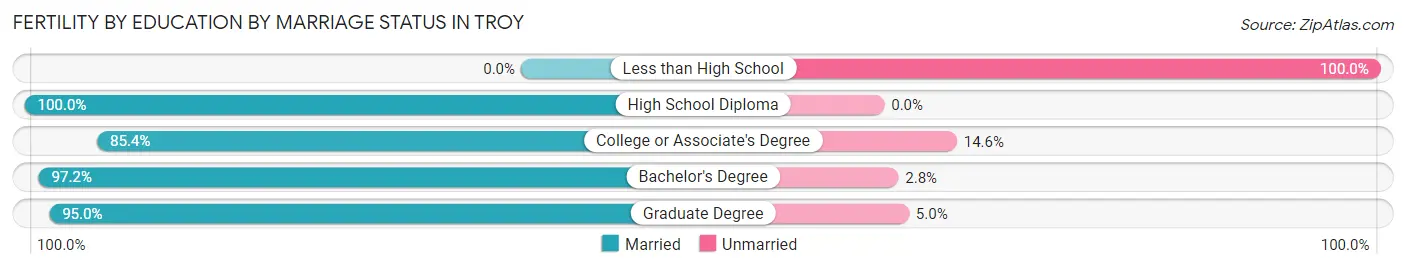
| Educational Attainment | Married | Unmarried |
| Less than High School | 0 (0.0%) | 7 (100.0%) |
| High School Diploma | 23 (100.0%) | 0 (0.0%) |
| College or Associate's Degree | 228 (85.4%) | 39 (14.6%) |
| Bachelor's Degree | 275 (97.2%) | 8 (2.8%) |
| Graduate Degree | 326 (95.0%) | 17 (5.0%) |
| Total | 852 (92.3%) | 71 (7.7%) |
Employment Characteristics in Troy
Employment by Class of Employer in Troy
Among the 43,808 employed individuals in Troy, private company employees (32,633 | 74.5%), not-for-profit organizations (3,741 | 8.5%), and local government employees (2,067 | 4.7%) make up the most common classes of employment.
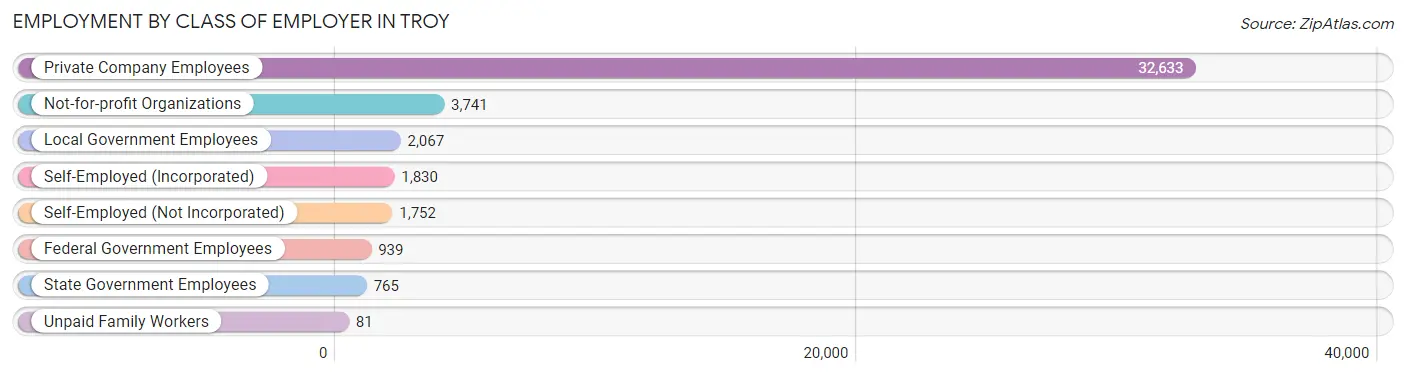
| Employer Class | # Employees | % Employees |
| Private Company Employees | 32,633 | 74.5% |
| Self-Employed (Incorporated) | 1,830 | 4.2% |
| Self-Employed (Not Incorporated) | 1,752 | 4.0% |
| Not-for-profit Organizations | 3,741 | 8.5% |
| Local Government Employees | 2,067 | 4.7% |
| State Government Employees | 765 | 1.8% |
| Federal Government Employees | 939 | 2.1% |
| Unpaid Family Workers | 81 | 0.2% |
| Total | 43,808 | 100.0% |
Employment Status by Age in Troy
According to the labor force statistics for Troy, out of the total population over 16 years of age (71,532), 64.5% or 46,138 individuals are in the labor force, with 3.9% or 1,799 of them unemployed. The age group with the highest labor force participation rate is 30 to 34 years, with 86.5% or 4,045 individuals in the labor force. Within the labor force, the 20 to 24 years age range has the highest percentage of unemployed individuals, with 11.0% or 564 of them being unemployed.
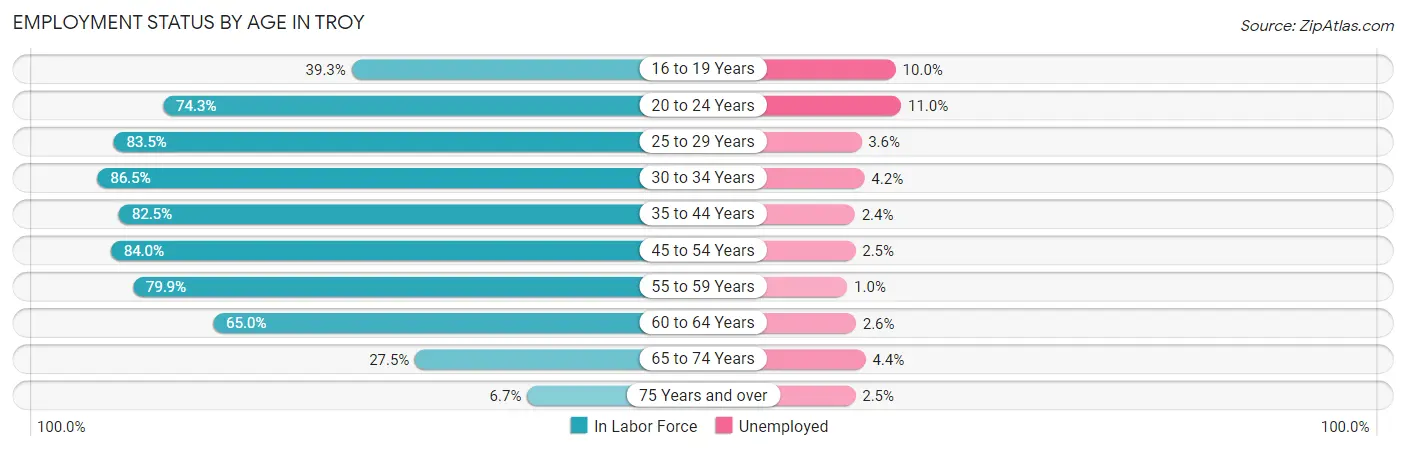
| Age Bracket | In Labor Force | Unemployed |
| 16 to 19 Years | 1,723 (39.3%) | 172 (10.0%) |
| 20 to 24 Years | 5,130 (74.3%) | 564 (11.0%) |
| 25 to 29 Years | 3,750 (83.5%) | 135 (3.6%) |
| 30 to 34 Years | 4,045 (86.5%) | 170 (4.2%) |
| 35 to 44 Years | 8,746 (82.5%) | 210 (2.4%) |
| 45 to 54 Years | 10,532 (84.0%) | 263 (2.5%) |
| 55 to 59 Years | 5,500 (79.9%) | 55 (1.0%) |
| 60 to 64 Years | 3,721 (65.0%) | 97 (2.6%) |
| 65 to 74 Years | 2,570 (27.5%) | 113 (4.4%) |
| 75 Years and over | 401 (6.7%) | 10 (2.5%) |
| Total | 46,138 (64.5%) | 1,799 (3.9%) |
Employment Status by Educational Attainment in Troy
According to labor force statistics for Troy, 80.8% of individuals (36,291) out of the total population between 25 and 64 years of age (44,914) are in the labor force, with 2.5% or 907 of them being unemployed. The group with the highest labor force participation rate are those with the educational attainment of bachelor's degree or higher, with 84.9% or 26,086 individuals in the labor force. Within the labor force, individuals with less than high school education have the highest percentage of unemployment, with 8.7% or 45 of them being unemployed.
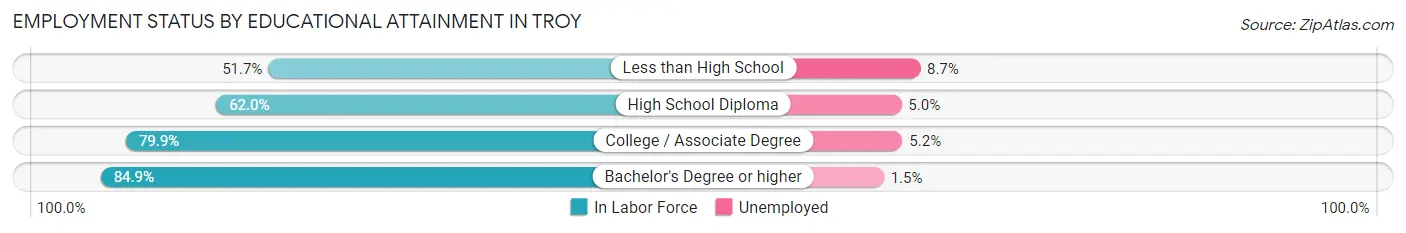
| Educational Attainment | In Labor Force | Unemployed |
| Less than High School | 519 (51.7%) | 87 (8.7%) |
| High School Diploma | 2,962 (62.0%) | 239 (5.0%) |
| College / Associate Degree | 6,717 (79.9%) | 437 (5.2%) |
| Bachelor's Degree or higher | 26,086 (84.9%) | 461 (1.5%) |
| Total | 36,291 (80.8%) | 1,123 (2.5%) |
Employment Occupations by Sex in Troy
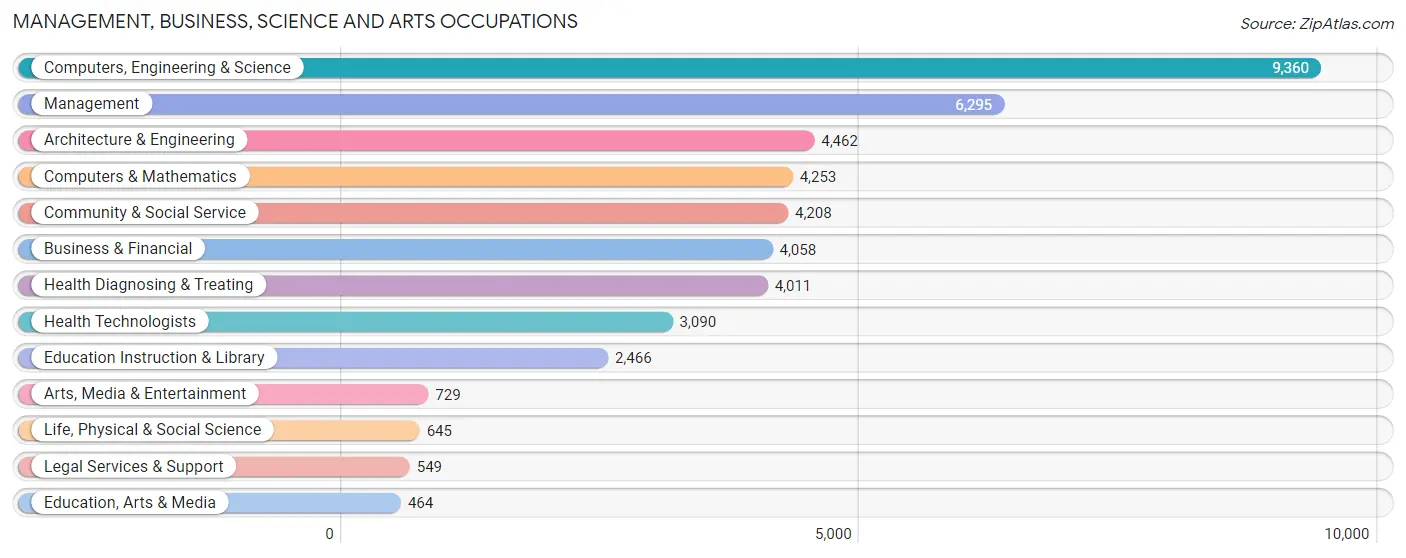
Management, Business, Science and Arts Occupations
The most common Management, Business, Science and Arts occupations in Troy are Computers, Engineering & Science (9,360 | 21.1%), Management (6,295 | 14.2%), Architecture & Engineering (4,462 | 10.1%), Computers & Mathematics (4,253 | 9.6%), and Community & Social Service (4,208 | 9.5%).
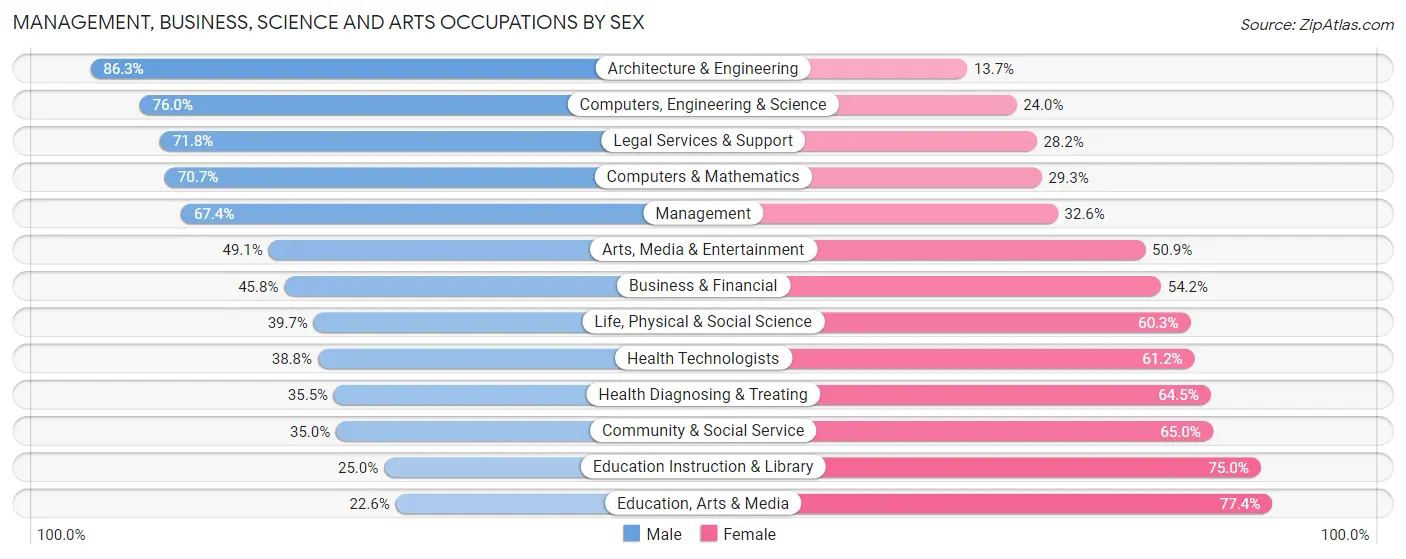
Management, Business, Science and Arts Occupations by Sex
Within the Management, Business, Science and Arts occupations in Troy, the most male-oriented occupations are Architecture & Engineering (86.3%), Computers, Engineering & Science (76.0%), and Legal Services & Support (71.8%), while the most female-oriented occupations are Education, Arts & Media (77.4%), Education Instruction & Library (75.0%), and Community & Social Service (65.0%).
| Occupation | Male | Female |
| Management | 4,241 (67.4%) | 2,054 (32.6%) |
| Business & Financial | 1,860 (45.8%) | 2,198 (54.2%) |
| Computers, Engineering & Science | 7,114 (76.0%) | 2,246 (24.0%) |
| Computers & Mathematics | 3,008 (70.7%) | 1,245 (29.3%) |
| Architecture & Engineering | 3,850 (86.3%) | 612 (13.7%) |
| Life, Physical & Social Science | 256 (39.7%) | 389 (60.3%) |
| Community & Social Service | 1,474 (35.0%) | 2,734 (65.0%) |
| Education, Arts & Media | 105 (22.6%) | 359 (77.4%) |
| Legal Services & Support | 394 (71.8%) | 155 (28.2%) |
| Education Instruction & Library | 617 (25.0%) | 1,849 (75.0%) |
| Arts, Media & Entertainment | 358 (49.1%) | 371 (50.9%) |
| Health Diagnosing & Treating | 1,423 (35.5%) | 2,588 (64.5%) |
| Health Technologists | 1,200 (38.8%) | 1,890 (61.2%) |
| Total (Category) | 16,112 (57.7%) | 11,820 (42.3%) |
| Total (Overall) | 25,222 (57.0%) | 19,030 (43.0%) |
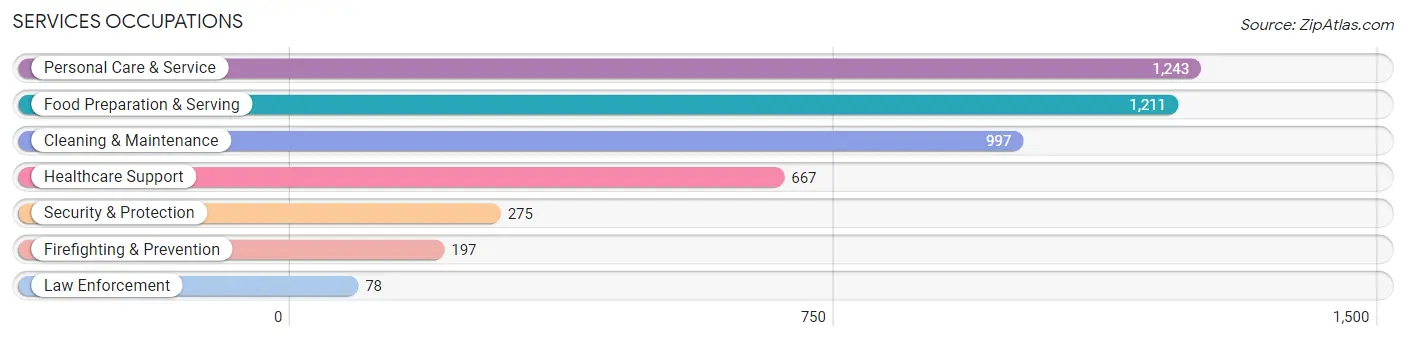
Services Occupations
The most common Services occupations in Troy are Personal Care & Service (1,243 | 2.8%), Food Preparation & Serving (1,211 | 2.7%), Cleaning & Maintenance (997 | 2.2%), Healthcare Support (667 | 1.5%), and Security & Protection (275 | 0.6%).
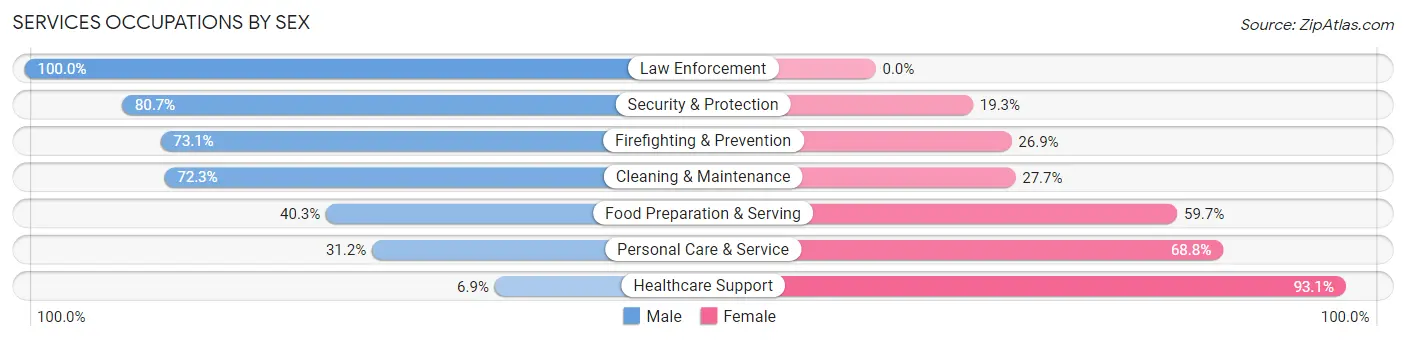
Services Occupations by Sex
Within the Services occupations in Troy, the most male-oriented occupations are Law Enforcement (100.0%), Security & Protection (80.7%), and Firefighting & Prevention (73.1%), while the most female-oriented occupations are Healthcare Support (93.1%), Personal Care & Service (68.8%), and Food Preparation & Serving (59.7%).
| Occupation | Male | Female |
| Healthcare Support | 46 (6.9%) | 621 (93.1%) |
| Security & Protection | 222 (80.7%) | 53 (19.3%) |
| Firefighting & Prevention | 144 (73.1%) | 53 (26.9%) |
| Law Enforcement | 78 (100.0%) | 0 (0.0%) |
| Food Preparation & Serving | 488 (40.3%) | 723 (59.7%) |
| Cleaning & Maintenance | 721 (72.3%) | 276 (27.7%) |
| Personal Care & Service | 388 (31.2%) | 855 (68.8%) |
| Total (Category) | 1,865 (42.4%) | 2,528 (57.6%) |
| Total (Overall) | 25,222 (57.0%) | 19,030 (43.0%) |
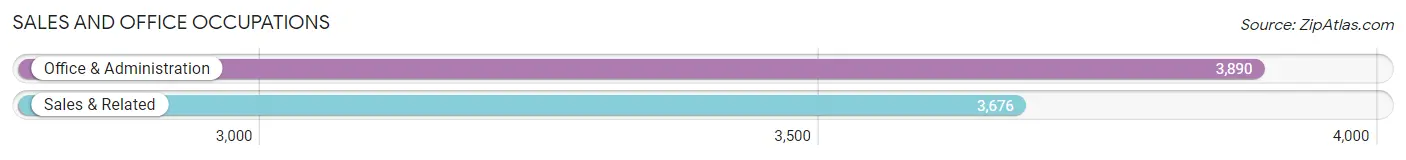
Sales and Office Occupations
The most common Sales and Office occupations in Troy are Office & Administration (3,890 | 8.8%), and Sales & Related (3,676 | 8.3%).
Sales and Office Occupations by Sex
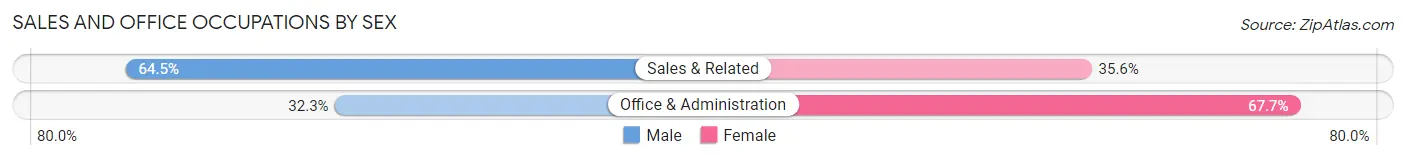
| Occupation | Male | Female |
| Sales & Related | 2,369 (64.4%) | 1,307 (35.5%) |
| Office & Administration | 1,258 (32.3%) | 2,632 (67.7%) |
| Total (Category) | 3,627 (47.9%) | 3,939 (52.1%) |
| Total (Overall) | 25,222 (57.0%) | 19,030 (43.0%) |
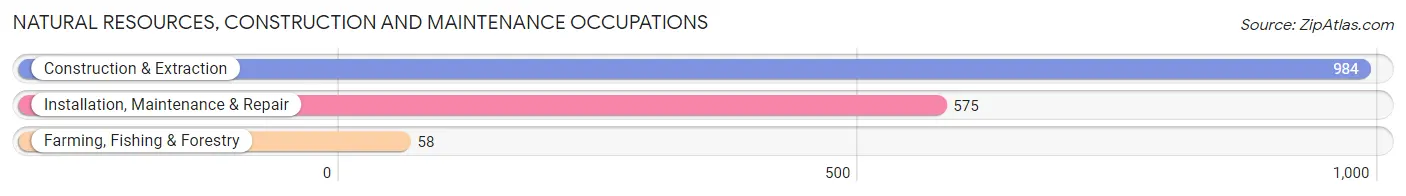
Natural Resources, Construction and Maintenance Occupations
The most common Natural Resources, Construction and Maintenance occupations in Troy are Construction & Extraction (984 | 2.2%), Installation, Maintenance & Repair (575 | 1.3%), and Farming, Fishing & Forestry (58 | 0.1%).
Natural Resources, Construction and Maintenance Occupations by Sex
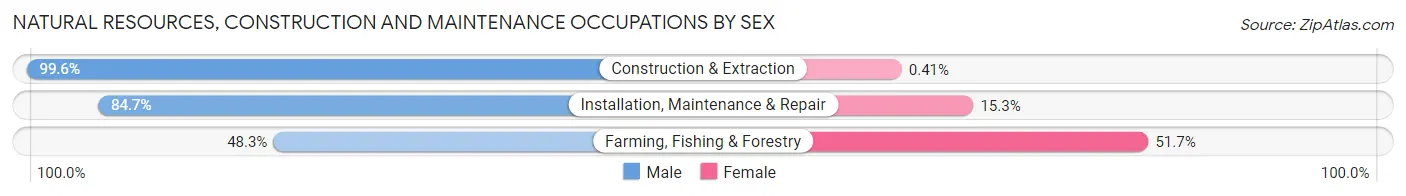
| Occupation | Male | Female |
| Farming, Fishing & Forestry | 28 (48.3%) | 30 (51.7%) |
| Construction & Extraction | 980 (99.6%) | 4 (0.4%) |
| Installation, Maintenance & Repair | 487 (84.7%) | 88 (15.3%) |
| Total (Category) | 1,495 (92.5%) | 122 (7.5%) |
| Total (Overall) | 25,222 (57.0%) | 19,030 (43.0%) |
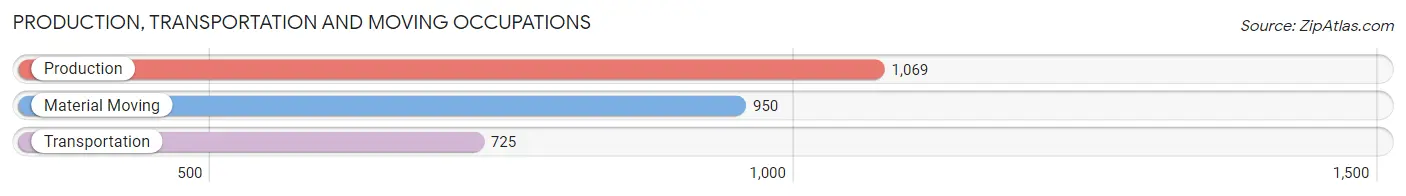
Production, Transportation and Moving Occupations
The most common Production, Transportation and Moving occupations in Troy are Production (1,069 | 2.4%), Material Moving (950 | 2.1%), and Transportation (725 | 1.6%).
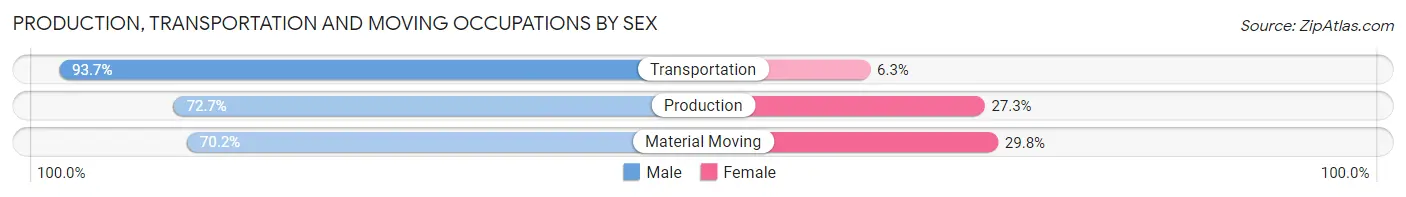
Production, Transportation and Moving Occupations by Sex
| Occupation | Male | Female |
| Production | 777 (72.7%) | 292 (27.3%) |
| Transportation | 679 (93.7%) | 46 (6.3%) |
| Material Moving | 667 (70.2%) | 283 (29.8%) |
| Total (Category) | 2,123 (77.4%) | 621 (22.6%) |
| Total (Overall) | 25,222 (57.0%) | 19,030 (43.0%) |
Employment Industries by Sex in Troy
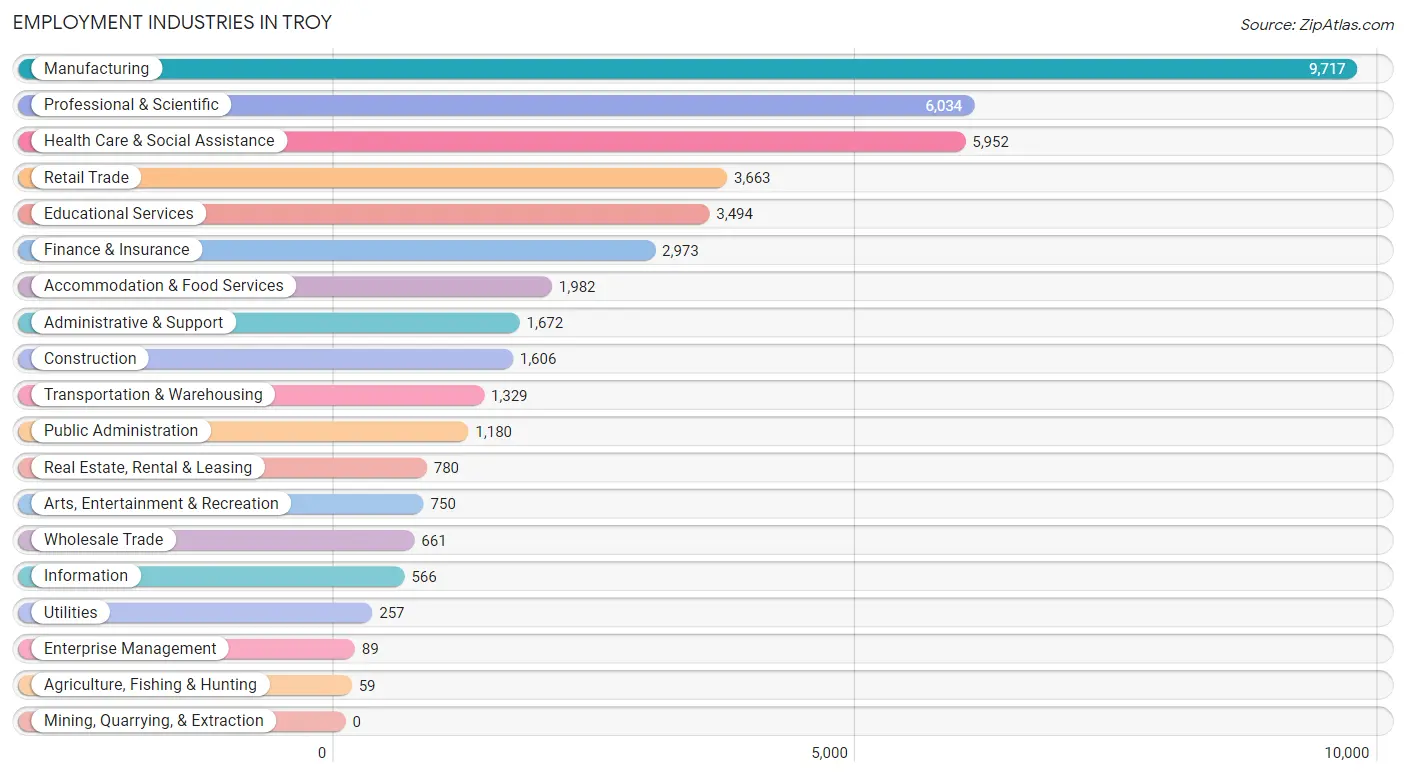
Employment Industries in Troy
The major employment industries in Troy include Manufacturing (9,717 | 22.0%), Professional & Scientific (6,034 | 13.6%), Health Care & Social Assistance (5,952 | 13.5%), Retail Trade (3,663 | 8.3%), and Educational Services (3,494 | 7.9%).
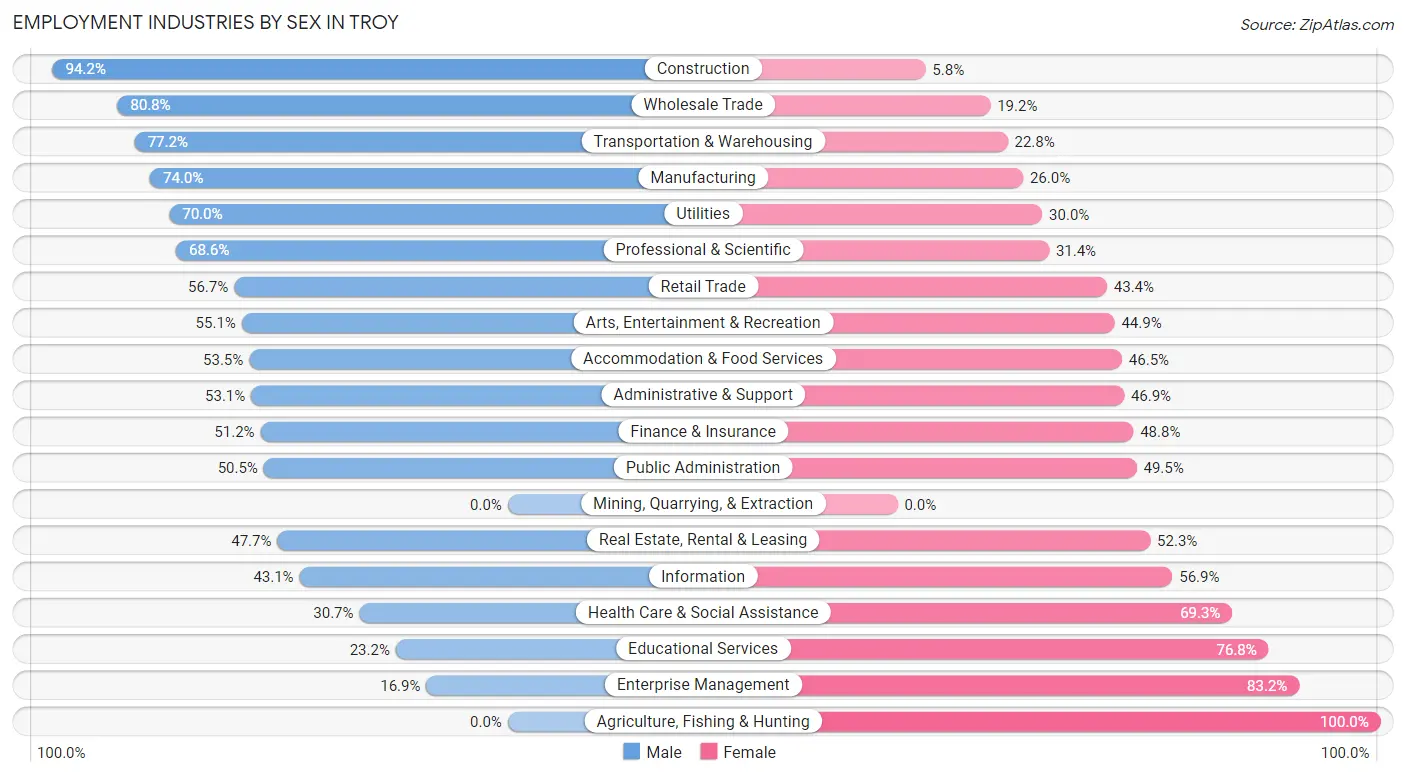
Employment Industries by Sex in Troy
The Troy industries that see more men than women are Construction (94.2%), Wholesale Trade (80.8%), and Transportation & Warehousing (77.2%), whereas the industries that tend to have a higher number of women are Agriculture, Fishing & Hunting (100.0%), Enterprise Management (83.2%), and Educational Services (76.8%).
| Industry | Male | Female |
| Agriculture, Fishing & Hunting | 0 (0.0%) | 59 (100.0%) |
| Mining, Quarrying, & Extraction | 0 (0.0%) | 0 (0.0%) |
| Construction | 1,513 (94.2%) | 93 (5.8%) |
| Manufacturing | 7,192 (74.0%) | 2,525 (26.0%) |
| Wholesale Trade | 534 (80.8%) | 127 (19.2%) |
| Retail Trade | 2,075 (56.7%) | 1,588 (43.3%) |
| Transportation & Warehousing | 1,026 (77.2%) | 303 (22.8%) |
| Utilities | 180 (70.0%) | 77 (30.0%) |
| Information | 244 (43.1%) | 322 (56.9%) |
| Finance & Insurance | 1,522 (51.2%) | 1,451 (48.8%) |
| Real Estate, Rental & Leasing | 372 (47.7%) | 408 (52.3%) |
| Professional & Scientific | 4,142 (68.6%) | 1,892 (31.4%) |
| Enterprise Management | 15 (16.9%) | 74 (83.2%) |
| Administrative & Support | 888 (53.1%) | 784 (46.9%) |
| Educational Services | 810 (23.2%) | 2,684 (76.8%) |
| Health Care & Social Assistance | 1,828 (30.7%) | 4,124 (69.3%) |
| Arts, Entertainment & Recreation | 413 (55.1%) | 337 (44.9%) |
| Accommodation & Food Services | 1,061 (53.5%) | 921 (46.5%) |
| Public Administration | 596 (50.5%) | 584 (49.5%) |
| Total | 25,222 (57.0%) | 19,030 (43.0%) |
Education in Troy
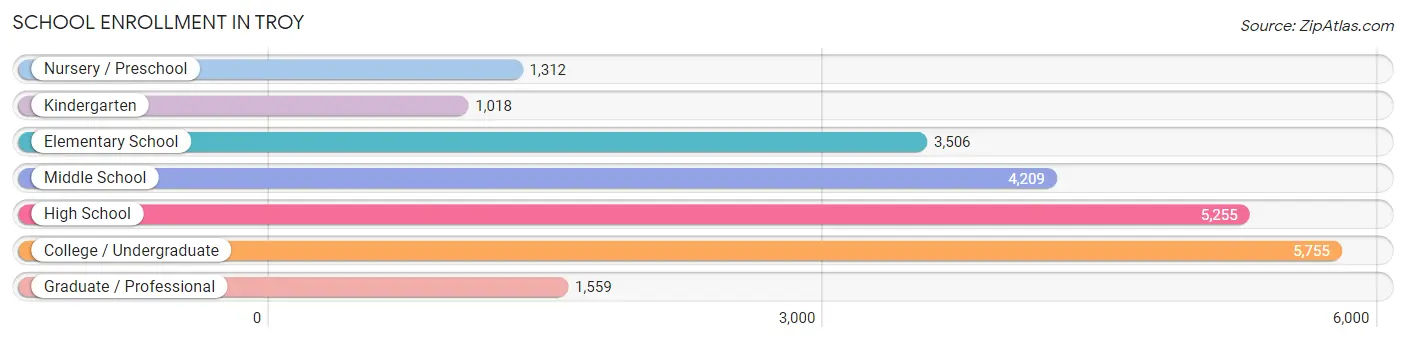
School Enrollment in Troy
The most common levels of schooling among the 22,614 students in Troy are college / undergraduate (5,755 | 25.5%), high school (5,255 | 23.2%), and middle school (4,209 | 18.6%).
| School Level | # Students | % Students |
| Nursery / Preschool | 1,312 | 5.8% |
| Kindergarten | 1,018 | 4.5% |
| Elementary School | 3,506 | 15.5% |
| Middle School | 4,209 | 18.6% |
| High School | 5,255 | 23.2% |
| College / Undergraduate | 5,755 | 25.5% |
| Graduate / Professional | 1,559 | 6.9% |
| Total | 22,614 | 100.0% |
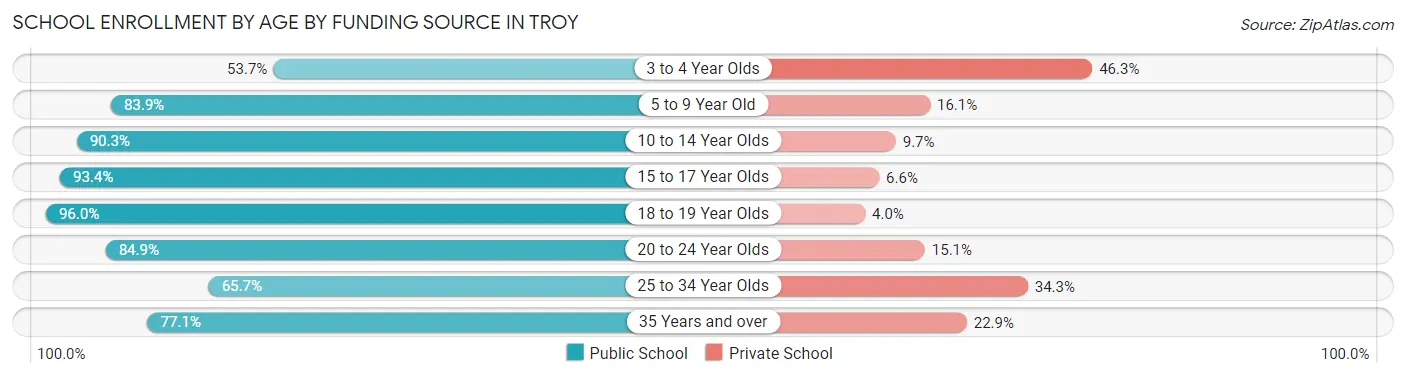
School Enrollment by Age by Funding Source in Troy
Out of a total of 22,614 students who are enrolled in schools in Troy, 3,279 (14.5%) attend a private institution, while the remaining 19,335 (85.5%) are enrolled in public schools. The age group of 3 to 4 year olds has the highest likelihood of being enrolled in private schools, with 501 (46.3% in the age bracket) enrolled. Conversely, the age group of 18 to 19 year olds has the lowest likelihood of being enrolled in a private school, with 1,662 (96.0% in the age bracket) attending a public institution.
| Age Bracket | Public School | Private School |
| 3 to 4 Year Olds | 581 (53.7%) | 501 (46.3%) |
| 5 to 9 Year Old | 3,620 (83.9%) | 694 (16.1%) |
| 10 to 14 Year Olds | 4,909 (90.3%) | 528 (9.7%) |
| 15 to 17 Year Olds | 3,671 (93.4%) | 260 (6.6%) |
| 18 to 19 Year Olds | 1,662 (96.0%) | 69 (4.0%) |
| 20 to 24 Year Olds | 3,307 (84.9%) | 589 (15.1%) |
| 25 to 34 Year Olds | 724 (65.7%) | 378 (34.3%) |
| 35 Years and over | 864 (77.1%) | 257 (22.9%) |
| Total | 19,335 (85.5%) | 3,279 (14.5%) |
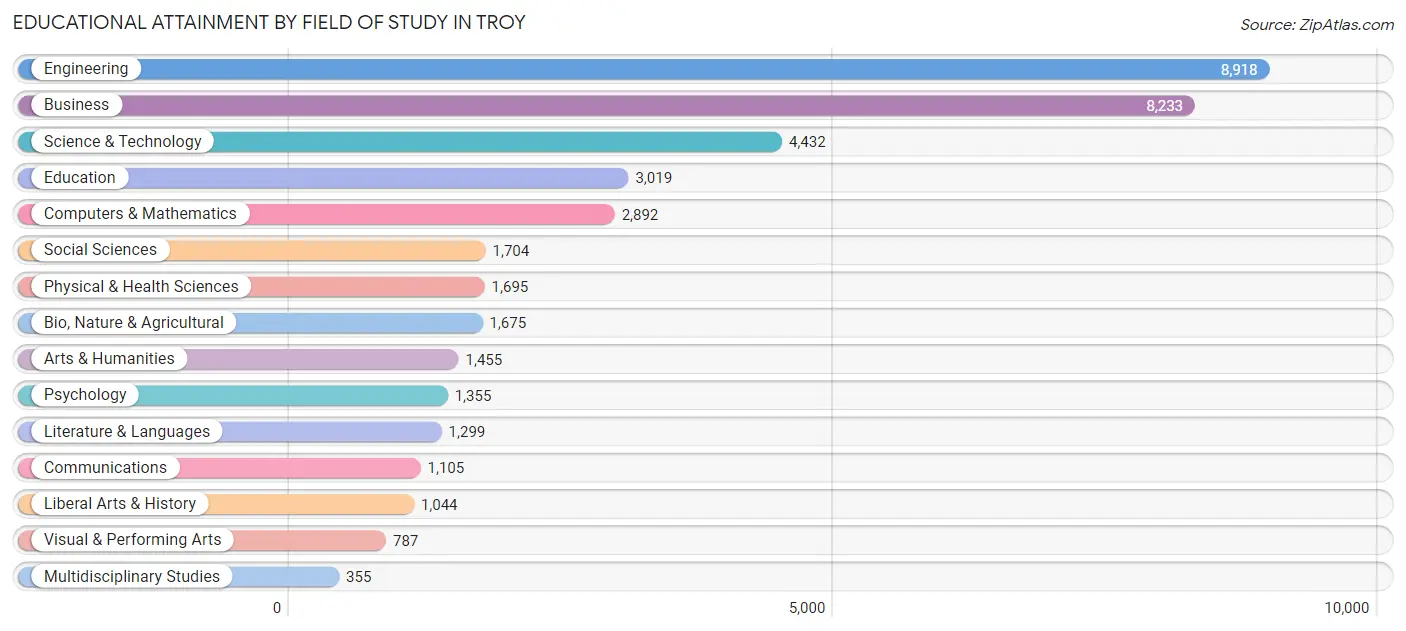
Educational Attainment by Field of Study in Troy
Engineering (8,918 | 22.3%), business (8,233 | 20.6%), science & technology (4,432 | 11.1%), education (3,019 | 7.5%), and computers & mathematics (2,892 | 7.2%) are the most common fields of study among 39,968 individuals in Troy who have obtained a bachelor's degree or higher.
| Field of Study | # Graduates | % Graduates |
| Computers & Mathematics | 2,892 | 7.2% |
| Bio, Nature & Agricultural | 1,675 | 4.2% |
| Physical & Health Sciences | 1,695 | 4.2% |
| Psychology | 1,355 | 3.4% |
| Social Sciences | 1,704 | 4.3% |
| Engineering | 8,918 | 22.3% |
| Multidisciplinary Studies | 355 | 0.9% |
| Science & Technology | 4,432 | 11.1% |
| Business | 8,233 | 20.6% |
| Education | 3,019 | 7.5% |
| Literature & Languages | 1,299 | 3.3% |
| Liberal Arts & History | 1,044 | 2.6% |
| Visual & Performing Arts | 787 | 2.0% |
| Communications | 1,105 | 2.8% |
| Arts & Humanities | 1,455 | 3.6% |
| Total | 39,968 | 100.0% |
Transportation & Commute in Troy
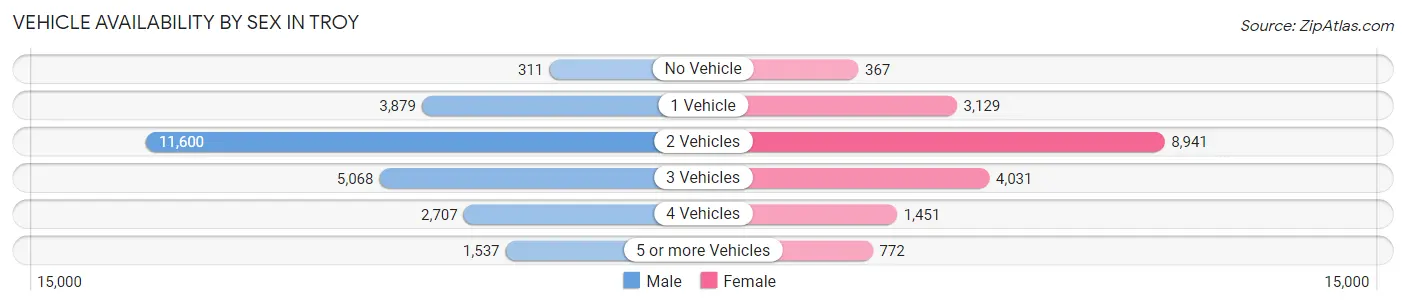
Vehicle Availability by Sex in Troy
The most prevalent vehicle ownership categories in Troy are males with 2 vehicles (11,600, accounting for 46.2%) and females with 2 vehicles (8,941, making up 62.1%).
| Vehicles Available | Male | Female |
| No Vehicle | 311 (1.2%) | 367 (2.0%) |
| 1 Vehicle | 3,879 (15.4%) | 3,129 (16.7%) |
| 2 Vehicles | 11,600 (46.2%) | 8,941 (47.8%) |
| 3 Vehicles | 5,068 (20.2%) | 4,031 (21.6%) |
| 4 Vehicles | 2,707 (10.8%) | 1,451 (7.8%) |
| 5 or more Vehicles | 1,537 (6.1%) | 772 (4.1%) |
| Total | 25,102 (100.0%) | 18,691 (100.0%) |
Commute Time in Troy
The most frequently occuring commute durations in Troy are 15 to 19 minutes (5,943 commuters, 16.5%), 20 to 24 minutes (5,653 commuters, 15.7%), and 10 to 14 minutes (5,297 commuters, 14.7%).
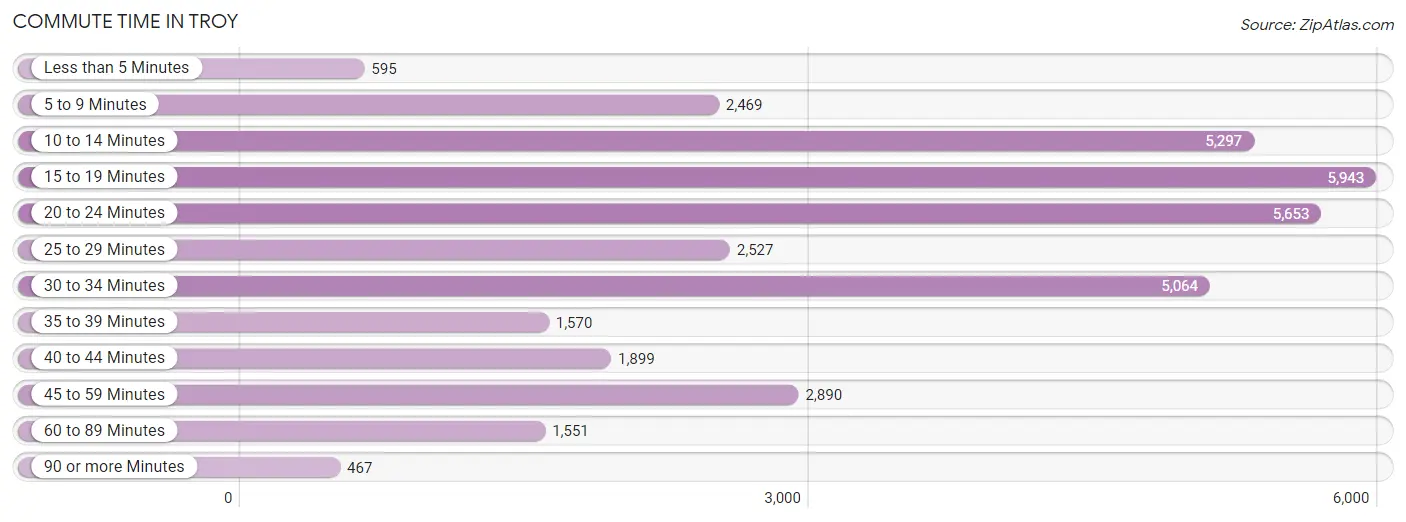
| Commute Time | # Commuters | % Commuters |
| Less than 5 Minutes | 595 | 1.7% |
| 5 to 9 Minutes | 2,469 | 6.9% |
| 10 to 14 Minutes | 5,297 | 14.7% |
| 15 to 19 Minutes | 5,943 | 16.5% |
| 20 to 24 Minutes | 5,653 | 15.7% |
| 25 to 29 Minutes | 2,527 | 7.0% |
| 30 to 34 Minutes | 5,064 | 14.1% |
| 35 to 39 Minutes | 1,570 | 4.4% |
| 40 to 44 Minutes | 1,899 | 5.3% |
| 45 to 59 Minutes | 2,890 | 8.0% |
| 60 to 89 Minutes | 1,551 | 4.3% |
| 90 or more Minutes | 467 | 1.3% |
Commute Time by Sex in Troy
The most common commute times in Troy are 20 to 24 minutes (3,365 commuters, 16.5%) for males and 15 to 19 minutes (2,754 commuters, 17.7%) for females.
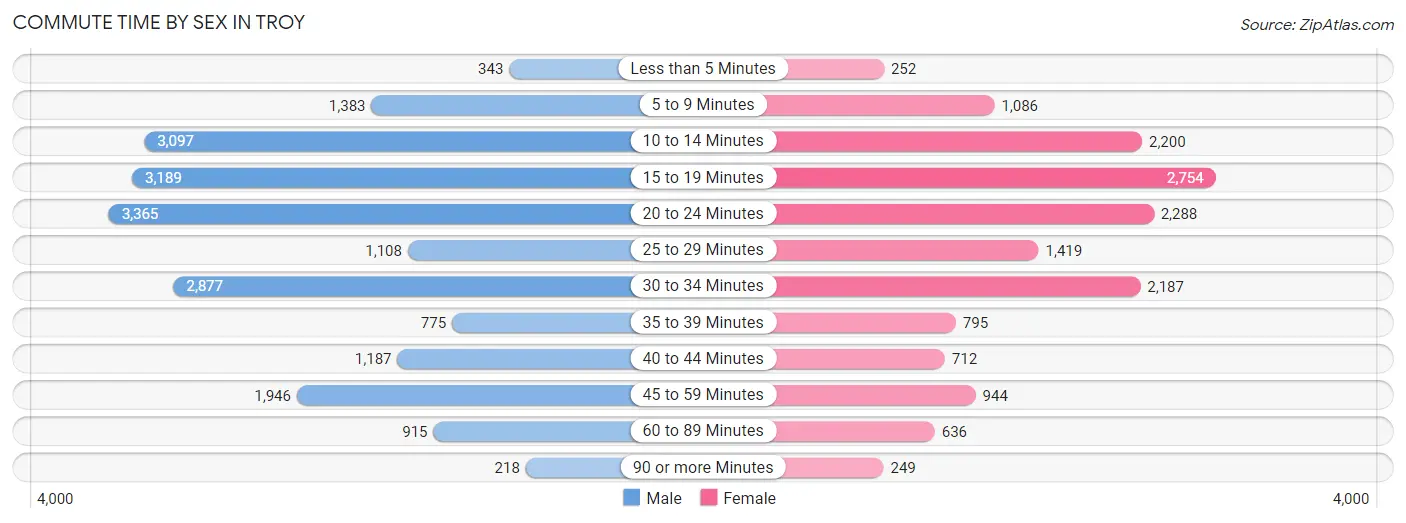
| Commute Time | Male | Female |
| Less than 5 Minutes | 343 (1.7%) | 252 (1.6%) |
| 5 to 9 Minutes | 1,383 (6.8%) | 1,086 (7.0%) |
| 10 to 14 Minutes | 3,097 (15.2%) | 2,200 (14.2%) |
| 15 to 19 Minutes | 3,189 (15.6%) | 2,754 (17.7%) |
| 20 to 24 Minutes | 3,365 (16.5%) | 2,288 (14.7%) |
| 25 to 29 Minutes | 1,108 (5.4%) | 1,419 (9.1%) |
| 30 to 34 Minutes | 2,877 (14.1%) | 2,187 (14.1%) |
| 35 to 39 Minutes | 775 (3.8%) | 795 (5.1%) |
| 40 to 44 Minutes | 1,187 (5.8%) | 712 (4.6%) |
| 45 to 59 Minutes | 1,946 (9.5%) | 944 (6.1%) |
| 60 to 89 Minutes | 915 (4.5%) | 636 (4.1%) |
| 90 or more Minutes | 218 (1.1%) | 249 (1.6%) |
Time of Departure to Work by Sex in Troy
The most frequent times of departure to work in Troy are 8:00 AM to 8:29 AM (3,684, 18.1%) for males and 7:30 AM to 7:59 AM (2,290, 14.7%) for females.
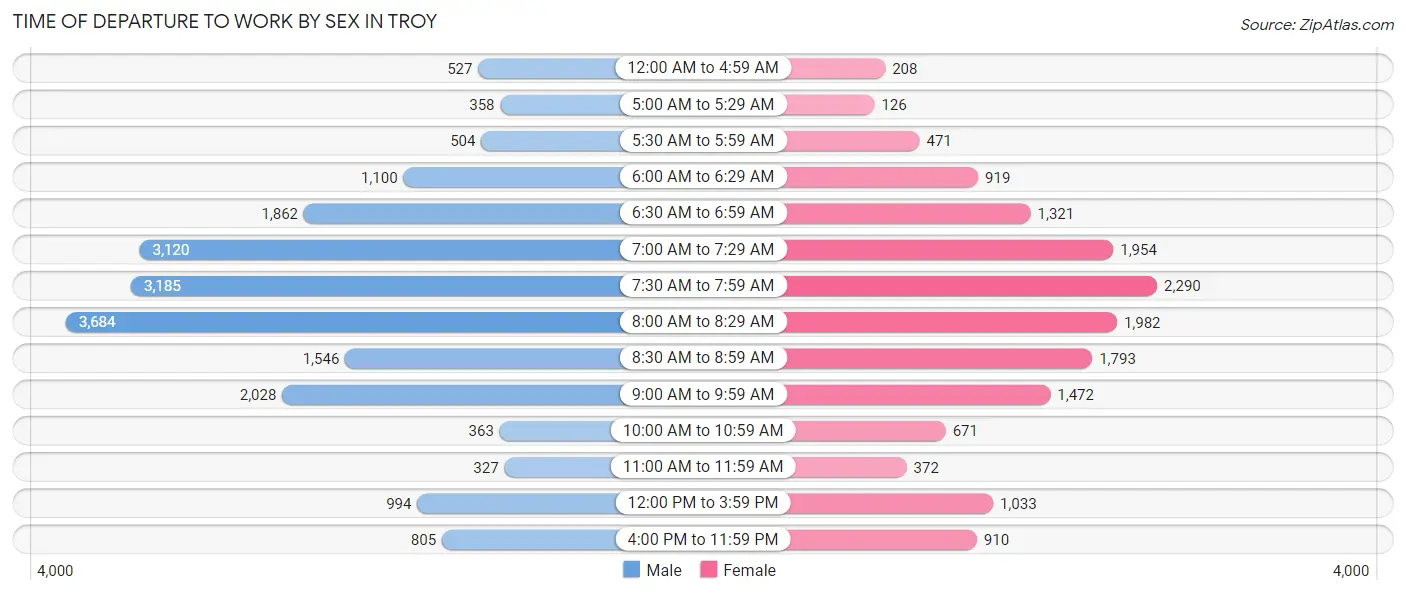
| Time of Departure | Male | Female |
| 12:00 AM to 4:59 AM | 527 (2.6%) | 208 (1.3%) |
| 5:00 AM to 5:29 AM | 358 (1.8%) | 126 (0.8%) |
| 5:30 AM to 5:59 AM | 504 (2.5%) | 471 (3.0%) |
| 6:00 AM to 6:29 AM | 1,100 (5.4%) | 919 (5.9%) |
| 6:30 AM to 6:59 AM | 1,862 (9.1%) | 1,321 (8.5%) |
| 7:00 AM to 7:29 AM | 3,120 (15.3%) | 1,954 (12.6%) |
| 7:30 AM to 7:59 AM | 3,185 (15.6%) | 2,290 (14.7%) |
| 8:00 AM to 8:29 AM | 3,684 (18.1%) | 1,982 (12.8%) |
| 8:30 AM to 8:59 AM | 1,546 (7.6%) | 1,793 (11.6%) |
| 9:00 AM to 9:59 AM | 2,028 (9.9%) | 1,472 (9.5%) |
| 10:00 AM to 10:59 AM | 363 (1.8%) | 671 (4.3%) |
| 11:00 AM to 11:59 AM | 327 (1.6%) | 372 (2.4%) |
| 12:00 PM to 3:59 PM | 994 (4.9%) | 1,033 (6.7%) |
| 4:00 PM to 11:59 PM | 805 (4.0%) | 910 (5.9%) |
| Total | 20,403 (100.0%) | 15,522 (100.0%) |
Housing Occupancy in Troy
Occupancy by Ownership in Troy
Of the total 33,000 dwellings in Troy, owner-occupied units account for 24,761 (75.0%), while renter-occupied units make up 8,239 (25.0%).
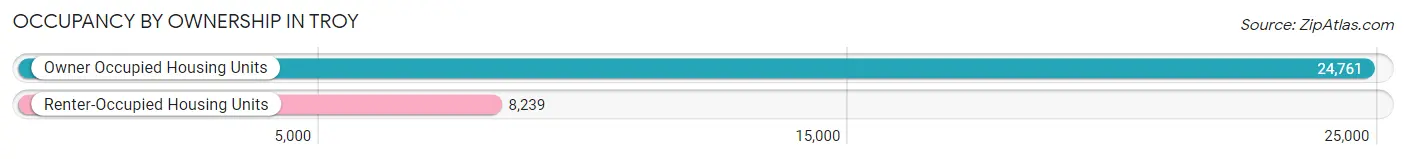
| Occupancy | # Housing Units | % Housing Units |
| Owner Occupied Housing Units | 24,761 | 75.0% |
| Renter-Occupied Housing Units | 8,239 | 25.0% |
| Total Occupied Housing Units | 33,000 | 100.0% |
Occupancy by Household Size in Troy
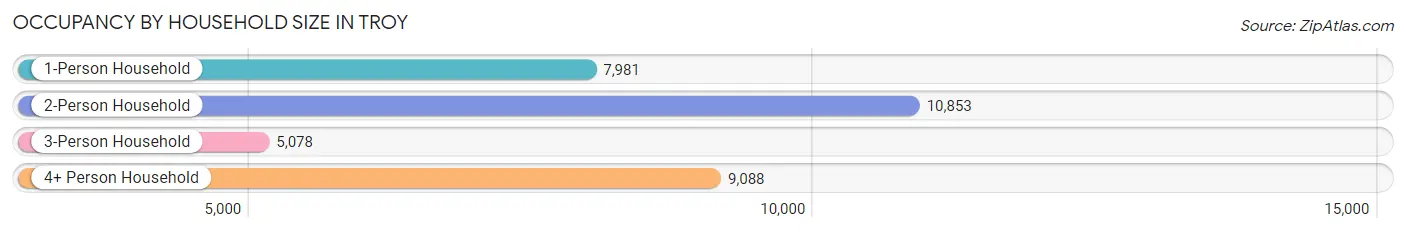
| Household Size | # Housing Units | % Housing Units |
| 1-Person Household | 7,981 | 24.2% |
| 2-Person Household | 10,853 | 32.9% |
| 3-Person Household | 5,078 | 15.4% |
| 4+ Person Household | 9,088 | 27.5% |
| Total Housing Units | 33,000 | 100.0% |
Occupancy by Ownership by Household Size in Troy
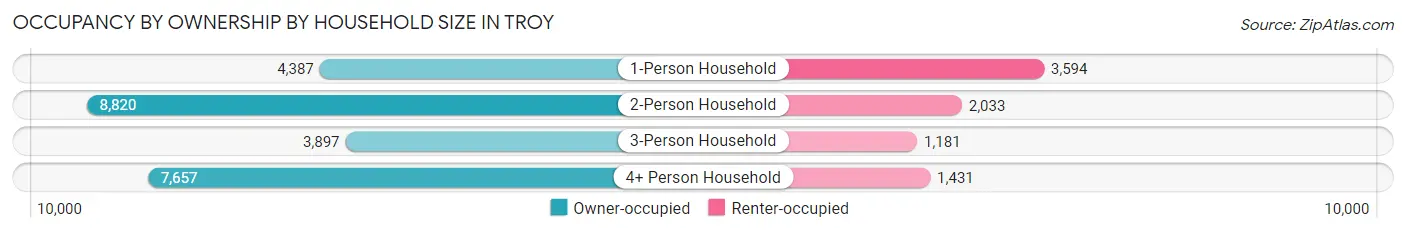
| Household Size | Owner-occupied | Renter-occupied |
| 1-Person Household | 4,387 (55.0%) | 3,594 (45.0%) |
| 2-Person Household | 8,820 (81.3%) | 2,033 (18.7%) |
| 3-Person Household | 3,897 (76.7%) | 1,181 (23.3%) |
| 4+ Person Household | 7,657 (84.3%) | 1,431 (15.8%) |
| Total Housing Units | 24,761 (75.0%) | 8,239 (25.0%) |
Occupancy by Educational Attainment in Troy
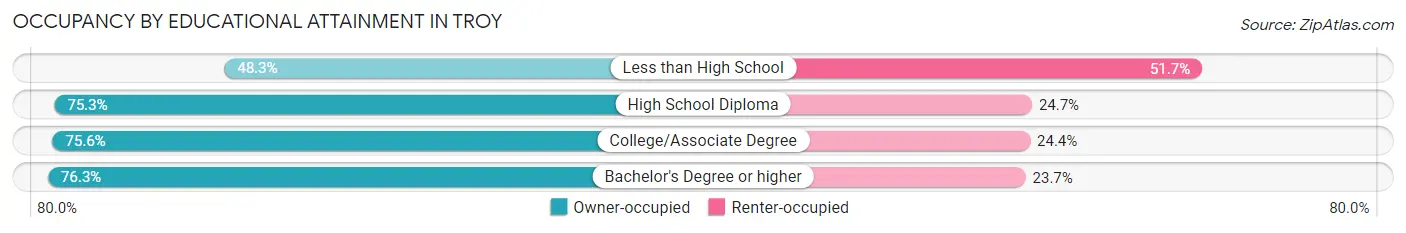
| Household Size | Owner-occupied | Renter-occupied |
| Less than High School | 575 (48.3%) | 615 (51.7%) |
| High School Diploma | 2,718 (75.3%) | 892 (24.7%) |
| College/Associate Degree | 5,027 (75.6%) | 1,624 (24.4%) |
| Bachelor's Degree or higher | 16,441 (76.3%) | 5,108 (23.7%) |
Occupancy by Age of Householder in Troy
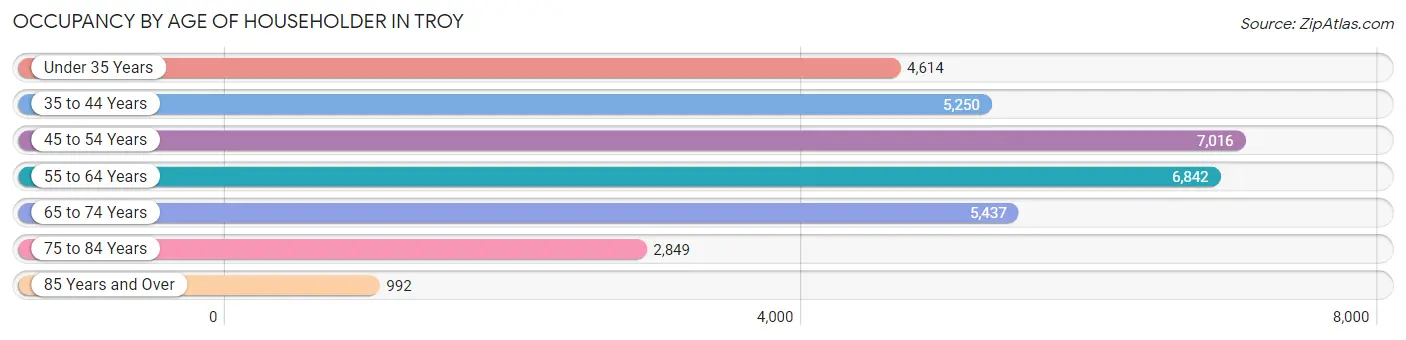
| Age Bracket | # Households | % Households |
| Under 35 Years | 4,614 | 14.0% |
| 35 to 44 Years | 5,250 | 15.9% |
| 45 to 54 Years | 7,016 | 21.3% |
| 55 to 64 Years | 6,842 | 20.7% |
| 65 to 74 Years | 5,437 | 16.5% |
| 75 to 84 Years | 2,849 | 8.6% |
| 85 Years and Over | 992 | 3.0% |
| Total | 33,000 | 100.0% |
Housing Finances in Troy
Median Income by Occupancy in Troy
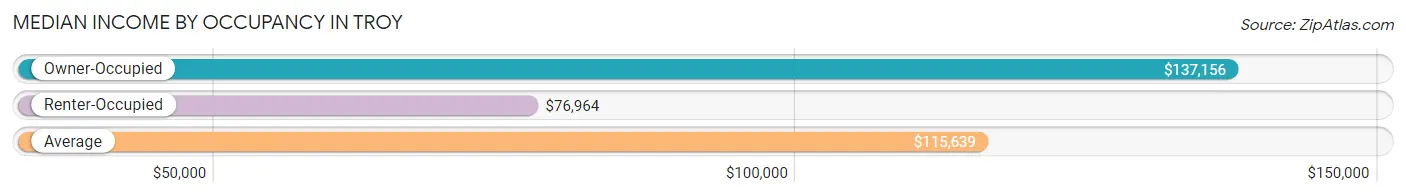
| Occupancy Type | # Households | Median Income |
| Owner-Occupied | 24,761 (75.0%) | $137,156 |
| Renter-Occupied | 8,239 (25.0%) | $76,964 |
| Average | 33,000 (100.0%) | $115,639 |
Occupancy by Householder Income Bracket in Troy
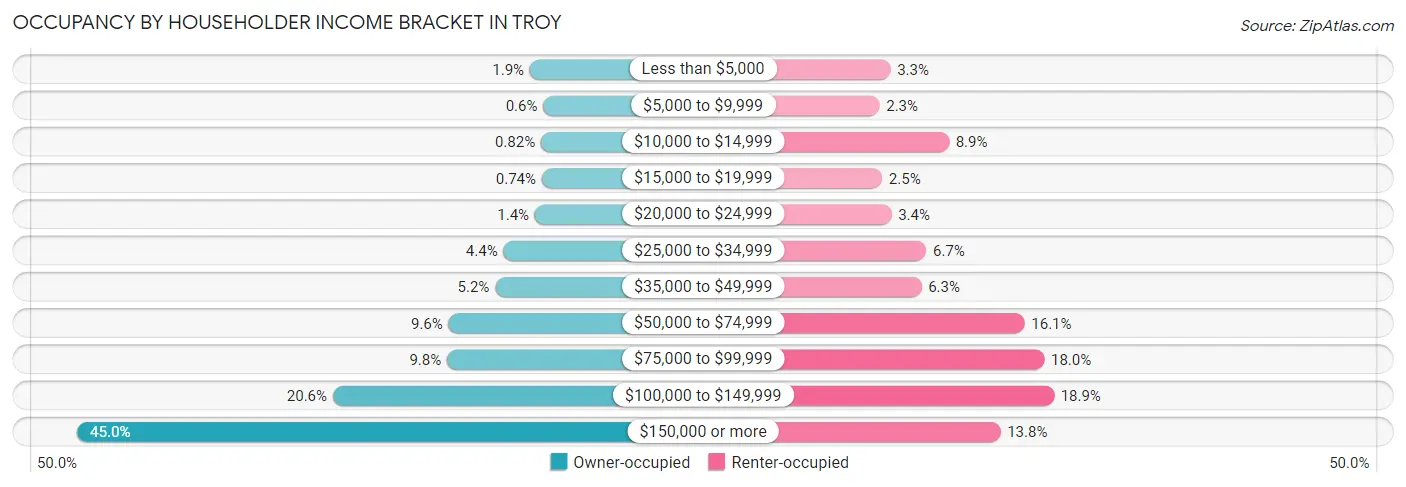
| Income Bracket | Owner-occupied | Renter-occupied |
| Less than $5,000 | 462 (1.9%) | 272 (3.3%) |
| $5,000 to $9,999 | 148 (0.6%) | 186 (2.3%) |
| $10,000 to $14,999 | 202 (0.8%) | 731 (8.9%) |
| $15,000 to $19,999 | 182 (0.7%) | 207 (2.5%) |
| $20,000 to $24,999 | 346 (1.4%) | 280 (3.4%) |
| $25,000 to $34,999 | 1,086 (4.4%) | 554 (6.7%) |
| $35,000 to $49,999 | 1,283 (5.2%) | 515 (6.2%) |
| $50,000 to $74,999 | 2,381 (9.6%) | 1,325 (16.1%) |
| $75,000 to $99,999 | 2,419 (9.8%) | 1,479 (17.9%) |
| $100,000 to $149,999 | 5,111 (20.6%) | 1,555 (18.9%) |
| $150,000 or more | 11,141 (45.0%) | 1,135 (13.8%) |
| Total | 24,761 (100.0%) | 8,239 (100.0%) |
Monthly Housing Cost Tiers in Troy
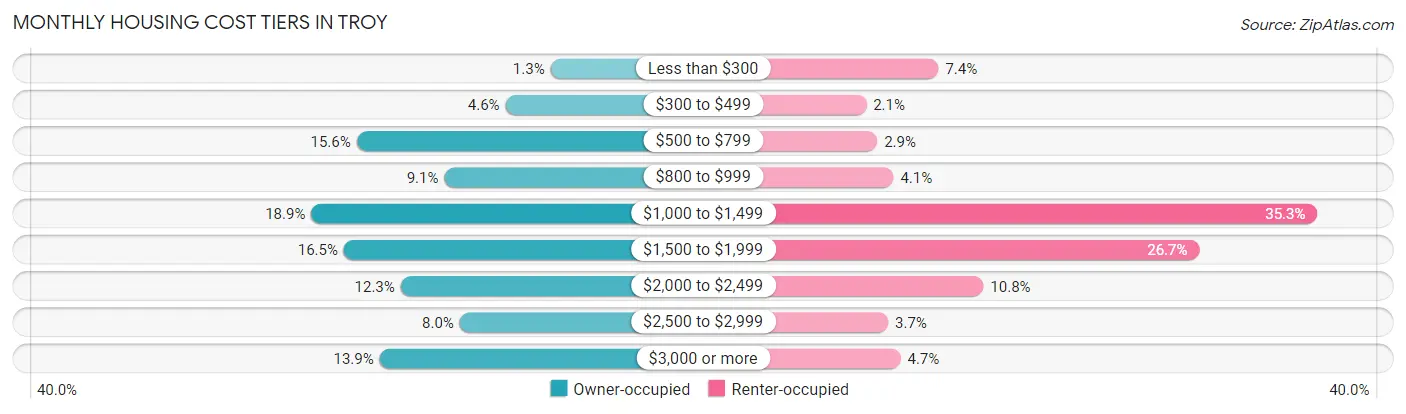
| Monthly Cost | Owner-occupied | Renter-occupied |
| Less than $300 | 314 (1.3%) | 613 (7.4%) |
| $300 to $499 | 1,136 (4.6%) | 175 (2.1%) |
| $500 to $799 | 3,850 (15.5%) | 241 (2.9%) |
| $800 to $999 | 2,250 (9.1%) | 340 (4.1%) |
| $1,000 to $1,499 | 4,677 (18.9%) | 2,912 (35.3%) |
| $1,500 to $1,999 | 4,082 (16.5%) | 2,196 (26.7%) |
| $2,000 to $2,499 | 3,049 (12.3%) | 886 (10.7%) |
| $2,500 to $2,999 | 1,970 (8.0%) | 307 (3.7%) |
| $3,000 or more | 3,433 (13.9%) | 383 (4.6%) |
| Total | 24,761 (100.0%) | 8,239 (100.0%) |
Physical Housing Characteristics in Troy
Housing Structures in Troy
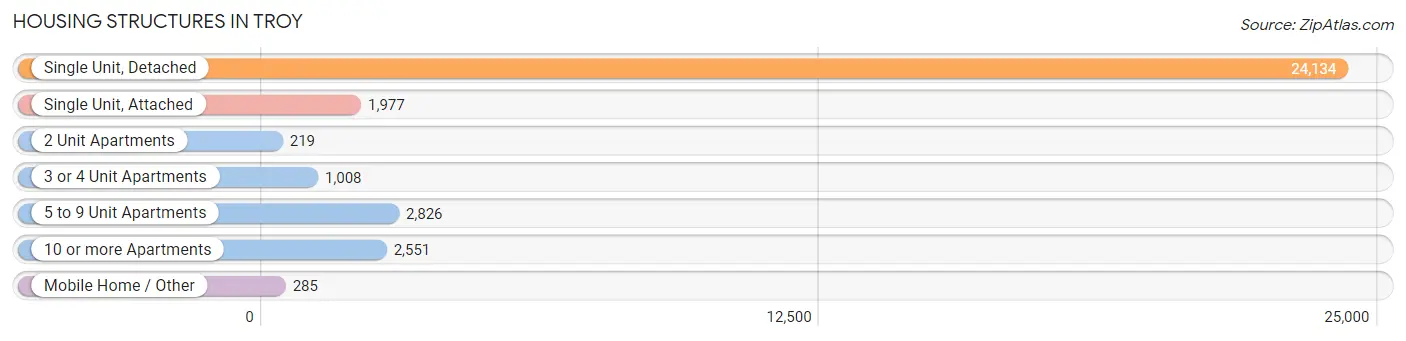
| Structure Type | # Housing Units | % Housing Units |
| Single Unit, Detached | 24,134 | 73.1% |
| Single Unit, Attached | 1,977 | 6.0% |
| 2 Unit Apartments | 219 | 0.7% |
| 3 or 4 Unit Apartments | 1,008 | 3.0% |
| 5 to 9 Unit Apartments | 2,826 | 8.6% |
| 10 or more Apartments | 2,551 | 7.7% |
| Mobile Home / Other | 285 | 0.9% |
| Total | 33,000 | 100.0% |
Housing Structures by Occupancy in Troy
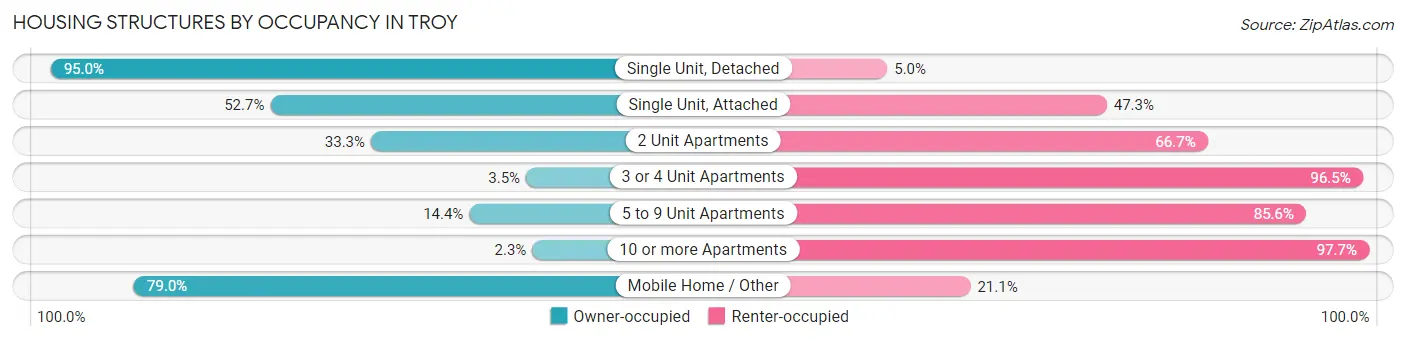
| Structure Type | Owner-occupied | Renter-occupied |
| Single Unit, Detached | 22,921 (95.0%) | 1,213 (5.0%) |
| Single Unit, Attached | 1,042 (52.7%) | 935 (47.3%) |
| 2 Unit Apartments | 73 (33.3%) | 146 (66.7%) |
| 3 or 4 Unit Apartments | 35 (3.5%) | 973 (96.5%) |
| 5 to 9 Unit Apartments | 407 (14.4%) | 2,419 (85.6%) |
| 10 or more Apartments | 58 (2.3%) | 2,493 (97.7%) |
| Mobile Home / Other | 225 (78.9%) | 60 (21.0%) |
| Total | 24,761 (75.0%) | 8,239 (25.0%) |
Housing Structures by Number of Rooms in Troy
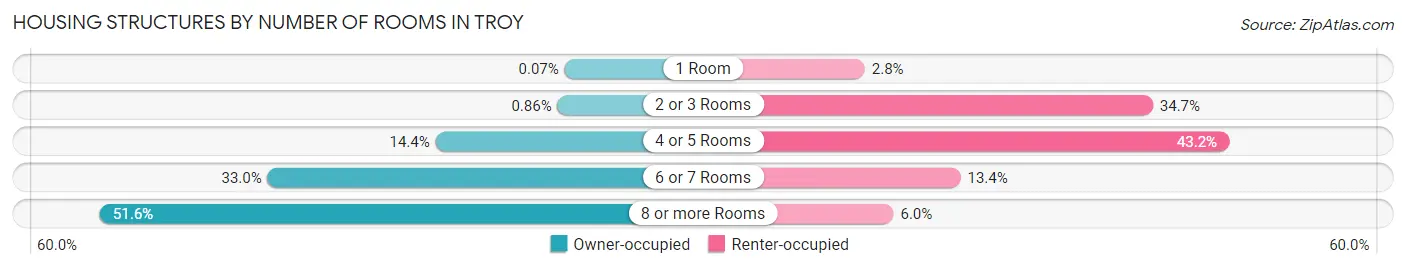
| Number of Rooms | Owner-occupied | Renter-occupied |
| 1 Room | 18 (0.1%) | 228 (2.8%) |
| 2 or 3 Rooms | 214 (0.9%) | 2,861 (34.7%) |
| 4 or 5 Rooms | 3,563 (14.4%) | 3,557 (43.2%) |
| 6 or 7 Rooms | 8,180 (33.0%) | 1,103 (13.4%) |
| 8 or more Rooms | 12,786 (51.6%) | 490 (5.9%) |
| Total | 24,761 (100.0%) | 8,239 (100.0%) |
Housing Structure by Heating Type in Troy
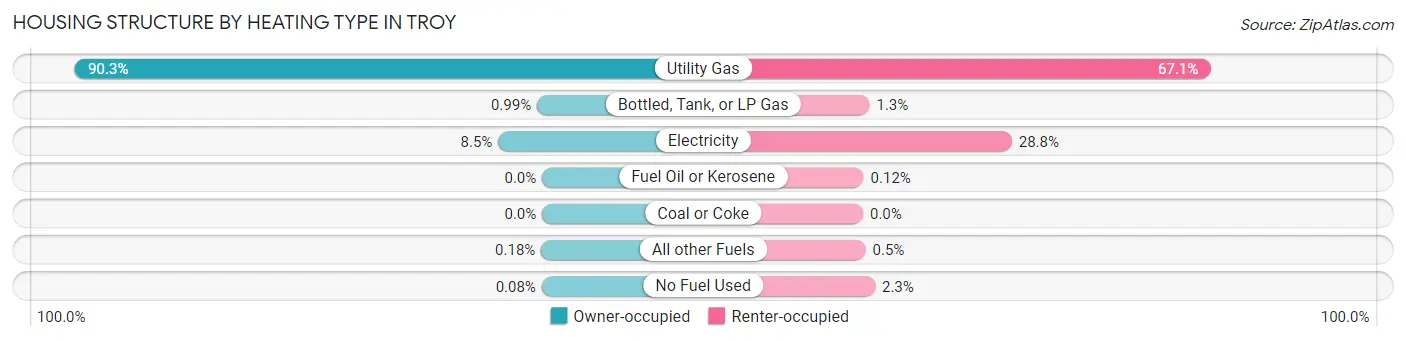
| Heating Type | Owner-occupied | Renter-occupied |
| Utility Gas | 22,349 (90.3%) | 5,525 (67.1%) |
| Bottled, Tank, or LP Gas | 246 (1.0%) | 104 (1.3%) |
| Electricity | 2,101 (8.5%) | 2,369 (28.7%) |
| Fuel Oil or Kerosene | 0 (0.0%) | 10 (0.1%) |
| Coal or Coke | 0 (0.0%) | 0 (0.0%) |
| All other Fuels | 45 (0.2%) | 41 (0.5%) |
| No Fuel Used | 20 (0.1%) | 190 (2.3%) |
| Total | 24,761 (100.0%) | 8,239 (100.0%) |
Household Vehicle Usage in Troy
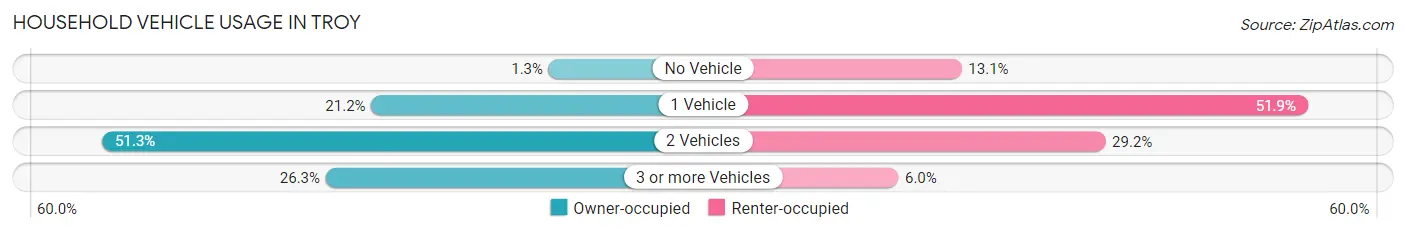
| Vehicles per Household | Owner-occupied | Renter-occupied |
| No Vehicle | 314 (1.3%) | 1,075 (13.1%) |
| 1 Vehicle | 5,236 (21.1%) | 4,272 (51.8%) |
| 2 Vehicles | 12,711 (51.3%) | 2,402 (29.1%) |
| 3 or more Vehicles | 6,500 (26.3%) | 490 (5.9%) |
| Total | 24,761 (100.0%) | 8,239 (100.0%) |
Real Estate & Mortgages in Troy
Real Estate and Mortgage Overview in Troy
| Characteristic | Without Mortgage | With Mortgage |
| Housing Units | 9,016 | 15,745 |
| Median Property Value | $356,000 | $387,800 |
| Median Household Income | $106,628 | $8,073 |
| Monthly Housing Costs | $766 | $3,417 |
| Real Estate Taxes | $4,598 | $141 |
Property Value by Mortgage Status in Troy
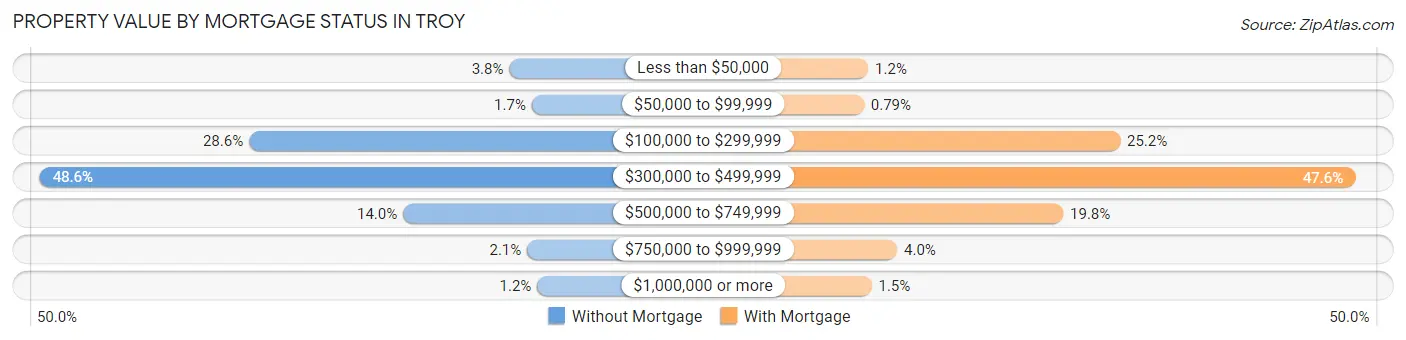
| Property Value | Without Mortgage | With Mortgage |
| Less than $50,000 | 346 (3.8%) | 189 (1.2%) |
| $50,000 to $99,999 | 153 (1.7%) | 124 (0.8%) |
| $100,000 to $299,999 | 2,581 (28.6%) | 3,966 (25.2%) |
| $300,000 to $499,999 | 4,378 (48.6%) | 7,489 (47.6%) |
| $500,000 to $749,999 | 1,259 (14.0%) | 3,113 (19.8%) |
| $750,000 to $999,999 | 193 (2.1%) | 624 (4.0%) |
| $1,000,000 or more | 106 (1.2%) | 240 (1.5%) |
| Total | 9,016 (100.0%) | 15,745 (100.0%) |
Household Income by Mortgage Status in Troy
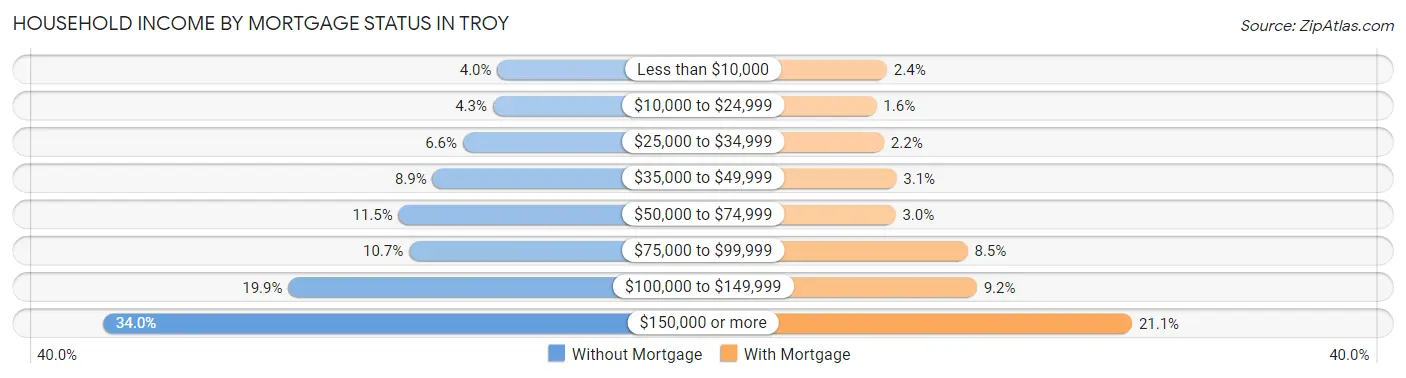
| Household Income | Without Mortgage | With Mortgage |
| Less than $10,000 | 359 (4.0%) | 377 (2.4%) |
| $10,000 to $24,999 | 390 (4.3%) | 251 (1.6%) |
| $25,000 to $34,999 | 596 (6.6%) | 340 (2.2%) |
| $35,000 to $49,999 | 804 (8.9%) | 490 (3.1%) |
| $50,000 to $74,999 | 1,038 (11.5%) | 479 (3.0%) |
| $75,000 to $99,999 | 966 (10.7%) | 1,343 (8.5%) |
| $100,000 to $149,999 | 1,795 (19.9%) | 1,453 (9.2%) |
| $150,000 or more | 3,068 (34.0%) | 3,316 (21.1%) |
| Total | 9,016 (100.0%) | 15,745 (100.0%) |
Property Value to Household Income Ratio in Troy
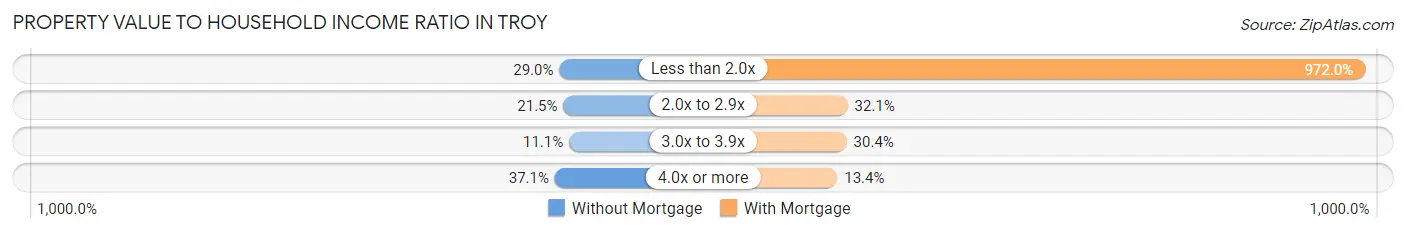
| Value-to-Income Ratio | Without Mortgage | With Mortgage |
| Less than 2.0x | 2,614 (29.0%) | 153,038 (972.0%) |
| 2.0x to 2.9x | 1,941 (21.5%) | 5,046 (32.1%) |
| 3.0x to 3.9x | 1,004 (11.1%) | 4,787 (30.4%) |
| 4.0x or more | 3,343 (37.1%) | 2,113 (13.4%) |
| Total | 9,016 (100.0%) | 15,745 (100.0%) |
Real Estate Taxes by Mortgage Status in Troy

| Property Taxes | Without Mortgage | With Mortgage |
| Less than $800 | 128 (1.4%) | 58 (0.4%) |
| $800 to $1,499 | 153 (1.7%) | 181 (1.1%) |
| $800 to $1,499 | 8,375 (92.9%) | 323 (2.1%) |
| Total | 9,016 (100.0%) | 15,745 (100.0%) |
Health & Disability in Troy
Health Insurance Coverage by Age in Troy
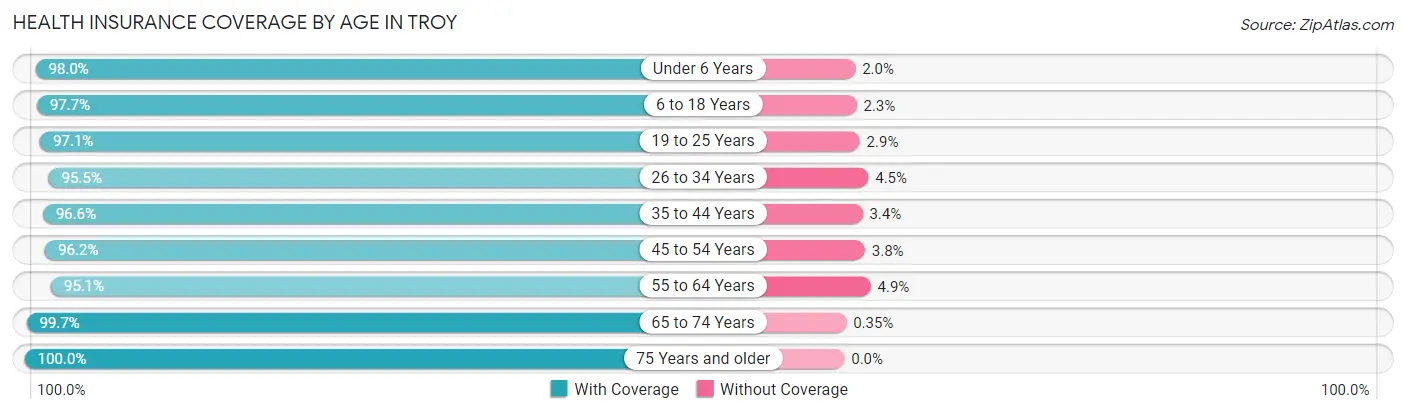
| Age Bracket | With Coverage | Without Coverage |
| Under 6 Years | 4,979 (98.0%) | 103 (2.0%) |
| 6 to 18 Years | 13,786 (97.7%) | 321 (2.3%) |
| 19 to 25 Years | 8,534 (97.1%) | 252 (2.9%) |
| 26 to 34 Years | 7,689 (95.5%) | 360 (4.5%) |
| 35 to 44 Years | 10,237 (96.6%) | 359 (3.4%) |
| 45 to 54 Years | 12,045 (96.2%) | 480 (3.8%) |
| 55 to 64 Years | 11,968 (95.1%) | 616 (4.9%) |
| 65 to 74 Years | 9,310 (99.7%) | 33 (0.4%) |
| 75 Years and older | 5,878 (100.0%) | 0 (0.0%) |
| Total | 84,426 (97.1%) | 2,524 (2.9%) |
Health Insurance Coverage by Citizenship Status in Troy
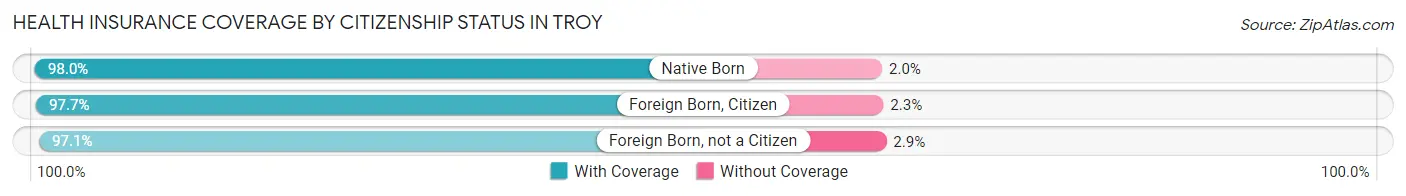
| Citizenship Status | With Coverage | Without Coverage |
| Native Born | 4,979 (98.0%) | 103 (2.0%) |
| Foreign Born, Citizen | 13,786 (97.7%) | 321 (2.3%) |
| Foreign Born, not a Citizen | 8,534 (97.1%) | 252 (2.9%) |
Health Insurance Coverage by Household Income in Troy
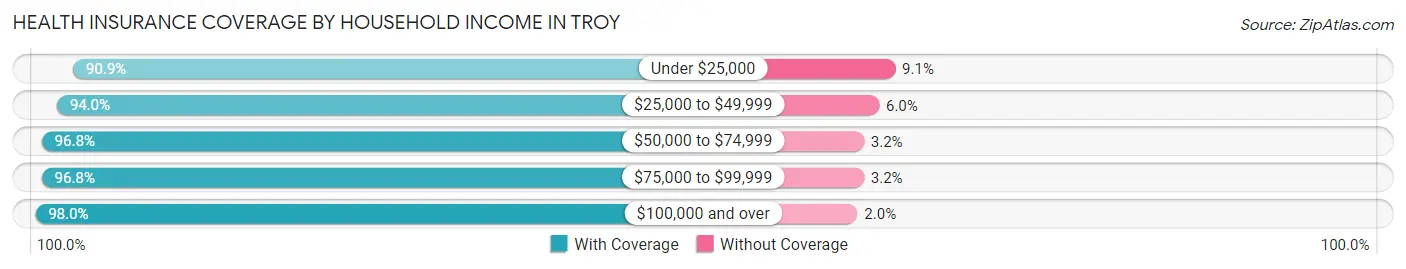
| Household Income | With Coverage | Without Coverage |
| Under $25,000 | 4,254 (90.9%) | 424 (9.1%) |
| $25,000 to $49,999 | 6,041 (94.0%) | 388 (6.0%) |
| $50,000 to $74,999 | 7,351 (96.8%) | 243 (3.2%) |
| $75,000 to $99,999 | 8,787 (96.8%) | 290 (3.2%) |
| $100,000 and over | 57,857 (98.0%) | 1,176 (2.0%) |
Public vs Private Health Insurance Coverage by Age in Troy
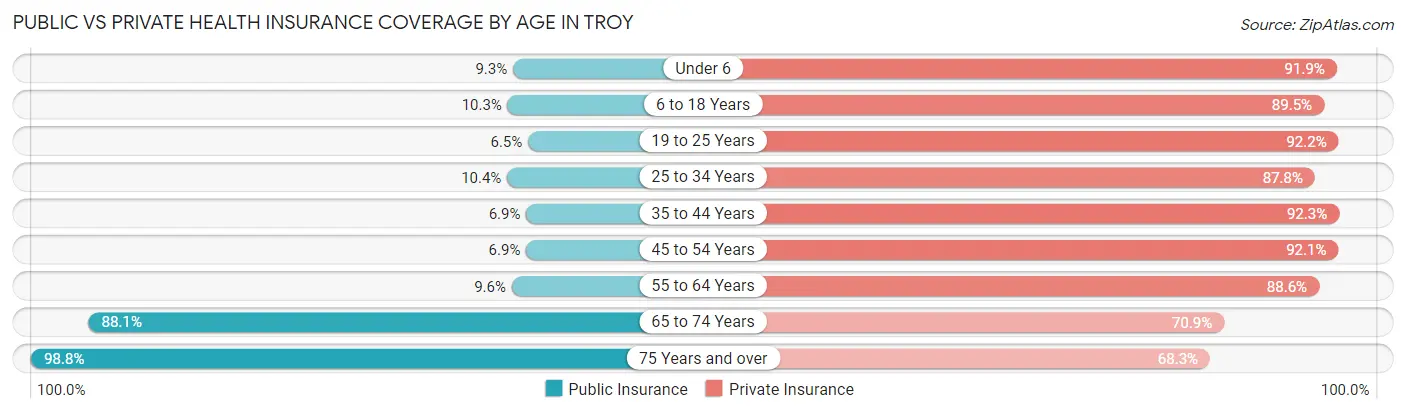
| Age Bracket | Public Insurance | Private Insurance |
| Under 6 | 474 (9.3%) | 4,668 (91.8%) |
| 6 to 18 Years | 1,457 (10.3%) | 12,623 (89.5%) |
| 19 to 25 Years | 575 (6.5%) | 8,100 (92.2%) |
| 25 to 34 Years | 839 (10.4%) | 7,066 (87.8%) |
| 35 to 44 Years | 728 (6.9%) | 9,778 (92.3%) |
| 45 to 54 Years | 863 (6.9%) | 11,541 (92.1%) |
| 55 to 64 Years | 1,204 (9.6%) | 11,143 (88.5%) |
| 65 to 74 Years | 8,233 (88.1%) | 6,628 (70.9%) |
| 75 Years and over | 5,808 (98.8%) | 4,016 (68.3%) |
| Total | 20,181 (23.2%) | 75,563 (86.9%) |
Disability Status by Sex by Age in Troy
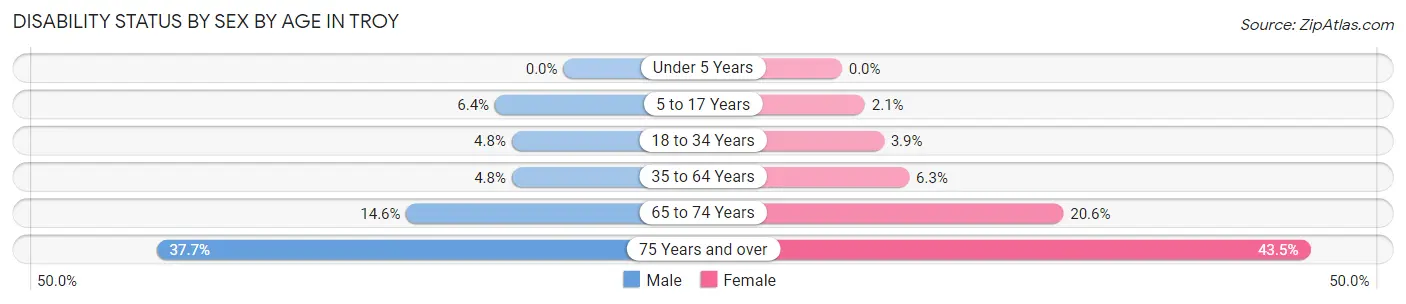
| Age Bracket | Male | Female |
| Under 5 Years | 0 (0.0%) | 0 (0.0%) |
| 5 to 17 Years | 481 (6.4%) | 137 (2.1%) |
| 18 to 34 Years | 479 (4.8%) | 310 (3.9%) |
| 35 to 64 Years | 852 (4.8%) | 1,117 (6.2%) |
| 65 to 74 Years | 621 (14.6%) | 1,045 (20.6%) |
| 75 Years and over | 1,056 (37.7%) | 1,339 (43.5%) |
Disability Class by Sex by Age in Troy
Disability Class: Hearing Difficulty
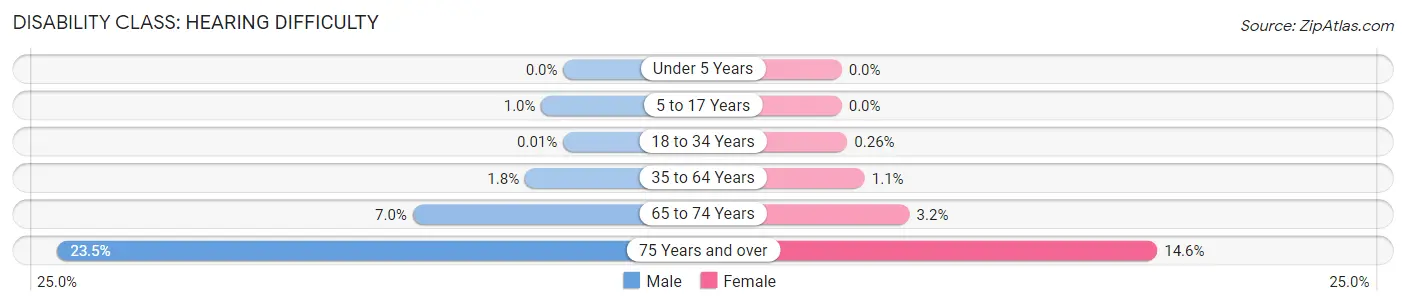
| Age Bracket | Male | Female |
| Under 5 Years | 0 (0.0%) | 0 (0.0%) |
| 5 to 17 Years | 77 (1.0%) | 0 (0.0%) |
| 18 to 34 Years | 1 (0.0%) | 21 (0.3%) |
| 35 to 64 Years | 318 (1.8%) | 192 (1.1%) |
| 65 to 74 Years | 298 (7.0%) | 160 (3.2%) |
| 75 Years and over | 657 (23.5%) | 451 (14.6%) |
Disability Class: Vision Difficulty
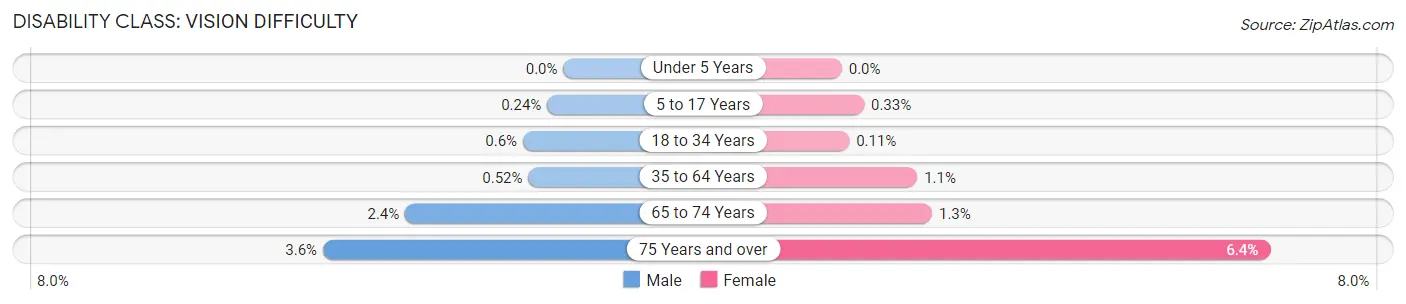
| Age Bracket | Male | Female |
| Under 5 Years | 0 (0.0%) | 0 (0.0%) |
| 5 to 17 Years | 18 (0.2%) | 21 (0.3%) |
| 18 to 34 Years | 60 (0.6%) | 9 (0.1%) |
| 35 to 64 Years | 93 (0.5%) | 200 (1.1%) |
| 65 to 74 Years | 100 (2.4%) | 68 (1.3%) |
| 75 Years and over | 100 (3.6%) | 196 (6.4%) |
Disability Class: Cognitive Difficulty
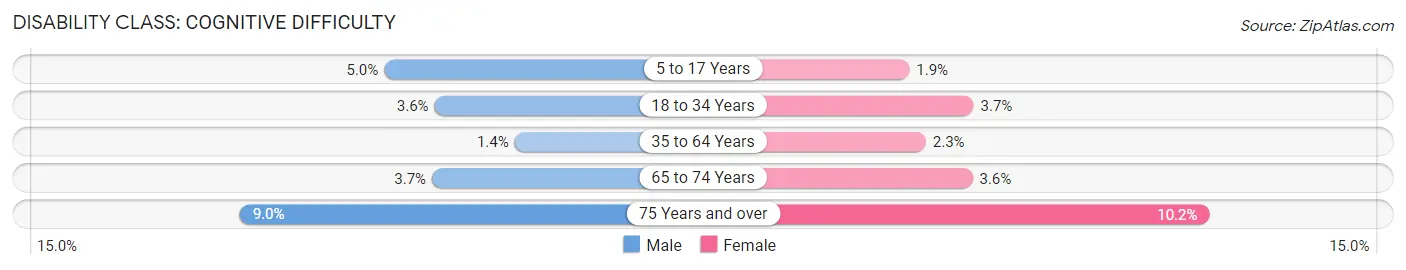
| Age Bracket | Male | Female |
| 5 to 17 Years | 378 (5.0%) | 120 (1.9%) |
| 18 to 34 Years | 359 (3.6%) | 292 (3.7%) |
| 35 to 64 Years | 243 (1.4%) | 419 (2.3%) |
| 65 to 74 Years | 156 (3.7%) | 185 (3.6%) |
| 75 Years and over | 252 (9.0%) | 315 (10.2%) |
Disability Class: Ambulatory Difficulty
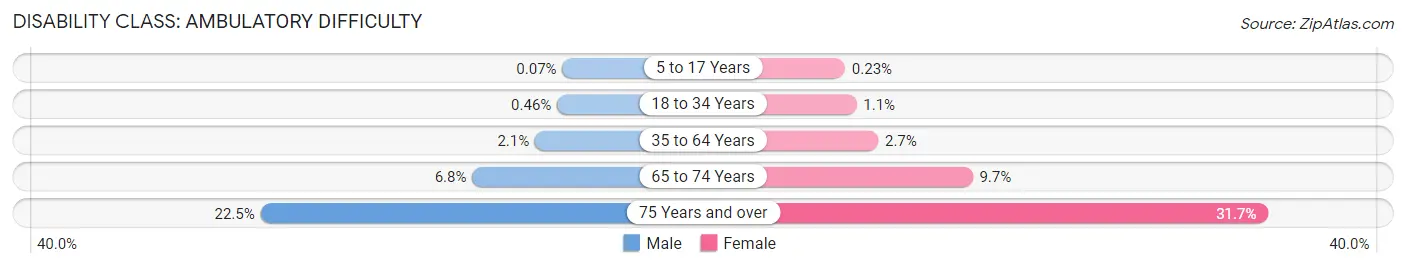
| Age Bracket | Male | Female |
| 5 to 17 Years | 5 (0.1%) | 15 (0.2%) |
| 18 to 34 Years | 46 (0.5%) | 86 (1.1%) |
| 35 to 64 Years | 374 (2.1%) | 481 (2.7%) |
| 65 to 74 Years | 288 (6.8%) | 493 (9.7%) |
| 75 Years and over | 629 (22.5%) | 975 (31.7%) |
Disability Class: Self-Care Difficulty
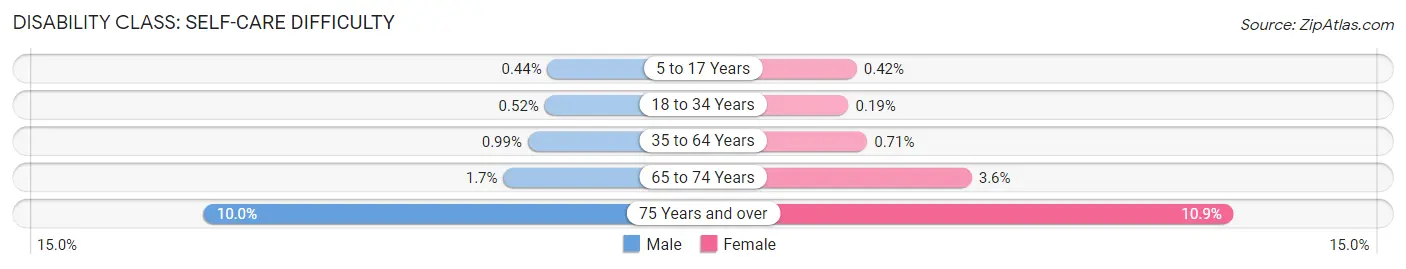
| Age Bracket | Male | Female |
| 5 to 17 Years | 33 (0.4%) | 27 (0.4%) |
| 18 to 34 Years | 52 (0.5%) | 15 (0.2%) |
| 35 to 64 Years | 177 (1.0%) | 127 (0.7%) |
| 65 to 74 Years | 71 (1.7%) | 184 (3.6%) |
| 75 Years and over | 280 (10.0%) | 336 (10.9%) |
Technology Access in Troy
Computing Device Access in Troy
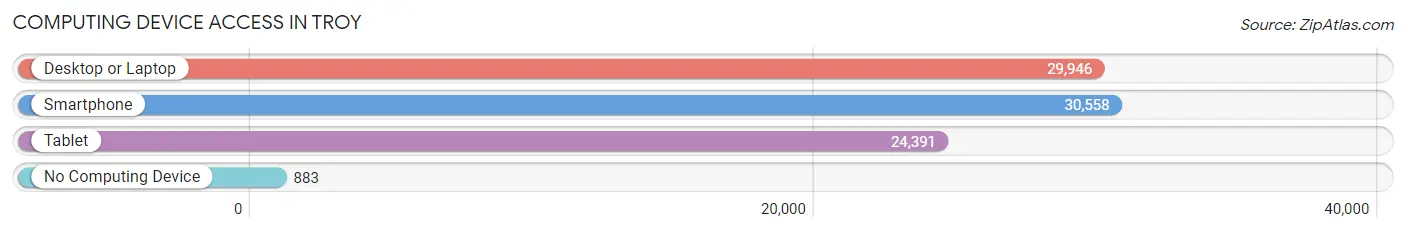
| Device Type | # Households | % Households |
| Desktop or Laptop | 29,946 | 90.7% |
| Smartphone | 30,558 | 92.6% |
| Tablet | 24,391 | 73.9% |
| No Computing Device | 883 | 2.7% |
| Total | 33,000 | 100.0% |
Internet Access in Troy
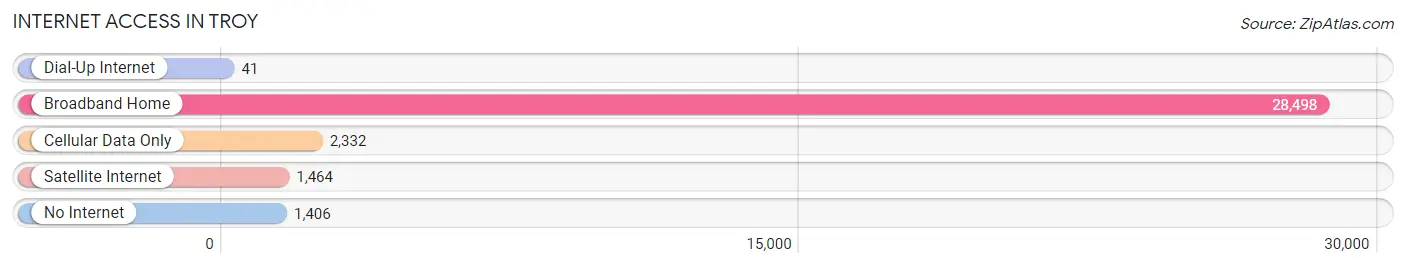
| Internet Type | # Households | % Households |
| Dial-Up Internet | 41 | 0.1% |
| Broadband Home | 28,498 | 86.4% |
| Cellular Data Only | 2,332 | 7.1% |
| Satellite Internet | 1,464 | 4.4% |
| No Internet | 1,406 | 4.3% |
| Total | 33,000 | 100.0% |
Troy Summary
Troy, Michigan is a city located in Oakland County, Michigan, United States. It is a suburb of Detroit and is part of the Metro Detroit area. As of the 2010 census, the city had a total population of 80,980, making it the 11th-largest city in Michigan by population. Troy is home to a variety of businesses, including the headquarters of Fortune 500 companies such as Delphi Automotive, Flagstar Bank, and Kelly Services.
History
Troy was first settled in 1819 by European settlers, who named it Troy Township after the city of Troy, New York. The township was incorporated in 1827 and became a village in 1867. In 1955, Troy was incorporated as a city.
Troy has a long history of manufacturing and industry. In the late 19th century, the city was home to several large manufacturing companies, including the Troy Iron and Steel Company, the Troy Carriage Works, and the Troy Stove Works. In the early 20th century, the city was home to the Detroit Stove Works, which manufactured stoves and other home appliances.
Geography
Troy is located in southeastern Michigan, about 25 miles north of Detroit. It is bordered by the cities of Clawson, Royal Oak, Madison Heights, and Birmingham. The city is situated on the banks of the Clinton River, which flows through the city.
Troy has a total area of 33.2 square miles, of which 32.9 square miles is land and 0.3 square miles is water. The city is located in the Huron-Clinton Metropolitan Authority, which includes the cities of Troy, Bloomfield Hills, and West Bloomfield.
Economy
Troy is home to a variety of businesses, including the headquarters of Fortune 500 companies such as Delphi Automotive, Flagstar Bank, and Kelly Services. The city is also home to several large shopping centers, including the Oakland Mall and the Somerset Collection.
Troy is also home to several large medical centers, including the Beaumont Hospital Troy, the St. John Providence Medical Center, and the William Beaumont Hospital Troy. The city is also home to several large educational institutions, including the University of Michigan-Troy, Oakland University, and Walsh College.
Demographics
As of the 2010 census, the city had a total population of 80,980. The racial makeup of the city was 79.2% White, 8.2% African American, 0.3% Native American, 8.2% Asian, 0.1% Pacific Islander, 1.3% from other races, and 2.9% from two or more races. Hispanic or Latino of any race were 4.2% of the population.
The median income for a household in the city was $76,824, and the median income for a family was $90,917. The per capita income for the city was $37,945. About 4.2% of families and 6.2% of the population were below the poverty line, including 8.2% of those under age 18 and 4.2% of those age 65 or over.
Common Questions
What is Per Capita Income in Troy?
Per Capita income in Troy is $54,762.
What is the Median Family Income in Troy?
Median Family Income in Troy is $142,644.
What is the Median Household income in Troy?
Median Household Income in Troy is $115,639.
What is Income or Wage Gap in Troy?
Income or Wage Gap in Troy is 41.3%.
Women in Troy earn 58.7 cents for every dollar earned by a man.
What is Family Income Deficit in Troy?
Family Income Deficit in Troy is $11,787.
Families that are below poverty line in Troy earn $11,787 less on average than the poverty threshold level.
What is Inequality or Gini Index in Troy?
Inequality or Gini Index in Troy is 0.42.
What is the Total Population of Troy?
Total Population of Troy is 87,170.
What is the Total Male Population of Troy?
Total Male Population of Troy is 44,942.
What is the Total Female Population of Troy?
Total Female Population of Troy is 42,228.
What is the Ratio of Males per 100 Females in Troy?
There are 106.43 Males per 100 Females in Troy.
What is the Ratio of Females per 100 Males in Troy?
There are 93.96 Females per 100 Males in Troy.
What is the Median Population Age in Troy?
Median Population Age in Troy is 42.1 Years.
What is the Average Family Size in Troy
Average Family Size in Troy is 3.2 People.
What is the Average Household Size in Troy
Average Household Size in Troy is 2.6 People.
How Large is the Labor Force in Troy?
There are 46,138 People in the Labor Forcein in Troy.
What is the Percentage of People in the Labor Force in Troy?
64.5% of People are in the Labor Force in Troy.
What is the Unemployment Rate in Troy?
Unemployment Rate in Troy is 3.9%.