El Cajon, CA Map & Demographics
El Cajon Map
El Cajon Overview
$29,639
PER CAPITA INCOME
$70,685
AVG FAMILY INCOME
$64,128
AVG HOUSEHOLD INCOME
25.6%
WAGE / INCOME GAP [ % ]
74.4¢/ $1
WAGE / INCOME GAP [ $ ]
$12,182
FAMILY INCOME DEFICIT
0.45
INEQUALITY / GINI INDEX
105,721
TOTAL POPULATION
51,842
MALE POPULATION
53,879
FEMALE POPULATION
96.22
MALES / 100 FEMALES
103.93
FEMALES / 100 MALES
35.6
MEDIAN AGE
3.5
AVG FAMILY SIZE
3.0
AVG HOUSEHOLD SIZE
51,229
LABOR FORCE [ PEOPLE ]
62.3%
PERCENT IN LABOR FORCE
8.1%
UNEMPLOYMENT RATE
El Cajon Area Codes
Income in El Cajon
Income Overview in El Cajon
Per Capita Income in El Cajon is $29,639, while median incomes of families and households are $70,685 and $64,128 respectively.
| Characteristic | Number | Measure |
| Per Capita Income | 105,721 | $29,639 |
| Median Family Income | 24,972 | $70,685 |
| Mean Family Income | 24,972 | $93,379 |
| Median Household Income | 34,624 | $64,128 |
| Mean Household Income | 34,624 | $86,068 |
| Income Deficit | 24,972 | $12,182 |
| Wage / Income Gap (%) | 105,721 | 25.59% |
| Wage / Income Gap ($) | 105,721 | 74.41¢ per $1 |
| Gini / Inequality Index | 105,721 | 0.45 |
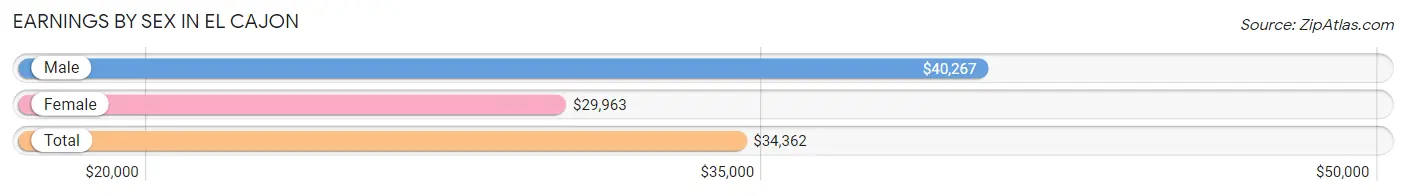
Earnings by Sex in El Cajon
Average Earnings in El Cajon are $34,362, $40,267 for men and $29,963 for women, a difference of 25.6%.
| Sex | Number | Average Earnings |
| Male | 27,829 (54.1%) | $40,267 |
| Female | 23,610 (45.9%) | $29,963 |
| Total | 51,439 (100.0%) | $34,362 |
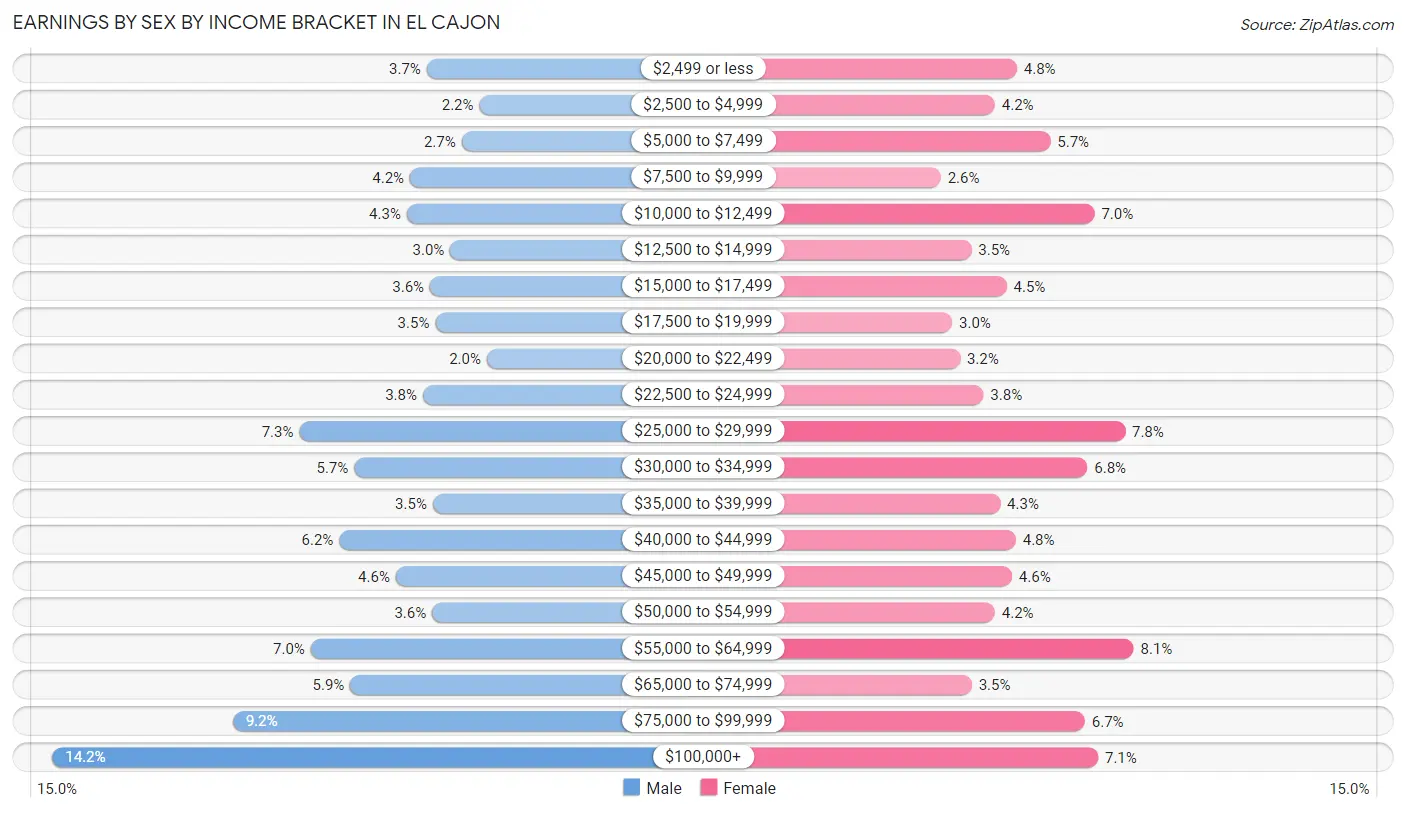
Earnings by Sex by Income Bracket in El Cajon
The most common earnings brackets in El Cajon are $100,000+ for men (3,958 | 14.2%) and $55,000 to $64,999 for women (1,902 | 8.1%).
| Income | Male | Female |
| $2,499 or less | 1,030 (3.7%) | 1,129 (4.8%) |
| $2,500 to $4,999 | 618 (2.2%) | 982 (4.2%) |
| $5,000 to $7,499 | 758 (2.7%) | 1,351 (5.7%) |
| $7,500 to $9,999 | 1,160 (4.2%) | 624 (2.6%) |
| $10,000 to $12,499 | 1,186 (4.3%) | 1,644 (7.0%) |
| $12,500 to $14,999 | 845 (3.0%) | 826 (3.5%) |
| $15,000 to $17,499 | 1,004 (3.6%) | 1,060 (4.5%) |
| $17,500 to $19,999 | 964 (3.5%) | 700 (3.0%) |
| $20,000 to $22,499 | 558 (2.0%) | 751 (3.2%) |
| $22,500 to $24,999 | 1,059 (3.8%) | 906 (3.8%) |
| $25,000 to $29,999 | 2,027 (7.3%) | 1,847 (7.8%) |
| $30,000 to $34,999 | 1,596 (5.7%) | 1,597 (6.8%) |
| $35,000 to $39,999 | 981 (3.5%) | 1,017 (4.3%) |
| $40,000 to $44,999 | 1,714 (6.2%) | 1,121 (4.8%) |
| $45,000 to $49,999 | 1,272 (4.6%) | 1,096 (4.6%) |
| $50,000 to $54,999 | 987 (3.5%) | 983 (4.2%) |
| $55,000 to $64,999 | 1,936 (7.0%) | 1,902 (8.1%) |
| $65,000 to $74,999 | 1,629 (5.9%) | 829 (3.5%) |
| $75,000 to $99,999 | 2,547 (9.1%) | 1,579 (6.7%) |
| $100,000+ | 3,958 (14.2%) | 1,666 (7.1%) |
| Total | 27,829 (100.0%) | 23,610 (100.0%) |
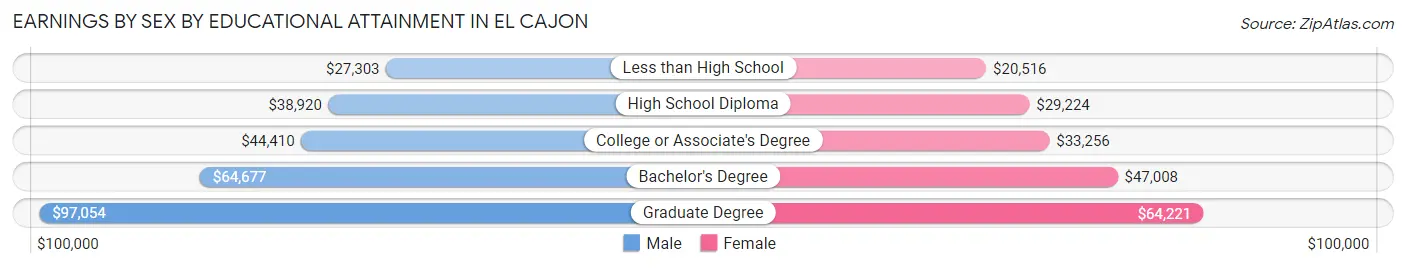
Earnings by Sex by Educational Attainment in El Cajon
Average earnings in El Cajon are $43,353 for men and $34,718 for women, a difference of 19.9%. Men with an educational attainment of graduate degree enjoy the highest average annual earnings of $97,054, while those with less than high school education earn the least with $27,303. Women with an educational attainment of graduate degree earn the most with the average annual earnings of $64,221, while those with less than high school education have the smallest earnings of $20,516.
| Educational Attainment | Male Income | Female Income |
| Less than High School | $27,303 | $20,516 |
| High School Diploma | $38,920 | $29,224 |
| College or Associate's Degree | $44,410 | $33,256 |
| Bachelor's Degree | $64,677 | $47,008 |
| Graduate Degree | $97,054 | $64,221 |
| Total | $43,353 | $34,718 |
Family Income in El Cajon
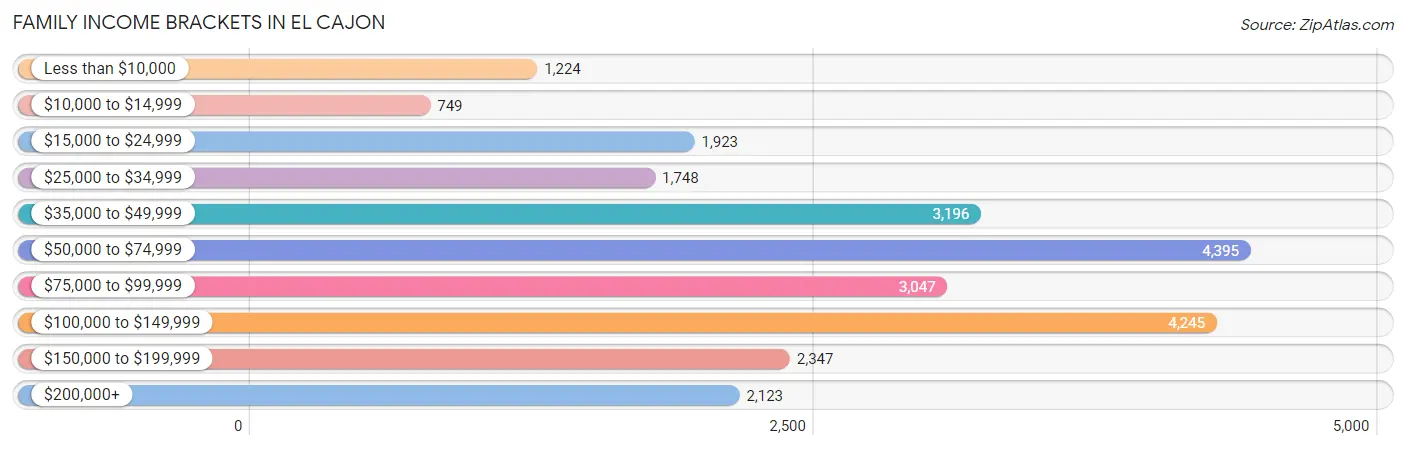
Family Income Brackets in El Cajon
According to the El Cajon family income data, there are 4,395 families falling into the $50,000 to $74,999 income range, which is the most common income bracket and makes up 17.6% of all families. Conversely, the $10,000 to $14,999 income bracket is the least frequent group with only 749 families (3.0%) belonging to this category.
| Income Bracket | # Families | % Families |
| Less than $10,000 | 1,224 | 4.9% |
| $10,000 to $14,999 | 749 | 3.0% |
| $15,000 to $24,999 | 1,923 | 7.7% |
| $25,000 to $34,999 | 1,748 | 7.0% |
| $35,000 to $49,999 | 3,196 | 12.8% |
| $50,000 to $74,999 | 4,395 | 17.6% |
| $75,000 to $99,999 | 3,047 | 12.2% |
| $100,000 to $149,999 | 4,245 | 17.0% |
| $150,000 to $199,999 | 2,347 | 9.4% |
| $200,000+ | 2,123 | 8.5% |
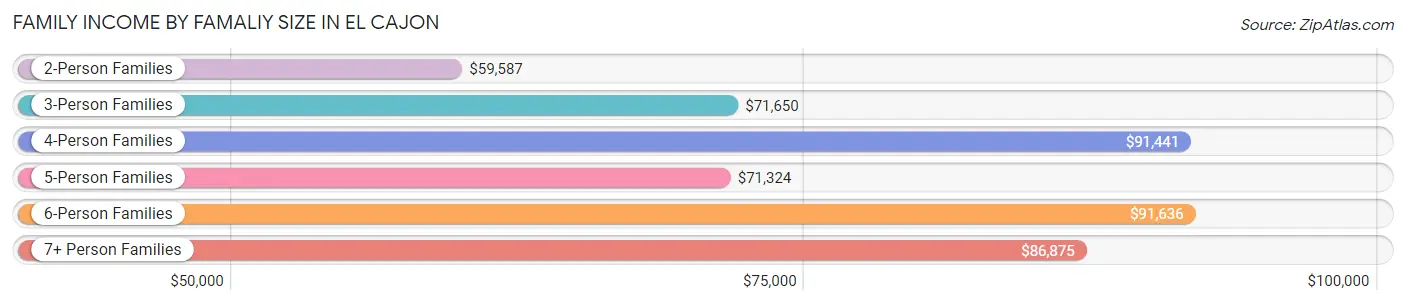
Family Income by Famaliy Size in El Cajon
6-person families (996 | 4.0%) account for the highest median family income in El Cajon with $91,636 per family, while 2-person families (9,275 | 37.1%) have the highest median income of $29,794 per family member.
| Income Bracket | # Families | Median Income |
| 2-Person Families | 9,275 (37.1%) | $59,587 |
| 3-Person Families | 6,098 (24.4%) | $71,650 |
| 4-Person Families | 5,376 (21.5%) | $91,441 |
| 5-Person Families | 2,518 (10.1%) | $71,324 |
| 6-Person Families | 996 (4.0%) | $91,636 |
| 7+ Person Families | 709 (2.8%) | $86,875 |
| Total | 24,972 (100.0%) | $70,685 |
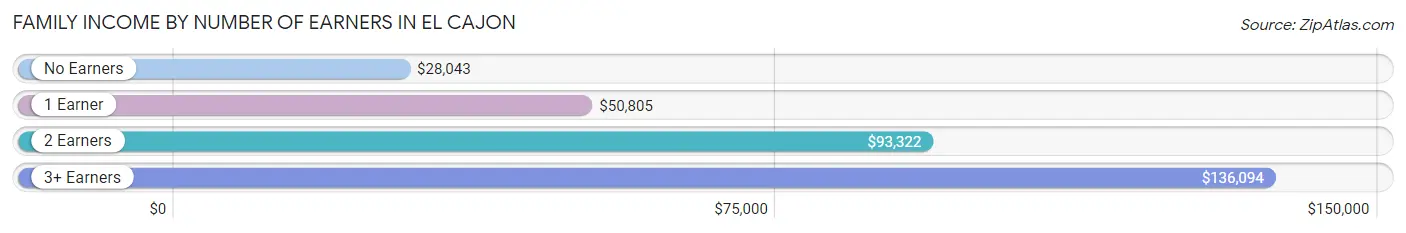
Family Income by Number of Earners in El Cajon
The median family income in El Cajon is $70,685, with families comprising 3+ earners (3,052) having the highest median family income of $136,094, while families with no earners (2,966) have the lowest median family income of $28,043, accounting for 12.2% and 11.9% of families, respectively.
| Number of Earners | # Families | Median Income |
| No Earners | 2,966 (11.9%) | $28,043 |
| 1 Earner | 9,389 (37.6%) | $50,805 |
| 2 Earners | 9,565 (38.3%) | $93,322 |
| 3+ Earners | 3,052 (12.2%) | $136,094 |
| Total | 24,972 (100.0%) | $70,685 |
Household Income in El Cajon
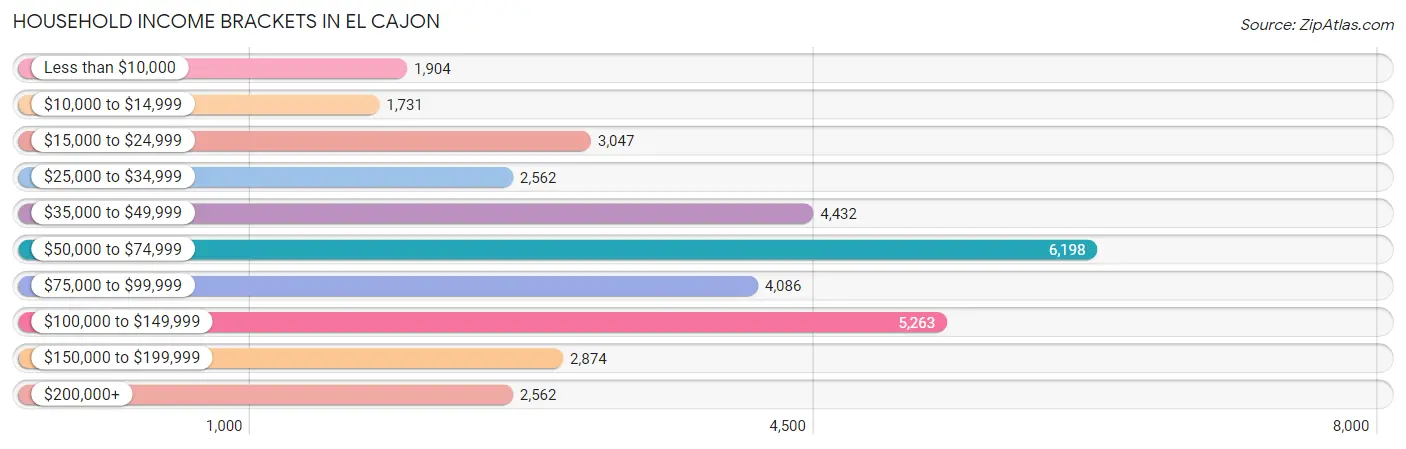
Household Income Brackets in El Cajon
With 6,198 households falling in the category, the $50,000 to $74,999 income range is the most frequent in El Cajon, accounting for 17.9% of all households. In contrast, only 1,731 households (5.0%) fall into the $10,000 to $14,999 income bracket, making it the least populous group.
| Income Bracket | # Households | % Households |
| Less than $10,000 | 1,904 | 5.5% |
| $10,000 to $14,999 | 1,731 | 5.0% |
| $15,000 to $24,999 | 3,047 | 8.8% |
| $25,000 to $34,999 | 2,562 | 7.4% |
| $35,000 to $49,999 | 4,432 | 12.8% |
| $50,000 to $74,999 | 6,198 | 17.9% |
| $75,000 to $99,999 | 4,086 | 11.8% |
| $100,000 to $149,999 | 5,263 | 15.2% |
| $150,000 to $199,999 | 2,874 | 8.3% |
| $200,000+ | 2,562 | 7.4% |
Household Income by Householder Age in El Cajon
The median household income in El Cajon is $64,128, with the highest median household income of $70,121 found in the 45 to 64 years age bracket for the primary householder. A total of 12,272 households (35.4%) fall into this category. Meanwhile, the 65+ years age bracket for the primary householder has the lowest median household income of $50,323, with 7,547 households (21.8%) in this group.
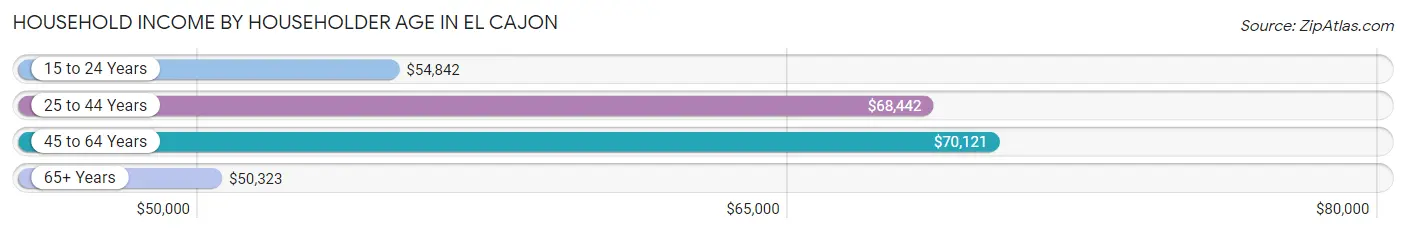
| Income Bracket | # Households | Median Income |
| 15 to 24 Years | 1,402 (4.1%) | $54,842 |
| 25 to 44 Years | 13,403 (38.7%) | $68,442 |
| 45 to 64 Years | 12,272 (35.4%) | $70,121 |
| 65+ Years | 7,547 (21.8%) | $50,323 |
| Total | 34,624 (100.0%) | $64,128 |
Poverty in El Cajon
Income Below Poverty by Sex and Age in El Cajon
With 18.3% poverty level for males and 19.4% for females among the residents of El Cajon, under 5 year old males and 15 year old females are the most vulnerable to poverty, with 1,007 males (28.0%) and 326 females (36.2%) in their respective age groups living below the poverty level.
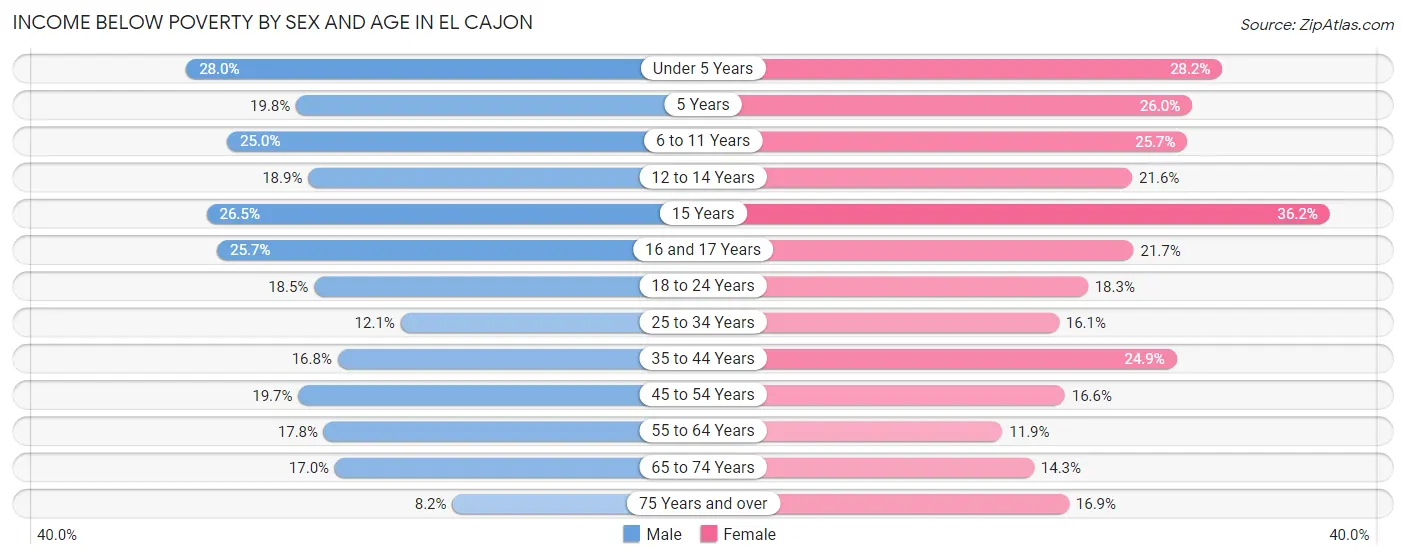
| Age Bracket | Male | Female |
| Under 5 Years | 1,007 (28.0%) | 1,060 (28.2%) |
| 5 Years | 123 (19.8%) | 136 (26.0%) |
| 6 to 11 Years | 1,141 (25.0%) | 1,164 (25.7%) |
| 12 to 14 Years | 385 (18.9%) | 467 (21.6%) |
| 15 Years | 107 (26.5%) | 326 (36.2%) |
| 16 and 17 Years | 337 (25.7%) | 251 (21.7%) |
| 18 to 24 Years | 907 (18.5%) | 890 (18.3%) |
| 25 to 34 Years | 950 (12.1%) | 1,273 (16.1%) |
| 35 to 44 Years | 1,258 (16.8%) | 1,827 (24.8%) |
| 45 to 54 Years | 1,180 (19.7%) | 1,002 (16.6%) |
| 55 to 64 Years | 1,067 (17.8%) | 772 (11.9%) |
| 65 to 74 Years | 678 (17.0%) | 601 (14.3%) |
| 75 Years and over | 176 (8.2%) | 501 (16.9%) |
| Total | 9,316 (18.3%) | 10,270 (19.4%) |
Income Above Poverty by Sex and Age in El Cajon
According to the poverty statistics in El Cajon, males aged 75 years and over and females aged 55 to 64 years are the age groups that are most secure financially, with 91.8% of males and 88.1% of females in these age groups living above the poverty line.
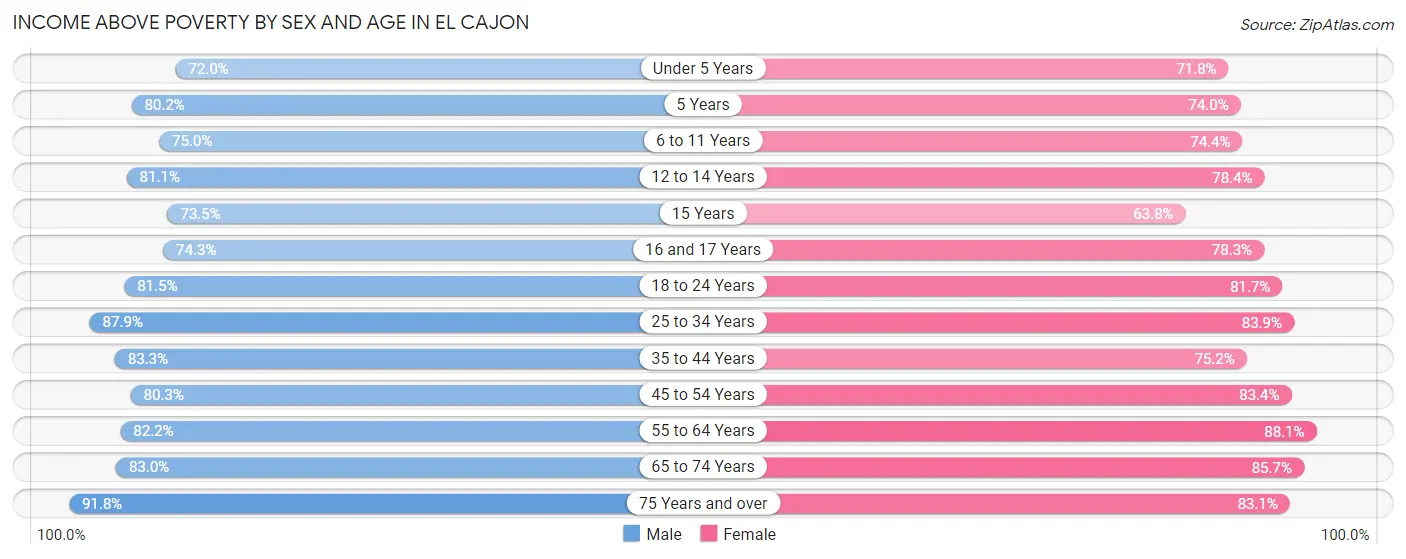
| Age Bracket | Male | Female |
| Under 5 Years | 2,590 (72.0%) | 2,694 (71.8%) |
| 5 Years | 497 (80.2%) | 387 (74.0%) |
| 6 to 11 Years | 3,431 (75.0%) | 3,374 (74.4%) |
| 12 to 14 Years | 1,648 (81.1%) | 1,699 (78.4%) |
| 15 Years | 297 (73.5%) | 574 (63.8%) |
| 16 and 17 Years | 974 (74.3%) | 908 (78.3%) |
| 18 to 24 Years | 3,995 (81.5%) | 3,985 (81.7%) |
| 25 to 34 Years | 6,914 (87.9%) | 6,627 (83.9%) |
| 35 to 44 Years | 6,253 (83.3%) | 5,525 (75.1%) |
| 45 to 54 Years | 4,817 (80.3%) | 5,049 (83.4%) |
| 55 to 64 Years | 4,935 (82.2%) | 5,702 (88.1%) |
| 65 to 74 Years | 3,319 (83.0%) | 3,615 (85.7%) |
| 75 Years and over | 1,959 (91.8%) | 2,470 (83.1%) |
| Total | 41,629 (81.7%) | 42,609 (80.6%) |
Income Below Poverty Among Married-Couple Families in El Cajon
The poverty statistics for married-couple families in El Cajon show that 12.5% or 2,073 of the total 16,570 families live below the poverty line. Families with 5 or more children have the highest poverty rate of 45.6%, comprising of 89 families. On the other hand, families with no children have the lowest poverty rate of 6.1%, which includes 496 families.
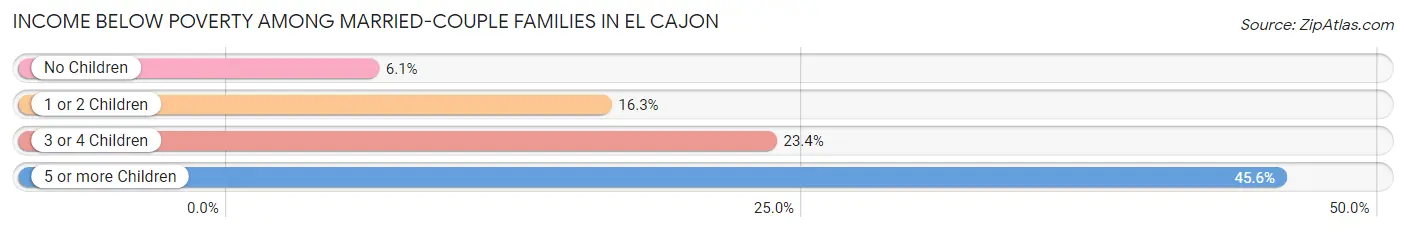
| Children | Above Poverty | Below Poverty |
| No Children | 7,593 (93.9%) | 496 (6.1%) |
| 1 or 2 Children | 5,292 (83.8%) | 1,027 (16.3%) |
| 3 or 4 Children | 1,506 (76.6%) | 461 (23.4%) |
| 5 or more Children | 106 (54.4%) | 89 (45.6%) |
| Total | 14,497 (87.5%) | 2,073 (12.5%) |
Income Below Poverty Among Single-Parent Households in El Cajon
According to the poverty data in El Cajon, 11.4% or 289 single-father households and 23.2% or 1,360 single-mother households are living below the poverty line. Among single-father households, those with 3 or 4 children have the highest poverty rate, with 74 households (63.8%) experiencing poverty. Likewise, among single-mother households, those with 3 or 4 children have the highest poverty rate, with 401 households (68.8%) falling below the poverty line.
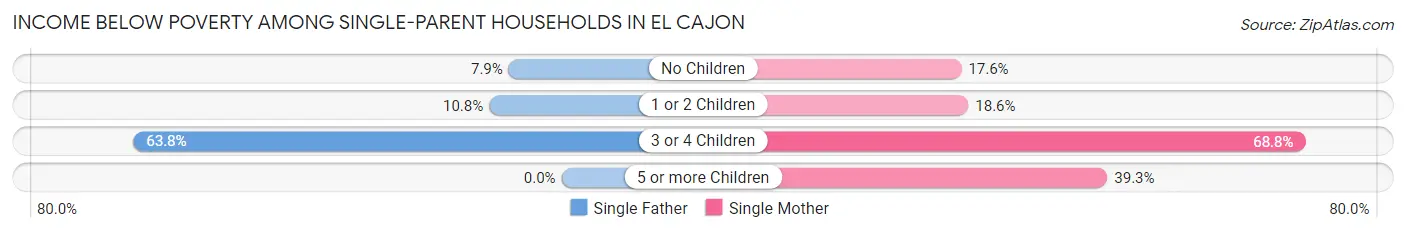
| Children | Single Father | Single Mother |
| No Children | 128 (7.9%) | 447 (17.5%) |
| 1 or 2 Children | 87 (10.8%) | 501 (18.6%) |
| 3 or 4 Children | 74 (63.8%) | 401 (68.8%) |
| 5 or more Children | 0 (0.0%) | 11 (39.3%) |
| Total | 289 (11.4%) | 1,360 (23.2%) |
Income Below Poverty Among Married-Couple vs Single-Parent Households in El Cajon
The poverty data for El Cajon shows that 2,073 of the married-couple family households (12.5%) and 1,649 of the single-parent households (19.6%) are living below the poverty level. Within the married-couple family households, those with 5 or more children have the highest poverty rate, with 89 households (45.6%) falling below the poverty line. Among the single-parent households, those with 3 or 4 children have the highest poverty rate, with 475 household (67.9%) living below poverty.
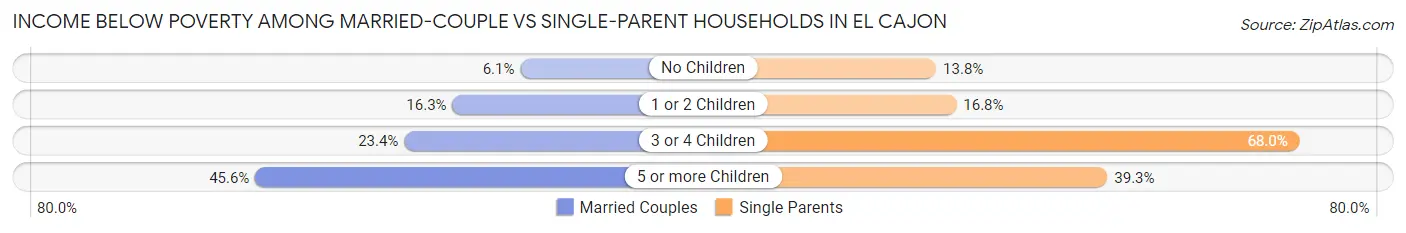
| Children | Married-Couple Families | Single-Parent Households |
| No Children | 496 (6.1%) | 575 (13.8%) |
| 1 or 2 Children | 1,027 (16.3%) | 588 (16.8%) |
| 3 or 4 Children | 461 (23.4%) | 475 (67.9%) |
| 5 or more Children | 89 (45.6%) | 11 (39.3%) |
| Total | 2,073 (12.5%) | 1,649 (19.6%) |
Race in El Cajon
The most populous races in El Cajon are White / Caucasian (69,099 | 65.4%), Hispanic or Latino (29,903 | 28.3%), and Some other Race (12,157 | 11.5%).
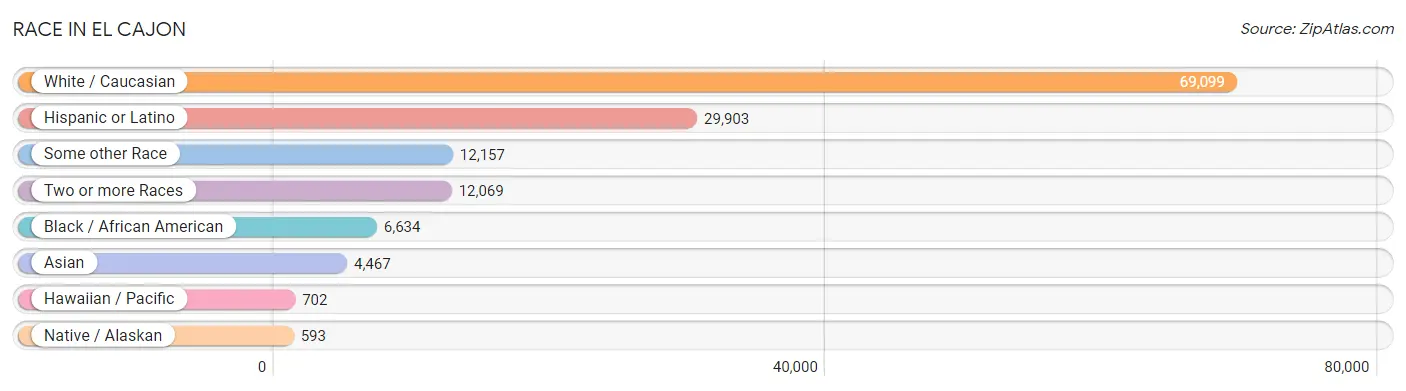
| Race | # Population | % Population |
| Asian | 4,467 | 4.2% |
| Black / African American | 6,634 | 6.3% |
| Hawaiian / Pacific | 702 | 0.7% |
| Hispanic or Latino | 29,903 | 28.3% |
| Native / Alaskan | 593 | 0.6% |
| White / Caucasian | 69,099 | 65.4% |
| Two or more Races | 12,069 | 11.4% |
| Some other Race | 12,157 | 11.5% |
| Total | 105,721 | 100.0% |
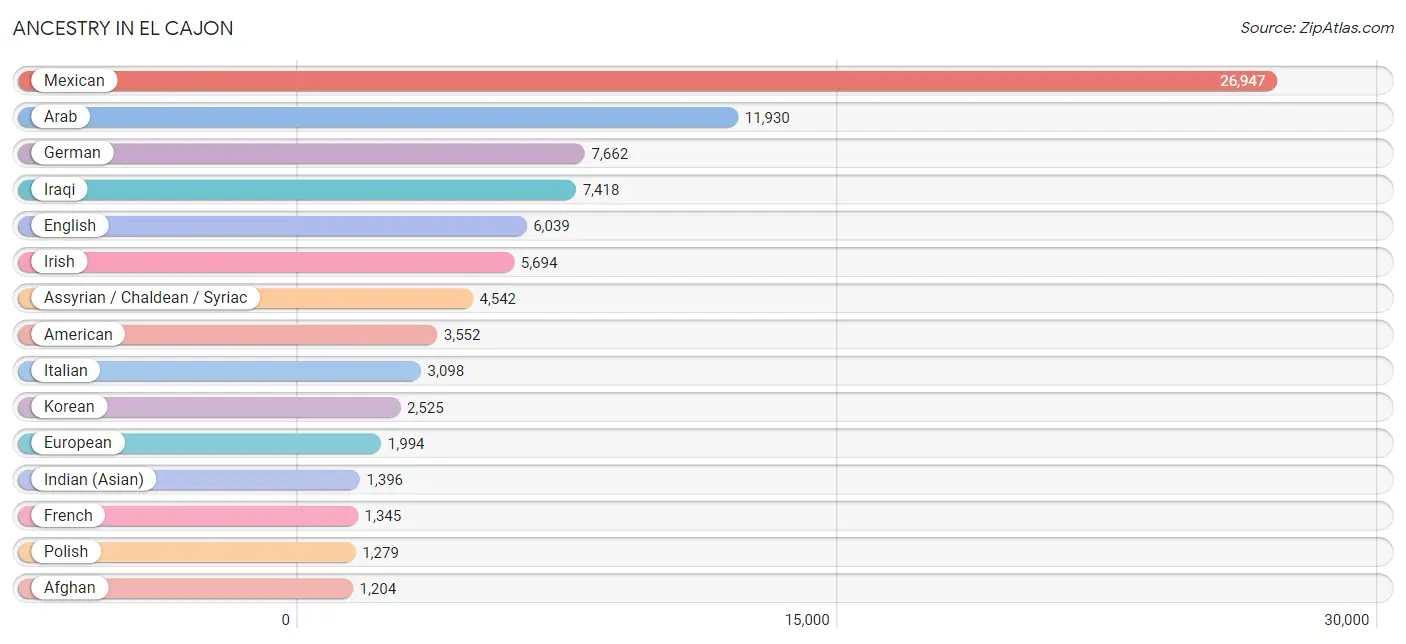
Ancestry in El Cajon
The most populous ancestries reported in El Cajon are Mexican (26,947 | 25.5%), Arab (11,930 | 11.3%), German (7,662 | 7.2%), Iraqi (7,418 | 7.0%), and English (6,039 | 5.7%), together accounting for 56.8% of all El Cajon residents.
| Ancestry | # Population | % Population |
| Afghan | 1,204 | 1.1% |
| African | 460 | 0.4% |
| Albanian | 3 | 0.0% |
| American | 3,552 | 3.4% |
| Apache | 16 | 0.0% |
| Arab | 11,930 | 11.3% |
| Armenian | 139 | 0.1% |
| Assyrian / Chaldean / Syriac | 4,542 | 4.3% |
| Austrian | 74 | 0.1% |
| Bangladeshi | 45 | 0.0% |
| Basque | 32 | 0.0% |
| Belgian | 54 | 0.1% |
| Belizean | 7 | 0.0% |
| Bhutanese | 503 | 0.5% |
| Blackfeet | 194 | 0.2% |
| Bolivian | 17 | 0.0% |
| Brazilian | 158 | 0.2% |
| British | 352 | 0.3% |
| British West Indian | 47 | 0.0% |
| Bulgarian | 97 | 0.1% |
| Burmese | 249 | 0.2% |
| Cambodian | 6 | 0.0% |
| Canadian | 78 | 0.1% |
| Celtic | 12 | 0.0% |
| Central American | 823 | 0.8% |
| Central American Indian | 62 | 0.1% |
| Cherokee | 424 | 0.4% |
| Chickasaw | 22 | 0.0% |
| Chinese | 21 | 0.0% |
| Chippewa | 19 | 0.0% |
| Choctaw | 21 | 0.0% |
| Colombian | 255 | 0.2% |
| Costa Rican | 150 | 0.1% |
| Creek | 18 | 0.0% |
| Croatian | 44 | 0.0% |
| Cuban | 43 | 0.0% |
| Czech | 162 | 0.2% |
| Czechoslovakian | 30 | 0.0% |
| Danish | 180 | 0.2% |
| Dominican | 60 | 0.1% |
| Dutch | 823 | 0.8% |
| Eastern European | 315 | 0.3% |
| Ecuadorian | 15 | 0.0% |
| Egyptian | 278 | 0.3% |
| English | 6,039 | 5.7% |
| Ethiopian | 123 | 0.1% |
| European | 1,994 | 1.9% |
| Finnish | 123 | 0.1% |
| French | 1,345 | 1.3% |
| French American Indian | 30 | 0.0% |
| French Canadian | 308 | 0.3% |
| German | 7,662 | 7.2% |
| Greek | 186 | 0.2% |
| Guamanian / Chamorro | 252 | 0.2% |
| Guatemalan | 208 | 0.2% |
| Haitian | 79 | 0.1% |
| Honduran | 41 | 0.0% |
| Hungarian | 371 | 0.4% |
| Indian (Asian) | 1,396 | 1.3% |
| Iranian | 390 | 0.4% |
| Iraqi | 7,418 | 7.0% |
| Irish | 5,694 | 5.4% |
| Iroquois | 12 | 0.0% |
| Israeli | 226 | 0.2% |
| Italian | 3,098 | 2.9% |
| Jamaican | 64 | 0.1% |
| Japanese | 208 | 0.2% |
| Jordanian | 184 | 0.2% |
| Kenyan | 14 | 0.0% |
| Korean | 2,525 | 2.4% |
| Laotian | 14 | 0.0% |
| Latvian | 20 | 0.0% |
| Lebanese | 69 | 0.1% |
| Lithuanian | 130 | 0.1% |
| Malaysian | 85 | 0.1% |
| Marshallese | 76 | 0.1% |
| Mexican | 26,947 | 25.5% |
| Mexican American Indian | 265 | 0.3% |
| Mongolian | 76 | 0.1% |
| Moroccan | 5 | 0.0% |
| Native Hawaiian | 188 | 0.2% |
| Navajo | 16 | 0.0% |
| Nicaraguan | 24 | 0.0% |
| Nigerian | 7 | 0.0% |
| Northern European | 249 | 0.2% |
| Norwegian | 958 | 0.9% |
| Ottawa | 40 | 0.0% |
| Pakistani | 70 | 0.1% |
| Palestinian | 285 | 0.3% |
| Panamanian | 117 | 0.1% |
| Pennsylvania German | 26 | 0.0% |
| Peruvian | 198 | 0.2% |
| Polish | 1,279 | 1.2% |
| Portuguese | 583 | 0.5% |
| Pueblo | 40 | 0.0% |
| Puerto Rican | 553 | 0.5% |
| Romanian | 152 | 0.1% |
| Russian | 401 | 0.4% |
| Salvadoran | 239 | 0.2% |
| Samoan | 409 | 0.4% |
| Scandinavian | 323 | 0.3% |
| Scotch-Irish | 495 | 0.5% |
| Scottish | 804 | 0.8% |
| Senegalese | 60 | 0.1% |
| Serbian | 23 | 0.0% |
| Sioux | 29 | 0.0% |
| Slavic | 21 | 0.0% |
| Slovak | 24 | 0.0% |
| Slovene | 5 | 0.0% |
| Somali | 12 | 0.0% |
| South American | 494 | 0.5% |
| South American Indian | 19 | 0.0% |
| Spaniard | 323 | 0.3% |
| Spanish | 472 | 0.4% |
| Sri Lankan | 847 | 0.8% |
| Subsaharan African | 1,067 | 1.0% |
| Sudanese | 175 | 0.2% |
| Swedish | 1,014 | 1.0% |
| Swiss | 121 | 0.1% |
| Syrian | 1,105 | 1.1% |
| Thai | 248 | 0.2% |
| Tongan | 69 | 0.1% |
| Turkish | 75 | 0.1% |
| Ukrainian | 182 | 0.2% |
| Venezuelan | 9 | 0.0% |
| Vietnamese | 29 | 0.0% |
| Welsh | 305 | 0.3% |
| West Indian | 38 | 0.0% |
| Yaqui | 51 | 0.1% |
| Yugoslavian | 22 | 0.0% |
| Yuman | 25 | 0.0% | View All 131 Rows |
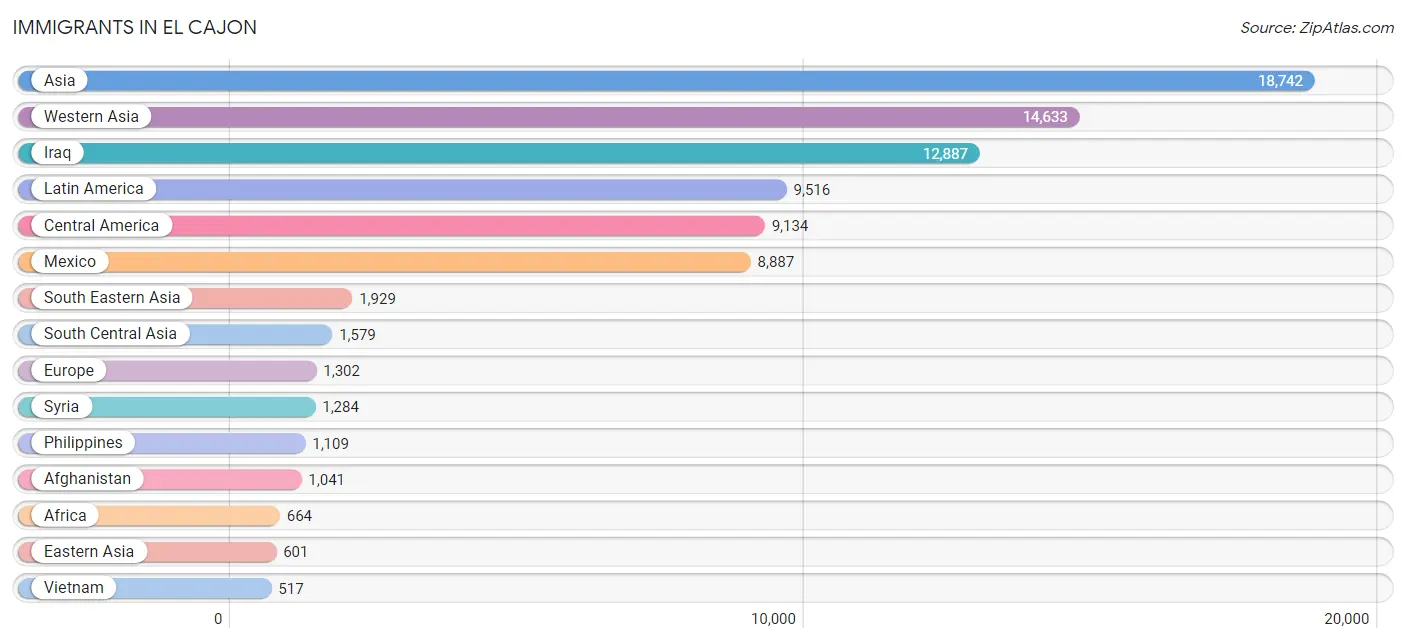
Immigrants in El Cajon
The most numerous immigrant groups reported in El Cajon came from Asia (18,742 | 17.7%), Western Asia (14,633 | 13.8%), Iraq (12,887 | 12.2%), Latin America (9,516 | 9.0%), and Central America (9,134 | 8.6%), together accounting for 61.4% of all El Cajon residents.
| Immigration Origin | # Population | % Population |
| Afghanistan | 1,041 | 1.0% |
| Africa | 664 | 0.6% |
| Asia | 18,742 | 17.7% |
| Austria | 10 | 0.0% |
| Bahamas | 3 | 0.0% |
| Bangladesh | 18 | 0.0% |
| Brazil | 134 | 0.1% |
| Cambodia | 70 | 0.1% |
| Cameroon | 38 | 0.0% |
| Canada | 99 | 0.1% |
| Caribbean | 106 | 0.1% |
| Central America | 9,134 | 8.6% |
| Chile | 21 | 0.0% |
| China | 422 | 0.4% |
| Colombia | 21 | 0.0% |
| Costa Rica | 111 | 0.1% |
| Cuba | 6 | 0.0% |
| Czechoslovakia | 42 | 0.0% |
| Denmark | 70 | 0.1% |
| Eastern Africa | 137 | 0.1% |
| Eastern Asia | 601 | 0.6% |
| Eastern Europe | 421 | 0.4% |
| Egypt | 150 | 0.1% |
| El Salvador | 24 | 0.0% |
| England | 50 | 0.1% |
| Ethiopia | 123 | 0.1% |
| Europe | 1,302 | 1.2% |
| France | 110 | 0.1% |
| Germany | 184 | 0.2% |
| Greece | 97 | 0.1% |
| Guatemala | 33 | 0.0% |
| Haiti | 27 | 0.0% |
| Honduras | 24 | 0.0% |
| Hong Kong | 67 | 0.1% |
| Hungary | 9 | 0.0% |
| India | 74 | 0.1% |
| Indonesia | 7 | 0.0% |
| Iran | 347 | 0.3% |
| Iraq | 12,887 | 12.2% |
| Ireland | 22 | 0.0% |
| Israel | 11 | 0.0% |
| Italy | 191 | 0.2% |
| Jamaica | 31 | 0.0% |
| Japan | 65 | 0.1% |
| Jordan | 192 | 0.2% |
| Kazakhstan | 7 | 0.0% |
| Kenya | 14 | 0.0% |
| Korea | 108 | 0.1% |
| Kuwait | 19 | 0.0% |
| Laos | 125 | 0.1% |
| Latin America | 9,516 | 9.0% |
| Latvia | 10 | 0.0% |
| Lebanon | 74 | 0.1% |
| Liberia | 29 | 0.0% |
| Lithuania | 34 | 0.0% |
| Malaysia | 13 | 0.0% |
| Mexico | 8,887 | 8.4% |
| Micronesia | 126 | 0.1% |
| Middle Africa | 38 | 0.0% |
| Netherlands | 30 | 0.0% |
| Nicaragua | 18 | 0.0% |
| Nigeria | 14 | 0.0% |
| Northern Africa | 325 | 0.3% |
| Northern Europe | 158 | 0.2% |
| Oceania | 157 | 0.2% |
| Pakistan | 83 | 0.1% |
| Panama | 37 | 0.0% |
| Peru | 79 | 0.1% |
| Philippines | 1,109 | 1.1% |
| Poland | 138 | 0.1% |
| Portugal | 78 | 0.1% |
| Russia | 96 | 0.1% |
| Saudi Arabia | 74 | 0.1% |
| South America | 276 | 0.3% |
| South Central Asia | 1,579 | 1.5% |
| South Eastern Asia | 1,929 | 1.8% |
| Southern Europe | 383 | 0.4% |
| Spain | 7 | 0.0% |
| Sri Lanka | 9 | 0.0% |
| St. Vincent and the Grenadines | 13 | 0.0% |
| Sudan | 175 | 0.2% |
| Syria | 1,284 | 1.2% |
| Taiwan | 20 | 0.0% |
| Thailand | 88 | 0.1% |
| Trinidad and Tobago | 26 | 0.0% |
| Turkey | 27 | 0.0% |
| Ukraine | 73 | 0.1% |
| Venezuela | 21 | 0.0% |
| Vietnam | 517 | 0.5% |
| Western Africa | 77 | 0.1% |
| Western Asia | 14,633 | 13.8% |
| Western Europe | 334 | 0.3% | View All 92 Rows |
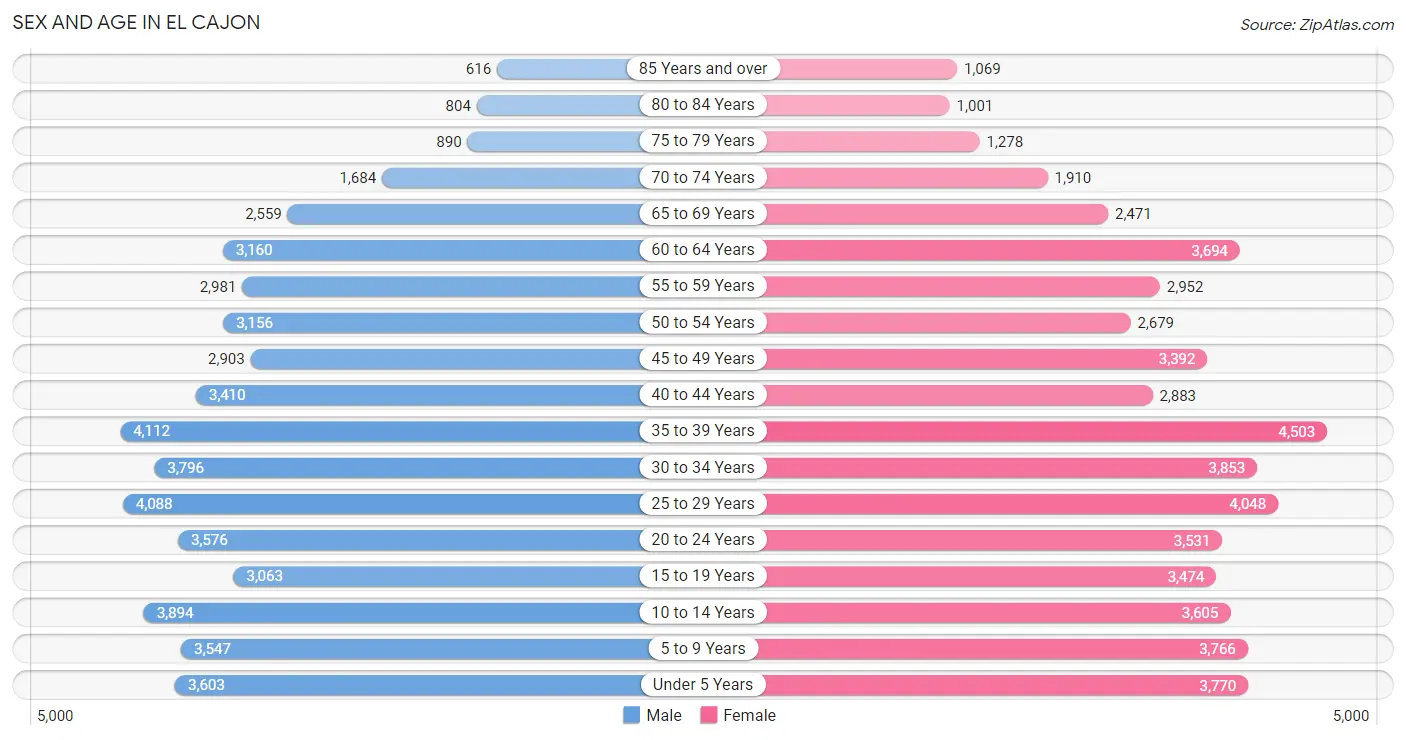
Sex and Age in El Cajon
Sex and Age in El Cajon
The most populous age groups in El Cajon are 35 to 39 Years (4,112 | 7.9%) for men and 35 to 39 Years (4,503 | 8.4%) for women.
| Age Bracket | Male | Female |
| Under 5 Years | 3,603 (7.0%) | 3,770 (7.0%) |
| 5 to 9 Years | 3,547 (6.8%) | 3,766 (7.0%) |
| 10 to 14 Years | 3,894 (7.5%) | 3,605 (6.7%) |
| 15 to 19 Years | 3,063 (5.9%) | 3,474 (6.5%) |
| 20 to 24 Years | 3,576 (6.9%) | 3,531 (6.6%) |
| 25 to 29 Years | 4,088 (7.9%) | 4,048 (7.5%) |
| 30 to 34 Years | 3,796 (7.3%) | 3,853 (7.1%) |
| 35 to 39 Years | 4,112 (7.9%) | 4,503 (8.4%) |
| 40 to 44 Years | 3,410 (6.6%) | 2,883 (5.3%) |
| 45 to 49 Years | 2,903 (5.6%) | 3,392 (6.3%) |
| 50 to 54 Years | 3,156 (6.1%) | 2,679 (5.0%) |
| 55 to 59 Years | 2,981 (5.8%) | 2,952 (5.5%) |
| 60 to 64 Years | 3,160 (6.1%) | 3,694 (6.9%) |
| 65 to 69 Years | 2,559 (4.9%) | 2,471 (4.6%) |
| 70 to 74 Years | 1,684 (3.3%) | 1,910 (3.5%) |
| 75 to 79 Years | 890 (1.7%) | 1,278 (2.4%) |
| 80 to 84 Years | 804 (1.5%) | 1,001 (1.9%) |
| 85 Years and over | 616 (1.2%) | 1,069 (2.0%) |
| Total | 51,842 (100.0%) | 53,879 (100.0%) |
Families and Households in El Cajon
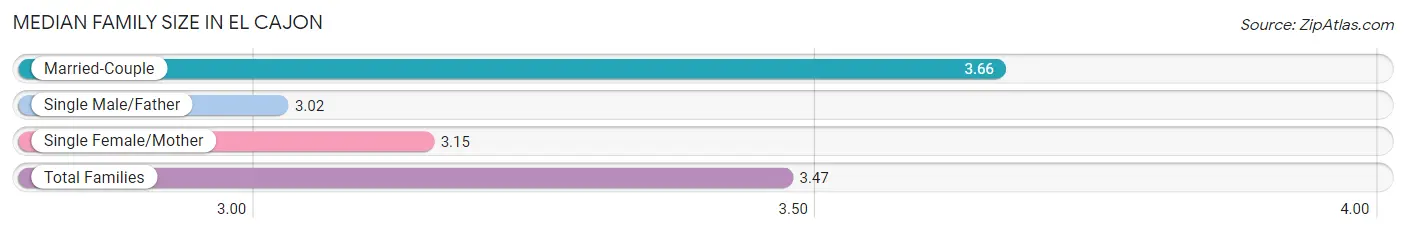
Median Family Size in El Cajon
The median family size in El Cajon is 3.47 persons per family, with married-couple families (16,570 | 66.3%) accounting for the largest median family size of 3.66 persons per family. On the other hand, single male/father families (2,547 | 10.2%) represent the smallest median family size with 3.02 persons per family.
| Family Type | # Families | Family Size |
| Married-Couple | 16,570 (66.3%) | 3.66 |
| Single Male/Father | 2,547 (10.2%) | 3.02 |
| Single Female/Mother | 5,855 (23.4%) | 3.15 |
| Total Families | 24,972 (100.0%) | 3.47 |
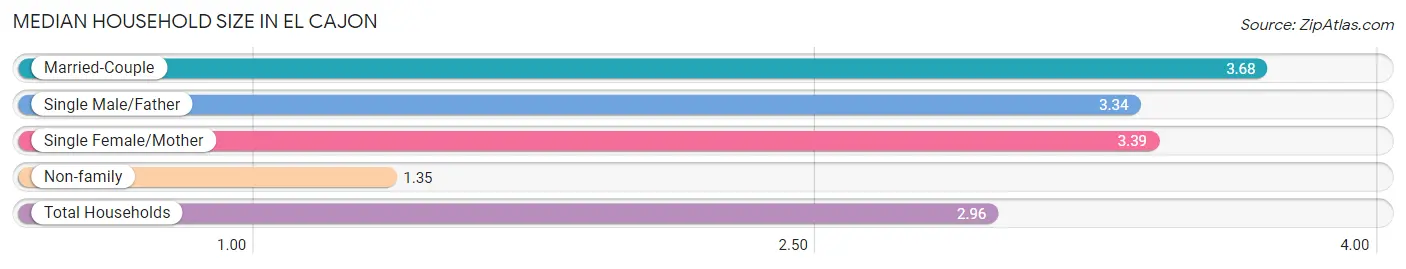
Median Household Size in El Cajon
The median household size in El Cajon is 2.96 persons per household, with married-couple households (16,570 | 47.9%) accounting for the largest median household size of 3.68 persons per household. non-family households (9,652 | 27.9%) represent the smallest median household size with 1.35 persons per household.
| Household Type | # Households | Household Size |
| Married-Couple | 16,570 (47.9%) | 3.68 |
| Single Male/Father | 2,547 (7.4%) | 3.34 |
| Single Female/Mother | 5,855 (16.9%) | 3.39 |
| Non-family | 9,652 (27.9%) | 1.35 |
| Total Households | 34,624 (100.0%) | 2.96 |
Household Size by Marriage Status in El Cajon
Out of a total of 34,624 households in El Cajon, 24,972 (72.1%) are family households, while 9,652 (27.9%) are nonfamily households. The most numerous type of family households are 2-person households, comprising 8,280, and the most common type of nonfamily households are 1-person households, comprising 7,408.
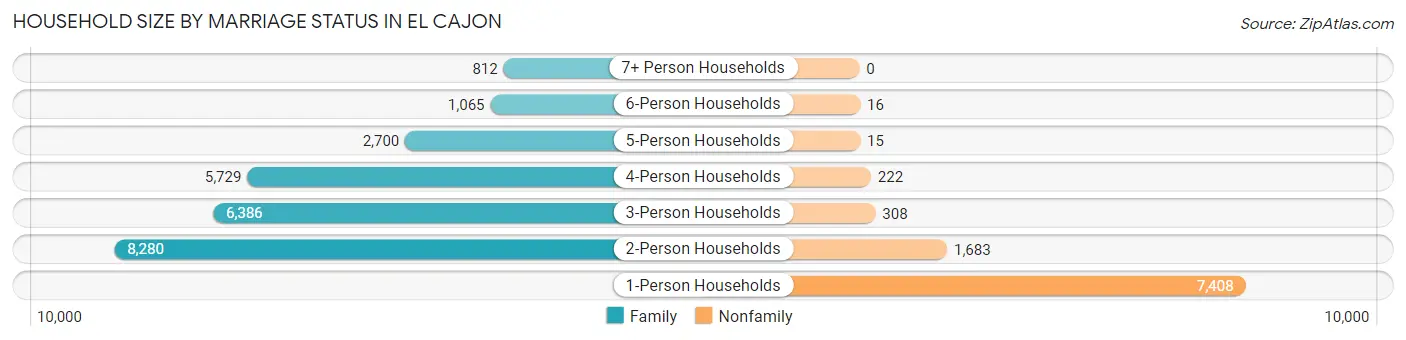
| Household Size | Family Households | Nonfamily Households |
| 1-Person Households | - | 7,408 (21.4%) |
| 2-Person Households | 8,280 (23.9%) | 1,683 (4.9%) |
| 3-Person Households | 6,386 (18.4%) | 308 (0.9%) |
| 4-Person Households | 5,729 (16.6%) | 222 (0.6%) |
| 5-Person Households | 2,700 (7.8%) | 15 (0.0%) |
| 6-Person Households | 1,065 (3.1%) | 16 (0.1%) |
| 7+ Person Households | 812 (2.4%) | 0 (0.0%) |
| Total | 24,972 (72.1%) | 9,652 (27.9%) |
Female Fertility in El Cajon
Fertility by Age in El Cajon
Average fertility rate in El Cajon is 81.0 births per 1,000 women. Women in the age bracket of 20 to 34 years have the highest fertility rate with 133.0 births per 1,000 women. Women in the age bracket of 20 to 34 years acount for 72.1% of all women with births.
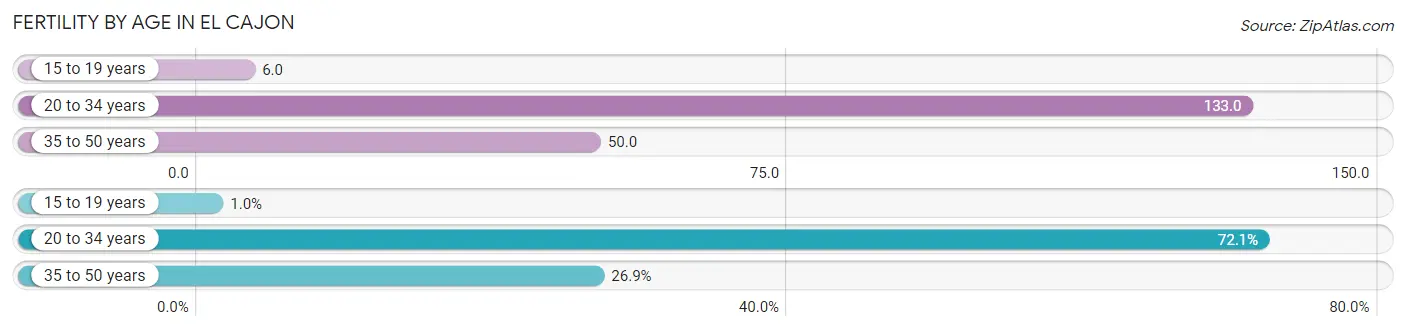
| Age Bracket | Women with Births | Births / 1,000 Women |
| 15 to 19 years | 22 (1.0%) | 6.0 |
| 20 to 34 years | 1,519 (72.1%) | 133.0 |
| 35 to 50 years | 567 (26.9%) | 50.0 |
| Total | 2,108 (100.0%) | 81.0 |
Fertility by Age by Marriage Status in El Cajon
70.2% of women with births (2,108) in El Cajon are married. The highest percentage of unmarried women with births falls into 20 to 34 years age bracket with 38.4% of them unmarried at the time of birth, while the lowest percentage of unmarried women with births belong to 15 to 19 years age bracket with 0.0% of them unmarried.
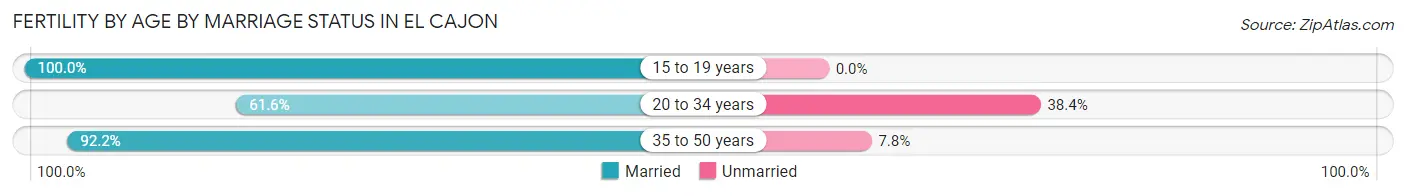
| Age Bracket | Married | Unmarried |
| 15 to 19 years | 22 (100.0%) | 0 (0.0%) |
| 20 to 34 years | 936 (61.6%) | 583 (38.4%) |
| 35 to 50 years | 523 (92.2%) | 44 (7.8%) |
| Total | 1,480 (70.2%) | 628 (29.8%) |
Fertility by Education in El Cajon
Average fertility rate in El Cajon is 81.0 births per 1,000 women. Women with the education attainment of college or associate's degree have the highest fertility rate of 107.0 births per 1,000 women, while women with the education attainment of graduate degree have the lowest fertility at 18.0 births per 1,000 women. Women with the education attainment of college or associate's degree represent 45.1% of all women with births.
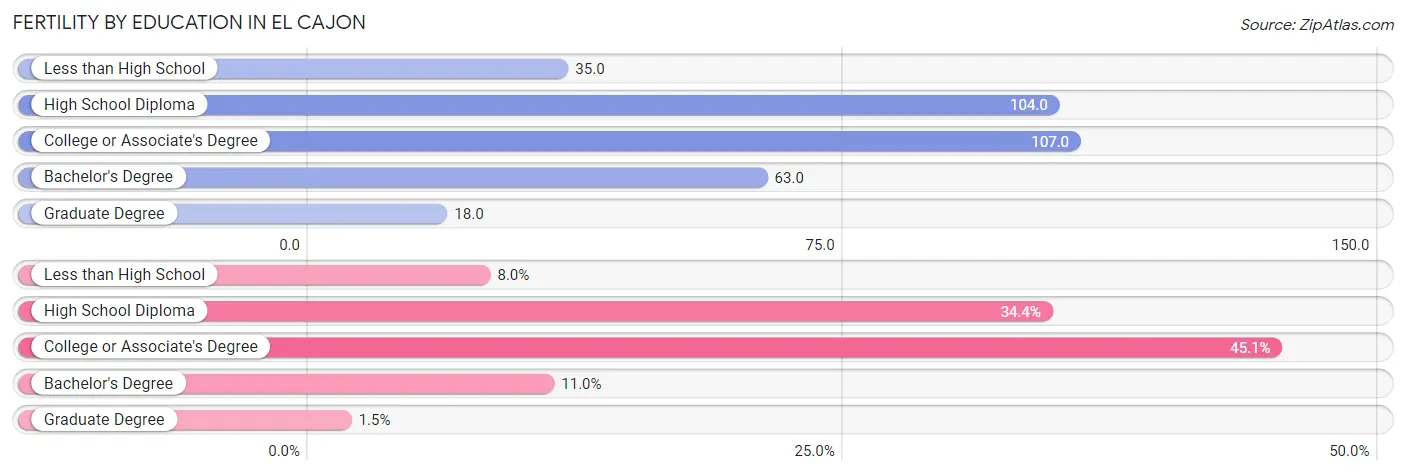
| Educational Attainment | Women with Births | Births / 1,000 Women |
| Less than High School | 169 (8.0%) | 35.0 |
| High School Diploma | 724 (34.4%) | 104.0 |
| College or Associate's Degree | 951 (45.1%) | 107.0 |
| Bachelor's Degree | 232 (11.0%) | 63.0 |
| Graduate Degree | 32 (1.5%) | 18.0 |
| Total | 2,108 (100.0%) | 81.0 |
Fertility by Education by Marriage Status in El Cajon
29.8% of women with births in El Cajon are unmarried. Women with the educational attainment of graduate degree are most likely to be married with 100.0% of them married at childbirth, while women with the educational attainment of college or associate's degree are least likely to be married with 36.9% of them unmarried at childbirth.
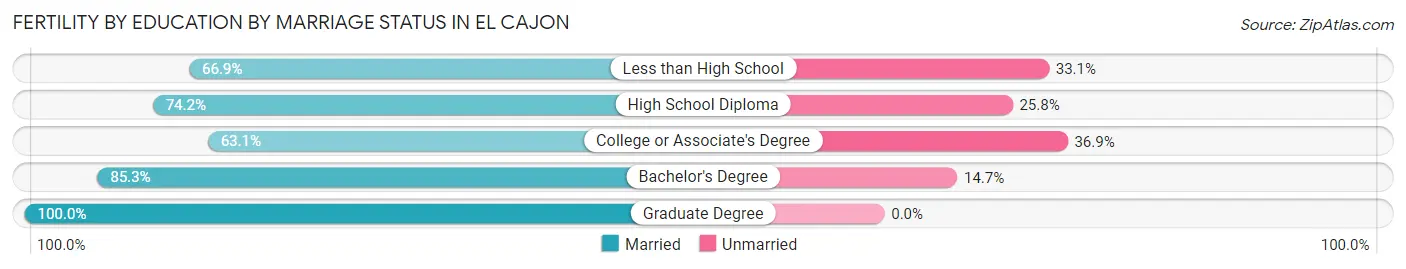
| Educational Attainment | Married | Unmarried |
| Less than High School | 113 (66.9%) | 56 (33.1%) |
| High School Diploma | 537 (74.2%) | 187 (25.8%) |
| College or Associate's Degree | 600 (63.1%) | 351 (36.9%) |
| Bachelor's Degree | 198 (85.3%) | 34 (14.7%) |
| Graduate Degree | 32 (100.0%) | 0 (0.0%) |
| Total | 1,480 (70.2%) | 628 (29.8%) |
Employment Characteristics in El Cajon
Employment by Class of Employer in El Cajon
Among the 45,983 employed individuals in El Cajon, private company employees (31,556 | 68.6%), not-for-profit organizations (4,456 | 9.7%), and local government employees (3,049 | 6.6%) make up the most common classes of employment.
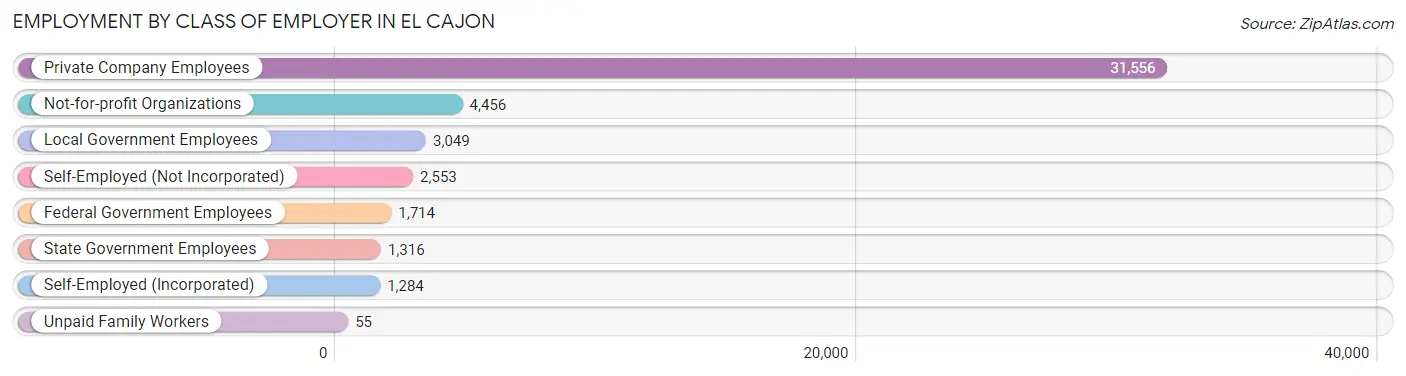
| Employer Class | # Employees | % Employees |
| Private Company Employees | 31,556 | 68.6% |
| Self-Employed (Incorporated) | 1,284 | 2.8% |
| Self-Employed (Not Incorporated) | 2,553 | 5.6% |
| Not-for-profit Organizations | 4,456 | 9.7% |
| Local Government Employees | 3,049 | 6.6% |
| State Government Employees | 1,316 | 2.9% |
| Federal Government Employees | 1,714 | 3.7% |
| Unpaid Family Workers | 55 | 0.1% |
| Total | 45,983 | 100.0% |
Employment Status by Age in El Cajon
According to the labor force statistics for El Cajon, out of the total population over 16 years of age (82,229), 62.3% or 51,229 individuals are in the labor force, with 8.1% or 4,150 of them unemployed. The age group with the highest labor force participation rate is 30 to 34 years, with 82.7% or 6,326 individuals in the labor force. Within the labor force, the 16 to 19 years age range has the highest percentage of unemployed individuals, with 23.6% or 425 of them being unemployed.
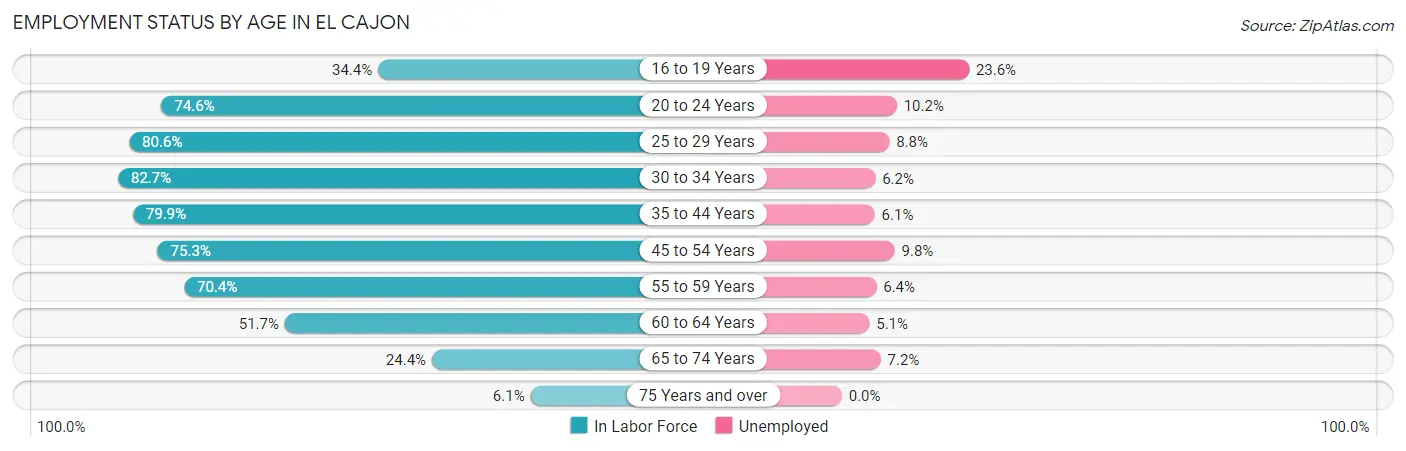
| Age Bracket | In Labor Force | Unemployed |
| 16 to 19 Years | 1,799 (34.4%) | 425 (23.6%) |
| 20 to 24 Years | 5,302 (74.6%) | 541 (10.2%) |
| 25 to 29 Years | 6,558 (80.6%) | 577 (8.8%) |
| 30 to 34 Years | 6,326 (82.7%) | 392 (6.2%) |
| 35 to 44 Years | 11,911 (79.9%) | 727 (6.1%) |
| 45 to 54 Years | 9,134 (75.3%) | 895 (9.8%) |
| 55 to 59 Years | 4,177 (70.4%) | 267 (6.4%) |
| 60 to 64 Years | 3,544 (51.7%) | 181 (5.1%) |
| 65 to 74 Years | 2,104 (24.4%) | 151 (7.2%) |
| 75 Years and over | 345 (6.1%) | 0 (0.0%) |
| Total | 51,229 (62.3%) | 4,150 (8.1%) |
Employment Status by Educational Attainment in El Cajon
According to labor force statistics for El Cajon, 74.9% of individuals (41,652) out of the total population between 25 and 64 years of age (55,610) are in the labor force, with 7.3% or 3,041 of them being unemployed. The group with the highest labor force participation rate are those with the educational attainment of bachelor's degree or higher, with 83.8% or 10,665 individuals in the labor force. Within the labor force, individuals with high school diploma education have the highest percentage of unemployment, with 9.4% or 1,118 of them being unemployed.
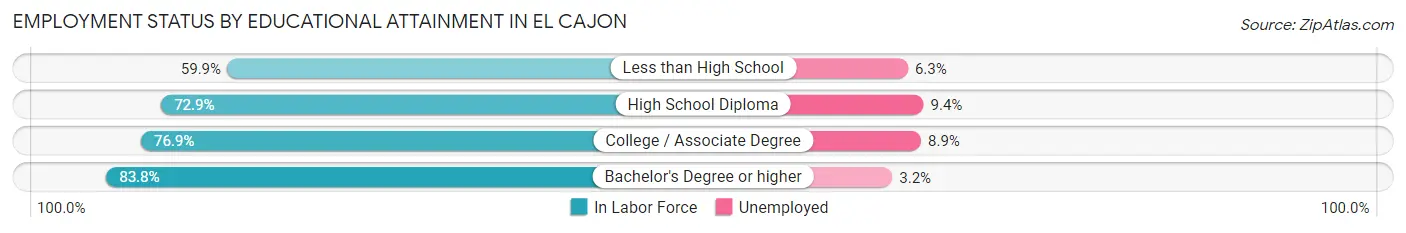
| Educational Attainment | In Labor Force | Unemployed |
| Less than High School | 4,724 (59.9%) | 497 (6.3%) |
| High School Diploma | 11,893 (72.9%) | 1,534 (9.4%) |
| College / Associate Degree | 14,366 (76.9%) | 1,663 (8.9%) |
| Bachelor's Degree or higher | 10,665 (83.8%) | 407 (3.2%) |
| Total | 41,652 (74.9%) | 4,060 (7.3%) |
Employment Occupations by Sex in El Cajon
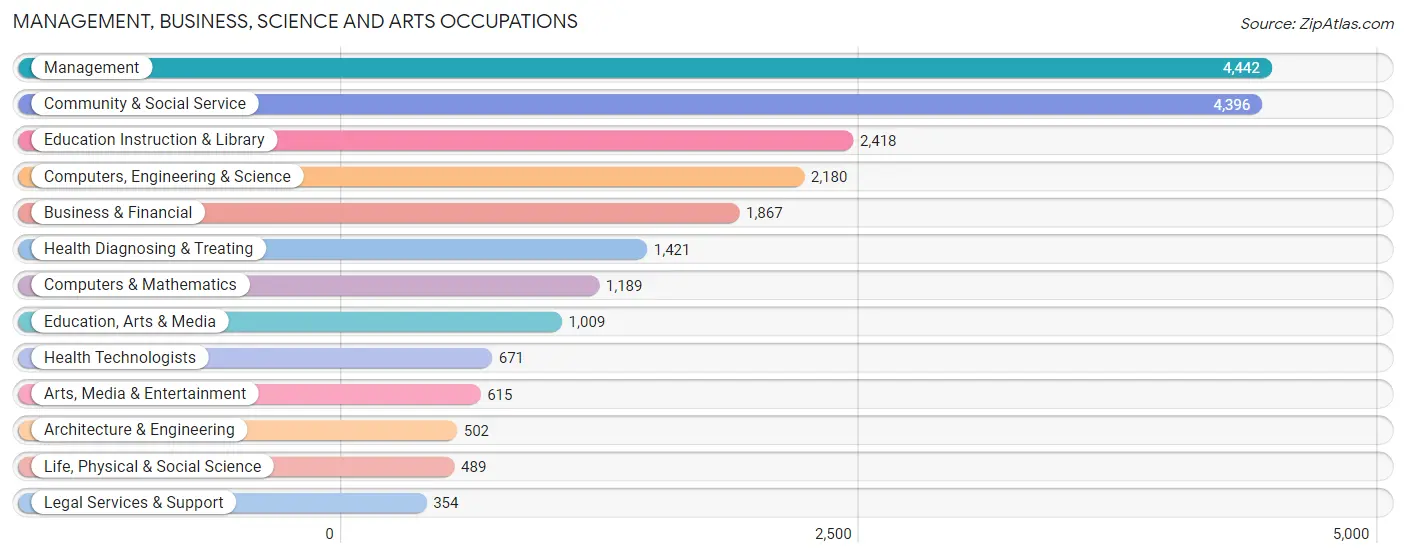
Management, Business, Science and Arts Occupations
The most common Management, Business, Science and Arts occupations in El Cajon are Management (4,442 | 9.5%), Community & Social Service (4,396 | 9.4%), Education Instruction & Library (2,418 | 5.2%), Computers, Engineering & Science (2,180 | 4.7%), and Business & Financial (1,867 | 4.0%).
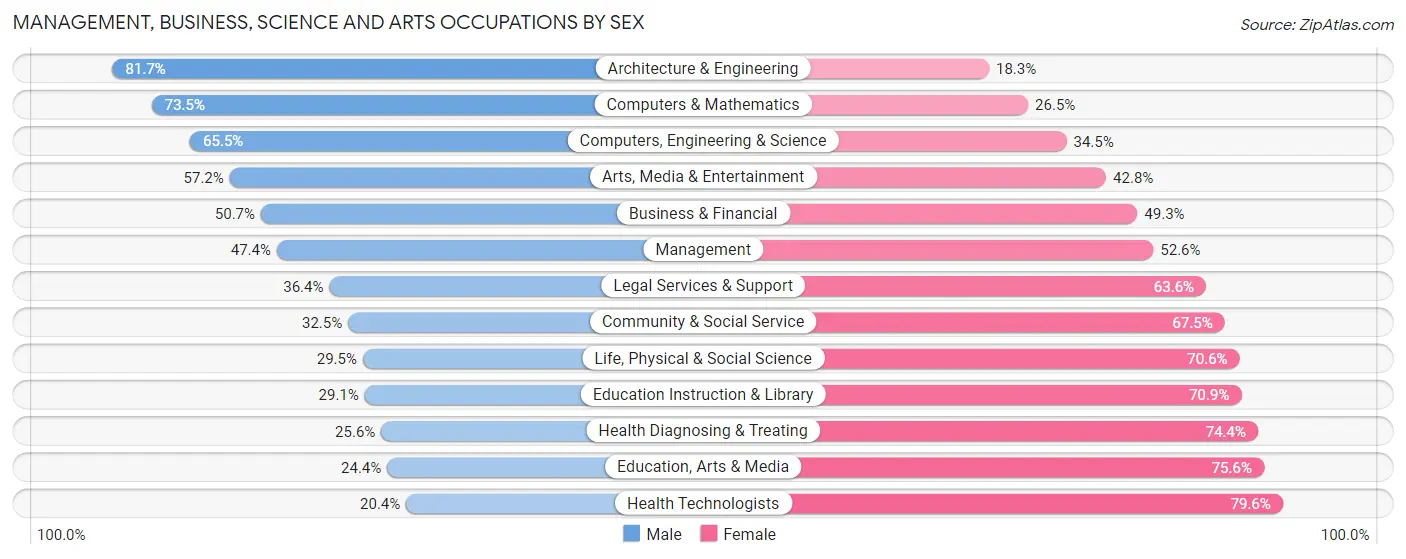
Management, Business, Science and Arts Occupations by Sex
Within the Management, Business, Science and Arts occupations in El Cajon, the most male-oriented occupations are Architecture & Engineering (81.7%), Computers & Mathematics (73.5%), and Computers, Engineering & Science (65.5%), while the most female-oriented occupations are Health Technologists (79.6%), Education, Arts & Media (75.6%), and Health Diagnosing & Treating (74.4%).
| Occupation | Male | Female |
| Management | 2,105 (47.4%) | 2,337 (52.6%) |
| Business & Financial | 947 (50.7%) | 920 (49.3%) |
| Computers, Engineering & Science | 1,428 (65.5%) | 752 (34.5%) |
| Computers & Mathematics | 874 (73.5%) | 315 (26.5%) |
| Architecture & Engineering | 410 (81.7%) | 92 (18.3%) |
| Life, Physical & Social Science | 144 (29.4%) | 345 (70.6%) |
| Community & Social Service | 1,430 (32.5%) | 2,966 (67.5%) |
| Education, Arts & Media | 246 (24.4%) | 763 (75.6%) |
| Legal Services & Support | 129 (36.4%) | 225 (63.6%) |
| Education Instruction & Library | 703 (29.1%) | 1,715 (70.9%) |
| Arts, Media & Entertainment | 352 (57.2%) | 263 (42.8%) |
| Health Diagnosing & Treating | 364 (25.6%) | 1,057 (74.4%) |
| Health Technologists | 137 (20.4%) | 534 (79.6%) |
| Total (Category) | 6,274 (43.9%) | 8,032 (56.1%) |
| Total (Overall) | 25,510 (54.7%) | 21,161 (45.3%) |
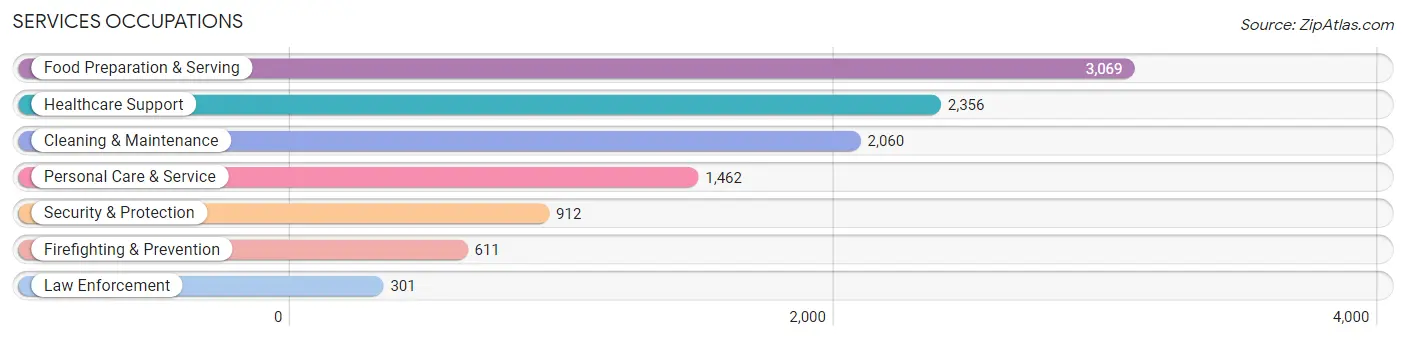
Services Occupations
The most common Services occupations in El Cajon are Food Preparation & Serving (3,069 | 6.6%), Healthcare Support (2,356 | 5.1%), Cleaning & Maintenance (2,060 | 4.4%), Personal Care & Service (1,462 | 3.1%), and Security & Protection (912 | 1.9%).
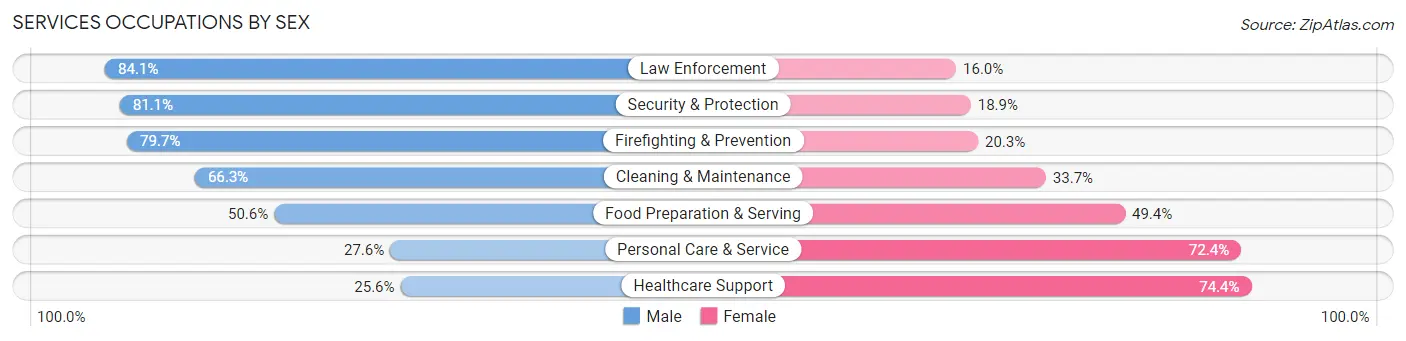
Services Occupations by Sex
Within the Services occupations in El Cajon, the most male-oriented occupations are Law Enforcement (84.1%), Security & Protection (81.1%), and Firefighting & Prevention (79.7%), while the most female-oriented occupations are Healthcare Support (74.4%), Personal Care & Service (72.4%), and Food Preparation & Serving (49.4%).
| Occupation | Male | Female |
| Healthcare Support | 603 (25.6%) | 1,753 (74.4%) |
| Security & Protection | 740 (81.1%) | 172 (18.9%) |
| Firefighting & Prevention | 487 (79.7%) | 124 (20.3%) |
| Law Enforcement | 253 (84.1%) | 48 (16.0%) |
| Food Preparation & Serving | 1,553 (50.6%) | 1,516 (49.4%) |
| Cleaning & Maintenance | 1,365 (66.3%) | 695 (33.7%) |
| Personal Care & Service | 404 (27.6%) | 1,058 (72.4%) |
| Total (Category) | 4,665 (47.3%) | 5,194 (52.7%) |
| Total (Overall) | 25,510 (54.7%) | 21,161 (45.3%) |
Sales and Office Occupations
The most common Sales and Office occupations in El Cajon are Sales & Related (5,718 | 12.2%), and Office & Administration (5,596 | 12.0%).

Sales and Office Occupations by Sex
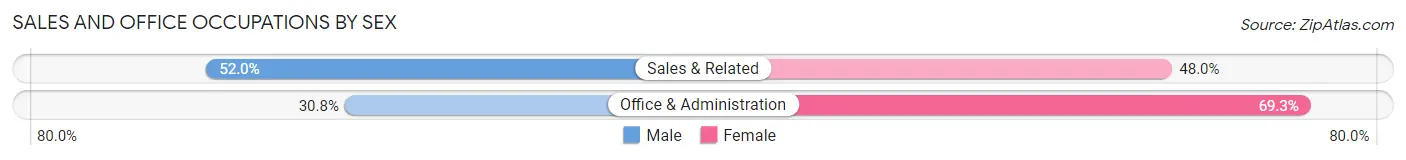
| Occupation | Male | Female |
| Sales & Related | 2,975 (52.0%) | 2,743 (48.0%) |
| Office & Administration | 1,721 (30.7%) | 3,875 (69.3%) |
| Total (Category) | 4,696 (41.5%) | 6,618 (58.5%) |
| Total (Overall) | 25,510 (54.7%) | 21,161 (45.3%) |
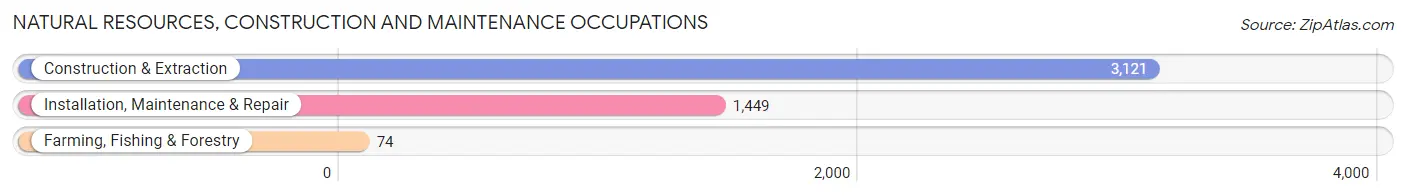
Natural Resources, Construction and Maintenance Occupations
The most common Natural Resources, Construction and Maintenance occupations in El Cajon are Construction & Extraction (3,121 | 6.7%), Installation, Maintenance & Repair (1,449 | 3.1%), and Farming, Fishing & Forestry (74 | 0.2%).
Natural Resources, Construction and Maintenance Occupations by Sex
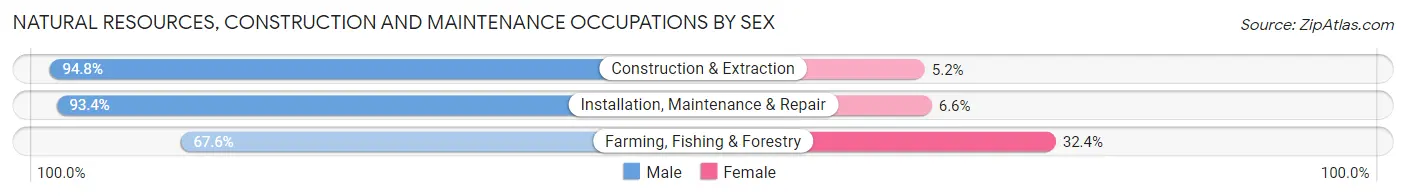
| Occupation | Male | Female |
| Farming, Fishing & Forestry | 50 (67.6%) | 24 (32.4%) |
| Construction & Extraction | 2,959 (94.8%) | 162 (5.2%) |
| Installation, Maintenance & Repair | 1,353 (93.4%) | 96 (6.6%) |
| Total (Category) | 4,362 (93.9%) | 282 (6.1%) |
| Total (Overall) | 25,510 (54.7%) | 21,161 (45.3%) |
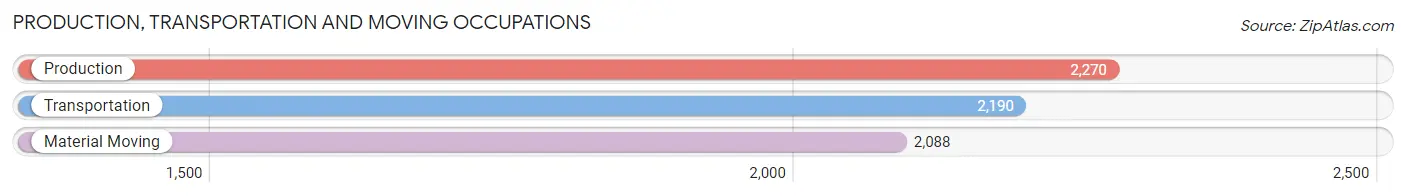
Production, Transportation and Moving Occupations
The most common Production, Transportation and Moving occupations in El Cajon are Production (2,270 | 4.9%), Transportation (2,190 | 4.7%), and Material Moving (2,088 | 4.5%).
Production, Transportation and Moving Occupations by Sex
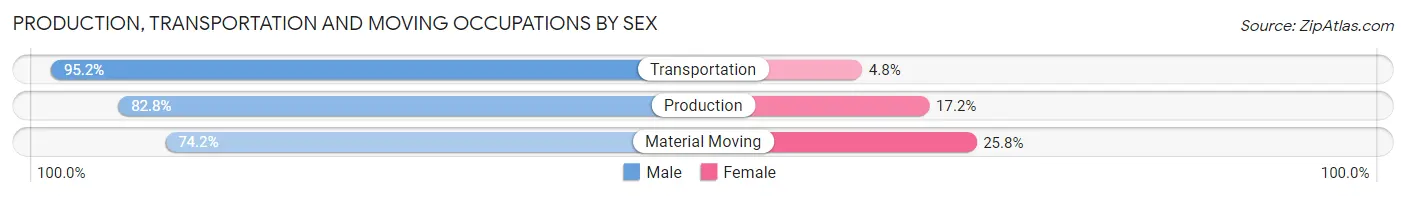
| Occupation | Male | Female |
| Production | 1,880 (82.8%) | 390 (17.2%) |
| Transportation | 2,084 (95.2%) | 106 (4.8%) |
| Material Moving | 1,549 (74.2%) | 539 (25.8%) |
| Total (Category) | 5,513 (84.2%) | 1,035 (15.8%) |
| Total (Overall) | 25,510 (54.7%) | 21,161 (45.3%) |
Employment Industries by Sex in El Cajon
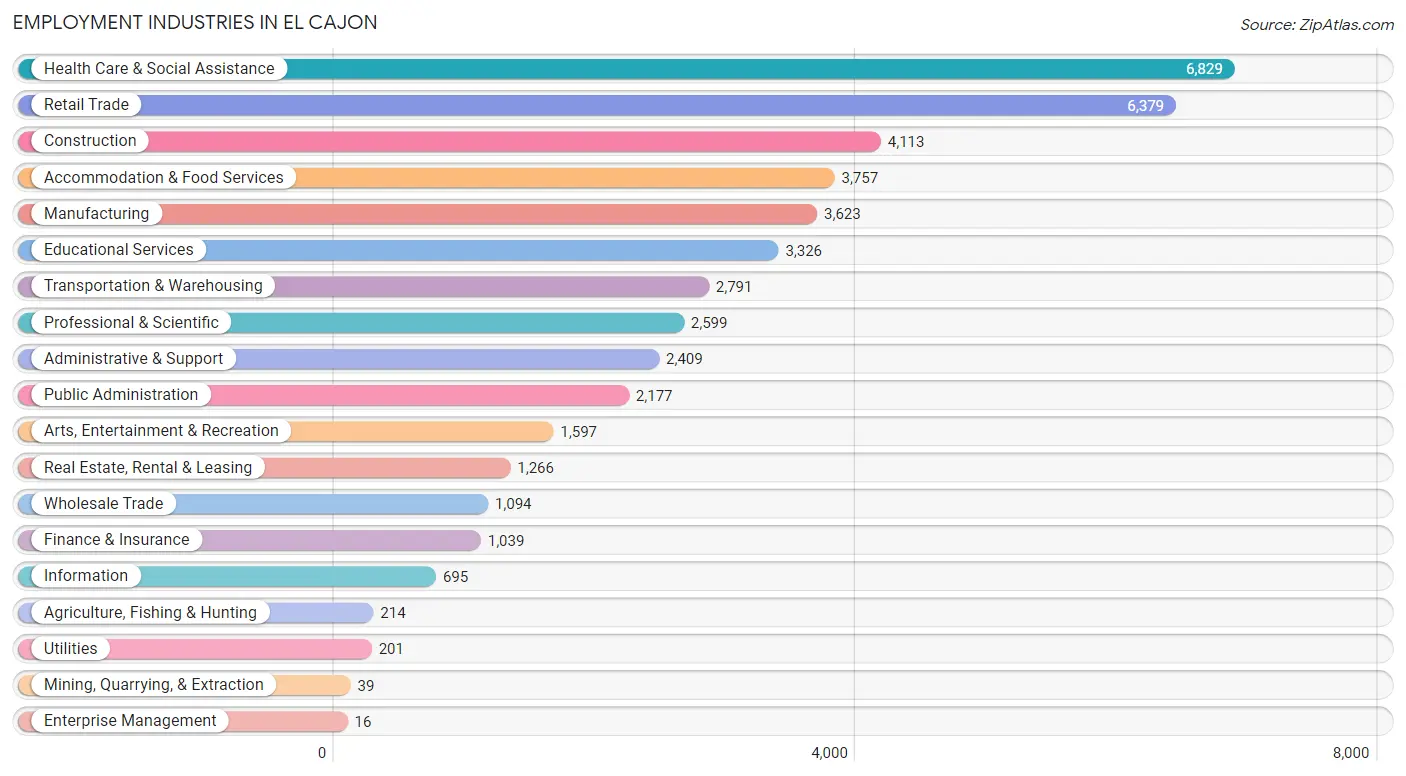
Employment Industries in El Cajon
The major employment industries in El Cajon include Health Care & Social Assistance (6,829 | 14.6%), Retail Trade (6,379 | 13.7%), Construction (4,113 | 8.8%), Accommodation & Food Services (3,757 | 8.1%), and Manufacturing (3,623 | 7.8%).
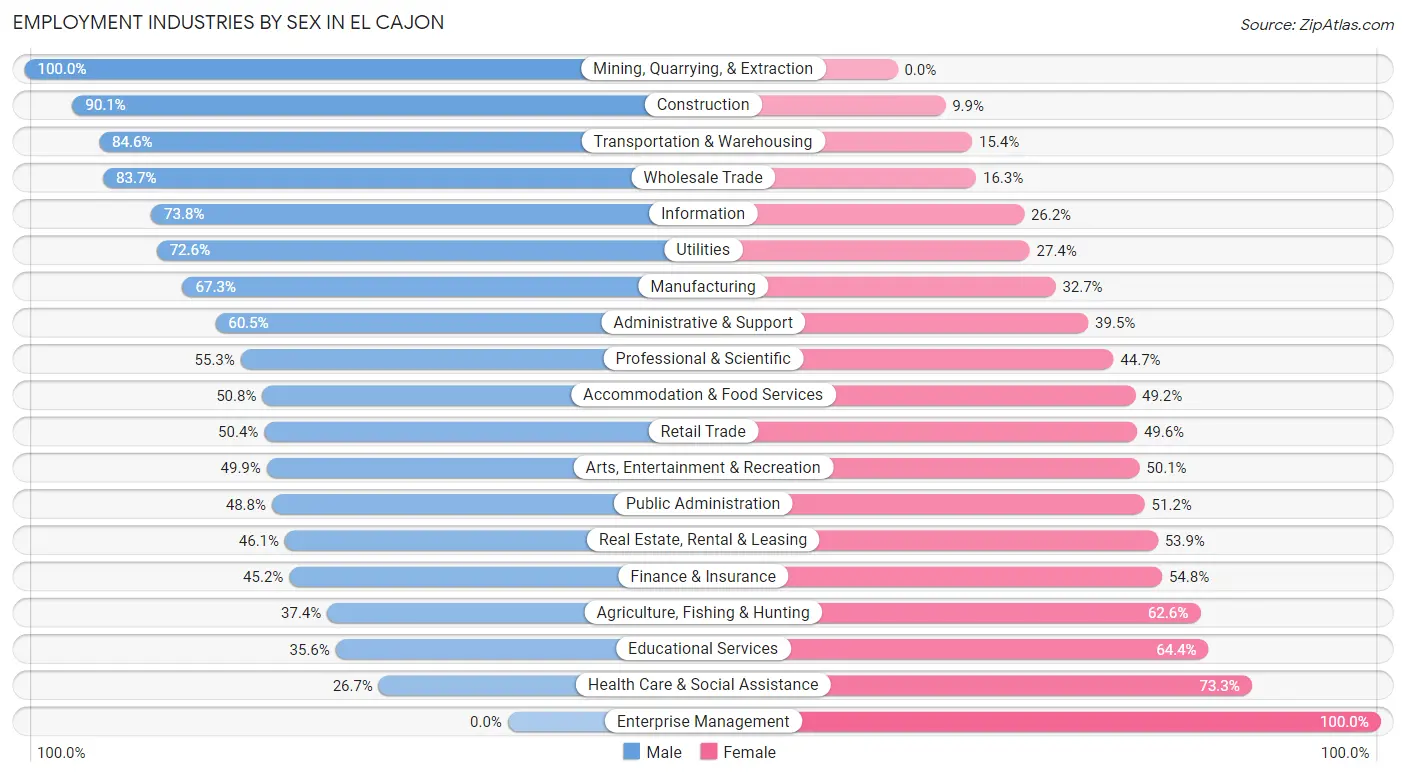
Employment Industries by Sex in El Cajon
The El Cajon industries that see more men than women are Mining, Quarrying, & Extraction (100.0%), Construction (90.1%), and Transportation & Warehousing (84.6%), whereas the industries that tend to have a higher number of women are Enterprise Management (100.0%), Health Care & Social Assistance (73.3%), and Educational Services (64.4%).
| Industry | Male | Female |
| Agriculture, Fishing & Hunting | 80 (37.4%) | 134 (62.6%) |
| Mining, Quarrying, & Extraction | 39 (100.0%) | 0 (0.0%) |
| Construction | 3,706 (90.1%) | 407 (9.9%) |
| Manufacturing | 2,438 (67.3%) | 1,185 (32.7%) |
| Wholesale Trade | 916 (83.7%) | 178 (16.3%) |
| Retail Trade | 3,216 (50.4%) | 3,163 (49.6%) |
| Transportation & Warehousing | 2,360 (84.6%) | 431 (15.4%) |
| Utilities | 146 (72.6%) | 55 (27.4%) |
| Information | 513 (73.8%) | 182 (26.2%) |
| Finance & Insurance | 470 (45.2%) | 569 (54.8%) |
| Real Estate, Rental & Leasing | 584 (46.1%) | 682 (53.9%) |
| Professional & Scientific | 1,437 (55.3%) | 1,162 (44.7%) |
| Enterprise Management | 0 (0.0%) | 16 (100.0%) |
| Administrative & Support | 1,458 (60.5%) | 951 (39.5%) |
| Educational Services | 1,185 (35.6%) | 2,141 (64.4%) |
| Health Care & Social Assistance | 1,824 (26.7%) | 5,005 (73.3%) |
| Arts, Entertainment & Recreation | 797 (49.9%) | 800 (50.1%) |
| Accommodation & Food Services | 1,909 (50.8%) | 1,848 (49.2%) |
| Public Administration | 1,063 (48.8%) | 1,114 (51.2%) |
| Total | 25,510 (54.7%) | 21,161 (45.3%) |
Education in El Cajon
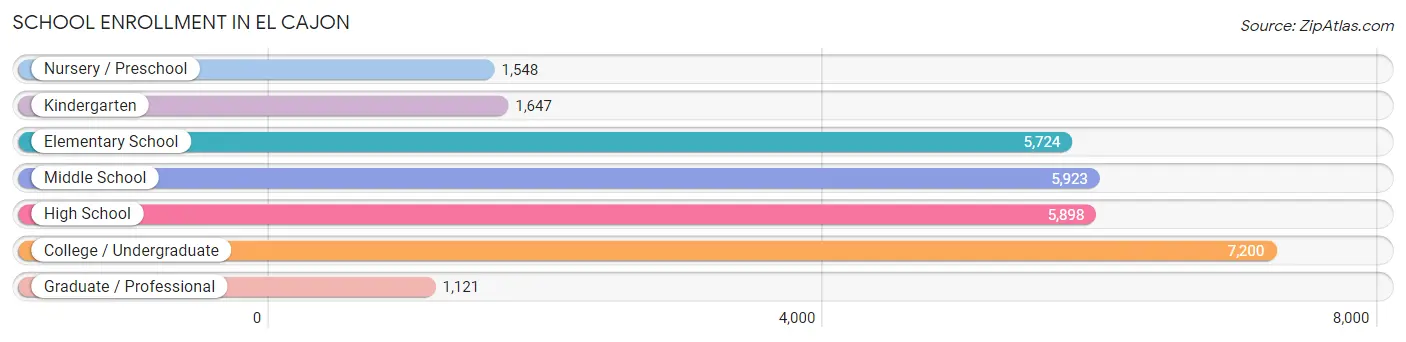
School Enrollment in El Cajon
The most common levels of schooling among the 29,061 students in El Cajon are college / undergraduate (7,200 | 24.8%), middle school (5,923 | 20.4%), and high school (5,898 | 20.3%).
| School Level | # Students | % Students |
| Nursery / Preschool | 1,548 | 5.3% |
| Kindergarten | 1,647 | 5.7% |
| Elementary School | 5,724 | 19.7% |
| Middle School | 5,923 | 20.4% |
| High School | 5,898 | 20.3% |
| College / Undergraduate | 7,200 | 24.8% |
| Graduate / Professional | 1,121 | 3.9% |
| Total | 29,061 | 100.0% |
School Enrollment by Age by Funding Source in El Cajon
Out of a total of 29,061 students who are enrolled in schools in El Cajon, 3,836 (13.2%) attend a private institution, while the remaining 25,225 (86.8%) are enrolled in public schools. The age group of 3 to 4 year olds has the highest likelihood of being enrolled in private schools, with 558 (39.0% in the age bracket) enrolled. Conversely, the age group of 15 to 17 year olds has the lowest likelihood of being enrolled in a private school, with 3,492 (92.8% in the age bracket) attending a public institution.
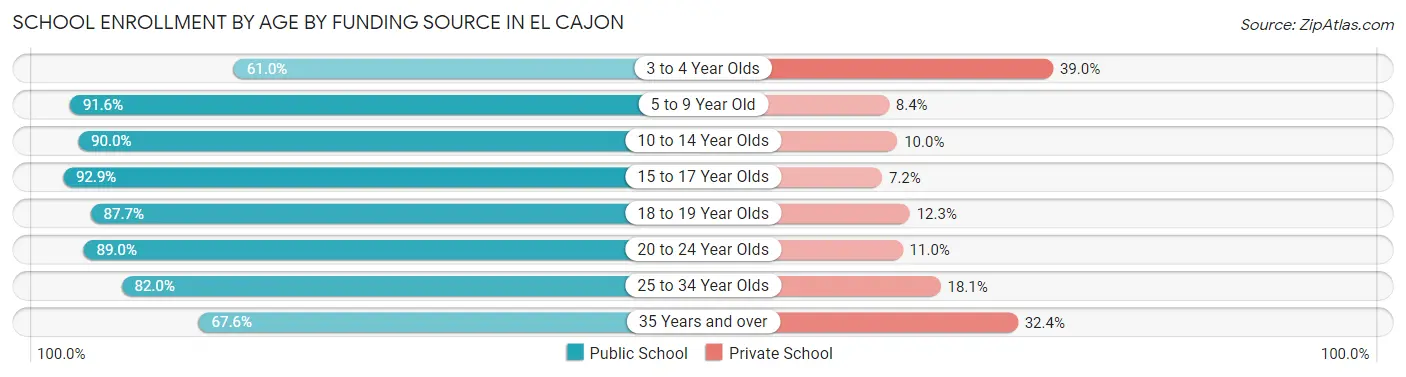
| Age Bracket | Public School | Private School |
| 3 to 4 Year Olds | 873 (61.0%) | 558 (39.0%) |
| 5 to 9 Year Old | 6,437 (91.6%) | 592 (8.4%) |
| 10 to 14 Year Olds | 6,572 (90.0%) | 729 (10.0%) |
| 15 to 17 Year Olds | 3,492 (92.8%) | 269 (7.1%) |
| 18 to 19 Year Olds | 1,761 (87.7%) | 247 (12.3%) |
| 20 to 24 Year Olds | 2,673 (89.0%) | 330 (11.0%) |
| 25 to 34 Year Olds | 1,997 (82.0%) | 440 (18.0%) |
| 35 Years and over | 1,413 (67.6%) | 678 (32.4%) |
| Total | 25,225 (86.8%) | 3,836 (13.2%) |
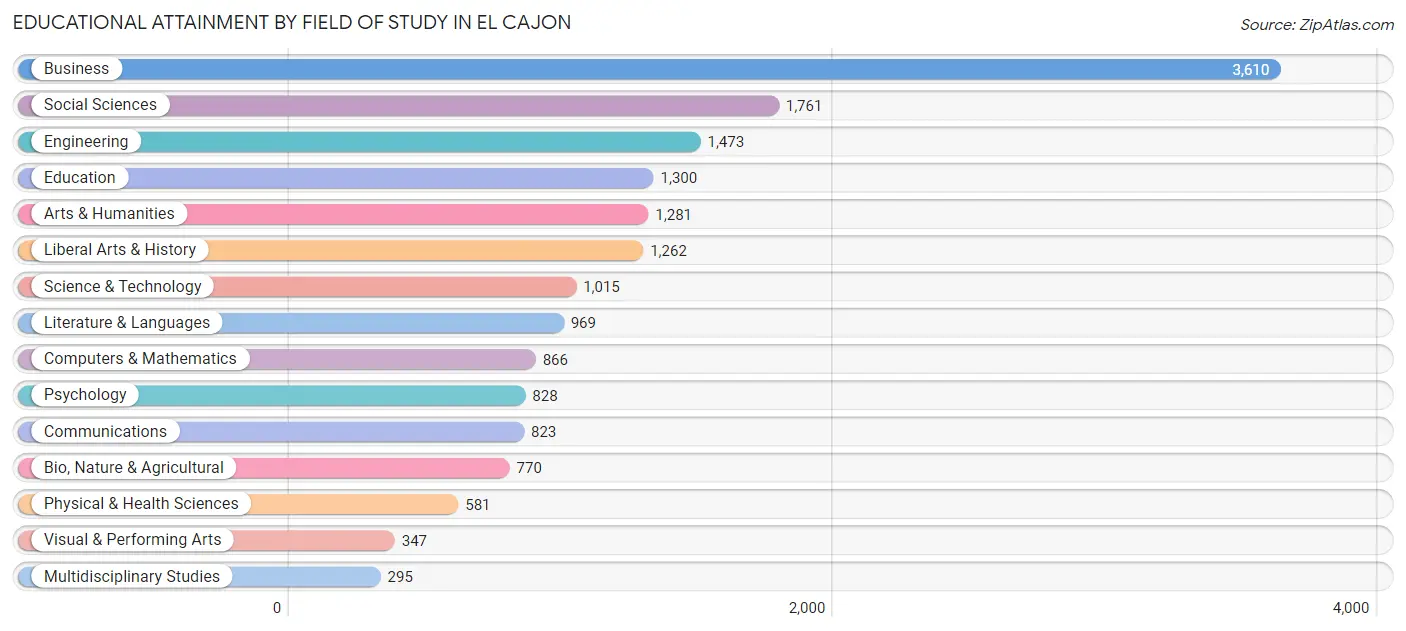
Educational Attainment by Field of Study in El Cajon
Business (3,610 | 21.0%), social sciences (1,761 | 10.2%), engineering (1,473 | 8.6%), education (1,300 | 7.6%), and arts & humanities (1,281 | 7.5%) are the most common fields of study among 17,181 individuals in El Cajon who have obtained a bachelor's degree or higher.
| Field of Study | # Graduates | % Graduates |
| Computers & Mathematics | 866 | 5.0% |
| Bio, Nature & Agricultural | 770 | 4.5% |
| Physical & Health Sciences | 581 | 3.4% |
| Psychology | 828 | 4.8% |
| Social Sciences | 1,761 | 10.2% |
| Engineering | 1,473 | 8.6% |
| Multidisciplinary Studies | 295 | 1.7% |
| Science & Technology | 1,015 | 5.9% |
| Business | 3,610 | 21.0% |
| Education | 1,300 | 7.6% |
| Literature & Languages | 969 | 5.6% |
| Liberal Arts & History | 1,262 | 7.3% |
| Visual & Performing Arts | 347 | 2.0% |
| Communications | 823 | 4.8% |
| Arts & Humanities | 1,281 | 7.5% |
| Total | 17,181 | 100.0% |
Transportation & Commute in El Cajon
Vehicle Availability by Sex in El Cajon
The most prevalent vehicle ownership categories in El Cajon are males with 2 vehicles (10,039, accounting for 40.1%) and females with 2 vehicles (8,010, making up 48.7%).
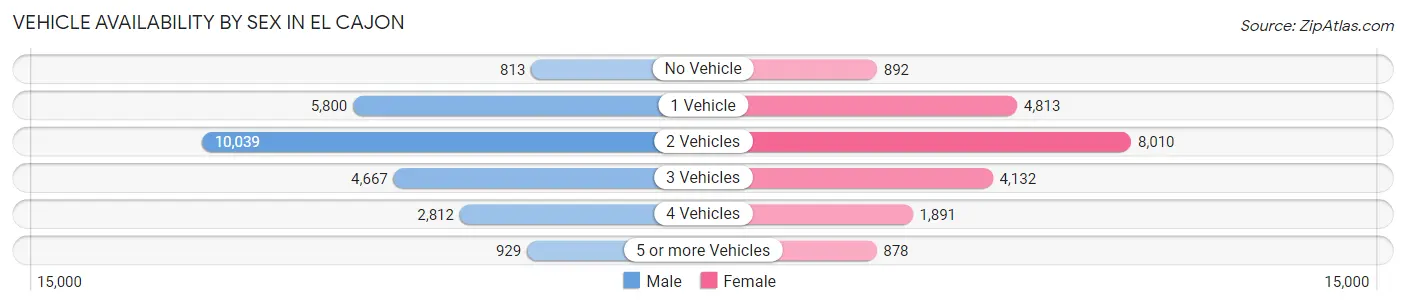
| Vehicles Available | Male | Female |
| No Vehicle | 813 (3.2%) | 892 (4.3%) |
| 1 Vehicle | 5,800 (23.1%) | 4,813 (23.4%) |
| 2 Vehicles | 10,039 (40.1%) | 8,010 (38.9%) |
| 3 Vehicles | 4,667 (18.6%) | 4,132 (20.0%) |
| 4 Vehicles | 2,812 (11.2%) | 1,891 (9.2%) |
| 5 or more Vehicles | 929 (3.7%) | 878 (4.3%) |
| Total | 25,060 (100.0%) | 20,616 (100.0%) |
Commute Time in El Cajon
The most frequently occuring commute durations in El Cajon are 15 to 19 minutes (7,324 commuters, 17.5%), 30 to 34 minutes (6,586 commuters, 15.7%), and 20 to 24 minutes (6,274 commuters, 15.0%).
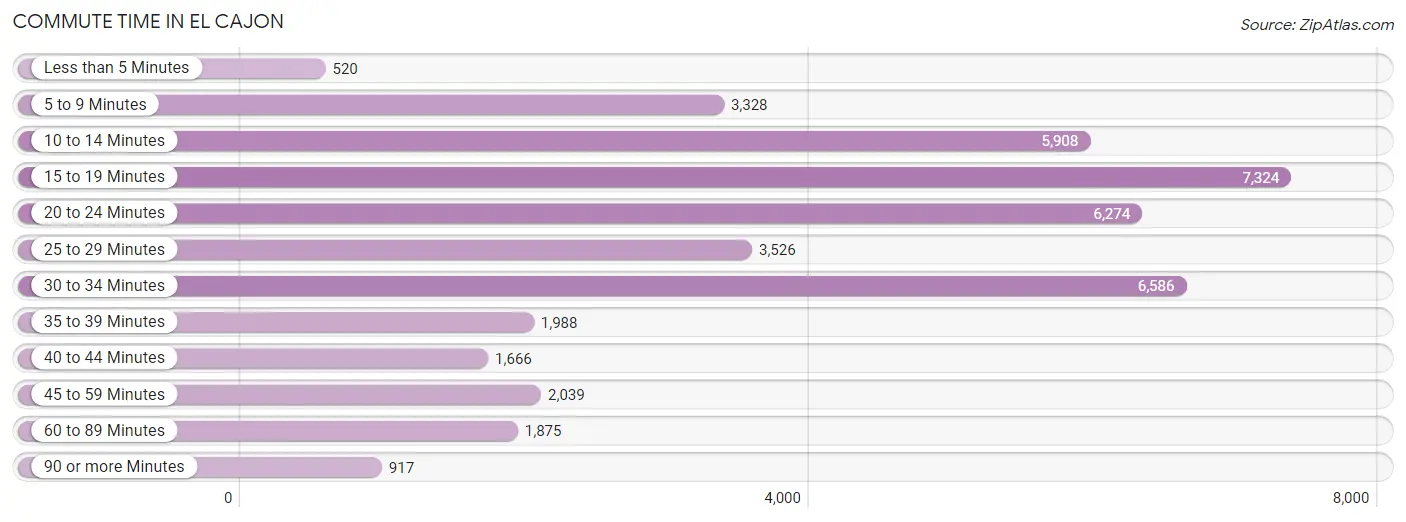
| Commute Time | # Commuters | % Commuters |
| Less than 5 Minutes | 520 | 1.2% |
| 5 to 9 Minutes | 3,328 | 7.9% |
| 10 to 14 Minutes | 5,908 | 14.1% |
| 15 to 19 Minutes | 7,324 | 17.5% |
| 20 to 24 Minutes | 6,274 | 15.0% |
| 25 to 29 Minutes | 3,526 | 8.4% |
| 30 to 34 Minutes | 6,586 | 15.7% |
| 35 to 39 Minutes | 1,988 | 4.7% |
| 40 to 44 Minutes | 1,666 | 4.0% |
| 45 to 59 Minutes | 2,039 | 4.9% |
| 60 to 89 Minutes | 1,875 | 4.5% |
| 90 or more Minutes | 917 | 2.2% |
Commute Time by Sex in El Cajon
The most common commute times in El Cajon are 15 to 19 minutes (4,046 commuters, 17.4%) for males and 15 to 19 minutes (3,278 commuters, 17.6%) for females.
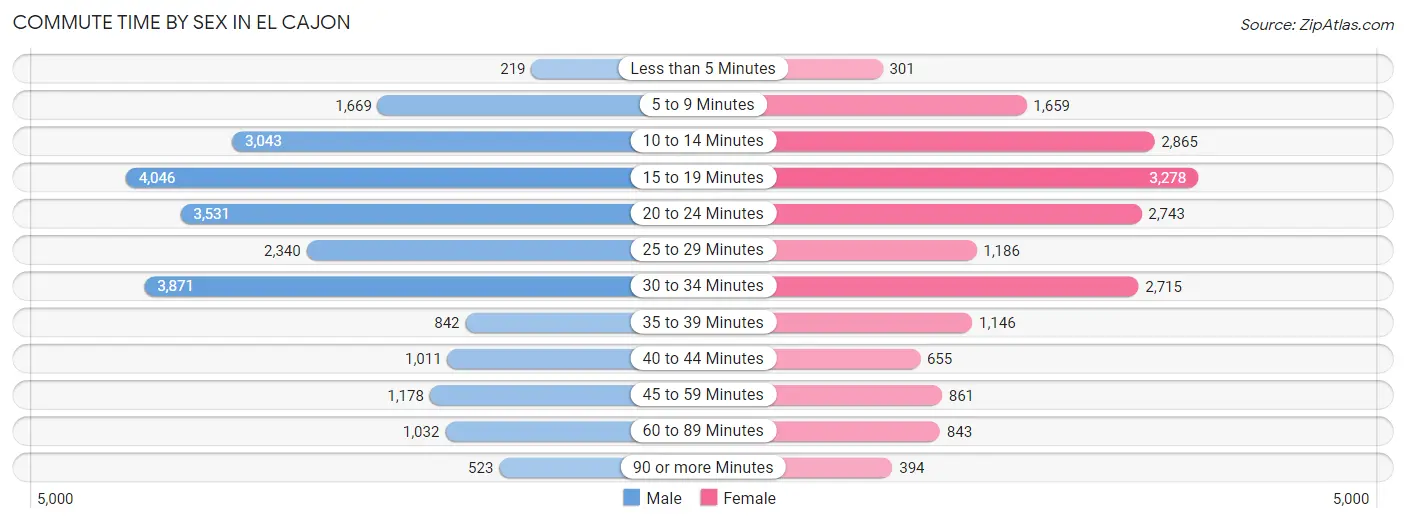
| Commute Time | Male | Female |
| Less than 5 Minutes | 219 (0.9%) | 301 (1.6%) |
| 5 to 9 Minutes | 1,669 (7.2%) | 1,659 (8.9%) |
| 10 to 14 Minutes | 3,043 (13.1%) | 2,865 (15.4%) |
| 15 to 19 Minutes | 4,046 (17.4%) | 3,278 (17.6%) |
| 20 to 24 Minutes | 3,531 (15.1%) | 2,743 (14.7%) |
| 25 to 29 Minutes | 2,340 (10.0%) | 1,186 (6.4%) |
| 30 to 34 Minutes | 3,871 (16.6%) | 2,715 (14.6%) |
| 35 to 39 Minutes | 842 (3.6%) | 1,146 (6.1%) |
| 40 to 44 Minutes | 1,011 (4.3%) | 655 (3.5%) |
| 45 to 59 Minutes | 1,178 (5.1%) | 861 (4.6%) |
| 60 to 89 Minutes | 1,032 (4.4%) | 843 (4.5%) |
| 90 or more Minutes | 523 (2.2%) | 394 (2.1%) |
Time of Departure to Work by Sex in El Cajon
The most frequent times of departure to work in El Cajon are 6:00 AM to 6:29 AM (2,774, 11.9%) for males and 7:00 AM to 7:29 AM (2,454, 13.2%) for females.
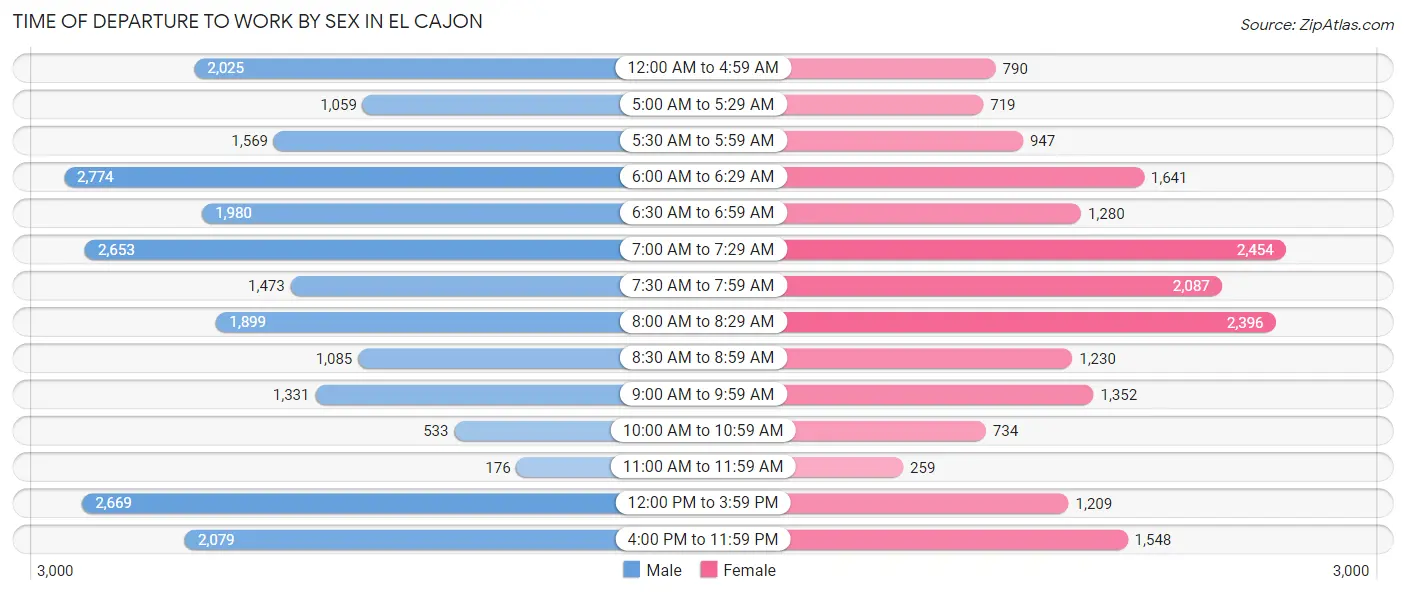
| Time of Departure | Male | Female |
| 12:00 AM to 4:59 AM | 2,025 (8.7%) | 790 (4.2%) |
| 5:00 AM to 5:29 AM | 1,059 (4.5%) | 719 (3.9%) |
| 5:30 AM to 5:59 AM | 1,569 (6.7%) | 947 (5.1%) |
| 6:00 AM to 6:29 AM | 2,774 (11.9%) | 1,641 (8.8%) |
| 6:30 AM to 6:59 AM | 1,980 (8.5%) | 1,280 (6.9%) |
| 7:00 AM to 7:29 AM | 2,653 (11.4%) | 2,454 (13.2%) |
| 7:30 AM to 7:59 AM | 1,473 (6.3%) | 2,087 (11.2%) |
| 8:00 AM to 8:29 AM | 1,899 (8.2%) | 2,396 (12.9%) |
| 8:30 AM to 8:59 AM | 1,085 (4.7%) | 1,230 (6.6%) |
| 9:00 AM to 9:59 AM | 1,331 (5.7%) | 1,352 (7.2%) |
| 10:00 AM to 10:59 AM | 533 (2.3%) | 734 (3.9%) |
| 11:00 AM to 11:59 AM | 176 (0.8%) | 259 (1.4%) |
| 12:00 PM to 3:59 PM | 2,669 (11.5%) | 1,209 (6.5%) |
| 4:00 PM to 11:59 PM | 2,079 (8.9%) | 1,548 (8.3%) |
| Total | 23,305 (100.0%) | 18,646 (100.0%) |
Housing Occupancy in El Cajon
Occupancy by Ownership in El Cajon
Of the total 34,624 dwellings in El Cajon, owner-occupied units account for 14,452 (41.7%), while renter-occupied units make up 20,172 (58.3%).
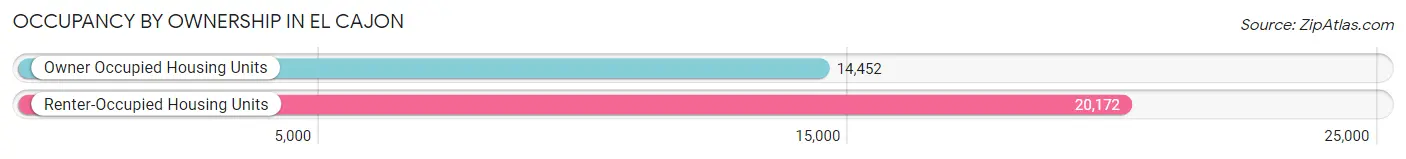
| Occupancy | # Housing Units | % Housing Units |
| Owner Occupied Housing Units | 14,452 | 41.7% |
| Renter-Occupied Housing Units | 20,172 | 58.3% |
| Total Occupied Housing Units | 34,624 | 100.0% |
Occupancy by Household Size in El Cajon
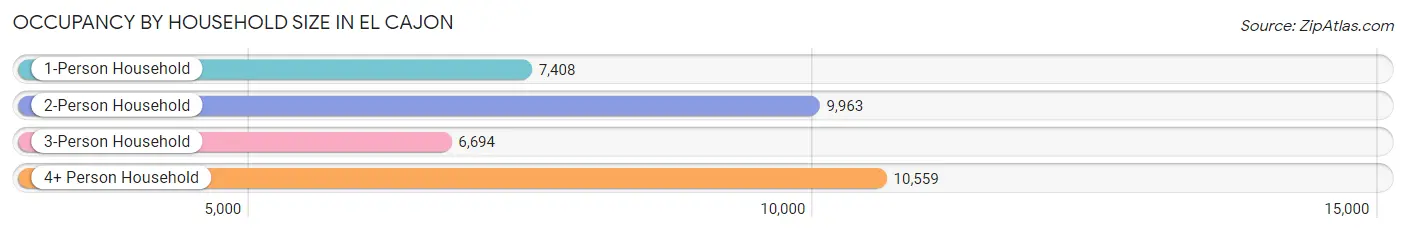
| Household Size | # Housing Units | % Housing Units |
| 1-Person Household | 7,408 | 21.4% |
| 2-Person Household | 9,963 | 28.8% |
| 3-Person Household | 6,694 | 19.3% |
| 4+ Person Household | 10,559 | 30.5% |
| Total Housing Units | 34,624 | 100.0% |
Occupancy by Ownership by Household Size in El Cajon
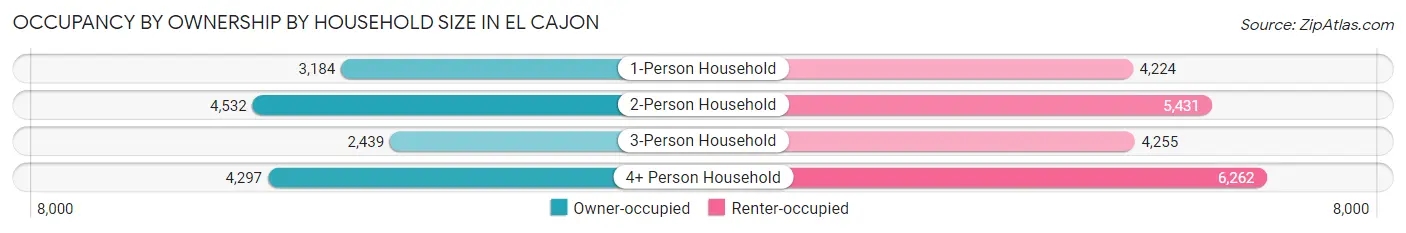
| Household Size | Owner-occupied | Renter-occupied |
| 1-Person Household | 3,184 (43.0%) | 4,224 (57.0%) |
| 2-Person Household | 4,532 (45.5%) | 5,431 (54.5%) |
| 3-Person Household | 2,439 (36.4%) | 4,255 (63.6%) |
| 4+ Person Household | 4,297 (40.7%) | 6,262 (59.3%) |
| Total Housing Units | 14,452 (41.7%) | 20,172 (58.3%) |
Occupancy by Educational Attainment in El Cajon
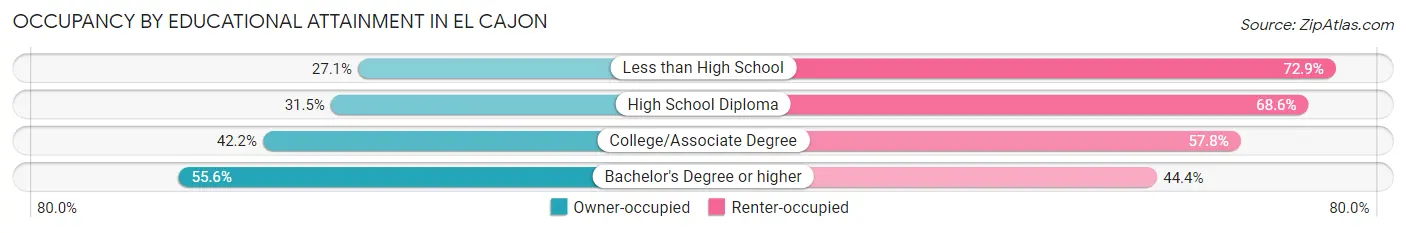
| Household Size | Owner-occupied | Renter-occupied |
| Less than High School | 937 (27.1%) | 2,515 (72.9%) |
| High School Diploma | 2,679 (31.5%) | 5,839 (68.5%) |
| College/Associate Degree | 5,544 (42.2%) | 7,587 (57.8%) |
| Bachelor's Degree or higher | 5,292 (55.6%) | 4,231 (44.4%) |
Occupancy by Age of Householder in El Cajon
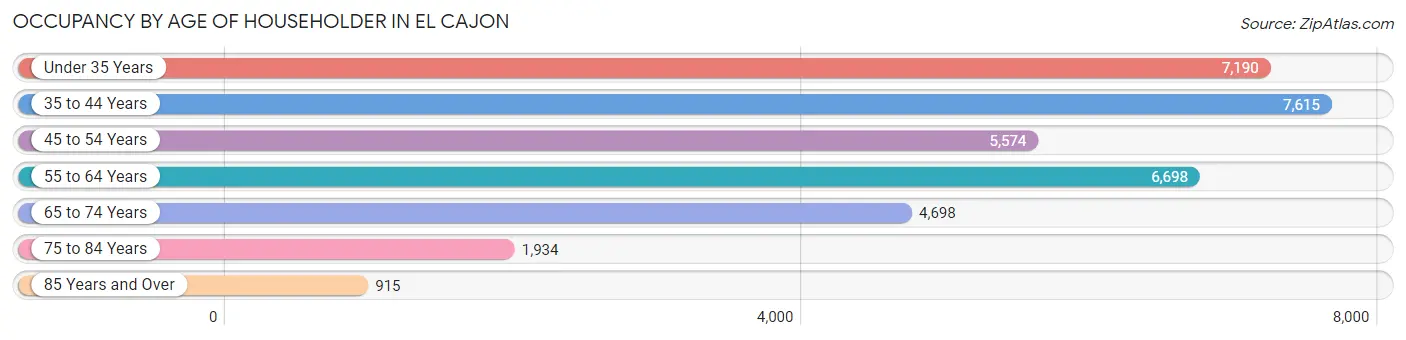
| Age Bracket | # Households | % Households |
| Under 35 Years | 7,190 | 20.8% |
| 35 to 44 Years | 7,615 | 22.0% |
| 45 to 54 Years | 5,574 | 16.1% |
| 55 to 64 Years | 6,698 | 19.3% |
| 65 to 74 Years | 4,698 | 13.6% |
| 75 to 84 Years | 1,934 | 5.6% |
| 85 Years and Over | 915 | 2.6% |
| Total | 34,624 | 100.0% |
Housing Finances in El Cajon
Median Income by Occupancy in El Cajon
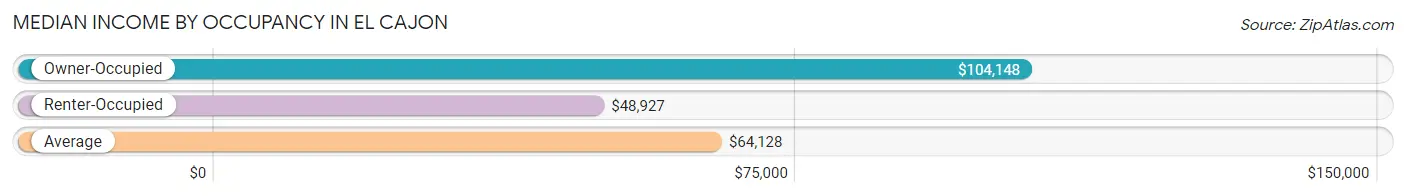
| Occupancy Type | # Households | Median Income |
| Owner-Occupied | 14,452 (41.7%) | $104,148 |
| Renter-Occupied | 20,172 (58.3%) | $48,927 |
| Average | 34,624 (100.0%) | $64,128 |
Occupancy by Householder Income Bracket in El Cajon
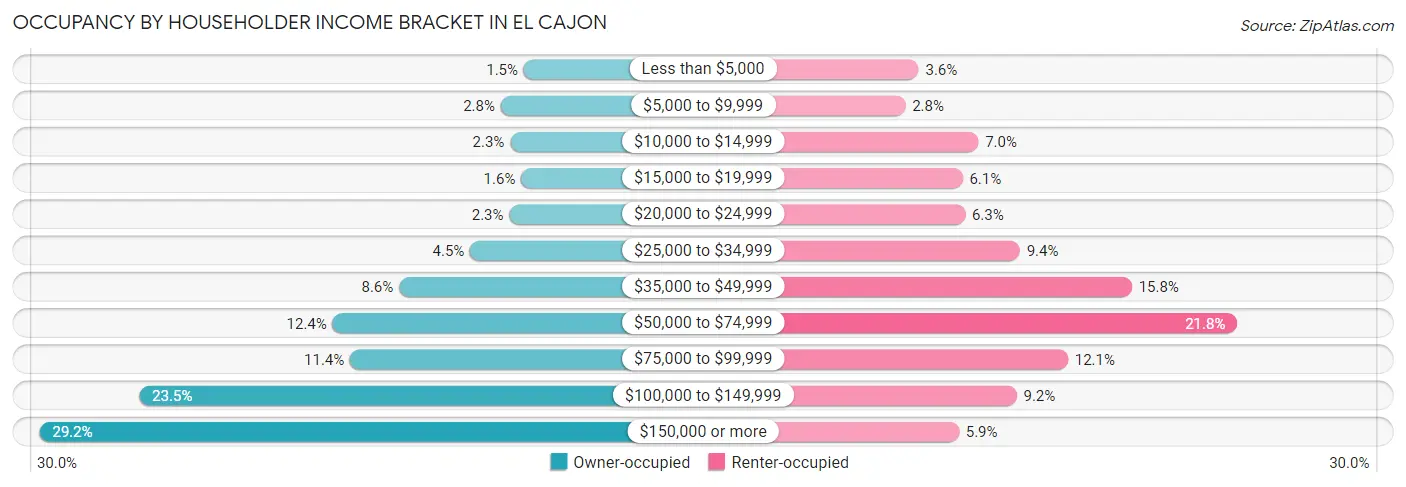
| Income Bracket | Owner-occupied | Renter-occupied |
| Less than $5,000 | 213 (1.5%) | 726 (3.6%) |
| $5,000 to $9,999 | 403 (2.8%) | 572 (2.8%) |
| $10,000 to $14,999 | 325 (2.2%) | 1,414 (7.0%) |
| $15,000 to $19,999 | 234 (1.6%) | 1,232 (6.1%) |
| $20,000 to $24,999 | 333 (2.3%) | 1,260 (6.2%) |
| $25,000 to $34,999 | 656 (4.5%) | 1,893 (9.4%) |
| $35,000 to $49,999 | 1,243 (8.6%) | 3,183 (15.8%) |
| $50,000 to $74,999 | 1,792 (12.4%) | 4,400 (21.8%) |
| $75,000 to $99,999 | 1,648 (11.4%) | 2,447 (12.1%) |
| $100,000 to $149,999 | 3,391 (23.5%) | 1,855 (9.2%) |
| $150,000 or more | 4,214 (29.2%) | 1,190 (5.9%) |
| Total | 14,452 (100.0%) | 20,172 (100.0%) |
Monthly Housing Cost Tiers in El Cajon
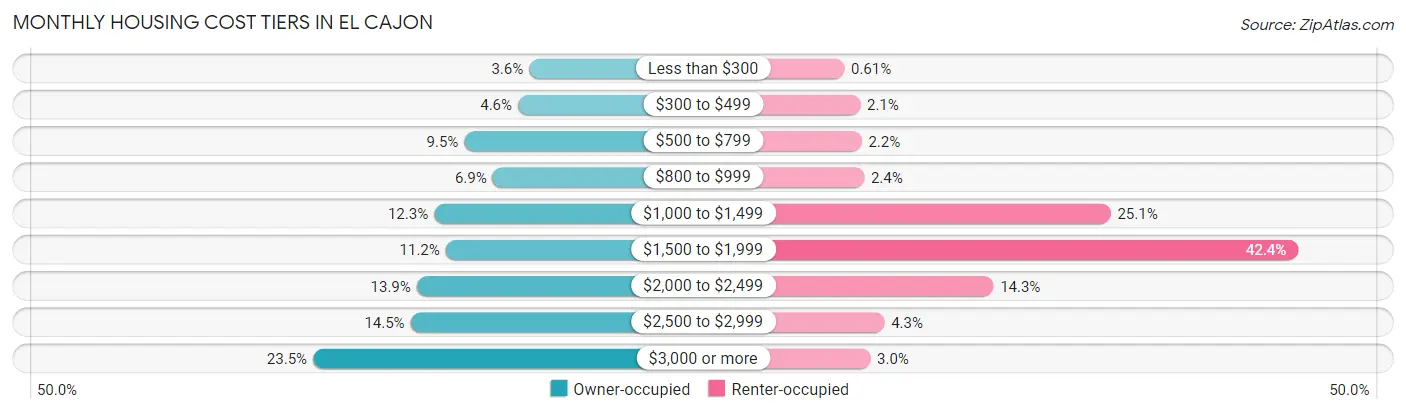
| Monthly Cost | Owner-occupied | Renter-occupied |
| Less than $300 | 515 (3.6%) | 123 (0.6%) |
| $300 to $499 | 664 (4.6%) | 419 (2.1%) |
| $500 to $799 | 1,377 (9.5%) | 445 (2.2%) |
| $800 to $999 | 1,000 (6.9%) | 492 (2.4%) |
| $1,000 to $1,499 | 1,779 (12.3%) | 5,072 (25.1%) |
| $1,500 to $1,999 | 1,625 (11.2%) | 8,555 (42.4%) |
| $2,000 to $2,499 | 2,010 (13.9%) | 2,893 (14.3%) |
| $2,500 to $2,999 | 2,092 (14.5%) | 869 (4.3%) |
| $3,000 or more | 3,390 (23.5%) | 608 (3.0%) |
| Total | 14,452 (100.0%) | 20,172 (100.0%) |
Physical Housing Characteristics in El Cajon
Housing Structures in El Cajon
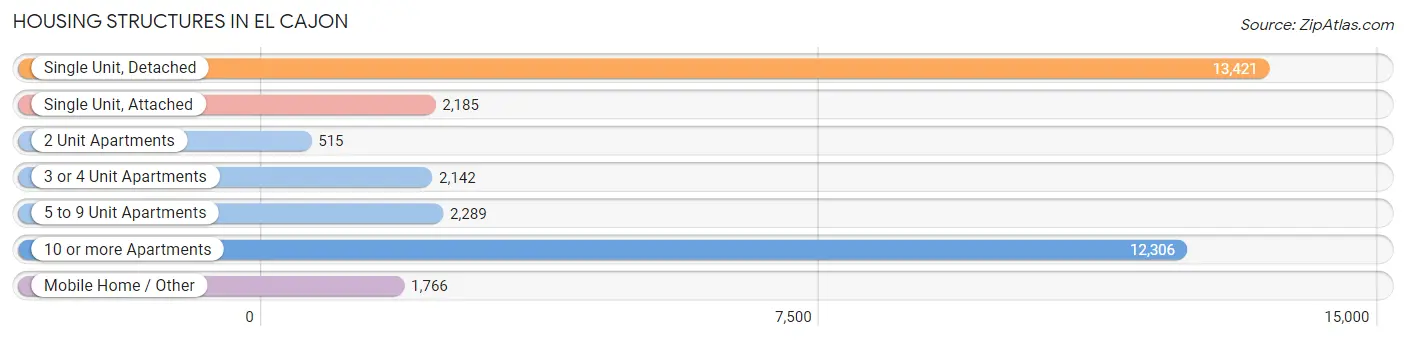
| Structure Type | # Housing Units | % Housing Units |
| Single Unit, Detached | 13,421 | 38.8% |
| Single Unit, Attached | 2,185 | 6.3% |
| 2 Unit Apartments | 515 | 1.5% |
| 3 or 4 Unit Apartments | 2,142 | 6.2% |
| 5 to 9 Unit Apartments | 2,289 | 6.6% |
| 10 or more Apartments | 12,306 | 35.5% |
| Mobile Home / Other | 1,766 | 5.1% |
| Total | 34,624 | 100.0% |
Housing Structures by Occupancy in El Cajon
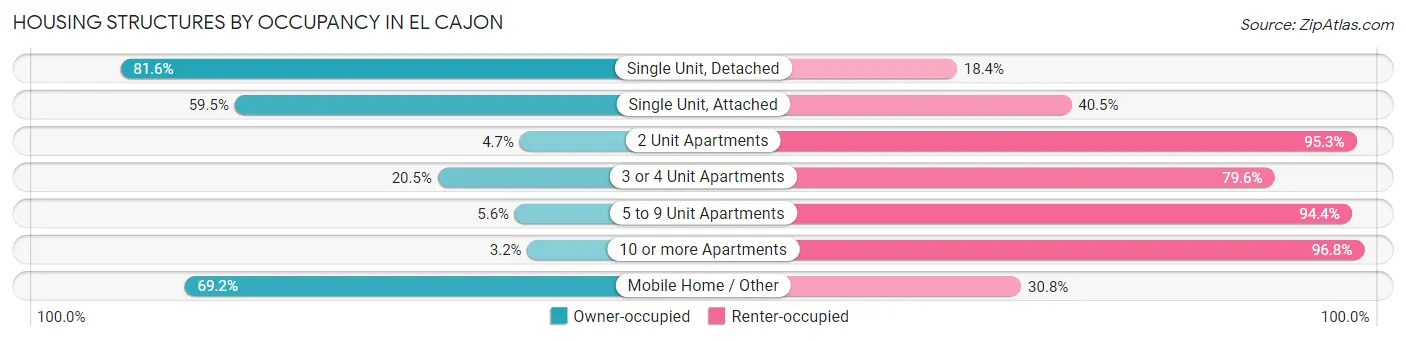
| Structure Type | Owner-occupied | Renter-occupied |
| Single Unit, Detached | 10,947 (81.6%) | 2,474 (18.4%) |
| Single Unit, Attached | 1,301 (59.5%) | 884 (40.5%) |
| 2 Unit Apartments | 24 (4.7%) | 491 (95.3%) |
| 3 or 4 Unit Apartments | 438 (20.4%) | 1,704 (79.5%) |
| 5 to 9 Unit Apartments | 128 (5.6%) | 2,161 (94.4%) |
| 10 or more Apartments | 392 (3.2%) | 11,914 (96.8%) |
| Mobile Home / Other | 1,222 (69.2%) | 544 (30.8%) |
| Total | 14,452 (41.7%) | 20,172 (58.3%) |
Housing Structures by Number of Rooms in El Cajon
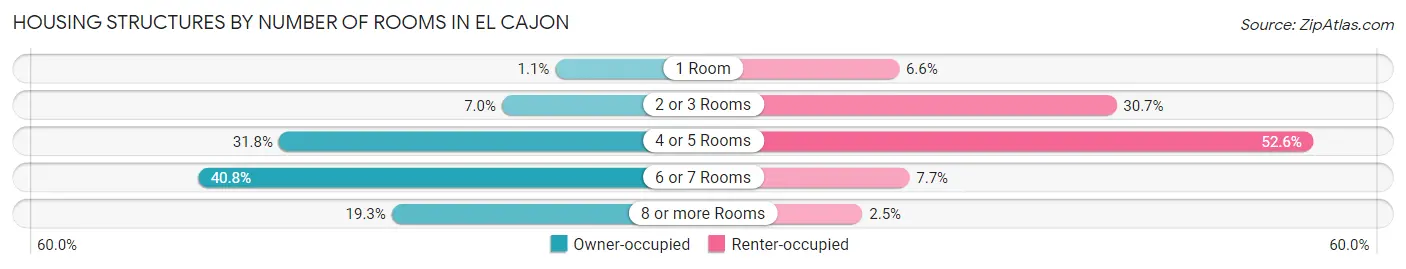
| Number of Rooms | Owner-occupied | Renter-occupied |
| 1 Room | 161 (1.1%) | 1,321 (6.6%) |
| 2 or 3 Rooms | 1,018 (7.0%) | 6,188 (30.7%) |
| 4 or 5 Rooms | 4,594 (31.8%) | 10,605 (52.6%) |
| 6 or 7 Rooms | 5,894 (40.8%) | 1,556 (7.7%) |
| 8 or more Rooms | 2,785 (19.3%) | 502 (2.5%) |
| Total | 14,452 (100.0%) | 20,172 (100.0%) |
Housing Structure by Heating Type in El Cajon
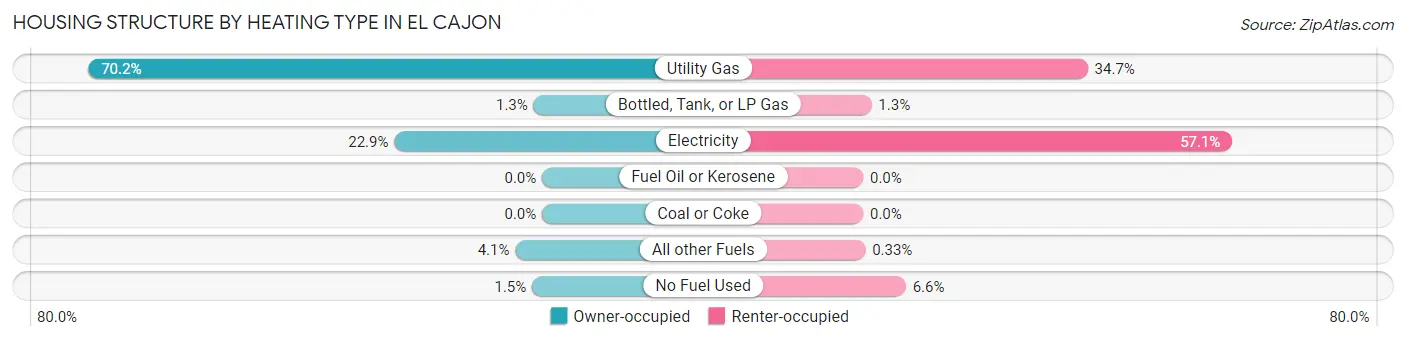
| Heating Type | Owner-occupied | Renter-occupied |
| Utility Gas | 10,139 (70.2%) | 7,004 (34.7%) |
| Bottled, Tank, or LP Gas | 190 (1.3%) | 260 (1.3%) |
| Electricity | 3,302 (22.9%) | 11,510 (57.1%) |
| Fuel Oil or Kerosene | 0 (0.0%) | 0 (0.0%) |
| Coal or Coke | 0 (0.0%) | 0 (0.0%) |
| All other Fuels | 598 (4.1%) | 66 (0.3%) |
| No Fuel Used | 223 (1.5%) | 1,332 (6.6%) |
| Total | 14,452 (100.0%) | 20,172 (100.0%) |
Household Vehicle Usage in El Cajon
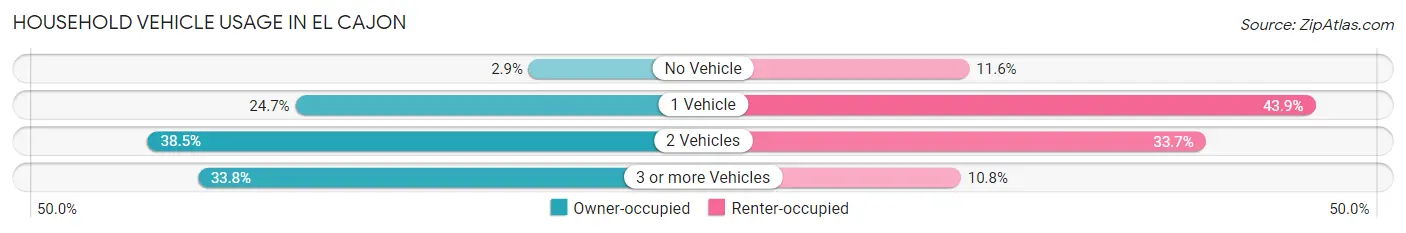
| Vehicles per Household | Owner-occupied | Renter-occupied |
| No Vehicle | 423 (2.9%) | 2,344 (11.6%) |
| 1 Vehicle | 3,572 (24.7%) | 8,856 (43.9%) |
| 2 Vehicles | 5,566 (38.5%) | 6,789 (33.7%) |
| 3 or more Vehicles | 4,891 (33.8%) | 2,183 (10.8%) |
| Total | 14,452 (100.0%) | 20,172 (100.0%) |
Real Estate & Mortgages in El Cajon
Real Estate and Mortgage Overview in El Cajon
| Characteristic | Without Mortgage | With Mortgage |
| Housing Units | 4,229 | 10,223 |
| Median Property Value | $550,100 | $606,200 |
| Median Household Income | $64,339 | $3,590 |
| Monthly Housing Costs | $750 | $3,390 |
| Real Estate Taxes | $3,111 | $248 |
Property Value by Mortgage Status in El Cajon
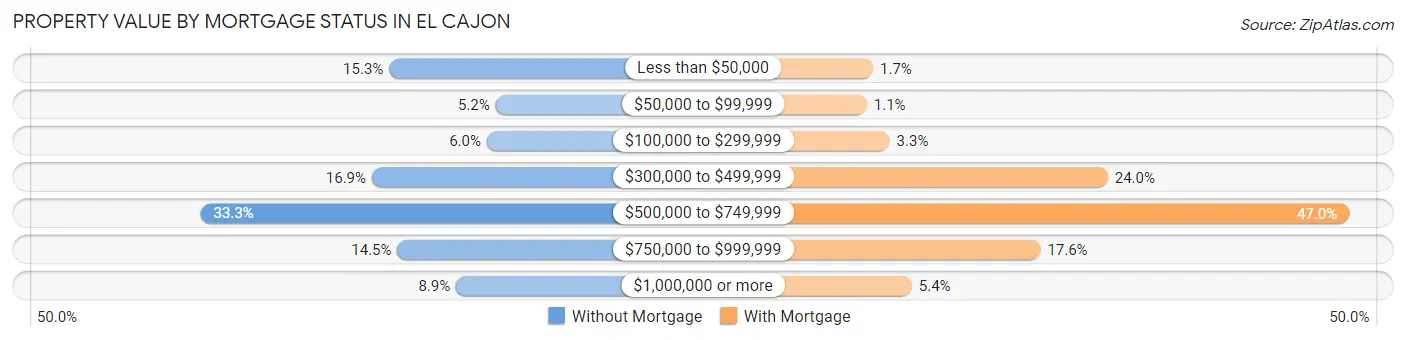
| Property Value | Without Mortgage | With Mortgage |
| Less than $50,000 | 646 (15.3%) | 171 (1.7%) |
| $50,000 to $99,999 | 218 (5.1%) | 110 (1.1%) |
| $100,000 to $299,999 | 253 (6.0%) | 332 (3.3%) |
| $300,000 to $499,999 | 716 (16.9%) | 2,456 (24.0%) |
| $500,000 to $749,999 | 1,406 (33.3%) | 4,806 (47.0%) |
| $750,000 to $999,999 | 613 (14.5%) | 1,800 (17.6%) |
| $1,000,000 or more | 377 (8.9%) | 548 (5.4%) |
| Total | 4,229 (100.0%) | 10,223 (100.0%) |
Household Income by Mortgage Status in El Cajon
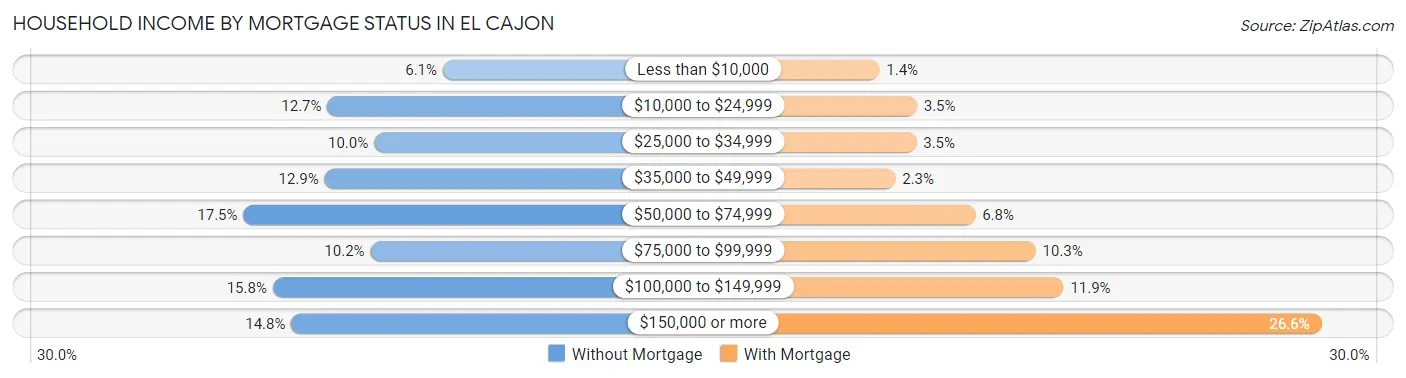
| Household Income | Without Mortgage | With Mortgage |
| Less than $10,000 | 258 (6.1%) | 139 (1.4%) |
| $10,000 to $24,999 | 537 (12.7%) | 358 (3.5%) |
| $25,000 to $34,999 | 424 (10.0%) | 355 (3.5%) |
| $35,000 to $49,999 | 544 (12.9%) | 232 (2.3%) |
| $50,000 to $74,999 | 740 (17.5%) | 699 (6.8%) |
| $75,000 to $99,999 | 433 (10.2%) | 1,052 (10.3%) |
| $100,000 to $149,999 | 669 (15.8%) | 1,215 (11.9%) |
| $150,000 or more | 624 (14.8%) | 2,722 (26.6%) |
| Total | 4,229 (100.0%) | 10,223 (100.0%) |
Property Value to Household Income Ratio in El Cajon
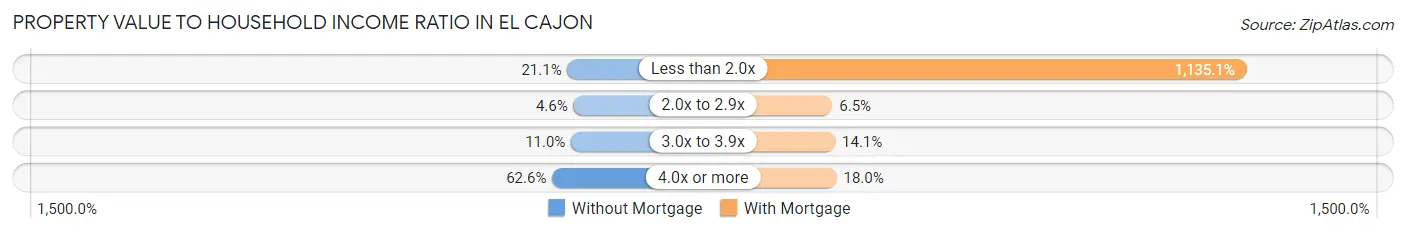
| Value-to-Income Ratio | Without Mortgage | With Mortgage |
| Less than 2.0x | 892 (21.1%) | 116,037 (1,135.1%) |
| 2.0x to 2.9x | 193 (4.6%) | 668 (6.5%) |
| 3.0x to 3.9x | 464 (11.0%) | 1,436 (14.1%) |
| 4.0x or more | 2,649 (62.6%) | 1,842 (18.0%) |
| Total | 4,229 (100.0%) | 10,223 (100.0%) |
Real Estate Taxes by Mortgage Status in El Cajon
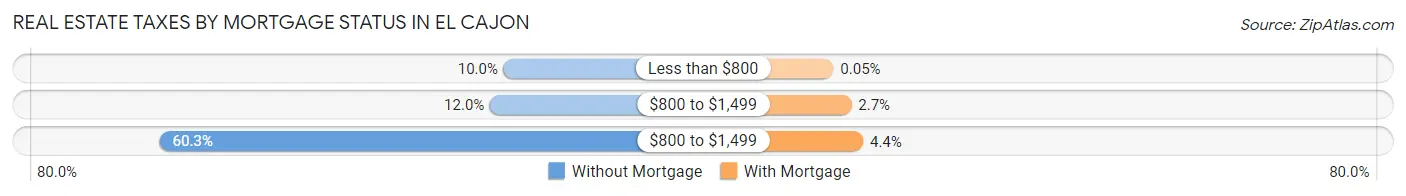
| Property Taxes | Without Mortgage | With Mortgage |
| Less than $800 | 422 (10.0%) | 5 (0.1%) |
| $800 to $1,499 | 506 (12.0%) | 273 (2.7%) |
| $800 to $1,499 | 2,549 (60.3%) | 448 (4.4%) |
| Total | 4,229 (100.0%) | 10,223 (100.0%) |
Health & Disability in El Cajon
Health Insurance Coverage by Age in El Cajon
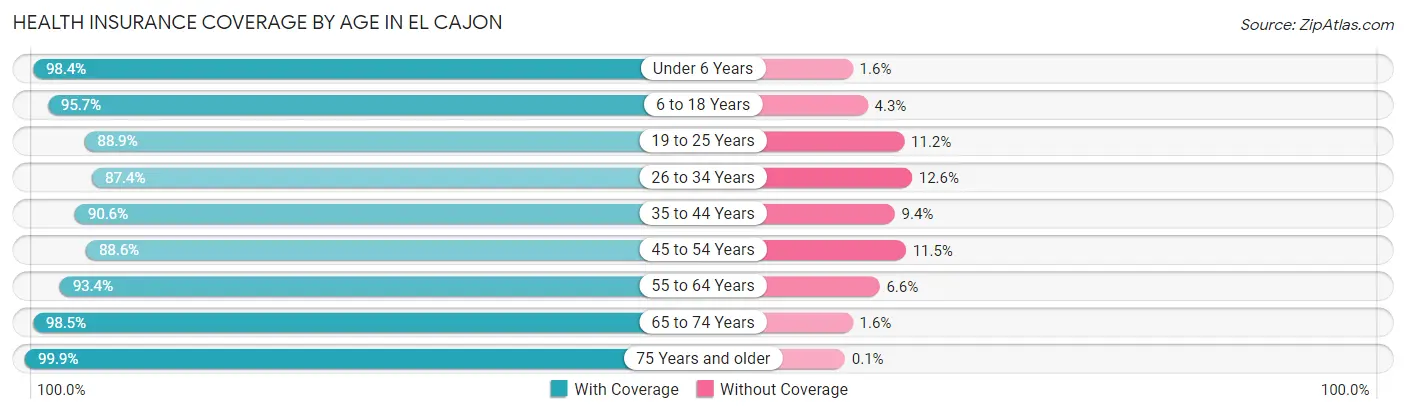
| Age Bracket | With Coverage | Without Coverage |
| Under 6 Years | 8,383 (98.4%) | 133 (1.6%) |
| 6 to 18 Years | 18,078 (95.7%) | 820 (4.3%) |
| 19 to 25 Years | 9,136 (88.8%) | 1,147 (11.2%) |
| 26 to 34 Years | 11,953 (87.4%) | 1,722 (12.6%) |
| 35 to 44 Years | 13,352 (90.6%) | 1,382 (9.4%) |
| 45 to 54 Years | 10,615 (88.5%) | 1,373 (11.5%) |
| 55 to 64 Years | 11,657 (93.4%) | 819 (6.6%) |
| 65 to 74 Years | 8,086 (98.5%) | 127 (1.5%) |
| 75 Years and older | 5,101 (99.9%) | 5 (0.1%) |
| Total | 96,361 (92.7%) | 7,528 (7.2%) |
Health Insurance Coverage by Citizenship Status in El Cajon
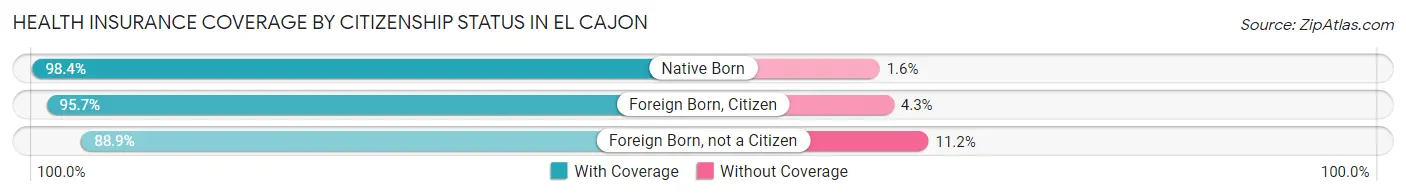
| Citizenship Status | With Coverage | Without Coverage |
| Native Born | 8,383 (98.4%) | 133 (1.6%) |
| Foreign Born, Citizen | 18,078 (95.7%) | 820 (4.3%) |
| Foreign Born, not a Citizen | 9,136 (88.8%) | 1,147 (11.2%) |
Health Insurance Coverage by Household Income in El Cajon
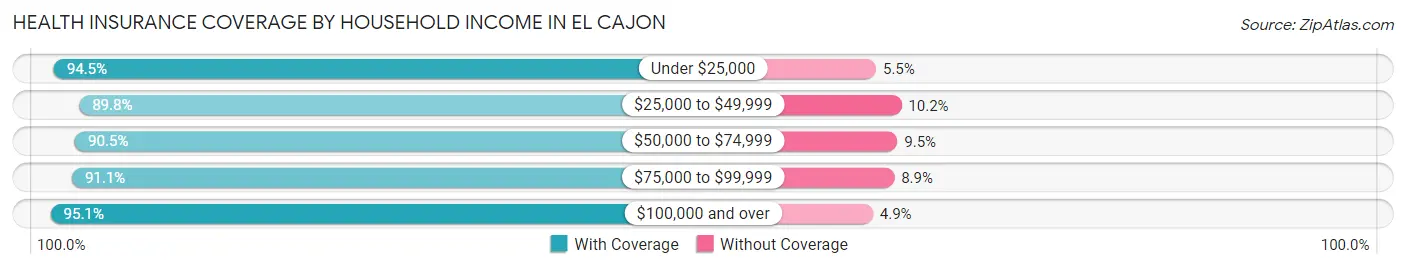
| Household Income | With Coverage | Without Coverage |
| Under $25,000 | 15,115 (94.5%) | 876 (5.5%) |
| $25,000 to $49,999 | 16,215 (89.8%) | 1,850 (10.2%) |
| $50,000 to $74,999 | 15,893 (90.5%) | 1,663 (9.5%) |
| $75,000 to $99,999 | 12,341 (91.1%) | 1,202 (8.9%) |
| $100,000 and over | 35,155 (95.1%) | 1,802 (4.9%) |
Public vs Private Health Insurance Coverage by Age in El Cajon
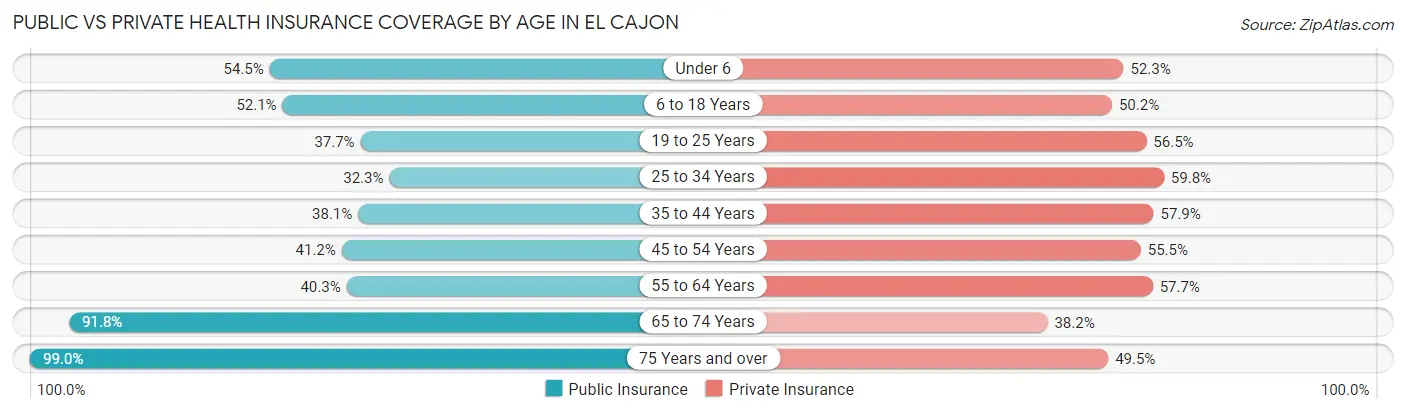
| Age Bracket | Public Insurance | Private Insurance |
| Under 6 | 4,643 (54.5%) | 4,453 (52.3%) |
| 6 to 18 Years | 9,854 (52.1%) | 9,477 (50.1%) |
| 19 to 25 Years | 3,873 (37.7%) | 5,814 (56.5%) |
| 25 to 34 Years | 4,418 (32.3%) | 8,176 (59.8%) |
| 35 to 44 Years | 5,614 (38.1%) | 8,528 (57.9%) |
| 45 to 54 Years | 4,934 (41.2%) | 6,653 (55.5%) |
| 55 to 64 Years | 5,021 (40.3%) | 7,200 (57.7%) |
| 65 to 74 Years | 7,536 (91.8%) | 3,136 (38.2%) |
| 75 Years and over | 5,054 (99.0%) | 2,525 (49.4%) |
| Total | 50,947 (49.0%) | 55,962 (53.9%) |
Disability Status by Sex by Age in El Cajon
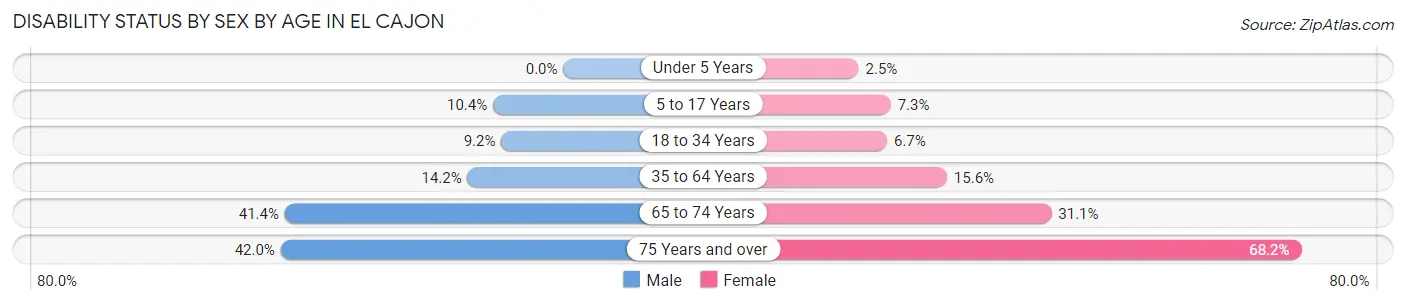
| Age Bracket | Male | Female |
| Under 5 Years | 0 (0.0%) | 94 (2.5%) |
| 5 to 17 Years | 956 (10.4%) | 686 (7.3%) |
| 18 to 34 Years | 1,163 (9.2%) | 859 (6.7%) |
| 35 to 64 Years | 2,761 (14.2%) | 3,091 (15.6%) |
| 65 to 74 Years | 1,653 (41.4%) | 1,312 (31.1%) |
| 75 Years and over | 896 (42.0%) | 2,027 (68.2%) |
Disability Class by Sex by Age in El Cajon
Disability Class: Hearing Difficulty
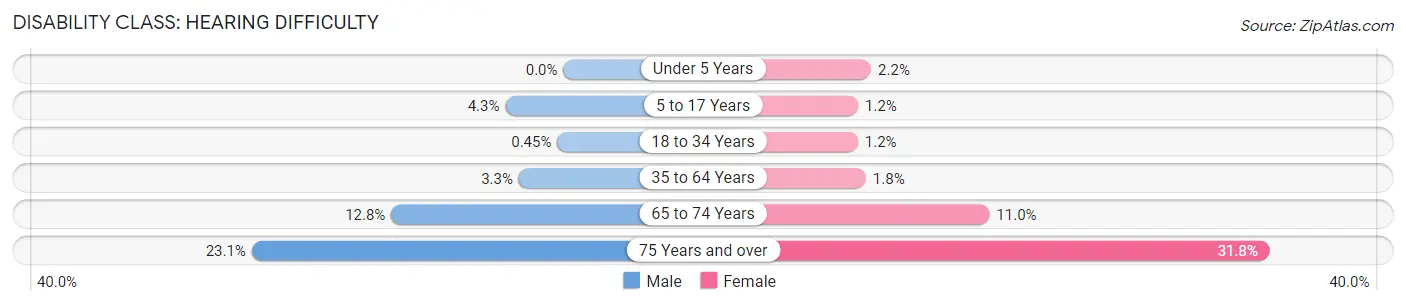
| Age Bracket | Male | Female |
| Under 5 Years | 0 (0.0%) | 82 (2.2%) |
| 5 to 17 Years | 395 (4.3%) | 114 (1.2%) |
| 18 to 34 Years | 57 (0.4%) | 152 (1.2%) |
| 35 to 64 Years | 642 (3.3%) | 355 (1.8%) |
| 65 to 74 Years | 511 (12.8%) | 462 (11.0%) |
| 75 Years and over | 494 (23.1%) | 944 (31.8%) |
Disability Class: Vision Difficulty
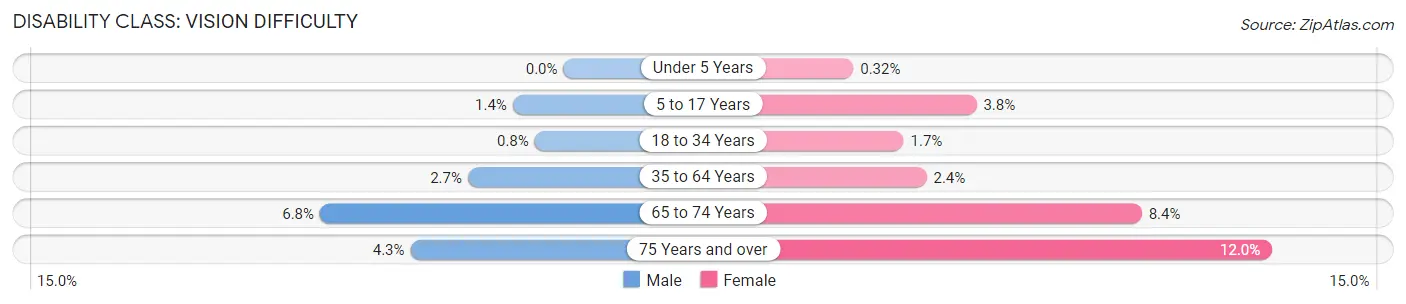
| Age Bracket | Male | Female |
| Under 5 Years | 0 (0.0%) | 12 (0.3%) |
| 5 to 17 Years | 129 (1.4%) | 354 (3.7%) |
| 18 to 34 Years | 101 (0.8%) | 220 (1.7%) |
| 35 to 64 Years | 517 (2.7%) | 468 (2.4%) |
| 65 to 74 Years | 271 (6.8%) | 352 (8.4%) |
| 75 Years and over | 91 (4.3%) | 356 (12.0%) |
Disability Class: Cognitive Difficulty
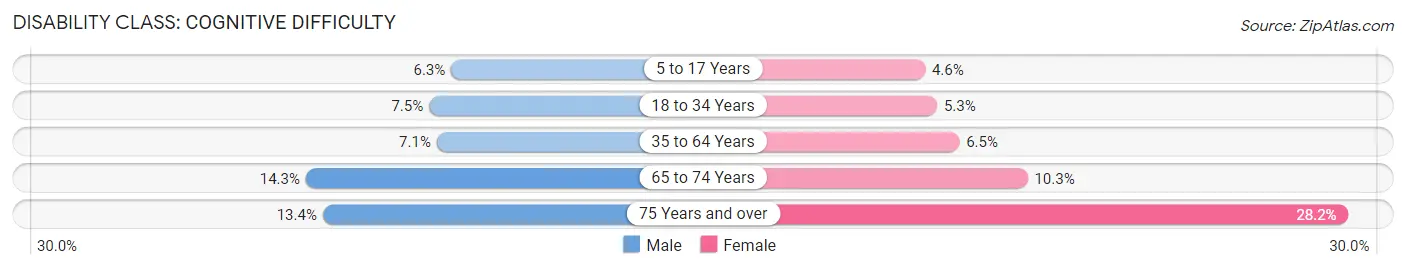
| Age Bracket | Male | Female |
| 5 to 17 Years | 572 (6.2%) | 437 (4.6%) |
| 18 to 34 Years | 945 (7.5%) | 677 (5.3%) |
| 35 to 64 Years | 1,367 (7.0%) | 1,295 (6.5%) |
| 65 to 74 Years | 573 (14.3%) | 436 (10.3%) |
| 75 Years and over | 286 (13.4%) | 838 (28.2%) |
Disability Class: Ambulatory Difficulty
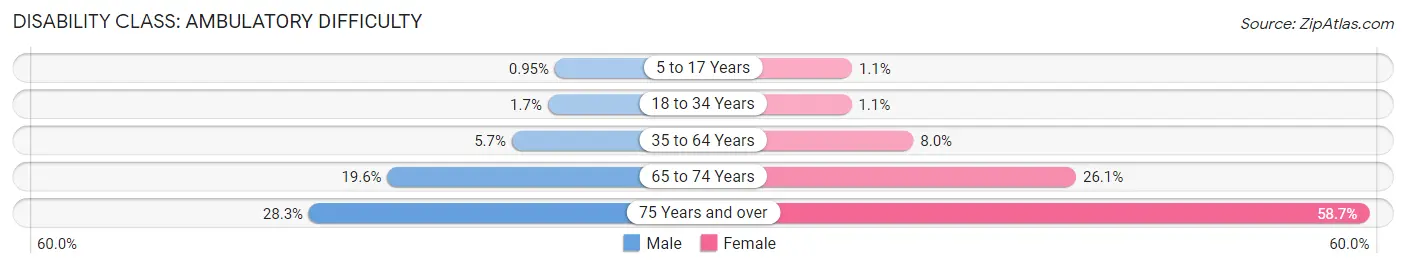
| Age Bracket | Male | Female |
| 5 to 17 Years | 87 (0.9%) | 107 (1.1%) |
| 18 to 34 Years | 220 (1.7%) | 138 (1.1%) |
| 35 to 64 Years | 1,114 (5.7%) | 1,578 (8.0%) |
| 65 to 74 Years | 783 (19.6%) | 1,100 (26.1%) |
| 75 Years and over | 605 (28.3%) | 1,745 (58.7%) |
Disability Class: Self-Care Difficulty
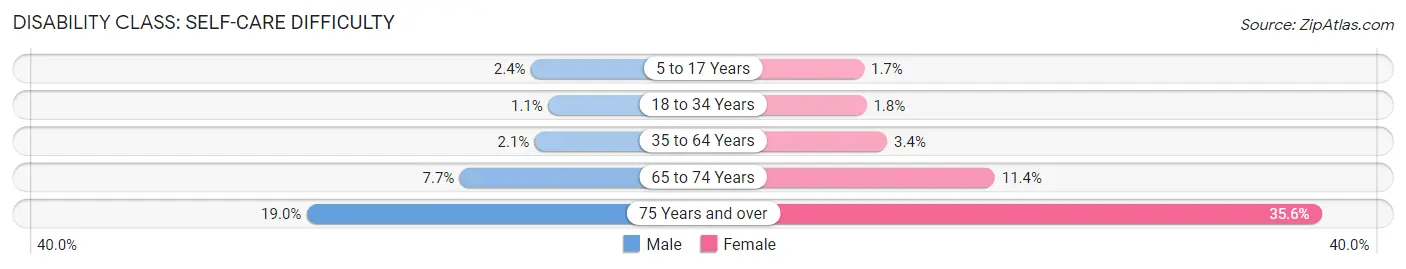
| Age Bracket | Male | Female |
| 5 to 17 Years | 217 (2.4%) | 156 (1.7%) |
| 18 to 34 Years | 138 (1.1%) | 234 (1.8%) |
| 35 to 64 Years | 405 (2.1%) | 668 (3.4%) |
| 65 to 74 Years | 306 (7.7%) | 479 (11.4%) |
| 75 Years and over | 406 (19.0%) | 1,058 (35.6%) |
Technology Access in El Cajon
Computing Device Access in El Cajon
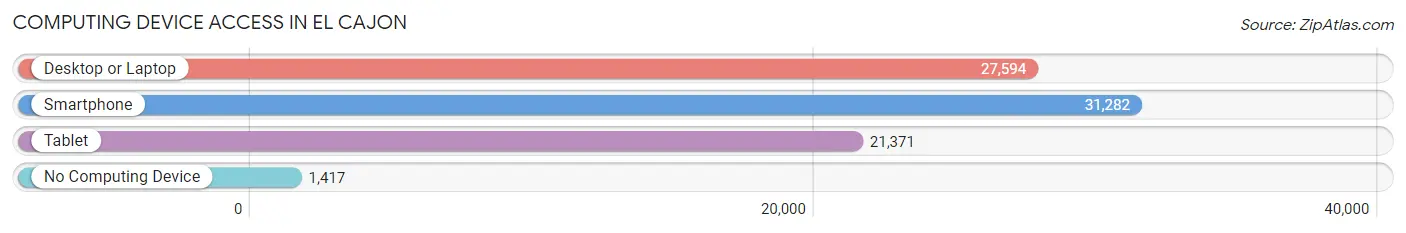
| Device Type | # Households | % Households |
| Desktop or Laptop | 27,594 | 79.7% |
| Smartphone | 31,282 | 90.3% |
| Tablet | 21,371 | 61.7% |
| No Computing Device | 1,417 | 4.1% |
| Total | 34,624 | 100.0% |
Internet Access in El Cajon
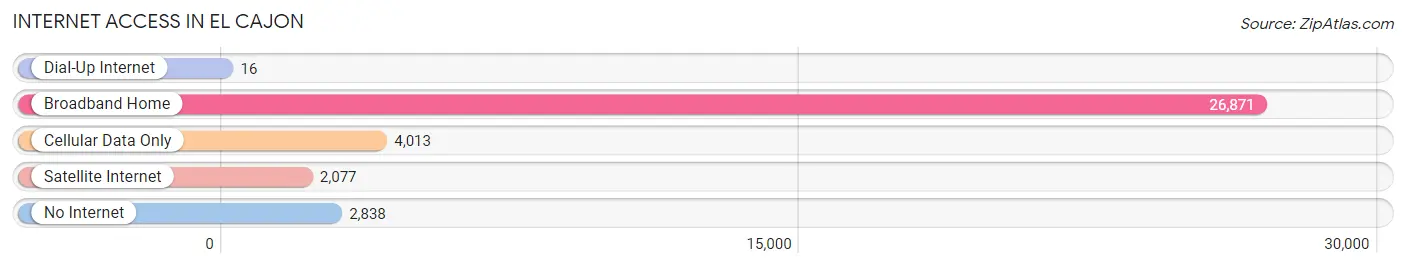
| Internet Type | # Households | % Households |
| Dial-Up Internet | 16 | 0.1% |
| Broadband Home | 26,871 | 77.6% |
| Cellular Data Only | 4,013 | 11.6% |
| Satellite Internet | 2,077 | 6.0% |
| No Internet | 2,838 | 8.2% |
| Total | 34,624 | 100.0% |
El Cajon Summary
El Cajon is a city located in San Diego County, California. It is situated in the foothills of the Cuyamaca Mountains and is located about 15 miles east of downtown San Diego. The city is home to a population of over 100,000 people and is the sixth largest city in the county.
History
The area that is now El Cajon was originally inhabited by the Kumeyaay people, who were hunter-gatherers. The first Europeans to settle in the area were Spanish missionaries, who established a mission in 1775. The mission was abandoned in 1834, and the area was later settled by American settlers in the 1850s. The city was officially incorporated in 1912 and was named after the Spanish word for “the box”, referring to the box-like shape of the valley.
Geography
El Cajon is located in the foothills of the Cuyamaca Mountains, which are part of the Peninsular Ranges. The city is situated at an elevation of 486 feet above sea level. The city covers an area of 14.4 square miles and is bordered by the cities of La Mesa, Santee, and Lakeside. The city is located about 15 miles east of downtown San Diego and is accessible via Interstate 8 and State Route 67.
Economy
El Cajon’s economy is largely based on the service industry, with many residents employed in retail, healthcare, and education. The city is also home to several manufacturing companies, including the El Cajon Machine Company, which produces industrial machinery. The city is also home to several military installations, including the Marine Corps Air Station Miramar and the Naval Base San Diego.
Demographics
As of the 2010 census, El Cajon had a population of over 100,000 people. The racial makeup of the city was 57.2% White, 8.2% African American, 1.2% Native American, 8.3% Asian, 0.4% Pacific Islander, and 22.7% from other races. The median household income was $50,867, and the median family income was $56,867. The city’s population is largely composed of people of Hispanic or Latino origin, making up over 40% of the population.
El Cajon is a diverse city with a rich history and a vibrant economy. The city is home to a variety of businesses and industries, and its population is composed of people from a variety of backgrounds. El Cajon is a great place to live, work, and play, and is a great place to call home.
Common Questions
What is Per Capita Income in El Cajon?
Per Capita income in El Cajon is $29,639.
What is the Median Family Income in El Cajon?
Median Family Income in El Cajon is $70,685.
What is the Median Household income in El Cajon?
Median Household Income in El Cajon is $64,128.
What is Income or Wage Gap in El Cajon?
Income or Wage Gap in El Cajon is 25.6%.
Women in El Cajon earn 74.4 cents for every dollar earned by a man.
What is Family Income Deficit in El Cajon?
Family Income Deficit in El Cajon is $12,182.
Families that are below poverty line in El Cajon earn $12,182 less on average than the poverty threshold level.
What is Inequality or Gini Index in El Cajon?
Inequality or Gini Index in El Cajon is 0.45.
What is the Total Population of El Cajon?
Total Population of El Cajon is 105,721.
What is the Total Male Population of El Cajon?
Total Male Population of El Cajon is 51,842.
What is the Total Female Population of El Cajon?
Total Female Population of El Cajon is 53,879.
What is the Ratio of Males per 100 Females in El Cajon?
There are 96.22 Males per 100 Females in El Cajon.
What is the Ratio of Females per 100 Males in El Cajon?
There are 103.93 Females per 100 Males in El Cajon.
What is the Median Population Age in El Cajon?
Median Population Age in El Cajon is 35.6 Years.
What is the Average Family Size in El Cajon
Average Family Size in El Cajon is 3.5 People.
What is the Average Household Size in El Cajon
Average Household Size in El Cajon is 3.0 People.
How Large is the Labor Force in El Cajon?
There are 51,229 People in the Labor Forcein in El Cajon.
What is the Percentage of People in the Labor Force in El Cajon?
62.3% of People are in the Labor Force in El Cajon.
What is the Unemployment Rate in El Cajon?
Unemployment Rate in El Cajon is 8.1%.