New Bern, NC Map & Demographics
New Bern Map
New Bern Overview
$35,330
PER CAPITA INCOME
$79,669
AVG FAMILY INCOME
$55,673
AVG HOUSEHOLD INCOME
31.5%
WAGE / INCOME GAP [ % ]
68.5¢/ $1
WAGE / INCOME GAP [ $ ]
$11,945
FAMILY INCOME DEFICIT
0.48
INEQUALITY / GINI INDEX
31,373
TOTAL POPULATION
14,685
MALE POPULATION
16,688
FEMALE POPULATION
88.00
MALES / 100 FEMALES
113.64
FEMALES / 100 MALES
40.4
MEDIAN AGE
2.9
AVG FAMILY SIZE
2.2
AVG HOUSEHOLD SIZE
14,762
LABOR FORCE [ PEOPLE ]
59.5%
PERCENT IN LABOR FORCE
4.5%
UNEMPLOYMENT RATE
New Bern Area Codes
Income in New Bern
Income Overview in New Bern
Per Capita Income in New Bern is $35,330, while median incomes of families and households are $79,669 and $55,673 respectively.
| Characteristic | Number | Measure |
| Per Capita Income | 31,373 | $35,330 |
| Median Family Income | 8,212 | $79,669 |
| Mean Family Income | 8,212 | $96,480 |
| Median Household Income | 14,182 | $55,673 |
| Mean Household Income | 14,182 | $77,980 |
| Income Deficit | 8,212 | $11,945 |
| Wage / Income Gap (%) | 31,373 | 31.54% |
| Wage / Income Gap ($) | 31,373 | 68.46¢ per $1 |
| Gini / Inequality Index | 31,373 | 0.48 |
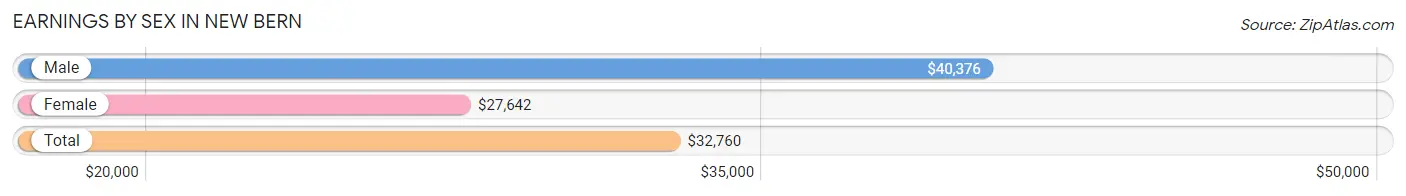
Earnings by Sex in New Bern
Average Earnings in New Bern are $32,760, $40,376 for men and $27,642 for women, a difference of 31.5%.
| Sex | Number | Average Earnings |
| Male | 7,309 (48.0%) | $40,376 |
| Female | 7,904 (52.0%) | $27,642 |
| Total | 15,213 (100.0%) | $32,760 |
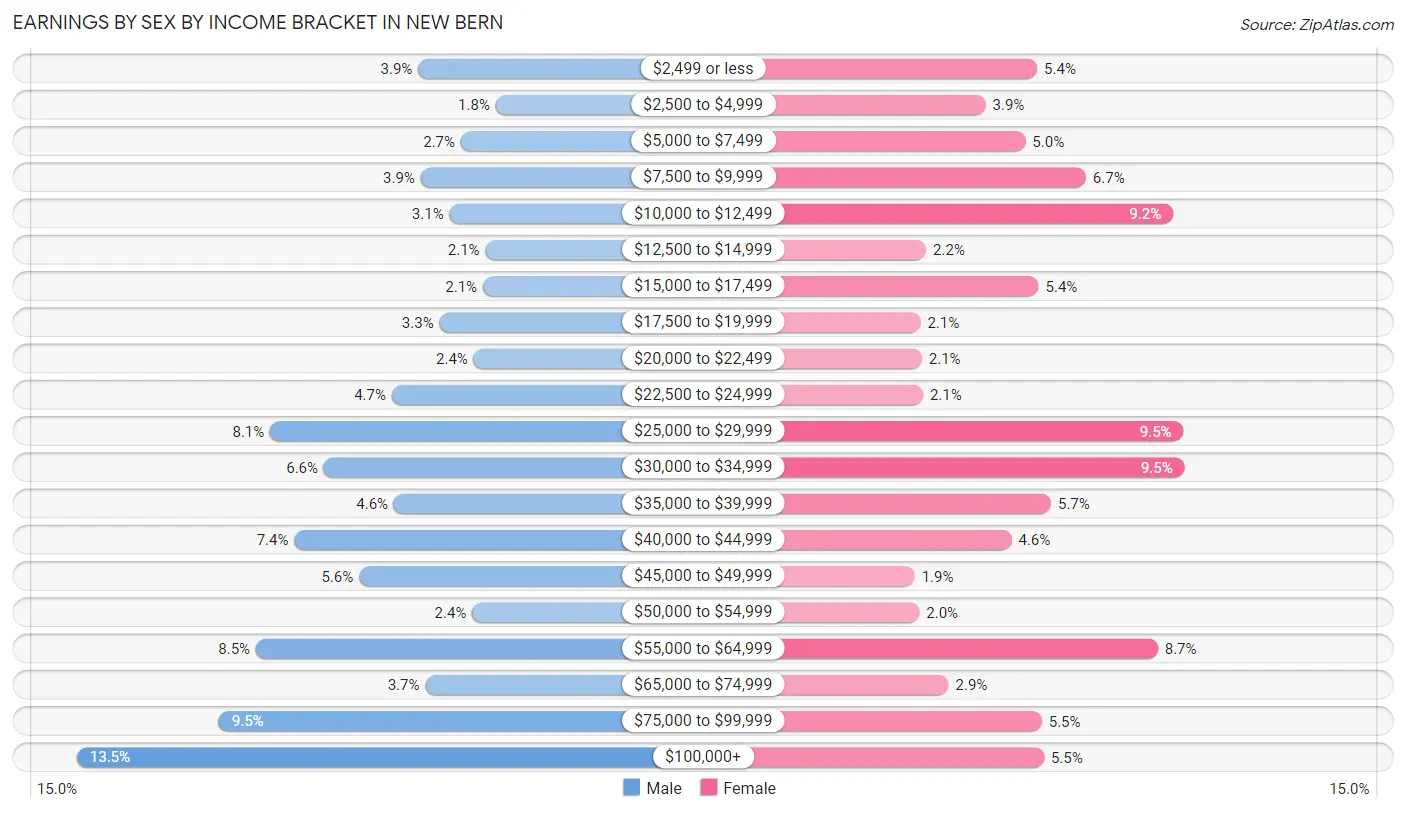
Earnings by Sex by Income Bracket in New Bern
The most common earnings brackets in New Bern are $100,000+ for men (989 | 13.5%) and $30,000 to $34,999 for women (750 | 9.5%).
| Income | Male | Female |
| $2,499 or less | 288 (3.9%) | 423 (5.3%) |
| $2,500 to $4,999 | 129 (1.8%) | 308 (3.9%) |
| $5,000 to $7,499 | 200 (2.7%) | 397 (5.0%) |
| $7,500 to $9,999 | 283 (3.9%) | 531 (6.7%) |
| $10,000 to $12,499 | 224 (3.1%) | 725 (9.2%) |
| $12,500 to $14,999 | 150 (2.1%) | 176 (2.2%) |
| $15,000 to $17,499 | 155 (2.1%) | 426 (5.4%) |
| $17,500 to $19,999 | 244 (3.3%) | 164 (2.1%) |
| $20,000 to $22,499 | 174 (2.4%) | 167 (2.1%) |
| $22,500 to $24,999 | 342 (4.7%) | 169 (2.1%) |
| $25,000 to $29,999 | 592 (8.1%) | 748 (9.5%) |
| $30,000 to $34,999 | 482 (6.6%) | 750 (9.5%) |
| $35,000 to $39,999 | 338 (4.6%) | 454 (5.7%) |
| $40,000 to $44,999 | 542 (7.4%) | 366 (4.6%) |
| $45,000 to $49,999 | 409 (5.6%) | 151 (1.9%) |
| $50,000 to $54,999 | 177 (2.4%) | 161 (2.0%) |
| $55,000 to $64,999 | 621 (8.5%) | 691 (8.7%) |
| $65,000 to $74,999 | 273 (3.7%) | 226 (2.9%) |
| $75,000 to $99,999 | 697 (9.5%) | 433 (5.5%) |
| $100,000+ | 989 (13.5%) | 438 (5.5%) |
| Total | 7,309 (100.0%) | 7,904 (100.0%) |
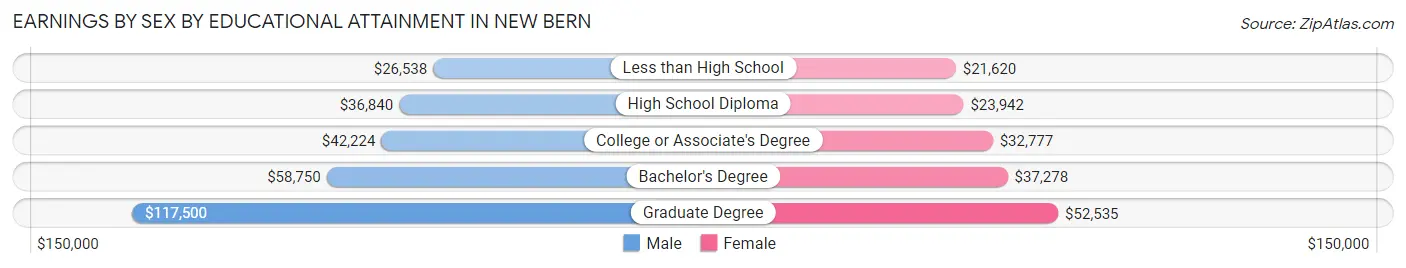
Earnings by Sex by Educational Attainment in New Bern
Average earnings in New Bern are $42,628 for men and $30,797 for women, a difference of 27.8%. Men with an educational attainment of graduate degree enjoy the highest average annual earnings of $117,500, while those with less than high school education earn the least with $26,538. Women with an educational attainment of graduate degree earn the most with the average annual earnings of $52,535, while those with less than high school education have the smallest earnings of $21,620.
| Educational Attainment | Male Income | Female Income |
| Less than High School | $26,538 | $21,620 |
| High School Diploma | $36,840 | $23,942 |
| College or Associate's Degree | $42,224 | $32,777 |
| Bachelor's Degree | $58,750 | $37,278 |
| Graduate Degree | $117,500 | $52,535 |
| Total | $42,628 | $30,797 |
Family Income in New Bern
Family Income Brackets in New Bern
According to the New Bern family income data, there are 1,708 families falling into the $100,000 to $149,999 income range, which is the most common income bracket and makes up 20.8% of all families. Conversely, the $10,000 to $14,999 income bracket is the least frequent group with only 181 families (2.2%) belonging to this category.
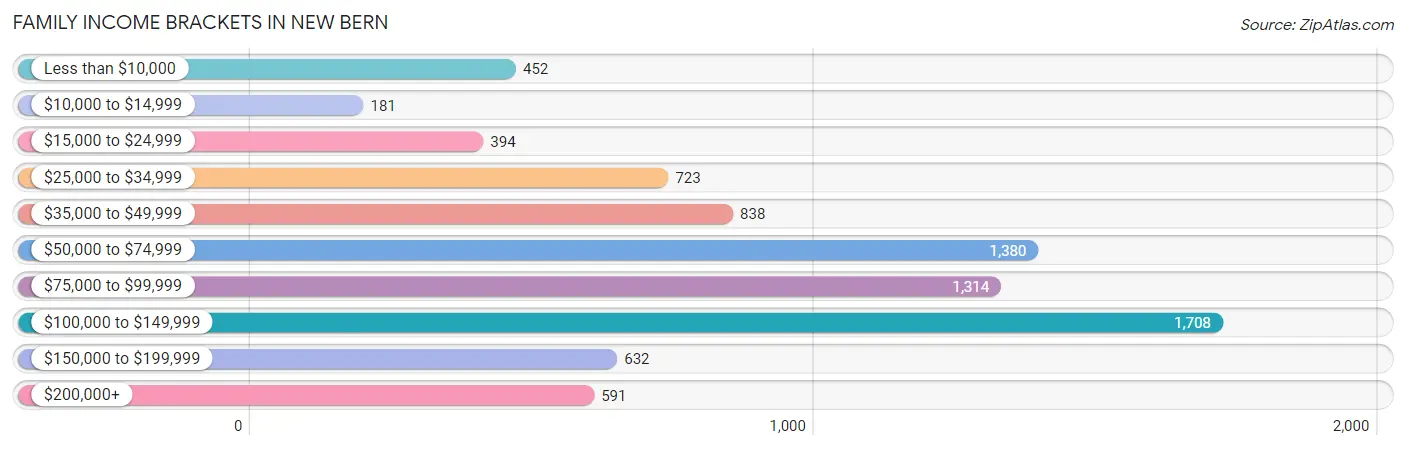
| Income Bracket | # Families | % Families |
| Less than $10,000 | 452 | 5.5% |
| $10,000 to $14,999 | 181 | 2.2% |
| $15,000 to $24,999 | 394 | 4.8% |
| $25,000 to $34,999 | 723 | 8.8% |
| $35,000 to $49,999 | 838 | 10.2% |
| $50,000 to $74,999 | 1,380 | 16.8% |
| $75,000 to $99,999 | 1,314 | 16.0% |
| $100,000 to $149,999 | 1,708 | 20.8% |
| $150,000 to $199,999 | 632 | 7.7% |
| $200,000+ | 591 | 7.2% |
Family Income by Famaliy Size in New Bern
4-person families (1,012 | 12.3%) account for the highest median family income in New Bern with $101,525 per family, while 2-person families (4,172 | 50.8%) have the highest median income of $34,598 per family member.
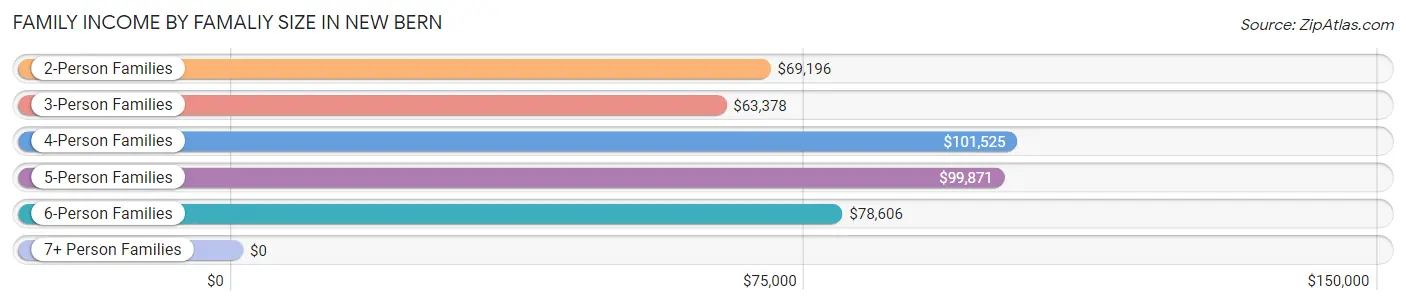
| Income Bracket | # Families | Median Income |
| 2-Person Families | 4,172 (50.8%) | $69,196 |
| 3-Person Families | 1,762 (21.5%) | $63,378 |
| 4-Person Families | 1,012 (12.3%) | $101,525 |
| 5-Person Families | 784 (9.6%) | $99,871 |
| 6-Person Families | 455 (5.5%) | $78,606 |
| 7+ Person Families | 27 (0.3%) | $0 |
| Total | 8,212 (100.0%) | $79,669 |
Family Income by Number of Earners in New Bern
The median family income in New Bern is $79,669, with families comprising 2 earners (3,275) having the highest median family income of $96,060, while families with 1 earner (2,204) have the lowest median family income of $53,457, accounting for 39.9% and 26.8% of families, respectively.
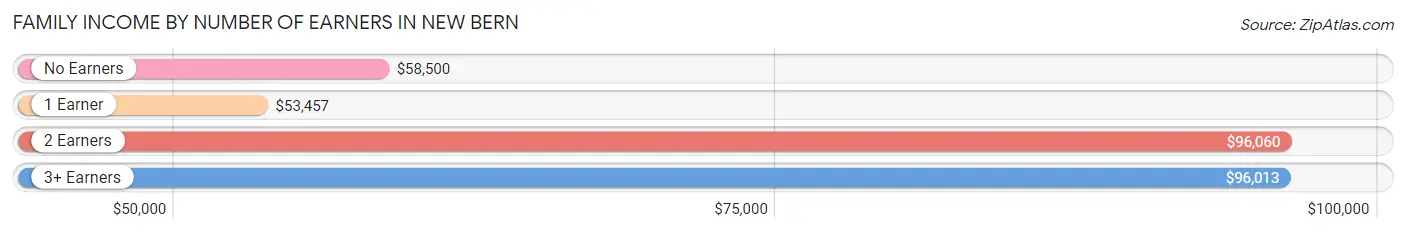
| Number of Earners | # Families | Median Income |
| No Earners | 1,906 (23.2%) | $58,500 |
| 1 Earner | 2,204 (26.8%) | $53,457 |
| 2 Earners | 3,275 (39.9%) | $96,060 |
| 3+ Earners | 827 (10.1%) | $96,013 |
| Total | 8,212 (100.0%) | $79,669 |
Household Income in New Bern
Household Income Brackets in New Bern
With 2,283 households falling in the category, the $100,000 to $149,999 income range is the most frequent in New Bern, accounting for 16.1% of all households. In contrast, only 709 households (5.0%) fall into the $200,000+ income bracket, making it the least populous group.
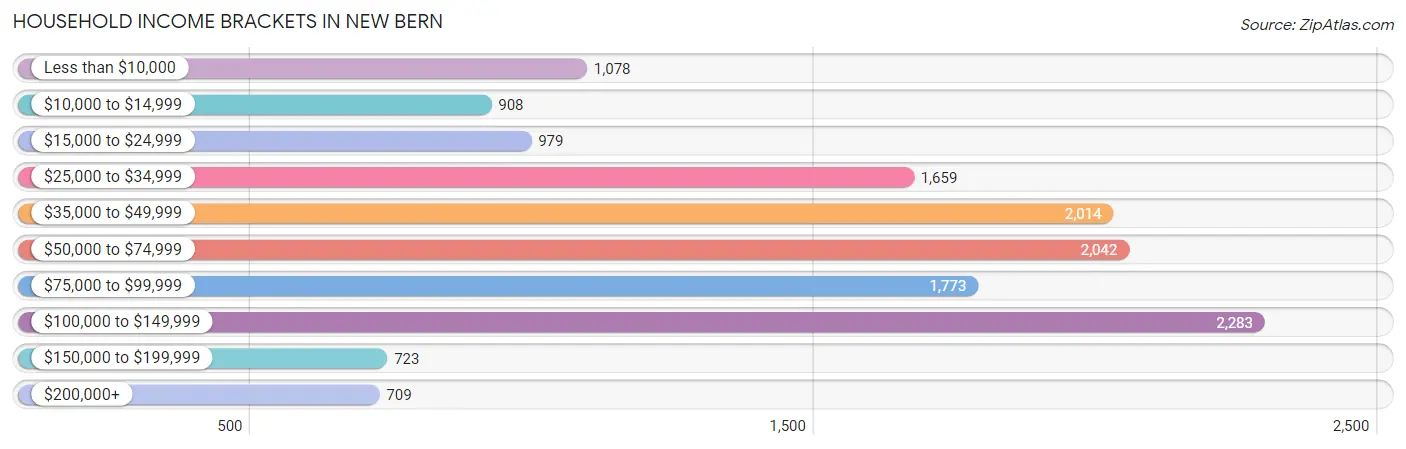
| Income Bracket | # Households | % Households |
| Less than $10,000 | 1,078 | 7.6% |
| $10,000 to $14,999 | 908 | 6.4% |
| $15,000 to $24,999 | 979 | 6.9% |
| $25,000 to $34,999 | 1,659 | 11.7% |
| $35,000 to $49,999 | 2,014 | 14.2% |
| $50,000 to $74,999 | 2,042 | 14.4% |
| $75,000 to $99,999 | 1,773 | 12.5% |
| $100,000 to $149,999 | 2,283 | 16.1% |
| $150,000 to $199,999 | 723 | 5.1% |
| $200,000+ | 709 | 5.0% |
Household Income by Householder Age in New Bern
The median household income in New Bern is $55,673, with the highest median household income of $66,422 found in the 45 to 64 years age bracket for the primary householder. A total of 4,051 households (28.6%) fall into this category. Meanwhile, the 15 to 24 years age bracket for the primary householder has the lowest median household income of $34,000, with 498 households (3.5%) in this group.
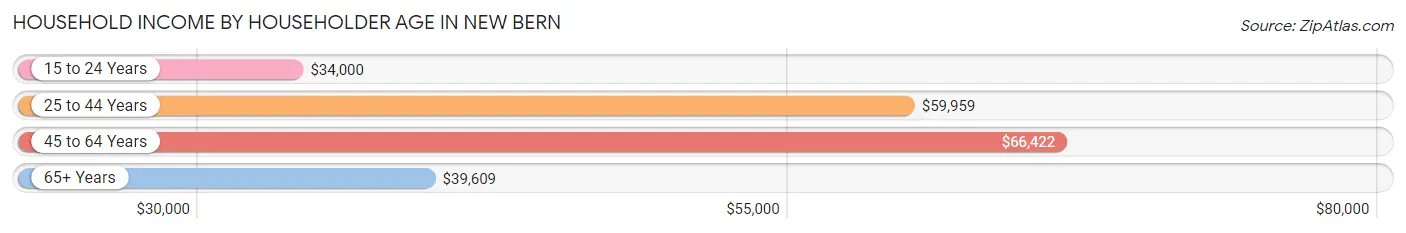
| Income Bracket | # Households | Median Income |
| 15 to 24 Years | 498 (3.5%) | $34,000 |
| 25 to 44 Years | 4,617 (32.6%) | $59,959 |
| 45 to 64 Years | 4,051 (28.6%) | $66,422 |
| 65+ Years | 5,016 (35.4%) | $39,609 |
| Total | 14,182 (100.0%) | $55,673 |
Poverty in New Bern
Income Below Poverty by Sex and Age in New Bern
With 13.6% poverty level for males and 19.1% for females among the residents of New Bern, 5 year old males and 5 year old females are the most vulnerable to poverty, with 73 males (49.0%) and 106 females (49.5%) in their respective age groups living below the poverty level.
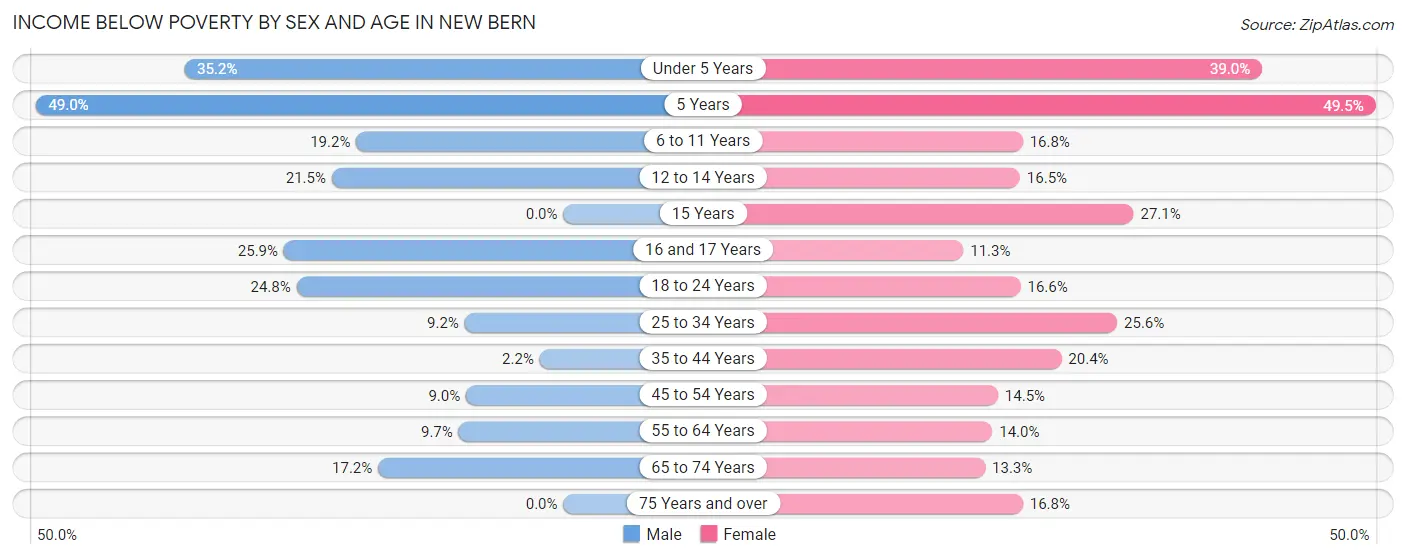
| Age Bracket | Male | Female |
| Under 5 Years | 370 (35.2%) | 365 (39.0%) |
| 5 Years | 73 (49.0%) | 106 (49.5%) |
| 6 to 11 Years | 260 (19.2%) | 197 (16.8%) |
| 12 to 14 Years | 98 (21.5%) | 81 (16.5%) |
| 15 Years | 0 (0.0%) | 65 (27.1%) |
| 16 and 17 Years | 55 (25.9%) | 45 (11.3%) |
| 18 to 24 Years | 234 (24.8%) | 178 (16.6%) |
| 25 to 34 Years | 214 (9.2%) | 617 (25.6%) |
| 35 to 44 Years | 32 (2.2%) | 380 (20.4%) |
| 45 to 54 Years | 141 (9.0%) | 282 (14.5%) |
| 55 to 64 Years | 134 (9.7%) | 259 (14.0%) |
| 65 to 74 Years | 350 (17.2%) | 298 (13.3%) |
| 75 Years and over | 0 (0.0%) | 270 (16.8%) |
| Total | 1,961 (13.6%) | 3,143 (19.1%) |
Income Above Poverty by Sex and Age in New Bern
According to the poverty statistics in New Bern, males aged 15 years and females aged 16 and 17 years are the age groups that are most secure financially, with 100.0% of males and 88.7% of females in these age groups living above the poverty line.
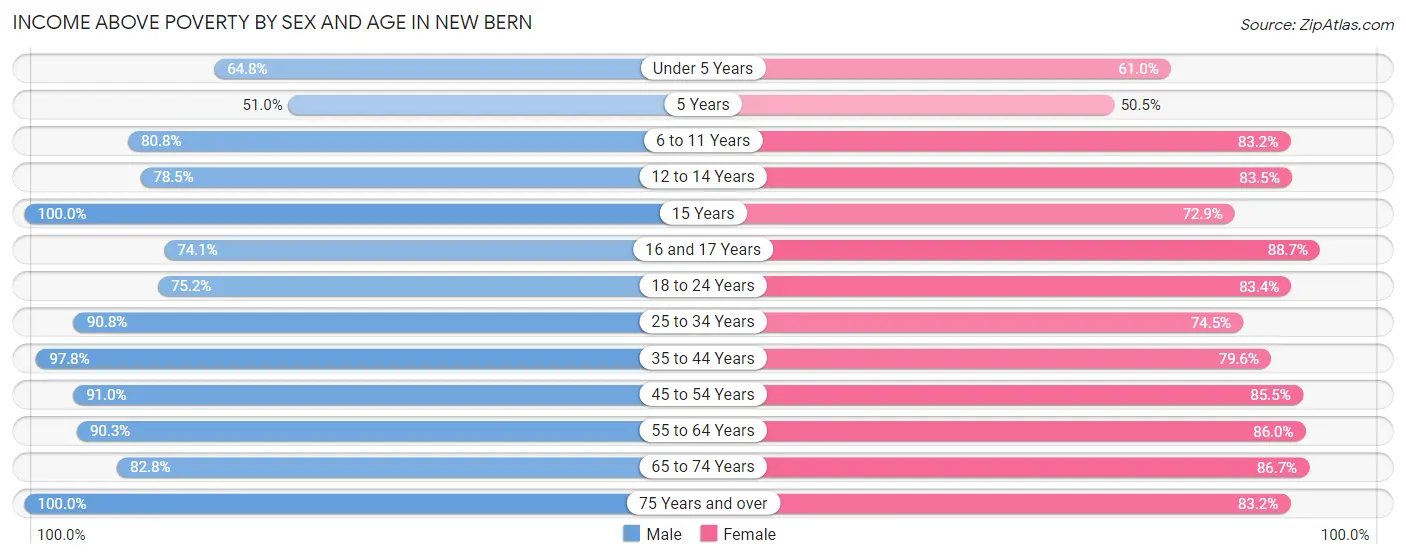
| Age Bracket | Male | Female |
| Under 5 Years | 681 (64.8%) | 571 (61.0%) |
| 5 Years | 76 (51.0%) | 108 (50.5%) |
| 6 to 11 Years | 1,093 (80.8%) | 976 (83.2%) |
| 12 to 14 Years | 358 (78.5%) | 409 (83.5%) |
| 15 Years | 298 (100.0%) | 175 (72.9%) |
| 16 and 17 Years | 157 (74.1%) | 354 (88.7%) |
| 18 to 24 Years | 711 (75.2%) | 895 (83.4%) |
| 25 to 34 Years | 2,121 (90.8%) | 1,798 (74.5%) |
| 35 to 44 Years | 1,430 (97.8%) | 1,485 (79.6%) |
| 45 to 54 Years | 1,420 (91.0%) | 1,664 (85.5%) |
| 55 to 64 Years | 1,245 (90.3%) | 1,595 (86.0%) |
| 65 to 74 Years | 1,686 (82.8%) | 1,943 (86.7%) |
| 75 Years and over | 1,162 (100.0%) | 1,337 (83.2%) |
| Total | 12,438 (86.4%) | 13,310 (80.9%) |
Income Below Poverty Among Married-Couple Families in New Bern
The poverty statistics for married-couple families in New Bern show that 5.2% or 301 of the total 5,780 families live below the poverty line. Families with 5 or more children have the highest poverty rate of 100.0%, comprising of 14 families. On the other hand, families with 1 or 2 children have the lowest poverty rate of 0.0%, which includes 0 families.
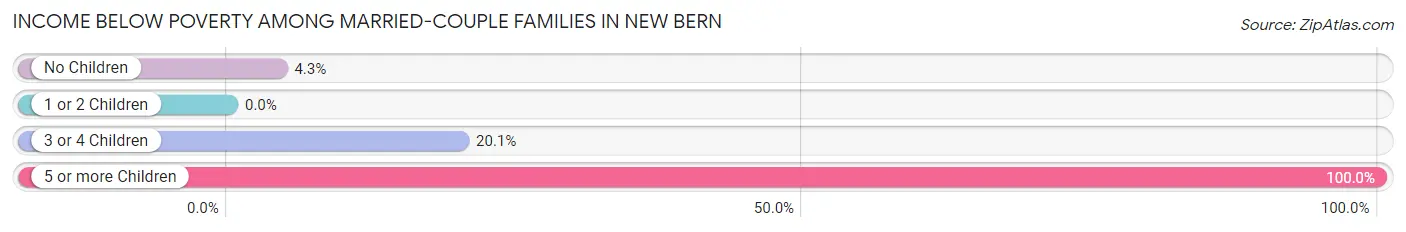
| Children | Above Poverty | Below Poverty |
| No Children | 3,518 (95.7%) | 158 (4.3%) |
| 1 or 2 Children | 1,449 (100.0%) | 0 (0.0%) |
| 3 or 4 Children | 512 (79.9%) | 129 (20.1%) |
| 5 or more Children | 0 (0.0%) | 14 (100.0%) |
| Total | 5,479 (94.8%) | 301 (5.2%) |
Income Below Poverty Among Single-Parent Households in New Bern
According to the poverty data in New Bern, 20.7% or 142 single-father households and 34.3% or 599 single-mother households are living below the poverty line. Among single-father households, those with 1 or 2 children have the highest poverty rate, with 104 households (30.3%) experiencing poverty. Likewise, among single-mother households, those with 5 or more children have the highest poverty rate, with 16 households (100.0%) falling below the poverty line.
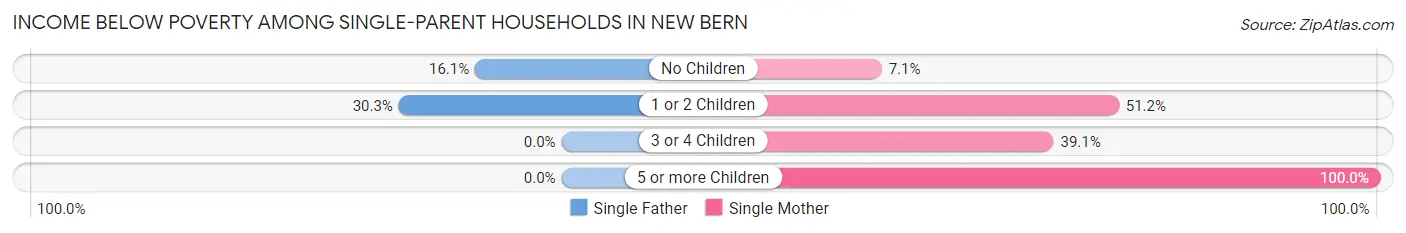
| Children | Single Father | Single Mother |
| No Children | 38 (16.1%) | 40 (7.1%) |
| 1 or 2 Children | 104 (30.3%) | 371 (51.2%) |
| 3 or 4 Children | 0 (0.0%) | 172 (39.1%) |
| 5 or more Children | 0 (0.0%) | 16 (100.0%) |
| Total | 142 (20.7%) | 599 (34.3%) |
Income Below Poverty Among Married-Couple vs Single-Parent Households in New Bern
The poverty data for New Bern shows that 301 of the married-couple family households (5.2%) and 741 of the single-parent households (30.5%) are living below the poverty level. Within the married-couple family households, those with 5 or more children have the highest poverty rate, with 14 households (100.0%) falling below the poverty line. Among the single-parent households, those with 5 or more children have the highest poverty rate, with 16 household (100.0%) living below poverty.
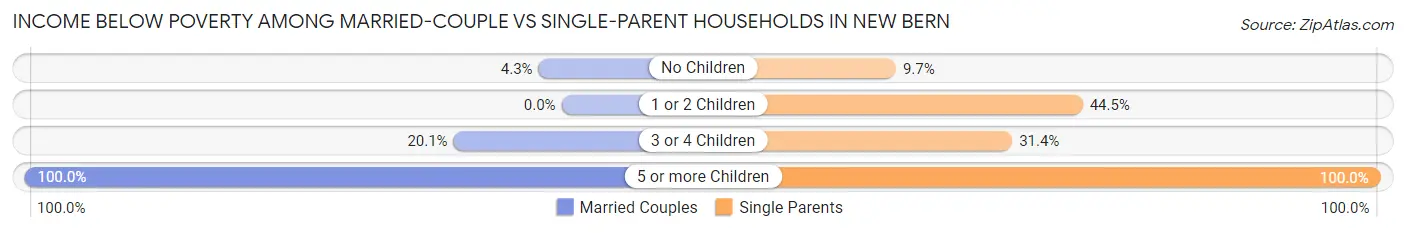
| Children | Married-Couple Families | Single-Parent Households |
| No Children | 158 (4.3%) | 78 (9.7%) |
| 1 or 2 Children | 0 (0.0%) | 475 (44.5%) |
| 3 or 4 Children | 129 (20.1%) | 172 (31.4%) |
| 5 or more Children | 14 (100.0%) | 16 (100.0%) |
| Total | 301 (5.2%) | 741 (30.5%) |
Race in New Bern
The most populous races in New Bern are White / Caucasian (17,571 | 56.0%), Black / African American (9,653 | 30.8%), and Hispanic or Latino (2,001 | 6.4%).
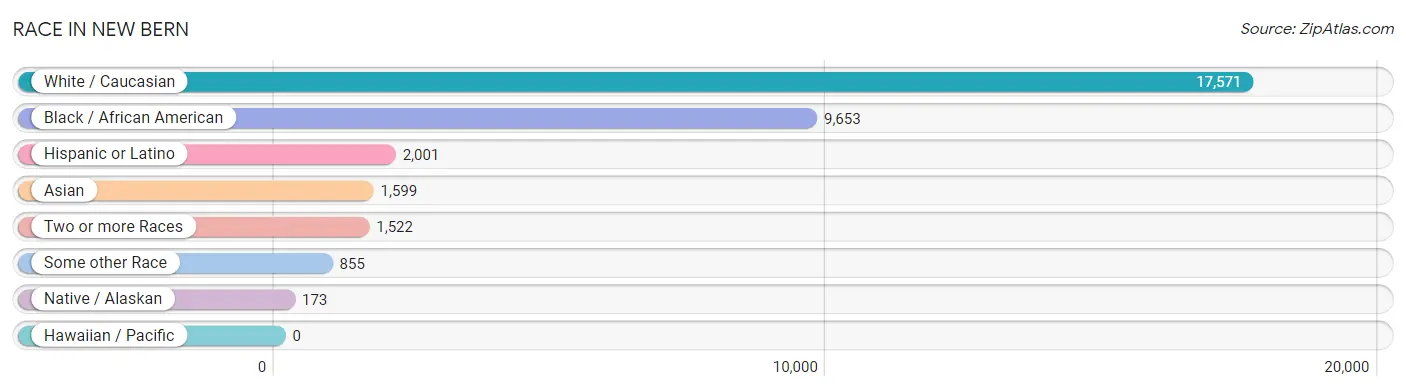
| Race | # Population | % Population |
| Asian | 1,599 | 5.1% |
| Black / African American | 9,653 | 30.8% |
| Hawaiian / Pacific | 0 | 0.0% |
| Hispanic or Latino | 2,001 | 6.4% |
| Native / Alaskan | 173 | 0.5% |
| White / Caucasian | 17,571 | 56.0% |
| Two or more Races | 1,522 | 4.9% |
| Some other Race | 855 | 2.7% |
| Total | 31,373 | 100.0% |
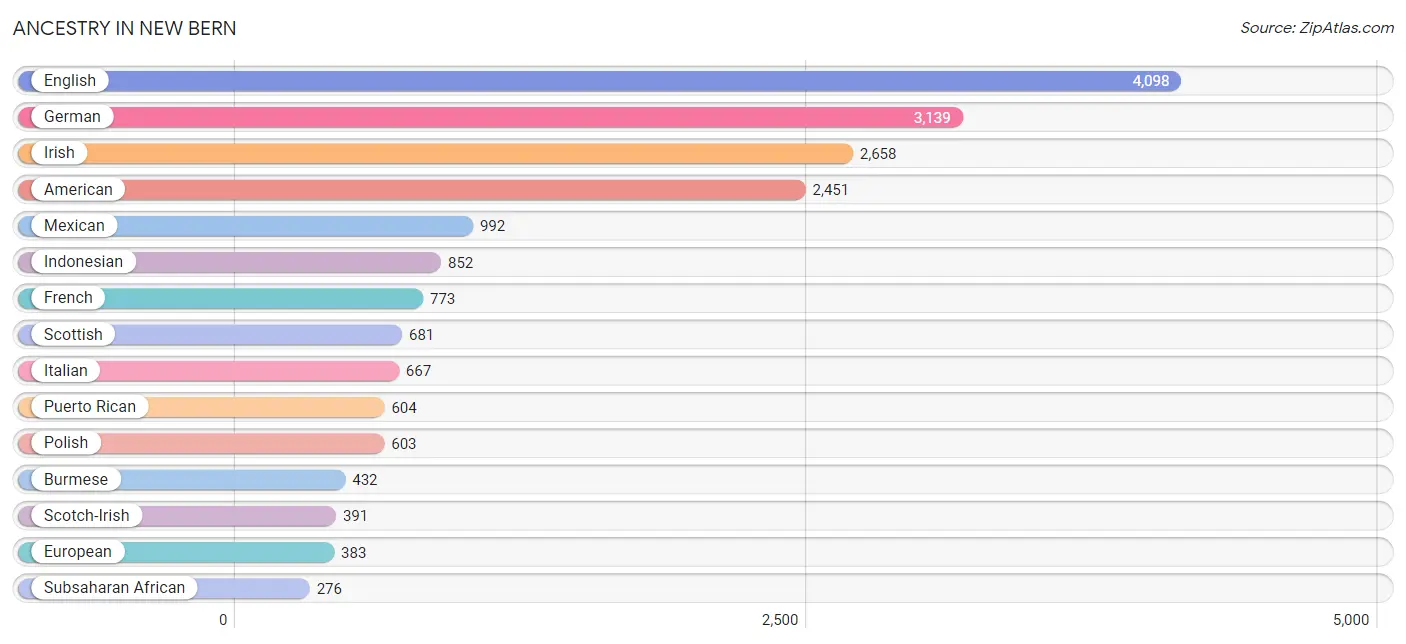
Ancestry in New Bern
The most populous ancestries reported in New Bern are English (4,098 | 13.1%), German (3,139 | 10.0%), Irish (2,658 | 8.5%), American (2,451 | 7.8%), and Mexican (992 | 3.2%), together accounting for 42.5% of all New Bern residents.
| Ancestry | # Population | % Population |
| African | 164 | 0.5% |
| American | 2,451 | 7.8% |
| Arab | 158 | 0.5% |
| Armenian | 10 | 0.0% |
| Austrian | 13 | 0.0% |
| Belgian | 15 | 0.1% |
| Bhutanese | 120 | 0.4% |
| Brazilian | 9 | 0.0% |
| British | 64 | 0.2% |
| Burmese | 432 | 1.4% |
| Canadian | 125 | 0.4% |
| Central American | 249 | 0.8% |
| Cherokee | 15 | 0.1% |
| Chilean | 52 | 0.2% |
| Colombian | 23 | 0.1% |
| Costa Rican | 6 | 0.0% |
| Croatian | 14 | 0.0% |
| Cuban | 49 | 0.2% |
| Czech | 146 | 0.5% |
| Czechoslovakian | 5 | 0.0% |
| Danish | 22 | 0.1% |
| Dominican | 32 | 0.1% |
| Dutch | 156 | 0.5% |
| Eastern European | 36 | 0.1% |
| Egyptian | 20 | 0.1% |
| English | 4,098 | 13.1% |
| European | 383 | 1.2% |
| Finnish | 12 | 0.0% |
| French | 773 | 2.5% |
| French Canadian | 248 | 0.8% |
| German | 3,139 | 10.0% |
| Greek | 22 | 0.1% |
| Guamanian / Chamorro | 14 | 0.0% |
| Guatemalan | 171 | 0.5% |
| Haitian | 104 | 0.3% |
| Honduran | 23 | 0.1% |
| Hungarian | 188 | 0.6% |
| Indian (Asian) | 40 | 0.1% |
| Indonesian | 852 | 2.7% |
| Irish | 2,658 | 8.5% |
| Italian | 667 | 2.1% |
| Jamaican | 13 | 0.0% |
| Japanese | 117 | 0.4% |
| Korean | 203 | 0.6% |
| Lebanese | 138 | 0.4% |
| Lithuanian | 54 | 0.2% |
| Lumbee | 101 | 0.3% |
| Malaysian | 26 | 0.1% |
| Mexican | 992 | 3.2% |
| Native Hawaiian | 14 | 0.0% |
| Navajo | 61 | 0.2% |
| Nicaraguan | 36 | 0.1% |
| Northern European | 8 | 0.0% |
| Norwegian | 103 | 0.3% |
| Polish | 603 | 1.9% |
| Portuguese | 3 | 0.0% |
| Puerto Rican | 604 | 1.9% |
| Romanian | 9 | 0.0% |
| Russian | 27 | 0.1% |
| Salvadoran | 13 | 0.0% |
| Samoan | 14 | 0.0% |
| Scandinavian | 25 | 0.1% |
| Scotch-Irish | 391 | 1.3% |
| Scottish | 681 | 2.2% |
| Serbian | 14 | 0.0% |
| Slavic | 20 | 0.1% |
| Slovak | 68 | 0.2% |
| South African | 14 | 0.0% |
| South American | 75 | 0.2% |
| Sri Lankan | 198 | 0.6% |
| Subsaharan African | 276 | 0.9% |
| Swedish | 140 | 0.4% |
| Swiss | 133 | 0.4% |
| Thai | 14 | 0.0% |
| Ukrainian | 70 | 0.2% |
| Welsh | 114 | 0.4% | View All 76 Rows |
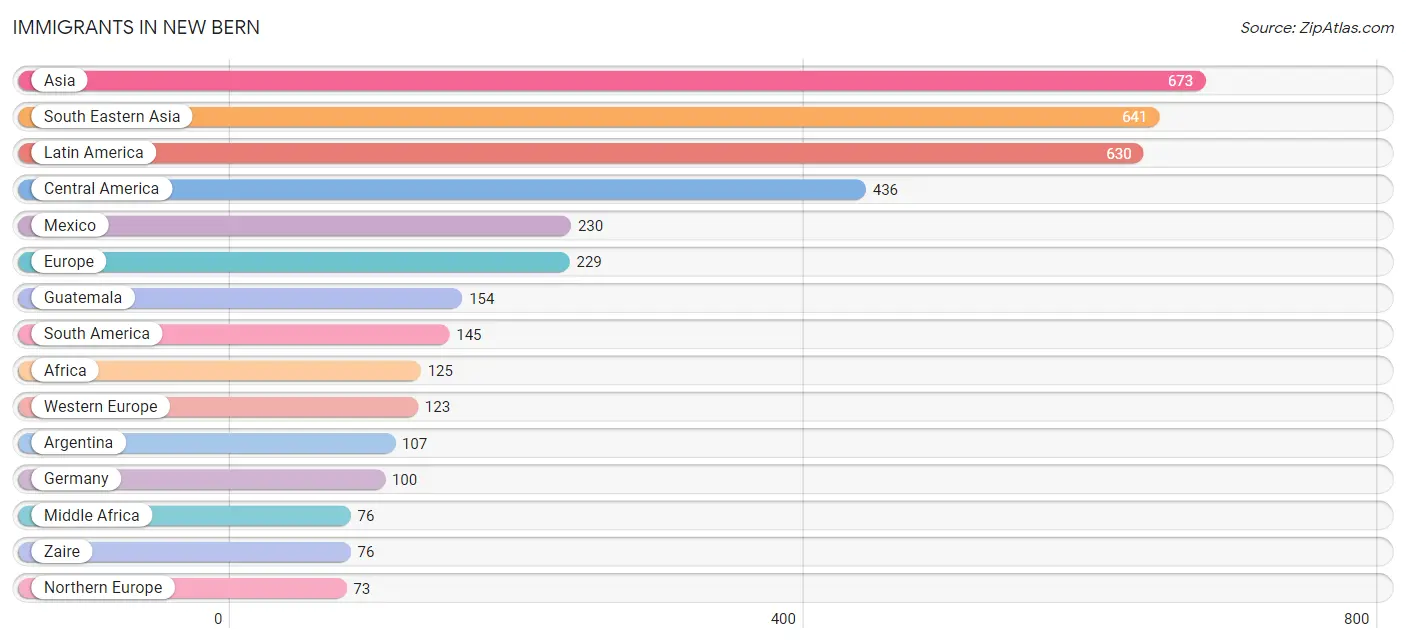
Immigrants in New Bern
The most numerous immigrant groups reported in New Bern came from Asia (673 | 2.1%), South Eastern Asia (641 | 2.0%), Latin America (630 | 2.0%), Central America (436 | 1.4%), and Mexico (230 | 0.7%), together accounting for 8.3% of all New Bern residents.
| Immigration Origin | # Population | % Population |
| Africa | 125 | 0.4% |
| Argentina | 107 | 0.3% |
| Asia | 673 | 2.1% |
| Bosnia and Herzegovina | 4 | 0.0% |
| Cambodia | 9 | 0.0% |
| Canada | 34 | 0.1% |
| Caribbean | 49 | 0.2% |
| Central America | 436 | 1.4% |
| Chile | 8 | 0.0% |
| Colombia | 23 | 0.1% |
| Costa Rica | 6 | 0.0% |
| Cuba | 49 | 0.2% |
| Eastern Asia | 32 | 0.1% |
| Eastern Europe | 30 | 0.1% |
| Egypt | 20 | 0.1% |
| England | 8 | 0.0% |
| Europe | 229 | 0.7% |
| France | 16 | 0.1% |
| Germany | 100 | 0.3% |
| Ghana | 15 | 0.1% |
| Guatemala | 154 | 0.5% |
| Honduras | 10 | 0.0% |
| Japan | 32 | 0.1% |
| Laos | 26 | 0.1% |
| Latin America | 630 | 2.0% |
| Malaysia | 42 | 0.1% |
| Mexico | 230 | 0.7% |
| Middle Africa | 76 | 0.2% |
| Netherlands | 7 | 0.0% |
| Nicaragua | 36 | 0.1% |
| Northern Africa | 20 | 0.1% |
| Northern Europe | 73 | 0.2% |
| Philippines | 54 | 0.2% |
| Portugal | 3 | 0.0% |
| Scotland | 34 | 0.1% |
| South Africa | 14 | 0.0% |
| South America | 145 | 0.5% |
| South Eastern Asia | 641 | 2.0% |
| Southern Europe | 3 | 0.0% |
| Thailand | 60 | 0.2% |
| Ukraine | 26 | 0.1% |
| Western Africa | 15 | 0.1% |
| Western Europe | 123 | 0.4% |
| Zaire | 76 | 0.2% | View All 44 Rows |
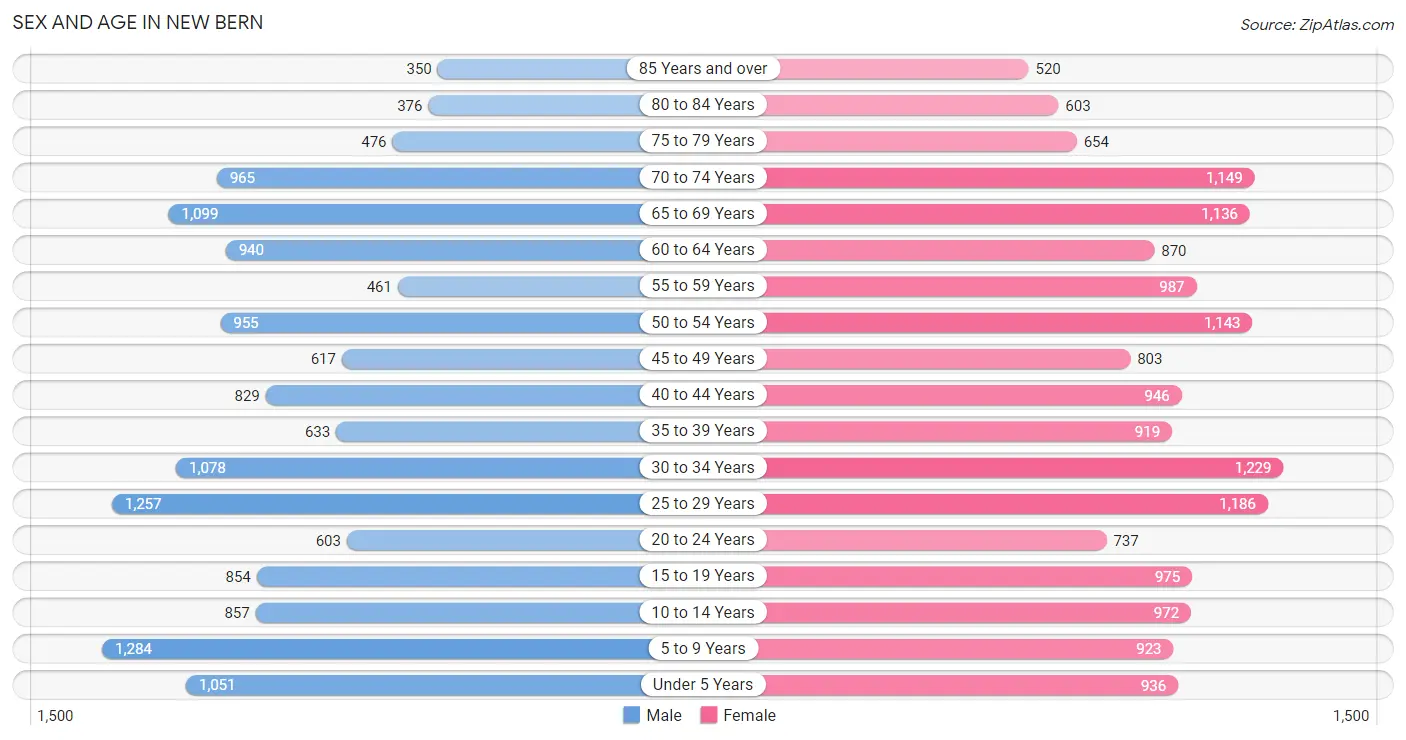
Sex and Age in New Bern
Sex and Age in New Bern
The most populous age groups in New Bern are 5 to 9 Years (1,284 | 8.7%) for men and 30 to 34 Years (1,229 | 7.4%) for women.
| Age Bracket | Male | Female |
| Under 5 Years | 1,051 (7.2%) | 936 (5.6%) |
| 5 to 9 Years | 1,284 (8.7%) | 923 (5.5%) |
| 10 to 14 Years | 857 (5.8%) | 972 (5.8%) |
| 15 to 19 Years | 854 (5.8%) | 975 (5.8%) |
| 20 to 24 Years | 603 (4.1%) | 737 (4.4%) |
| 25 to 29 Years | 1,257 (8.6%) | 1,186 (7.1%) |
| 30 to 34 Years | 1,078 (7.3%) | 1,229 (7.4%) |
| 35 to 39 Years | 633 (4.3%) | 919 (5.5%) |
| 40 to 44 Years | 829 (5.7%) | 946 (5.7%) |
| 45 to 49 Years | 617 (4.2%) | 803 (4.8%) |
| 50 to 54 Years | 955 (6.5%) | 1,143 (6.9%) |
| 55 to 59 Years | 461 (3.1%) | 987 (5.9%) |
| 60 to 64 Years | 940 (6.4%) | 870 (5.2%) |
| 65 to 69 Years | 1,099 (7.5%) | 1,136 (6.8%) |
| 70 to 74 Years | 965 (6.6%) | 1,149 (6.9%) |
| 75 to 79 Years | 476 (3.2%) | 654 (3.9%) |
| 80 to 84 Years | 376 (2.6%) | 603 (3.6%) |
| 85 Years and over | 350 (2.4%) | 520 (3.1%) |
| Total | 14,685 (100.0%) | 16,688 (100.0%) |
Families and Households in New Bern
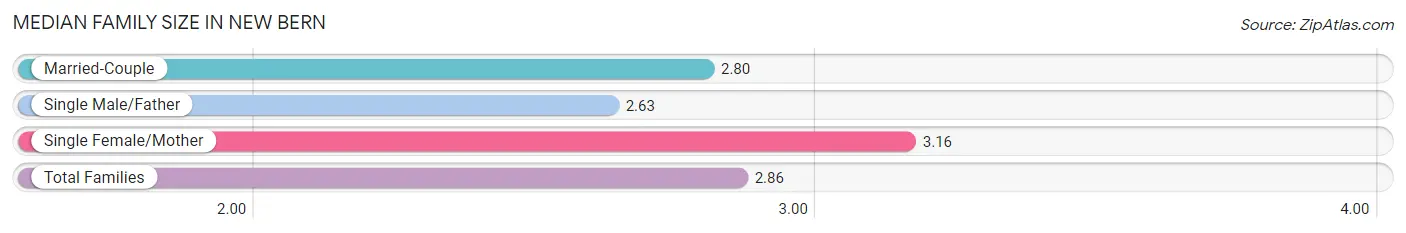
Median Family Size in New Bern
The median family size in New Bern is 2.86 persons per family, with single female/mother families (1,745 | 21.2%) accounting for the largest median family size of 3.16 persons per family. On the other hand, single male/father families (687 | 8.4%) represent the smallest median family size with 2.63 persons per family.
| Family Type | # Families | Family Size |
| Married-Couple | 5,780 (70.4%) | 2.80 |
| Single Male/Father | 687 (8.4%) | 2.63 |
| Single Female/Mother | 1,745 (21.2%) | 3.16 |
| Total Families | 8,212 (100.0%) | 2.86 |
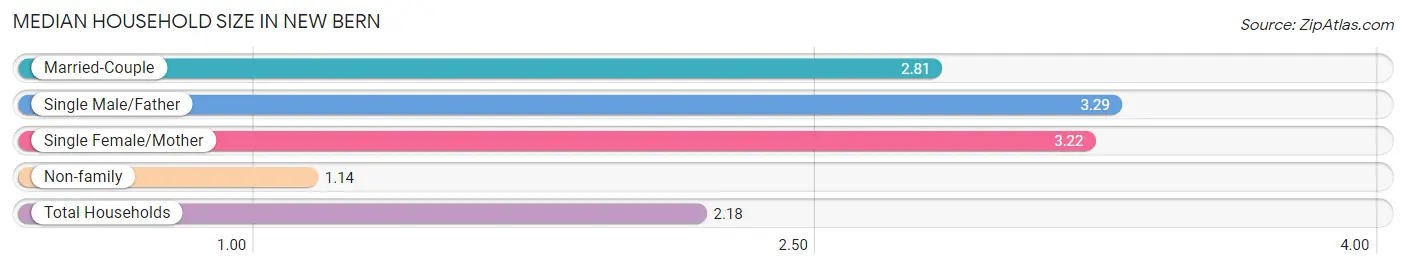
Median Household Size in New Bern
The median household size in New Bern is 2.18 persons per household, with single male/father households (687 | 4.8%) accounting for the largest median household size of 3.29 persons per household. non-family households (5,970 | 42.1%) represent the smallest median household size with 1.14 persons per household.
| Household Type | # Households | Household Size |
| Married-Couple | 5,780 (40.8%) | 2.81 |
| Single Male/Father | 687 (4.8%) | 3.29 |
| Single Female/Mother | 1,745 (12.3%) | 3.22 |
| Non-family | 5,970 (42.1%) | 1.14 |
| Total Households | 14,182 (100.0%) | 2.18 |
Household Size by Marriage Status in New Bern
Out of a total of 14,182 households in New Bern, 8,212 (57.9%) are family households, while 5,970 (42.1%) are nonfamily households. The most numerous type of family households are 2-person households, comprising 4,018, and the most common type of nonfamily households are 1-person households, comprising 5,126.
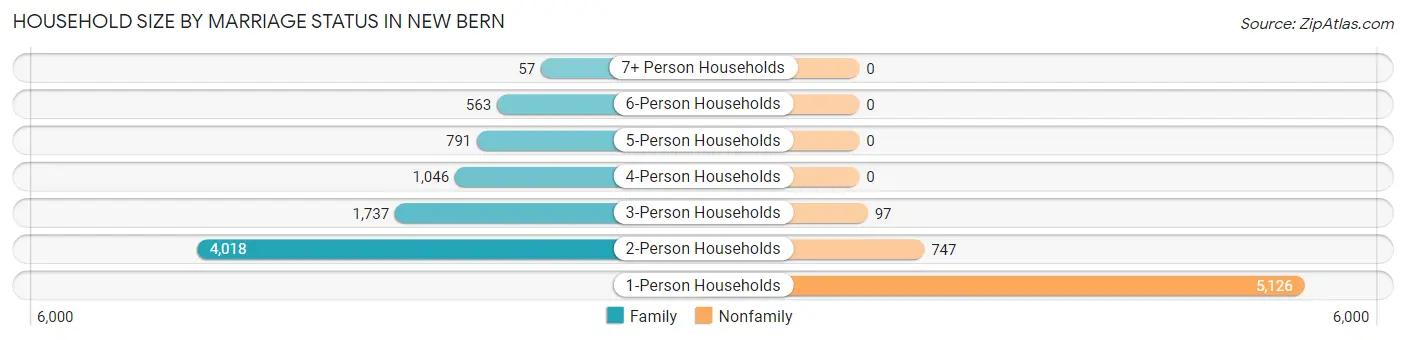
| Household Size | Family Households | Nonfamily Households |
| 1-Person Households | - | 5,126 (36.1%) |
| 2-Person Households | 4,018 (28.3%) | 747 (5.3%) |
| 3-Person Households | 1,737 (12.2%) | 97 (0.7%) |
| 4-Person Households | 1,046 (7.4%) | 0 (0.0%) |
| 5-Person Households | 791 (5.6%) | 0 (0.0%) |
| 6-Person Households | 563 (4.0%) | 0 (0.0%) |
| 7+ Person Households | 57 (0.4%) | 0 (0.0%) |
| Total | 8,212 (57.9%) | 5,970 (42.1%) |
Female Fertility in New Bern
Fertility by Age in New Bern
Average fertility rate in New Bern is 51.0 births per 1,000 women. Women in the age bracket of 20 to 34 years have the highest fertility rate with 70.0 births per 1,000 women. Women in the age bracket of 20 to 34 years acount for 61.2% of all women with births.
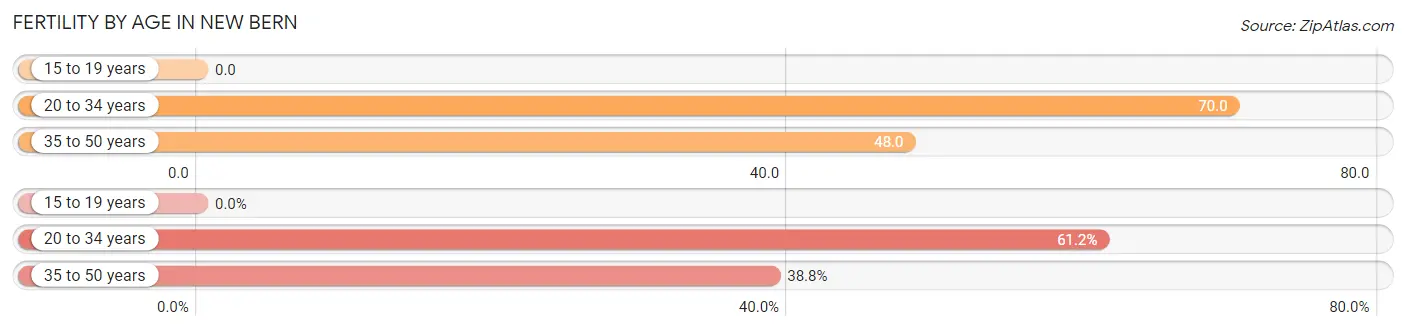
| Age Bracket | Women with Births | Births / 1,000 Women |
| 15 to 19 years | 0 (0.0%) | 0.0 |
| 20 to 34 years | 222 (61.2%) | 70.0 |
| 35 to 50 years | 141 (38.8%) | 48.0 |
| Total | 363 (100.0%) | 51.0 |
Fertility by Age by Marriage Status in New Bern
57.3% of women with births (363) in New Bern are married. The highest percentage of unmarried women with births falls into 35 to 50 years age bracket with 90.1% of them unmarried at the time of birth, while the lowest percentage of unmarried women with births belong to 20 to 34 years age bracket with 12.6% of them unmarried.
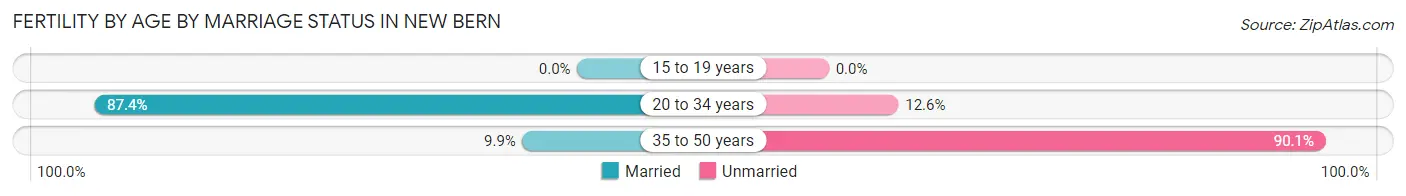
| Age Bracket | Married | Unmarried |
| 15 to 19 years | 0 (0.0%) | 0 (0.0%) |
| 20 to 34 years | 194 (87.4%) | 28 (12.6%) |
| 35 to 50 years | 14 (9.9%) | 127 (90.1%) |
| Total | 208 (57.3%) | 155 (42.7%) |
Fertility by Education in New Bern
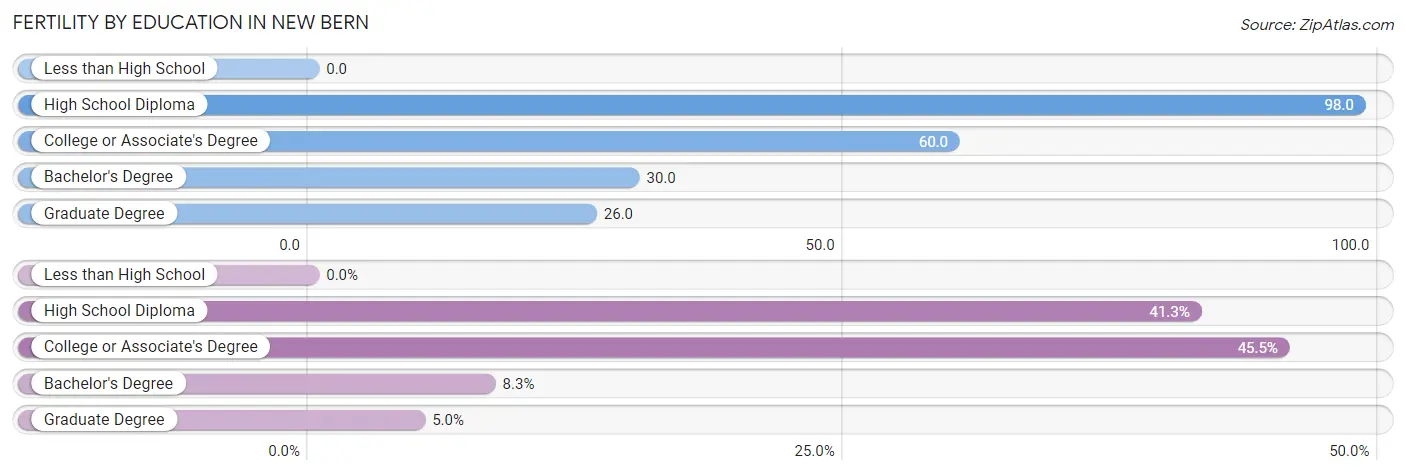
| Educational Attainment | Women with Births | Births / 1,000 Women |
| Less than High School | 0 (0.0%) | 0.0 |
| High School Diploma | 150 (41.3%) | 98.0 |
| College or Associate's Degree | 165 (45.5%) | 60.0 |
| Bachelor's Degree | 30 (8.3%) | 30.0 |
| Graduate Degree | 18 (5.0%) | 26.0 |
| Total | 363 (100.0%) | 51.0 |
Fertility by Education by Marriage Status in New Bern
42.7% of women with births in New Bern are unmarried. Women with the educational attainment of bachelor's degree are most likely to be married with 100.0% of them married at childbirth, while women with the educational attainment of high school diploma are least likely to be married with 78.7% of them unmarried at childbirth.
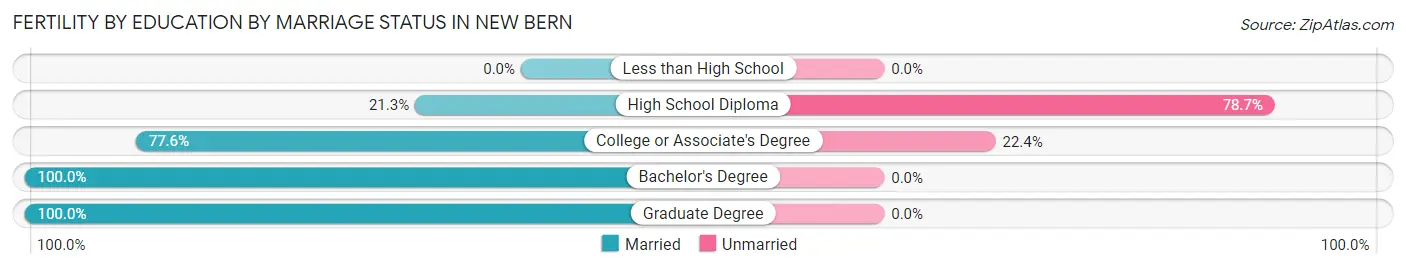
| Educational Attainment | Married | Unmarried |
| Less than High School | 0 (0.0%) | 0 (0.0%) |
| High School Diploma | 32 (21.3%) | 118 (78.7%) |
| College or Associate's Degree | 128 (77.6%) | 37 (22.4%) |
| Bachelor's Degree | 30 (100.0%) | 0 (0.0%) |
| Graduate Degree | 18 (100.0%) | 0 (0.0%) |
| Total | 208 (57.3%) | 155 (42.7%) |
Employment Characteristics in New Bern
Employment by Class of Employer in New Bern
Among the 13,919 employed individuals in New Bern, private company employees (8,879 | 63.8%), not-for-profit organizations (1,451 | 10.4%), and local government employees (1,252 | 9.0%) make up the most common classes of employment.
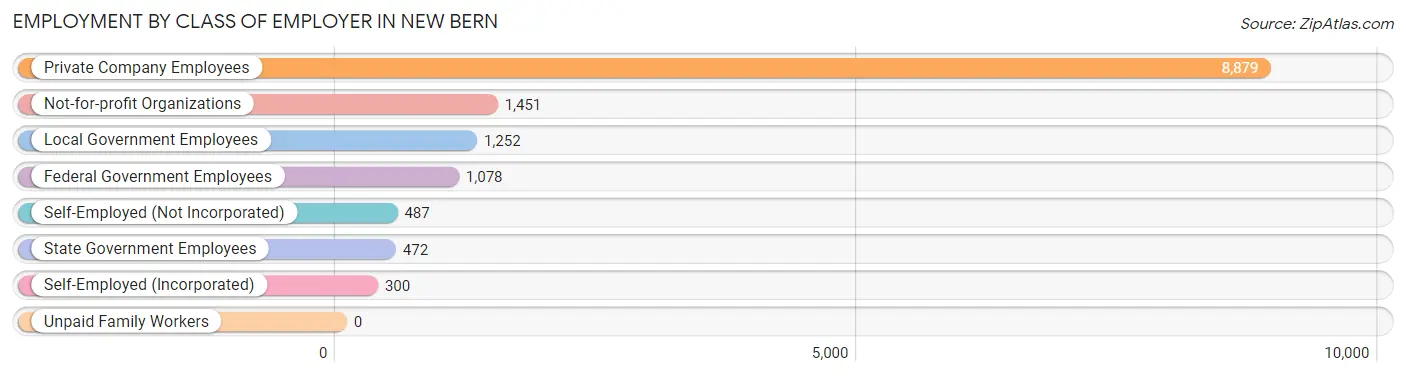
| Employer Class | # Employees | % Employees |
| Private Company Employees | 8,879 | 63.8% |
| Self-Employed (Incorporated) | 300 | 2.2% |
| Self-Employed (Not Incorporated) | 487 | 3.5% |
| Not-for-profit Organizations | 1,451 | 10.4% |
| Local Government Employees | 1,252 | 9.0% |
| State Government Employees | 472 | 3.4% |
| Federal Government Employees | 1,078 | 7.7% |
| Unpaid Family Workers | 0 | 0.0% |
| Total | 13,919 | 100.0% |
Employment Status by Age in New Bern
According to the labor force statistics for New Bern, out of the total population over 16 years of age (24,810), 59.5% or 14,762 individuals are in the labor force, with 4.5% or 664 of them unemployed. The age group with the highest labor force participation rate is 20 to 24 years, with 94.3% or 1,264 individuals in the labor force. Within the labor force, the 20 to 24 years age range has the highest percentage of unemployed individuals, with 12.3% or 155 of them being unemployed.
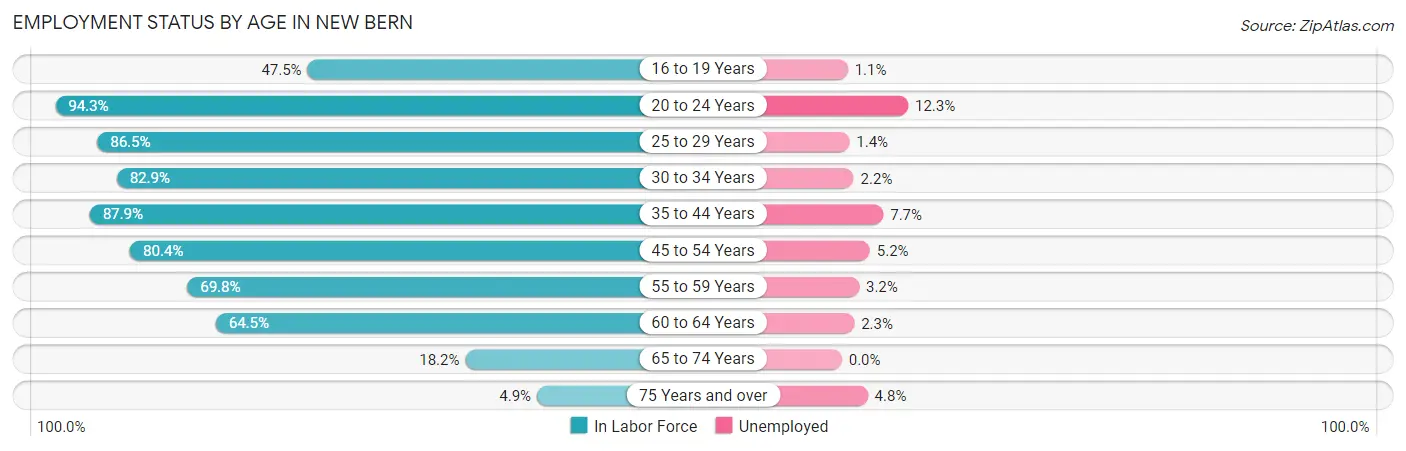
| Age Bracket | In Labor Force | Unemployed |
| 16 to 19 Years | 612 (47.5%) | 7 (1.1%) |
| 20 to 24 Years | 1,264 (94.3%) | 155 (12.3%) |
| 25 to 29 Years | 2,113 (86.5%) | 30 (1.4%) |
| 30 to 34 Years | 1,913 (82.9%) | 42 (2.2%) |
| 35 to 44 Years | 2,924 (87.9%) | 225 (7.7%) |
| 45 to 54 Years | 2,828 (80.4%) | 147 (5.2%) |
| 55 to 59 Years | 1,011 (69.8%) | 32 (3.2%) |
| 60 to 64 Years | 1,167 (64.5%) | 27 (2.3%) |
| 65 to 74 Years | 792 (18.2%) | 0 (0.0%) |
| 75 Years and over | 146 (4.9%) | 7 (4.8%) |
| Total | 14,762 (59.5%) | 664 (4.5%) |
Employment Status by Educational Attainment in New Bern
According to labor force statistics for New Bern, 80.5% of individuals (11,957) out of the total population between 25 and 64 years of age (14,853) are in the labor force, with 4.2% or 502 of them being unemployed. The group with the highest labor force participation rate are those with the educational attainment of bachelor's degree or higher, with 84.7% or 3,415 individuals in the labor force. Within the labor force, individuals with less than high school education have the highest percentage of unemployment, with 13.8% or 136 of them being unemployed.
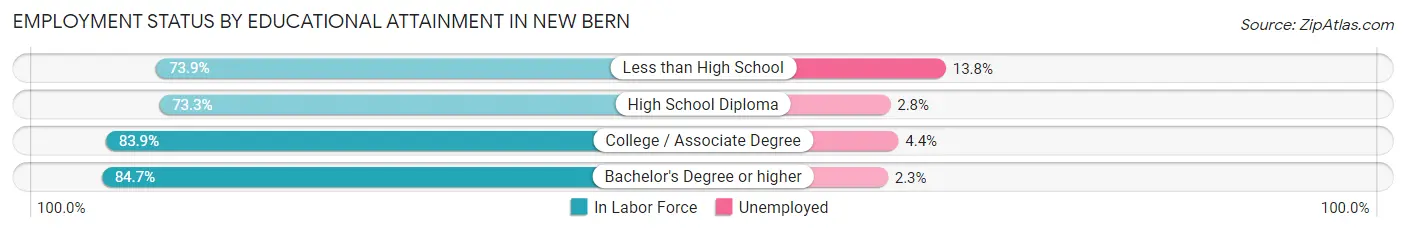
| Educational Attainment | In Labor Force | Unemployed |
| Less than High School | 987 (73.9%) | 184 (13.8%) |
| High School Diploma | 2,823 (73.3%) | 108 (2.8%) |
| College / Associate Degree | 4,728 (83.9%) | 248 (4.4%) |
| Bachelor's Degree or higher | 3,415 (84.7%) | 93 (2.3%) |
| Total | 11,957 (80.5%) | 624 (4.2%) |
Employment Occupations by Sex in New Bern
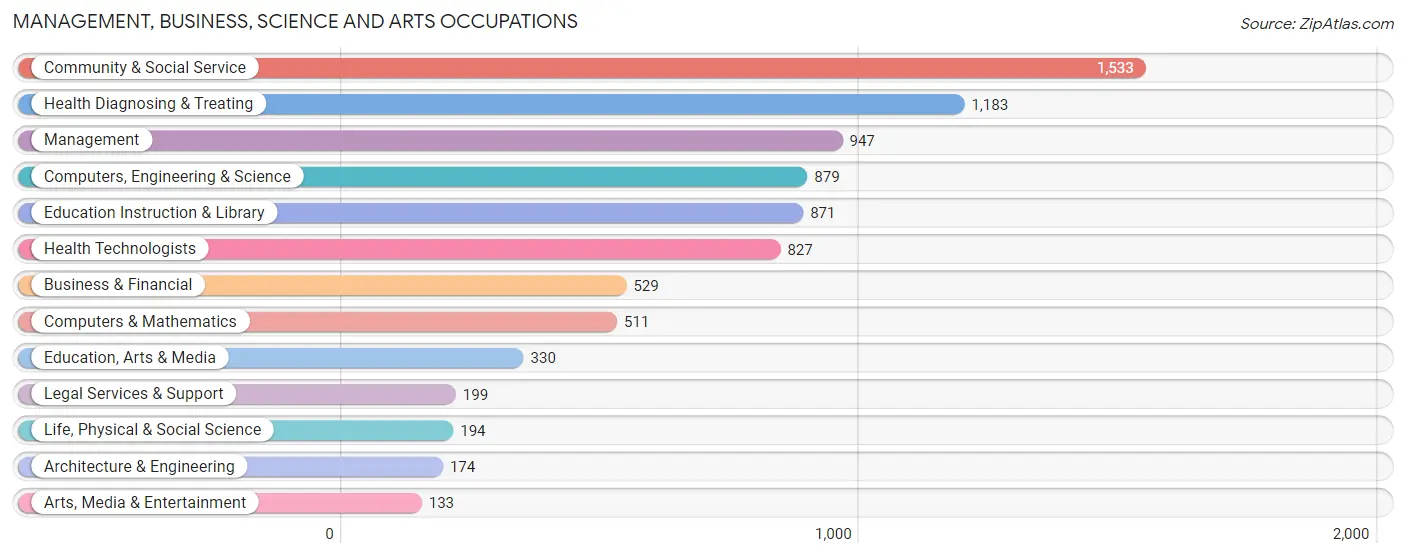
Management, Business, Science and Arts Occupations
The most common Management, Business, Science and Arts occupations in New Bern are Community & Social Service (1,533 | 11.2%), Health Diagnosing & Treating (1,183 | 8.6%), Management (947 | 6.9%), Computers, Engineering & Science (879 | 6.4%), and Education Instruction & Library (871 | 6.3%).
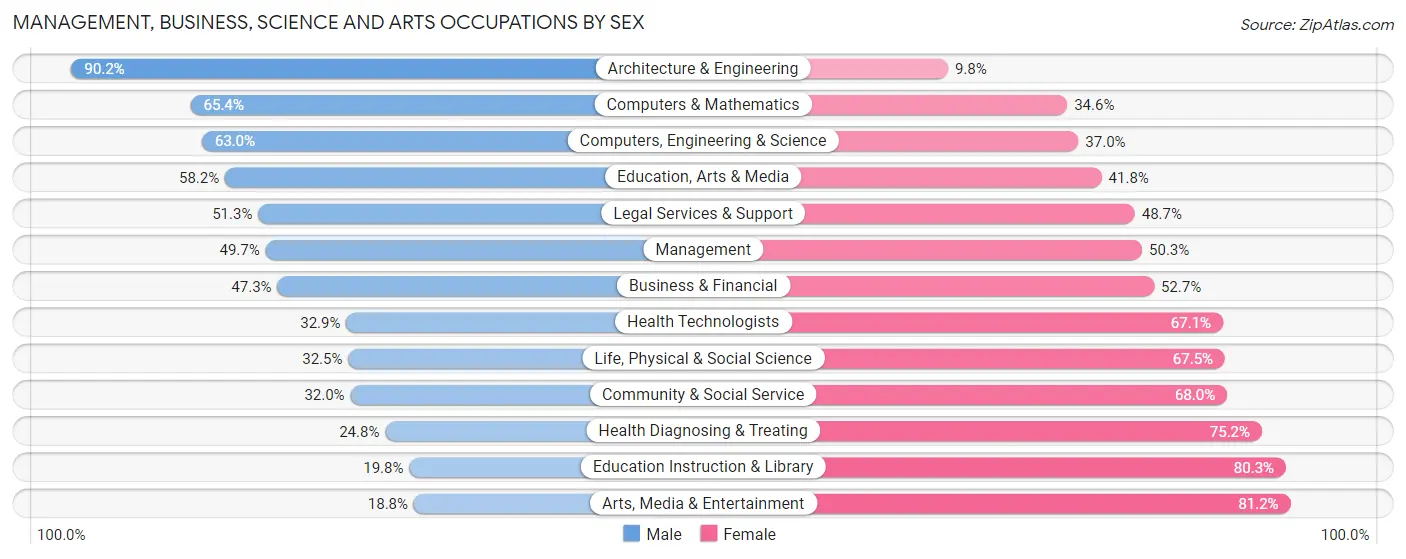
Management, Business, Science and Arts Occupations by Sex
Within the Management, Business, Science and Arts occupations in New Bern, the most male-oriented occupations are Architecture & Engineering (90.2%), Computers & Mathematics (65.4%), and Computers, Engineering & Science (63.0%), while the most female-oriented occupations are Arts, Media & Entertainment (81.2%), Education Instruction & Library (80.2%), and Health Diagnosing & Treating (75.2%).
| Occupation | Male | Female |
| Management | 471 (49.7%) | 476 (50.3%) |
| Business & Financial | 250 (47.3%) | 279 (52.7%) |
| Computers, Engineering & Science | 554 (63.0%) | 325 (37.0%) |
| Computers & Mathematics | 334 (65.4%) | 177 (34.6%) |
| Architecture & Engineering | 157 (90.2%) | 17 (9.8%) |
| Life, Physical & Social Science | 63 (32.5%) | 131 (67.5%) |
| Community & Social Service | 491 (32.0%) | 1,042 (68.0%) |
| Education, Arts & Media | 192 (58.2%) | 138 (41.8%) |
| Legal Services & Support | 102 (51.3%) | 97 (48.7%) |
| Education Instruction & Library | 172 (19.8%) | 699 (80.2%) |
| Arts, Media & Entertainment | 25 (18.8%) | 108 (81.2%) |
| Health Diagnosing & Treating | 293 (24.8%) | 890 (75.2%) |
| Health Technologists | 272 (32.9%) | 555 (67.1%) |
| Total (Category) | 2,059 (40.6%) | 3,012 (59.4%) |
| Total (Overall) | 6,413 (46.7%) | 7,317 (53.3%) |
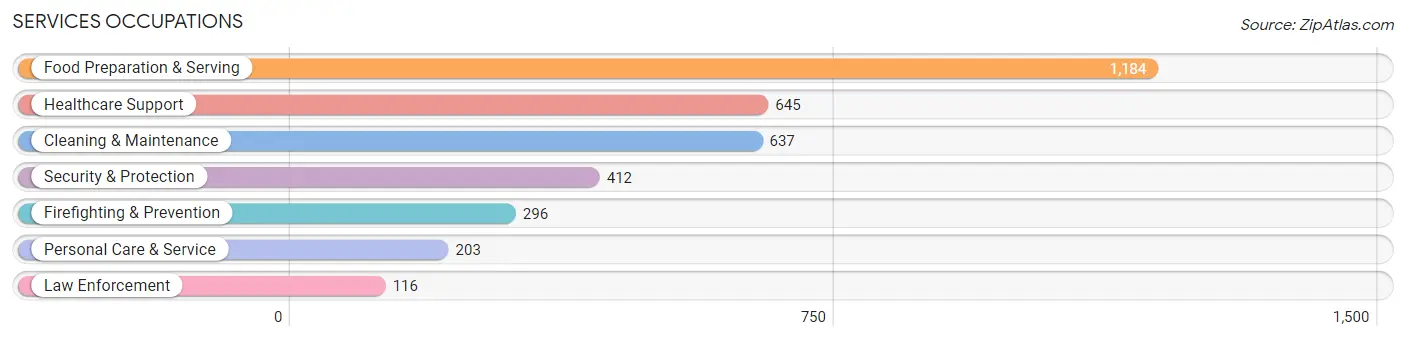
Services Occupations
The most common Services occupations in New Bern are Food Preparation & Serving (1,184 | 8.6%), Healthcare Support (645 | 4.7%), Cleaning & Maintenance (637 | 4.6%), Security & Protection (412 | 3.0%), and Firefighting & Prevention (296 | 2.2%).
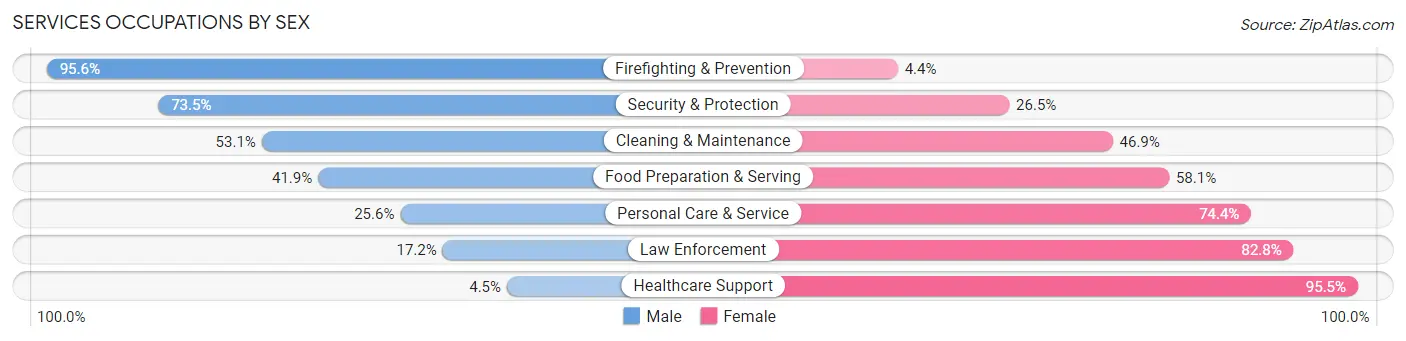
Services Occupations by Sex
Within the Services occupations in New Bern, the most male-oriented occupations are Firefighting & Prevention (95.6%), Security & Protection (73.5%), and Cleaning & Maintenance (53.1%), while the most female-oriented occupations are Healthcare Support (95.5%), Law Enforcement (82.8%), and Personal Care & Service (74.4%).
| Occupation | Male | Female |
| Healthcare Support | 29 (4.5%) | 616 (95.5%) |
| Security & Protection | 303 (73.5%) | 109 (26.5%) |
| Firefighting & Prevention | 283 (95.6%) | 13 (4.4%) |
| Law Enforcement | 20 (17.2%) | 96 (82.8%) |
| Food Preparation & Serving | 496 (41.9%) | 688 (58.1%) |
| Cleaning & Maintenance | 338 (53.1%) | 299 (46.9%) |
| Personal Care & Service | 52 (25.6%) | 151 (74.4%) |
| Total (Category) | 1,218 (39.5%) | 1,863 (60.5%) |
| Total (Overall) | 6,413 (46.7%) | 7,317 (53.3%) |
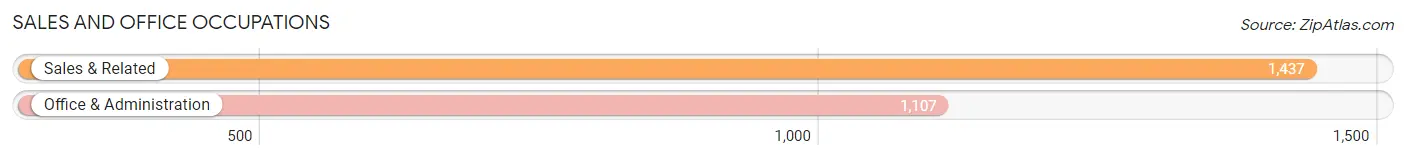
Sales and Office Occupations
The most common Sales and Office occupations in New Bern are Sales & Related (1,437 | 10.5%), and Office & Administration (1,107 | 8.1%).
Sales and Office Occupations by Sex
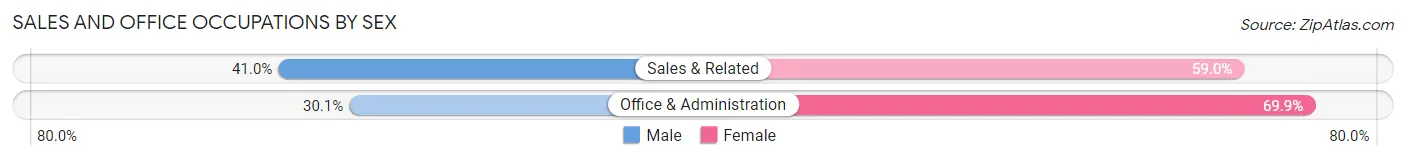
| Occupation | Male | Female |
| Sales & Related | 589 (41.0%) | 848 (59.0%) |
| Office & Administration | 333 (30.1%) | 774 (69.9%) |
| Total (Category) | 922 (36.2%) | 1,622 (63.8%) |
| Total (Overall) | 6,413 (46.7%) | 7,317 (53.3%) |
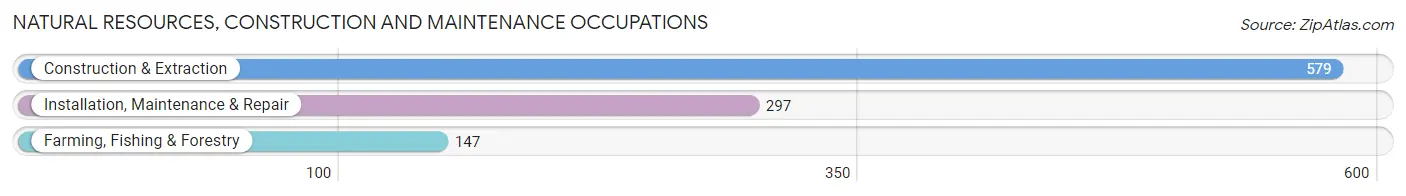
Natural Resources, Construction and Maintenance Occupations
The most common Natural Resources, Construction and Maintenance occupations in New Bern are Construction & Extraction (579 | 4.2%), Installation, Maintenance & Repair (297 | 2.2%), and Farming, Fishing & Forestry (147 | 1.1%).
Natural Resources, Construction and Maintenance Occupations by Sex
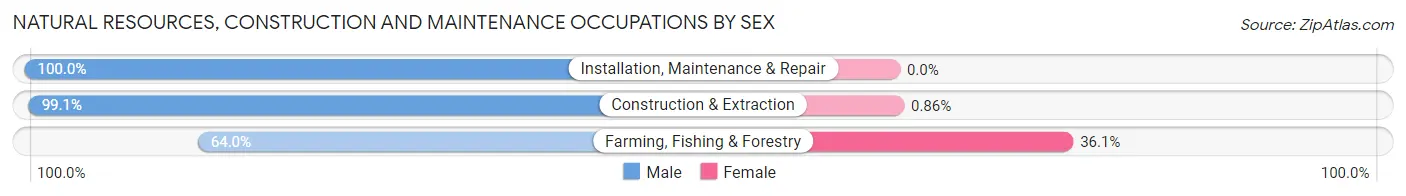
| Occupation | Male | Female |
| Farming, Fishing & Forestry | 94 (63.9%) | 53 (36.0%) |
| Construction & Extraction | 574 (99.1%) | 5 (0.9%) |
| Installation, Maintenance & Repair | 297 (100.0%) | 0 (0.0%) |
| Total (Category) | 965 (94.3%) | 58 (5.7%) |
| Total (Overall) | 6,413 (46.7%) | 7,317 (53.3%) |
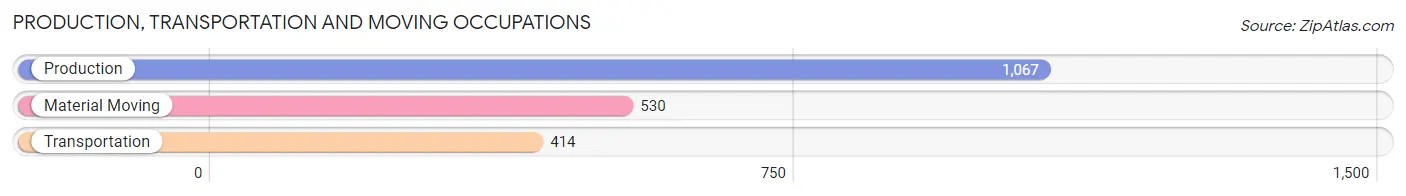
Production, Transportation and Moving Occupations
The most common Production, Transportation and Moving occupations in New Bern are Production (1,067 | 7.8%), Material Moving (530 | 3.9%), and Transportation (414 | 3.0%).
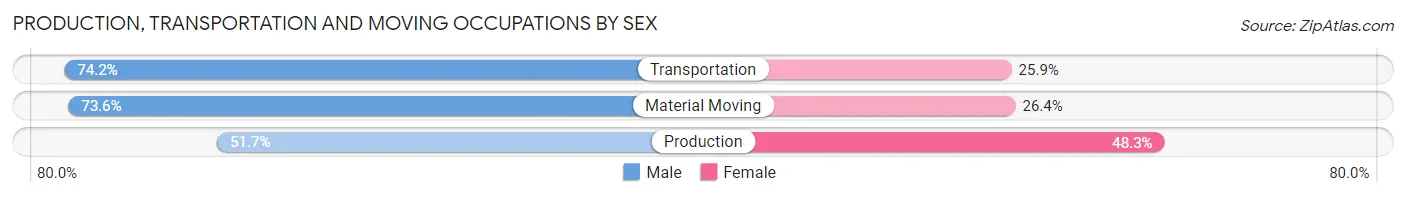
Production, Transportation and Moving Occupations by Sex
| Occupation | Male | Female |
| Production | 552 (51.7%) | 515 (48.3%) |
| Transportation | 307 (74.2%) | 107 (25.9%) |
| Material Moving | 390 (73.6%) | 140 (26.4%) |
| Total (Category) | 1,249 (62.1%) | 762 (37.9%) |
| Total (Overall) | 6,413 (46.7%) | 7,317 (53.3%) |
Employment Industries by Sex in New Bern
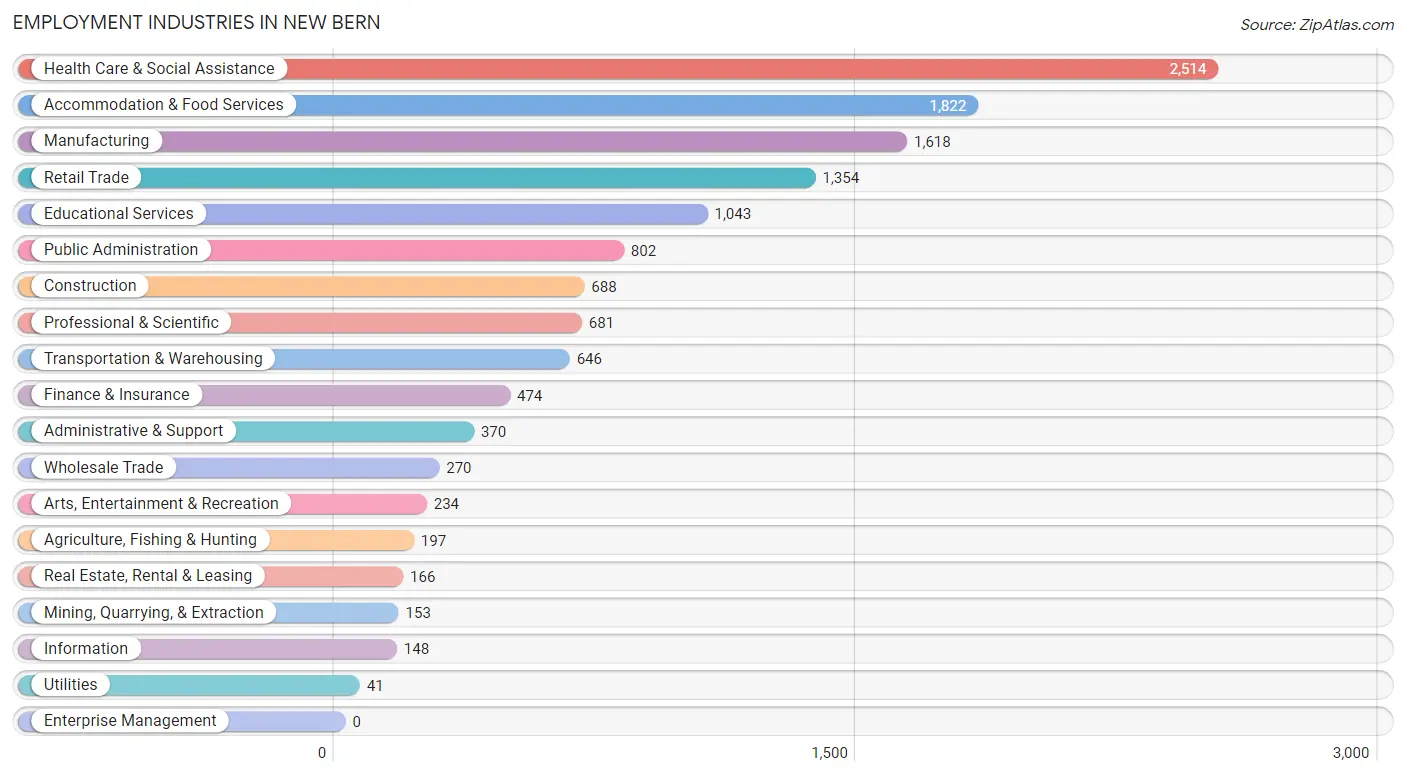
Employment Industries in New Bern
The major employment industries in New Bern include Health Care & Social Assistance (2,514 | 18.3%), Accommodation & Food Services (1,822 | 13.3%), Manufacturing (1,618 | 11.8%), Retail Trade (1,354 | 9.9%), and Educational Services (1,043 | 7.6%).
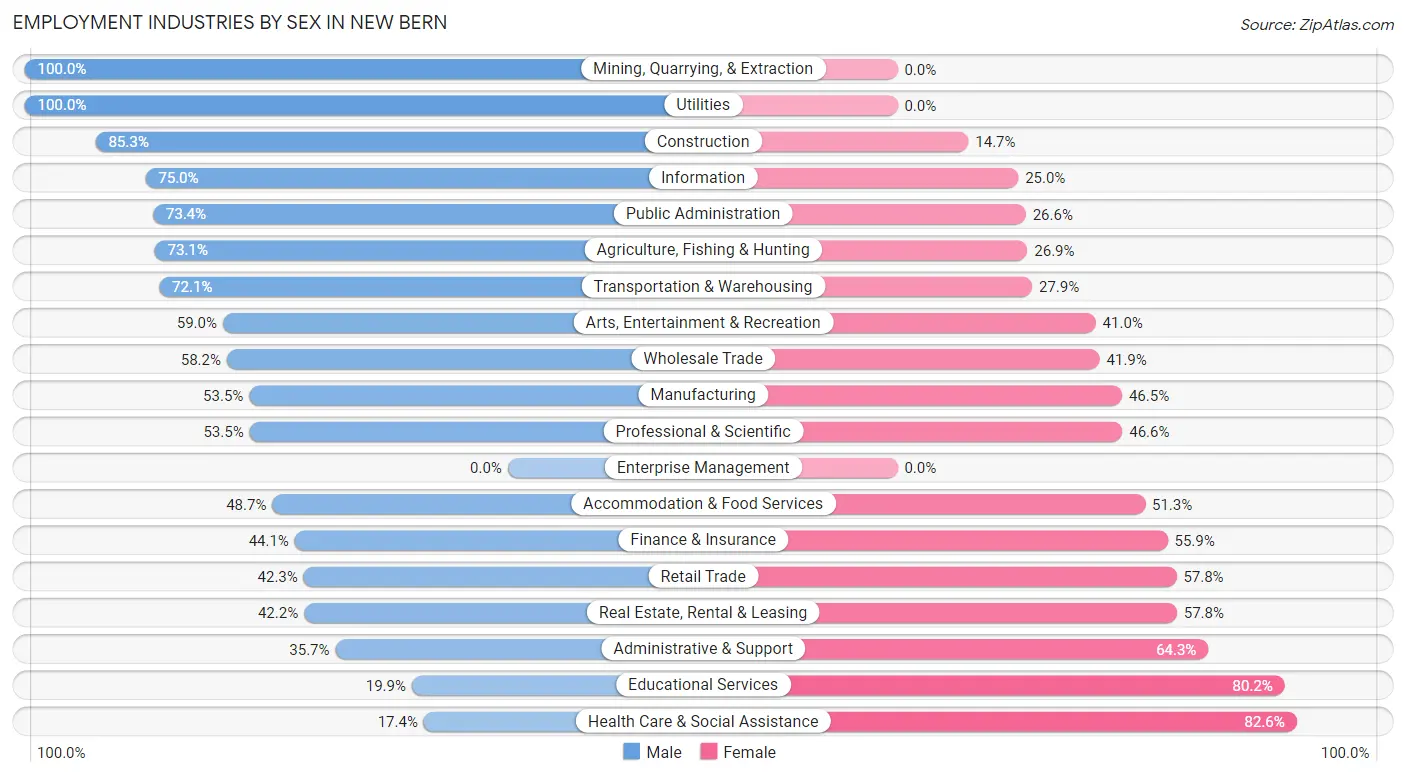
Employment Industries by Sex in New Bern
The New Bern industries that see more men than women are Mining, Quarrying, & Extraction (100.0%), Utilities (100.0%), and Construction (85.3%), whereas the industries that tend to have a higher number of women are Health Care & Social Assistance (82.6%), Educational Services (80.1%), and Administrative & Support (64.3%).
| Industry | Male | Female |
| Agriculture, Fishing & Hunting | 144 (73.1%) | 53 (26.9%) |
| Mining, Quarrying, & Extraction | 153 (100.0%) | 0 (0.0%) |
| Construction | 587 (85.3%) | 101 (14.7%) |
| Manufacturing | 866 (53.5%) | 752 (46.5%) |
| Wholesale Trade | 157 (58.2%) | 113 (41.8%) |
| Retail Trade | 572 (42.2%) | 782 (57.8%) |
| Transportation & Warehousing | 466 (72.1%) | 180 (27.9%) |
| Utilities | 41 (100.0%) | 0 (0.0%) |
| Information | 111 (75.0%) | 37 (25.0%) |
| Finance & Insurance | 209 (44.1%) | 265 (55.9%) |
| Real Estate, Rental & Leasing | 70 (42.2%) | 96 (57.8%) |
| Professional & Scientific | 364 (53.4%) | 317 (46.6%) |
| Enterprise Management | 0 (0.0%) | 0 (0.0%) |
| Administrative & Support | 132 (35.7%) | 238 (64.3%) |
| Educational Services | 207 (19.9%) | 836 (80.1%) |
| Health Care & Social Assistance | 437 (17.4%) | 2,077 (82.6%) |
| Arts, Entertainment & Recreation | 138 (59.0%) | 96 (41.0%) |
| Accommodation & Food Services | 888 (48.7%) | 934 (51.3%) |
| Public Administration | 589 (73.4%) | 213 (26.6%) |
| Total | 6,413 (46.7%) | 7,317 (53.3%) |
Education in New Bern
School Enrollment in New Bern
The most common levels of schooling among the 7,632 students in New Bern are elementary school (1,829 | 24.0%), college / undergraduate (1,665 | 21.8%), and middle school (1,549 | 20.3%).
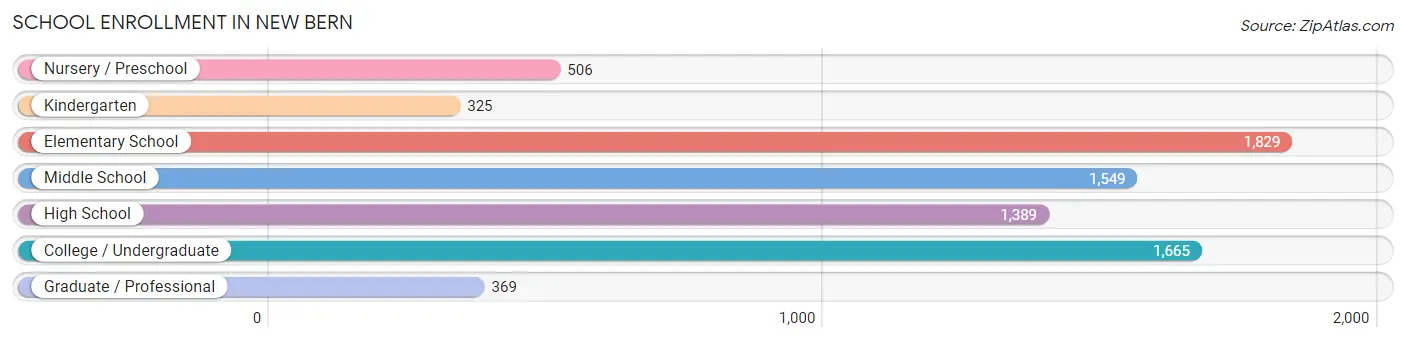
| School Level | # Students | % Students |
| Nursery / Preschool | 506 | 6.6% |
| Kindergarten | 325 | 4.3% |
| Elementary School | 1,829 | 24.0% |
| Middle School | 1,549 | 20.3% |
| High School | 1,389 | 18.2% |
| College / Undergraduate | 1,665 | 21.8% |
| Graduate / Professional | 369 | 4.8% |
| Total | 7,632 | 100.0% |
School Enrollment by Age by Funding Source in New Bern
Out of a total of 7,632 students who are enrolled in schools in New Bern, 1,511 (19.8%) attend a private institution, while the remaining 6,121 (80.2%) are enrolled in public schools. The age group of 25 to 34 year olds has the highest likelihood of being enrolled in private schools, with 293 (52.3% in the age bracket) enrolled. Conversely, the age group of 18 to 19 year olds has the lowest likelihood of being enrolled in a private school, with 348 (100.0% in the age bracket) attending a public institution.
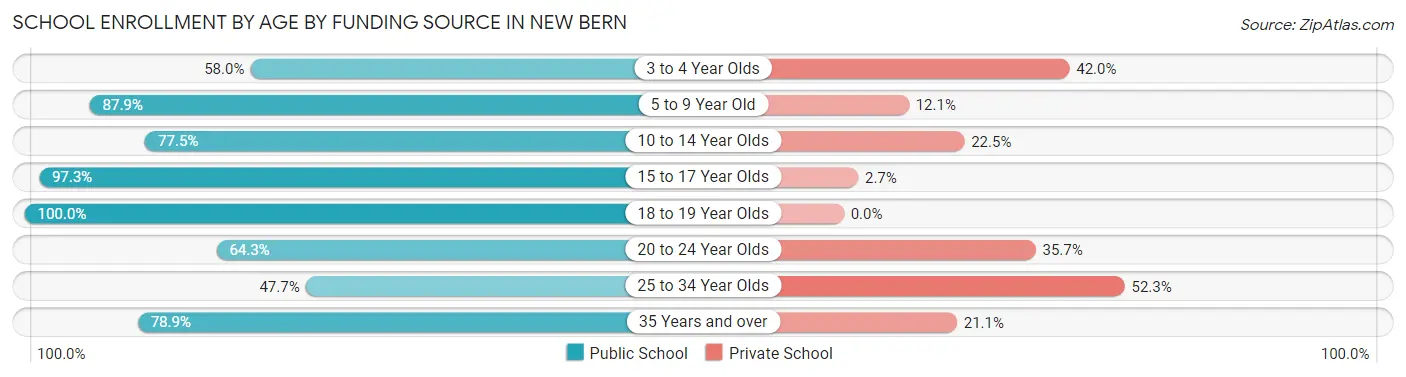
| Age Bracket | Public School | Private School |
| 3 to 4 Year Olds | 200 (58.0%) | 145 (42.0%) |
| 5 to 9 Year Old | 1,863 (87.9%) | 257 (12.1%) |
| 10 to 14 Year Olds | 1,405 (77.5%) | 407 (22.5%) |
| 15 to 17 Year Olds | 1,016 (97.3%) | 28 (2.7%) |
| 18 to 19 Year Olds | 348 (100.0%) | 0 (0.0%) |
| 20 to 24 Year Olds | 374 (64.3%) | 208 (35.7%) |
| 25 to 34 Year Olds | 267 (47.7%) | 293 (52.3%) |
| 35 Years and over | 648 (78.9%) | 173 (21.1%) |
| Total | 6,121 (80.2%) | 1,511 (19.8%) |
Educational Attainment by Field of Study in New Bern
Business (1,101 | 16.7%), education (879 | 13.3%), social sciences (642 | 9.7%), arts & humanities (601 | 9.1%), and engineering (592 | 9.0%) are the most common fields of study among 6,610 individuals in New Bern who have obtained a bachelor's degree or higher.
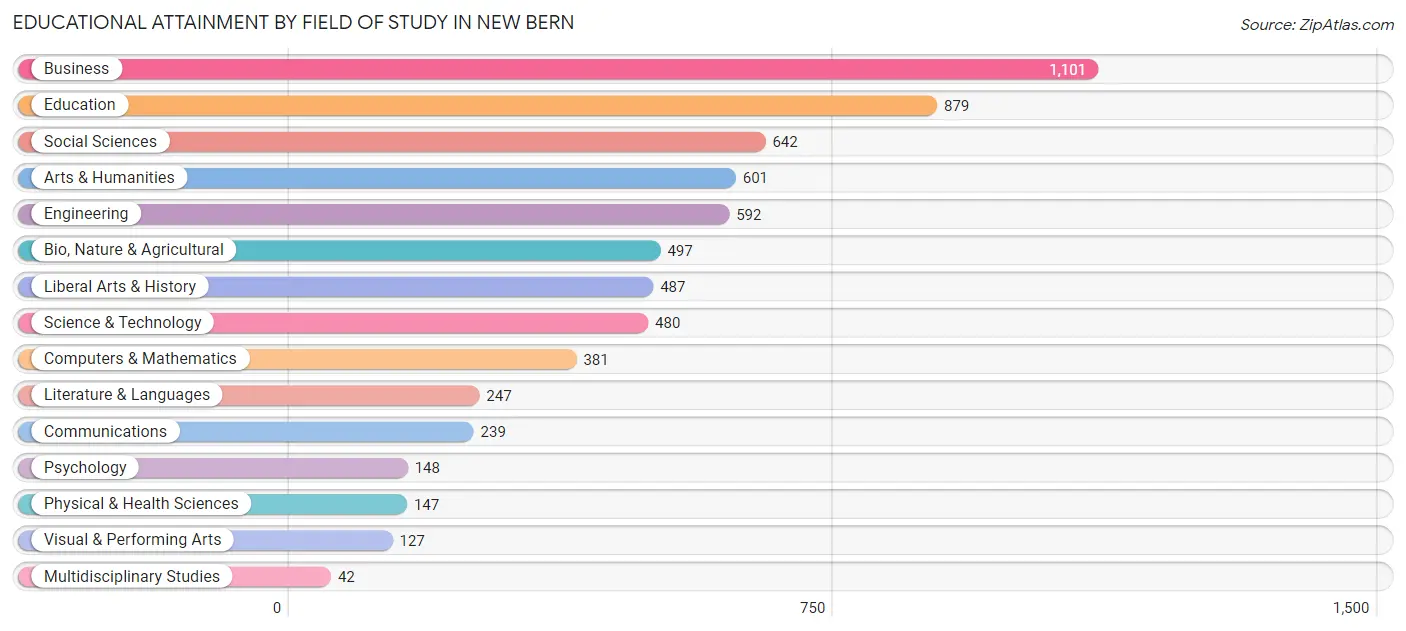
| Field of Study | # Graduates | % Graduates |
| Computers & Mathematics | 381 | 5.8% |
| Bio, Nature & Agricultural | 497 | 7.5% |
| Physical & Health Sciences | 147 | 2.2% |
| Psychology | 148 | 2.2% |
| Social Sciences | 642 | 9.7% |
| Engineering | 592 | 9.0% |
| Multidisciplinary Studies | 42 | 0.6% |
| Science & Technology | 480 | 7.3% |
| Business | 1,101 | 16.7% |
| Education | 879 | 13.3% |
| Literature & Languages | 247 | 3.7% |
| Liberal Arts & History | 487 | 7.4% |
| Visual & Performing Arts | 127 | 1.9% |
| Communications | 239 | 3.6% |
| Arts & Humanities | 601 | 9.1% |
| Total | 6,610 | 100.0% |
Transportation & Commute in New Bern
Vehicle Availability by Sex in New Bern
The most prevalent vehicle ownership categories in New Bern are males with 2 vehicles (3,514, accounting for 52.6%) and females with 2 vehicles (3,440, making up 48.7%).
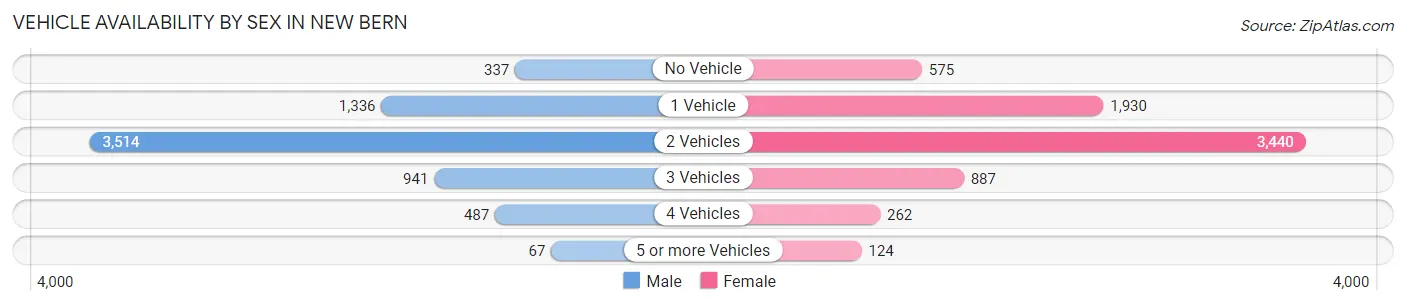
| Vehicles Available | Male | Female |
| No Vehicle | 337 (5.0%) | 575 (8.0%) |
| 1 Vehicle | 1,336 (20.0%) | 1,930 (26.7%) |
| 2 Vehicles | 3,514 (52.6%) | 3,440 (47.7%) |
| 3 Vehicles | 941 (14.1%) | 887 (12.3%) |
| 4 Vehicles | 487 (7.3%) | 262 (3.6%) |
| 5 or more Vehicles | 67 (1.0%) | 124 (1.7%) |
| Total | 6,682 (100.0%) | 7,218 (100.0%) |
Commute Time in New Bern
The most frequently occuring commute durations in New Bern are 10 to 14 minutes (3,842 commuters, 29.1%), 5 to 9 minutes (2,251 commuters, 17.1%), and 15 to 19 minutes (1,976 commuters, 15.0%).
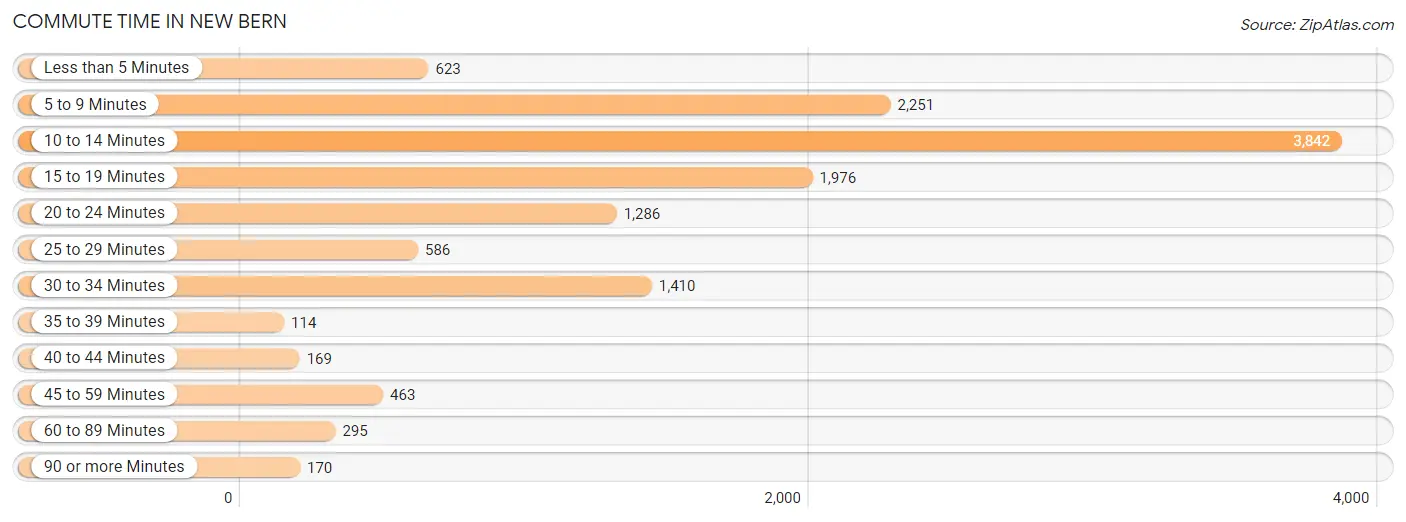
| Commute Time | # Commuters | % Commuters |
| Less than 5 Minutes | 623 | 4.7% |
| 5 to 9 Minutes | 2,251 | 17.1% |
| 10 to 14 Minutes | 3,842 | 29.1% |
| 15 to 19 Minutes | 1,976 | 15.0% |
| 20 to 24 Minutes | 1,286 | 9.8% |
| 25 to 29 Minutes | 586 | 4.4% |
| 30 to 34 Minutes | 1,410 | 10.7% |
| 35 to 39 Minutes | 114 | 0.9% |
| 40 to 44 Minutes | 169 | 1.3% |
| 45 to 59 Minutes | 463 | 3.5% |
| 60 to 89 Minutes | 295 | 2.2% |
| 90 or more Minutes | 170 | 1.3% |
Commute Time by Sex in New Bern
The most common commute times in New Bern are 10 to 14 minutes (1,773 commuters, 27.6%) for males and 10 to 14 minutes (2,069 commuters, 30.6%) for females.
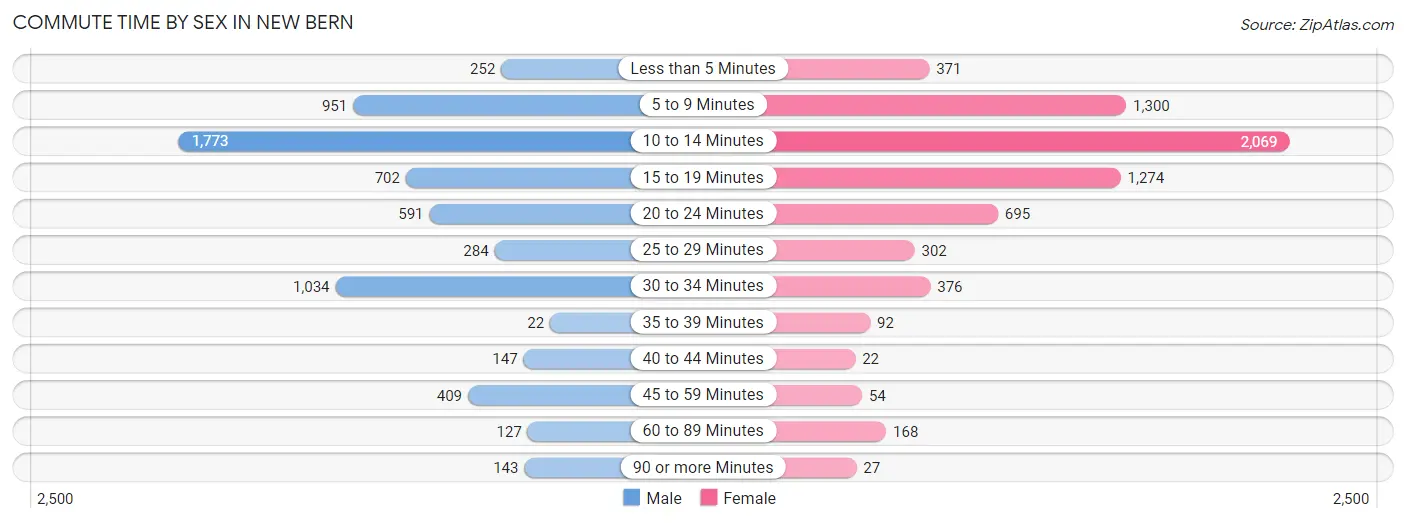
| Commute Time | Male | Female |
| Less than 5 Minutes | 252 (3.9%) | 371 (5.5%) |
| 5 to 9 Minutes | 951 (14.8%) | 1,300 (19.3%) |
| 10 to 14 Minutes | 1,773 (27.6%) | 2,069 (30.6%) |
| 15 to 19 Minutes | 702 (10.9%) | 1,274 (18.9%) |
| 20 to 24 Minutes | 591 (9.2%) | 695 (10.3%) |
| 25 to 29 Minutes | 284 (4.4%) | 302 (4.5%) |
| 30 to 34 Minutes | 1,034 (16.1%) | 376 (5.6%) |
| 35 to 39 Minutes | 22 (0.3%) | 92 (1.4%) |
| 40 to 44 Minutes | 147 (2.3%) | 22 (0.3%) |
| 45 to 59 Minutes | 409 (6.4%) | 54 (0.8%) |
| 60 to 89 Minutes | 127 (2.0%) | 168 (2.5%) |
| 90 or more Minutes | 143 (2.2%) | 27 (0.4%) |
Time of Departure to Work by Sex in New Bern
The most frequent times of departure to work in New Bern are 6:00 AM to 6:29 AM (1,017, 15.8%) for males and 8:00 AM to 8:29 AM (952, 14.1%) for females.
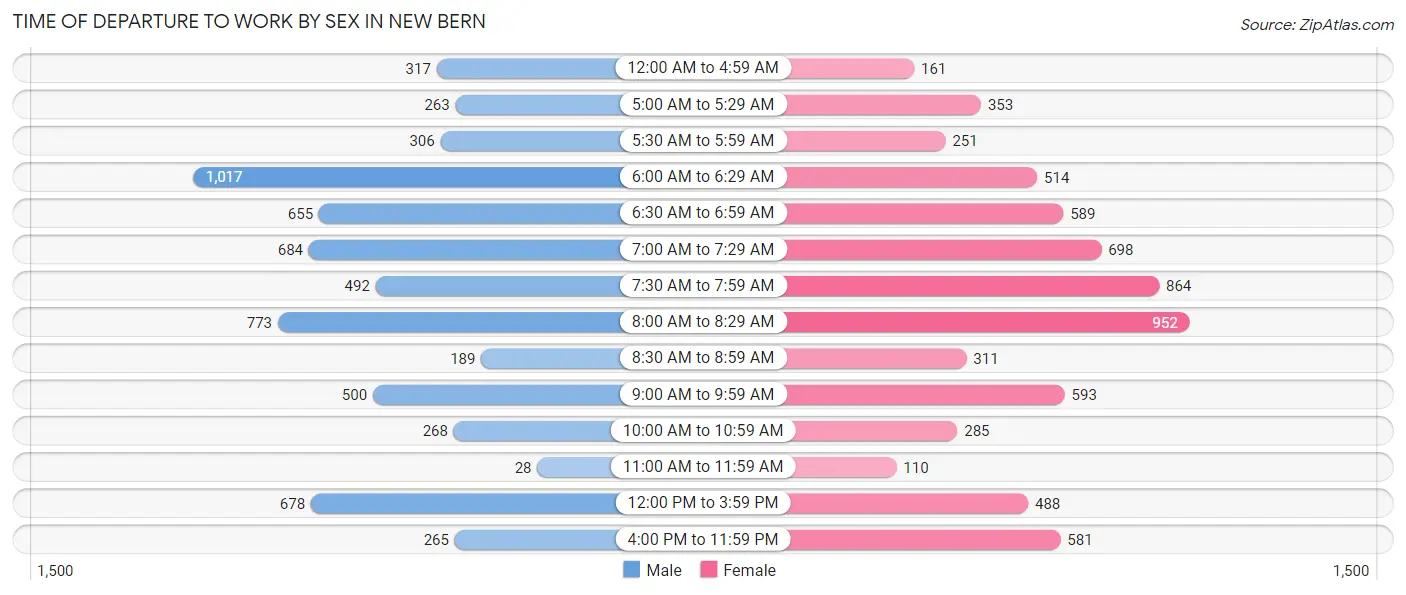
| Time of Departure | Male | Female |
| 12:00 AM to 4:59 AM | 317 (4.9%) | 161 (2.4%) |
| 5:00 AM to 5:29 AM | 263 (4.1%) | 353 (5.2%) |
| 5:30 AM to 5:59 AM | 306 (4.8%) | 251 (3.7%) |
| 6:00 AM to 6:29 AM | 1,017 (15.8%) | 514 (7.6%) |
| 6:30 AM to 6:59 AM | 655 (10.2%) | 589 (8.7%) |
| 7:00 AM to 7:29 AM | 684 (10.6%) | 698 (10.3%) |
| 7:30 AM to 7:59 AM | 492 (7.6%) | 864 (12.8%) |
| 8:00 AM to 8:29 AM | 773 (12.0%) | 952 (14.1%) |
| 8:30 AM to 8:59 AM | 189 (2.9%) | 311 (4.6%) |
| 9:00 AM to 9:59 AM | 500 (7.8%) | 593 (8.8%) |
| 10:00 AM to 10:59 AM | 268 (4.2%) | 285 (4.2%) |
| 11:00 AM to 11:59 AM | 28 (0.4%) | 110 (1.6%) |
| 12:00 PM to 3:59 PM | 678 (10.5%) | 488 (7.2%) |
| 4:00 PM to 11:59 PM | 265 (4.1%) | 581 (8.6%) |
| Total | 6,435 (100.0%) | 6,750 (100.0%) |
Housing Occupancy in New Bern
Occupancy by Ownership in New Bern
Of the total 14,182 dwellings in New Bern, owner-occupied units account for 8,279 (58.4%), while renter-occupied units make up 5,903 (41.6%).
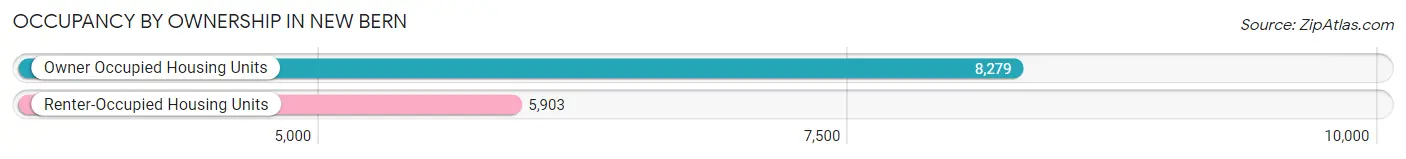
| Occupancy | # Housing Units | % Housing Units |
| Owner Occupied Housing Units | 8,279 | 58.4% |
| Renter-Occupied Housing Units | 5,903 | 41.6% |
| Total Occupied Housing Units | 14,182 | 100.0% |
Occupancy by Household Size in New Bern
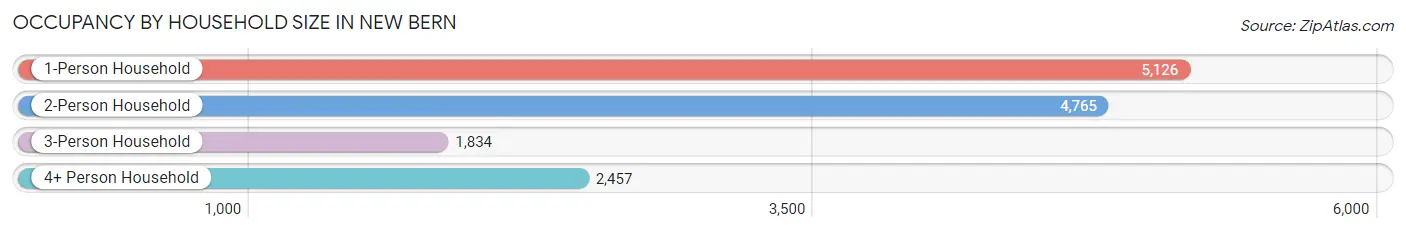
| Household Size | # Housing Units | % Housing Units |
| 1-Person Household | 5,126 | 36.1% |
| 2-Person Household | 4,765 | 33.6% |
| 3-Person Household | 1,834 | 12.9% |
| 4+ Person Household | 2,457 | 17.3% |
| Total Housing Units | 14,182 | 100.0% |
Occupancy by Ownership by Household Size in New Bern
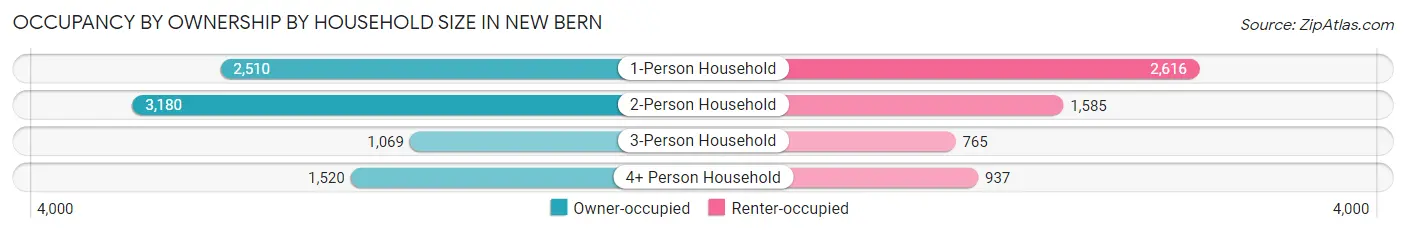
| Household Size | Owner-occupied | Renter-occupied |
| 1-Person Household | 2,510 (49.0%) | 2,616 (51.0%) |
| 2-Person Household | 3,180 (66.7%) | 1,585 (33.3%) |
| 3-Person Household | 1,069 (58.3%) | 765 (41.7%) |
| 4+ Person Household | 1,520 (61.9%) | 937 (38.1%) |
| Total Housing Units | 8,279 (58.4%) | 5,903 (41.6%) |
Occupancy by Educational Attainment in New Bern
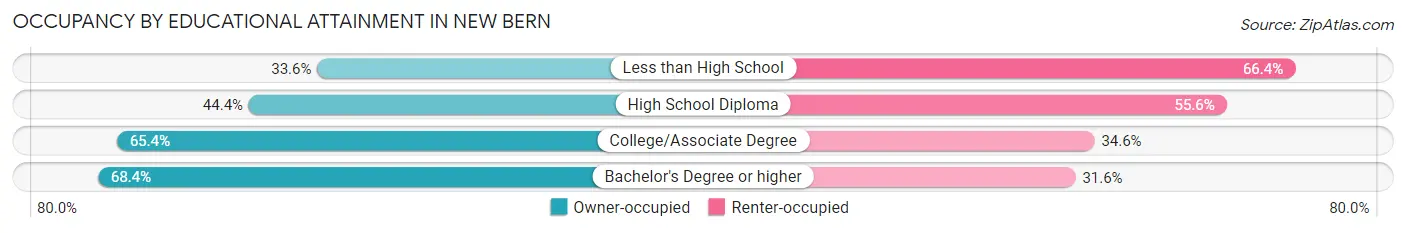
| Household Size | Owner-occupied | Renter-occupied |
| Less than High School | 463 (33.6%) | 916 (66.4%) |
| High School Diploma | 1,441 (44.4%) | 1,803 (55.6%) |
| College/Associate Degree | 3,530 (65.4%) | 1,869 (34.6%) |
| Bachelor's Degree or higher | 2,845 (68.4%) | 1,315 (31.6%) |
Occupancy by Age of Householder in New Bern
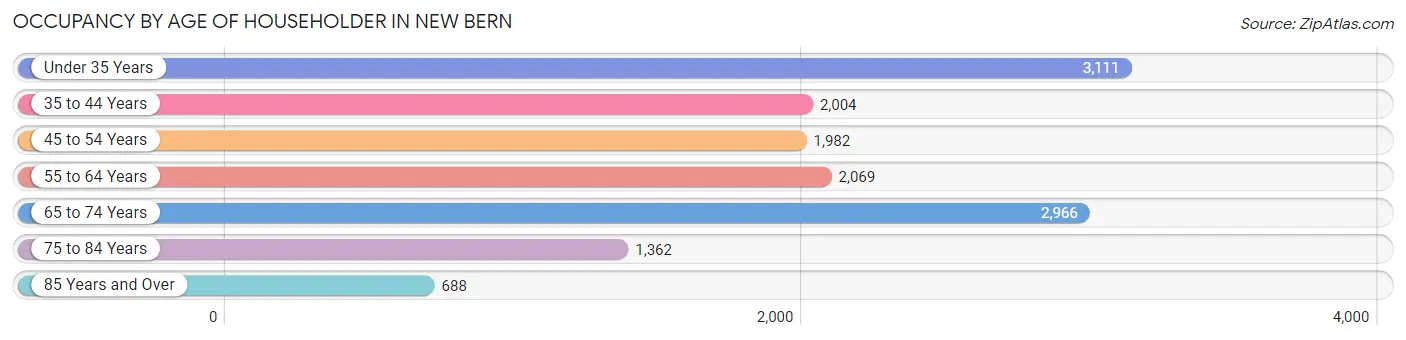
| Age Bracket | # Households | % Households |
| Under 35 Years | 3,111 | 21.9% |
| 35 to 44 Years | 2,004 | 14.1% |
| 45 to 54 Years | 1,982 | 14.0% |
| 55 to 64 Years | 2,069 | 14.6% |
| 65 to 74 Years | 2,966 | 20.9% |
| 75 to 84 Years | 1,362 | 9.6% |
| 85 Years and Over | 688 | 4.9% |
| Total | 14,182 | 100.0% |
Housing Finances in New Bern
Median Income by Occupancy in New Bern
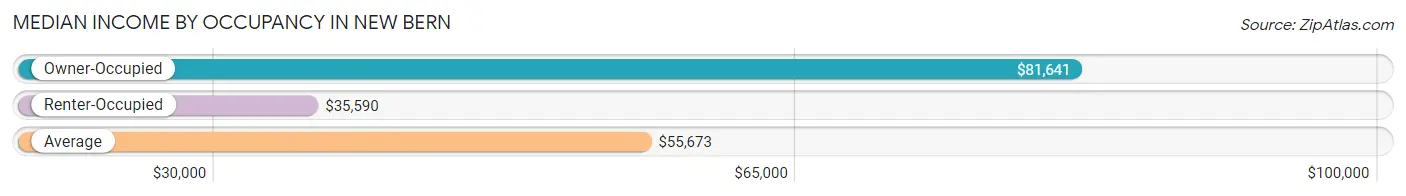
| Occupancy Type | # Households | Median Income |
| Owner-Occupied | 8,279 (58.4%) | $81,641 |
| Renter-Occupied | 5,903 (41.6%) | $35,590 |
| Average | 14,182 (100.0%) | $55,673 |
Occupancy by Householder Income Bracket in New Bern
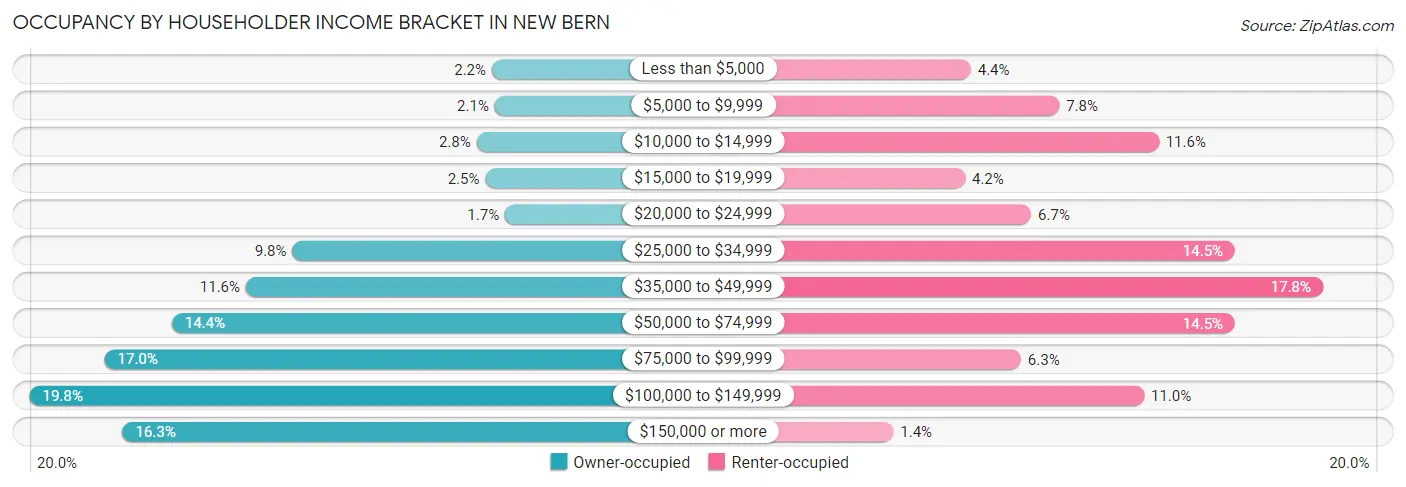
| Income Bracket | Owner-occupied | Renter-occupied |
| Less than $5,000 | 182 (2.2%) | 259 (4.4%) |
| $5,000 to $9,999 | 173 (2.1%) | 458 (7.8%) |
| $10,000 to $14,999 | 230 (2.8%) | 682 (11.6%) |
| $15,000 to $19,999 | 203 (2.5%) | 246 (4.2%) |
| $20,000 to $24,999 | 141 (1.7%) | 395 (6.7%) |
| $25,000 to $34,999 | 811 (9.8%) | 853 (14.4%) |
| $35,000 to $49,999 | 958 (11.6%) | 1,051 (17.8%) |
| $50,000 to $74,999 | 1,191 (14.4%) | 853 (14.4%) |
| $75,000 to $99,999 | 1,403 (17.0%) | 372 (6.3%) |
| $100,000 to $149,999 | 1,640 (19.8%) | 649 (11.0%) |
| $150,000 or more | 1,347 (16.3%) | 85 (1.4%) |
| Total | 8,279 (100.0%) | 5,903 (100.0%) |
Monthly Housing Cost Tiers in New Bern
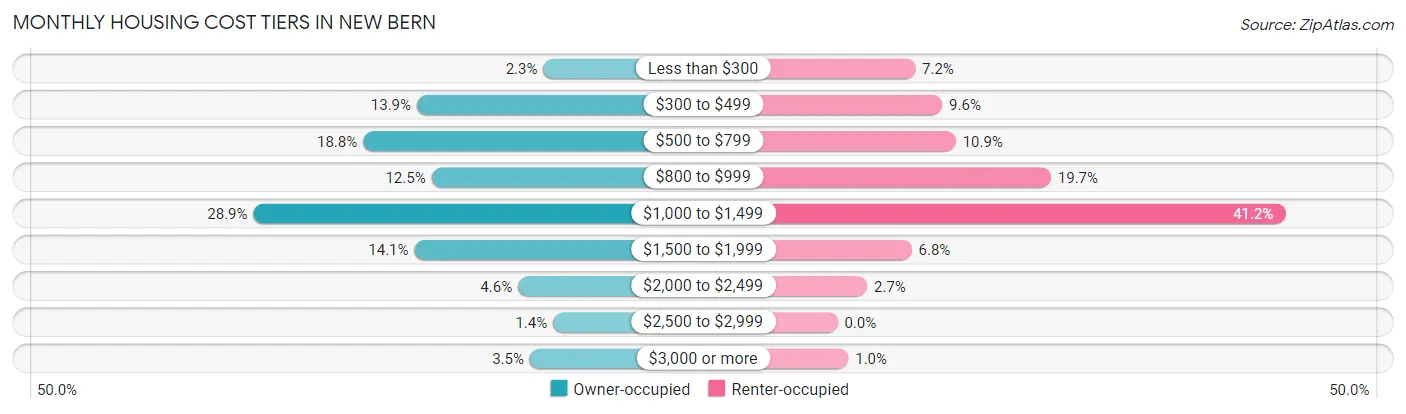
| Monthly Cost | Owner-occupied | Renter-occupied |
| Less than $300 | 186 (2.2%) | 422 (7.1%) |
| $300 to $499 | 1,150 (13.9%) | 569 (9.6%) |
| $500 to $799 | 1,560 (18.8%) | 643 (10.9%) |
| $800 to $999 | 1,038 (12.5%) | 1,160 (19.7%) |
| $1,000 to $1,499 | 2,396 (28.9%) | 2,433 (41.2%) |
| $1,500 to $1,999 | 1,169 (14.1%) | 403 (6.8%) |
| $2,000 to $2,499 | 379 (4.6%) | 161 (2.7%) |
| $2,500 to $2,999 | 112 (1.3%) | 0 (0.0%) |
| $3,000 or more | 289 (3.5%) | 59 (1.0%) |
| Total | 8,279 (100.0%) | 5,903 (100.0%) |
Physical Housing Characteristics in New Bern
Housing Structures in New Bern
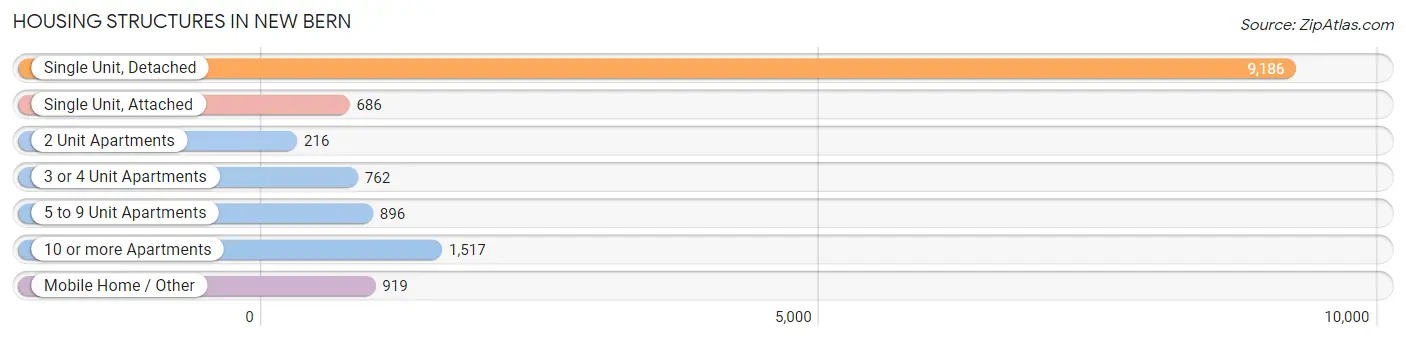
| Structure Type | # Housing Units | % Housing Units |
| Single Unit, Detached | 9,186 | 64.8% |
| Single Unit, Attached | 686 | 4.8% |
| 2 Unit Apartments | 216 | 1.5% |
| 3 or 4 Unit Apartments | 762 | 5.4% |
| 5 to 9 Unit Apartments | 896 | 6.3% |
| 10 or more Apartments | 1,517 | 10.7% |
| Mobile Home / Other | 919 | 6.5% |
| Total | 14,182 | 100.0% |
Housing Structures by Occupancy in New Bern
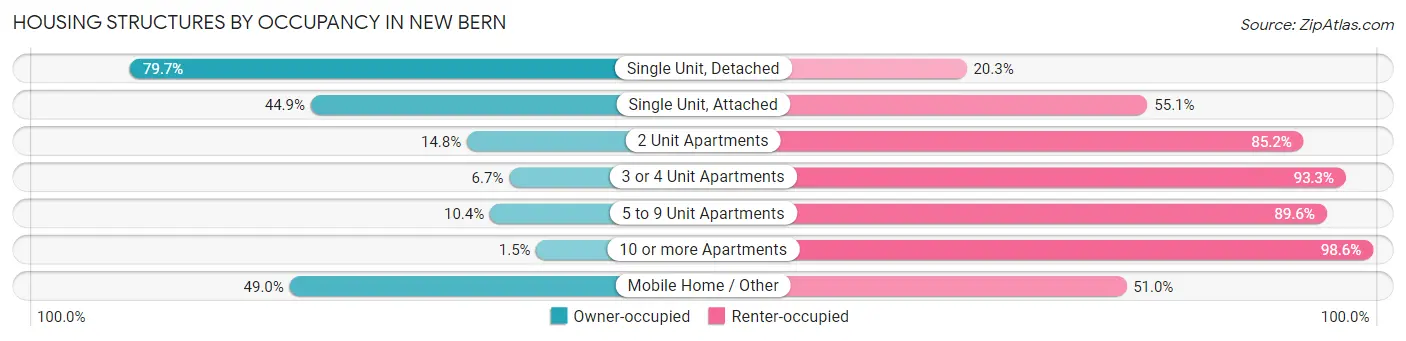
| Structure Type | Owner-occupied | Renter-occupied |
| Single Unit, Detached | 7,323 (79.7%) | 1,863 (20.3%) |
| Single Unit, Attached | 308 (44.9%) | 378 (55.1%) |
| 2 Unit Apartments | 32 (14.8%) | 184 (85.2%) |
| 3 or 4 Unit Apartments | 51 (6.7%) | 711 (93.3%) |
| 5 to 9 Unit Apartments | 93 (10.4%) | 803 (89.6%) |
| 10 or more Apartments | 22 (1.5%) | 1,495 (98.6%) |
| Mobile Home / Other | 450 (49.0%) | 469 (51.0%) |
| Total | 8,279 (58.4%) | 5,903 (41.6%) |
Housing Structures by Number of Rooms in New Bern
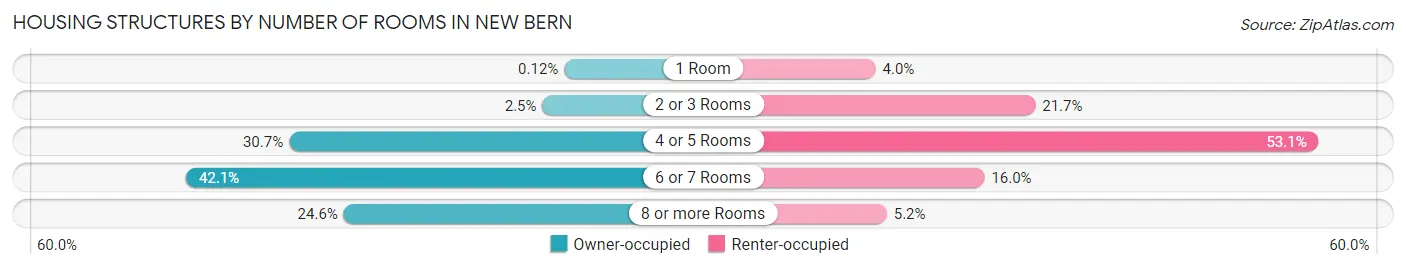
| Number of Rooms | Owner-occupied | Renter-occupied |
| 1 Room | 10 (0.1%) | 234 (4.0%) |
| 2 or 3 Rooms | 210 (2.5%) | 1,280 (21.7%) |
| 4 or 5 Rooms | 2,538 (30.7%) | 3,135 (53.1%) |
| 6 or 7 Rooms | 3,485 (42.1%) | 947 (16.0%) |
| 8 or more Rooms | 2,036 (24.6%) | 307 (5.2%) |
| Total | 8,279 (100.0%) | 5,903 (100.0%) |
Housing Structure by Heating Type in New Bern
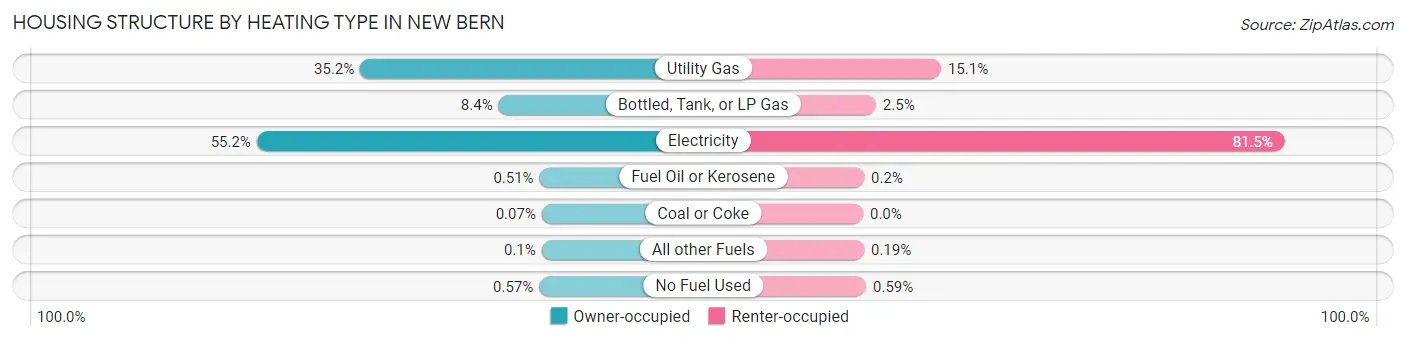
| Heating Type | Owner-occupied | Renter-occupied |
| Utility Gas | 2,912 (35.2%) | 889 (15.1%) |
| Bottled, Tank, or LP Gas | 698 (8.4%) | 147 (2.5%) |
| Electricity | 4,566 (55.1%) | 4,809 (81.5%) |
| Fuel Oil or Kerosene | 42 (0.5%) | 12 (0.2%) |
| Coal or Coke | 6 (0.1%) | 0 (0.0%) |
| All other Fuels | 8 (0.1%) | 11 (0.2%) |
| No Fuel Used | 47 (0.6%) | 35 (0.6%) |
| Total | 8,279 (100.0%) | 5,903 (100.0%) |
Household Vehicle Usage in New Bern
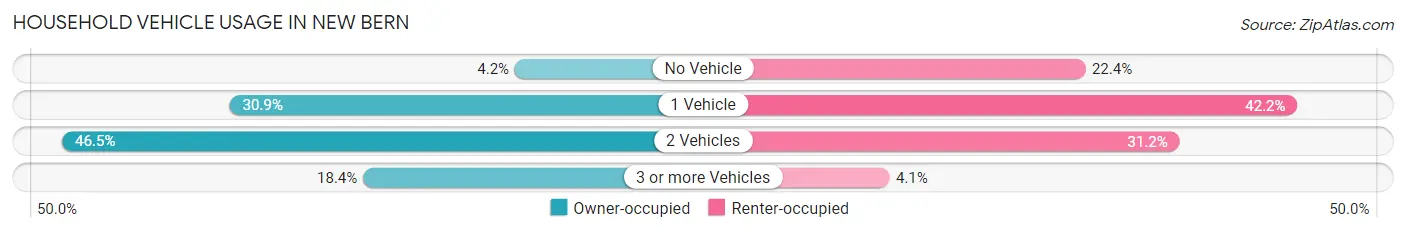
| Vehicles per Household | Owner-occupied | Renter-occupied |
| No Vehicle | 350 (4.2%) | 1,323 (22.4%) |
| 1 Vehicle | 2,556 (30.9%) | 2,493 (42.2%) |
| 2 Vehicles | 3,850 (46.5%) | 1,844 (31.2%) |
| 3 or more Vehicles | 1,523 (18.4%) | 243 (4.1%) |
| Total | 8,279 (100.0%) | 5,903 (100.0%) |
Real Estate & Mortgages in New Bern
Real Estate and Mortgage Overview in New Bern
| Characteristic | Without Mortgage | With Mortgage |
| Housing Units | 3,160 | 5,119 |
| Median Property Value | $179,700 | $217,900 |
| Median Household Income | $66,623 | $941 |
| Monthly Housing Costs | $544 | $289 |
| Real Estate Taxes | $1,503 | $111 |
Property Value by Mortgage Status in New Bern
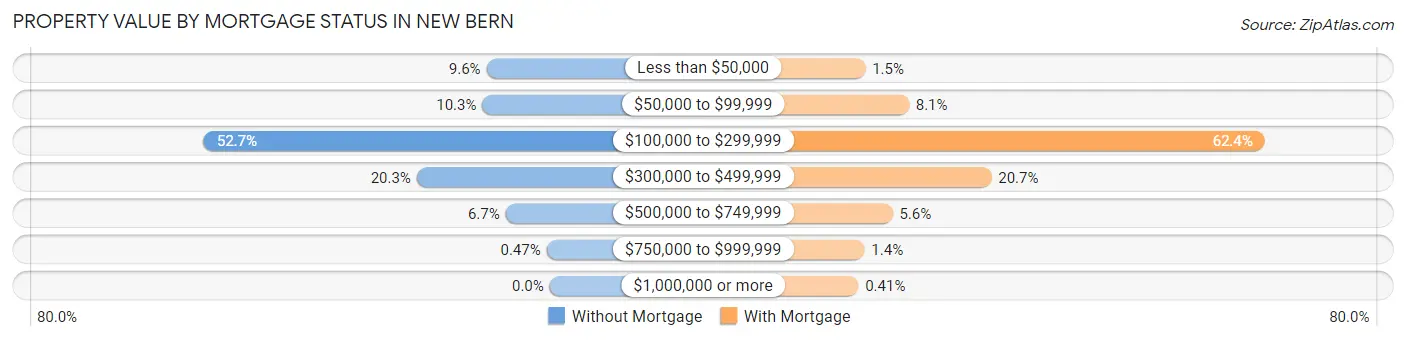
| Property Value | Without Mortgage | With Mortgage |
| Less than $50,000 | 304 (9.6%) | 75 (1.5%) |
| $50,000 to $99,999 | 324 (10.2%) | 415 (8.1%) |
| $100,000 to $299,999 | 1,665 (52.7%) | 3,192 (62.4%) |
| $300,000 to $499,999 | 640 (20.3%) | 1,059 (20.7%) |
| $500,000 to $749,999 | 212 (6.7%) | 288 (5.6%) |
| $750,000 to $999,999 | 15 (0.5%) | 69 (1.3%) |
| $1,000,000 or more | 0 (0.0%) | 21 (0.4%) |
| Total | 3,160 (100.0%) | 5,119 (100.0%) |
Household Income by Mortgage Status in New Bern
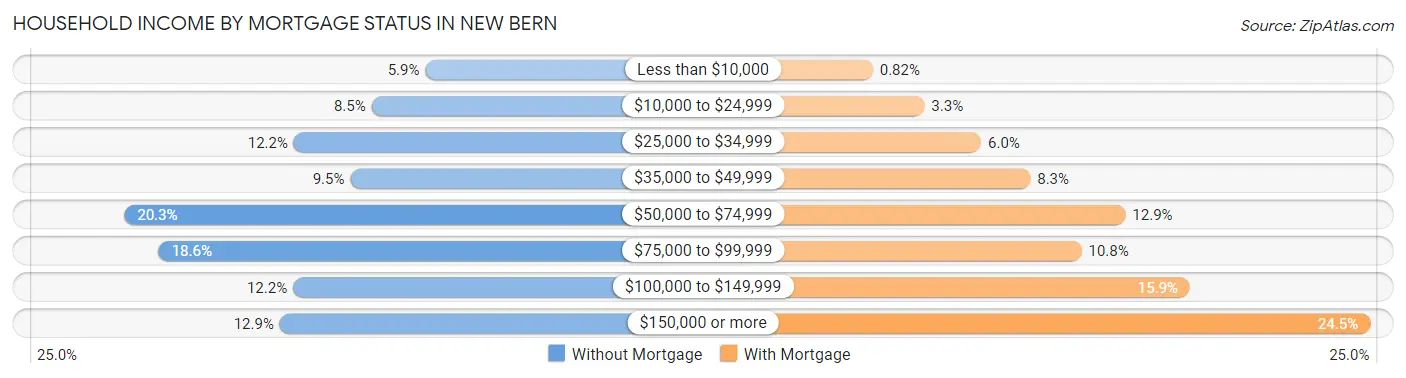
| Household Income | Without Mortgage | With Mortgage |
| Less than $10,000 | 187 (5.9%) | 42 (0.8%) |
| $10,000 to $24,999 | 268 (8.5%) | 168 (3.3%) |
| $25,000 to $34,999 | 385 (12.2%) | 306 (6.0%) |
| $35,000 to $49,999 | 300 (9.5%) | 426 (8.3%) |
| $50,000 to $74,999 | 640 (20.3%) | 658 (12.9%) |
| $75,000 to $99,999 | 588 (18.6%) | 551 (10.8%) |
| $100,000 to $149,999 | 386 (12.2%) | 815 (15.9%) |
| $150,000 or more | 406 (12.9%) | 1,254 (24.5%) |
| Total | 3,160 (100.0%) | 5,119 (100.0%) |
Property Value to Household Income Ratio in New Bern
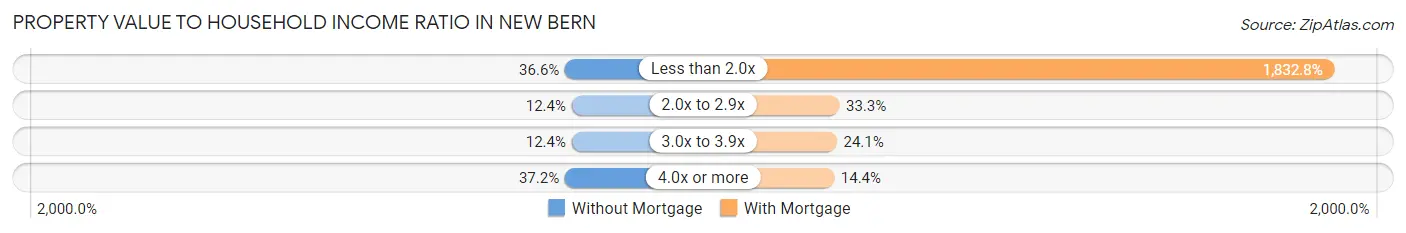
| Value-to-Income Ratio | Without Mortgage | With Mortgage |
| Less than 2.0x | 1,155 (36.5%) | 93,821 (1,832.8%) |
| 2.0x to 2.9x | 391 (12.4%) | 1,702 (33.3%) |
| 3.0x to 3.9x | 393 (12.4%) | 1,235 (24.1%) |
| 4.0x or more | 1,176 (37.2%) | 735 (14.4%) |
| Total | 3,160 (100.0%) | 5,119 (100.0%) |
Real Estate Taxes by Mortgage Status in New Bern
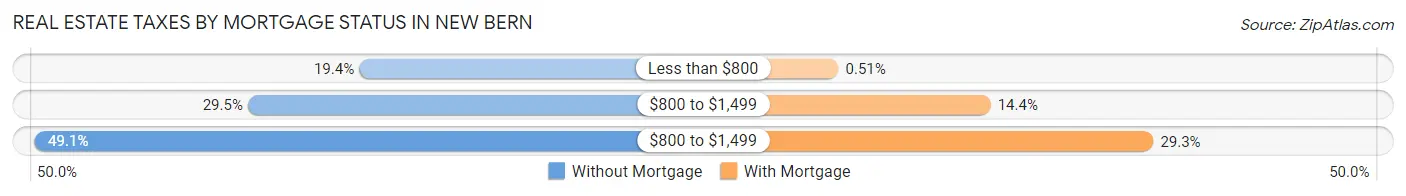
| Property Taxes | Without Mortgage | With Mortgage |
| Less than $800 | 612 (19.4%) | 26 (0.5%) |
| $800 to $1,499 | 933 (29.5%) | 737 (14.4%) |
| $800 to $1,499 | 1,550 (49.0%) | 1,498 (29.3%) |
| Total | 3,160 (100.0%) | 5,119 (100.0%) |
Health & Disability in New Bern
Health Insurance Coverage by Age in New Bern
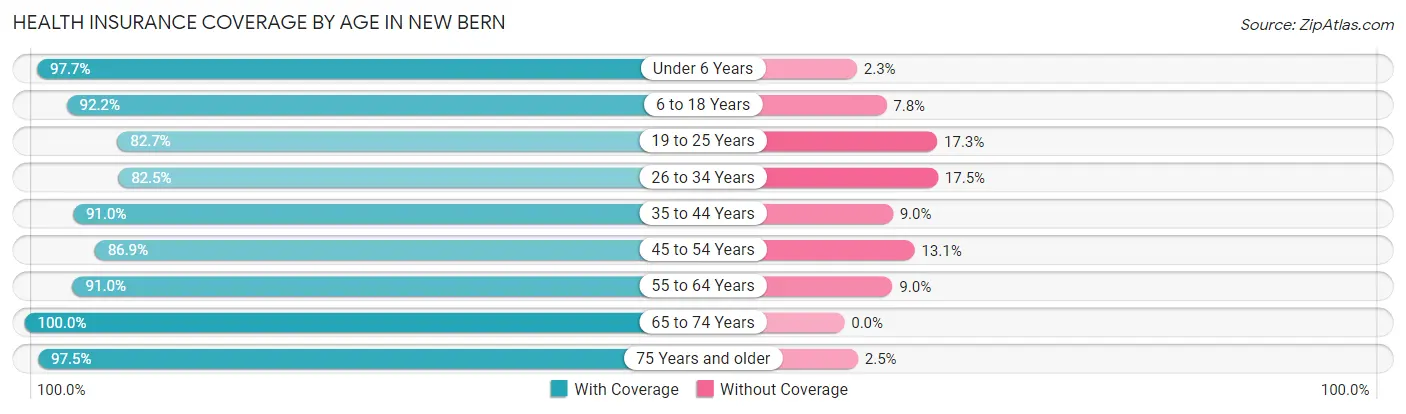
| Age Bracket | With Coverage | Without Coverage |
| Under 6 Years | 2,295 (97.7%) | 55 (2.3%) |
| 6 to 18 Years | 4,799 (92.2%) | 408 (7.8%) |
| 19 to 25 Years | 1,615 (82.7%) | 338 (17.3%) |
| 26 to 34 Years | 3,471 (82.5%) | 734 (17.5%) |
| 35 to 44 Years | 2,902 (91.0%) | 288 (9.0%) |
| 45 to 54 Years | 3,033 (86.9%) | 457 (13.1%) |
| 55 to 64 Years | 2,934 (91.0%) | 289 (9.0%) |
| 65 to 74 Years | 4,277 (100.0%) | 0 (0.0%) |
| 75 Years and older | 2,699 (97.5%) | 70 (2.5%) |
| Total | 28,025 (91.4%) | 2,639 (8.6%) |
Health Insurance Coverage by Citizenship Status in New Bern
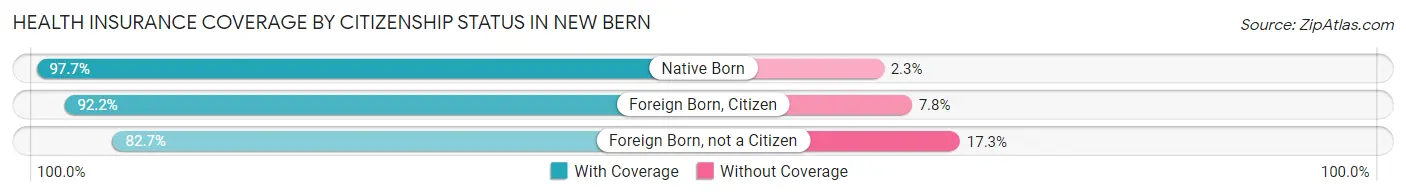
| Citizenship Status | With Coverage | Without Coverage |
| Native Born | 2,295 (97.7%) | 55 (2.3%) |
| Foreign Born, Citizen | 4,799 (92.2%) | 408 (7.8%) |
| Foreign Born, not a Citizen | 1,615 (82.7%) | 338 (17.3%) |
Health Insurance Coverage by Household Income in New Bern
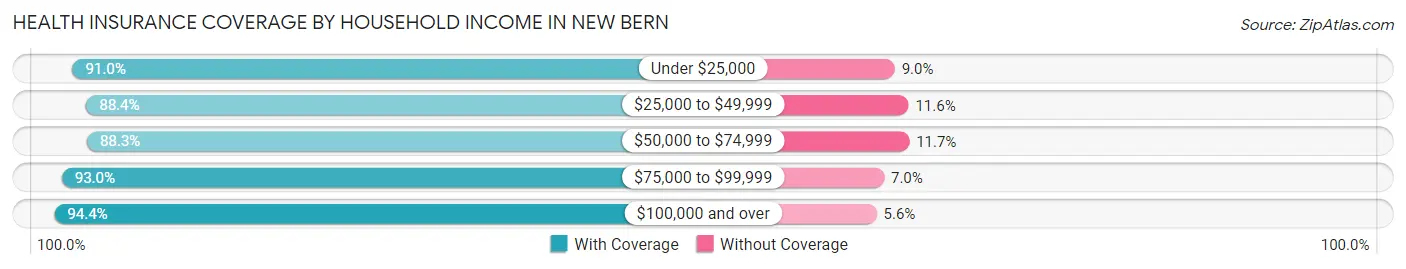
| Household Income | With Coverage | Without Coverage |
| Under $25,000 | 4,366 (91.0%) | 431 (9.0%) |
| $25,000 to $49,999 | 6,045 (88.4%) | 790 (11.6%) |
| $50,000 to $74,999 | 3,935 (88.3%) | 521 (11.7%) |
| $75,000 to $99,999 | 4,079 (93.0%) | 306 (7.0%) |
| $100,000 and over | 9,525 (94.4%) | 564 (5.6%) |
Public vs Private Health Insurance Coverage by Age in New Bern
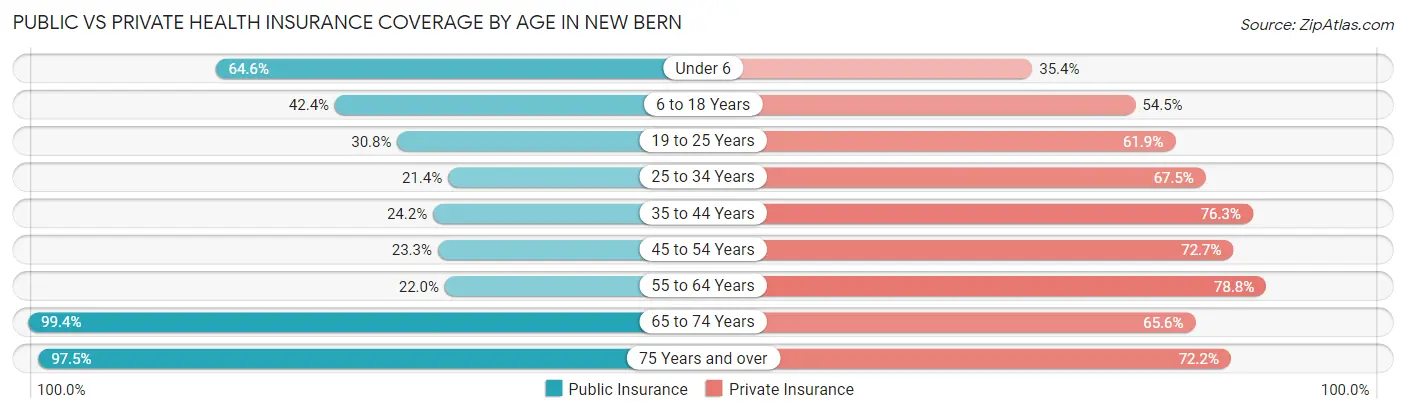
| Age Bracket | Public Insurance | Private Insurance |
| Under 6 | 1,517 (64.5%) | 831 (35.4%) |
| 6 to 18 Years | 2,208 (42.4%) | 2,838 (54.5%) |
| 19 to 25 Years | 602 (30.8%) | 1,208 (61.9%) |
| 25 to 34 Years | 900 (21.4%) | 2,840 (67.5%) |
| 35 to 44 Years | 772 (24.2%) | 2,433 (76.3%) |
| 45 to 54 Years | 813 (23.3%) | 2,536 (72.7%) |
| 55 to 64 Years | 709 (22.0%) | 2,538 (78.7%) |
| 65 to 74 Years | 4,249 (99.4%) | 2,806 (65.6%) |
| 75 Years and over | 2,699 (97.5%) | 1,999 (72.2%) |
| Total | 14,469 (47.2%) | 20,029 (65.3%) |
Disability Status by Sex by Age in New Bern
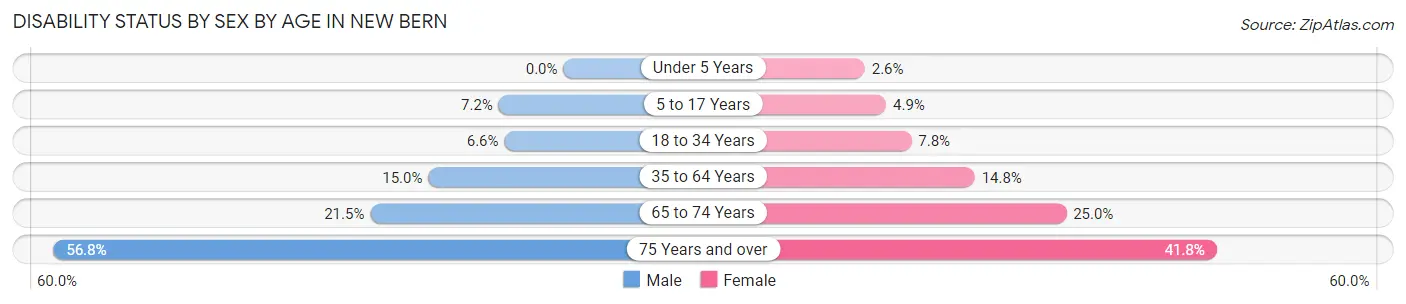
| Age Bracket | Male | Female |
| Under 5 Years | 0 (0.0%) | 24 (2.6%) |
| 5 to 17 Years | 191 (7.2%) | 125 (4.9%) |
| 18 to 34 Years | 202 (6.6%) | 269 (7.7%) |
| 35 to 64 Years | 639 (15.0%) | 837 (14.8%) |
| 65 to 74 Years | 438 (21.5%) | 560 (25.0%) |
| 75 Years and over | 660 (56.8%) | 671 (41.7%) |
Disability Class by Sex by Age in New Bern
Disability Class: Hearing Difficulty
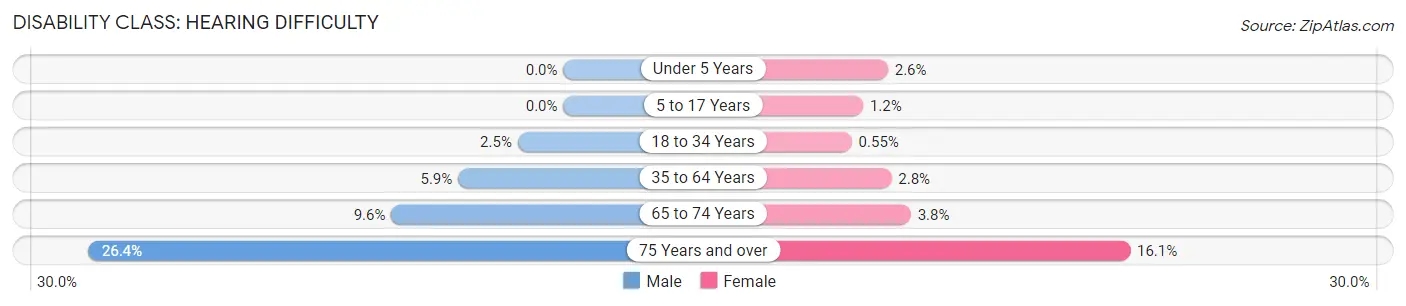
| Age Bracket | Male | Female |
| Under 5 Years | 0 (0.0%) | 24 (2.6%) |
| 5 to 17 Years | 0 (0.0%) | 30 (1.2%) |
| 18 to 34 Years | 78 (2.5%) | 19 (0.5%) |
| 35 to 64 Years | 249 (5.9%) | 156 (2.8%) |
| 65 to 74 Years | 195 (9.6%) | 86 (3.8%) |
| 75 Years and over | 307 (26.4%) | 258 (16.1%) |
Disability Class: Vision Difficulty
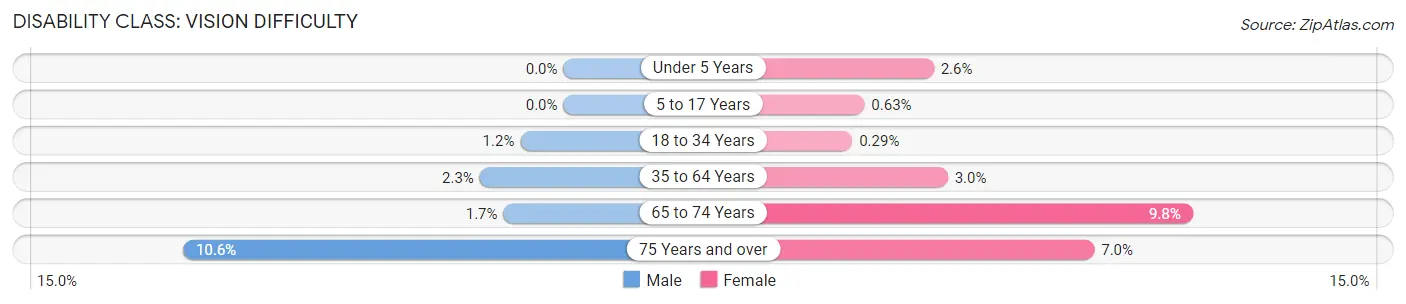
| Age Bracket | Male | Female |
| Under 5 Years | 0 (0.0%) | 24 (2.6%) |
| 5 to 17 Years | 0 (0.0%) | 16 (0.6%) |
| 18 to 34 Years | 37 (1.2%) | 10 (0.3%) |
| 35 to 64 Years | 99 (2.3%) | 167 (2.9%) |
| 65 to 74 Years | 34 (1.7%) | 219 (9.8%) |
| 75 Years and over | 123 (10.6%) | 113 (7.0%) |
Disability Class: Cognitive Difficulty
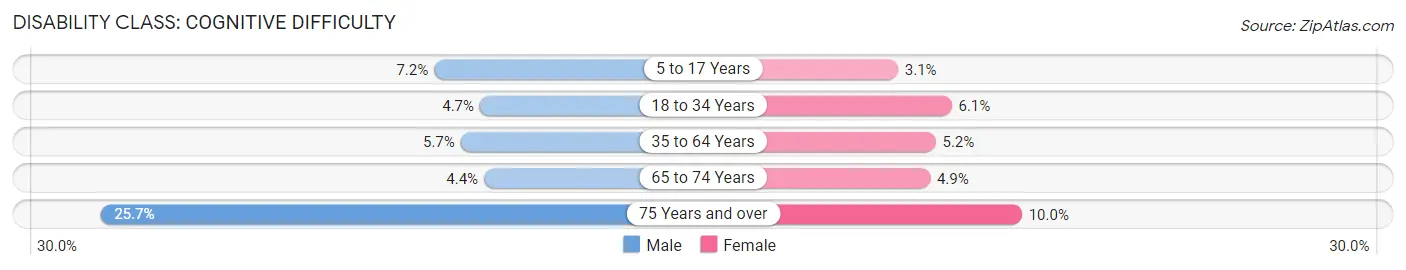
| Age Bracket | Male | Female |
| 5 to 17 Years | 191 (7.2%) | 79 (3.1%) |
| 18 to 34 Years | 143 (4.6%) | 212 (6.1%) |
| 35 to 64 Years | 243 (5.7%) | 295 (5.2%) |
| 65 to 74 Years | 90 (4.4%) | 110 (4.9%) |
| 75 Years and over | 299 (25.7%) | 161 (10.0%) |
Disability Class: Ambulatory Difficulty
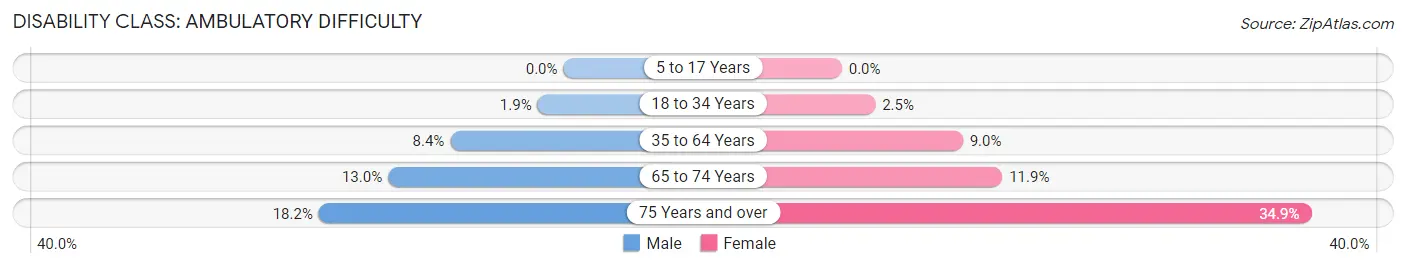
| Age Bracket | Male | Female |
| 5 to 17 Years | 0 (0.0%) | 0 (0.0%) |
| 18 to 34 Years | 59 (1.9%) | 86 (2.5%) |
| 35 to 64 Years | 357 (8.4%) | 508 (9.0%) |
| 65 to 74 Years | 265 (13.0%) | 267 (11.9%) |
| 75 Years and over | 211 (18.2%) | 560 (34.8%) |
Disability Class: Self-Care Difficulty
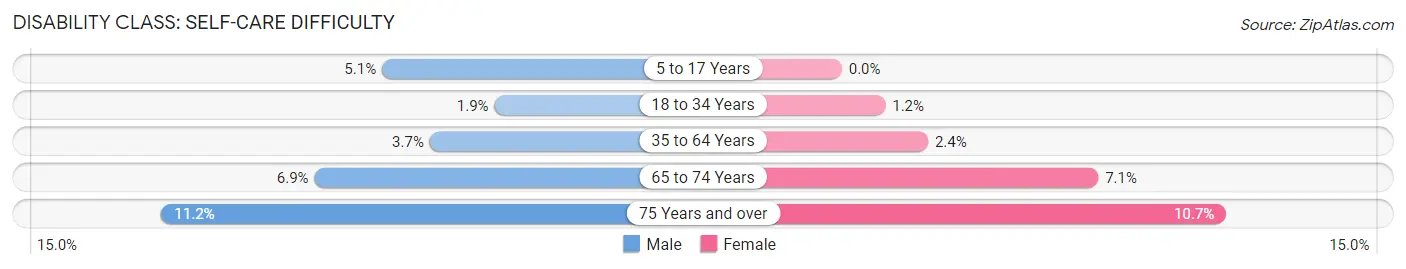
| Age Bracket | Male | Female |
| 5 to 17 Years | 134 (5.1%) | 0 (0.0%) |
| 18 to 34 Years | 59 (1.9%) | 42 (1.2%) |
| 35 to 64 Years | 158 (3.7%) | 136 (2.4%) |
| 65 to 74 Years | 141 (6.9%) | 160 (7.1%) |
| 75 Years and over | 130 (11.2%) | 172 (10.7%) |
Technology Access in New Bern
Computing Device Access in New Bern
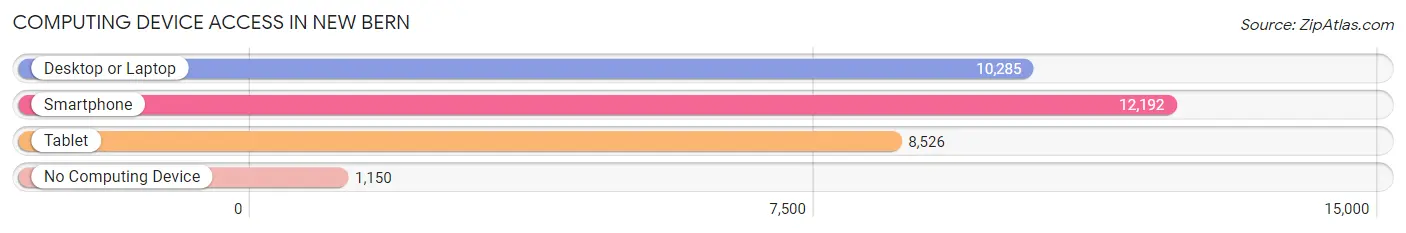
| Device Type | # Households | % Households |
| Desktop or Laptop | 10,285 | 72.5% |
| Smartphone | 12,192 | 86.0% |
| Tablet | 8,526 | 60.1% |
| No Computing Device | 1,150 | 8.1% |
| Total | 14,182 | 100.0% |
Internet Access in New Bern
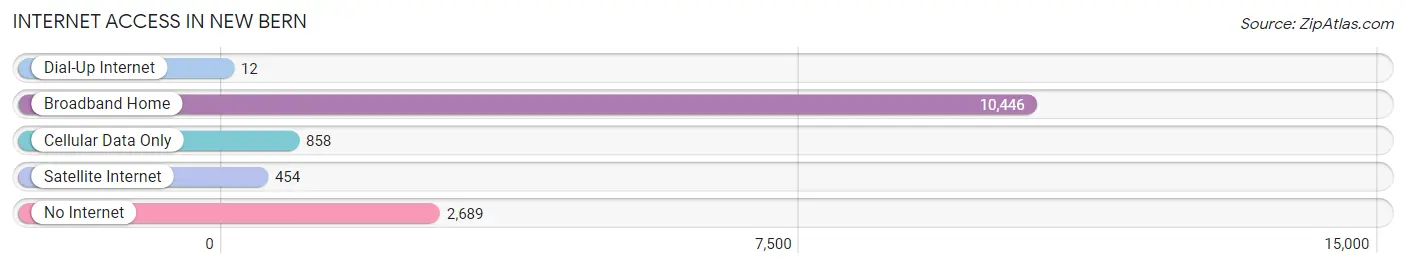
| Internet Type | # Households | % Households |
| Dial-Up Internet | 12 | 0.1% |
| Broadband Home | 10,446 | 73.7% |
| Cellular Data Only | 858 | 6.0% |
| Satellite Internet | 454 | 3.2% |
| No Internet | 2,689 | 19.0% |
| Total | 14,182 | 100.0% |
New Bern Summary
New Bern is a city located in Craven County, North Carolina. It is the county seat of Craven County and is located at the confluence of the Trent and Neuse rivers. It is the second-oldest European-American settlement in the state, after Bath. The city has a population of approximately 30,000 people and is part of the New Bern Metropolitan Statistical Area.
Geography
New Bern is located in the Coastal Plain region of North Carolina, approximately 90 miles east of Raleigh. The city is situated at the confluence of the Trent and Neuse rivers, which form the Pamlico Sound. The city is located on the eastern shore of the sound, and is bordered by the Croatan National Forest to the north and east. The city is also located near the Neuse River Estuary, which is a major source of seafood for the area.
The city has a humid subtropical climate, with hot, humid summers and mild winters. The average annual temperature is around 70 degrees Fahrenheit, and the average annual precipitation is around 50 inches.
History
New Bern was founded in 1710 by Swiss and Palatine German immigrants. The city was named after Bern, Switzerland, the hometown of one of the settlers. The city was an important port city during the American Revolution, and was the site of the Battle of New Bern in 1776. The city was also the site of the first state capital of North Carolina, from 1770 to 1794.
The city was an important center of commerce during the 19th century, and was home to several large industries, including shipbuilding, lumber, and textiles. The city was also home to several prominent figures in American history, including the first governor of North Carolina, Richard Caswell, and the first president of the United States, Andrew Jackson.
Economy
New Bern’s economy is largely based on tourism, manufacturing, and the military. The city is home to Marine Corps Air Station Cherry Point, which is a major employer in the area. The city is also home to several large manufacturing companies, including Moen, Inc., which produces plumbing fixtures, and West Pharmaceutical Services, which produces pharmaceutical packaging.
The city is also a popular tourist destination, with several historic sites, including Tryon Palace, the birthplace of Pepsi-Cola, and the New Bern Firemen’s Museum. The city also hosts several annual festivals, including the North Carolina Jazz Festival and the New Bern Riverfront Convention Center.
Demographics
As of the 2010 census, the population of New Bern was 29,524. The racial makeup of the city was 68.3% White, 24.2% African American, 0.5% Native American, 2.2% Asian, 0.1% Pacific Islander, 2.2% from other races, and 2.5% from two or more races. Hispanic or Latino of any race were 5.3% of the population.
The median income for a household in the city was $41,945, and the median income for a family was $50,945. The per capita income for the city was $22,945. About 17.2% of the population was below the poverty line.
New Bern is a diverse city with a rich history and a vibrant economy. The city is home to several large industries, and is a popular tourist destination. The city is also home to several prominent figures in American history, and is an important center of commerce in the region.
Common Questions
What is Per Capita Income in New Bern?
Per Capita income in New Bern is $35,330.
What is the Median Family Income in New Bern?
Median Family Income in New Bern is $79,669.
What is the Median Household income in New Bern?
Median Household Income in New Bern is $55,673.
What is Income or Wage Gap in New Bern?
Income or Wage Gap in New Bern is 31.5%.
Women in New Bern earn 68.5 cents for every dollar earned by a man.
What is Family Income Deficit in New Bern?
Family Income Deficit in New Bern is $11,945.
Families that are below poverty line in New Bern earn $11,945 less on average than the poverty threshold level.
What is Inequality or Gini Index in New Bern?
Inequality or Gini Index in New Bern is 0.48.
What is the Total Population of New Bern?
Total Population of New Bern is 31,373.
What is the Total Male Population of New Bern?
Total Male Population of New Bern is 14,685.
What is the Total Female Population of New Bern?
Total Female Population of New Bern is 16,688.
What is the Ratio of Males per 100 Females in New Bern?
There are 88.00 Males per 100 Females in New Bern.
What is the Ratio of Females per 100 Males in New Bern?
There are 113.64 Females per 100 Males in New Bern.
What is the Median Population Age in New Bern?
Median Population Age in New Bern is 40.4 Years.
What is the Average Family Size in New Bern
Average Family Size in New Bern is 2.9 People.
What is the Average Household Size in New Bern
Average Household Size in New Bern is 2.2 People.
How Large is the Labor Force in New Bern?
There are 14,762 People in the Labor Forcein in New Bern.
What is the Percentage of People in the Labor Force in New Bern?
59.5% of People are in the Labor Force in New Bern.
What is the Unemployment Rate in New Bern?
Unemployment Rate in New Bern is 4.5%.