Scranton, AR Map & Demographics
Scranton Map
Scranton Overview
$33,505
PER CAPITA INCOME
$88,125
AVG FAMILY INCOME
$82,750
AVG HOUSEHOLD INCOME
29.9%
WAGE / INCOME GAP [ % ]
70.1¢/ $1
WAGE / INCOME GAP [ $ ]
0.36
INEQUALITY / GINI INDEX
245
TOTAL POPULATION
94
MALE POPULATION
151
FEMALE POPULATION
62.25
MALES / 100 FEMALES
160.64
FEMALES / 100 MALES
39.1
MEDIAN AGE
2.9
AVG FAMILY SIZE
2.6
AVG HOUSEHOLD SIZE
144
LABOR FORCE [ PEOPLE ]
68.9%
PERCENT IN LABOR FORCE
0.7%
UNEMPLOYMENT RATE
Scranton Zip Codes
Scranton Area Codes
Income in Scranton
Income Overview in Scranton
Per Capita Income in Scranton is $33,505, while median incomes of families and households are $88,125 and $82,750 respectively.
| Characteristic | Number | Measure |
| Per Capita Income | 245 | $33,505 |
| Median Family Income | 73 | $88,125 |
| Mean Family Income | 73 | $85,877 |
| Median Household Income | 93 | $82,750 |
| Mean Household Income | 93 | $87,411 |
| Income Deficit | 73 | $0 |
| Wage / Income Gap (%) | 245 | 29.87% |
| Wage / Income Gap ($) | 245 | 70.13¢ per $1 |
| Gini / Inequality Index | 245 | 0.36 |
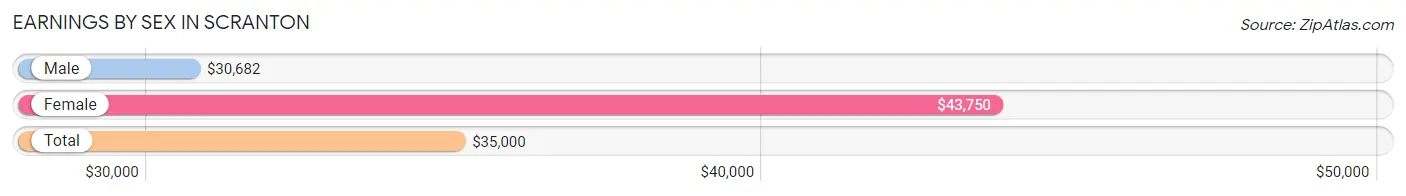
Earnings by Sex in Scranton
Average Earnings in Scranton are $35,000, $30,682 for men and $43,750 for women, a difference of 29.9%.
| Sex | Number | Average Earnings |
| Male | 68 (46.0%) | $30,682 |
| Female | 80 (54.0%) | $43,750 |
| Total | 148 (100.0%) | $35,000 |
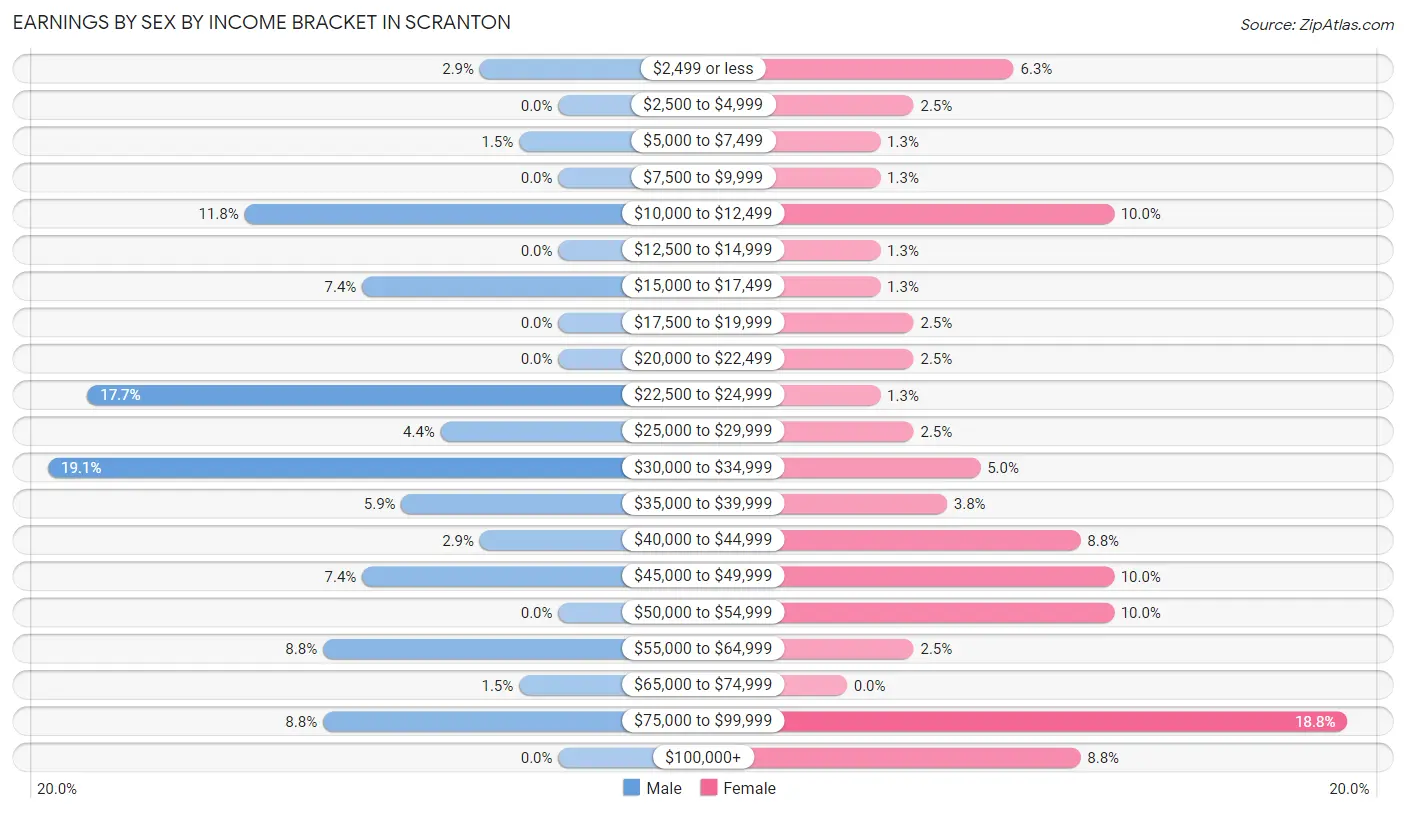
Earnings by Sex by Income Bracket in Scranton
The most common earnings brackets in Scranton are $30,000 to $34,999 for men (13 | 19.1%) and $75,000 to $99,999 for women (15 | 18.8%).
| Income | Male | Female |
| $2,499 or less | 2 (2.9%) | 5 (6.2%) |
| $2,500 to $4,999 | 0 (0.0%) | 2 (2.5%) |
| $5,000 to $7,499 | 1 (1.5%) | 1 (1.3%) |
| $7,500 to $9,999 | 0 (0.0%) | 1 (1.3%) |
| $10,000 to $12,499 | 8 (11.8%) | 8 (10.0%) |
| $12,500 to $14,999 | 0 (0.0%) | 1 (1.3%) |
| $15,000 to $17,499 | 5 (7.3%) | 1 (1.3%) |
| $17,500 to $19,999 | 0 (0.0%) | 2 (2.5%) |
| $20,000 to $22,499 | 0 (0.0%) | 2 (2.5%) |
| $22,500 to $24,999 | 12 (17.6%) | 1 (1.3%) |
| $25,000 to $29,999 | 3 (4.4%) | 2 (2.5%) |
| $30,000 to $34,999 | 13 (19.1%) | 4 (5.0%) |
| $35,000 to $39,999 | 4 (5.9%) | 3 (3.7%) |
| $40,000 to $44,999 | 2 (2.9%) | 7 (8.7%) |
| $45,000 to $49,999 | 5 (7.3%) | 8 (10.0%) |
| $50,000 to $54,999 | 0 (0.0%) | 8 (10.0%) |
| $55,000 to $64,999 | 6 (8.8%) | 2 (2.5%) |
| $65,000 to $74,999 | 1 (1.5%) | 0 (0.0%) |
| $75,000 to $99,999 | 6 (8.8%) | 15 (18.8%) |
| $100,000+ | 0 (0.0%) | 7 (8.7%) |
| Total | 68 (100.0%) | 80 (100.0%) |
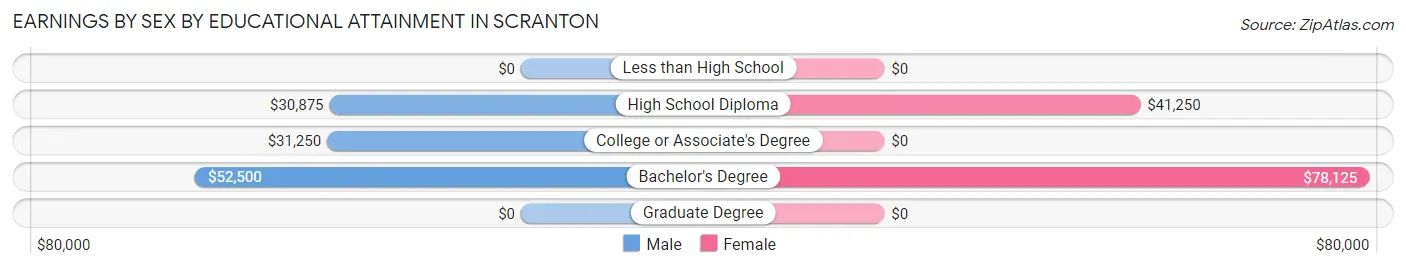
Earnings by Sex by Educational Attainment in Scranton
Average earnings in Scranton are $32,273 for men and $48,750 for women, a difference of 33.8%. Men with an educational attainment of bachelor's degree enjoy the highest average annual earnings of $52,500, while those with high school diploma education earn the least with $30,875. Women with an educational attainment of bachelor's degree earn the most with the average annual earnings of $78,125, while those with high school diploma education have the smallest earnings of $41,250.
| Educational Attainment | Male Income | Female Income |
| Less than High School | - | - |
| High School Diploma | $30,875 | $41,250 |
| College or Associate's Degree | $31,250 | $0 |
| Bachelor's Degree | $52,500 | $78,125 |
| Graduate Degree | - | - |
| Total | $32,273 | $48,750 |
Family Income in Scranton
Family Income Brackets in Scranton
According to the Scranton family income data, there are 24 families falling into the $100,000 to $149,999 income range, which is the most common income bracket and makes up 32.9% of all families.
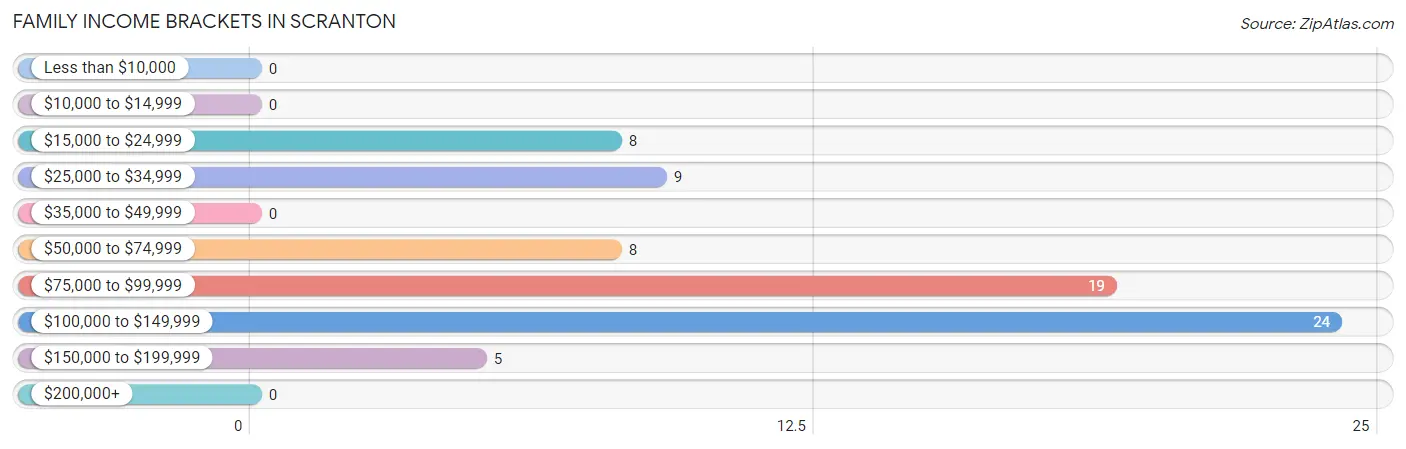
| Income Bracket | # Families | % Families |
| Less than $10,000 | 0 | 0.0% |
| $10,000 to $14,999 | 0 | 0.0% |
| $15,000 to $24,999 | 8 | 11.0% |
| $25,000 to $34,999 | 9 | 12.3% |
| $35,000 to $49,999 | 0 | 0.0% |
| $50,000 to $74,999 | 8 | 11.0% |
| $75,000 to $99,999 | 19 | 26.0% |
| $100,000 to $149,999 | 24 | 32.9% |
| $150,000 to $199,999 | 5 | 6.8% |
| $200,000+ | 0 | 0.0% |
Family Income by Famaliy Size in Scranton
3-person families (30 | 41.1%) account for the highest median family income in Scranton with $108,088 per family, while 2-person families (24 | 32.9%) have the highest median income of $39,375 per family member.
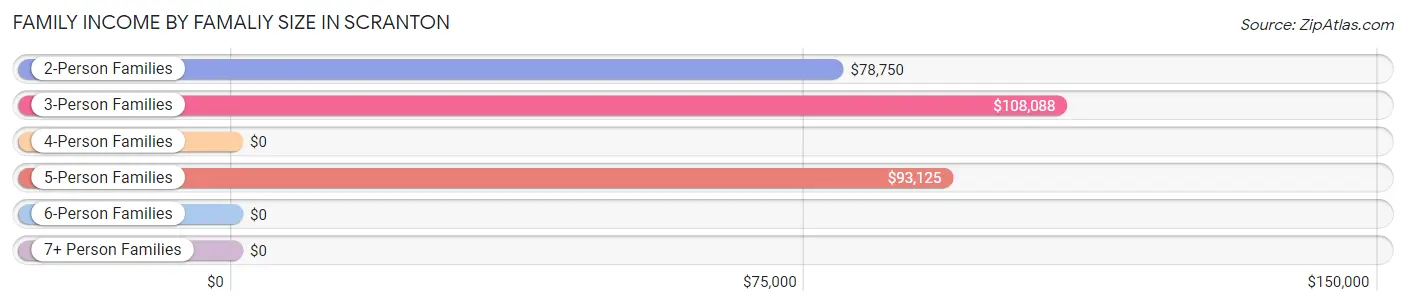
| Income Bracket | # Families | Median Income |
| 2-Person Families | 24 (32.9%) | $78,750 |
| 3-Person Families | 30 (41.1%) | $108,088 |
| 4-Person Families | 7 (9.6%) | $0 |
| 5-Person Families | 11 (15.1%) | $93,125 |
| 6-Person Families | 1 (1.4%) | $0 |
| 7+ Person Families | 0 (0.0%) | $0 |
| Total | 73 (100.0%) | $88,125 |
Family Income by Number of Earners in Scranton
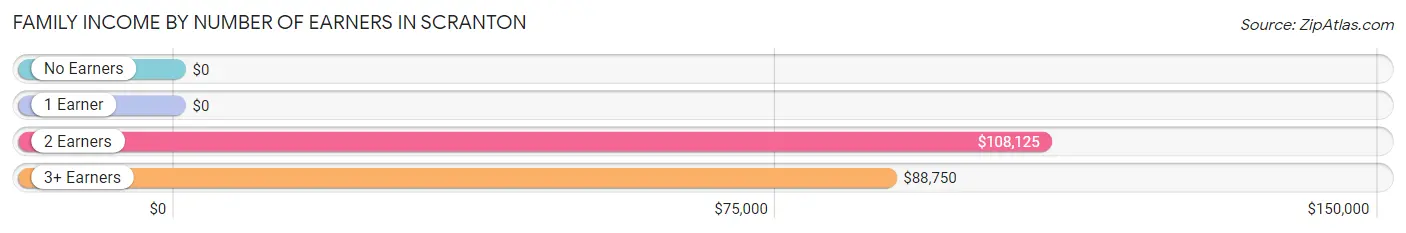
| Number of Earners | # Families | Median Income |
| No Earners | 4 (5.5%) | $0 |
| 1 Earner | 26 (35.6%) | $0 |
| 2 Earners | 29 (39.7%) | $108,125 |
| 3+ Earners | 14 (19.2%) | $88,750 |
| Total | 73 (100.0%) | $88,125 |
Household Income in Scranton
Household Income Brackets in Scranton
With 24 households falling in the category, the $100,000 to $149,999 income range is the most frequent in Scranton, accounting for 25.8% of all households. In contrast, only 1 households (1.1%) fall into the $10,000 to $14,999 income bracket, making it the least populous group.
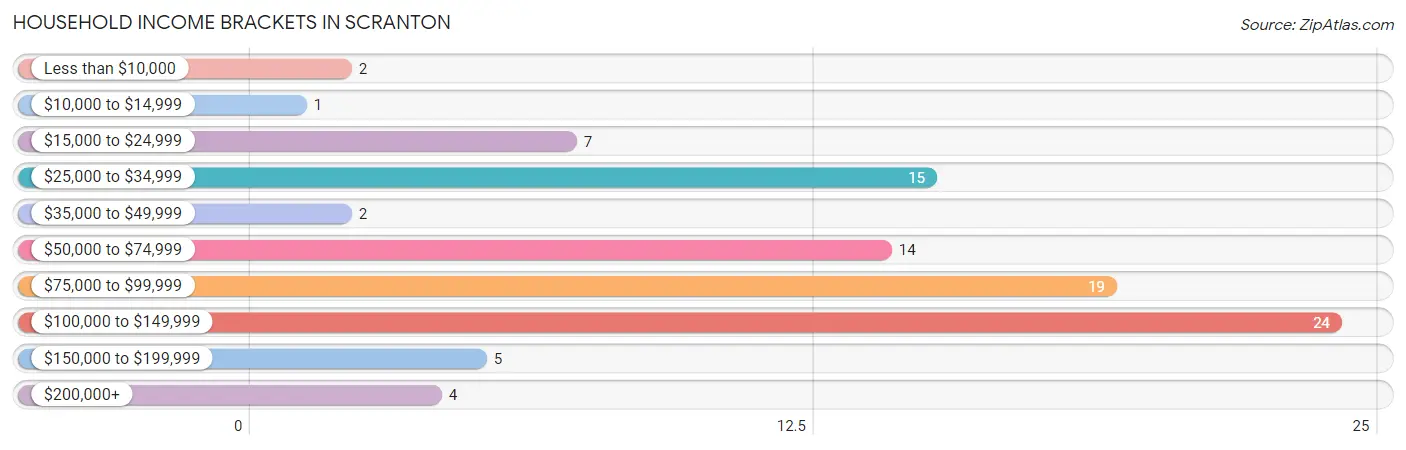
| Income Bracket | # Households | % Households |
| Less than $10,000 | 2 | 2.2% |
| $10,000 to $14,999 | 1 | 1.1% |
| $15,000 to $24,999 | 7 | 7.5% |
| $25,000 to $34,999 | 15 | 16.1% |
| $35,000 to $49,999 | 2 | 2.2% |
| $50,000 to $74,999 | 14 | 15.1% |
| $75,000 to $99,999 | 19 | 20.4% |
| $100,000 to $149,999 | 24 | 25.8% |
| $150,000 to $199,999 | 5 | 5.4% |
| $200,000+ | 4 | 4.3% |
Household Income by Householder Age in Scranton
The median household income in Scranton is $82,750, with the highest median household income of $93,750 found in the 65+ years age bracket for the primary householder. A total of 20 households (21.5%) fall into this category. Meanwhile, the 15 to 24 years age bracket for the primary householder has the lowest median household income of $32,500, with 8 households (8.6%) in this group.
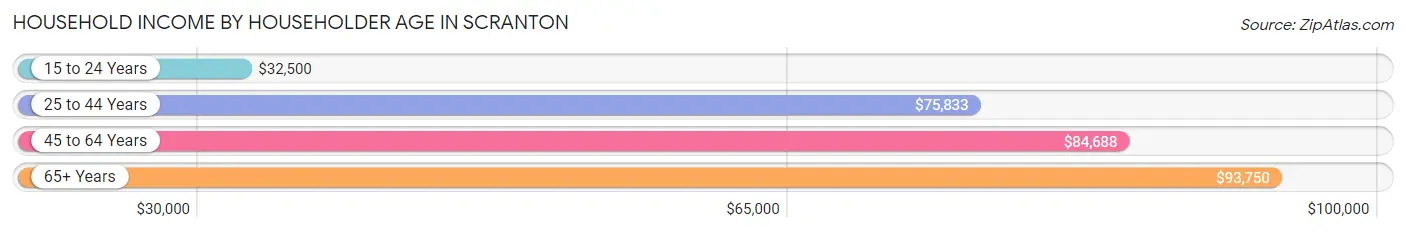
| Income Bracket | # Households | Median Income |
| 15 to 24 Years | 8 (8.6%) | $32,500 |
| 25 to 44 Years | 26 (28.0%) | $75,833 |
| 45 to 64 Years | 39 (41.9%) | $84,688 |
| 65+ Years | 20 (21.5%) | $93,750 |
| Total | 93 (100.0%) | $82,750 |
Poverty in Scranton
Income Below Poverty by Sex and Age in Scranton
With 12.8% poverty level for males and 8.6% for females among the residents of Scranton, under 5 year old males and under 5 year old females are the most vulnerable to poverty, with 2 males (66.7%) and 3 females (42.9%) in their respective age groups living below the poverty level.
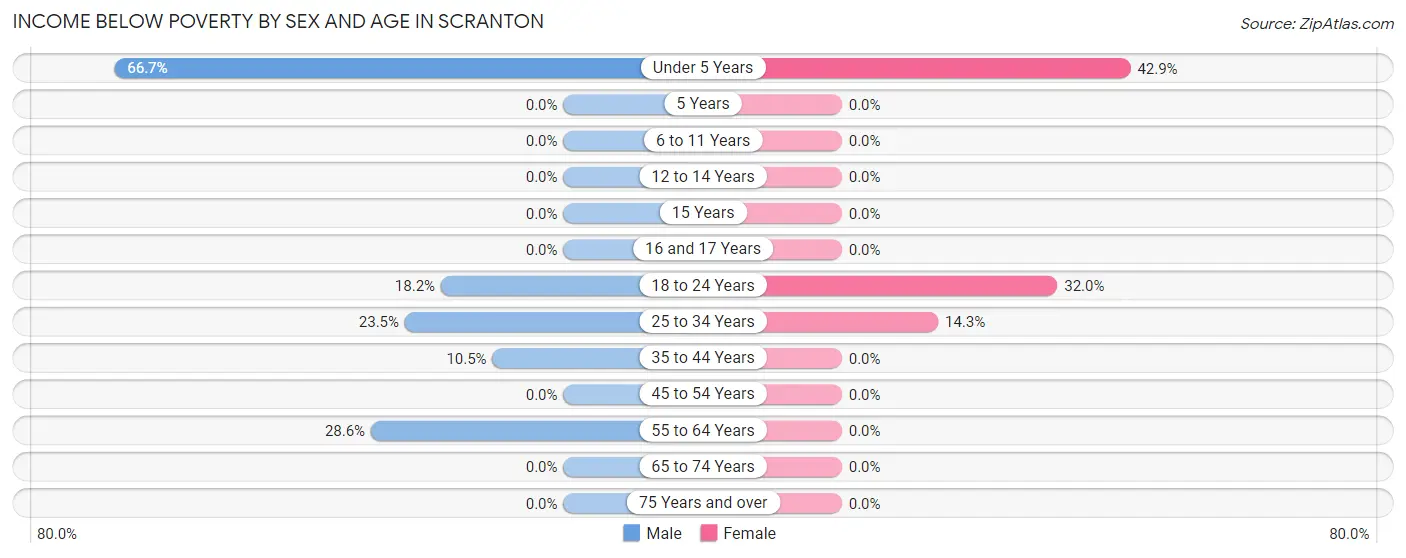
| Age Bracket | Male | Female |
| Under 5 Years | 2 (66.7%) | 3 (42.9%) |
| 5 Years | 0 (0.0%) | 0 (0.0%) |
| 6 to 11 Years | 0 (0.0%) | 0 (0.0%) |
| 12 to 14 Years | 0 (0.0%) | 0 (0.0%) |
| 15 Years | 0 (0.0%) | 0 (0.0%) |
| 16 and 17 Years | 0 (0.0%) | 0 (0.0%) |
| 18 to 24 Years | 2 (18.2%) | 8 (32.0%) |
| 25 to 34 Years | 4 (23.5%) | 2 (14.3%) |
| 35 to 44 Years | 2 (10.5%) | 0 (0.0%) |
| 45 to 54 Years | 0 (0.0%) | 0 (0.0%) |
| 55 to 64 Years | 2 (28.6%) | 0 (0.0%) |
| 65 to 74 Years | 0 (0.0%) | 0 (0.0%) |
| 75 Years and over | 0 (0.0%) | 0 (0.0%) |
| Total | 12 (12.8%) | 13 (8.6%) |
Income Above Poverty by Sex and Age in Scranton
According to the poverty statistics in Scranton, males aged 6 to 11 years and females aged 6 to 11 years are the age groups that are most secure financially, with 100.0% of males and 100.0% of females in these age groups living above the poverty line.
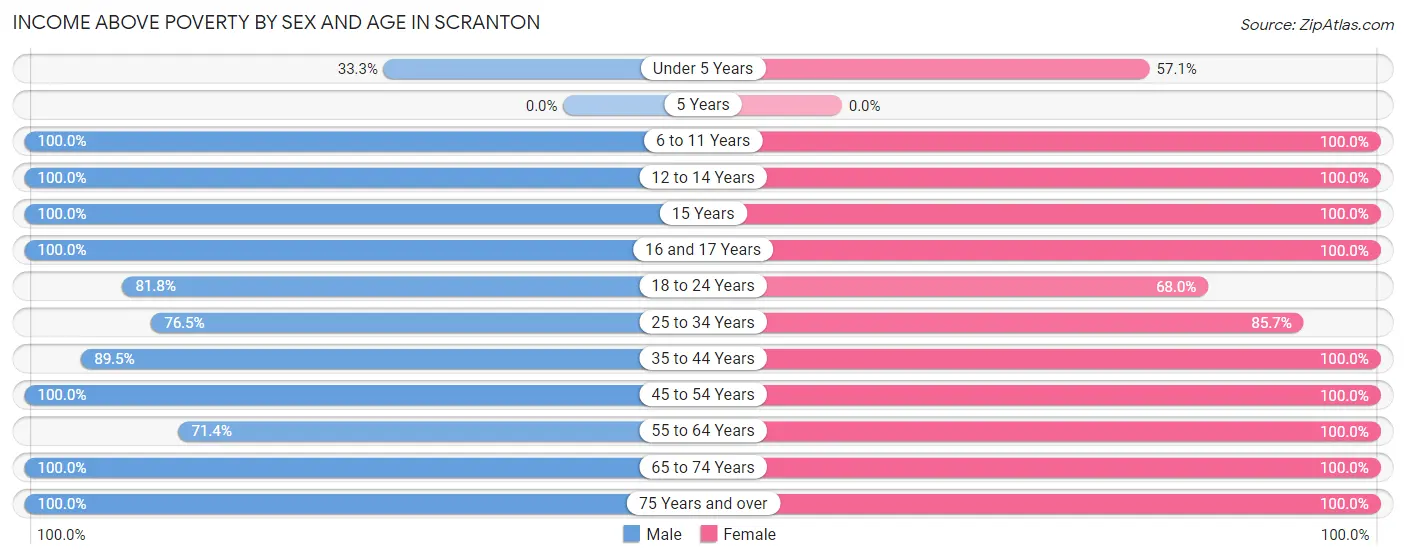
| Age Bracket | Male | Female |
| Under 5 Years | 1 (33.3%) | 4 (57.1%) |
| 5 Years | 0 (0.0%) | 0 (0.0%) |
| 6 to 11 Years | 5 (100.0%) | 8 (100.0%) |
| 12 to 14 Years | 4 (100.0%) | 6 (100.0%) |
| 15 Years | 1 (100.0%) | 2 (100.0%) |
| 16 and 17 Years | 3 (100.0%) | 8 (100.0%) |
| 18 to 24 Years | 9 (81.8%) | 17 (68.0%) |
| 25 to 34 Years | 13 (76.5%) | 12 (85.7%) |
| 35 to 44 Years | 17 (89.5%) | 10 (100.0%) |
| 45 to 54 Years | 7 (100.0%) | 25 (100.0%) |
| 55 to 64 Years | 5 (71.4%) | 17 (100.0%) |
| 65 to 74 Years | 13 (100.0%) | 18 (100.0%) |
| 75 Years and over | 4 (100.0%) | 11 (100.0%) |
| Total | 82 (87.2%) | 138 (91.4%) |
Income Below Poverty Among Married-Couple Families in Scranton
The poverty statistics for married-couple families in Scranton show that 8.2% or 4 of the total 49 families live below the poverty line. Families with 1 or 2 children have the highest poverty rate of 17.4%, comprising of 4 families. On the other hand, families with no children have the lowest poverty rate of 0.0%, which includes 0 families.
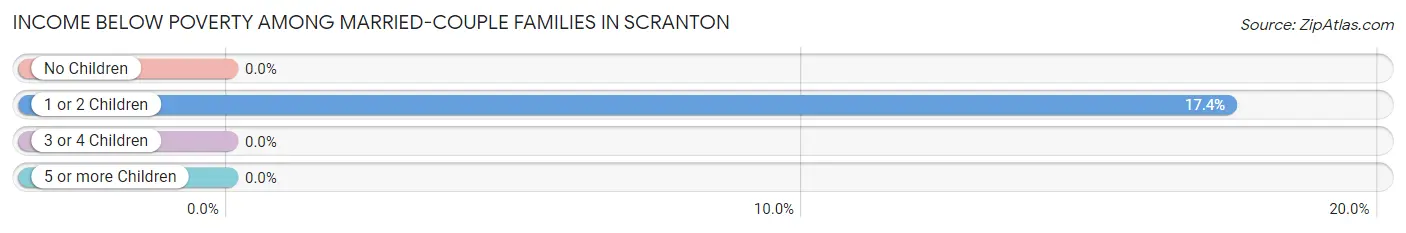
| Children | Above Poverty | Below Poverty |
| No Children | 21 (100.0%) | 0 (0.0%) |
| 1 or 2 Children | 19 (82.6%) | 4 (17.4%) |
| 3 or 4 Children | 5 (100.0%) | 0 (0.0%) |
| 5 or more Children | 0 (0.0%) | 0 (0.0%) |
| Total | 45 (91.8%) | 4 (8.2%) |
Income Below Poverty Among Single-Parent Households in Scranton
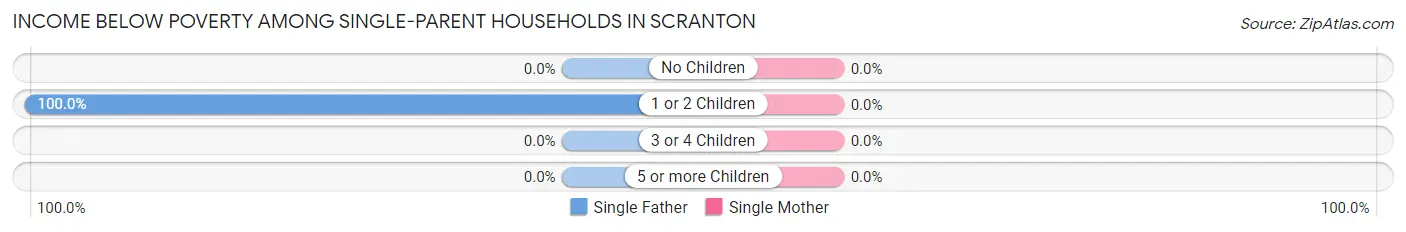
| Children | Single Father | Single Mother |
| No Children | 0 (0.0%) | 0 (0.0%) |
| 1 or 2 Children | 3 (100.0%) | 0 (0.0%) |
| 3 or 4 Children | 0 (0.0%) | 0 (0.0%) |
| 5 or more Children | 0 (0.0%) | 0 (0.0%) |
| Total | 3 (75.0%) | 0 (0.0%) |
Income Below Poverty Among Married-Couple vs Single-Parent Households in Scranton
The poverty data for Scranton shows that 4 of the married-couple family households (8.2%) and 3 of the single-parent households (12.5%) are living below the poverty level. Within the married-couple family households, those with 1 or 2 children have the highest poverty rate, with 4 households (17.4%) falling below the poverty line. Among the single-parent households, those with 1 or 2 children have the highest poverty rate, with 3 household (37.5%) living below poverty.
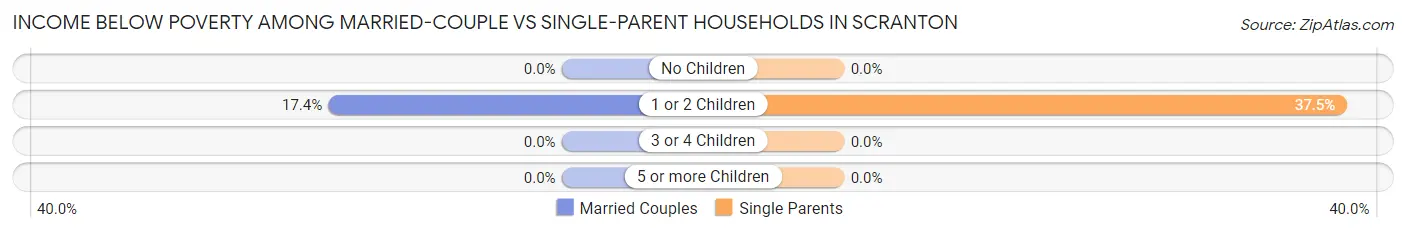
| Children | Married-Couple Families | Single-Parent Households |
| No Children | 0 (0.0%) | 0 (0.0%) |
| 1 or 2 Children | 4 (17.4%) | 3 (37.5%) |
| 3 or 4 Children | 0 (0.0%) | 0 (0.0%) |
| 5 or more Children | 0 (0.0%) | 0 (0.0%) |
| Total | 4 (8.2%) | 3 (12.5%) |
Race in Scranton
The most populous races in Scranton are White / Caucasian (228 | 93.1%), Two or more Races (10 | 4.1%), and Asian (7 | 2.9%).
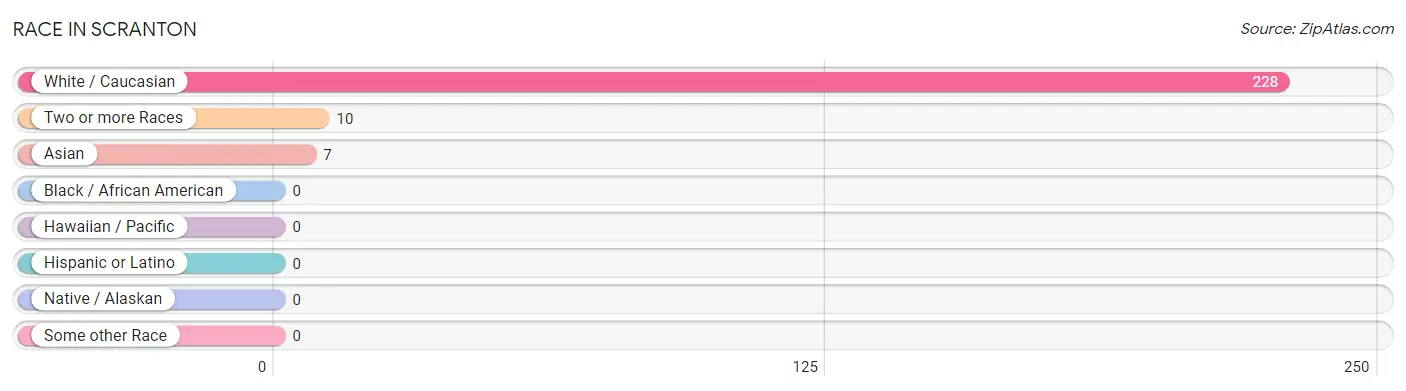
| Race | # Population | % Population |
| Asian | 7 | 2.9% |
| Black / African American | 0 | 0.0% |
| Hawaiian / Pacific | 0 | 0.0% |
| Hispanic or Latino | 0 | 0.0% |
| Native / Alaskan | 0 | 0.0% |
| White / Caucasian | 228 | 93.1% |
| Two or more Races | 10 | 4.1% |
| Some other Race | 0 | 0.0% |
| Total | 245 | 100.0% |
Ancestry in Scranton
The most populous ancestries reported in Scranton are German (63 | 25.7%), American (17 | 6.9%), Irish (17 | 6.9%), English (14 | 5.7%), and Scotch-Irish (13 | 5.3%), together accounting for 50.6% of all Scranton residents.
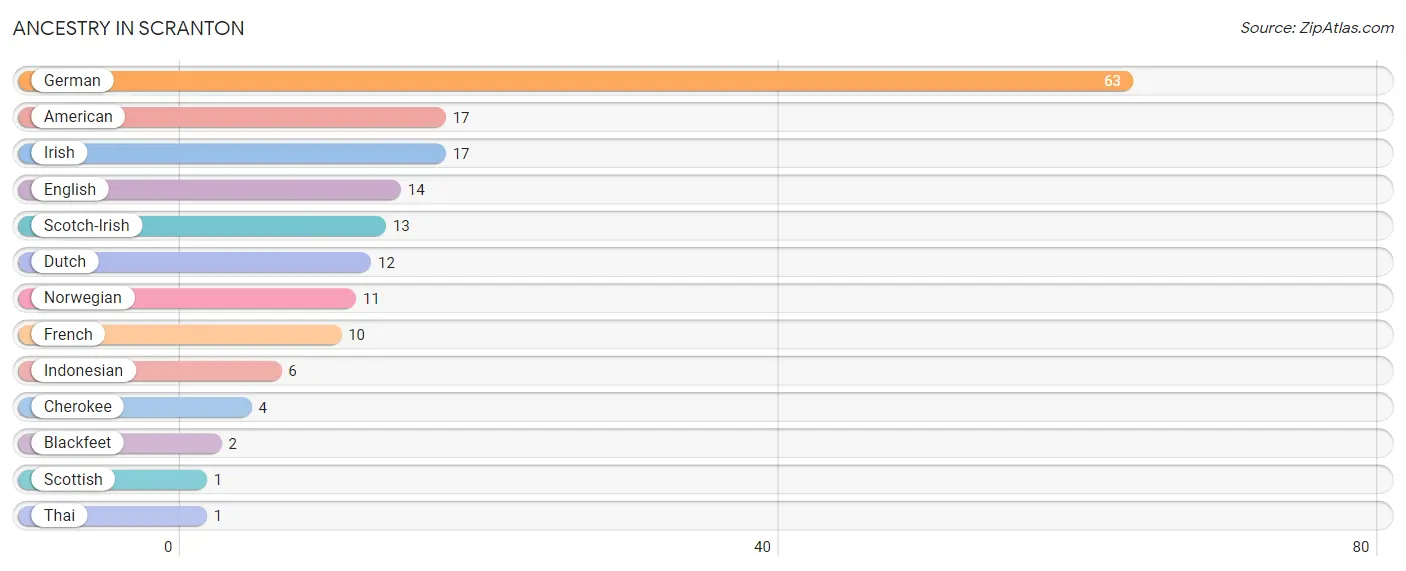
| Ancestry | # Population | % Population |
| American | 17 | 6.9% |
| Blackfeet | 2 | 0.8% |
| Cherokee | 4 | 1.6% |
| Dutch | 12 | 4.9% |
| English | 14 | 5.7% |
| French | 10 | 4.1% |
| German | 63 | 25.7% |
| Indonesian | 6 | 2.5% |
| Irish | 17 | 6.9% |
| Norwegian | 11 | 4.5% |
| Scotch-Irish | 13 | 5.3% |
| Scottish | 1 | 0.4% |
| Thai | 1 | 0.4% | View All 13 Rows |
Immigrants in Scranton
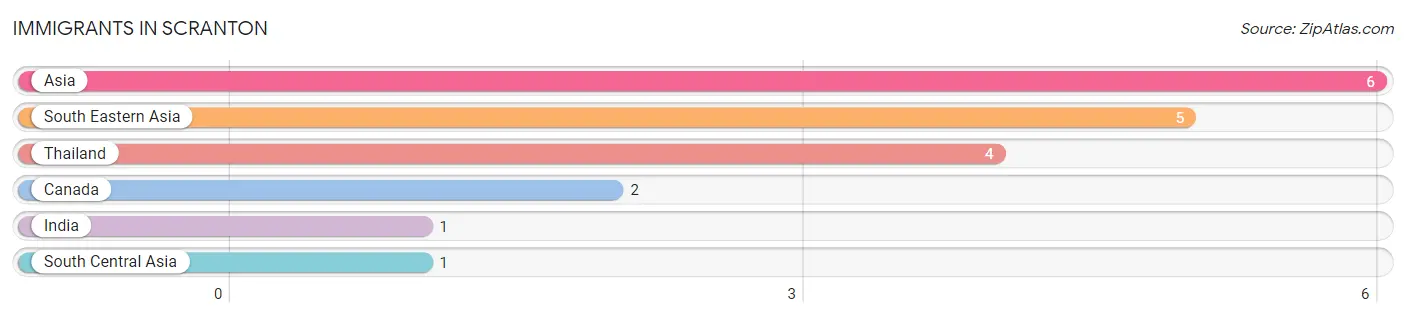
The most numerous immigrant groups reported in Scranton came from Asia (6 | 2.5%), South Eastern Asia (5 | 2.0%), Thailand (4 | 1.6%), Canada (2 | 0.8%), and India (1 | 0.4%), together accounting for 7.4% of all Scranton residents.
| Immigration Origin | # Population | % Population |
| Asia | 6 | 2.5% |
| Canada | 2 | 0.8% |
| India | 1 | 0.4% |
| South Central Asia | 1 | 0.4% |
| South Eastern Asia | 5 | 2.0% |
| Thailand | 4 | 1.6% | View All 6 Rows |
Sex and Age in Scranton
Sex and Age in Scranton
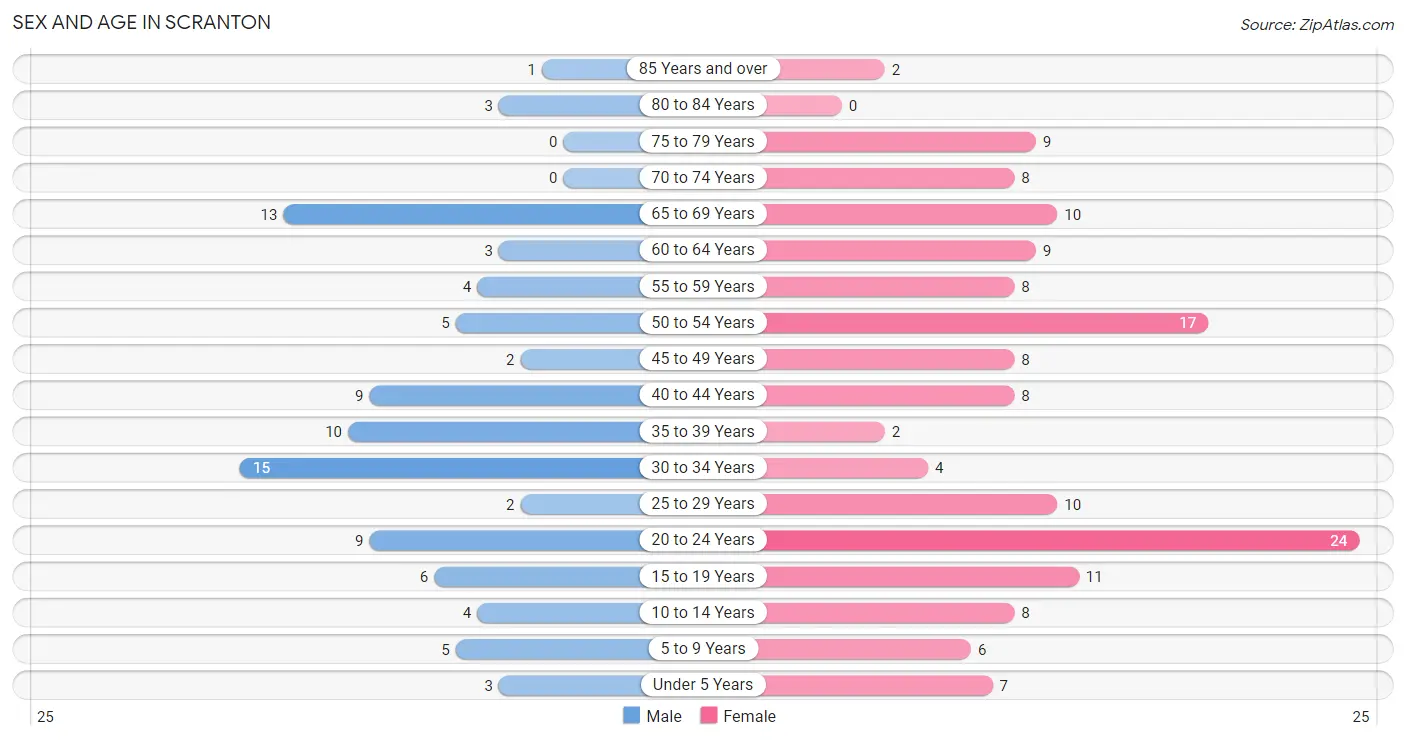
The most populous age groups in Scranton are 30 to 34 Years (15 | 16.0%) for men and 20 to 24 Years (24 | 15.9%) for women.
| Age Bracket | Male | Female |
| Under 5 Years | 3 (3.2%) | 7 (4.6%) |
| 5 to 9 Years | 5 (5.3%) | 6 (4.0%) |
| 10 to 14 Years | 4 (4.3%) | 8 (5.3%) |
| 15 to 19 Years | 6 (6.4%) | 11 (7.3%) |
| 20 to 24 Years | 9 (9.6%) | 24 (15.9%) |
| 25 to 29 Years | 2 (2.1%) | 10 (6.6%) |
| 30 to 34 Years | 15 (16.0%) | 4 (2.6%) |
| 35 to 39 Years | 10 (10.6%) | 2 (1.3%) |
| 40 to 44 Years | 9 (9.6%) | 8 (5.3%) |
| 45 to 49 Years | 2 (2.1%) | 8 (5.3%) |
| 50 to 54 Years | 5 (5.3%) | 17 (11.3%) |
| 55 to 59 Years | 4 (4.3%) | 8 (5.3%) |
| 60 to 64 Years | 3 (3.2%) | 9 (6.0%) |
| 65 to 69 Years | 13 (13.8%) | 10 (6.6%) |
| 70 to 74 Years | 0 (0.0%) | 8 (5.3%) |
| 75 to 79 Years | 0 (0.0%) | 9 (6.0%) |
| 80 to 84 Years | 3 (3.2%) | 0 (0.0%) |
| 85 Years and over | 1 (1.1%) | 2 (1.3%) |
| Total | 94 (100.0%) | 151 (100.0%) |
Families and Households in Scranton
Median Family Size in Scranton
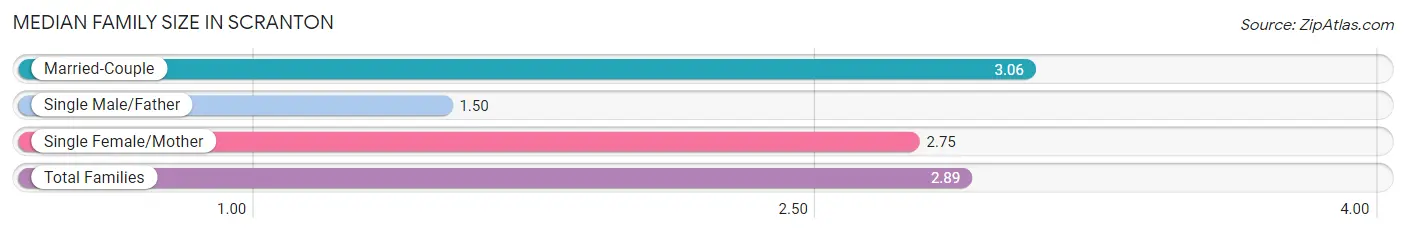
The median family size in Scranton is 2.89 persons per family, with married-couple families (49 | 67.1%) accounting for the largest median family size of 3.06 persons per family. On the other hand, single male/father families (4 | 5.5%) represent the smallest median family size with 1.50 persons per family.
| Family Type | # Families | Family Size |
| Married-Couple | 49 (67.1%) | 3.06 |
| Single Male/Father | 4 (5.5%) | 1.50 |
| Single Female/Mother | 20 (27.4%) | 2.75 |
| Total Families | 73 (100.0%) | 2.89 |
Median Household Size in Scranton
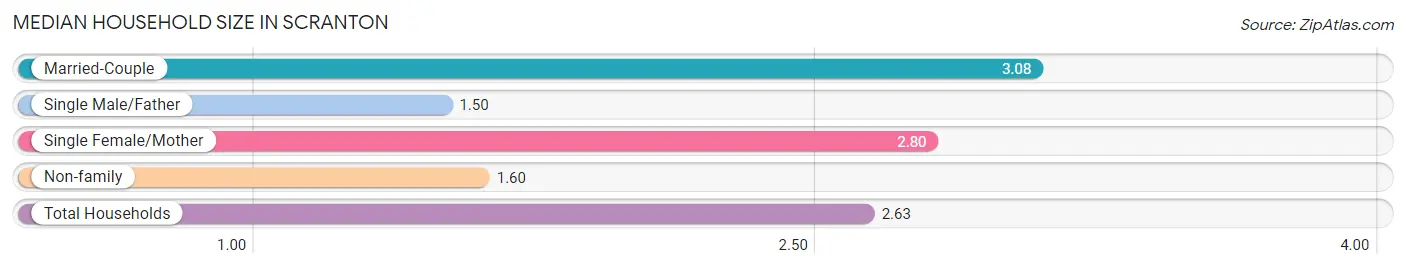
The median household size in Scranton is 2.63 persons per household, with married-couple households (49 | 52.7%) accounting for the largest median household size of 3.08 persons per household. single male/father households (4 | 4.3%) represent the smallest median household size with 1.50 persons per household.
| Household Type | # Households | Household Size |
| Married-Couple | 49 (52.7%) | 3.08 |
| Single Male/Father | 4 (4.3%) | 1.50 |
| Single Female/Mother | 20 (21.5%) | 2.80 |
| Non-family | 20 (21.5%) | 1.60 |
| Total Households | 93 (100.0%) | 2.63 |
Household Size by Marriage Status in Scranton
Out of a total of 93 households in Scranton, 73 (78.5%) are family households, while 20 (21.5%) are nonfamily households. The most numerous type of family households are 3-person households, comprising 28, and the most common type of nonfamily households are 1-person households, comprising 11.
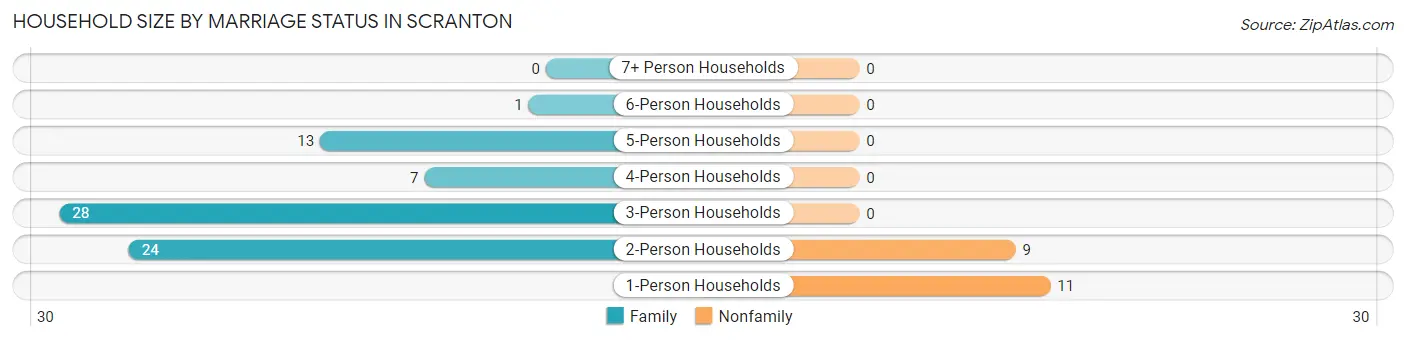
| Household Size | Family Households | Nonfamily Households |
| 1-Person Households | - | 11 (11.8%) |
| 2-Person Households | 24 (25.8%) | 9 (9.7%) |
| 3-Person Households | 28 (30.1%) | 0 (0.0%) |
| 4-Person Households | 7 (7.5%) | 0 (0.0%) |
| 5-Person Households | 13 (14.0%) | 0 (0.0%) |
| 6-Person Households | 1 (1.1%) | 0 (0.0%) |
| 7+ Person Households | 0 (0.0%) | 0 (0.0%) |
| Total | 73 (78.5%) | 20 (21.5%) |
Female Fertility in Scranton
Fertility by Age in Scranton
Average fertility rate in Scranton is 30.0 births per 1,000 women. Women in the age bracket of 20 to 34 years have the highest fertility rate with 53.0 births per 1,000 women. Women in the age bracket of 20 to 34 years acount for 100.0% of all women with births.
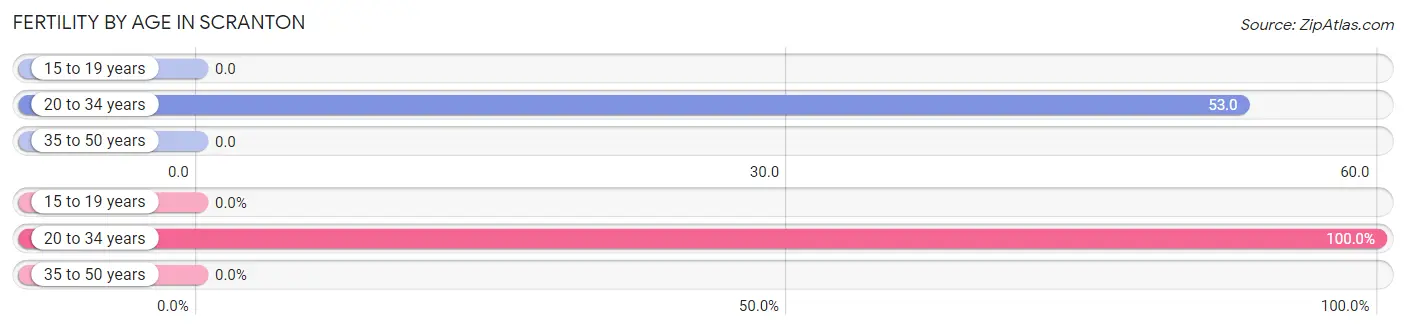
| Age Bracket | Women with Births | Births / 1,000 Women |
| 15 to 19 years | 0 (0.0%) | 0.0 |
| 20 to 34 years | 2 (100.0%) | 53.0 |
| 35 to 50 years | 0 (0.0%) | 0.0 |
| Total | 2 (100.0%) | 30.0 |
Fertility by Age by Marriage Status in Scranton
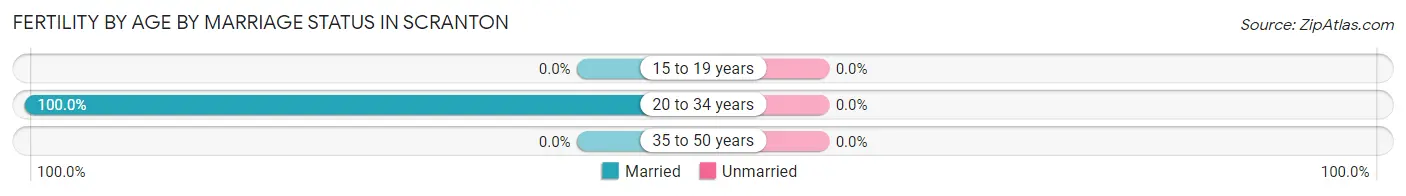
| Age Bracket | Married | Unmarried |
| 15 to 19 years | 0 (0.0%) | 0 (0.0%) |
| 20 to 34 years | 2 (100.0%) | 0 (0.0%) |
| 35 to 50 years | 0 (0.0%) | 0 (0.0%) |
| Total | 2 (100.0%) | 0 (0.0%) |
Fertility by Education in Scranton
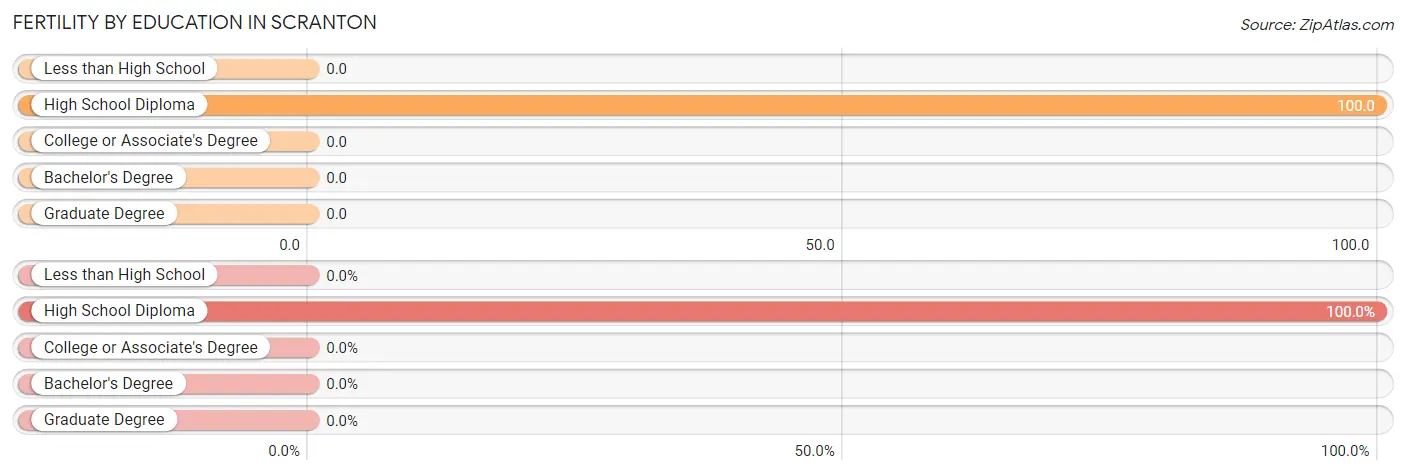
| Educational Attainment | Women with Births | Births / 1,000 Women |
| Less than High School | 0 (0.0%) | 0.0 |
| High School Diploma | 2 (100.0%) | 100.0 |
| College or Associate's Degree | 0 (0.0%) | 0.0 |
| Bachelor's Degree | 0 (0.0%) | 0.0 |
| Graduate Degree | 0 (0.0%) | 0.0 |
| Total | 2 (100.0%) | 30.0 |
Fertility by Education by Marriage Status in Scranton
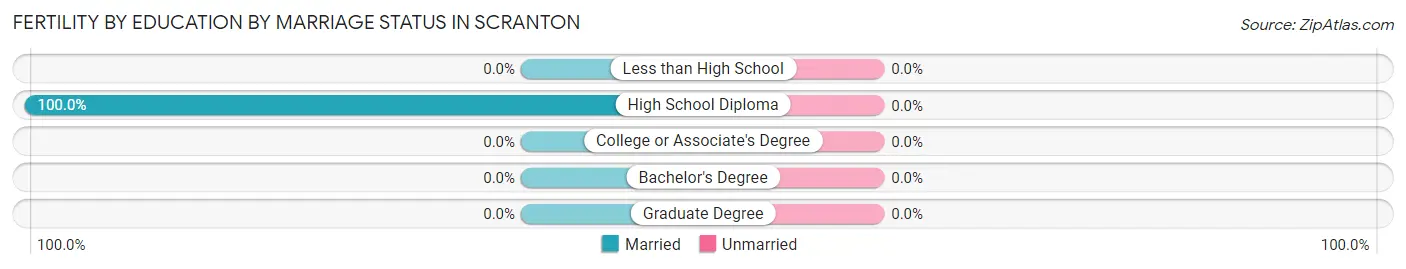
| Educational Attainment | Married | Unmarried |
| Less than High School | 0 (0.0%) | 0 (0.0%) |
| High School Diploma | 2 (100.0%) | 0 (0.0%) |
| College or Associate's Degree | 0 (0.0%) | 0 (0.0%) |
| Bachelor's Degree | 0 (0.0%) | 0 (0.0%) |
| Graduate Degree | 0 (0.0%) | 0 (0.0%) |
| Total | 2 (100.0%) | 0 (0.0%) |
Employment Characteristics in Scranton
Employment by Class of Employer in Scranton
Among the 141 employed individuals in Scranton, private company employees (92 | 65.2%), federal government employees (11 | 7.8%), and state government employees (10 | 7.1%) make up the most common classes of employment.
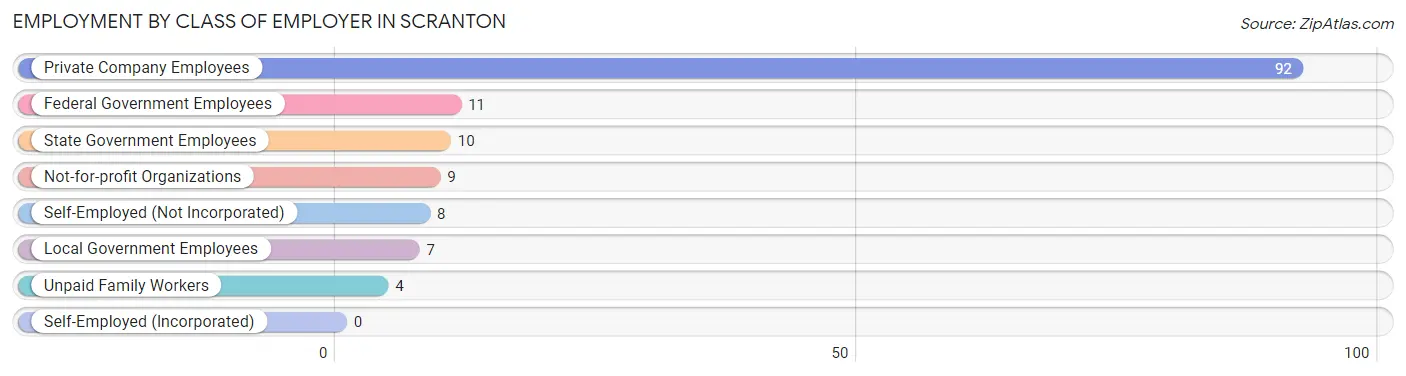
| Employer Class | # Employees | % Employees |
| Private Company Employees | 92 | 65.2% |
| Self-Employed (Incorporated) | 0 | 0.0% |
| Self-Employed (Not Incorporated) | 8 | 5.7% |
| Not-for-profit Organizations | 9 | 6.4% |
| Local Government Employees | 7 | 5.0% |
| State Government Employees | 10 | 7.1% |
| Federal Government Employees | 11 | 7.8% |
| Unpaid Family Workers | 4 | 2.8% |
| Total | 141 | 100.0% |
Employment Status by Age in Scranton
According to the labor force statistics for Scranton, out of the total population over 16 years of age (209), 68.9% or 144 individuals are in the labor force, with 0.7% or 1 of them unemployed. The age group with the highest labor force participation rate is 25 to 29 years, with 91.7% or 11 individuals in the labor force. Within the labor force, the 16 to 19 years age range has the highest percentage of unemployed individuals, with 11.1% or 1 of them being unemployed.
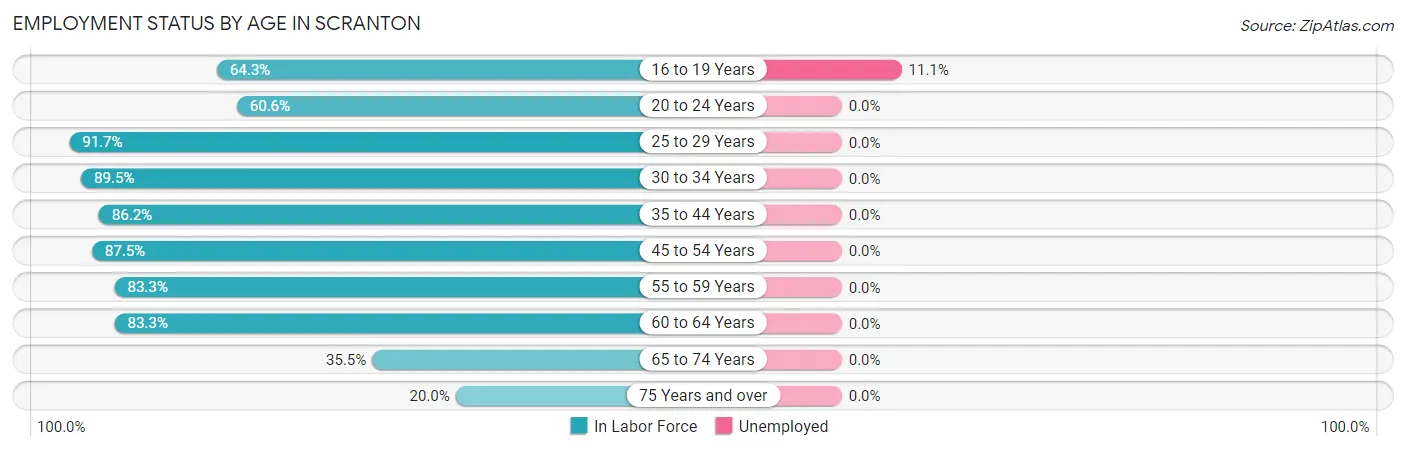
| Age Bracket | In Labor Force | Unemployed |
| 16 to 19 Years | 9 (64.3%) | 1 (11.1%) |
| 20 to 24 Years | 20 (60.6%) | 0 (0.0%) |
| 25 to 29 Years | 11 (91.7%) | 0 (0.0%) |
| 30 to 34 Years | 17 (89.5%) | 0 (0.0%) |
| 35 to 44 Years | 25 (86.2%) | 0 (0.0%) |
| 45 to 54 Years | 28 (87.5%) | 0 (0.0%) |
| 55 to 59 Years | 10 (83.3%) | 0 (0.0%) |
| 60 to 64 Years | 10 (83.3%) | 0 (0.0%) |
| 65 to 74 Years | 11 (35.5%) | 0 (0.0%) |
| 75 Years and over | 3 (20.0%) | 0 (0.0%) |
| Total | 144 (68.9%) | 1 (0.7%) |
Employment Status by Educational Attainment in Scranton
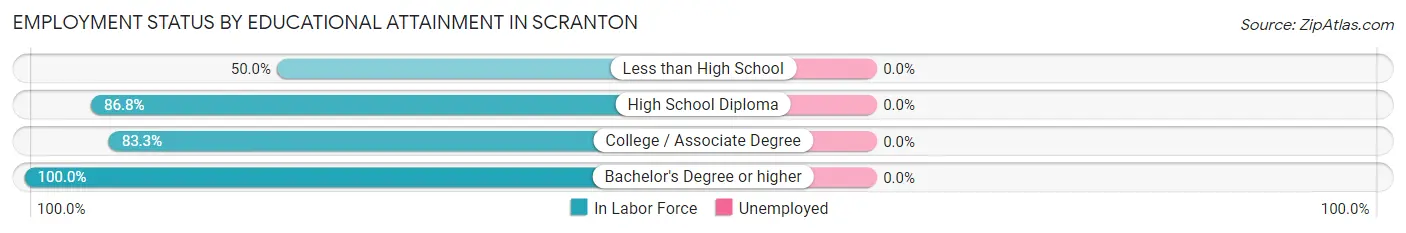
| Educational Attainment | In Labor Force | Unemployed |
| Less than High School | 1 (50.0%) | 0 (0.0%) |
| High School Diploma | 46 (86.8%) | 0 (0.0%) |
| College / Associate Degree | 35 (83.3%) | 0 (0.0%) |
| Bachelor's Degree or higher | 19 (100.0%) | 0 (0.0%) |
| Total | 101 (87.1%) | 0 (0.0%) |
Employment Occupations by Sex in Scranton
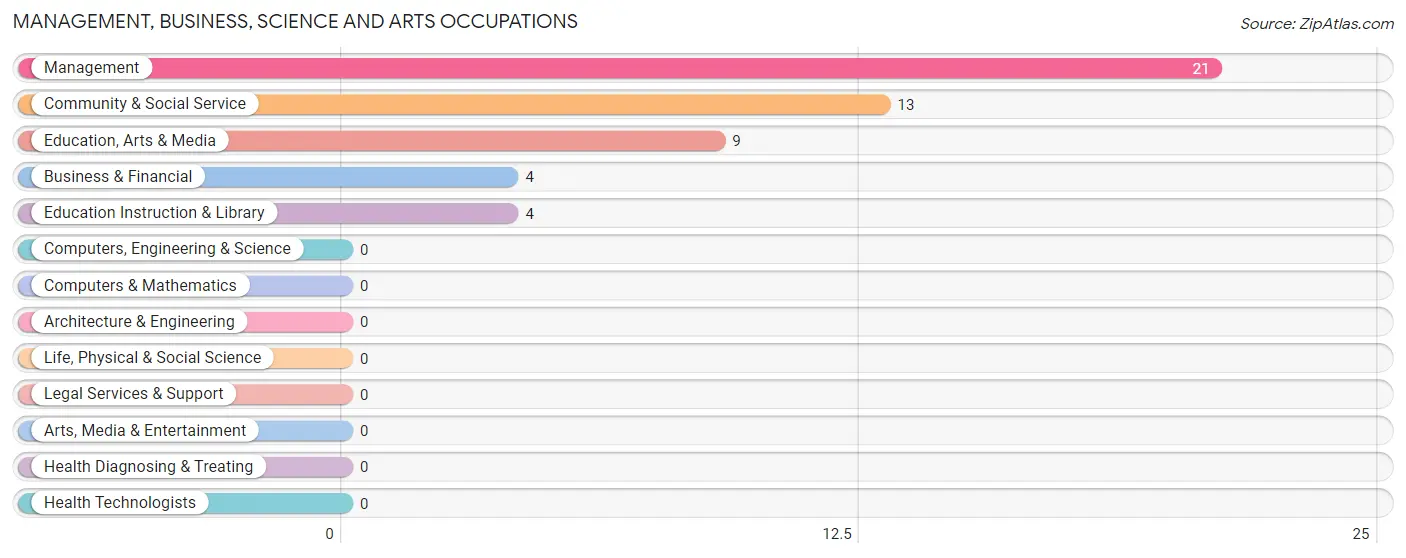
Management, Business, Science and Arts Occupations
The most common Management, Business, Science and Arts occupations in Scranton are Management (21 | 14.7%), Community & Social Service (13 | 9.1%), Education, Arts & Media (9 | 6.3%), Business & Financial (4 | 2.8%), and Education Instruction & Library (4 | 2.8%).
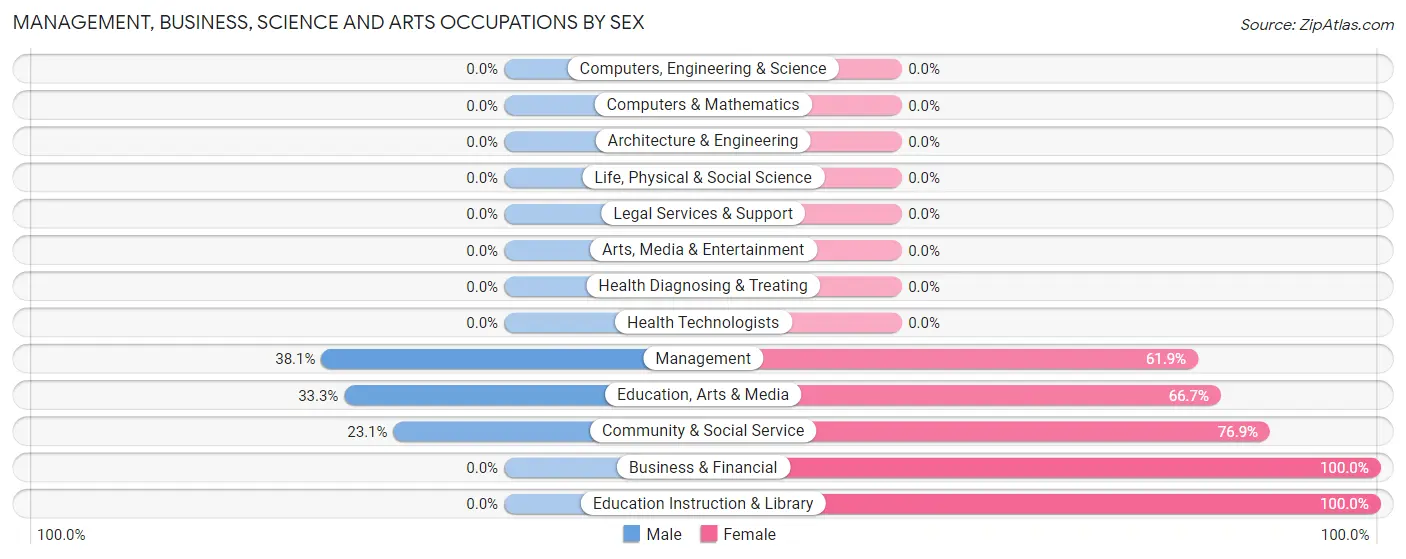
Management, Business, Science and Arts Occupations by Sex
Within the Management, Business, Science and Arts occupations in Scranton, the most male-oriented occupations are Management (38.1%), Education, Arts & Media (33.3%), and Community & Social Service (23.1%), while the most female-oriented occupations are Business & Financial (100.0%), Education Instruction & Library (100.0%), and Community & Social Service (76.9%).
| Occupation | Male | Female |
| Management | 8 (38.1%) | 13 (61.9%) |
| Business & Financial | 0 (0.0%) | 4 (100.0%) |
| Computers, Engineering & Science | 0 (0.0%) | 0 (0.0%) |
| Computers & Mathematics | 0 (0.0%) | 0 (0.0%) |
| Architecture & Engineering | 0 (0.0%) | 0 (0.0%) |
| Life, Physical & Social Science | 0 (0.0%) | 0 (0.0%) |
| Community & Social Service | 3 (23.1%) | 10 (76.9%) |
| Education, Arts & Media | 3 (33.3%) | 6 (66.7%) |
| Legal Services & Support | 0 (0.0%) | 0 (0.0%) |
| Education Instruction & Library | 0 (0.0%) | 4 (100.0%) |
| Arts, Media & Entertainment | 0 (0.0%) | 0 (0.0%) |
| Health Diagnosing & Treating | 0 (0.0%) | 0 (0.0%) |
| Health Technologists | 0 (0.0%) | 0 (0.0%) |
| Total (Category) | 11 (28.9%) | 27 (71.1%) |
| Total (Overall) | 67 (46.9%) | 76 (53.1%) |
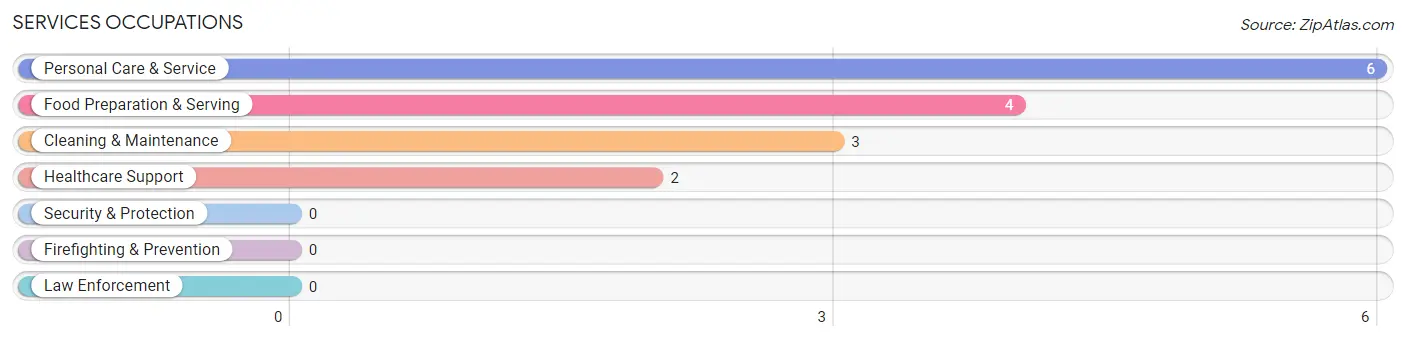
Services Occupations
The most common Services occupations in Scranton are Personal Care & Service (6 | 4.2%), Food Preparation & Serving (4 | 2.8%), Cleaning & Maintenance (3 | 2.1%), and Healthcare Support (2 | 1.4%).
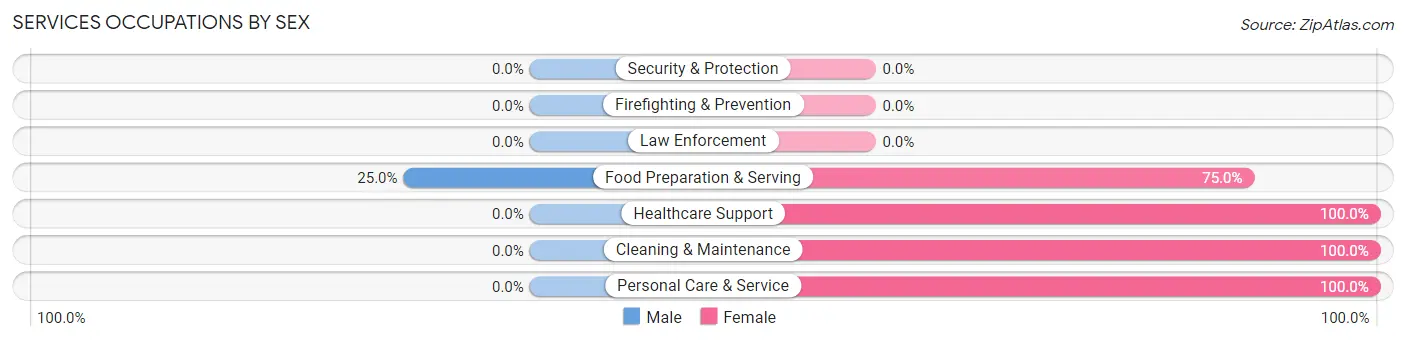
Services Occupations by Sex
| Occupation | Male | Female |
| Healthcare Support | 0 (0.0%) | 2 (100.0%) |
| Security & Protection | 0 (0.0%) | 0 (0.0%) |
| Firefighting & Prevention | 0 (0.0%) | 0 (0.0%) |
| Law Enforcement | 0 (0.0%) | 0 (0.0%) |
| Food Preparation & Serving | 1 (25.0%) | 3 (75.0%) |
| Cleaning & Maintenance | 0 (0.0%) | 3 (100.0%) |
| Personal Care & Service | 0 (0.0%) | 6 (100.0%) |
| Total (Category) | 1 (6.7%) | 14 (93.3%) |
| Total (Overall) | 67 (46.9%) | 76 (53.1%) |
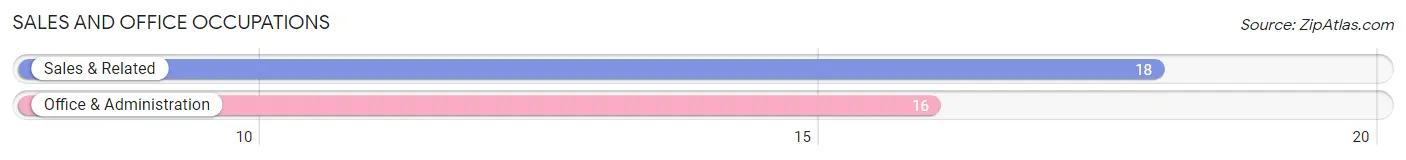
Sales and Office Occupations
The most common Sales and Office occupations in Scranton are Sales & Related (18 | 12.6%), and Office & Administration (16 | 11.2%).
Sales and Office Occupations by Sex
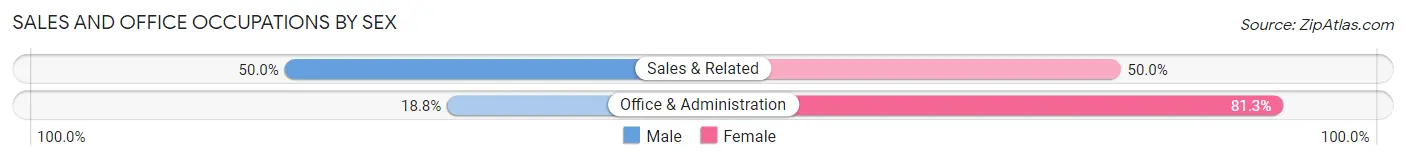
| Occupation | Male | Female |
| Sales & Related | 9 (50.0%) | 9 (50.0%) |
| Office & Administration | 3 (18.8%) | 13 (81.2%) |
| Total (Category) | 12 (35.3%) | 22 (64.7%) |
| Total (Overall) | 67 (46.9%) | 76 (53.1%) |
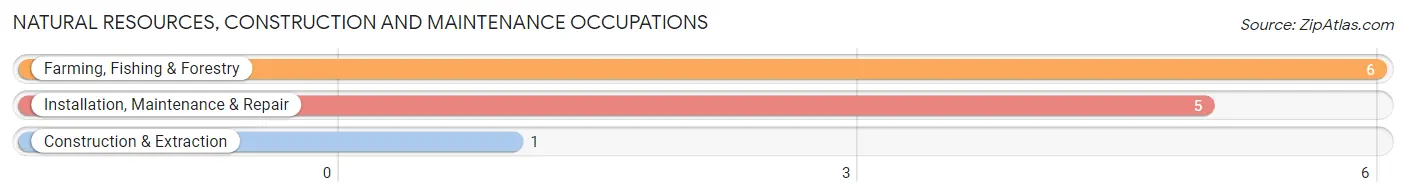
Natural Resources, Construction and Maintenance Occupations
The most common Natural Resources, Construction and Maintenance occupations in Scranton are Farming, Fishing & Forestry (6 | 4.2%), Installation, Maintenance & Repair (5 | 3.5%), and Construction & Extraction (1 | 0.7%).
Natural Resources, Construction and Maintenance Occupations by Sex
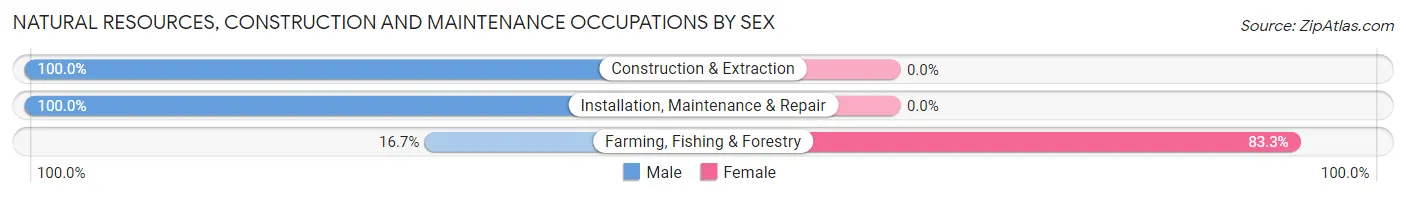
| Occupation | Male | Female |
| Farming, Fishing & Forestry | 1 (16.7%) | 5 (83.3%) |
| Construction & Extraction | 1 (100.0%) | 0 (0.0%) |
| Installation, Maintenance & Repair | 5 (100.0%) | 0 (0.0%) |
| Total (Category) | 7 (58.3%) | 5 (41.7%) |
| Total (Overall) | 67 (46.9%) | 76 (53.1%) |
Production, Transportation and Moving Occupations
The most common Production, Transportation and Moving occupations in Scranton are Production (20 | 14.0%), Material Moving (18 | 12.6%), and Transportation (6 | 4.2%).
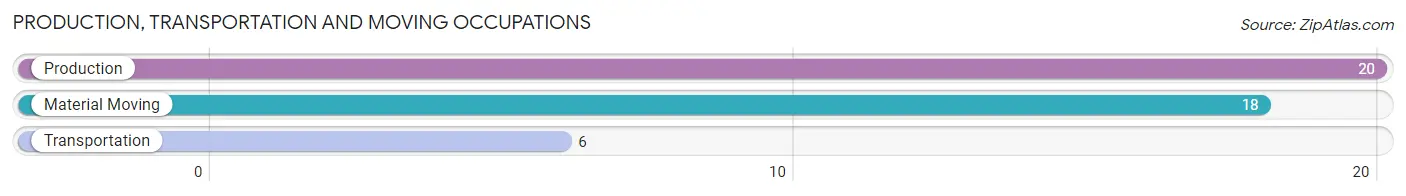
Production, Transportation and Moving Occupations by Sex
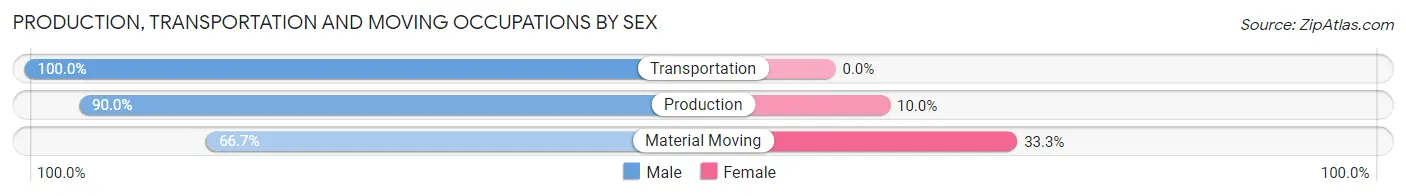
| Occupation | Male | Female |
| Production | 18 (90.0%) | 2 (10.0%) |
| Transportation | 6 (100.0%) | 0 (0.0%) |
| Material Moving | 12 (66.7%) | 6 (33.3%) |
| Total (Category) | 36 (81.8%) | 8 (18.2%) |
| Total (Overall) | 67 (46.9%) | 76 (53.1%) |
Employment Industries by Sex in Scranton
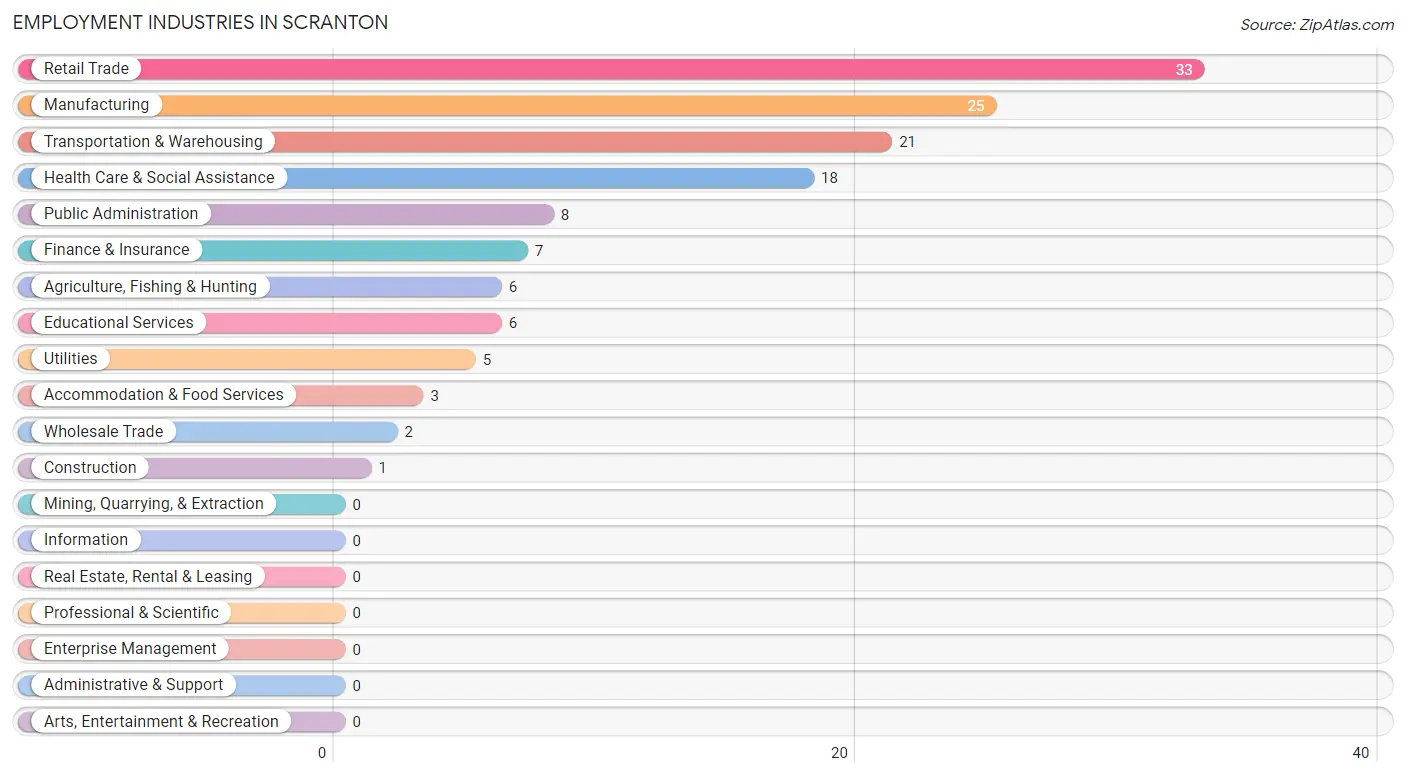
Employment Industries in Scranton
The major employment industries in Scranton include Retail Trade (33 | 23.1%), Manufacturing (25 | 17.5%), Transportation & Warehousing (21 | 14.7%), Health Care & Social Assistance (18 | 12.6%), and Public Administration (8 | 5.6%).
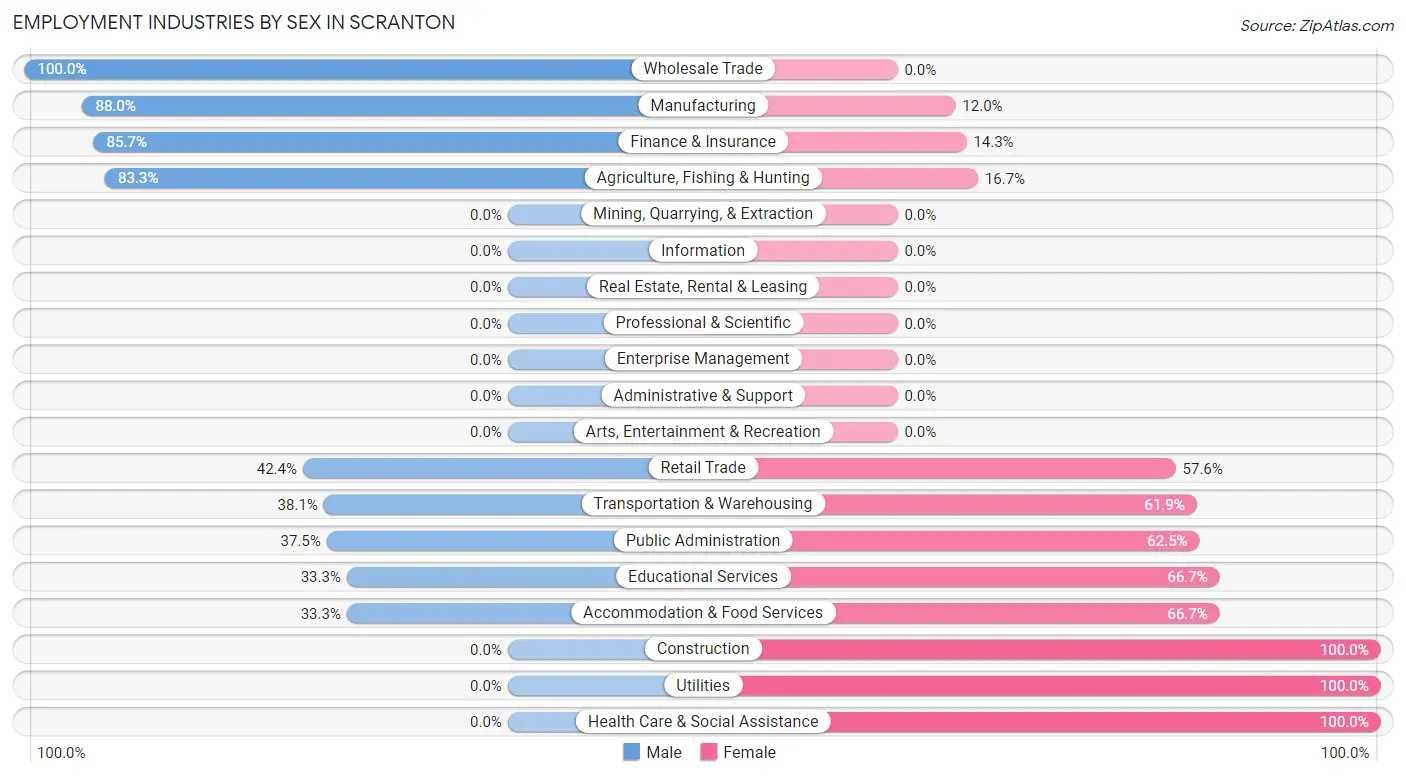
Employment Industries by Sex in Scranton
The Scranton industries that see more men than women are Wholesale Trade (100.0%), Manufacturing (88.0%), and Finance & Insurance (85.7%), whereas the industries that tend to have a higher number of women are Construction (100.0%), Utilities (100.0%), and Health Care & Social Assistance (100.0%).
| Industry | Male | Female |
| Agriculture, Fishing & Hunting | 5 (83.3%) | 1 (16.7%) |
| Mining, Quarrying, & Extraction | 0 (0.0%) | 0 (0.0%) |
| Construction | 0 (0.0%) | 1 (100.0%) |
| Manufacturing | 22 (88.0%) | 3 (12.0%) |
| Wholesale Trade | 2 (100.0%) | 0 (0.0%) |
| Retail Trade | 14 (42.4%) | 19 (57.6%) |
| Transportation & Warehousing | 8 (38.1%) | 13 (61.9%) |
| Utilities | 0 (0.0%) | 5 (100.0%) |
| Information | 0 (0.0%) | 0 (0.0%) |
| Finance & Insurance | 6 (85.7%) | 1 (14.3%) |
| Real Estate, Rental & Leasing | 0 (0.0%) | 0 (0.0%) |
| Professional & Scientific | 0 (0.0%) | 0 (0.0%) |
| Enterprise Management | 0 (0.0%) | 0 (0.0%) |
| Administrative & Support | 0 (0.0%) | 0 (0.0%) |
| Educational Services | 2 (33.3%) | 4 (66.7%) |
| Health Care & Social Assistance | 0 (0.0%) | 18 (100.0%) |
| Arts, Entertainment & Recreation | 0 (0.0%) | 0 (0.0%) |
| Accommodation & Food Services | 1 (33.3%) | 2 (66.7%) |
| Public Administration | 3 (37.5%) | 5 (62.5%) |
| Total | 67 (46.9%) | 76 (53.1%) |
Education in Scranton
School Enrollment in Scranton
The most common levels of schooling among the 57 students in Scranton are college / undergraduate (22 | 38.6%), high school (14 | 24.6%), and middle school (12 | 21.0%).
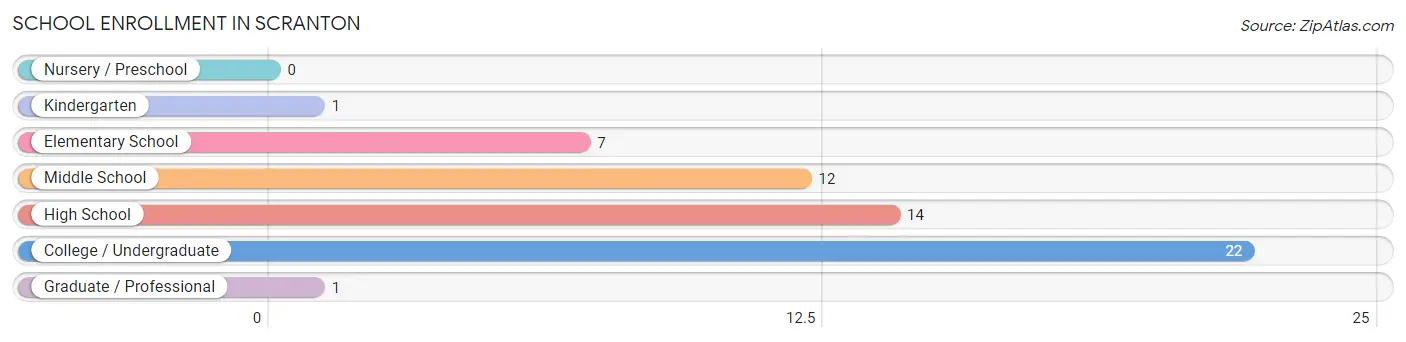
| School Level | # Students | % Students |
| Nursery / Preschool | 0 | 0.0% |
| Kindergarten | 1 | 1.8% |
| Elementary School | 7 | 12.3% |
| Middle School | 12 | 21.0% |
| High School | 14 | 24.6% |
| College / Undergraduate | 22 | 38.6% |
| Graduate / Professional | 1 | 1.8% |
| Total | 57 | 100.0% |
School Enrollment by Age by Funding Source in Scranton
Out of a total of 57 students who are enrolled in schools in Scranton, 5 (8.8%) attend a private institution, while the remaining 52 (91.2%) are enrolled in public schools. The age group of 18 to 19 year olds has the highest likelihood of being enrolled in private schools, with 3 (100.0% in the age bracket) enrolled. Conversely, the age group of 3 to 4 year olds has the lowest likelihood of being enrolled in a private school, with 1 (100.0% in the age bracket) attending a public institution.
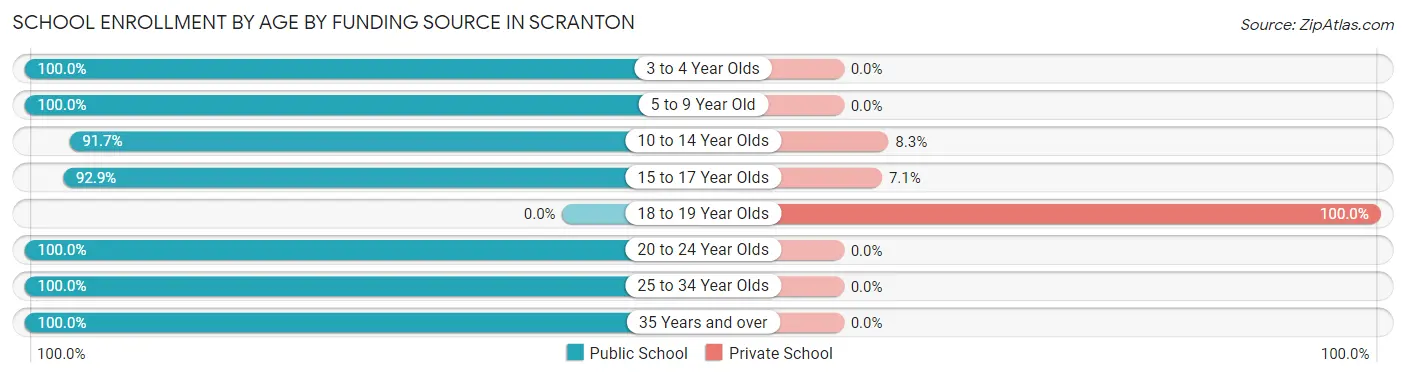
| Age Bracket | Public School | Private School |
| 3 to 4 Year Olds | 1 (100.0%) | 0 (0.0%) |
| 5 to 9 Year Old | 7 (100.0%) | 0 (0.0%) |
| 10 to 14 Year Olds | 11 (91.7%) | 1 (8.3%) |
| 15 to 17 Year Olds | 13 (92.9%) | 1 (7.1%) |
| 18 to 19 Year Olds | 0 (0.0%) | 3 (100.0%) |
| 20 to 24 Year Olds | 13 (100.0%) | 0 (0.0%) |
| 25 to 34 Year Olds | 5 (100.0%) | 0 (0.0%) |
| 35 Years and over | 2 (100.0%) | 0 (0.0%) |
| Total | 52 (91.2%) | 5 (8.8%) |
Educational Attainment by Field of Study in Scranton
Bio, nature & agricultural (8 | 25.0%), psychology (6 | 18.8%), social sciences (6 | 18.8%), science & technology (3 | 9.4%), and business (3 | 9.4%) are the most common fields of study among 32 individuals in Scranton who have obtained a bachelor's degree or higher.
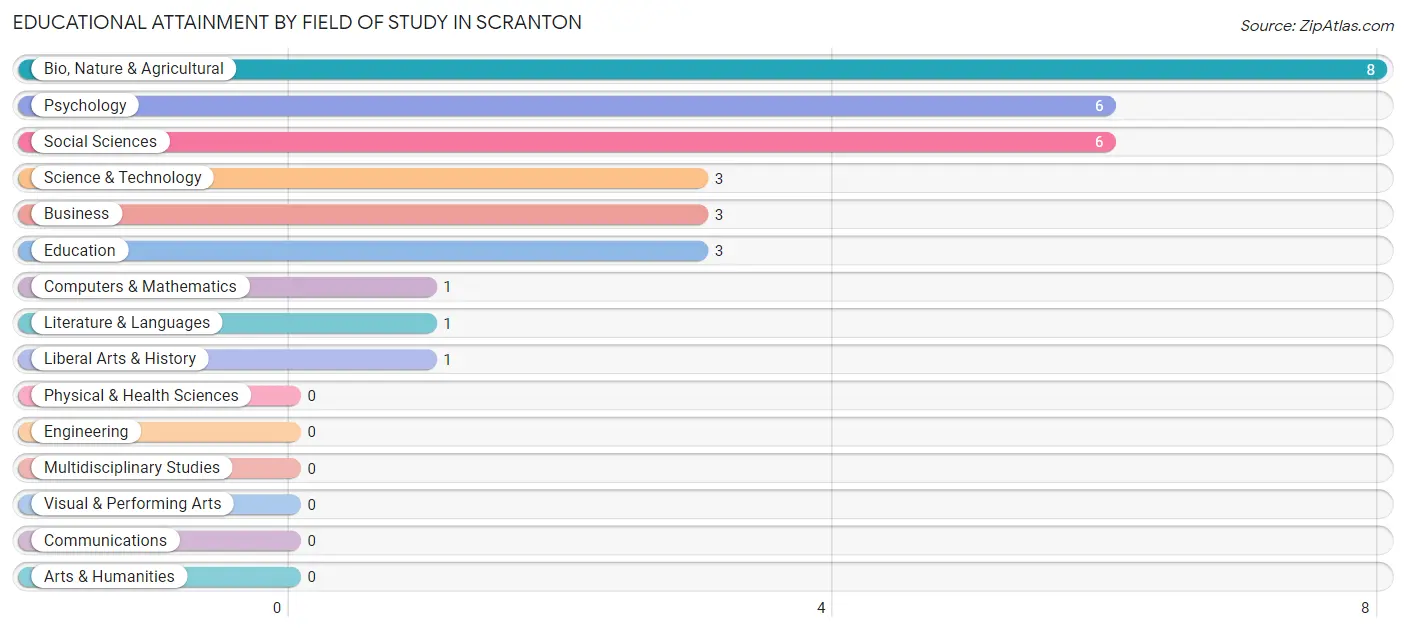
| Field of Study | # Graduates | % Graduates |
| Computers & Mathematics | 1 | 3.1% |
| Bio, Nature & Agricultural | 8 | 25.0% |
| Physical & Health Sciences | 0 | 0.0% |
| Psychology | 6 | 18.8% |
| Social Sciences | 6 | 18.8% |
| Engineering | 0 | 0.0% |
| Multidisciplinary Studies | 0 | 0.0% |
| Science & Technology | 3 | 9.4% |
| Business | 3 | 9.4% |
| Education | 3 | 9.4% |
| Literature & Languages | 1 | 3.1% |
| Liberal Arts & History | 1 | 3.1% |
| Visual & Performing Arts | 0 | 0.0% |
| Communications | 0 | 0.0% |
| Arts & Humanities | 0 | 0.0% |
| Total | 32 | 100.0% |
Transportation & Commute in Scranton
Vehicle Availability by Sex in Scranton
The most prevalent vehicle ownership categories in Scranton are males with 2 vehicles (34, accounting for 52.3%) and females with 2 vehicles (39, making up 44.7%).
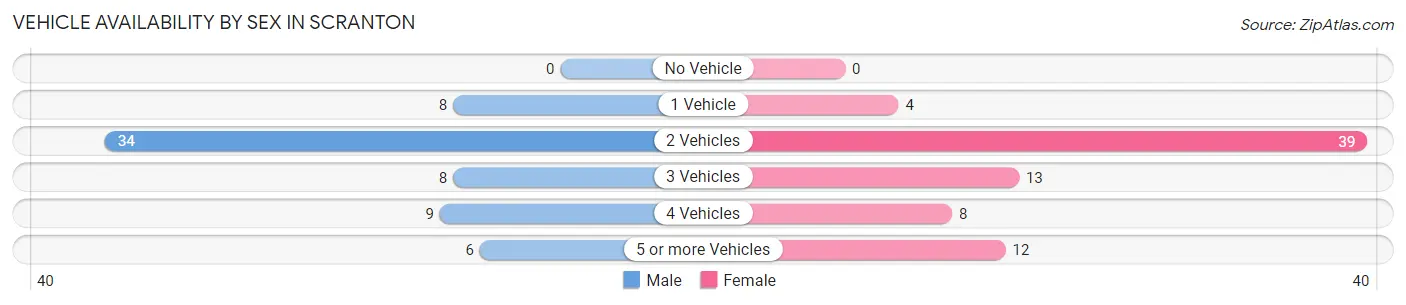
| Vehicles Available | Male | Female |
| No Vehicle | 0 (0.0%) | 0 (0.0%) |
| 1 Vehicle | 8 (12.3%) | 4 (5.3%) |
| 2 Vehicles | 34 (52.3%) | 39 (51.3%) |
| 3 Vehicles | 8 (12.3%) | 13 (17.1%) |
| 4 Vehicles | 9 (13.9%) | 8 (10.5%) |
| 5 or more Vehicles | 6 (9.2%) | 12 (15.8%) |
| Total | 65 (100.0%) | 76 (100.0%) |
Commute Time in Scranton
The most frequently occuring commute durations in Scranton are 15 to 19 minutes (31 commuters, 22.6%), 30 to 34 minutes (31 commuters, 22.6%), and 5 to 9 minutes (22 commuters, 16.1%).
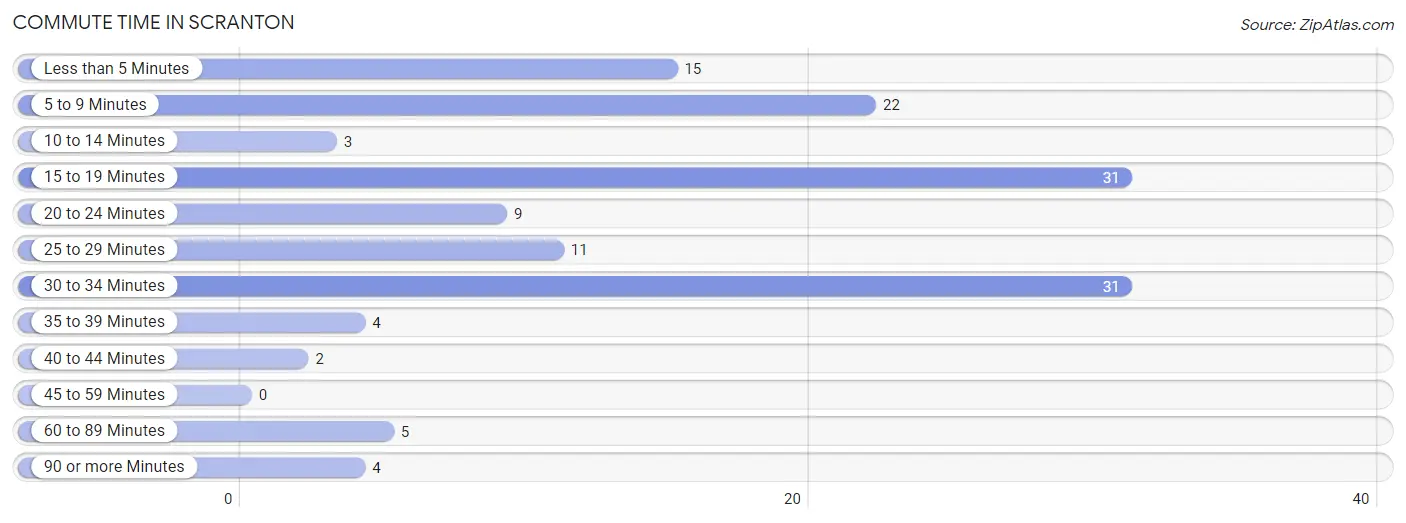
| Commute Time | # Commuters | % Commuters |
| Less than 5 Minutes | 15 | 11.0% |
| 5 to 9 Minutes | 22 | 16.1% |
| 10 to 14 Minutes | 3 | 2.2% |
| 15 to 19 Minutes | 31 | 22.6% |
| 20 to 24 Minutes | 9 | 6.6% |
| 25 to 29 Minutes | 11 | 8.0% |
| 30 to 34 Minutes | 31 | 22.6% |
| 35 to 39 Minutes | 4 | 2.9% |
| 40 to 44 Minutes | 2 | 1.5% |
| 45 to 59 Minutes | 0 | 0.0% |
| 60 to 89 Minutes | 5 | 3.6% |
| 90 or more Minutes | 4 | 2.9% |
Commute Time by Sex in Scranton
The most common commute times in Scranton are 15 to 19 minutes (19 commuters, 29.2%) for males and 30 to 34 minutes (16 commuters, 22.2%) for females.
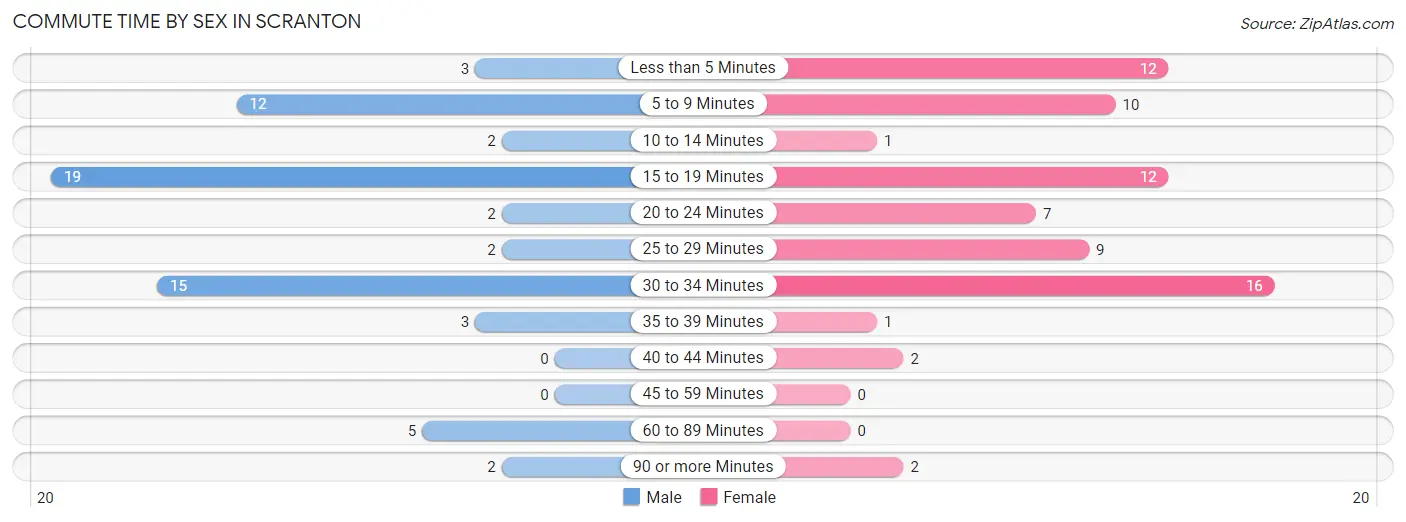
| Commute Time | Male | Female |
| Less than 5 Minutes | 3 (4.6%) | 12 (16.7%) |
| 5 to 9 Minutes | 12 (18.5%) | 10 (13.9%) |
| 10 to 14 Minutes | 2 (3.1%) | 1 (1.4%) |
| 15 to 19 Minutes | 19 (29.2%) | 12 (16.7%) |
| 20 to 24 Minutes | 2 (3.1%) | 7 (9.7%) |
| 25 to 29 Minutes | 2 (3.1%) | 9 (12.5%) |
| 30 to 34 Minutes | 15 (23.1%) | 16 (22.2%) |
| 35 to 39 Minutes | 3 (4.6%) | 1 (1.4%) |
| 40 to 44 Minutes | 0 (0.0%) | 2 (2.8%) |
| 45 to 59 Minutes | 0 (0.0%) | 0 (0.0%) |
| 60 to 89 Minutes | 5 (7.7%) | 0 (0.0%) |
| 90 or more Minutes | 2 (3.1%) | 2 (2.8%) |
Time of Departure to Work by Sex in Scranton
The most frequent times of departure to work in Scranton are 7:00 AM to 7:29 AM (18, 27.7%) for males and 12:00 PM to 3:59 PM (21, 29.2%) for females.
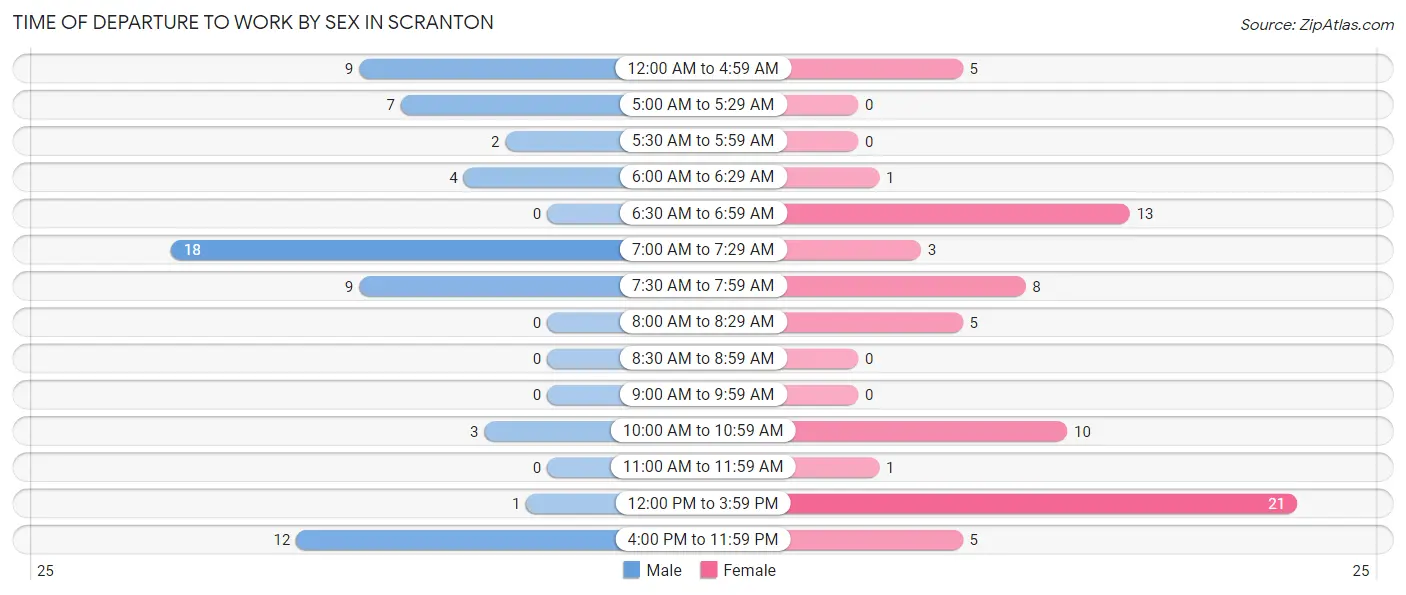
| Time of Departure | Male | Female |
| 12:00 AM to 4:59 AM | 9 (13.9%) | 5 (6.9%) |
| 5:00 AM to 5:29 AM | 7 (10.8%) | 0 (0.0%) |
| 5:30 AM to 5:59 AM | 2 (3.1%) | 0 (0.0%) |
| 6:00 AM to 6:29 AM | 4 (6.1%) | 1 (1.4%) |
| 6:30 AM to 6:59 AM | 0 (0.0%) | 13 (18.1%) |
| 7:00 AM to 7:29 AM | 18 (27.7%) | 3 (4.2%) |
| 7:30 AM to 7:59 AM | 9 (13.9%) | 8 (11.1%) |
| 8:00 AM to 8:29 AM | 0 (0.0%) | 5 (6.9%) |
| 8:30 AM to 8:59 AM | 0 (0.0%) | 0 (0.0%) |
| 9:00 AM to 9:59 AM | 0 (0.0%) | 0 (0.0%) |
| 10:00 AM to 10:59 AM | 3 (4.6%) | 10 (13.9%) |
| 11:00 AM to 11:59 AM | 0 (0.0%) | 1 (1.4%) |
| 12:00 PM to 3:59 PM | 1 (1.5%) | 21 (29.2%) |
| 4:00 PM to 11:59 PM | 12 (18.5%) | 5 (6.9%) |
| Total | 65 (100.0%) | 72 (100.0%) |
Housing Occupancy in Scranton
Occupancy by Ownership in Scranton
Of the total 93 dwellings in Scranton, owner-occupied units account for 72 (77.4%), while renter-occupied units make up 21 (22.6%).
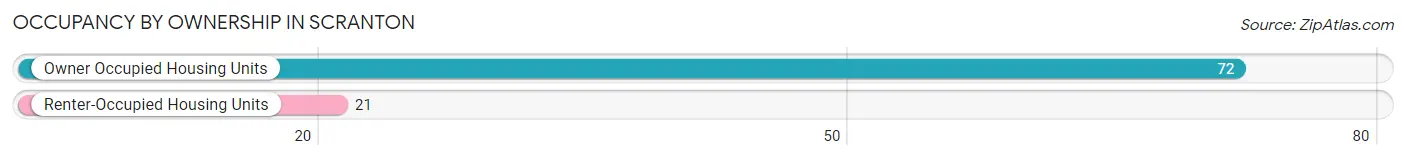
| Occupancy | # Housing Units | % Housing Units |
| Owner Occupied Housing Units | 72 | 77.4% |
| Renter-Occupied Housing Units | 21 | 22.6% |
| Total Occupied Housing Units | 93 | 100.0% |
Occupancy by Household Size in Scranton
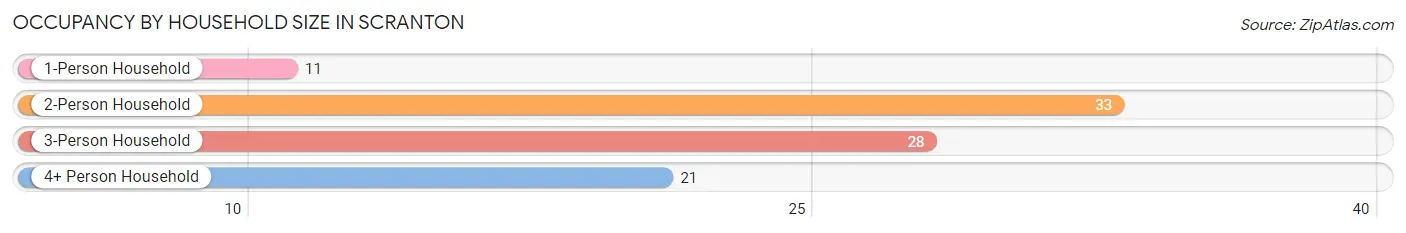
| Household Size | # Housing Units | % Housing Units |
| 1-Person Household | 11 | 11.8% |
| 2-Person Household | 33 | 35.5% |
| 3-Person Household | 28 | 30.1% |
| 4+ Person Household | 21 | 22.6% |
| Total Housing Units | 93 | 100.0% |
Occupancy by Ownership by Household Size in Scranton
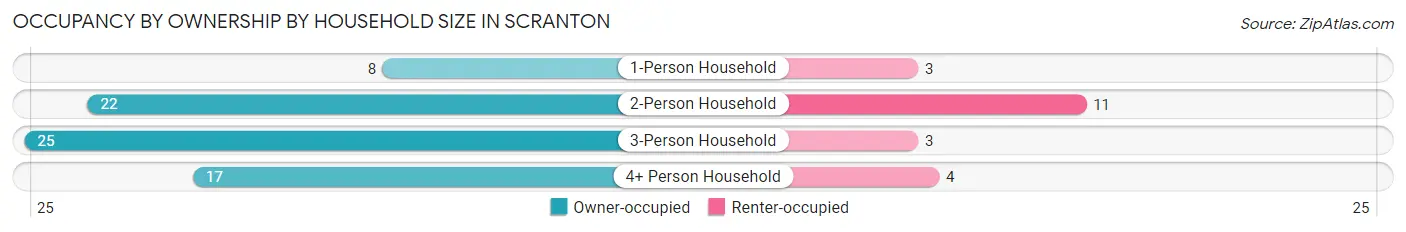
| Household Size | Owner-occupied | Renter-occupied |
| 1-Person Household | 8 (72.7%) | 3 (27.3%) |
| 2-Person Household | 22 (66.7%) | 11 (33.3%) |
| 3-Person Household | 25 (89.3%) | 3 (10.7%) |
| 4+ Person Household | 17 (80.9%) | 4 (19.1%) |
| Total Housing Units | 72 (77.4%) | 21 (22.6%) |
Occupancy by Educational Attainment in Scranton
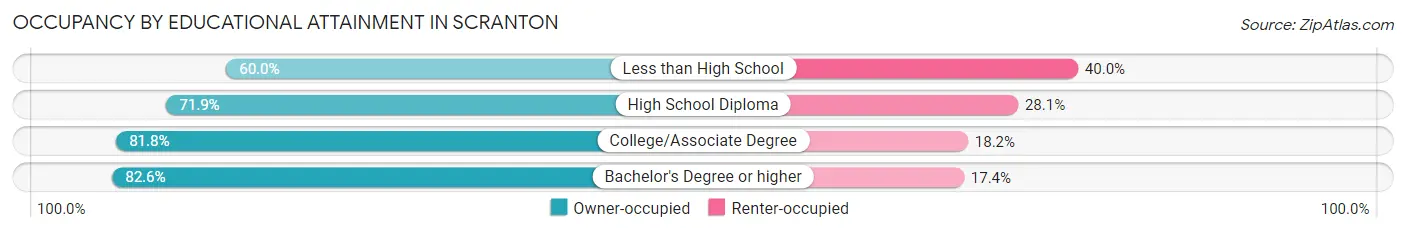
| Household Size | Owner-occupied | Renter-occupied |
| Less than High School | 3 (60.0%) | 2 (40.0%) |
| High School Diploma | 23 (71.9%) | 9 (28.1%) |
| College/Associate Degree | 27 (81.8%) | 6 (18.2%) |
| Bachelor's Degree or higher | 19 (82.6%) | 4 (17.4%) |
Occupancy by Age of Householder in Scranton
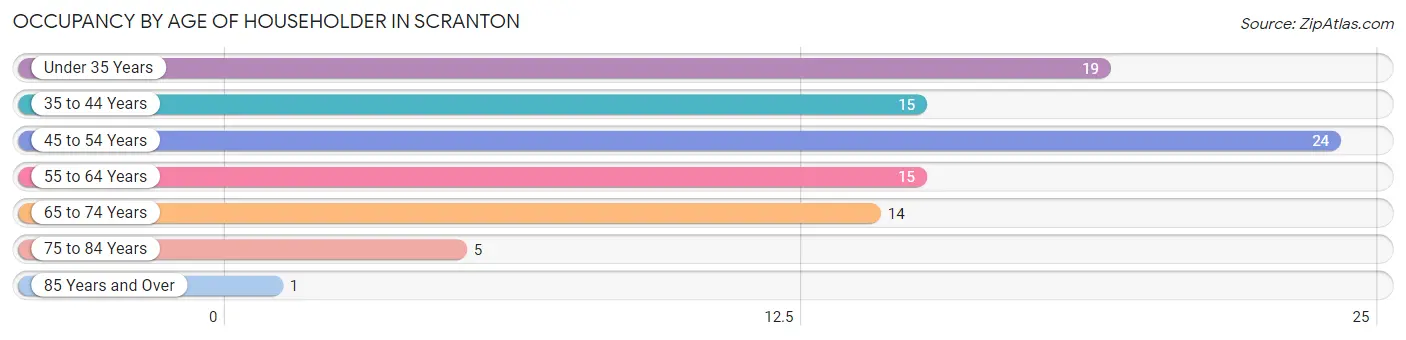
| Age Bracket | # Households | % Households |
| Under 35 Years | 19 | 20.4% |
| 35 to 44 Years | 15 | 16.1% |
| 45 to 54 Years | 24 | 25.8% |
| 55 to 64 Years | 15 | 16.1% |
| 65 to 74 Years | 14 | 15.0% |
| 75 to 84 Years | 5 | 5.4% |
| 85 Years and Over | 1 | 1.1% |
| Total | 93 | 100.0% |
Housing Finances in Scranton
Median Income by Occupancy in Scranton
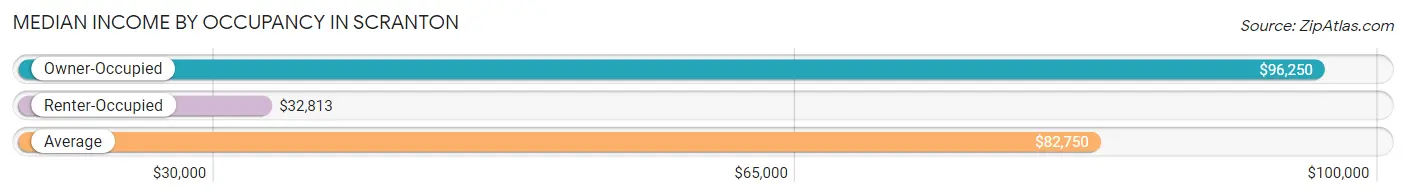
| Occupancy Type | # Households | Median Income |
| Owner-Occupied | 72 (77.4%) | $96,250 |
| Renter-Occupied | 21 (22.6%) | $32,813 |
| Average | 93 (100.0%) | $82,750 |
Occupancy by Householder Income Bracket in Scranton
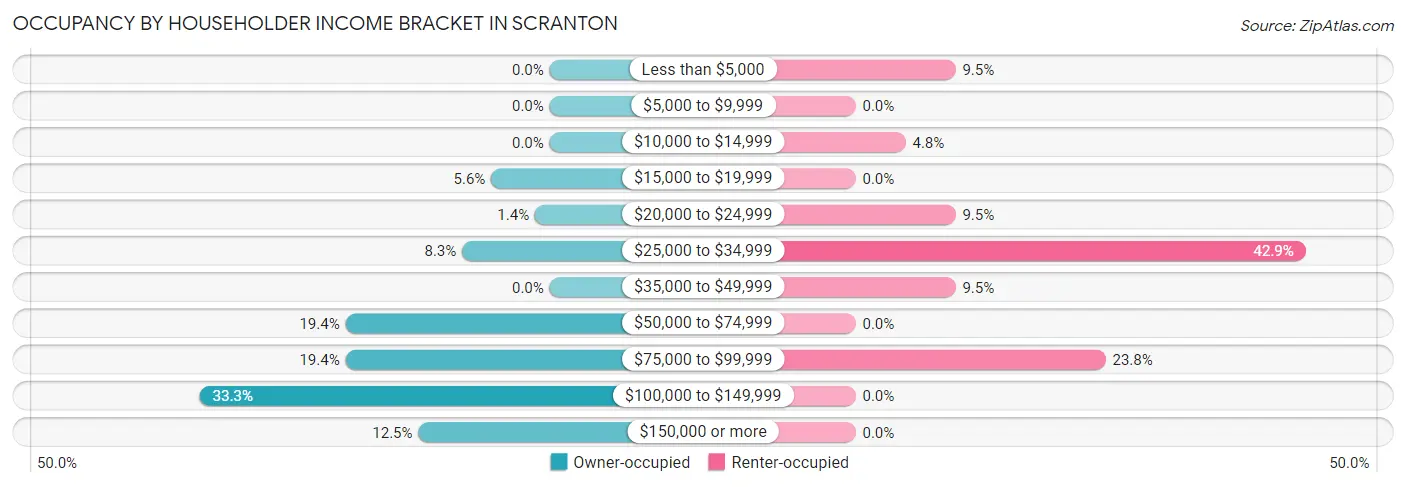
| Income Bracket | Owner-occupied | Renter-occupied |
| Less than $5,000 | 0 (0.0%) | 2 (9.5%) |
| $5,000 to $9,999 | 0 (0.0%) | 0 (0.0%) |
| $10,000 to $14,999 | 0 (0.0%) | 1 (4.8%) |
| $15,000 to $19,999 | 4 (5.6%) | 0 (0.0%) |
| $20,000 to $24,999 | 1 (1.4%) | 2 (9.5%) |
| $25,000 to $34,999 | 6 (8.3%) | 9 (42.9%) |
| $35,000 to $49,999 | 0 (0.0%) | 2 (9.5%) |
| $50,000 to $74,999 | 14 (19.4%) | 0 (0.0%) |
| $75,000 to $99,999 | 14 (19.4%) | 5 (23.8%) |
| $100,000 to $149,999 | 24 (33.3%) | 0 (0.0%) |
| $150,000 or more | 9 (12.5%) | 0 (0.0%) |
| Total | 72 (100.0%) | 21 (100.0%) |
Monthly Housing Cost Tiers in Scranton
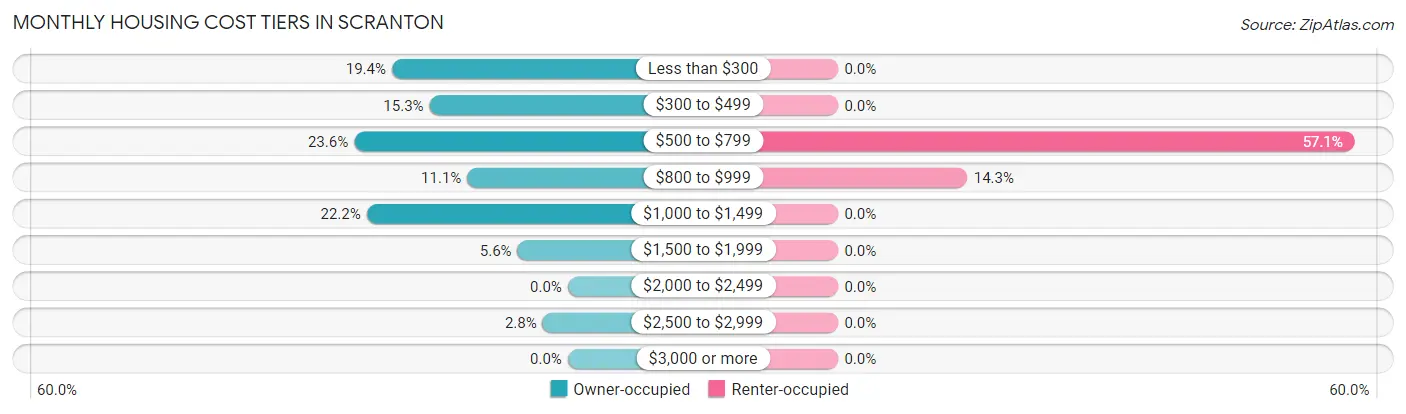
| Monthly Cost | Owner-occupied | Renter-occupied |
| Less than $300 | 14 (19.4%) | 0 (0.0%) |
| $300 to $499 | 11 (15.3%) | 0 (0.0%) |
| $500 to $799 | 17 (23.6%) | 12 (57.1%) |
| $800 to $999 | 8 (11.1%) | 3 (14.3%) |
| $1,000 to $1,499 | 16 (22.2%) | 0 (0.0%) |
| $1,500 to $1,999 | 4 (5.6%) | 0 (0.0%) |
| $2,000 to $2,499 | 0 (0.0%) | 0 (0.0%) |
| $2,500 to $2,999 | 2 (2.8%) | 0 (0.0%) |
| $3,000 or more | 0 (0.0%) | 0 (0.0%) |
| Total | 72 (100.0%) | 21 (100.0%) |
Physical Housing Characteristics in Scranton
Housing Structures in Scranton
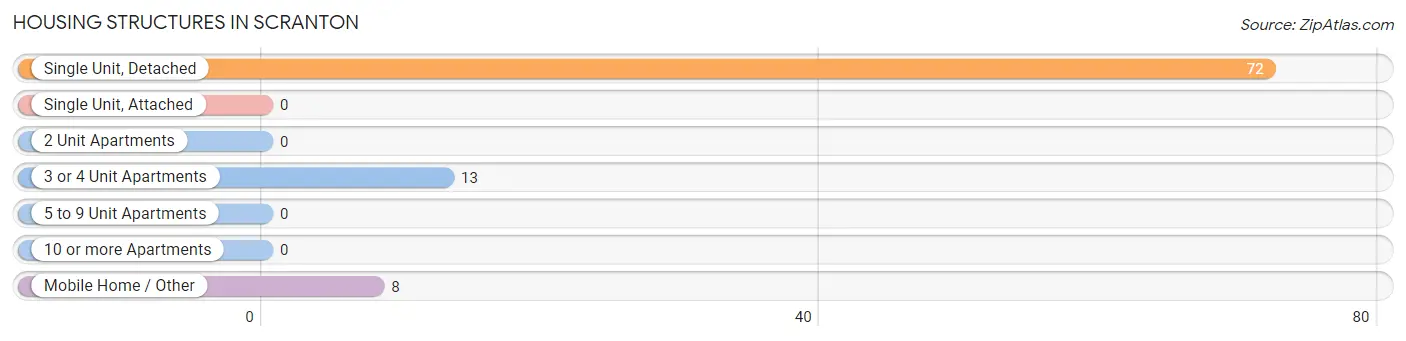
| Structure Type | # Housing Units | % Housing Units |
| Single Unit, Detached | 72 | 77.4% |
| Single Unit, Attached | 0 | 0.0% |
| 2 Unit Apartments | 0 | 0.0% |
| 3 or 4 Unit Apartments | 13 | 14.0% |
| 5 to 9 Unit Apartments | 0 | 0.0% |
| 10 or more Apartments | 0 | 0.0% |
| Mobile Home / Other | 8 | 8.6% |
| Total | 93 | 100.0% |
Housing Structures by Occupancy in Scranton
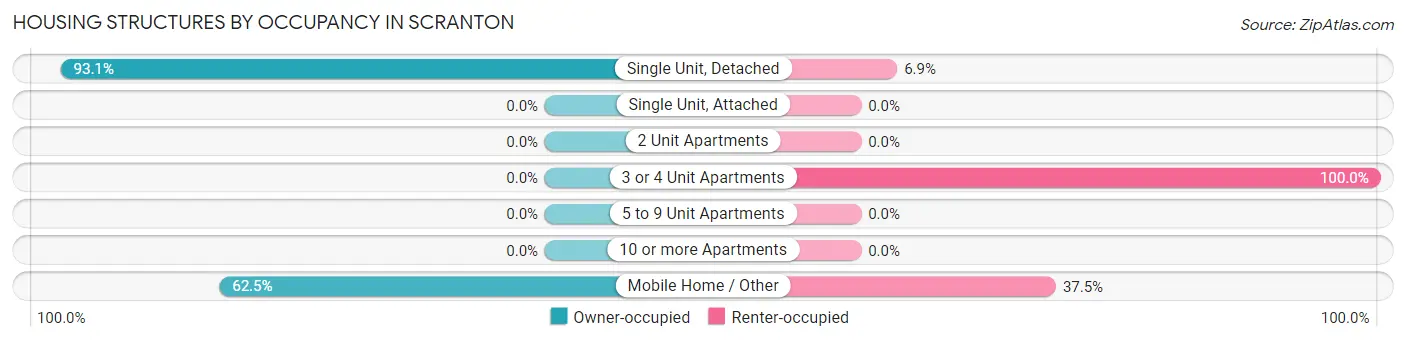
| Structure Type | Owner-occupied | Renter-occupied |
| Single Unit, Detached | 67 (93.1%) | 5 (6.9%) |
| Single Unit, Attached | 0 (0.0%) | 0 (0.0%) |
| 2 Unit Apartments | 0 (0.0%) | 0 (0.0%) |
| 3 or 4 Unit Apartments | 0 (0.0%) | 13 (100.0%) |
| 5 to 9 Unit Apartments | 0 (0.0%) | 0 (0.0%) |
| 10 or more Apartments | 0 (0.0%) | 0 (0.0%) |
| Mobile Home / Other | 5 (62.5%) | 3 (37.5%) |
| Total | 72 (77.4%) | 21 (22.6%) |
Housing Structures by Number of Rooms in Scranton
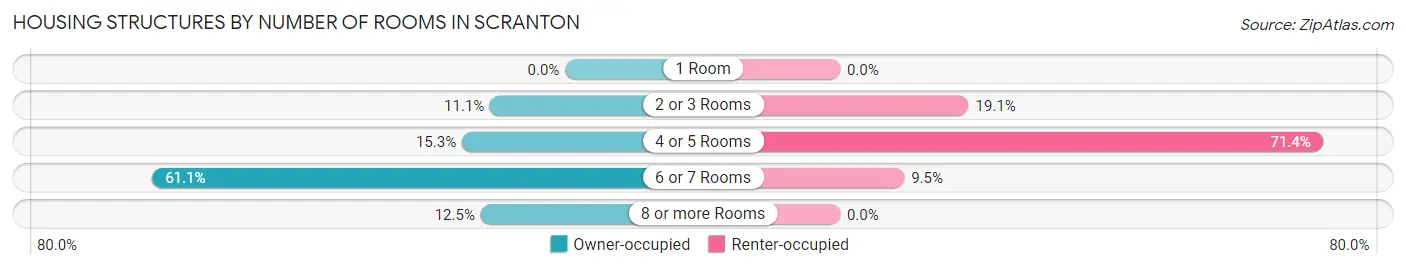
| Number of Rooms | Owner-occupied | Renter-occupied |
| 1 Room | 0 (0.0%) | 0 (0.0%) |
| 2 or 3 Rooms | 8 (11.1%) | 4 (19.1%) |
| 4 or 5 Rooms | 11 (15.3%) | 15 (71.4%) |
| 6 or 7 Rooms | 44 (61.1%) | 2 (9.5%) |
| 8 or more Rooms | 9 (12.5%) | 0 (0.0%) |
| Total | 72 (100.0%) | 21 (100.0%) |
Housing Structure by Heating Type in Scranton
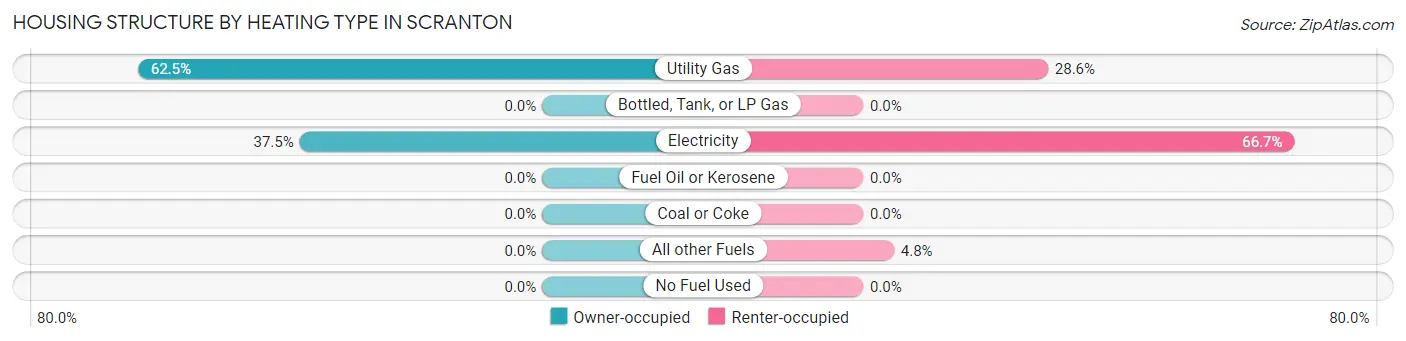
| Heating Type | Owner-occupied | Renter-occupied |
| Utility Gas | 45 (62.5%) | 6 (28.6%) |
| Bottled, Tank, or LP Gas | 0 (0.0%) | 0 (0.0%) |
| Electricity | 27 (37.5%) | 14 (66.7%) |
| Fuel Oil or Kerosene | 0 (0.0%) | 0 (0.0%) |
| Coal or Coke | 0 (0.0%) | 0 (0.0%) |
| All other Fuels | 0 (0.0%) | 1 (4.8%) |
| No Fuel Used | 0 (0.0%) | 0 (0.0%) |
| Total | 72 (100.0%) | 21 (100.0%) |
Household Vehicle Usage in Scranton
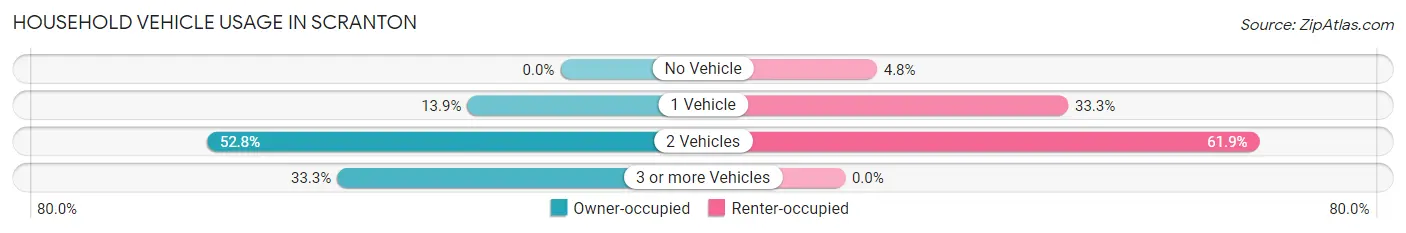
| Vehicles per Household | Owner-occupied | Renter-occupied |
| No Vehicle | 0 (0.0%) | 1 (4.8%) |
| 1 Vehicle | 10 (13.9%) | 7 (33.3%) |
| 2 Vehicles | 38 (52.8%) | 13 (61.9%) |
| 3 or more Vehicles | 24 (33.3%) | 0 (0.0%) |
| Total | 72 (100.0%) | 21 (100.0%) |
Real Estate & Mortgages in Scranton
Real Estate and Mortgage Overview in Scranton
| Characteristic | Without Mortgage | With Mortgage |
| Housing Units | 30 | 42 |
| Median Property Value | $104,200 | $106,300 |
| Median Household Income | $93,750 | $7 |
| Monthly Housing Costs | $313 | $0 |
| Real Estate Taxes | $550 | $0 |
Property Value by Mortgage Status in Scranton
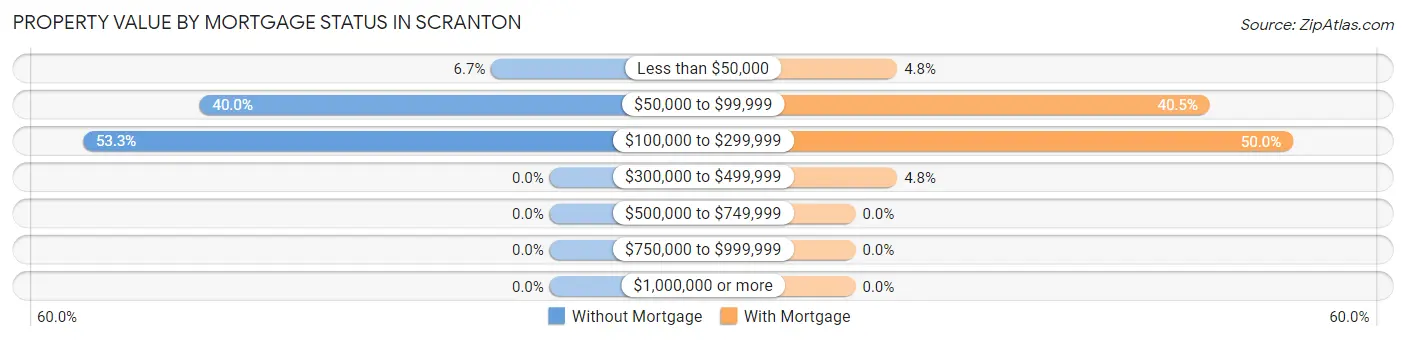
| Property Value | Without Mortgage | With Mortgage |
| Less than $50,000 | 2 (6.7%) | 2 (4.8%) |
| $50,000 to $99,999 | 12 (40.0%) | 17 (40.5%) |
| $100,000 to $299,999 | 16 (53.3%) | 21 (50.0%) |
| $300,000 to $499,999 | 0 (0.0%) | 2 (4.8%) |
| $500,000 to $749,999 | 0 (0.0%) | 0 (0.0%) |
| $750,000 to $999,999 | 0 (0.0%) | 0 (0.0%) |
| $1,000,000 or more | 0 (0.0%) | 0 (0.0%) |
| Total | 30 (100.0%) | 42 (100.0%) |
Household Income by Mortgage Status in Scranton
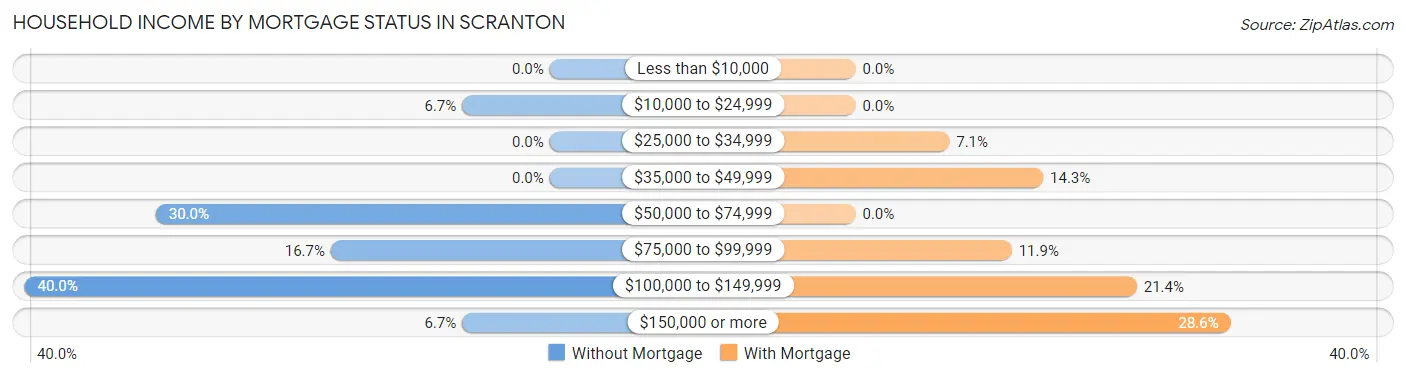
| Household Income | Without Mortgage | With Mortgage |
| Less than $10,000 | 0 (0.0%) | 0 (0.0%) |
| $10,000 to $24,999 | 2 (6.7%) | 0 (0.0%) |
| $25,000 to $34,999 | 0 (0.0%) | 3 (7.1%) |
| $35,000 to $49,999 | 0 (0.0%) | 6 (14.3%) |
| $50,000 to $74,999 | 9 (30.0%) | 0 (0.0%) |
| $75,000 to $99,999 | 5 (16.7%) | 5 (11.9%) |
| $100,000 to $149,999 | 12 (40.0%) | 9 (21.4%) |
| $150,000 or more | 2 (6.7%) | 12 (28.6%) |
| Total | 30 (100.0%) | 42 (100.0%) |
Property Value to Household Income Ratio in Scranton
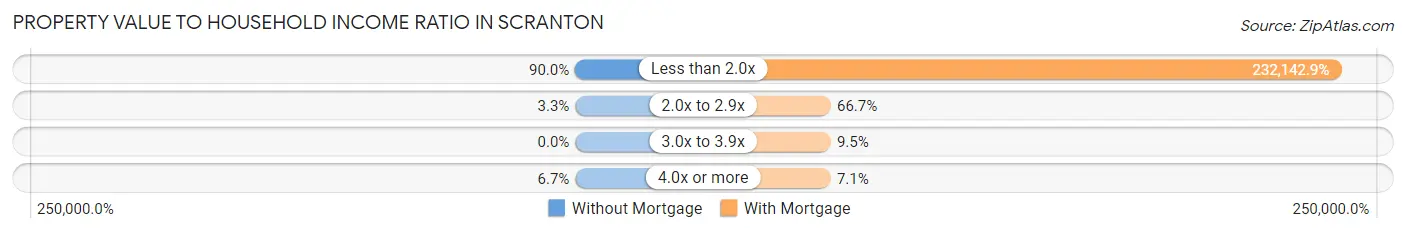
| Value-to-Income Ratio | Without Mortgage | With Mortgage |
| Less than 2.0x | 27 (90.0%) | 97,500 (232,142.9%) |
| 2.0x to 2.9x | 1 (3.3%) | 28 (66.7%) |
| 3.0x to 3.9x | 0 (0.0%) | 4 (9.5%) |
| 4.0x or more | 2 (6.7%) | 3 (7.1%) |
| Total | 30 (100.0%) | 42 (100.0%) |
Real Estate Taxes by Mortgage Status in Scranton
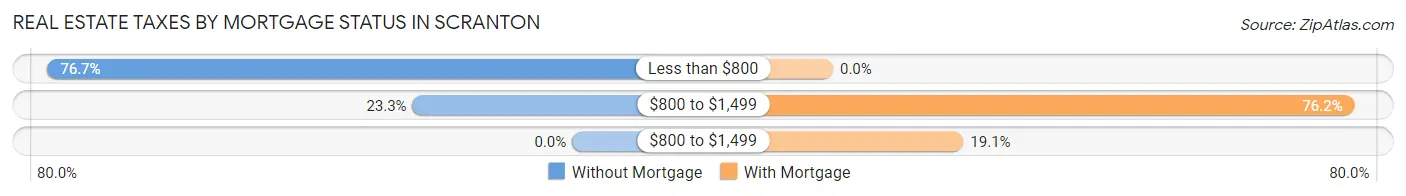
| Property Taxes | Without Mortgage | With Mortgage |
| Less than $800 | 23 (76.7%) | 0 (0.0%) |
| $800 to $1,499 | 7 (23.3%) | 32 (76.2%) |
| $800 to $1,499 | 0 (0.0%) | 8 (19.1%) |
| Total | 30 (100.0%) | 42 (100.0%) |
Health & Disability in Scranton
Health Insurance Coverage by Age in Scranton
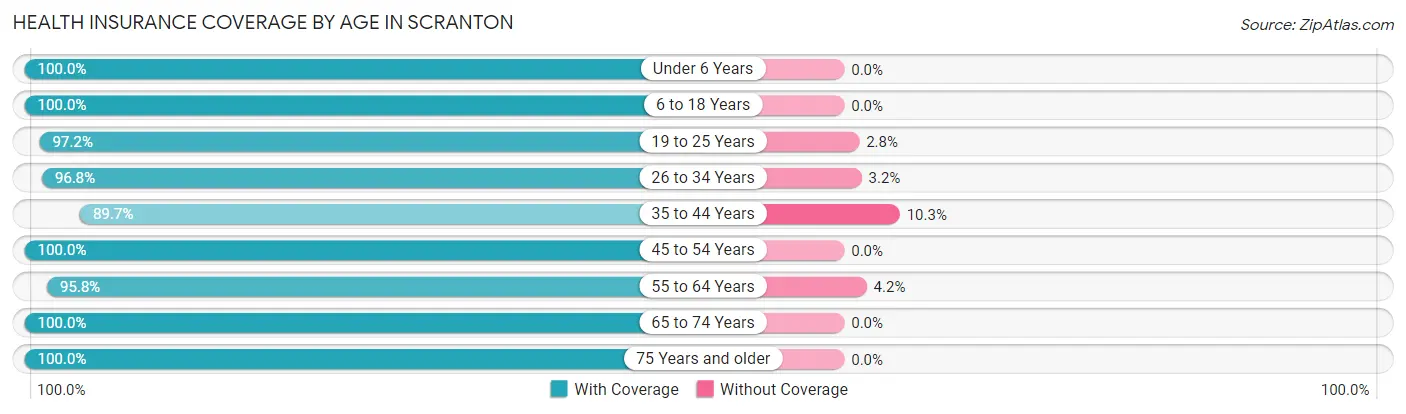
| Age Bracket | With Coverage | Without Coverage |
| Under 6 Years | 10 (100.0%) | 0 (0.0%) |
| 6 to 18 Years | 37 (100.0%) | 0 (0.0%) |
| 19 to 25 Years | 35 (97.2%) | 1 (2.8%) |
| 26 to 34 Years | 30 (96.8%) | 1 (3.2%) |
| 35 to 44 Years | 26 (89.7%) | 3 (10.3%) |
| 45 to 54 Years | 32 (100.0%) | 0 (0.0%) |
| 55 to 64 Years | 23 (95.8%) | 1 (4.2%) |
| 65 to 74 Years | 31 (100.0%) | 0 (0.0%) |
| 75 Years and older | 15 (100.0%) | 0 (0.0%) |
| Total | 239 (97.6%) | 6 (2.5%) |
Health Insurance Coverage by Citizenship Status in Scranton
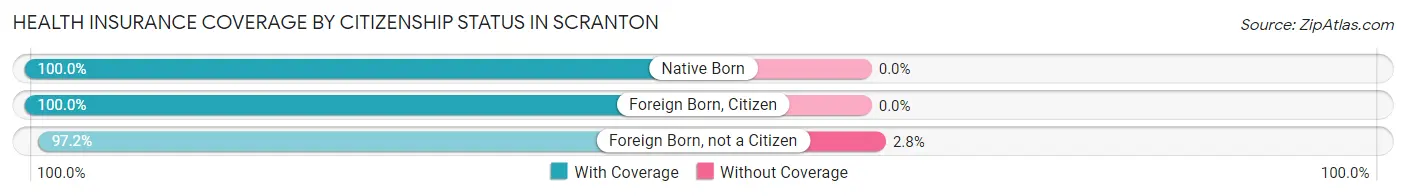
| Citizenship Status | With Coverage | Without Coverage |
| Native Born | 10 (100.0%) | 0 (0.0%) |
| Foreign Born, Citizen | 37 (100.0%) | 0 (0.0%) |
| Foreign Born, not a Citizen | 35 (97.2%) | 1 (2.8%) |
Health Insurance Coverage by Household Income in Scranton
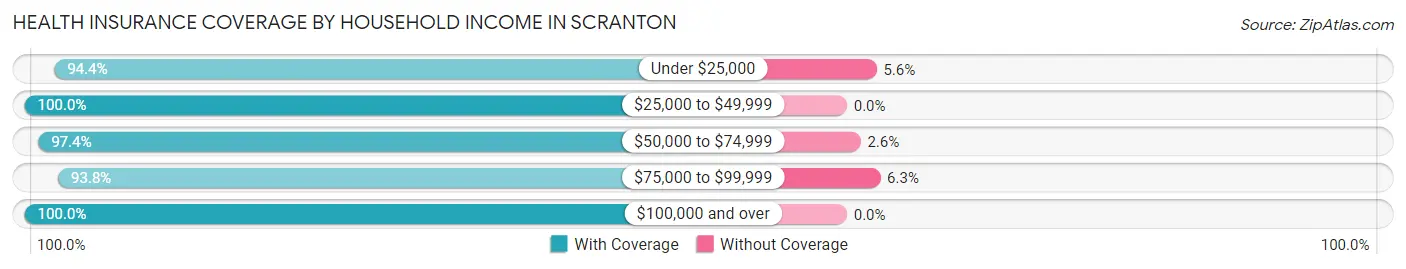
| Household Income | With Coverage | Without Coverage |
| Under $25,000 | 17 (94.4%) | 1 (5.6%) |
| $25,000 to $49,999 | 41 (100.0%) | 0 (0.0%) |
| $50,000 to $74,999 | 38 (97.4%) | 1 (2.6%) |
| $75,000 to $99,999 | 60 (93.8%) | 4 (6.2%) |
| $100,000 and over | 83 (100.0%) | 0 (0.0%) |
Public vs Private Health Insurance Coverage by Age in Scranton
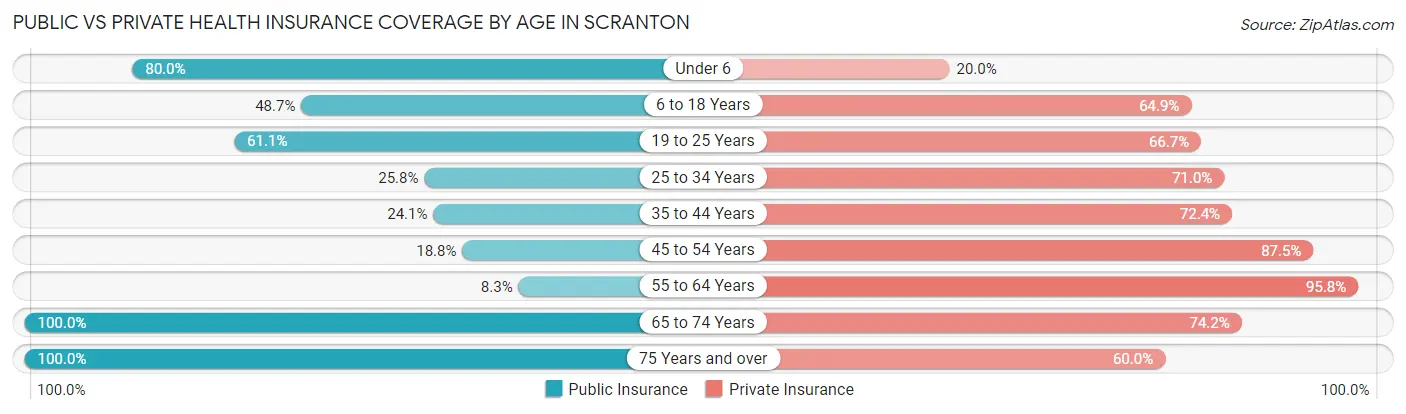
| Age Bracket | Public Insurance | Private Insurance |
| Under 6 | 8 (80.0%) | 2 (20.0%) |
| 6 to 18 Years | 18 (48.6%) | 24 (64.9%) |
| 19 to 25 Years | 22 (61.1%) | 24 (66.7%) |
| 25 to 34 Years | 8 (25.8%) | 22 (71.0%) |
| 35 to 44 Years | 7 (24.1%) | 21 (72.4%) |
| 45 to 54 Years | 6 (18.8%) | 28 (87.5%) |
| 55 to 64 Years | 2 (8.3%) | 23 (95.8%) |
| 65 to 74 Years | 31 (100.0%) | 23 (74.2%) |
| 75 Years and over | 15 (100.0%) | 9 (60.0%) |
| Total | 117 (47.8%) | 176 (71.8%) |
Disability Status by Sex by Age in Scranton
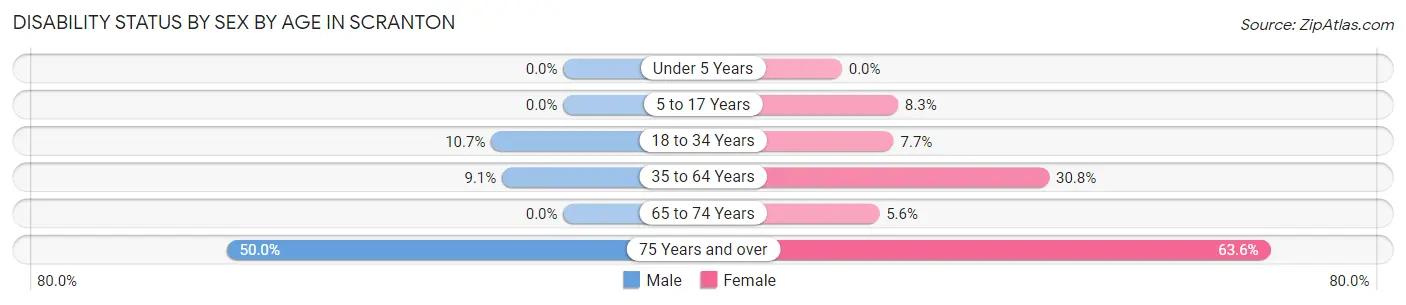
| Age Bracket | Male | Female |
| Under 5 Years | 0 (0.0%) | 0 (0.0%) |
| 5 to 17 Years | 0 (0.0%) | 2 (8.3%) |
| 18 to 34 Years | 3 (10.7%) | 3 (7.7%) |
| 35 to 64 Years | 3 (9.1%) | 16 (30.8%) |
| 65 to 74 Years | 0 (0.0%) | 1 (5.6%) |
| 75 Years and over | 2 (50.0%) | 7 (63.6%) |
Disability Class by Sex by Age in Scranton
Disability Class: Hearing Difficulty
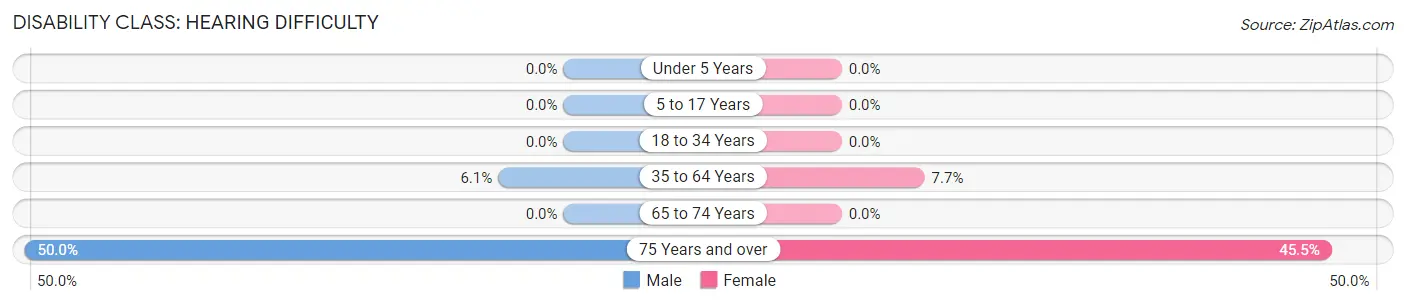
| Age Bracket | Male | Female |
| Under 5 Years | 0 (0.0%) | 0 (0.0%) |
| 5 to 17 Years | 0 (0.0%) | 0 (0.0%) |
| 18 to 34 Years | 0 (0.0%) | 0 (0.0%) |
| 35 to 64 Years | 2 (6.1%) | 4 (7.7%) |
| 65 to 74 Years | 0 (0.0%) | 0 (0.0%) |
| 75 Years and over | 2 (50.0%) | 5 (45.5%) |
Disability Class: Vision Difficulty
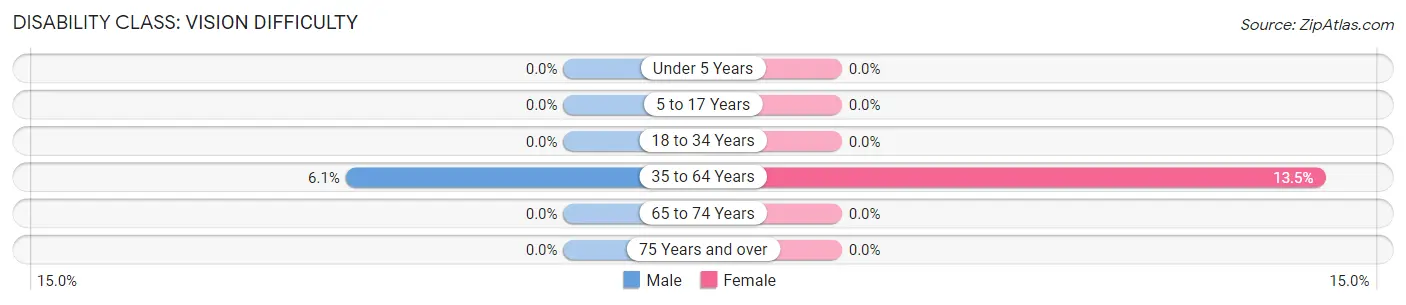
| Age Bracket | Male | Female |
| Under 5 Years | 0 (0.0%) | 0 (0.0%) |
| 5 to 17 Years | 0 (0.0%) | 0 (0.0%) |
| 18 to 34 Years | 0 (0.0%) | 0 (0.0%) |
| 35 to 64 Years | 2 (6.1%) | 7 (13.5%) |
| 65 to 74 Years | 0 (0.0%) | 0 (0.0%) |
| 75 Years and over | 0 (0.0%) | 0 (0.0%) |
Disability Class: Cognitive Difficulty
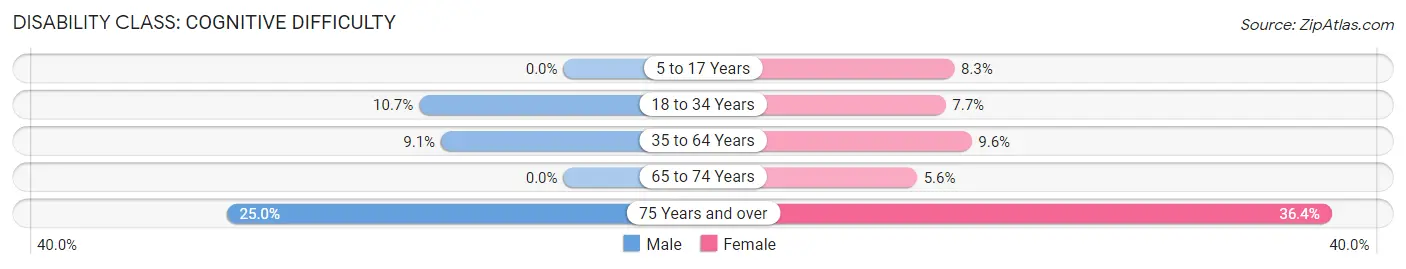
| Age Bracket | Male | Female |
| 5 to 17 Years | 0 (0.0%) | 2 (8.3%) |
| 18 to 34 Years | 3 (10.7%) | 3 (7.7%) |
| 35 to 64 Years | 3 (9.1%) | 5 (9.6%) |
| 65 to 74 Years | 0 (0.0%) | 1 (5.6%) |
| 75 Years and over | 1 (25.0%) | 4 (36.4%) |
Disability Class: Ambulatory Difficulty
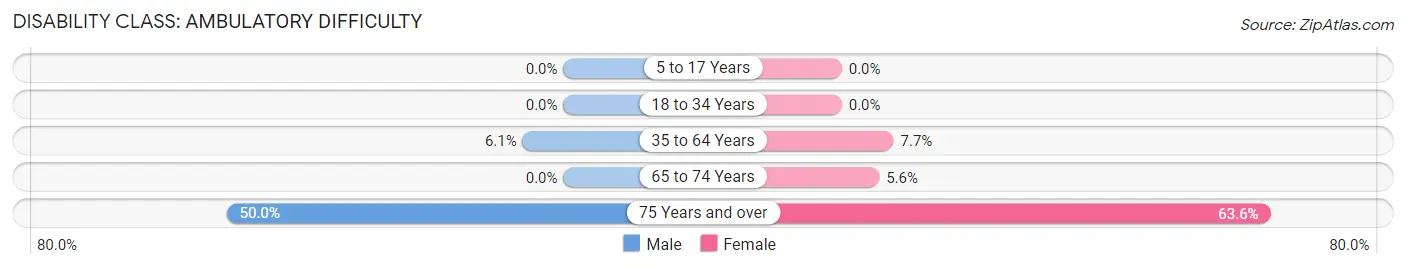
| Age Bracket | Male | Female |
| 5 to 17 Years | 0 (0.0%) | 0 (0.0%) |
| 18 to 34 Years | 0 (0.0%) | 0 (0.0%) |
| 35 to 64 Years | 2 (6.1%) | 4 (7.7%) |
| 65 to 74 Years | 0 (0.0%) | 1 (5.6%) |
| 75 Years and over | 2 (50.0%) | 7 (63.6%) |
Disability Class: Self-Care Difficulty
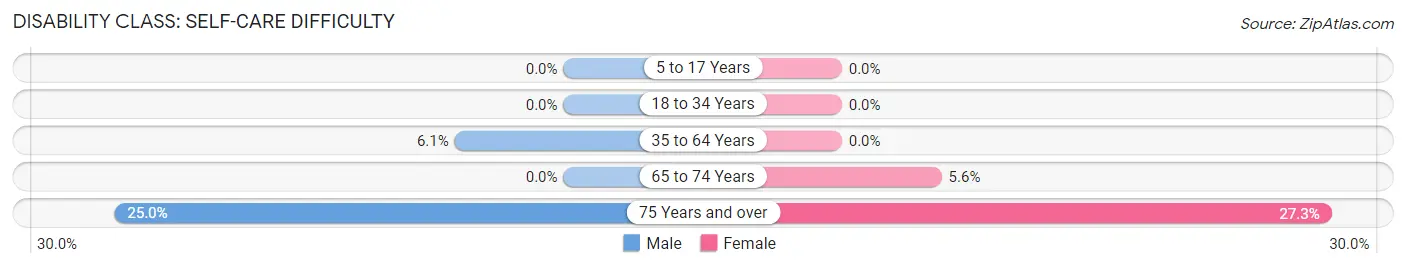
| Age Bracket | Male | Female |
| 5 to 17 Years | 0 (0.0%) | 0 (0.0%) |
| 18 to 34 Years | 0 (0.0%) | 0 (0.0%) |
| 35 to 64 Years | 2 (6.1%) | 0 (0.0%) |
| 65 to 74 Years | 0 (0.0%) | 1 (5.6%) |
| 75 Years and over | 1 (25.0%) | 3 (27.3%) |
Technology Access in Scranton
Computing Device Access in Scranton
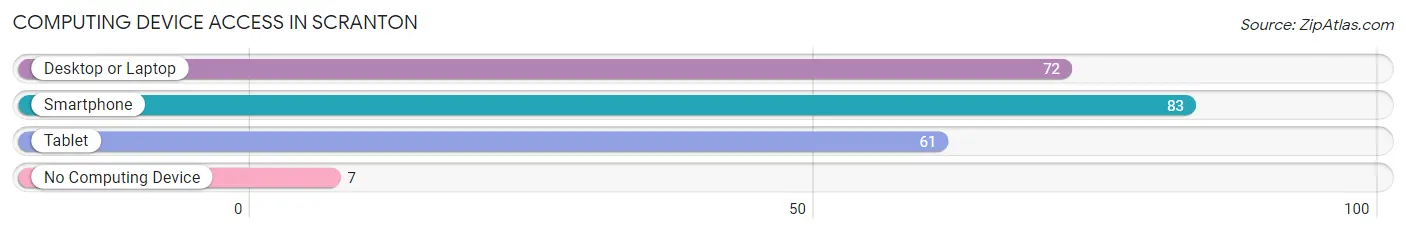
| Device Type | # Households | % Households |
| Desktop or Laptop | 72 | 77.4% |
| Smartphone | 83 | 89.2% |
| Tablet | 61 | 65.6% |
| No Computing Device | 7 | 7.5% |
| Total | 93 | 100.0% |
Internet Access in Scranton
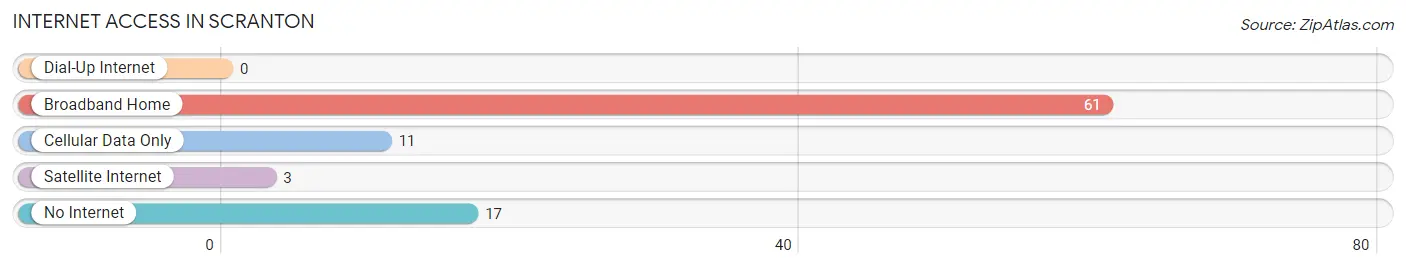
| Internet Type | # Households | % Households |
| Dial-Up Internet | 0 | 0.0% |
| Broadband Home | 61 | 65.6% |
| Cellular Data Only | 11 | 11.8% |
| Satellite Internet | 3 | 3.2% |
| No Internet | 17 | 18.3% |
| Total | 93 | 100.0% |
Scranton Summary
Scranton is a small town located in the northwest corner of Arkansas, in the Ozark Mountains. It is situated in Washington County, and is part of the Fayetteville-Springdale-Rogers Metropolitan Statistical Area. The town has a population of just over 1,000 people, and is known for its rural charm and small-town atmosphere.
History
Scranton was founded in 1881 by a group of settlers from Pennsylvania, who named the town after their hometown of Scranton, Pennsylvania. The town was originally a farming community, and the settlers grew cotton, corn, and other crops. The town was incorporated in 1883, and the first post office was established in 1884.
In the early 1900s, the town began to grow and develop. The first school was built in 1906, and the first bank opened in 1907. The town also had a newspaper, a hotel, and a variety of stores. In the 1920s, the town was connected to the rest of the state by the Arkansas and Ozarks Railway.
Geography
Scranton is located in the northwest corner of Arkansas, in the Ozark Mountains. The town is situated in Washington County, and is part of the Fayetteville-Springdale-Rogers Metropolitan Statistical Area. The town is located at an elevation of 1,072 feet, and has a total area of 1.2 square miles.
The town is surrounded by rolling hills and forests, and is home to a variety of wildlife. The town is located near the White River, and is a popular destination for fishing and other outdoor activities.
Economy
The economy of Scranton is largely based on agriculture and tourism. The town is home to a variety of farms, which produce a variety of crops, including cotton, corn, soybeans, and wheat. The town is also home to a number of small businesses, including restaurants, shops, and other services.
The town is a popular destination for tourists, who come to enjoy the rural charm and small-town atmosphere. The town is home to a variety of attractions, including the Ozark Folk Center State Park, which features a variety of traditional crafts and music.
Demographics
As of the 2010 census, the population of Scranton was 1,072. The town has a median household income of $37,500, and a median age of 39. The town is predominantly white, with a population that is 97.3% white, 0.7% African American, 0.3% Native American, 0.3% Asian, and 1.4% from other races.
Scranton is a small town with a rural charm and a small-town atmosphere. The town is home to a variety of businesses and attractions, and is a popular destination for tourists. The town is also home to a variety of farms, which produce a variety of crops. The town has a population of just over 1,000 people, and is known for its rural charm and small-town atmosphere.
Common Questions
What is Per Capita Income in Scranton?
Per Capita income in Scranton is $33,505.
What is the Median Family Income in Scranton?
Median Family Income in Scranton is $88,125.
What is the Median Household income in Scranton?
Median Household Income in Scranton is $82,750.
What is Income or Wage Gap in Scranton?
Income or Wage Gap in Scranton is 29.9%.
Women in Scranton earn 70.1 cents for every dollar earned by a man.
What is Inequality or Gini Index in Scranton?
Inequality or Gini Index in Scranton is 0.36.
What is the Total Population of Scranton?
Total Population of Scranton is 245.
What is the Total Male Population of Scranton?
Total Male Population of Scranton is 94.
What is the Total Female Population of Scranton?
Total Female Population of Scranton is 151.
What is the Ratio of Males per 100 Females in Scranton?
There are 62.25 Males per 100 Females in Scranton.
What is the Ratio of Females per 100 Males in Scranton?
There are 160.64 Females per 100 Males in Scranton.
What is the Median Population Age in Scranton?
Median Population Age in Scranton is 39.1 Years.
What is the Average Family Size in Scranton
Average Family Size in Scranton is 2.9 People.
What is the Average Household Size in Scranton
Average Household Size in Scranton is 2.6 People.
How Large is the Labor Force in Scranton?
There are 144 People in the Labor Forcein in Scranton.
What is the Percentage of People in the Labor Force in Scranton?
68.9% of People are in the Labor Force in Scranton.
What is the Unemployment Rate in Scranton?
Unemployment Rate in Scranton is 0.7%.