East Moline, IL Map & Demographics
East Moline Map
East Moline Overview
$27,609
PER CAPITA INCOME
$80,364
AVG FAMILY INCOME
$60,032
AVG HOUSEHOLD INCOME
44.0%
WAGE / INCOME GAP [ % ]
56.0¢/ $1
WAGE / INCOME GAP [ $ ]
0.41
INEQUALITY / GINI INDEX
20,937
TOTAL POPULATION
10,074
MALE POPULATION
10,863
FEMALE POPULATION
92.74
MALES / 100 FEMALES
107.83
FEMALES / 100 MALES
39.5
MEDIAN AGE
3.0
AVG FAMILY SIZE
2.4
AVG HOUSEHOLD SIZE
9,600
LABOR FORCE [ PEOPLE ]
58.6%
PERCENT IN LABOR FORCE
4.1%
UNEMPLOYMENT RATE
East Moline Zip Codes
East Moline Area Codes
Income in East Moline
Income Overview in East Moline
Per Capita Income in East Moline is $27,609, while median incomes of families and households are $80,364 and $60,032 respectively.
| Characteristic | Number | Measure |
| Per Capita Income | 20,937 | $27,609 |
| Median Family Income | 5,141 | $80,364 |
| Mean Family Income | 5,141 | $84,863 |
| Median Household Income | 8,275 | $60,032 |
| Mean Household Income | 8,275 | $70,323 |
| Income Deficit | 5,141 | $0 |
| Wage / Income Gap (%) | 20,937 | 44.05% |
| Wage / Income Gap ($) | 20,937 | 55.95¢ per $1 |
| Gini / Inequality Index | 20,937 | 0.41 |
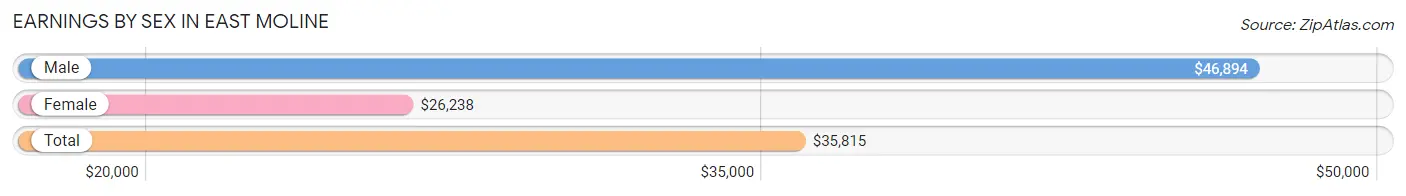
Earnings by Sex in East Moline
Average Earnings in East Moline are $35,815, $46,894 for men and $26,238 for women, a difference of 44.1%.
| Sex | Number | Average Earnings |
| Male | 5,033 (49.6%) | $46,894 |
| Female | 5,109 (50.4%) | $26,238 |
| Total | 10,142 (100.0%) | $35,815 |
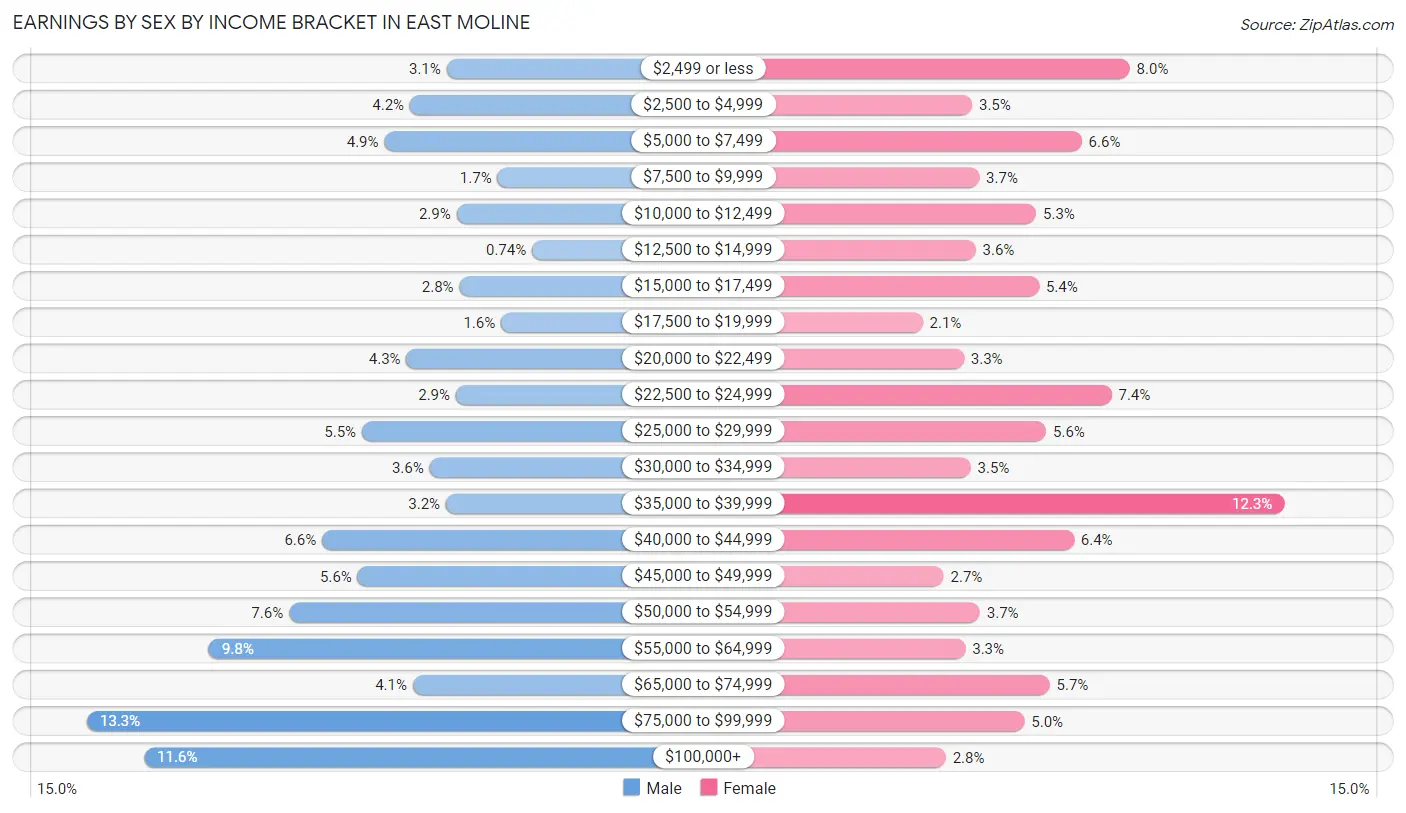
Earnings by Sex by Income Bracket in East Moline
The most common earnings brackets in East Moline are $75,000 to $99,999 for men (667 | 13.3%) and $35,000 to $39,999 for women (628 | 12.3%).
| Income | Male | Female |
| $2,499 or less | 158 (3.1%) | 406 (8.0%) |
| $2,500 to $4,999 | 210 (4.2%) | 180 (3.5%) |
| $5,000 to $7,499 | 246 (4.9%) | 337 (6.6%) |
| $7,500 to $9,999 | 86 (1.7%) | 190 (3.7%) |
| $10,000 to $12,499 | 144 (2.9%) | 272 (5.3%) |
| $12,500 to $14,999 | 37 (0.7%) | 185 (3.6%) |
| $15,000 to $17,499 | 140 (2.8%) | 276 (5.4%) |
| $17,500 to $19,999 | 81 (1.6%) | 109 (2.1%) |
| $20,000 to $22,499 | 215 (4.3%) | 168 (3.3%) |
| $22,500 to $24,999 | 145 (2.9%) | 380 (7.4%) |
| $25,000 to $29,999 | 278 (5.5%) | 286 (5.6%) |
| $30,000 to $34,999 | 182 (3.6%) | 178 (3.5%) |
| $35,000 to $39,999 | 159 (3.2%) | 628 (12.3%) |
| $40,000 to $44,999 | 334 (6.6%) | 326 (6.4%) |
| $45,000 to $49,999 | 284 (5.6%) | 139 (2.7%) |
| $50,000 to $54,999 | 381 (7.6%) | 191 (3.7%) |
| $55,000 to $64,999 | 494 (9.8%) | 170 (3.3%) |
| $65,000 to $74,999 | 206 (4.1%) | 291 (5.7%) |
| $75,000 to $99,999 | 667 (13.3%) | 255 (5.0%) |
| $100,000+ | 586 (11.6%) | 142 (2.8%) |
| Total | 5,033 (100.0%) | 5,109 (100.0%) |
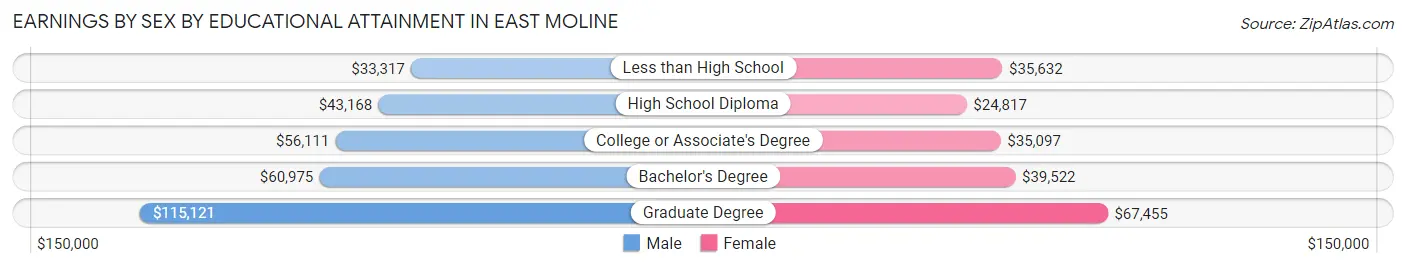
Earnings by Sex by Educational Attainment in East Moline
Average earnings in East Moline are $52,588 for men and $35,056 for women, a difference of 33.3%. Men with an educational attainment of graduate degree enjoy the highest average annual earnings of $115,121, while those with less than high school education earn the least with $33,317. Women with an educational attainment of graduate degree earn the most with the average annual earnings of $67,455, while those with high school diploma education have the smallest earnings of $24,817.
| Educational Attainment | Male Income | Female Income |
| Less than High School | $33,317 | $35,632 |
| High School Diploma | $43,168 | $24,817 |
| College or Associate's Degree | $56,111 | $35,097 |
| Bachelor's Degree | $60,975 | $39,522 |
| Graduate Degree | $115,121 | $67,455 |
| Total | $52,588 | $35,056 |
Family Income in East Moline
Family Income Brackets in East Moline
According to the East Moline family income data, there are 1,059 families falling into the $75,000 to $99,999 income range, which is the most common income bracket and makes up 20.6% of all families. Conversely, the $10,000 to $14,999 income bracket is the least frequent group with only 170 families (3.3%) belonging to this category.
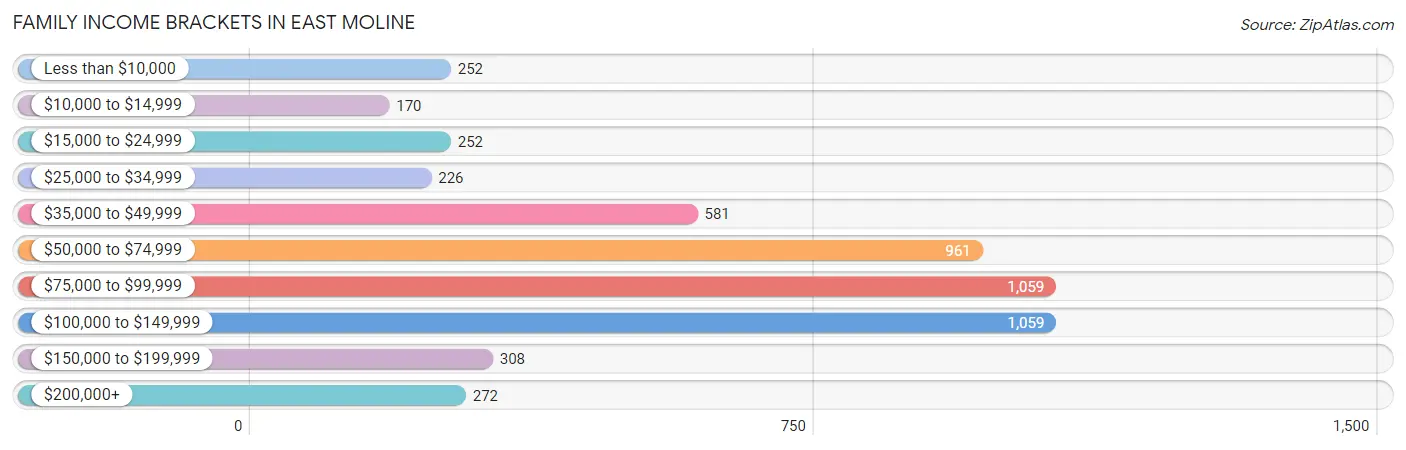
| Income Bracket | # Families | % Families |
| Less than $10,000 | 252 | 4.9% |
| $10,000 to $14,999 | 170 | 3.3% |
| $15,000 to $24,999 | 252 | 4.9% |
| $25,000 to $34,999 | 226 | 4.4% |
| $35,000 to $49,999 | 581 | 11.3% |
| $50,000 to $74,999 | 961 | 18.7% |
| $75,000 to $99,999 | 1,059 | 20.6% |
| $100,000 to $149,999 | 1,059 | 20.6% |
| $150,000 to $199,999 | 308 | 6.0% |
| $200,000+ | 272 | 5.3% |
Family Income by Famaliy Size in East Moline
6-person families (148 | 2.9%) account for the highest median family income in East Moline with $110,476 per family, while 2-person families (2,556 | 49.7%) have the highest median income of $35,328 per family member.
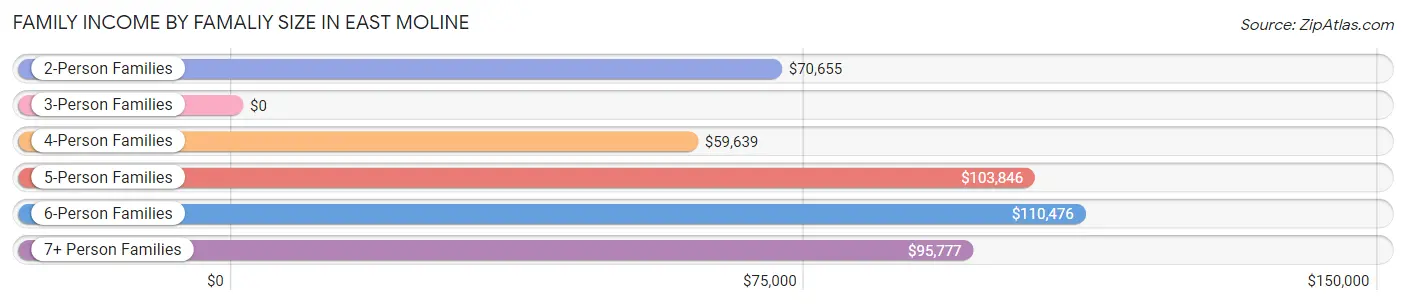
| Income Bracket | # Families | Median Income |
| 2-Person Families | 2,556 (49.7%) | $70,655 |
| 3-Person Families | 843 (16.4%) | $0 |
| 4-Person Families | 942 (18.3%) | $59,639 |
| 5-Person Families | 550 (10.7%) | $103,846 |
| 6-Person Families | 148 (2.9%) | $110,476 |
| 7+ Person Families | 102 (2.0%) | $95,777 |
| Total | 5,141 (100.0%) | $80,364 |
Family Income by Number of Earners in East Moline
The median family income in East Moline is $80,364, with families comprising 3+ earners (721) having the highest median family income of $101,445, while families with 1 earner (1,464) have the lowest median family income of $41,844, accounting for 14.0% and 28.5% of families, respectively.
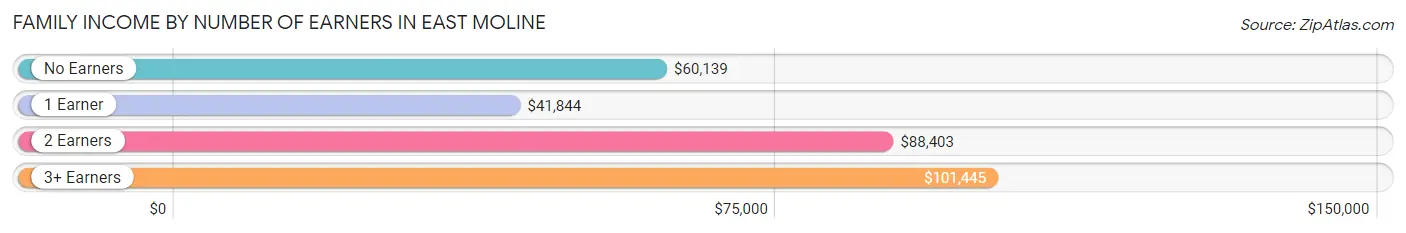
| Number of Earners | # Families | Median Income |
| No Earners | 729 (14.2%) | $60,139 |
| 1 Earner | 1,464 (28.5%) | $41,844 |
| 2 Earners | 2,227 (43.3%) | $88,403 |
| 3+ Earners | 721 (14.0%) | $101,445 |
| Total | 5,141 (100.0%) | $80,364 |
Household Income in East Moline
Household Income Brackets in East Moline
With 1,564 households falling in the category, the $50,000 to $74,999 income range is the most frequent in East Moline, accounting for 18.9% of all households. In contrast, only 273 households (3.3%) fall into the $200,000+ income bracket, making it the least populous group.
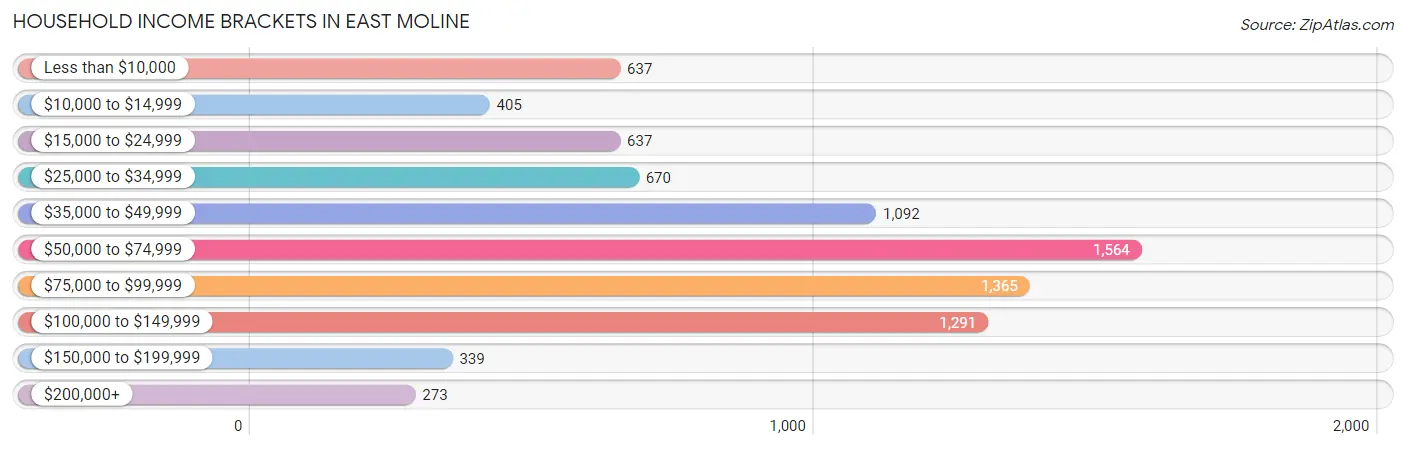
| Income Bracket | # Households | % Households |
| Less than $10,000 | 637 | 7.7% |
| $10,000 to $14,999 | 405 | 4.9% |
| $15,000 to $24,999 | 637 | 7.7% |
| $25,000 to $34,999 | 670 | 8.1% |
| $35,000 to $49,999 | 1,092 | 13.2% |
| $50,000 to $74,999 | 1,564 | 18.9% |
| $75,000 to $99,999 | 1,365 | 16.5% |
| $100,000 to $149,999 | 1,291 | 15.6% |
| $150,000 to $199,999 | 339 | 4.1% |
| $200,000+ | 273 | 3.3% |
Household Income by Householder Age in East Moline
The median household income in East Moline is $60,032, with the highest median household income of $78,200 found in the 45 to 64 years age bracket for the primary householder. A total of 2,798 households (33.8%) fall into this category. Meanwhile, the 15 to 24 years age bracket for the primary householder has the lowest median household income of $22,125, with 310 households (3.7%) in this group.
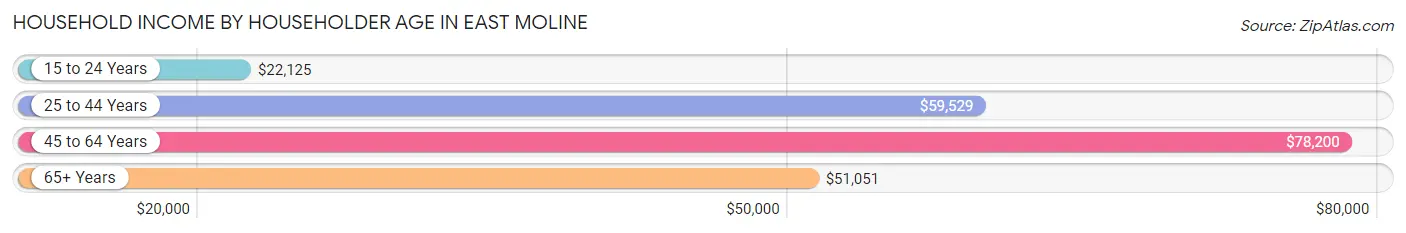
| Income Bracket | # Households | Median Income |
| 15 to 24 Years | 310 (3.7%) | $22,125 |
| 25 to 44 Years | 2,847 (34.4%) | $59,529 |
| 45 to 64 Years | 2,798 (33.8%) | $78,200 |
| 65+ Years | 2,320 (28.0%) | $51,051 |
| Total | 8,275 (100.0%) | $60,032 |
Poverty in East Moline
Income Below Poverty by Sex and Age in East Moline
With 14.6% poverty level for males and 15.6% for females among the residents of East Moline, under 5 year old males and 5 year old females are the most vulnerable to poverty, with 231 males (37.5%) and 47 females (82.5%) in their respective age groups living below the poverty level.
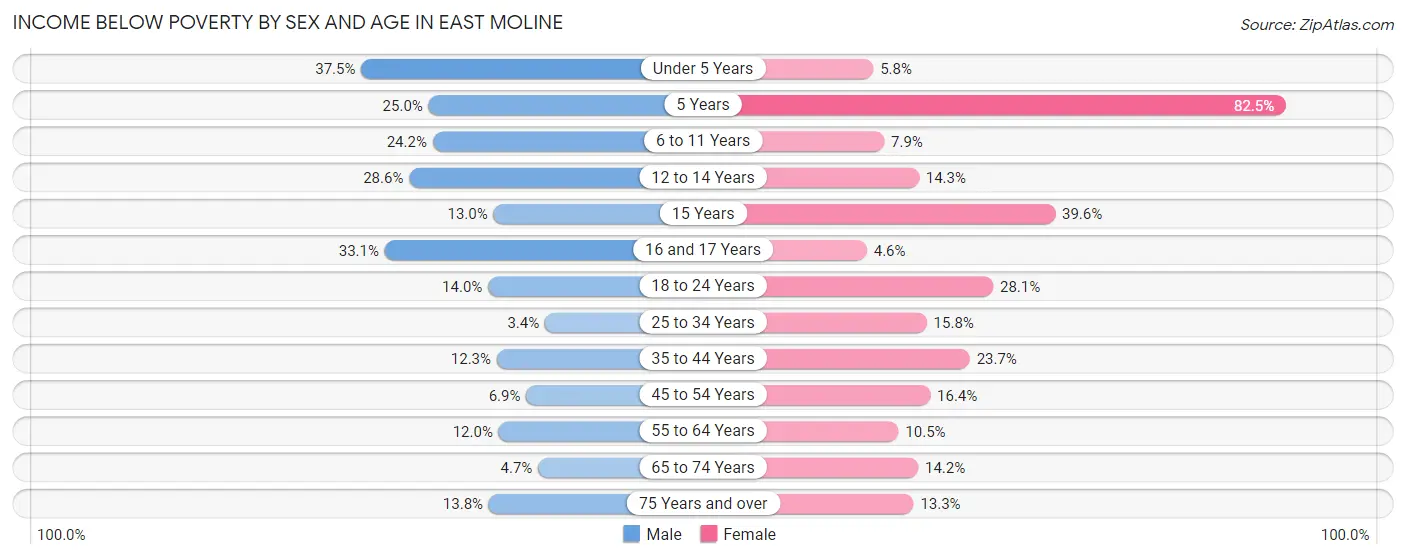
| Age Bracket | Male | Female |
| Under 5 Years | 231 (37.5%) | 42 (5.8%) |
| 5 Years | 15 (25.0%) | 47 (82.5%) |
| 6 to 11 Years | 222 (24.2%) | 76 (7.9%) |
| 12 to 14 Years | 111 (28.6%) | 82 (14.3%) |
| 15 Years | 25 (13.0%) | 19 (39.6%) |
| 16 and 17 Years | 114 (33.1%) | 13 (4.6%) |
| 18 to 24 Years | 85 (14.0%) | 238 (28.1%) |
| 25 to 34 Years | 32 (3.4%) | 160 (15.8%) |
| 35 to 44 Years | 146 (12.3%) | 353 (23.7%) |
| 45 to 54 Years | 86 (6.9%) | 231 (16.4%) |
| 55 to 64 Years | 115 (12.0%) | 143 (10.5%) |
| 65 to 74 Years | 43 (4.7%) | 103 (14.1%) |
| 75 Years and over | 64 (13.8%) | 149 (13.3%) |
| Total | 1,289 (14.6%) | 1,656 (15.6%) |
Income Above Poverty by Sex and Age in East Moline
According to the poverty statistics in East Moline, males aged 25 to 34 years and females aged 16 and 17 years are the age groups that are most secure financially, with 96.6% of males and 95.4% of females in these age groups living above the poverty line.
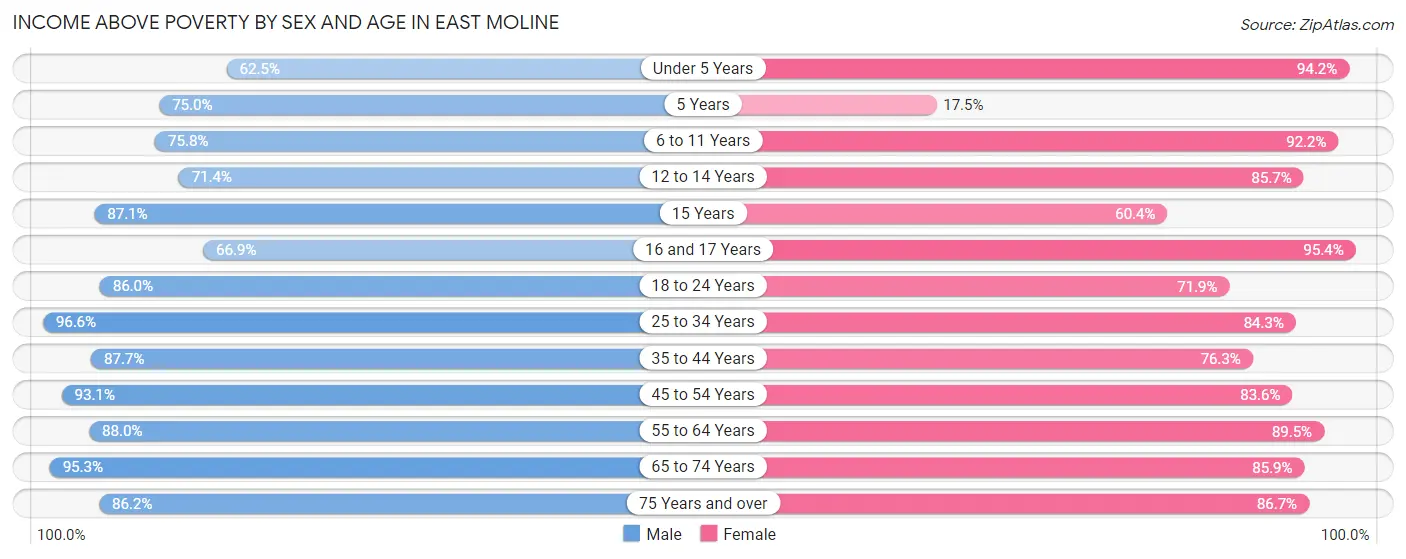
| Age Bracket | Male | Female |
| Under 5 Years | 385 (62.5%) | 677 (94.2%) |
| 5 Years | 45 (75.0%) | 10 (17.5%) |
| 6 to 11 Years | 694 (75.8%) | 892 (92.1%) |
| 12 to 14 Years | 277 (71.4%) | 492 (85.7%) |
| 15 Years | 168 (87.1%) | 29 (60.4%) |
| 16 and 17 Years | 230 (66.9%) | 267 (95.4%) |
| 18 to 24 Years | 524 (86.0%) | 610 (71.9%) |
| 25 to 34 Years | 910 (96.6%) | 856 (84.3%) |
| 35 to 44 Years | 1,037 (87.7%) | 1,134 (76.3%) |
| 45 to 54 Years | 1,165 (93.1%) | 1,178 (83.6%) |
| 55 to 64 Years | 844 (88.0%) | 1,217 (89.5%) |
| 65 to 74 Years | 878 (95.3%) | 625 (85.9%) |
| 75 Years and over | 399 (86.2%) | 971 (86.7%) |
| Total | 7,556 (85.4%) | 8,958 (84.4%) |
Income Below Poverty Among Married-Couple Families in East Moline
The poverty statistics for married-couple families in East Moline show that 4.7% or 161 of the total 3,452 families live below the poverty line. Families with 3 or 4 children have the highest poverty rate of 7.5%, comprising of 27 families. On the other hand, families with 5 or more children have the lowest poverty rate of 0.0%, which includes 0 families.
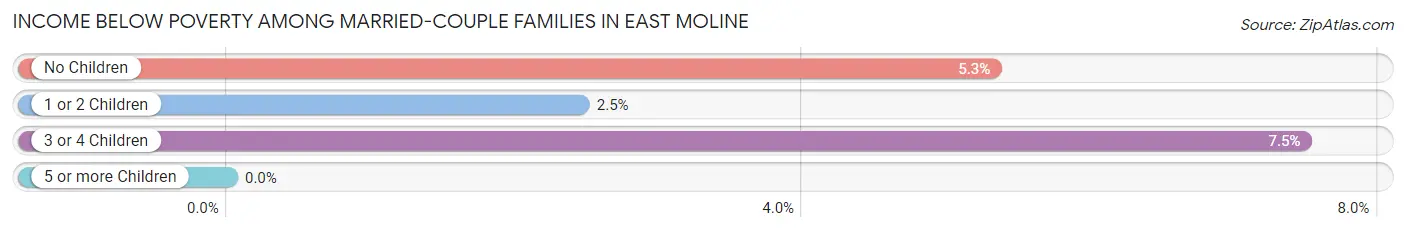
| Children | Above Poverty | Below Poverty |
| No Children | 1,995 (94.7%) | 112 (5.3%) |
| 1 or 2 Children | 877 (97.6%) | 22 (2.5%) |
| 3 or 4 Children | 334 (92.5%) | 27 (7.5%) |
| 5 or more Children | 85 (100.0%) | 0 (0.0%) |
| Total | 3,291 (95.3%) | 161 (4.7%) |
Income Below Poverty Among Single-Parent Households in East Moline
According to the poverty data in East Moline, 1.7% or 7 single-father households and 35.5% or 455 single-mother households are living below the poverty line. Among single-father households, those with 1 or 2 children have the highest poverty rate, with 7 households (6.0%) experiencing poverty. Likewise, among single-mother households, those with 5 or more children have the highest poverty rate, with 17 households (100.0%) falling below the poverty line.
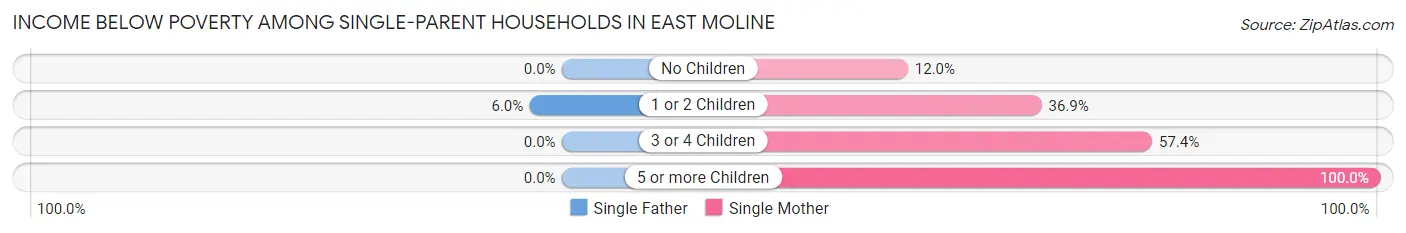
| Children | Single Father | Single Mother |
| No Children | 0 (0.0%) | 33 (12.0%) |
| 1 or 2 Children | 7 (6.0%) | 293 (36.9%) |
| 3 or 4 Children | 0 (0.0%) | 112 (57.4%) |
| 5 or more Children | 0 (0.0%) | 17 (100.0%) |
| Total | 7 (1.7%) | 455 (35.5%) |
Income Below Poverty Among Married-Couple vs Single-Parent Households in East Moline
The poverty data for East Moline shows that 161 of the married-couple family households (4.7%) and 462 of the single-parent households (27.4%) are living below the poverty level. Within the married-couple family households, those with 3 or 4 children have the highest poverty rate, with 27 households (7.5%) falling below the poverty line. Among the single-parent households, those with 5 or more children have the highest poverty rate, with 17 household (100.0%) living below poverty.
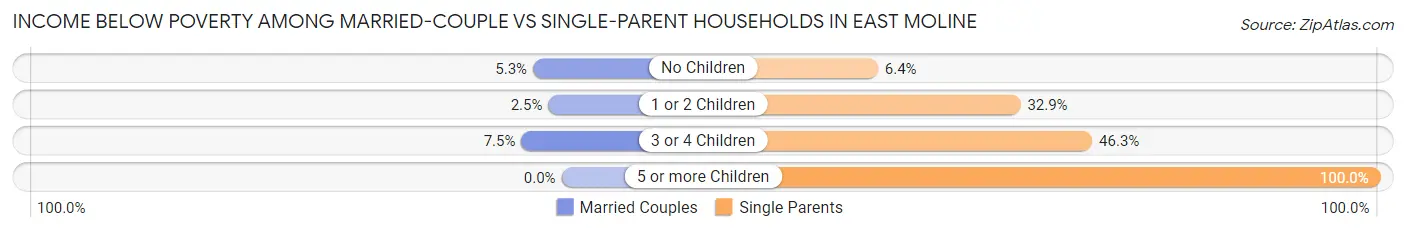
| Children | Married-Couple Families | Single-Parent Households |
| No Children | 112 (5.3%) | 33 (6.4%) |
| 1 or 2 Children | 22 (2.5%) | 300 (32.9%) |
| 3 or 4 Children | 27 (7.5%) | 112 (46.3%) |
| 5 or more Children | 0 (0.0%) | 17 (100.0%) |
| Total | 161 (4.7%) | 462 (27.4%) |
Race in East Moline
The most populous races in East Moline are White / Caucasian (13,270 | 63.4%), Hispanic or Latino (4,014 | 19.2%), and Black / African American (3,845 | 18.4%).
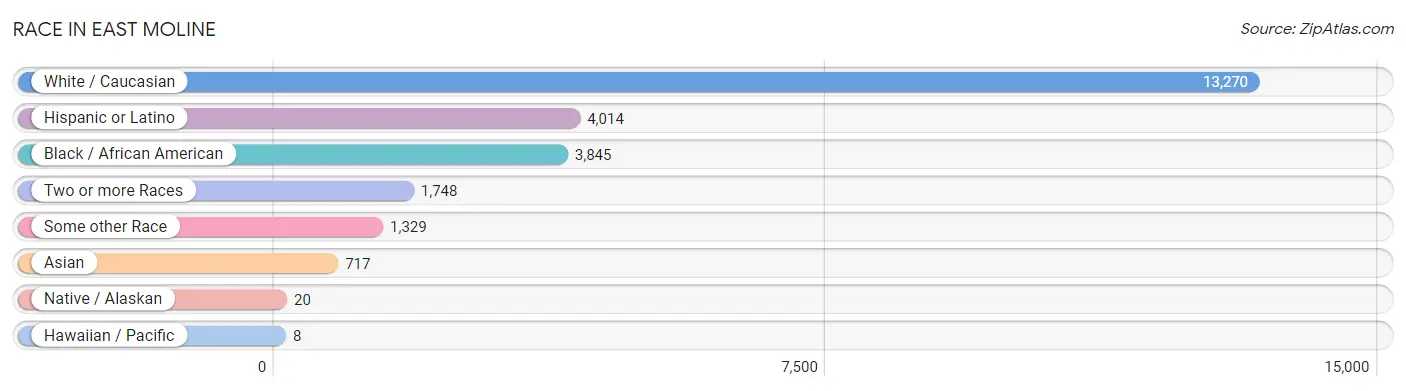
| Race | # Population | % Population |
| Asian | 717 | 3.4% |
| Black / African American | 3,845 | 18.4% |
| Hawaiian / Pacific | 8 | 0.0% |
| Hispanic or Latino | 4,014 | 19.2% |
| Native / Alaskan | 20 | 0.1% |
| White / Caucasian | 13,270 | 63.4% |
| Two or more Races | 1,748 | 8.4% |
| Some other Race | 1,329 | 6.4% |
| Total | 20,937 | 100.0% |
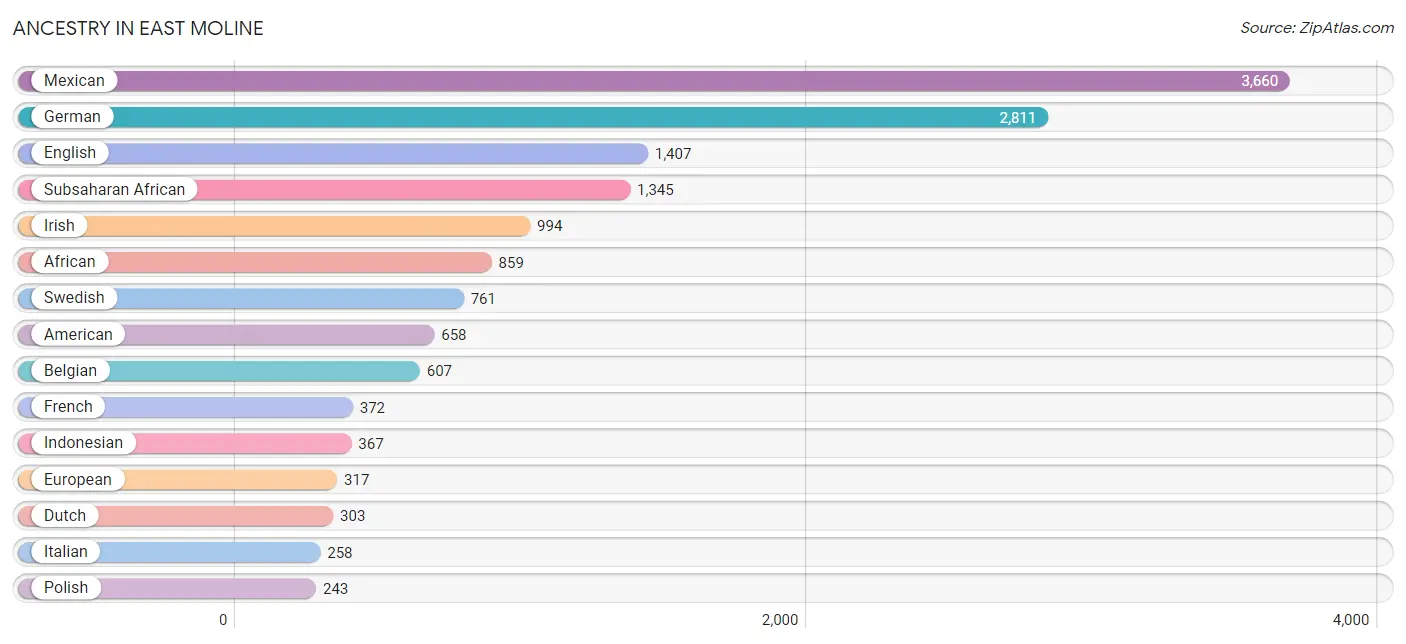
Ancestry in East Moline
The most populous ancestries reported in East Moline are Mexican (3,660 | 17.5%), German (2,811 | 13.4%), English (1,407 | 6.7%), Subsaharan African (1,345 | 6.4%), and Irish (994 | 4.8%), together accounting for 48.8% of all East Moline residents.
| Ancestry | # Population | % Population |
| African | 859 | 4.1% |
| American | 658 | 3.1% |
| Arab | 29 | 0.1% |
| Belgian | 607 | 2.9% |
| Bhutanese | 12 | 0.1% |
| Blackfeet | 50 | 0.2% |
| British | 108 | 0.5% |
| Cambodian | 155 | 0.7% |
| Canadian | 35 | 0.2% |
| Central American | 41 | 0.2% |
| Cherokee | 37 | 0.2% |
| Choctaw | 37 | 0.2% |
| Croatian | 77 | 0.4% |
| Cuban | 16 | 0.1% |
| Czech | 34 | 0.2% |
| Czechoslovakian | 43 | 0.2% |
| Danish | 114 | 0.5% |
| Dutch | 303 | 1.5% |
| Ecuadorian | 56 | 0.3% |
| English | 1,407 | 6.7% |
| European | 317 | 1.5% |
| Finnish | 25 | 0.1% |
| French | 372 | 1.8% |
| French Canadian | 11 | 0.1% |
| German | 2,811 | 13.4% |
| Guamanian / Chamorro | 8 | 0.0% |
| Haitian | 8 | 0.0% |
| Honduran | 22 | 0.1% |
| Hungarian | 23 | 0.1% |
| Indian (Asian) | 177 | 0.9% |
| Indonesian | 367 | 1.8% |
| Irish | 994 | 4.8% |
| Italian | 258 | 1.2% |
| Jamaican | 50 | 0.2% |
| Korean | 7 | 0.0% |
| Lithuanian | 6 | 0.0% |
| Mexican | 3,660 | 17.5% |
| Mexican American Indian | 8 | 0.0% |
| Moroccan | 9 | 0.0% |
| Nigerian | 28 | 0.1% |
| Northern European | 16 | 0.1% |
| Norwegian | 192 | 0.9% |
| Panamanian | 13 | 0.1% |
| Pennsylvania German | 12 | 0.1% |
| Polish | 243 | 1.2% |
| Puerto Rican | 173 | 0.8% |
| Russian | 21 | 0.1% |
| Salvadoran | 6 | 0.0% |
| Scandinavian | 57 | 0.3% |
| Scotch-Irish | 157 | 0.7% |
| Scottish | 199 | 0.9% |
| Serbian | 41 | 0.2% |
| Sioux | 41 | 0.2% |
| Slavic | 9 | 0.0% |
| Slovene | 8 | 0.0% |
| South American | 56 | 0.3% |
| Spanish | 7 | 0.0% |
| Sri Lankan | 36 | 0.2% |
| Subsaharan African | 1,345 | 6.4% |
| Sudanese | 7 | 0.0% |
| Swedish | 761 | 3.6% |
| Swiss | 46 | 0.2% |
| Thai | 227 | 1.1% |
| Welsh | 225 | 1.1% | View All 64 Rows |
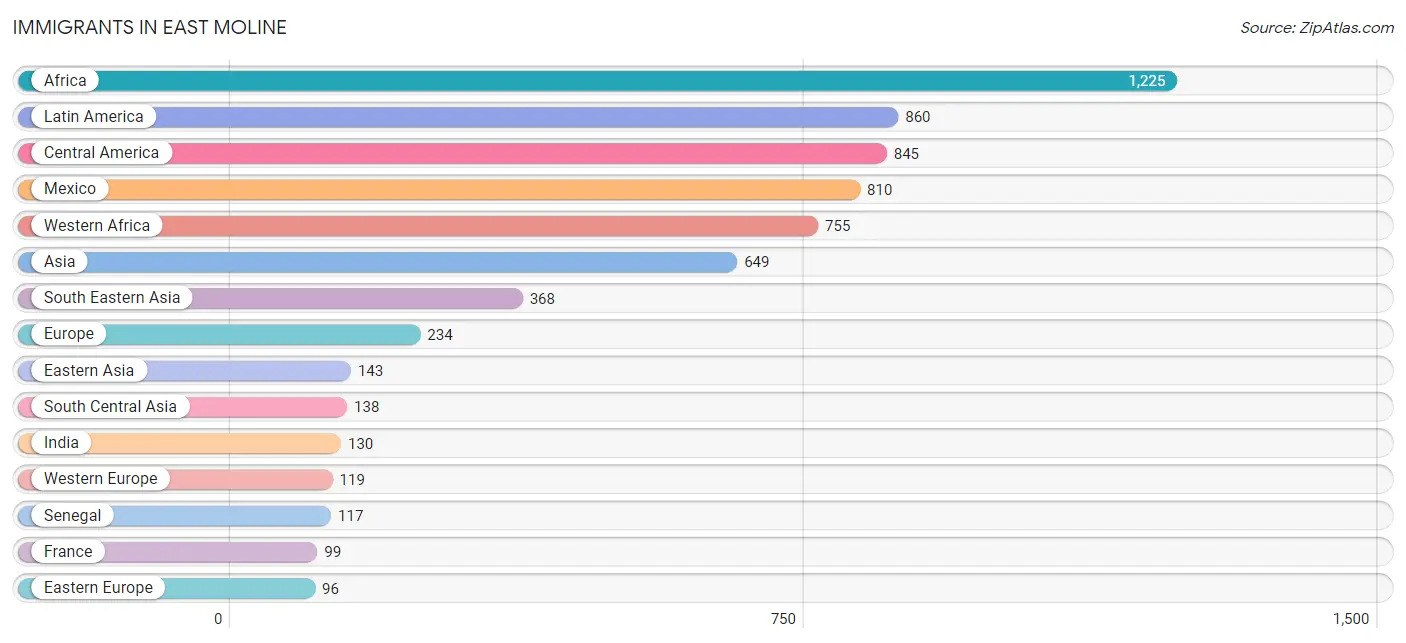
Immigrants in East Moline
The most numerous immigrant groups reported in East Moline came from Africa (1,225 | 5.9%), Latin America (860 | 4.1%), Central America (845 | 4.0%), Mexico (810 | 3.9%), and Western Africa (755 | 3.6%), together accounting for 21.5% of all East Moline residents.
| Immigration Origin | # Population | % Population |
| Africa | 1,225 | 5.9% |
| Asia | 649 | 3.1% |
| Canada | 26 | 0.1% |
| Caribbean | 9 | 0.0% |
| Central America | 845 | 4.0% |
| China | 33 | 0.2% |
| Eastern Asia | 143 | 0.7% |
| Eastern Europe | 96 | 0.5% |
| Ecuador | 6 | 0.0% |
| England | 19 | 0.1% |
| Europe | 234 | 1.1% |
| France | 99 | 0.5% |
| Germany | 20 | 0.1% |
| Honduras | 22 | 0.1% |
| India | 130 | 0.6% |
| Jamaica | 9 | 0.0% |
| Japan | 26 | 0.1% |
| Latin America | 860 | 4.1% |
| Liberia | 67 | 0.3% |
| Malaysia | 49 | 0.2% |
| Mexico | 810 | 3.9% |
| Middle Africa | 12 | 0.1% |
| Morocco | 9 | 0.0% |
| Nigeria | 16 | 0.1% |
| Northern Africa | 29 | 0.1% |
| Northern Europe | 19 | 0.1% |
| Pakistan | 8 | 0.0% |
| Panama | 13 | 0.1% |
| Philippines | 12 | 0.1% |
| Poland | 96 | 0.5% |
| Senegal | 117 | 0.6% |
| South America | 6 | 0.0% |
| South Central Asia | 138 | 0.7% |
| South Eastern Asia | 368 | 1.8% |
| Sudan | 20 | 0.1% |
| Western Africa | 755 | 3.6% |
| Western Europe | 119 | 0.6% | View All 37 Rows |
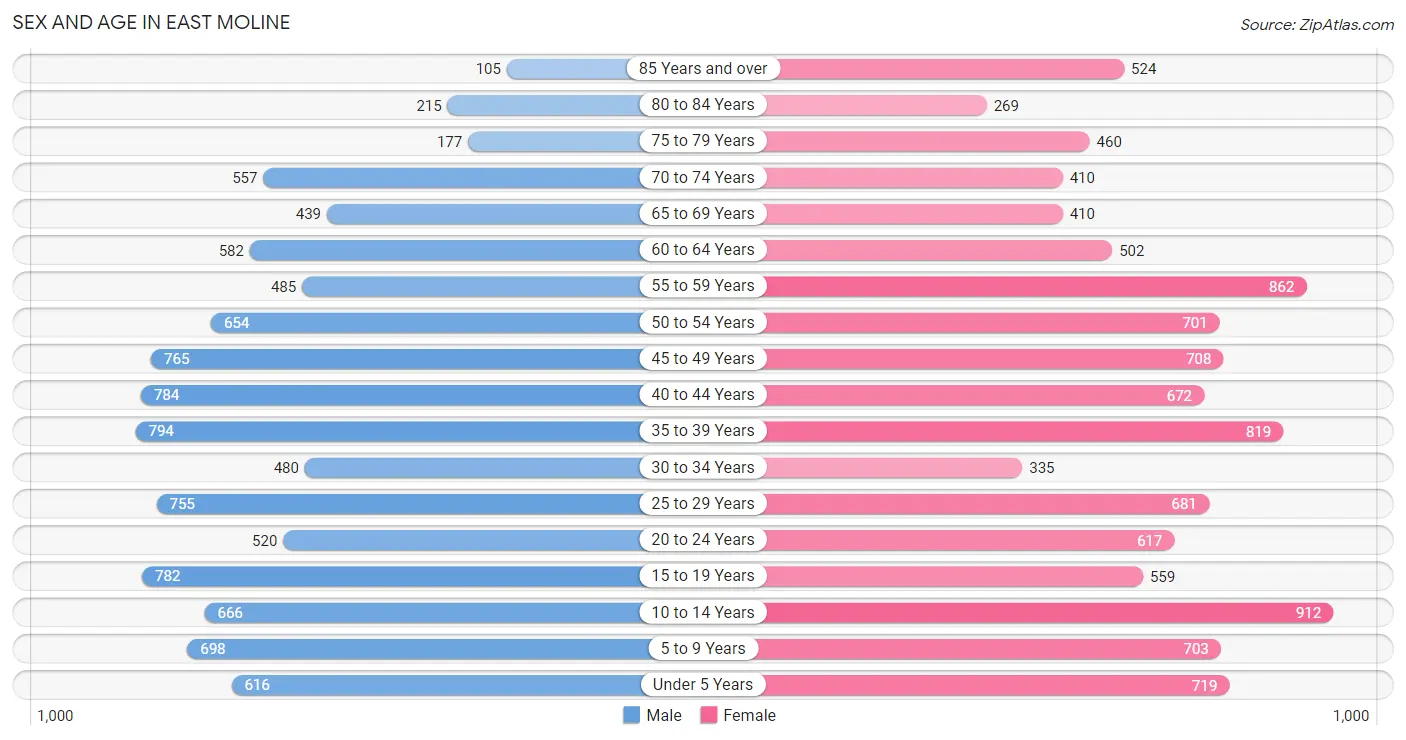
Sex and Age in East Moline
Sex and Age in East Moline
The most populous age groups in East Moline are 35 to 39 Years (794 | 7.9%) for men and 10 to 14 Years (912 | 8.4%) for women.
| Age Bracket | Male | Female |
| Under 5 Years | 616 (6.1%) | 719 (6.6%) |
| 5 to 9 Years | 698 (6.9%) | 703 (6.5%) |
| 10 to 14 Years | 666 (6.6%) | 912 (8.4%) |
| 15 to 19 Years | 782 (7.8%) | 559 (5.1%) |
| 20 to 24 Years | 520 (5.2%) | 617 (5.7%) |
| 25 to 29 Years | 755 (7.5%) | 681 (6.3%) |
| 30 to 34 Years | 480 (4.8%) | 335 (3.1%) |
| 35 to 39 Years | 794 (7.9%) | 819 (7.5%) |
| 40 to 44 Years | 784 (7.8%) | 672 (6.2%) |
| 45 to 49 Years | 765 (7.6%) | 708 (6.5%) |
| 50 to 54 Years | 654 (6.5%) | 701 (6.5%) |
| 55 to 59 Years | 485 (4.8%) | 862 (7.9%) |
| 60 to 64 Years | 582 (5.8%) | 502 (4.6%) |
| 65 to 69 Years | 439 (4.4%) | 410 (3.8%) |
| 70 to 74 Years | 557 (5.5%) | 410 (3.8%) |
| 75 to 79 Years | 177 (1.8%) | 460 (4.2%) |
| 80 to 84 Years | 215 (2.1%) | 269 (2.5%) |
| 85 Years and over | 105 (1.0%) | 524 (4.8%) |
| Total | 10,074 (100.0%) | 10,863 (100.0%) |
Families and Households in East Moline
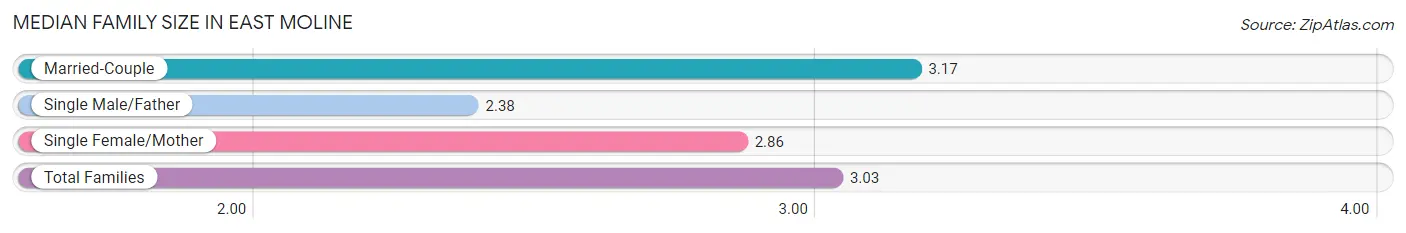
Median Family Size in East Moline
The median family size in East Moline is 3.03 persons per family, with married-couple families (3,452 | 67.1%) accounting for the largest median family size of 3.17 persons per family. On the other hand, single male/father families (406 | 7.9%) represent the smallest median family size with 2.38 persons per family.
| Family Type | # Families | Family Size |
| Married-Couple | 3,452 (67.1%) | 3.17 |
| Single Male/Father | 406 (7.9%) | 2.38 |
| Single Female/Mother | 1,283 (25.0%) | 2.86 |
| Total Families | 5,141 (100.0%) | 3.03 |
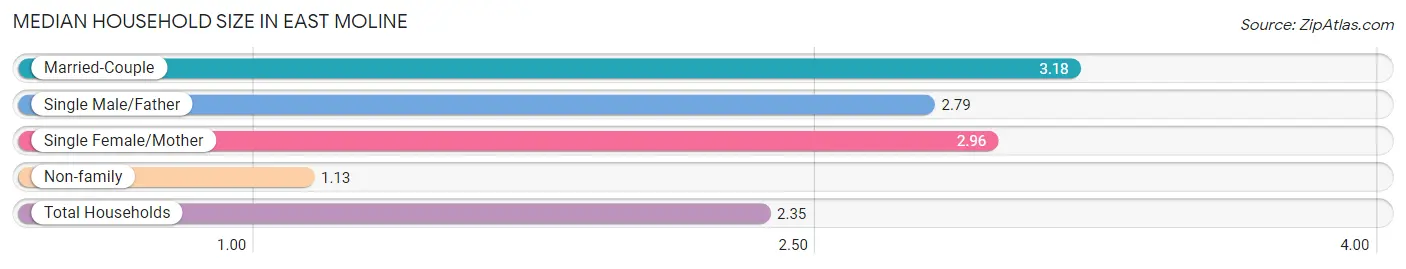
Median Household Size in East Moline
The median household size in East Moline is 2.35 persons per household, with married-couple households (3,452 | 41.7%) accounting for the largest median household size of 3.18 persons per household. non-family households (3,134 | 37.9%) represent the smallest median household size with 1.13 persons per household.
| Household Type | # Households | Household Size |
| Married-Couple | 3,452 (41.7%) | 3.18 |
| Single Male/Father | 406 (4.9%) | 2.79 |
| Single Female/Mother | 1,283 (15.5%) | 2.96 |
| Non-family | 3,134 (37.9%) | 1.13 |
| Total Households | 8,275 (100.0%) | 2.35 |
Household Size by Marriage Status in East Moline
Out of a total of 8,275 households in East Moline, 5,141 (62.1%) are family households, while 3,134 (37.9%) are nonfamily households. The most numerous type of family households are 2-person households, comprising 2,400, and the most common type of nonfamily households are 1-person households, comprising 2,751.
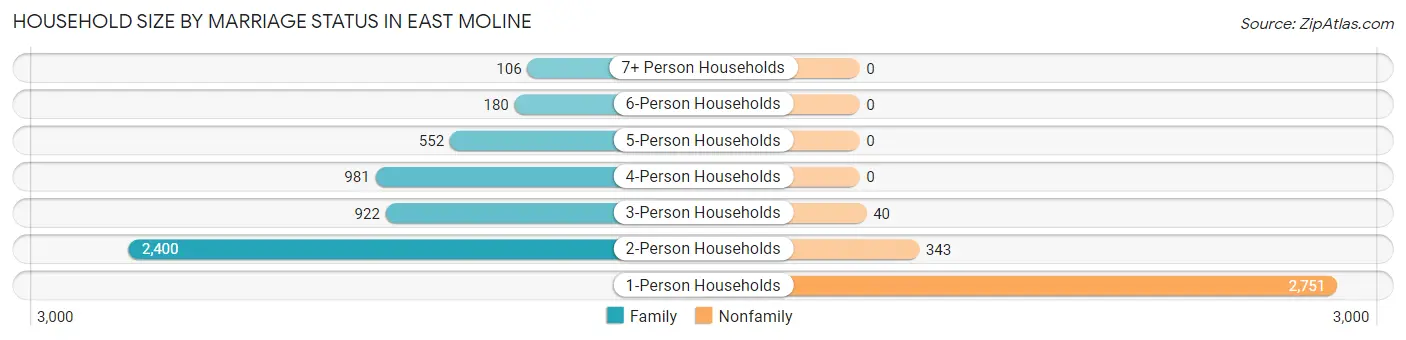
| Household Size | Family Households | Nonfamily Households |
| 1-Person Households | - | 2,751 (33.2%) |
| 2-Person Households | 2,400 (29.0%) | 343 (4.2%) |
| 3-Person Households | 922 (11.1%) | 40 (0.5%) |
| 4-Person Households | 981 (11.8%) | 0 (0.0%) |
| 5-Person Households | 552 (6.7%) | 0 (0.0%) |
| 6-Person Households | 180 (2.2%) | 0 (0.0%) |
| 7+ Person Households | 106 (1.3%) | 0 (0.0%) |
| Total | 5,141 (62.1%) | 3,134 (37.9%) |
Female Fertility in East Moline
Fertility by Age in East Moline
Average fertility rate in East Moline is 37.0 births per 1,000 women. Women in the age bracket of 20 to 34 years have the highest fertility rate with 76.0 births per 1,000 women. Women in the age bracket of 20 to 34 years acount for 73.8% of all women with births.
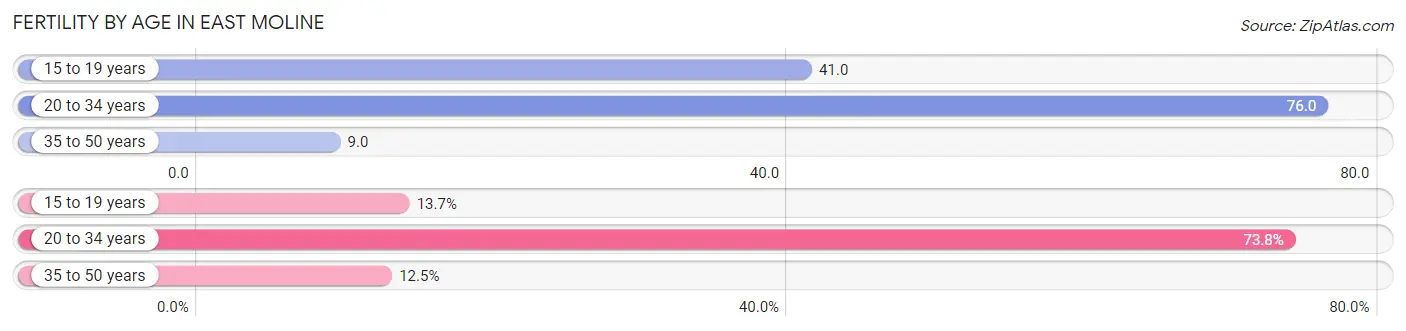
| Age Bracket | Women with Births | Births / 1,000 Women |
| 15 to 19 years | 23 (13.7%) | 41.0 |
| 20 to 34 years | 124 (73.8%) | 76.0 |
| 35 to 50 years | 21 (12.5%) | 9.0 |
| Total | 168 (100.0%) | 37.0 |
Fertility by Age by Marriage Status in East Moline
78.0% of women with births (168) in East Moline are married. The highest percentage of unmarried women with births falls into 15 to 19 years age bracket with 100.0% of them unmarried at the time of birth, while the lowest percentage of unmarried women with births belong to 20 to 34 years age bracket with 8.1% of them unmarried.
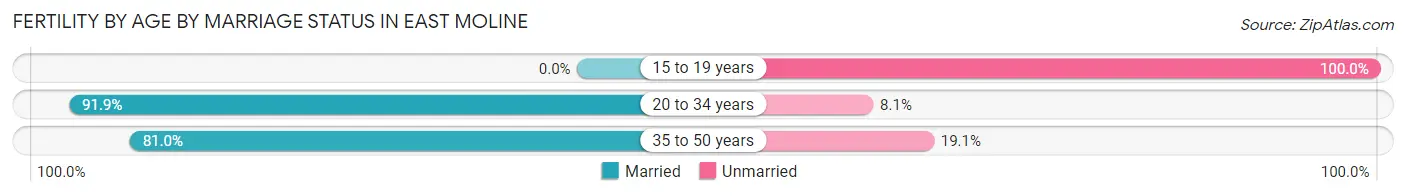
| Age Bracket | Married | Unmarried |
| 15 to 19 years | 0 (0.0%) | 23 (100.0%) |
| 20 to 34 years | 114 (91.9%) | 10 (8.1%) |
| 35 to 50 years | 17 (80.9%) | 4 (19.1%) |
| Total | 131 (78.0%) | 37 (22.0%) |
Fertility by Education in East Moline
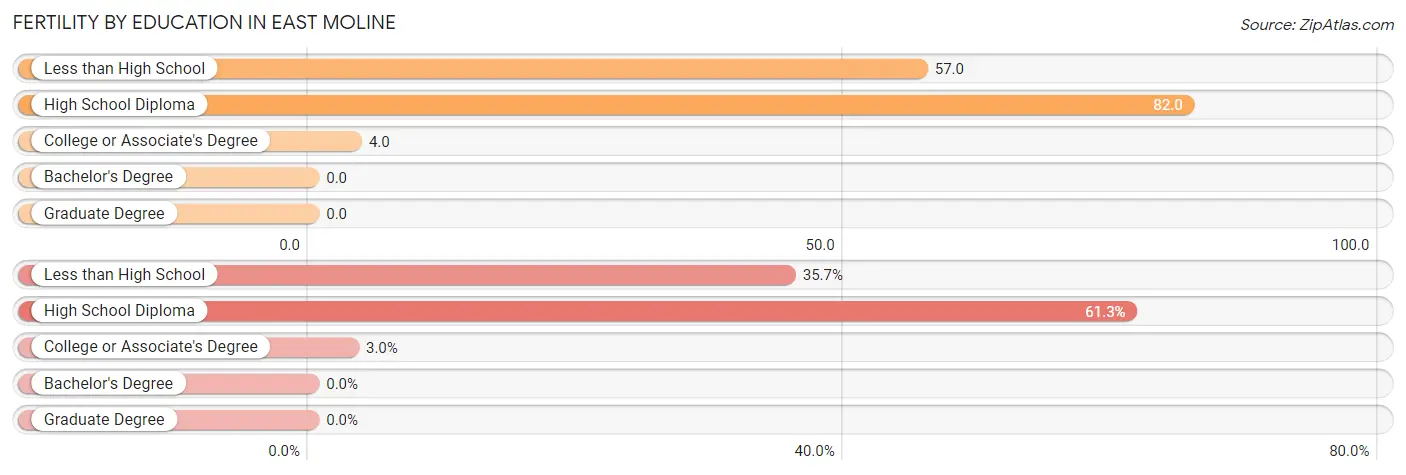
| Educational Attainment | Women with Births | Births / 1,000 Women |
| Less than High School | 60 (35.7%) | 57.0 |
| High School Diploma | 103 (61.3%) | 82.0 |
| College or Associate's Degree | 5 (3.0%) | 4.0 |
| Bachelor's Degree | 0 (0.0%) | 0.0 |
| Graduate Degree | 0 (0.0%) | 0.0 |
| Total | 168 (100.0%) | 37.0 |
Fertility by Education by Marriage Status in East Moline
22.0% of women with births in East Moline are unmarried. Women with the educational attainment of college or associate's degree are most likely to be married with 100.0% of them married at childbirth, while women with the educational attainment of less than high school are least likely to be married with 45.0% of them unmarried at childbirth.
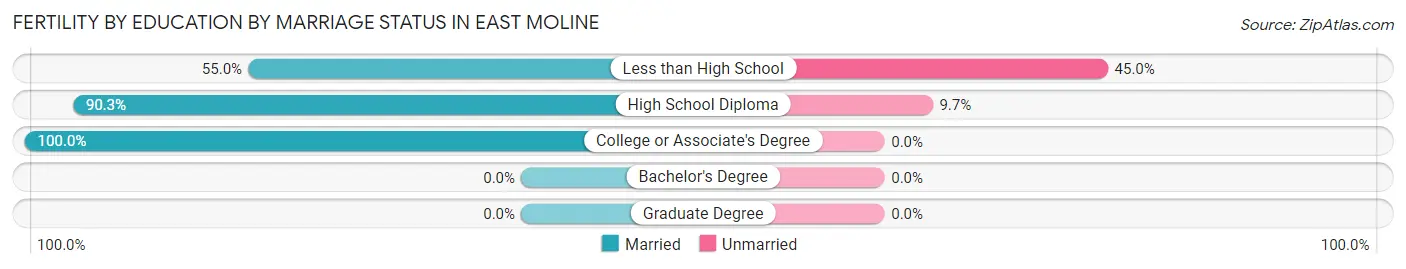
| Educational Attainment | Married | Unmarried |
| Less than High School | 33 (55.0%) | 27 (45.0%) |
| High School Diploma | 93 (90.3%) | 10 (9.7%) |
| College or Associate's Degree | 5 (100.0%) | 0 (0.0%) |
| Bachelor's Degree | 0 (0.0%) | 0 (0.0%) |
| Graduate Degree | 0 (0.0%) | 0 (0.0%) |
| Total | 131 (78.0%) | 37 (22.0%) |
Employment Characteristics in East Moline
Employment by Class of Employer in East Moline
Among the 8,795 employed individuals in East Moline, private company employees (6,407 | 72.9%), not-for-profit organizations (644 | 7.3%), and local government employees (498 | 5.7%) make up the most common classes of employment.
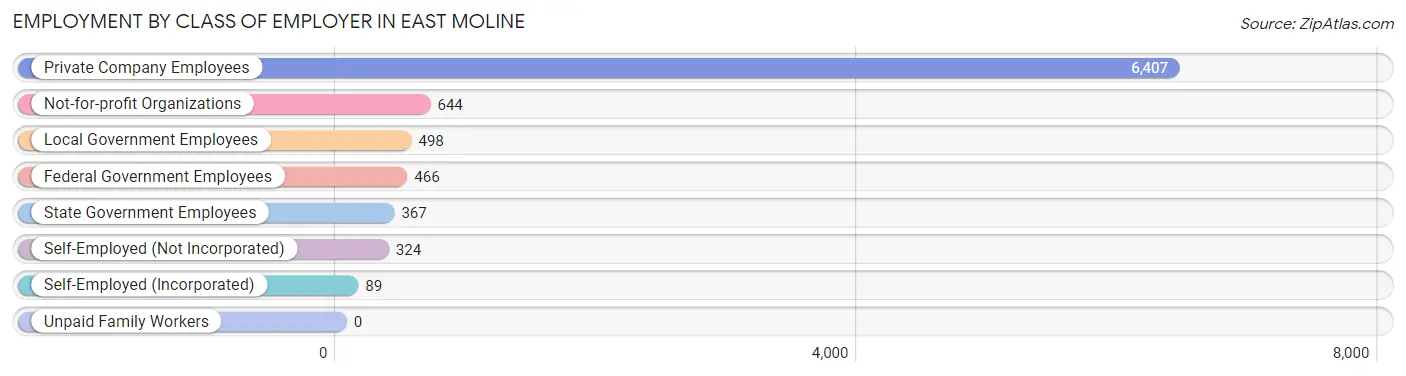
| Employer Class | # Employees | % Employees |
| Private Company Employees | 6,407 | 72.9% |
| Self-Employed (Incorporated) | 89 | 1.0% |
| Self-Employed (Not Incorporated) | 324 | 3.7% |
| Not-for-profit Organizations | 644 | 7.3% |
| Local Government Employees | 498 | 5.7% |
| State Government Employees | 367 | 4.2% |
| Federal Government Employees | 466 | 5.3% |
| Unpaid Family Workers | 0 | 0.0% |
| Total | 8,795 | 100.0% |
Employment Status by Age in East Moline
According to the labor force statistics for East Moline, out of the total population over 16 years of age (16,382), 58.6% or 9,600 individuals are in the labor force, with 4.1% or 394 of them unemployed. The age group with the highest labor force participation rate is 20 to 24 years, with 84.6% or 962 individuals in the labor force. Within the labor force, the 25 to 29 years age range has the highest percentage of unemployed individuals, with 12.8% or 152 of them being unemployed.
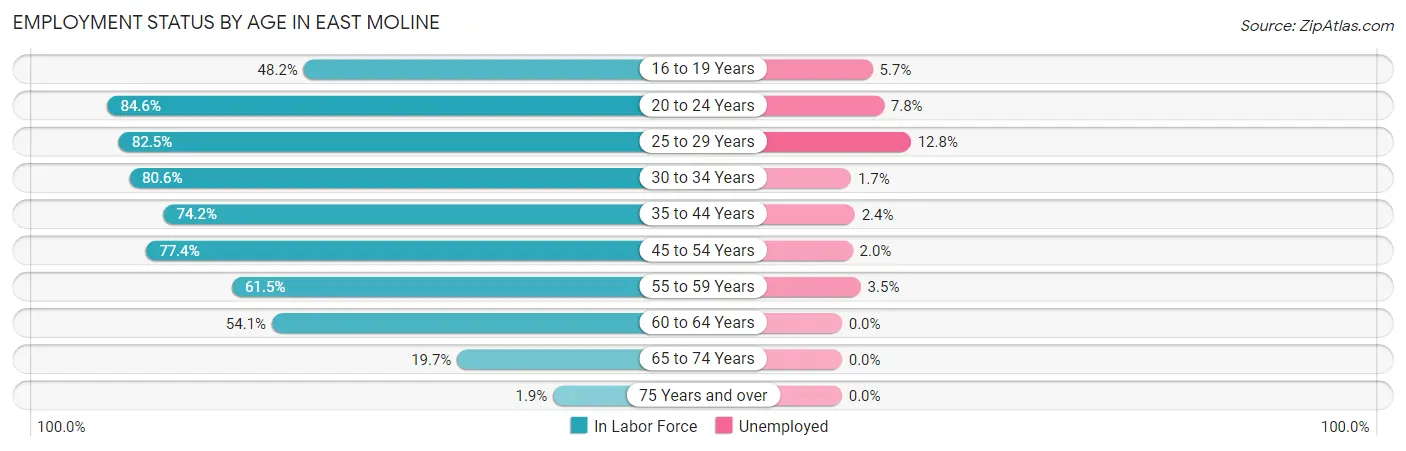
| Age Bracket | In Labor Force | Unemployed |
| 16 to 19 Years | 530 (48.2%) | 30 (5.7%) |
| 20 to 24 Years | 962 (84.6%) | 75 (7.8%) |
| 25 to 29 Years | 1,185 (82.5%) | 152 (12.8%) |
| 30 to 34 Years | 657 (80.6%) | 11 (1.7%) |
| 35 to 44 Years | 2,277 (74.2%) | 55 (2.4%) |
| 45 to 54 Years | 2,189 (77.4%) | 44 (2.0%) |
| 55 to 59 Years | 828 (61.5%) | 29 (3.5%) |
| 60 to 64 Years | 586 (54.1%) | 0 (0.0%) |
| 65 to 74 Years | 358 (19.7%) | 0 (0.0%) |
| 75 Years and over | 33 (1.9%) | 0 (0.0%) |
| Total | 9,600 (58.6%) | 394 (4.1%) |
Employment Status by Educational Attainment in East Moline
According to labor force statistics for East Moline, 73.0% of individuals (7,723) out of the total population between 25 and 64 years of age (10,579) are in the labor force, with 3.7% or 286 of them being unemployed. The group with the highest labor force participation rate are those with the educational attainment of bachelor's degree or higher, with 93.3% or 1,923 individuals in the labor force. Within the labor force, individuals with college / associate degree education have the highest percentage of unemployment, with 5.8% or 160 of them being unemployed.
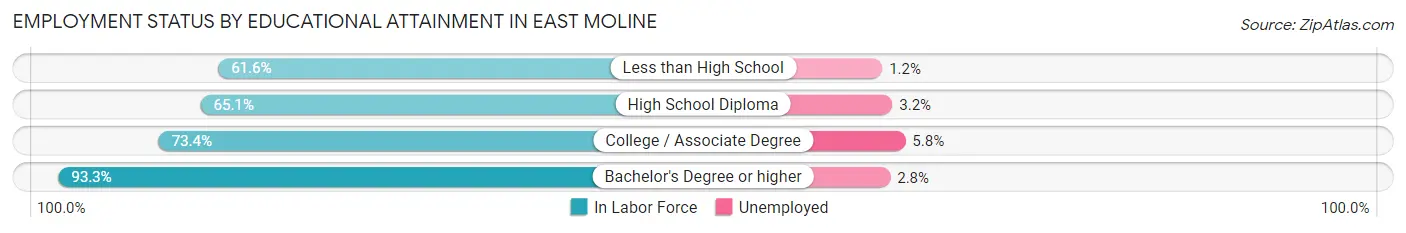
| Educational Attainment | In Labor Force | Unemployed |
| Less than High School | 999 (61.6%) | 19 (1.2%) |
| High School Diploma | 2,043 (65.1%) | 100 (3.2%) |
| College / Associate Degree | 2,758 (73.4%) | 218 (5.8%) |
| Bachelor's Degree or higher | 1,923 (93.3%) | 58 (2.8%) |
| Total | 7,723 (73.0%) | 391 (3.7%) |
Employment Occupations by Sex in East Moline
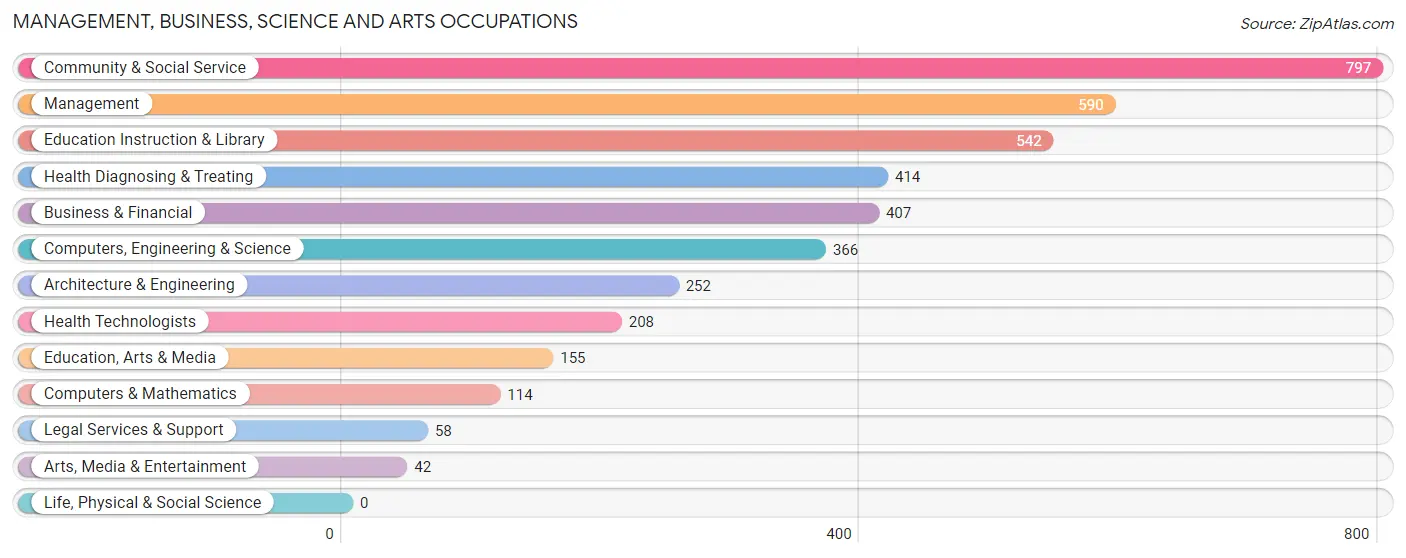
Management, Business, Science and Arts Occupations
The most common Management, Business, Science and Arts occupations in East Moline are Community & Social Service (797 | 8.7%), Management (590 | 6.4%), Education Instruction & Library (542 | 5.9%), Health Diagnosing & Treating (414 | 4.5%), and Business & Financial (407 | 4.4%).
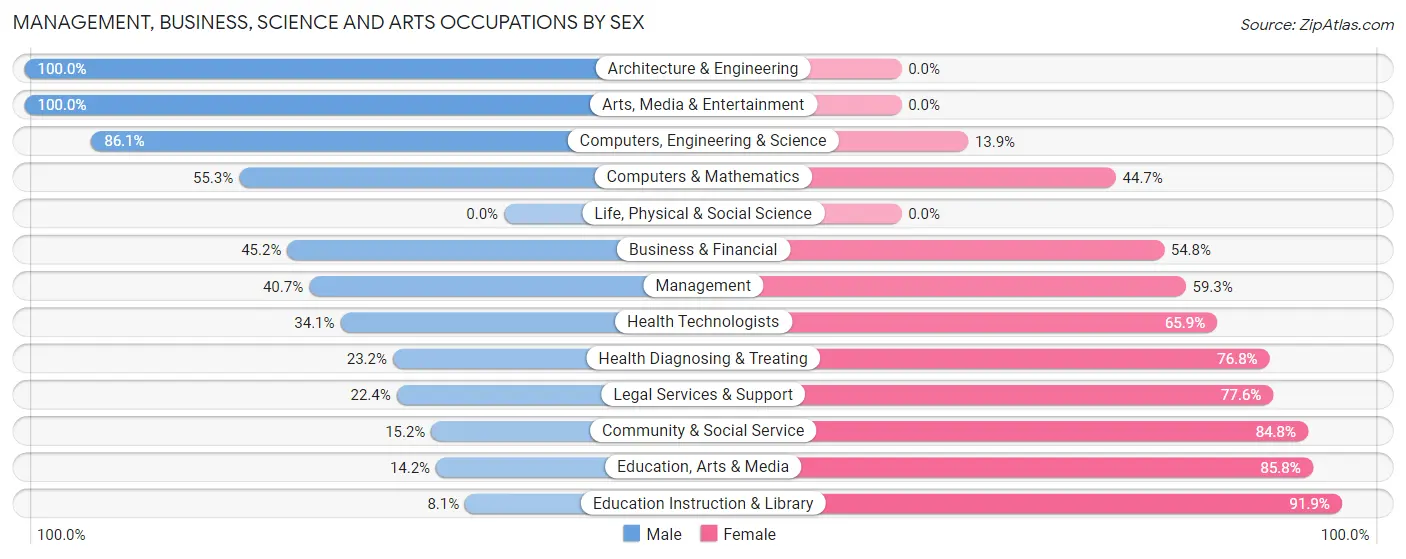
Management, Business, Science and Arts Occupations by Sex
Within the Management, Business, Science and Arts occupations in East Moline, the most male-oriented occupations are Architecture & Engineering (100.0%), Arts, Media & Entertainment (100.0%), and Computers, Engineering & Science (86.1%), while the most female-oriented occupations are Education Instruction & Library (91.9%), Education, Arts & Media (85.8%), and Community & Social Service (84.8%).
| Occupation | Male | Female |
| Management | 240 (40.7%) | 350 (59.3%) |
| Business & Financial | 184 (45.2%) | 223 (54.8%) |
| Computers, Engineering & Science | 315 (86.1%) | 51 (13.9%) |
| Computers & Mathematics | 63 (55.3%) | 51 (44.7%) |
| Architecture & Engineering | 252 (100.0%) | 0 (0.0%) |
| Life, Physical & Social Science | 0 (0.0%) | 0 (0.0%) |
| Community & Social Service | 121 (15.2%) | 676 (84.8%) |
| Education, Arts & Media | 22 (14.2%) | 133 (85.8%) |
| Legal Services & Support | 13 (22.4%) | 45 (77.6%) |
| Education Instruction & Library | 44 (8.1%) | 498 (91.9%) |
| Arts, Media & Entertainment | 42 (100.0%) | 0 (0.0%) |
| Health Diagnosing & Treating | 96 (23.2%) | 318 (76.8%) |
| Health Technologists | 71 (34.1%) | 137 (65.9%) |
| Total (Category) | 956 (37.1%) | 1,618 (62.9%) |
| Total (Overall) | 4,431 (48.3%) | 4,745 (51.7%) |
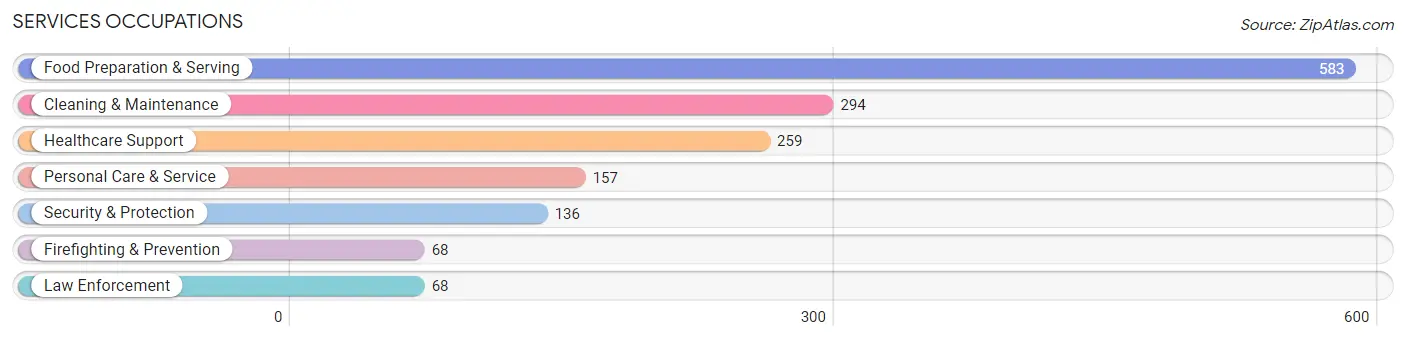
Services Occupations
The most common Services occupations in East Moline are Food Preparation & Serving (583 | 6.4%), Cleaning & Maintenance (294 | 3.2%), Healthcare Support (259 | 2.8%), Personal Care & Service (157 | 1.7%), and Security & Protection (136 | 1.5%).
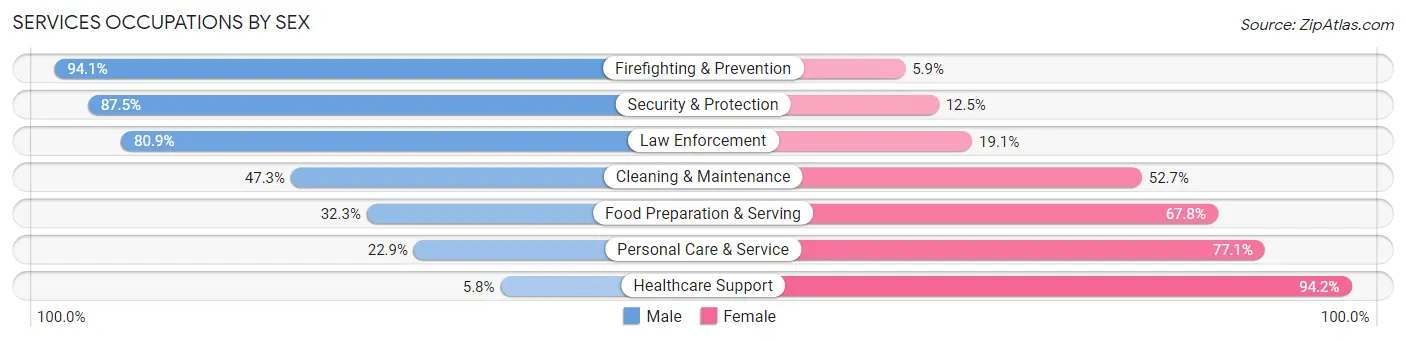
Services Occupations by Sex
Within the Services occupations in East Moline, the most male-oriented occupations are Firefighting & Prevention (94.1%), Security & Protection (87.5%), and Law Enforcement (80.9%), while the most female-oriented occupations are Healthcare Support (94.2%), Personal Care & Service (77.1%), and Food Preparation & Serving (67.7%).
| Occupation | Male | Female |
| Healthcare Support | 15 (5.8%) | 244 (94.2%) |
| Security & Protection | 119 (87.5%) | 17 (12.5%) |
| Firefighting & Prevention | 64 (94.1%) | 4 (5.9%) |
| Law Enforcement | 55 (80.9%) | 13 (19.1%) |
| Food Preparation & Serving | 188 (32.3%) | 395 (67.7%) |
| Cleaning & Maintenance | 139 (47.3%) | 155 (52.7%) |
| Personal Care & Service | 36 (22.9%) | 121 (77.1%) |
| Total (Category) | 497 (34.8%) | 932 (65.2%) |
| Total (Overall) | 4,431 (48.3%) | 4,745 (51.7%) |
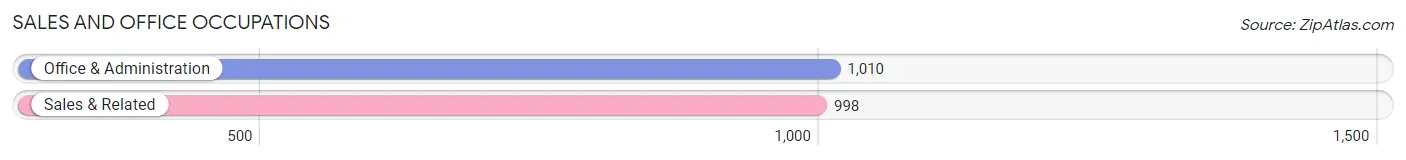
Sales and Office Occupations
The most common Sales and Office occupations in East Moline are Office & Administration (1,010 | 11.0%), and Sales & Related (998 | 10.9%).
Sales and Office Occupations by Sex
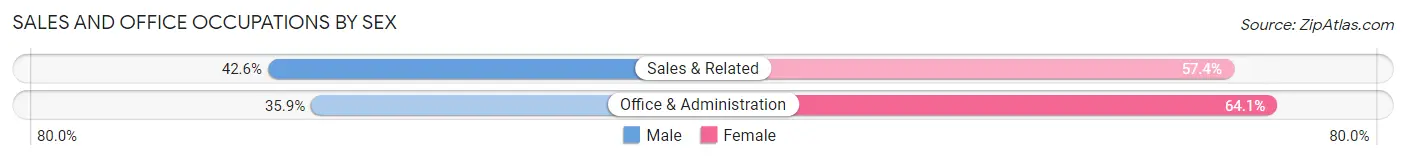
| Occupation | Male | Female |
| Sales & Related | 425 (42.6%) | 573 (57.4%) |
| Office & Administration | 363 (35.9%) | 647 (64.1%) |
| Total (Category) | 788 (39.2%) | 1,220 (60.8%) |
| Total (Overall) | 4,431 (48.3%) | 4,745 (51.7%) |
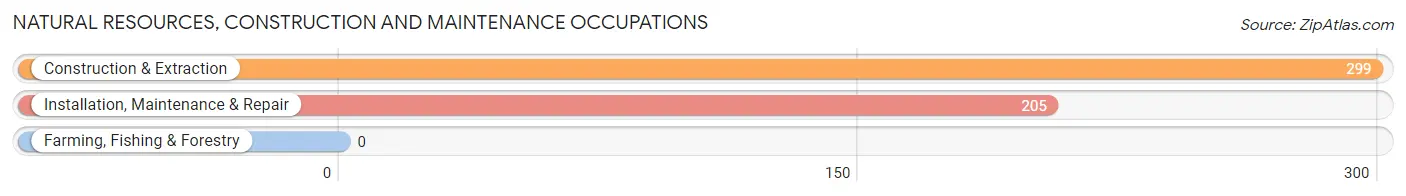
Natural Resources, Construction and Maintenance Occupations
The most common Natural Resources, Construction and Maintenance occupations in East Moline are Construction & Extraction (299 | 3.3%), and Installation, Maintenance & Repair (205 | 2.2%).
Natural Resources, Construction and Maintenance Occupations by Sex
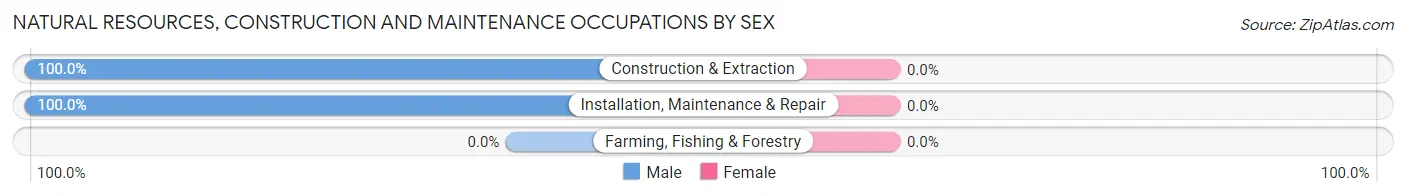
| Occupation | Male | Female |
| Farming, Fishing & Forestry | 0 (0.0%) | 0 (0.0%) |
| Construction & Extraction | 299 (100.0%) | 0 (0.0%) |
| Installation, Maintenance & Repair | 205 (100.0%) | 0 (0.0%) |
| Total (Category) | 504 (100.0%) | 0 (0.0%) |
| Total (Overall) | 4,431 (48.3%) | 4,745 (51.7%) |
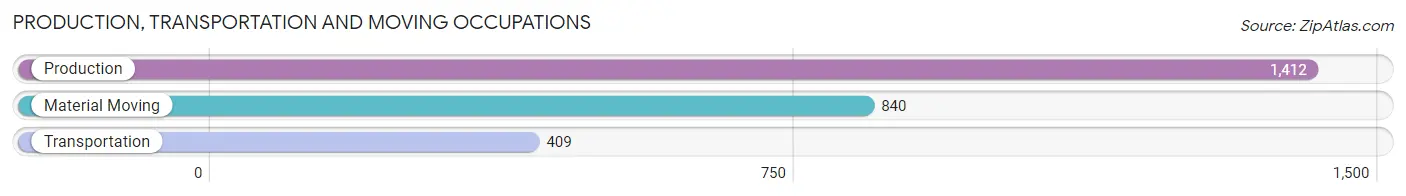
Production, Transportation and Moving Occupations
The most common Production, Transportation and Moving occupations in East Moline are Production (1,412 | 15.4%), Material Moving (840 | 9.1%), and Transportation (409 | 4.5%).
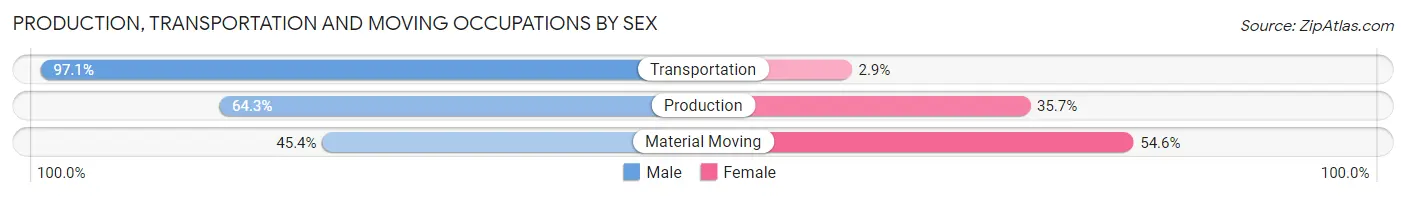
Production, Transportation and Moving Occupations by Sex
| Occupation | Male | Female |
| Production | 908 (64.3%) | 504 (35.7%) |
| Transportation | 397 (97.1%) | 12 (2.9%) |
| Material Moving | 381 (45.4%) | 459 (54.6%) |
| Total (Category) | 1,686 (63.4%) | 975 (36.6%) |
| Total (Overall) | 4,431 (48.3%) | 4,745 (51.7%) |
Employment Industries by Sex in East Moline
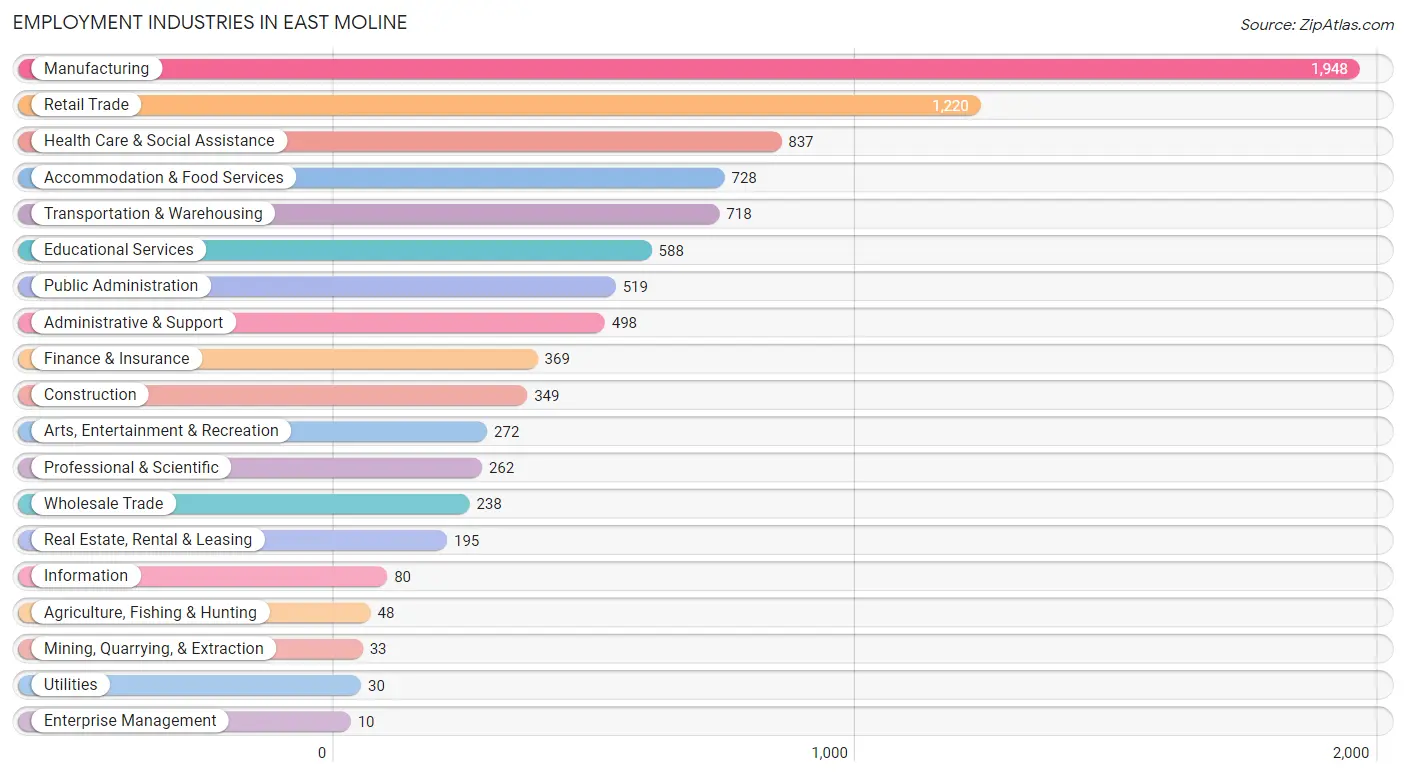
Employment Industries in East Moline
The major employment industries in East Moline include Manufacturing (1,948 | 21.2%), Retail Trade (1,220 | 13.3%), Health Care & Social Assistance (837 | 9.1%), Accommodation & Food Services (728 | 7.9%), and Transportation & Warehousing (718 | 7.8%).
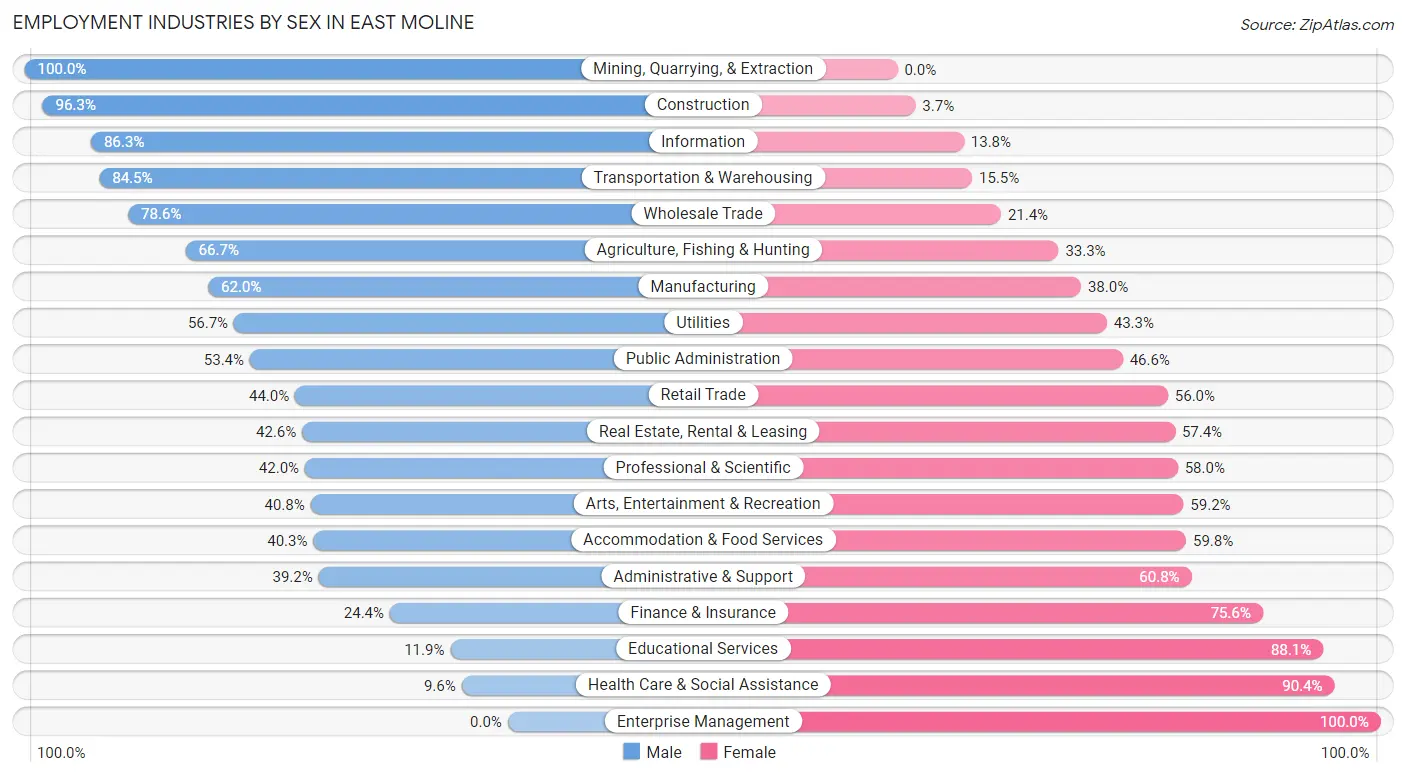
Employment Industries by Sex in East Moline
The East Moline industries that see more men than women are Mining, Quarrying, & Extraction (100.0%), Construction (96.3%), and Information (86.3%), whereas the industries that tend to have a higher number of women are Enterprise Management (100.0%), Health Care & Social Assistance (90.4%), and Educational Services (88.1%).
| Industry | Male | Female |
| Agriculture, Fishing & Hunting | 32 (66.7%) | 16 (33.3%) |
| Mining, Quarrying, & Extraction | 33 (100.0%) | 0 (0.0%) |
| Construction | 336 (96.3%) | 13 (3.7%) |
| Manufacturing | 1,208 (62.0%) | 740 (38.0%) |
| Wholesale Trade | 187 (78.6%) | 51 (21.4%) |
| Retail Trade | 537 (44.0%) | 683 (56.0%) |
| Transportation & Warehousing | 607 (84.5%) | 111 (15.5%) |
| Utilities | 17 (56.7%) | 13 (43.3%) |
| Information | 69 (86.3%) | 11 (13.8%) |
| Finance & Insurance | 90 (24.4%) | 279 (75.6%) |
| Real Estate, Rental & Leasing | 83 (42.6%) | 112 (57.4%) |
| Professional & Scientific | 110 (42.0%) | 152 (58.0%) |
| Enterprise Management | 0 (0.0%) | 10 (100.0%) |
| Administrative & Support | 195 (39.2%) | 303 (60.8%) |
| Educational Services | 70 (11.9%) | 518 (88.1%) |
| Health Care & Social Assistance | 80 (9.6%) | 757 (90.4%) |
| Arts, Entertainment & Recreation | 111 (40.8%) | 161 (59.2%) |
| Accommodation & Food Services | 293 (40.3%) | 435 (59.8%) |
| Public Administration | 277 (53.4%) | 242 (46.6%) |
| Total | 4,431 (48.3%) | 4,745 (51.7%) |
Education in East Moline
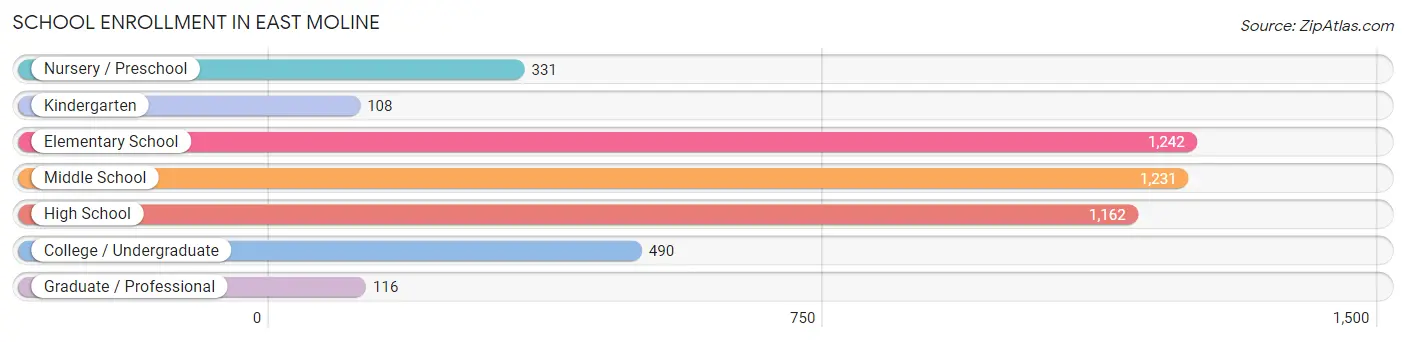
School Enrollment in East Moline
The most common levels of schooling among the 4,680 students in East Moline are elementary school (1,242 | 26.5%), middle school (1,231 | 26.3%), and high school (1,162 | 24.8%).
| School Level | # Students | % Students |
| Nursery / Preschool | 331 | 7.1% |
| Kindergarten | 108 | 2.3% |
| Elementary School | 1,242 | 26.5% |
| Middle School | 1,231 | 26.3% |
| High School | 1,162 | 24.8% |
| College / Undergraduate | 490 | 10.5% |
| Graduate / Professional | 116 | 2.5% |
| Total | 4,680 | 100.0% |
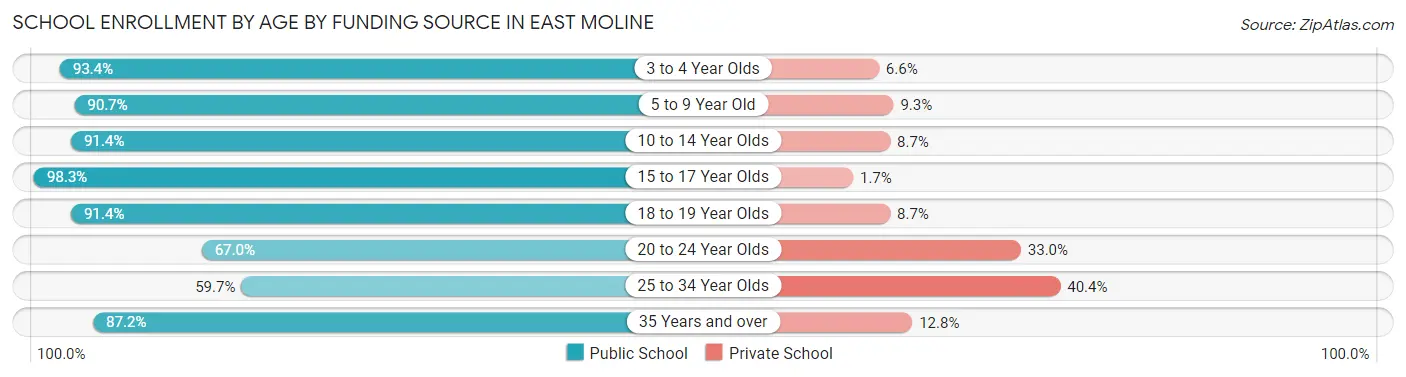
School Enrollment by Age by Funding Source in East Moline
Out of a total of 4,680 students who are enrolled in schools in East Moline, 463 (9.9%) attend a private institution, while the remaining 4,217 (90.1%) are enrolled in public schools. The age group of 25 to 34 year olds has the highest likelihood of being enrolled in private schools, with 69 (40.4% in the age bracket) enrolled. Conversely, the age group of 15 to 17 year olds has the lowest likelihood of being enrolled in a private school, with 790 (98.3% in the age bracket) attending a public institution.
| Age Bracket | Public School | Private School |
| 3 to 4 Year Olds | 228 (93.4%) | 16 (6.6%) |
| 5 to 9 Year Old | 1,233 (90.7%) | 126 (9.3%) |
| 10 to 14 Year Olds | 1,363 (91.3%) | 129 (8.6%) |
| 15 to 17 Year Olds | 790 (98.3%) | 14 (1.7%) |
| 18 to 19 Year Olds | 243 (91.3%) | 23 (8.6%) |
| 20 to 24 Year Olds | 136 (67.0%) | 67 (33.0%) |
| 25 to 34 Year Olds | 102 (59.7%) | 69 (40.4%) |
| 35 Years and over | 123 (87.2%) | 18 (12.8%) |
| Total | 4,217 (90.1%) | 463 (9.9%) |
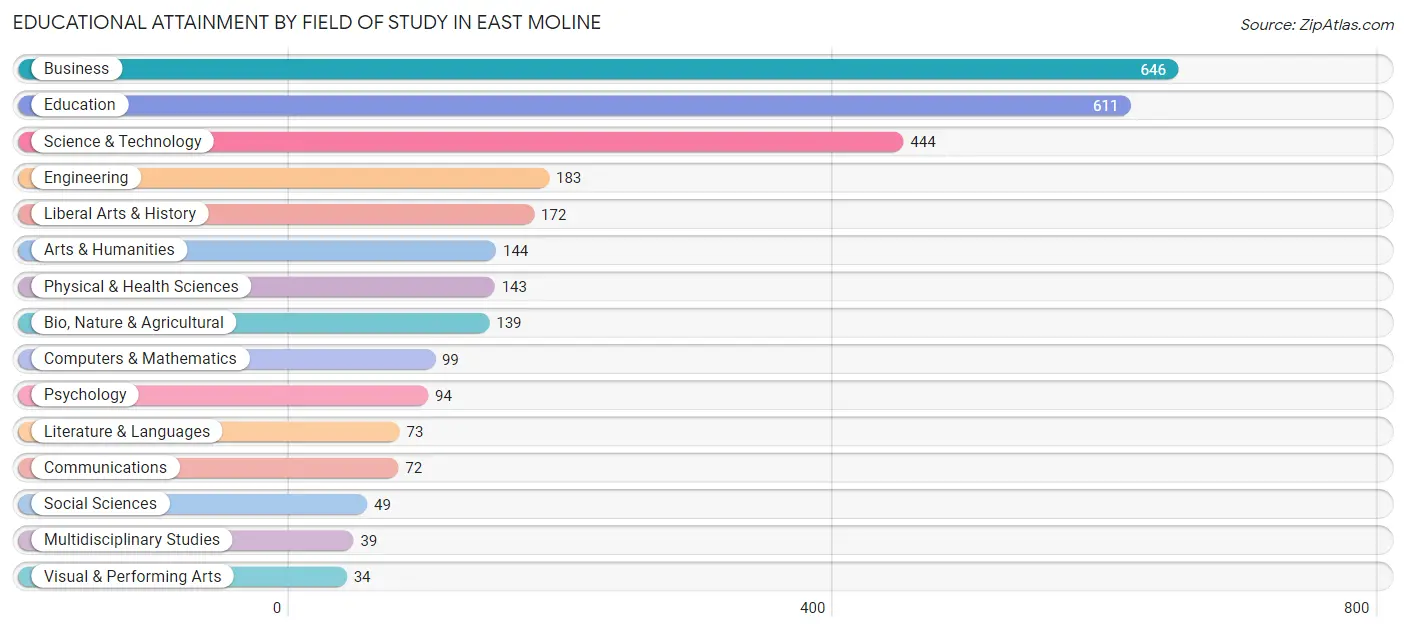
Educational Attainment by Field of Study in East Moline
Business (646 | 22.0%), education (611 | 20.8%), science & technology (444 | 15.1%), engineering (183 | 6.2%), and liberal arts & history (172 | 5.9%) are the most common fields of study among 2,942 individuals in East Moline who have obtained a bachelor's degree or higher.
| Field of Study | # Graduates | % Graduates |
| Computers & Mathematics | 99 | 3.4% |
| Bio, Nature & Agricultural | 139 | 4.7% |
| Physical & Health Sciences | 143 | 4.9% |
| Psychology | 94 | 3.2% |
| Social Sciences | 49 | 1.7% |
| Engineering | 183 | 6.2% |
| Multidisciplinary Studies | 39 | 1.3% |
| Science & Technology | 444 | 15.1% |
| Business | 646 | 22.0% |
| Education | 611 | 20.8% |
| Literature & Languages | 73 | 2.5% |
| Liberal Arts & History | 172 | 5.9% |
| Visual & Performing Arts | 34 | 1.2% |
| Communications | 72 | 2.5% |
| Arts & Humanities | 144 | 4.9% |
| Total | 2,942 | 100.0% |
Transportation & Commute in East Moline
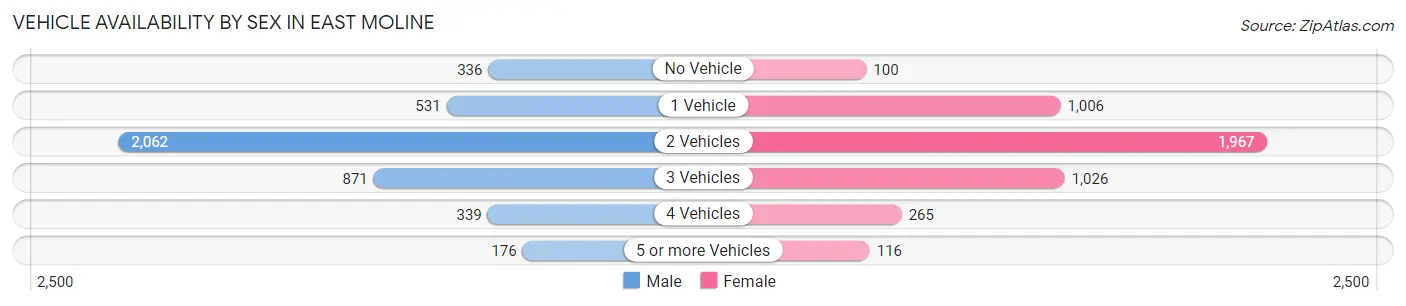
Vehicle Availability by Sex in East Moline
The most prevalent vehicle ownership categories in East Moline are males with 2 vehicles (2,062, accounting for 47.8%) and females with 2 vehicles (1,967, making up 46.0%).
| Vehicles Available | Male | Female |
| No Vehicle | 336 (7.8%) | 100 (2.2%) |
| 1 Vehicle | 531 (12.3%) | 1,006 (22.5%) |
| 2 Vehicles | 2,062 (47.8%) | 1,967 (43.9%) |
| 3 Vehicles | 871 (20.2%) | 1,026 (22.9%) |
| 4 Vehicles | 339 (7.9%) | 265 (5.9%) |
| 5 or more Vehicles | 176 (4.1%) | 116 (2.6%) |
| Total | 4,315 (100.0%) | 4,480 (100.0%) |
Commute Time in East Moline
The most frequently occuring commute durations in East Moline are 20 to 24 minutes (1,990 commuters, 23.0%), 15 to 19 minutes (1,661 commuters, 19.2%), and 5 to 9 minutes (1,099 commuters, 12.7%).
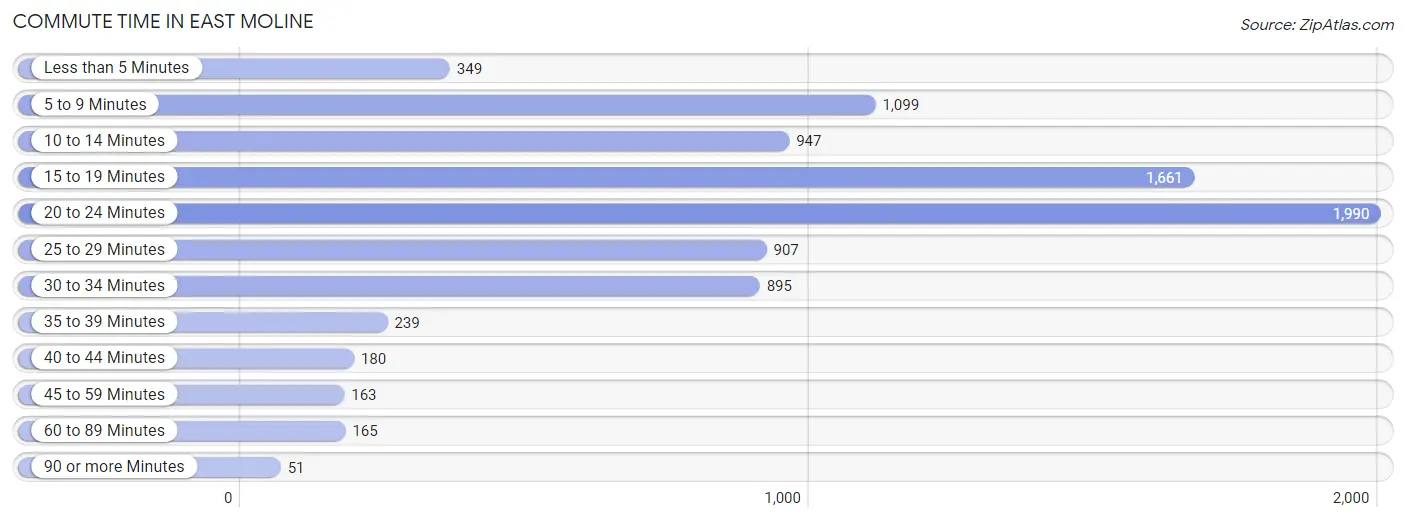
| Commute Time | # Commuters | % Commuters |
| Less than 5 Minutes | 349 | 4.0% |
| 5 to 9 Minutes | 1,099 | 12.7% |
| 10 to 14 Minutes | 947 | 11.0% |
| 15 to 19 Minutes | 1,661 | 19.2% |
| 20 to 24 Minutes | 1,990 | 23.0% |
| 25 to 29 Minutes | 907 | 10.5% |
| 30 to 34 Minutes | 895 | 10.3% |
| 35 to 39 Minutes | 239 | 2.8% |
| 40 to 44 Minutes | 180 | 2.1% |
| 45 to 59 Minutes | 163 | 1.9% |
| 60 to 89 Minutes | 165 | 1.9% |
| 90 or more Minutes | 51 | 0.6% |
Commute Time by Sex in East Moline
The most common commute times in East Moline are 20 to 24 minutes (976 commuters, 22.7%) for males and 20 to 24 minutes (1,014 commuters, 23.3%) for females.
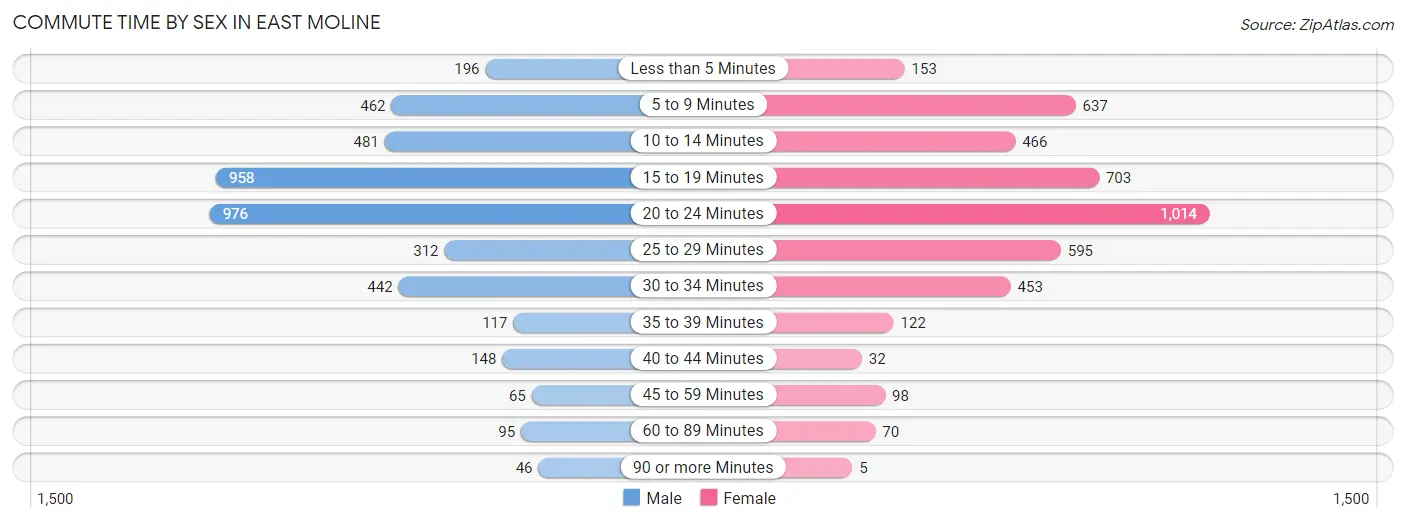
| Commute Time | Male | Female |
| Less than 5 Minutes | 196 (4.6%) | 153 (3.5%) |
| 5 to 9 Minutes | 462 (10.7%) | 637 (14.6%) |
| 10 to 14 Minutes | 481 (11.2%) | 466 (10.7%) |
| 15 to 19 Minutes | 958 (22.3%) | 703 (16.2%) |
| 20 to 24 Minutes | 976 (22.7%) | 1,014 (23.3%) |
| 25 to 29 Minutes | 312 (7.3%) | 595 (13.7%) |
| 30 to 34 Minutes | 442 (10.3%) | 453 (10.4%) |
| 35 to 39 Minutes | 117 (2.7%) | 122 (2.8%) |
| 40 to 44 Minutes | 148 (3.4%) | 32 (0.7%) |
| 45 to 59 Minutes | 65 (1.5%) | 98 (2.2%) |
| 60 to 89 Minutes | 95 (2.2%) | 70 (1.6%) |
| 90 or more Minutes | 46 (1.1%) | 5 (0.1%) |
Time of Departure to Work by Sex in East Moline
The most frequent times of departure to work in East Moline are 12:00 PM to 3:59 PM (663, 15.4%) for males and 6:30 AM to 6:59 AM (588, 13.5%) for females.
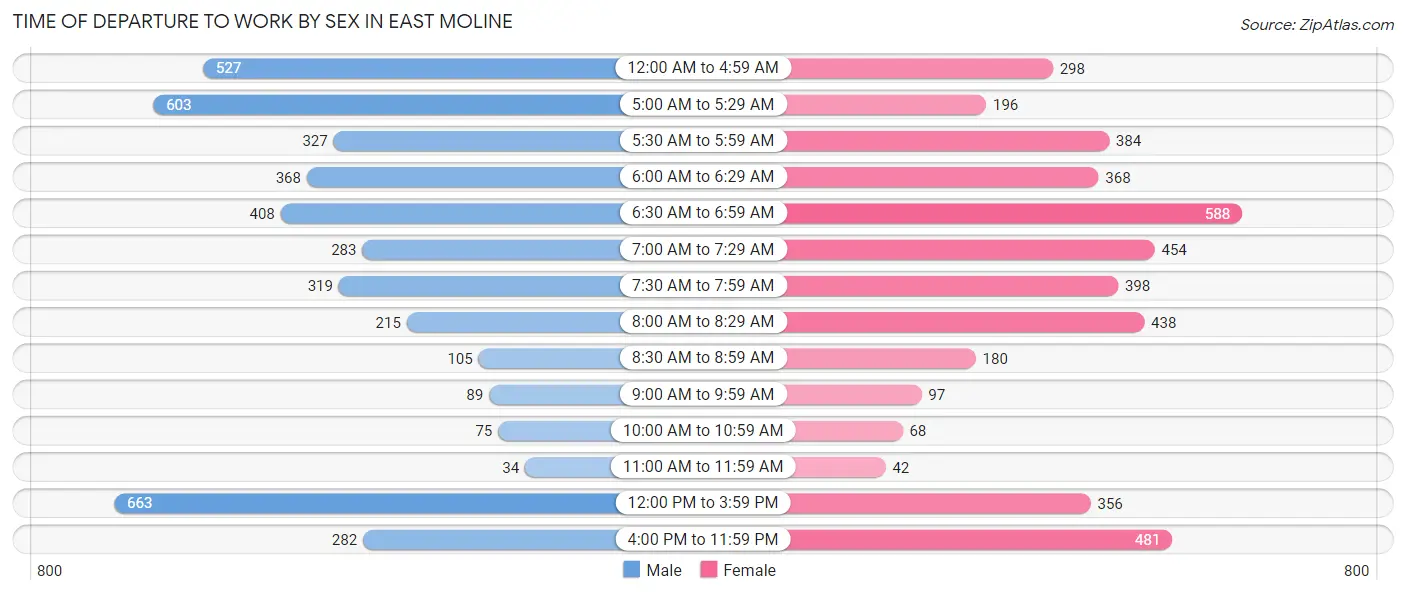
| Time of Departure | Male | Female |
| 12:00 AM to 4:59 AM | 527 (12.3%) | 298 (6.9%) |
| 5:00 AM to 5:29 AM | 603 (14.0%) | 196 (4.5%) |
| 5:30 AM to 5:59 AM | 327 (7.6%) | 384 (8.8%) |
| 6:00 AM to 6:29 AM | 368 (8.6%) | 368 (8.5%) |
| 6:30 AM to 6:59 AM | 408 (9.5%) | 588 (13.5%) |
| 7:00 AM to 7:29 AM | 283 (6.6%) | 454 (10.4%) |
| 7:30 AM to 7:59 AM | 319 (7.4%) | 398 (9.1%) |
| 8:00 AM to 8:29 AM | 215 (5.0%) | 438 (10.1%) |
| 8:30 AM to 8:59 AM | 105 (2.4%) | 180 (4.1%) |
| 9:00 AM to 9:59 AM | 89 (2.1%) | 97 (2.2%) |
| 10:00 AM to 10:59 AM | 75 (1.7%) | 68 (1.6%) |
| 11:00 AM to 11:59 AM | 34 (0.8%) | 42 (1.0%) |
| 12:00 PM to 3:59 PM | 663 (15.4%) | 356 (8.2%) |
| 4:00 PM to 11:59 PM | 282 (6.6%) | 481 (11.1%) |
| Total | 4,298 (100.0%) | 4,348 (100.0%) |
Housing Occupancy in East Moline
Occupancy by Ownership in East Moline
Of the total 8,275 dwellings in East Moline, owner-occupied units account for 5,425 (65.6%), while renter-occupied units make up 2,850 (34.4%).
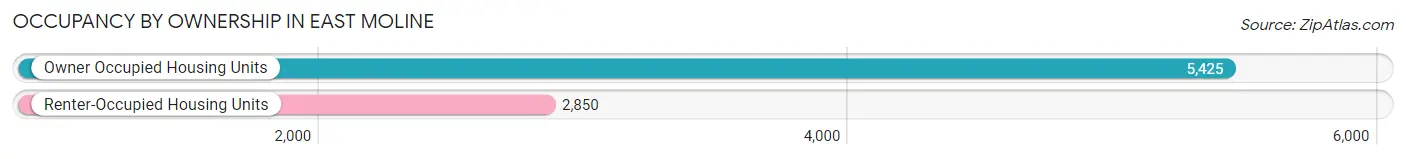
| Occupancy | # Housing Units | % Housing Units |
| Owner Occupied Housing Units | 5,425 | 65.6% |
| Renter-Occupied Housing Units | 2,850 | 34.4% |
| Total Occupied Housing Units | 8,275 | 100.0% |
Occupancy by Household Size in East Moline
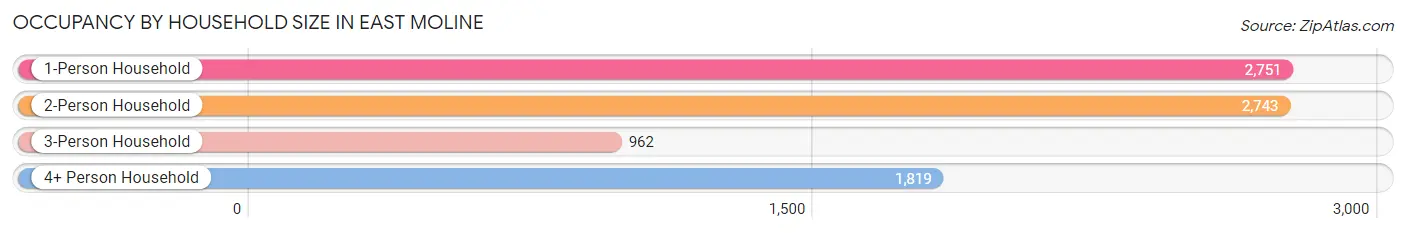
| Household Size | # Housing Units | % Housing Units |
| 1-Person Household | 2,751 | 33.2% |
| 2-Person Household | 2,743 | 33.2% |
| 3-Person Household | 962 | 11.6% |
| 4+ Person Household | 1,819 | 22.0% |
| Total Housing Units | 8,275 | 100.0% |
Occupancy by Ownership by Household Size in East Moline
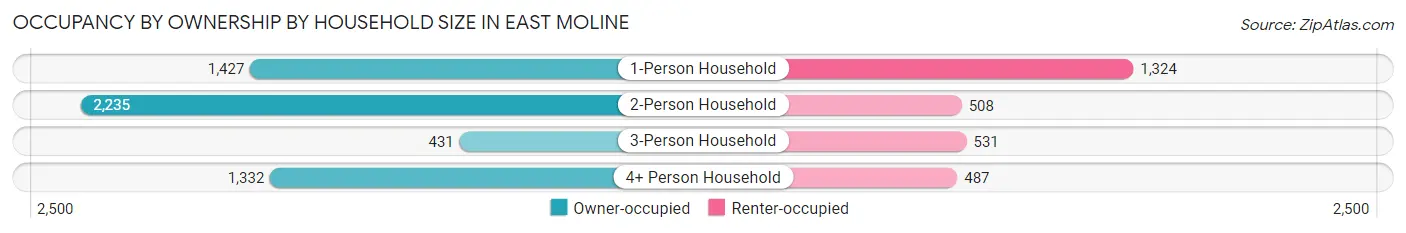
| Household Size | Owner-occupied | Renter-occupied |
| 1-Person Household | 1,427 (51.9%) | 1,324 (48.1%) |
| 2-Person Household | 2,235 (81.5%) | 508 (18.5%) |
| 3-Person Household | 431 (44.8%) | 531 (55.2%) |
| 4+ Person Household | 1,332 (73.2%) | 487 (26.8%) |
| Total Housing Units | 5,425 (65.6%) | 2,850 (34.4%) |
Occupancy by Educational Attainment in East Moline
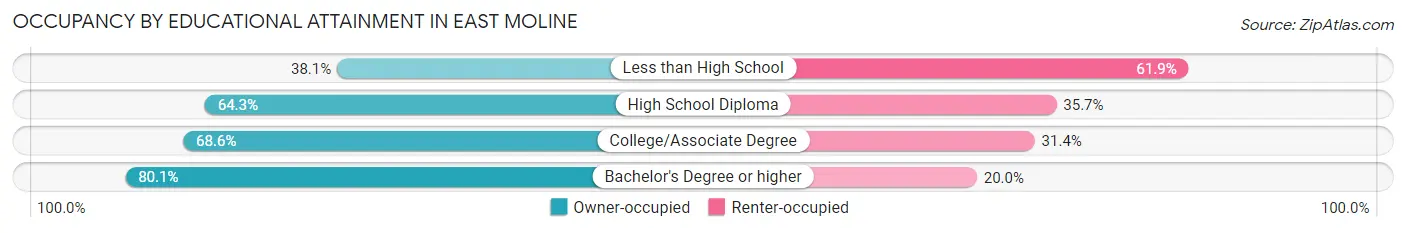
| Household Size | Owner-occupied | Renter-occupied |
| Less than High School | 411 (38.1%) | 669 (61.9%) |
| High School Diploma | 1,599 (64.3%) | 889 (35.7%) |
| College/Associate Degree | 2,111 (68.6%) | 967 (31.4%) |
| Bachelor's Degree or higher | 1,304 (80.0%) | 325 (20.0%) |
Occupancy by Age of Householder in East Moline
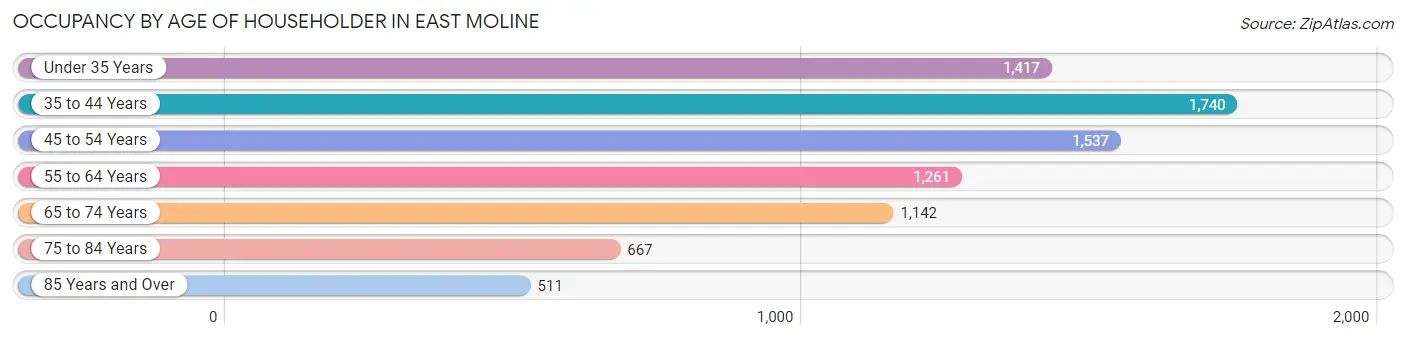
| Age Bracket | # Households | % Households |
| Under 35 Years | 1,417 | 17.1% |
| 35 to 44 Years | 1,740 | 21.0% |
| 45 to 54 Years | 1,537 | 18.6% |
| 55 to 64 Years | 1,261 | 15.2% |
| 65 to 74 Years | 1,142 | 13.8% |
| 75 to 84 Years | 667 | 8.1% |
| 85 Years and Over | 511 | 6.2% |
| Total | 8,275 | 100.0% |
Housing Finances in East Moline
Median Income by Occupancy in East Moline
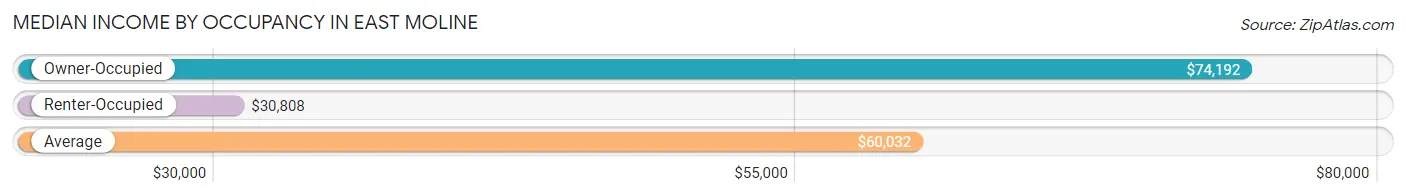
| Occupancy Type | # Households | Median Income |
| Owner-Occupied | 5,425 (65.6%) | $74,192 |
| Renter-Occupied | 2,850 (34.4%) | $30,808 |
| Average | 8,275 (100.0%) | $60,032 |
Occupancy by Householder Income Bracket in East Moline
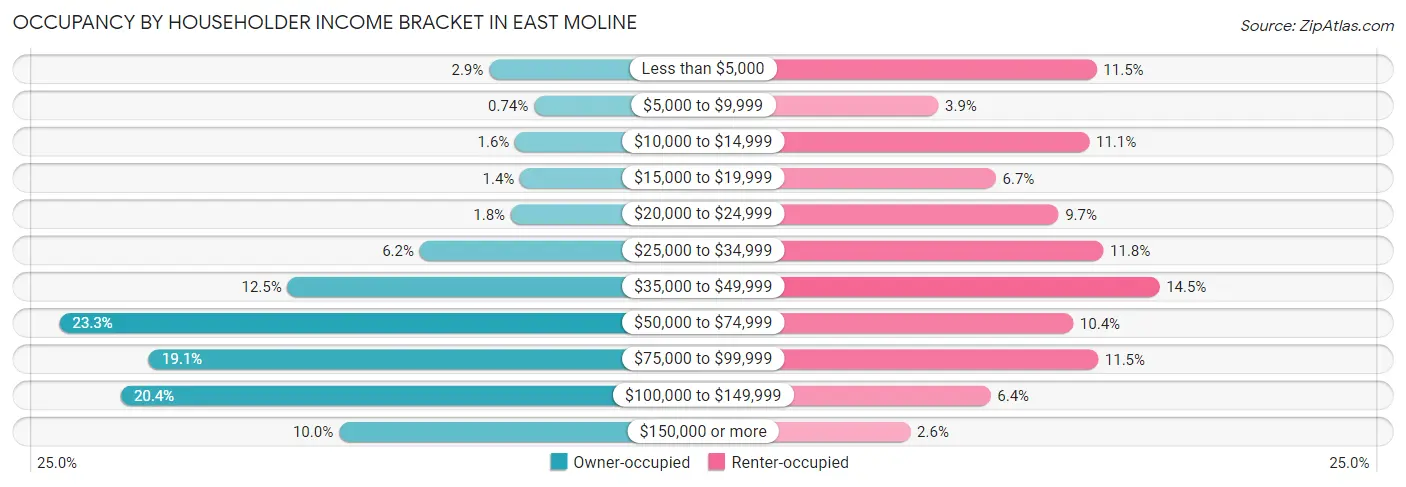
| Income Bracket | Owner-occupied | Renter-occupied |
| Less than $5,000 | 156 (2.9%) | 327 (11.5%) |
| $5,000 to $9,999 | 40 (0.7%) | 112 (3.9%) |
| $10,000 to $14,999 | 89 (1.6%) | 317 (11.1%) |
| $15,000 to $19,999 | 76 (1.4%) | 190 (6.7%) |
| $20,000 to $24,999 | 100 (1.8%) | 275 (9.7%) |
| $25,000 to $34,999 | 335 (6.2%) | 336 (11.8%) |
| $35,000 to $49,999 | 677 (12.5%) | 412 (14.5%) |
| $50,000 to $74,999 | 1,266 (23.3%) | 295 (10.3%) |
| $75,000 to $99,999 | 1,035 (19.1%) | 329 (11.5%) |
| $100,000 to $149,999 | 1,107 (20.4%) | 183 (6.4%) |
| $150,000 or more | 544 (10.0%) | 74 (2.6%) |
| Total | 5,425 (100.0%) | 2,850 (100.0%) |
Monthly Housing Cost Tiers in East Moline
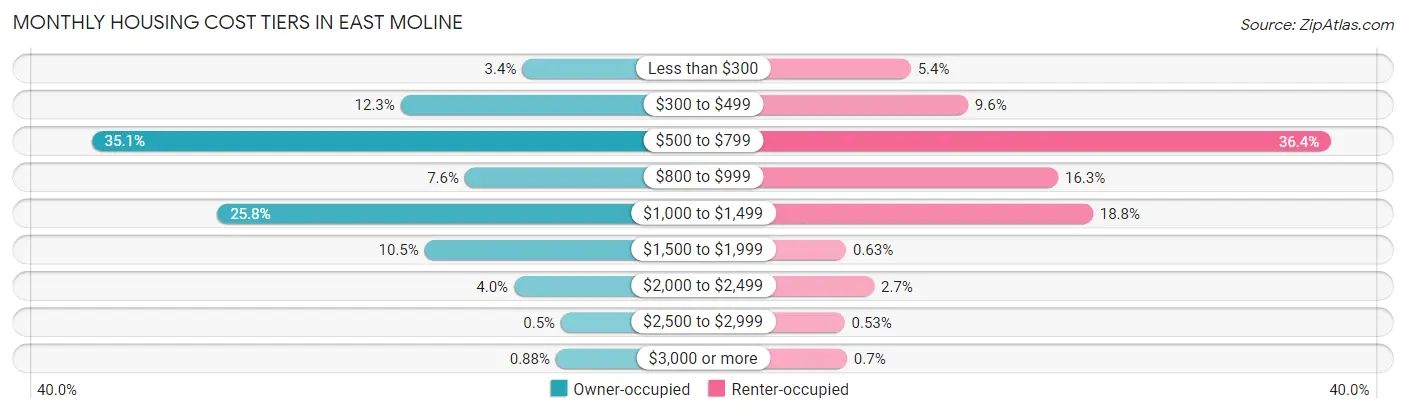
| Monthly Cost | Owner-occupied | Renter-occupied |
| Less than $300 | 182 (3.4%) | 154 (5.4%) |
| $300 to $499 | 668 (12.3%) | 274 (9.6%) |
| $500 to $799 | 1,902 (35.1%) | 1,036 (36.3%) |
| $800 to $999 | 411 (7.6%) | 463 (16.3%) |
| $1,000 to $1,499 | 1,400 (25.8%) | 536 (18.8%) |
| $1,500 to $1,999 | 572 (10.5%) | 18 (0.6%) |
| $2,000 to $2,499 | 215 (4.0%) | 77 (2.7%) |
| $2,500 to $2,999 | 27 (0.5%) | 15 (0.5%) |
| $3,000 or more | 48 (0.9%) | 20 (0.7%) |
| Total | 5,425 (100.0%) | 2,850 (100.0%) |
Physical Housing Characteristics in East Moline
Housing Structures in East Moline
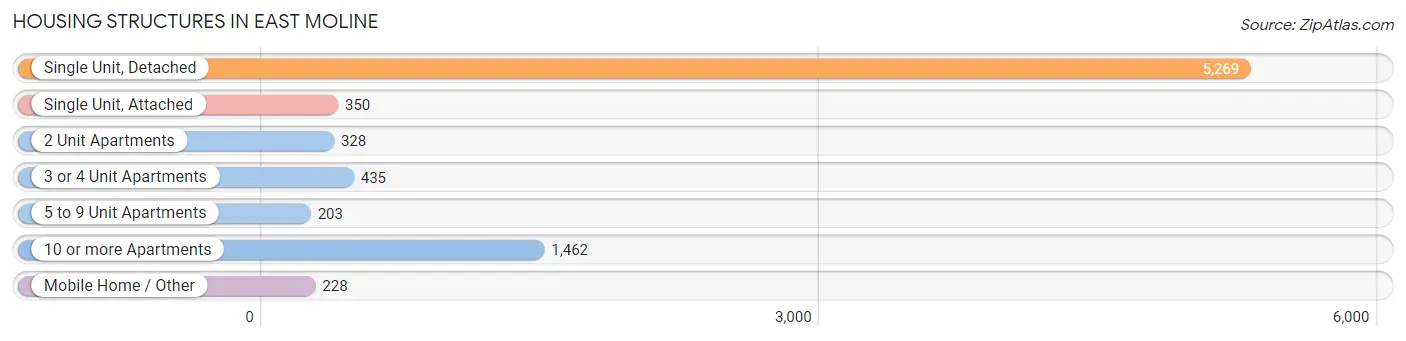
| Structure Type | # Housing Units | % Housing Units |
| Single Unit, Detached | 5,269 | 63.7% |
| Single Unit, Attached | 350 | 4.2% |
| 2 Unit Apartments | 328 | 4.0% |
| 3 or 4 Unit Apartments | 435 | 5.3% |
| 5 to 9 Unit Apartments | 203 | 2.5% |
| 10 or more Apartments | 1,462 | 17.7% |
| Mobile Home / Other | 228 | 2.8% |
| Total | 8,275 | 100.0% |
Housing Structures by Occupancy in East Moline
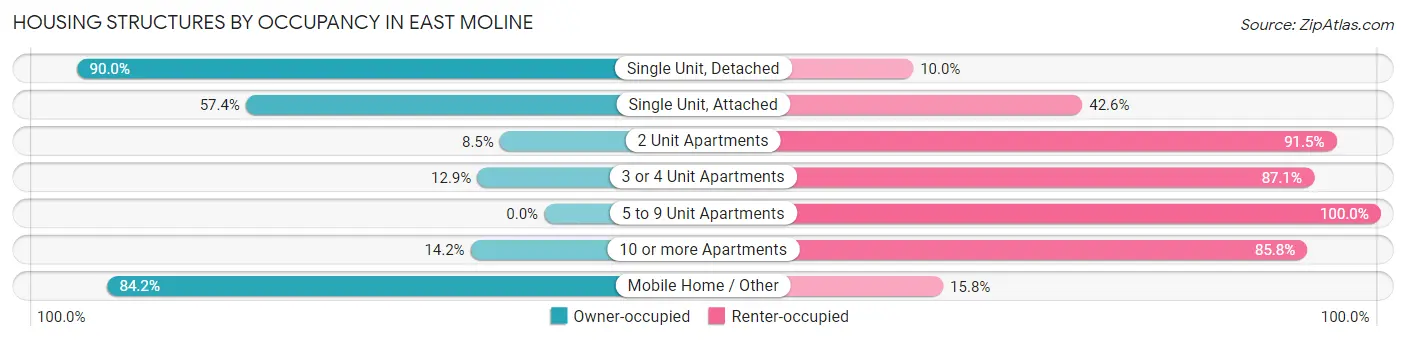
| Structure Type | Owner-occupied | Renter-occupied |
| Single Unit, Detached | 4,741 (90.0%) | 528 (10.0%) |
| Single Unit, Attached | 201 (57.4%) | 149 (42.6%) |
| 2 Unit Apartments | 28 (8.5%) | 300 (91.5%) |
| 3 or 4 Unit Apartments | 56 (12.9%) | 379 (87.1%) |
| 5 to 9 Unit Apartments | 0 (0.0%) | 203 (100.0%) |
| 10 or more Apartments | 207 (14.2%) | 1,255 (85.8%) |
| Mobile Home / Other | 192 (84.2%) | 36 (15.8%) |
| Total | 5,425 (65.6%) | 2,850 (34.4%) |
Housing Structures by Number of Rooms in East Moline
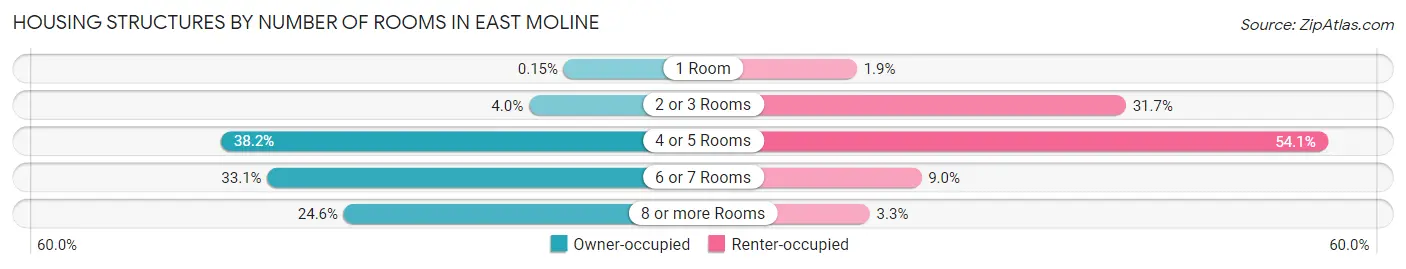
| Number of Rooms | Owner-occupied | Renter-occupied |
| 1 Room | 8 (0.2%) | 53 (1.9%) |
| 2 or 3 Rooms | 218 (4.0%) | 904 (31.7%) |
| 4 or 5 Rooms | 2,073 (38.2%) | 1,542 (54.1%) |
| 6 or 7 Rooms | 1,793 (33.1%) | 257 (9.0%) |
| 8 or more Rooms | 1,333 (24.6%) | 94 (3.3%) |
| Total | 5,425 (100.0%) | 2,850 (100.0%) |
Housing Structure by Heating Type in East Moline
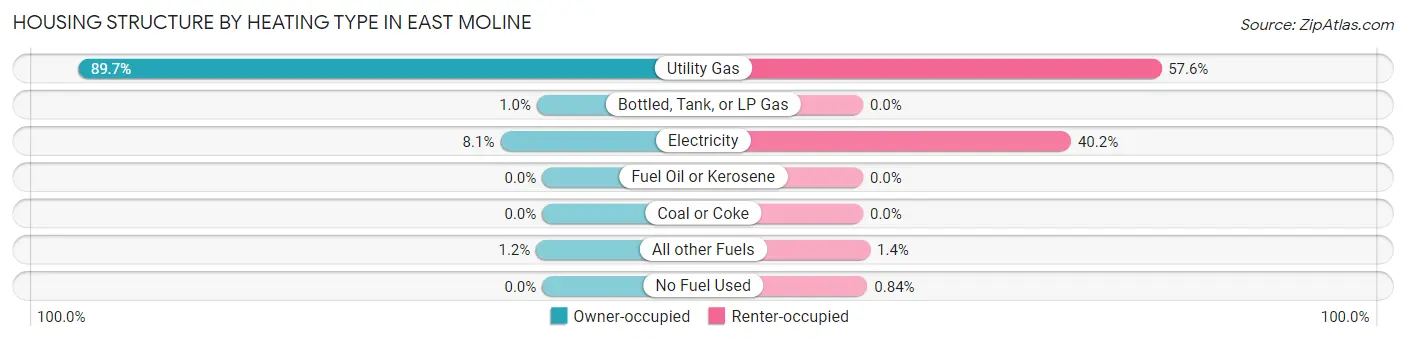
| Heating Type | Owner-occupied | Renter-occupied |
| Utility Gas | 4,867 (89.7%) | 1,642 (57.6%) |
| Bottled, Tank, or LP Gas | 56 (1.0%) | 0 (0.0%) |
| Electricity | 439 (8.1%) | 1,145 (40.2%) |
| Fuel Oil or Kerosene | 0 (0.0%) | 0 (0.0%) |
| Coal or Coke | 0 (0.0%) | 0 (0.0%) |
| All other Fuels | 63 (1.2%) | 39 (1.4%) |
| No Fuel Used | 0 (0.0%) | 24 (0.8%) |
| Total | 5,425 (100.0%) | 2,850 (100.0%) |
Household Vehicle Usage in East Moline
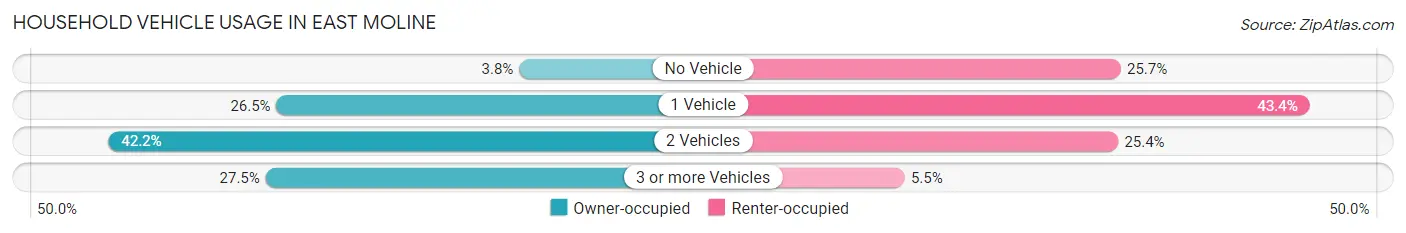
| Vehicles per Household | Owner-occupied | Renter-occupied |
| No Vehicle | 208 (3.8%) | 732 (25.7%) |
| 1 Vehicle | 1,437 (26.5%) | 1,236 (43.4%) |
| 2 Vehicles | 2,288 (42.2%) | 725 (25.4%) |
| 3 or more Vehicles | 1,492 (27.5%) | 157 (5.5%) |
| Total | 5,425 (100.0%) | 2,850 (100.0%) |
Real Estate & Mortgages in East Moline
Real Estate and Mortgage Overview in East Moline
| Characteristic | Without Mortgage | With Mortgage |
| Housing Units | 2,756 | 2,669 |
| Median Property Value | $134,000 | $128,200 |
| Median Household Income | $60,233 | $308 |
| Monthly Housing Costs | $582 | $29 |
| Real Estate Taxes | $3,242 | $39 |
Property Value by Mortgage Status in East Moline
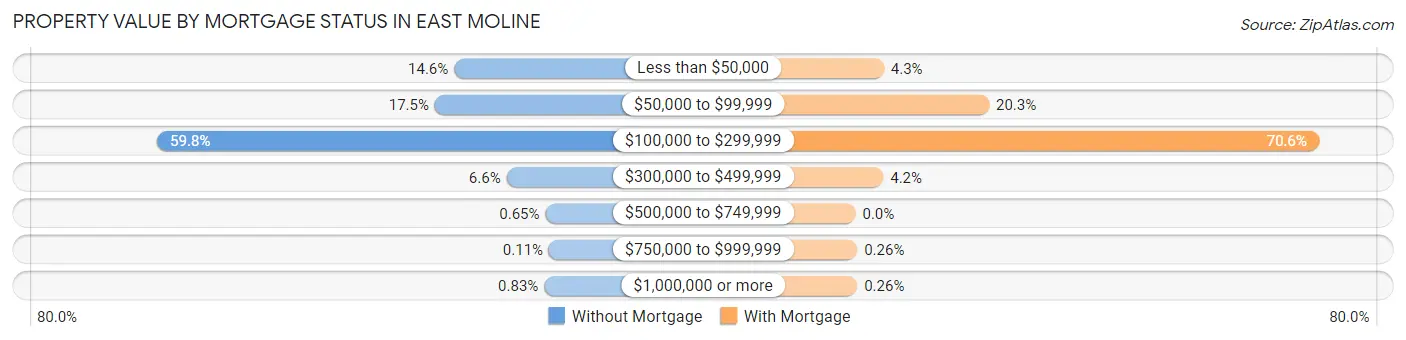
| Property Value | Without Mortgage | With Mortgage |
| Less than $50,000 | 401 (14.5%) | 115 (4.3%) |
| $50,000 to $99,999 | 482 (17.5%) | 543 (20.3%) |
| $100,000 to $299,999 | 1,648 (59.8%) | 1,884 (70.6%) |
| $300,000 to $499,999 | 181 (6.6%) | 113 (4.2%) |
| $500,000 to $749,999 | 18 (0.6%) | 0 (0.0%) |
| $750,000 to $999,999 | 3 (0.1%) | 7 (0.3%) |
| $1,000,000 or more | 23 (0.8%) | 7 (0.3%) |
| Total | 2,756 (100.0%) | 2,669 (100.0%) |
Household Income by Mortgage Status in East Moline
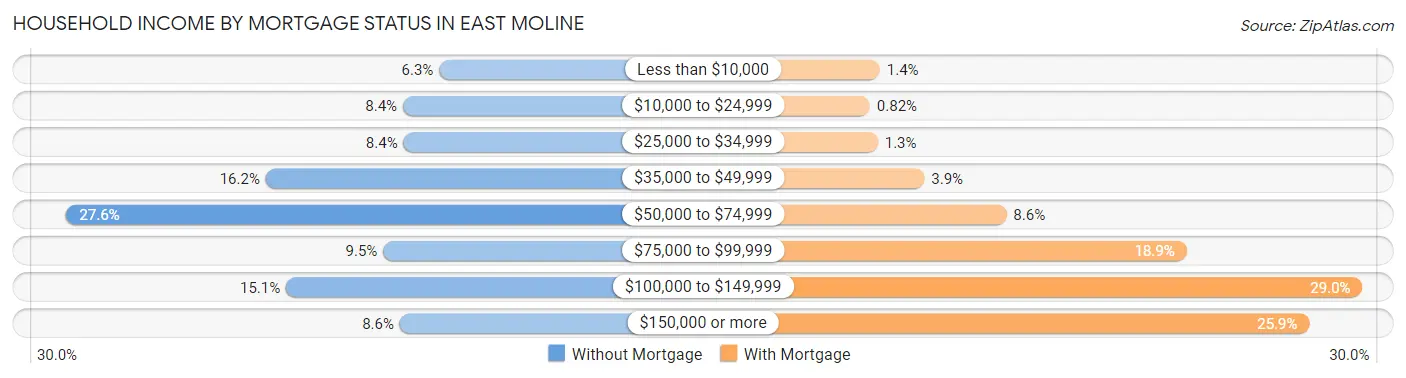
| Household Income | Without Mortgage | With Mortgage |
| Less than $10,000 | 174 (6.3%) | 37 (1.4%) |
| $10,000 to $24,999 | 231 (8.4%) | 22 (0.8%) |
| $25,000 to $34,999 | 230 (8.4%) | 34 (1.3%) |
| $35,000 to $49,999 | 447 (16.2%) | 105 (3.9%) |
| $50,000 to $74,999 | 761 (27.6%) | 230 (8.6%) |
| $75,000 to $99,999 | 262 (9.5%) | 505 (18.9%) |
| $100,000 to $149,999 | 415 (15.1%) | 773 (29.0%) |
| $150,000 or more | 236 (8.6%) | 692 (25.9%) |
| Total | 2,756 (100.0%) | 2,669 (100.0%) |
Property Value to Household Income Ratio in East Moline
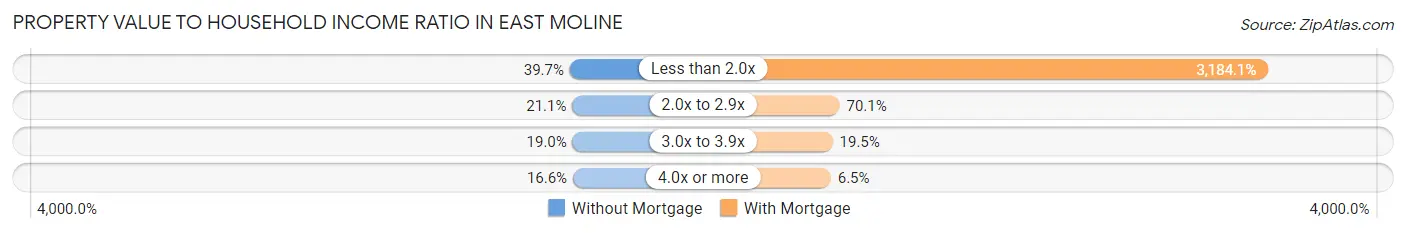
| Value-to-Income Ratio | Without Mortgage | With Mortgage |
| Less than 2.0x | 1,094 (39.7%) | 84,983 (3,184.1%) |
| 2.0x to 2.9x | 581 (21.1%) | 1,870 (70.1%) |
| 3.0x to 3.9x | 523 (19.0%) | 520 (19.5%) |
| 4.0x or more | 457 (16.6%) | 173 (6.5%) |
| Total | 2,756 (100.0%) | 2,669 (100.0%) |
Real Estate Taxes by Mortgage Status in East Moline
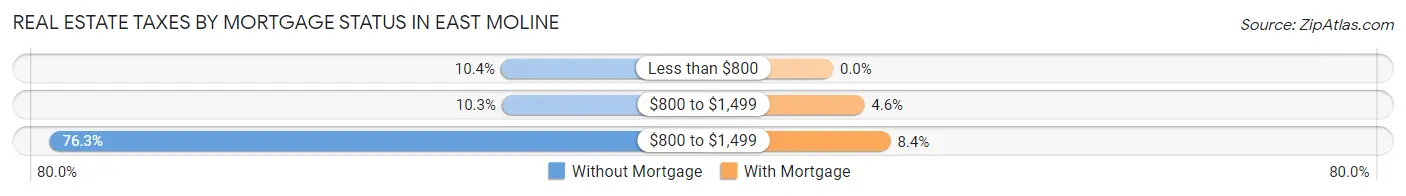
| Property Taxes | Without Mortgage | With Mortgage |
| Less than $800 | 287 (10.4%) | 0 (0.0%) |
| $800 to $1,499 | 283 (10.3%) | 122 (4.6%) |
| $800 to $1,499 | 2,104 (76.3%) | 224 (8.4%) |
| Total | 2,756 (100.0%) | 2,669 (100.0%) |
Health & Disability in East Moline
Health Insurance Coverage by Age in East Moline
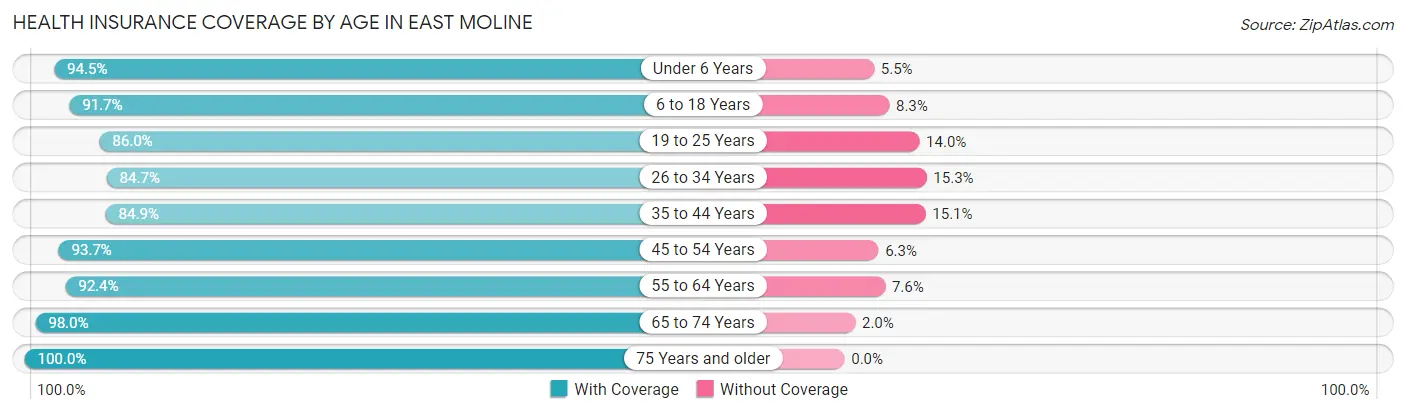
| Age Bracket | With Coverage | Without Coverage |
| Under 6 Years | 1,372 (94.5%) | 80 (5.5%) |
| 6 to 18 Years | 3,694 (91.7%) | 336 (8.3%) |
| 19 to 25 Years | 1,233 (86.0%) | 200 (14.0%) |
| 26 to 34 Years | 1,422 (84.7%) | 257 (15.3%) |
| 35 to 44 Years | 2,235 (84.9%) | 398 (15.1%) |
| 45 to 54 Years | 2,492 (93.7%) | 168 (6.3%) |
| 55 to 64 Years | 2,143 (92.4%) | 176 (7.6%) |
| 65 to 74 Years | 1,616 (98.0%) | 33 (2.0%) |
| 75 Years and older | 1,583 (100.0%) | 0 (0.0%) |
| Total | 17,790 (91.5%) | 1,648 (8.5%) |
Health Insurance Coverage by Citizenship Status in East Moline
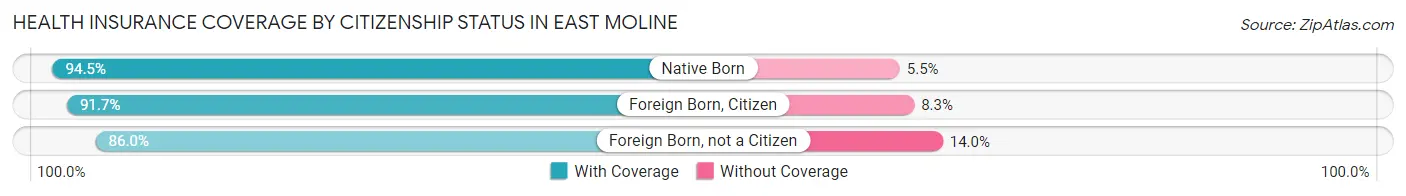
| Citizenship Status | With Coverage | Without Coverage |
| Native Born | 1,372 (94.5%) | 80 (5.5%) |
| Foreign Born, Citizen | 3,694 (91.7%) | 336 (8.3%) |
| Foreign Born, not a Citizen | 1,233 (86.0%) | 200 (14.0%) |
Health Insurance Coverage by Household Income in East Moline
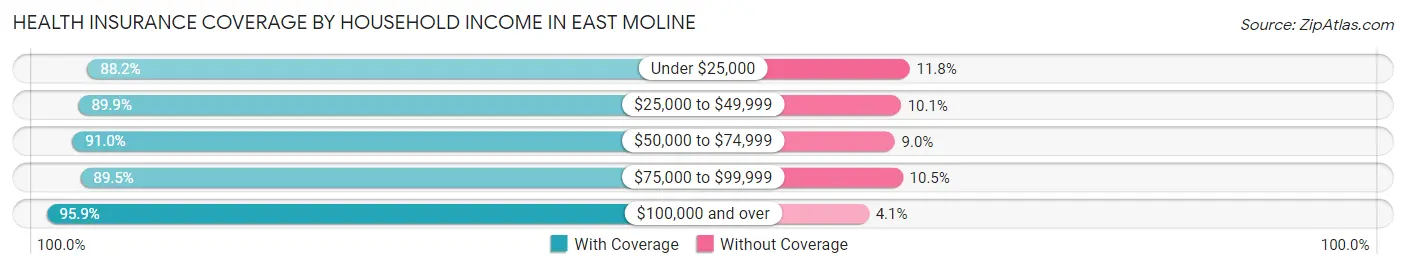
| Household Income | With Coverage | Without Coverage |
| Under $25,000 | 2,634 (88.2%) | 351 (11.8%) |
| $25,000 to $49,999 | 2,938 (89.9%) | 330 (10.1%) |
| $50,000 to $74,999 | 2,999 (91.0%) | 295 (9.0%) |
| $75,000 to $99,999 | 3,757 (89.5%) | 439 (10.5%) |
| $100,000 and over | 5,451 (95.9%) | 233 (4.1%) |
Public vs Private Health Insurance Coverage by Age in East Moline
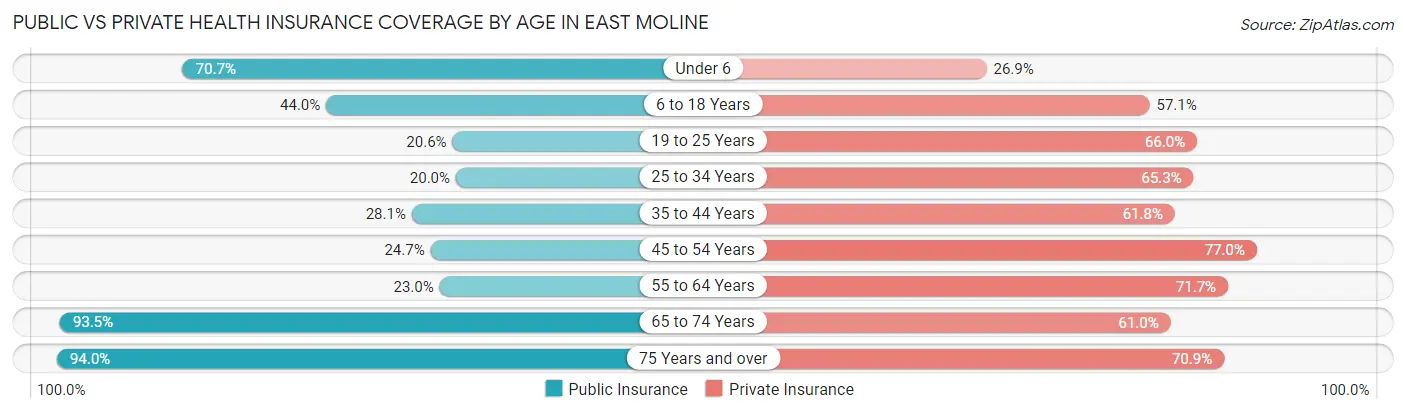
| Age Bracket | Public Insurance | Private Insurance |
| Under 6 | 1,026 (70.7%) | 390 (26.9%) |
| 6 to 18 Years | 1,775 (44.0%) | 2,302 (57.1%) |
| 19 to 25 Years | 295 (20.6%) | 945 (65.9%) |
| 25 to 34 Years | 335 (20.0%) | 1,096 (65.3%) |
| 35 to 44 Years | 741 (28.1%) | 1,627 (61.8%) |
| 45 to 54 Years | 656 (24.7%) | 2,049 (77.0%) |
| 55 to 64 Years | 533 (23.0%) | 1,662 (71.7%) |
| 65 to 74 Years | 1,541 (93.4%) | 1,006 (61.0%) |
| 75 Years and over | 1,488 (94.0%) | 1,123 (70.9%) |
| Total | 8,390 (43.2%) | 12,200 (62.8%) |
Disability Status by Sex by Age in East Moline
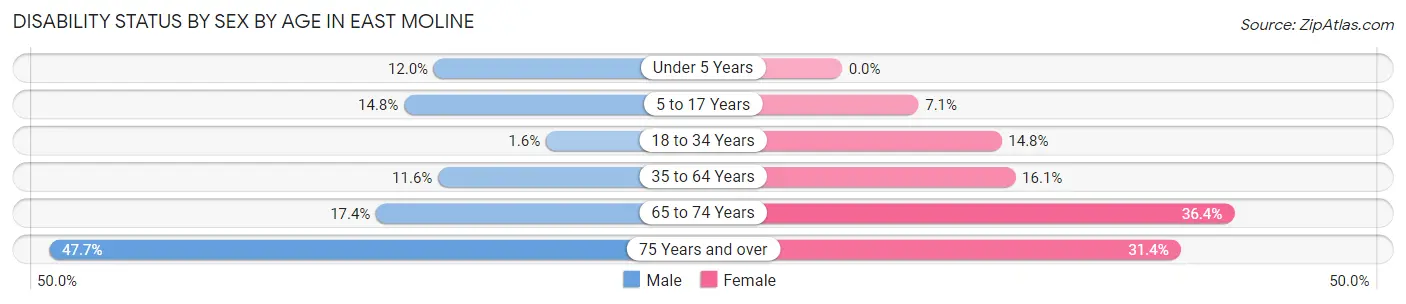
| Age Bracket | Male | Female |
| Under 5 Years | 74 (12.0%) | 0 (0.0%) |
| 5 to 17 Years | 281 (14.8%) | 138 (7.1%) |
| 18 to 34 Years | 25 (1.6%) | 276 (14.8%) |
| 35 to 64 Years | 390 (11.6%) | 685 (16.1%) |
| 65 to 74 Years | 160 (17.4%) | 265 (36.4%) |
| 75 Years and over | 221 (47.7%) | 352 (31.4%) |
Disability Class by Sex by Age in East Moline
Disability Class: Hearing Difficulty
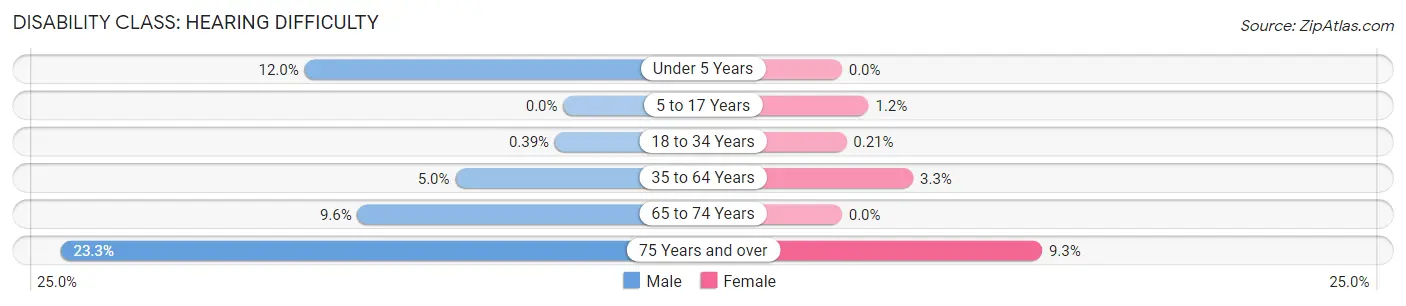
| Age Bracket | Male | Female |
| Under 5 Years | 74 (12.0%) | 0 (0.0%) |
| 5 to 17 Years | 0 (0.0%) | 24 (1.2%) |
| 18 to 34 Years | 6 (0.4%) | 4 (0.2%) |
| 35 to 64 Years | 168 (5.0%) | 141 (3.3%) |
| 65 to 74 Years | 88 (9.6%) | 0 (0.0%) |
| 75 Years and over | 108 (23.3%) | 104 (9.3%) |
Disability Class: Vision Difficulty
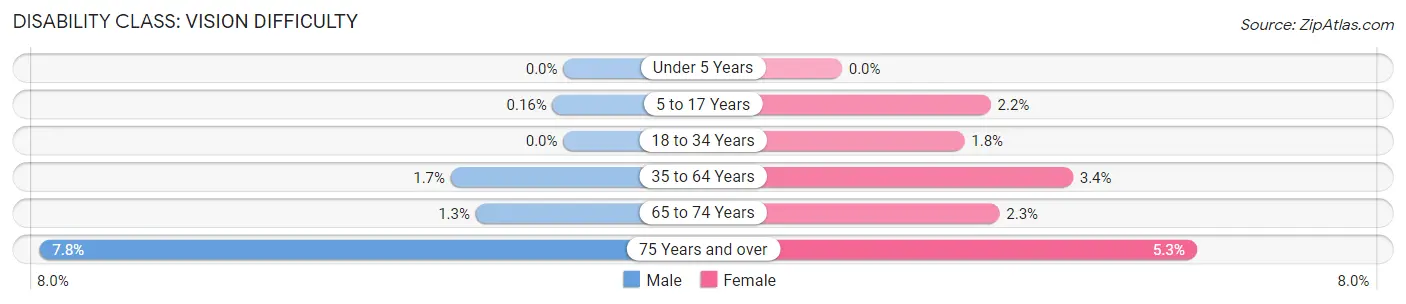
| Age Bracket | Male | Female |
| Under 5 Years | 0 (0.0%) | 0 (0.0%) |
| 5 to 17 Years | 3 (0.2%) | 43 (2.2%) |
| 18 to 34 Years | 0 (0.0%) | 34 (1.8%) |
| 35 to 64 Years | 56 (1.7%) | 146 (3.4%) |
| 65 to 74 Years | 12 (1.3%) | 17 (2.3%) |
| 75 Years and over | 36 (7.8%) | 59 (5.3%) |
Disability Class: Cognitive Difficulty
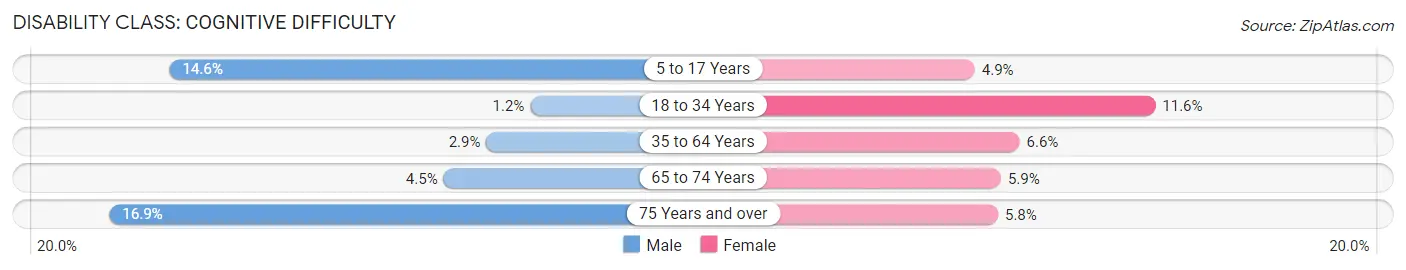
| Age Bracket | Male | Female |
| 5 to 17 Years | 278 (14.6%) | 96 (4.9%) |
| 18 to 34 Years | 19 (1.2%) | 217 (11.6%) |
| 35 to 64 Years | 96 (2.9%) | 281 (6.6%) |
| 65 to 74 Years | 41 (4.4%) | 43 (5.9%) |
| 75 Years and over | 78 (16.9%) | 65 (5.8%) |
Disability Class: Ambulatory Difficulty
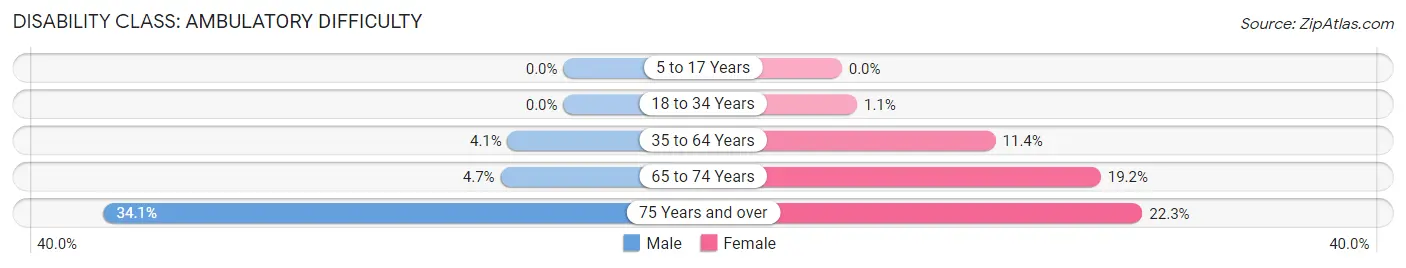
| Age Bracket | Male | Female |
| 5 to 17 Years | 0 (0.0%) | 0 (0.0%) |
| 18 to 34 Years | 0 (0.0%) | 21 (1.1%) |
| 35 to 64 Years | 139 (4.1%) | 486 (11.4%) |
| 65 to 74 Years | 43 (4.7%) | 140 (19.2%) |
| 75 Years and over | 158 (34.1%) | 250 (22.3%) |
Disability Class: Self-Care Difficulty
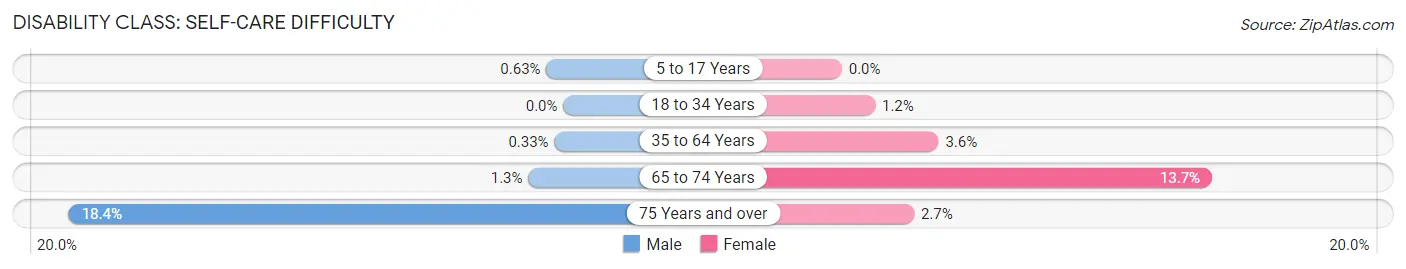
| Age Bracket | Male | Female |
| 5 to 17 Years | 12 (0.6%) | 0 (0.0%) |
| 18 to 34 Years | 0 (0.0%) | 23 (1.2%) |
| 35 to 64 Years | 11 (0.3%) | 153 (3.6%) |
| 65 to 74 Years | 12 (1.3%) | 100 (13.7%) |
| 75 Years and over | 85 (18.4%) | 30 (2.7%) |
Technology Access in East Moline
Computing Device Access in East Moline
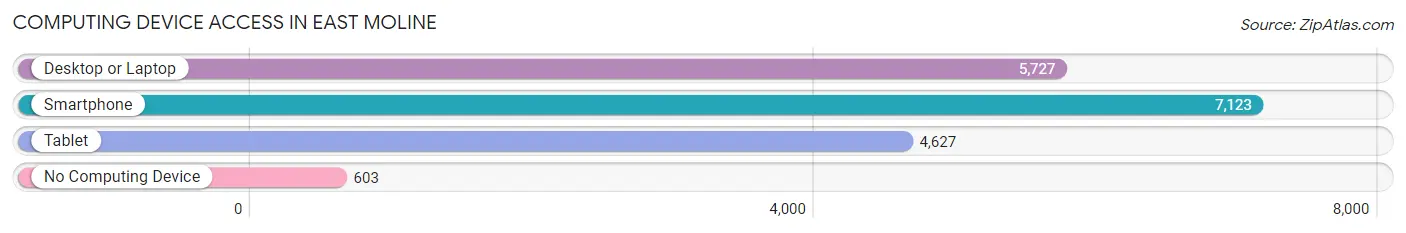
| Device Type | # Households | % Households |
| Desktop or Laptop | 5,727 | 69.2% |
| Smartphone | 7,123 | 86.1% |
| Tablet | 4,627 | 55.9% |
| No Computing Device | 603 | 7.3% |
| Total | 8,275 | 100.0% |
Internet Access in East Moline
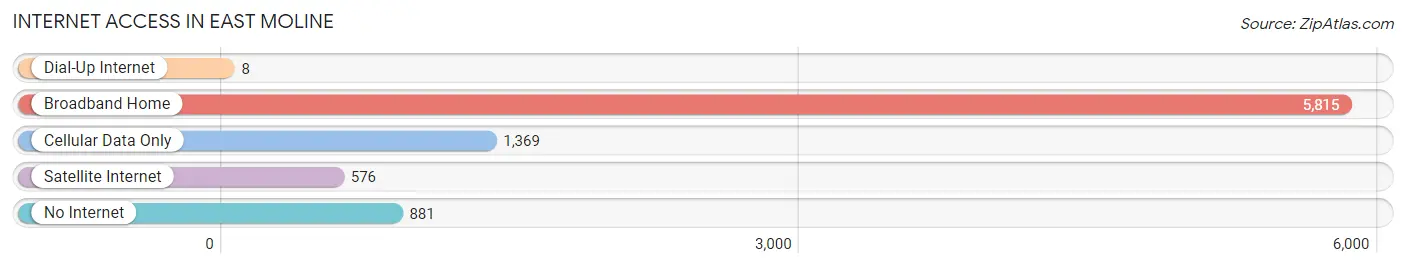
| Internet Type | # Households | % Households |
| Dial-Up Internet | 8 | 0.1% |
| Broadband Home | 5,815 | 70.3% |
| Cellular Data Only | 1,369 | 16.5% |
| Satellite Internet | 576 | 7.0% |
| No Internet | 881 | 10.6% |
| Total | 8,275 | 100.0% |
East Moline Summary
East Moline is a city located in Rock Island County, Illinois, United States. It is part of the Quad Cities metropolitan area, which includes the cities of Davenport and Bettendorf in Iowa, and Rock Island, Moline, and East Moline in Illinois. The population of East Moline was 23,303 at the 2010 census, making it the fifth-largest city in the Quad Cities.
History
East Moline was first settled in 1836 by William and Mary Ann Coleman, who built a log cabin on the banks of the Mississippi River. The city was originally known as Coleman’s Grove, and was later renamed East Moline in 1872. The city was incorporated in 1892.
East Moline was an important industrial center in the early 20th century, with several large factories located in the city. The most prominent of these was the International Harvester plant, which opened in 1902 and employed thousands of workers until it closed in 1982.
Geography
East Moline is located at 41°30′N 90°26′W (41.50, -90.43). According to the 2010 census, the city has a total area of 11.2 square miles (29.0 km2), of which 10.9 square miles (28.2 km2) is land and 0.3 square miles (0.8 km2) is water.
East Moline is located on the banks of the Mississippi River, and is bordered by the cities of Moline to the west, Silvis to the north, and Carbon Cliff to the south.
Economy
East Moline’s economy is largely based on manufacturing and agriculture. The city is home to several large manufacturing plants, including John Deere, Case IH, and Komatsu. The city is also home to several agricultural businesses, including grain elevators, feed mills, and livestock operations.
The city is also home to several retail businesses, including a Walmart Supercenter, a Target, and several restaurants.
Demographics
As of the 2010 census, there were 23,303 people, 9,717 households, and 6,541 families residing in the city. The population density was 2,128.3 people per square mile (821.7/km2). There were 10,541 housing units at an average density of 963.3 per square mile (371.7/km2). The racial makeup of the city was 79.2% White, 14.2% African American, 0.4% Native American, 1.2% Asian, 0.1% Pacific Islander, 2.7% from other races, and 2.2% from two or more races. Hispanic or Latino of any race were 6.7% of the population.
There were 9,717 households, out of which 30.2% had children under the age of 18 living with them, 46.2% were married couples living together, 14.7% had a female householder with no husband present, and 34.2% were non-families. 28.7% of all households were made up of individuals, and 11.3% had someone living alone who was 65 years of age or older. The average household size was 2.41 and the average family size was 2.94.
In the city, the population was spread out, with 24.2% under the age of 18, 8.7% from 18 to 24, 28.2% from 25 to 44, 23.2% from 45 to 64, and 15.7% who were 65 years of age or older. The median age was 37 years. For every 100 females, there were 93.2 males. For every 100 females age 18 and over, there were 89.3 males.
The median income for a household in the city was $41,945, and the median income for a family was $50,945. Males had a median income of $41,945 versus $30,945 for females. The per capita income for the city was $20,945. About 8.7% of families and 11.3% of the population were below the poverty line, including 16.7% of those under age 18 and 8.7% of those age 65 or over.
Common Questions
What is Per Capita Income in East Moline?
Per Capita income in East Moline is $27,609.
What is the Median Family Income in East Moline?
Median Family Income in East Moline is $80,364.
What is the Median Household income in East Moline?
Median Household Income in East Moline is $60,032.
What is Income or Wage Gap in East Moline?
Income or Wage Gap in East Moline is 44.0%.
Women in East Moline earn 56.0 cents for every dollar earned by a man.
What is Inequality or Gini Index in East Moline?
Inequality or Gini Index in East Moline is 0.41.
What is the Total Population of East Moline?
Total Population of East Moline is 20,937.
What is the Total Male Population of East Moline?
Total Male Population of East Moline is 10,074.
What is the Total Female Population of East Moline?
Total Female Population of East Moline is 10,863.
What is the Ratio of Males per 100 Females in East Moline?
There are 92.74 Males per 100 Females in East Moline.
What is the Ratio of Females per 100 Males in East Moline?
There are 107.83 Females per 100 Males in East Moline.
What is the Median Population Age in East Moline?
Median Population Age in East Moline is 39.5 Years.
What is the Average Family Size in East Moline
Average Family Size in East Moline is 3.0 People.
What is the Average Household Size in East Moline
Average Household Size in East Moline is 2.4 People.
How Large is the Labor Force in East Moline?
There are 9,600 People in the Labor Forcein in East Moline.
What is the Percentage of People in the Labor Force in East Moline?
58.6% of People are in the Labor Force in East Moline.
What is the Unemployment Rate in East Moline?
Unemployment Rate in East Moline is 4.1%.