Fulda, MN Map & Demographics
Fulda Map
Fulda Overview
$33,182
PER CAPITA INCOME
$95,139
AVG FAMILY INCOME
$69,583
AVG HOUSEHOLD INCOME
33.9%
WAGE / INCOME GAP [ % ]
66.1¢/ $1
WAGE / INCOME GAP [ $ ]
0.37
INEQUALITY / GINI INDEX
1,377
TOTAL POPULATION
636
MALE POPULATION
741
FEMALE POPULATION
85.83
MALES / 100 FEMALES
116.51
FEMALES / 100 MALES
44.6
MEDIAN AGE
3.1
AVG FAMILY SIZE
2.2
AVG HOUSEHOLD SIZE
711
LABOR FORCE [ PEOPLE ]
66.5%
PERCENT IN LABOR FORCE
1.4%
UNEMPLOYMENT RATE
Fulda Zip Codes
Fulda Area Codes
Income in Fulda
Income Overview in Fulda
Per Capita Income in Fulda is $33,182, while median incomes of families and households are $95,139 and $69,583 respectively.
| Characteristic | Number | Measure |
| Per Capita Income | 1,377 | $33,182 |
| Median Family Income | 303 | $95,139 |
| Mean Family Income | 303 | $100,123 |
| Median Household Income | 583 | $69,583 |
| Mean Household Income | 583 | $76,025 |
| Income Deficit | 303 | $0 |
| Wage / Income Gap (%) | 1,377 | 33.90% |
| Wage / Income Gap ($) | 1,377 | 66.10¢ per $1 |
| Gini / Inequality Index | 1,377 | 0.37 |
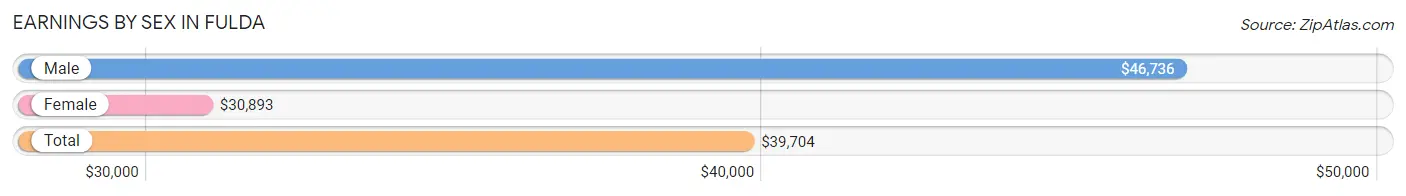
Earnings by Sex in Fulda
Average Earnings in Fulda are $39,704, $46,736 for men and $30,893 for women, a difference of 33.9%.
| Sex | Number | Average Earnings |
| Male | 379 (49.0%) | $46,736 |
| Female | 394 (51.0%) | $30,893 |
| Total | 773 (100.0%) | $39,704 |
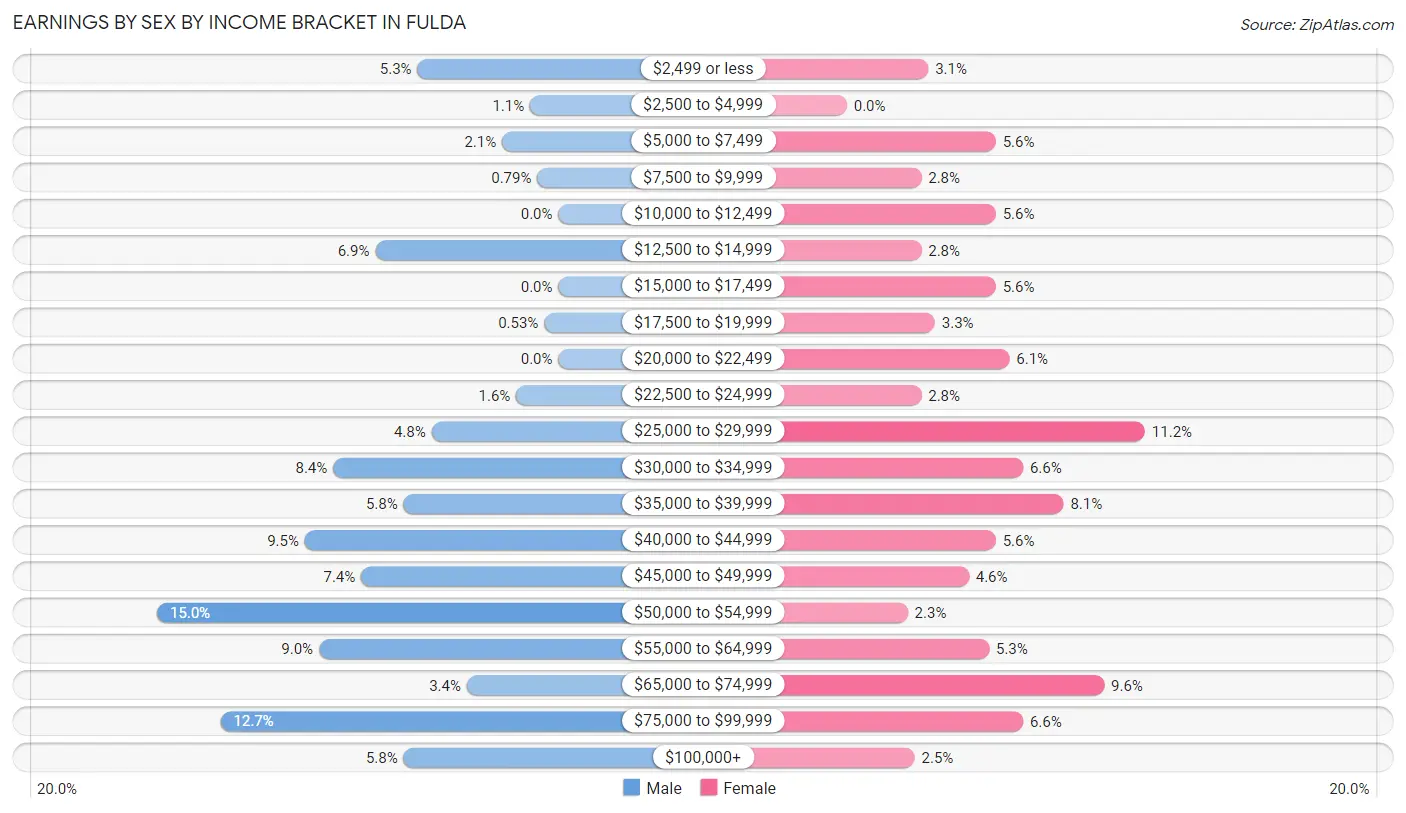
Earnings by Sex by Income Bracket in Fulda
The most common earnings brackets in Fulda are $50,000 to $54,999 for men (57 | 15.0%) and $25,000 to $29,999 for women (44 | 11.2%).
| Income | Male | Female |
| $2,499 or less | 20 (5.3%) | 12 (3.0%) |
| $2,500 to $4,999 | 4 (1.1%) | 0 (0.0%) |
| $5,000 to $7,499 | 8 (2.1%) | 22 (5.6%) |
| $7,500 to $9,999 | 3 (0.8%) | 11 (2.8%) |
| $10,000 to $12,499 | 0 (0.0%) | 22 (5.6%) |
| $12,500 to $14,999 | 26 (6.9%) | 11 (2.8%) |
| $15,000 to $17,499 | 0 (0.0%) | 22 (5.6%) |
| $17,500 to $19,999 | 2 (0.5%) | 13 (3.3%) |
| $20,000 to $22,499 | 0 (0.0%) | 24 (6.1%) |
| $22,500 to $24,999 | 6 (1.6%) | 11 (2.8%) |
| $25,000 to $29,999 | 18 (4.8%) | 44 (11.2%) |
| $30,000 to $34,999 | 32 (8.4%) | 26 (6.6%) |
| $35,000 to $39,999 | 22 (5.8%) | 32 (8.1%) |
| $40,000 to $44,999 | 36 (9.5%) | 22 (5.6%) |
| $45,000 to $49,999 | 28 (7.4%) | 18 (4.6%) |
| $50,000 to $54,999 | 57 (15.0%) | 9 (2.3%) |
| $55,000 to $64,999 | 34 (9.0%) | 21 (5.3%) |
| $65,000 to $74,999 | 13 (3.4%) | 38 (9.6%) |
| $75,000 to $99,999 | 48 (12.7%) | 26 (6.6%) |
| $100,000+ | 22 (5.8%) | 10 (2.5%) |
| Total | 379 (100.0%) | 394 (100.0%) |
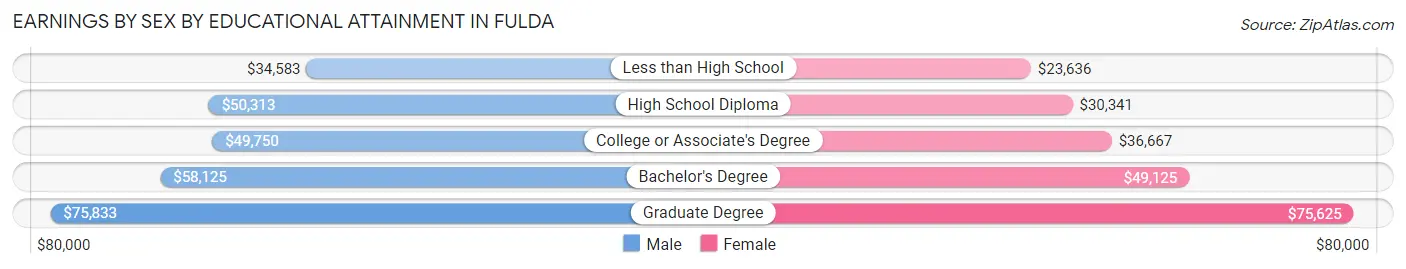
Earnings by Sex by Educational Attainment in Fulda
Average earnings in Fulda are $50,449 for men and $34,688 for women, a difference of 31.2%. Men with an educational attainment of graduate degree enjoy the highest average annual earnings of $75,833, while those with less than high school education earn the least with $34,583. Women with an educational attainment of graduate degree earn the most with the average annual earnings of $75,625, while those with less than high school education have the smallest earnings of $23,636.
| Educational Attainment | Male Income | Female Income |
| Less than High School | $34,583 | $23,636 |
| High School Diploma | $50,313 | $30,341 |
| College or Associate's Degree | $49,750 | $36,667 |
| Bachelor's Degree | $58,125 | $49,125 |
| Graduate Degree | $75,833 | $75,625 |
| Total | $50,449 | $34,688 |
Family Income in Fulda
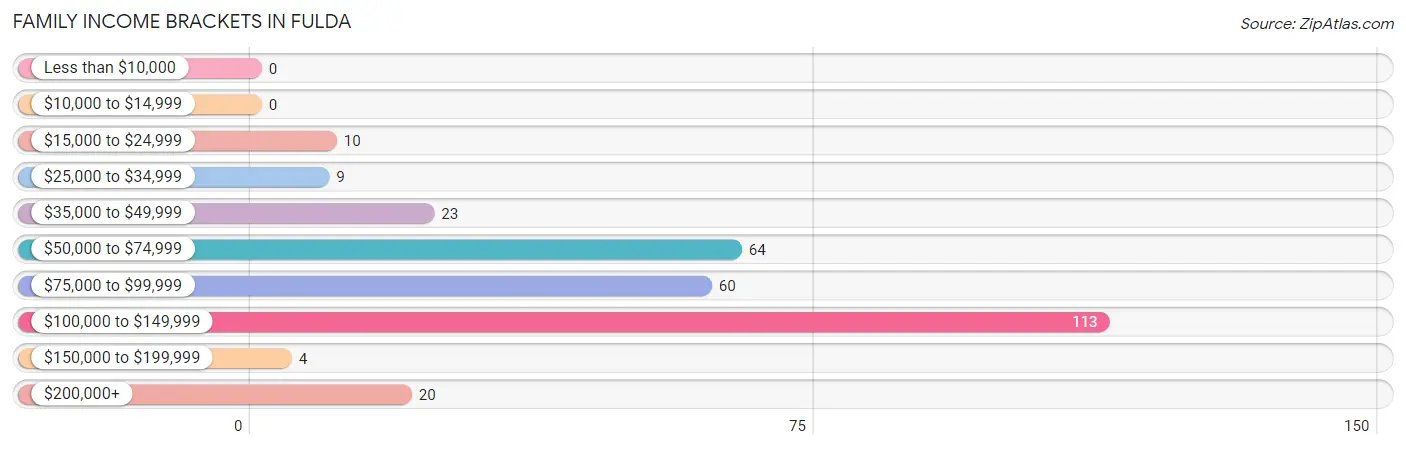
Family Income Brackets in Fulda
According to the Fulda family income data, there are 113 families falling into the $100,000 to $149,999 income range, which is the most common income bracket and makes up 37.3% of all families.
| Income Bracket | # Families | % Families |
| Less than $10,000 | 0 | 0.0% |
| $10,000 to $14,999 | 0 | 0.0% |
| $15,000 to $24,999 | 10 | 3.3% |
| $25,000 to $34,999 | 9 | 3.0% |
| $35,000 to $49,999 | 23 | 7.6% |
| $50,000 to $74,999 | 64 | 21.1% |
| $75,000 to $99,999 | 60 | 19.8% |
| $100,000 to $149,999 | 113 | 37.3% |
| $150,000 to $199,999 | 4 | 1.3% |
| $200,000+ | 20 | 6.6% |
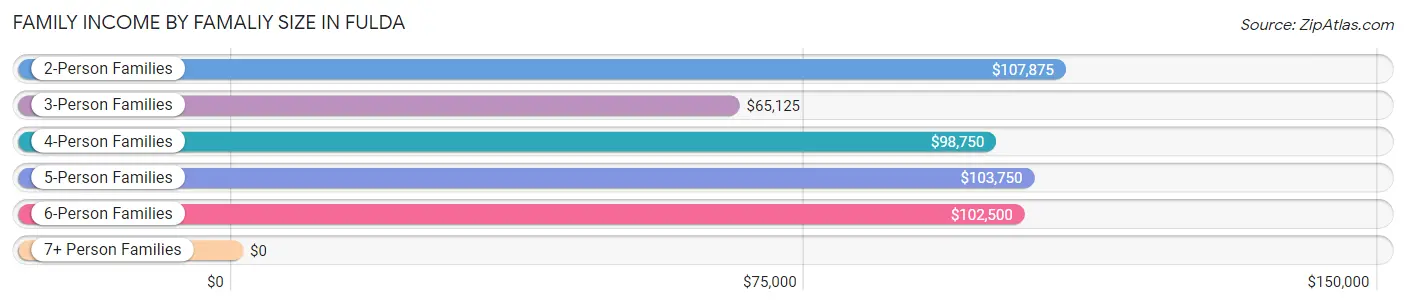
Family Income by Famaliy Size in Fulda
2-person families (159 | 52.5%) account for the highest median family income in Fulda with $107,875 per family, while 2-person families (159 | 52.5%) have the highest median income of $53,938 per family member.
| Income Bracket | # Families | Median Income |
| 2-Person Families | 159 (52.5%) | $107,875 |
| 3-Person Families | 41 (13.5%) | $65,125 |
| 4-Person Families | 42 (13.9%) | $98,750 |
| 5-Person Families | 36 (11.9%) | $103,750 |
| 6-Person Families | 22 (7.3%) | $102,500 |
| 7+ Person Families | 3 (1.0%) | $0 |
| Total | 303 (100.0%) | $95,139 |
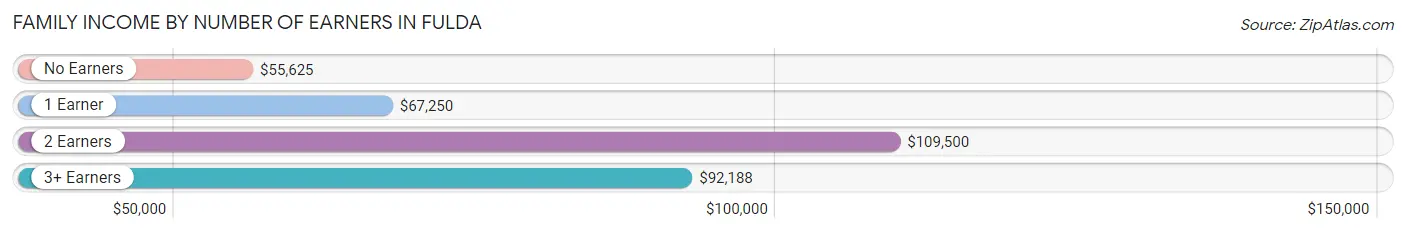
Family Income by Number of Earners in Fulda
The median family income in Fulda is $95,139, with families comprising 2 earners (174) having the highest median family income of $109,500, while families with no earners (20) have the lowest median family income of $55,625, accounting for 57.4% and 6.6% of families, respectively.
| Number of Earners | # Families | Median Income |
| No Earners | 20 (6.6%) | $55,625 |
| 1 Earner | 76 (25.1%) | $67,250 |
| 2 Earners | 174 (57.4%) | $109,500 |
| 3+ Earners | 33 (10.9%) | $92,188 |
| Total | 303 (100.0%) | $95,139 |
Household Income in Fulda
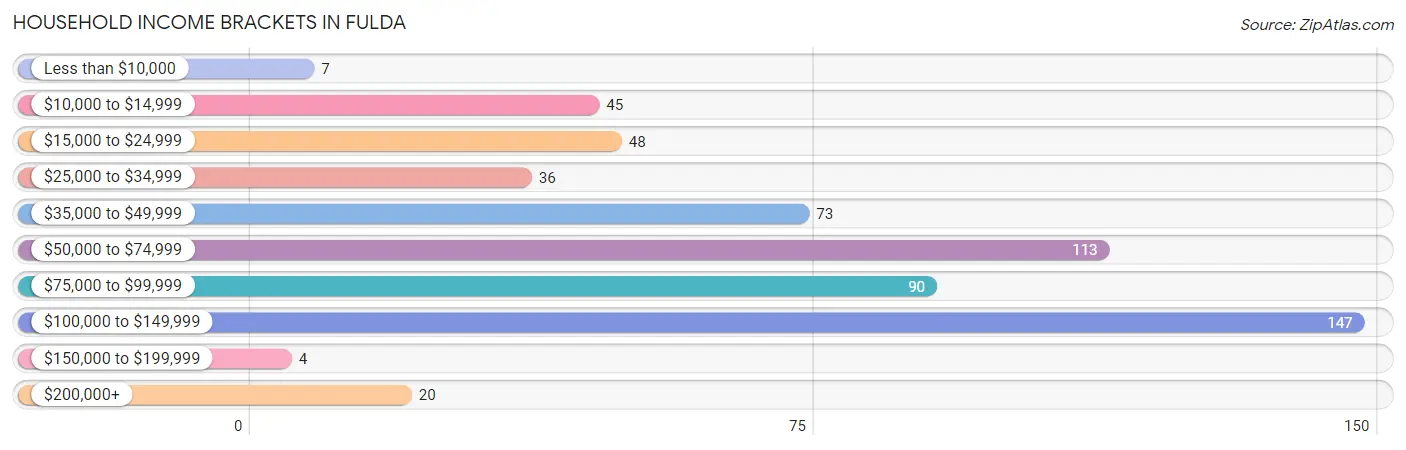
Household Income Brackets in Fulda
With 147 households falling in the category, the $100,000 to $149,999 income range is the most frequent in Fulda, accounting for 25.2% of all households. In contrast, only 4 households (0.7%) fall into the $150,000 to $199,999 income bracket, making it the least populous group.
| Income Bracket | # Households | % Households |
| Less than $10,000 | 7 | 1.2% |
| $10,000 to $14,999 | 45 | 7.7% |
| $15,000 to $24,999 | 48 | 8.2% |
| $25,000 to $34,999 | 36 | 6.2% |
| $35,000 to $49,999 | 73 | 12.5% |
| $50,000 to $74,999 | 113 | 19.4% |
| $75,000 to $99,999 | 90 | 15.4% |
| $100,000 to $149,999 | 147 | 25.2% |
| $150,000 to $199,999 | 4 | 0.7% |
| $200,000+ | 20 | 3.4% |
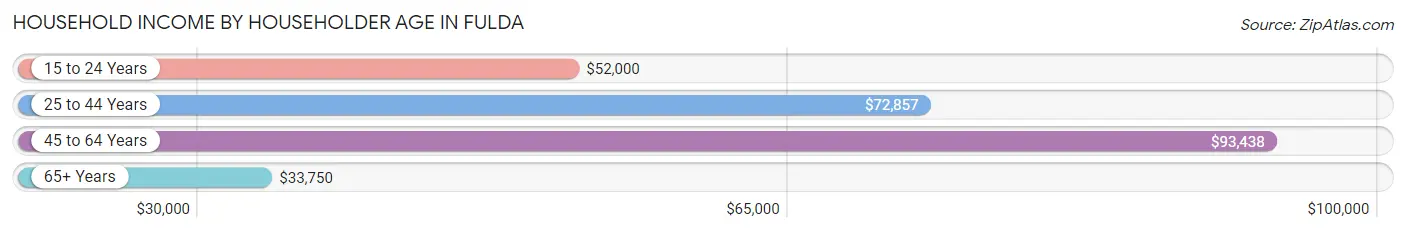
Household Income by Householder Age in Fulda
The median household income in Fulda is $69,583, with the highest median household income of $93,438 found in the 45 to 64 years age bracket for the primary householder. A total of 245 households (42.0%) fall into this category. Meanwhile, the 65+ years age bracket for the primary householder has the lowest median household income of $33,750, with 180 households (30.9%) in this group.
| Income Bracket | # Households | Median Income |
| 15 to 24 Years | 32 (5.5%) | $52,000 |
| 25 to 44 Years | 126 (21.6%) | $72,857 |
| 45 to 64 Years | 245 (42.0%) | $93,438 |
| 65+ Years | 180 (30.9%) | $33,750 |
| Total | 583 (100.0%) | $69,583 |
Poverty in Fulda
Income Below Poverty by Sex and Age in Fulda
With 5.2% poverty level for males and 9.3% for females among the residents of Fulda, 65 to 74 year old males and 75 year old and over females are the most vulnerable to poverty, with 10 males (14.7%) and 27 females (29.7%) in their respective age groups living below the poverty level.
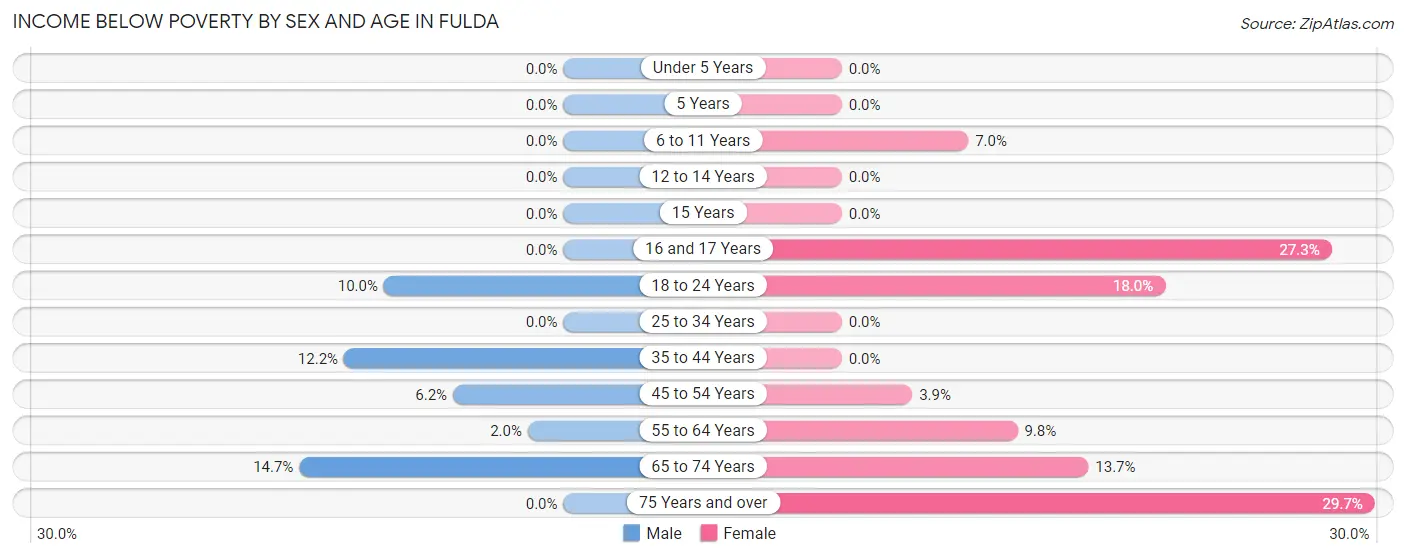
| Age Bracket | Male | Female |
| Under 5 Years | 0 (0.0%) | 0 (0.0%) |
| 5 Years | 0 (0.0%) | 0 (0.0%) |
| 6 to 11 Years | 0 (0.0%) | 5 (7.0%) |
| 12 to 14 Years | 0 (0.0%) | 0 (0.0%) |
| 15 Years | 0 (0.0%) | 0 (0.0%) |
| 16 and 17 Years | 0 (0.0%) | 3 (27.3%) |
| 18 to 24 Years | 5 (10.0%) | 9 (18.0%) |
| 25 to 34 Years | 0 (0.0%) | 0 (0.0%) |
| 35 to 44 Years | 11 (12.2%) | 0 (0.0%) |
| 45 to 54 Years | 4 (6.1%) | 4 (3.9%) |
| 55 to 64 Years | 2 (2.0%) | 9 (9.8%) |
| 65 to 74 Years | 10 (14.7%) | 7 (13.7%) |
| 75 Years and over | 0 (0.0%) | 27 (29.7%) |
| Total | 32 (5.2%) | 64 (9.3%) |
Income Above Poverty by Sex and Age in Fulda
According to the poverty statistics in Fulda, males aged under 5 years and females aged under 5 years are the age groups that are most secure financially, with 100.0% of males and 100.0% of females in these age groups living above the poverty line.
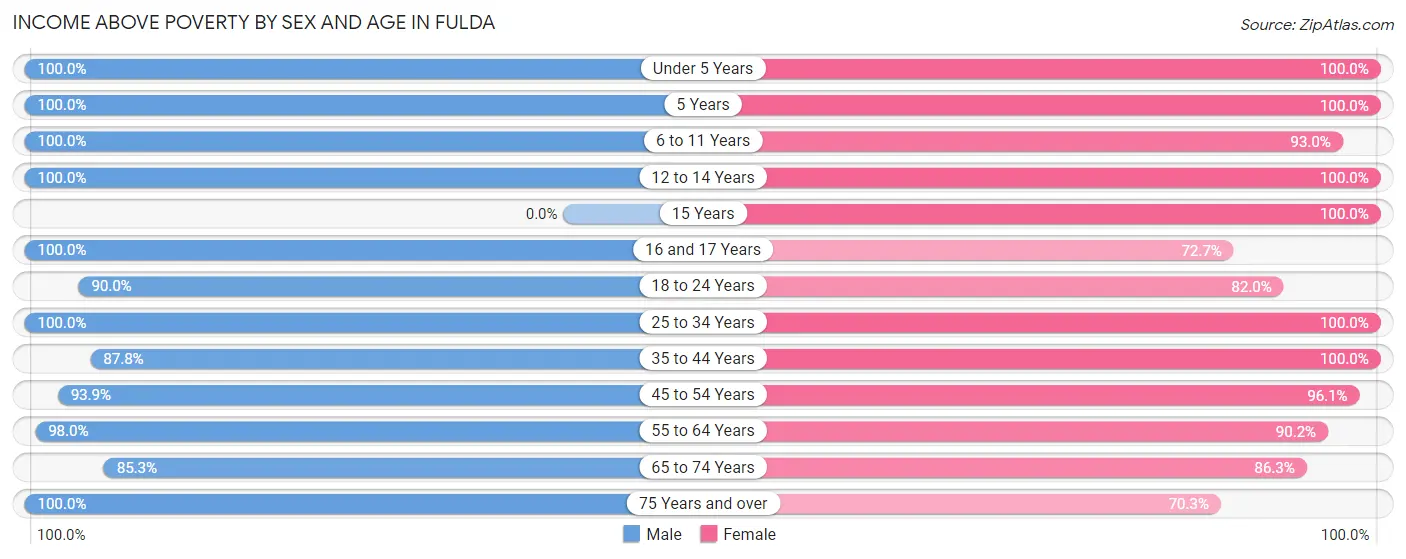
| Age Bracket | Male | Female |
| Under 5 Years | 23 (100.0%) | 43 (100.0%) |
| 5 Years | 3 (100.0%) | 2 (100.0%) |
| 6 to 11 Years | 105 (100.0%) | 66 (93.0%) |
| 12 to 14 Years | 12 (100.0%) | 26 (100.0%) |
| 15 Years | 0 (0.0%) | 9 (100.0%) |
| 16 and 17 Years | 21 (100.0%) | 8 (72.7%) |
| 18 to 24 Years | 45 (90.0%) | 41 (82.0%) |
| 25 to 34 Years | 39 (100.0%) | 89 (100.0%) |
| 35 to 44 Years | 79 (87.8%) | 50 (100.0%) |
| 45 to 54 Years | 61 (93.9%) | 98 (96.1%) |
| 55 to 64 Years | 99 (98.0%) | 83 (90.2%) |
| 65 to 74 Years | 58 (85.3%) | 44 (86.3%) |
| 75 Years and over | 39 (100.0%) | 64 (70.3%) |
| Total | 584 (94.8%) | 623 (90.7%) |
Income Below Poverty Among Married-Couple Families in Fulda
The poverty statistics for married-couple families in Fulda show that 1.7% or 4 of the total 232 families live below the poverty line. Families with 1 or 2 children have the highest poverty rate of 12.5%, comprising of 4 families. On the other hand, families with no children have the lowest poverty rate of 0.0%, which includes 0 families.
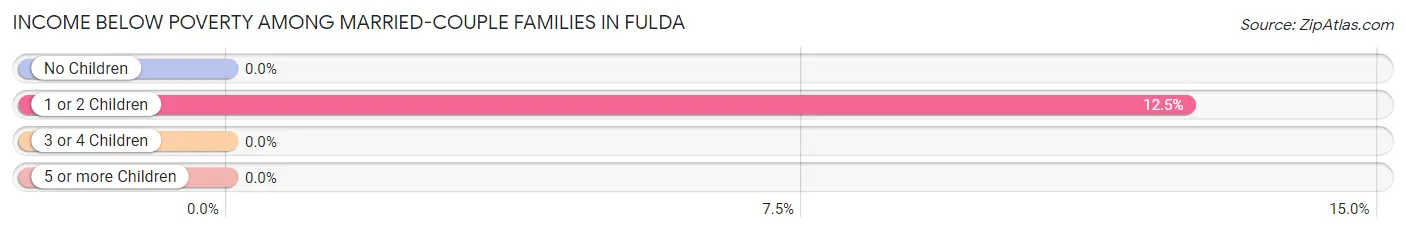
| Children | Above Poverty | Below Poverty |
| No Children | 143 (100.0%) | 0 (0.0%) |
| 1 or 2 Children | 28 (87.5%) | 4 (12.5%) |
| 3 or 4 Children | 54 (100.0%) | 0 (0.0%) |
| 5 or more Children | 3 (100.0%) | 0 (0.0%) |
| Total | 228 (98.3%) | 4 (1.7%) |
Income Below Poverty Among Single-Parent Households in Fulda
| Children | Single Father | Single Mother |
| No Children | 0 (0.0%) | 0 (0.0%) |
| 1 or 2 Children | 0 (0.0%) | 0 (0.0%) |
| 3 or 4 Children | 0 (0.0%) | 0 (0.0%) |
| 5 or more Children | 0 (0.0%) | 0 (0.0%) |
| Total | 0 (0.0%) | 0 (0.0%) |
Income Below Poverty Among Married-Couple vs Single-Parent Households in Fulda
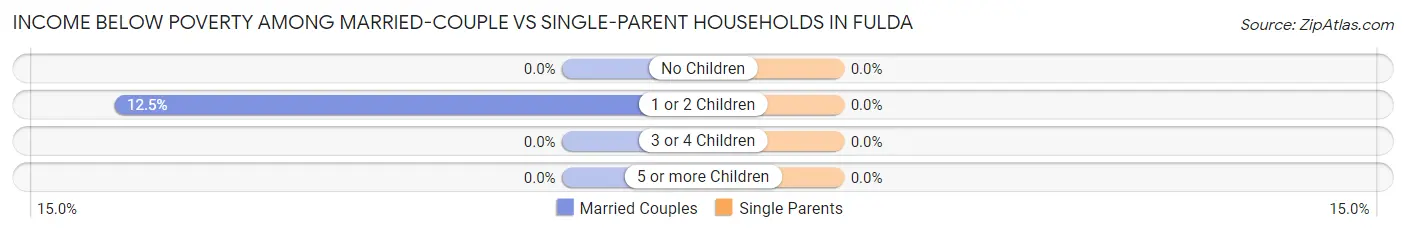
| Children | Married-Couple Families | Single-Parent Households |
| No Children | 0 (0.0%) | 0 (0.0%) |
| 1 or 2 Children | 4 (12.5%) | 0 (0.0%) |
| 3 or 4 Children | 0 (0.0%) | 0 (0.0%) |
| 5 or more Children | 0 (0.0%) | 0 (0.0%) |
| Total | 4 (1.7%) | 0 (0.0%) |
Race in Fulda
The most populous races in Fulda are White / Caucasian (1,140 | 82.8%), Asian (107 | 7.8%), and Two or more Races (103 | 7.5%).
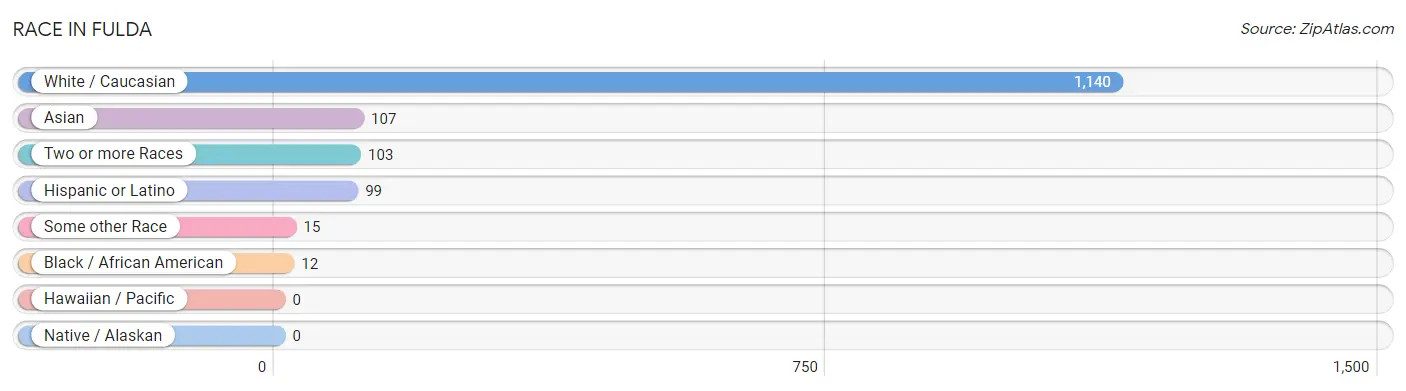
| Race | # Population | % Population |
| Asian | 107 | 7.8% |
| Black / African American | 12 | 0.9% |
| Hawaiian / Pacific | 0 | 0.0% |
| Hispanic or Latino | 99 | 7.2% |
| Native / Alaskan | 0 | 0.0% |
| White / Caucasian | 1,140 | 82.8% |
| Two or more Races | 103 | 7.5% |
| Some other Race | 15 | 1.1% |
| Total | 1,377 | 100.0% |
Ancestry in Fulda
The most populous ancestries reported in Fulda are German (660 | 47.9%), Indonesian (120 | 8.7%), Norwegian (96 | 7.0%), Dutch (80 | 5.8%), and Irish (69 | 5.0%), together accounting for 74.4% of all Fulda residents.
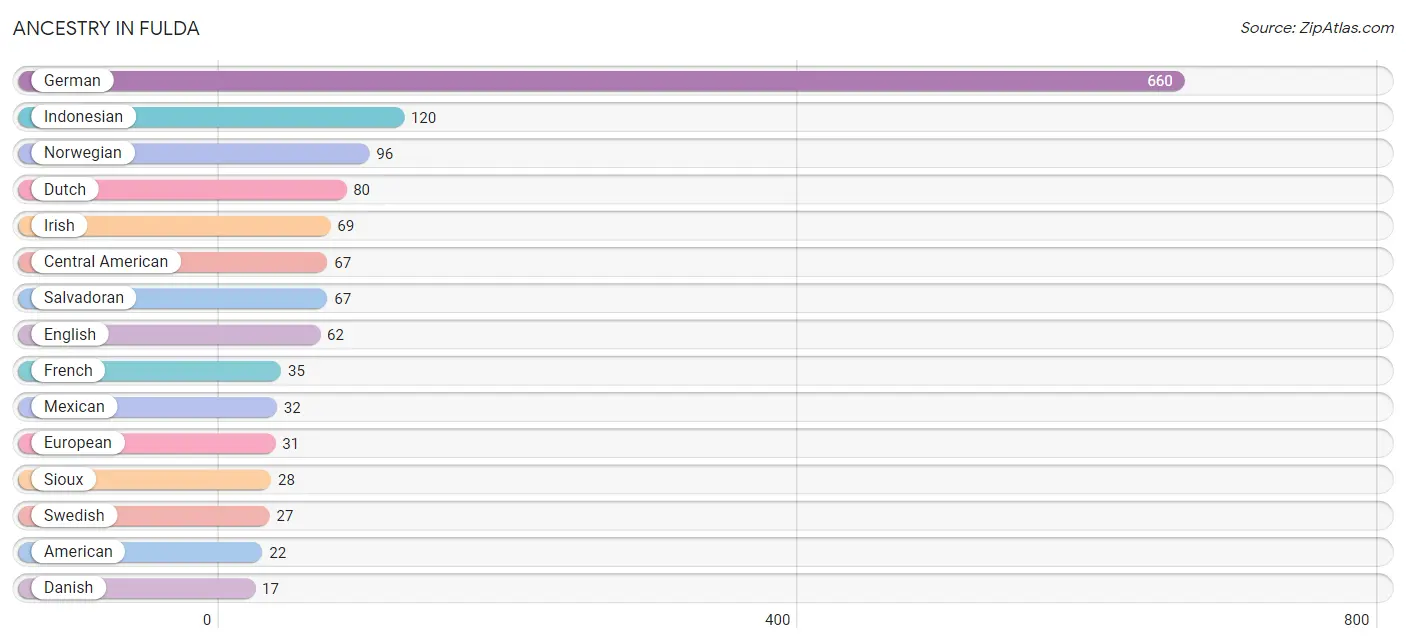
| Ancestry | # Population | % Population |
| American | 22 | 1.6% |
| Belgian | 3 | 0.2% |
| Central American | 67 | 4.9% |
| Czech | 4 | 0.3% |
| Czechoslovakian | 3 | 0.2% |
| Danish | 17 | 1.2% |
| Dutch | 80 | 5.8% |
| English | 62 | 4.5% |
| European | 31 | 2.2% |
| French | 35 | 2.5% |
| German | 660 | 47.9% |
| Indonesian | 120 | 8.7% |
| Irish | 69 | 5.0% |
| Italian | 11 | 0.8% |
| Mexican | 32 | 2.3% |
| Norwegian | 96 | 7.0% |
| Pakistani | 16 | 1.2% |
| Polish | 8 | 0.6% |
| Salvadoran | 67 | 4.9% |
| Scandinavian | 4 | 0.3% |
| Scotch-Irish | 5 | 0.4% |
| Sioux | 28 | 2.0% |
| Slovak | 3 | 0.2% |
| Swedish | 27 | 2.0% | View All 24 Rows |
Immigrants in Fulda
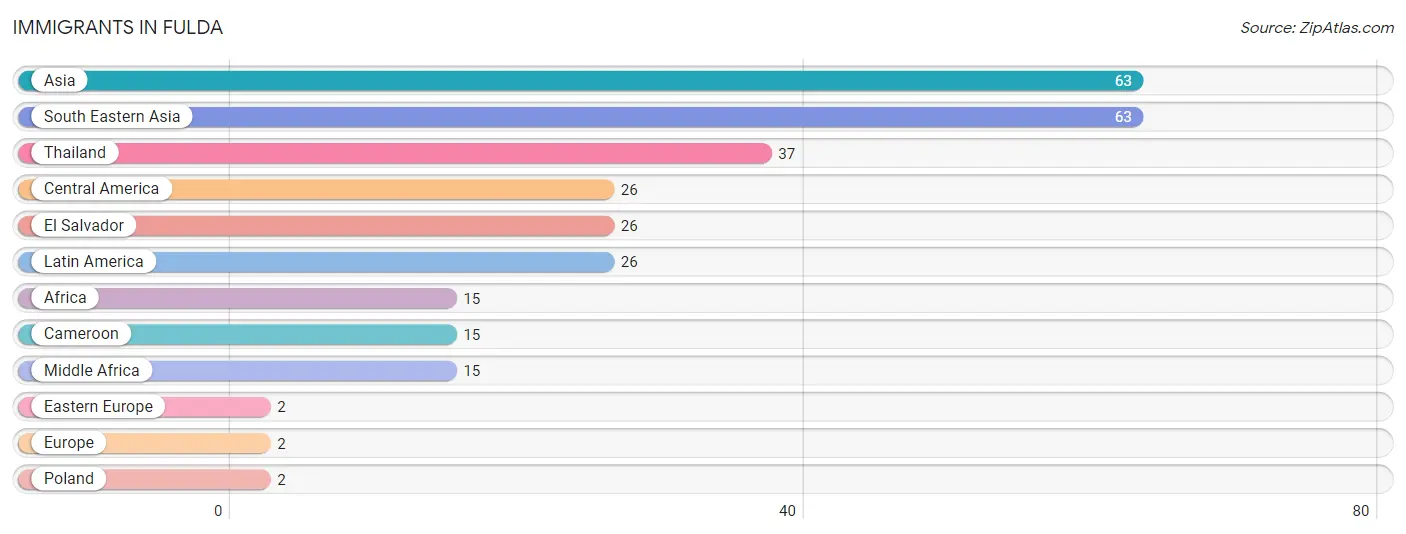
The most numerous immigrant groups reported in Fulda came from Asia (63 | 4.6%), South Eastern Asia (63 | 4.6%), Thailand (37 | 2.7%), Central America (26 | 1.9%), and El Salvador (26 | 1.9%), together accounting for 15.6% of all Fulda residents.
| Immigration Origin | # Population | % Population |
| Africa | 15 | 1.1% |
| Asia | 63 | 4.6% |
| Cameroon | 15 | 1.1% |
| Central America | 26 | 1.9% |
| Eastern Europe | 2 | 0.2% |
| El Salvador | 26 | 1.9% |
| Europe | 2 | 0.2% |
| Latin America | 26 | 1.9% |
| Middle Africa | 15 | 1.1% |
| Poland | 2 | 0.2% |
| South Eastern Asia | 63 | 4.6% |
| Thailand | 37 | 2.7% | View All 12 Rows |
Sex and Age in Fulda
Sex and Age in Fulda
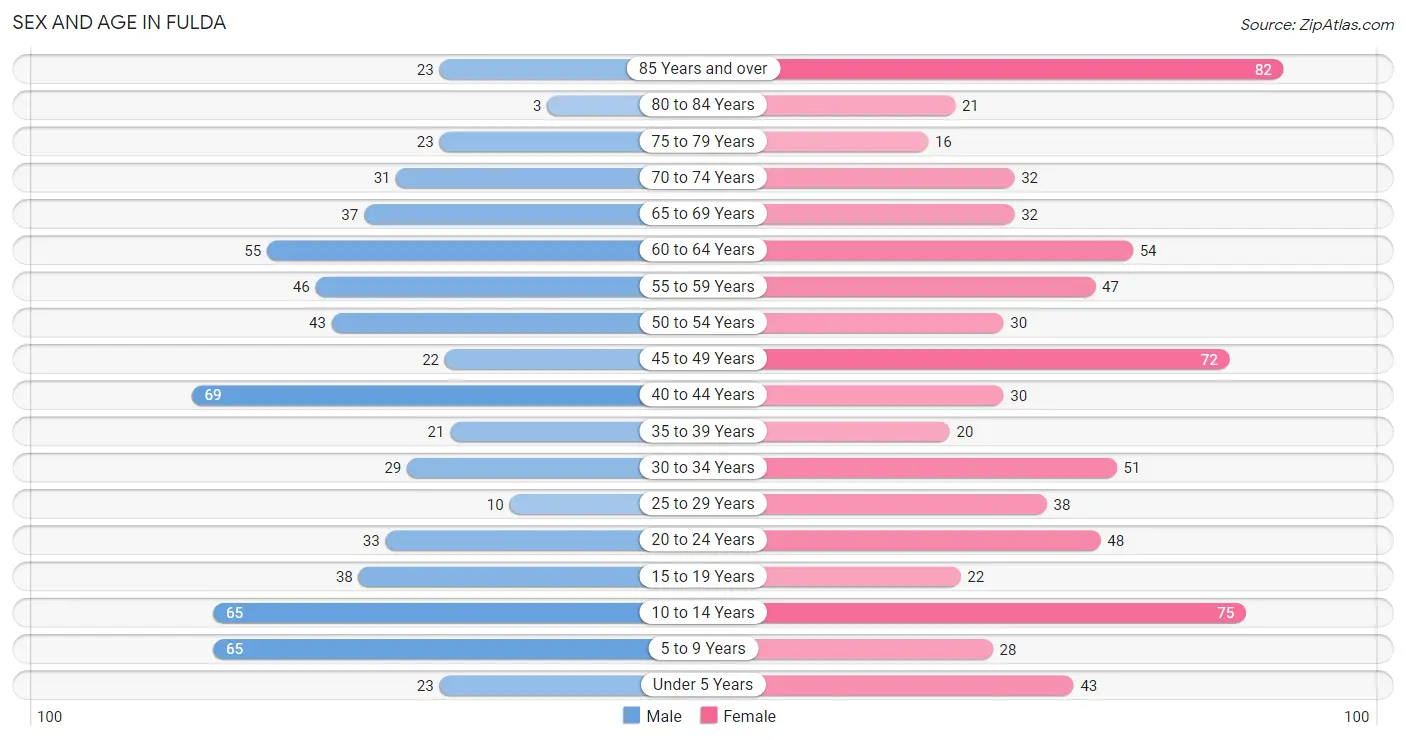
The most populous age groups in Fulda are 40 to 44 Years (69 | 10.8%) for men and 85 Years and over (82 | 11.1%) for women.
| Age Bracket | Male | Female |
| Under 5 Years | 23 (3.6%) | 43 (5.8%) |
| 5 to 9 Years | 65 (10.2%) | 28 (3.8%) |
| 10 to 14 Years | 65 (10.2%) | 75 (10.1%) |
| 15 to 19 Years | 38 (6.0%) | 22 (3.0%) |
| 20 to 24 Years | 33 (5.2%) | 48 (6.5%) |
| 25 to 29 Years | 10 (1.6%) | 38 (5.1%) |
| 30 to 34 Years | 29 (4.6%) | 51 (6.9%) |
| 35 to 39 Years | 21 (3.3%) | 20 (2.7%) |
| 40 to 44 Years | 69 (10.8%) | 30 (4.1%) |
| 45 to 49 Years | 22 (3.5%) | 72 (9.7%) |
| 50 to 54 Years | 43 (6.8%) | 30 (4.1%) |
| 55 to 59 Years | 46 (7.2%) | 47 (6.3%) |
| 60 to 64 Years | 55 (8.6%) | 54 (7.3%) |
| 65 to 69 Years | 37 (5.8%) | 32 (4.3%) |
| 70 to 74 Years | 31 (4.9%) | 32 (4.3%) |
| 75 to 79 Years | 23 (3.6%) | 16 (2.2%) |
| 80 to 84 Years | 3 (0.5%) | 21 (2.8%) |
| 85 Years and over | 23 (3.6%) | 82 (11.1%) |
| Total | 636 (100.0%) | 741 (100.0%) |
Families and Households in Fulda
Median Family Size in Fulda
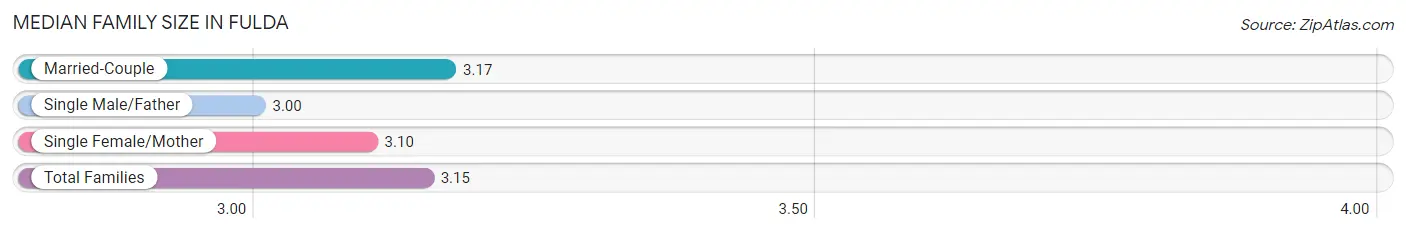
The median family size in Fulda is 3.15 persons per family, with married-couple families (232 | 76.6%) accounting for the largest median family size of 3.17 persons per family. On the other hand, single male/father families (12 | 4.0%) represent the smallest median family size with 3.00 persons per family.
| Family Type | # Families | Family Size |
| Married-Couple | 232 (76.6%) | 3.17 |
| Single Male/Father | 12 (4.0%) | 3.00 |
| Single Female/Mother | 59 (19.5%) | 3.10 |
| Total Families | 303 (100.0%) | 3.15 |
Median Household Size in Fulda
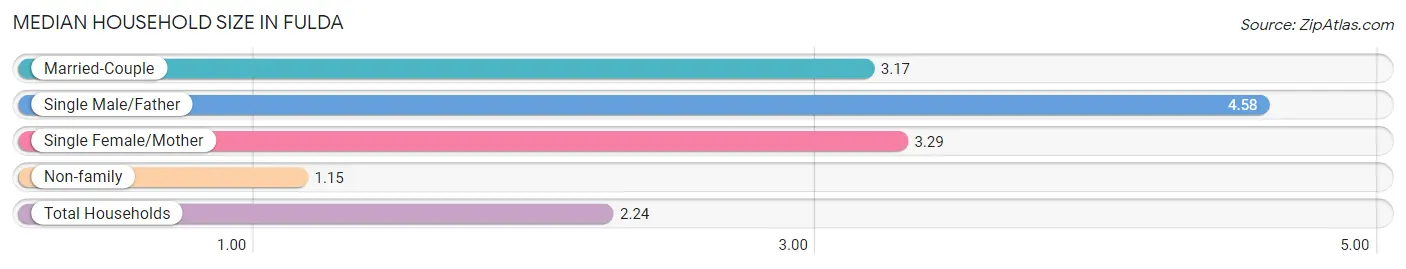
The median household size in Fulda is 2.24 persons per household, with single male/father households (12 | 2.1%) accounting for the largest median household size of 4.58 persons per household. non-family households (280 | 48.0%) represent the smallest median household size with 1.15 persons per household.
| Household Type | # Households | Household Size |
| Married-Couple | 232 (39.8%) | 3.17 |
| Single Male/Father | 12 (2.1%) | 4.58 |
| Single Female/Mother | 59 (10.1%) | 3.29 |
| Non-family | 280 (48.0%) | 1.15 |
| Total Households | 583 (100.0%) | 2.24 |
Household Size by Marriage Status in Fulda
Out of a total of 583 households in Fulda, 303 (52.0%) are family households, while 280 (48.0%) are nonfamily households. The most numerous type of family households are 2-person households, comprising 150, and the most common type of nonfamily households are 1-person households, comprising 237.
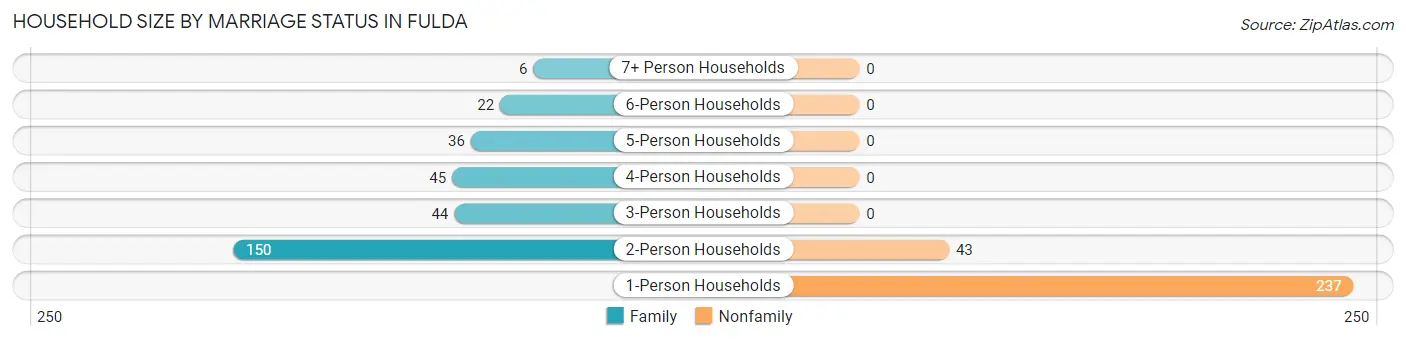
| Household Size | Family Households | Nonfamily Households |
| 1-Person Households | - | 237 (40.6%) |
| 2-Person Households | 150 (25.7%) | 43 (7.4%) |
| 3-Person Households | 44 (7.5%) | 0 (0.0%) |
| 4-Person Households | 45 (7.7%) | 0 (0.0%) |
| 5-Person Households | 36 (6.2%) | 0 (0.0%) |
| 6-Person Households | 22 (3.8%) | 0 (0.0%) |
| 7+ Person Households | 6 (1.0%) | 0 (0.0%) |
| Total | 303 (52.0%) | 280 (48.0%) |
Female Fertility in Fulda
Fertility by Age in Fulda
Average fertility rate in Fulda is 36.0 births per 1,000 women. Women in the age bracket of 20 to 34 years have the highest fertility rate with 73.0 births per 1,000 women. Women in the age bracket of 20 to 34 years acount for 100.0% of all women with births.
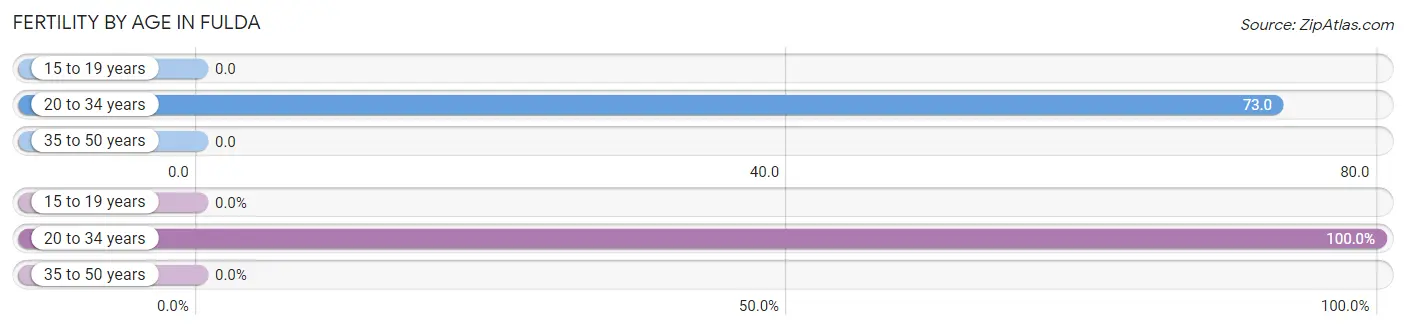
| Age Bracket | Women with Births | Births / 1,000 Women |
| 15 to 19 years | 0 (0.0%) | 0.0 |
| 20 to 34 years | 10 (100.0%) | 73.0 |
| 35 to 50 years | 0 (0.0%) | 0.0 |
| Total | 10 (100.0%) | 36.0 |
Fertility by Age by Marriage Status in Fulda
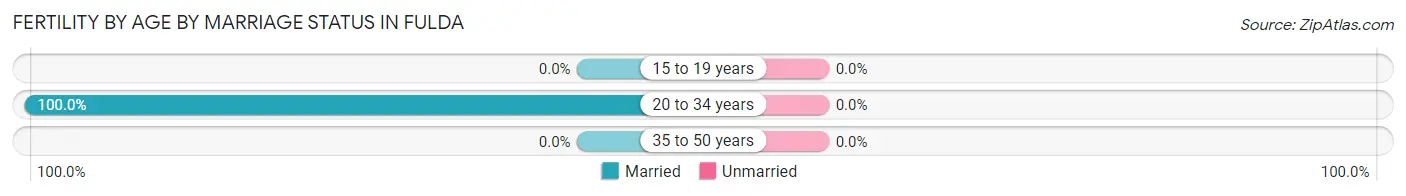
| Age Bracket | Married | Unmarried |
| 15 to 19 years | 0 (0.0%) | 0 (0.0%) |
| 20 to 34 years | 10 (100.0%) | 0 (0.0%) |
| 35 to 50 years | 0 (0.0%) | 0 (0.0%) |
| Total | 10 (100.0%) | 0 (0.0%) |
Fertility by Education in Fulda
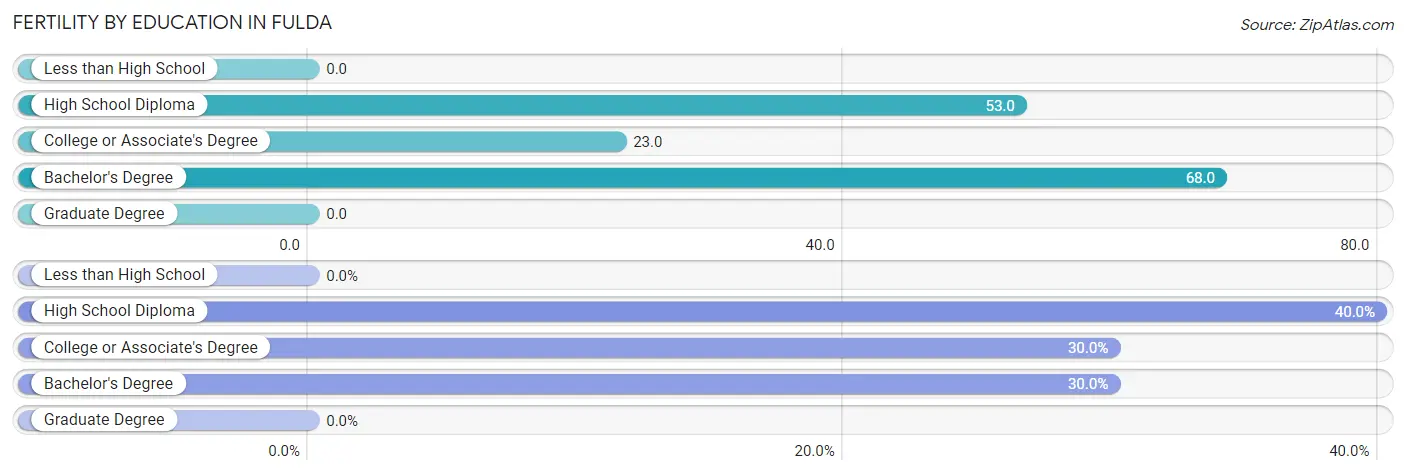
| Educational Attainment | Women with Births | Births / 1,000 Women |
| Less than High School | 0 (0.0%) | 0.0 |
| High School Diploma | 4 (40.0%) | 53.0 |
| College or Associate's Degree | 3 (30.0%) | 23.0 |
| Bachelor's Degree | 3 (30.0%) | 68.0 |
| Graduate Degree | 0 (0.0%) | 0.0 |
| Total | 10 (100.0%) | 36.0 |
Fertility by Education by Marriage Status in Fulda
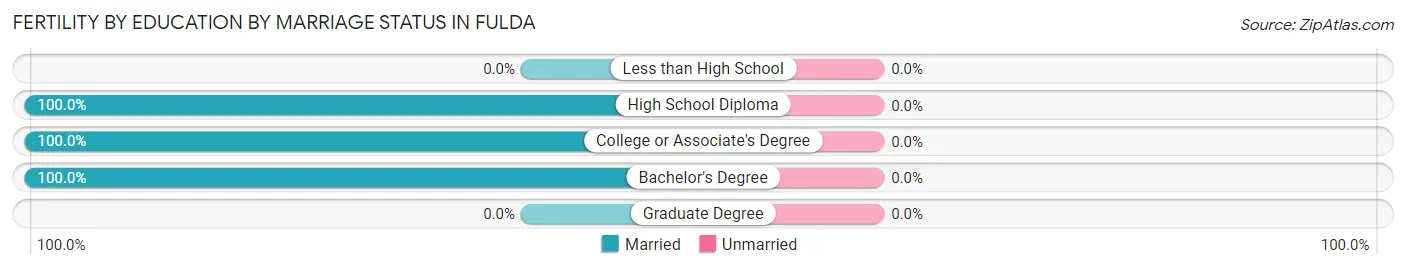
| Educational Attainment | Married | Unmarried |
| Less than High School | 0 (0.0%) | 0 (0.0%) |
| High School Diploma | 4 (100.0%) | 0 (0.0%) |
| College or Associate's Degree | 3 (100.0%) | 0 (0.0%) |
| Bachelor's Degree | 3 (100.0%) | 0 (0.0%) |
| Graduate Degree | 0 (0.0%) | 0 (0.0%) |
| Total | 10 (100.0%) | 0 (0.0%) |
Employment Characteristics in Fulda
Employment by Class of Employer in Fulda
Among the 688 employed individuals in Fulda, private company employees (435 | 63.2%), local government employees (99 | 14.4%), and not-for-profit organizations (71 | 10.3%) make up the most common classes of employment.
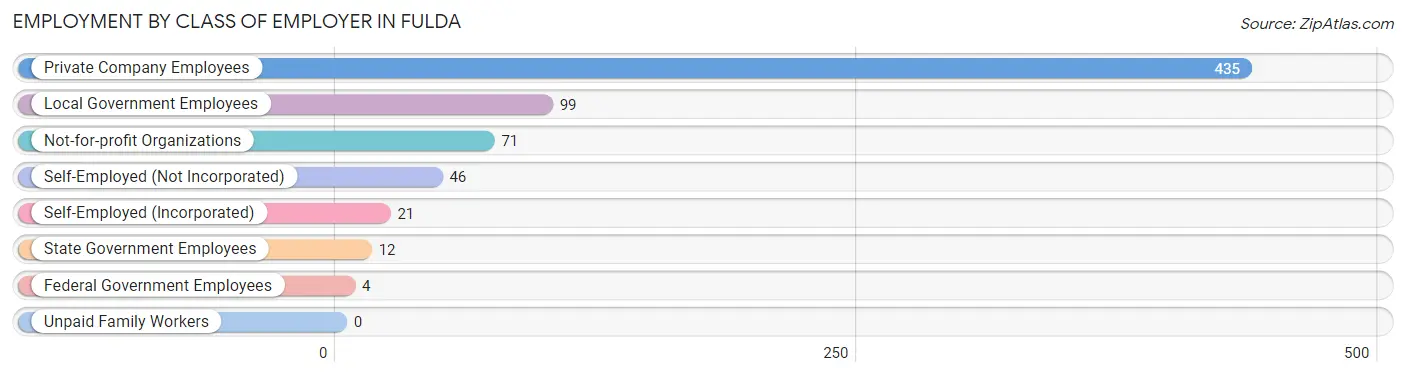
| Employer Class | # Employees | % Employees |
| Private Company Employees | 435 | 63.2% |
| Self-Employed (Incorporated) | 21 | 3.0% |
| Self-Employed (Not Incorporated) | 46 | 6.7% |
| Not-for-profit Organizations | 71 | 10.3% |
| Local Government Employees | 99 | 14.4% |
| State Government Employees | 12 | 1.7% |
| Federal Government Employees | 4 | 0.6% |
| Unpaid Family Workers | 0 | 0.0% |
| Total | 688 | 100.0% |
Employment Status by Age in Fulda
According to the labor force statistics for Fulda, out of the total population over 16 years of age (1,069), 66.5% or 711 individuals are in the labor force, with 1.4% or 10 of them unemployed. The age group with the highest labor force participation rate is 30 to 34 years, with 100.0% or 80 individuals in the labor force. Within the labor force, the 16 to 19 years age range has the highest percentage of unemployed individuals, with 15.6% or 5 of them being unemployed.
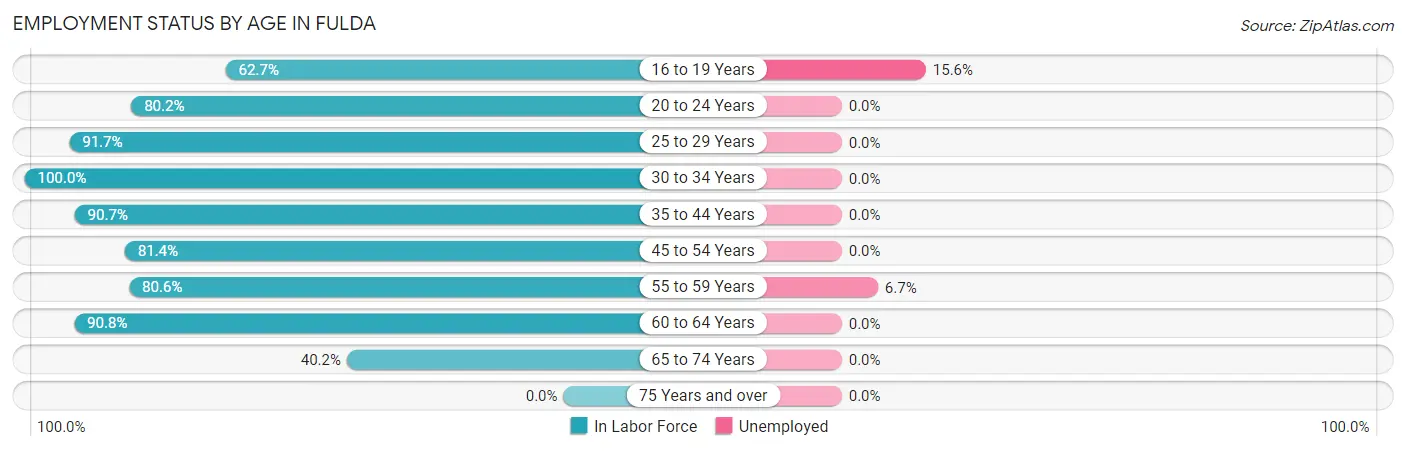
| Age Bracket | In Labor Force | Unemployed |
| 16 to 19 Years | 32 (62.7%) | 5 (15.6%) |
| 20 to 24 Years | 65 (80.2%) | 0 (0.0%) |
| 25 to 29 Years | 44 (91.7%) | 0 (0.0%) |
| 30 to 34 Years | 80 (100.0%) | 0 (0.0%) |
| 35 to 44 Years | 127 (90.7%) | 0 (0.0%) |
| 45 to 54 Years | 136 (81.4%) | 0 (0.0%) |
| 55 to 59 Years | 75 (80.6%) | 5 (6.7%) |
| 60 to 64 Years | 99 (90.8%) | 0 (0.0%) |
| 65 to 74 Years | 53 (40.2%) | 0 (0.0%) |
| 75 Years and over | 0 (0.0%) | 0 (0.0%) |
| Total | 711 (66.5%) | 10 (1.4%) |
Employment Status by Educational Attainment in Fulda
According to labor force statistics for Fulda, 88.1% of individuals (561) out of the total population between 25 and 64 years of age (637) are in the labor force, with 0.9% or 5 of them being unemployed. The group with the highest labor force participation rate are those with the educational attainment of bachelor's degree or higher, with 100.0% or 89 individuals in the labor force. Within the labor force, individuals with college / associate degree education have the highest percentage of unemployment, with 1.2% or 3 of them being unemployed.
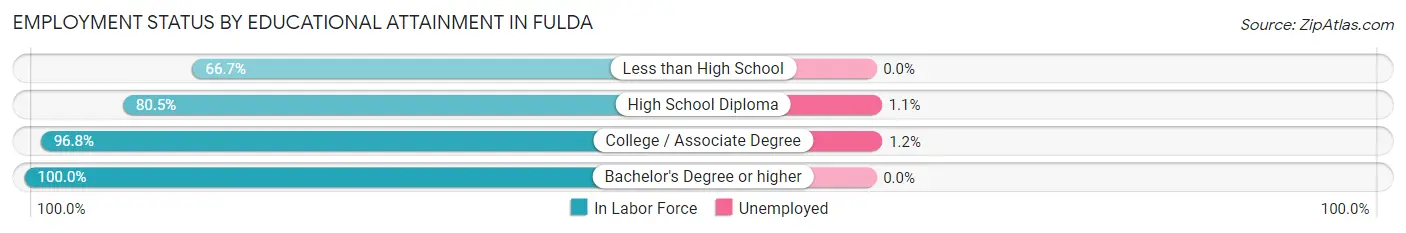
| Educational Attainment | In Labor Force | Unemployed |
| Less than High School | 50 (66.7%) | 0 (0.0%) |
| High School Diploma | 177 (80.5%) | 2 (1.1%) |
| College / Associate Degree | 245 (96.8%) | 3 (1.2%) |
| Bachelor's Degree or higher | 89 (100.0%) | 0 (0.0%) |
| Total | 561 (88.1%) | 6 (0.9%) |
Employment Occupations by Sex in Fulda
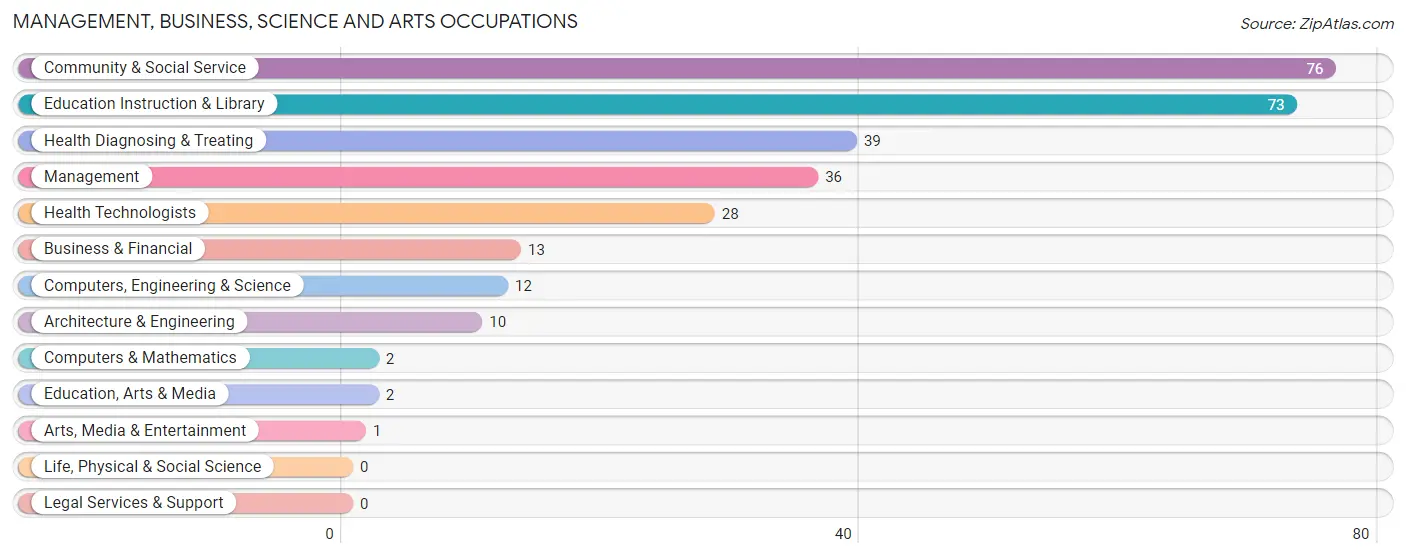
Management, Business, Science and Arts Occupations
The most common Management, Business, Science and Arts occupations in Fulda are Community & Social Service (76 | 10.8%), Education Instruction & Library (73 | 10.4%), Health Diagnosing & Treating (39 | 5.6%), Management (36 | 5.1%), and Health Technologists (28 | 4.0%).
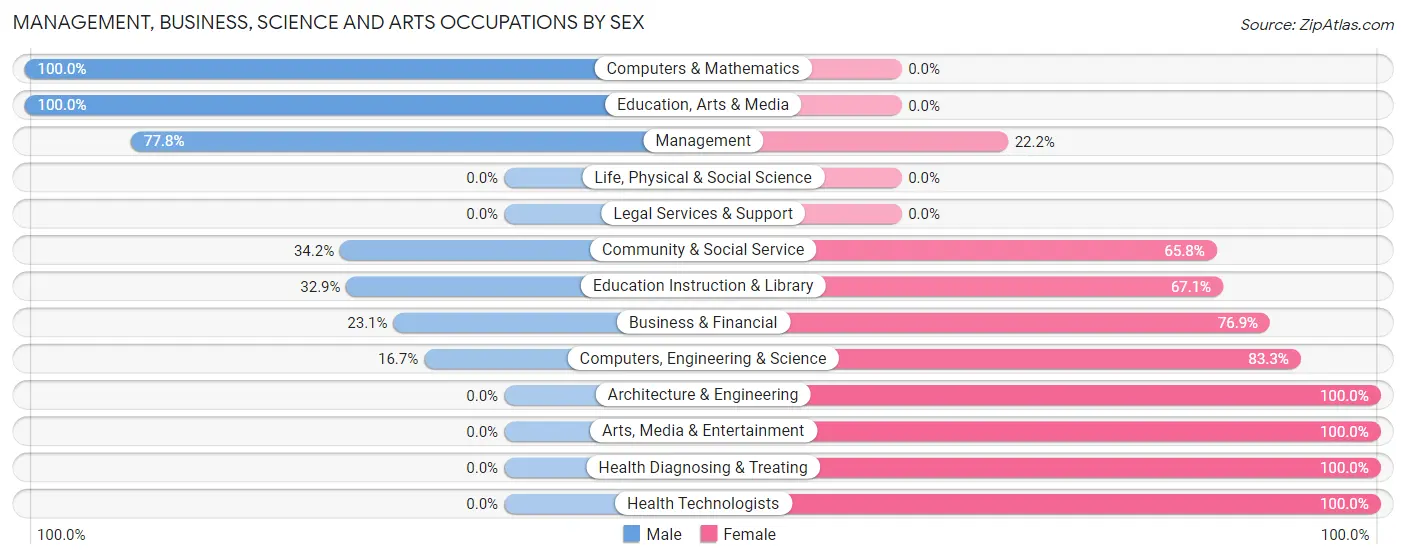
Management, Business, Science and Arts Occupations by Sex
Within the Management, Business, Science and Arts occupations in Fulda, the most male-oriented occupations are Computers & Mathematics (100.0%), Education, Arts & Media (100.0%), and Management (77.8%), while the most female-oriented occupations are Architecture & Engineering (100.0%), Arts, Media & Entertainment (100.0%), and Health Diagnosing & Treating (100.0%).
| Occupation | Male | Female |
| Management | 28 (77.8%) | 8 (22.2%) |
| Business & Financial | 3 (23.1%) | 10 (76.9%) |
| Computers, Engineering & Science | 2 (16.7%) | 10 (83.3%) |
| Computers & Mathematics | 2 (100.0%) | 0 (0.0%) |
| Architecture & Engineering | 0 (0.0%) | 10 (100.0%) |
| Life, Physical & Social Science | 0 (0.0%) | 0 (0.0%) |
| Community & Social Service | 26 (34.2%) | 50 (65.8%) |
| Education, Arts & Media | 2 (100.0%) | 0 (0.0%) |
| Legal Services & Support | 0 (0.0%) | 0 (0.0%) |
| Education Instruction & Library | 24 (32.9%) | 49 (67.1%) |
| Arts, Media & Entertainment | 0 (0.0%) | 1 (100.0%) |
| Health Diagnosing & Treating | 0 (0.0%) | 39 (100.0%) |
| Health Technologists | 0 (0.0%) | 28 (100.0%) |
| Total (Category) | 59 (33.5%) | 117 (66.5%) |
| Total (Overall) | 315 (44.9%) | 386 (55.1%) |
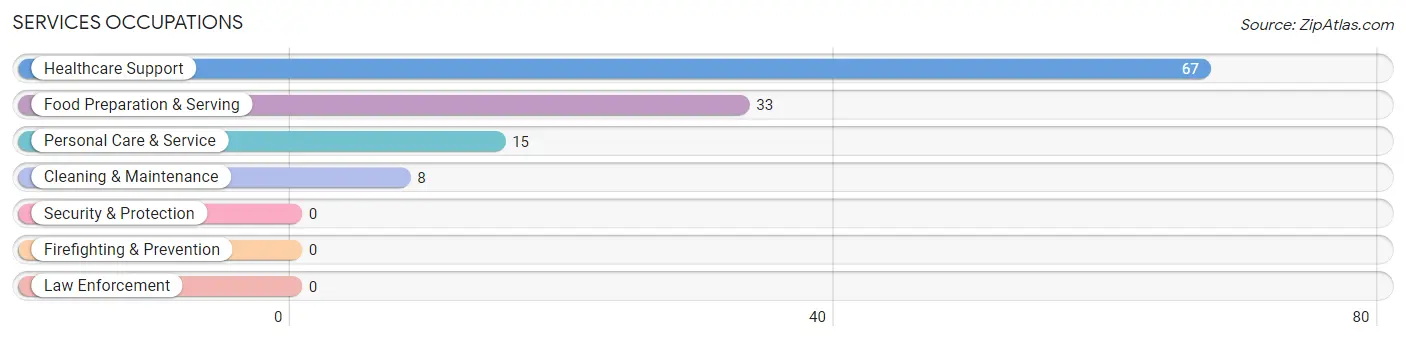
Services Occupations
The most common Services occupations in Fulda are Healthcare Support (67 | 9.6%), Food Preparation & Serving (33 | 4.7%), Personal Care & Service (15 | 2.1%), and Cleaning & Maintenance (8 | 1.1%).
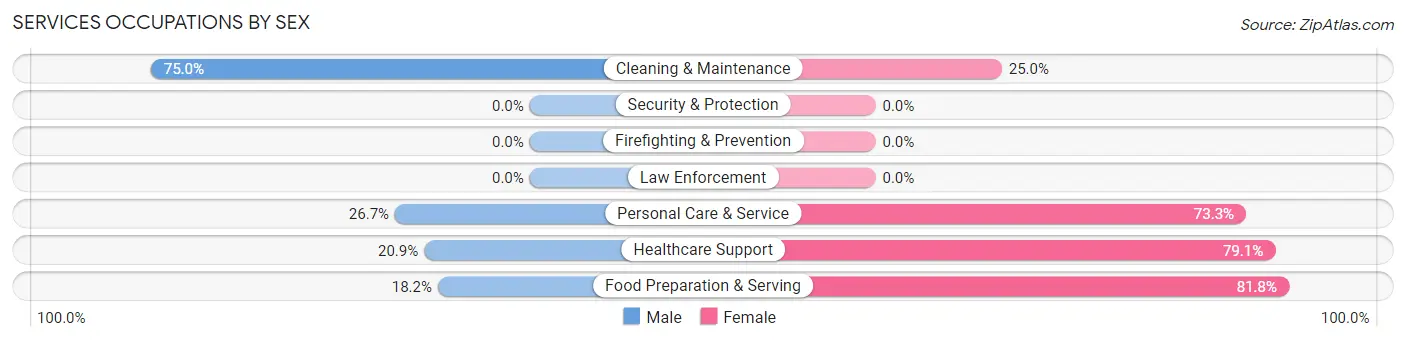
Services Occupations by Sex
Within the Services occupations in Fulda, the most male-oriented occupations are Cleaning & Maintenance (75.0%), Personal Care & Service (26.7%), and Healthcare Support (20.9%), while the most female-oriented occupations are Food Preparation & Serving (81.8%), Healthcare Support (79.1%), and Personal Care & Service (73.3%).
| Occupation | Male | Female |
| Healthcare Support | 14 (20.9%) | 53 (79.1%) |
| Security & Protection | 0 (0.0%) | 0 (0.0%) |
| Firefighting & Prevention | 0 (0.0%) | 0 (0.0%) |
| Law Enforcement | 0 (0.0%) | 0 (0.0%) |
| Food Preparation & Serving | 6 (18.2%) | 27 (81.8%) |
| Cleaning & Maintenance | 6 (75.0%) | 2 (25.0%) |
| Personal Care & Service | 4 (26.7%) | 11 (73.3%) |
| Total (Category) | 30 (24.4%) | 93 (75.6%) |
| Total (Overall) | 315 (44.9%) | 386 (55.1%) |
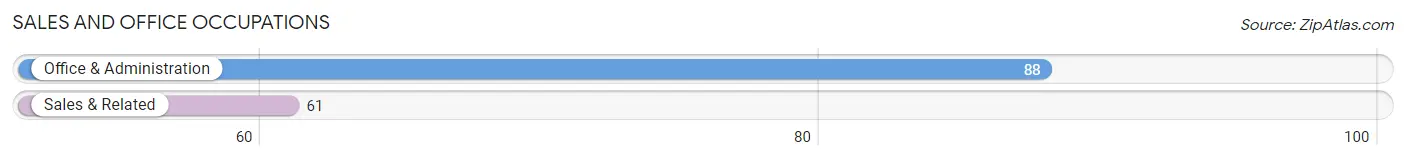
Sales and Office Occupations
The most common Sales and Office occupations in Fulda are Office & Administration (88 | 12.6%), and Sales & Related (61 | 8.7%).
Sales and Office Occupations by Sex
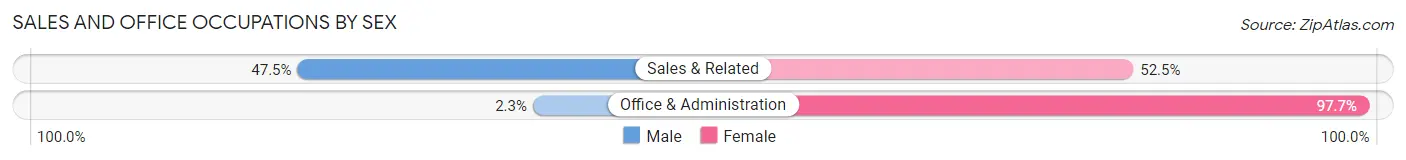
| Occupation | Male | Female |
| Sales & Related | 29 (47.5%) | 32 (52.5%) |
| Office & Administration | 2 (2.3%) | 86 (97.7%) |
| Total (Category) | 31 (20.8%) | 118 (79.2%) |
| Total (Overall) | 315 (44.9%) | 386 (55.1%) |
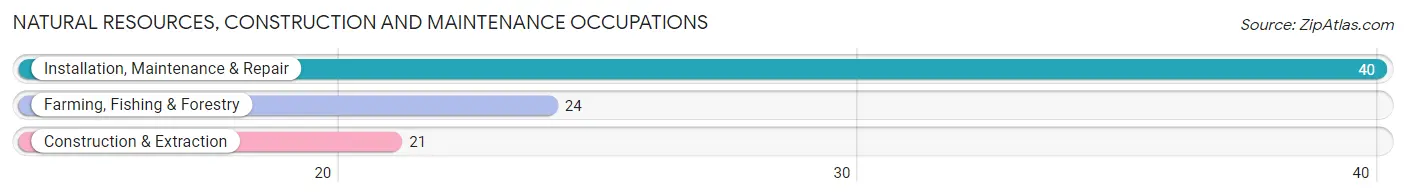
Natural Resources, Construction and Maintenance Occupations
The most common Natural Resources, Construction and Maintenance occupations in Fulda are Installation, Maintenance & Repair (40 | 5.7%), Farming, Fishing & Forestry (24 | 3.4%), and Construction & Extraction (21 | 3.0%).
Natural Resources, Construction and Maintenance Occupations by Sex
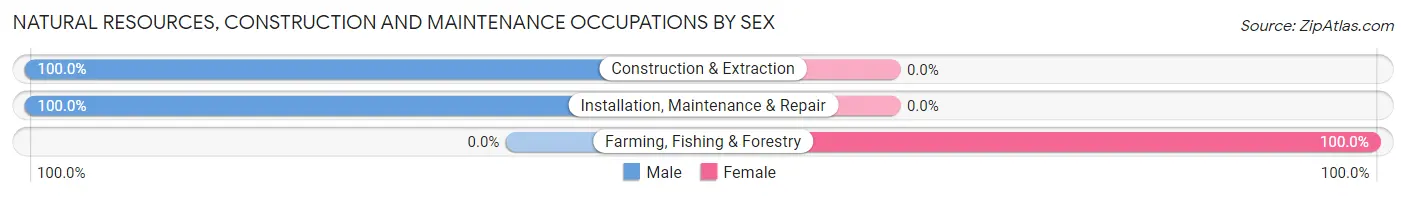
| Occupation | Male | Female |
| Farming, Fishing & Forestry | 0 (0.0%) | 24 (100.0%) |
| Construction & Extraction | 21 (100.0%) | 0 (0.0%) |
| Installation, Maintenance & Repair | 40 (100.0%) | 0 (0.0%) |
| Total (Category) | 61 (71.8%) | 24 (28.2%) |
| Total (Overall) | 315 (44.9%) | 386 (55.1%) |
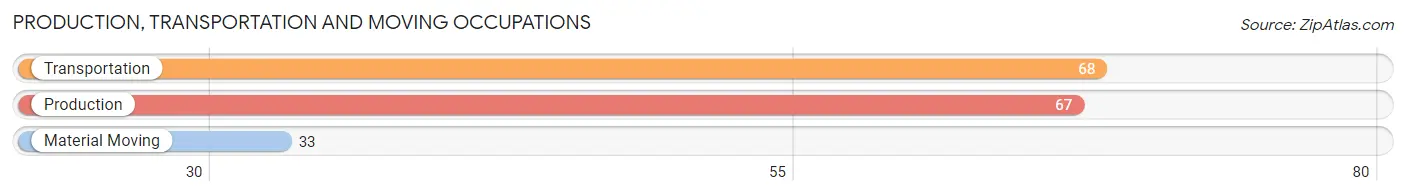
Production, Transportation and Moving Occupations
The most common Production, Transportation and Moving occupations in Fulda are Transportation (68 | 9.7%), Production (67 | 9.6%), and Material Moving (33 | 4.7%).
Production, Transportation and Moving Occupations by Sex
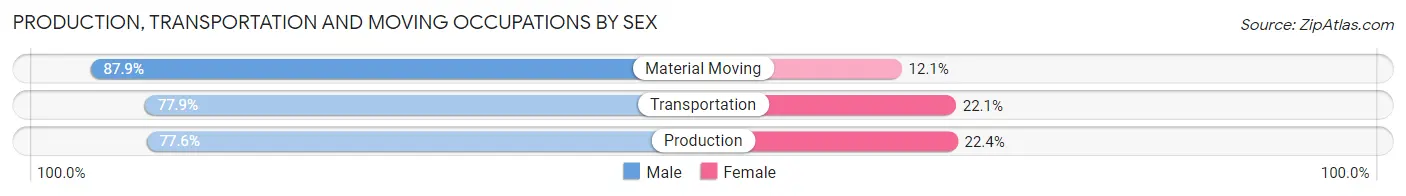
| Occupation | Male | Female |
| Production | 52 (77.6%) | 15 (22.4%) |
| Transportation | 53 (77.9%) | 15 (22.1%) |
| Material Moving | 29 (87.9%) | 4 (12.1%) |
| Total (Category) | 134 (79.8%) | 34 (20.2%) |
| Total (Overall) | 315 (44.9%) | 386 (55.1%) |
Employment Industries by Sex in Fulda
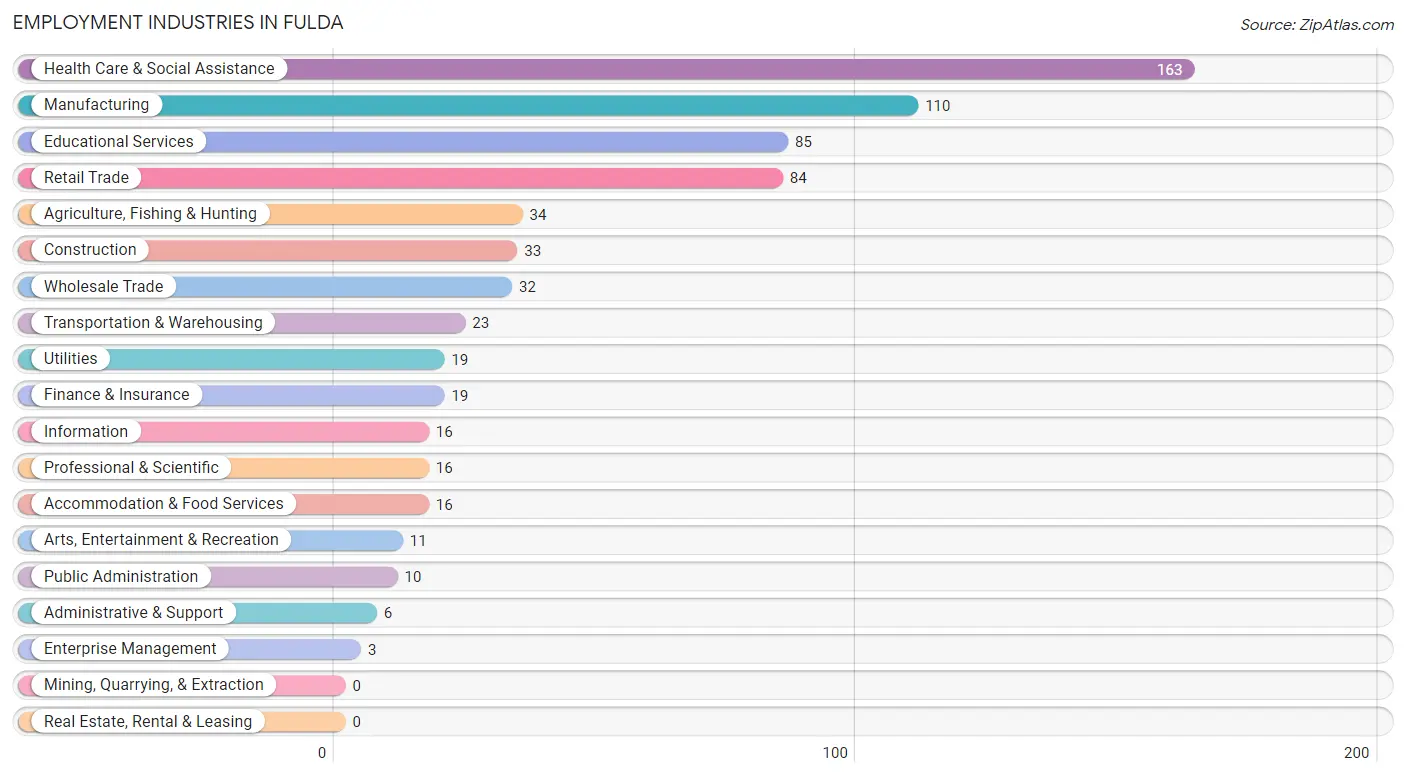
Employment Industries in Fulda
The major employment industries in Fulda include Health Care & Social Assistance (163 | 23.3%), Manufacturing (110 | 15.7%), Educational Services (85 | 12.1%), Retail Trade (84 | 12.0%), and Agriculture, Fishing & Hunting (34 | 4.9%).
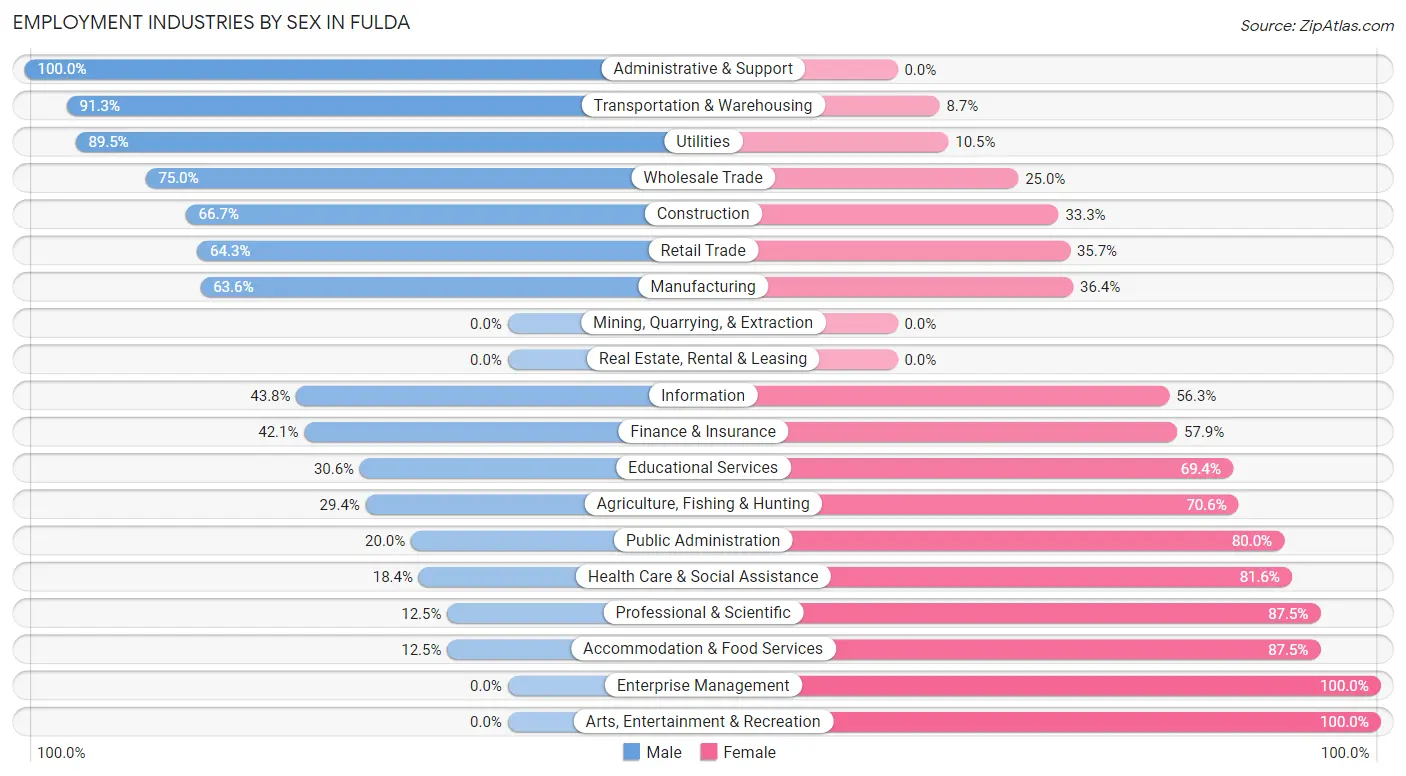
Employment Industries by Sex in Fulda
The Fulda industries that see more men than women are Administrative & Support (100.0%), Transportation & Warehousing (91.3%), and Utilities (89.5%), whereas the industries that tend to have a higher number of women are Enterprise Management (100.0%), Arts, Entertainment & Recreation (100.0%), and Professional & Scientific (87.5%).
| Industry | Male | Female |
| Agriculture, Fishing & Hunting | 10 (29.4%) | 24 (70.6%) |
| Mining, Quarrying, & Extraction | 0 (0.0%) | 0 (0.0%) |
| Construction | 22 (66.7%) | 11 (33.3%) |
| Manufacturing | 70 (63.6%) | 40 (36.4%) |
| Wholesale Trade | 24 (75.0%) | 8 (25.0%) |
| Retail Trade | 54 (64.3%) | 30 (35.7%) |
| Transportation & Warehousing | 21 (91.3%) | 2 (8.7%) |
| Utilities | 17 (89.5%) | 2 (10.5%) |
| Information | 7 (43.8%) | 9 (56.2%) |
| Finance & Insurance | 8 (42.1%) | 11 (57.9%) |
| Real Estate, Rental & Leasing | 0 (0.0%) | 0 (0.0%) |
| Professional & Scientific | 2 (12.5%) | 14 (87.5%) |
| Enterprise Management | 0 (0.0%) | 3 (100.0%) |
| Administrative & Support | 6 (100.0%) | 0 (0.0%) |
| Educational Services | 26 (30.6%) | 59 (69.4%) |
| Health Care & Social Assistance | 30 (18.4%) | 133 (81.6%) |
| Arts, Entertainment & Recreation | 0 (0.0%) | 11 (100.0%) |
| Accommodation & Food Services | 2 (12.5%) | 14 (87.5%) |
| Public Administration | 2 (20.0%) | 8 (80.0%) |
| Total | 315 (44.9%) | 386 (55.1%) |
Education in Fulda
School Enrollment in Fulda
The most common levels of schooling among the 326 students in Fulda are elementary school (106 | 32.5%), middle school (97 | 29.7%), and high school (48 | 14.7%).
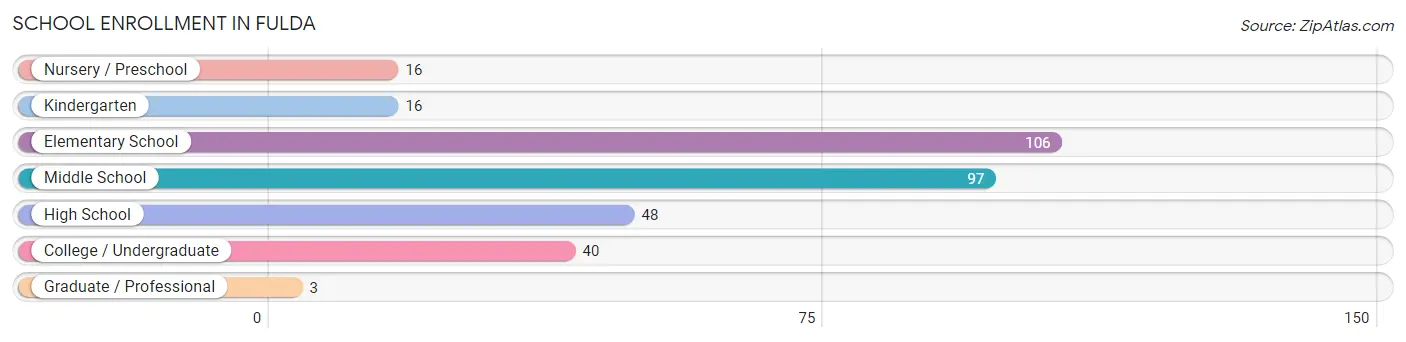
| School Level | # Students | % Students |
| Nursery / Preschool | 16 | 4.9% |
| Kindergarten | 16 | 4.9% |
| Elementary School | 106 | 32.5% |
| Middle School | 97 | 29.7% |
| High School | 48 | 14.7% |
| College / Undergraduate | 40 | 12.3% |
| Graduate / Professional | 3 | 0.9% |
| Total | 326 | 100.0% |
School Enrollment by Age by Funding Source in Fulda
Out of a total of 326 students who are enrolled in schools in Fulda, 12 (3.7%) attend a private institution, while the remaining 314 (96.3%) are enrolled in public schools. The age group of 35 years and over has the highest likelihood of being enrolled in private schools, with 3 (100.0% in the age bracket) enrolled. Conversely, the age group of 3 to 4 year olds has the lowest likelihood of being enrolled in a private school, with 14 (100.0% in the age bracket) attending a public institution.
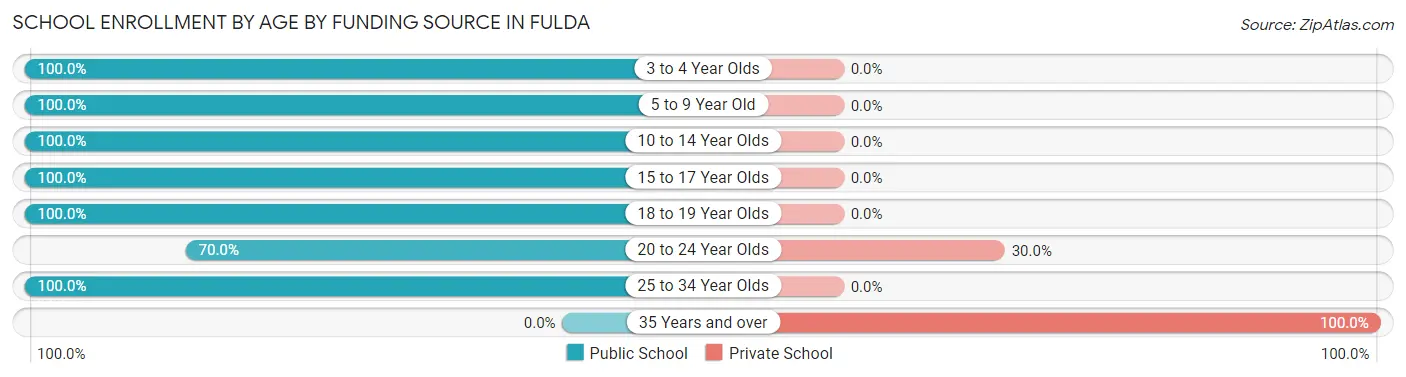
| Age Bracket | Public School | Private School |
| 3 to 4 Year Olds | 14 (100.0%) | 0 (0.0%) |
| 5 to 9 Year Old | 92 (100.0%) | 0 (0.0%) |
| 10 to 14 Year Olds | 132 (100.0%) | 0 (0.0%) |
| 15 to 17 Year Olds | 41 (100.0%) | 0 (0.0%) |
| 18 to 19 Year Olds | 9 (100.0%) | 0 (0.0%) |
| 20 to 24 Year Olds | 21 (70.0%) | 9 (30.0%) |
| 25 to 34 Year Olds | 5 (100.0%) | 0 (0.0%) |
| 35 Years and over | 0 (0.0%) | 3 (100.0%) |
| Total | 314 (96.3%) | 12 (3.7%) |
Educational Attainment by Field of Study in Fulda
Education (66 | 49.2%), bio, nature & agricultural (16 | 11.9%), engineering (14 | 10.4%), science & technology (13 | 9.7%), and business (6 | 4.5%) are the most common fields of study among 134 individuals in Fulda who have obtained a bachelor's degree or higher.
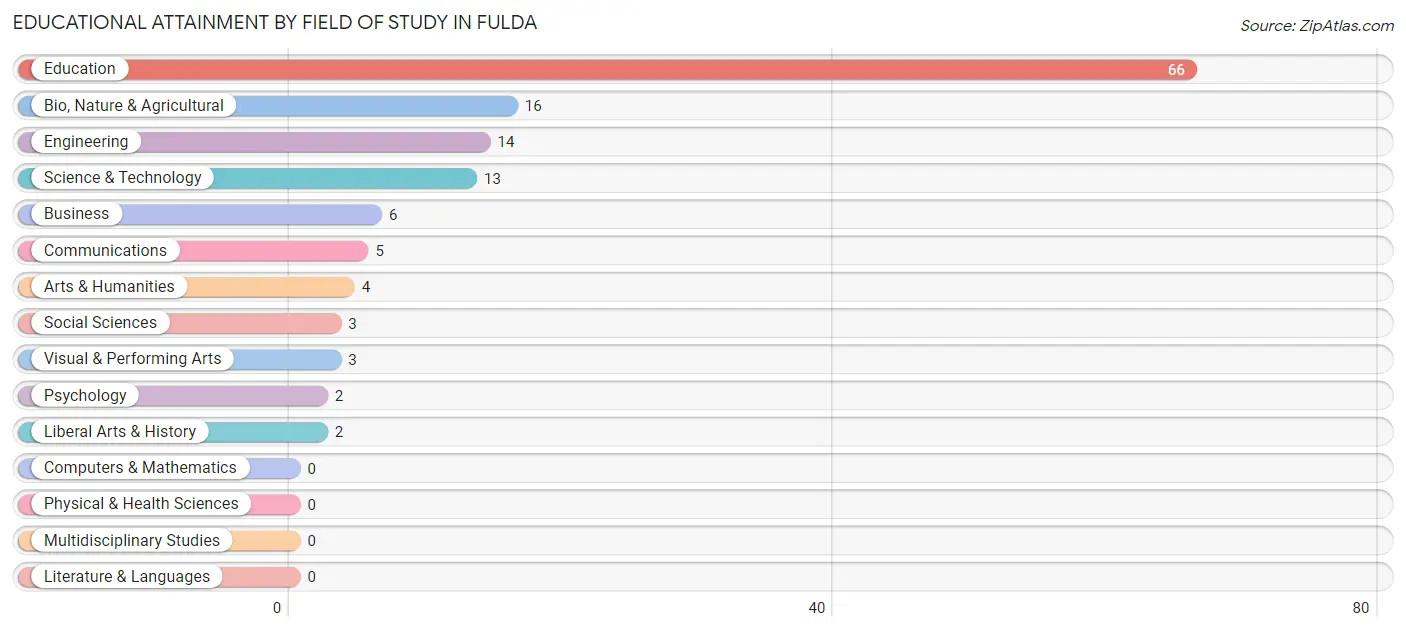
| Field of Study | # Graduates | % Graduates |
| Computers & Mathematics | 0 | 0.0% |
| Bio, Nature & Agricultural | 16 | 11.9% |
| Physical & Health Sciences | 0 | 0.0% |
| Psychology | 2 | 1.5% |
| Social Sciences | 3 | 2.2% |
| Engineering | 14 | 10.4% |
| Multidisciplinary Studies | 0 | 0.0% |
| Science & Technology | 13 | 9.7% |
| Business | 6 | 4.5% |
| Education | 66 | 49.2% |
| Literature & Languages | 0 | 0.0% |
| Liberal Arts & History | 2 | 1.5% |
| Visual & Performing Arts | 3 | 2.2% |
| Communications | 5 | 3.7% |
| Arts & Humanities | 4 | 3.0% |
| Total | 134 | 100.0% |
Transportation & Commute in Fulda
Vehicle Availability by Sex in Fulda
The most prevalent vehicle ownership categories in Fulda are males with 3 vehicles (115, accounting for 37.6%) and females with 3 vehicles (115, making up 30.1%).
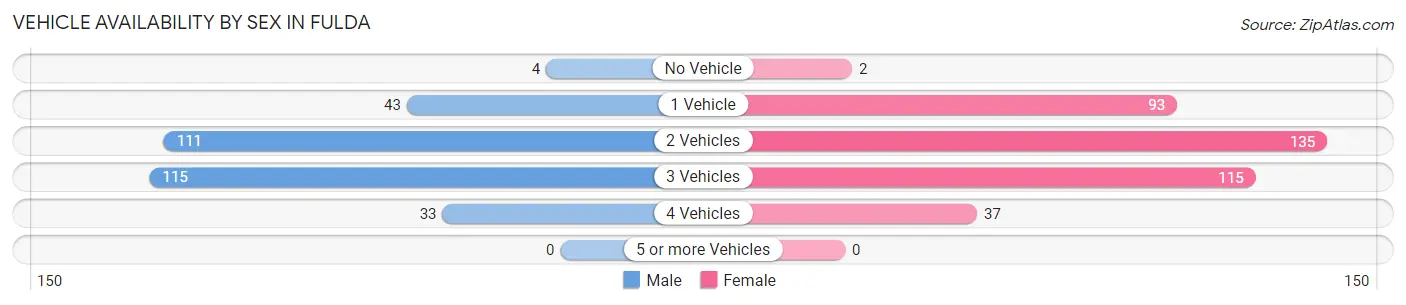
| Vehicles Available | Male | Female |
| No Vehicle | 4 (1.3%) | 2 (0.5%) |
| 1 Vehicle | 43 (14.1%) | 93 (24.3%) |
| 2 Vehicles | 111 (36.3%) | 135 (35.3%) |
| 3 Vehicles | 115 (37.6%) | 115 (30.1%) |
| 4 Vehicles | 33 (10.8%) | 37 (9.7%) |
| 5 or more Vehicles | 0 (0.0%) | 0 (0.0%) |
| Total | 306 (100.0%) | 382 (100.0%) |
Commute Time in Fulda
The most frequently occuring commute durations in Fulda are 20 to 24 minutes (146 commuters, 21.7%), less than 5 minutes (136 commuters, 20.2%), and 25 to 29 minutes (87 commuters, 12.9%).
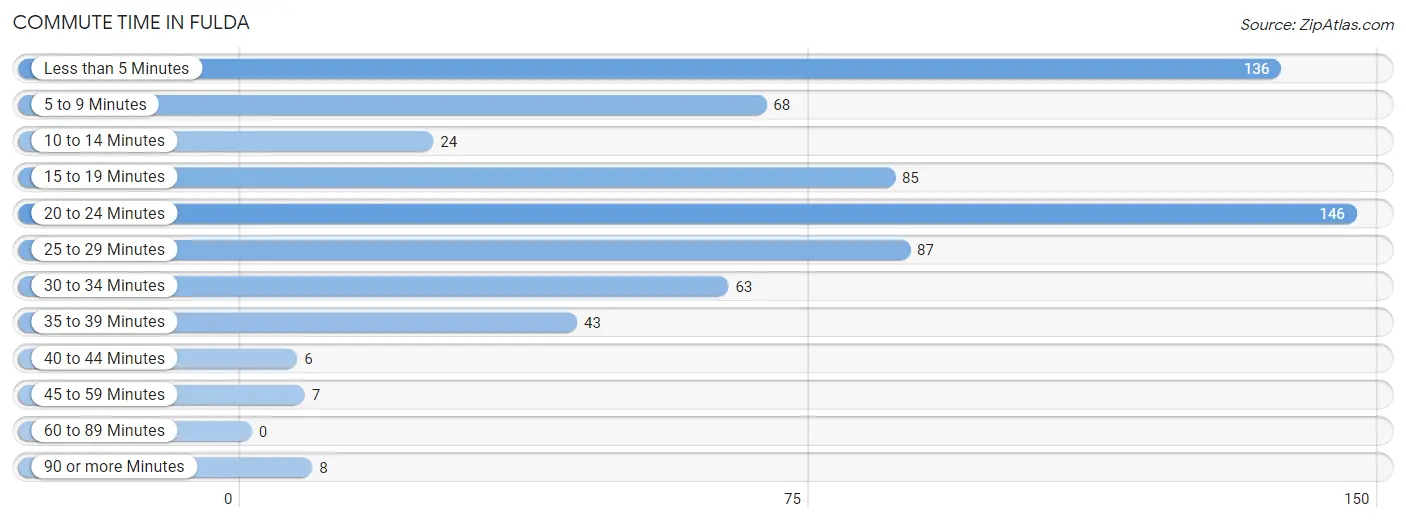
| Commute Time | # Commuters | % Commuters |
| Less than 5 Minutes | 136 | 20.2% |
| 5 to 9 Minutes | 68 | 10.1% |
| 10 to 14 Minutes | 24 | 3.6% |
| 15 to 19 Minutes | 85 | 12.6% |
| 20 to 24 Minutes | 146 | 21.7% |
| 25 to 29 Minutes | 87 | 12.9% |
| 30 to 34 Minutes | 63 | 9.4% |
| 35 to 39 Minutes | 43 | 6.4% |
| 40 to 44 Minutes | 6 | 0.9% |
| 45 to 59 Minutes | 7 | 1.0% |
| 60 to 89 Minutes | 0 | 0.0% |
| 90 or more Minutes | 8 | 1.2% |
Commute Time by Sex in Fulda
The most common commute times in Fulda are 20 to 24 minutes (78 commuters, 25.9%) for males and 20 to 24 minutes (68 commuters, 18.3%) for females.
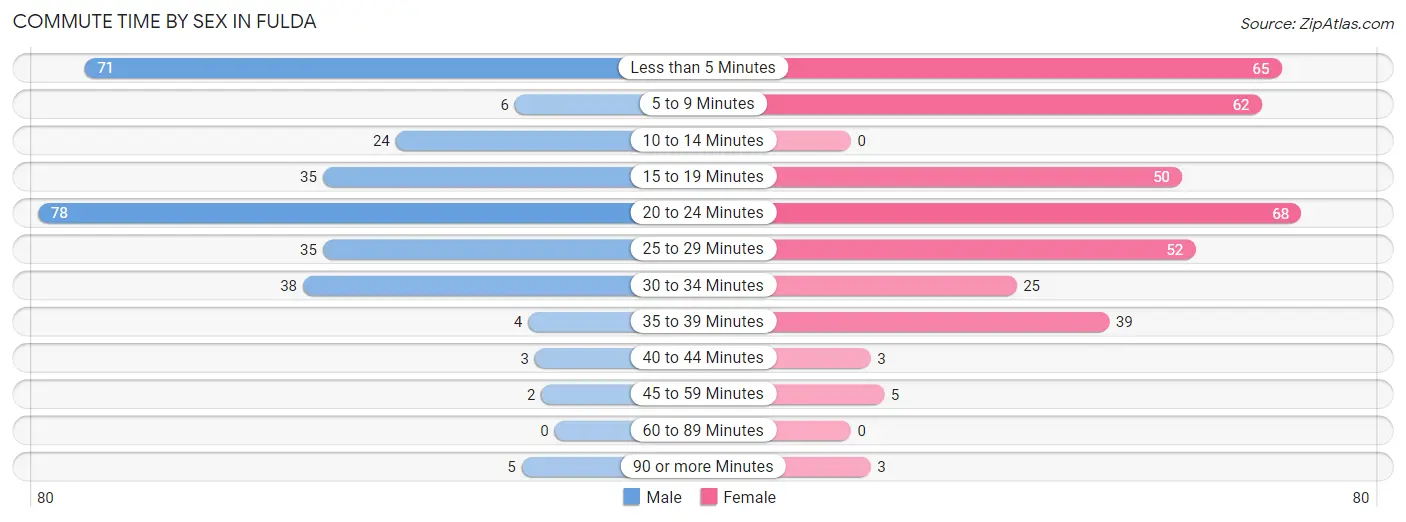
| Commute Time | Male | Female |
| Less than 5 Minutes | 71 (23.6%) | 65 (17.5%) |
| 5 to 9 Minutes | 6 (2.0%) | 62 (16.7%) |
| 10 to 14 Minutes | 24 (8.0%) | 0 (0.0%) |
| 15 to 19 Minutes | 35 (11.6%) | 50 (13.4%) |
| 20 to 24 Minutes | 78 (25.9%) | 68 (18.3%) |
| 25 to 29 Minutes | 35 (11.6%) | 52 (14.0%) |
| 30 to 34 Minutes | 38 (12.6%) | 25 (6.7%) |
| 35 to 39 Minutes | 4 (1.3%) | 39 (10.5%) |
| 40 to 44 Minutes | 3 (1.0%) | 3 (0.8%) |
| 45 to 59 Minutes | 2 (0.7%) | 5 (1.3%) |
| 60 to 89 Minutes | 0 (0.0%) | 0 (0.0%) |
| 90 or more Minutes | 5 (1.7%) | 3 (0.8%) |
Time of Departure to Work by Sex in Fulda
The most frequent times of departure to work in Fulda are 7:30 AM to 7:59 AM (77, 25.6%) for males and 7:00 AM to 7:29 AM (59, 15.9%) for females.
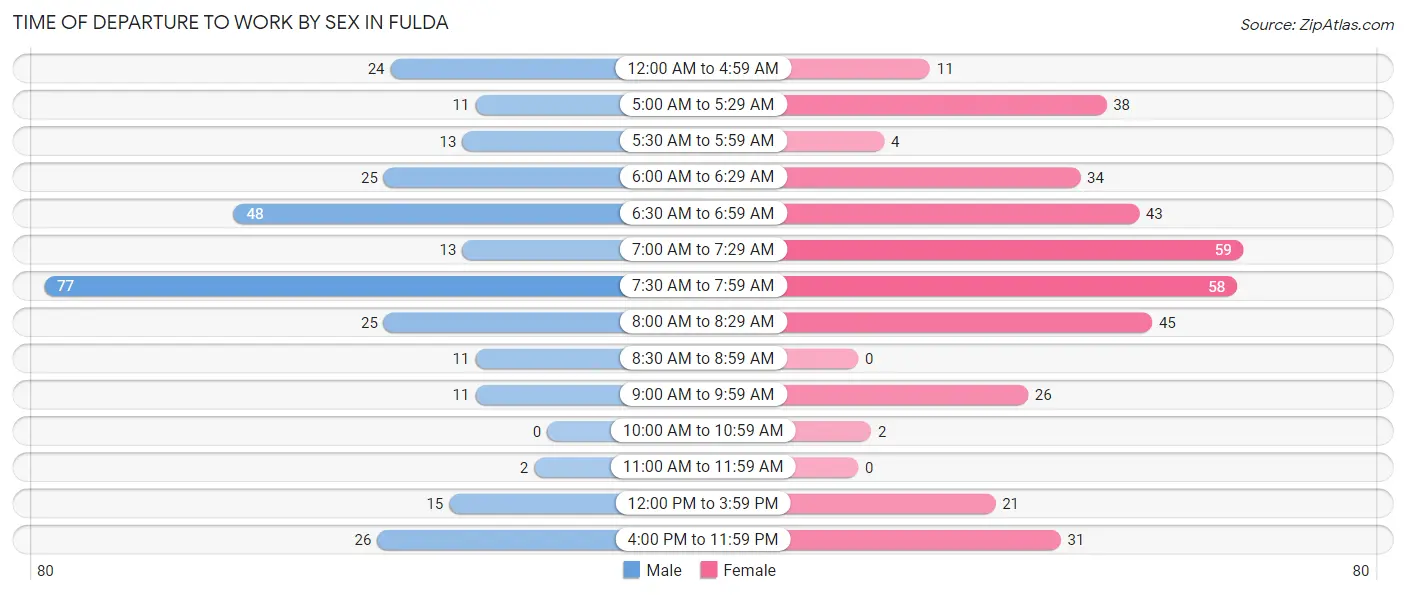
| Time of Departure | Male | Female |
| 12:00 AM to 4:59 AM | 24 (8.0%) | 11 (3.0%) |
| 5:00 AM to 5:29 AM | 11 (3.6%) | 38 (10.2%) |
| 5:30 AM to 5:59 AM | 13 (4.3%) | 4 (1.1%) |
| 6:00 AM to 6:29 AM | 25 (8.3%) | 34 (9.1%) |
| 6:30 AM to 6:59 AM | 48 (16.0%) | 43 (11.6%) |
| 7:00 AM to 7:29 AM | 13 (4.3%) | 59 (15.9%) |
| 7:30 AM to 7:59 AM | 77 (25.6%) | 58 (15.6%) |
| 8:00 AM to 8:29 AM | 25 (8.3%) | 45 (12.1%) |
| 8:30 AM to 8:59 AM | 11 (3.6%) | 0 (0.0%) |
| 9:00 AM to 9:59 AM | 11 (3.6%) | 26 (7.0%) |
| 10:00 AM to 10:59 AM | 0 (0.0%) | 2 (0.5%) |
| 11:00 AM to 11:59 AM | 2 (0.7%) | 0 (0.0%) |
| 12:00 PM to 3:59 PM | 15 (5.0%) | 21 (5.7%) |
| 4:00 PM to 11:59 PM | 26 (8.6%) | 31 (8.3%) |
| Total | 301 (100.0%) | 372 (100.0%) |
Housing Occupancy in Fulda
Occupancy by Ownership in Fulda
Of the total 583 dwellings in Fulda, owner-occupied units account for 477 (81.8%), while renter-occupied units make up 106 (18.2%).
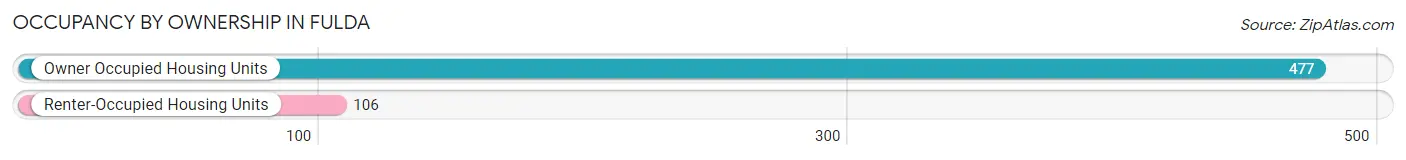
| Occupancy | # Housing Units | % Housing Units |
| Owner Occupied Housing Units | 477 | 81.8% |
| Renter-Occupied Housing Units | 106 | 18.2% |
| Total Occupied Housing Units | 583 | 100.0% |
Occupancy by Household Size in Fulda
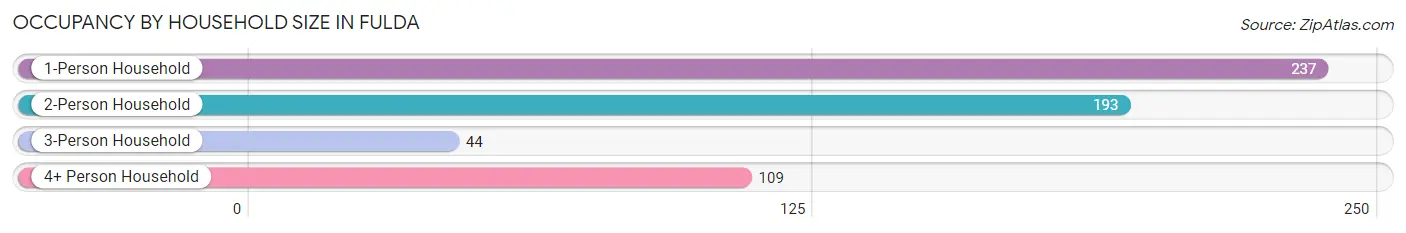
| Household Size | # Housing Units | % Housing Units |
| 1-Person Household | 237 | 40.6% |
| 2-Person Household | 193 | 33.1% |
| 3-Person Household | 44 | 7.5% |
| 4+ Person Household | 109 | 18.7% |
| Total Housing Units | 583 | 100.0% |
Occupancy by Ownership by Household Size in Fulda
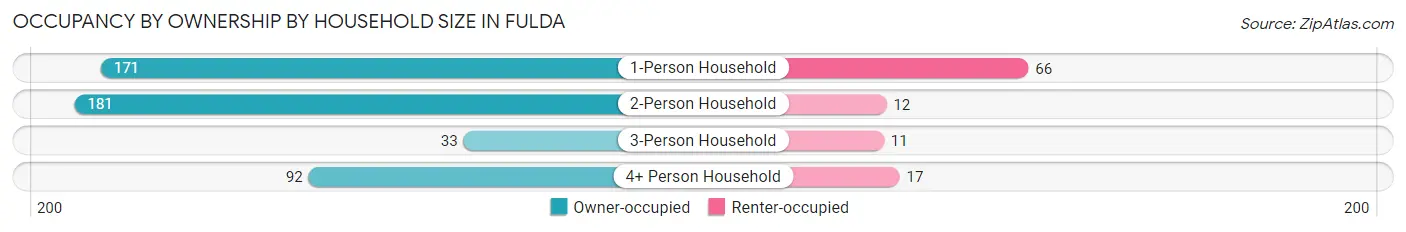
| Household Size | Owner-occupied | Renter-occupied |
| 1-Person Household | 171 (72.2%) | 66 (27.9%) |
| 2-Person Household | 181 (93.8%) | 12 (6.2%) |
| 3-Person Household | 33 (75.0%) | 11 (25.0%) |
| 4+ Person Household | 92 (84.4%) | 17 (15.6%) |
| Total Housing Units | 477 (81.8%) | 106 (18.2%) |
Occupancy by Educational Attainment in Fulda
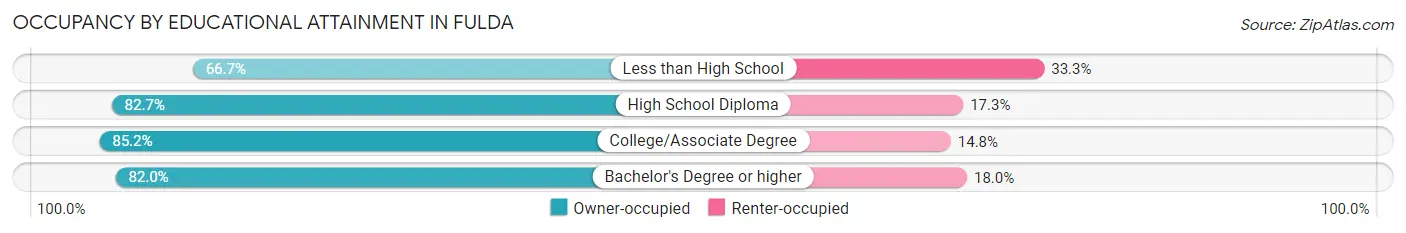
| Household Size | Owner-occupied | Renter-occupied |
| Less than High School | 38 (66.7%) | 19 (33.3%) |
| High School Diploma | 187 (82.7%) | 39 (17.3%) |
| College/Associate Degree | 161 (85.2%) | 28 (14.8%) |
| Bachelor's Degree or higher | 91 (82.0%) | 20 (18.0%) |
Occupancy by Age of Householder in Fulda
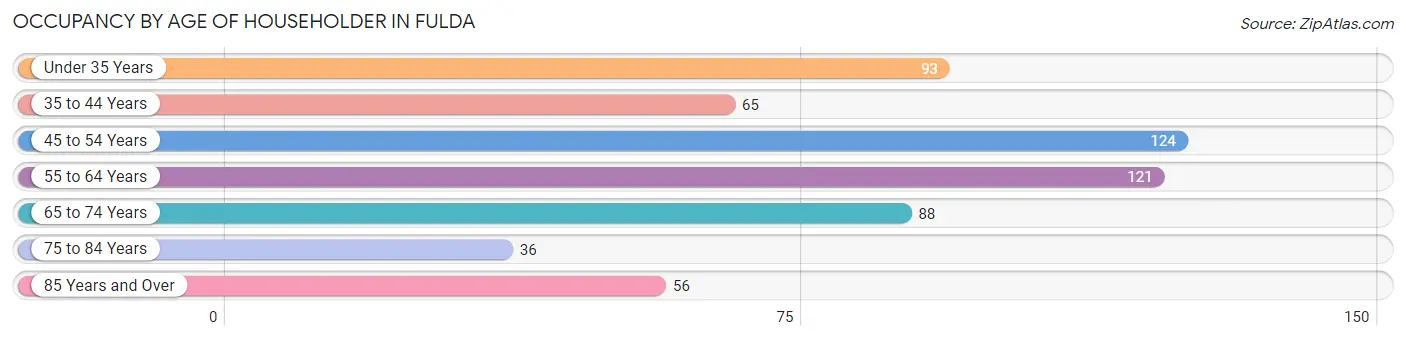
| Age Bracket | # Households | % Households |
| Under 35 Years | 93 | 16.0% |
| 35 to 44 Years | 65 | 11.2% |
| 45 to 54 Years | 124 | 21.3% |
| 55 to 64 Years | 121 | 20.7% |
| 65 to 74 Years | 88 | 15.1% |
| 75 to 84 Years | 36 | 6.2% |
| 85 Years and Over | 56 | 9.6% |
| Total | 583 | 100.0% |
Housing Finances in Fulda
Median Income by Occupancy in Fulda
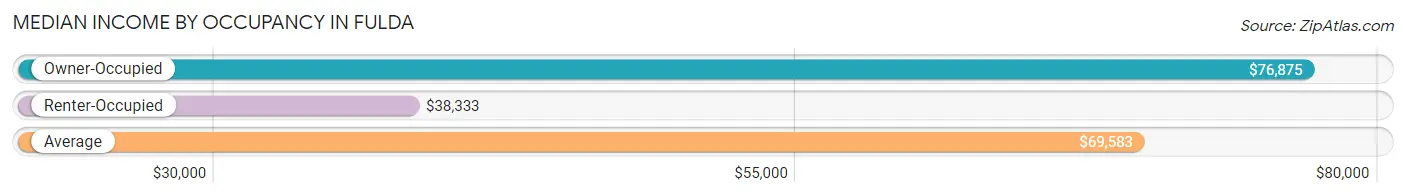
| Occupancy Type | # Households | Median Income |
| Owner-Occupied | 477 (81.8%) | $76,875 |
| Renter-Occupied | 106 (18.2%) | $38,333 |
| Average | 583 (100.0%) | $69,583 |
Occupancy by Householder Income Bracket in Fulda
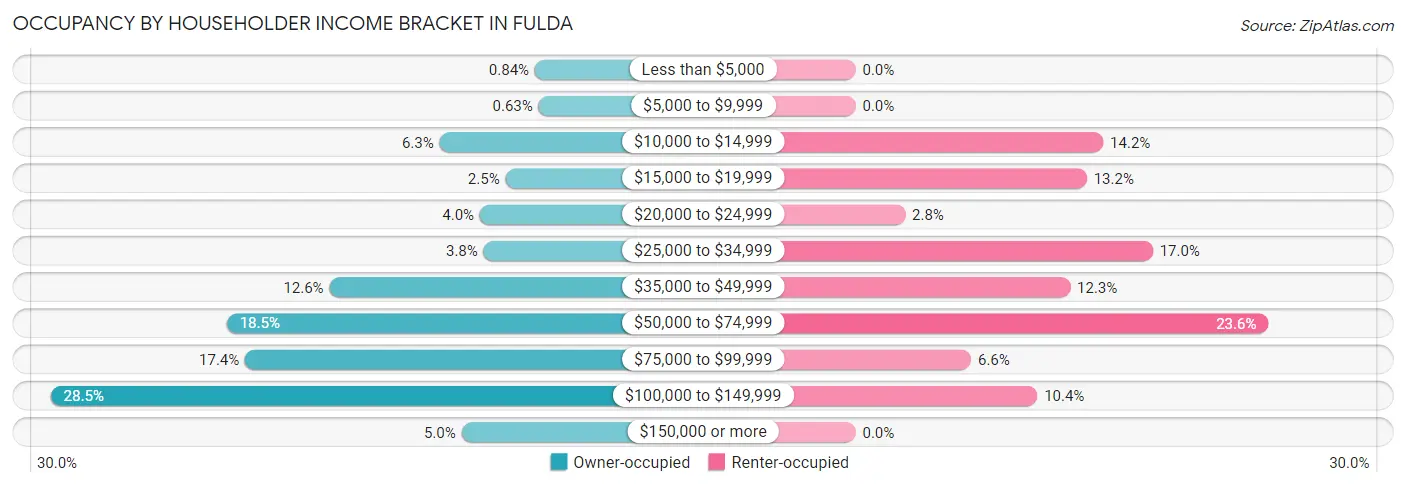
| Income Bracket | Owner-occupied | Renter-occupied |
| Less than $5,000 | 4 (0.8%) | 0 (0.0%) |
| $5,000 to $9,999 | 3 (0.6%) | 0 (0.0%) |
| $10,000 to $14,999 | 30 (6.3%) | 15 (14.1%) |
| $15,000 to $19,999 | 12 (2.5%) | 14 (13.2%) |
| $20,000 to $24,999 | 19 (4.0%) | 3 (2.8%) |
| $25,000 to $34,999 | 18 (3.8%) | 18 (17.0%) |
| $35,000 to $49,999 | 60 (12.6%) | 13 (12.3%) |
| $50,000 to $74,999 | 88 (18.4%) | 25 (23.6%) |
| $75,000 to $99,999 | 83 (17.4%) | 7 (6.6%) |
| $100,000 to $149,999 | 136 (28.5%) | 11 (10.4%) |
| $150,000 or more | 24 (5.0%) | 0 (0.0%) |
| Total | 477 (100.0%) | 106 (100.0%) |
Monthly Housing Cost Tiers in Fulda
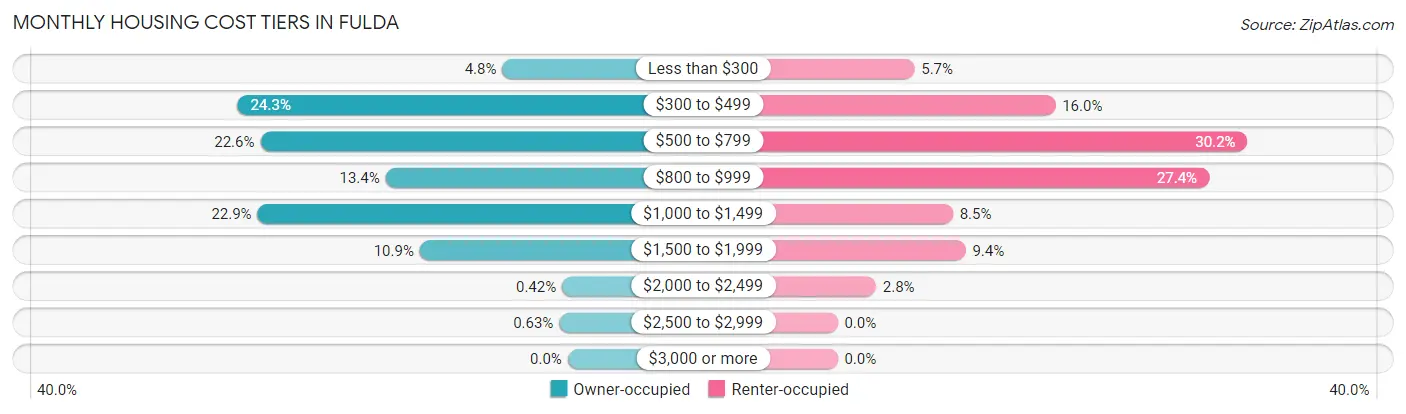
| Monthly Cost | Owner-occupied | Renter-occupied |
| Less than $300 | 23 (4.8%) | 6 (5.7%) |
| $300 to $499 | 116 (24.3%) | 17 (16.0%) |
| $500 to $799 | 108 (22.6%) | 32 (30.2%) |
| $800 to $999 | 64 (13.4%) | 29 (27.4%) |
| $1,000 to $1,499 | 109 (22.9%) | 9 (8.5%) |
| $1,500 to $1,999 | 52 (10.9%) | 10 (9.4%) |
| $2,000 to $2,499 | 2 (0.4%) | 3 (2.8%) |
| $2,500 to $2,999 | 3 (0.6%) | 0 (0.0%) |
| $3,000 or more | 0 (0.0%) | 0 (0.0%) |
| Total | 477 (100.0%) | 106 (100.0%) |
Physical Housing Characteristics in Fulda
Housing Structures in Fulda
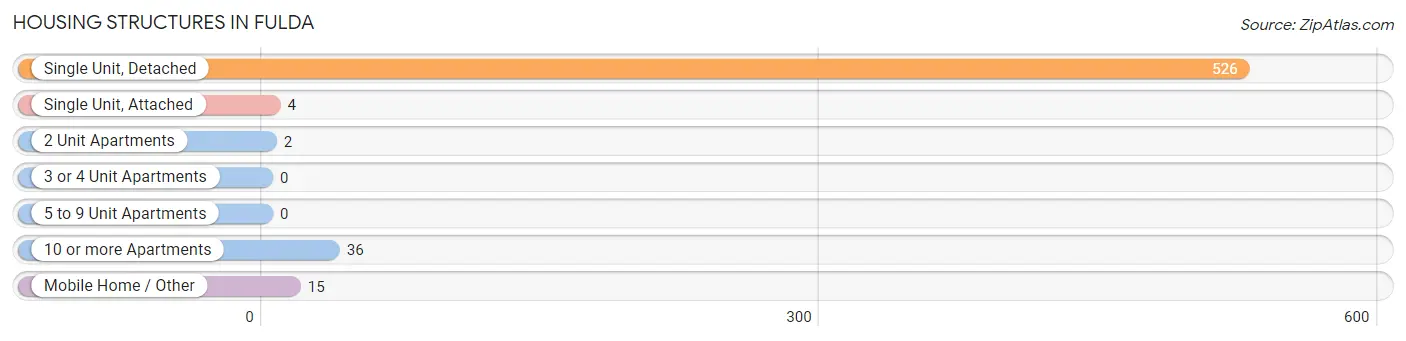
| Structure Type | # Housing Units | % Housing Units |
| Single Unit, Detached | 526 | 90.2% |
| Single Unit, Attached | 4 | 0.7% |
| 2 Unit Apartments | 2 | 0.3% |
| 3 or 4 Unit Apartments | 0 | 0.0% |
| 5 to 9 Unit Apartments | 0 | 0.0% |
| 10 or more Apartments | 36 | 6.2% |
| Mobile Home / Other | 15 | 2.6% |
| Total | 583 | 100.0% |
Housing Structures by Occupancy in Fulda
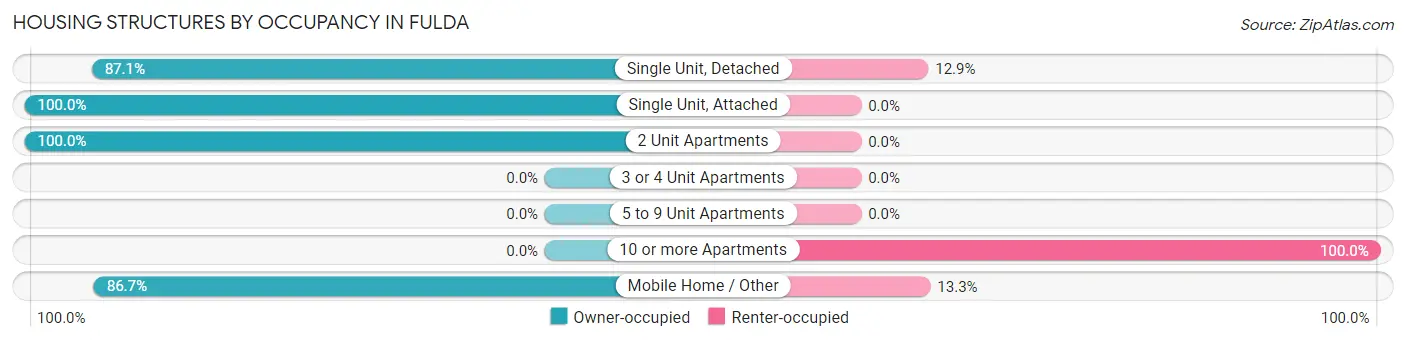
| Structure Type | Owner-occupied | Renter-occupied |
| Single Unit, Detached | 458 (87.1%) | 68 (12.9%) |
| Single Unit, Attached | 4 (100.0%) | 0 (0.0%) |
| 2 Unit Apartments | 2 (100.0%) | 0 (0.0%) |
| 3 or 4 Unit Apartments | 0 (0.0%) | 0 (0.0%) |
| 5 to 9 Unit Apartments | 0 (0.0%) | 0 (0.0%) |
| 10 or more Apartments | 0 (0.0%) | 36 (100.0%) |
| Mobile Home / Other | 13 (86.7%) | 2 (13.3%) |
| Total | 477 (81.8%) | 106 (18.2%) |
Housing Structures by Number of Rooms in Fulda
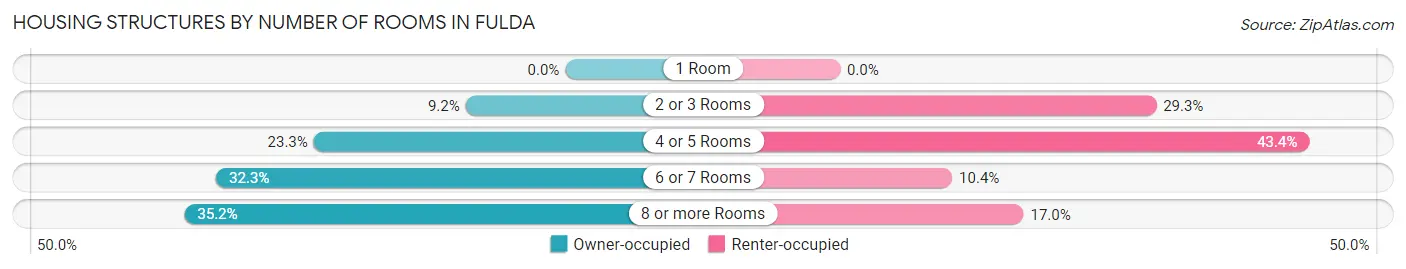
| Number of Rooms | Owner-occupied | Renter-occupied |
| 1 Room | 0 (0.0%) | 0 (0.0%) |
| 2 or 3 Rooms | 44 (9.2%) | 31 (29.2%) |
| 4 or 5 Rooms | 111 (23.3%) | 46 (43.4%) |
| 6 or 7 Rooms | 154 (32.3%) | 11 (10.4%) |
| 8 or more Rooms | 168 (35.2%) | 18 (17.0%) |
| Total | 477 (100.0%) | 106 (100.0%) |
Housing Structure by Heating Type in Fulda
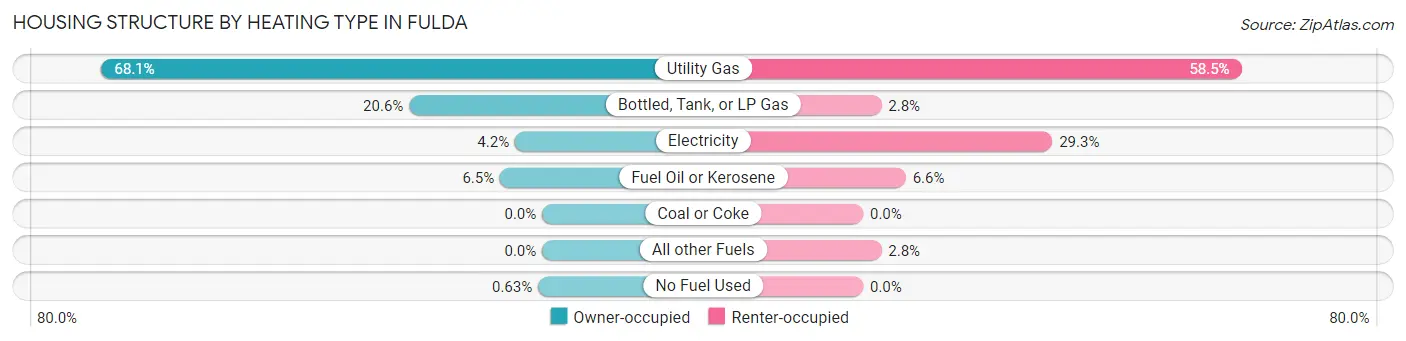
| Heating Type | Owner-occupied | Renter-occupied |
| Utility Gas | 325 (68.1%) | 62 (58.5%) |
| Bottled, Tank, or LP Gas | 98 (20.5%) | 3 (2.8%) |
| Electricity | 20 (4.2%) | 31 (29.2%) |
| Fuel Oil or Kerosene | 31 (6.5%) | 7 (6.6%) |
| Coal or Coke | 0 (0.0%) | 0 (0.0%) |
| All other Fuels | 0 (0.0%) | 3 (2.8%) |
| No Fuel Used | 3 (0.6%) | 0 (0.0%) |
| Total | 477 (100.0%) | 106 (100.0%) |
Household Vehicle Usage in Fulda
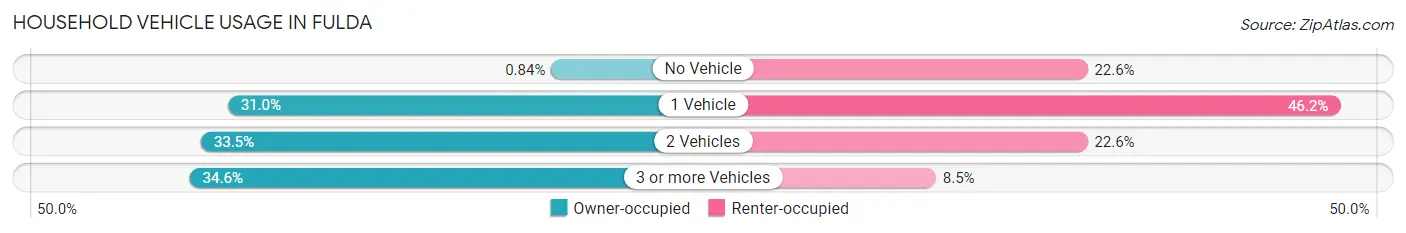
| Vehicles per Household | Owner-occupied | Renter-occupied |
| No Vehicle | 4 (0.8%) | 24 (22.6%) |
| 1 Vehicle | 148 (31.0%) | 49 (46.2%) |
| 2 Vehicles | 160 (33.5%) | 24 (22.6%) |
| 3 or more Vehicles | 165 (34.6%) | 9 (8.5%) |
| Total | 477 (100.0%) | 106 (100.0%) |
Real Estate & Mortgages in Fulda
Real Estate and Mortgage Overview in Fulda
| Characteristic | Without Mortgage | With Mortgage |
| Housing Units | 230 | 247 |
| Median Property Value | $131,700 | $153,300 |
| Median Household Income | $56,250 | $16 |
| Monthly Housing Costs | $484 | $0 |
| Real Estate Taxes | $1,476 | $5 |
Property Value by Mortgage Status in Fulda
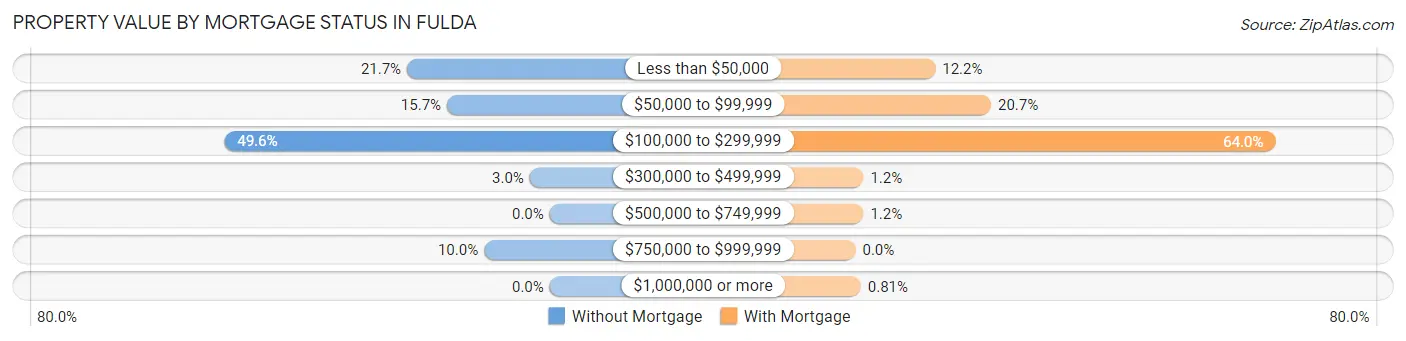
| Property Value | Without Mortgage | With Mortgage |
| Less than $50,000 | 50 (21.7%) | 30 (12.1%) |
| $50,000 to $99,999 | 36 (15.7%) | 51 (20.6%) |
| $100,000 to $299,999 | 114 (49.6%) | 158 (64.0%) |
| $300,000 to $499,999 | 7 (3.0%) | 3 (1.2%) |
| $500,000 to $749,999 | 0 (0.0%) | 3 (1.2%) |
| $750,000 to $999,999 | 23 (10.0%) | 0 (0.0%) |
| $1,000,000 or more | 0 (0.0%) | 2 (0.8%) |
| Total | 230 (100.0%) | 247 (100.0%) |
Household Income by Mortgage Status in Fulda
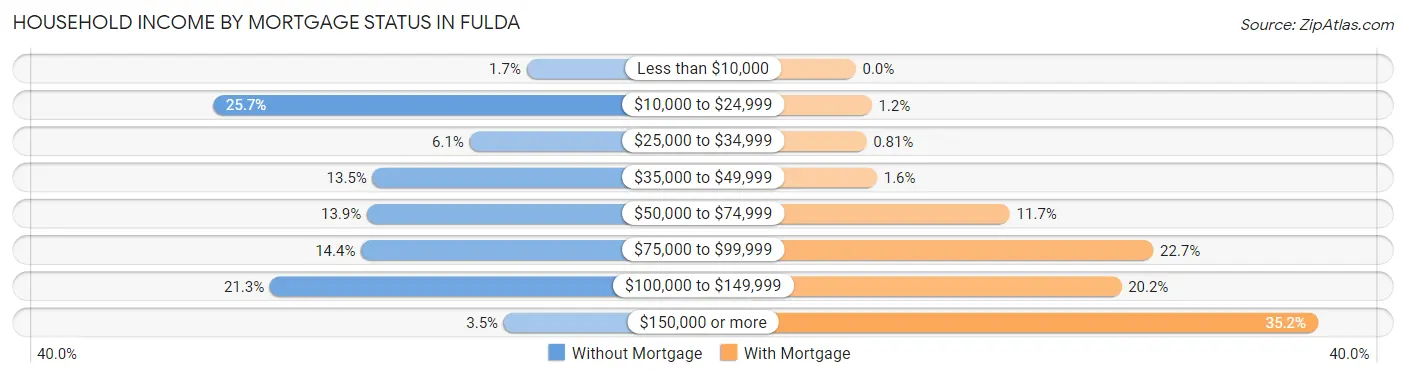
| Household Income | Without Mortgage | With Mortgage |
| Less than $10,000 | 4 (1.7%) | 0 (0.0%) |
| $10,000 to $24,999 | 59 (25.7%) | 3 (1.2%) |
| $25,000 to $34,999 | 14 (6.1%) | 2 (0.8%) |
| $35,000 to $49,999 | 31 (13.5%) | 4 (1.6%) |
| $50,000 to $74,999 | 32 (13.9%) | 29 (11.7%) |
| $75,000 to $99,999 | 33 (14.3%) | 56 (22.7%) |
| $100,000 to $149,999 | 49 (21.3%) | 50 (20.2%) |
| $150,000 or more | 8 (3.5%) | 87 (35.2%) |
| Total | 230 (100.0%) | 247 (100.0%) |
Property Value to Household Income Ratio in Fulda
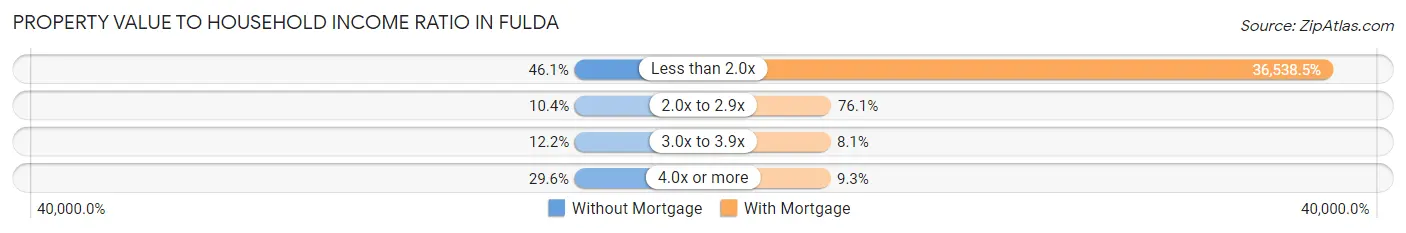
| Value-to-Income Ratio | Without Mortgage | With Mortgage |
| Less than 2.0x | 106 (46.1%) | 90,250 (36,538.5%) |
| 2.0x to 2.9x | 24 (10.4%) | 188 (76.1%) |
| 3.0x to 3.9x | 28 (12.2%) | 20 (8.1%) |
| 4.0x or more | 68 (29.6%) | 23 (9.3%) |
| Total | 230 (100.0%) | 247 (100.0%) |
Real Estate Taxes by Mortgage Status in Fulda
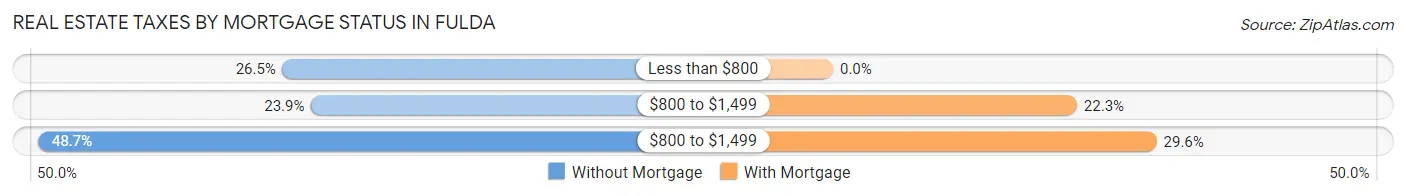
| Property Taxes | Without Mortgage | With Mortgage |
| Less than $800 | 61 (26.5%) | 0 (0.0%) |
| $800 to $1,499 | 55 (23.9%) | 55 (22.3%) |
| $800 to $1,499 | 112 (48.7%) | 73 (29.5%) |
| Total | 230 (100.0%) | 247 (100.0%) |
Health & Disability in Fulda
Health Insurance Coverage by Age in Fulda
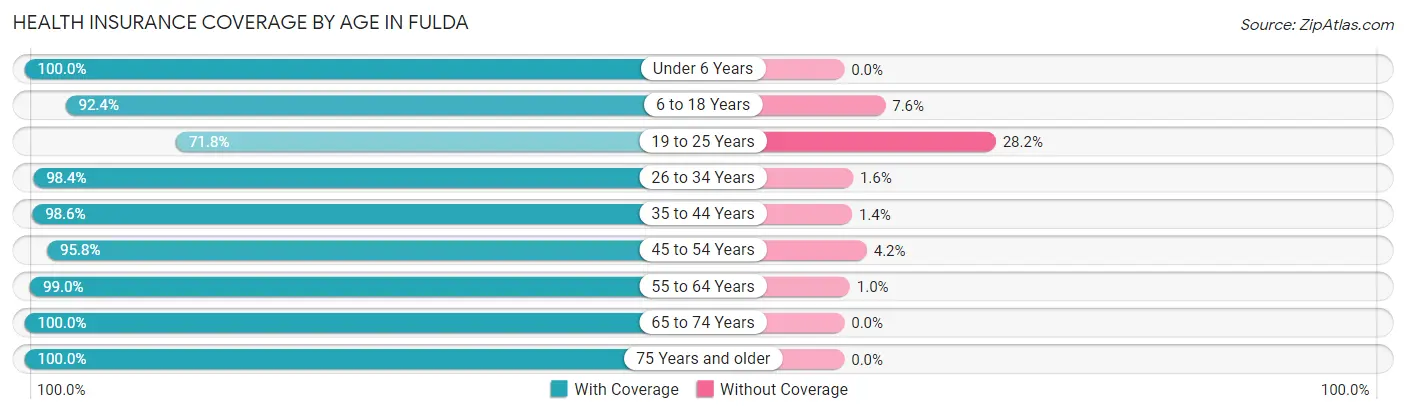
| Age Bracket | With Coverage | Without Coverage |
| Under 6 Years | 71 (100.0%) | 0 (0.0%) |
| 6 to 18 Years | 266 (92.4%) | 22 (7.6%) |
| 19 to 25 Years | 61 (71.8%) | 24 (28.2%) |
| 26 to 34 Years | 122 (98.4%) | 2 (1.6%) |
| 35 to 44 Years | 138 (98.6%) | 2 (1.4%) |
| 45 to 54 Years | 160 (95.8%) | 7 (4.2%) |
| 55 to 64 Years | 191 (99.0%) | 2 (1.0%) |
| 65 to 74 Years | 119 (100.0%) | 0 (0.0%) |
| 75 Years and older | 130 (100.0%) | 0 (0.0%) |
| Total | 1,258 (95.5%) | 59 (4.5%) |
Health Insurance Coverage by Citizenship Status in Fulda
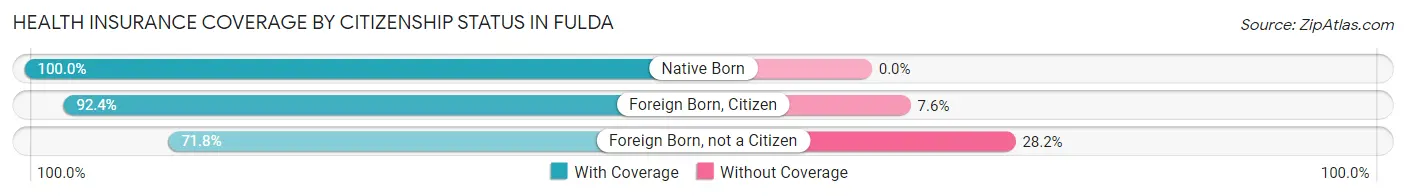
| Citizenship Status | With Coverage | Without Coverage |
| Native Born | 71 (100.0%) | 0 (0.0%) |
| Foreign Born, Citizen | 266 (92.4%) | 22 (7.6%) |
| Foreign Born, not a Citizen | 61 (71.8%) | 24 (28.2%) |
Health Insurance Coverage by Household Income in Fulda
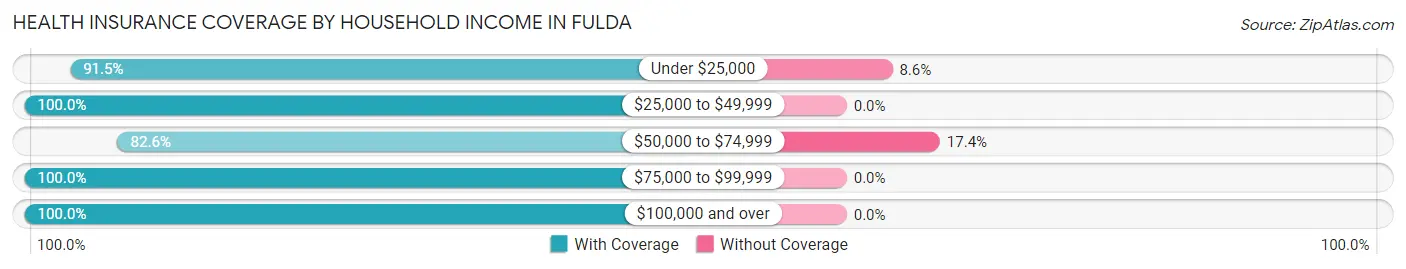
| Household Income | With Coverage | Without Coverage |
| Under $25,000 | 107 (91.4%) | 10 (8.6%) |
| $25,000 to $49,999 | 175 (100.0%) | 0 (0.0%) |
| $50,000 to $74,999 | 232 (82.6%) | 49 (17.4%) |
| $75,000 to $99,999 | 244 (100.0%) | 0 (0.0%) |
| $100,000 and over | 489 (100.0%) | 0 (0.0%) |
Public vs Private Health Insurance Coverage by Age in Fulda
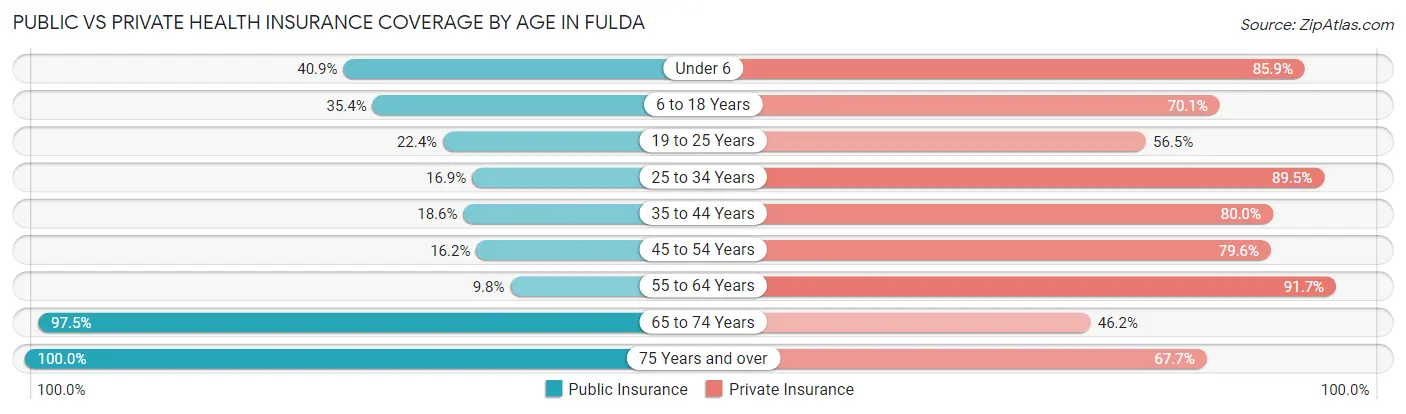
| Age Bracket | Public Insurance | Private Insurance |
| Under 6 | 29 (40.8%) | 61 (85.9%) |
| 6 to 18 Years | 102 (35.4%) | 202 (70.1%) |
| 19 to 25 Years | 19 (22.4%) | 48 (56.5%) |
| 25 to 34 Years | 21 (16.9%) | 111 (89.5%) |
| 35 to 44 Years | 26 (18.6%) | 112 (80.0%) |
| 45 to 54 Years | 27 (16.2%) | 133 (79.6%) |
| 55 to 64 Years | 19 (9.8%) | 177 (91.7%) |
| 65 to 74 Years | 116 (97.5%) | 55 (46.2%) |
| 75 Years and over | 130 (100.0%) | 88 (67.7%) |
| Total | 489 (37.1%) | 987 (74.9%) |
Disability Status by Sex by Age in Fulda
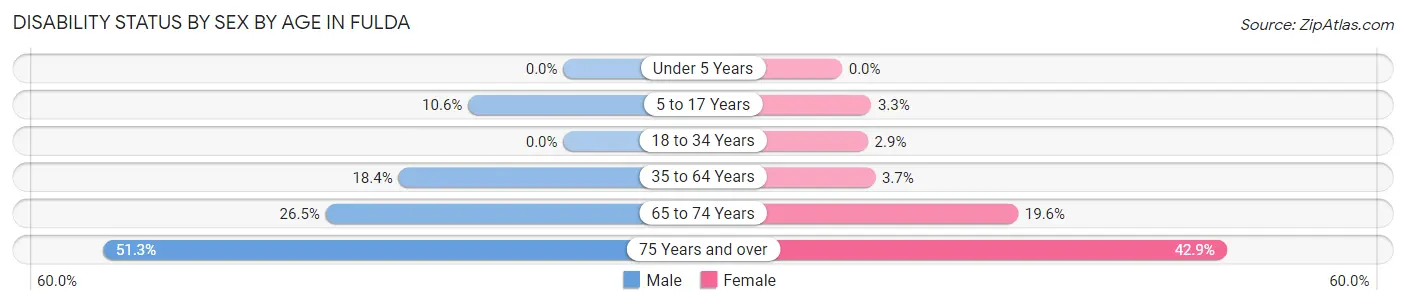
| Age Bracket | Male | Female |
| Under 5 Years | 0 (0.0%) | 0 (0.0%) |
| 5 to 17 Years | 16 (10.6%) | 4 (3.3%) |
| 18 to 34 Years | 0 (0.0%) | 4 (2.9%) |
| 35 to 64 Years | 47 (18.4%) | 9 (3.7%) |
| 65 to 74 Years | 18 (26.5%) | 10 (19.6%) |
| 75 Years and over | 20 (51.3%) | 39 (42.9%) |
Disability Class by Sex by Age in Fulda
Disability Class: Hearing Difficulty
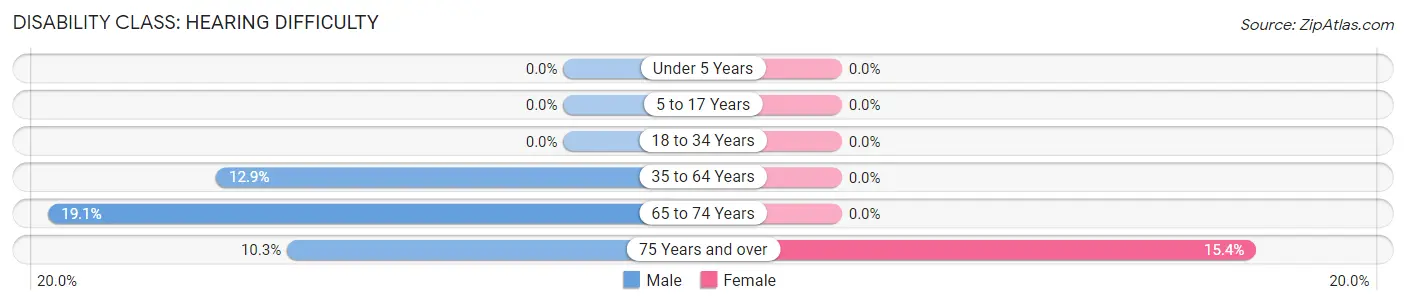
| Age Bracket | Male | Female |
| Under 5 Years | 0 (0.0%) | 0 (0.0%) |
| 5 to 17 Years | 0 (0.0%) | 0 (0.0%) |
| 18 to 34 Years | 0 (0.0%) | 0 (0.0%) |
| 35 to 64 Years | 33 (12.9%) | 0 (0.0%) |
| 65 to 74 Years | 13 (19.1%) | 0 (0.0%) |
| 75 Years and over | 4 (10.3%) | 14 (15.4%) |
Disability Class: Vision Difficulty
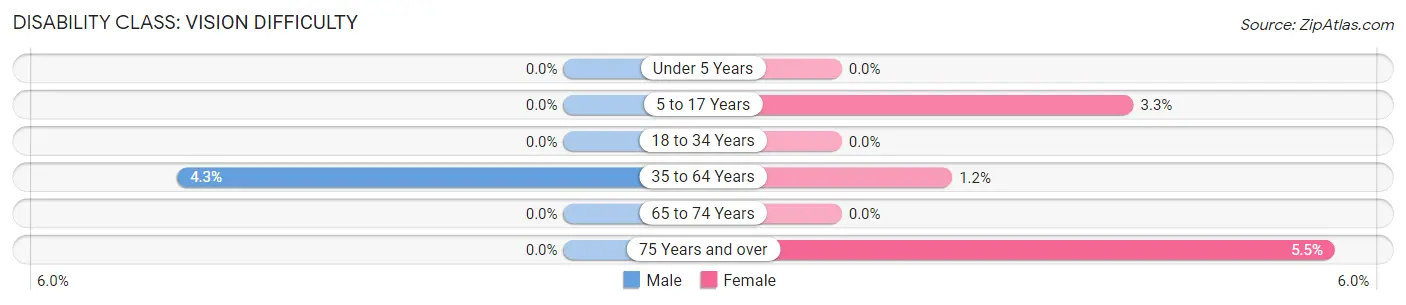
| Age Bracket | Male | Female |
| Under 5 Years | 0 (0.0%) | 0 (0.0%) |
| 5 to 17 Years | 0 (0.0%) | 4 (3.3%) |
| 18 to 34 Years | 0 (0.0%) | 0 (0.0%) |
| 35 to 64 Years | 11 (4.3%) | 3 (1.2%) |
| 65 to 74 Years | 0 (0.0%) | 0 (0.0%) |
| 75 Years and over | 0 (0.0%) | 5 (5.5%) |
Disability Class: Cognitive Difficulty
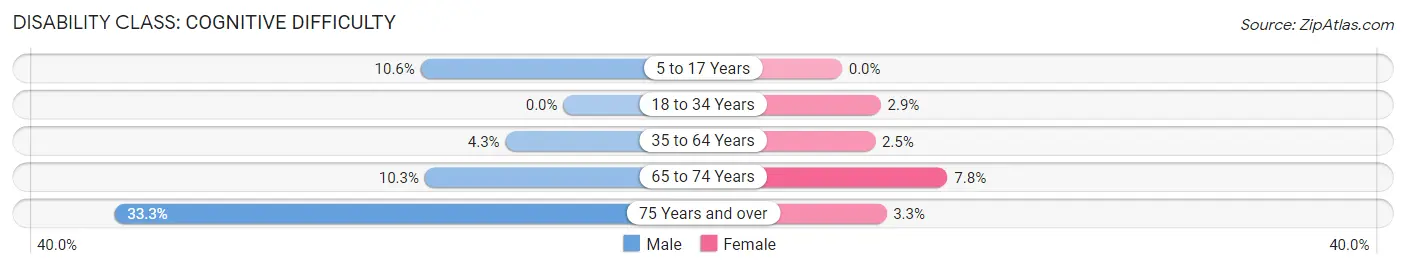
| Age Bracket | Male | Female |
| 5 to 17 Years | 16 (10.6%) | 0 (0.0%) |
| 18 to 34 Years | 0 (0.0%) | 4 (2.9%) |
| 35 to 64 Years | 11 (4.3%) | 6 (2.5%) |
| 65 to 74 Years | 7 (10.3%) | 4 (7.8%) |
| 75 Years and over | 13 (33.3%) | 3 (3.3%) |
Disability Class: Ambulatory Difficulty
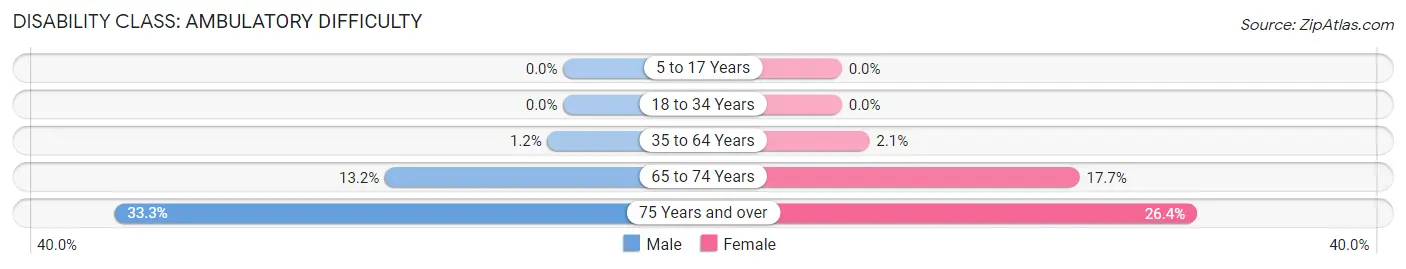
| Age Bracket | Male | Female |
| 5 to 17 Years | 0 (0.0%) | 0 (0.0%) |
| 18 to 34 Years | 0 (0.0%) | 0 (0.0%) |
| 35 to 64 Years | 3 (1.2%) | 5 (2.1%) |
| 65 to 74 Years | 9 (13.2%) | 9 (17.6%) |
| 75 Years and over | 13 (33.3%) | 24 (26.4%) |
Disability Class: Self-Care Difficulty
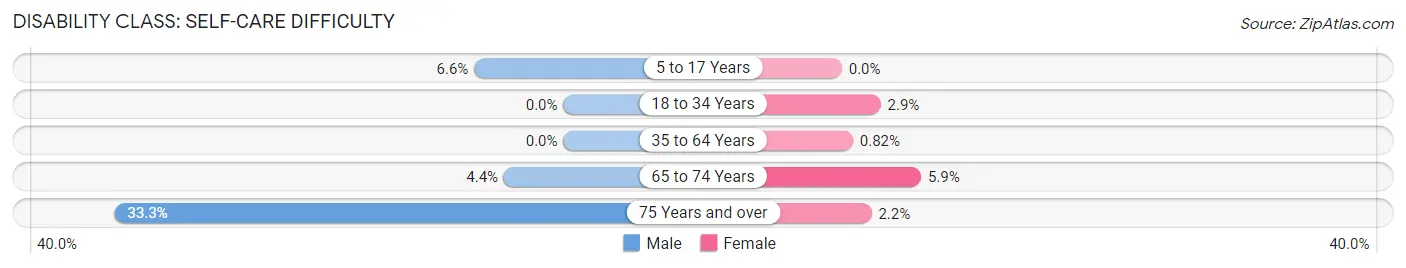
| Age Bracket | Male | Female |
| 5 to 17 Years | 10 (6.6%) | 0 (0.0%) |
| 18 to 34 Years | 0 (0.0%) | 4 (2.9%) |
| 35 to 64 Years | 0 (0.0%) | 2 (0.8%) |
| 65 to 74 Years | 3 (4.4%) | 3 (5.9%) |
| 75 Years and over | 13 (33.3%) | 2 (2.2%) |
Technology Access in Fulda
Computing Device Access in Fulda
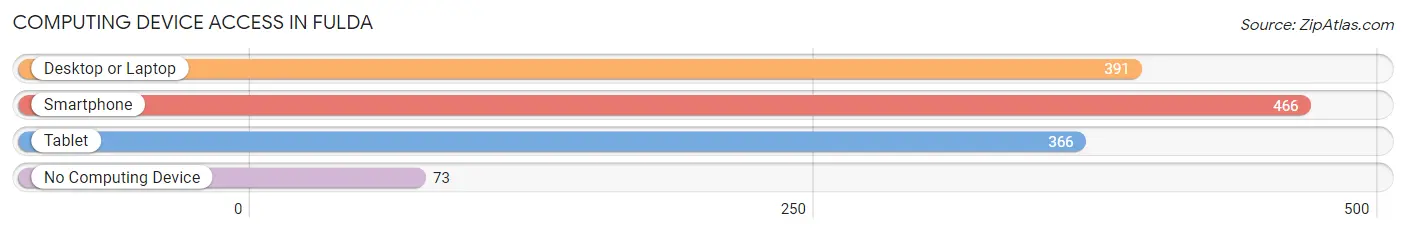
| Device Type | # Households | % Households |
| Desktop or Laptop | 391 | 67.1% |
| Smartphone | 466 | 79.9% |
| Tablet | 366 | 62.8% |
| No Computing Device | 73 | 12.5% |
| Total | 583 | 100.0% |
Internet Access in Fulda
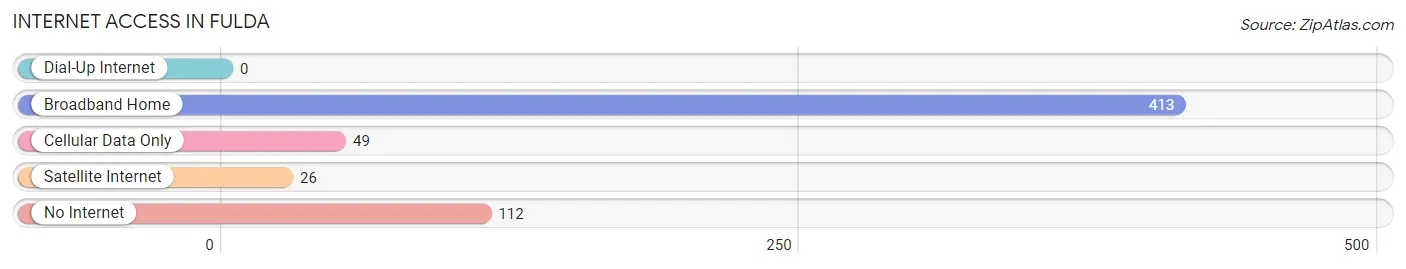
| Internet Type | # Households | % Households |
| Dial-Up Internet | 0 | 0.0% |
| Broadband Home | 413 | 70.8% |
| Cellular Data Only | 49 | 8.4% |
| Satellite Internet | 26 | 4.5% |
| No Internet | 112 | 19.2% |
| Total | 583 | 100.0% |
Fulda Summary
History
The city of Fulda, Minnesota is located in the southwestern corner of the state, in Murray County. It is situated on the banks of the Des Moines River, and is the county seat of Murray County. The city was founded in 1872, and was named after Fulda, Germany. The city was originally a trading post, and was later incorporated in 1881.
The city of Fulda has a rich history, and has been home to many different cultures over the years. The first settlers to the area were Native Americans, who were drawn to the area due to its abundance of natural resources. The first white settlers to the area were German immigrants, who arrived in the late 1800s. The city was also home to a large population of Scandinavian immigrants, who arrived in the early 1900s.
The city of Fulda has been an important part of the region’s economy for many years. It was an important stop on the railroad line, and was also home to a large number of businesses, including a flour mill, a creamery, and a lumber mill. The city was also home to a large number of farms, which provided the area with much of its food and other resources.
Geography
The city of Fulda is located in the southwestern corner of Minnesota, in Murray County. It is situated on the banks of the Des Moines River, and is the county seat of Murray County. The city is located at an elevation of 1,072 feet above sea level.
The city of Fulda is located in a region of rolling hills and prairies. The area is known for its fertile soil, and is home to a variety of crops, including corn, soybeans, and wheat. The city is also home to a variety of wildlife, including deer, turkey, and pheasants.
The city of Fulda is located in a humid continental climate zone, which is characterized by hot summers and cold winters. The average temperature in the summer is around 75 degrees Fahrenheit, and the average temperature in the winter is around 20 degrees Fahrenheit.
Economy
The city of Fulda has a strong and diverse economy. The city is home to a variety of businesses, including manufacturing, retail, and service industries. The city is also home to a number of agricultural businesses, including dairy farms, grain elevators, and feed mills.
The city of Fulda is also home to a number of educational institutions, including a community college, a technical college, and a vocational school. The city is also home to a number of healthcare facilities, including a hospital and several clinics.
The city of Fulda is also home to a number of recreational activities, including golf courses, parks, and trails. The city is also home to a number of cultural attractions, including museums, galleries, and theaters.
Demographics
The city of Fulda has a population of 2,845 people, according to the 2010 census. The population is made up of a variety of ethnic and racial backgrounds, including White (90.2%), Hispanic or Latino (4.2%), African American (2.2%), and Native American (1.2%).
The median household income in the city of Fulda is $41,944, and the median home value is $90,400. The city has a poverty rate of 16.2%, and the unemployment rate is 4.2%. The city has a high school graduation rate of 87.2%, and the average commute time is 18.2 minutes.
Common Questions
What is Per Capita Income in Fulda?
Per Capita income in Fulda is $33,182.
What is the Median Family Income in Fulda?
Median Family Income in Fulda is $95,139.
What is the Median Household income in Fulda?
Median Household Income in Fulda is $69,583.
What is Income or Wage Gap in Fulda?
Income or Wage Gap in Fulda is 33.9%.
Women in Fulda earn 66.1 cents for every dollar earned by a man.
What is Inequality or Gini Index in Fulda?
Inequality or Gini Index in Fulda is 0.37.
What is the Total Population of Fulda?
Total Population of Fulda is 1,377.
What is the Total Male Population of Fulda?
Total Male Population of Fulda is 636.
What is the Total Female Population of Fulda?
Total Female Population of Fulda is 741.
What is the Ratio of Males per 100 Females in Fulda?
There are 85.83 Males per 100 Females in Fulda.
What is the Ratio of Females per 100 Males in Fulda?
There are 116.51 Females per 100 Males in Fulda.
What is the Median Population Age in Fulda?
Median Population Age in Fulda is 44.6 Years.
What is the Average Family Size in Fulda
Average Family Size in Fulda is 3.1 People.
What is the Average Household Size in Fulda
Average Household Size in Fulda is 2.2 People.
How Large is the Labor Force in Fulda?
There are 711 People in the Labor Forcein in Fulda.
What is the Percentage of People in the Labor Force in Fulda?
66.5% of People are in the Labor Force in Fulda.
What is the Unemployment Rate in Fulda?
Unemployment Rate in Fulda is 1.4%.