Eldridge, IA Map & Demographics
Eldridge Map
Eldridge Overview
$45,273
PER CAPITA INCOME
$110,268
AVG FAMILY INCOME
$89,946
AVG HOUSEHOLD INCOME
32.0%
WAGE / INCOME GAP [ % ]
68.0¢/ $1
WAGE / INCOME GAP [ $ ]
0.41
INEQUALITY / GINI INDEX
6,693
TOTAL POPULATION
3,487
MALE POPULATION
3,206
FEMALE POPULATION
108.76
MALES / 100 FEMALES
91.94
FEMALES / 100 MALES
39.7
MEDIAN AGE
3.2
AVG FAMILY SIZE
2.6
AVG HOUSEHOLD SIZE
3,417
LABOR FORCE [ PEOPLE ]
69.7%
PERCENT IN LABOR FORCE
1.7%
UNEMPLOYMENT RATE
Eldridge Zip Codes
Eldridge Area Codes
Income in Eldridge
Income Overview in Eldridge
Per Capita Income in Eldridge is $45,273, while median incomes of families and households are $110,268 and $89,946 respectively.
| Characteristic | Number | Measure |
| Per Capita Income | 6,693 | $45,273 |
| Median Family Income | 1,844 | $110,268 |
| Mean Family Income | 1,844 | $137,315 |
| Median Household Income | 2,589 | $89,946 |
| Mean Household Income | 2,589 | $116,285 |
| Income Deficit | 1,844 | $0 |
| Wage / Income Gap (%) | 6,693 | 32.01% |
| Wage / Income Gap ($) | 6,693 | 67.99¢ per $1 |
| Gini / Inequality Index | 6,693 | 0.41 |
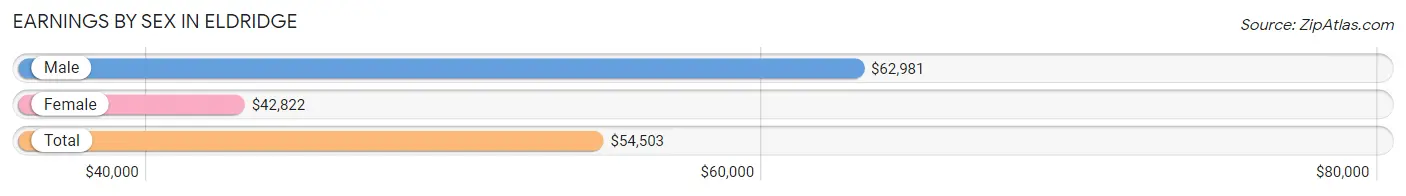
Earnings by Sex in Eldridge
Average Earnings in Eldridge are $54,503, $62,981 for men and $42,822 for women, a difference of 32.0%.
| Sex | Number | Average Earnings |
| Male | 1,972 (56.1%) | $62,981 |
| Female | 1,545 (43.9%) | $42,822 |
| Total | 3,517 (100.0%) | $54,503 |
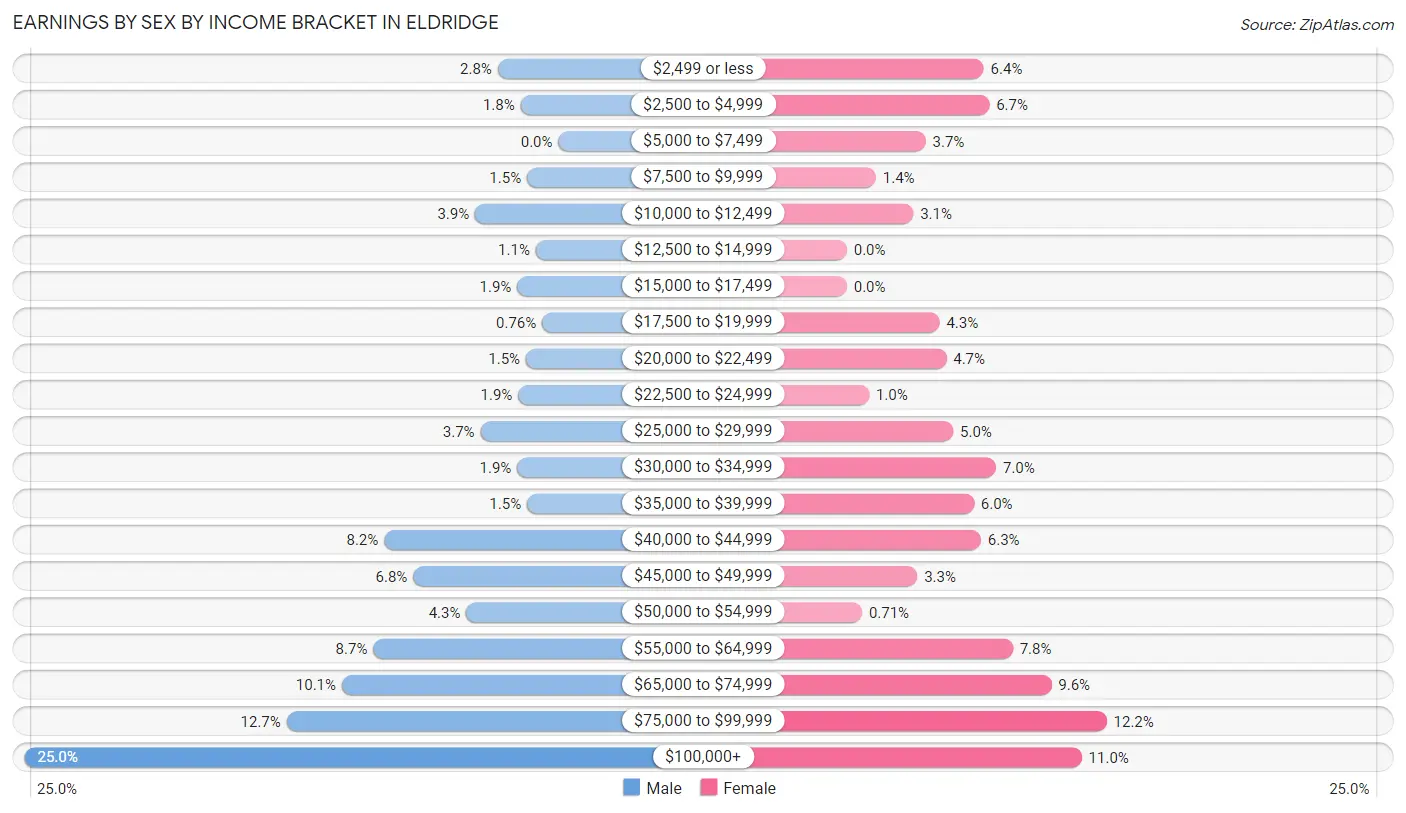
Earnings by Sex by Income Bracket in Eldridge
The most common earnings brackets in Eldridge are $100,000+ for men (493 | 25.0%) and $75,000 to $99,999 for women (188 | 12.2%).
| Income | Male | Female |
| $2,499 or less | 56 (2.8%) | 99 (6.4%) |
| $2,500 to $4,999 | 35 (1.8%) | 103 (6.7%) |
| $5,000 to $7,499 | 0 (0.0%) | 57 (3.7%) |
| $7,500 to $9,999 | 29 (1.5%) | 21 (1.4%) |
| $10,000 to $12,499 | 77 (3.9%) | 48 (3.1%) |
| $12,500 to $14,999 | 21 (1.1%) | 0 (0.0%) |
| $15,000 to $17,499 | 38 (1.9%) | 0 (0.0%) |
| $17,500 to $19,999 | 15 (0.8%) | 67 (4.3%) |
| $20,000 to $22,499 | 30 (1.5%) | 72 (4.7%) |
| $22,500 to $24,999 | 37 (1.9%) | 16 (1.0%) |
| $25,000 to $29,999 | 72 (3.6%) | 77 (5.0%) |
| $30,000 to $34,999 | 38 (1.9%) | 108 (7.0%) |
| $35,000 to $39,999 | 29 (1.5%) | 92 (5.9%) |
| $40,000 to $44,999 | 161 (8.2%) | 97 (6.3%) |
| $45,000 to $49,999 | 134 (6.8%) | 51 (3.3%) |
| $50,000 to $54,999 | 85 (4.3%) | 11 (0.7%) |
| $55,000 to $64,999 | 171 (8.7%) | 120 (7.8%) |
| $65,000 to $74,999 | 200 (10.1%) | 148 (9.6%) |
| $75,000 to $99,999 | 251 (12.7%) | 188 (12.2%) |
| $100,000+ | 493 (25.0%) | 170 (11.0%) |
| Total | 1,972 (100.0%) | 1,545 (100.0%) |
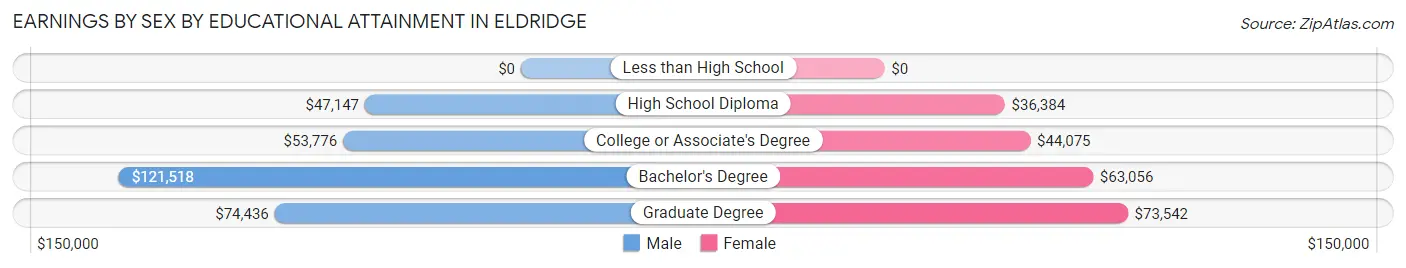
Earnings by Sex by Educational Attainment in Eldridge
Average earnings in Eldridge are $68,475 for men and $49,081 for women, a difference of 28.3%. Men with an educational attainment of bachelor's degree enjoy the highest average annual earnings of $121,518, while those with high school diploma education earn the least with $47,147. Women with an educational attainment of graduate degree earn the most with the average annual earnings of $73,542, while those with high school diploma education have the smallest earnings of $36,384.
| Educational Attainment | Male Income | Female Income |
| Less than High School | - | - |
| High School Diploma | $47,147 | $36,384 |
| College or Associate's Degree | $53,776 | $44,075 |
| Bachelor's Degree | $121,518 | $63,056 |
| Graduate Degree | $74,436 | $73,542 |
| Total | $68,475 | $49,081 |
Family Income in Eldridge
Family Income Brackets in Eldridge
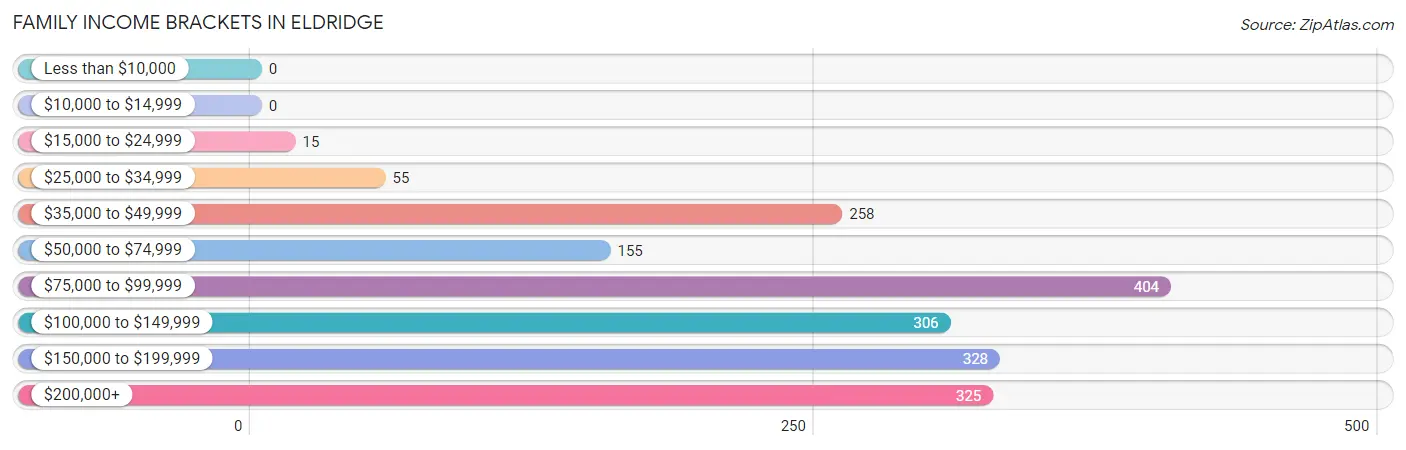
According to the Eldridge family income data, there are 404 families falling into the $75,000 to $99,999 income range, which is the most common income bracket and makes up 21.9% of all families.
| Income Bracket | # Families | % Families |
| Less than $10,000 | 0 | 0.0% |
| $10,000 to $14,999 | 0 | 0.0% |
| $15,000 to $24,999 | 15 | 0.8% |
| $25,000 to $34,999 | 55 | 3.0% |
| $35,000 to $49,999 | 258 | 14.0% |
| $50,000 to $74,999 | 155 | 8.4% |
| $75,000 to $99,999 | 404 | 21.9% |
| $100,000 to $149,999 | 306 | 16.6% |
| $150,000 to $199,999 | 328 | 17.8% |
| $200,000+ | 325 | 17.6% |
Family Income by Famaliy Size in Eldridge
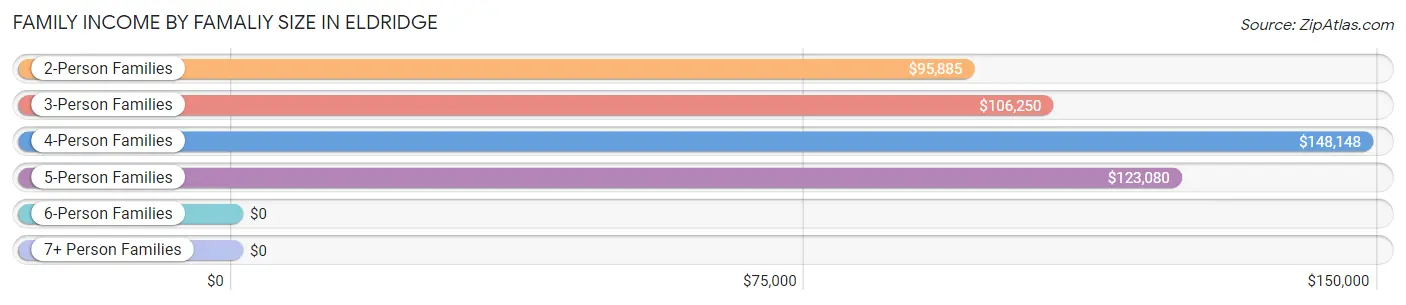
4-person families (412 | 22.3%) account for the highest median family income in Eldridge with $148,148 per family, while 2-person families (737 | 40.0%) have the highest median income of $47,942 per family member.
| Income Bracket | # Families | Median Income |
| 2-Person Families | 737 (40.0%) | $95,885 |
| 3-Person Families | 438 (23.7%) | $106,250 |
| 4-Person Families | 412 (22.3%) | $148,148 |
| 5-Person Families | 247 (13.4%) | $123,080 |
| 6-Person Families | 10 (0.5%) | $0 |
| 7+ Person Families | 0 (0.0%) | $0 |
| Total | 1,844 (100.0%) | $110,268 |
Family Income by Number of Earners in Eldridge
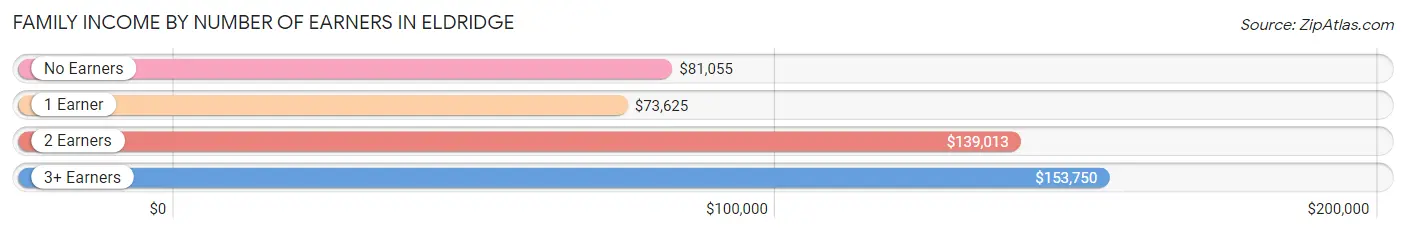
The median family income in Eldridge is $110,268, with families comprising 3+ earners (218) having the highest median family income of $153,750, while families with 1 earner (608) have the lowest median family income of $73,625, accounting for 11.8% and 33.0% of families, respectively.
| Number of Earners | # Families | Median Income |
| No Earners | 197 (10.7%) | $81,055 |
| 1 Earner | 608 (33.0%) | $73,625 |
| 2 Earners | 821 (44.5%) | $139,013 |
| 3+ Earners | 218 (11.8%) | $153,750 |
| Total | 1,844 (100.0%) | $110,268 |
Household Income in Eldridge
Household Income Brackets in Eldridge
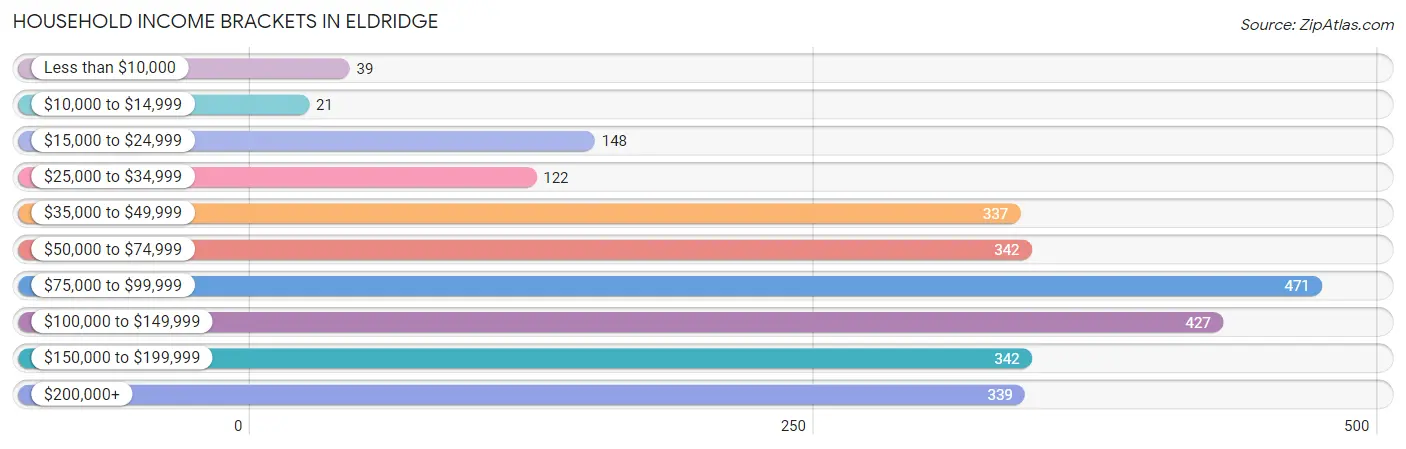
With 471 households falling in the category, the $75,000 to $99,999 income range is the most frequent in Eldridge, accounting for 18.2% of all households. In contrast, only 21 households (0.8%) fall into the $10,000 to $14,999 income bracket, making it the least populous group.
| Income Bracket | # Households | % Households |
| Less than $10,000 | 39 | 1.5% |
| $10,000 to $14,999 | 21 | 0.8% |
| $15,000 to $24,999 | 148 | 5.7% |
| $25,000 to $34,999 | 122 | 4.7% |
| $35,000 to $49,999 | 337 | 13.0% |
| $50,000 to $74,999 | 342 | 13.2% |
| $75,000 to $99,999 | 471 | 18.2% |
| $100,000 to $149,999 | 427 | 16.5% |
| $150,000 to $199,999 | 342 | 13.2% |
| $200,000+ | 339 | 13.1% |
Household Income by Householder Age in Eldridge
The median household income in Eldridge is $89,946, with the highest median household income of $128,750 found in the 25 to 44 years age bracket for the primary householder. A total of 819 households (31.6%) fall into this category. Meanwhile, the 15 to 24 years age bracket for the primary householder has the lowest median household income of $0, with 46 households (1.8%) in this group.
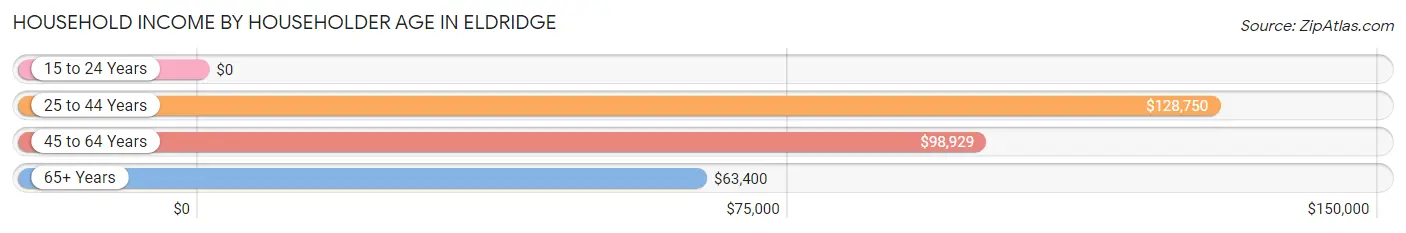
| Income Bracket | # Households | Median Income |
| 15 to 24 Years | 46 (1.8%) | $0 |
| 25 to 44 Years | 819 (31.6%) | $128,750 |
| 45 to 64 Years | 1,084 (41.9%) | $98,929 |
| 65+ Years | 640 (24.7%) | $63,400 |
| Total | 2,589 (100.0%) | $89,946 |
Poverty in Eldridge
Income Below Poverty by Sex and Age in Eldridge
With 0.8% poverty level for males and 2.3% for females among the residents of Eldridge, 75 year old and over males and 75 year old and over females are the most vulnerable to poverty, with 29 males (21.6%) and 36 females (13.9%) in their respective age groups living below the poverty level.
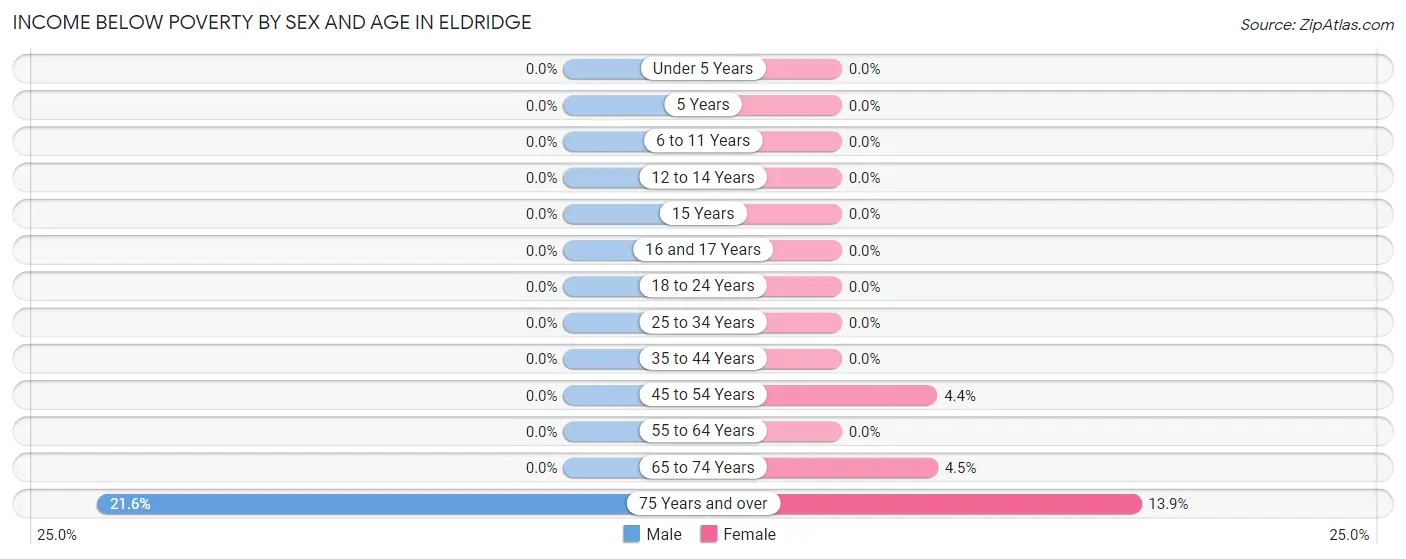
| Age Bracket | Male | Female |
| Under 5 Years | 0 (0.0%) | 0 (0.0%) |
| 5 Years | 0 (0.0%) | 0 (0.0%) |
| 6 to 11 Years | 0 (0.0%) | 0 (0.0%) |
| 12 to 14 Years | 0 (0.0%) | 0 (0.0%) |
| 15 Years | 0 (0.0%) | 0 (0.0%) |
| 16 and 17 Years | 0 (0.0%) | 0 (0.0%) |
| 18 to 24 Years | 0 (0.0%) | 0 (0.0%) |
| 25 to 34 Years | 0 (0.0%) | 0 (0.0%) |
| 35 to 44 Years | 0 (0.0%) | 0 (0.0%) |
| 45 to 54 Years | 0 (0.0%) | 25 (4.4%) |
| 55 to 64 Years | 0 (0.0%) | 0 (0.0%) |
| 65 to 74 Years | 0 (0.0%) | 13 (4.4%) |
| 75 Years and over | 29 (21.6%) | 36 (13.9%) |
| Total | 29 (0.8%) | 74 (2.3%) |
Income Above Poverty by Sex and Age in Eldridge
According to the poverty statistics in Eldridge, males aged under 5 years and females aged under 5 years are the age groups that are most secure financially, with 100.0% of males and 100.0% of females in these age groups living above the poverty line.
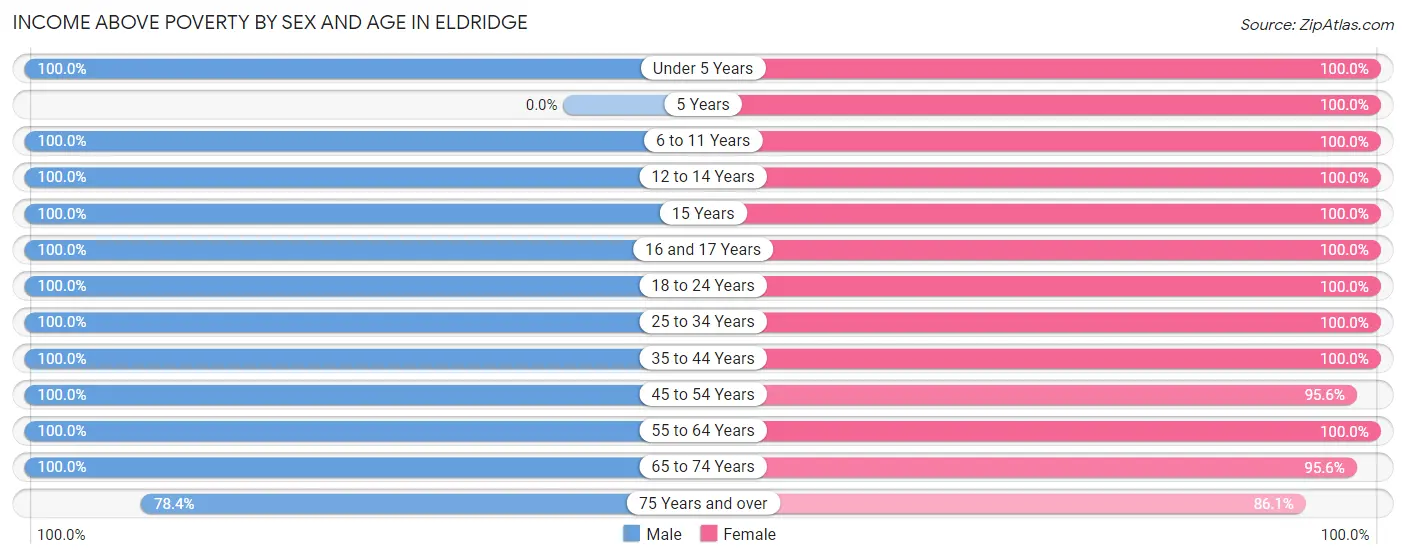
| Age Bracket | Male | Female |
| Under 5 Years | 268 (100.0%) | 103 (100.0%) |
| 5 Years | 0 (0.0%) | 18 (100.0%) |
| 6 to 11 Years | 337 (100.0%) | 421 (100.0%) |
| 12 to 14 Years | 346 (100.0%) | 192 (100.0%) |
| 15 Years | 26 (100.0%) | 80 (100.0%) |
| 16 and 17 Years | 163 (100.0%) | 204 (100.0%) |
| 18 to 24 Years | 176 (100.0%) | 171 (100.0%) |
| 25 to 34 Years | 215 (100.0%) | 201 (100.0%) |
| 35 to 44 Years | 581 (100.0%) | 381 (100.0%) |
| 45 to 54 Years | 510 (100.0%) | 539 (95.6%) |
| 55 to 64 Years | 343 (100.0%) | 320 (100.0%) |
| 65 to 74 Years | 388 (100.0%) | 279 (95.6%) |
| 75 Years and over | 105 (78.4%) | 223 (86.1%) |
| Total | 3,458 (99.2%) | 3,132 (97.7%) |
Income Below Poverty Among Married-Couple Families in Eldridge
The poverty statistics for married-couple families in Eldridge show that 1.0% or 14 of the total 1,450 families live below the poverty line. Families with no children have the highest poverty rate of 2.3%, comprising of 14 families. On the other hand, families with 1 or 2 children have the lowest poverty rate of 0.0%, which includes 0 families.
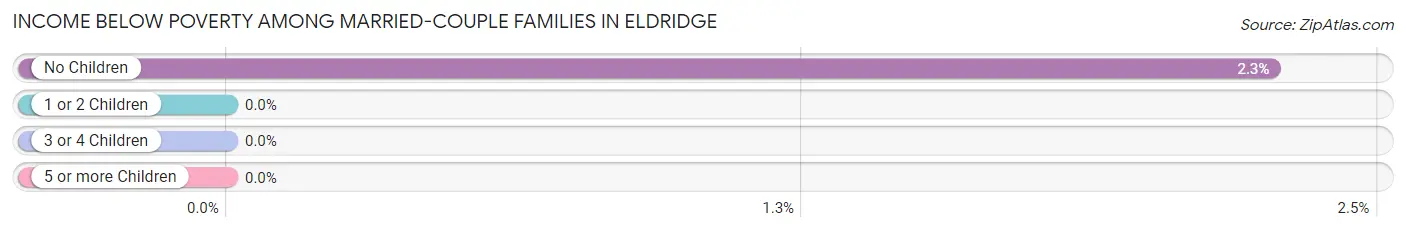
| Children | Above Poverty | Below Poverty |
| No Children | 604 (97.7%) | 14 (2.3%) |
| 1 or 2 Children | 647 (100.0%) | 0 (0.0%) |
| 3 or 4 Children | 185 (100.0%) | 0 (0.0%) |
| 5 or more Children | 0 (0.0%) | 0 (0.0%) |
| Total | 1,436 (99.0%) | 14 (1.0%) |
Income Below Poverty Among Single-Parent Households in Eldridge
| Children | Single Father | Single Mother |
| No Children | 0 (0.0%) | 0 (0.0%) |
| 1 or 2 Children | 0 (0.0%) | 0 (0.0%) |
| 3 or 4 Children | 0 (0.0%) | 0 (0.0%) |
| 5 or more Children | 0 (0.0%) | 0 (0.0%) |
| Total | 0 (0.0%) | 0 (0.0%) |
Income Below Poverty Among Married-Couple vs Single-Parent Households in Eldridge
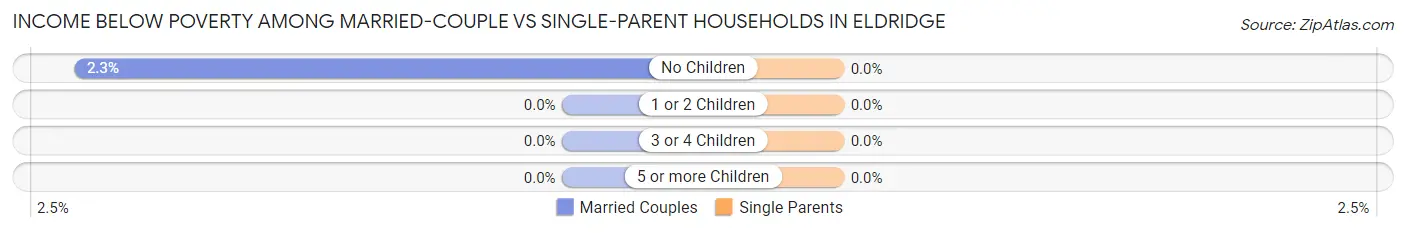
| Children | Married-Couple Families | Single-Parent Households |
| No Children | 14 (2.3%) | 0 (0.0%) |
| 1 or 2 Children | 0 (0.0%) | 0 (0.0%) |
| 3 or 4 Children | 0 (0.0%) | 0 (0.0%) |
| 5 or more Children | 0 (0.0%) | 0 (0.0%) |
| Total | 14 (1.0%) | 0 (0.0%) |
Race in Eldridge
The most populous races in Eldridge are White / Caucasian (5,963 | 89.1%), Hispanic or Latino (513 | 7.7%), and Two or more Races (488 | 7.3%).
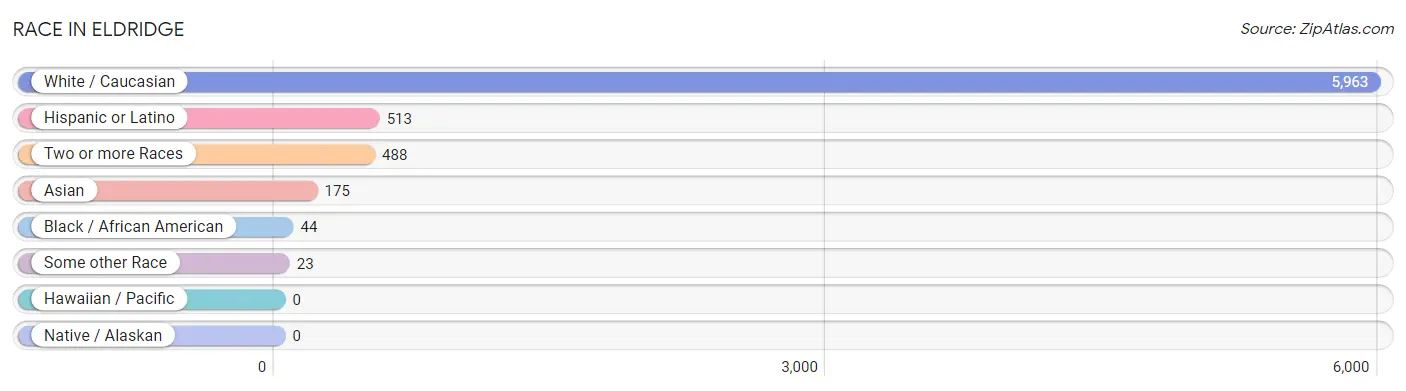
| Race | # Population | % Population |
| Asian | 175 | 2.6% |
| Black / African American | 44 | 0.7% |
| Hawaiian / Pacific | 0 | 0.0% |
| Hispanic or Latino | 513 | 7.7% |
| Native / Alaskan | 0 | 0.0% |
| White / Caucasian | 5,963 | 89.1% |
| Two or more Races | 488 | 7.3% |
| Some other Race | 23 | 0.3% |
| Total | 6,693 | 100.0% |
Ancestry in Eldridge
The most populous ancestries reported in Eldridge are German (2,764 | 41.3%), Irish (1,075 | 16.1%), English (1,011 | 15.1%), Mexican (461 | 6.9%), and American (339 | 5.1%), together accounting for 84.4% of all Eldridge residents.
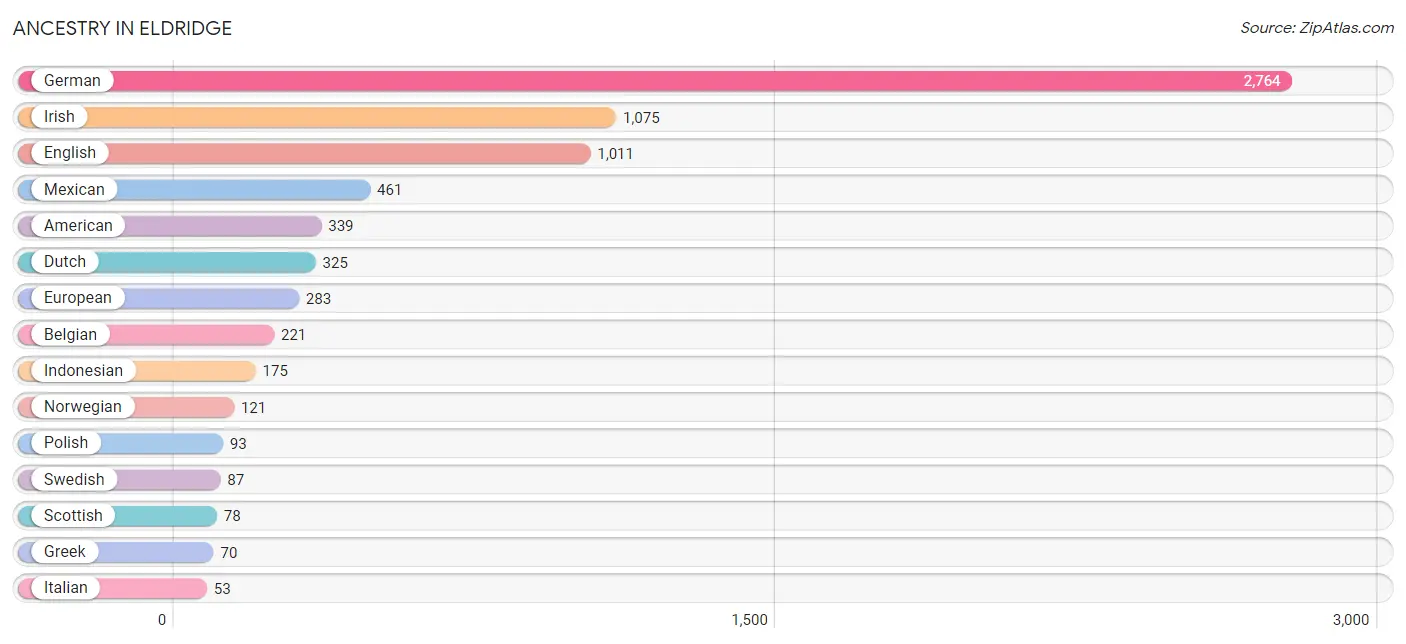
| Ancestry | # Population | % Population |
| American | 339 | 5.1% |
| Belgian | 221 | 3.3% |
| Central American | 52 | 0.8% |
| Costa Rican | 52 | 0.8% |
| Czech | 12 | 0.2% |
| Czechoslovakian | 14 | 0.2% |
| Danish | 13 | 0.2% |
| Dutch | 325 | 4.9% |
| English | 1,011 | 15.1% |
| European | 283 | 4.2% |
| French | 22 | 0.3% |
| French Canadian | 14 | 0.2% |
| German | 2,764 | 41.3% |
| Greek | 70 | 1.1% |
| Indian (Asian) | 1 | 0.0% |
| Indonesian | 175 | 2.6% |
| Irish | 1,075 | 16.1% |
| Italian | 53 | 0.8% |
| Mexican | 461 | 6.9% |
| Norwegian | 121 | 1.8% |
| Polish | 93 | 1.4% |
| Scandinavian | 15 | 0.2% |
| Scottish | 78 | 1.2% |
| Swedish | 87 | 1.3% | View All 24 Rows |
Immigrants in Eldridge
The most numerous immigrant groups reported in Eldridge came from Asia (60 | 0.9%), South Eastern Asia (60 | 0.9%), Central America (50 | 0.7%), Latin America (50 | 0.7%), and Costa Rica (25 | 0.4%), together accounting for 3.7% of all Eldridge residents.
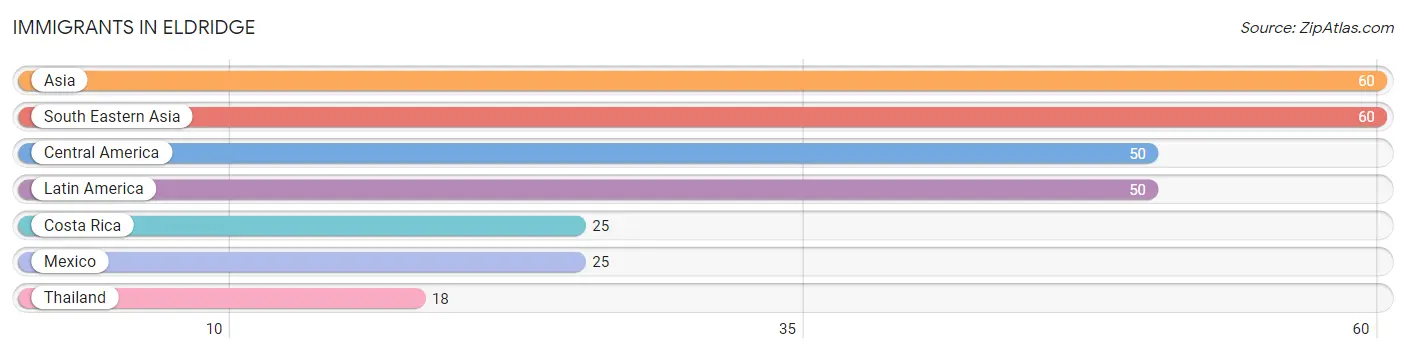
| Immigration Origin | # Population | % Population |
| Asia | 60 | 0.9% |
| Central America | 50 | 0.7% |
| Costa Rica | 25 | 0.4% |
| Latin America | 50 | 0.7% |
| Mexico | 25 | 0.4% |
| South Eastern Asia | 60 | 0.9% |
| Thailand | 18 | 0.3% | View All 7 Rows |
Sex and Age in Eldridge
Sex and Age in Eldridge
The most populous age groups in Eldridge are 10 to 14 Years (439 | 12.6%) for men and 15 to 19 Years (393 | 12.3%) for women.
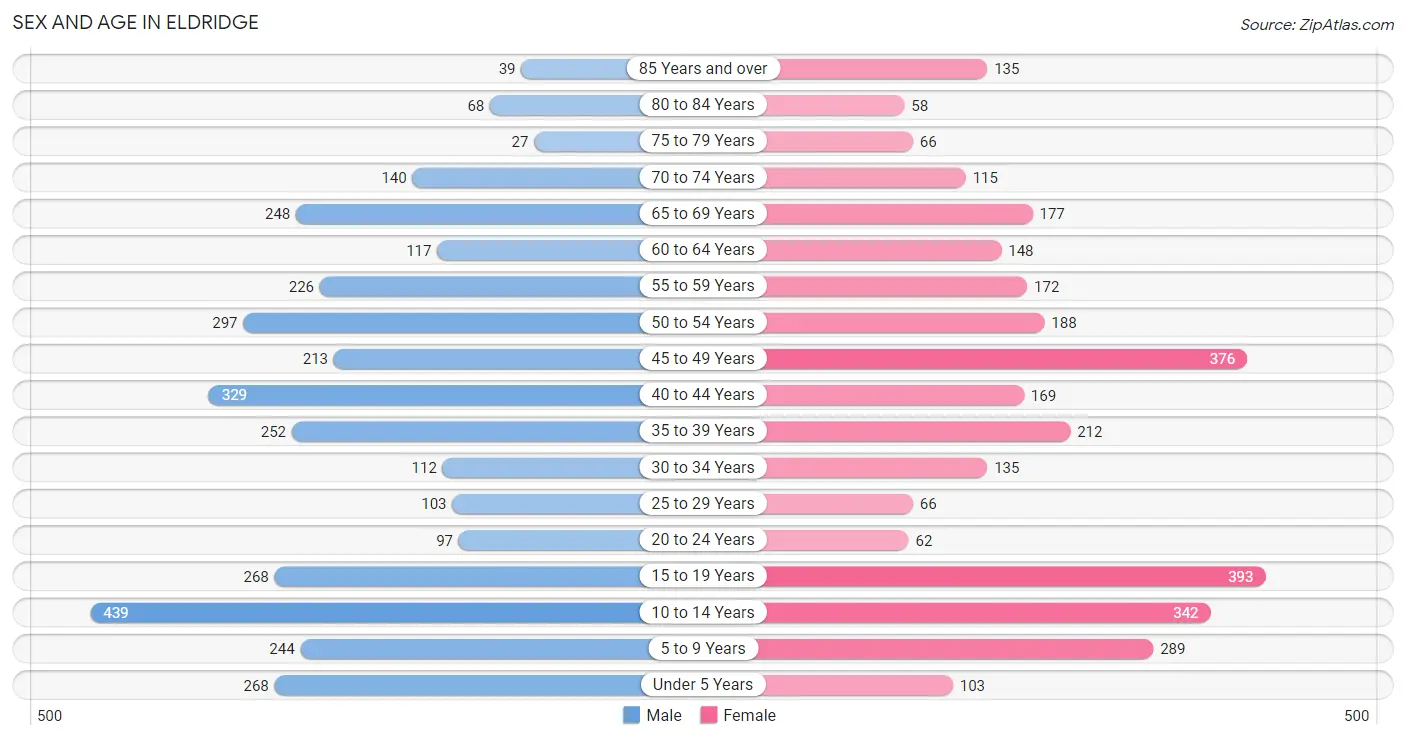
| Age Bracket | Male | Female |
| Under 5 Years | 268 (7.7%) | 103 (3.2%) |
| 5 to 9 Years | 244 (7.0%) | 289 (9.0%) |
| 10 to 14 Years | 439 (12.6%) | 342 (10.7%) |
| 15 to 19 Years | 268 (7.7%) | 393 (12.3%) |
| 20 to 24 Years | 97 (2.8%) | 62 (1.9%) |
| 25 to 29 Years | 103 (2.9%) | 66 (2.1%) |
| 30 to 34 Years | 112 (3.2%) | 135 (4.2%) |
| 35 to 39 Years | 252 (7.2%) | 212 (6.6%) |
| 40 to 44 Years | 329 (9.4%) | 169 (5.3%) |
| 45 to 49 Years | 213 (6.1%) | 376 (11.7%) |
| 50 to 54 Years | 297 (8.5%) | 188 (5.9%) |
| 55 to 59 Years | 226 (6.5%) | 172 (5.4%) |
| 60 to 64 Years | 117 (3.4%) | 148 (4.6%) |
| 65 to 69 Years | 248 (7.1%) | 177 (5.5%) |
| 70 to 74 Years | 140 (4.0%) | 115 (3.6%) |
| 75 to 79 Years | 27 (0.8%) | 66 (2.1%) |
| 80 to 84 Years | 68 (1.9%) | 58 (1.8%) |
| 85 Years and over | 39 (1.1%) | 135 (4.2%) |
| Total | 3,487 (100.0%) | 3,206 (100.0%) |
Families and Households in Eldridge
Median Family Size in Eldridge
The median family size in Eldridge is 3.16 persons per family, with married-couple families (1,450 | 78.6%) accounting for the largest median family size of 3.24 persons per family. On the other hand, single female/mother families (182 | 9.9%) represent the smallest median family size with 2.74 persons per family.
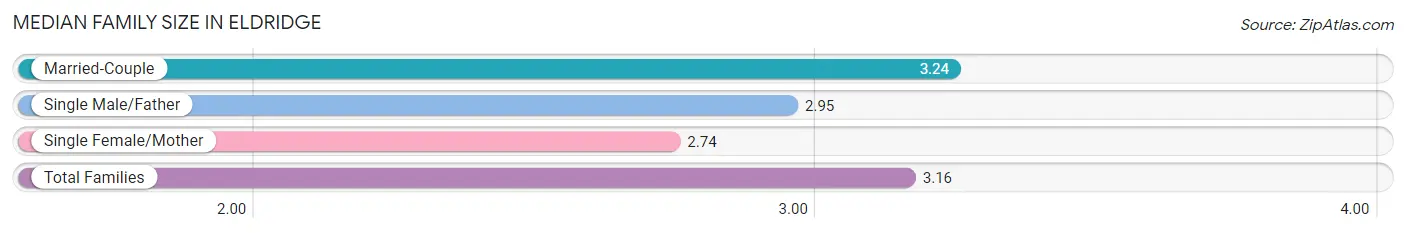
| Family Type | # Families | Family Size |
| Married-Couple | 1,450 (78.6%) | 3.24 |
| Single Male/Father | 212 (11.5%) | 2.95 |
| Single Female/Mother | 182 (9.9%) | 2.74 |
| Total Families | 1,844 (100.0%) | 3.16 |
Median Household Size in Eldridge
The median household size in Eldridge is 2.59 persons per household, with married-couple households (1,450 | 56.0%) accounting for the largest median household size of 3.24 persons per household. non-family households (745 | 28.8%) represent the smallest median household size with 1.11 persons per household.
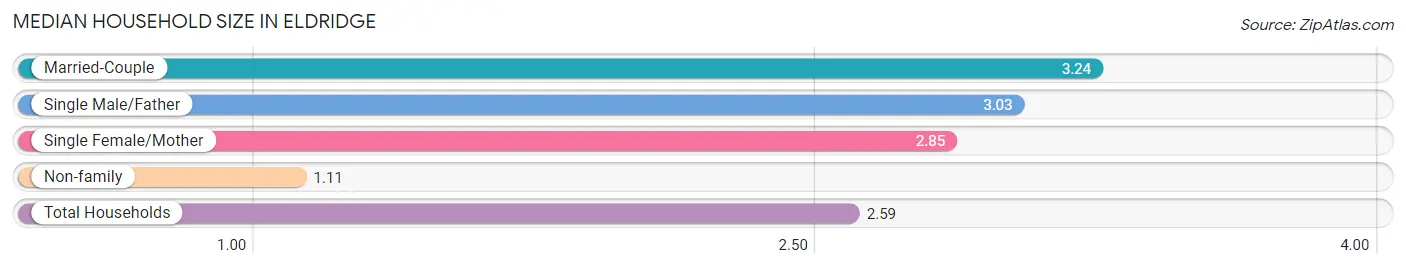
| Household Type | # Households | Household Size |
| Married-Couple | 1,450 (56.0%) | 3.24 |
| Single Male/Father | 212 (8.2%) | 3.03 |
| Single Female/Mother | 182 (7.0%) | 2.85 |
| Non-family | 745 (28.8%) | 1.11 |
| Total Households | 2,589 (100.0%) | 2.59 |
Household Size by Marriage Status in Eldridge
Out of a total of 2,589 households in Eldridge, 1,844 (71.2%) are family households, while 745 (28.8%) are nonfamily households. The most numerous type of family households are 2-person households, comprising 737, and the most common type of nonfamily households are 1-person households, comprising 607.
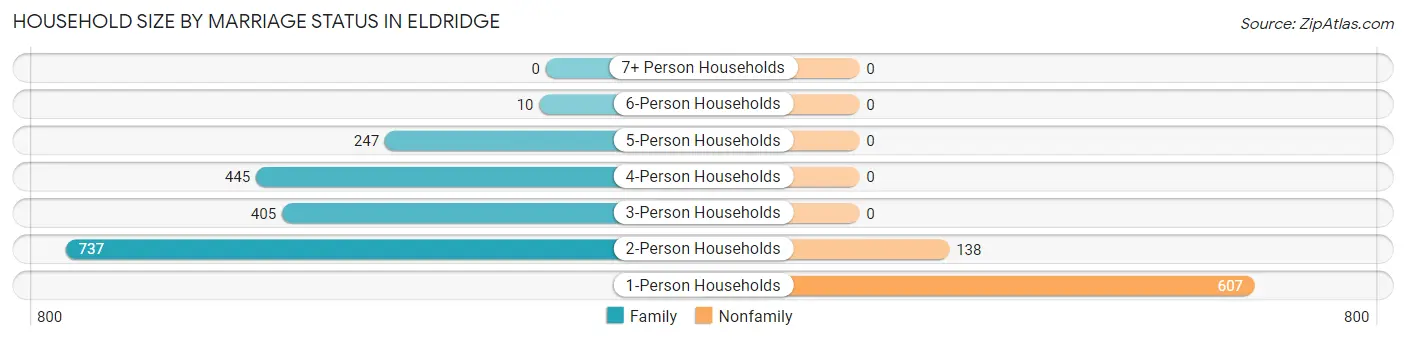
| Household Size | Family Households | Nonfamily Households |
| 1-Person Households | - | 607 (23.4%) |
| 2-Person Households | 737 (28.5%) | 138 (5.3%) |
| 3-Person Households | 405 (15.6%) | 0 (0.0%) |
| 4-Person Households | 445 (17.2%) | 0 (0.0%) |
| 5-Person Households | 247 (9.5%) | 0 (0.0%) |
| 6-Person Households | 10 (0.4%) | 0 (0.0%) |
| 7+ Person Households | 0 (0.0%) | 0 (0.0%) |
| Total | 1,844 (71.2%) | 745 (28.8%) |
Female Fertility in Eldridge
Fertility by Age in Eldridge
Average fertility rate in Eldridge is 32.0 births per 1,000 women. Women in the age bracket of 20 to 34 years have the highest fertility rate with 179.0 births per 1,000 women. Women in the age bracket of 20 to 34 years acount for 100.0% of all women with births.
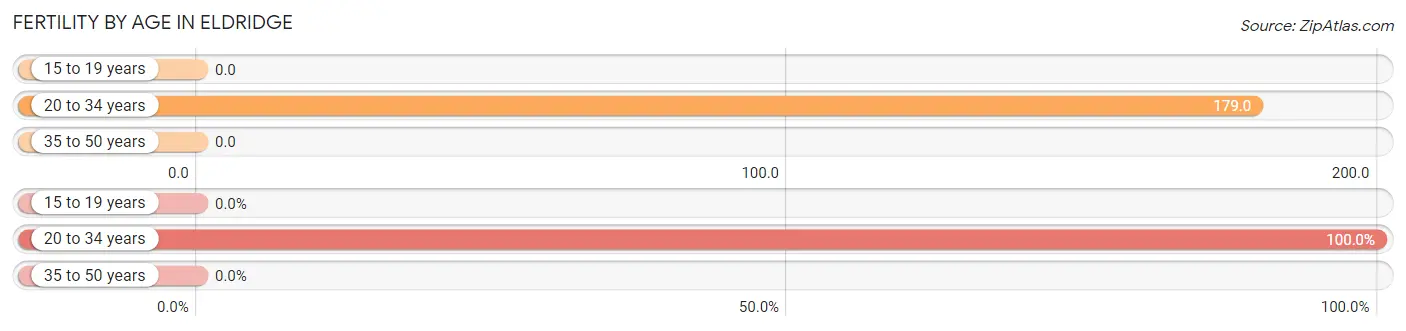
| Age Bracket | Women with Births | Births / 1,000 Women |
| 15 to 19 years | 0 (0.0%) | 0.0 |
| 20 to 34 years | 47 (100.0%) | 179.0 |
| 35 to 50 years | 0 (0.0%) | 0.0 |
| Total | 47 (100.0%) | 32.0 |
Fertility by Age by Marriage Status in Eldridge
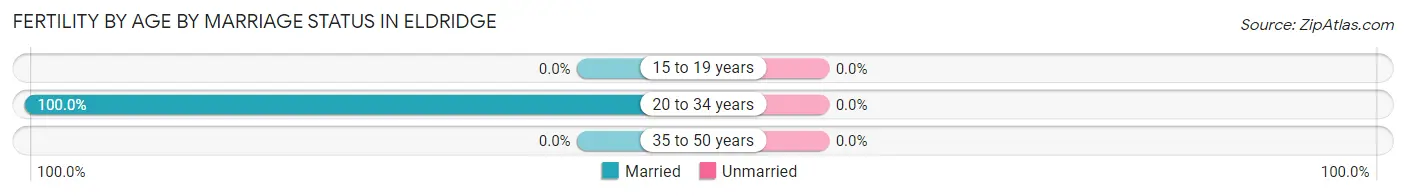
| Age Bracket | Married | Unmarried |
| 15 to 19 years | 0 (0.0%) | 0 (0.0%) |
| 20 to 34 years | 47 (100.0%) | 0 (0.0%) |
| 35 to 50 years | 0 (0.0%) | 0 (0.0%) |
| Total | 47 (100.0%) | 0 (0.0%) |
Fertility by Education in Eldridge
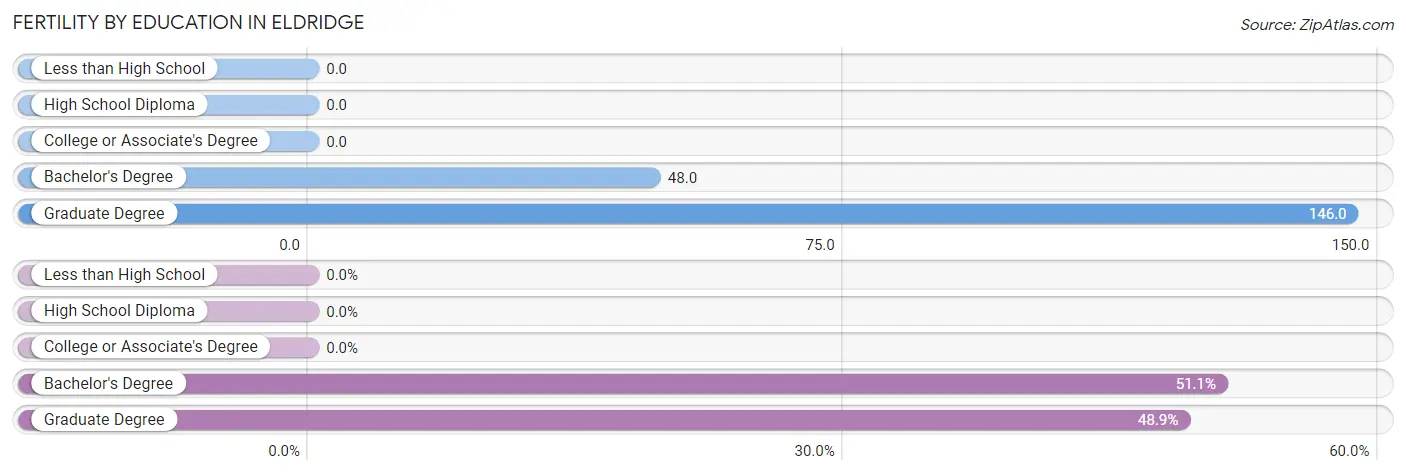
| Educational Attainment | Women with Births | Births / 1,000 Women |
| Less than High School | 0 (0.0%) | 0.0 |
| High School Diploma | 0 (0.0%) | 0.0 |
| College or Associate's Degree | 0 (0.0%) | 0.0 |
| Bachelor's Degree | 24 (51.1%) | 48.0 |
| Graduate Degree | 23 (48.9%) | 146.0 |
| Total | 47 (100.0%) | 32.0 |
Fertility by Education by Marriage Status in Eldridge
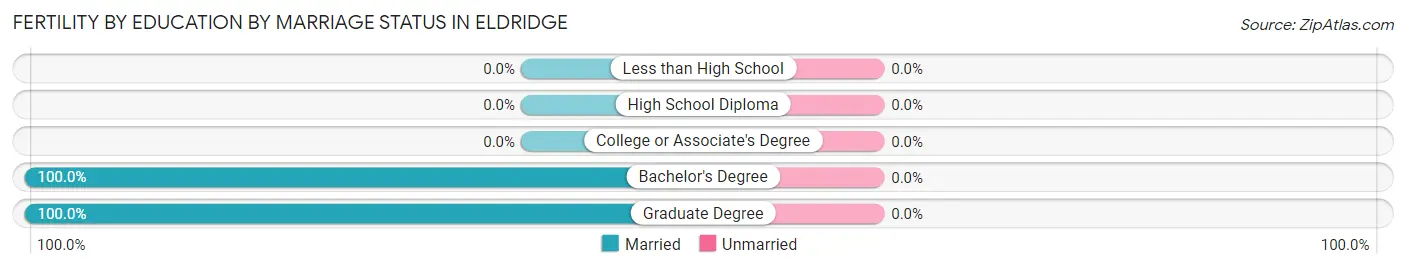
| Educational Attainment | Married | Unmarried |
| Less than High School | 0 (0.0%) | 0 (0.0%) |
| High School Diploma | 0 (0.0%) | 0 (0.0%) |
| College or Associate's Degree | 0 (0.0%) | 0 (0.0%) |
| Bachelor's Degree | 24 (100.0%) | 0 (0.0%) |
| Graduate Degree | 23 (100.0%) | 0 (0.0%) |
| Total | 47 (100.0%) | 0 (0.0%) |
Employment Characteristics in Eldridge
Employment by Class of Employer in Eldridge
Among the 3,248 employed individuals in Eldridge, private company employees (2,070 | 63.7%), self-employed (incorporated) (262 | 8.1%), and not-for-profit organizations (250 | 7.7%) make up the most common classes of employment.
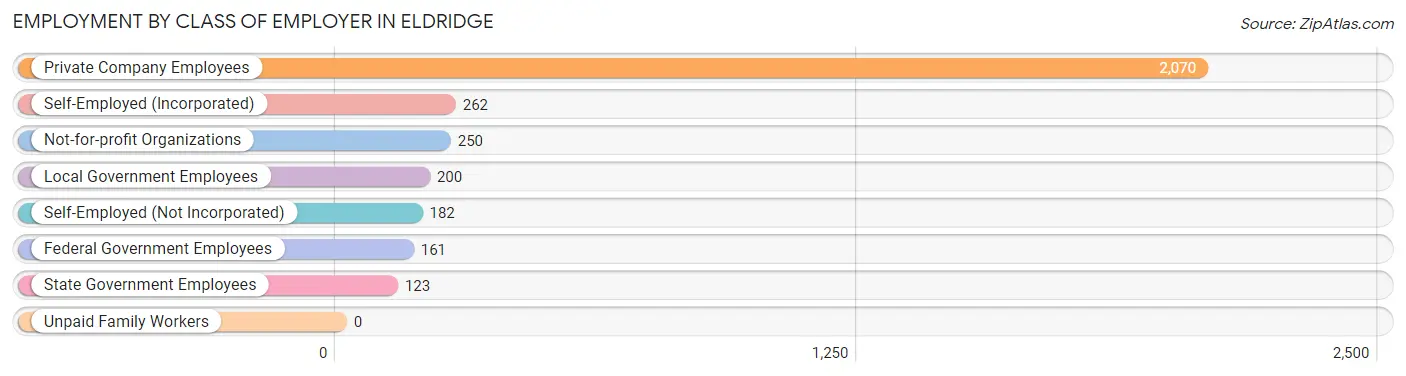
| Employer Class | # Employees | % Employees |
| Private Company Employees | 2,070 | 63.7% |
| Self-Employed (Incorporated) | 262 | 8.1% |
| Self-Employed (Not Incorporated) | 182 | 5.6% |
| Not-for-profit Organizations | 250 | 7.7% |
| Local Government Employees | 200 | 6.2% |
| State Government Employees | 123 | 3.8% |
| Federal Government Employees | 161 | 5.0% |
| Unpaid Family Workers | 0 | 0.0% |
| Total | 3,248 | 100.0% |
Employment Status by Age in Eldridge
According to the labor force statistics for Eldridge, out of the total population over 16 years of age (4,902), 69.7% or 3,417 individuals are in the labor force, with 1.7% or 58 of them unemployed. The age group with the highest labor force participation rate is 20 to 24 years, with 100.0% or 159 individuals in the labor force. Within the labor force, the 16 to 19 years age range has the highest percentage of unemployed individuals, with 7.8% or 21 of them being unemployed.
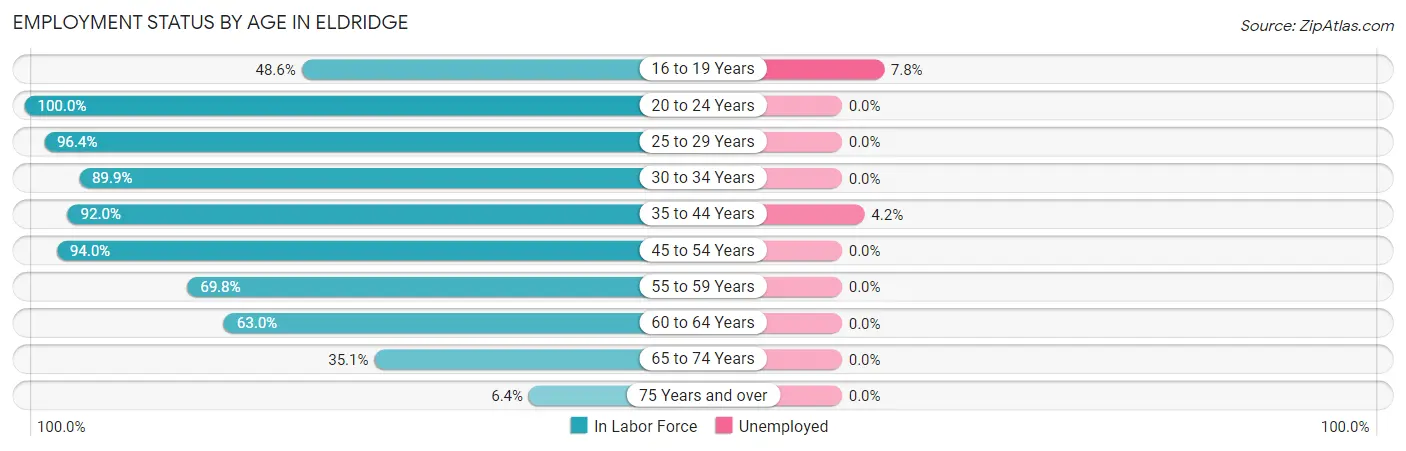
| Age Bracket | In Labor Force | Unemployed |
| 16 to 19 Years | 270 (48.6%) | 21 (7.8%) |
| 20 to 24 Years | 159 (100.0%) | 0 (0.0%) |
| 25 to 29 Years | 163 (96.4%) | 0 (0.0%) |
| 30 to 34 Years | 222 (89.9%) | 0 (0.0%) |
| 35 to 44 Years | 885 (92.0%) | 37 (4.2%) |
| 45 to 54 Years | 1,010 (94.0%) | 0 (0.0%) |
| 55 to 59 Years | 278 (69.8%) | 0 (0.0%) |
| 60 to 64 Years | 167 (63.0%) | 0 (0.0%) |
| 65 to 74 Years | 239 (35.1%) | 0 (0.0%) |
| 75 Years and over | 25 (6.4%) | 0 (0.0%) |
| Total | 3,417 (69.7%) | 58 (1.7%) |
Employment Status by Educational Attainment in Eldridge
According to labor force statistics for Eldridge, 87.5% of individuals (2,726) out of the total population between 25 and 64 years of age (3,115) are in the labor force, with 1.4% or 38 of them being unemployed. The group with the highest labor force participation rate are those with the educational attainment of less than high school, with 100.0% or 42 individuals in the labor force. Within the labor force, individuals with bachelor's degree or higher education have the highest percentage of unemployment, with 2.7% or 38 of them being unemployed.
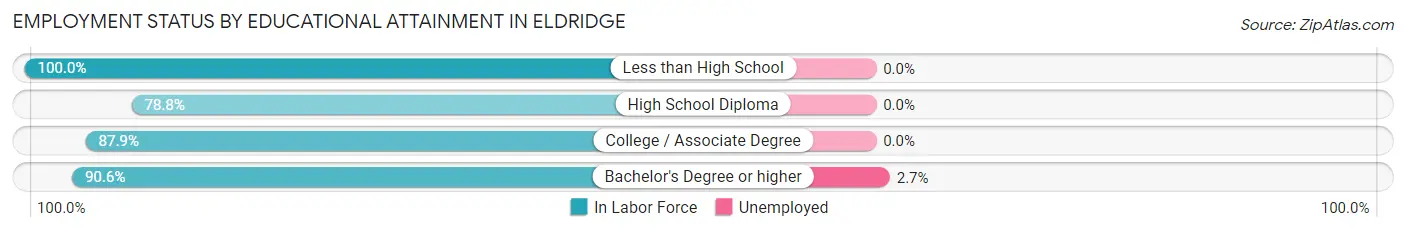
| Educational Attainment | In Labor Force | Unemployed |
| Less than High School | 42 (100.0%) | 0 (0.0%) |
| High School Diploma | 513 (78.8%) | 0 (0.0%) |
| College / Associate Degree | 781 (87.9%) | 0 (0.0%) |
| Bachelor's Degree or higher | 1,389 (90.6%) | 41 (2.7%) |
| Total | 2,726 (87.5%) | 44 (1.4%) |
Employment Occupations by Sex in Eldridge
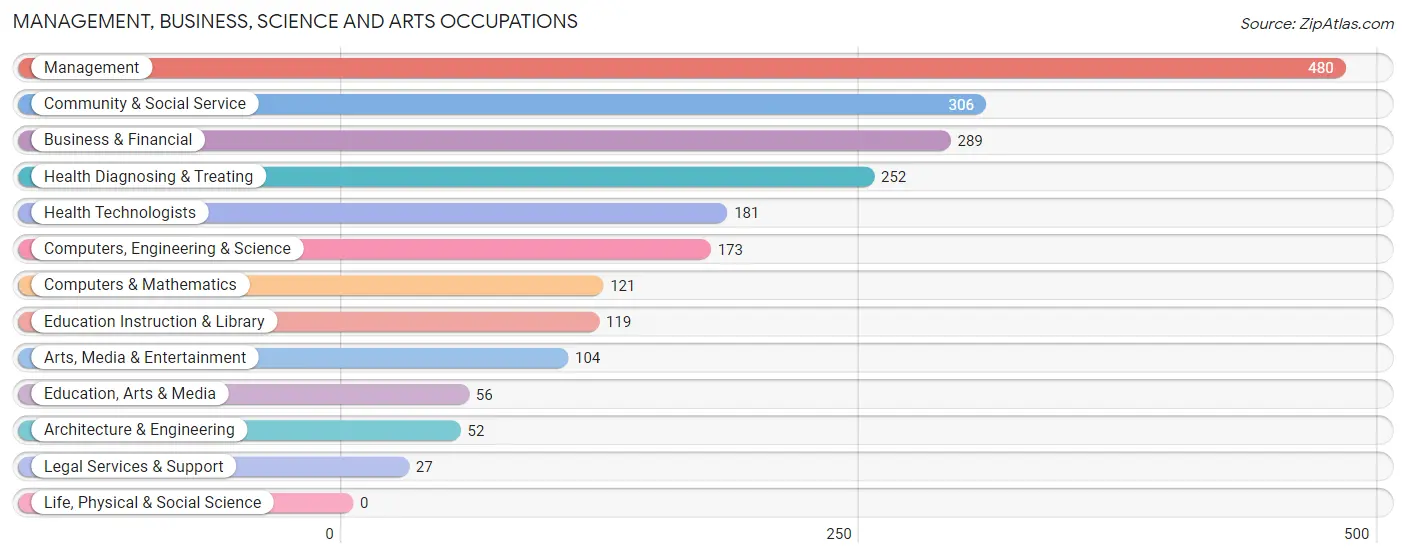
Management, Business, Science and Arts Occupations
The most common Management, Business, Science and Arts occupations in Eldridge are Management (480 | 14.3%), Community & Social Service (306 | 9.1%), Business & Financial (289 | 8.6%), Health Diagnosing & Treating (252 | 7.5%), and Health Technologists (181 | 5.4%).
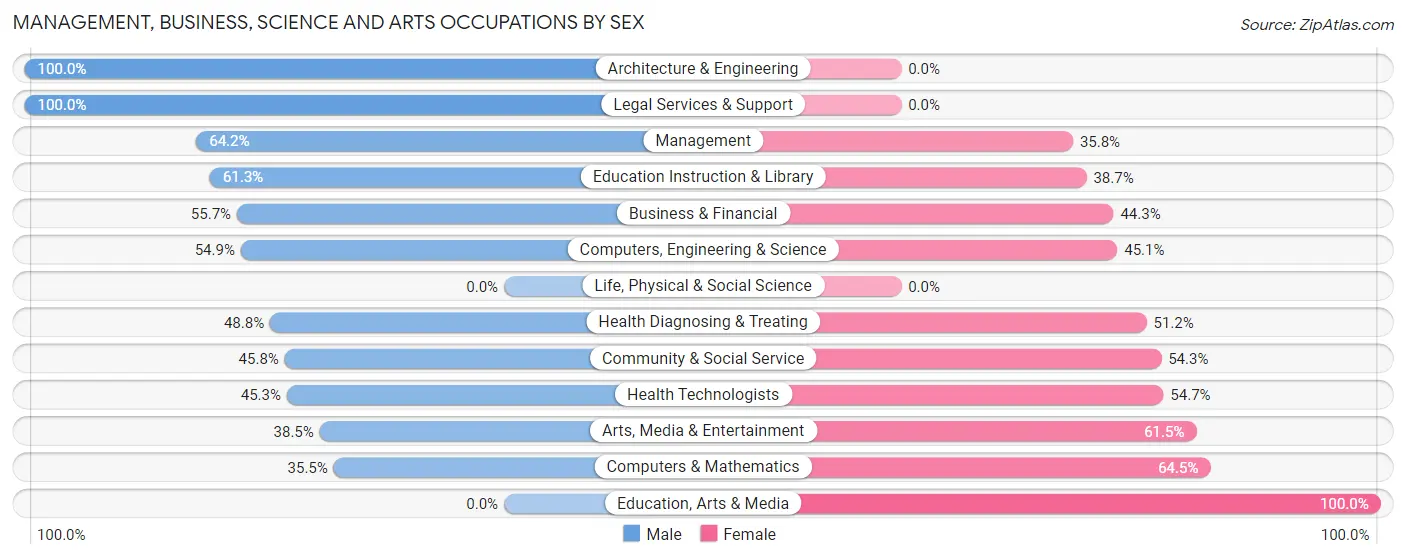
Management, Business, Science and Arts Occupations by Sex
Within the Management, Business, Science and Arts occupations in Eldridge, the most male-oriented occupations are Architecture & Engineering (100.0%), Legal Services & Support (100.0%), and Management (64.2%), while the most female-oriented occupations are Education, Arts & Media (100.0%), Computers & Mathematics (64.5%), and Arts, Media & Entertainment (61.5%).
| Occupation | Male | Female |
| Management | 308 (64.2%) | 172 (35.8%) |
| Business & Financial | 161 (55.7%) | 128 (44.3%) |
| Computers, Engineering & Science | 95 (54.9%) | 78 (45.1%) |
| Computers & Mathematics | 43 (35.5%) | 78 (64.5%) |
| Architecture & Engineering | 52 (100.0%) | 0 (0.0%) |
| Life, Physical & Social Science | 0 (0.0%) | 0 (0.0%) |
| Community & Social Service | 140 (45.8%) | 166 (54.2%) |
| Education, Arts & Media | 0 (0.0%) | 56 (100.0%) |
| Legal Services & Support | 27 (100.0%) | 0 (0.0%) |
| Education Instruction & Library | 73 (61.3%) | 46 (38.7%) |
| Arts, Media & Entertainment | 40 (38.5%) | 64 (61.5%) |
| Health Diagnosing & Treating | 123 (48.8%) | 129 (51.2%) |
| Health Technologists | 82 (45.3%) | 99 (54.7%) |
| Total (Category) | 827 (55.1%) | 673 (44.9%) |
| Total (Overall) | 1,871 (55.7%) | 1,489 (44.3%) |
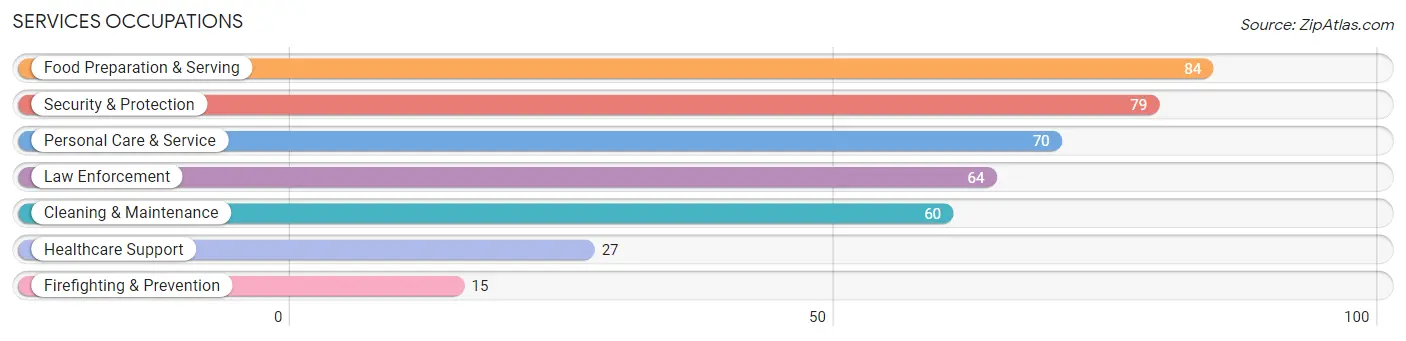
Services Occupations
The most common Services occupations in Eldridge are Food Preparation & Serving (84 | 2.5%), Security & Protection (79 | 2.4%), Personal Care & Service (70 | 2.1%), Law Enforcement (64 | 1.9%), and Cleaning & Maintenance (60 | 1.8%).
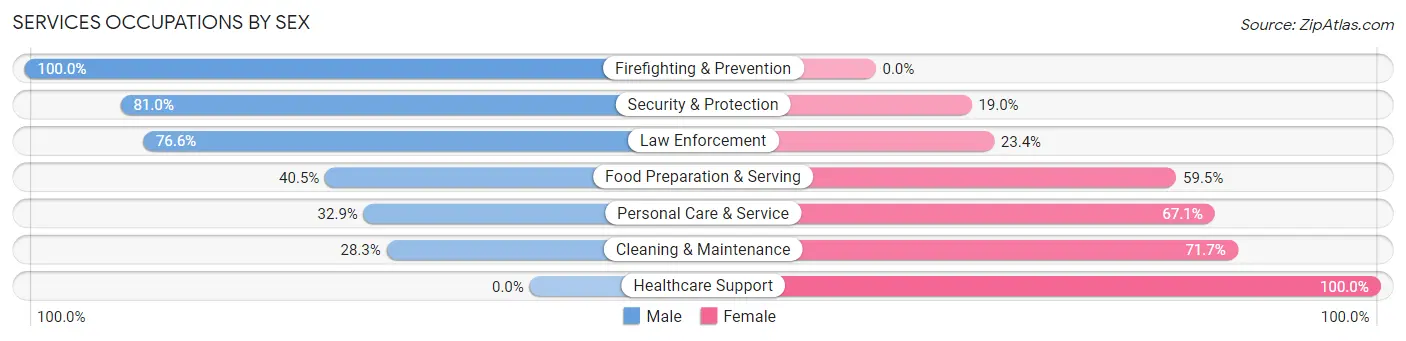
Services Occupations by Sex
Within the Services occupations in Eldridge, the most male-oriented occupations are Firefighting & Prevention (100.0%), Security & Protection (81.0%), and Law Enforcement (76.6%), while the most female-oriented occupations are Healthcare Support (100.0%), Cleaning & Maintenance (71.7%), and Personal Care & Service (67.1%).
| Occupation | Male | Female |
| Healthcare Support | 0 (0.0%) | 27 (100.0%) |
| Security & Protection | 64 (81.0%) | 15 (19.0%) |
| Firefighting & Prevention | 15 (100.0%) | 0 (0.0%) |
| Law Enforcement | 49 (76.6%) | 15 (23.4%) |
| Food Preparation & Serving | 34 (40.5%) | 50 (59.5%) |
| Cleaning & Maintenance | 17 (28.3%) | 43 (71.7%) |
| Personal Care & Service | 23 (32.9%) | 47 (67.1%) |
| Total (Category) | 138 (43.1%) | 182 (56.9%) |
| Total (Overall) | 1,871 (55.7%) | 1,489 (44.3%) |
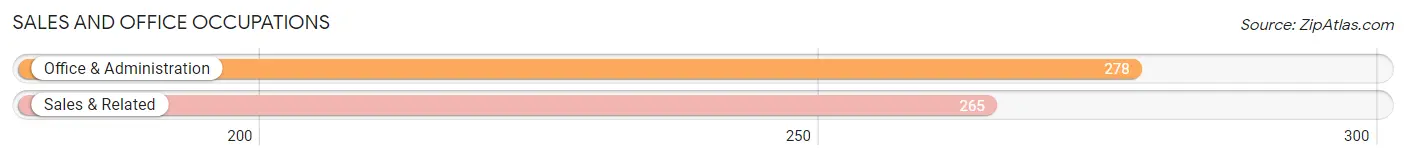
Sales and Office Occupations
The most common Sales and Office occupations in Eldridge are Office & Administration (278 | 8.3%), and Sales & Related (265 | 7.9%).
Sales and Office Occupations by Sex
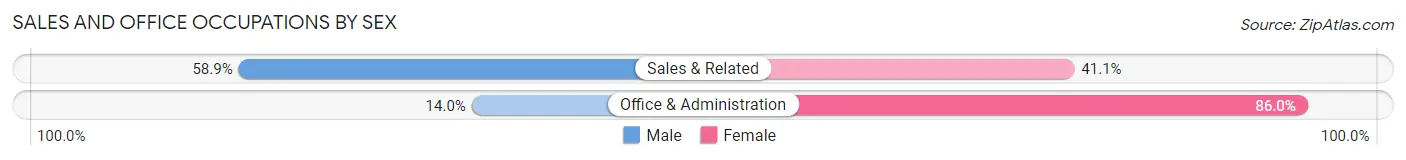
| Occupation | Male | Female |
| Sales & Related | 156 (58.9%) | 109 (41.1%) |
| Office & Administration | 39 (14.0%) | 239 (86.0%) |
| Total (Category) | 195 (35.9%) | 348 (64.1%) |
| Total (Overall) | 1,871 (55.7%) | 1,489 (44.3%) |
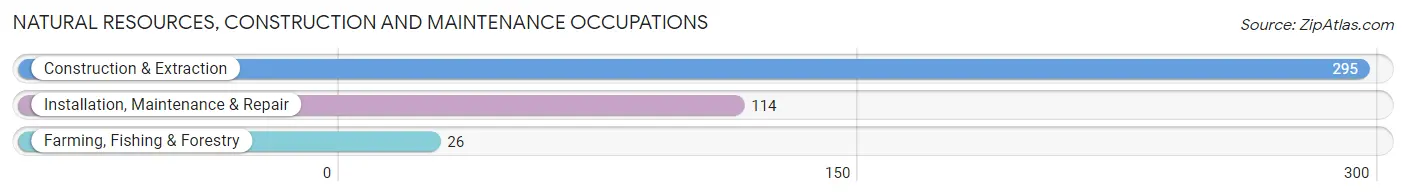
Natural Resources, Construction and Maintenance Occupations
The most common Natural Resources, Construction and Maintenance occupations in Eldridge are Construction & Extraction (295 | 8.8%), Installation, Maintenance & Repair (114 | 3.4%), and Farming, Fishing & Forestry (26 | 0.8%).
Natural Resources, Construction and Maintenance Occupations by Sex
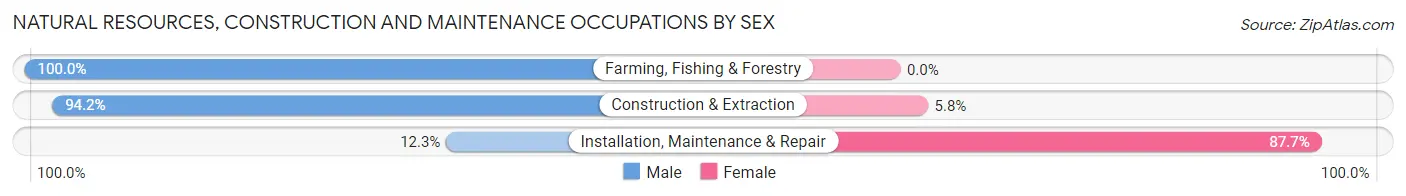
| Occupation | Male | Female |
| Farming, Fishing & Forestry | 26 (100.0%) | 0 (0.0%) |
| Construction & Extraction | 278 (94.2%) | 17 (5.8%) |
| Installation, Maintenance & Repair | 14 (12.3%) | 100 (87.7%) |
| Total (Category) | 318 (73.1%) | 117 (26.9%) |
| Total (Overall) | 1,871 (55.7%) | 1,489 (44.3%) |
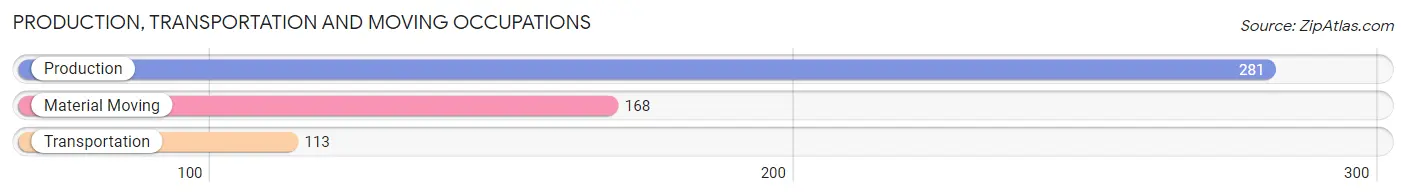
Production, Transportation and Moving Occupations
The most common Production, Transportation and Moving occupations in Eldridge are Production (281 | 8.4%), Material Moving (168 | 5.0%), and Transportation (113 | 3.4%).
Production, Transportation and Moving Occupations by Sex
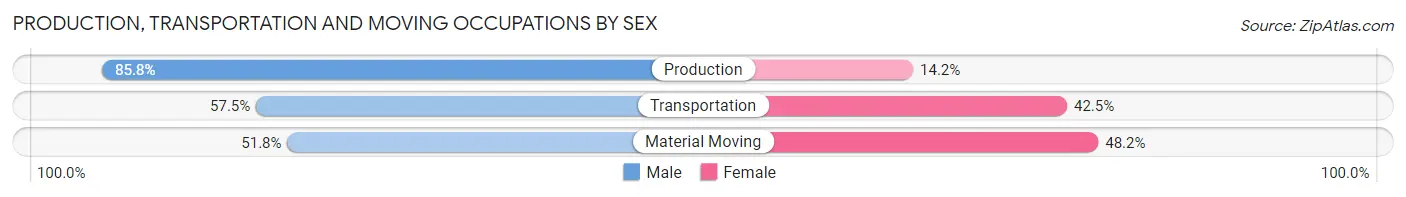
| Occupation | Male | Female |
| Production | 241 (85.8%) | 40 (14.2%) |
| Transportation | 65 (57.5%) | 48 (42.5%) |
| Material Moving | 87 (51.8%) | 81 (48.2%) |
| Total (Category) | 393 (69.9%) | 169 (30.1%) |
| Total (Overall) | 1,871 (55.7%) | 1,489 (44.3%) |
Employment Industries by Sex in Eldridge
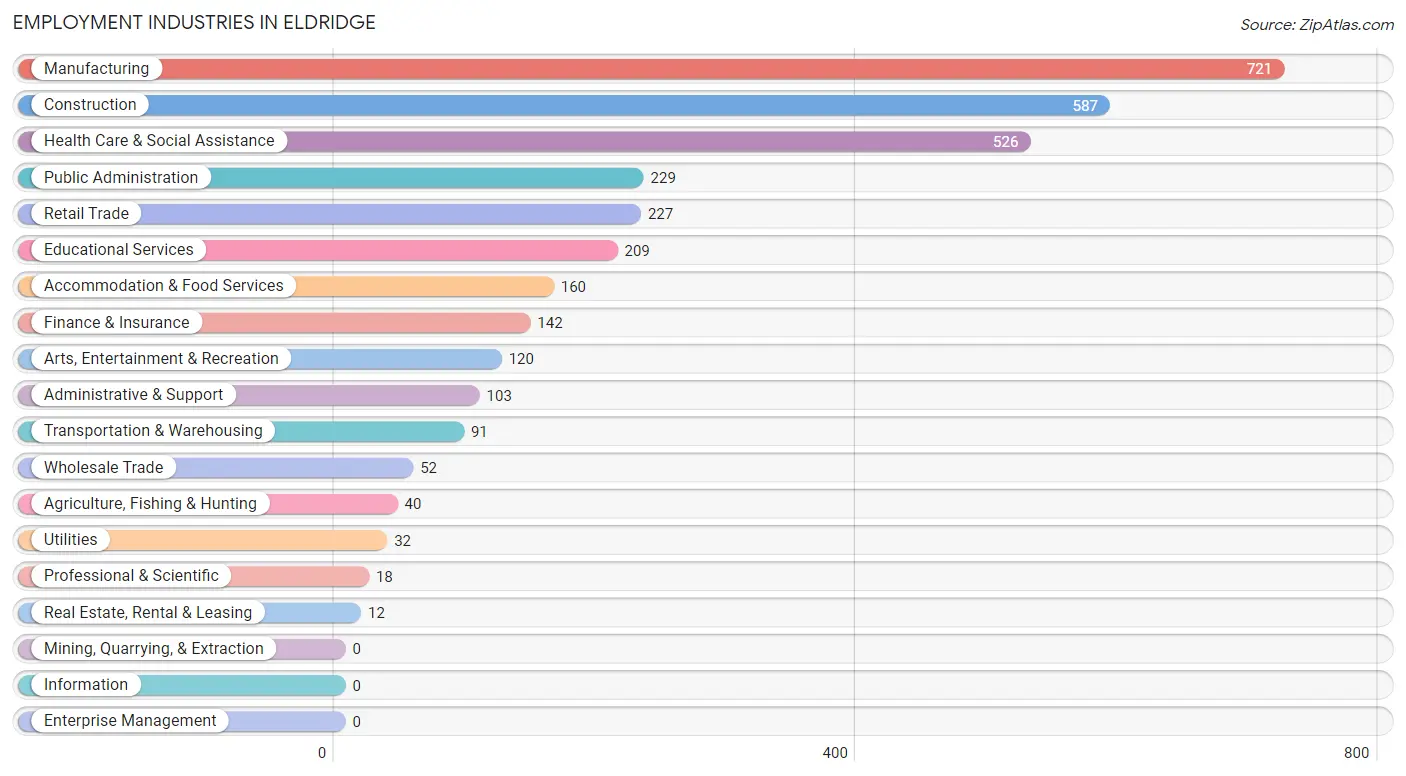
Employment Industries in Eldridge
The major employment industries in Eldridge include Manufacturing (721 | 21.5%), Construction (587 | 17.5%), Health Care & Social Assistance (526 | 15.7%), Public Administration (229 | 6.8%), and Retail Trade (227 | 6.8%).
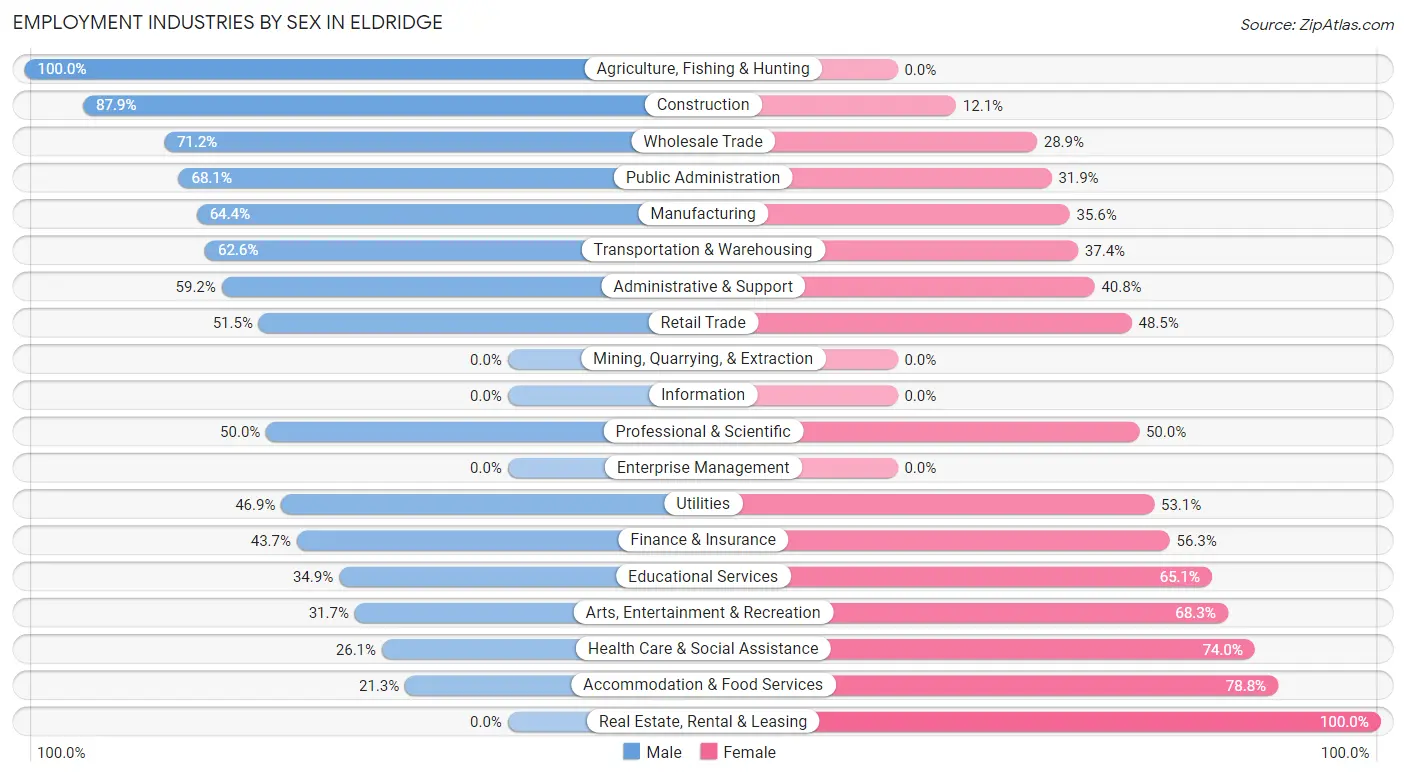
Employment Industries by Sex in Eldridge
The Eldridge industries that see more men than women are Agriculture, Fishing & Hunting (100.0%), Construction (87.9%), and Wholesale Trade (71.2%), whereas the industries that tend to have a higher number of women are Real Estate, Rental & Leasing (100.0%), Accommodation & Food Services (78.7%), and Health Care & Social Assistance (74.0%).
| Industry | Male | Female |
| Agriculture, Fishing & Hunting | 40 (100.0%) | 0 (0.0%) |
| Mining, Quarrying, & Extraction | 0 (0.0%) | 0 (0.0%) |
| Construction | 516 (87.9%) | 71 (12.1%) |
| Manufacturing | 464 (64.4%) | 257 (35.6%) |
| Wholesale Trade | 37 (71.2%) | 15 (28.8%) |
| Retail Trade | 117 (51.5%) | 110 (48.5%) |
| Transportation & Warehousing | 57 (62.6%) | 34 (37.4%) |
| Utilities | 15 (46.9%) | 17 (53.1%) |
| Information | 0 (0.0%) | 0 (0.0%) |
| Finance & Insurance | 62 (43.7%) | 80 (56.3%) |
| Real Estate, Rental & Leasing | 0 (0.0%) | 12 (100.0%) |
| Professional & Scientific | 9 (50.0%) | 9 (50.0%) |
| Enterprise Management | 0 (0.0%) | 0 (0.0%) |
| Administrative & Support | 61 (59.2%) | 42 (40.8%) |
| Educational Services | 73 (34.9%) | 136 (65.1%) |
| Health Care & Social Assistance | 137 (26.1%) | 389 (74.0%) |
| Arts, Entertainment & Recreation | 38 (31.7%) | 82 (68.3%) |
| Accommodation & Food Services | 34 (21.2%) | 126 (78.7%) |
| Public Administration | 156 (68.1%) | 73 (31.9%) |
| Total | 1,871 (55.7%) | 1,489 (44.3%) |
Education in Eldridge
School Enrollment in Eldridge
The most common levels of schooling among the 2,135 students in Eldridge are high school (642 | 30.1%), middle school (635 | 29.7%), and elementary school (473 | 22.2%).
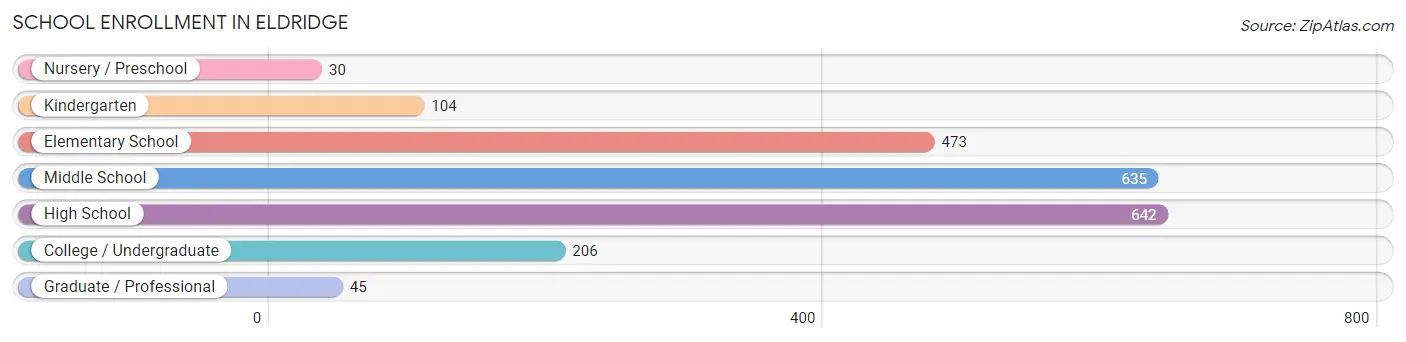
| School Level | # Students | % Students |
| Nursery / Preschool | 30 | 1.4% |
| Kindergarten | 104 | 4.9% |
| Elementary School | 473 | 22.2% |
| Middle School | 635 | 29.7% |
| High School | 642 | 30.1% |
| College / Undergraduate | 206 | 9.7% |
| Graduate / Professional | 45 | 2.1% |
| Total | 2,135 | 100.0% |
School Enrollment by Age by Funding Source in Eldridge
Out of a total of 2,135 students who are enrolled in schools in Eldridge, 102 (4.8%) attend a private institution, while the remaining 2,033 (95.2%) are enrolled in public schools. The age group of 25 to 34 year olds has the highest likelihood of being enrolled in private schools, with 30 (75.0% in the age bracket) enrolled. Conversely, the age group of 18 to 19 year olds has the lowest likelihood of being enrolled in a private school, with 167 (100.0% in the age bracket) attending a public institution.
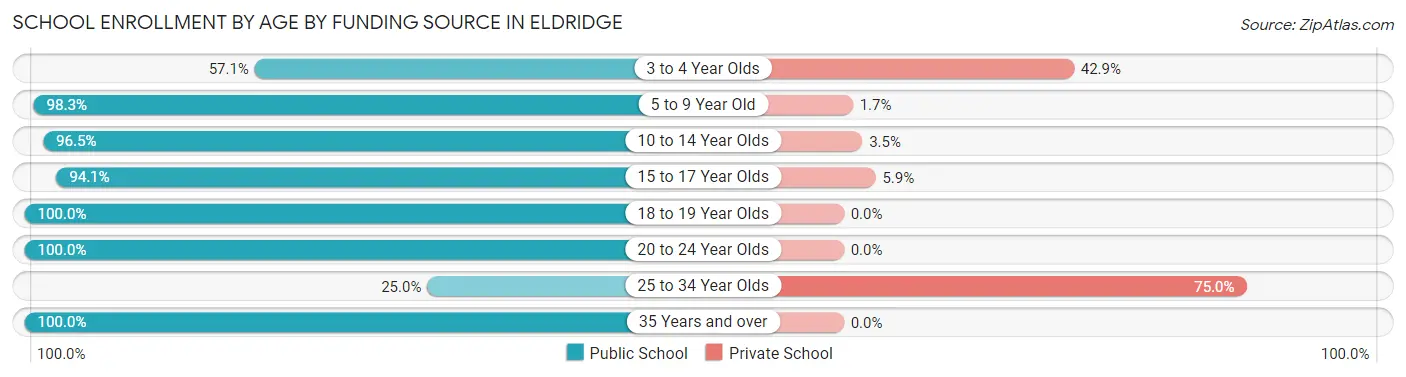
| Age Bracket | Public School | Private School |
| 3 to 4 Year Olds | 12 (57.1%) | 9 (42.9%) |
| 5 to 9 Year Old | 524 (98.3%) | 9 (1.7%) |
| 10 to 14 Year Olds | 754 (96.5%) | 27 (3.5%) |
| 15 to 17 Year Olds | 445 (94.1%) | 28 (5.9%) |
| 18 to 19 Year Olds | 167 (100.0%) | 0 (0.0%) |
| 20 to 24 Year Olds | 79 (100.0%) | 0 (0.0%) |
| 25 to 34 Year Olds | 10 (25.0%) | 30 (75.0%) |
| 35 Years and over | 41 (100.0%) | 0 (0.0%) |
| Total | 2,033 (95.2%) | 102 (4.8%) |
Educational Attainment by Field of Study in Eldridge
Business (485 | 24.3%), science & technology (275 | 13.8%), education (252 | 12.7%), communications (162 | 8.1%), and bio, nature & agricultural (141 | 7.1%) are the most common fields of study among 1,992 individuals in Eldridge who have obtained a bachelor's degree or higher.
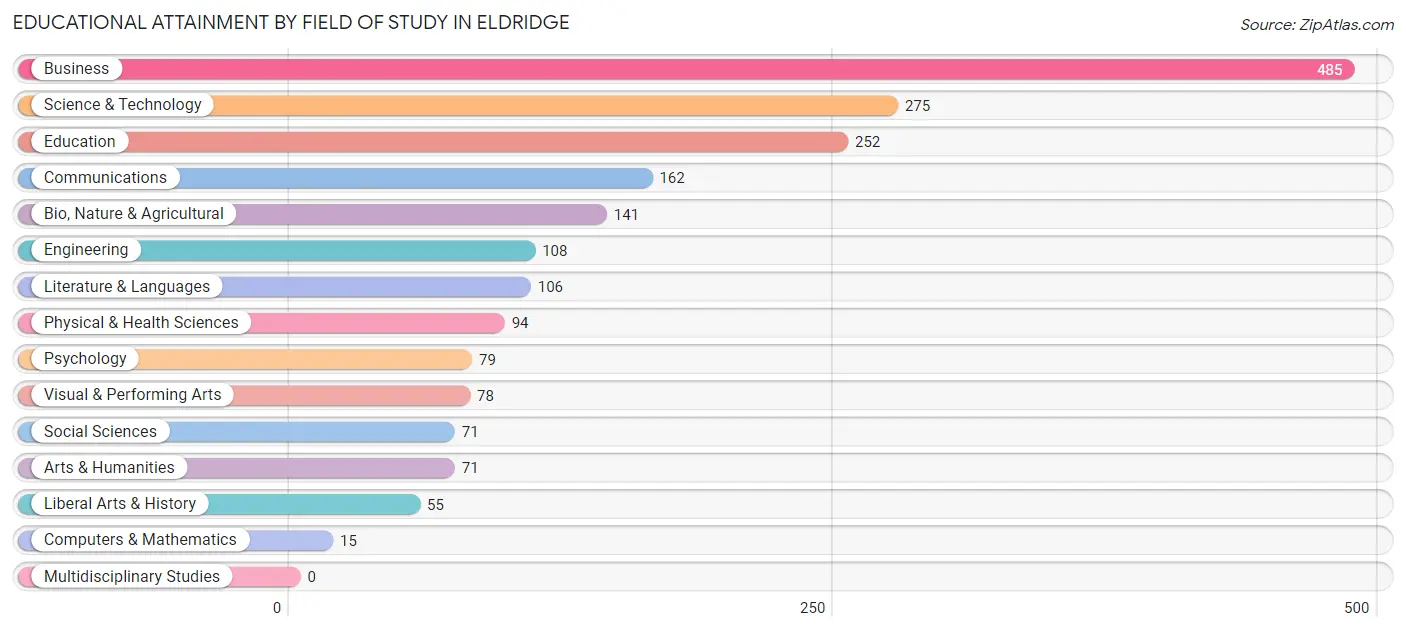
| Field of Study | # Graduates | % Graduates |
| Computers & Mathematics | 15 | 0.7% |
| Bio, Nature & Agricultural | 141 | 7.1% |
| Physical & Health Sciences | 94 | 4.7% |
| Psychology | 79 | 4.0% |
| Social Sciences | 71 | 3.6% |
| Engineering | 108 | 5.4% |
| Multidisciplinary Studies | 0 | 0.0% |
| Science & Technology | 275 | 13.8% |
| Business | 485 | 24.3% |
| Education | 252 | 12.7% |
| Literature & Languages | 106 | 5.3% |
| Liberal Arts & History | 55 | 2.8% |
| Visual & Performing Arts | 78 | 3.9% |
| Communications | 162 | 8.1% |
| Arts & Humanities | 71 | 3.6% |
| Total | 1,992 | 100.0% |
Transportation & Commute in Eldridge
Vehicle Availability by Sex in Eldridge
The most prevalent vehicle ownership categories in Eldridge are males with 2 vehicles (794, accounting for 44.8%) and females with 2 vehicles (561, making up 53.9%).
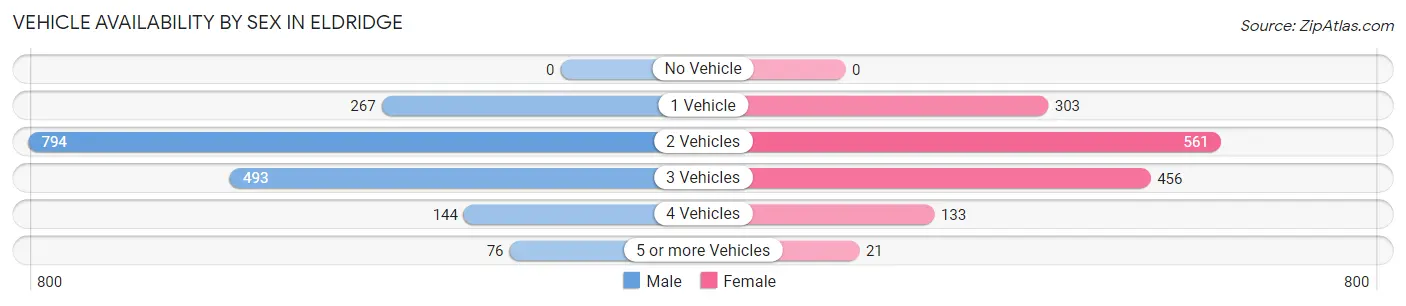
| Vehicles Available | Male | Female |
| No Vehicle | 0 (0.0%) | 0 (0.0%) |
| 1 Vehicle | 267 (15.0%) | 303 (20.6%) |
| 2 Vehicles | 794 (44.8%) | 561 (38.1%) |
| 3 Vehicles | 493 (27.8%) | 456 (30.9%) |
| 4 Vehicles | 144 (8.1%) | 133 (9.0%) |
| 5 or more Vehicles | 76 (4.3%) | 21 (1.4%) |
| Total | 1,774 (100.0%) | 1,474 (100.0%) |
Commute Time in Eldridge
The most frequently occuring commute durations in Eldridge are 15 to 19 minutes (557 commuters, 20.0%), 20 to 24 minutes (544 commuters, 19.5%), and 5 to 9 minutes (501 commuters, 18.0%).
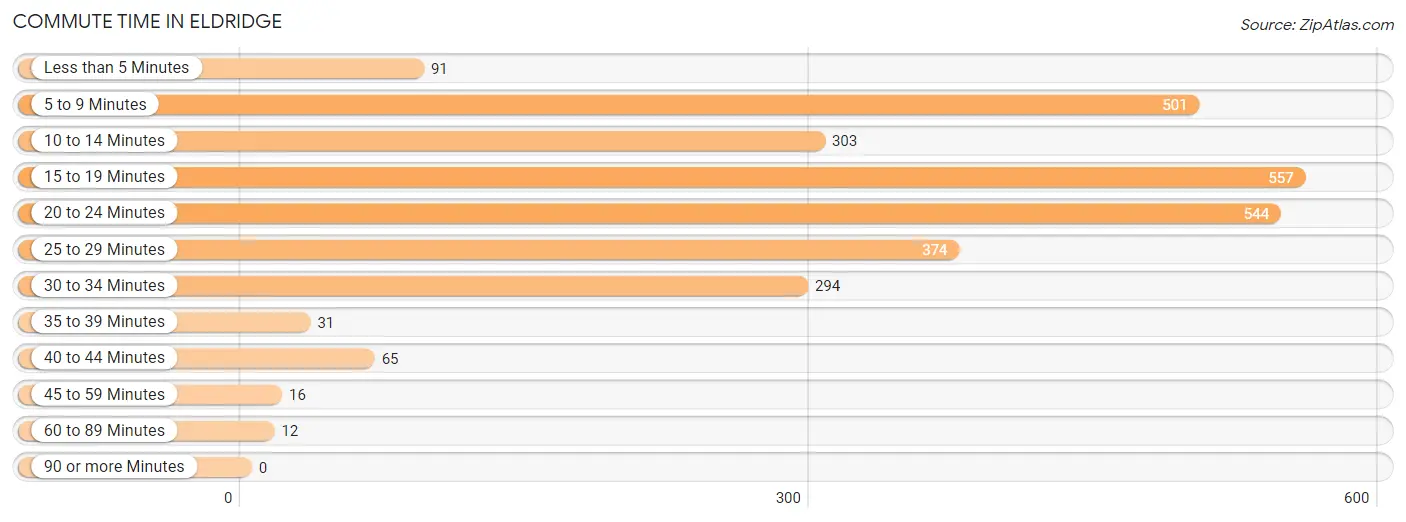
| Commute Time | # Commuters | % Commuters |
| Less than 5 Minutes | 91 | 3.3% |
| 5 to 9 Minutes | 501 | 18.0% |
| 10 to 14 Minutes | 303 | 10.9% |
| 15 to 19 Minutes | 557 | 20.0% |
| 20 to 24 Minutes | 544 | 19.5% |
| 25 to 29 Minutes | 374 | 13.4% |
| 30 to 34 Minutes | 294 | 10.5% |
| 35 to 39 Minutes | 31 | 1.1% |
| 40 to 44 Minutes | 65 | 2.3% |
| 45 to 59 Minutes | 16 | 0.6% |
| 60 to 89 Minutes | 12 | 0.4% |
| 90 or more Minutes | 0 | 0.0% |
Commute Time by Sex in Eldridge
The most common commute times in Eldridge are 5 to 9 minutes (334 commuters, 21.3%) for males and 20 to 24 minutes (304 commuters, 24.9%) for females.
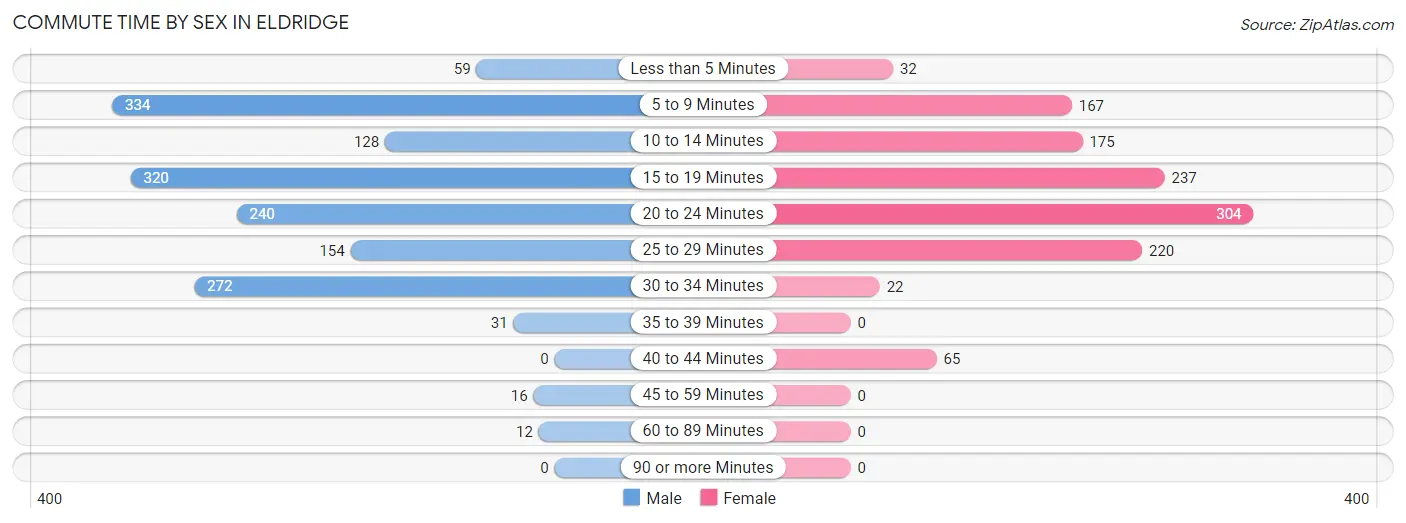
| Commute Time | Male | Female |
| Less than 5 Minutes | 59 (3.8%) | 32 (2.6%) |
| 5 to 9 Minutes | 334 (21.3%) | 167 (13.7%) |
| 10 to 14 Minutes | 128 (8.2%) | 175 (14.3%) |
| 15 to 19 Minutes | 320 (20.4%) | 237 (19.4%) |
| 20 to 24 Minutes | 240 (15.3%) | 304 (24.9%) |
| 25 to 29 Minutes | 154 (9.8%) | 220 (18.0%) |
| 30 to 34 Minutes | 272 (17.4%) | 22 (1.8%) |
| 35 to 39 Minutes | 31 (2.0%) | 0 (0.0%) |
| 40 to 44 Minutes | 0 (0.0%) | 65 (5.3%) |
| 45 to 59 Minutes | 16 (1.0%) | 0 (0.0%) |
| 60 to 89 Minutes | 12 (0.8%) | 0 (0.0%) |
| 90 or more Minutes | 0 (0.0%) | 0 (0.0%) |
Time of Departure to Work by Sex in Eldridge
The most frequent times of departure to work in Eldridge are 6:30 AM to 6:59 AM (453, 28.9%) for males and 7:30 AM to 7:59 AM (316, 25.9%) for females.
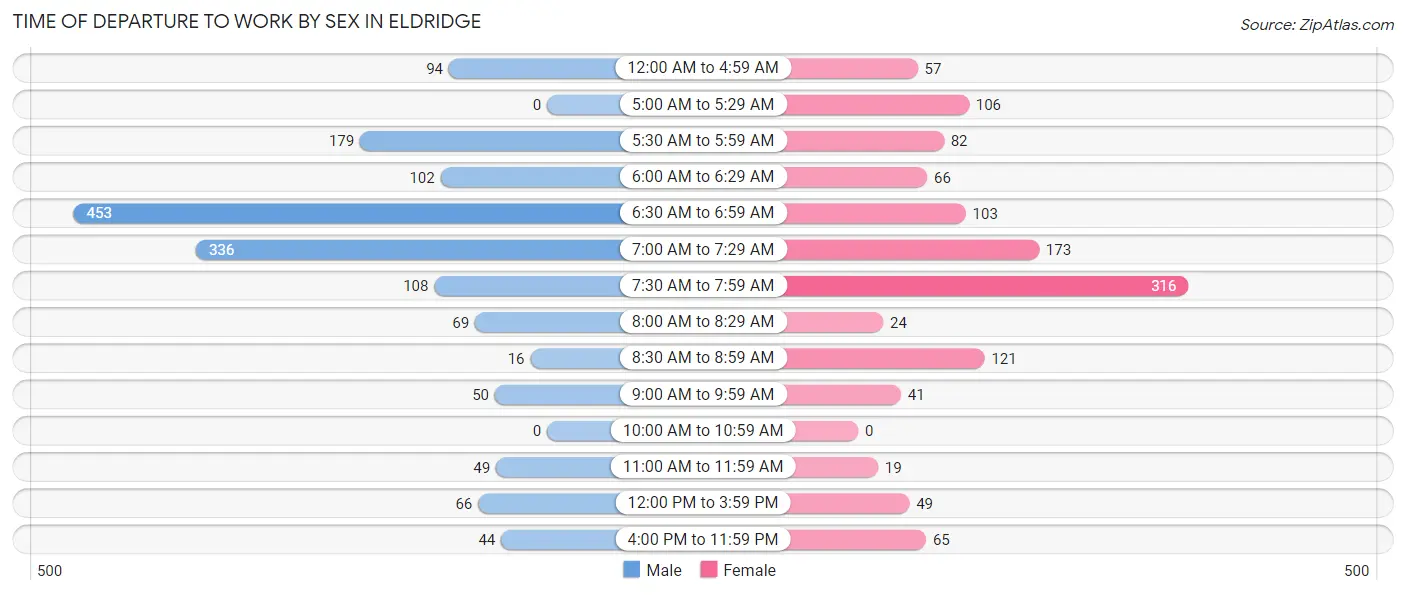
| Time of Departure | Male | Female |
| 12:00 AM to 4:59 AM | 94 (6.0%) | 57 (4.7%) |
| 5:00 AM to 5:29 AM | 0 (0.0%) | 106 (8.7%) |
| 5:30 AM to 5:59 AM | 179 (11.4%) | 82 (6.7%) |
| 6:00 AM to 6:29 AM | 102 (6.5%) | 66 (5.4%) |
| 6:30 AM to 6:59 AM | 453 (28.9%) | 103 (8.4%) |
| 7:00 AM to 7:29 AM | 336 (21.5%) | 173 (14.2%) |
| 7:30 AM to 7:59 AM | 108 (6.9%) | 316 (25.9%) |
| 8:00 AM to 8:29 AM | 69 (4.4%) | 24 (2.0%) |
| 8:30 AM to 8:59 AM | 16 (1.0%) | 121 (9.9%) |
| 9:00 AM to 9:59 AM | 50 (3.2%) | 41 (3.4%) |
| 10:00 AM to 10:59 AM | 0 (0.0%) | 0 (0.0%) |
| 11:00 AM to 11:59 AM | 49 (3.1%) | 19 (1.5%) |
| 12:00 PM to 3:59 PM | 66 (4.2%) | 49 (4.0%) |
| 4:00 PM to 11:59 PM | 44 (2.8%) | 65 (5.3%) |
| Total | 1,566 (100.0%) | 1,222 (100.0%) |
Housing Occupancy in Eldridge
Occupancy by Ownership in Eldridge
Of the total 2,589 dwellings in Eldridge, owner-occupied units account for 2,104 (81.3%), while renter-occupied units make up 485 (18.7%).
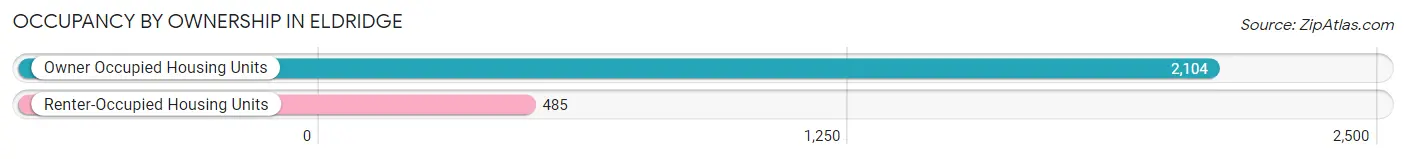
| Occupancy | # Housing Units | % Housing Units |
| Owner Occupied Housing Units | 2,104 | 81.3% |
| Renter-Occupied Housing Units | 485 | 18.7% |
| Total Occupied Housing Units | 2,589 | 100.0% |
Occupancy by Household Size in Eldridge
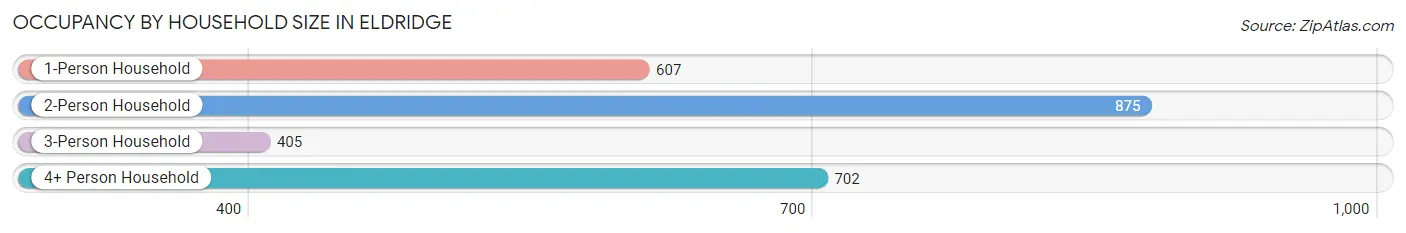
| Household Size | # Housing Units | % Housing Units |
| 1-Person Household | 607 | 23.4% |
| 2-Person Household | 875 | 33.8% |
| 3-Person Household | 405 | 15.6% |
| 4+ Person Household | 702 | 27.1% |
| Total Housing Units | 2,589 | 100.0% |
Occupancy by Ownership by Household Size in Eldridge
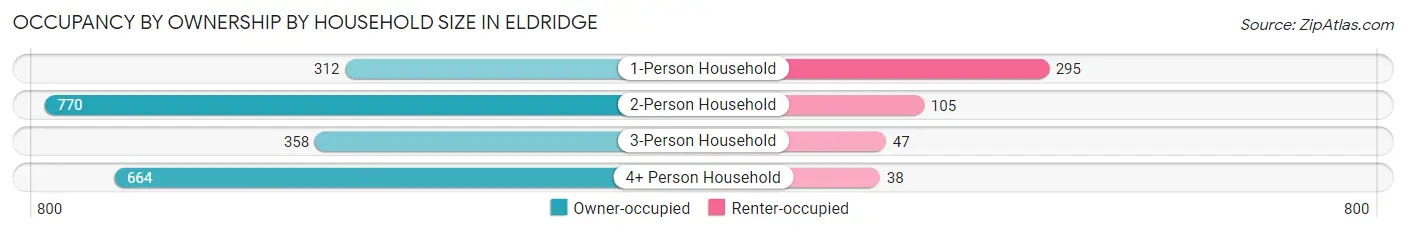
| Household Size | Owner-occupied | Renter-occupied |
| 1-Person Household | 312 (51.4%) | 295 (48.6%) |
| 2-Person Household | 770 (88.0%) | 105 (12.0%) |
| 3-Person Household | 358 (88.4%) | 47 (11.6%) |
| 4+ Person Household | 664 (94.6%) | 38 (5.4%) |
| Total Housing Units | 2,104 (81.3%) | 485 (18.7%) |
Occupancy by Educational Attainment in Eldridge
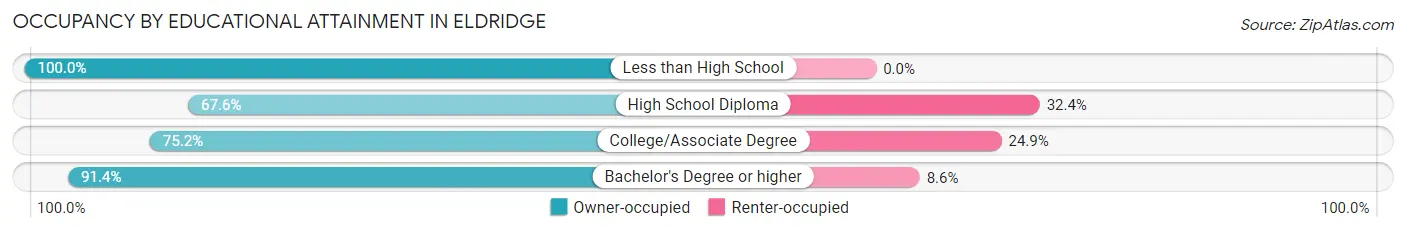
| Household Size | Owner-occupied | Renter-occupied |
| Less than High School | 42 (100.0%) | 0 (0.0%) |
| High School Diploma | 442 (67.6%) | 212 (32.4%) |
| College/Associate Degree | 508 (75.1%) | 168 (24.8%) |
| Bachelor's Degree or higher | 1,112 (91.4%) | 105 (8.6%) |
Occupancy by Age of Householder in Eldridge
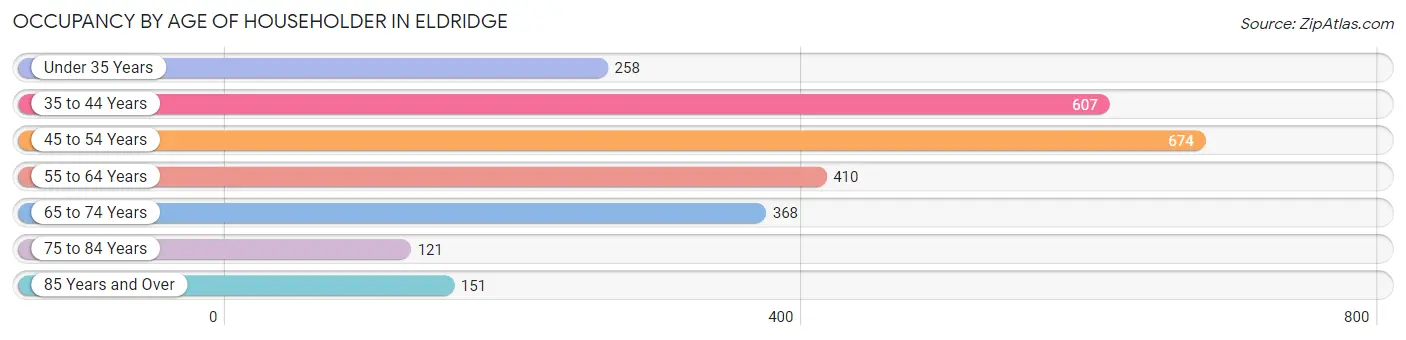
| Age Bracket | # Households | % Households |
| Under 35 Years | 258 | 10.0% |
| 35 to 44 Years | 607 | 23.4% |
| 45 to 54 Years | 674 | 26.0% |
| 55 to 64 Years | 410 | 15.8% |
| 65 to 74 Years | 368 | 14.2% |
| 75 to 84 Years | 121 | 4.7% |
| 85 Years and Over | 151 | 5.8% |
| Total | 2,589 | 100.0% |
Housing Finances in Eldridge
Median Income by Occupancy in Eldridge
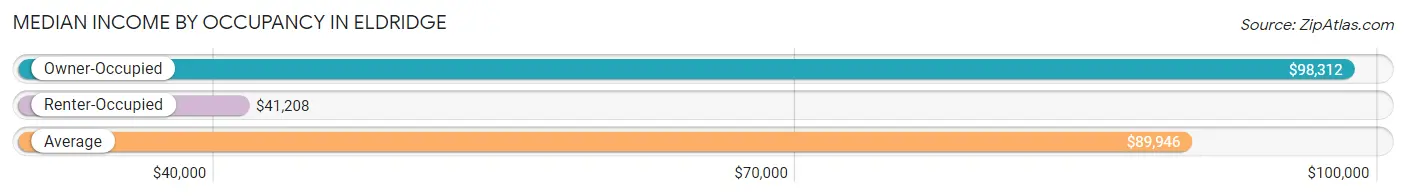
| Occupancy Type | # Households | Median Income |
| Owner-Occupied | 2,104 (81.3%) | $98,312 |
| Renter-Occupied | 485 (18.7%) | $41,208 |
| Average | 2,589 (100.0%) | $89,946 |
Occupancy by Householder Income Bracket in Eldridge
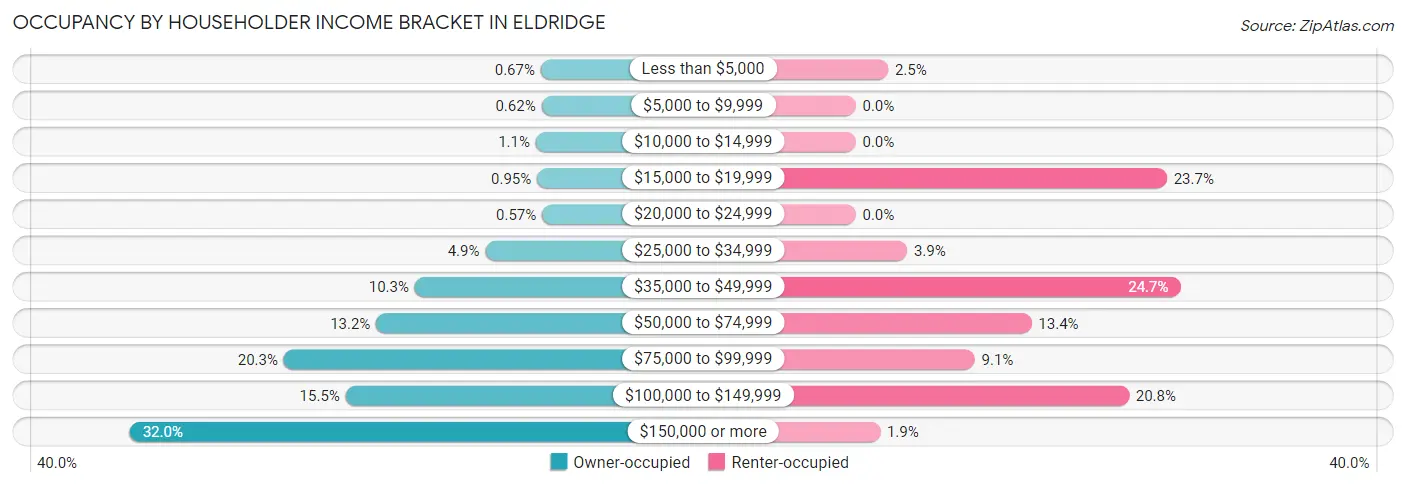
| Income Bracket | Owner-occupied | Renter-occupied |
| Less than $5,000 | 14 (0.7%) | 12 (2.5%) |
| $5,000 to $9,999 | 13 (0.6%) | 0 (0.0%) |
| $10,000 to $14,999 | 22 (1.1%) | 0 (0.0%) |
| $15,000 to $19,999 | 20 (0.9%) | 115 (23.7%) |
| $20,000 to $24,999 | 12 (0.6%) | 0 (0.0%) |
| $25,000 to $34,999 | 103 (4.9%) | 19 (3.9%) |
| $35,000 to $49,999 | 216 (10.3%) | 120 (24.7%) |
| $50,000 to $74,999 | 278 (13.2%) | 65 (13.4%) |
| $75,000 to $99,999 | 426 (20.3%) | 44 (9.1%) |
| $100,000 to $149,999 | 327 (15.5%) | 101 (20.8%) |
| $150,000 or more | 673 (32.0%) | 9 (1.9%) |
| Total | 2,104 (100.0%) | 485 (100.0%) |
Monthly Housing Cost Tiers in Eldridge
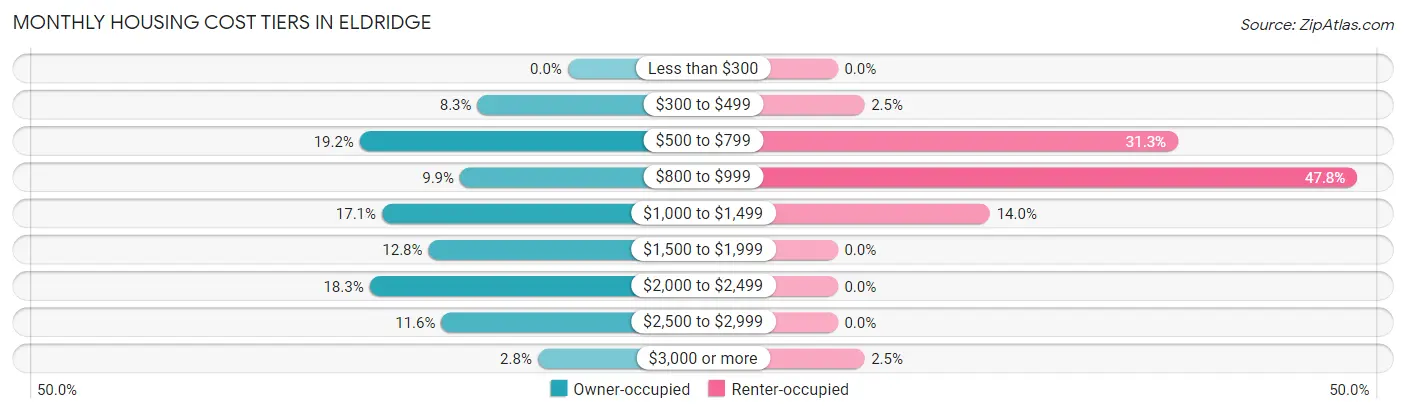
| Monthly Cost | Owner-occupied | Renter-occupied |
| Less than $300 | 0 (0.0%) | 0 (0.0%) |
| $300 to $499 | 175 (8.3%) | 12 (2.5%) |
| $500 to $799 | 403 (19.2%) | 152 (31.3%) |
| $800 to $999 | 209 (9.9%) | 232 (47.8%) |
| $1,000 to $1,499 | 360 (17.1%) | 68 (14.0%) |
| $1,500 to $1,999 | 270 (12.8%) | 0 (0.0%) |
| $2,000 to $2,499 | 384 (18.2%) | 0 (0.0%) |
| $2,500 to $2,999 | 245 (11.6%) | 0 (0.0%) |
| $3,000 or more | 58 (2.8%) | 12 (2.5%) |
| Total | 2,104 (100.0%) | 485 (100.0%) |
Physical Housing Characteristics in Eldridge
Housing Structures in Eldridge
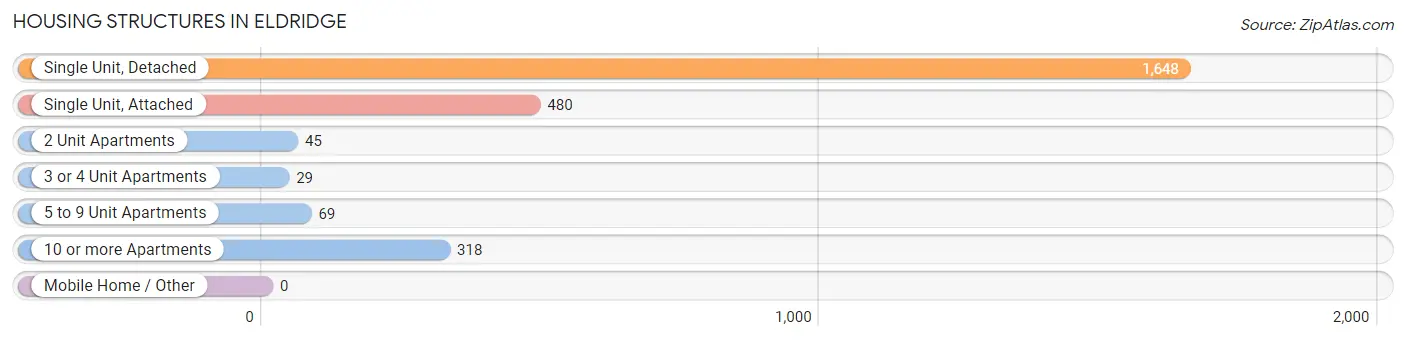
| Structure Type | # Housing Units | % Housing Units |
| Single Unit, Detached | 1,648 | 63.6% |
| Single Unit, Attached | 480 | 18.5% |
| 2 Unit Apartments | 45 | 1.7% |
| 3 or 4 Unit Apartments | 29 | 1.1% |
| 5 to 9 Unit Apartments | 69 | 2.7% |
| 10 or more Apartments | 318 | 12.3% |
| Mobile Home / Other | 0 | 0.0% |
| Total | 2,589 | 100.0% |
Housing Structures by Occupancy in Eldridge
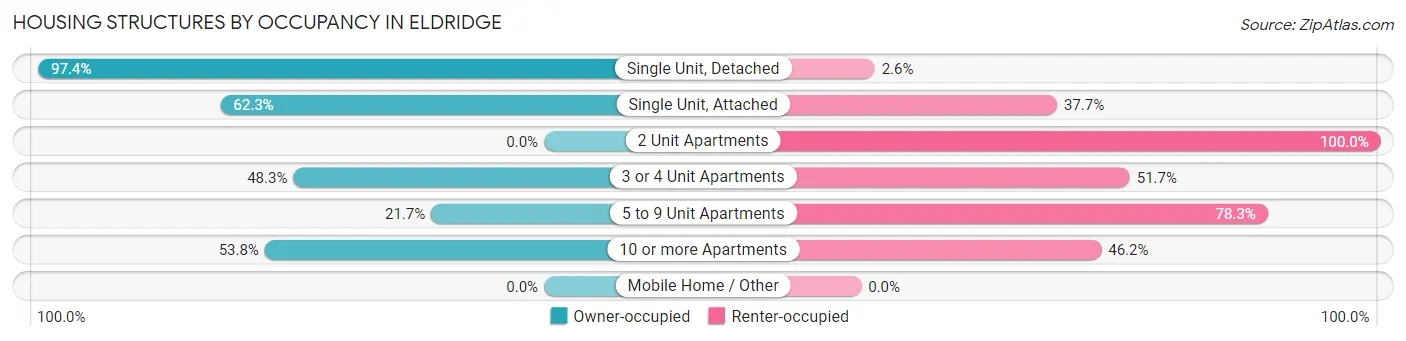
| Structure Type | Owner-occupied | Renter-occupied |
| Single Unit, Detached | 1,605 (97.4%) | 43 (2.6%) |
| Single Unit, Attached | 299 (62.3%) | 181 (37.7%) |
| 2 Unit Apartments | 0 (0.0%) | 45 (100.0%) |
| 3 or 4 Unit Apartments | 14 (48.3%) | 15 (51.7%) |
| 5 to 9 Unit Apartments | 15 (21.7%) | 54 (78.3%) |
| 10 or more Apartments | 171 (53.8%) | 147 (46.2%) |
| Mobile Home / Other | 0 (0.0%) | 0 (0.0%) |
| Total | 2,104 (81.3%) | 485 (18.7%) |
Housing Structures by Number of Rooms in Eldridge
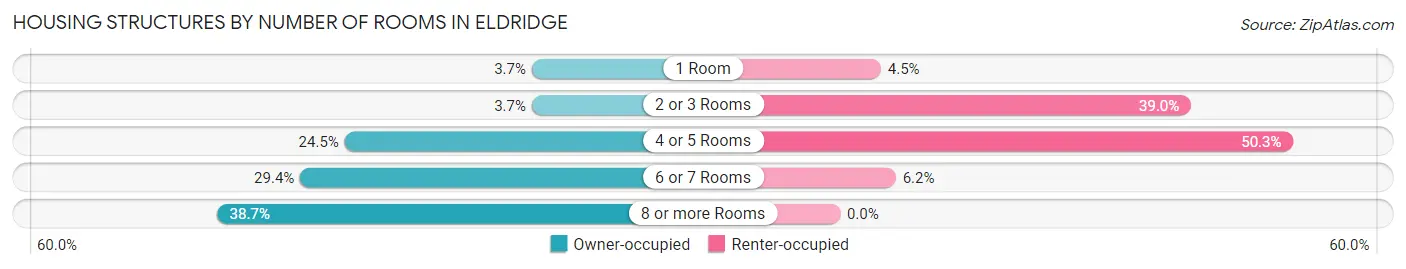
| Number of Rooms | Owner-occupied | Renter-occupied |
| 1 Room | 78 (3.7%) | 22 (4.5%) |
| 2 or 3 Rooms | 78 (3.7%) | 189 (39.0%) |
| 4 or 5 Rooms | 515 (24.5%) | 244 (50.3%) |
| 6 or 7 Rooms | 619 (29.4%) | 30 (6.2%) |
| 8 or more Rooms | 814 (38.7%) | 0 (0.0%) |
| Total | 2,104 (100.0%) | 485 (100.0%) |
Housing Structure by Heating Type in Eldridge
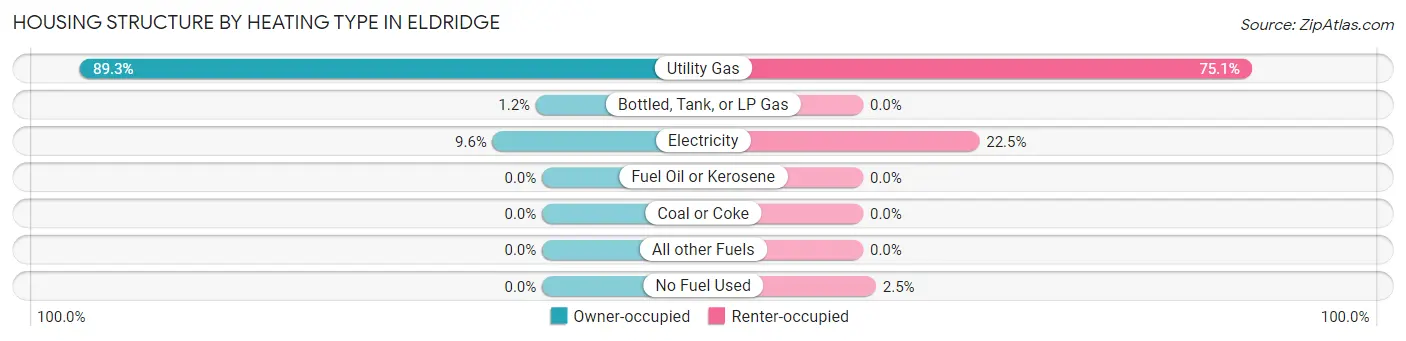
| Heating Type | Owner-occupied | Renter-occupied |
| Utility Gas | 1,878 (89.3%) | 364 (75.0%) |
| Bottled, Tank, or LP Gas | 25 (1.2%) | 0 (0.0%) |
| Electricity | 201 (9.6%) | 109 (22.5%) |
| Fuel Oil or Kerosene | 0 (0.0%) | 0 (0.0%) |
| Coal or Coke | 0 (0.0%) | 0 (0.0%) |
| All other Fuels | 0 (0.0%) | 0 (0.0%) |
| No Fuel Used | 0 (0.0%) | 12 (2.5%) |
| Total | 2,104 (100.0%) | 485 (100.0%) |
Household Vehicle Usage in Eldridge
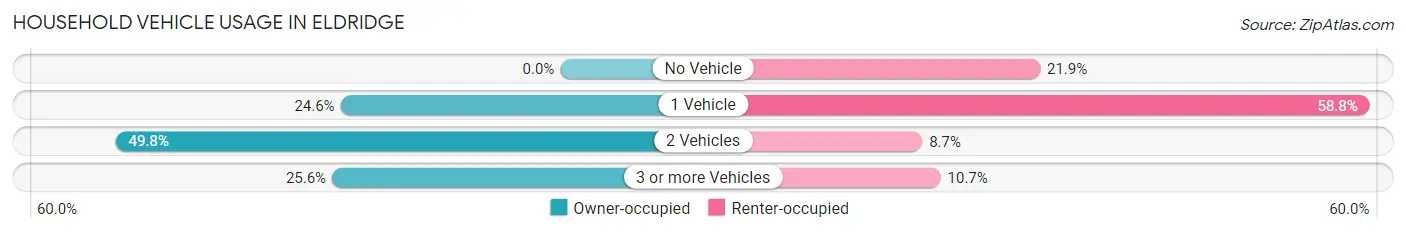
| Vehicles per Household | Owner-occupied | Renter-occupied |
| No Vehicle | 0 (0.0%) | 106 (21.9%) |
| 1 Vehicle | 518 (24.6%) | 285 (58.8%) |
| 2 Vehicles | 1,048 (49.8%) | 42 (8.7%) |
| 3 or more Vehicles | 538 (25.6%) | 52 (10.7%) |
| Total | 2,104 (100.0%) | 485 (100.0%) |
Real Estate & Mortgages in Eldridge
Real Estate and Mortgage Overview in Eldridge
| Characteristic | Without Mortgage | With Mortgage |
| Housing Units | 593 | 1,511 |
| Median Property Value | $273,900 | $295,900 |
| Median Household Income | $88,207 | $539 |
| Monthly Housing Costs | $645 | $58 |
| Real Estate Taxes | $3,617 | $15 |
Property Value by Mortgage Status in Eldridge
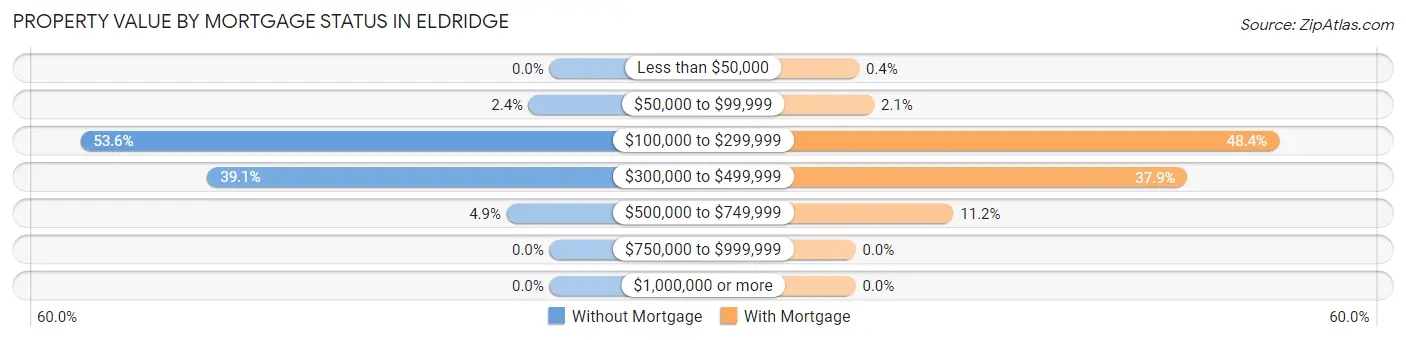
| Property Value | Without Mortgage | With Mortgage |
| Less than $50,000 | 0 (0.0%) | 6 (0.4%) |
| $50,000 to $99,999 | 14 (2.4%) | 32 (2.1%) |
| $100,000 to $299,999 | 318 (53.6%) | 731 (48.4%) |
| $300,000 to $499,999 | 232 (39.1%) | 573 (37.9%) |
| $500,000 to $749,999 | 29 (4.9%) | 169 (11.2%) |
| $750,000 to $999,999 | 0 (0.0%) | 0 (0.0%) |
| $1,000,000 or more | 0 (0.0%) | 0 (0.0%) |
| Total | 593 (100.0%) | 1,511 (100.0%) |
Household Income by Mortgage Status in Eldridge
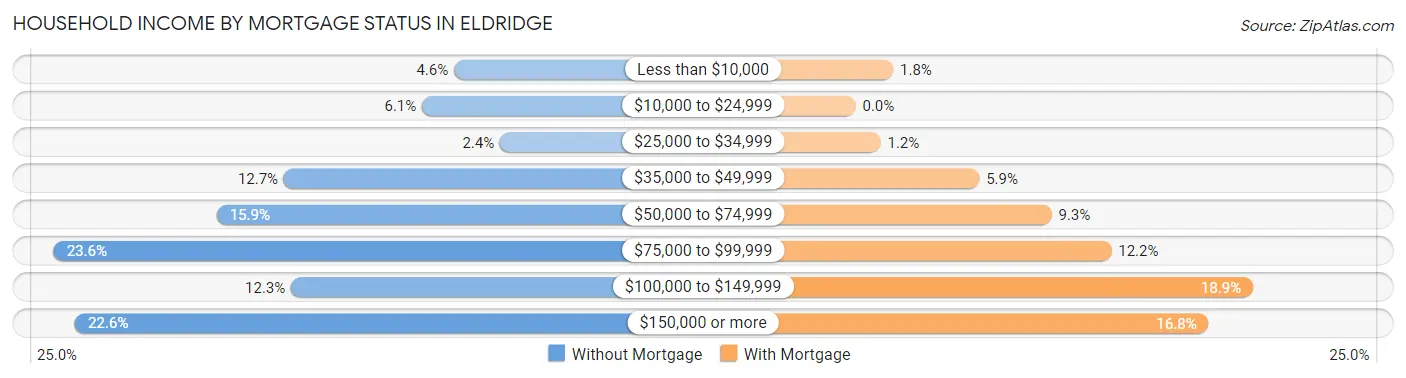
| Household Income | Without Mortgage | With Mortgage |
| Less than $10,000 | 27 (4.5%) | 27 (1.8%) |
| $10,000 to $24,999 | 36 (6.1%) | 0 (0.0%) |
| $25,000 to $34,999 | 14 (2.4%) | 18 (1.2%) |
| $35,000 to $49,999 | 75 (12.7%) | 89 (5.9%) |
| $50,000 to $74,999 | 94 (15.9%) | 141 (9.3%) |
| $75,000 to $99,999 | 140 (23.6%) | 184 (12.2%) |
| $100,000 to $149,999 | 73 (12.3%) | 286 (18.9%) |
| $150,000 or more | 134 (22.6%) | 254 (16.8%) |
| Total | 593 (100.0%) | 1,511 (100.0%) |
Property Value to Household Income Ratio in Eldridge
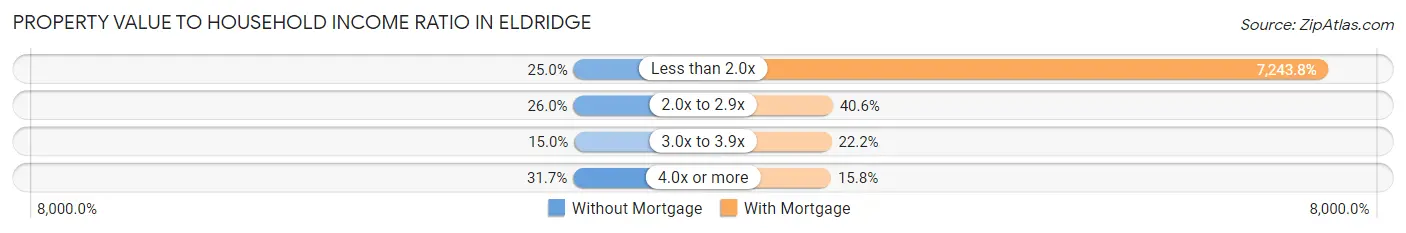
| Value-to-Income Ratio | Without Mortgage | With Mortgage |
| Less than 2.0x | 148 (25.0%) | 109,453 (7,243.8%) |
| 2.0x to 2.9x | 154 (26.0%) | 613 (40.6%) |
| 3.0x to 3.9x | 89 (15.0%) | 336 (22.2%) |
| 4.0x or more | 188 (31.7%) | 238 (15.8%) |
| Total | 593 (100.0%) | 1,511 (100.0%) |
Real Estate Taxes by Mortgage Status in Eldridge
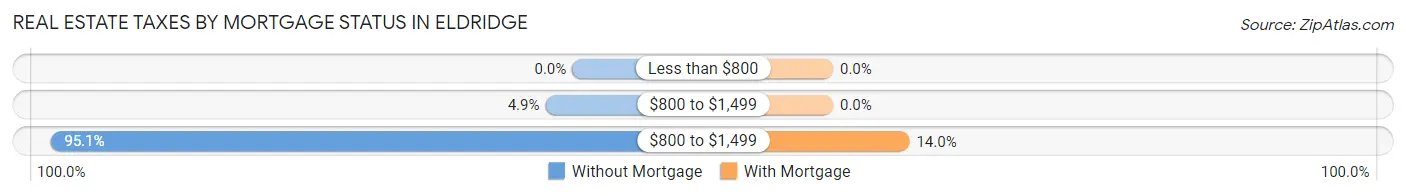
| Property Taxes | Without Mortgage | With Mortgage |
| Less than $800 | 0 (0.0%) | 0 (0.0%) |
| $800 to $1,499 | 29 (4.9%) | 0 (0.0%) |
| $800 to $1,499 | 564 (95.1%) | 211 (14.0%) |
| Total | 593 (100.0%) | 1,511 (100.0%) |
Health & Disability in Eldridge
Health Insurance Coverage by Age in Eldridge
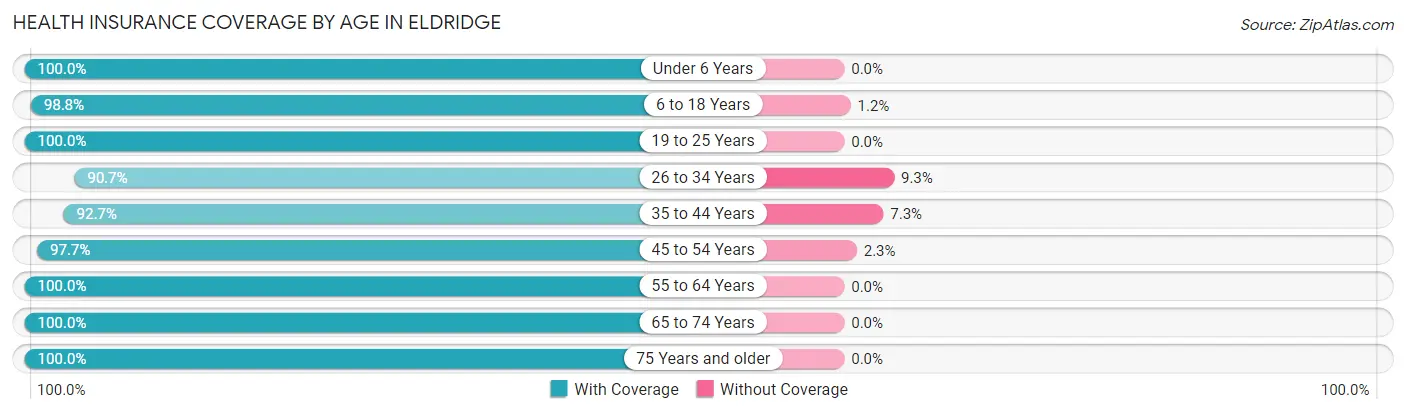
| Age Bracket | With Coverage | Without Coverage |
| Under 6 Years | 389 (100.0%) | 0 (0.0%) |
| 6 to 18 Years | 1,858 (98.8%) | 22 (1.2%) |
| 19 to 25 Years | 307 (100.0%) | 0 (0.0%) |
| 26 to 34 Years | 313 (90.7%) | 32 (9.3%) |
| 35 to 44 Years | 892 (92.7%) | 70 (7.3%) |
| 45 to 54 Years | 1,049 (97.7%) | 25 (2.3%) |
| 55 to 64 Years | 663 (100.0%) | 0 (0.0%) |
| 65 to 74 Years | 680 (100.0%) | 0 (0.0%) |
| 75 Years and older | 393 (100.0%) | 0 (0.0%) |
| Total | 6,544 (97.8%) | 149 (2.2%) |
Health Insurance Coverage by Citizenship Status in Eldridge
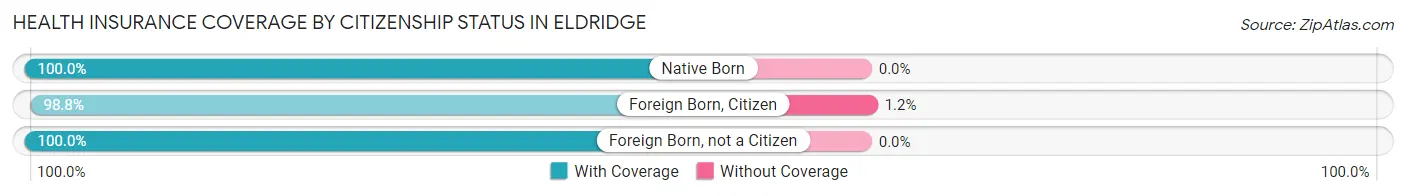
| Citizenship Status | With Coverage | Without Coverage |
| Native Born | 389 (100.0%) | 0 (0.0%) |
| Foreign Born, Citizen | 1,858 (98.8%) | 22 (1.2%) |
| Foreign Born, not a Citizen | 307 (100.0%) | 0 (0.0%) |
Health Insurance Coverage by Household Income in Eldridge
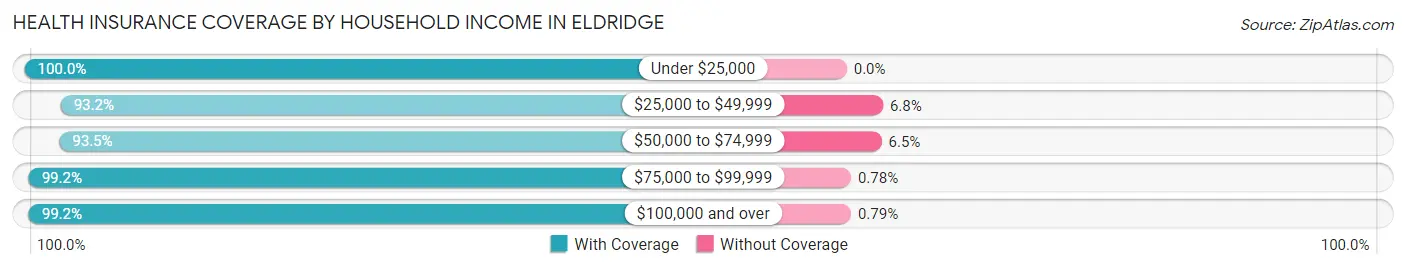
| Household Income | With Coverage | Without Coverage |
| Under $25,000 | 223 (100.0%) | 0 (0.0%) |
| $25,000 to $49,999 | 962 (93.2%) | 70 (6.8%) |
| $50,000 to $74,999 | 588 (93.5%) | 41 (6.5%) |
| $75,000 to $99,999 | 1,273 (99.2%) | 10 (0.8%) |
| $100,000 and over | 3,498 (99.2%) | 28 (0.8%) |
Public vs Private Health Insurance Coverage by Age in Eldridge
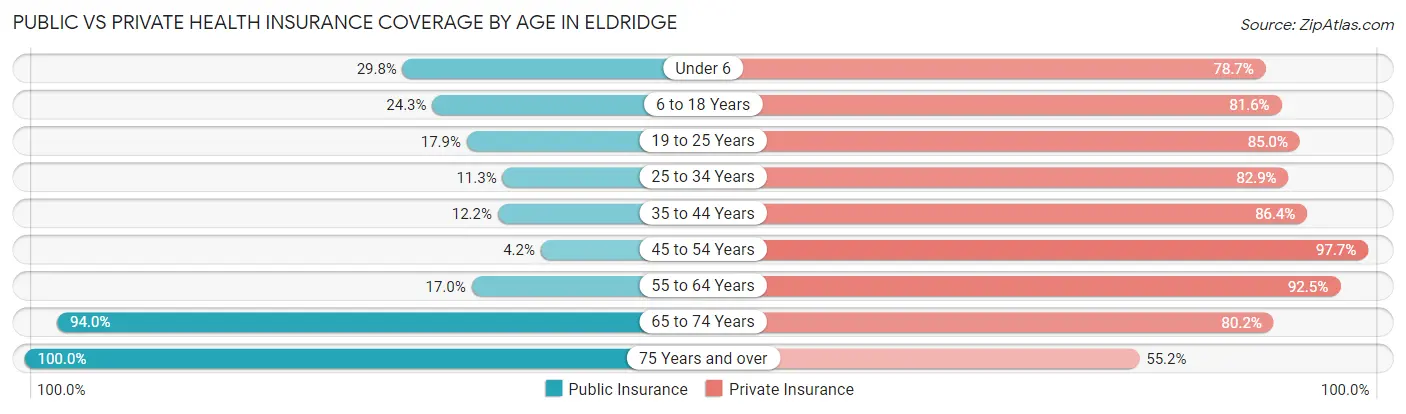
| Age Bracket | Public Insurance | Private Insurance |
| Under 6 | 116 (29.8%) | 306 (78.7%) |
| 6 to 18 Years | 457 (24.3%) | 1,534 (81.6%) |
| 19 to 25 Years | 55 (17.9%) | 261 (85.0%) |
| 25 to 34 Years | 39 (11.3%) | 286 (82.9%) |
| 35 to 44 Years | 117 (12.2%) | 831 (86.4%) |
| 45 to 54 Years | 45 (4.2%) | 1,049 (97.7%) |
| 55 to 64 Years | 113 (17.0%) | 613 (92.5%) |
| 65 to 74 Years | 639 (94.0%) | 545 (80.1%) |
| 75 Years and over | 393 (100.0%) | 217 (55.2%) |
| Total | 1,974 (29.5%) | 5,642 (84.3%) |
Disability Status by Sex by Age in Eldridge
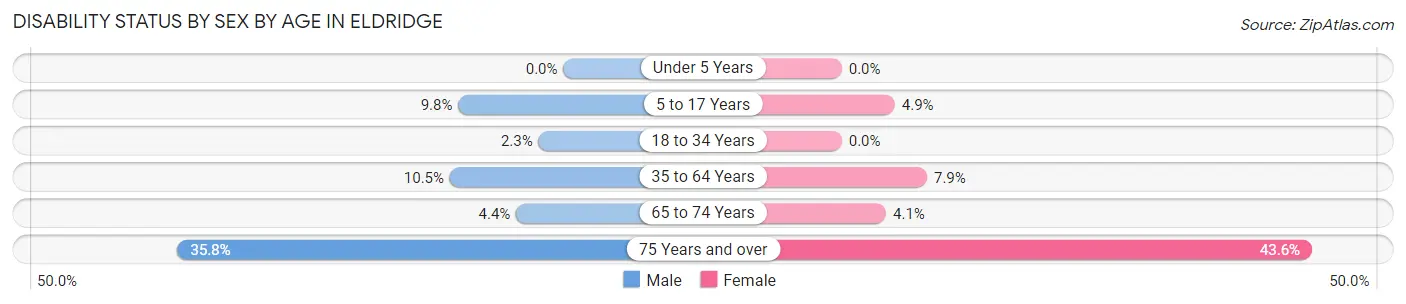
| Age Bracket | Male | Female |
| Under 5 Years | 0 (0.0%) | 0 (0.0%) |
| 5 to 17 Years | 85 (9.8%) | 45 (4.9%) |
| 18 to 34 Years | 9 (2.3%) | 0 (0.0%) |
| 35 to 64 Years | 151 (10.5%) | 100 (7.9%) |
| 65 to 74 Years | 17 (4.4%) | 12 (4.1%) |
| 75 Years and over | 48 (35.8%) | 113 (43.6%) |
Disability Class by Sex by Age in Eldridge
Disability Class: Hearing Difficulty
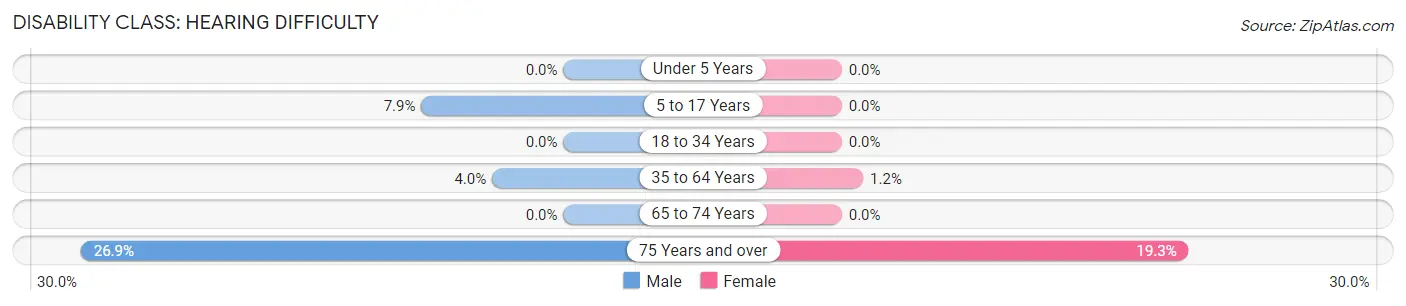
| Age Bracket | Male | Female |
| Under 5 Years | 0 (0.0%) | 0 (0.0%) |
| 5 to 17 Years | 69 (7.9%) | 0 (0.0%) |
| 18 to 34 Years | 0 (0.0%) | 0 (0.0%) |
| 35 to 64 Years | 57 (4.0%) | 15 (1.2%) |
| 65 to 74 Years | 0 (0.0%) | 0 (0.0%) |
| 75 Years and over | 36 (26.9%) | 50 (19.3%) |
Disability Class: Vision Difficulty
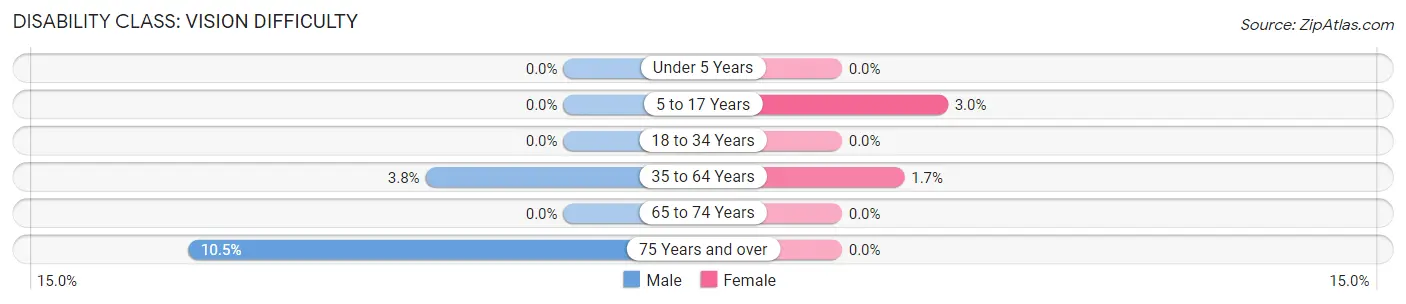
| Age Bracket | Male | Female |
| Under 5 Years | 0 (0.0%) | 0 (0.0%) |
| 5 to 17 Years | 0 (0.0%) | 27 (2.9%) |
| 18 to 34 Years | 0 (0.0%) | 0 (0.0%) |
| 35 to 64 Years | 55 (3.8%) | 22 (1.7%) |
| 65 to 74 Years | 0 (0.0%) | 0 (0.0%) |
| 75 Years and over | 14 (10.4%) | 0 (0.0%) |
Disability Class: Cognitive Difficulty
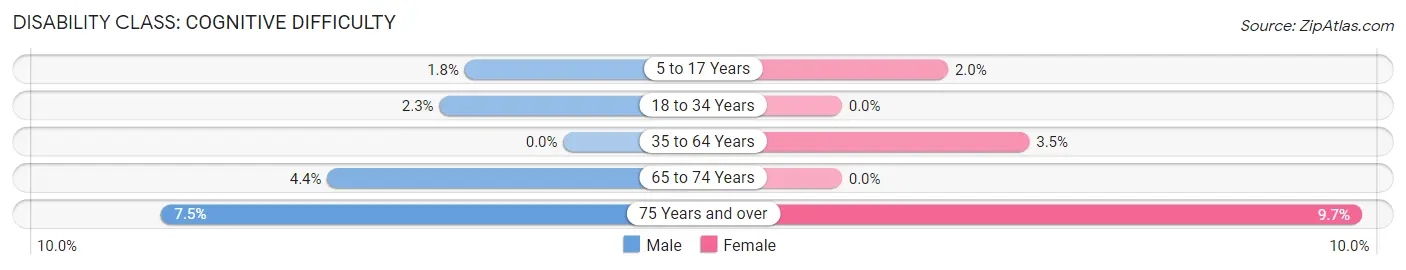
| Age Bracket | Male | Female |
| 5 to 17 Years | 16 (1.8%) | 18 (2.0%) |
| 18 to 34 Years | 9 (2.3%) | 0 (0.0%) |
| 35 to 64 Years | 0 (0.0%) | 44 (3.5%) |
| 65 to 74 Years | 17 (4.4%) | 0 (0.0%) |
| 75 Years and over | 10 (7.5%) | 25 (9.7%) |
Disability Class: Ambulatory Difficulty
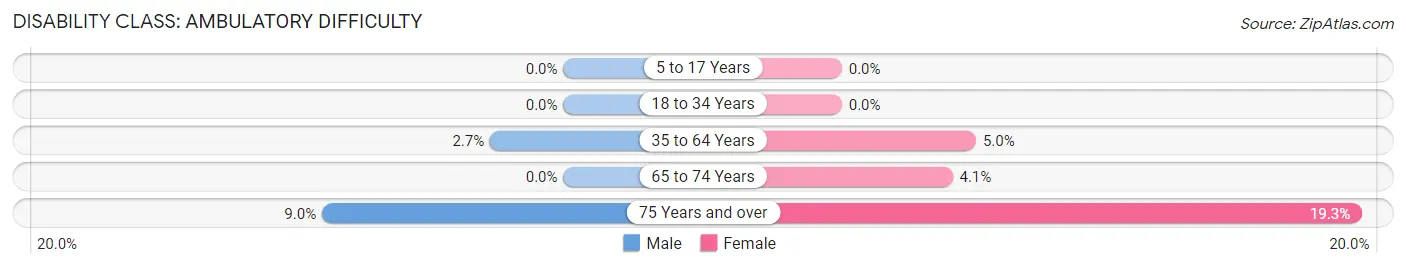
| Age Bracket | Male | Female |
| 5 to 17 Years | 0 (0.0%) | 0 (0.0%) |
| 18 to 34 Years | 0 (0.0%) | 0 (0.0%) |
| 35 to 64 Years | 39 (2.7%) | 63 (5.0%) |
| 65 to 74 Years | 0 (0.0%) | 12 (4.1%) |
| 75 Years and over | 12 (9.0%) | 50 (19.3%) |
Disability Class: Self-Care Difficulty
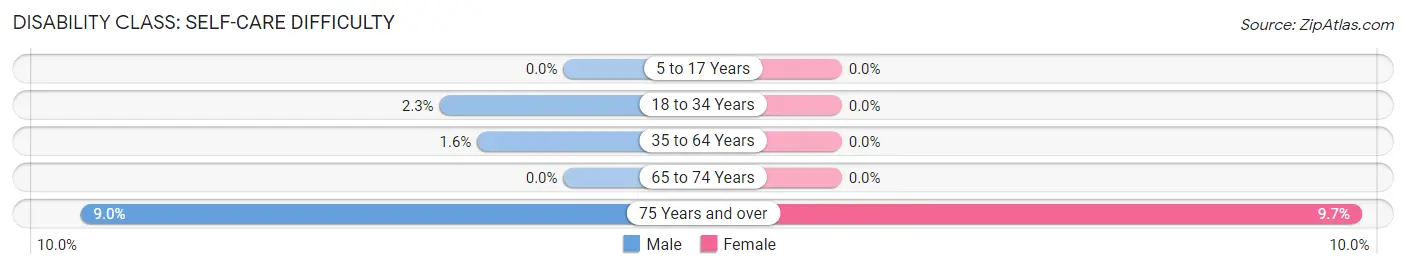
| Age Bracket | Male | Female |
| 5 to 17 Years | 0 (0.0%) | 0 (0.0%) |
| 18 to 34 Years | 9 (2.3%) | 0 (0.0%) |
| 35 to 64 Years | 23 (1.6%) | 0 (0.0%) |
| 65 to 74 Years | 0 (0.0%) | 0 (0.0%) |
| 75 Years and over | 12 (9.0%) | 25 (9.7%) |
Technology Access in Eldridge
Computing Device Access in Eldridge
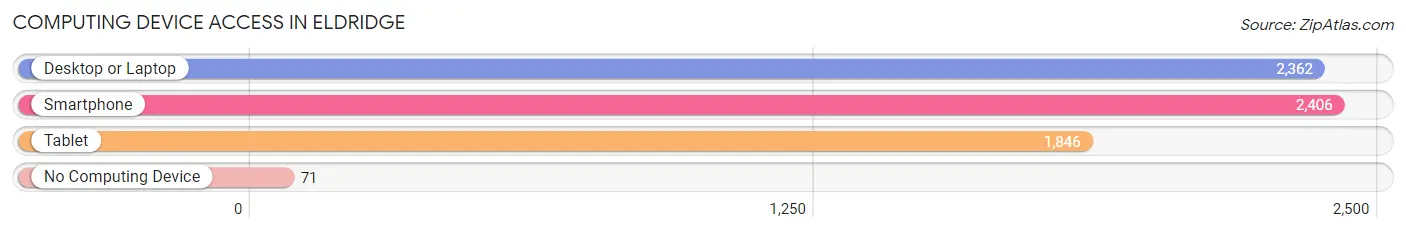
| Device Type | # Households | % Households |
| Desktop or Laptop | 2,362 | 91.2% |
| Smartphone | 2,406 | 92.9% |
| Tablet | 1,846 | 71.3% |
| No Computing Device | 71 | 2.7% |
| Total | 2,589 | 100.0% |
Internet Access in Eldridge
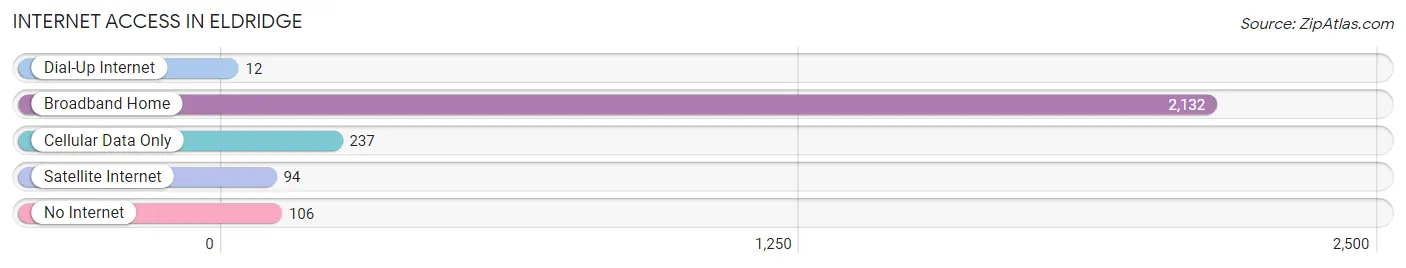
| Internet Type | # Households | % Households |
| Dial-Up Internet | 12 | 0.5% |
| Broadband Home | 2,132 | 82.4% |
| Cellular Data Only | 237 | 9.1% |
| Satellite Internet | 94 | 3.6% |
| No Internet | 106 | 4.1% |
| Total | 2,589 | 100.0% |
Eldridge Summary
Eldridge, Iowa is a small city located in Scott County, Iowa. It is part of the Davenport-Moline-Rock Island Metropolitan Statistical Area. The city has a population of 6,162 as of the 2010 census.
History
Eldridge was founded in 1855 by William Eldridge, a settler from Ohio. The city was originally known as Eldridge Station, as it was a stop on the Chicago, Rock Island and Pacific Railroad. The city was incorporated in 1872.
In the late 19th century, Eldridge was a major center for the production of brick and tile. The city was also home to a number of other industries, including a flour mill, a creamery, and a furniture factory.
Geography
Eldridge is located at 41°37'25" North, 90°31'45" West (41.623, -90.529). The city is situated in the rolling hills of the Driftless Area, an area of the Midwest that was not glaciated during the last ice age.
The city is located along the Rock River, which flows through the city from east to west. The city is also located near the Mississippi River, which is about 10 miles to the east.
The city has a total area of 4 2 square miles all of which is land
Economy
Eldridge is home to a number of businesses, including manufacturing, retail, and service industries. The city is also home to a number of small businesses, including restaurants, shops, and professional services.
The city is home to a number of large employers, including John Deere, which has a manufacturing facility in the city. Other major employers include the Rock Island County Health Department, the Scott County Sheriff's Office, and the Scott County Courthouse.
Demographics
As of the 2010 census, the population of Eldridge was 6,162. The racial makeup of the city was 94.2% White, 1.2% African American, 0.3% Native American, 0.7% Asian, 0.1% Pacific Islander, 1.7% from other races, and 1.8% from two or more races. Hispanic or Latino of any race were 3.7% of the population.
The median income for a household in the city was $50,902, and the median income for a family was $60,902. The per capita income for the city was $24,902. About 5.2% of families and 7.2% of the population were below the poverty line, including 8.2% of those under age 18 and 6.2% of those age 65 or over.
Common Questions
What is Per Capita Income in Eldridge?
Per Capita income in Eldridge is $45,273.
What is the Median Family Income in Eldridge?
Median Family Income in Eldridge is $110,268.
What is the Median Household income in Eldridge?
Median Household Income in Eldridge is $89,946.
What is Income or Wage Gap in Eldridge?
Income or Wage Gap in Eldridge is 32.0%.
Women in Eldridge earn 68.0 cents for every dollar earned by a man.
What is Inequality or Gini Index in Eldridge?
Inequality or Gini Index in Eldridge is 0.41.
What is the Total Population of Eldridge?
Total Population of Eldridge is 6,693.
What is the Total Male Population of Eldridge?
Total Male Population of Eldridge is 3,487.
What is the Total Female Population of Eldridge?
Total Female Population of Eldridge is 3,206.
What is the Ratio of Males per 100 Females in Eldridge?
There are 108.76 Males per 100 Females in Eldridge.
What is the Ratio of Females per 100 Males in Eldridge?
There are 91.94 Females per 100 Males in Eldridge.
What is the Median Population Age in Eldridge?
Median Population Age in Eldridge is 39.7 Years.
What is the Average Family Size in Eldridge
Average Family Size in Eldridge is 3.2 People.
What is the Average Household Size in Eldridge
Average Household Size in Eldridge is 2.6 People.
How Large is the Labor Force in Eldridge?
There are 3,417 People in the Labor Forcein in Eldridge.
What is the Percentage of People in the Labor Force in Eldridge?
69.7% of People are in the Labor Force in Eldridge.
What is the Unemployment Rate in Eldridge?
Unemployment Rate in Eldridge is 1.7%.