Knob Noster, MO Map & Demographics
Knob Noster Map
Knob Noster Overview
$30,600
PER CAPITA INCOME
$75,625
AVG FAMILY INCOME
$49,640
AVG HOUSEHOLD INCOME
30.0%
WAGE / INCOME GAP [ % ]
70.0¢/ $1
WAGE / INCOME GAP [ $ ]
0.36
INEQUALITY / GINI INDEX
2,793
TOTAL POPULATION
1,458
MALE POPULATION
1,335
FEMALE POPULATION
109.21
MALES / 100 FEMALES
91.56
FEMALES / 100 MALES
29.5
MEDIAN AGE
3.2
AVG FAMILY SIZE
2.1
AVG HOUSEHOLD SIZE
1,650
LABOR FORCE [ PEOPLE ]
72.5%
PERCENT IN LABOR FORCE
8.9%
UNEMPLOYMENT RATE
Knob Noster Zip Codes
Knob Noster Area Codes
Income in Knob Noster
Income Overview in Knob Noster
Per Capita Income in Knob Noster is $30,600, while median incomes of families and households are $75,625 and $49,640 respectively.
| Characteristic | Number | Measure |
| Per Capita Income | 2,793 | $30,600 |
| Median Family Income | 584 | $75,625 |
| Mean Family Income | 584 | $80,843 |
| Median Household Income | 1,305 | $49,640 |
| Mean Household Income | 1,305 | $63,362 |
| Income Deficit | 584 | $0 |
| Wage / Income Gap (%) | 2,793 | 30.03% |
| Wage / Income Gap ($) | 2,793 | 69.97¢ per $1 |
| Gini / Inequality Index | 2,793 | 0.36 |
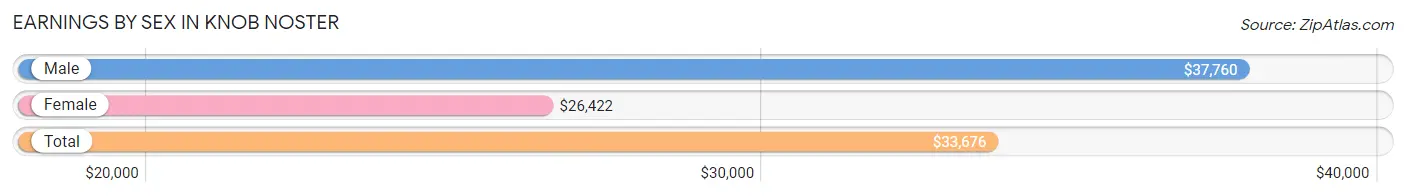
Earnings by Sex in Knob Noster
Average Earnings in Knob Noster are $33,676, $37,760 for men and $26,422 for women, a difference of 30.0%.
| Sex | Number | Average Earnings |
| Male | 989 (58.6%) | $37,760 |
| Female | 700 (41.4%) | $26,422 |
| Total | 1,689 (100.0%) | $33,676 |
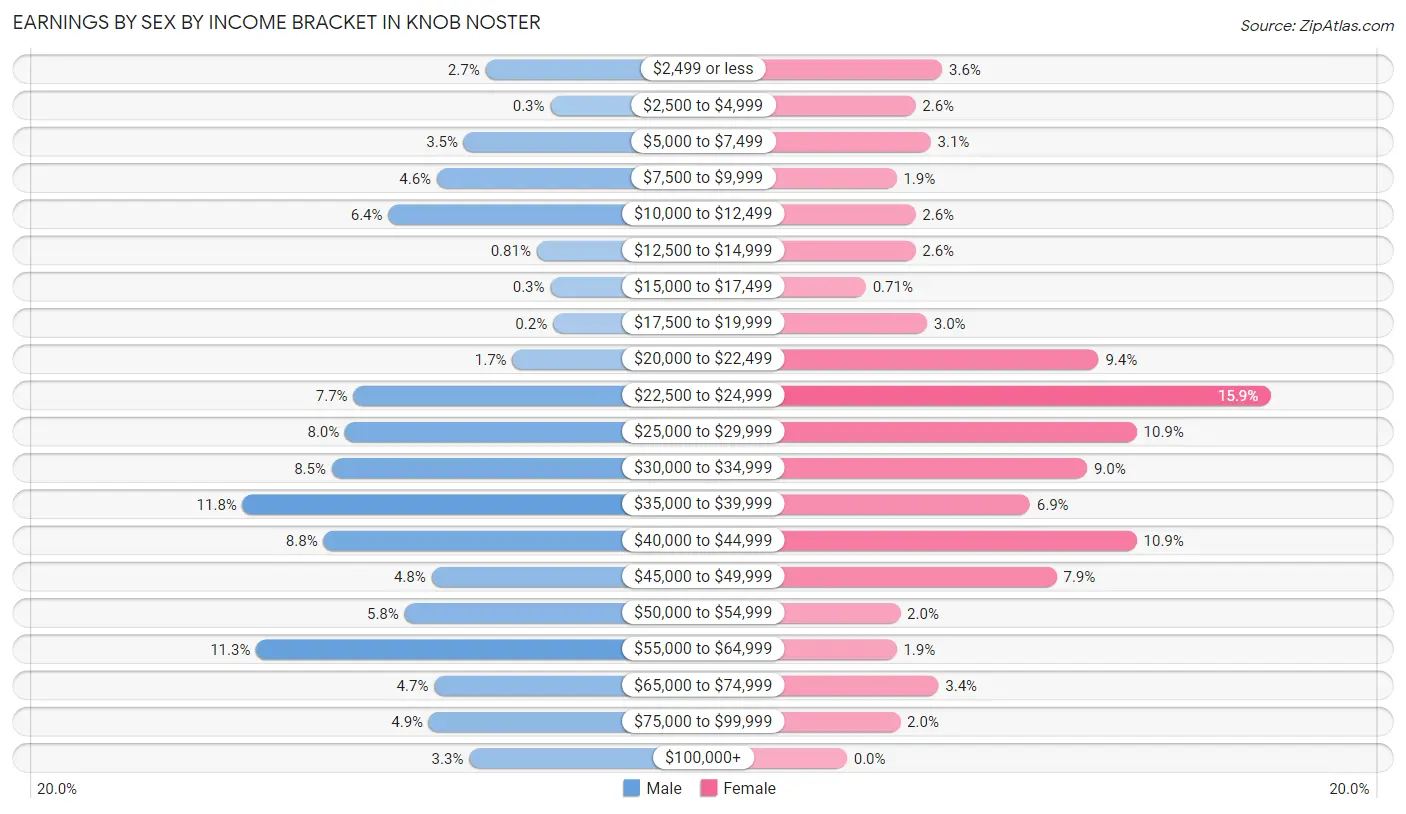
Earnings by Sex by Income Bracket in Knob Noster
The most common earnings brackets in Knob Noster are $35,000 to $39,999 for men (117 | 11.8%) and $22,500 to $24,999 for women (111 | 15.9%).
| Income | Male | Female |
| $2,499 or less | 27 (2.7%) | 25 (3.6%) |
| $2,500 to $4,999 | 3 (0.3%) | 18 (2.6%) |
| $5,000 to $7,499 | 35 (3.5%) | 22 (3.1%) |
| $7,500 to $9,999 | 45 (4.5%) | 13 (1.9%) |
| $10,000 to $12,499 | 63 (6.4%) | 18 (2.6%) |
| $12,500 to $14,999 | 8 (0.8%) | 18 (2.6%) |
| $15,000 to $17,499 | 3 (0.3%) | 5 (0.7%) |
| $17,500 to $19,999 | 2 (0.2%) | 21 (3.0%) |
| $20,000 to $22,499 | 17 (1.7%) | 66 (9.4%) |
| $22,500 to $24,999 | 76 (7.7%) | 111 (15.9%) |
| $25,000 to $29,999 | 79 (8.0%) | 76 (10.9%) |
| $30,000 to $34,999 | 84 (8.5%) | 63 (9.0%) |
| $35,000 to $39,999 | 117 (11.8%) | 48 (6.9%) |
| $40,000 to $44,999 | 87 (8.8%) | 76 (10.9%) |
| $45,000 to $49,999 | 47 (4.8%) | 55 (7.9%) |
| $50,000 to $54,999 | 57 (5.8%) | 14 (2.0%) |
| $55,000 to $64,999 | 112 (11.3%) | 13 (1.9%) |
| $65,000 to $74,999 | 46 (4.6%) | 24 (3.4%) |
| $75,000 to $99,999 | 48 (4.9%) | 14 (2.0%) |
| $100,000+ | 33 (3.3%) | 0 (0.0%) |
| Total | 989 (100.0%) | 700 (100.0%) |
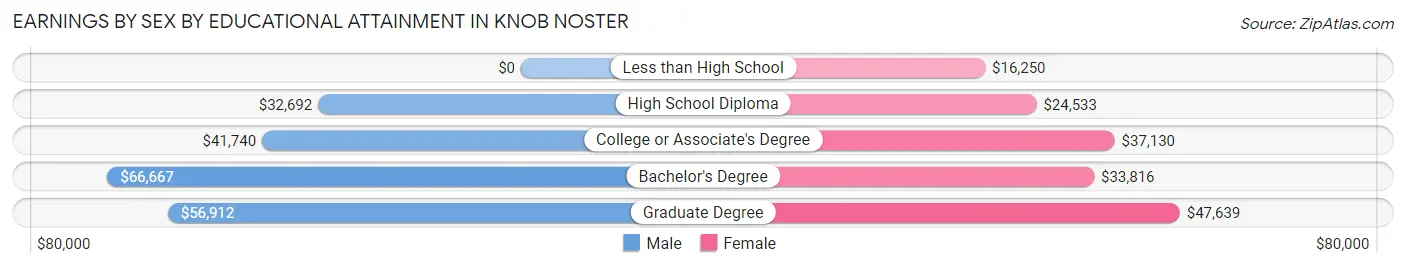
Earnings by Sex by Educational Attainment in Knob Noster
Average earnings in Knob Noster are $41,789 for men and $32,780 for women, a difference of 21.6%. Men with an educational attainment of bachelor's degree enjoy the highest average annual earnings of $66,667, while those with high school diploma education earn the least with $32,692. Women with an educational attainment of graduate degree earn the most with the average annual earnings of $47,639, while those with less than high school education have the smallest earnings of $16,250.
| Educational Attainment | Male Income | Female Income |
| Less than High School | - | - |
| High School Diploma | $32,692 | $24,533 |
| College or Associate's Degree | $41,740 | $37,130 |
| Bachelor's Degree | $66,667 | $33,816 |
| Graduate Degree | $56,912 | $47,639 |
| Total | $41,789 | $32,780 |
Family Income in Knob Noster
Family Income Brackets in Knob Noster
According to the Knob Noster family income data, there are 145 families falling into the $100,000 to $149,999 income range, which is the most common income bracket and makes up 24.8% of all families.
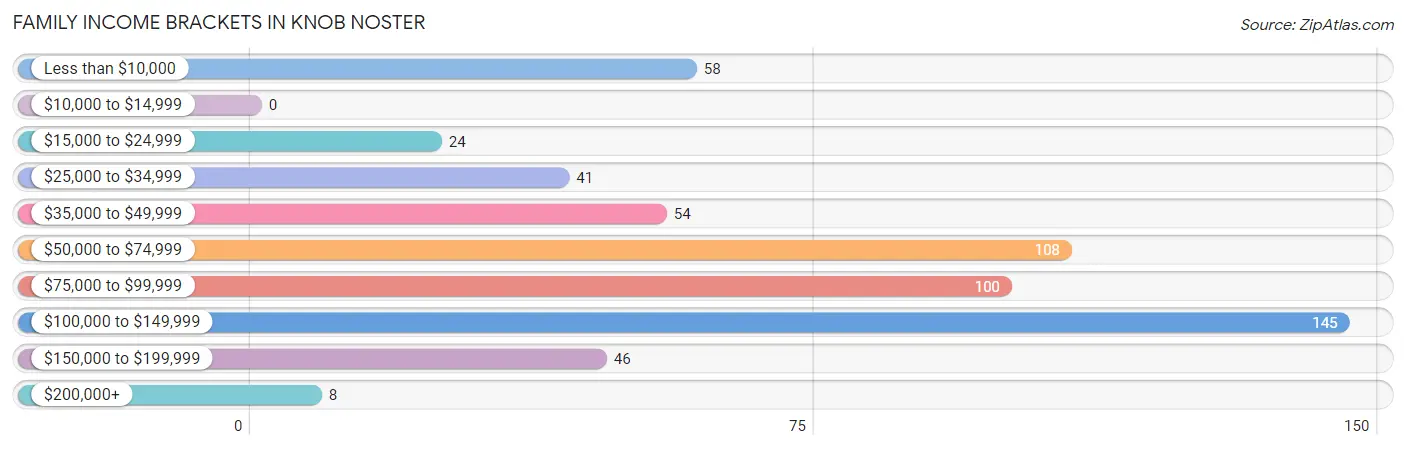
| Income Bracket | # Families | % Families |
| Less than $10,000 | 58 | 9.9% |
| $10,000 to $14,999 | 0 | 0.0% |
| $15,000 to $24,999 | 24 | 4.1% |
| $25,000 to $34,999 | 41 | 7.0% |
| $35,000 to $49,999 | 54 | 9.2% |
| $50,000 to $74,999 | 108 | 18.5% |
| $75,000 to $99,999 | 100 | 17.1% |
| $100,000 to $149,999 | 145 | 24.8% |
| $150,000 to $199,999 | 46 | 7.9% |
| $200,000+ | 8 | 1.4% |
Family Income by Famaliy Size in Knob Noster
5-person families (68 | 11.6%) account for the highest median family income in Knob Noster with $136,042 per family, while 2-person families (277 | 47.4%) have the highest median income of $30,693 per family member.
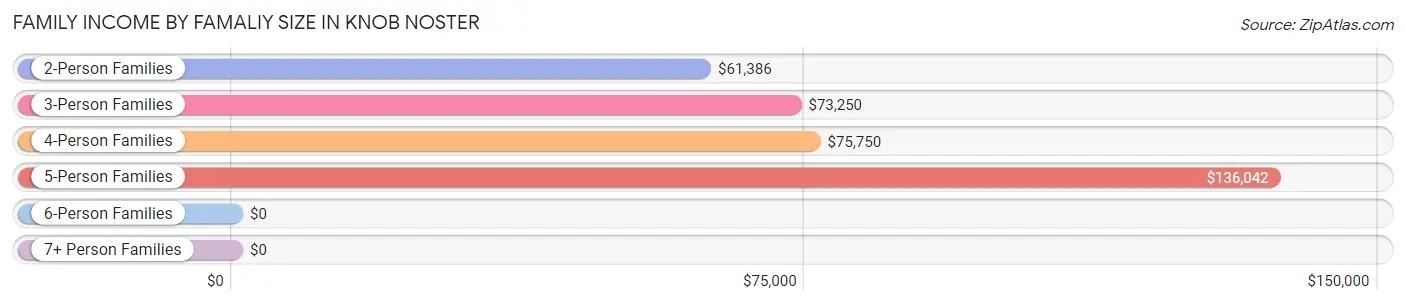
| Income Bracket | # Families | Median Income |
| 2-Person Families | 277 (47.4%) | $61,386 |
| 3-Person Families | 123 (21.1%) | $73,250 |
| 4-Person Families | 104 (17.8%) | $75,750 |
| 5-Person Families | 68 (11.6%) | $136,042 |
| 6-Person Families | 12 (2.1%) | $0 |
| 7+ Person Families | 0 (0.0%) | $0 |
| Total | 584 (100.0%) | $75,625 |
Family Income by Number of Earners in Knob Noster
The median family income in Knob Noster is $75,625, with families comprising 3+ earners (72) having the highest median family income of $136,979, while families with 1 earner (200) have the lowest median family income of $57,500, accounting for 12.3% and 34.3% of families, respectively.
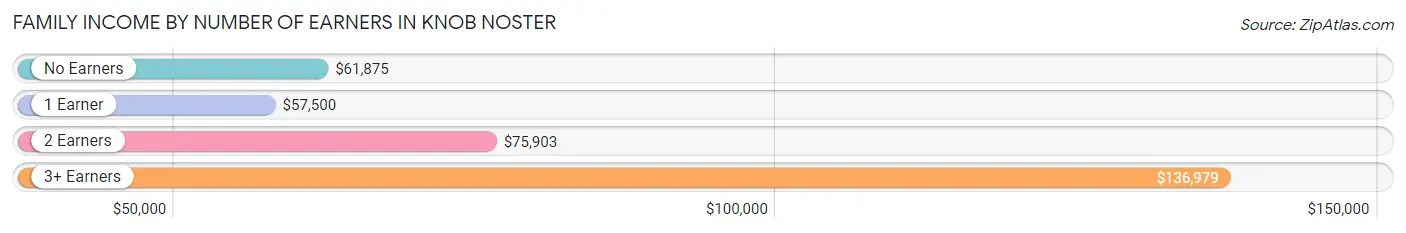
| Number of Earners | # Families | Median Income |
| No Earners | 77 (13.2%) | $61,875 |
| 1 Earner | 200 (34.3%) | $57,500 |
| 2 Earners | 235 (40.2%) | $75,903 |
| 3+ Earners | 72 (12.3%) | $136,979 |
| Total | 584 (100.0%) | $75,625 |
Household Income in Knob Noster
Household Income Brackets in Knob Noster
With 397 households falling in the category, the $35,000 to $49,999 income range is the most frequent in Knob Noster, accounting for 30.4% of all households. In contrast, only 8 households (0.6%) fall into the $200,000+ income bracket, making it the least populous group.
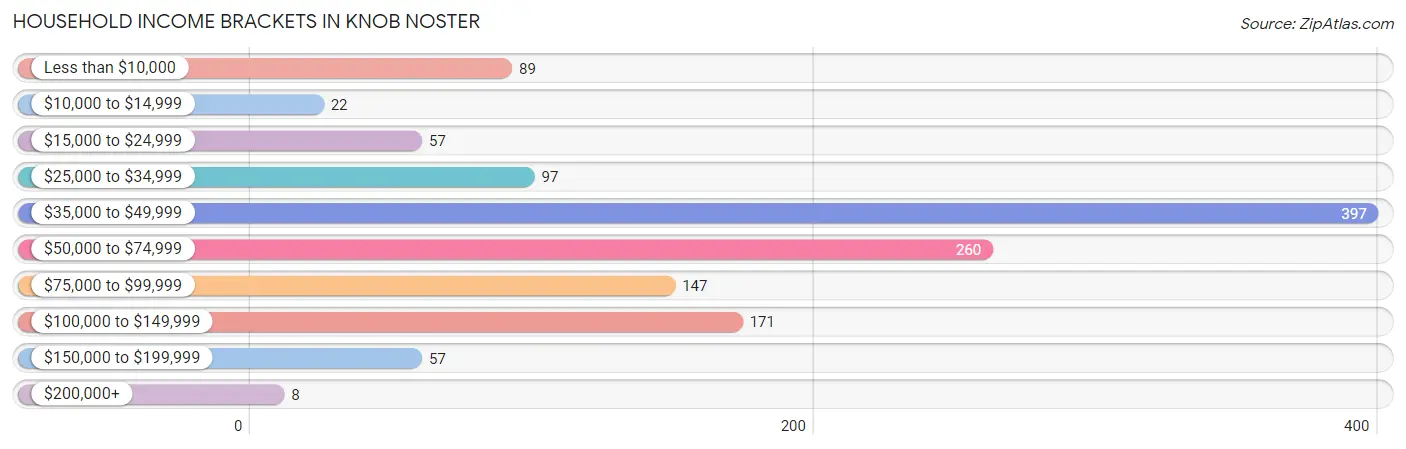
| Income Bracket | # Households | % Households |
| Less than $10,000 | 89 | 6.8% |
| $10,000 to $14,999 | 22 | 1.7% |
| $15,000 to $24,999 | 57 | 4.4% |
| $25,000 to $34,999 | 97 | 7.4% |
| $35,000 to $49,999 | 397 | 30.4% |
| $50,000 to $74,999 | 260 | 19.9% |
| $75,000 to $99,999 | 147 | 11.3% |
| $100,000 to $149,999 | 171 | 13.1% |
| $150,000 to $199,999 | 57 | 4.4% |
| $200,000+ | 8 | 0.6% |
Household Income by Householder Age in Knob Noster
The median household income in Knob Noster is $49,640, with the highest median household income of $85,179 found in the 45 to 64 years age bracket for the primary householder. A total of 311 households (23.8%) fall into this category. Meanwhile, the 15 to 24 years age bracket for the primary householder has the lowest median household income of $40,125, with 241 households (18.5%) in this group.
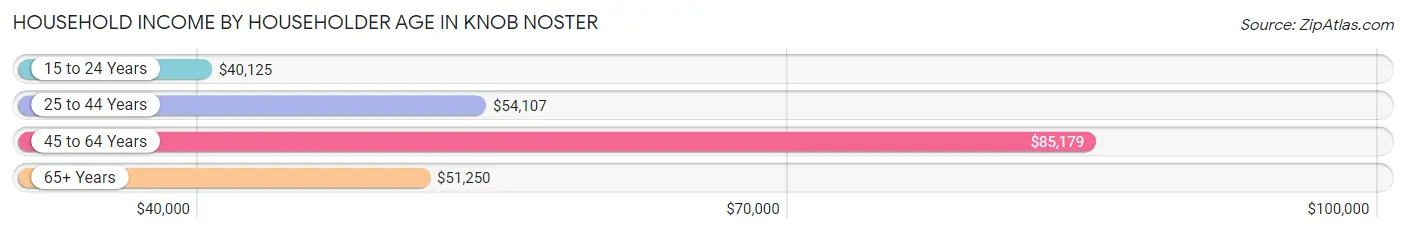
| Income Bracket | # Households | Median Income |
| 15 to 24 Years | 241 (18.5%) | $40,125 |
| 25 to 44 Years | 533 (40.8%) | $54,107 |
| 45 to 64 Years | 311 (23.8%) | $85,179 |
| 65+ Years | 220 (16.9%) | $51,250 |
| Total | 1,305 (100.0%) | $49,640 |
Poverty in Knob Noster
Income Below Poverty by Sex and Age in Knob Noster
With 12.3% poverty level for males and 9.9% for females among the residents of Knob Noster, under 5 year old males and 18 to 24 year old females are the most vulnerable to poverty, with 42 males (41.6%) and 64 females (40.5%) in their respective age groups living below the poverty level.
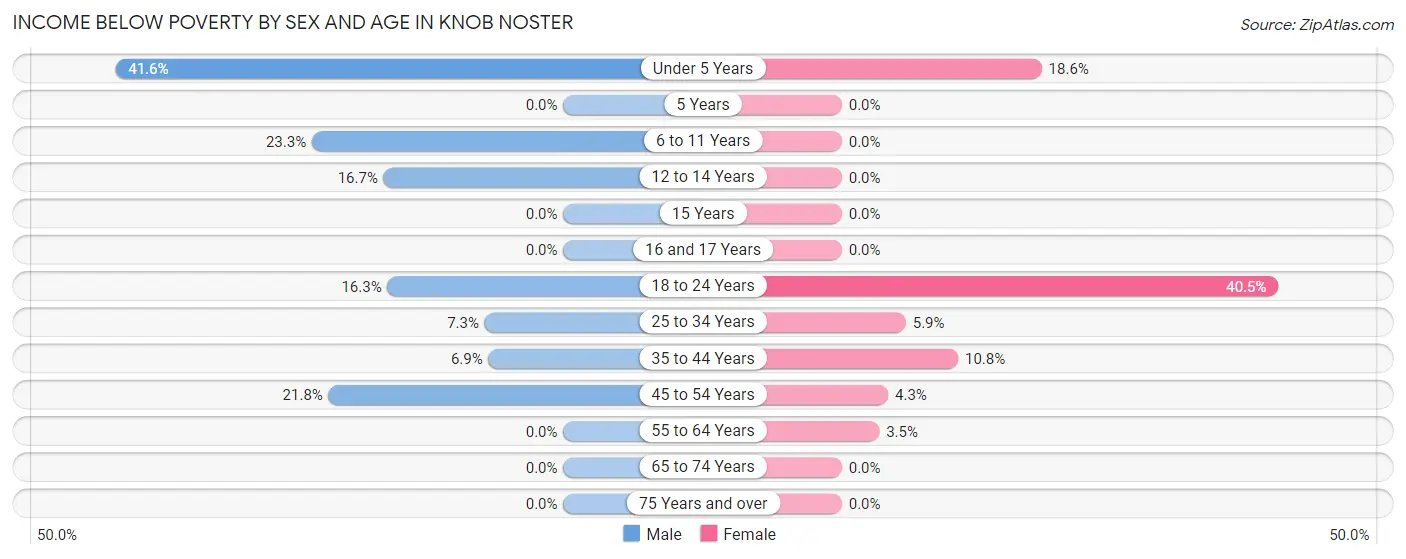
| Age Bracket | Male | Female |
| Under 5 Years | 42 (41.6%) | 23 (18.5%) |
| 5 Years | 0 (0.0%) | 0 (0.0%) |
| 6 to 11 Years | 7 (23.3%) | 0 (0.0%) |
| 12 to 14 Years | 13 (16.7%) | 0 (0.0%) |
| 15 Years | 0 (0.0%) | 0 (0.0%) |
| 16 and 17 Years | 0 (0.0%) | 0 (0.0%) |
| 18 to 24 Years | 55 (16.3%) | 64 (40.5%) |
| 25 to 34 Years | 25 (7.3%) | 18 (5.9%) |
| 35 to 44 Years | 15 (6.9%) | 15 (10.8%) |
| 45 to 54 Years | 22 (21.8%) | 4 (4.3%) |
| 55 to 64 Years | 0 (0.0%) | 5 (3.5%) |
| 65 to 74 Years | 0 (0.0%) | 0 (0.0%) |
| 75 Years and over | 0 (0.0%) | 0 (0.0%) |
| Total | 179 (12.3%) | 129 (9.9%) |
Income Above Poverty by Sex and Age in Knob Noster
According to the poverty statistics in Knob Noster, males aged 16 and 17 years and females aged 6 to 11 years are the age groups that are most secure financially, with 100.0% of males and 100.0% of females in these age groups living above the poverty line.
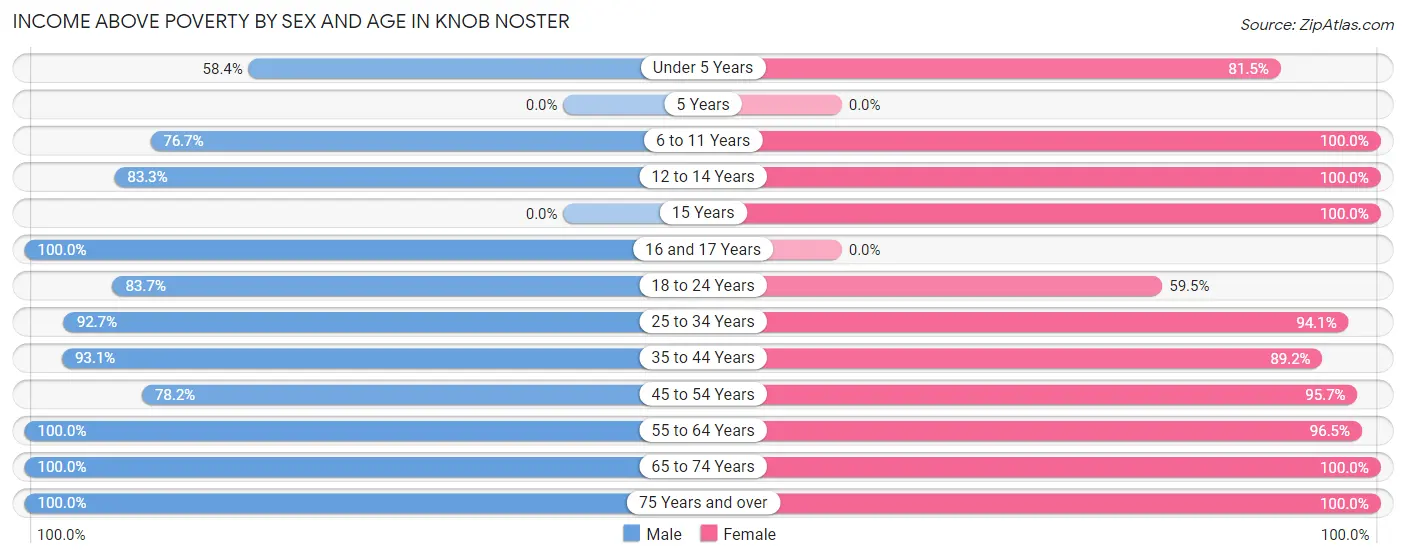
| Age Bracket | Male | Female |
| Under 5 Years | 59 (58.4%) | 101 (81.5%) |
| 5 Years | 0 (0.0%) | 0 (0.0%) |
| 6 to 11 Years | 23 (76.7%) | 102 (100.0%) |
| 12 to 14 Years | 65 (83.3%) | 35 (100.0%) |
| 15 Years | 0 (0.0%) | 20 (100.0%) |
| 16 and 17 Years | 13 (100.0%) | 0 (0.0%) |
| 18 to 24 Years | 282 (83.7%) | 94 (59.5%) |
| 25 to 34 Years | 318 (92.7%) | 285 (94.1%) |
| 35 to 44 Years | 201 (93.1%) | 124 (89.2%) |
| 45 to 54 Years | 79 (78.2%) | 89 (95.7%) |
| 55 to 64 Years | 122 (100.0%) | 139 (96.5%) |
| 65 to 74 Years | 61 (100.0%) | 85 (100.0%) |
| 75 Years and over | 56 (100.0%) | 105 (100.0%) |
| Total | 1,279 (87.7%) | 1,179 (90.1%) |
Income Below Poverty Among Married-Couple Families in Knob Noster
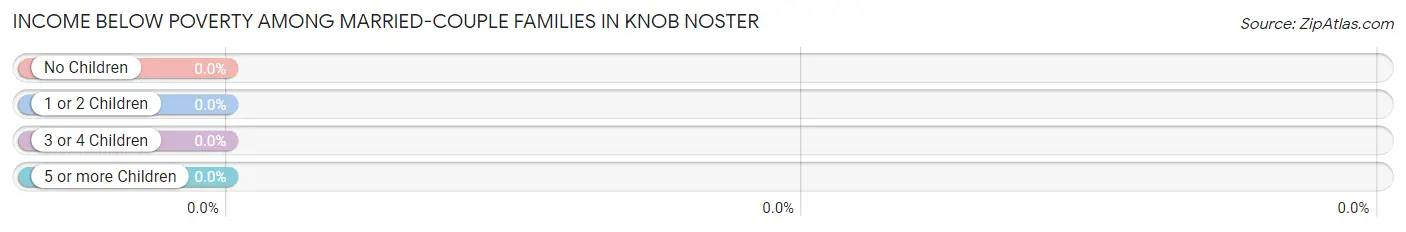
| Children | Above Poverty | Below Poverty |
| No Children | 215 (100.0%) | 0 (0.0%) |
| 1 or 2 Children | 95 (100.0%) | 0 (0.0%) |
| 3 or 4 Children | 47 (100.0%) | 0 (0.0%) |
| 5 or more Children | 0 (0.0%) | 0 (0.0%) |
| Total | 357 (100.0%) | 0 (0.0%) |
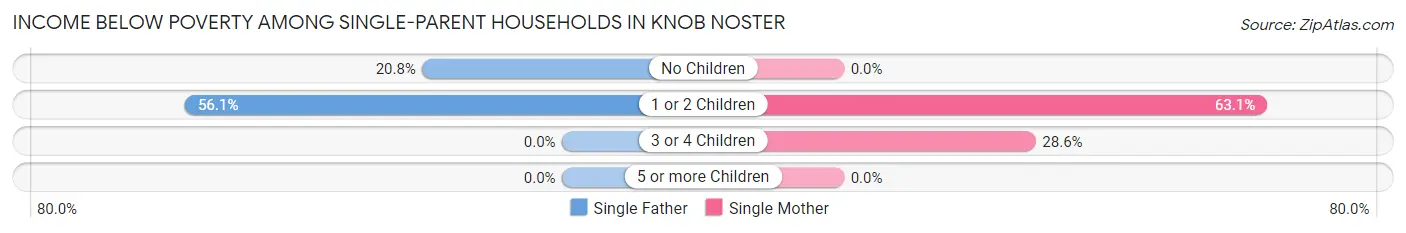
Income Below Poverty Among Single-Parent Households in Knob Noster
According to the poverty data in Knob Noster, 33.6% or 38 single-father households and 41.2% or 47 single-mother households are living below the poverty line. Among single-father households, those with 1 or 2 children have the highest poverty rate, with 23 households (56.1%) experiencing poverty. Likewise, among single-mother households, those with 1 or 2 children have the highest poverty rate, with 41 households (63.1%) falling below the poverty line.
| Children | Single Father | Single Mother |
| No Children | 15 (20.8%) | 0 (0.0%) |
| 1 or 2 Children | 23 (56.1%) | 41 (63.1%) |
| 3 or 4 Children | 0 (0.0%) | 6 (28.6%) |
| 5 or more Children | 0 (0.0%) | 0 (0.0%) |
| Total | 38 (33.6%) | 47 (41.2%) |
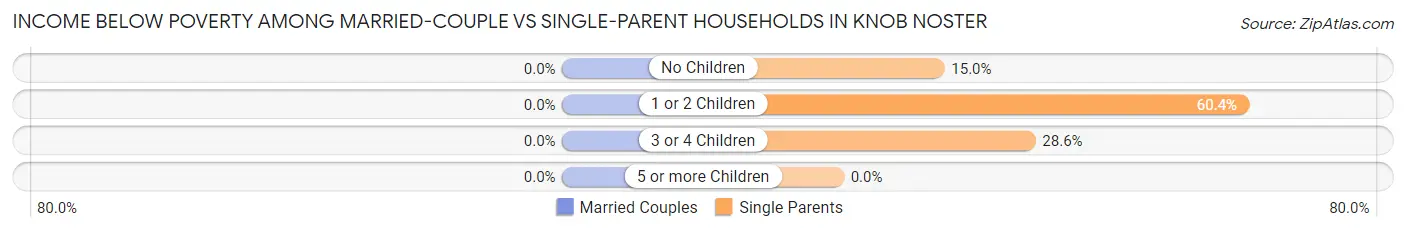
Income Below Poverty Among Married-Couple vs Single-Parent Households in Knob Noster
| Children | Married-Couple Families | Single-Parent Households |
| No Children | 0 (0.0%) | 15 (15.0%) |
| 1 or 2 Children | 0 (0.0%) | 64 (60.4%) |
| 3 or 4 Children | 0 (0.0%) | 6 (28.6%) |
| 5 or more Children | 0 (0.0%) | 0 (0.0%) |
| Total | 0 (0.0%) | 85 (37.4%) |
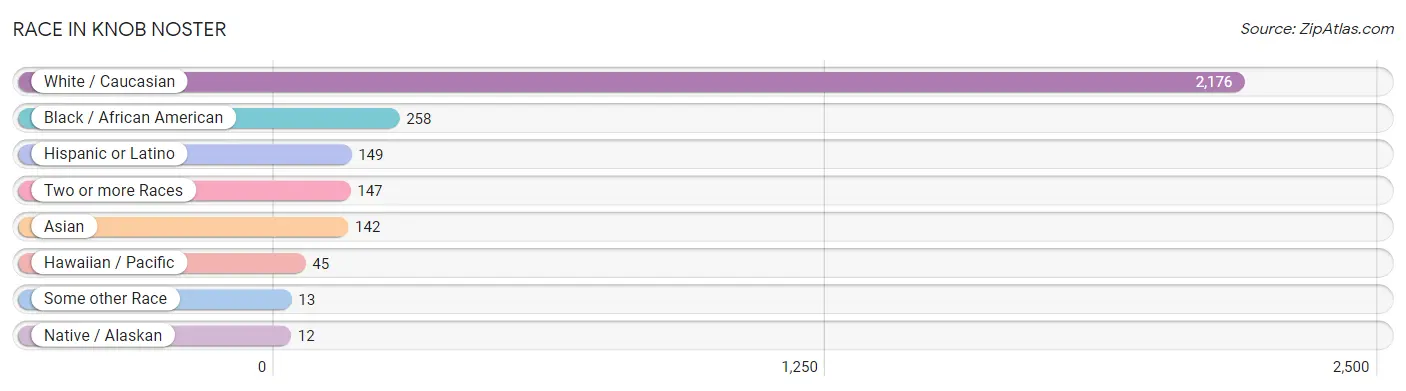
Race in Knob Noster
The most populous races in Knob Noster are White / Caucasian (2,176 | 77.9%), Black / African American (258 | 9.2%), and Hispanic or Latino (149 | 5.3%).
| Race | # Population | % Population |
| Asian | 142 | 5.1% |
| Black / African American | 258 | 9.2% |
| Hawaiian / Pacific | 45 | 1.6% |
| Hispanic or Latino | 149 | 5.3% |
| Native / Alaskan | 12 | 0.4% |
| White / Caucasian | 2,176 | 77.9% |
| Two or more Races | 147 | 5.3% |
| Some other Race | 13 | 0.5% |
| Total | 2,793 | 100.0% |
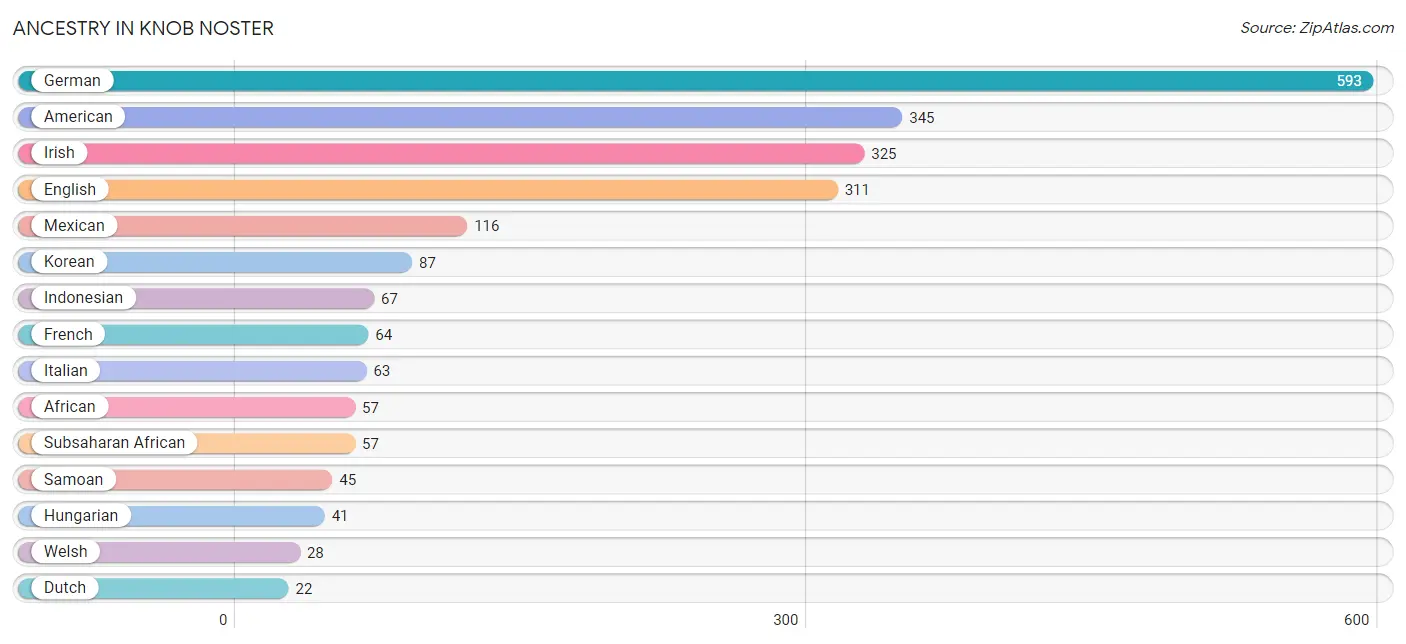
Ancestry in Knob Noster
The most populous ancestries reported in Knob Noster are German (593 | 21.2%), American (345 | 12.3%), Irish (325 | 11.6%), English (311 | 11.1%), and Mexican (116 | 4.2%), together accounting for 60.5% of all Knob Noster residents.
| Ancestry | # Population | % Population |
| African | 57 | 2.0% |
| American | 345 | 12.3% |
| Bhutanese | 12 | 0.4% |
| British | 3 | 0.1% |
| Cherokee | 3 | 0.1% |
| Chippewa | 6 | 0.2% |
| Cuban | 15 | 0.5% |
| Danish | 3 | 0.1% |
| Dutch | 22 | 0.8% |
| English | 311 | 11.1% |
| European | 21 | 0.7% |
| French | 64 | 2.3% |
| German | 593 | 21.2% |
| Hungarian | 41 | 1.5% |
| Indian (Asian) | 7 | 0.3% |
| Indonesian | 67 | 2.4% |
| Irish | 325 | 11.6% |
| Italian | 63 | 2.3% |
| Jamaican | 10 | 0.4% |
| Korean | 87 | 3.1% |
| Mexican | 116 | 4.2% |
| Native Hawaiian | 12 | 0.4% |
| Norwegian | 4 | 0.1% |
| Pakistani | 19 | 0.7% |
| Pennsylvania German | 5 | 0.2% |
| Puerto Rican | 18 | 0.6% |
| Samoan | 45 | 1.6% |
| Scotch-Irish | 12 | 0.4% |
| Scottish | 16 | 0.6% |
| Subsaharan African | 57 | 2.0% |
| Swedish | 17 | 0.6% |
| Thai | 7 | 0.3% |
| Welsh | 28 | 1.0% | View All 33 Rows |
Immigrants in Knob Noster
The most numerous immigrant groups reported in Knob Noster came from Asia (73 | 2.6%), South Eastern Asia (66 | 2.4%), Oceania (45 | 1.6%), Eastern Europe (35 | 1.3%), and Europe (35 | 1.3%), together accounting for 9.1% of all Knob Noster residents.
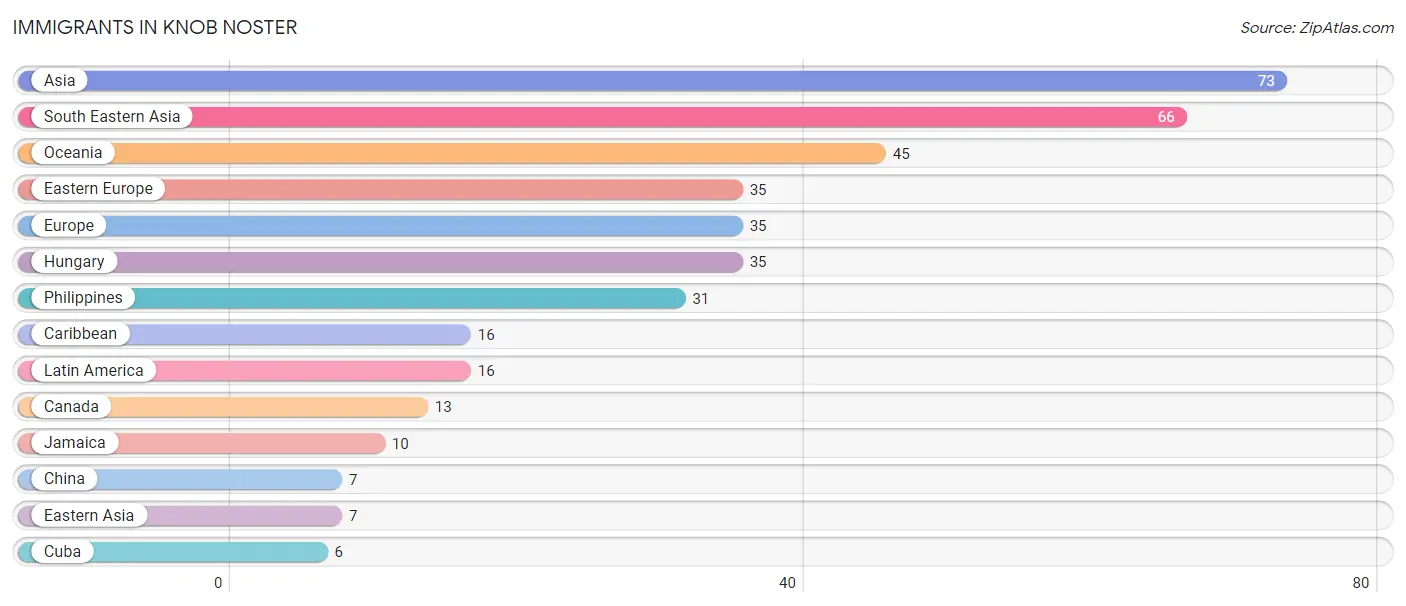
| Immigration Origin | # Population | % Population |
| Asia | 73 | 2.6% |
| Canada | 13 | 0.5% |
| Caribbean | 16 | 0.6% |
| China | 7 | 0.3% |
| Cuba | 6 | 0.2% |
| Eastern Asia | 7 | 0.3% |
| Eastern Europe | 35 | 1.3% |
| Europe | 35 | 1.3% |
| Hungary | 35 | 1.3% |
| Jamaica | 10 | 0.4% |
| Latin America | 16 | 0.6% |
| Oceania | 45 | 1.6% |
| Philippines | 31 | 1.1% |
| South Eastern Asia | 66 | 2.4% | View All 14 Rows |
Sex and Age in Knob Noster
Sex and Age in Knob Noster
The most populous age groups in Knob Noster are 20 to 24 Years (316 | 21.7%) for men and 25 to 29 Years (167 | 12.5%) for women.
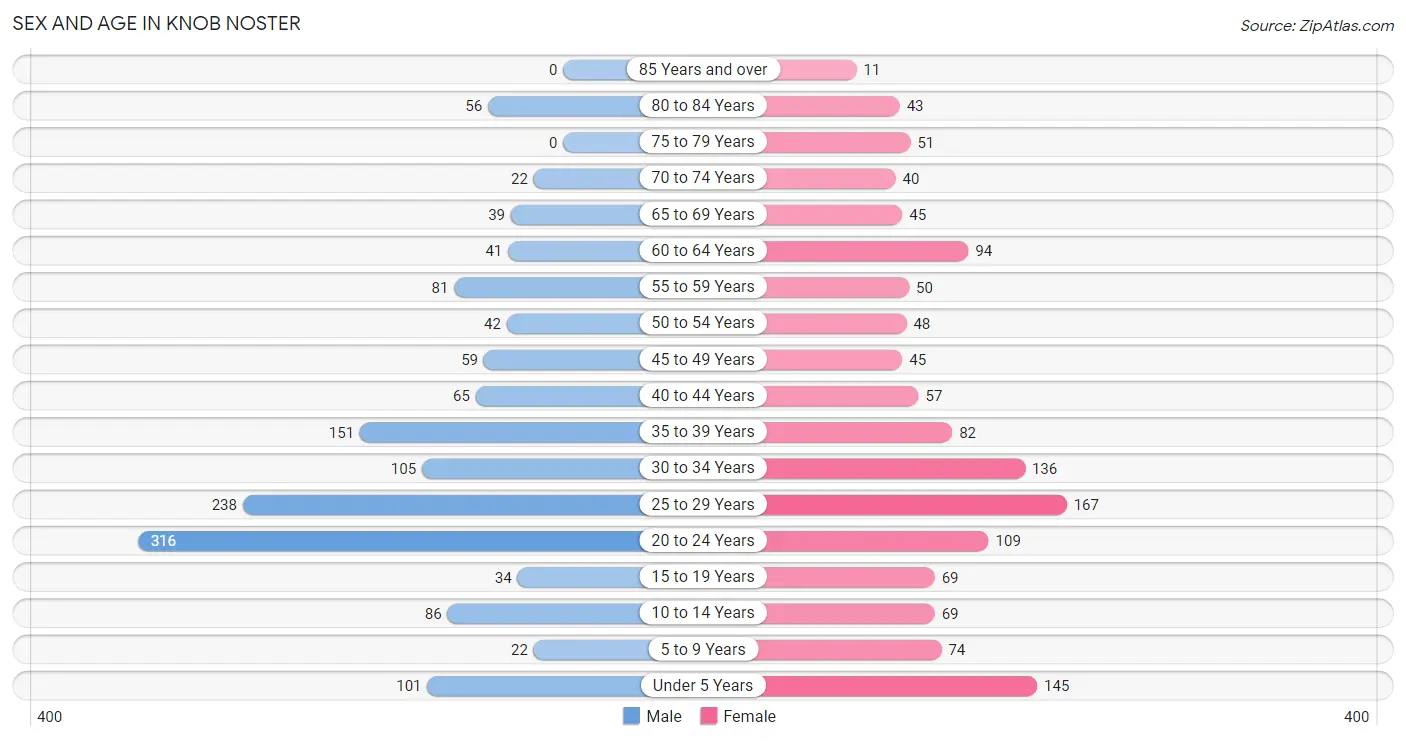
| Age Bracket | Male | Female |
| Under 5 Years | 101 (6.9%) | 145 (10.9%) |
| 5 to 9 Years | 22 (1.5%) | 74 (5.5%) |
| 10 to 14 Years | 86 (5.9%) | 69 (5.2%) |
| 15 to 19 Years | 34 (2.3%) | 69 (5.2%) |
| 20 to 24 Years | 316 (21.7%) | 109 (8.2%) |
| 25 to 29 Years | 238 (16.3%) | 167 (12.5%) |
| 30 to 34 Years | 105 (7.2%) | 136 (10.2%) |
| 35 to 39 Years | 151 (10.4%) | 82 (6.1%) |
| 40 to 44 Years | 65 (4.5%) | 57 (4.3%) |
| 45 to 49 Years | 59 (4.1%) | 45 (3.4%) |
| 50 to 54 Years | 42 (2.9%) | 48 (3.6%) |
| 55 to 59 Years | 81 (5.6%) | 50 (3.7%) |
| 60 to 64 Years | 41 (2.8%) | 94 (7.0%) |
| 65 to 69 Years | 39 (2.7%) | 45 (3.4%) |
| 70 to 74 Years | 22 (1.5%) | 40 (3.0%) |
| 75 to 79 Years | 0 (0.0%) | 51 (3.8%) |
| 80 to 84 Years | 56 (3.8%) | 43 (3.2%) |
| 85 Years and over | 0 (0.0%) | 11 (0.8%) |
| Total | 1,458 (100.0%) | 1,335 (100.0%) |
Families and Households in Knob Noster
Median Family Size in Knob Noster
The median family size in Knob Noster is 3.20 persons per family, with single female/mother families (114 | 19.5%) accounting for the largest median family size of 3.76 persons per family. On the other hand, single male/father families (113 | 19.4%) represent the smallest median family size with 2.60 persons per family.
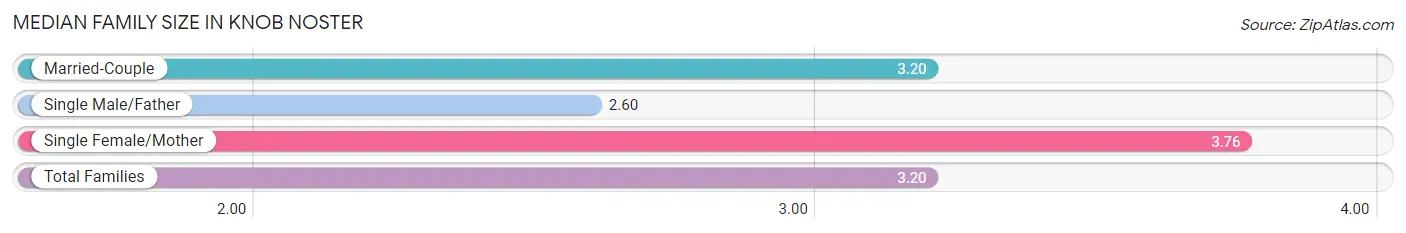
| Family Type | # Families | Family Size |
| Married-Couple | 357 (61.1%) | 3.20 |
| Single Male/Father | 113 (19.4%) | 2.60 |
| Single Female/Mother | 114 (19.5%) | 3.76 |
| Total Families | 584 (100.0%) | 3.20 |
Median Household Size in Knob Noster
The median household size in Knob Noster is 2.14 persons per household, with single female/mother households (114 | 8.7%) accounting for the largest median household size of 4.11 persons per household. non-family households (721 | 55.2%) represent the smallest median household size with 1.17 persons per household.
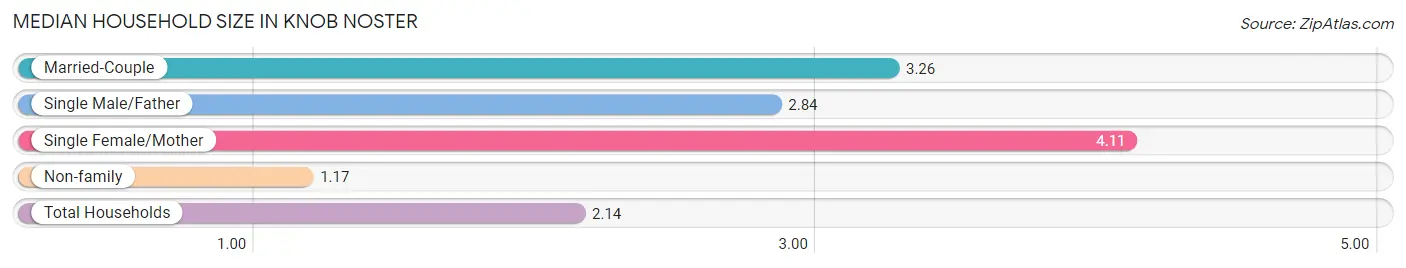
| Household Type | # Households | Household Size |
| Married-Couple | 357 (27.4%) | 3.26 |
| Single Male/Father | 113 (8.7%) | 2.84 |
| Single Female/Mother | 114 (8.7%) | 4.11 |
| Non-family | 721 (55.2%) | 1.17 |
| Total Households | 1,305 (100.0%) | 2.14 |
Household Size by Marriage Status in Knob Noster
Out of a total of 1,305 households in Knob Noster, 584 (44.8%) are family households, while 721 (55.2%) are nonfamily households. The most numerous type of family households are 2-person households, comprising 229, and the most common type of nonfamily households are 1-person households, comprising 590.
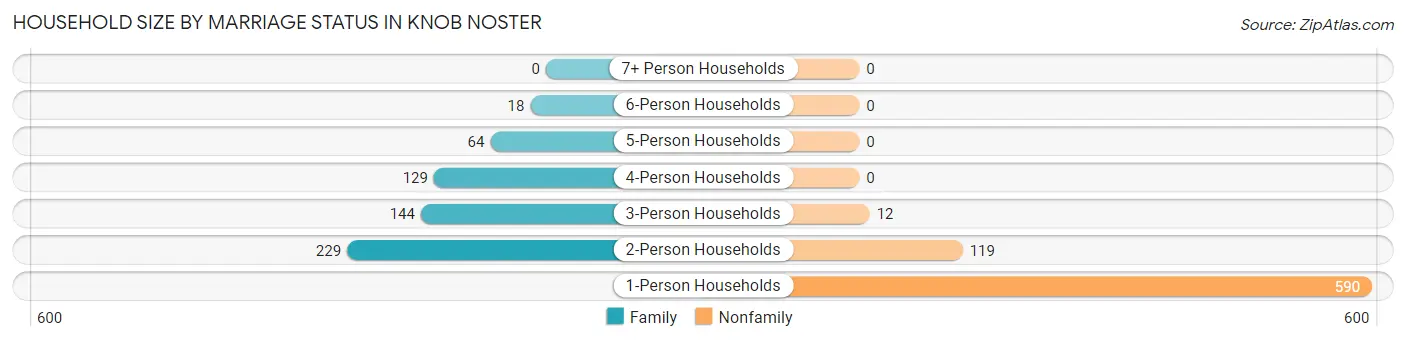
| Household Size | Family Households | Nonfamily Households |
| 1-Person Households | - | 590 (45.2%) |
| 2-Person Households | 229 (17.5%) | 119 (9.1%) |
| 3-Person Households | 144 (11.0%) | 12 (0.9%) |
| 4-Person Households | 129 (9.9%) | 0 (0.0%) |
| 5-Person Households | 64 (4.9%) | 0 (0.0%) |
| 6-Person Households | 18 (1.4%) | 0 (0.0%) |
| 7+ Person Households | 0 (0.0%) | 0 (0.0%) |
| Total | 584 (44.8%) | 721 (55.2%) |
Female Fertility in Knob Noster
Fertility by Age in Knob Noster
Average fertility rate in Knob Noster is 90.0 births per 1,000 women. Women in the age bracket of 15 to 19 years have the highest fertility rate with 449.0 births per 1,000 women. Women in the age bracket of 15 to 19 years acount for 50.8% of all women with births.
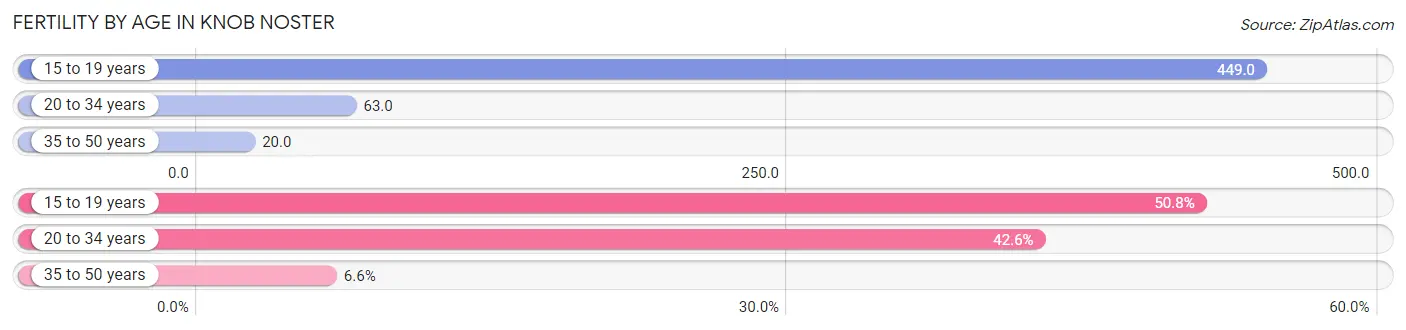
| Age Bracket | Women with Births | Births / 1,000 Women |
| 15 to 19 years | 31 (50.8%) | 449.0 |
| 20 to 34 years | 26 (42.6%) | 63.0 |
| 35 to 50 years | 4 (6.6%) | 20.0 |
| Total | 61 (100.0%) | 90.0 |
Fertility by Age by Marriage Status in Knob Noster
27.9% of women with births (61) in Knob Noster are married. The highest percentage of unmarried women with births falls into 15 to 19 years age bracket with 100.0% of them unmarried at the time of birth, while the lowest percentage of unmarried women with births belong to 35 to 50 years age bracket with 0.0% of them unmarried.
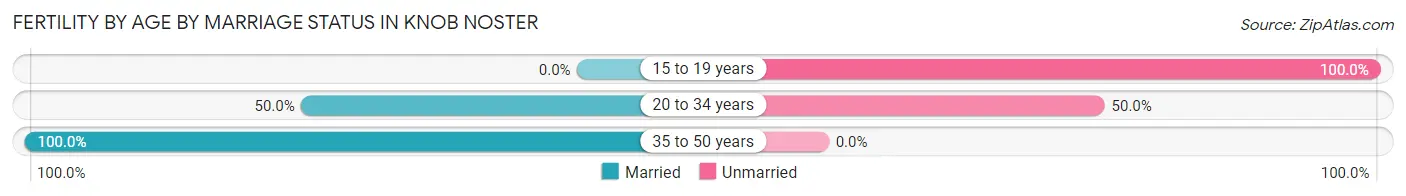
| Age Bracket | Married | Unmarried |
| 15 to 19 years | 0 (0.0%) | 31 (100.0%) |
| 20 to 34 years | 13 (50.0%) | 13 (50.0%) |
| 35 to 50 years | 4 (100.0%) | 0 (0.0%) |
| Total | 17 (27.9%) | 44 (72.1%) |
Fertility by Education in Knob Noster
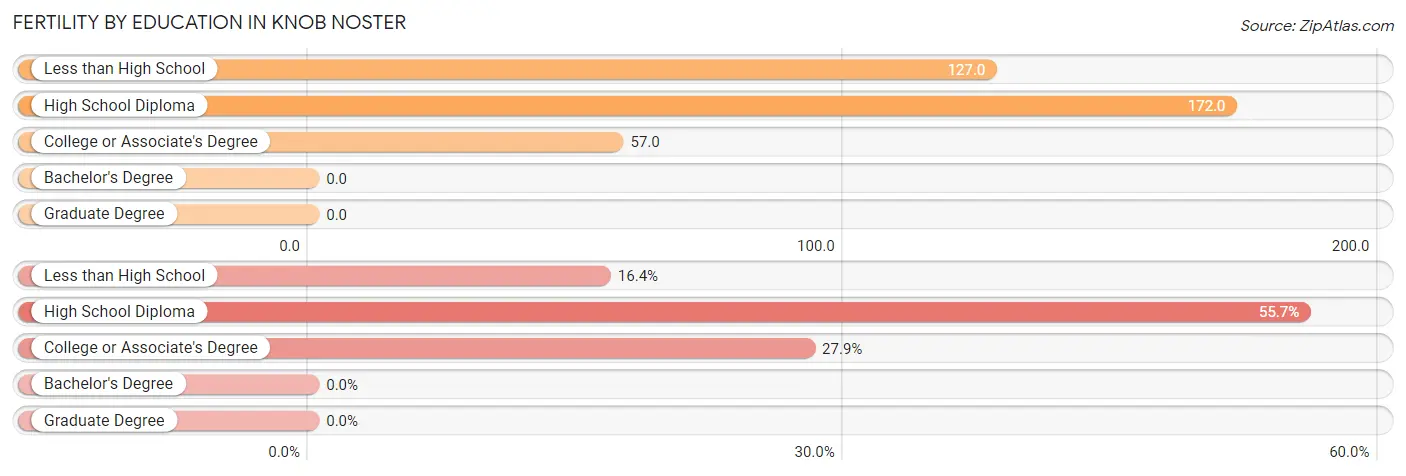
| Educational Attainment | Women with Births | Births / 1,000 Women |
| Less than High School | 10 (16.4%) | 127.0 |
| High School Diploma | 34 (55.7%) | 172.0 |
| College or Associate's Degree | 17 (27.9%) | 57.0 |
| Bachelor's Degree | 0 (0.0%) | 0.0 |
| Graduate Degree | 0 (0.0%) | 0.0 |
| Total | 61 (100.0%) | 90.0 |
Fertility by Education by Marriage Status in Knob Noster
72.1% of women with births in Knob Noster are unmarried. Women with the educational attainment of college or associate's degree are most likely to be married with 100.0% of them married at childbirth, while women with the educational attainment of less than high school are least likely to be married with 100.0% of them unmarried at childbirth.
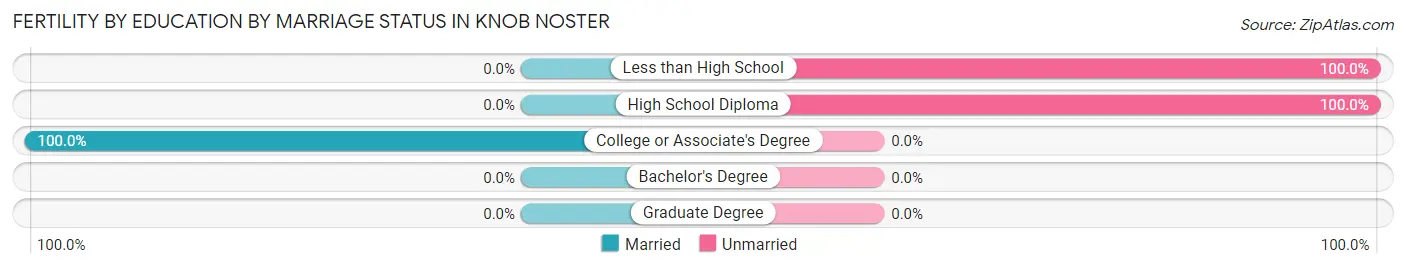
| Educational Attainment | Married | Unmarried |
| Less than High School | 0 (0.0%) | 10 (100.0%) |
| High School Diploma | 0 (0.0%) | 34 (100.0%) |
| College or Associate's Degree | 17 (100.0%) | 0 (0.0%) |
| Bachelor's Degree | 0 (0.0%) | 0 (0.0%) |
| Graduate Degree | 0 (0.0%) | 0 (0.0%) |
| Total | 17 (27.9%) | 44 (72.1%) |
Employment Characteristics in Knob Noster
Employment by Class of Employer in Knob Noster
Among the 1,528 employed individuals in Knob Noster, private company employees (739 | 48.4%), federal government employees (529 | 34.6%), and not-for-profit organizations (100 | 6.5%) make up the most common classes of employment.
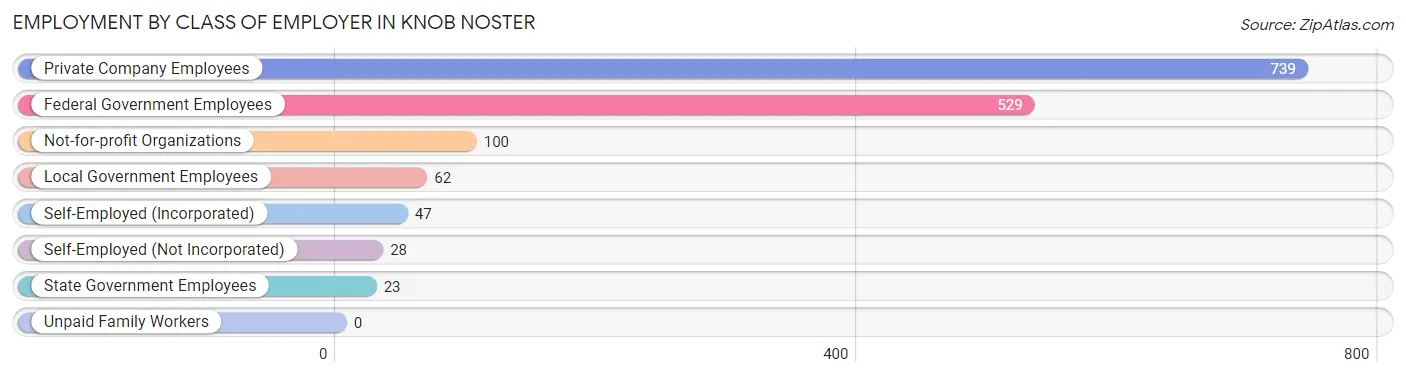
| Employer Class | # Employees | % Employees |
| Private Company Employees | 739 | 48.4% |
| Self-Employed (Incorporated) | 47 | 3.1% |
| Self-Employed (Not Incorporated) | 28 | 1.8% |
| Not-for-profit Organizations | 100 | 6.5% |
| Local Government Employees | 62 | 4.1% |
| State Government Employees | 23 | 1.5% |
| Federal Government Employees | 529 | 34.6% |
| Unpaid Family Workers | 0 | 0.0% |
| Total | 1,528 | 100.0% |
Employment Status by Age in Knob Noster
According to the labor force statistics for Knob Noster, out of the total population over 16 years of age (2,276), 72.5% or 1,650 individuals are in the labor force, with 8.9% or 147 of them unemployed. The age group with the highest labor force participation rate is 20 to 24 years, with 91.1% or 387 individuals in the labor force. Within the labor force, the 35 to 44 years age range has the highest percentage of unemployed individuals, with 28.6% or 81 of them being unemployed.
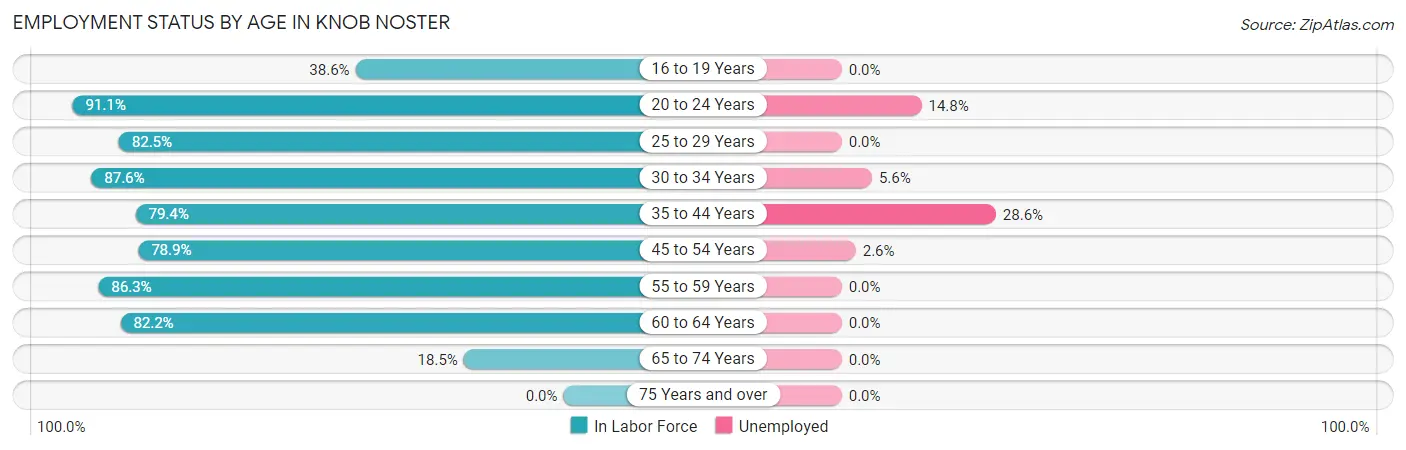
| Age Bracket | In Labor Force | Unemployed |
| 16 to 19 Years | 32 (38.6%) | 0 (0.0%) |
| 20 to 24 Years | 387 (91.1%) | 57 (14.8%) |
| 25 to 29 Years | 334 (82.5%) | 0 (0.0%) |
| 30 to 34 Years | 211 (87.6%) | 12 (5.6%) |
| 35 to 44 Years | 282 (79.4%) | 81 (28.6%) |
| 45 to 54 Years | 153 (78.9%) | 4 (2.6%) |
| 55 to 59 Years | 113 (86.3%) | 0 (0.0%) |
| 60 to 64 Years | 111 (82.2%) | 0 (0.0%) |
| 65 to 74 Years | 27 (18.5%) | 0 (0.0%) |
| 75 Years and over | 0 (0.0%) | 0 (0.0%) |
| Total | 1,650 (72.5%) | 147 (8.9%) |
Employment Status by Educational Attainment in Knob Noster
According to labor force statistics for Knob Noster, 82.4% of individuals (1,204) out of the total population between 25 and 64 years of age (1,461) are in the labor force, with 7.8% or 94 of them being unemployed. The group with the highest labor force participation rate are those with the educational attainment of less than high school, with 97.6% or 82 individuals in the labor force. Within the labor force, individuals with bachelor's degree or higher education have the highest percentage of unemployment, with 19.3% or 44 of them being unemployed.
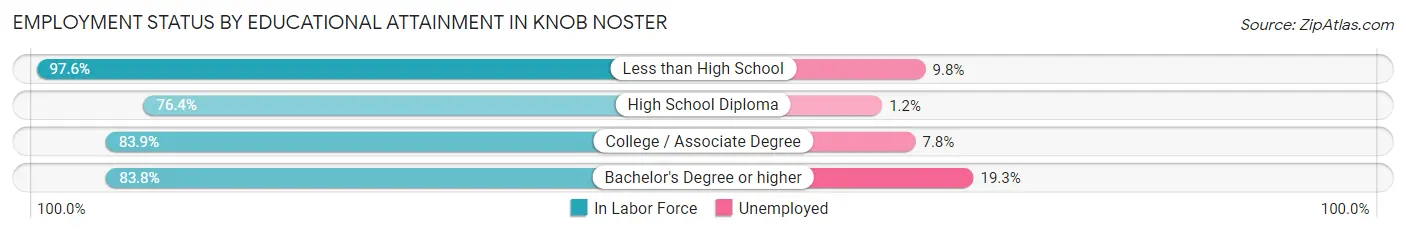
| Educational Attainment | In Labor Force | Unemployed |
| Less than High School | 82 (97.6%) | 8 (9.8%) |
| High School Diploma | 334 (76.4%) | 5 (1.2%) |
| College / Associate Degree | 561 (83.9%) | 52 (7.8%) |
| Bachelor's Degree or higher | 227 (83.8%) | 52 (19.3%) |
| Total | 1,204 (82.4%) | 114 (7.8%) |
Employment Occupations by Sex in Knob Noster
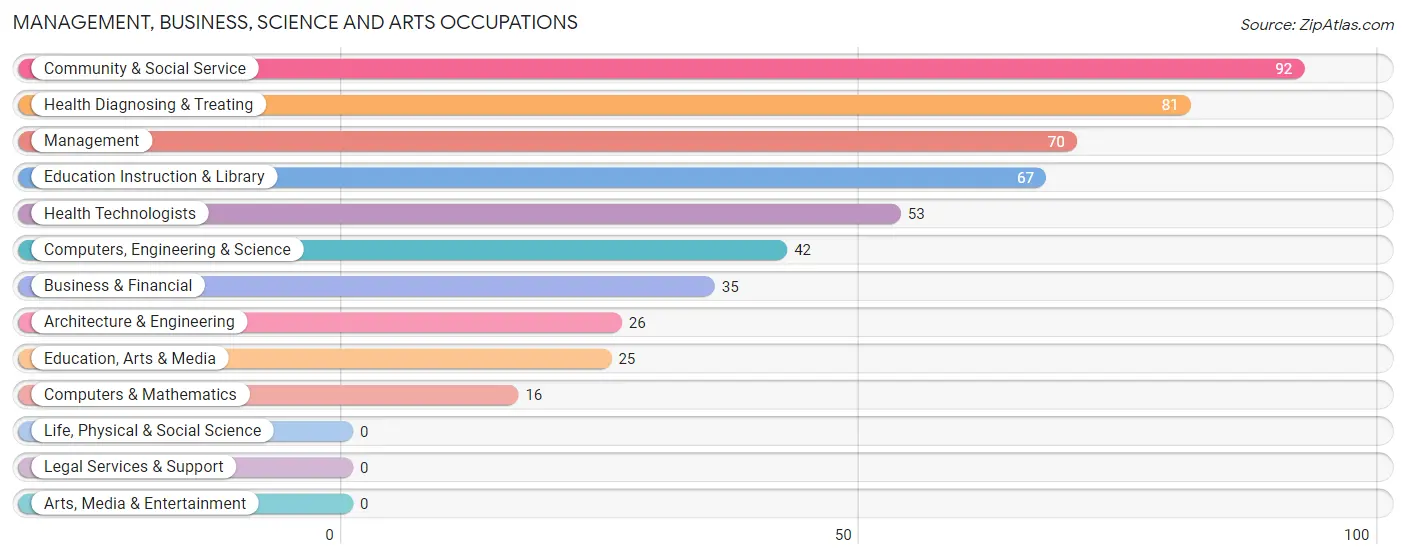
Management, Business, Science and Arts Occupations
The most common Management, Business, Science and Arts occupations in Knob Noster are Community & Social Service (92 | 7.9%), Health Diagnosing & Treating (81 | 6.9%), Management (70 | 6.0%), Education Instruction & Library (67 | 5.7%), and Health Technologists (53 | 4.5%).
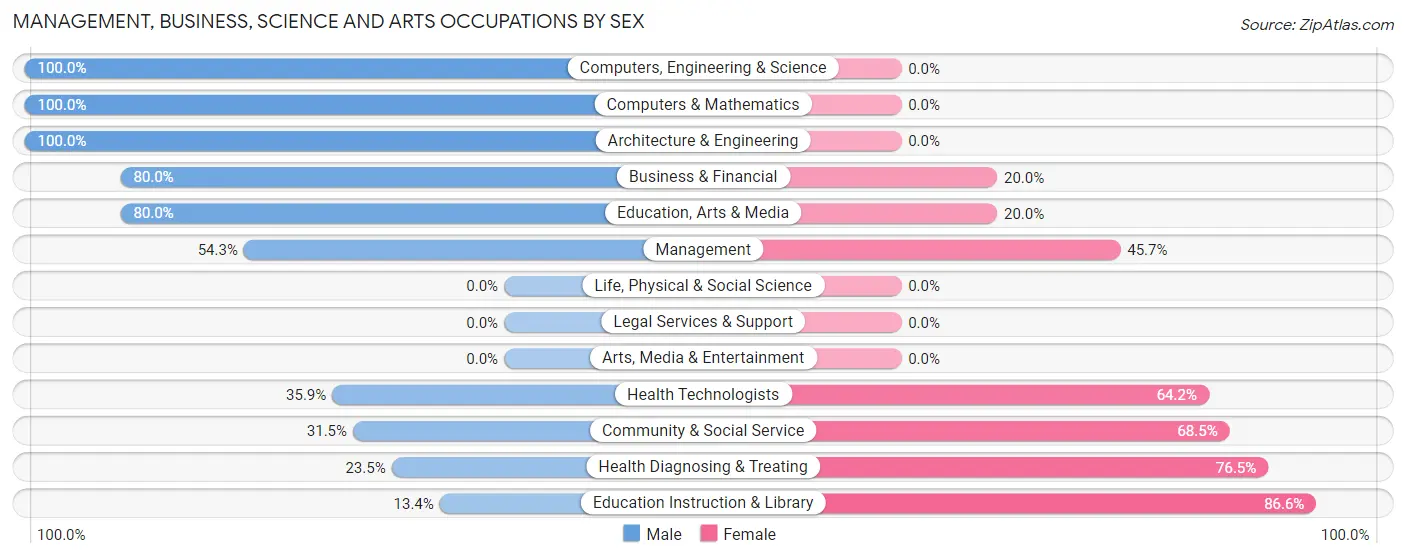
Management, Business, Science and Arts Occupations by Sex
Within the Management, Business, Science and Arts occupations in Knob Noster, the most male-oriented occupations are Computers, Engineering & Science (100.0%), Computers & Mathematics (100.0%), and Architecture & Engineering (100.0%), while the most female-oriented occupations are Education Instruction & Library (86.6%), Health Diagnosing & Treating (76.5%), and Community & Social Service (68.5%).
| Occupation | Male | Female |
| Management | 38 (54.3%) | 32 (45.7%) |
| Business & Financial | 28 (80.0%) | 7 (20.0%) |
| Computers, Engineering & Science | 42 (100.0%) | 0 (0.0%) |
| Computers & Mathematics | 16 (100.0%) | 0 (0.0%) |
| Architecture & Engineering | 26 (100.0%) | 0 (0.0%) |
| Life, Physical & Social Science | 0 (0.0%) | 0 (0.0%) |
| Community & Social Service | 29 (31.5%) | 63 (68.5%) |
| Education, Arts & Media | 20 (80.0%) | 5 (20.0%) |
| Legal Services & Support | 0 (0.0%) | 0 (0.0%) |
| Education Instruction & Library | 9 (13.4%) | 58 (86.6%) |
| Arts, Media & Entertainment | 0 (0.0%) | 0 (0.0%) |
| Health Diagnosing & Treating | 19 (23.5%) | 62 (76.5%) |
| Health Technologists | 19 (35.8%) | 34 (64.1%) |
| Total (Category) | 156 (48.7%) | 164 (51.2%) |
| Total (Overall) | 625 (53.5%) | 544 (46.5%) |
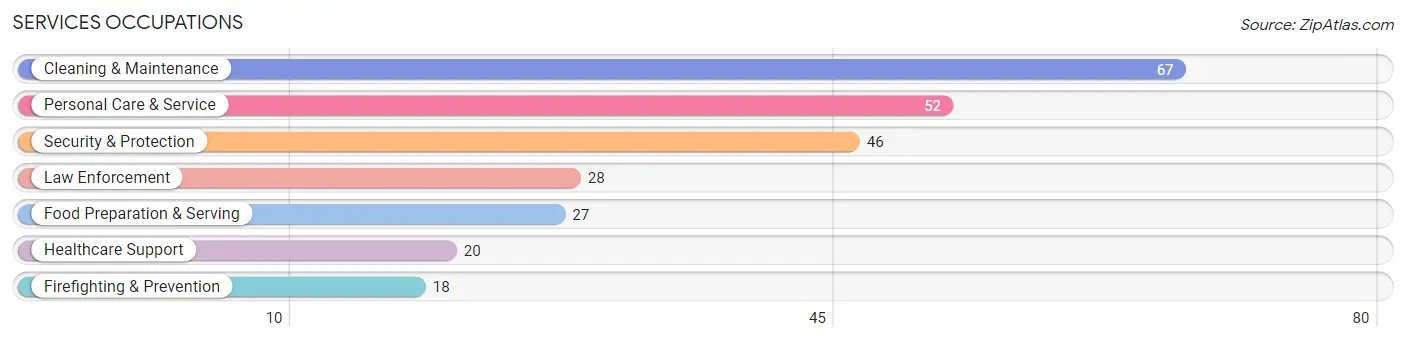
Services Occupations
The most common Services occupations in Knob Noster are Cleaning & Maintenance (67 | 5.7%), Personal Care & Service (52 | 4.4%), Security & Protection (46 | 3.9%), Law Enforcement (28 | 2.4%), and Food Preparation & Serving (27 | 2.3%).
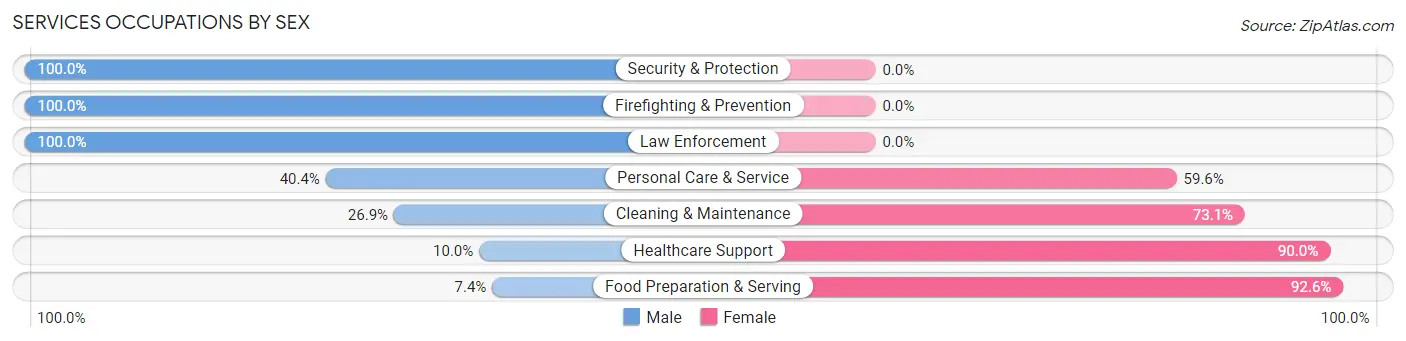
Services Occupations by Sex
Within the Services occupations in Knob Noster, the most male-oriented occupations are Security & Protection (100.0%), Firefighting & Prevention (100.0%), and Law Enforcement (100.0%), while the most female-oriented occupations are Food Preparation & Serving (92.6%), Healthcare Support (90.0%), and Cleaning & Maintenance (73.1%).
| Occupation | Male | Female |
| Healthcare Support | 2 (10.0%) | 18 (90.0%) |
| Security & Protection | 46 (100.0%) | 0 (0.0%) |
| Firefighting & Prevention | 18 (100.0%) | 0 (0.0%) |
| Law Enforcement | 28 (100.0%) | 0 (0.0%) |
| Food Preparation & Serving | 2 (7.4%) | 25 (92.6%) |
| Cleaning & Maintenance | 18 (26.9%) | 49 (73.1%) |
| Personal Care & Service | 21 (40.4%) | 31 (59.6%) |
| Total (Category) | 89 (42.0%) | 123 (58.0%) |
| Total (Overall) | 625 (53.5%) | 544 (46.5%) |
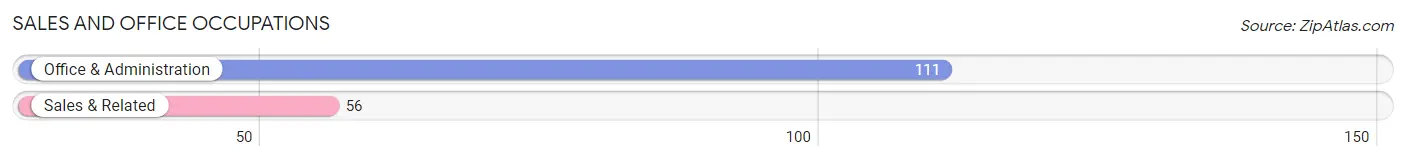
Sales and Office Occupations
The most common Sales and Office occupations in Knob Noster are Office & Administration (111 | 9.5%), and Sales & Related (56 | 4.8%).
Sales and Office Occupations by Sex
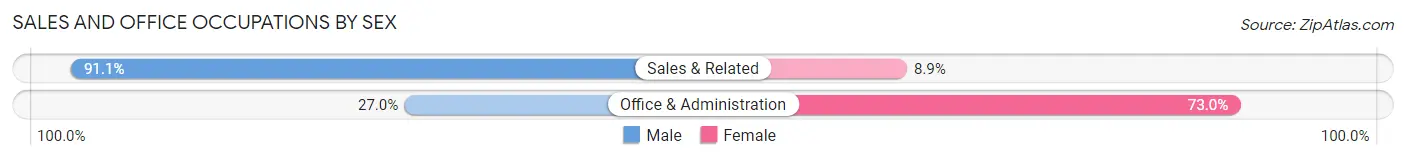
| Occupation | Male | Female |
| Sales & Related | 51 (91.1%) | 5 (8.9%) |
| Office & Administration | 30 (27.0%) | 81 (73.0%) |
| Total (Category) | 81 (48.5%) | 86 (51.5%) |
| Total (Overall) | 625 (53.5%) | 544 (46.5%) |
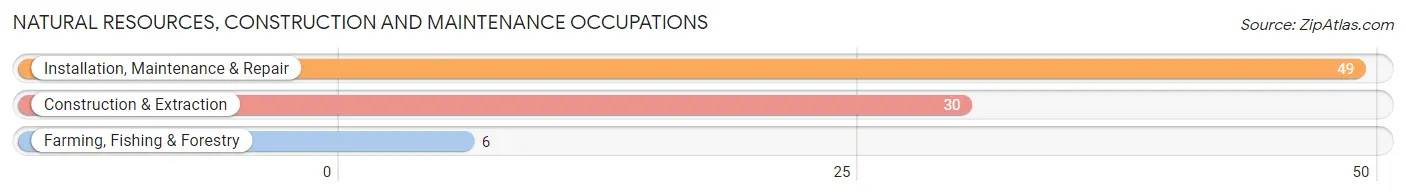
Natural Resources, Construction and Maintenance Occupations
The most common Natural Resources, Construction and Maintenance occupations in Knob Noster are Installation, Maintenance & Repair (49 | 4.2%), Construction & Extraction (30 | 2.6%), and Farming, Fishing & Forestry (6 | 0.5%).
Natural Resources, Construction and Maintenance Occupations by Sex
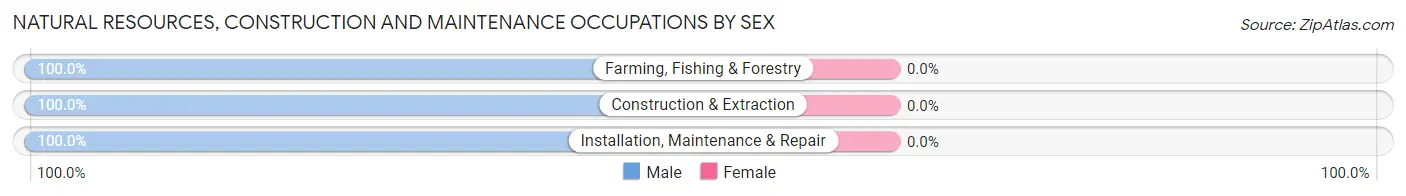
| Occupation | Male | Female |
| Farming, Fishing & Forestry | 6 (100.0%) | 0 (0.0%) |
| Construction & Extraction | 30 (100.0%) | 0 (0.0%) |
| Installation, Maintenance & Repair | 49 (100.0%) | 0 (0.0%) |
| Total (Category) | 85 (100.0%) | 0 (0.0%) |
| Total (Overall) | 625 (53.5%) | 544 (46.5%) |
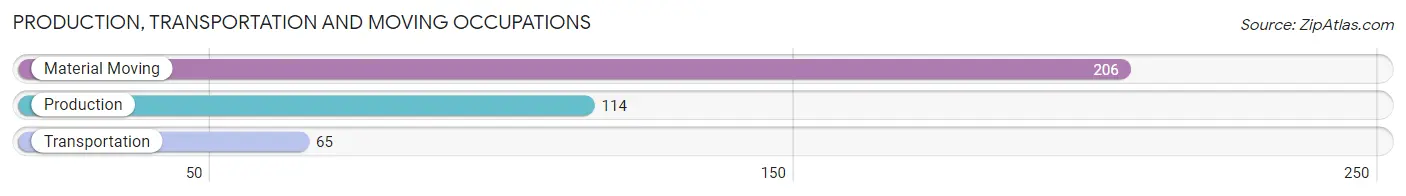
Production, Transportation and Moving Occupations
The most common Production, Transportation and Moving occupations in Knob Noster are Material Moving (206 | 17.6%), Production (114 | 9.8%), and Transportation (65 | 5.6%).
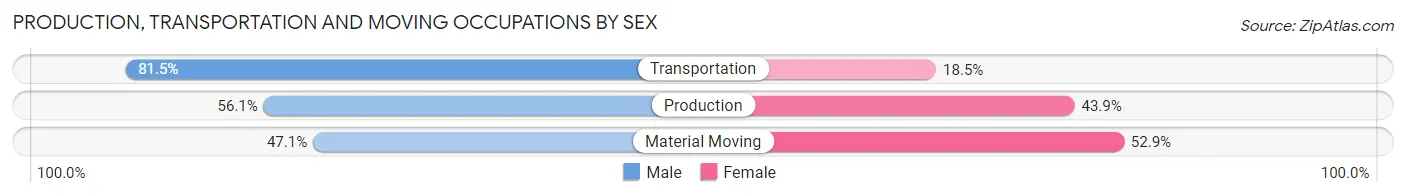
Production, Transportation and Moving Occupations by Sex
| Occupation | Male | Female |
| Production | 64 (56.1%) | 50 (43.9%) |
| Transportation | 53 (81.5%) | 12 (18.5%) |
| Material Moving | 97 (47.1%) | 109 (52.9%) |
| Total (Category) | 214 (55.6%) | 171 (44.4%) |
| Total (Overall) | 625 (53.5%) | 544 (46.5%) |
Employment Industries by Sex in Knob Noster
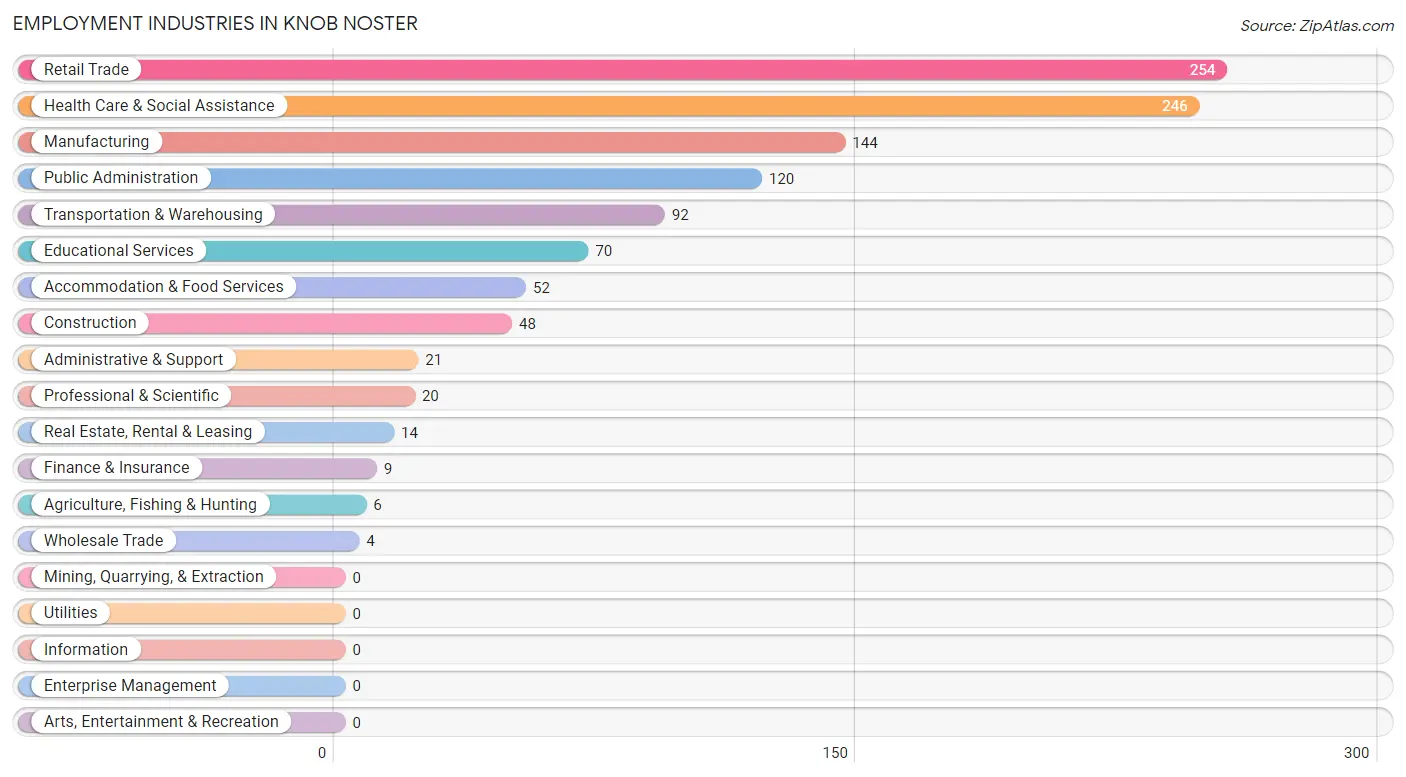
Employment Industries in Knob Noster
The major employment industries in Knob Noster include Retail Trade (254 | 21.7%), Health Care & Social Assistance (246 | 21.0%), Manufacturing (144 | 12.3%), Public Administration (120 | 10.3%), and Transportation & Warehousing (92 | 7.9%).
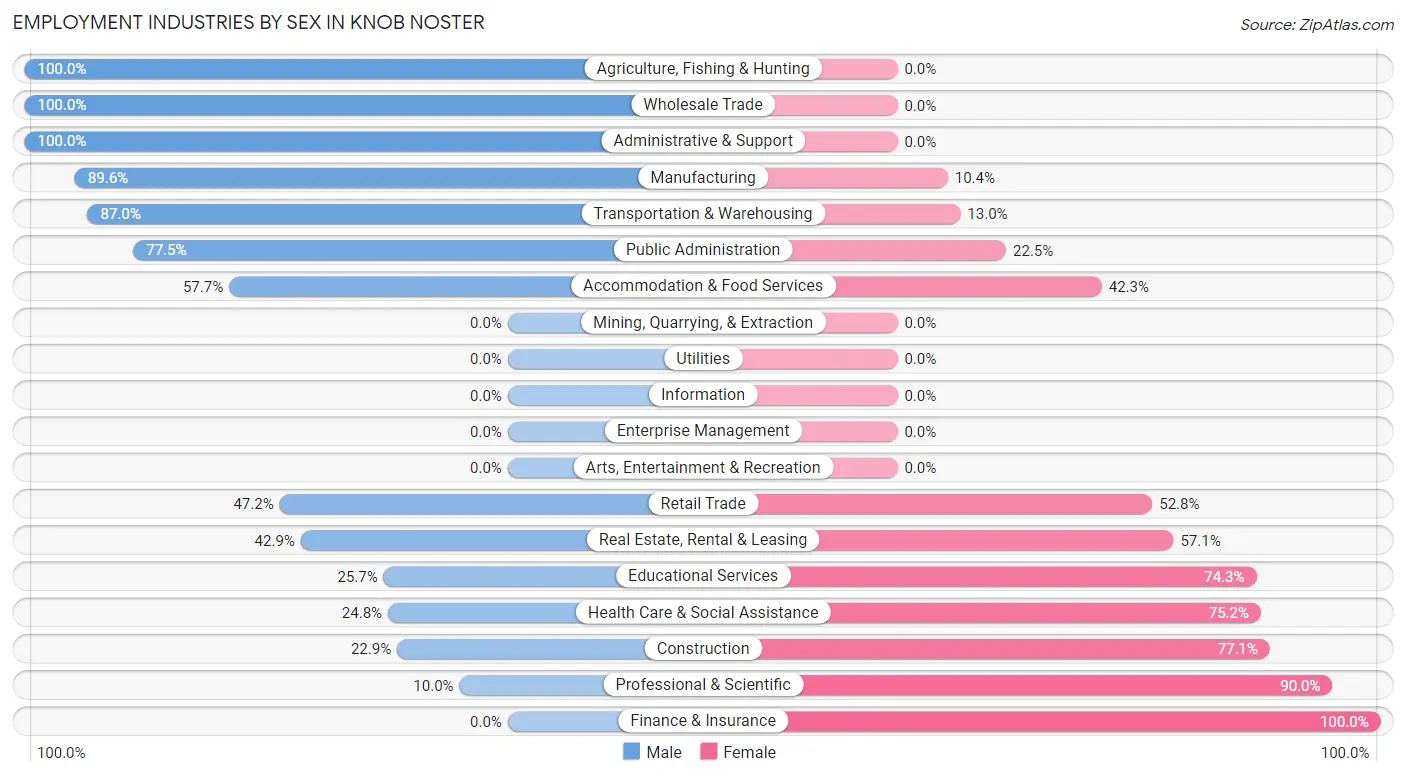
Employment Industries by Sex in Knob Noster
The Knob Noster industries that see more men than women are Agriculture, Fishing & Hunting (100.0%), Wholesale Trade (100.0%), and Administrative & Support (100.0%), whereas the industries that tend to have a higher number of women are Finance & Insurance (100.0%), Professional & Scientific (90.0%), and Construction (77.1%).
| Industry | Male | Female |
| Agriculture, Fishing & Hunting | 6 (100.0%) | 0 (0.0%) |
| Mining, Quarrying, & Extraction | 0 (0.0%) | 0 (0.0%) |
| Construction | 11 (22.9%) | 37 (77.1%) |
| Manufacturing | 129 (89.6%) | 15 (10.4%) |
| Wholesale Trade | 4 (100.0%) | 0 (0.0%) |
| Retail Trade | 120 (47.2%) | 134 (52.8%) |
| Transportation & Warehousing | 80 (87.0%) | 12 (13.0%) |
| Utilities | 0 (0.0%) | 0 (0.0%) |
| Information | 0 (0.0%) | 0 (0.0%) |
| Finance & Insurance | 0 (0.0%) | 9 (100.0%) |
| Real Estate, Rental & Leasing | 6 (42.9%) | 8 (57.1%) |
| Professional & Scientific | 2 (10.0%) | 18 (90.0%) |
| Enterprise Management | 0 (0.0%) | 0 (0.0%) |
| Administrative & Support | 21 (100.0%) | 0 (0.0%) |
| Educational Services | 18 (25.7%) | 52 (74.3%) |
| Health Care & Social Assistance | 61 (24.8%) | 185 (75.2%) |
| Arts, Entertainment & Recreation | 0 (0.0%) | 0 (0.0%) |
| Accommodation & Food Services | 30 (57.7%) | 22 (42.3%) |
| Public Administration | 93 (77.5%) | 27 (22.5%) |
| Total | 625 (53.5%) | 544 (46.5%) |
Education in Knob Noster
School Enrollment in Knob Noster
The most common levels of schooling among the 656 students in Knob Noster are college / undergraduate (224 | 34.2%), middle school (123 | 18.8%), and high school (84 | 12.8%).
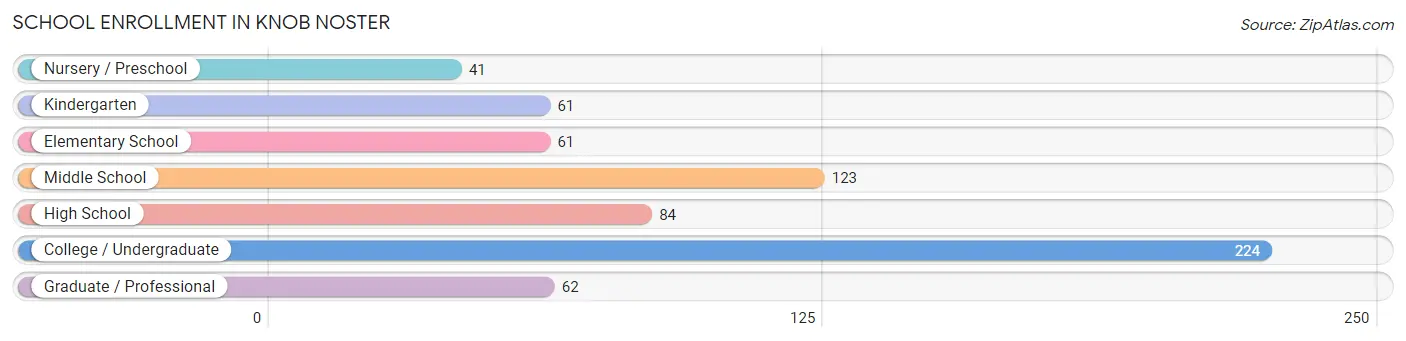
| School Level | # Students | % Students |
| Nursery / Preschool | 41 | 6.2% |
| Kindergarten | 61 | 9.3% |
| Elementary School | 61 | 9.3% |
| Middle School | 123 | 18.8% |
| High School | 84 | 12.8% |
| College / Undergraduate | 224 | 34.2% |
| Graduate / Professional | 62 | 9.5% |
| Total | 656 | 100.0% |
School Enrollment by Age by Funding Source in Knob Noster
Out of a total of 656 students who are enrolled in schools in Knob Noster, 59 (9.0%) attend a private institution, while the remaining 597 (91.0%) are enrolled in public schools. The age group of 10 to 14 year olds has the highest likelihood of being enrolled in private schools, with 34 (21.9% in the age bracket) enrolled. Conversely, the age group of 3 to 4 year olds has the lowest likelihood of being enrolled in a private school, with 41 (100.0% in the age bracket) attending a public institution.
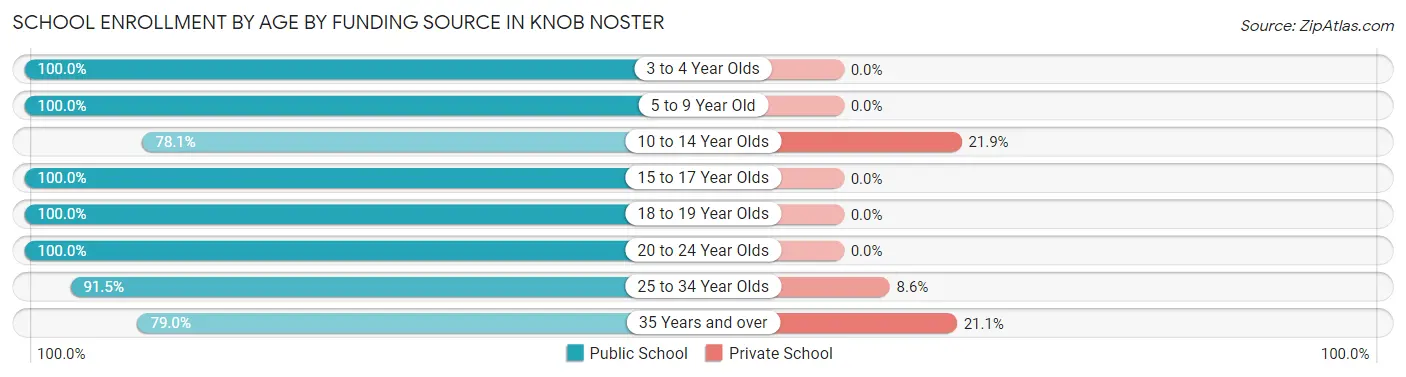
| Age Bracket | Public School | Private School |
| 3 to 4 Year Olds | 41 (100.0%) | 0 (0.0%) |
| 5 to 9 Year Old | 96 (100.0%) | 0 (0.0%) |
| 10 to 14 Year Olds | 121 (78.1%) | 34 (21.9%) |
| 15 to 17 Year Olds | 33 (100.0%) | 0 (0.0%) |
| 18 to 19 Year Olds | 46 (100.0%) | 0 (0.0%) |
| 20 to 24 Year Olds | 76 (100.0%) | 0 (0.0%) |
| 25 to 34 Year Olds | 139 (91.4%) | 13 (8.6%) |
| 35 Years and over | 45 (78.9%) | 12 (21.0%) |
| Total | 597 (91.0%) | 59 (9.0%) |
Educational Attainment by Field of Study in Knob Noster
Business (144 | 39.3%), education (87 | 23.8%), psychology (44 | 12.0%), arts & humanities (24 | 6.6%), and science & technology (20 | 5.5%) are the most common fields of study among 366 individuals in Knob Noster who have obtained a bachelor's degree or higher.
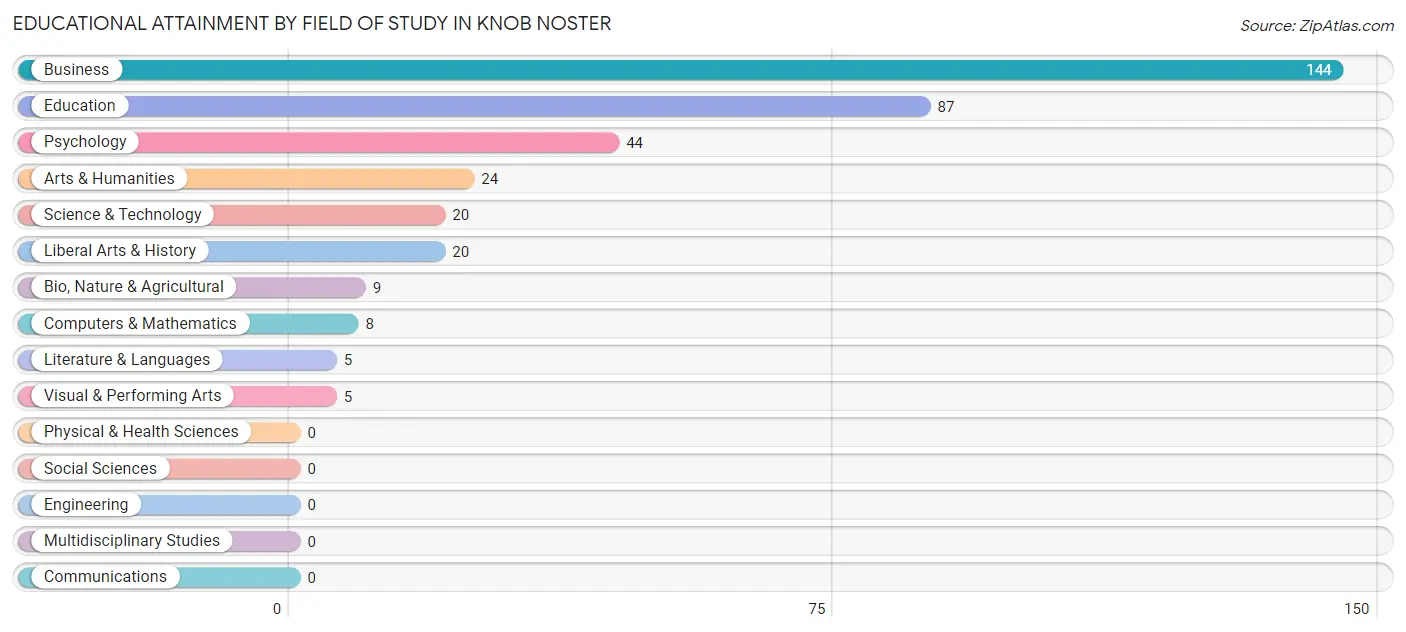
| Field of Study | # Graduates | % Graduates |
| Computers & Mathematics | 8 | 2.2% |
| Bio, Nature & Agricultural | 9 | 2.5% |
| Physical & Health Sciences | 0 | 0.0% |
| Psychology | 44 | 12.0% |
| Social Sciences | 0 | 0.0% |
| Engineering | 0 | 0.0% |
| Multidisciplinary Studies | 0 | 0.0% |
| Science & Technology | 20 | 5.5% |
| Business | 144 | 39.3% |
| Education | 87 | 23.8% |
| Literature & Languages | 5 | 1.4% |
| Liberal Arts & History | 20 | 5.5% |
| Visual & Performing Arts | 5 | 1.4% |
| Communications | 0 | 0.0% |
| Arts & Humanities | 24 | 6.6% |
| Total | 366 | 100.0% |
Transportation & Commute in Knob Noster
Vehicle Availability by Sex in Knob Noster
The most prevalent vehicle ownership categories in Knob Noster are males with 1 vehicle (305, accounting for 33.4%) and females with 1 vehicle (50, making up 49.5%).
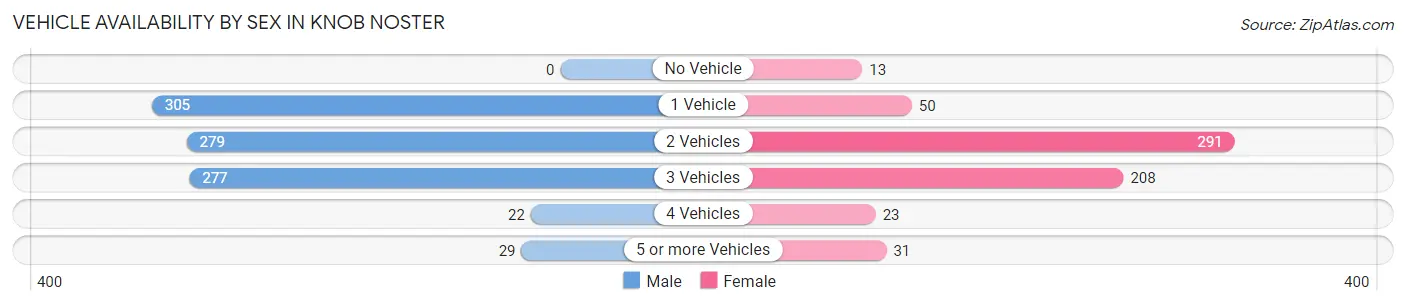
| Vehicles Available | Male | Female |
| No Vehicle | 0 (0.0%) | 13 (2.1%) |
| 1 Vehicle | 305 (33.4%) | 50 (8.1%) |
| 2 Vehicles | 279 (30.6%) | 291 (47.2%) |
| 3 Vehicles | 277 (30.4%) | 208 (33.8%) |
| 4 Vehicles | 22 (2.4%) | 23 (3.7%) |
| 5 or more Vehicles | 29 (3.2%) | 31 (5.0%) |
| Total | 912 (100.0%) | 616 (100.0%) |
Commute Time in Knob Noster
The most frequently occuring commute durations in Knob Noster are 10 to 14 minutes (362 commuters, 24.1%), 15 to 19 minutes (236 commuters, 15.7%), and 5 to 9 minutes (227 commuters, 15.1%).
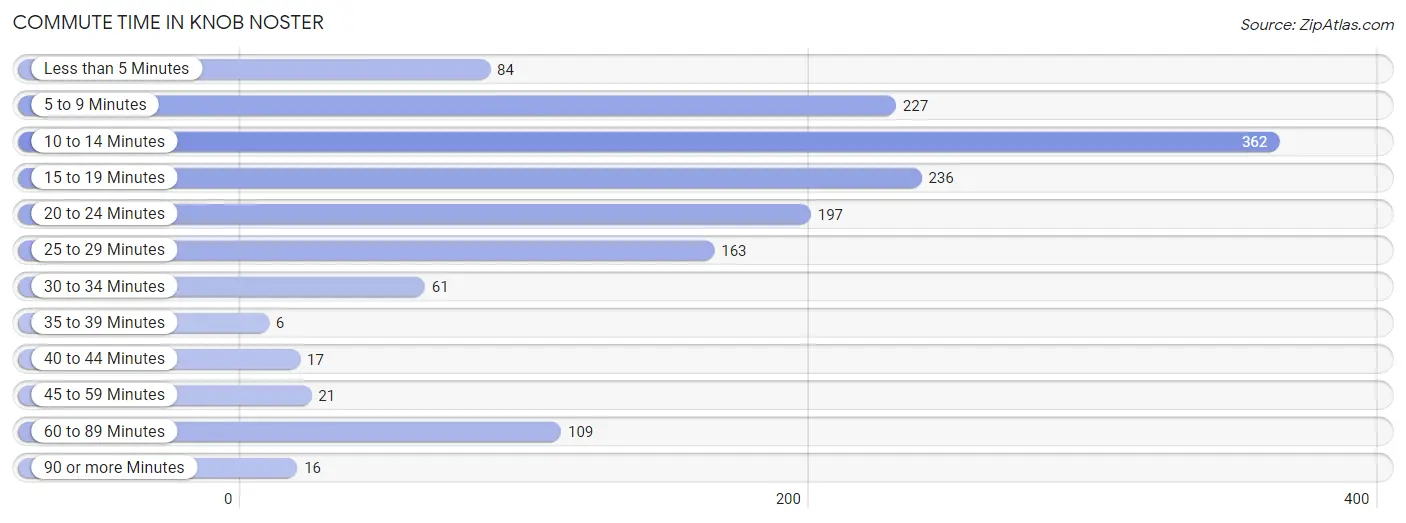
| Commute Time | # Commuters | % Commuters |
| Less than 5 Minutes | 84 | 5.6% |
| 5 to 9 Minutes | 227 | 15.1% |
| 10 to 14 Minutes | 362 | 24.1% |
| 15 to 19 Minutes | 236 | 15.7% |
| 20 to 24 Minutes | 197 | 13.1% |
| 25 to 29 Minutes | 163 | 10.9% |
| 30 to 34 Minutes | 61 | 4.1% |
| 35 to 39 Minutes | 6 | 0.4% |
| 40 to 44 Minutes | 17 | 1.1% |
| 45 to 59 Minutes | 21 | 1.4% |
| 60 to 89 Minutes | 109 | 7.3% |
| 90 or more Minutes | 16 | 1.1% |
Commute Time by Sex in Knob Noster
The most common commute times in Knob Noster are 10 to 14 minutes (248 commuters, 27.9%) for males and 25 to 29 minutes (147 commuters, 24.1%) for females.
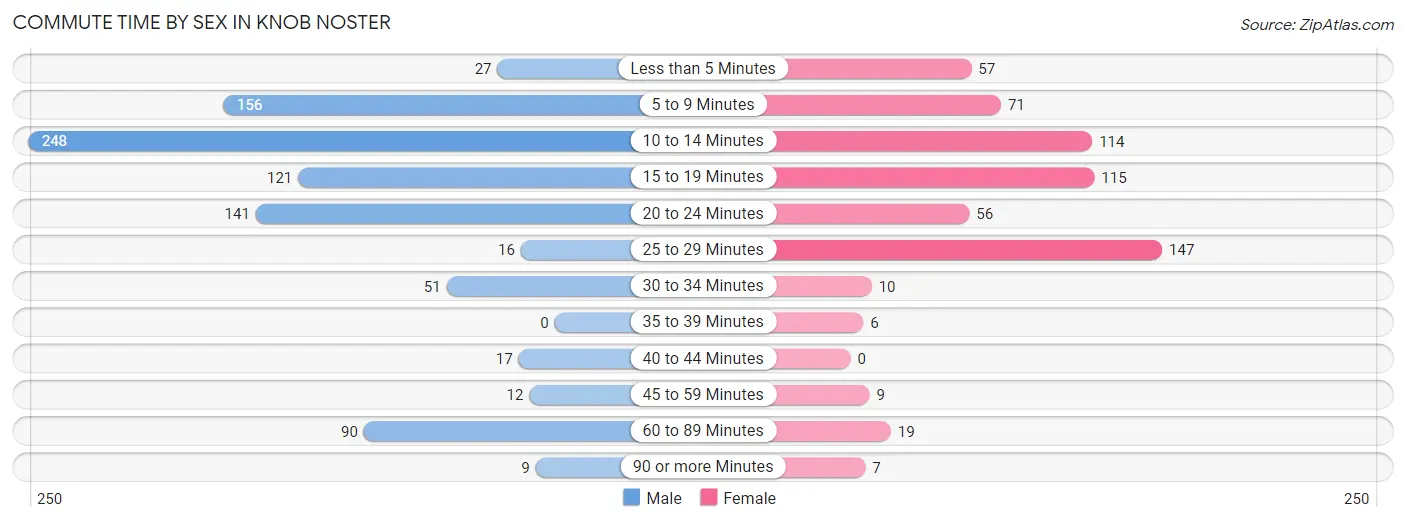
| Commute Time | Male | Female |
| Less than 5 Minutes | 27 (3.0%) | 57 (9.3%) |
| 5 to 9 Minutes | 156 (17.6%) | 71 (11.6%) |
| 10 to 14 Minutes | 248 (27.9%) | 114 (18.7%) |
| 15 to 19 Minutes | 121 (13.6%) | 115 (18.8%) |
| 20 to 24 Minutes | 141 (15.9%) | 56 (9.2%) |
| 25 to 29 Minutes | 16 (1.8%) | 147 (24.1%) |
| 30 to 34 Minutes | 51 (5.7%) | 10 (1.6%) |
| 35 to 39 Minutes | 0 (0.0%) | 6 (1.0%) |
| 40 to 44 Minutes | 17 (1.9%) | 0 (0.0%) |
| 45 to 59 Minutes | 12 (1.3%) | 9 (1.5%) |
| 60 to 89 Minutes | 90 (10.1%) | 19 (3.1%) |
| 90 or more Minutes | 9 (1.0%) | 7 (1.1%) |
Time of Departure to Work by Sex in Knob Noster
The most frequent times of departure to work in Knob Noster are 4:00 PM to 11:59 PM (170, 19.1%) for males and 4:00 PM to 11:59 PM (232, 38.0%) for females.
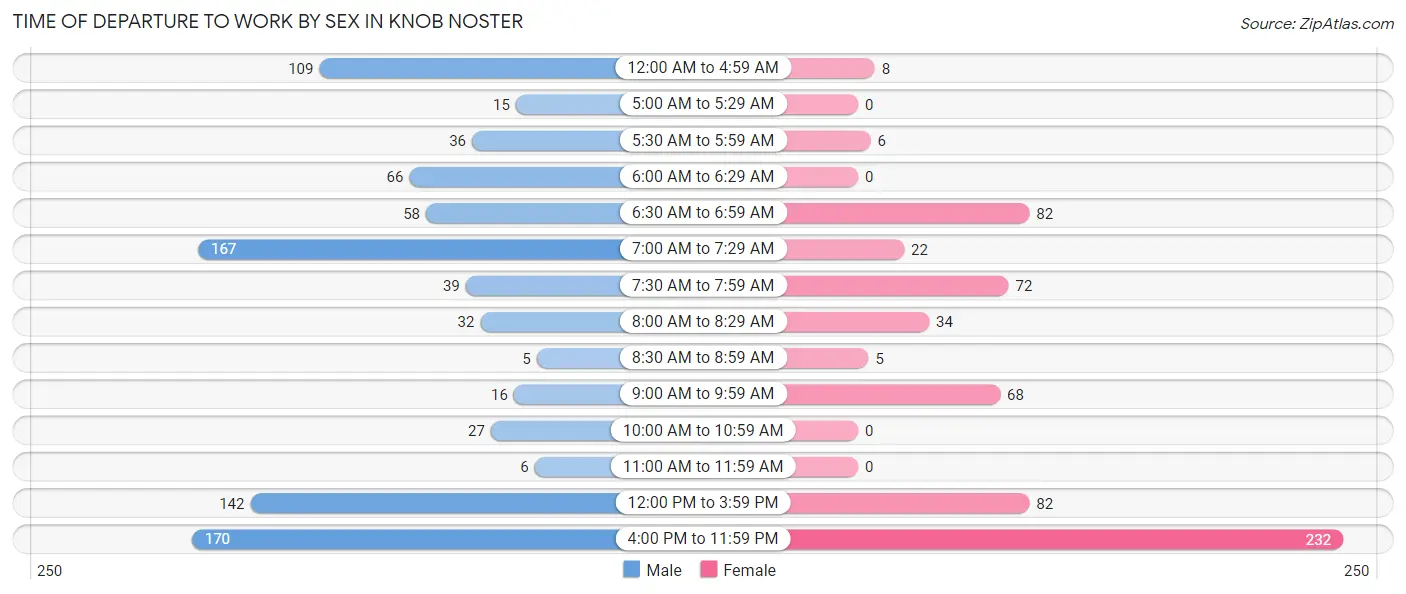
| Time of Departure | Male | Female |
| 12:00 AM to 4:59 AM | 109 (12.3%) | 8 (1.3%) |
| 5:00 AM to 5:29 AM | 15 (1.7%) | 0 (0.0%) |
| 5:30 AM to 5:59 AM | 36 (4.1%) | 6 (1.0%) |
| 6:00 AM to 6:29 AM | 66 (7.4%) | 0 (0.0%) |
| 6:30 AM to 6:59 AM | 58 (6.5%) | 82 (13.4%) |
| 7:00 AM to 7:29 AM | 167 (18.8%) | 22 (3.6%) |
| 7:30 AM to 7:59 AM | 39 (4.4%) | 72 (11.8%) |
| 8:00 AM to 8:29 AM | 32 (3.6%) | 34 (5.6%) |
| 8:30 AM to 8:59 AM | 5 (0.6%) | 5 (0.8%) |
| 9:00 AM to 9:59 AM | 16 (1.8%) | 68 (11.1%) |
| 10:00 AM to 10:59 AM | 27 (3.0%) | 0 (0.0%) |
| 11:00 AM to 11:59 AM | 6 (0.7%) | 0 (0.0%) |
| 12:00 PM to 3:59 PM | 142 (16.0%) | 82 (13.4%) |
| 4:00 PM to 11:59 PM | 170 (19.1%) | 232 (38.0%) |
| Total | 888 (100.0%) | 611 (100.0%) |
Housing Occupancy in Knob Noster
Occupancy by Ownership in Knob Noster
Of the total 1,305 dwellings in Knob Noster, owner-occupied units account for 581 (44.5%), while renter-occupied units make up 724 (55.5%).
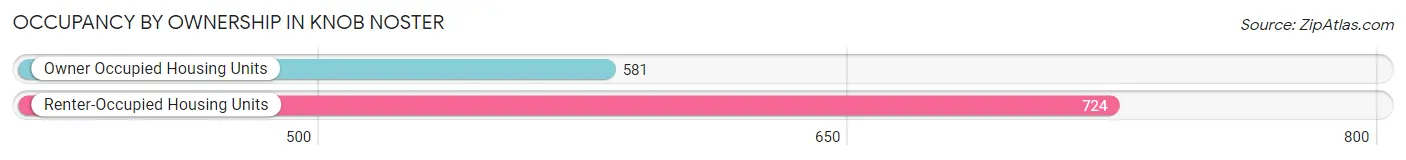
| Occupancy | # Housing Units | % Housing Units |
| Owner Occupied Housing Units | 581 | 44.5% |
| Renter-Occupied Housing Units | 724 | 55.5% |
| Total Occupied Housing Units | 1,305 | 100.0% |
Occupancy by Household Size in Knob Noster
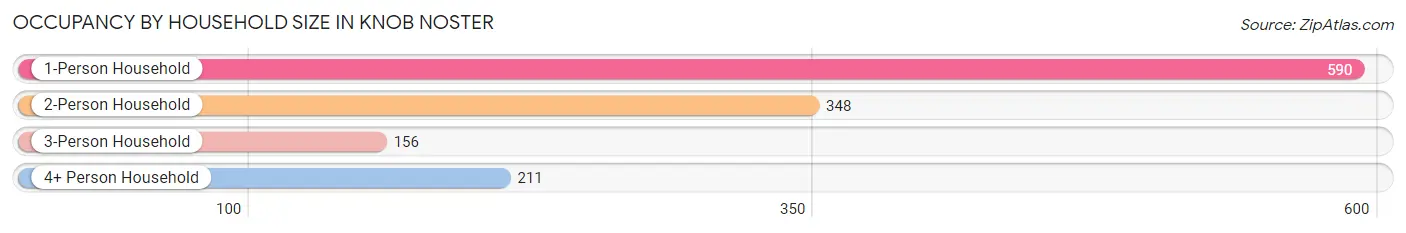
| Household Size | # Housing Units | % Housing Units |
| 1-Person Household | 590 | 45.2% |
| 2-Person Household | 348 | 26.7% |
| 3-Person Household | 156 | 11.9% |
| 4+ Person Household | 211 | 16.2% |
| Total Housing Units | 1,305 | 100.0% |
Occupancy by Ownership by Household Size in Knob Noster
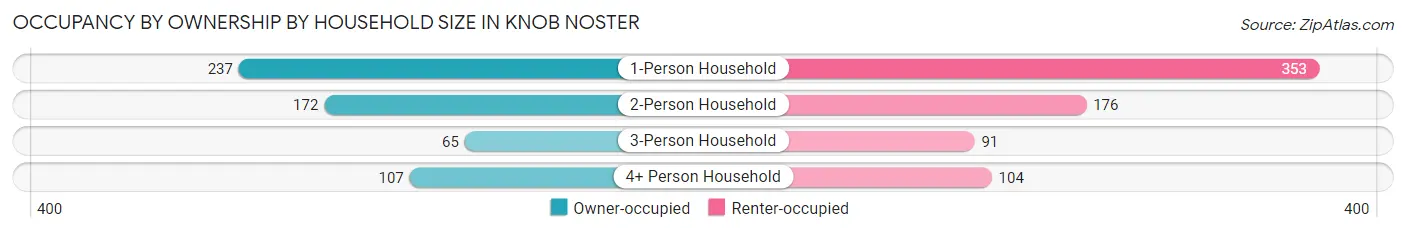
| Household Size | Owner-occupied | Renter-occupied |
| 1-Person Household | 237 (40.2%) | 353 (59.8%) |
| 2-Person Household | 172 (49.4%) | 176 (50.6%) |
| 3-Person Household | 65 (41.7%) | 91 (58.3%) |
| 4+ Person Household | 107 (50.7%) | 104 (49.3%) |
| Total Housing Units | 581 (44.5%) | 724 (55.5%) |
Occupancy by Educational Attainment in Knob Noster
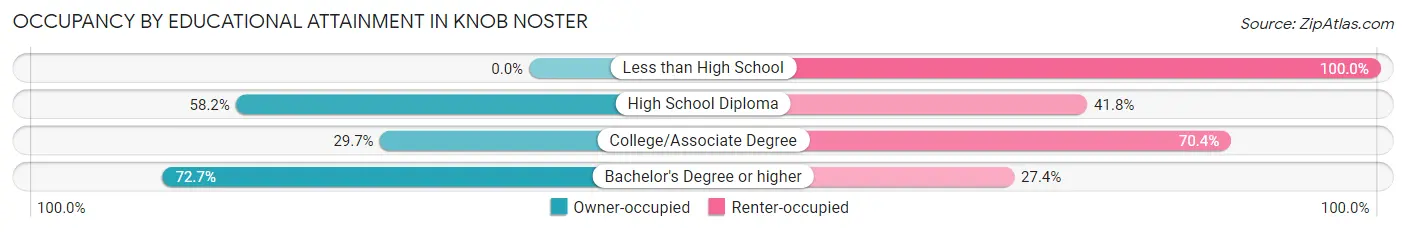
| Household Size | Owner-occupied | Renter-occupied |
| Less than High School | 0 (0.0%) | 69 (100.0%) |
| High School Diploma | 242 (58.2%) | 174 (41.8%) |
| College/Associate Degree | 177 (29.6%) | 420 (70.4%) |
| Bachelor's Degree or higher | 162 (72.7%) | 61 (27.4%) |
Occupancy by Age of Householder in Knob Noster
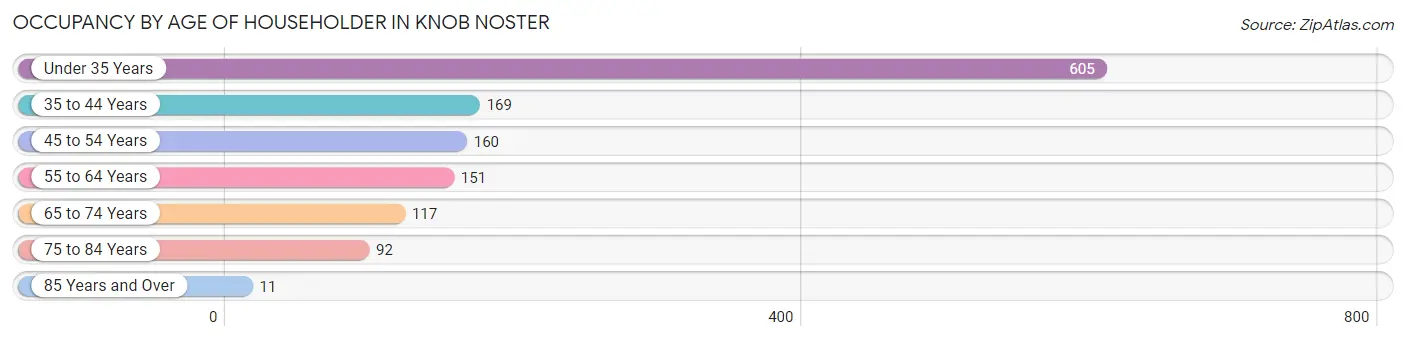
| Age Bracket | # Households | % Households |
| Under 35 Years | 605 | 46.4% |
| 35 to 44 Years | 169 | 13.0% |
| 45 to 54 Years | 160 | 12.3% |
| 55 to 64 Years | 151 | 11.6% |
| 65 to 74 Years | 117 | 9.0% |
| 75 to 84 Years | 92 | 7.0% |
| 85 Years and Over | 11 | 0.8% |
| Total | 1,305 | 100.0% |
Housing Finances in Knob Noster
Median Income by Occupancy in Knob Noster
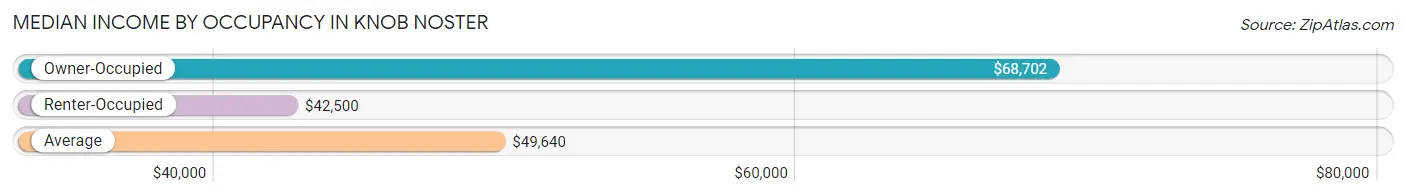
| Occupancy Type | # Households | Median Income |
| Owner-Occupied | 581 (44.5%) | $68,702 |
| Renter-Occupied | 724 (55.5%) | $42,500 |
| Average | 1,305 (100.0%) | $49,640 |
Occupancy by Householder Income Bracket in Knob Noster
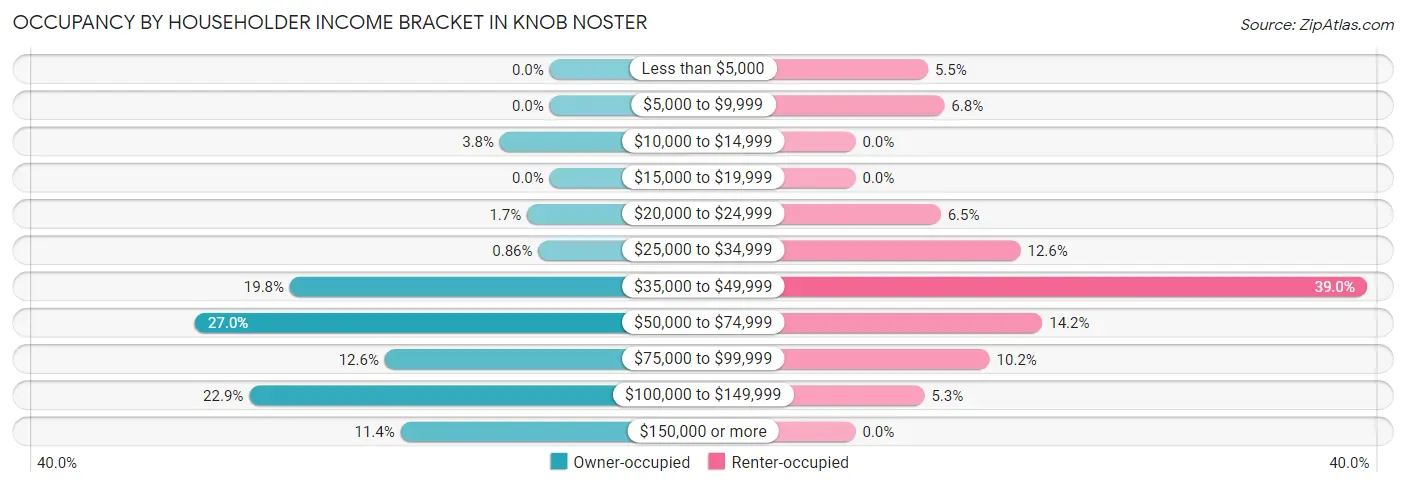
| Income Bracket | Owner-occupied | Renter-occupied |
| Less than $5,000 | 0 (0.0%) | 40 (5.5%) |
| $5,000 to $9,999 | 0 (0.0%) | 49 (6.8%) |
| $10,000 to $14,999 | 22 (3.8%) | 0 (0.0%) |
| $15,000 to $19,999 | 0 (0.0%) | 0 (0.0%) |
| $20,000 to $24,999 | 10 (1.7%) | 47 (6.5%) |
| $25,000 to $34,999 | 5 (0.9%) | 91 (12.6%) |
| $35,000 to $49,999 | 115 (19.8%) | 282 (39.0%) |
| $50,000 to $74,999 | 157 (27.0%) | 103 (14.2%) |
| $75,000 to $99,999 | 73 (12.6%) | 74 (10.2%) |
| $100,000 to $149,999 | 133 (22.9%) | 38 (5.2%) |
| $150,000 or more | 66 (11.4%) | 0 (0.0%) |
| Total | 581 (100.0%) | 724 (100.0%) |
Monthly Housing Cost Tiers in Knob Noster
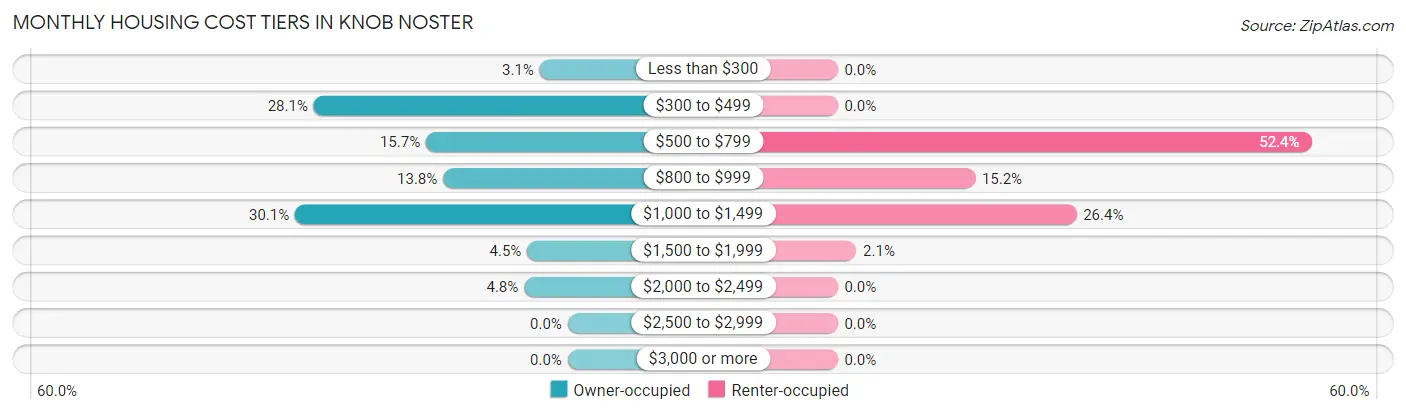
| Monthly Cost | Owner-occupied | Renter-occupied |
| Less than $300 | 18 (3.1%) | 0 (0.0%) |
| $300 to $499 | 163 (28.1%) | 0 (0.0%) |
| $500 to $799 | 91 (15.7%) | 379 (52.3%) |
| $800 to $999 | 80 (13.8%) | 110 (15.2%) |
| $1,000 to $1,499 | 175 (30.1%) | 191 (26.4%) |
| $1,500 to $1,999 | 26 (4.5%) | 15 (2.1%) |
| $2,000 to $2,499 | 28 (4.8%) | 0 (0.0%) |
| $2,500 to $2,999 | 0 (0.0%) | 0 (0.0%) |
| $3,000 or more | 0 (0.0%) | 0 (0.0%) |
| Total | 581 (100.0%) | 724 (100.0%) |
Physical Housing Characteristics in Knob Noster
Housing Structures in Knob Noster
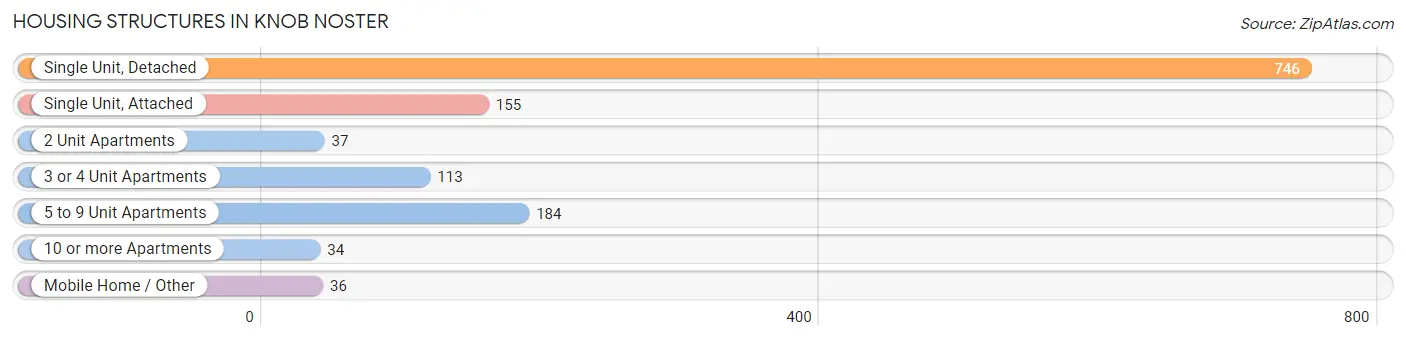
| Structure Type | # Housing Units | % Housing Units |
| Single Unit, Detached | 746 | 57.2% |
| Single Unit, Attached | 155 | 11.9% |
| 2 Unit Apartments | 37 | 2.8% |
| 3 or 4 Unit Apartments | 113 | 8.7% |
| 5 to 9 Unit Apartments | 184 | 14.1% |
| 10 or more Apartments | 34 | 2.6% |
| Mobile Home / Other | 36 | 2.8% |
| Total | 1,305 | 100.0% |
Housing Structures by Occupancy in Knob Noster
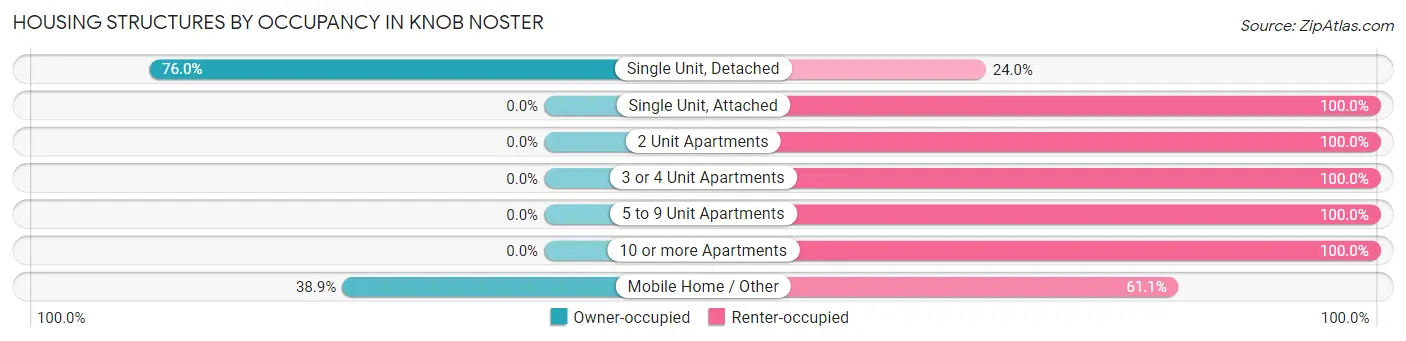
| Structure Type | Owner-occupied | Renter-occupied |
| Single Unit, Detached | 567 (76.0%) | 179 (24.0%) |
| Single Unit, Attached | 0 (0.0%) | 155 (100.0%) |
| 2 Unit Apartments | 0 (0.0%) | 37 (100.0%) |
| 3 or 4 Unit Apartments | 0 (0.0%) | 113 (100.0%) |
| 5 to 9 Unit Apartments | 0 (0.0%) | 184 (100.0%) |
| 10 or more Apartments | 0 (0.0%) | 34 (100.0%) |
| Mobile Home / Other | 14 (38.9%) | 22 (61.1%) |
| Total | 581 (44.5%) | 724 (55.5%) |
Housing Structures by Number of Rooms in Knob Noster
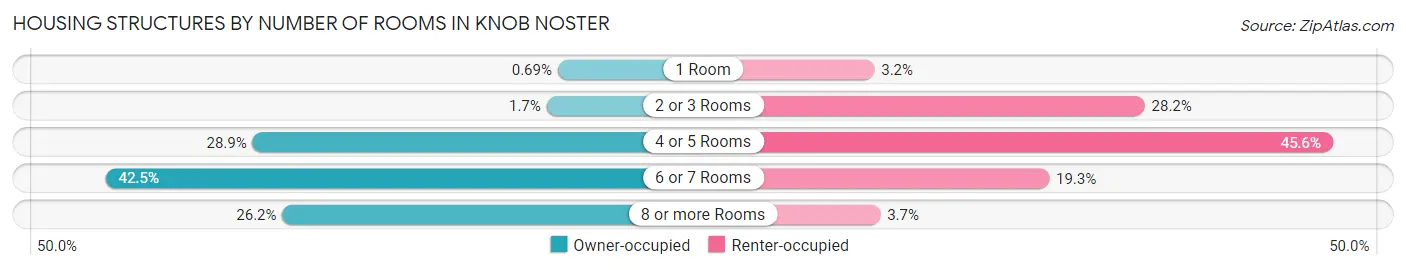
| Number of Rooms | Owner-occupied | Renter-occupied |
| 1 Room | 4 (0.7%) | 23 (3.2%) |
| 2 or 3 Rooms | 10 (1.7%) | 204 (28.2%) |
| 4 or 5 Rooms | 168 (28.9%) | 330 (45.6%) |
| 6 or 7 Rooms | 247 (42.5%) | 140 (19.3%) |
| 8 or more Rooms | 152 (26.2%) | 27 (3.7%) |
| Total | 581 (100.0%) | 724 (100.0%) |
Housing Structure by Heating Type in Knob Noster
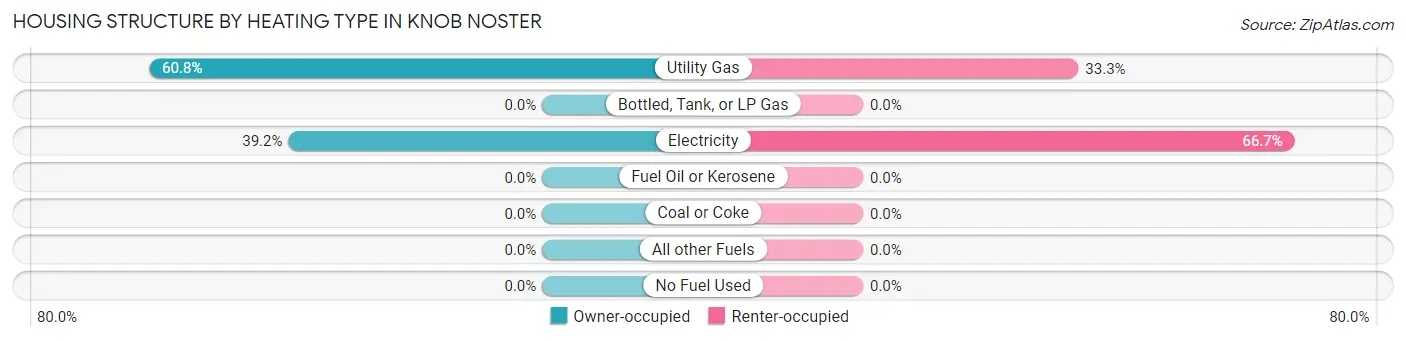
| Heating Type | Owner-occupied | Renter-occupied |
| Utility Gas | 353 (60.8%) | 241 (33.3%) |
| Bottled, Tank, or LP Gas | 0 (0.0%) | 0 (0.0%) |
| Electricity | 228 (39.2%) | 483 (66.7%) |
| Fuel Oil or Kerosene | 0 (0.0%) | 0 (0.0%) |
| Coal or Coke | 0 (0.0%) | 0 (0.0%) |
| All other Fuels | 0 (0.0%) | 0 (0.0%) |
| No Fuel Used | 0 (0.0%) | 0 (0.0%) |
| Total | 581 (100.0%) | 724 (100.0%) |
Household Vehicle Usage in Knob Noster
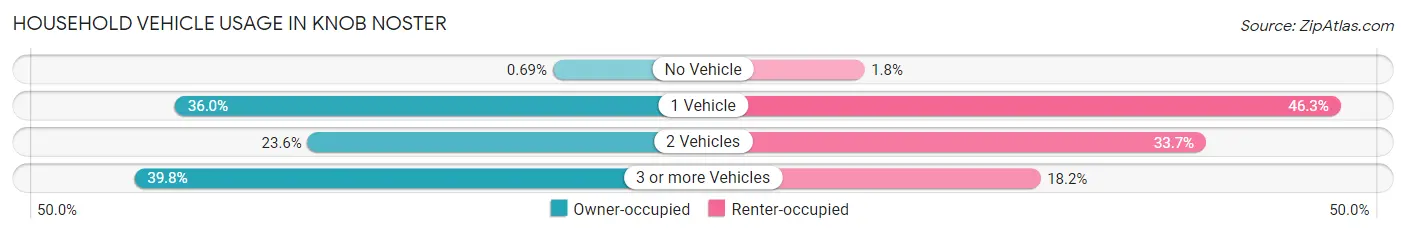
| Vehicles per Household | Owner-occupied | Renter-occupied |
| No Vehicle | 4 (0.7%) | 13 (1.8%) |
| 1 Vehicle | 209 (36.0%) | 335 (46.3%) |
| 2 Vehicles | 137 (23.6%) | 244 (33.7%) |
| 3 or more Vehicles | 231 (39.8%) | 132 (18.2%) |
| Total | 581 (100.0%) | 724 (100.0%) |
Real Estate & Mortgages in Knob Noster
Real Estate and Mortgage Overview in Knob Noster
| Characteristic | Without Mortgage | With Mortgage |
| Housing Units | 219 | 362 |
| Median Property Value | $168,300 | $150,000 |
| Median Household Income | $65,625 | $50 |
| Monthly Housing Costs | $418 | $0 |
| Real Estate Taxes | $1,348 | $23 |
Property Value by Mortgage Status in Knob Noster
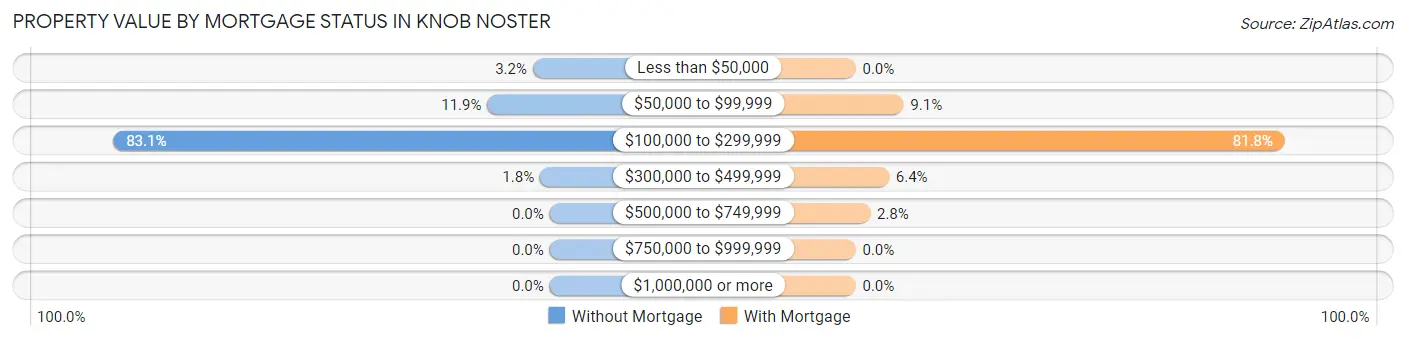
| Property Value | Without Mortgage | With Mortgage |
| Less than $50,000 | 7 (3.2%) | 0 (0.0%) |
| $50,000 to $99,999 | 26 (11.9%) | 33 (9.1%) |
| $100,000 to $299,999 | 182 (83.1%) | 296 (81.8%) |
| $300,000 to $499,999 | 4 (1.8%) | 23 (6.4%) |
| $500,000 to $749,999 | 0 (0.0%) | 10 (2.8%) |
| $750,000 to $999,999 | 0 (0.0%) | 0 (0.0%) |
| $1,000,000 or more | 0 (0.0%) | 0 (0.0%) |
| Total | 219 (100.0%) | 362 (100.0%) |
Household Income by Mortgage Status in Knob Noster
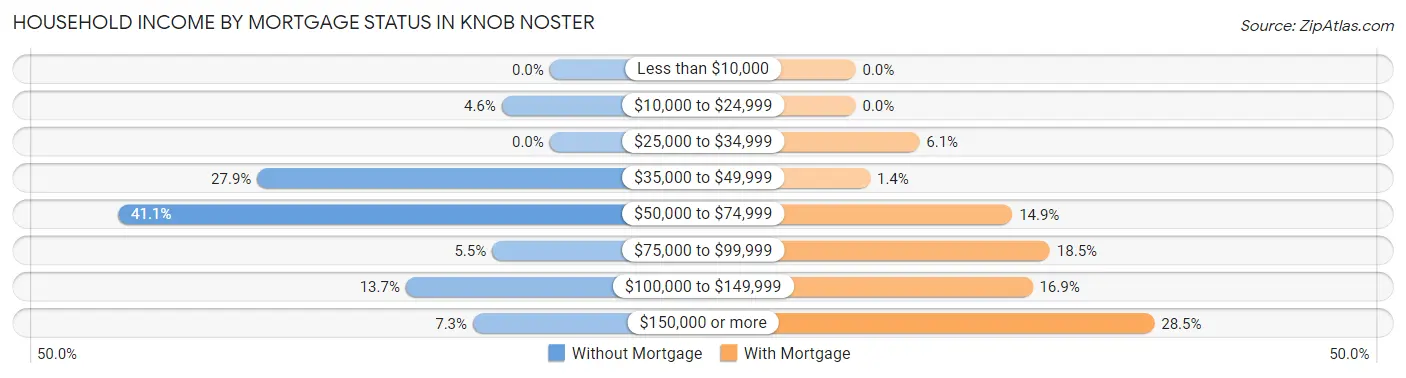
| Household Income | Without Mortgage | With Mortgage |
| Less than $10,000 | 0 (0.0%) | 0 (0.0%) |
| $10,000 to $24,999 | 10 (4.6%) | 0 (0.0%) |
| $25,000 to $34,999 | 0 (0.0%) | 22 (6.1%) |
| $35,000 to $49,999 | 61 (27.9%) | 5 (1.4%) |
| $50,000 to $74,999 | 90 (41.1%) | 54 (14.9%) |
| $75,000 to $99,999 | 12 (5.5%) | 67 (18.5%) |
| $100,000 to $149,999 | 30 (13.7%) | 61 (16.9%) |
| $150,000 or more | 16 (7.3%) | 103 (28.4%) |
| Total | 219 (100.0%) | 362 (100.0%) |
Property Value to Household Income Ratio in Knob Noster
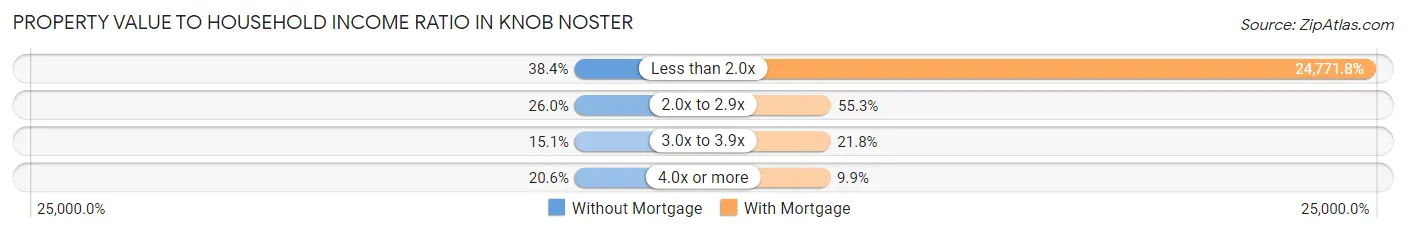
| Value-to-Income Ratio | Without Mortgage | With Mortgage |
| Less than 2.0x | 84 (38.4%) | 89,674 (24,771.8%) |
| 2.0x to 2.9x | 57 (26.0%) | 200 (55.2%) |
| 3.0x to 3.9x | 33 (15.1%) | 79 (21.8%) |
| 4.0x or more | 45 (20.5%) | 36 (9.9%) |
| Total | 219 (100.0%) | 362 (100.0%) |
Real Estate Taxes by Mortgage Status in Knob Noster
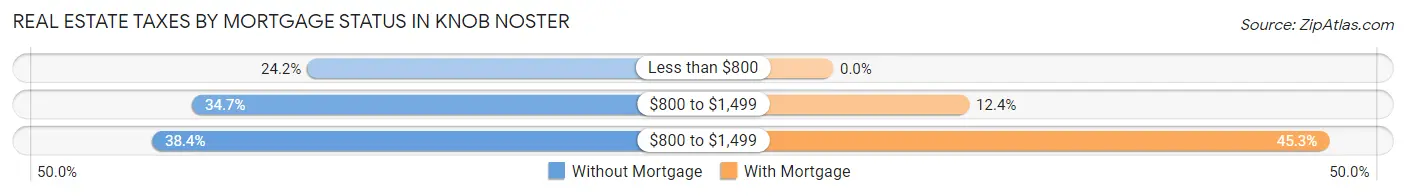
| Property Taxes | Without Mortgage | With Mortgage |
| Less than $800 | 53 (24.2%) | 0 (0.0%) |
| $800 to $1,499 | 76 (34.7%) | 45 (12.4%) |
| $800 to $1,499 | 84 (38.4%) | 164 (45.3%) |
| Total | 219 (100.0%) | 362 (100.0%) |
Health & Disability in Knob Noster
Health Insurance Coverage by Age in Knob Noster
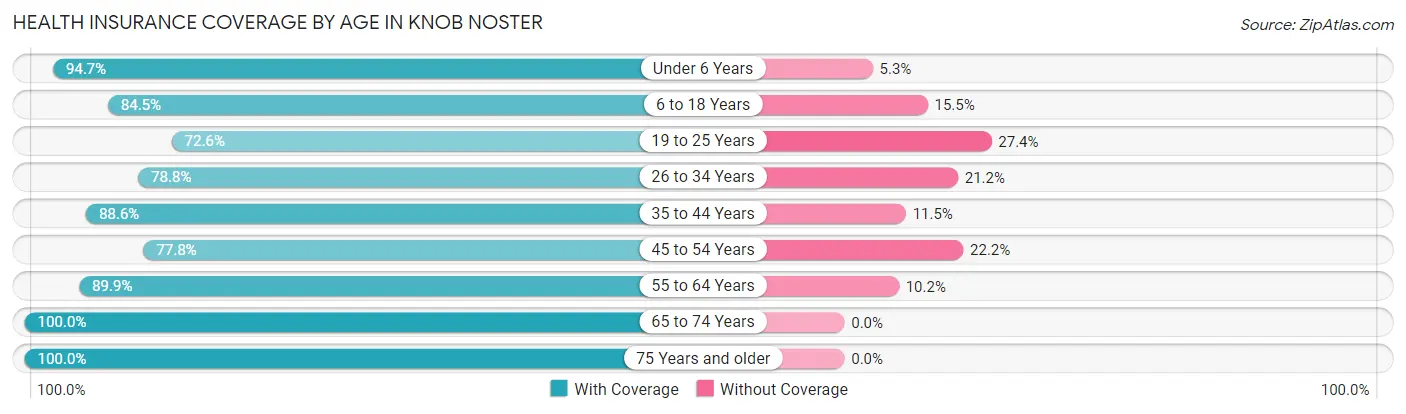
| Age Bracket | With Coverage | Without Coverage |
| Under 6 Years | 233 (94.7%) | 13 (5.3%) |
| 6 to 18 Years | 272 (84.5%) | 50 (15.5%) |
| 19 to 25 Years | 278 (72.6%) | 105 (27.4%) |
| 26 to 34 Years | 324 (78.8%) | 87 (21.2%) |
| 35 to 44 Years | 263 (88.5%) | 34 (11.5%) |
| 45 to 54 Years | 151 (77.8%) | 43 (22.2%) |
| 55 to 64 Years | 239 (89.8%) | 27 (10.2%) |
| 65 to 74 Years | 146 (100.0%) | 0 (0.0%) |
| 75 Years and older | 161 (100.0%) | 0 (0.0%) |
| Total | 2,067 (85.2%) | 359 (14.8%) |
Health Insurance Coverage by Citizenship Status in Knob Noster
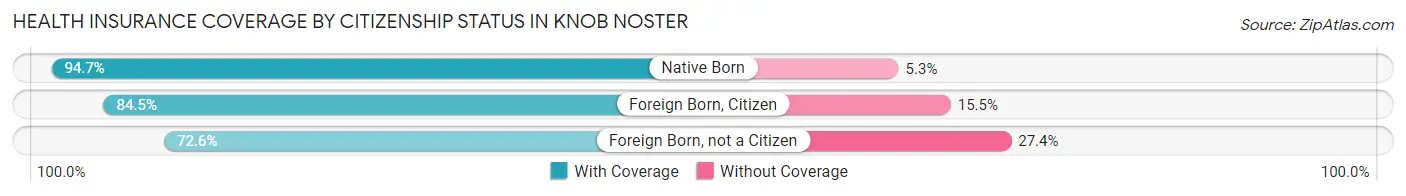
| Citizenship Status | With Coverage | Without Coverage |
| Native Born | 233 (94.7%) | 13 (5.3%) |
| Foreign Born, Citizen | 272 (84.5%) | 50 (15.5%) |
| Foreign Born, not a Citizen | 278 (72.6%) | 105 (27.4%) |
Health Insurance Coverage by Household Income in Knob Noster
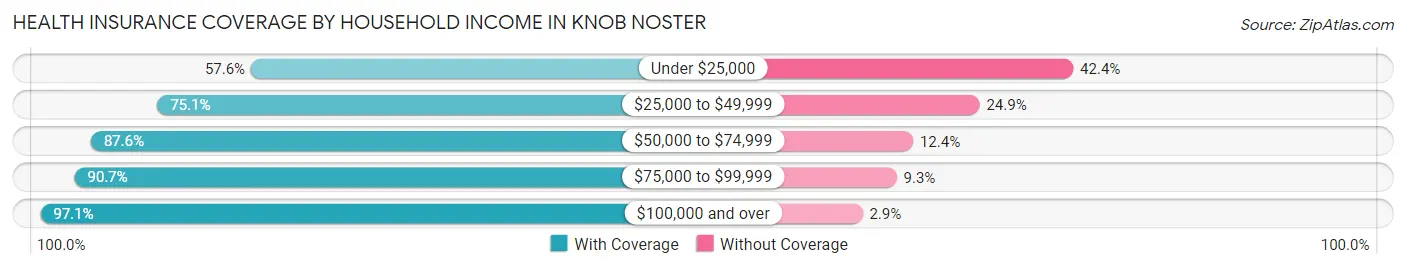
| Household Income | With Coverage | Without Coverage |
| Under $25,000 | 148 (57.6%) | 109 (42.4%) |
| $25,000 to $49,999 | 414 (75.1%) | 137 (24.9%) |
| $50,000 to $74,999 | 339 (87.6%) | 48 (12.4%) |
| $75,000 to $99,999 | 408 (90.7%) | 42 (9.3%) |
| $100,000 and over | 758 (97.1%) | 23 (2.9%) |
Public vs Private Health Insurance Coverage by Age in Knob Noster
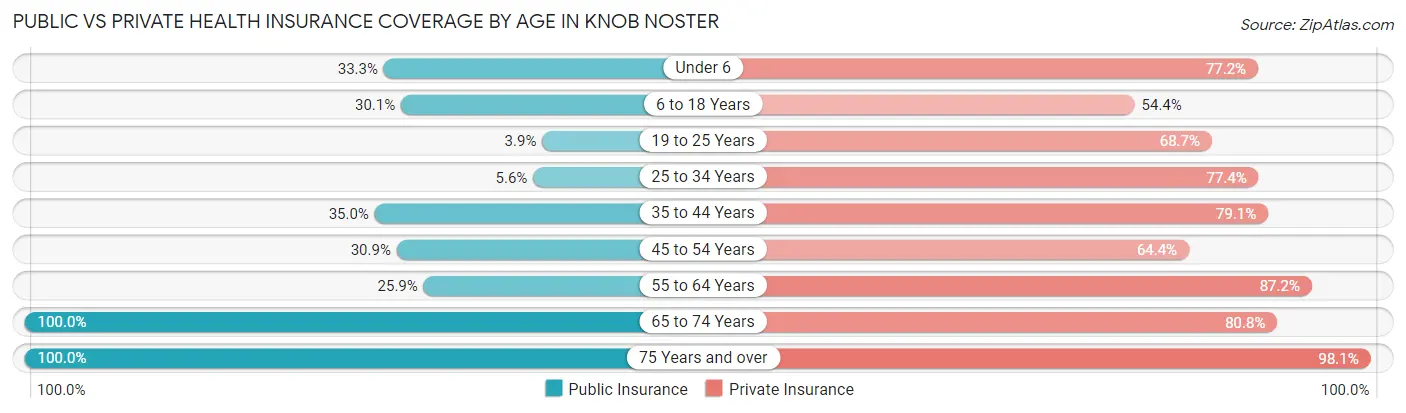
| Age Bracket | Public Insurance | Private Insurance |
| Under 6 | 82 (33.3%) | 190 (77.2%) |
| 6 to 18 Years | 97 (30.1%) | 175 (54.3%) |
| 19 to 25 Years | 15 (3.9%) | 263 (68.7%) |
| 25 to 34 Years | 23 (5.6%) | 318 (77.4%) |
| 35 to 44 Years | 104 (35.0%) | 235 (79.1%) |
| 45 to 54 Years | 60 (30.9%) | 125 (64.4%) |
| 55 to 64 Years | 69 (25.9%) | 232 (87.2%) |
| 65 to 74 Years | 146 (100.0%) | 118 (80.8%) |
| 75 Years and over | 161 (100.0%) | 158 (98.1%) |
| Total | 757 (31.2%) | 1,814 (74.8%) |
Disability Status by Sex by Age in Knob Noster
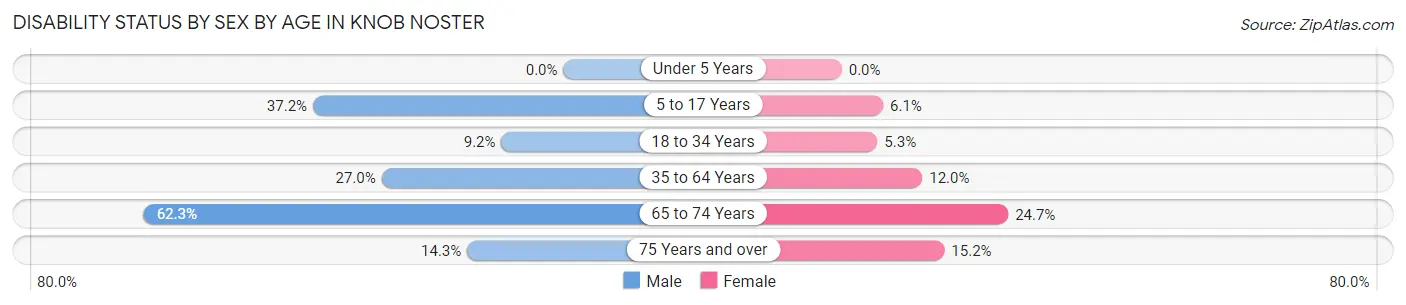
| Age Bracket | Male | Female |
| Under 5 Years | 0 (0.0%) | 0 (0.0%) |
| 5 to 17 Years | 45 (37.2%) | 10 (6.1%) |
| 18 to 34 Years | 40 (9.2%) | 21 (5.3%) |
| 35 to 64 Years | 105 (27.0%) | 44 (12.0%) |
| 65 to 74 Years | 38 (62.3%) | 21 (24.7%) |
| 75 Years and over | 8 (14.3%) | 16 (15.2%) |
Disability Class by Sex by Age in Knob Noster
Disability Class: Hearing Difficulty
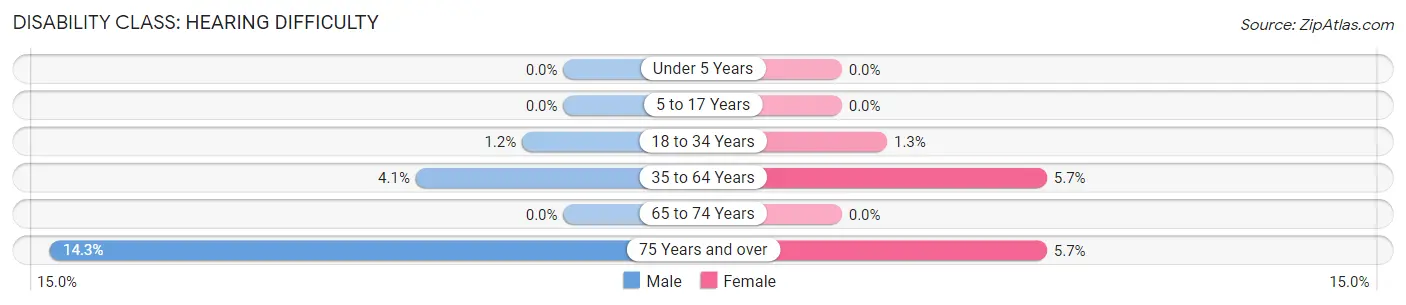
| Age Bracket | Male | Female |
| Under 5 Years | 0 (0.0%) | 0 (0.0%) |
| 5 to 17 Years | 0 (0.0%) | 0 (0.0%) |
| 18 to 34 Years | 5 (1.1%) | 5 (1.3%) |
| 35 to 64 Years | 16 (4.1%) | 21 (5.7%) |
| 65 to 74 Years | 0 (0.0%) | 0 (0.0%) |
| 75 Years and over | 8 (14.3%) | 6 (5.7%) |
Disability Class: Vision Difficulty
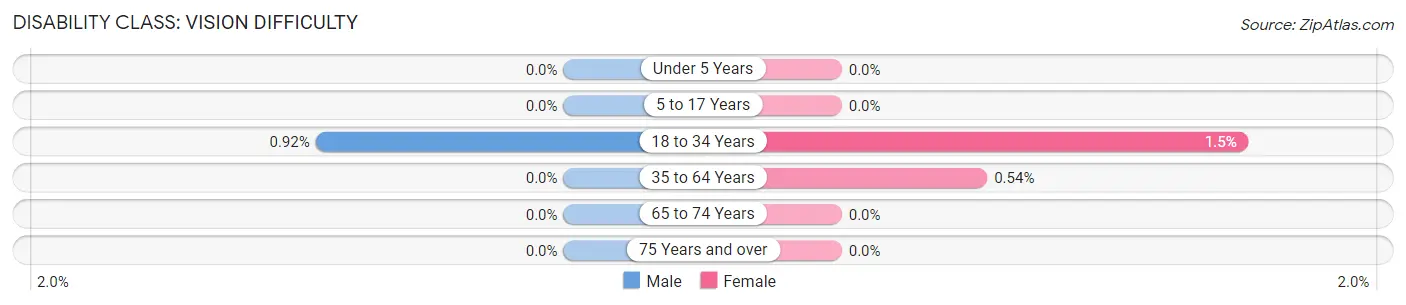
| Age Bracket | Male | Female |
| Under 5 Years | 0 (0.0%) | 0 (0.0%) |
| 5 to 17 Years | 0 (0.0%) | 0 (0.0%) |
| 18 to 34 Years | 4 (0.9%) | 6 (1.5%) |
| 35 to 64 Years | 0 (0.0%) | 2 (0.5%) |
| 65 to 74 Years | 0 (0.0%) | 0 (0.0%) |
| 75 Years and over | 0 (0.0%) | 0 (0.0%) |
Disability Class: Cognitive Difficulty
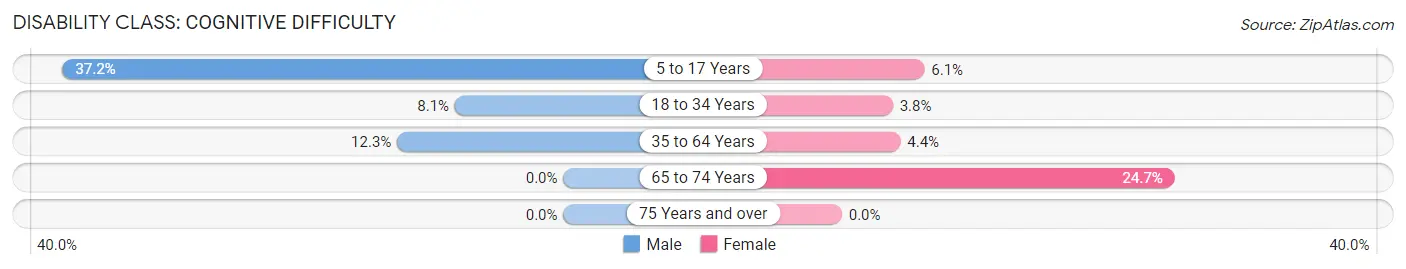
| Age Bracket | Male | Female |
| 5 to 17 Years | 45 (37.2%) | 10 (6.1%) |
| 18 to 34 Years | 35 (8.1%) | 15 (3.8%) |
| 35 to 64 Years | 48 (12.3%) | 16 (4.3%) |
| 65 to 74 Years | 0 (0.0%) | 21 (24.7%) |
| 75 Years and over | 0 (0.0%) | 0 (0.0%) |
Disability Class: Ambulatory Difficulty
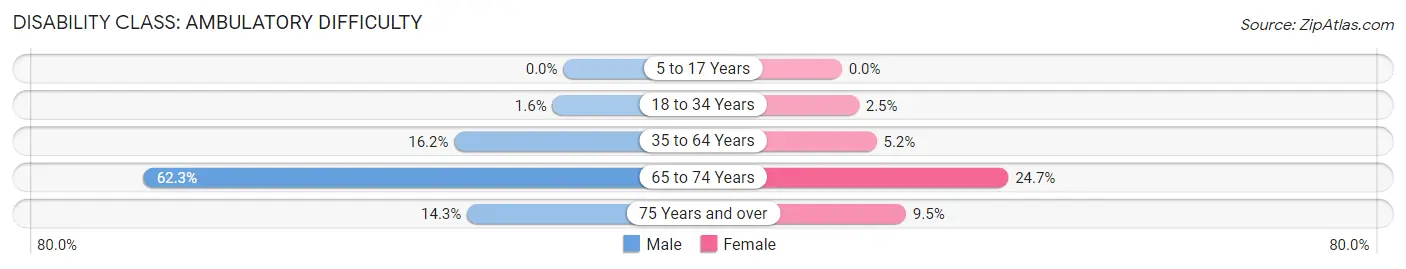
| Age Bracket | Male | Female |
| 5 to 17 Years | 0 (0.0%) | 0 (0.0%) |
| 18 to 34 Years | 7 (1.6%) | 10 (2.5%) |
| 35 to 64 Years | 63 (16.2%) | 19 (5.2%) |
| 65 to 74 Years | 38 (62.3%) | 21 (24.7%) |
| 75 Years and over | 8 (14.3%) | 10 (9.5%) |
Disability Class: Self-Care Difficulty
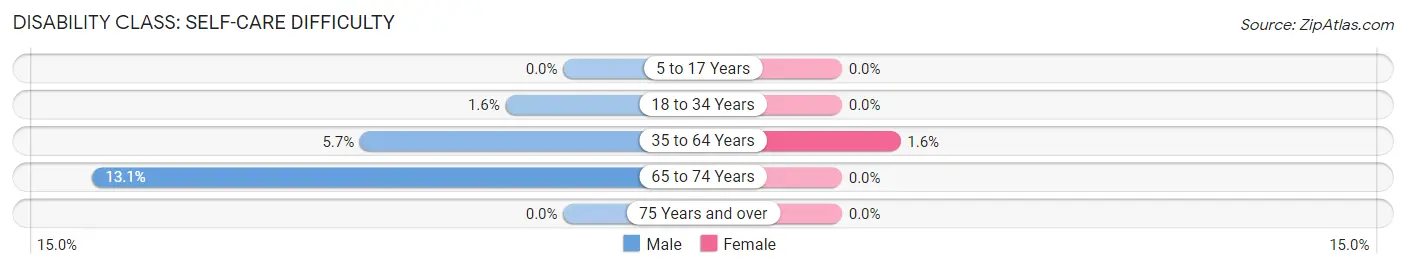
| Age Bracket | Male | Female |
| 5 to 17 Years | 0 (0.0%) | 0 (0.0%) |
| 18 to 34 Years | 7 (1.6%) | 0 (0.0%) |
| 35 to 64 Years | 22 (5.7%) | 6 (1.6%) |
| 65 to 74 Years | 8 (13.1%) | 0 (0.0%) |
| 75 Years and over | 0 (0.0%) | 0 (0.0%) |
Technology Access in Knob Noster
Computing Device Access in Knob Noster
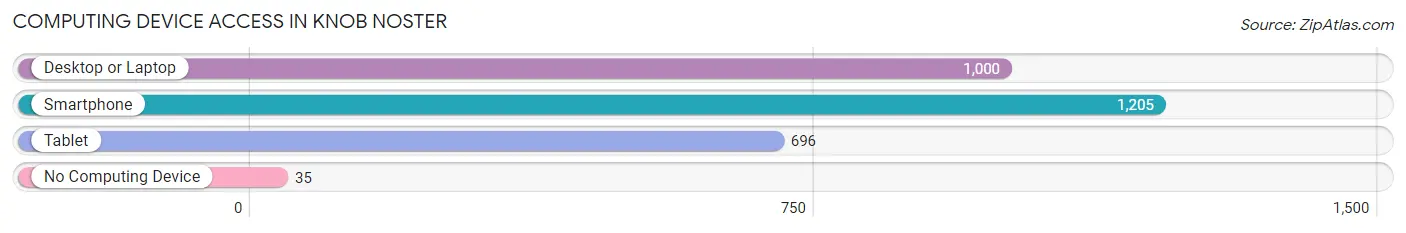
| Device Type | # Households | % Households |
| Desktop or Laptop | 1,000 | 76.6% |
| Smartphone | 1,205 | 92.3% |
| Tablet | 696 | 53.3% |
| No Computing Device | 35 | 2.7% |
| Total | 1,305 | 100.0% |
Internet Access in Knob Noster
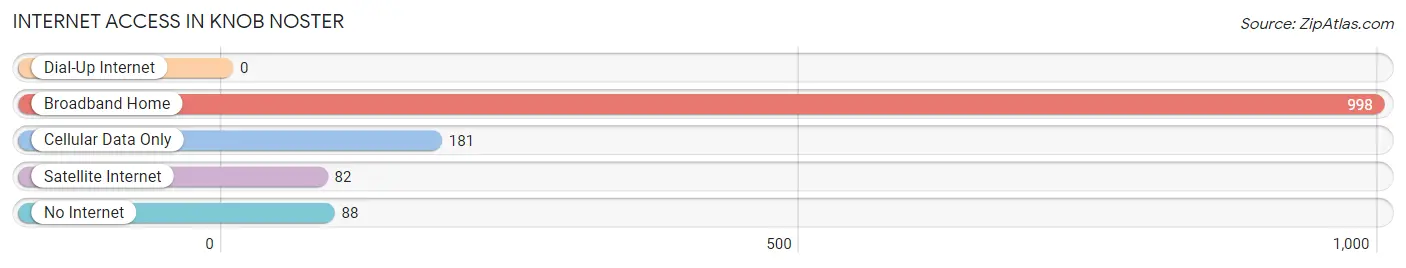
| Internet Type | # Households | % Households |
| Dial-Up Internet | 0 | 0.0% |
| Broadband Home | 998 | 76.5% |
| Cellular Data Only | 181 | 13.9% |
| Satellite Internet | 82 | 6.3% |
| No Internet | 88 | 6.7% |
| Total | 1,305 | 100.0% |
Knob Noster Summary
Knob Noster, Missouri is a small town located in Johnson County, Missouri. It is situated about 40 miles east of Kansas City and is part of the Warrensburg Micropolitan Statistical Area. The town was founded in 1871 and was named after a nearby hill, which was known as “Knob Noster”. The town has a population of approximately 2,000 people and is known for its small-town charm and friendly atmosphere.
Geography
Knob Noster is located in the western part of Johnson County, Missouri. It is situated on the western edge of the Ozark Plateau, which is a region of rolling hills and valleys. The town is located at an elevation of 890 feet above sea level and is surrounded by the towns of Warrensburg, Holden, and Whiteman Air Force Base. The town is located in a rural area and is surrounded by farmland and wooded areas.
The climate in Knob Noster is typical of the Midwest, with hot summers and cold winters. The average temperature in the summer is around 80 degrees Fahrenheit, while the average temperature in the winter is around 30 degrees Fahrenheit. The town receives an average of 40 inches of precipitation per year, with most of it falling in the spring and summer months.
Demographics
As of the 2010 census, the population of Knob Noster was 2,000 people. The racial makeup of the town was 95.2% White, 1.2% African American, 0.7% Native American, 0.3% Asian, 0.1% Pacific Islander, 0.7% from other races, and 1.7% from two or more races. Hispanic or Latino of any race were 2.2% of the population.
The median household income in Knob Noster was $41,250, and the median family income was $50,000. The per capita income for the town was $20,845. About 11.2% of families and 14.2% of the population were below the poverty line, including 18.2% of those under age 18 and 8.3% of those age 65 or over.
Economy
Knob Noster’s economy is largely based on agriculture and manufacturing. The town is home to several large farms, which produce a variety of crops, including corn, soybeans, wheat, and hay. The town is also home to several manufacturing companies, which produce a variety of products, including furniture, automotive parts, and electronics.
Knob Noster is also home to Whiteman Air Force Base, which is the largest employer in the town. The base is home to the 509th Bomb Wing, which is the only unit in the Air Force that is capable of delivering nuclear weapons. The base also provides a variety of services to the local community, including medical care, education, and recreation.
Conclusion
Knob Noster, Missouri is a small town located in Johnson County, Missouri. It is situated about 40 miles east of Kansas City and is part of the Warrensburg Micropolitan Statistical Area. The town was founded in 1871 and was named after a nearby hill, which was known as “Knob Noster”. The town has a population of approximately 2,000 people and is known for its small-town charm and friendly atmosphere. The town’s economy is largely based on agriculture and manufacturing, and it is also home to Whiteman Air Force Base, which is the largest employer in the town.
Common Questions
What is Per Capita Income in Knob Noster?
Per Capita income in Knob Noster is $30,600.
What is the Median Family Income in Knob Noster?
Median Family Income in Knob Noster is $75,625.
What is the Median Household income in Knob Noster?
Median Household Income in Knob Noster is $49,640.
What is Income or Wage Gap in Knob Noster?
Income or Wage Gap in Knob Noster is 30.0%.
Women in Knob Noster earn 70.0 cents for every dollar earned by a man.
What is Inequality or Gini Index in Knob Noster?
Inequality or Gini Index in Knob Noster is 0.36.
What is the Total Population of Knob Noster?
Total Population of Knob Noster is 2,793.
What is the Total Male Population of Knob Noster?
Total Male Population of Knob Noster is 1,458.
What is the Total Female Population of Knob Noster?
Total Female Population of Knob Noster is 1,335.
What is the Ratio of Males per 100 Females in Knob Noster?
There are 109.21 Males per 100 Females in Knob Noster.
What is the Ratio of Females per 100 Males in Knob Noster?
There are 91.56 Females per 100 Males in Knob Noster.
What is the Median Population Age in Knob Noster?
Median Population Age in Knob Noster is 29.5 Years.
What is the Average Family Size in Knob Noster
Average Family Size in Knob Noster is 3.2 People.
What is the Average Household Size in Knob Noster
Average Household Size in Knob Noster is 2.1 People.
How Large is the Labor Force in Knob Noster?
There are 1,650 People in the Labor Forcein in Knob Noster.
What is the Percentage of People in the Labor Force in Knob Noster?
72.5% of People are in the Labor Force in Knob Noster.
What is the Unemployment Rate in Knob Noster?
Unemployment Rate in Knob Noster is 8.9%.