Cramerton, NC Map & Demographics
Cramerton Map
Cramerton Overview
$46,776
PER CAPITA INCOME
$101,971
AVG FAMILY INCOME
$89,313
AVG HOUSEHOLD INCOME
41.1%
WAGE / INCOME GAP [ % ]
58.9¢/ $1
WAGE / INCOME GAP [ $ ]
0.43
INEQUALITY / GINI INDEX
5,294
TOTAL POPULATION
2,559
MALE POPULATION
2,735
FEMALE POPULATION
93.56
MALES / 100 FEMALES
106.88
FEMALES / 100 MALES
35.3
MEDIAN AGE
3.0
AVG FAMILY SIZE
2.5
AVG HOUSEHOLD SIZE
3,090
LABOR FORCE [ PEOPLE ]
74.5%
PERCENT IN LABOR FORCE
4.7%
UNEMPLOYMENT RATE
Cramerton Zip Codes
Cramerton Area Codes
Income in Cramerton
Income Overview in Cramerton
Per Capita Income in Cramerton is $46,776, while median incomes of families and households are $101,971 and $89,313 respectively.
| Characteristic | Number | Measure |
| Per Capita Income | 5,294 | $46,776 |
| Median Family Income | 1,482 | $101,971 |
| Mean Family Income | 1,482 | $131,073 |
| Median Household Income | 2,147 | $89,313 |
| Mean Household Income | 2,147 | $112,477 |
| Income Deficit | 1,482 | $0 |
| Wage / Income Gap (%) | 5,294 | 41.10% |
| Wage / Income Gap ($) | 5,294 | 58.90¢ per $1 |
| Gini / Inequality Index | 5,294 | 0.43 |
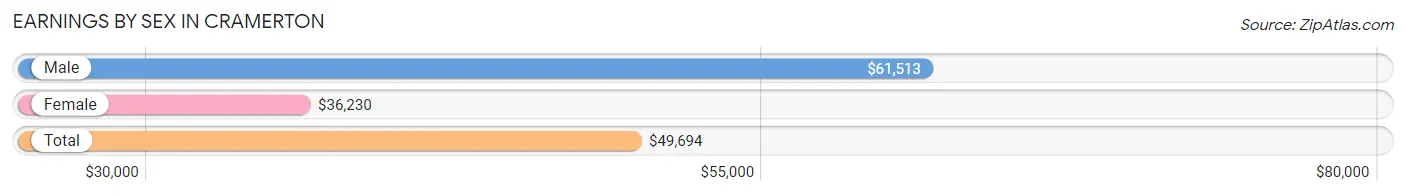
Earnings by Sex in Cramerton
Average Earnings in Cramerton are $49,694, $61,513 for men and $36,230 for women, a difference of 41.1%.
| Sex | Number | Average Earnings |
| Male | 1,549 (49.2%) | $61,513 |
| Female | 1,597 (50.8%) | $36,230 |
| Total | 3,146 (100.0%) | $49,694 |
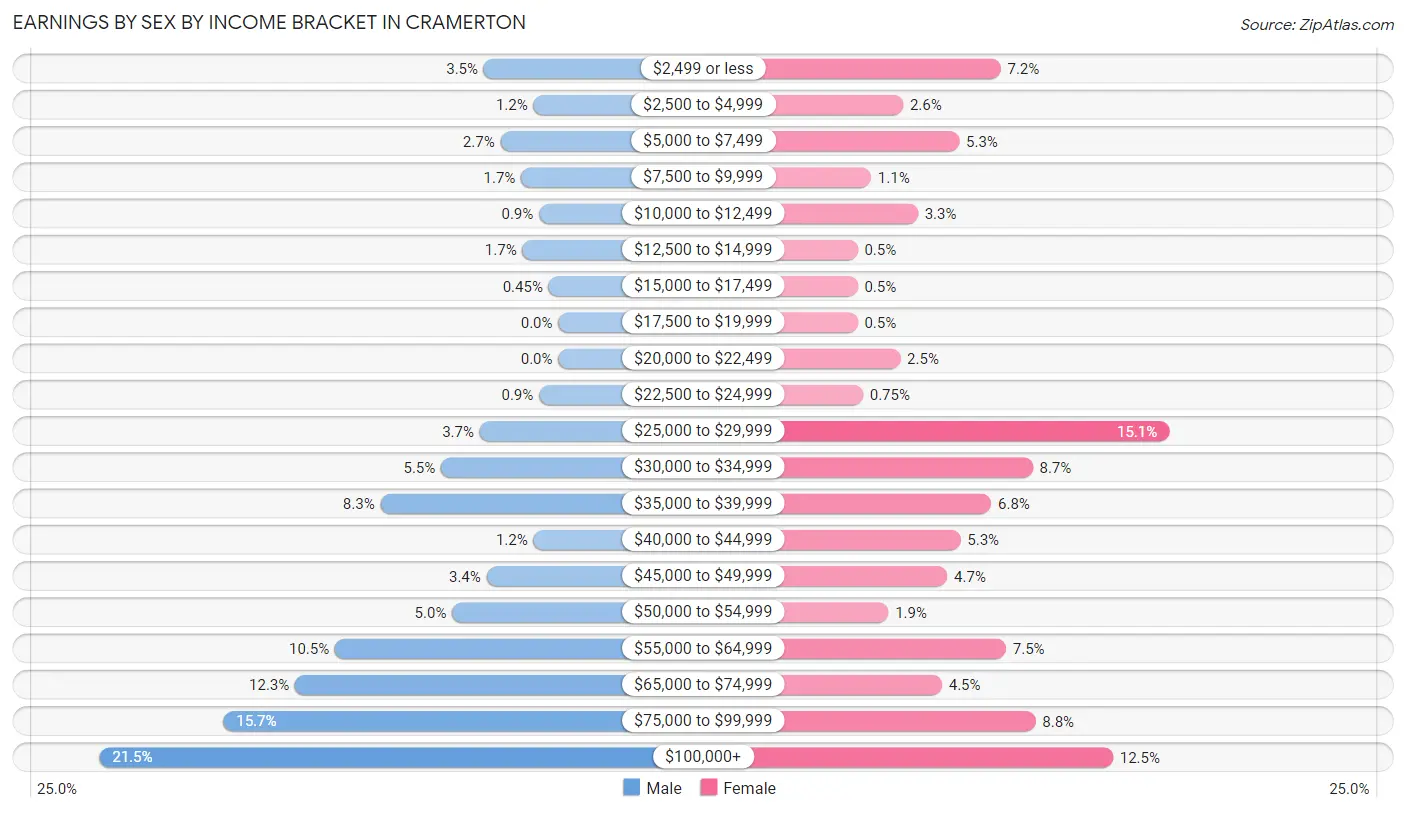
Earnings by Sex by Income Bracket in Cramerton
The most common earnings brackets in Cramerton are $100,000+ for men (333 | 21.5%) and $25,000 to $29,999 for women (241 | 15.1%).
| Income | Male | Female |
| $2,499 or less | 54 (3.5%) | 115 (7.2%) |
| $2,500 to $4,999 | 18 (1.2%) | 42 (2.6%) |
| $5,000 to $7,499 | 42 (2.7%) | 84 (5.3%) |
| $7,500 to $9,999 | 27 (1.7%) | 18 (1.1%) |
| $10,000 to $12,499 | 14 (0.9%) | 53 (3.3%) |
| $12,500 to $14,999 | 26 (1.7%) | 8 (0.5%) |
| $15,000 to $17,499 | 7 (0.4%) | 8 (0.5%) |
| $17,500 to $19,999 | 0 (0.0%) | 8 (0.5%) |
| $20,000 to $22,499 | 0 (0.0%) | 40 (2.5%) |
| $22,500 to $24,999 | 14 (0.9%) | 12 (0.7%) |
| $25,000 to $29,999 | 57 (3.7%) | 241 (15.1%) |
| $30,000 to $34,999 | 85 (5.5%) | 139 (8.7%) |
| $35,000 to $39,999 | 129 (8.3%) | 108 (6.8%) |
| $40,000 to $44,999 | 18 (1.2%) | 85 (5.3%) |
| $45,000 to $49,999 | 52 (3.4%) | 75 (4.7%) |
| $50,000 to $54,999 | 77 (5.0%) | 31 (1.9%) |
| $55,000 to $64,999 | 162 (10.5%) | 119 (7.4%) |
| $65,000 to $74,999 | 191 (12.3%) | 71 (4.4%) |
| $75,000 to $99,999 | 243 (15.7%) | 141 (8.8%) |
| $100,000+ | 333 (21.5%) | 199 (12.5%) |
| Total | 1,549 (100.0%) | 1,597 (100.0%) |
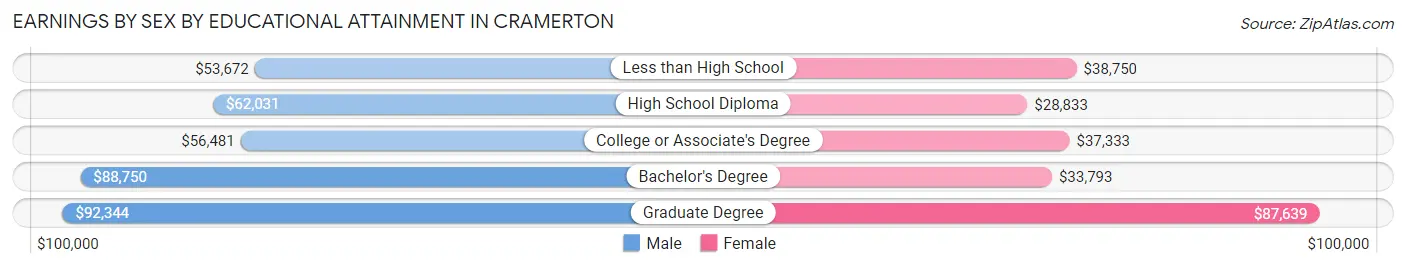
Earnings by Sex by Educational Attainment in Cramerton
Average earnings in Cramerton are $67,963 for men and $38,587 for women, a difference of 43.2%. Men with an educational attainment of graduate degree enjoy the highest average annual earnings of $92,344, while those with less than high school education earn the least with $53,672. Women with an educational attainment of graduate degree earn the most with the average annual earnings of $87,639, while those with high school diploma education have the smallest earnings of $28,833.
| Educational Attainment | Male Income | Female Income |
| Less than High School | $53,672 | $38,750 |
| High School Diploma | $62,031 | $28,833 |
| College or Associate's Degree | $56,481 | $37,333 |
| Bachelor's Degree | $88,750 | $33,793 |
| Graduate Degree | $92,344 | $87,639 |
| Total | $67,963 | $38,587 |
Family Income in Cramerton
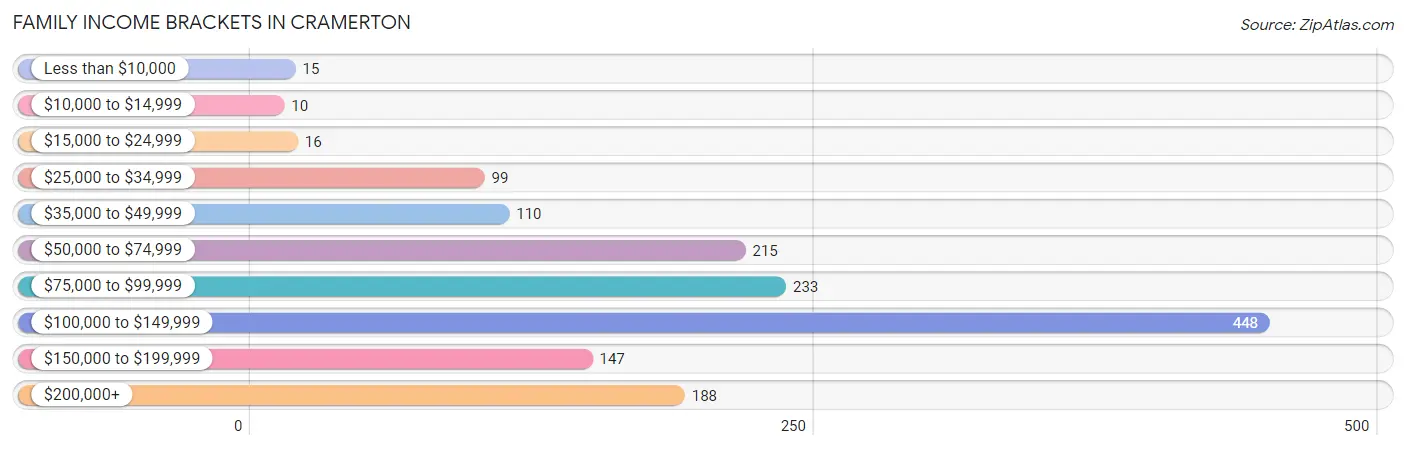
Family Income Brackets in Cramerton
According to the Cramerton family income data, there are 448 families falling into the $100,000 to $149,999 income range, which is the most common income bracket and makes up 30.2% of all families. Conversely, the $10,000 to $14,999 income bracket is the least frequent group with only 10 families (0.7%) belonging to this category.
| Income Bracket | # Families | % Families |
| Less than $10,000 | 15 | 1.0% |
| $10,000 to $14,999 | 10 | 0.7% |
| $15,000 to $24,999 | 16 | 1.1% |
| $25,000 to $34,999 | 99 | 6.7% |
| $35,000 to $49,999 | 110 | 7.4% |
| $50,000 to $74,999 | 215 | 14.5% |
| $75,000 to $99,999 | 233 | 15.7% |
| $100,000 to $149,999 | 448 | 30.2% |
| $150,000 to $199,999 | 147 | 9.9% |
| $200,000+ | 188 | 12.7% |
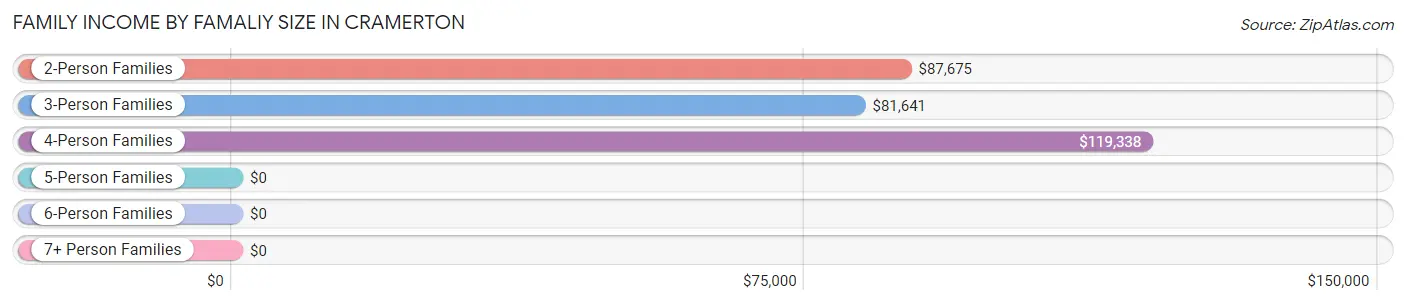
Family Income by Famaliy Size in Cramerton
4-person families (375 | 25.3%) account for the highest median family income in Cramerton with $119,338 per family, while 2-person families (685 | 46.2%) have the highest median income of $43,838 per family member.
| Income Bracket | # Families | Median Income |
| 2-Person Families | 685 (46.2%) | $87,675 |
| 3-Person Families | 357 (24.1%) | $81,641 |
| 4-Person Families | 375 (25.3%) | $119,338 |
| 5-Person Families | 47 (3.2%) | $0 |
| 6-Person Families | 18 (1.2%) | $0 |
| 7+ Person Families | 0 (0.0%) | $0 |
| Total | 1,482 (100.0%) | $101,971 |
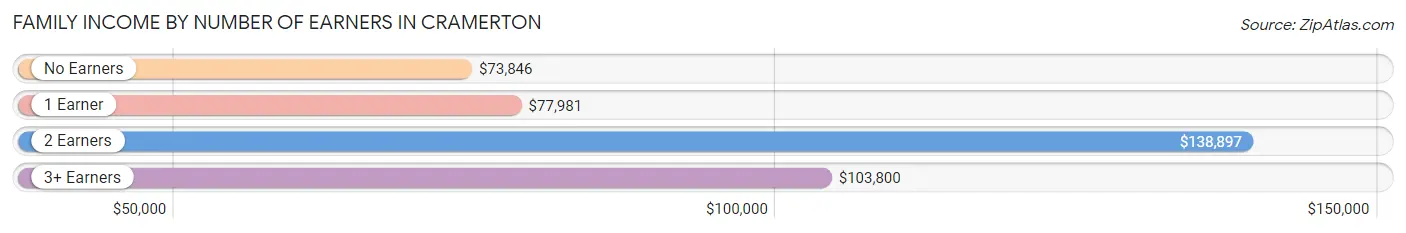
Family Income by Number of Earners in Cramerton
The median family income in Cramerton is $101,971, with families comprising 2 earners (709) having the highest median family income of $138,897, while families with no earners (144) have the lowest median family income of $73,846, accounting for 47.8% and 9.7% of families, respectively.
| Number of Earners | # Families | Median Income |
| No Earners | 144 (9.7%) | $73,846 |
| 1 Earner | 465 (31.4%) | $77,981 |
| 2 Earners | 709 (47.8%) | $138,897 |
| 3+ Earners | 164 (11.1%) | $103,800 |
| Total | 1,482 (100.0%) | $101,971 |
Household Income in Cramerton
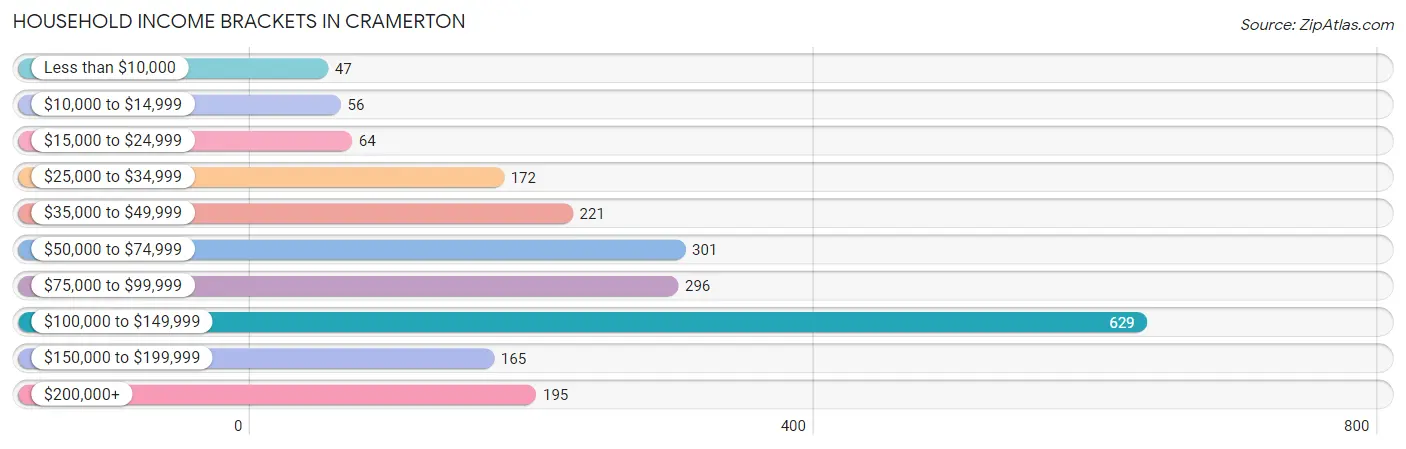
Household Income Brackets in Cramerton
With 629 households falling in the category, the $100,000 to $149,999 income range is the most frequent in Cramerton, accounting for 29.3% of all households. In contrast, only 47 households (2.2%) fall into the less than $10,000 income bracket, making it the least populous group.
| Income Bracket | # Households | % Households |
| Less than $10,000 | 47 | 2.2% |
| $10,000 to $14,999 | 56 | 2.6% |
| $15,000 to $24,999 | 64 | 3.0% |
| $25,000 to $34,999 | 172 | 8.0% |
| $35,000 to $49,999 | 221 | 10.3% |
| $50,000 to $74,999 | 301 | 14.0% |
| $75,000 to $99,999 | 296 | 13.8% |
| $100,000 to $149,999 | 629 | 29.3% |
| $150,000 to $199,999 | 165 | 7.7% |
| $200,000+ | 195 | 9.1% |
Household Income by Householder Age in Cramerton
The median household income in Cramerton is $89,313, with the highest median household income of $103,627 found in the 45 to 64 years age bracket for the primary householder. A total of 780 households (36.3%) fall into this category. Meanwhile, the 15 to 24 years age bracket for the primary householder has the lowest median household income of $0, with 18 households (0.8%) in this group.
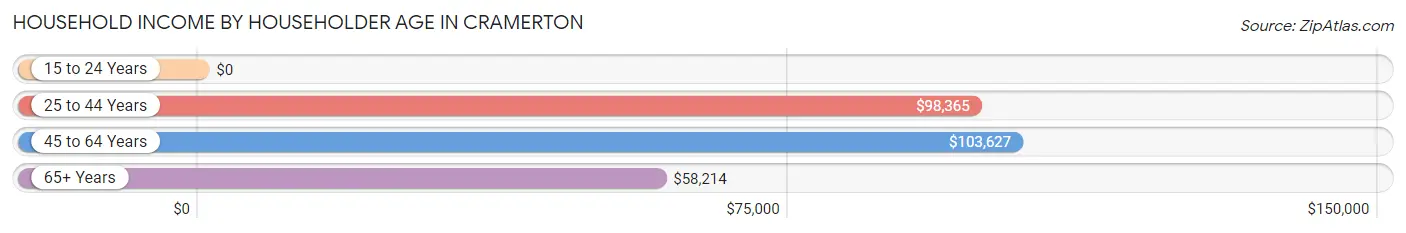
| Income Bracket | # Households | Median Income |
| 15 to 24 Years | 18 (0.8%) | $0 |
| 25 to 44 Years | 871 (40.6%) | $98,365 |
| 45 to 64 Years | 780 (36.3%) | $103,627 |
| 65+ Years | 478 (22.3%) | $58,214 |
| Total | 2,147 (100.0%) | $89,313 |
Poverty in Cramerton
Income Below Poverty by Sex and Age in Cramerton
With 2.5% poverty level for males and 3.8% for females among the residents of Cramerton, 18 to 24 year old males and 65 to 74 year old females are the most vulnerable to poverty, with 7 males (8.3%) and 24 females (12.3%) in their respective age groups living below the poverty level.
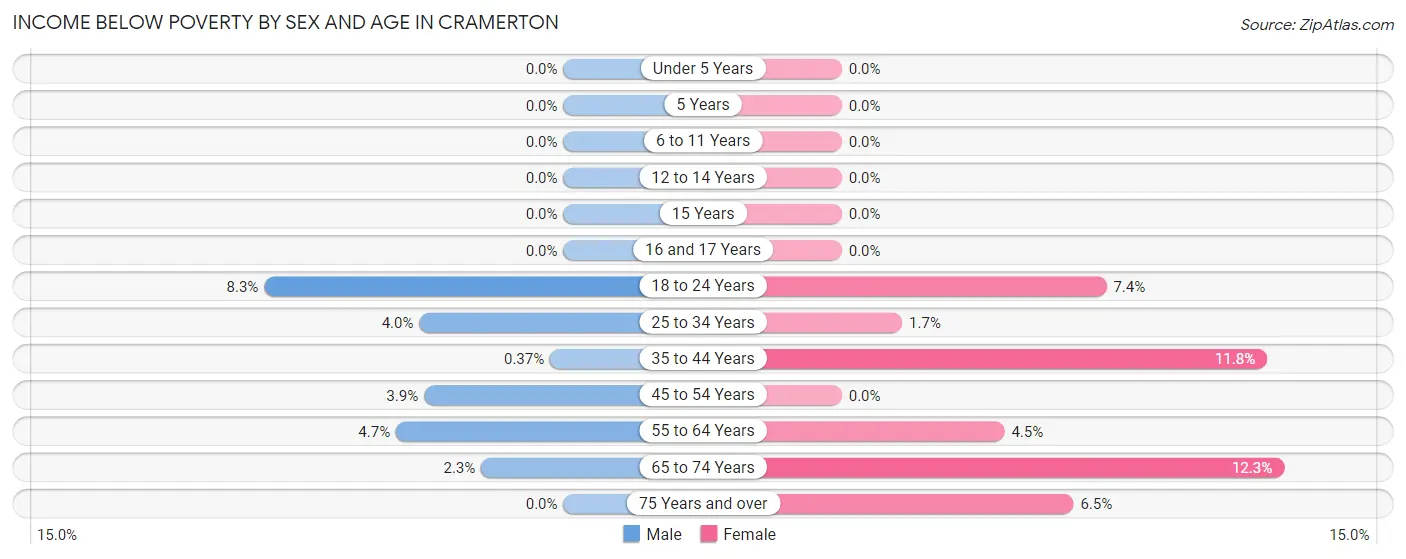
| Age Bracket | Male | Female |
| Under 5 Years | 0 (0.0%) | 0 (0.0%) |
| 5 Years | 0 (0.0%) | 0 (0.0%) |
| 6 to 11 Years | 0 (0.0%) | 0 (0.0%) |
| 12 to 14 Years | 0 (0.0%) | 0 (0.0%) |
| 15 Years | 0 (0.0%) | 0 (0.0%) |
| 16 and 17 Years | 0 (0.0%) | 0 (0.0%) |
| 18 to 24 Years | 7 (8.3%) | 7 (7.4%) |
| 25 to 34 Years | 19 (4.0%) | 11 (1.7%) |
| 35 to 44 Years | 1 (0.4%) | 38 (11.8%) |
| 45 to 54 Years | 12 (3.9%) | 0 (0.0%) |
| 55 to 64 Years | 19 (4.7%) | 15 (4.5%) |
| 65 to 74 Years | 5 (2.3%) | 24 (12.3%) |
| 75 Years and over | 0 (0.0%) | 8 (6.5%) |
| Total | 63 (2.5%) | 103 (3.8%) |
Income Above Poverty by Sex and Age in Cramerton
According to the poverty statistics in Cramerton, males aged under 5 years and females aged under 5 years are the age groups that are most secure financially, with 100.0% of males and 100.0% of females in these age groups living above the poverty line.
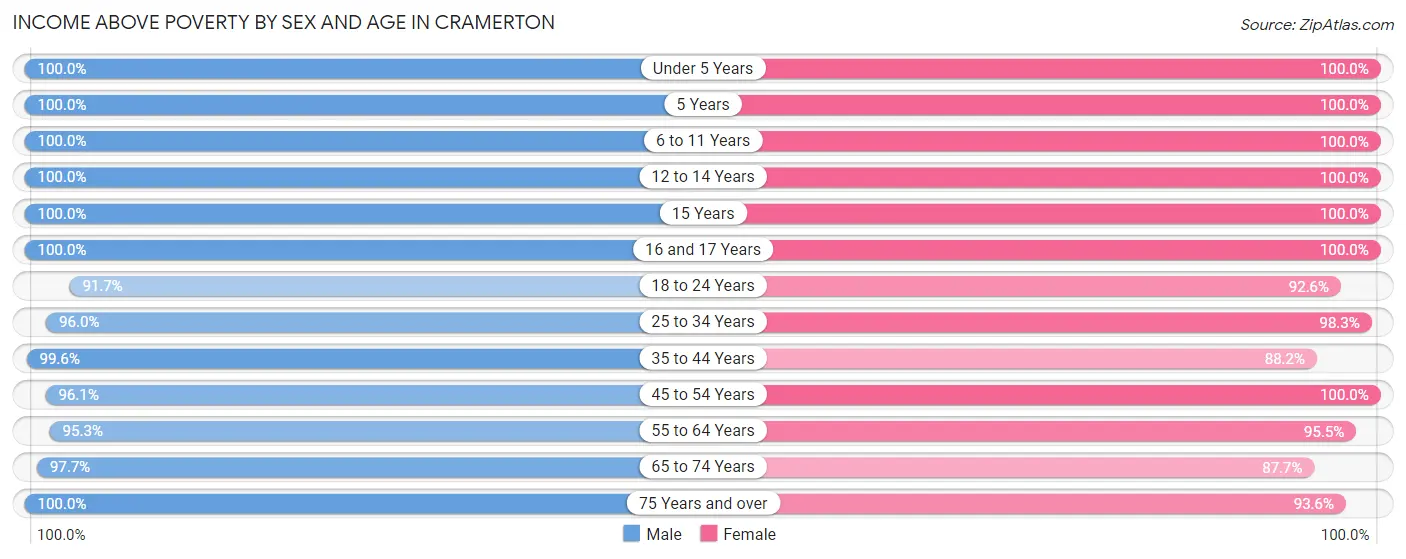
| Age Bracket | Male | Female |
| Under 5 Years | 172 (100.0%) | 173 (100.0%) |
| 5 Years | 96 (100.0%) | 32 (100.0%) |
| 6 to 11 Years | 233 (100.0%) | 181 (100.0%) |
| 12 to 14 Years | 81 (100.0%) | 105 (100.0%) |
| 15 Years | 38 (100.0%) | 17 (100.0%) |
| 16 and 17 Years | 54 (100.0%) | 104 (100.0%) |
| 18 to 24 Years | 77 (91.7%) | 88 (92.6%) |
| 25 to 34 Years | 455 (96.0%) | 645 (98.3%) |
| 35 to 44 Years | 271 (99.6%) | 283 (88.2%) |
| 45 to 54 Years | 297 (96.1%) | 382 (100.0%) |
| 55 to 64 Years | 389 (95.3%) | 316 (95.5%) |
| 65 to 74 Years | 213 (97.7%) | 171 (87.7%) |
| 75 Years and over | 113 (100.0%) | 116 (93.5%) |
| Total | 2,489 (97.5%) | 2,613 (96.2%) |
Income Below Poverty Among Married-Couple Families in Cramerton
The poverty statistics for married-couple families in Cramerton show that 1.8% or 21 of the total 1,135 families live below the poverty line. Families with no children have the highest poverty rate of 3.3%, comprising of 21 families. On the other hand, families with 1 or 2 children have the lowest poverty rate of 0.0%, which includes 0 families.
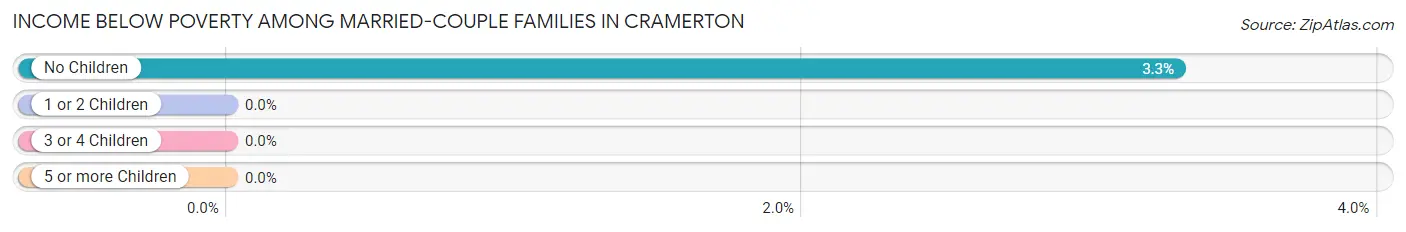
| Children | Above Poverty | Below Poverty |
| No Children | 616 (96.7%) | 21 (3.3%) |
| 1 or 2 Children | 451 (100.0%) | 0 (0.0%) |
| 3 or 4 Children | 47 (100.0%) | 0 (0.0%) |
| 5 or more Children | 0 (0.0%) | 0 (0.0%) |
| Total | 1,114 (98.2%) | 21 (1.8%) |
Income Below Poverty Among Single-Parent Households in Cramerton
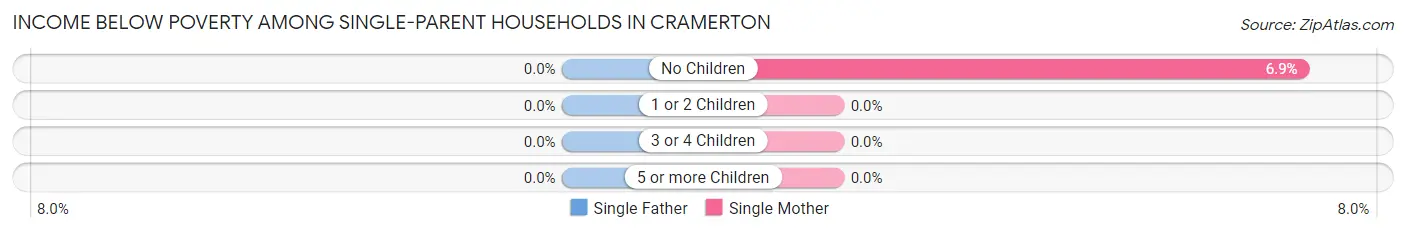
| Children | Single Father | Single Mother |
| No Children | 0 (0.0%) | 5 (6.9%) |
| 1 or 2 Children | 0 (0.0%) | 0 (0.0%) |
| 3 or 4 Children | 0 (0.0%) | 0 (0.0%) |
| 5 or more Children | 0 (0.0%) | 0 (0.0%) |
| Total | 0 (0.0%) | 5 (2.2%) |
Income Below Poverty Among Married-Couple vs Single-Parent Households in Cramerton
The poverty data for Cramerton shows that 21 of the married-couple family households (1.8%) and 5 of the single-parent households (1.4%) are living below the poverty level. Within the married-couple family households, those with no children have the highest poverty rate, with 21 households (3.3%) falling below the poverty line. Among the single-parent households, those with no children have the highest poverty rate, with 5 household (3.2%) living below poverty.
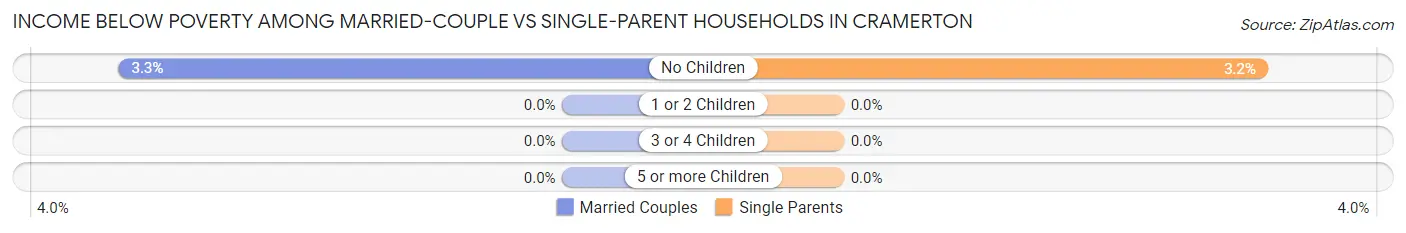
| Children | Married-Couple Families | Single-Parent Households |
| No Children | 21 (3.3%) | 5 (3.2%) |
| 1 or 2 Children | 0 (0.0%) | 0 (0.0%) |
| 3 or 4 Children | 0 (0.0%) | 0 (0.0%) |
| 5 or more Children | 0 (0.0%) | 0 (0.0%) |
| Total | 21 (1.8%) | 5 (1.4%) |
Race in Cramerton
The most populous races in Cramerton are White / Caucasian (4,078 | 77.0%), Black / African American (776 | 14.7%), and Hispanic or Latino (191 | 3.6%).
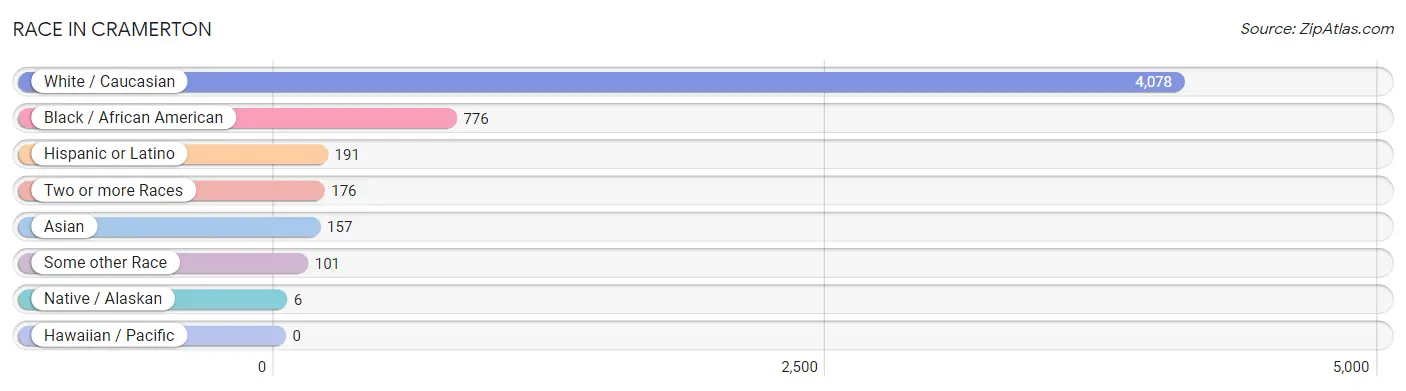
| Race | # Population | % Population |
| Asian | 157 | 3.0% |
| Black / African American | 776 | 14.7% |
| Hawaiian / Pacific | 0 | 0.0% |
| Hispanic or Latino | 191 | 3.6% |
| Native / Alaskan | 6 | 0.1% |
| White / Caucasian | 4,078 | 77.0% |
| Two or more Races | 176 | 3.3% |
| Some other Race | 101 | 1.9% |
| Total | 5,294 | 100.0% |
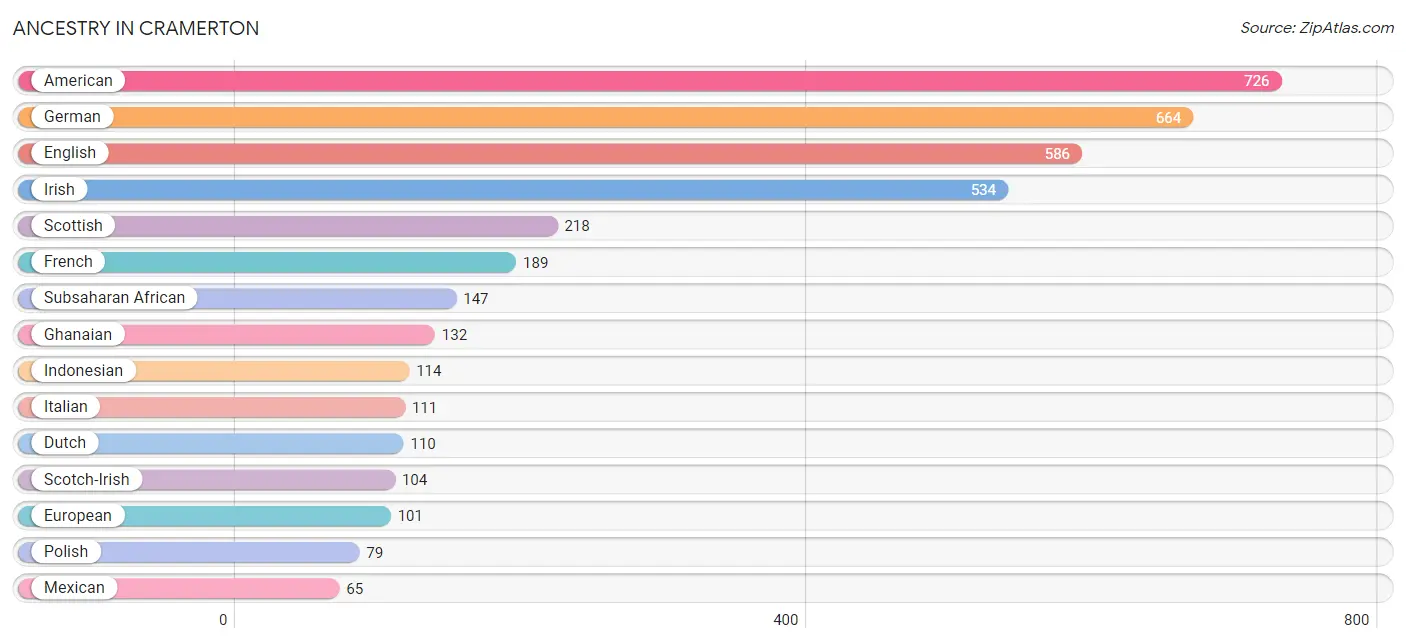
Ancestry in Cramerton
The most populous ancestries reported in Cramerton are American (726 | 13.7%), German (664 | 12.5%), English (586 | 11.1%), Irish (534 | 10.1%), and Scottish (218 | 4.1%), together accounting for 51.5% of all Cramerton residents.
| Ancestry | # Population | % Population |
| American | 726 | 13.7% |
| Arab | 30 | 0.6% |
| Bhutanese | 22 | 0.4% |
| Brazilian | 26 | 0.5% |
| British | 63 | 1.2% |
| Cherokee | 63 | 1.2% |
| Colombian | 9 | 0.2% |
| Cuban | 57 | 1.1% |
| Cypriot | 8 | 0.2% |
| Czechoslovakian | 7 | 0.1% |
| Dutch | 110 | 2.1% |
| English | 586 | 11.1% |
| European | 101 | 1.9% |
| French | 189 | 3.6% |
| French Canadian | 18 | 0.3% |
| German | 664 | 12.5% |
| Ghanaian | 132 | 2.5% |
| Greek | 7 | 0.1% |
| Hungarian | 5 | 0.1% |
| Indian (Asian) | 21 | 0.4% |
| Indonesian | 114 | 2.1% |
| Irish | 534 | 10.1% |
| Italian | 111 | 2.1% |
| Korean | 6 | 0.1% |
| Lebanese | 21 | 0.4% |
| Lithuanian | 9 | 0.2% |
| Lumbee | 9 | 0.2% |
| Mexican | 65 | 1.2% |
| Navajo | 18 | 0.3% |
| Peruvian | 8 | 0.2% |
| Polish | 79 | 1.5% |
| Russian | 23 | 0.4% |
| Scotch-Irish | 104 | 2.0% |
| Scottish | 218 | 4.1% |
| Slavic | 9 | 0.2% |
| Slovene | 15 | 0.3% |
| South American | 41 | 0.8% |
| Spanish | 7 | 0.1% |
| Subsaharan African | 147 | 2.8% |
| Sudanese | 15 | 0.3% |
| Swedish | 25 | 0.5% |
| Swiss | 50 | 0.9% |
| Syrian | 9 | 0.2% |
| Venezuelan | 24 | 0.4% |
| Welsh | 55 | 1.0% | View All 45 Rows |
Immigrants in Cramerton
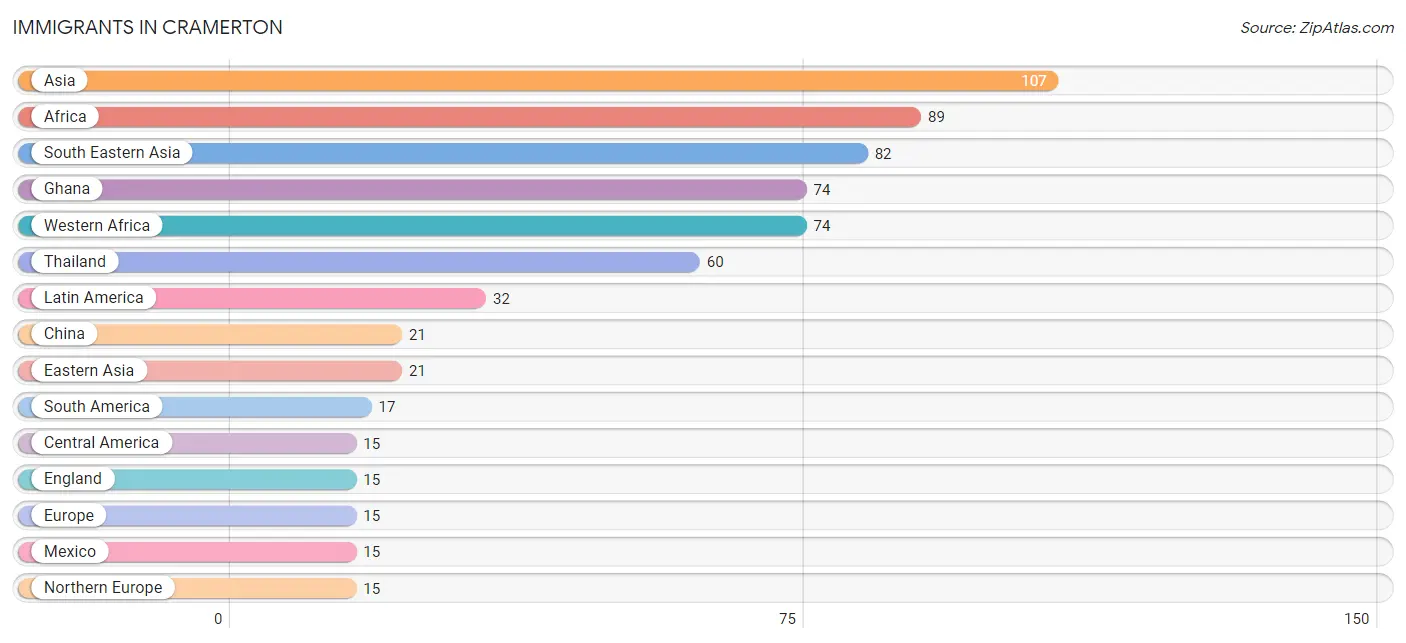
The most numerous immigrant groups reported in Cramerton came from Asia (107 | 2.0%), Africa (89 | 1.7%), South Eastern Asia (82 | 1.5%), Ghana (74 | 1.4%), and Western Africa (74 | 1.4%), together accounting for 8.1% of all Cramerton residents.
| Immigration Origin | # Population | % Population |
| Africa | 89 | 1.7% |
| Asia | 107 | 2.0% |
| Canada | 11 | 0.2% |
| Central America | 15 | 0.3% |
| China | 21 | 0.4% |
| Colombia | 9 | 0.2% |
| Eastern Asia | 21 | 0.4% |
| England | 15 | 0.3% |
| Europe | 15 | 0.3% |
| Ghana | 74 | 1.4% |
| Latin America | 32 | 0.6% |
| Lebanon | 4 | 0.1% |
| Mexico | 15 | 0.3% |
| Northern Europe | 15 | 0.3% |
| Peru | 8 | 0.2% |
| South Africa | 15 | 0.3% |
| South America | 17 | 0.3% |
| South Eastern Asia | 82 | 1.5% |
| Thailand | 60 | 1.1% |
| Western Africa | 74 | 1.4% |
| Western Asia | 4 | 0.1% | View All 21 Rows |
Sex and Age in Cramerton
Sex and Age in Cramerton
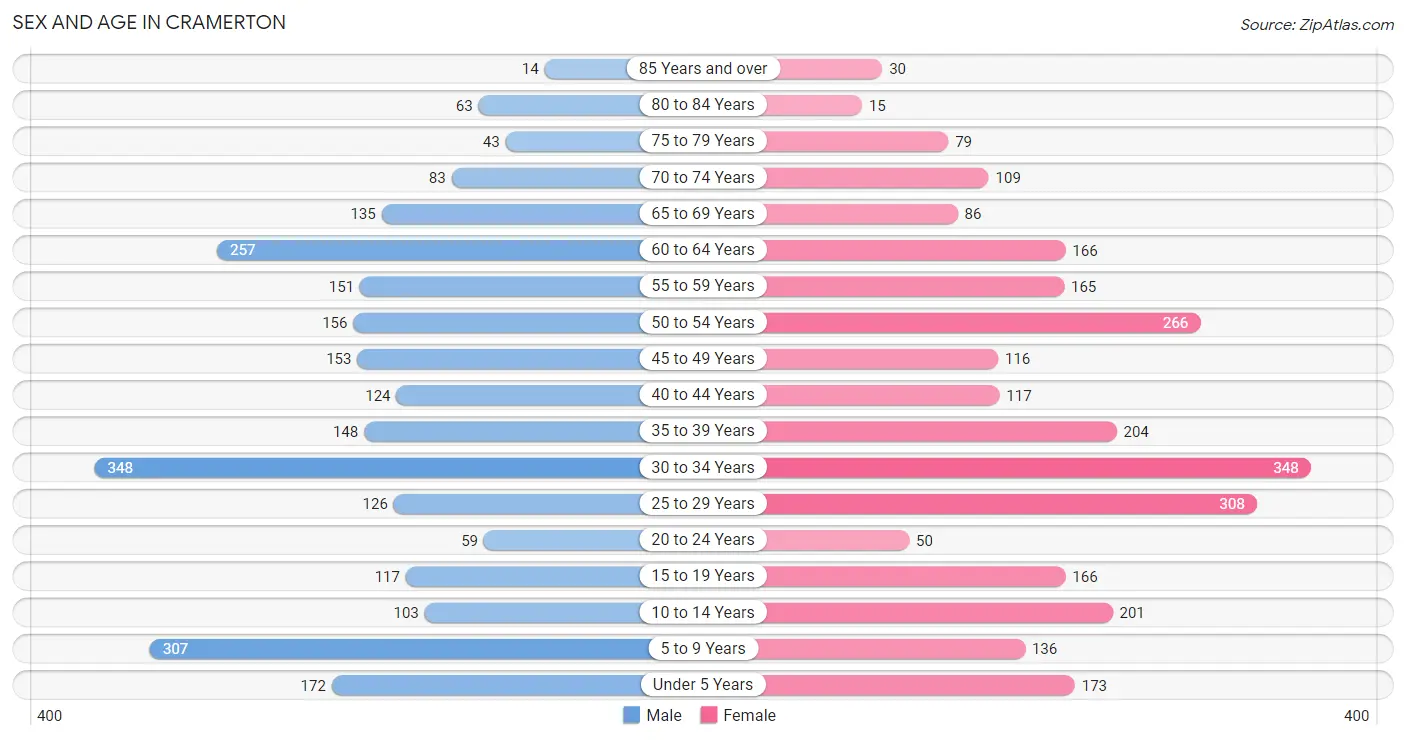
The most populous age groups in Cramerton are 30 to 34 Years (348 | 13.6%) for men and 30 to 34 Years (348 | 12.7%) for women.
| Age Bracket | Male | Female |
| Under 5 Years | 172 (6.7%) | 173 (6.3%) |
| 5 to 9 Years | 307 (12.0%) | 136 (5.0%) |
| 10 to 14 Years | 103 (4.0%) | 201 (7.3%) |
| 15 to 19 Years | 117 (4.6%) | 166 (6.1%) |
| 20 to 24 Years | 59 (2.3%) | 50 (1.8%) |
| 25 to 29 Years | 126 (4.9%) | 308 (11.3%) |
| 30 to 34 Years | 348 (13.6%) | 348 (12.7%) |
| 35 to 39 Years | 148 (5.8%) | 204 (7.5%) |
| 40 to 44 Years | 124 (4.9%) | 117 (4.3%) |
| 45 to 49 Years | 153 (6.0%) | 116 (4.2%) |
| 50 to 54 Years | 156 (6.1%) | 266 (9.7%) |
| 55 to 59 Years | 151 (5.9%) | 165 (6.0%) |
| 60 to 64 Years | 257 (10.0%) | 166 (6.1%) |
| 65 to 69 Years | 135 (5.3%) | 86 (3.1%) |
| 70 to 74 Years | 83 (3.2%) | 109 (4.0%) |
| 75 to 79 Years | 43 (1.7%) | 79 (2.9%) |
| 80 to 84 Years | 63 (2.5%) | 15 (0.5%) |
| 85 Years and over | 14 (0.5%) | 30 (1.1%) |
| Total | 2,559 (100.0%) | 2,735 (100.0%) |
Families and Households in Cramerton
Median Family Size in Cramerton
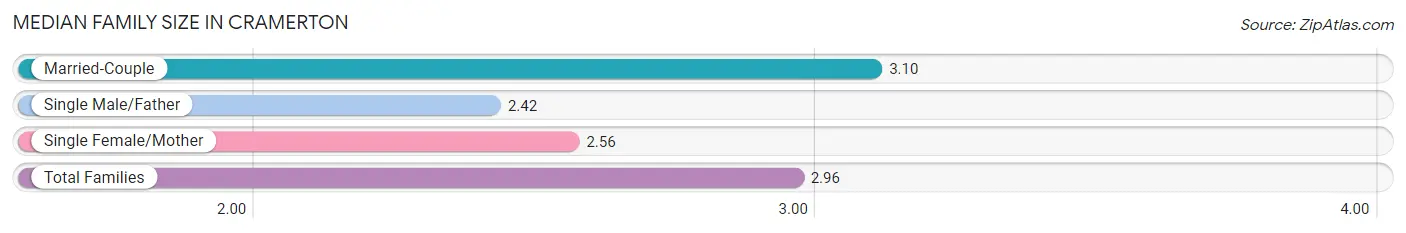
The median family size in Cramerton is 2.96 persons per family, with married-couple families (1,135 | 76.6%) accounting for the largest median family size of 3.1 persons per family. On the other hand, single male/father families (123 | 8.3%) represent the smallest median family size with 2.42 persons per family.
| Family Type | # Families | Family Size |
| Married-Couple | 1,135 (76.6%) | 3.10 |
| Single Male/Father | 123 (8.3%) | 2.42 |
| Single Female/Mother | 224 (15.1%) | 2.56 |
| Total Families | 1,482 (100.0%) | 2.96 |
Median Household Size in Cramerton
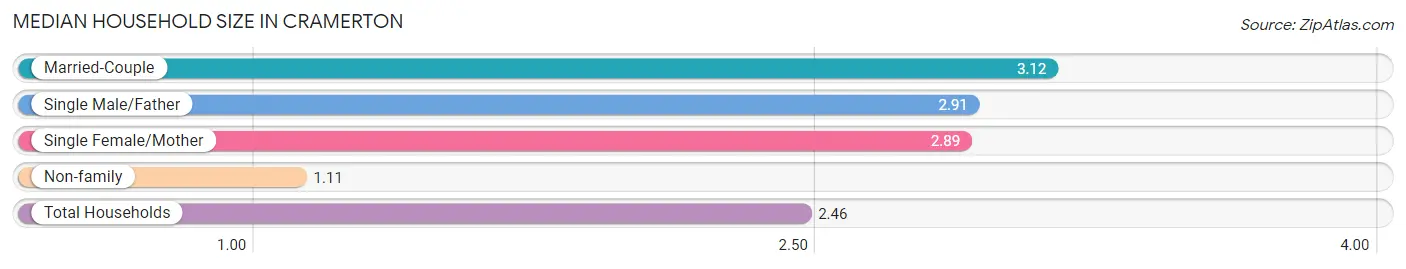
The median household size in Cramerton is 2.46 persons per household, with married-couple households (1,135 | 52.9%) accounting for the largest median household size of 3.12 persons per household. non-family households (665 | 31.0%) represent the smallest median household size with 1.11 persons per household.
| Household Type | # Households | Household Size |
| Married-Couple | 1,135 (52.9%) | 3.12 |
| Single Male/Father | 123 (5.7%) | 2.91 |
| Single Female/Mother | 224 (10.4%) | 2.89 |
| Non-family | 665 (31.0%) | 1.11 |
| Total Households | 2,147 (100.0%) | 2.46 |
Household Size by Marriage Status in Cramerton
Out of a total of 2,147 households in Cramerton, 1,482 (69.0%) are family households, while 665 (31.0%) are nonfamily households. The most numerous type of family households are 2-person households, comprising 672, and the most common type of nonfamily households are 1-person households, comprising 592.
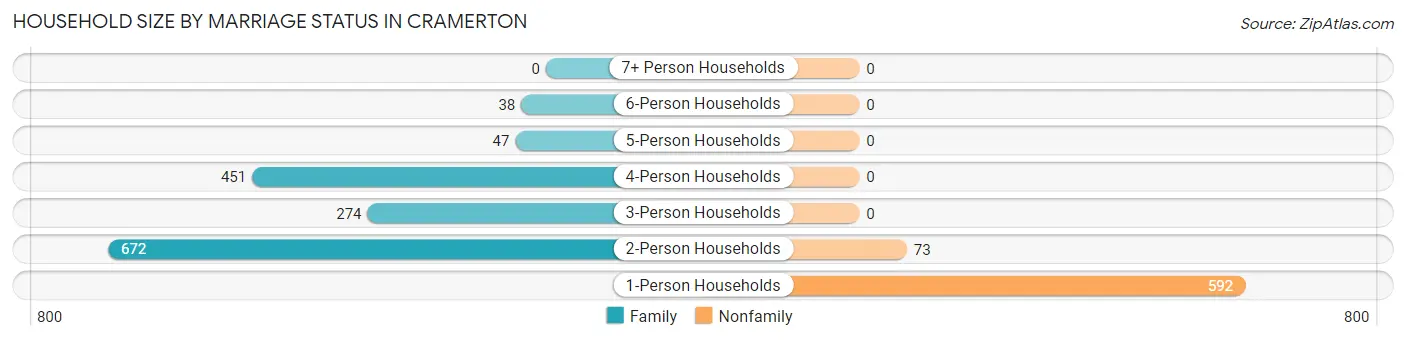
| Household Size | Family Households | Nonfamily Households |
| 1-Person Households | - | 592 (27.6%) |
| 2-Person Households | 672 (31.3%) | 73 (3.4%) |
| 3-Person Households | 274 (12.8%) | 0 (0.0%) |
| 4-Person Households | 451 (21.0%) | 0 (0.0%) |
| 5-Person Households | 47 (2.2%) | 0 (0.0%) |
| 6-Person Households | 38 (1.8%) | 0 (0.0%) |
| 7+ Person Households | 0 (0.0%) | 0 (0.0%) |
| Total | 1,482 (69.0%) | 665 (31.0%) |
Female Fertility in Cramerton
Fertility by Age in Cramerton
Average fertility rate in Cramerton is 52.0 births per 1,000 women. Women in the age bracket of 20 to 34 years have the highest fertility rate with 98.0 births per 1,000 women. Women in the age bracket of 20 to 34 years acount for 100.0% of all women with births.
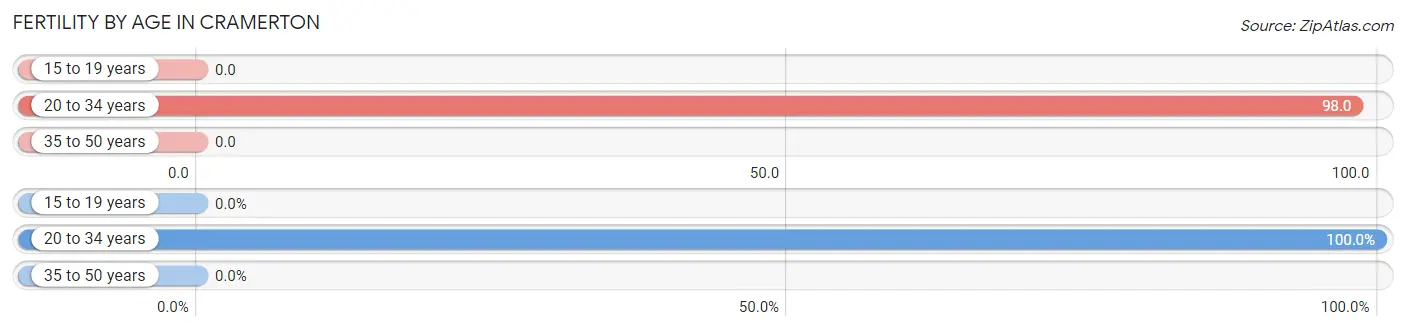
| Age Bracket | Women with Births | Births / 1,000 Women |
| 15 to 19 years | 0 (0.0%) | 0.0 |
| 20 to 34 years | 69 (100.0%) | 98.0 |
| 35 to 50 years | 0 (0.0%) | 0.0 |
| Total | 69 (100.0%) | 52.0 |
Fertility by Age by Marriage Status in Cramerton
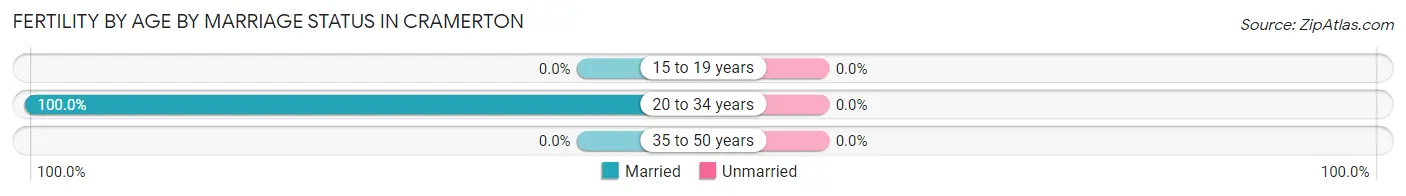
| Age Bracket | Married | Unmarried |
| 15 to 19 years | 0 (0.0%) | 0 (0.0%) |
| 20 to 34 years | 69 (100.0%) | 0 (0.0%) |
| 35 to 50 years | 0 (0.0%) | 0 (0.0%) |
| Total | 69 (100.0%) | 0 (0.0%) |
Fertility by Education in Cramerton
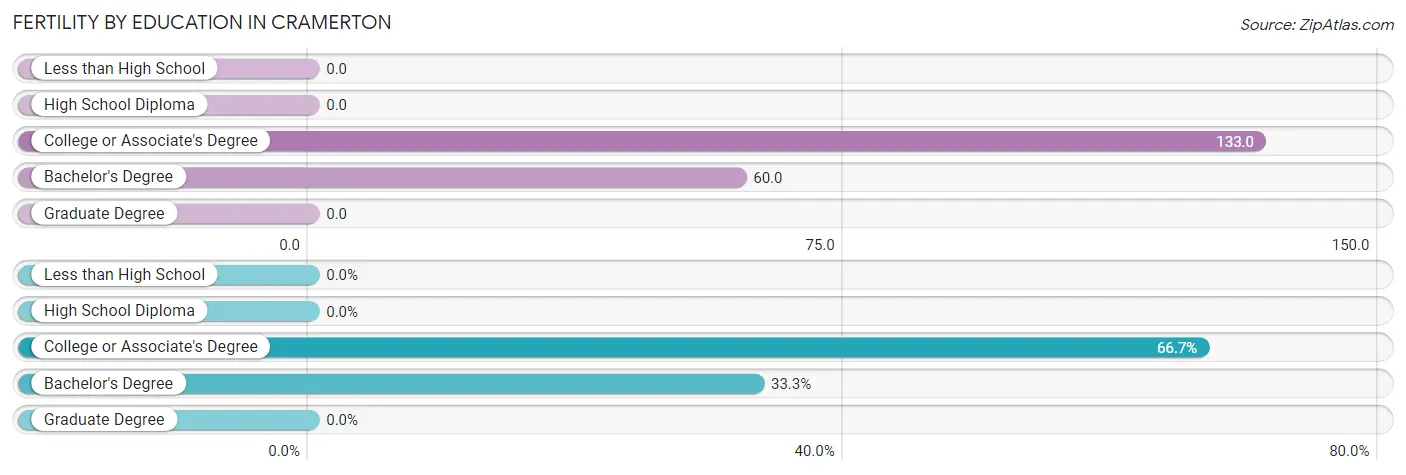
| Educational Attainment | Women with Births | Births / 1,000 Women |
| Less than High School | 0 (0.0%) | 0.0 |
| High School Diploma | 0 (0.0%) | 0.0 |
| College or Associate's Degree | 46 (66.7%) | 133.0 |
| Bachelor's Degree | 23 (33.3%) | 60.0 |
| Graduate Degree | 0 (0.0%) | 0.0 |
| Total | 69 (100.0%) | 52.0 |
Fertility by Education by Marriage Status in Cramerton
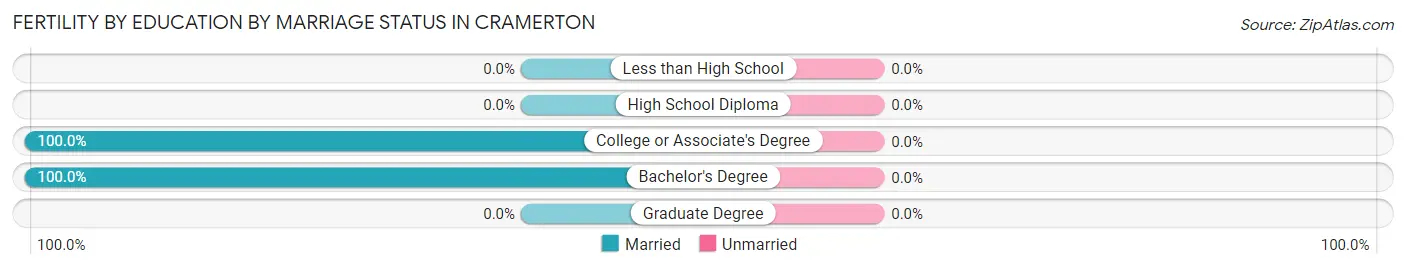
| Educational Attainment | Married | Unmarried |
| Less than High School | 0 (0.0%) | 0 (0.0%) |
| High School Diploma | 0 (0.0%) | 0 (0.0%) |
| College or Associate's Degree | 46 (100.0%) | 0 (0.0%) |
| Bachelor's Degree | 23 (100.0%) | 0 (0.0%) |
| Graduate Degree | 0 (0.0%) | 0 (0.0%) |
| Total | 69 (100.0%) | 0 (0.0%) |
Employment Characteristics in Cramerton
Employment by Class of Employer in Cramerton
Among the 2,923 employed individuals in Cramerton, private company employees (2,058 | 70.4%), not-for-profit organizations (317 | 10.8%), and local government employees (180 | 6.2%) make up the most common classes of employment.
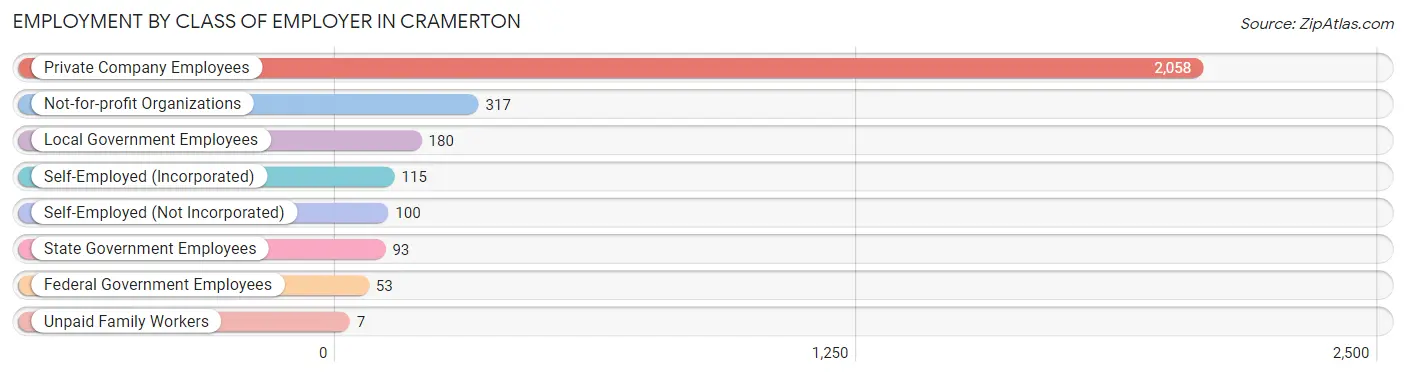
| Employer Class | # Employees | % Employees |
| Private Company Employees | 2,058 | 70.4% |
| Self-Employed (Incorporated) | 115 | 3.9% |
| Self-Employed (Not Incorporated) | 100 | 3.4% |
| Not-for-profit Organizations | 317 | 10.8% |
| Local Government Employees | 180 | 6.2% |
| State Government Employees | 93 | 3.2% |
| Federal Government Employees | 53 | 1.8% |
| Unpaid Family Workers | 7 | 0.2% |
| Total | 2,923 | 100.0% |
Employment Status by Age in Cramerton
According to the labor force statistics for Cramerton, out of the total population over 16 years of age (4,147), 74.5% or 3,090 individuals are in the labor force, with 4.7% or 145 of them unemployed. The age group with the highest labor force participation rate is 30 to 34 years, with 93.2% or 649 individuals in the labor force. Within the labor force, the 45 to 54 years age range has the highest percentage of unemployed individuals, with 14.9% or 96 of them being unemployed.
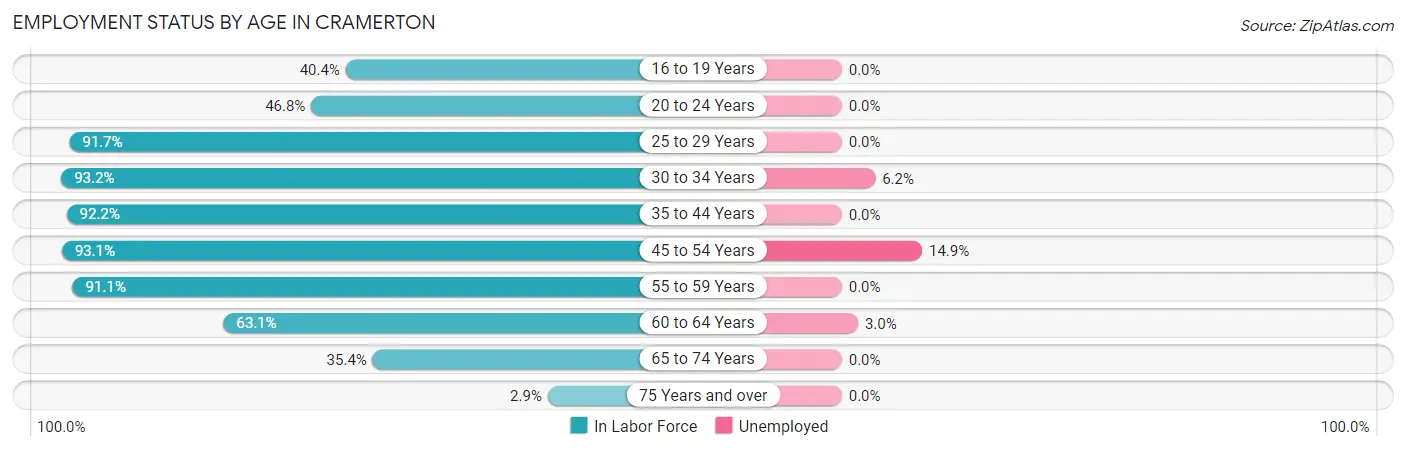
| Age Bracket | In Labor Force | Unemployed |
| 16 to 19 Years | 92 (40.4%) | 0 (0.0%) |
| 20 to 24 Years | 51 (46.8%) | 0 (0.0%) |
| 25 to 29 Years | 398 (91.7%) | 0 (0.0%) |
| 30 to 34 Years | 649 (93.2%) | 40 (6.2%) |
| 35 to 44 Years | 547 (92.2%) | 0 (0.0%) |
| 45 to 54 Years | 643 (93.1%) | 96 (14.9%) |
| 55 to 59 Years | 288 (91.1%) | 0 (0.0%) |
| 60 to 64 Years | 267 (63.1%) | 8 (3.0%) |
| 65 to 74 Years | 146 (35.4%) | 0 (0.0%) |
| 75 Years and over | 7 (2.9%) | 0 (0.0%) |
| Total | 3,090 (74.5%) | 145 (4.7%) |
Employment Status by Educational Attainment in Cramerton
According to labor force statistics for Cramerton, 88.6% of individuals (2,794) out of the total population between 25 and 64 years of age (3,153) are in the labor force, with 5.2% or 145 of them being unemployed. The group with the highest labor force participation rate are those with the educational attainment of college / associate degree, with 91.3% or 814 individuals in the labor force. Within the labor force, individuals with college / associate degree education have the highest percentage of unemployment, with 10.4% or 85 of them being unemployed.
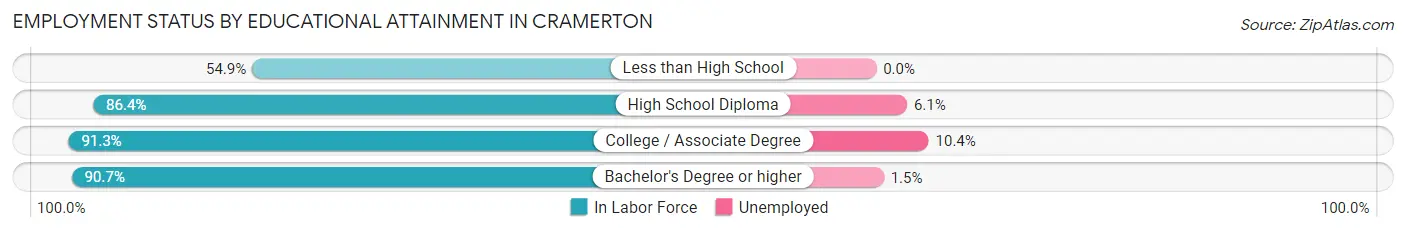
| Educational Attainment | In Labor Force | Unemployed |
| Less than High School | 62 (54.9%) | 0 (0.0%) |
| High School Diploma | 655 (86.4%) | 46 (6.1%) |
| College / Associate Degree | 814 (91.3%) | 93 (10.4%) |
| Bachelor's Degree or higher | 1,261 (90.7%) | 21 (1.5%) |
| Total | 2,794 (88.6%) | 164 (5.2%) |
Employment Occupations by Sex in Cramerton
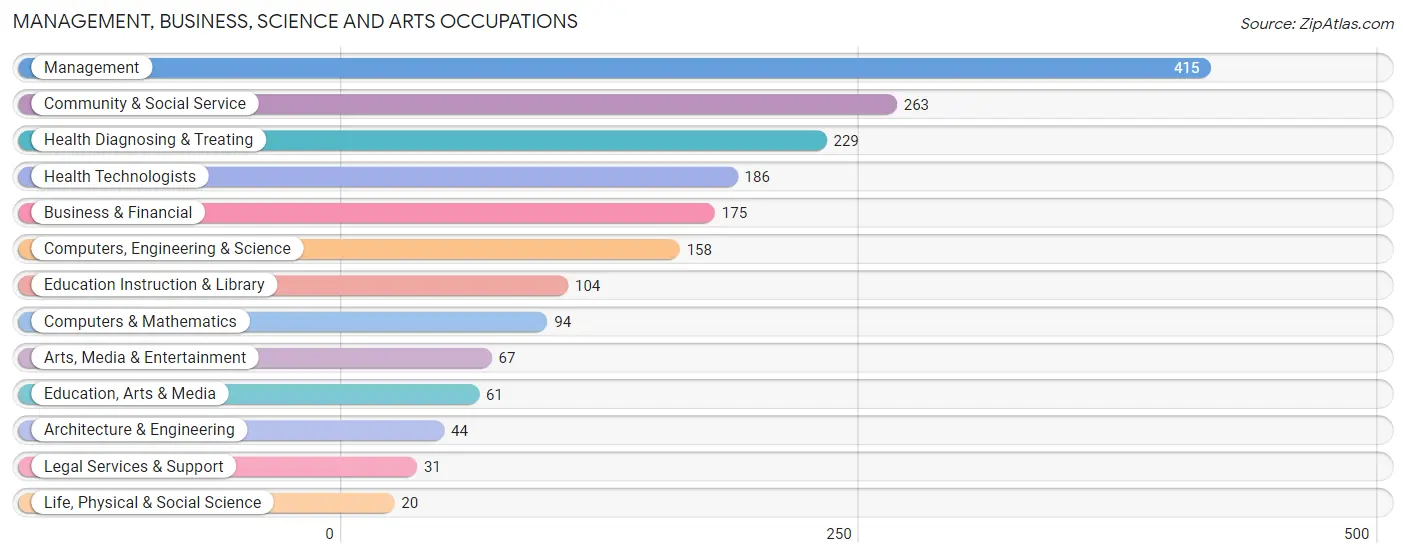
Management, Business, Science and Arts Occupations
The most common Management, Business, Science and Arts occupations in Cramerton are Management (415 | 14.1%), Community & Social Service (263 | 8.9%), Health Diagnosing & Treating (229 | 7.8%), Health Technologists (186 | 6.3%), and Business & Financial (175 | 5.9%).
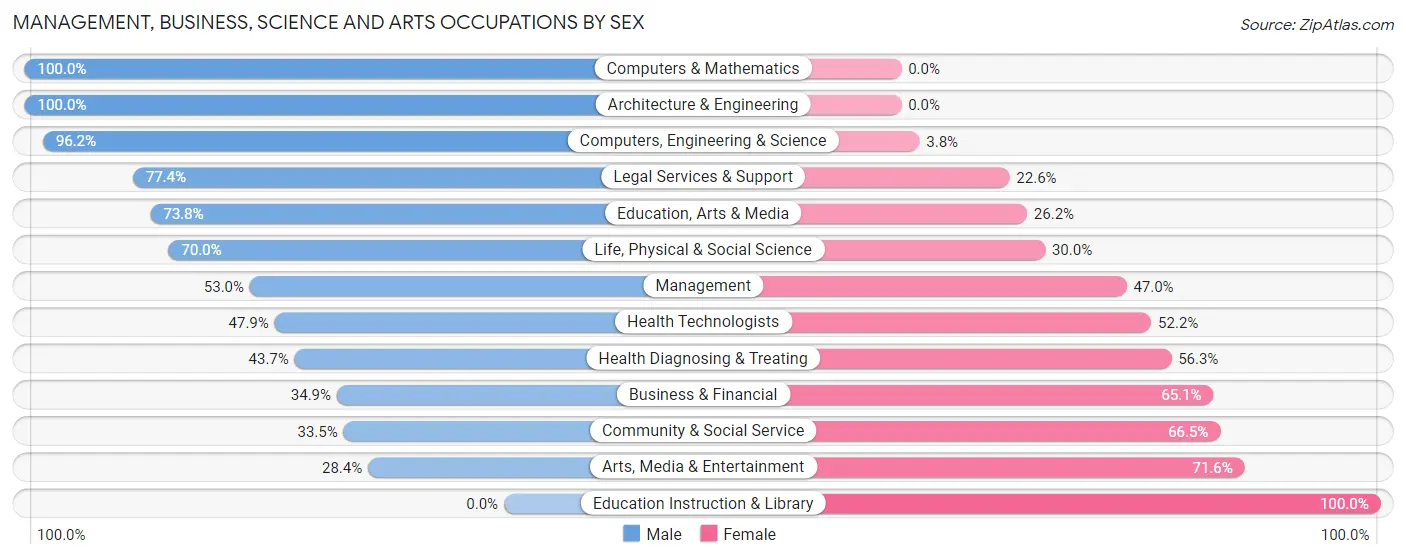
Management, Business, Science and Arts Occupations by Sex
Within the Management, Business, Science and Arts occupations in Cramerton, the most male-oriented occupations are Computers & Mathematics (100.0%), Architecture & Engineering (100.0%), and Computers, Engineering & Science (96.2%), while the most female-oriented occupations are Education Instruction & Library (100.0%), Arts, Media & Entertainment (71.6%), and Community & Social Service (66.5%).
| Occupation | Male | Female |
| Management | 220 (53.0%) | 195 (47.0%) |
| Business & Financial | 61 (34.9%) | 114 (65.1%) |
| Computers, Engineering & Science | 152 (96.2%) | 6 (3.8%) |
| Computers & Mathematics | 94 (100.0%) | 0 (0.0%) |
| Architecture & Engineering | 44 (100.0%) | 0 (0.0%) |
| Life, Physical & Social Science | 14 (70.0%) | 6 (30.0%) |
| Community & Social Service | 88 (33.5%) | 175 (66.5%) |
| Education, Arts & Media | 45 (73.8%) | 16 (26.2%) |
| Legal Services & Support | 24 (77.4%) | 7 (22.6%) |
| Education Instruction & Library | 0 (0.0%) | 104 (100.0%) |
| Arts, Media & Entertainment | 19 (28.4%) | 48 (71.6%) |
| Health Diagnosing & Treating | 100 (43.7%) | 129 (56.3%) |
| Health Technologists | 89 (47.8%) | 97 (52.1%) |
| Total (Category) | 621 (50.1%) | 619 (49.9%) |
| Total (Overall) | 1,498 (50.9%) | 1,446 (49.1%) |
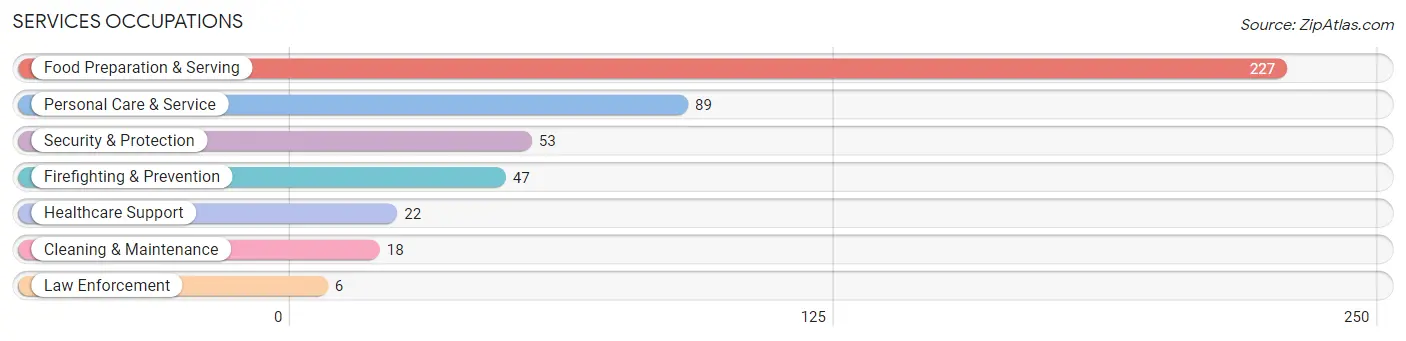
Services Occupations
The most common Services occupations in Cramerton are Food Preparation & Serving (227 | 7.7%), Personal Care & Service (89 | 3.0%), Security & Protection (53 | 1.8%), Firefighting & Prevention (47 | 1.6%), and Healthcare Support (22 | 0.7%).
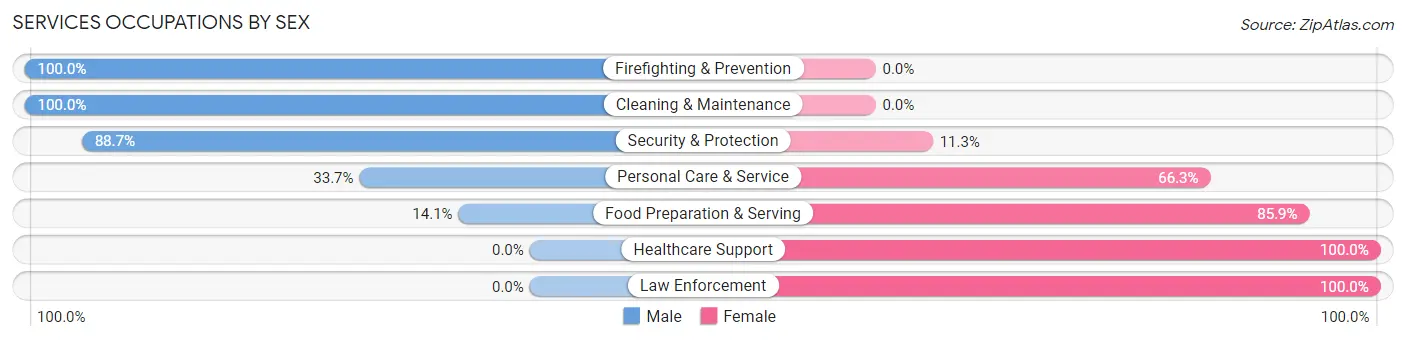
Services Occupations by Sex
Within the Services occupations in Cramerton, the most male-oriented occupations are Firefighting & Prevention (100.0%), Cleaning & Maintenance (100.0%), and Security & Protection (88.7%), while the most female-oriented occupations are Healthcare Support (100.0%), Law Enforcement (100.0%), and Food Preparation & Serving (85.9%).
| Occupation | Male | Female |
| Healthcare Support | 0 (0.0%) | 22 (100.0%) |
| Security & Protection | 47 (88.7%) | 6 (11.3%) |
| Firefighting & Prevention | 47 (100.0%) | 0 (0.0%) |
| Law Enforcement | 0 (0.0%) | 6 (100.0%) |
| Food Preparation & Serving | 32 (14.1%) | 195 (85.9%) |
| Cleaning & Maintenance | 18 (100.0%) | 0 (0.0%) |
| Personal Care & Service | 30 (33.7%) | 59 (66.3%) |
| Total (Category) | 127 (31.0%) | 282 (69.0%) |
| Total (Overall) | 1,498 (50.9%) | 1,446 (49.1%) |
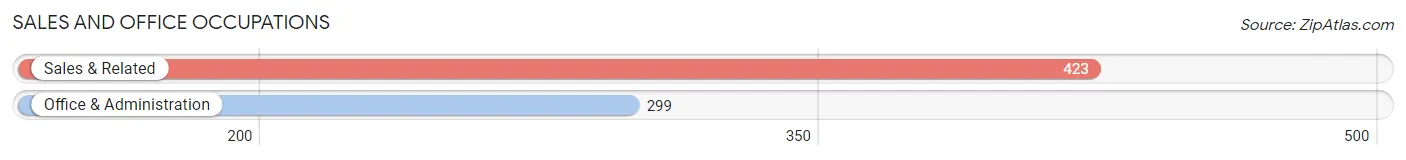
Sales and Office Occupations
The most common Sales and Office occupations in Cramerton are Sales & Related (423 | 14.4%), and Office & Administration (299 | 10.2%).
Sales and Office Occupations by Sex
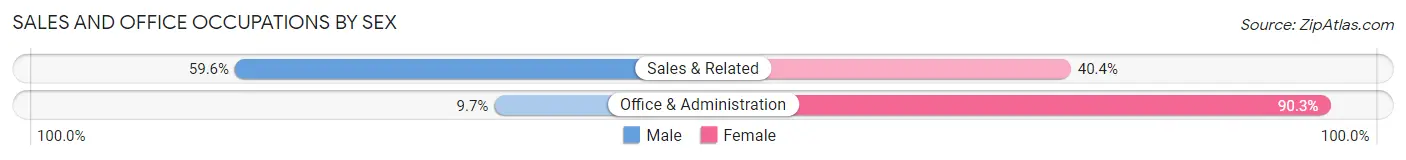
| Occupation | Male | Female |
| Sales & Related | 252 (59.6%) | 171 (40.4%) |
| Office & Administration | 29 (9.7%) | 270 (90.3%) |
| Total (Category) | 281 (38.9%) | 441 (61.1%) |
| Total (Overall) | 1,498 (50.9%) | 1,446 (49.1%) |
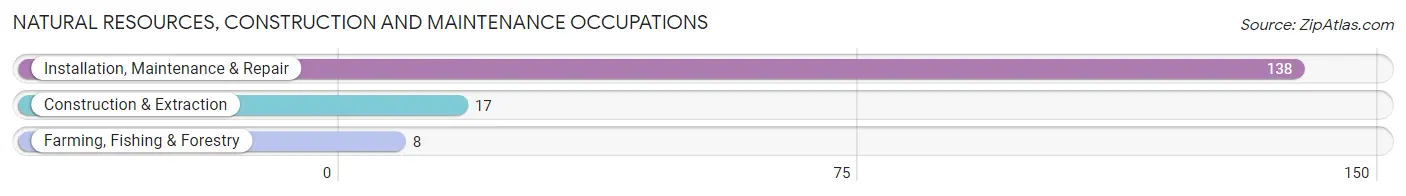
Natural Resources, Construction and Maintenance Occupations
The most common Natural Resources, Construction and Maintenance occupations in Cramerton are Installation, Maintenance & Repair (138 | 4.7%), Construction & Extraction (17 | 0.6%), and Farming, Fishing & Forestry (8 | 0.3%).
Natural Resources, Construction and Maintenance Occupations by Sex
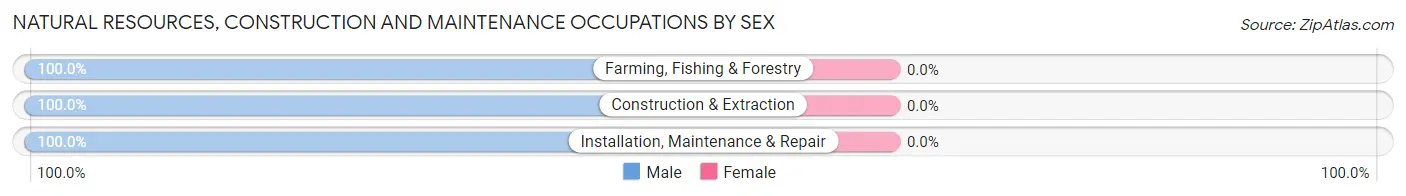
| Occupation | Male | Female |
| Farming, Fishing & Forestry | 8 (100.0%) | 0 (0.0%) |
| Construction & Extraction | 17 (100.0%) | 0 (0.0%) |
| Installation, Maintenance & Repair | 138 (100.0%) | 0 (0.0%) |
| Total (Category) | 163 (100.0%) | 0 (0.0%) |
| Total (Overall) | 1,498 (50.9%) | 1,446 (49.1%) |
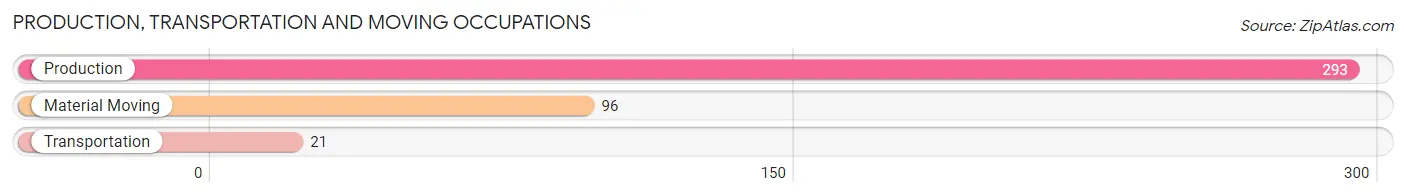
Production, Transportation and Moving Occupations
The most common Production, Transportation and Moving occupations in Cramerton are Production (293 | 10.0%), Material Moving (96 | 3.3%), and Transportation (21 | 0.7%).
Production, Transportation and Moving Occupations by Sex
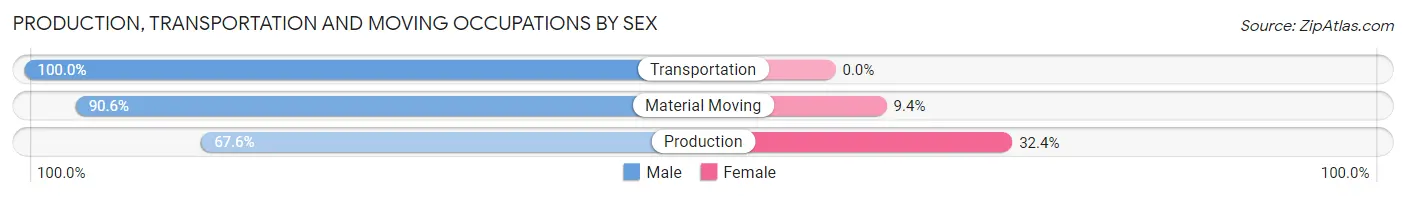
| Occupation | Male | Female |
| Production | 198 (67.6%) | 95 (32.4%) |
| Transportation | 21 (100.0%) | 0 (0.0%) |
| Material Moving | 87 (90.6%) | 9 (9.4%) |
| Total (Category) | 306 (74.6%) | 104 (25.4%) |
| Total (Overall) | 1,498 (50.9%) | 1,446 (49.1%) |
Employment Industries by Sex in Cramerton
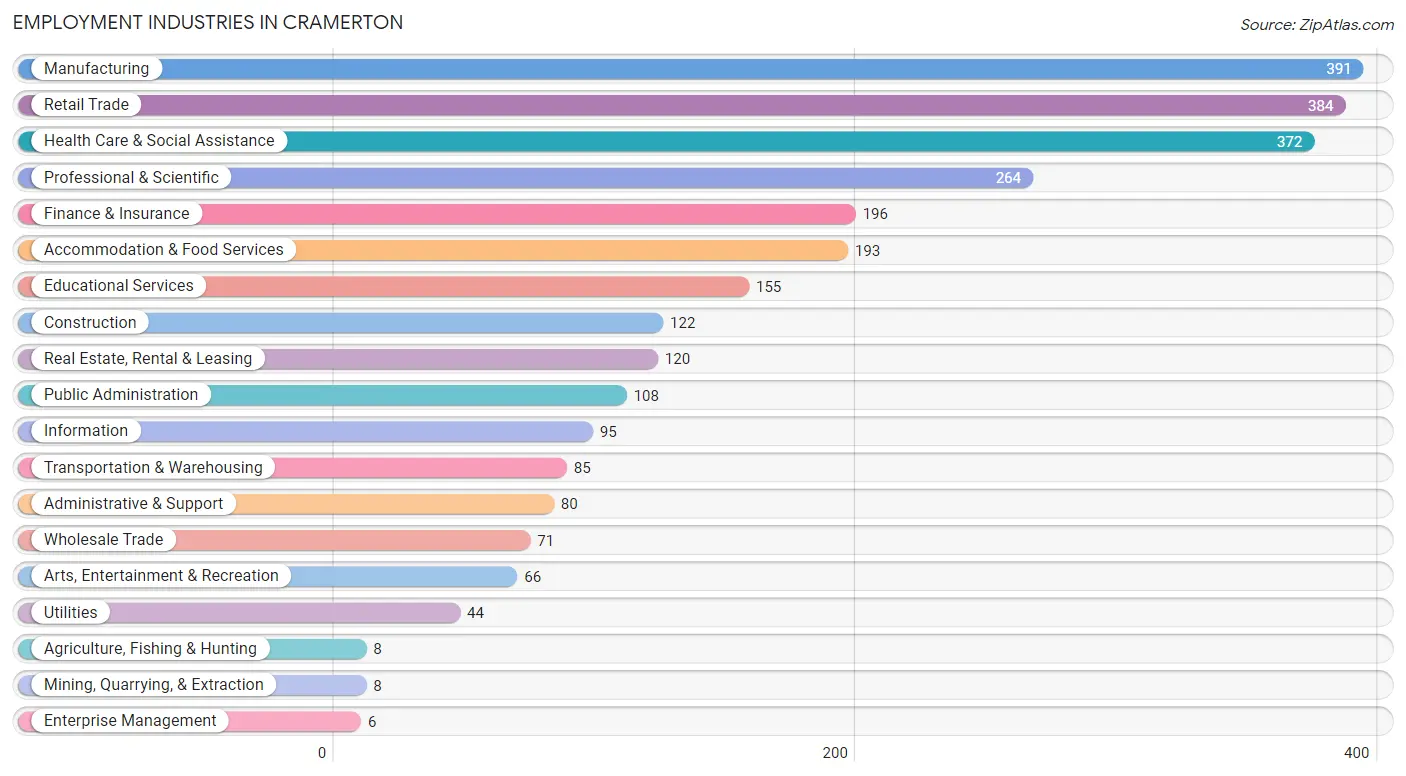
Employment Industries in Cramerton
The major employment industries in Cramerton include Manufacturing (391 | 13.3%), Retail Trade (384 | 13.0%), Health Care & Social Assistance (372 | 12.6%), Professional & Scientific (264 | 9.0%), and Finance & Insurance (196 | 6.7%).
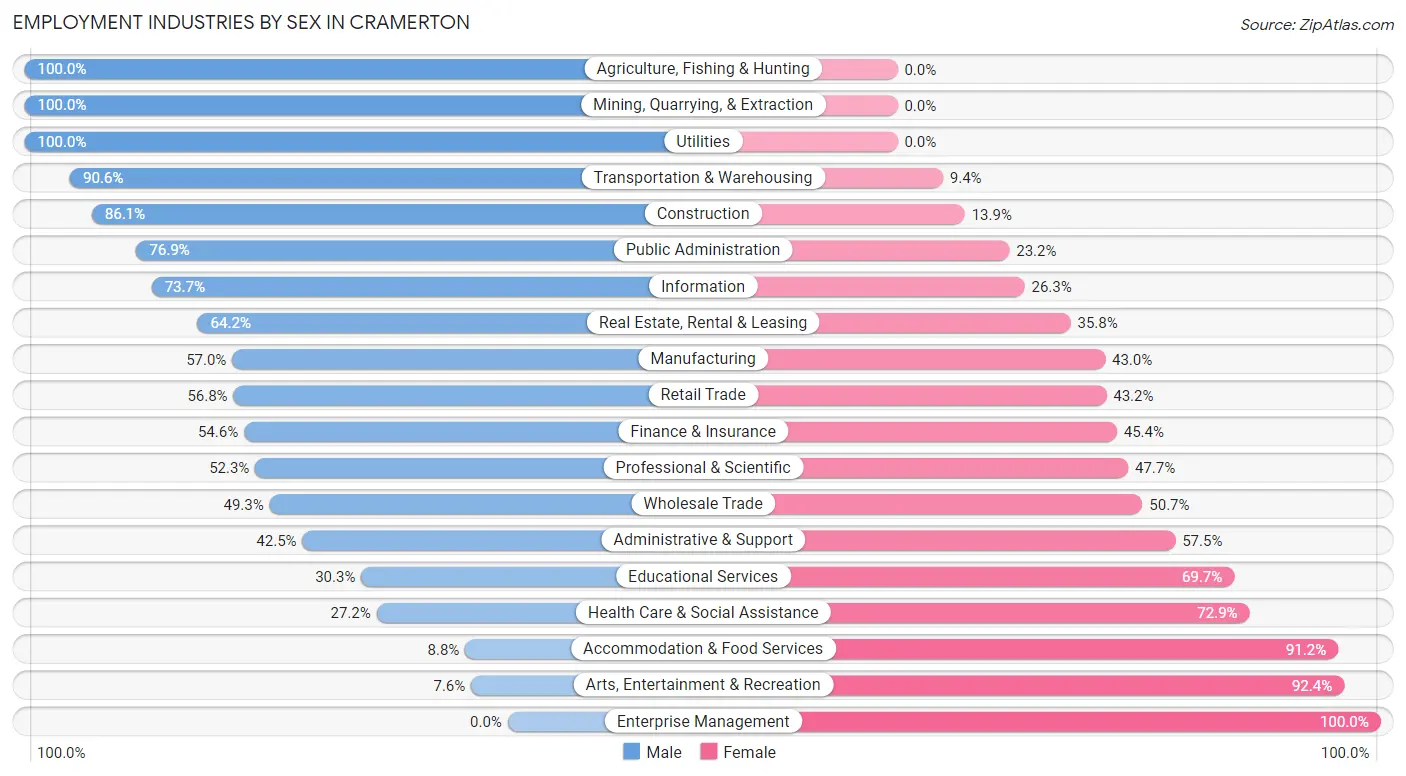
Employment Industries by Sex in Cramerton
The Cramerton industries that see more men than women are Agriculture, Fishing & Hunting (100.0%), Mining, Quarrying, & Extraction (100.0%), and Utilities (100.0%), whereas the industries that tend to have a higher number of women are Enterprise Management (100.0%), Arts, Entertainment & Recreation (92.4%), and Accommodation & Food Services (91.2%).
| Industry | Male | Female |
| Agriculture, Fishing & Hunting | 8 (100.0%) | 0 (0.0%) |
| Mining, Quarrying, & Extraction | 8 (100.0%) | 0 (0.0%) |
| Construction | 105 (86.1%) | 17 (13.9%) |
| Manufacturing | 223 (57.0%) | 168 (43.0%) |
| Wholesale Trade | 35 (49.3%) | 36 (50.7%) |
| Retail Trade | 218 (56.8%) | 166 (43.2%) |
| Transportation & Warehousing | 77 (90.6%) | 8 (9.4%) |
| Utilities | 44 (100.0%) | 0 (0.0%) |
| Information | 70 (73.7%) | 25 (26.3%) |
| Finance & Insurance | 107 (54.6%) | 89 (45.4%) |
| Real Estate, Rental & Leasing | 77 (64.2%) | 43 (35.8%) |
| Professional & Scientific | 138 (52.3%) | 126 (47.7%) |
| Enterprise Management | 0 (0.0%) | 6 (100.0%) |
| Administrative & Support | 34 (42.5%) | 46 (57.5%) |
| Educational Services | 47 (30.3%) | 108 (69.7%) |
| Health Care & Social Assistance | 101 (27.2%) | 271 (72.9%) |
| Arts, Entertainment & Recreation | 5 (7.6%) | 61 (92.4%) |
| Accommodation & Food Services | 17 (8.8%) | 176 (91.2%) |
| Public Administration | 83 (76.8%) | 25 (23.2%) |
| Total | 1,498 (50.9%) | 1,446 (49.1%) |
Education in Cramerton
School Enrollment in Cramerton
The most common levels of schooling among the 1,143 students in Cramerton are middle school (263 | 23.0%), high school (260 | 22.8%), and elementary school (240 | 21.0%).
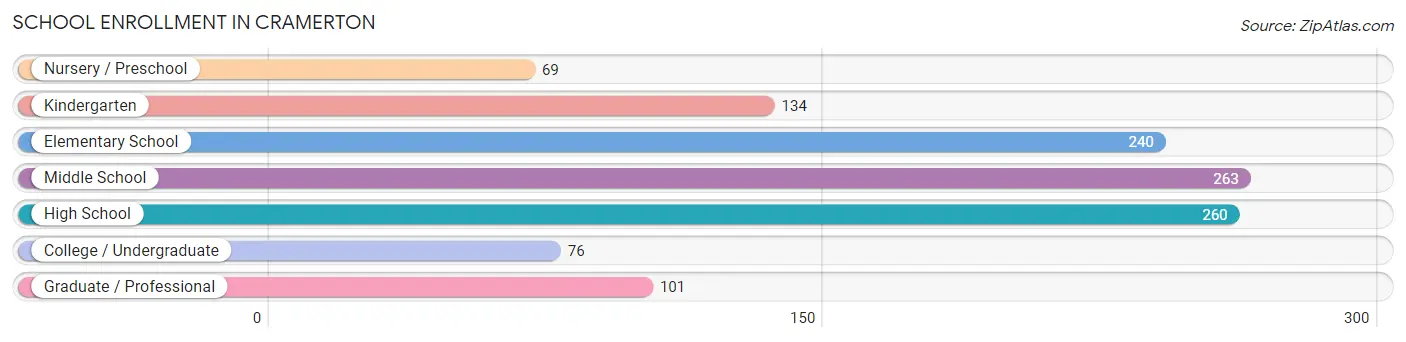
| School Level | # Students | % Students |
| Nursery / Preschool | 69 | 6.0% |
| Kindergarten | 134 | 11.7% |
| Elementary School | 240 | 21.0% |
| Middle School | 263 | 23.0% |
| High School | 260 | 22.8% |
| College / Undergraduate | 76 | 6.7% |
| Graduate / Professional | 101 | 8.8% |
| Total | 1,143 | 100.0% |
School Enrollment by Age by Funding Source in Cramerton
Out of a total of 1,143 students who are enrolled in schools in Cramerton, 253 (22.1%) attend a private institution, while the remaining 890 (77.9%) are enrolled in public schools. The age group of 3 to 4 year olds has the highest likelihood of being enrolled in private schools, with 19 (100.0% in the age bracket) enrolled. Conversely, the age group of 10 to 14 year olds has the lowest likelihood of being enrolled in a private school, with 295 (100.0% in the age bracket) attending a public institution.
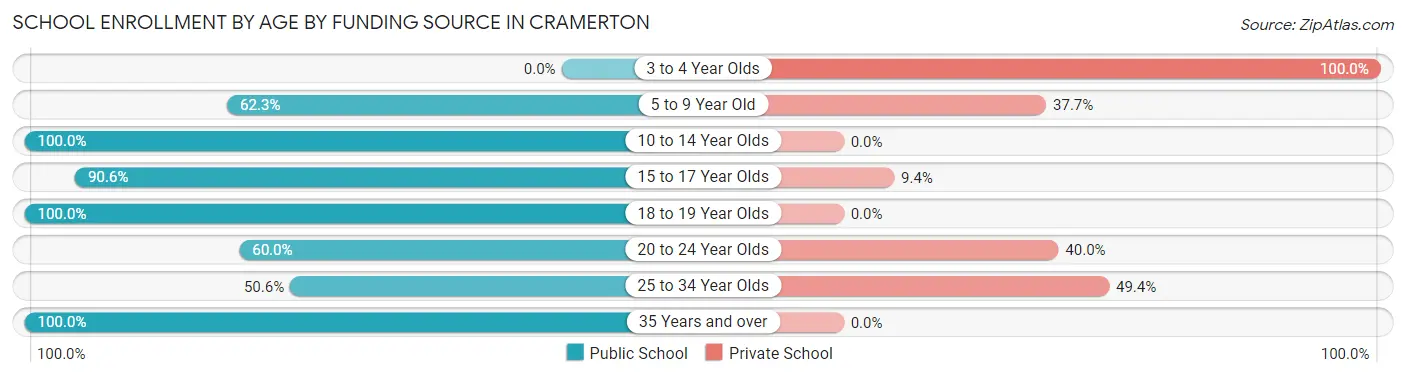
| Age Bracket | Public School | Private School |
| 3 to 4 Year Olds | 0 (0.0%) | 19 (100.0%) |
| 5 to 9 Year Old | 256 (62.3%) | 155 (37.7%) |
| 10 to 14 Year Olds | 295 (100.0%) | 0 (0.0%) |
| 15 to 17 Year Olds | 193 (90.6%) | 20 (9.4%) |
| 18 to 19 Year Olds | 28 (100.0%) | 0 (0.0%) |
| 20 to 24 Year Olds | 24 (60.0%) | 16 (40.0%) |
| 25 to 34 Year Olds | 44 (50.6%) | 43 (49.4%) |
| 35 Years and over | 50 (100.0%) | 0 (0.0%) |
| Total | 890 (77.9%) | 253 (22.1%) |
Educational Attainment by Field of Study in Cramerton
Business (492 | 27.1%), education (211 | 11.6%), science & technology (190 | 10.4%), social sciences (133 | 7.3%), and psychology (118 | 6.5%) are the most common fields of study among 1,819 individuals in Cramerton who have obtained a bachelor's degree or higher.
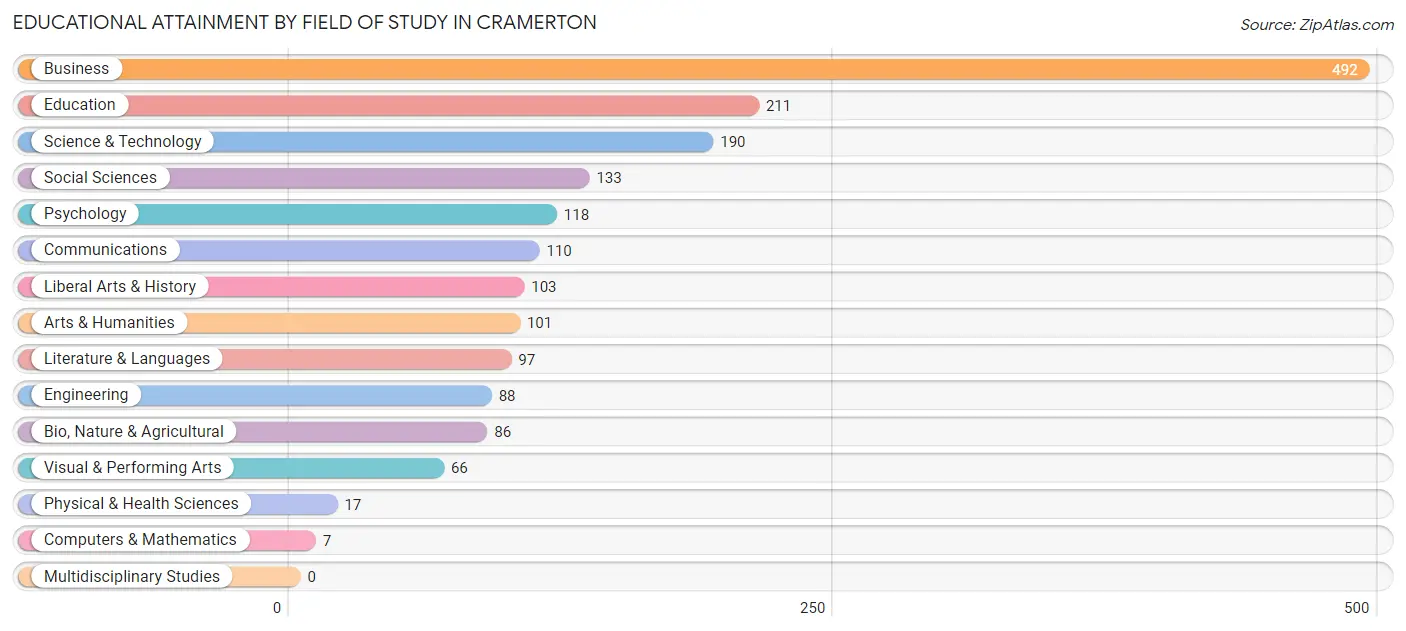
| Field of Study | # Graduates | % Graduates |
| Computers & Mathematics | 7 | 0.4% |
| Bio, Nature & Agricultural | 86 | 4.7% |
| Physical & Health Sciences | 17 | 0.9% |
| Psychology | 118 | 6.5% |
| Social Sciences | 133 | 7.3% |
| Engineering | 88 | 4.8% |
| Multidisciplinary Studies | 0 | 0.0% |
| Science & Technology | 190 | 10.4% |
| Business | 492 | 27.1% |
| Education | 211 | 11.6% |
| Literature & Languages | 97 | 5.3% |
| Liberal Arts & History | 103 | 5.7% |
| Visual & Performing Arts | 66 | 3.6% |
| Communications | 110 | 6.0% |
| Arts & Humanities | 101 | 5.6% |
| Total | 1,819 | 100.0% |
Transportation & Commute in Cramerton
Vehicle Availability by Sex in Cramerton
The most prevalent vehicle ownership categories in Cramerton are males with 2 vehicles (826, accounting for 55.6%) and females with 2 vehicles (827, making up 57.5%).
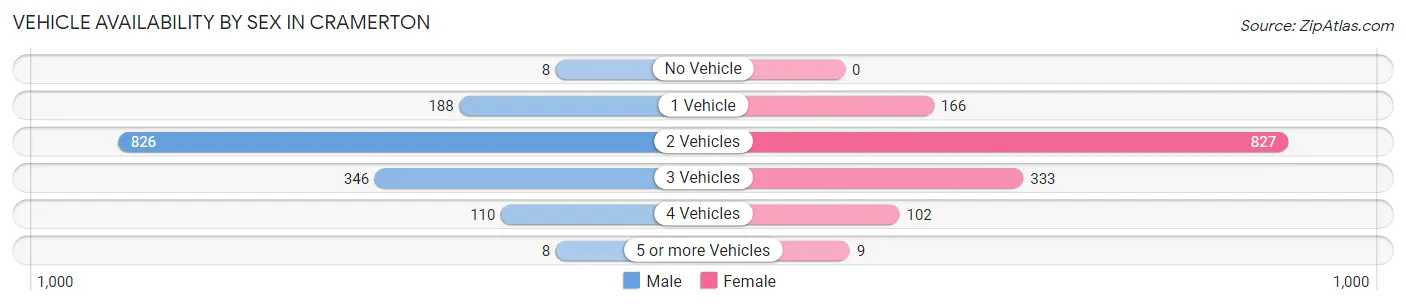
| Vehicles Available | Male | Female |
| No Vehicle | 8 (0.5%) | 0 (0.0%) |
| 1 Vehicle | 188 (12.7%) | 166 (11.6%) |
| 2 Vehicles | 826 (55.6%) | 827 (57.6%) |
| 3 Vehicles | 346 (23.3%) | 333 (23.2%) |
| 4 Vehicles | 110 (7.4%) | 102 (7.1%) |
| 5 or more Vehicles | 8 (0.5%) | 9 (0.6%) |
| Total | 1,486 (100.0%) | 1,437 (100.0%) |
Commute Time in Cramerton
The most frequently occuring commute durations in Cramerton are 20 to 24 minutes (464 commuters, 18.9%), 15 to 19 minutes (446 commuters, 18.1%), and 30 to 34 minutes (397 commuters, 16.1%).
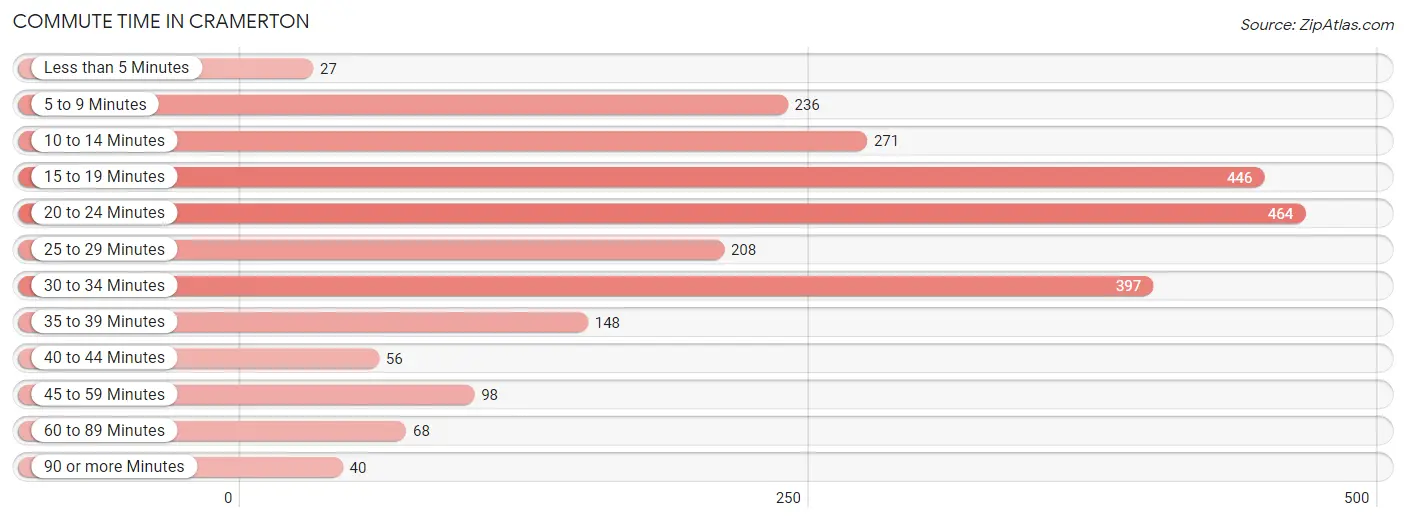
| Commute Time | # Commuters | % Commuters |
| Less than 5 Minutes | 27 | 1.1% |
| 5 to 9 Minutes | 236 | 9.6% |
| 10 to 14 Minutes | 271 | 11.0% |
| 15 to 19 Minutes | 446 | 18.1% |
| 20 to 24 Minutes | 464 | 18.9% |
| 25 to 29 Minutes | 208 | 8.5% |
| 30 to 34 Minutes | 397 | 16.1% |
| 35 to 39 Minutes | 148 | 6.0% |
| 40 to 44 Minutes | 56 | 2.3% |
| 45 to 59 Minutes | 98 | 4.0% |
| 60 to 89 Minutes | 68 | 2.8% |
| 90 or more Minutes | 40 | 1.6% |
Commute Time by Sex in Cramerton
The most common commute times in Cramerton are 20 to 24 minutes (253 commuters, 20.2%) for males and 15 to 19 minutes (223 commuters, 18.5%) for females.
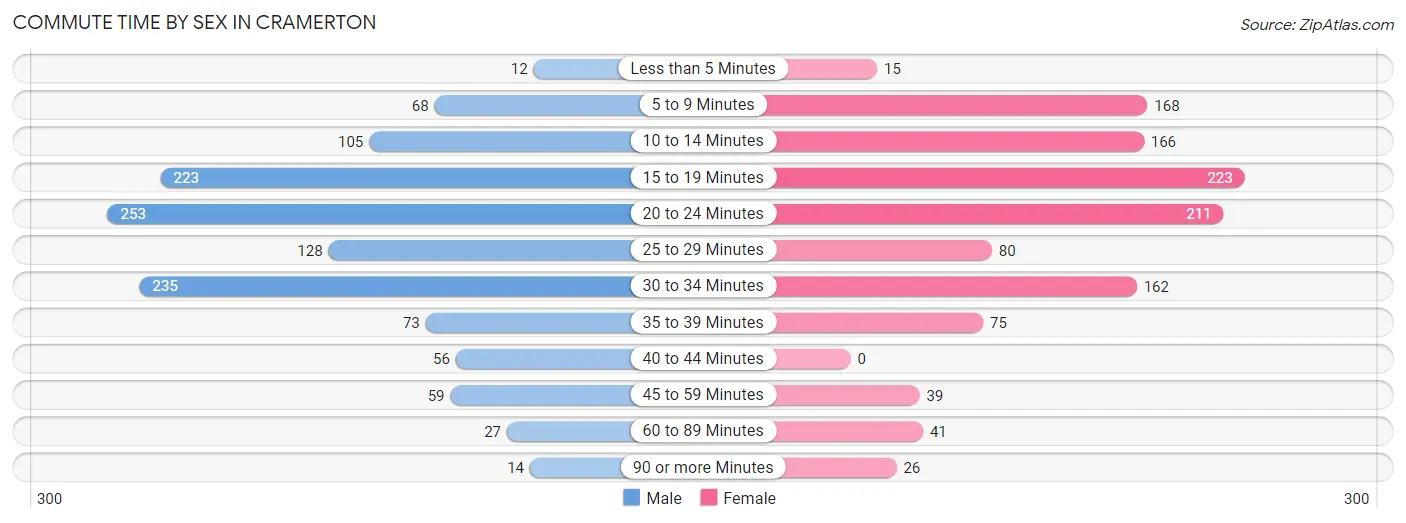
| Commute Time | Male | Female |
| Less than 5 Minutes | 12 (1.0%) | 15 (1.2%) |
| 5 to 9 Minutes | 68 (5.4%) | 168 (13.9%) |
| 10 to 14 Minutes | 105 (8.4%) | 166 (13.8%) |
| 15 to 19 Minutes | 223 (17.8%) | 223 (18.5%) |
| 20 to 24 Minutes | 253 (20.2%) | 211 (17.5%) |
| 25 to 29 Minutes | 128 (10.2%) | 80 (6.6%) |
| 30 to 34 Minutes | 235 (18.8%) | 162 (13.4%) |
| 35 to 39 Minutes | 73 (5.8%) | 75 (6.2%) |
| 40 to 44 Minutes | 56 (4.5%) | 0 (0.0%) |
| 45 to 59 Minutes | 59 (4.7%) | 39 (3.2%) |
| 60 to 89 Minutes | 27 (2.1%) | 41 (3.4%) |
| 90 or more Minutes | 14 (1.1%) | 26 (2.2%) |
Time of Departure to Work by Sex in Cramerton
The most frequent times of departure to work in Cramerton are 7:30 AM to 7:59 AM (199, 15.9%) for males and 7:00 AM to 7:29 AM (221, 18.3%) for females.
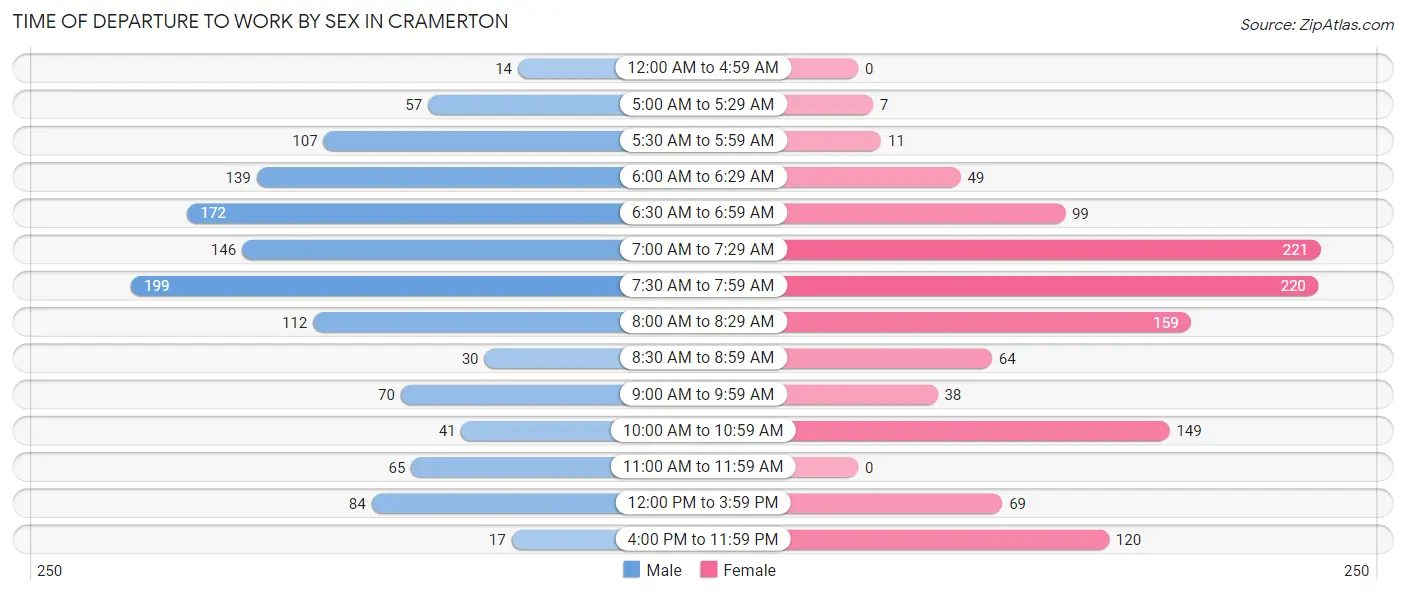
| Time of Departure | Male | Female |
| 12:00 AM to 4:59 AM | 14 (1.1%) | 0 (0.0%) |
| 5:00 AM to 5:29 AM | 57 (4.5%) | 7 (0.6%) |
| 5:30 AM to 5:59 AM | 107 (8.5%) | 11 (0.9%) |
| 6:00 AM to 6:29 AM | 139 (11.1%) | 49 (4.1%) |
| 6:30 AM to 6:59 AM | 172 (13.7%) | 99 (8.2%) |
| 7:00 AM to 7:29 AM | 146 (11.7%) | 221 (18.3%) |
| 7:30 AM to 7:59 AM | 199 (15.9%) | 220 (18.2%) |
| 8:00 AM to 8:29 AM | 112 (8.9%) | 159 (13.2%) |
| 8:30 AM to 8:59 AM | 30 (2.4%) | 64 (5.3%) |
| 9:00 AM to 9:59 AM | 70 (5.6%) | 38 (3.2%) |
| 10:00 AM to 10:59 AM | 41 (3.3%) | 149 (12.3%) |
| 11:00 AM to 11:59 AM | 65 (5.2%) | 0 (0.0%) |
| 12:00 PM to 3:59 PM | 84 (6.7%) | 69 (5.7%) |
| 4:00 PM to 11:59 PM | 17 (1.4%) | 120 (10.0%) |
| Total | 1,253 (100.0%) | 1,206 (100.0%) |
Housing Occupancy in Cramerton
Occupancy by Ownership in Cramerton
Of the total 2,147 dwellings in Cramerton, owner-occupied units account for 1,448 (67.4%), while renter-occupied units make up 699 (32.6%).
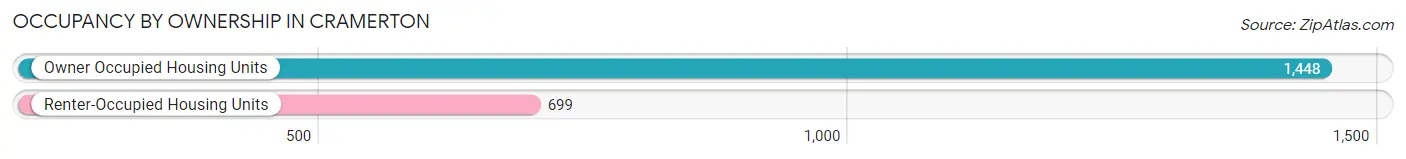
| Occupancy | # Housing Units | % Housing Units |
| Owner Occupied Housing Units | 1,448 | 67.4% |
| Renter-Occupied Housing Units | 699 | 32.6% |
| Total Occupied Housing Units | 2,147 | 100.0% |
Occupancy by Household Size in Cramerton
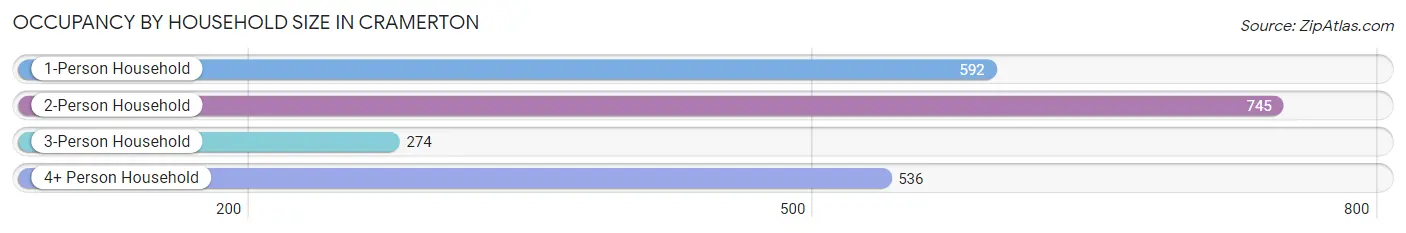
| Household Size | # Housing Units | % Housing Units |
| 1-Person Household | 592 | 27.6% |
| 2-Person Household | 745 | 34.7% |
| 3-Person Household | 274 | 12.8% |
| 4+ Person Household | 536 | 25.0% |
| Total Housing Units | 2,147 | 100.0% |
Occupancy by Ownership by Household Size in Cramerton
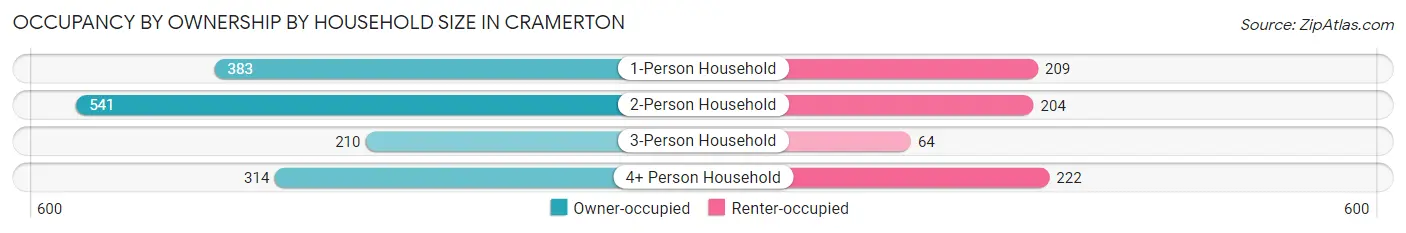
| Household Size | Owner-occupied | Renter-occupied |
| 1-Person Household | 383 (64.7%) | 209 (35.3%) |
| 2-Person Household | 541 (72.6%) | 204 (27.4%) |
| 3-Person Household | 210 (76.6%) | 64 (23.4%) |
| 4+ Person Household | 314 (58.6%) | 222 (41.4%) |
| Total Housing Units | 1,448 (67.4%) | 699 (32.6%) |
Occupancy by Educational Attainment in Cramerton
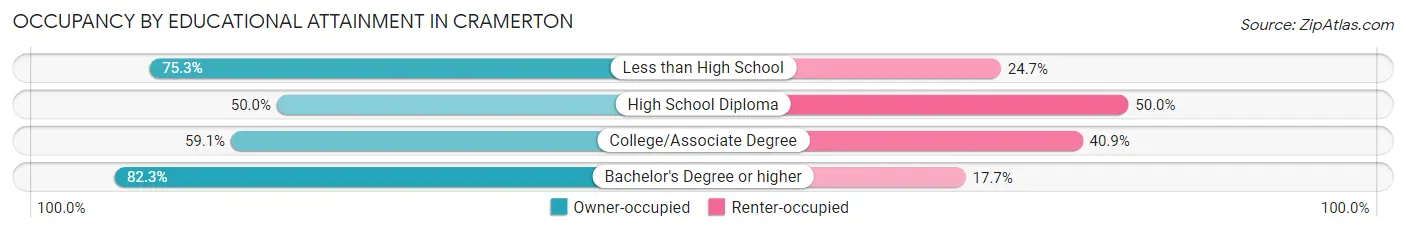
| Household Size | Owner-occupied | Renter-occupied |
| Less than High School | 67 (75.3%) | 22 (24.7%) |
| High School Diploma | 215 (50.0%) | 215 (50.0%) |
| College/Associate Degree | 442 (59.1%) | 306 (40.9%) |
| Bachelor's Degree or higher | 724 (82.3%) | 156 (17.7%) |
Occupancy by Age of Householder in Cramerton
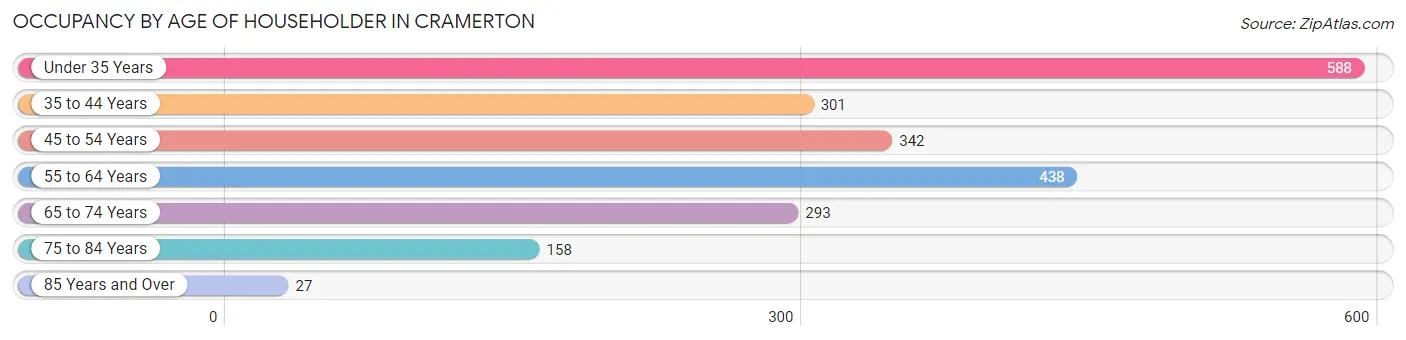
| Age Bracket | # Households | % Households |
| Under 35 Years | 588 | 27.4% |
| 35 to 44 Years | 301 | 14.0% |
| 45 to 54 Years | 342 | 15.9% |
| 55 to 64 Years | 438 | 20.4% |
| 65 to 74 Years | 293 | 13.7% |
| 75 to 84 Years | 158 | 7.4% |
| 85 Years and Over | 27 | 1.3% |
| Total | 2,147 | 100.0% |
Housing Finances in Cramerton
Median Income by Occupancy in Cramerton
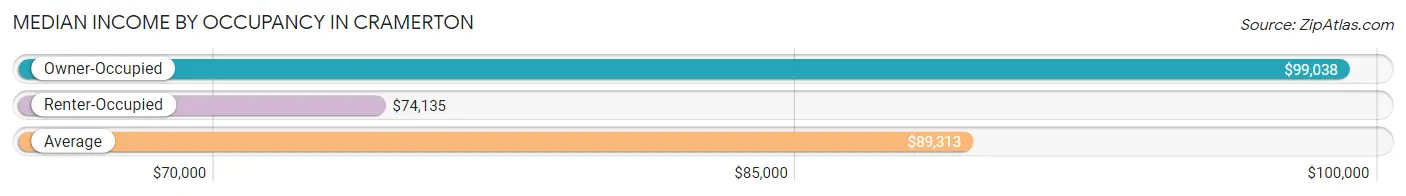
| Occupancy Type | # Households | Median Income |
| Owner-Occupied | 1,448 (67.4%) | $99,038 |
| Renter-Occupied | 699 (32.6%) | $74,135 |
| Average | 2,147 (100.0%) | $89,313 |
Occupancy by Householder Income Bracket in Cramerton
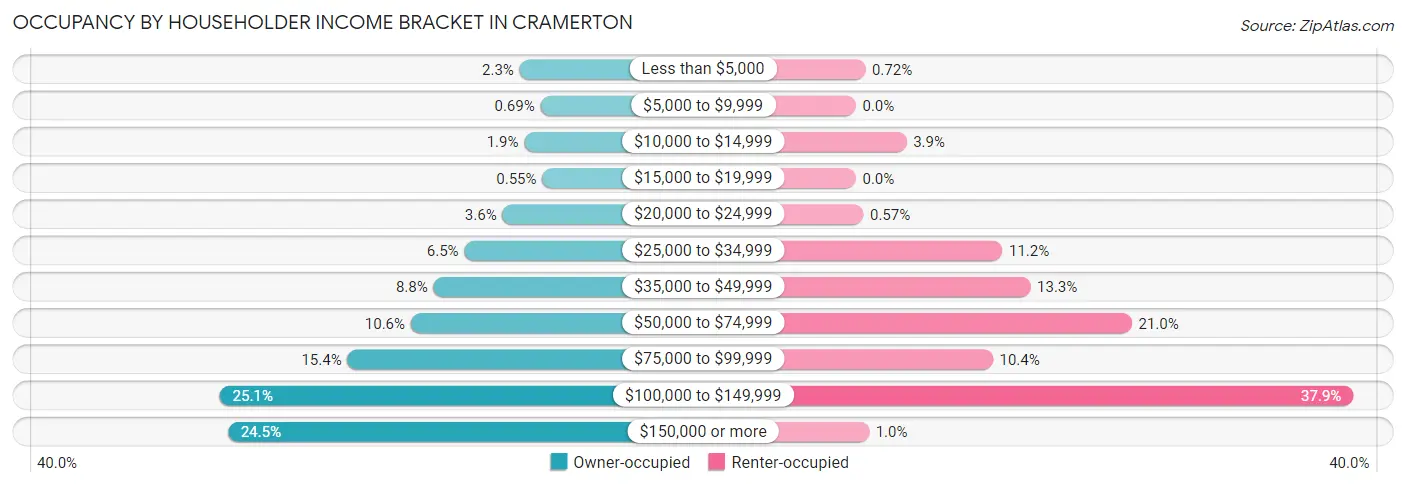
| Income Bracket | Owner-occupied | Renter-occupied |
| Less than $5,000 | 33 (2.3%) | 5 (0.7%) |
| $5,000 to $9,999 | 10 (0.7%) | 0 (0.0%) |
| $10,000 to $14,999 | 28 (1.9%) | 27 (3.9%) |
| $15,000 to $19,999 | 8 (0.5%) | 0 (0.0%) |
| $20,000 to $24,999 | 52 (3.6%) | 4 (0.6%) |
| $25,000 to $34,999 | 94 (6.5%) | 78 (11.2%) |
| $35,000 to $49,999 | 128 (8.8%) | 93 (13.3%) |
| $50,000 to $74,999 | 153 (10.6%) | 147 (21.0%) |
| $75,000 to $99,999 | 223 (15.4%) | 73 (10.4%) |
| $100,000 to $149,999 | 364 (25.1%) | 265 (37.9%) |
| $150,000 or more | 355 (24.5%) | 7 (1.0%) |
| Total | 1,448 (100.0%) | 699 (100.0%) |
Monthly Housing Cost Tiers in Cramerton
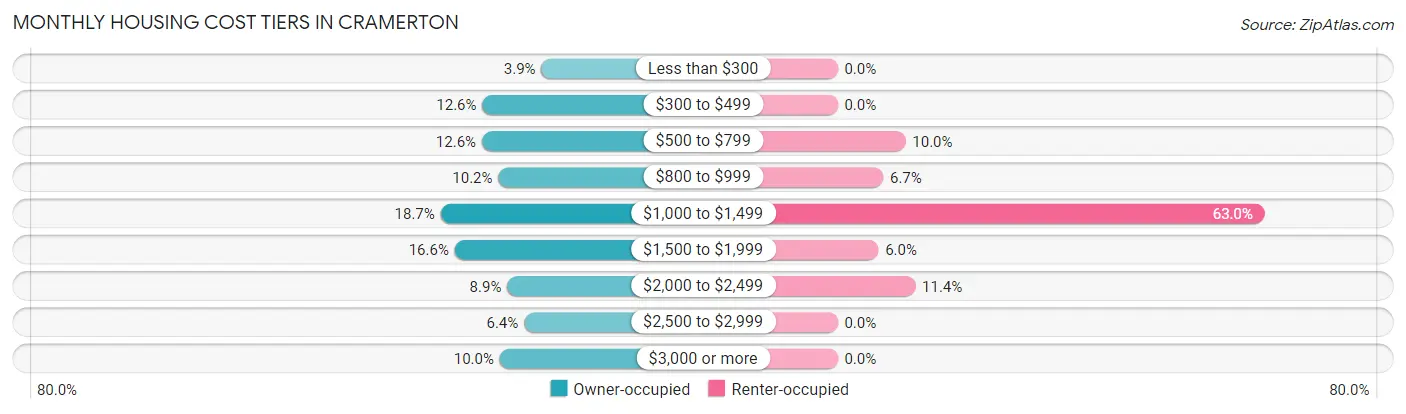
| Monthly Cost | Owner-occupied | Renter-occupied |
| Less than $300 | 56 (3.9%) | 0 (0.0%) |
| $300 to $499 | 182 (12.6%) | 0 (0.0%) |
| $500 to $799 | 183 (12.6%) | 70 (10.0%) |
| $800 to $999 | 148 (10.2%) | 47 (6.7%) |
| $1,000 to $1,499 | 271 (18.7%) | 440 (62.9%) |
| $1,500 to $1,999 | 241 (16.6%) | 42 (6.0%) |
| $2,000 to $2,499 | 129 (8.9%) | 80 (11.4%) |
| $2,500 to $2,999 | 93 (6.4%) | 0 (0.0%) |
| $3,000 or more | 145 (10.0%) | 0 (0.0%) |
| Total | 1,448 (100.0%) | 699 (100.0%) |
Physical Housing Characteristics in Cramerton
Housing Structures in Cramerton
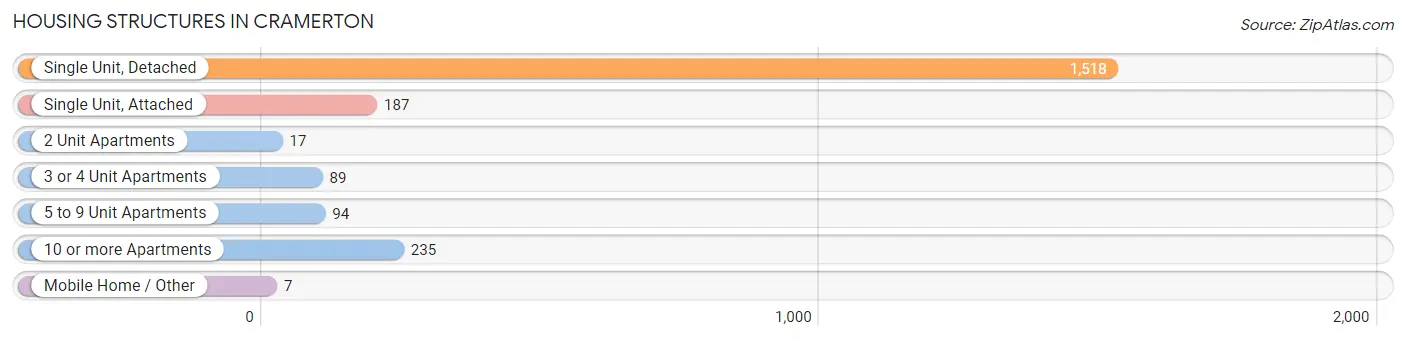
| Structure Type | # Housing Units | % Housing Units |
| Single Unit, Detached | 1,518 | 70.7% |
| Single Unit, Attached | 187 | 8.7% |
| 2 Unit Apartments | 17 | 0.8% |
| 3 or 4 Unit Apartments | 89 | 4.2% |
| 5 to 9 Unit Apartments | 94 | 4.4% |
| 10 or more Apartments | 235 | 11.0% |
| Mobile Home / Other | 7 | 0.3% |
| Total | 2,147 | 100.0% |
Housing Structures by Occupancy in Cramerton
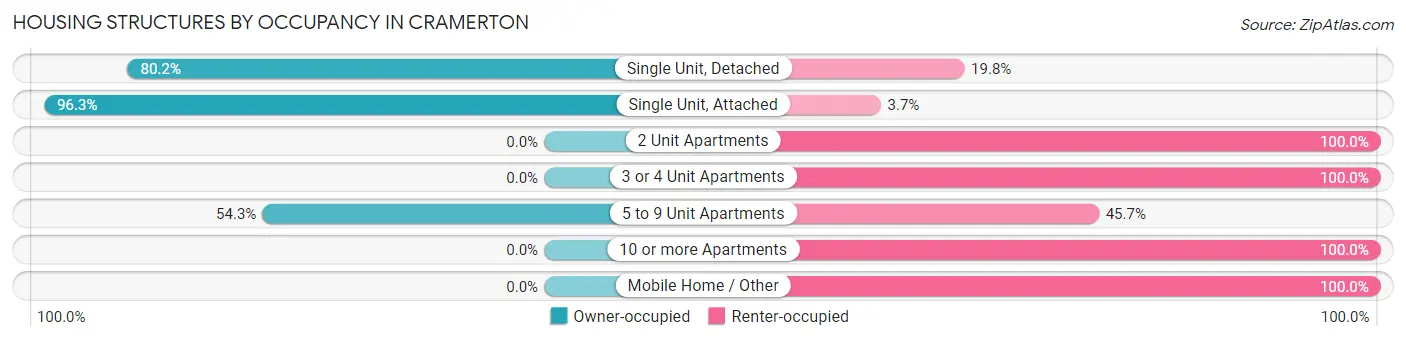
| Structure Type | Owner-occupied | Renter-occupied |
| Single Unit, Detached | 1,217 (80.2%) | 301 (19.8%) |
| Single Unit, Attached | 180 (96.3%) | 7 (3.7%) |
| 2 Unit Apartments | 0 (0.0%) | 17 (100.0%) |
| 3 or 4 Unit Apartments | 0 (0.0%) | 89 (100.0%) |
| 5 to 9 Unit Apartments | 51 (54.3%) | 43 (45.7%) |
| 10 or more Apartments | 0 (0.0%) | 235 (100.0%) |
| Mobile Home / Other | 0 (0.0%) | 7 (100.0%) |
| Total | 1,448 (67.4%) | 699 (32.6%) |
Housing Structures by Number of Rooms in Cramerton
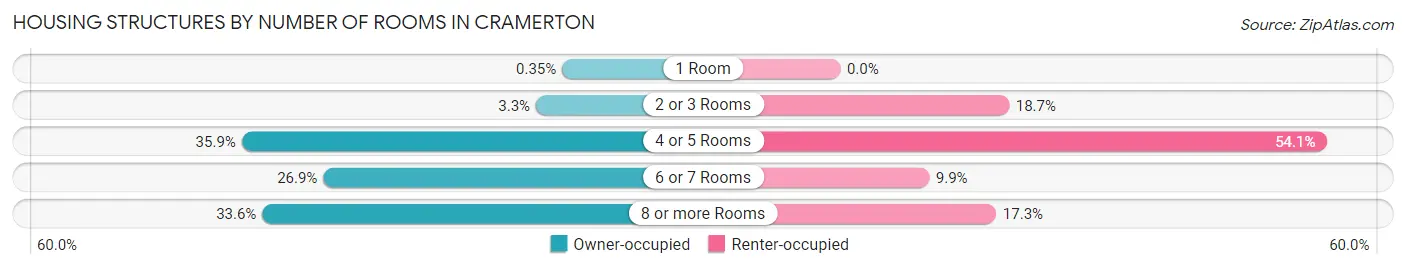
| Number of Rooms | Owner-occupied | Renter-occupied |
| 1 Room | 5 (0.4%) | 0 (0.0%) |
| 2 or 3 Rooms | 47 (3.3%) | 131 (18.7%) |
| 4 or 5 Rooms | 520 (35.9%) | 378 (54.1%) |
| 6 or 7 Rooms | 389 (26.9%) | 69 (9.9%) |
| 8 or more Rooms | 487 (33.6%) | 121 (17.3%) |
| Total | 1,448 (100.0%) | 699 (100.0%) |
Housing Structure by Heating Type in Cramerton
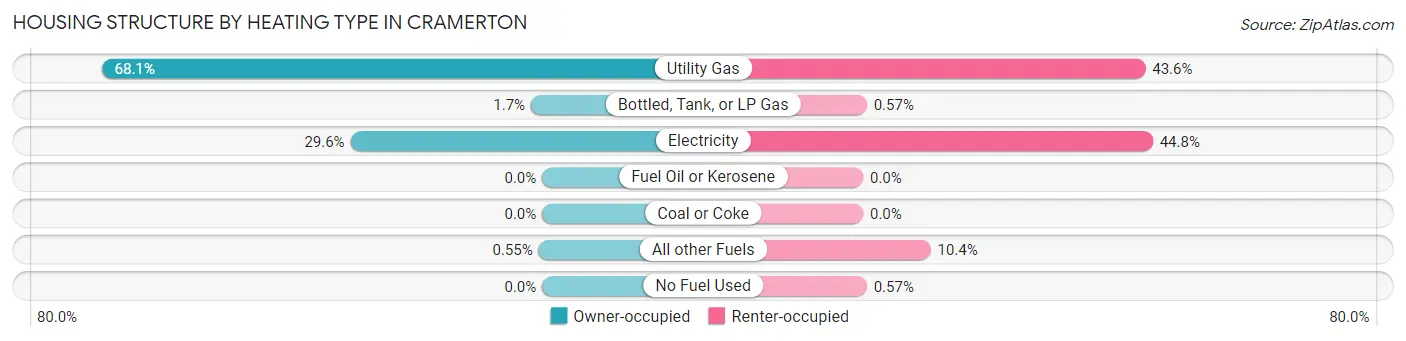
| Heating Type | Owner-occupied | Renter-occupied |
| Utility Gas | 986 (68.1%) | 305 (43.6%) |
| Bottled, Tank, or LP Gas | 25 (1.7%) | 4 (0.6%) |
| Electricity | 429 (29.6%) | 313 (44.8%) |
| Fuel Oil or Kerosene | 0 (0.0%) | 0 (0.0%) |
| Coal or Coke | 0 (0.0%) | 0 (0.0%) |
| All other Fuels | 8 (0.5%) | 73 (10.4%) |
| No Fuel Used | 0 (0.0%) | 4 (0.6%) |
| Total | 1,448 (100.0%) | 699 (100.0%) |
Household Vehicle Usage in Cramerton
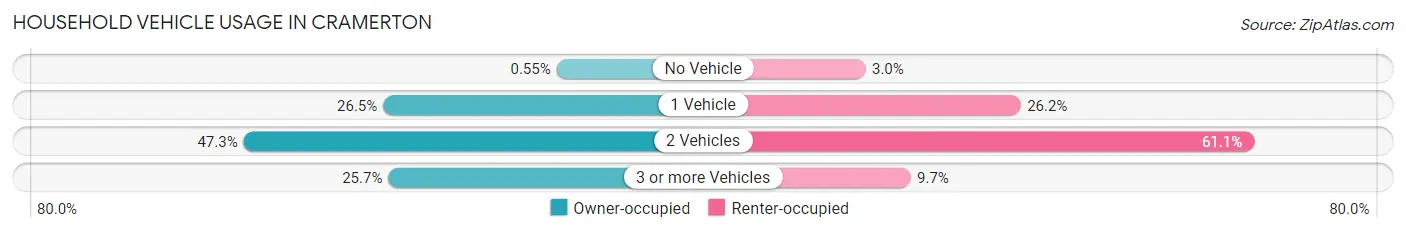
| Vehicles per Household | Owner-occupied | Renter-occupied |
| No Vehicle | 8 (0.5%) | 21 (3.0%) |
| 1 Vehicle | 383 (26.5%) | 183 (26.2%) |
| 2 Vehicles | 685 (47.3%) | 427 (61.1%) |
| 3 or more Vehicles | 372 (25.7%) | 68 (9.7%) |
| Total | 1,448 (100.0%) | 699 (100.0%) |
Real Estate & Mortgages in Cramerton
Real Estate and Mortgage Overview in Cramerton
| Characteristic | Without Mortgage | With Mortgage |
| Housing Units | 406 | 1,042 |
| Median Property Value | $221,400 | $298,100 |
| Median Household Income | $57,857 | $303 |
| Monthly Housing Costs | $492 | $145 |
| Real Estate Taxes | $2,365 | $0 |
Property Value by Mortgage Status in Cramerton
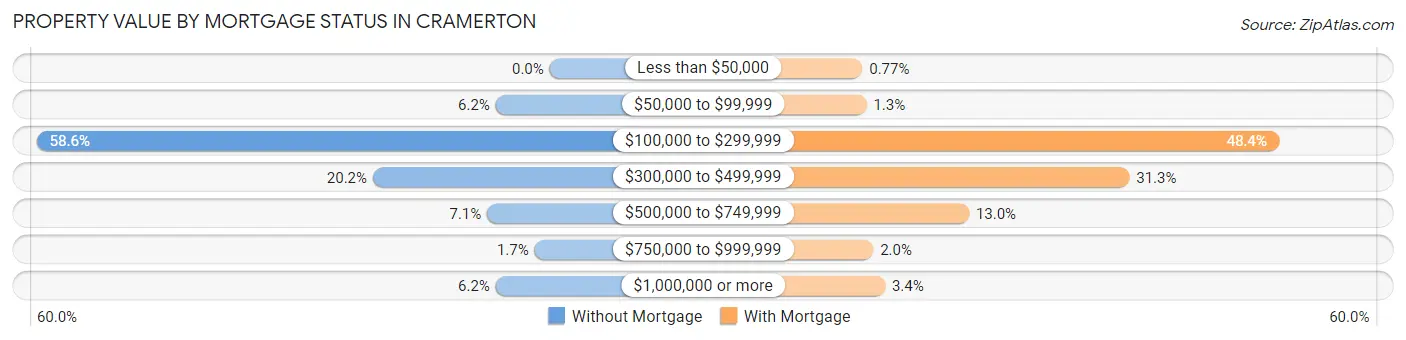
| Property Value | Without Mortgage | With Mortgage |
| Less than $50,000 | 0 (0.0%) | 8 (0.8%) |
| $50,000 to $99,999 | 25 (6.2%) | 13 (1.3%) |
| $100,000 to $299,999 | 238 (58.6%) | 504 (48.4%) |
| $300,000 to $499,999 | 82 (20.2%) | 326 (31.3%) |
| $500,000 to $749,999 | 29 (7.1%) | 135 (13.0%) |
| $750,000 to $999,999 | 7 (1.7%) | 21 (2.0%) |
| $1,000,000 or more | 25 (6.2%) | 35 (3.4%) |
| Total | 406 (100.0%) | 1,042 (100.0%) |
Household Income by Mortgage Status in Cramerton
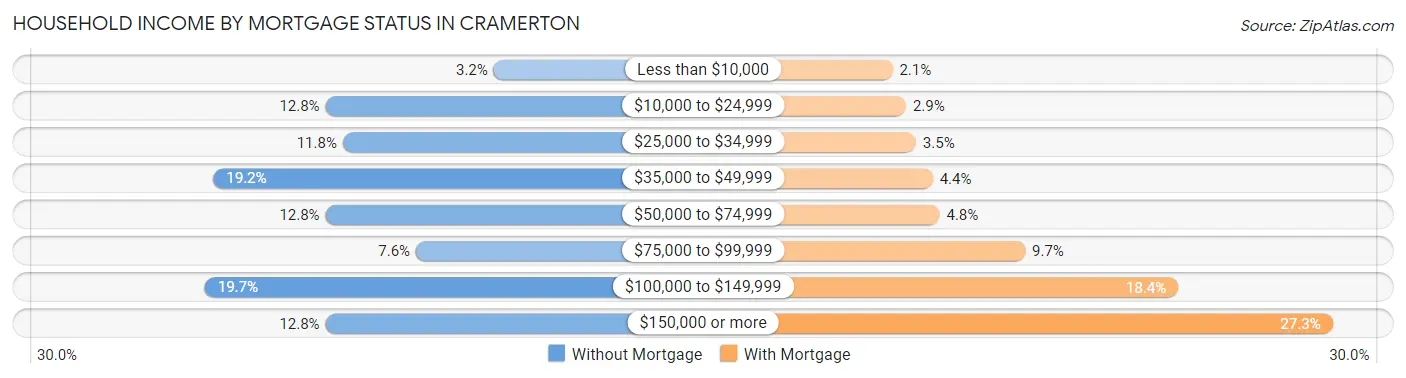
| Household Income | Without Mortgage | With Mortgage |
| Less than $10,000 | 13 (3.2%) | 22 (2.1%) |
| $10,000 to $24,999 | 52 (12.8%) | 30 (2.9%) |
| $25,000 to $34,999 | 48 (11.8%) | 36 (3.5%) |
| $35,000 to $49,999 | 78 (19.2%) | 46 (4.4%) |
| $50,000 to $74,999 | 52 (12.8%) | 50 (4.8%) |
| $75,000 to $99,999 | 31 (7.6%) | 101 (9.7%) |
| $100,000 to $149,999 | 80 (19.7%) | 192 (18.4%) |
| $150,000 or more | 52 (12.8%) | 284 (27.3%) |
| Total | 406 (100.0%) | 1,042 (100.0%) |
Property Value to Household Income Ratio in Cramerton
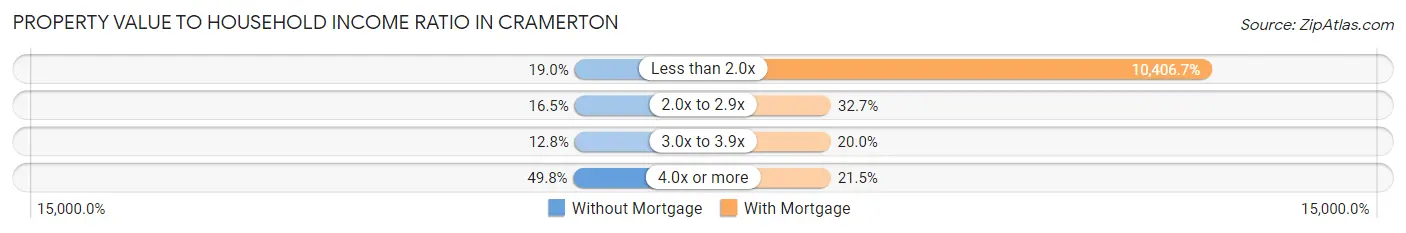
| Value-to-Income Ratio | Without Mortgage | With Mortgage |
| Less than 2.0x | 77 (19.0%) | 108,438 (10,406.7%) |
| 2.0x to 2.9x | 67 (16.5%) | 341 (32.7%) |
| 3.0x to 3.9x | 52 (12.8%) | 208 (20.0%) |
| 4.0x or more | 202 (49.7%) | 224 (21.5%) |
| Total | 406 (100.0%) | 1,042 (100.0%) |
Real Estate Taxes by Mortgage Status in Cramerton
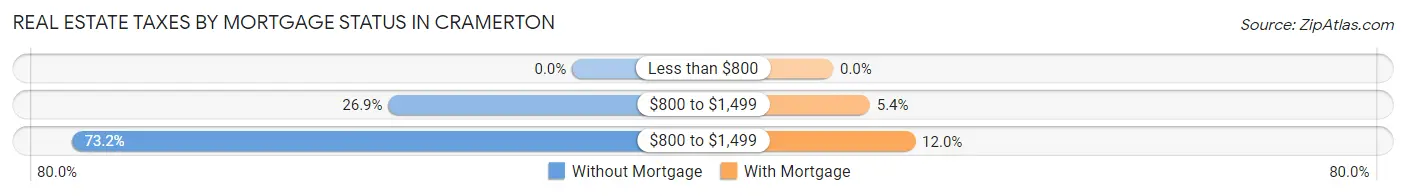
| Property Taxes | Without Mortgage | With Mortgage |
| Less than $800 | 0 (0.0%) | 0 (0.0%) |
| $800 to $1,499 | 109 (26.9%) | 56 (5.4%) |
| $800 to $1,499 | 297 (73.2%) | 125 (12.0%) |
| Total | 406 (100.0%) | 1,042 (100.0%) |
Health & Disability in Cramerton
Health Insurance Coverage by Age in Cramerton
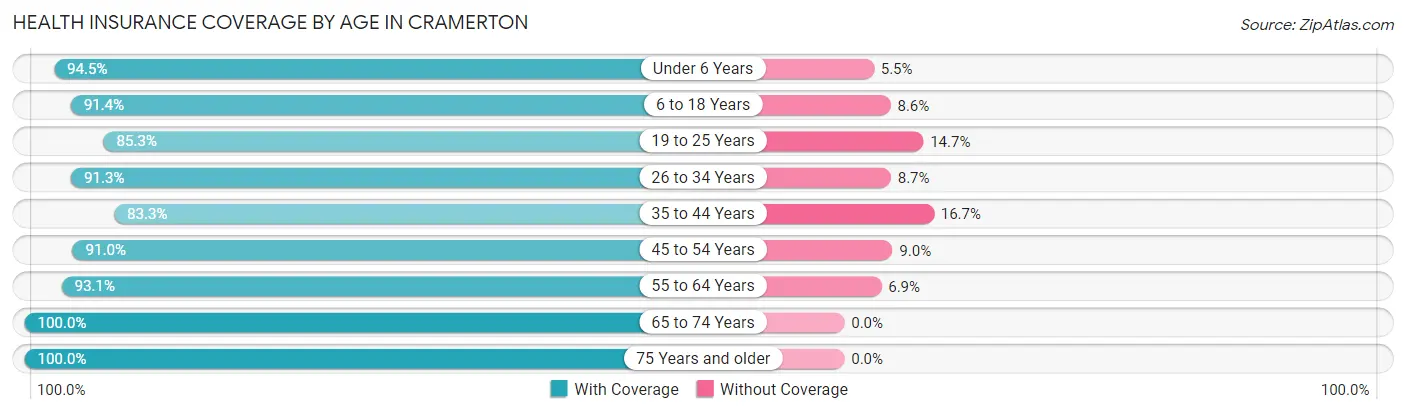
| Age Bracket | With Coverage | Without Coverage |
| Under 6 Years | 447 (94.5%) | 26 (5.5%) |
| 6 to 18 Years | 806 (91.4%) | 76 (8.6%) |
| 19 to 25 Years | 139 (85.3%) | 24 (14.7%) |
| 26 to 34 Years | 1,001 (91.3%) | 95 (8.7%) |
| 35 to 44 Years | 494 (83.3%) | 99 (16.7%) |
| 45 to 54 Years | 629 (91.0%) | 62 (9.0%) |
| 55 to 64 Years | 688 (93.1%) | 51 (6.9%) |
| 65 to 74 Years | 413 (100.0%) | 0 (0.0%) |
| 75 Years and older | 237 (100.0%) | 0 (0.0%) |
| Total | 4,854 (91.8%) | 433 (8.2%) |
Health Insurance Coverage by Citizenship Status in Cramerton
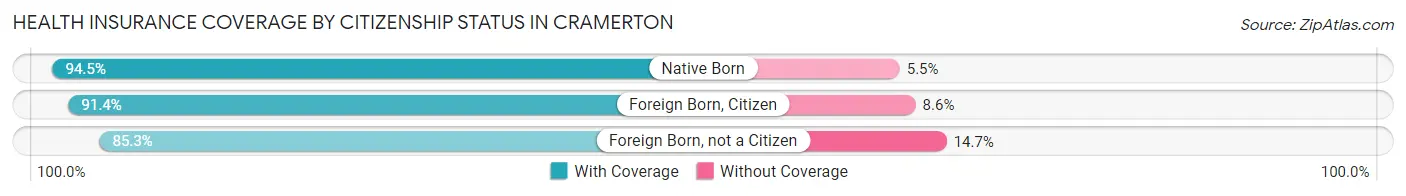
| Citizenship Status | With Coverage | Without Coverage |
| Native Born | 447 (94.5%) | 26 (5.5%) |
| Foreign Born, Citizen | 806 (91.4%) | 76 (8.6%) |
| Foreign Born, not a Citizen | 139 (85.3%) | 24 (14.7%) |
Health Insurance Coverage by Household Income in Cramerton
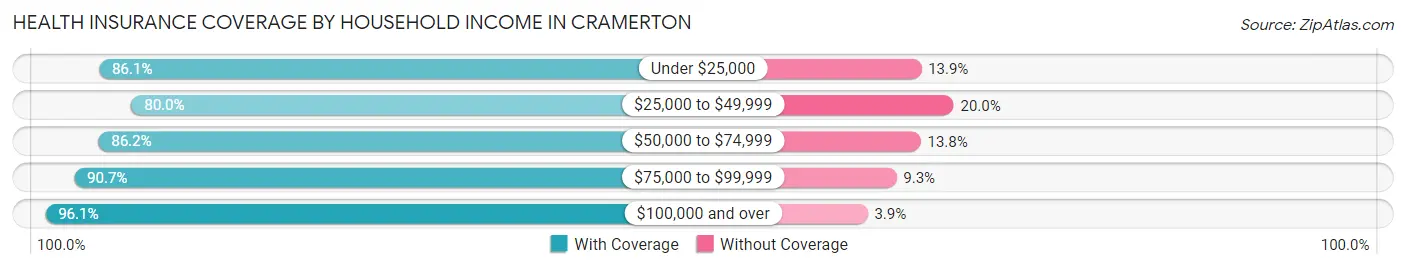
| Household Income | With Coverage | Without Coverage |
| Under $25,000 | 179 (86.1%) | 29 (13.9%) |
| $25,000 to $49,999 | 460 (80.0%) | 115 (20.0%) |
| $50,000 to $74,999 | 586 (86.2%) | 94 (13.8%) |
| $75,000 to $99,999 | 791 (90.7%) | 81 (9.3%) |
| $100,000 and over | 2,831 (96.1%) | 114 (3.9%) |
Public vs Private Health Insurance Coverage by Age in Cramerton
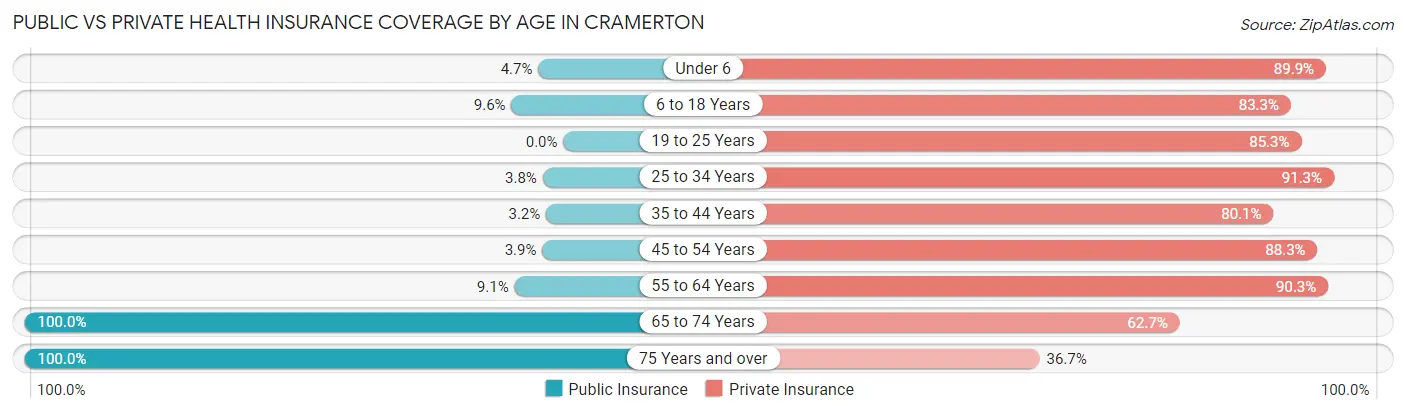
| Age Bracket | Public Insurance | Private Insurance |
| Under 6 | 22 (4.6%) | 425 (89.8%) |
| 6 to 18 Years | 85 (9.6%) | 735 (83.3%) |
| 19 to 25 Years | 0 (0.0%) | 139 (85.3%) |
| 25 to 34 Years | 42 (3.8%) | 1,001 (91.3%) |
| 35 to 44 Years | 19 (3.2%) | 475 (80.1%) |
| 45 to 54 Years | 27 (3.9%) | 610 (88.3%) |
| 55 to 64 Years | 67 (9.1%) | 667 (90.3%) |
| 65 to 74 Years | 413 (100.0%) | 259 (62.7%) |
| 75 Years and over | 237 (100.0%) | 87 (36.7%) |
| Total | 912 (17.2%) | 4,398 (83.2%) |
Disability Status by Sex by Age in Cramerton
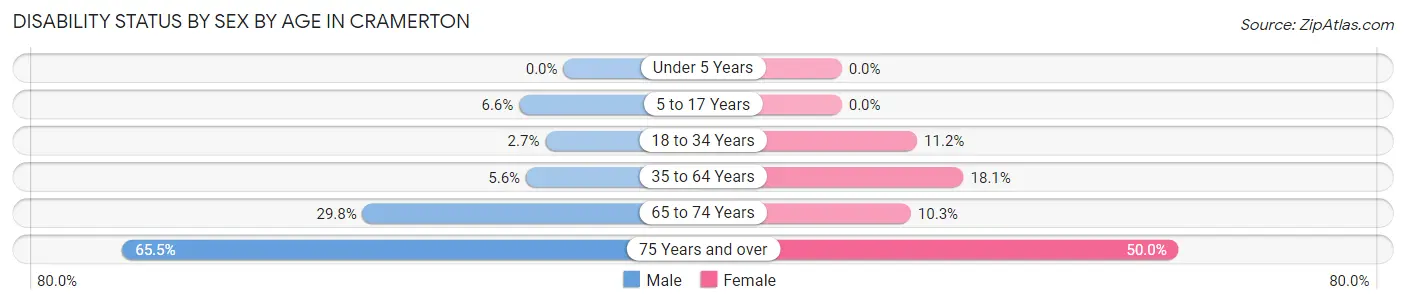
| Age Bracket | Male | Female |
| Under 5 Years | 0 (0.0%) | 0 (0.0%) |
| 5 to 17 Years | 33 (6.6%) | 0 (0.0%) |
| 18 to 34 Years | 15 (2.7%) | 84 (11.2%) |
| 35 to 64 Years | 55 (5.6%) | 187 (18.1%) |
| 65 to 74 Years | 65 (29.8%) | 20 (10.3%) |
| 75 Years and over | 74 (65.5%) | 62 (50.0%) |
Disability Class by Sex by Age in Cramerton
Disability Class: Hearing Difficulty
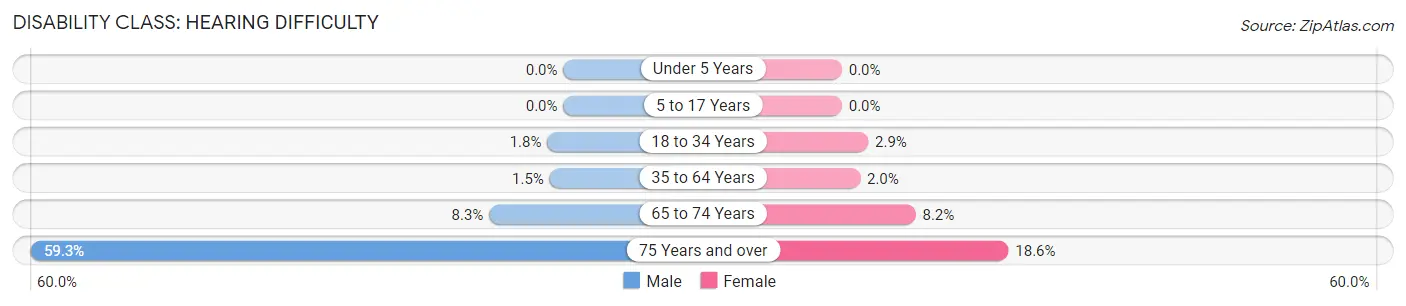
| Age Bracket | Male | Female |
| Under 5 Years | 0 (0.0%) | 0 (0.0%) |
| 5 to 17 Years | 0 (0.0%) | 0 (0.0%) |
| 18 to 34 Years | 10 (1.8%) | 22 (2.9%) |
| 35 to 64 Years | 15 (1.5%) | 21 (2.0%) |
| 65 to 74 Years | 18 (8.3%) | 16 (8.2%) |
| 75 Years and over | 67 (59.3%) | 23 (18.5%) |
Disability Class: Vision Difficulty
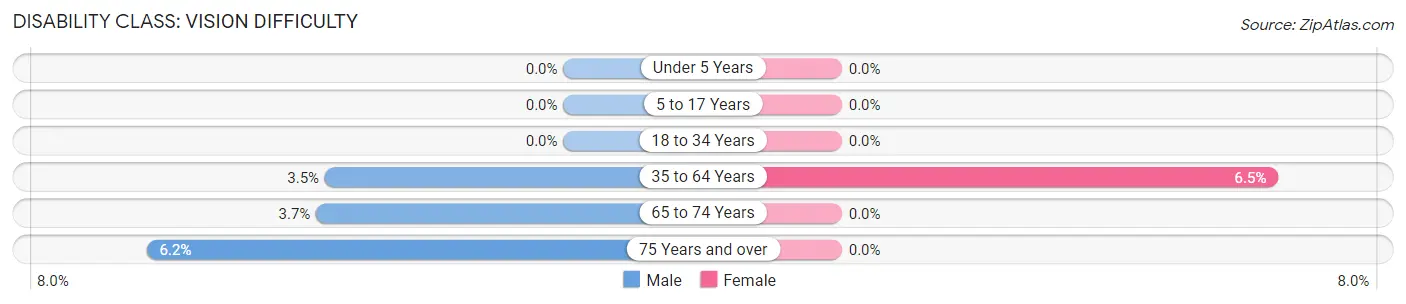
| Age Bracket | Male | Female |
| Under 5 Years | 0 (0.0%) | 0 (0.0%) |
| 5 to 17 Years | 0 (0.0%) | 0 (0.0%) |
| 18 to 34 Years | 0 (0.0%) | 0 (0.0%) |
| 35 to 64 Years | 35 (3.5%) | 67 (6.5%) |
| 65 to 74 Years | 8 (3.7%) | 0 (0.0%) |
| 75 Years and over | 7 (6.2%) | 0 (0.0%) |
Disability Class: Cognitive Difficulty
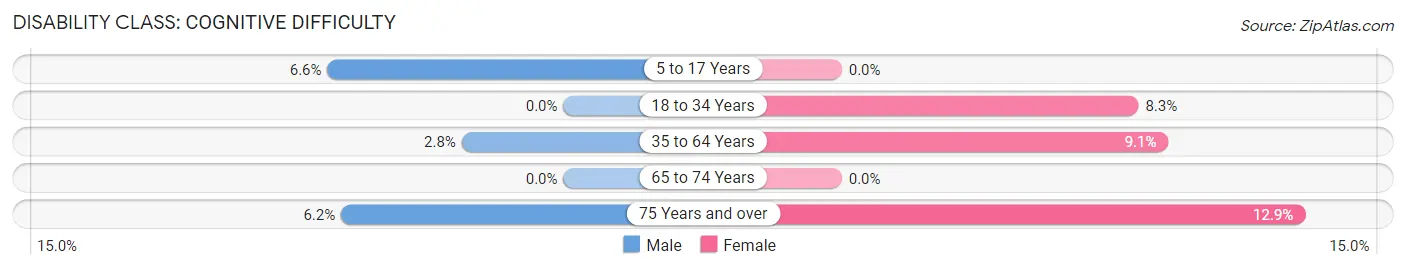
| Age Bracket | Male | Female |
| 5 to 17 Years | 33 (6.6%) | 0 (0.0%) |
| 18 to 34 Years | 0 (0.0%) | 62 (8.3%) |
| 35 to 64 Years | 28 (2.8%) | 94 (9.1%) |
| 65 to 74 Years | 0 (0.0%) | 0 (0.0%) |
| 75 Years and over | 7 (6.2%) | 16 (12.9%) |
Disability Class: Ambulatory Difficulty
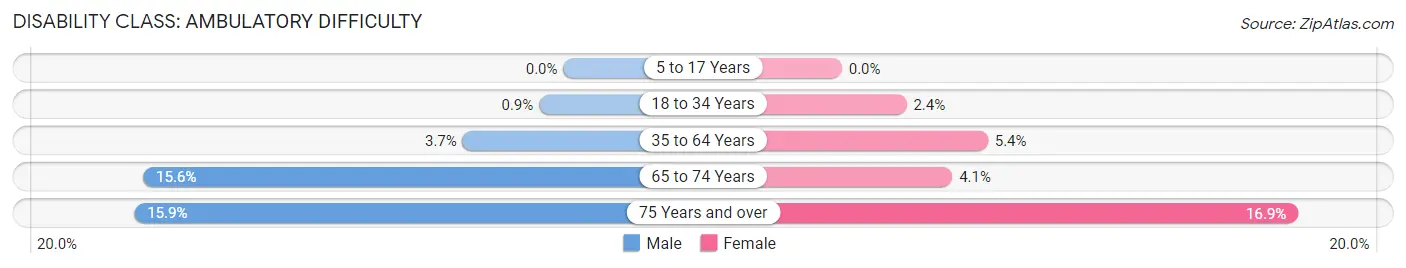
| Age Bracket | Male | Female |
| 5 to 17 Years | 0 (0.0%) | 0 (0.0%) |
| 18 to 34 Years | 5 (0.9%) | 18 (2.4%) |
| 35 to 64 Years | 37 (3.7%) | 56 (5.4%) |
| 65 to 74 Years | 34 (15.6%) | 8 (4.1%) |
| 75 Years and over | 18 (15.9%) | 21 (16.9%) |
Disability Class: Self-Care Difficulty
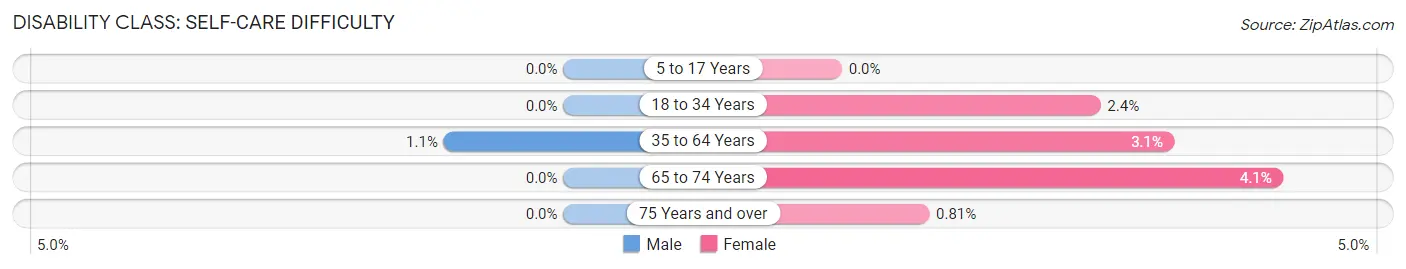
| Age Bracket | Male | Female |
| 5 to 17 Years | 0 (0.0%) | 0 (0.0%) |
| 18 to 34 Years | 0 (0.0%) | 18 (2.4%) |
| 35 to 64 Years | 11 (1.1%) | 32 (3.1%) |
| 65 to 74 Years | 0 (0.0%) | 8 (4.1%) |
| 75 Years and over | 0 (0.0%) | 1 (0.8%) |
Technology Access in Cramerton
Computing Device Access in Cramerton
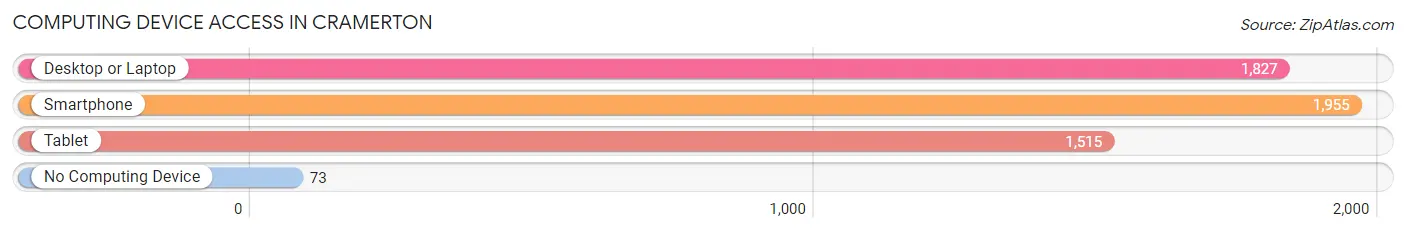
| Device Type | # Households | % Households |
| Desktop or Laptop | 1,827 | 85.1% |
| Smartphone | 1,955 | 91.1% |
| Tablet | 1,515 | 70.6% |
| No Computing Device | 73 | 3.4% |
| Total | 2,147 | 100.0% |
Internet Access in Cramerton
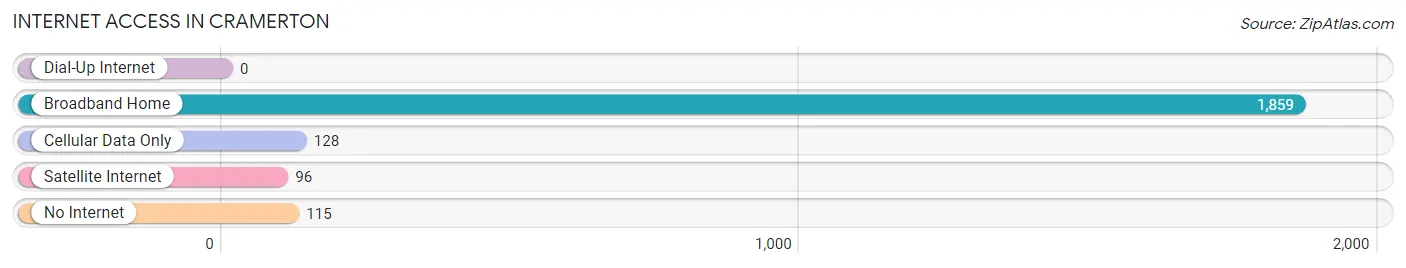
| Internet Type | # Households | % Households |
| Dial-Up Internet | 0 | 0.0% |
| Broadband Home | 1,859 | 86.6% |
| Cellular Data Only | 128 | 6.0% |
| Satellite Internet | 96 | 4.5% |
| No Internet | 115 | 5.4% |
| Total | 2,147 | 100.0% |
Cramerton Summary
Cramerton, North Carolina is a small town located in Gaston County, approximately 15 miles west of Charlotte. The town was founded in 1891 and incorporated in 1907. It is situated along the South Fork Catawba River and is home to approximately 4,000 people.
History
Cramerton was founded in 1891 by William Cramer, a local farmer and businessman. He purchased a large tract of land along the South Fork Catawba River and began to develop the area. He named the town after himself and it quickly grew into a thriving community.
The town was officially incorporated in 1907 and the first mayor was elected in 1908. The town quickly grew and by the 1920s, it had become a popular destination for tourists and vacationers. The town was known for its beautiful scenery and its many outdoor activities, such as fishing, hunting, and camping.
In the 1950s, the town began to experience a period of growth and development. The population increased and new businesses began to open. The town also began to attract new industries, such as textiles and furniture manufacturing.
Geography
Cramerton is located in Gaston County, approximately 15 miles west of Charlotte. The town is situated along the South Fork Catawba River and is surrounded by rolling hills and forests. The town is located at an elevation of 830 feet above sea level.
The climate in Cramerton is mild and humid. The average temperature in the summer is around 80 degrees Fahrenheit and the average temperature in the winter is around 40 degrees Fahrenheit. The town receives an average of 48 inches of rain per year.
Economy
The economy of Cramerton is largely based on manufacturing and retail. The town is home to several large manufacturing companies, such as Cramerton Furniture Company and Cramerton Textiles. The town also has several retail stores, such as grocery stores, clothing stores, and restaurants.
The town is also home to several small businesses, such as auto repair shops, hair salons, and florists. The town is also home to several medical facilities, such as a hospital and several doctor’s offices.
Demographics
As of the 2010 census, the population of Cramerton was 4,000. The racial makeup of the town was 87.3% White, 8.2% African American, 0.7% Asian, 0.2% Native American, and 3.6% from other races. The median household income was $45,000 and the median family income was $50,000.
The town is served by the Gaston County School System. The town has one elementary school, one middle school, and one high school. The town also has several private schools, such as Cramerton Christian Academy and Cramerton Academy.
Conclusion
Cramerton, North Carolina is a small town located in Gaston County, approximately 15 miles west of Charlotte. The town was founded in 1891 and incorporated in 1907. It is situated along the South Fork Catawba River and is home to approximately 4,000 people. The economy of Cramerton is largely based on manufacturing and retail. The town is served by the Gaston County School System and has several private schools. The town has a mild and humid climate and receives an average of 48 inches of rain per year. The population of Cramerton is 87.3% White, 8.2% African American, 0.7% Asian, 0.2% Native American, and 3.6% from other races. The median household income was $45,000 and the median family income was $50,000.
Common Questions
What is Per Capita Income in Cramerton?
Per Capita income in Cramerton is $46,776.
What is the Median Family Income in Cramerton?
Median Family Income in Cramerton is $101,971.
What is the Median Household income in Cramerton?
Median Household Income in Cramerton is $89,313.
What is Income or Wage Gap in Cramerton?
Income or Wage Gap in Cramerton is 41.1%.
Women in Cramerton earn 58.9 cents for every dollar earned by a man.
What is Inequality or Gini Index in Cramerton?
Inequality or Gini Index in Cramerton is 0.43.
What is the Total Population of Cramerton?
Total Population of Cramerton is 5,294.
What is the Total Male Population of Cramerton?
Total Male Population of Cramerton is 2,559.
What is the Total Female Population of Cramerton?
Total Female Population of Cramerton is 2,735.
What is the Ratio of Males per 100 Females in Cramerton?
There are 93.56 Males per 100 Females in Cramerton.
What is the Ratio of Females per 100 Males in Cramerton?
There are 106.88 Females per 100 Males in Cramerton.
What is the Median Population Age in Cramerton?
Median Population Age in Cramerton is 35.3 Years.
What is the Average Family Size in Cramerton
Average Family Size in Cramerton is 3.0 People.
What is the Average Household Size in Cramerton
Average Household Size in Cramerton is 2.5 People.
How Large is the Labor Force in Cramerton?
There are 3,090 People in the Labor Forcein in Cramerton.
What is the Percentage of People in the Labor Force in Cramerton?
74.5% of People are in the Labor Force in Cramerton.
What is the Unemployment Rate in Cramerton?
Unemployment Rate in Cramerton is 4.7%.