Battle Creek, MI Map & Demographics
Battle Creek Map
Battle Creek Overview
$28,689
PER CAPITA INCOME
$67,665
AVG FAMILY INCOME
$49,684
AVG HOUSEHOLD INCOME
16.7%
WAGE / INCOME GAP [ % ]
83.3¢/ $1
WAGE / INCOME GAP [ $ ]
$10,323
FAMILY INCOME DEFICIT
0.45
INEQUALITY / GINI INDEX
52,469
TOTAL POPULATION
25,531
MALE POPULATION
26,938
FEMALE POPULATION
94.78
MALES / 100 FEMALES
105.51
FEMALES / 100 MALES
37.0
MEDIAN AGE
3.2
AVG FAMILY SIZE
2.4
AVG HOUSEHOLD SIZE
25,307
LABOR FORCE [ PEOPLE ]
61.7%
PERCENT IN LABOR FORCE
7.6%
UNEMPLOYMENT RATE
Battle Creek Area Codes
Income in Battle Creek
Income Overview in Battle Creek
Per Capita Income in Battle Creek is $28,689, while median incomes of families and households are $67,665 and $49,684 respectively.
| Characteristic | Number | Measure |
| Per Capita Income | 52,469 | $28,689 |
| Median Family Income | 11,941 | $67,665 |
| Mean Family Income | 11,941 | $84,956 |
| Median Household Income | 21,140 | $49,684 |
| Mean Household Income | 21,140 | $68,566 |
| Income Deficit | 11,941 | $10,323 |
| Wage / Income Gap (%) | 52,469 | 16.70% |
| Wage / Income Gap ($) | 52,469 | 83.30¢ per $1 |
| Gini / Inequality Index | 52,469 | 0.45 |
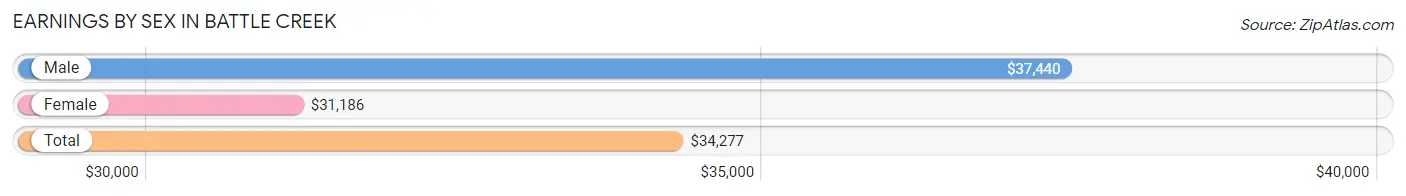
Earnings by Sex in Battle Creek
Average Earnings in Battle Creek are $34,277, $37,440 for men and $31,186 for women, a difference of 16.7%.
| Sex | Number | Average Earnings |
| Male | 13,054 (49.7%) | $37,440 |
| Female | 13,217 (50.3%) | $31,186 |
| Total | 26,271 (100.0%) | $34,277 |
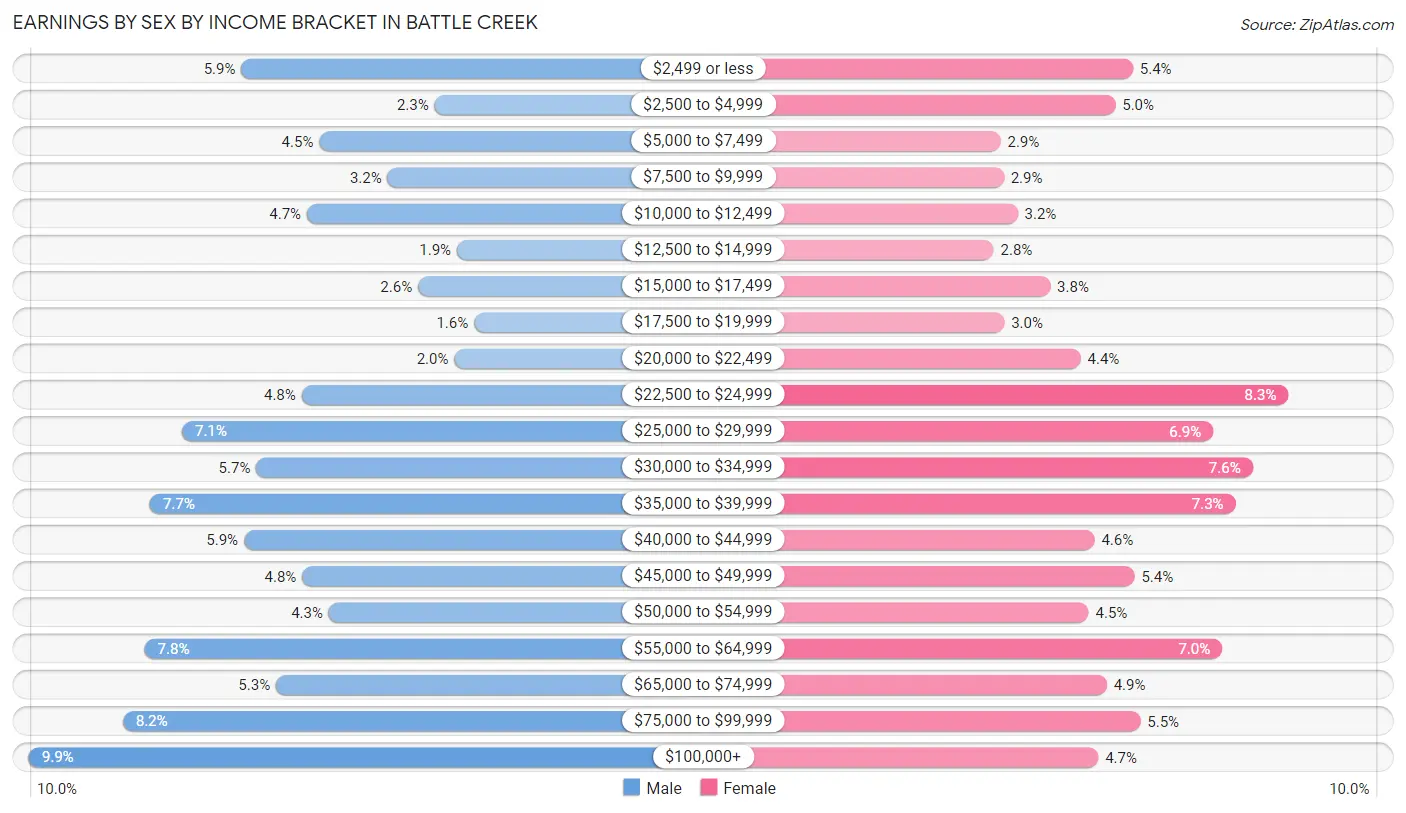
Earnings by Sex by Income Bracket in Battle Creek
The most common earnings brackets in Battle Creek are $100,000+ for men (1,295 | 9.9%) and $22,500 to $24,999 for women (1,093 | 8.3%).
| Income | Male | Female |
| $2,499 or less | 776 (5.9%) | 709 (5.4%) |
| $2,500 to $4,999 | 303 (2.3%) | 665 (5.0%) |
| $5,000 to $7,499 | 585 (4.5%) | 381 (2.9%) |
| $7,500 to $9,999 | 418 (3.2%) | 388 (2.9%) |
| $10,000 to $12,499 | 615 (4.7%) | 423 (3.2%) |
| $12,500 to $14,999 | 248 (1.9%) | 364 (2.8%) |
| $15,000 to $17,499 | 343 (2.6%) | 504 (3.8%) |
| $17,500 to $19,999 | 206 (1.6%) | 390 (2.9%) |
| $20,000 to $22,499 | 255 (1.9%) | 579 (4.4%) |
| $22,500 to $24,999 | 628 (4.8%) | 1,093 (8.3%) |
| $25,000 to $29,999 | 920 (7.0%) | 907 (6.9%) |
| $30,000 to $34,999 | 739 (5.7%) | 1,005 (7.6%) |
| $35,000 to $39,999 | 998 (7.6%) | 962 (7.3%) |
| $40,000 to $44,999 | 769 (5.9%) | 613 (4.6%) |
| $45,000 to $49,999 | 627 (4.8%) | 712 (5.4%) |
| $50,000 to $54,999 | 561 (4.3%) | 599 (4.5%) |
| $55,000 to $64,999 | 1,012 (7.7%) | 929 (7.0%) |
| $65,000 to $74,999 | 691 (5.3%) | 644 (4.9%) |
| $75,000 to $99,999 | 1,065 (8.2%) | 727 (5.5%) |
| $100,000+ | 1,295 (9.9%) | 623 (4.7%) |
| Total | 13,054 (100.0%) | 13,217 (100.0%) |
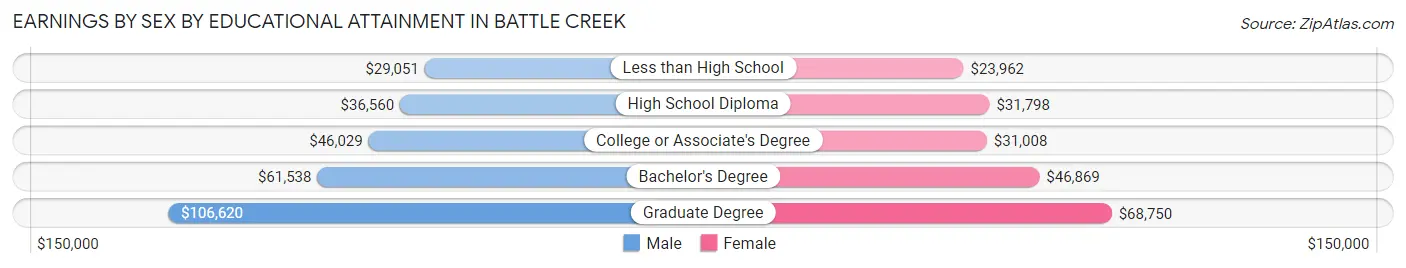
Earnings by Sex by Educational Attainment in Battle Creek
Average earnings in Battle Creek are $42,844 for men and $34,533 for women, a difference of 19.4%. Men with an educational attainment of graduate degree enjoy the highest average annual earnings of $106,620, while those with less than high school education earn the least with $29,051. Women with an educational attainment of graduate degree earn the most with the average annual earnings of $68,750, while those with less than high school education have the smallest earnings of $23,962.
| Educational Attainment | Male Income | Female Income |
| Less than High School | $29,051 | $23,962 |
| High School Diploma | $36,560 | $31,798 |
| College or Associate's Degree | $46,029 | $31,008 |
| Bachelor's Degree | $61,538 | $46,869 |
| Graduate Degree | $106,620 | $68,750 |
| Total | $42,844 | $34,533 |
Family Income in Battle Creek
Family Income Brackets in Battle Creek
According to the Battle Creek family income data, there are 2,018 families falling into the $50,000 to $74,999 income range, which is the most common income bracket and makes up 16.9% of all families. Conversely, the less than $10,000 income bracket is the least frequent group with only 370 families (3.1%) belonging to this category.
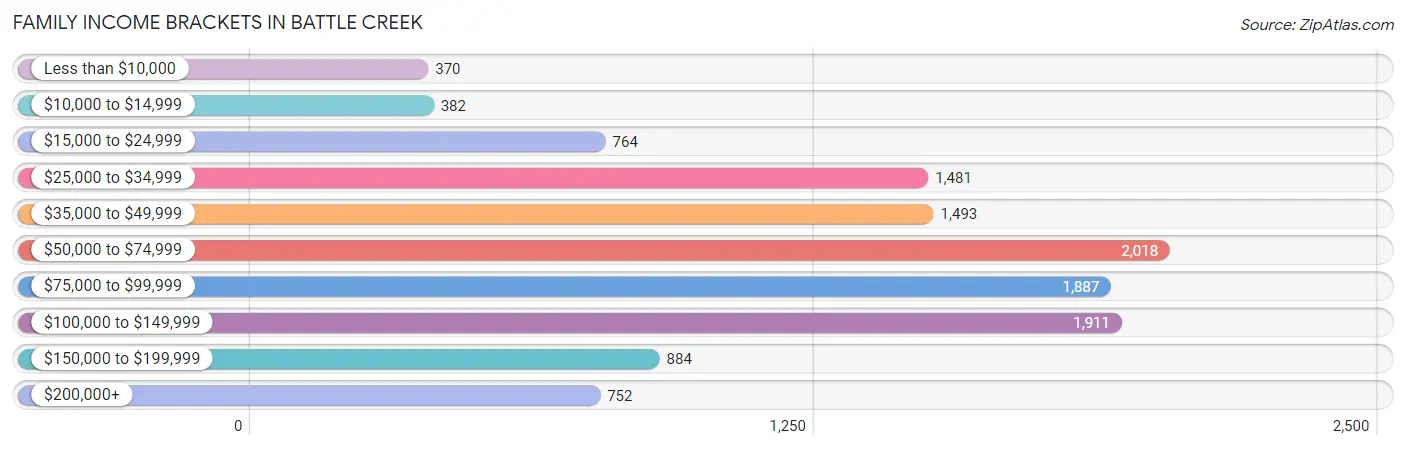
| Income Bracket | # Families | % Families |
| Less than $10,000 | 370 | 3.1% |
| $10,000 to $14,999 | 382 | 3.2% |
| $15,000 to $24,999 | 764 | 6.4% |
| $25,000 to $34,999 | 1,481 | 12.4% |
| $35,000 to $49,999 | 1,493 | 12.5% |
| $50,000 to $74,999 | 2,018 | 16.9% |
| $75,000 to $99,999 | 1,887 | 15.8% |
| $100,000 to $149,999 | 1,911 | 16.0% |
| $150,000 to $199,999 | 884 | 7.4% |
| $200,000+ | 752 | 6.3% |
Family Income by Famaliy Size in Battle Creek
7+ person families (161 | 1.3%) account for the highest median family income in Battle Creek with $84,938 per family, while 2-person families (5,663 | 47.4%) have the highest median income of $29,760 per family member.
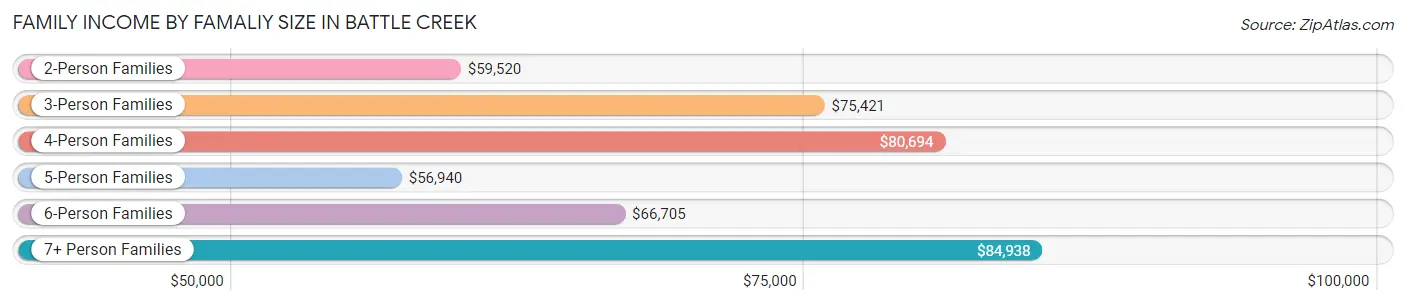
| Income Bracket | # Families | Median Income |
| 2-Person Families | 5,663 (47.4%) | $59,520 |
| 3-Person Families | 2,743 (23.0%) | $75,421 |
| 4-Person Families | 2,068 (17.3%) | $80,694 |
| 5-Person Families | 1,045 (8.7%) | $56,940 |
| 6-Person Families | 261 (2.2%) | $66,705 |
| 7+ Person Families | 161 (1.3%) | $84,938 |
| Total | 11,941 (100.0%) | $67,665 |
Family Income by Number of Earners in Battle Creek
The median family income in Battle Creek is $67,665, with families comprising 3+ earners (1,382) having the highest median family income of $123,182, while families with 1 earner (4,338) have the lowest median family income of $38,296, accounting for 11.6% and 36.3% of families, respectively.
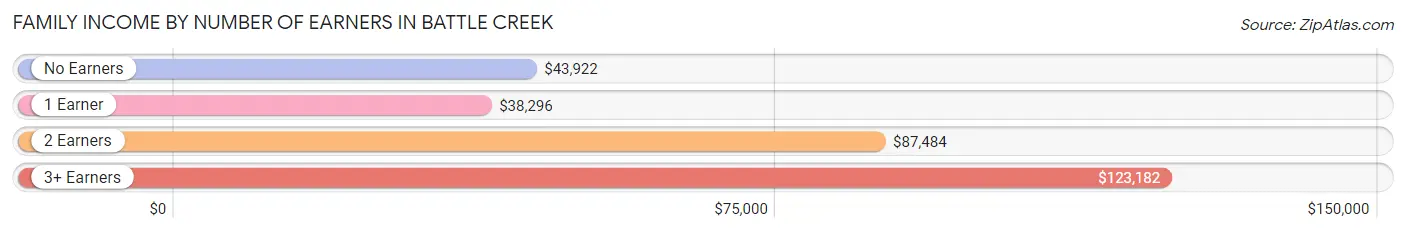
| Number of Earners | # Families | Median Income |
| No Earners | 1,950 (16.3%) | $43,922 |
| 1 Earner | 4,338 (36.3%) | $38,296 |
| 2 Earners | 4,271 (35.8%) | $87,484 |
| 3+ Earners | 1,382 (11.6%) | $123,182 |
| Total | 11,941 (100.0%) | $67,665 |
Household Income in Battle Creek
Household Income Brackets in Battle Creek
With 3,615 households falling in the category, the $50,000 to $74,999 income range is the most frequent in Battle Creek, accounting for 17.1% of all households. In contrast, only 909 households (4.3%) fall into the $200,000+ income bracket, making it the least populous group.
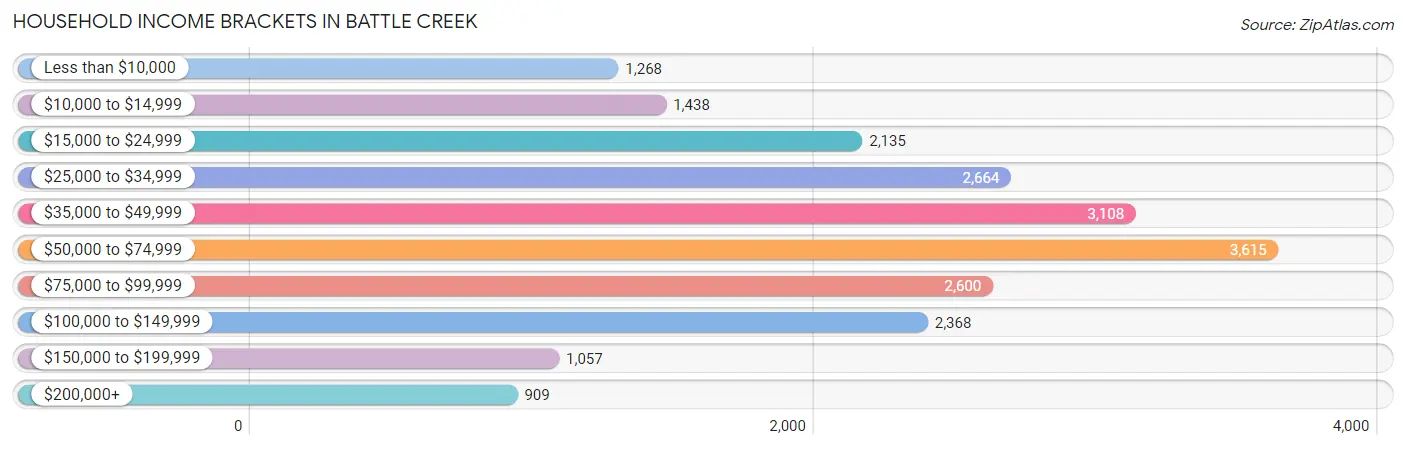
| Income Bracket | # Households | % Households |
| Less than $10,000 | 1,268 | 6.0% |
| $10,000 to $14,999 | 1,438 | 6.8% |
| $15,000 to $24,999 | 2,135 | 10.1% |
| $25,000 to $34,999 | 2,664 | 12.6% |
| $35,000 to $49,999 | 3,108 | 14.7% |
| $50,000 to $74,999 | 3,615 | 17.1% |
| $75,000 to $99,999 | 2,600 | 12.3% |
| $100,000 to $149,999 | 2,368 | 11.2% |
| $150,000 to $199,999 | 1,057 | 5.0% |
| $200,000+ | 909 | 4.3% |
Household Income by Householder Age in Battle Creek
The median household income in Battle Creek is $49,684, with the highest median household income of $61,012 found in the 45 to 64 years age bracket for the primary householder. A total of 7,507 households (35.5%) fall into this category. Meanwhile, the 15 to 24 years age bracket for the primary householder has the lowest median household income of $38,650, with 753 households (3.6%) in this group.
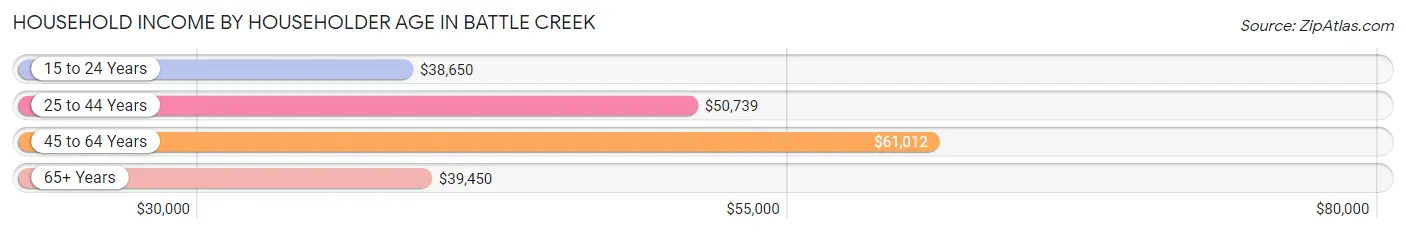
| Income Bracket | # Households | Median Income |
| 15 to 24 Years | 753 (3.6%) | $38,650 |
| 25 to 44 Years | 7,472 (35.3%) | $50,739 |
| 45 to 64 Years | 7,507 (35.5%) | $61,012 |
| 65+ Years | 5,408 (25.6%) | $39,450 |
| Total | 21,140 (100.0%) | $49,684 |
Poverty in Battle Creek
Income Below Poverty by Sex and Age in Battle Creek
With 19.7% poverty level for males and 18.8% for females among the residents of Battle Creek, under 5 year old males and 6 to 11 year old females are the most vulnerable to poverty, with 703 males (38.1%) and 761 females (37.9%) in their respective age groups living below the poverty level.
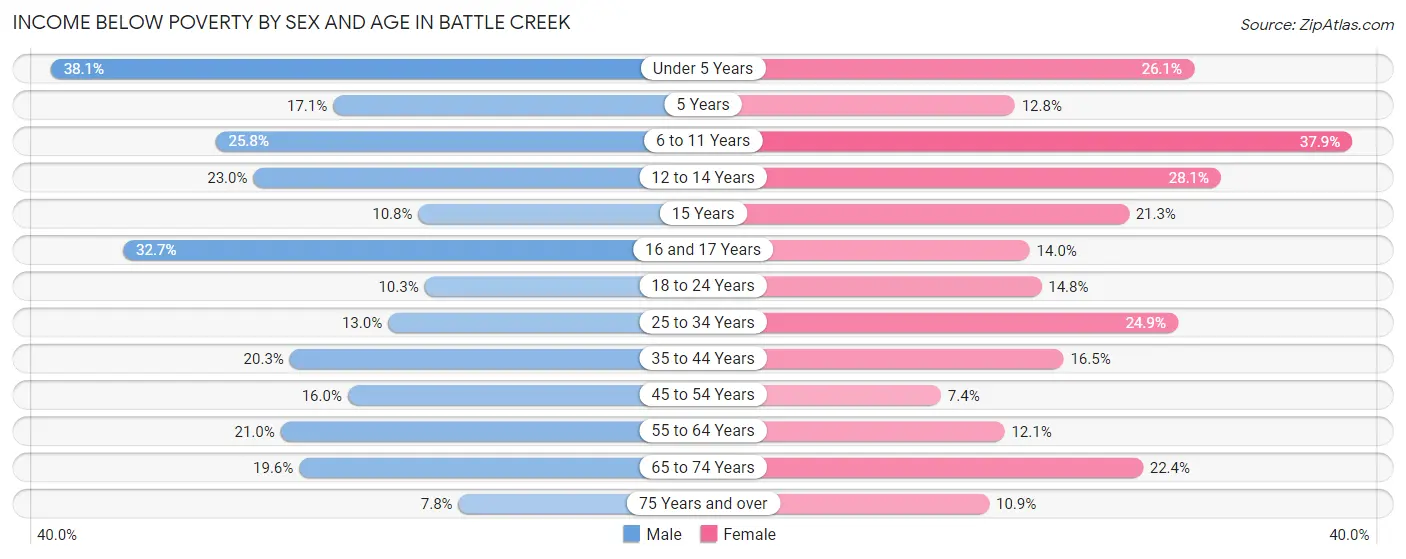
| Age Bracket | Male | Female |
| Under 5 Years | 703 (38.1%) | 428 (26.1%) |
| 5 Years | 59 (17.1%) | 42 (12.8%) |
| 6 to 11 Years | 534 (25.8%) | 761 (37.9%) |
| 12 to 14 Years | 201 (23.0%) | 396 (28.1%) |
| 15 Years | 32 (10.8%) | 82 (21.3%) |
| 16 and 17 Years | 403 (32.7%) | 102 (14.0%) |
| 18 to 24 Years | 226 (10.3%) | 296 (14.8%) |
| 25 to 34 Years | 428 (13.0%) | 873 (24.9%) |
| 35 to 44 Years | 649 (20.3%) | 634 (16.5%) |
| 45 to 54 Years | 470 (16.0%) | 230 (7.4%) |
| 55 to 64 Years | 672 (21.0%) | 372 (12.1%) |
| 65 to 74 Years | 413 (19.6%) | 570 (22.4%) |
| 75 Years and over | 104 (7.8%) | 212 (10.9%) |
| Total | 4,894 (19.7%) | 4,998 (18.8%) |
Income Above Poverty by Sex and Age in Battle Creek
According to the poverty statistics in Battle Creek, males aged 75 years and over and females aged 45 to 54 years are the age groups that are most secure financially, with 92.2% of males and 92.6% of females in these age groups living above the poverty line.
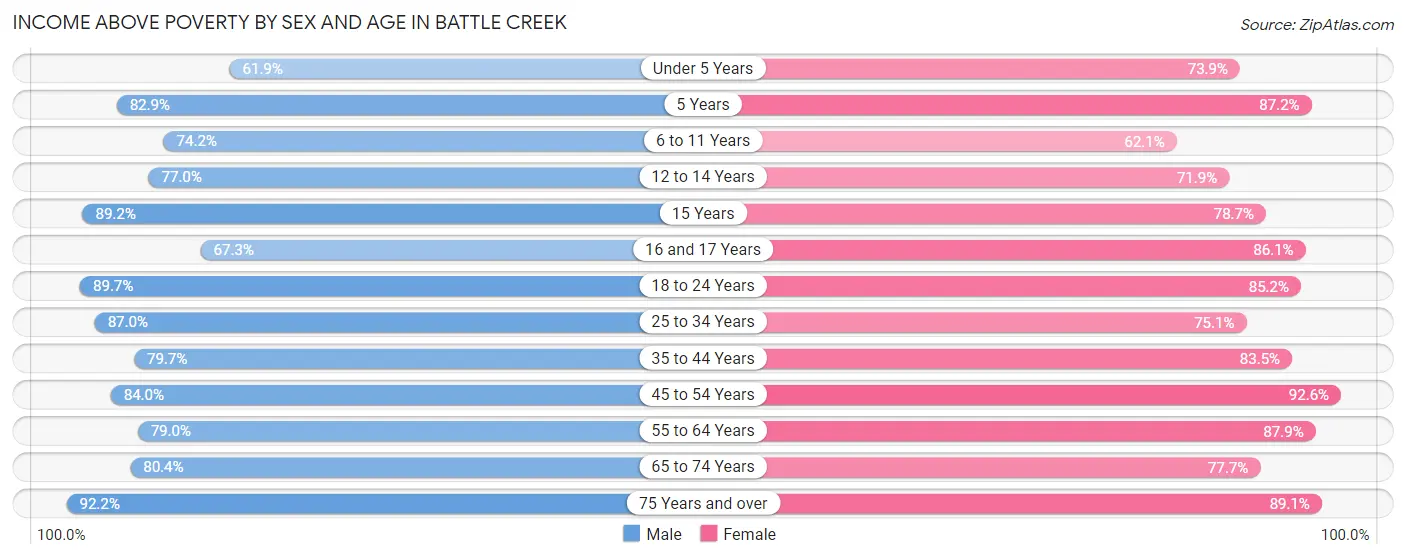
| Age Bracket | Male | Female |
| Under 5 Years | 1,144 (61.9%) | 1,210 (73.9%) |
| 5 Years | 286 (82.9%) | 285 (87.2%) |
| 6 to 11 Years | 1,534 (74.2%) | 1,248 (62.1%) |
| 12 to 14 Years | 672 (77.0%) | 1,011 (71.9%) |
| 15 Years | 265 (89.2%) | 303 (78.7%) |
| 16 and 17 Years | 830 (67.3%) | 629 (86.1%) |
| 18 to 24 Years | 1,965 (89.7%) | 1,702 (85.2%) |
| 25 to 34 Years | 2,860 (87.0%) | 2,627 (75.1%) |
| 35 to 44 Years | 2,545 (79.7%) | 3,217 (83.5%) |
| 45 to 54 Years | 2,465 (84.0%) | 2,893 (92.6%) |
| 55 to 64 Years | 2,528 (79.0%) | 2,708 (87.9%) |
| 65 to 74 Years | 1,692 (80.4%) | 1,980 (77.6%) |
| 75 Years and over | 1,231 (92.2%) | 1,728 (89.1%) |
| Total | 20,017 (80.3%) | 21,541 (81.2%) |
Income Below Poverty Among Married-Couple Families in Battle Creek
The poverty statistics for married-couple families in Battle Creek show that 4.6% or 328 of the total 7,173 families live below the poverty line. Families with 3 or 4 children have the highest poverty rate of 20.3%, comprising of 132 families. On the other hand, families with 5 or more children have the lowest poverty rate of 2.1%, which includes 2 families.
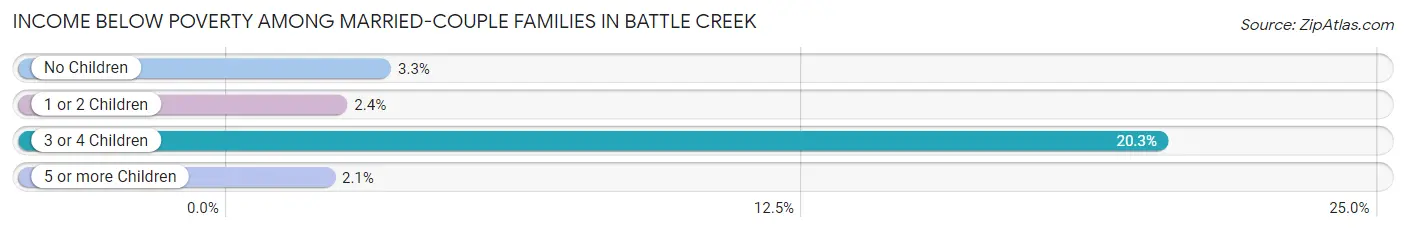
| Children | Above Poverty | Below Poverty |
| No Children | 4,183 (96.7%) | 144 (3.3%) |
| 1 or 2 Children | 2,049 (97.6%) | 50 (2.4%) |
| 3 or 4 Children | 520 (79.7%) | 132 (20.3%) |
| 5 or more Children | 93 (97.9%) | 2 (2.1%) |
| Total | 6,845 (95.4%) | 328 (4.6%) |
Income Below Poverty Among Single-Parent Households in Battle Creek
According to the poverty data in Battle Creek, 20.8% or 242 single-father households and 26.9% or 970 single-mother households are living below the poverty line. Among single-father households, those with 3 or 4 children have the highest poverty rate, with 67 households (62.0%) experiencing poverty. Likewise, among single-mother households, those with 3 or 4 children have the highest poverty rate, with 468 households (64.8%) falling below the poverty line.
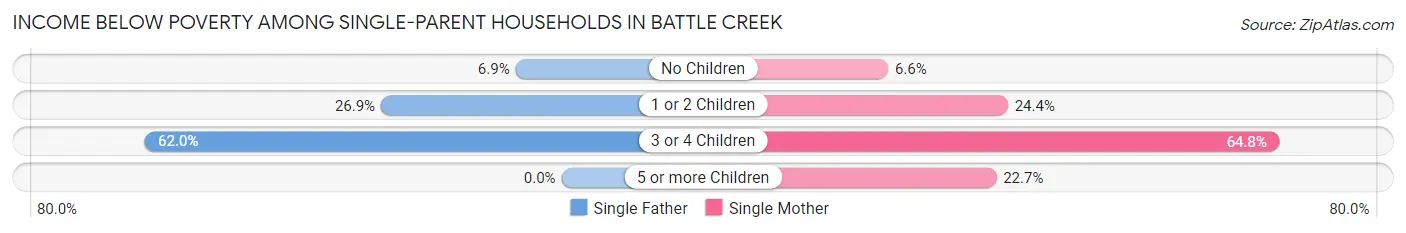
| Children | Single Father | Single Mother |
| No Children | 37 (6.9%) | 75 (6.6%) |
| 1 or 2 Children | 138 (26.9%) | 422 (24.4%) |
| 3 or 4 Children | 67 (62.0%) | 468 (64.8%) |
| 5 or more Children | 0 (0.0%) | 5 (22.7%) |
| Total | 242 (20.8%) | 970 (26.9%) |
Income Below Poverty Among Married-Couple vs Single-Parent Households in Battle Creek
The poverty data for Battle Creek shows that 328 of the married-couple family households (4.6%) and 1,212 of the single-parent households (25.4%) are living below the poverty level. Within the married-couple family households, those with 3 or 4 children have the highest poverty rate, with 132 households (20.3%) falling below the poverty line. Among the single-parent households, those with 3 or 4 children have the highest poverty rate, with 535 household (64.5%) living below poverty.
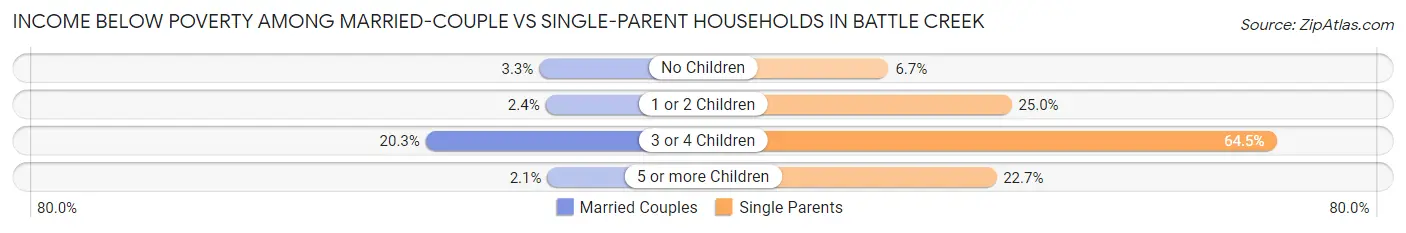
| Children | Married-Couple Families | Single-Parent Households |
| No Children | 144 (3.3%) | 112 (6.7%) |
| 1 or 2 Children | 50 (2.4%) | 560 (25.0%) |
| 3 or 4 Children | 132 (20.3%) | 535 (64.5%) |
| 5 or more Children | 2 (2.1%) | 5 (22.7%) |
| Total | 328 (4.6%) | 1,212 (25.4%) |
Race in Battle Creek
The most populous races in Battle Creek are White / Caucasian (34,610 | 66.0%), Black / African American (8,528 | 16.3%), and Two or more Races (5,354 | 10.2%).
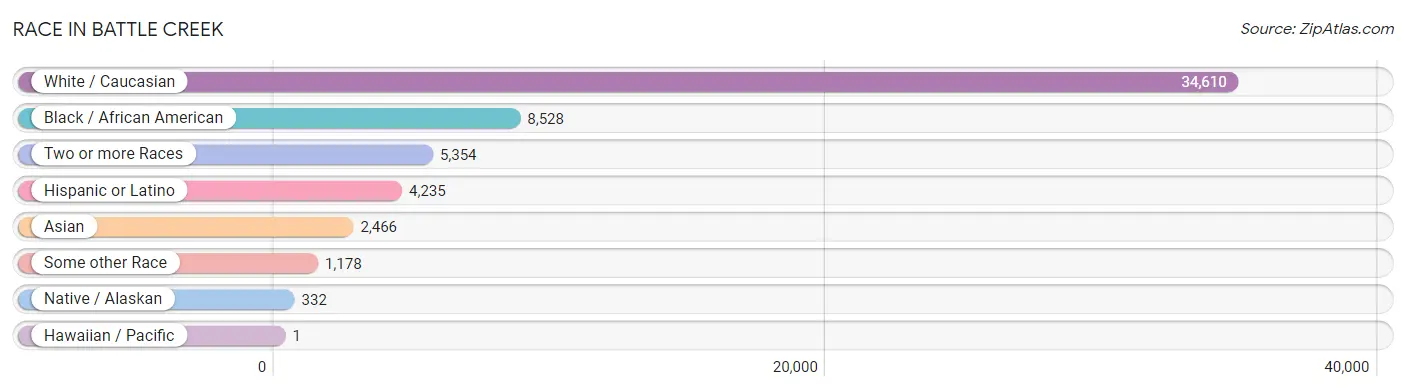
| Race | # Population | % Population |
| Asian | 2,466 | 4.7% |
| Black / African American | 8,528 | 16.3% |
| Hawaiian / Pacific | 1 | 0.0% |
| Hispanic or Latino | 4,235 | 8.1% |
| Native / Alaskan | 332 | 0.6% |
| White / Caucasian | 34,610 | 66.0% |
| Two or more Races | 5,354 | 10.2% |
| Some other Race | 1,178 | 2.2% |
| Total | 52,469 | 100.0% |
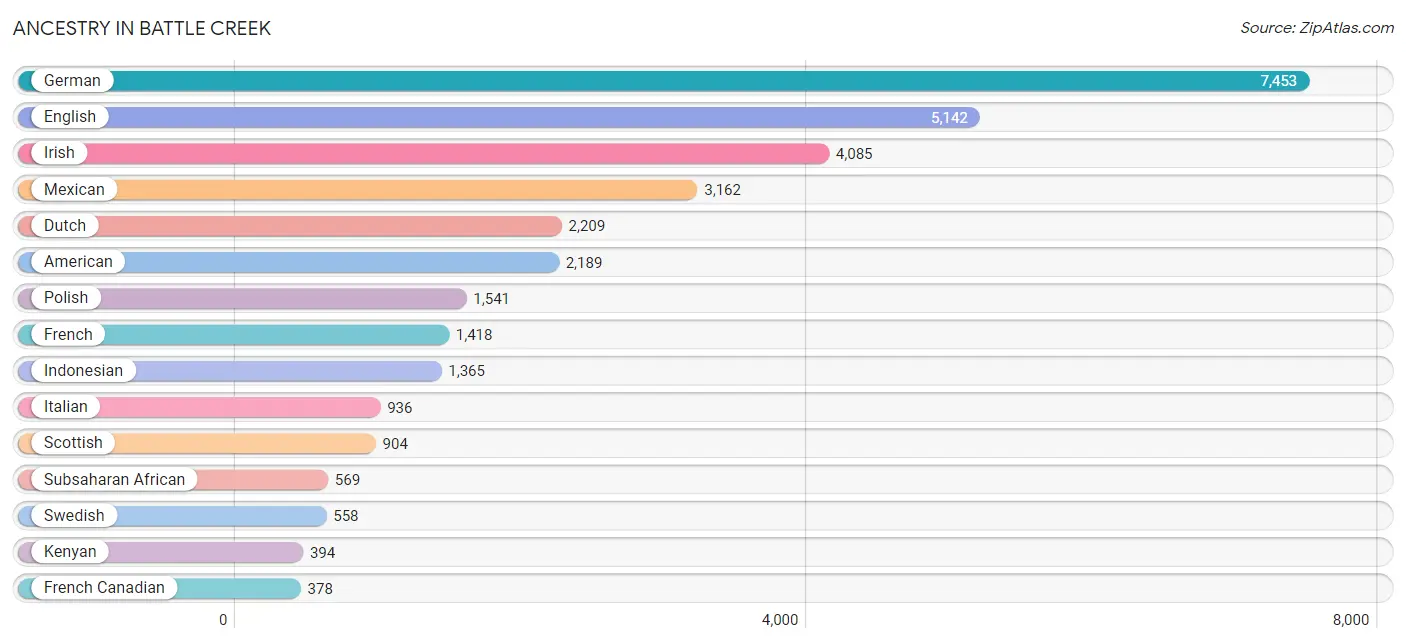
Ancestry in Battle Creek
The most populous ancestries reported in Battle Creek are German (7,453 | 14.2%), English (5,142 | 9.8%), Irish (4,085 | 7.8%), Mexican (3,162 | 6.0%), and Dutch (2,209 | 4.2%), together accounting for 42.0% of all Battle Creek residents.
| Ancestry | # Population | % Population |
| African | 49 | 0.1% |
| Alaskan Athabascan | 4 | 0.0% |
| Aleut | 5 | 0.0% |
| American | 2,189 | 4.2% |
| Apache | 3 | 0.0% |
| Arab | 20 | 0.0% |
| Austrian | 67 | 0.1% |
| Belgian | 68 | 0.1% |
| Bhutanese | 139 | 0.3% |
| Blackfeet | 35 | 0.1% |
| Brazilian | 1 | 0.0% |
| British | 255 | 0.5% |
| Burmese | 80 | 0.2% |
| Canadian | 48 | 0.1% |
| Celtic | 6 | 0.0% |
| Central American | 112 | 0.2% |
| Central American Indian | 17 | 0.0% |
| Cherokee | 138 | 0.3% |
| Chilean | 22 | 0.0% |
| Chippewa | 103 | 0.2% |
| Choctaw | 14 | 0.0% |
| Colombian | 38 | 0.1% |
| Colville | 38 | 0.1% |
| Comanche | 34 | 0.1% |
| Costa Rican | 65 | 0.1% |
| Creek | 8 | 0.0% |
| Croatian | 85 | 0.2% |
| Cuban | 57 | 0.1% |
| Czech | 31 | 0.1% |
| Czechoslovakian | 11 | 0.0% |
| Danish | 133 | 0.3% |
| Delaware | 4 | 0.0% |
| Dominican | 235 | 0.4% |
| Dutch | 2,209 | 4.2% |
| Dutch West Indian | 13 | 0.0% |
| Eastern European | 87 | 0.2% |
| Ecuadorian | 33 | 0.1% |
| English | 5,142 | 9.8% |
| Estonian | 14 | 0.0% |
| Ethiopian | 24 | 0.1% |
| European | 358 | 0.7% |
| Finnish | 274 | 0.5% |
| French | 1,418 | 2.7% |
| French Canadian | 378 | 0.7% |
| German | 7,453 | 14.2% |
| Greek | 118 | 0.2% |
| Guatemalan | 36 | 0.1% |
| Hmong | 48 | 0.1% |
| Hungarian | 248 | 0.5% |
| Indian (Asian) | 93 | 0.2% |
| Indonesian | 1,365 | 2.6% |
| Inupiat | 10 | 0.0% |
| Iraqi | 9 | 0.0% |
| Irish | 4,085 | 7.8% |
| Italian | 936 | 1.8% |
| Jamaican | 7 | 0.0% |
| Japanese | 7 | 0.0% |
| Kenyan | 394 | 0.7% |
| Kiowa | 3 | 0.0% |
| Korean | 305 | 0.6% |
| Laotian | 123 | 0.2% |
| Lebanese | 3 | 0.0% |
| Lithuanian | 89 | 0.2% |
| Macedonian | 2 | 0.0% |
| Maltese | 12 | 0.0% |
| Mexican | 3,162 | 6.0% |
| Mexican American Indian | 170 | 0.3% |
| Native Hawaiian | 12 | 0.0% |
| Navajo | 46 | 0.1% |
| Northern European | 68 | 0.1% |
| Norwegian | 212 | 0.4% |
| Ottawa | 26 | 0.1% |
| Pakistani | 9 | 0.0% |
| Panamanian | 1 | 0.0% |
| Paraguayan | 38 | 0.1% |
| Pennsylvania German | 11 | 0.0% |
| Polish | 1,541 | 2.9% |
| Portuguese | 131 | 0.3% |
| Potawatomi | 57 | 0.1% |
| Puerto Rican | 328 | 0.6% |
| Romanian | 41 | 0.1% |
| Russian | 173 | 0.3% |
| Salvadoran | 10 | 0.0% |
| Scandinavian | 98 | 0.2% |
| Scotch-Irish | 302 | 0.6% |
| Scottish | 904 | 1.7% |
| Serbian | 10 | 0.0% |
| Sioux | 17 | 0.0% |
| Slavic | 7 | 0.0% |
| Slovak | 9 | 0.0% |
| Slovene | 14 | 0.0% |
| South American | 141 | 0.3% |
| South American Indian | 22 | 0.0% |
| Spaniard | 94 | 0.2% |
| Spanish | 10 | 0.0% |
| Sri Lankan | 213 | 0.4% |
| Subsaharan African | 569 | 1.1% |
| Swedish | 558 | 1.1% |
| Swiss | 101 | 0.2% |
| Thai | 355 | 0.7% |
| Tohono O'Odham | 10 | 0.0% |
| Ukrainian | 100 | 0.2% |
| Venezuelan | 10 | 0.0% |
| Vietnamese | 121 | 0.2% |
| Welsh | 140 | 0.3% |
| Yugoslavian | 60 | 0.1% | View All 106 Rows |
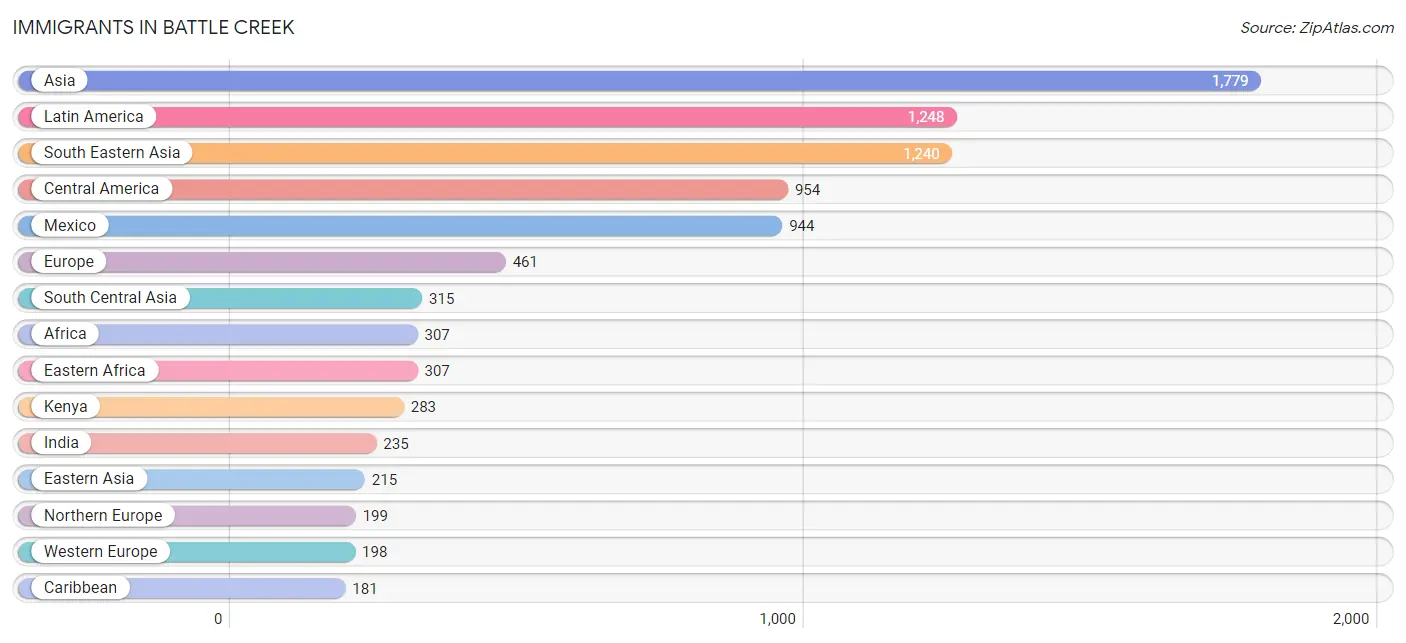
Immigrants in Battle Creek
The most numerous immigrant groups reported in Battle Creek came from Asia (1,779 | 3.4%), Latin America (1,248 | 2.4%), South Eastern Asia (1,240 | 2.4%), Central America (954 | 1.8%), and Mexico (944 | 1.8%), together accounting for 11.8% of all Battle Creek residents.
| Immigration Origin | # Population | % Population |
| Africa | 307 | 0.6% |
| Asia | 1,779 | 3.4% |
| Bangladesh | 61 | 0.1% |
| Belgium | 33 | 0.1% |
| Canada | 48 | 0.1% |
| Caribbean | 181 | 0.3% |
| Central America | 954 | 1.8% |
| Chile | 22 | 0.0% |
| China | 85 | 0.2% |
| Colombia | 48 | 0.1% |
| Cuba | 57 | 0.1% |
| Dominican Republic | 86 | 0.2% |
| Eastern Africa | 307 | 0.6% |
| Eastern Asia | 215 | 0.4% |
| Eastern Europe | 40 | 0.1% |
| Ecuador | 33 | 0.1% |
| El Salvador | 10 | 0.0% |
| Ethiopia | 24 | 0.1% |
| Europe | 461 | 0.9% |
| Germany | 151 | 0.3% |
| Haiti | 31 | 0.1% |
| Hungary | 8 | 0.0% |
| India | 235 | 0.4% |
| Iraq | 9 | 0.0% |
| Ireland | 18 | 0.0% |
| Italy | 24 | 0.1% |
| Jamaica | 7 | 0.0% |
| Japan | 66 | 0.1% |
| Kenya | 283 | 0.5% |
| Korea | 64 | 0.1% |
| Latin America | 1,248 | 2.4% |
| Malaysia | 129 | 0.3% |
| Mexico | 944 | 1.8% |
| Netherlands | 14 | 0.0% |
| Northern Europe | 199 | 0.4% |
| Pakistan | 5 | 0.0% |
| Philippines | 49 | 0.1% |
| Russia | 24 | 0.1% |
| South America | 113 | 0.2% |
| South Central Asia | 315 | 0.6% |
| South Eastern Asia | 1,240 | 2.4% |
| Southern Europe | 24 | 0.1% |
| Sweden | 174 | 0.3% |
| Uzbekistan | 14 | 0.0% |
| Venezuela | 10 | 0.0% |
| Vietnam | 75 | 0.1% |
| Western Asia | 9 | 0.0% |
| Western Europe | 198 | 0.4% | View All 48 Rows |
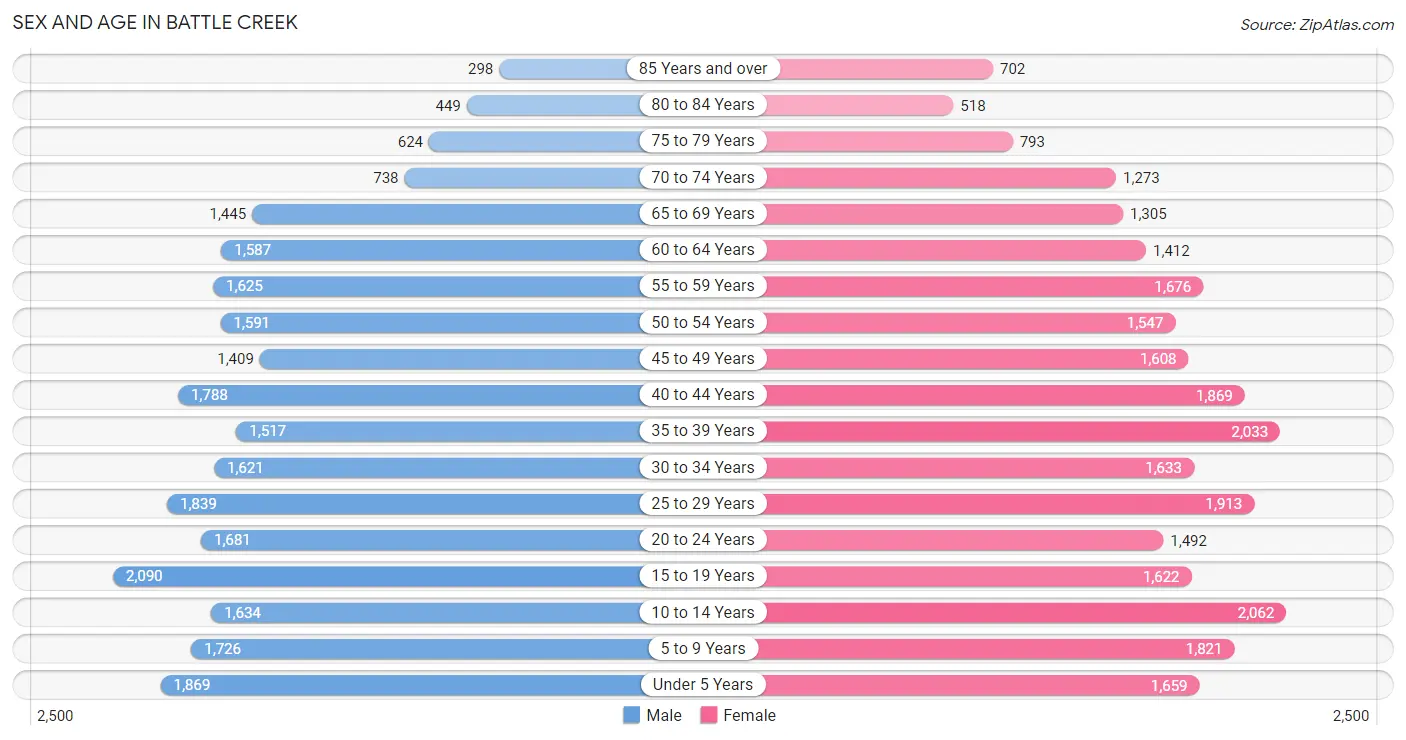
Sex and Age in Battle Creek
Sex and Age in Battle Creek
The most populous age groups in Battle Creek are 15 to 19 Years (2,090 | 8.2%) for men and 10 to 14 Years (2,062 | 7.6%) for women.
| Age Bracket | Male | Female |
| Under 5 Years | 1,869 (7.3%) | 1,659 (6.2%) |
| 5 to 9 Years | 1,726 (6.8%) | 1,821 (6.8%) |
| 10 to 14 Years | 1,634 (6.4%) | 2,062 (7.6%) |
| 15 to 19 Years | 2,090 (8.2%) | 1,622 (6.0%) |
| 20 to 24 Years | 1,681 (6.6%) | 1,492 (5.5%) |
| 25 to 29 Years | 1,839 (7.2%) | 1,913 (7.1%) |
| 30 to 34 Years | 1,621 (6.4%) | 1,633 (6.1%) |
| 35 to 39 Years | 1,517 (5.9%) | 2,033 (7.5%) |
| 40 to 44 Years | 1,788 (7.0%) | 1,869 (6.9%) |
| 45 to 49 Years | 1,409 (5.5%) | 1,608 (6.0%) |
| 50 to 54 Years | 1,591 (6.2%) | 1,547 (5.7%) |
| 55 to 59 Years | 1,625 (6.4%) | 1,676 (6.2%) |
| 60 to 64 Years | 1,587 (6.2%) | 1,412 (5.2%) |
| 65 to 69 Years | 1,445 (5.7%) | 1,305 (4.8%) |
| 70 to 74 Years | 738 (2.9%) | 1,273 (4.7%) |
| 75 to 79 Years | 624 (2.4%) | 793 (2.9%) |
| 80 to 84 Years | 449 (1.8%) | 518 (1.9%) |
| 85 Years and over | 298 (1.2%) | 702 (2.6%) |
| Total | 25,531 (100.0%) | 26,938 (100.0%) |
Families and Households in Battle Creek
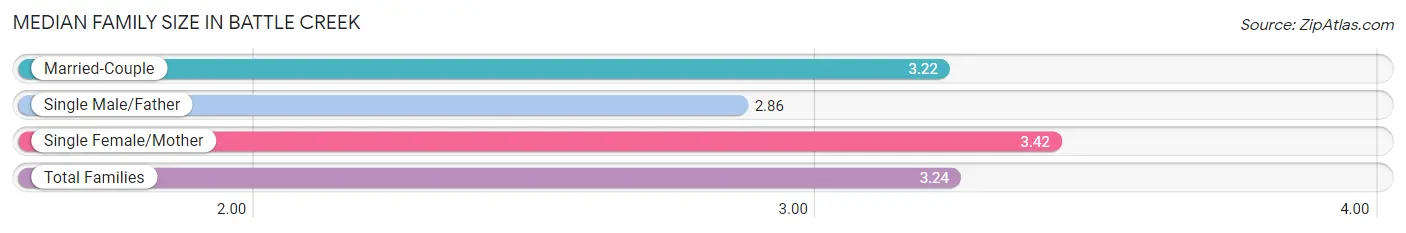
Median Family Size in Battle Creek
The median family size in Battle Creek is 3.24 persons per family, with single female/mother families (3,607 | 30.2%) accounting for the largest median family size of 3.42 persons per family. On the other hand, single male/father families (1,161 | 9.7%) represent the smallest median family size with 2.86 persons per family.
| Family Type | # Families | Family Size |
| Married-Couple | 7,173 (60.1%) | 3.22 |
| Single Male/Father | 1,161 (9.7%) | 2.86 |
| Single Female/Mother | 3,607 (30.2%) | 3.42 |
| Total Families | 11,941 (100.0%) | 3.24 |
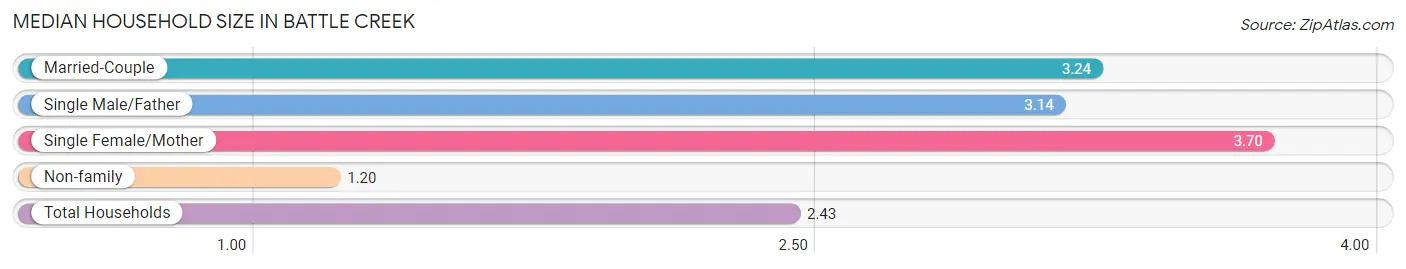
Median Household Size in Battle Creek
The median household size in Battle Creek is 2.43 persons per household, with single female/mother households (3,607 | 17.1%) accounting for the largest median household size of 3.7 persons per household. non-family households (9,199 | 43.5%) represent the smallest median household size with 1.20 persons per household.
| Household Type | # Households | Household Size |
| Married-Couple | 7,173 (33.9%) | 3.24 |
| Single Male/Father | 1,161 (5.5%) | 3.14 |
| Single Female/Mother | 3,607 (17.1%) | 3.70 |
| Non-family | 9,199 (43.5%) | 1.20 |
| Total Households | 21,140 (100.0%) | 2.43 |
Household Size by Marriage Status in Battle Creek
Out of a total of 21,140 households in Battle Creek, 11,941 (56.5%) are family households, while 9,199 (43.5%) are nonfamily households. The most numerous type of family households are 2-person households, comprising 5,213, and the most common type of nonfamily households are 1-person households, comprising 7,841.
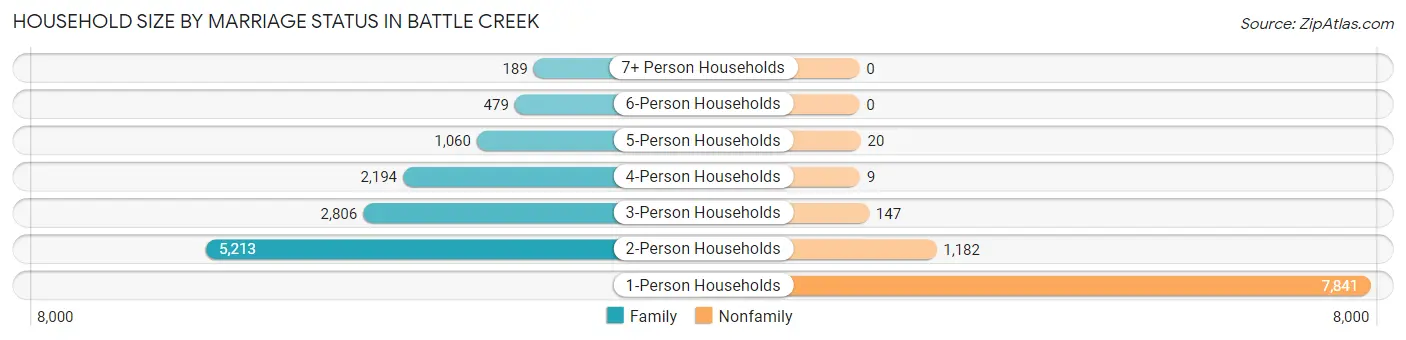
| Household Size | Family Households | Nonfamily Households |
| 1-Person Households | - | 7,841 (37.1%) |
| 2-Person Households | 5,213 (24.7%) | 1,182 (5.6%) |
| 3-Person Households | 2,806 (13.3%) | 147 (0.7%) |
| 4-Person Households | 2,194 (10.4%) | 9 (0.0%) |
| 5-Person Households | 1,060 (5.0%) | 20 (0.1%) |
| 6-Person Households | 479 (2.3%) | 0 (0.0%) |
| 7+ Person Households | 189 (0.9%) | 0 (0.0%) |
| Total | 11,941 (56.5%) | 9,199 (43.5%) |
Female Fertility in Battle Creek
Fertility by Age in Battle Creek
Average fertility rate in Battle Creek is 46.0 births per 1,000 women. Women in the age bracket of 20 to 34 years have the highest fertility rate with 88.0 births per 1,000 women. Women in the age bracket of 20 to 34 years acount for 77.0% of all women with births.
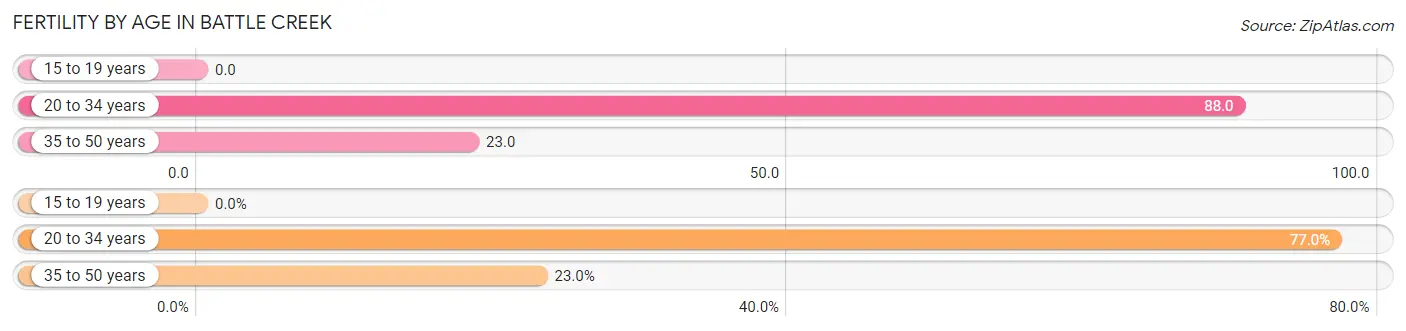
| Age Bracket | Women with Births | Births / 1,000 Women |
| 15 to 19 years | 0 (0.0%) | 0.0 |
| 20 to 34 years | 441 (77.0%) | 88.0 |
| 35 to 50 years | 132 (23.0%) | 23.0 |
| Total | 573 (100.0%) | 46.0 |
Fertility by Age by Marriage Status in Battle Creek
71.2% of women with births (573) in Battle Creek are married. The highest percentage of unmarried women with births falls into 20 to 34 years age bracket with 31.5% of them unmarried at the time of birth, while the lowest percentage of unmarried women with births belong to 35 to 50 years age bracket with 19.7% of them unmarried.
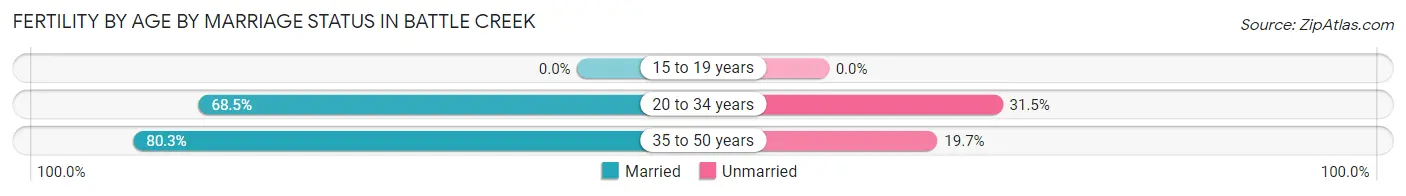
| Age Bracket | Married | Unmarried |
| 15 to 19 years | 0 (0.0%) | 0 (0.0%) |
| 20 to 34 years | 302 (68.5%) | 139 (31.5%) |
| 35 to 50 years | 106 (80.3%) | 26 (19.7%) |
| Total | 408 (71.2%) | 165 (28.8%) |
Fertility by Education in Battle Creek
Average fertility rate in Battle Creek is 46.0 births per 1,000 women. Women with the education attainment of graduate degree have the highest fertility rate of 71.0 births per 1,000 women, while women with the education attainment of college or associate's degree have the lowest fertility at 30.0 births per 1,000 women. Women with the education attainment of high school diploma represent 35.6% of all women with births.
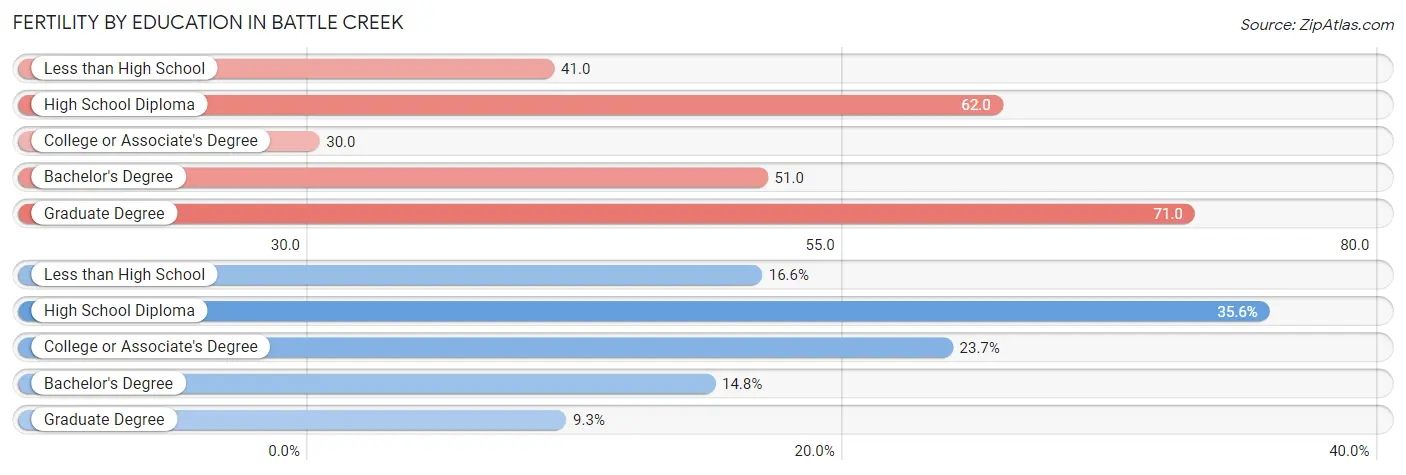
| Educational Attainment | Women with Births | Births / 1,000 Women |
| Less than High School | 95 (16.6%) | 41.0 |
| High School Diploma | 204 (35.6%) | 62.0 |
| College or Associate's Degree | 136 (23.7%) | 30.0 |
| Bachelor's Degree | 85 (14.8%) | 51.0 |
| Graduate Degree | 53 (9.2%) | 71.0 |
| Total | 573 (100.0%) | 46.0 |
Fertility by Education by Marriage Status in Battle Creek
28.8% of women with births in Battle Creek are unmarried. Women with the educational attainment of graduate degree are most likely to be married with 100.0% of them married at childbirth, while women with the educational attainment of less than high school are least likely to be married with 52.6% of them unmarried at childbirth.
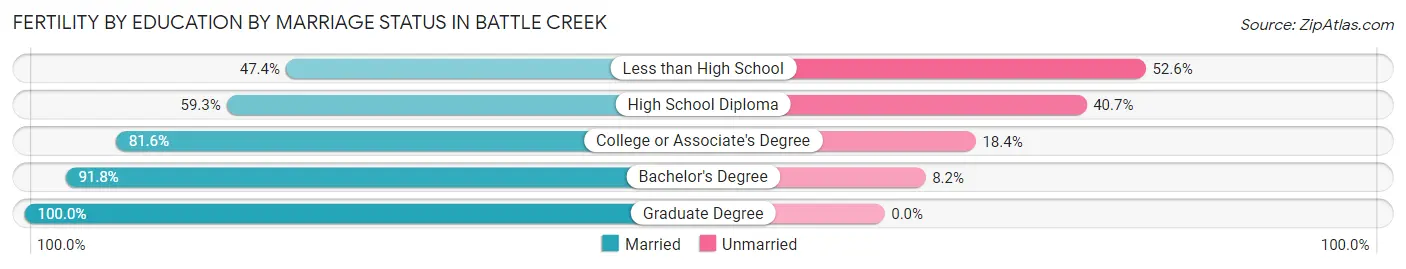
| Educational Attainment | Married | Unmarried |
| Less than High School | 45 (47.4%) | 50 (52.6%) |
| High School Diploma | 121 (59.3%) | 83 (40.7%) |
| College or Associate's Degree | 111 (81.6%) | 25 (18.4%) |
| Bachelor's Degree | 78 (91.8%) | 7 (8.2%) |
| Graduate Degree | 53 (100.0%) | 0 (0.0%) |
| Total | 408 (71.2%) | 165 (28.8%) |
Employment Characteristics in Battle Creek
Employment by Class of Employer in Battle Creek
Among the 22,714 employed individuals in Battle Creek, private company employees (16,694 | 73.5%), not-for-profit organizations (2,176 | 9.6%), and local government employees (1,503 | 6.6%) make up the most common classes of employment.
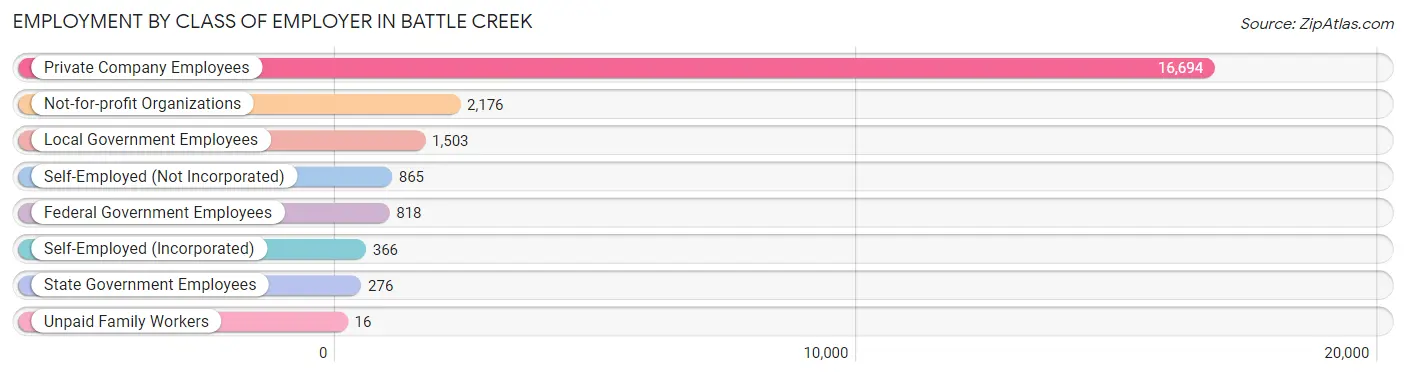
| Employer Class | # Employees | % Employees |
| Private Company Employees | 16,694 | 73.5% |
| Self-Employed (Incorporated) | 366 | 1.6% |
| Self-Employed (Not Incorporated) | 865 | 3.8% |
| Not-for-profit Organizations | 2,176 | 9.6% |
| Local Government Employees | 1,503 | 6.6% |
| State Government Employees | 276 | 1.2% |
| Federal Government Employees | 818 | 3.6% |
| Unpaid Family Workers | 16 | 0.1% |
| Total | 22,714 | 100.0% |
Employment Status by Age in Battle Creek
According to the labor force statistics for Battle Creek, out of the total population over 16 years of age (41,016), 61.7% or 25,307 individuals are in the labor force, with 7.6% or 1,923 of them unemployed. The age group with the highest labor force participation rate is 25 to 29 years, with 82.3% or 3,088 individuals in the labor force. Within the labor force, the 16 to 19 years age range has the highest percentage of unemployed individuals, with 17.1% or 250 of them being unemployed.
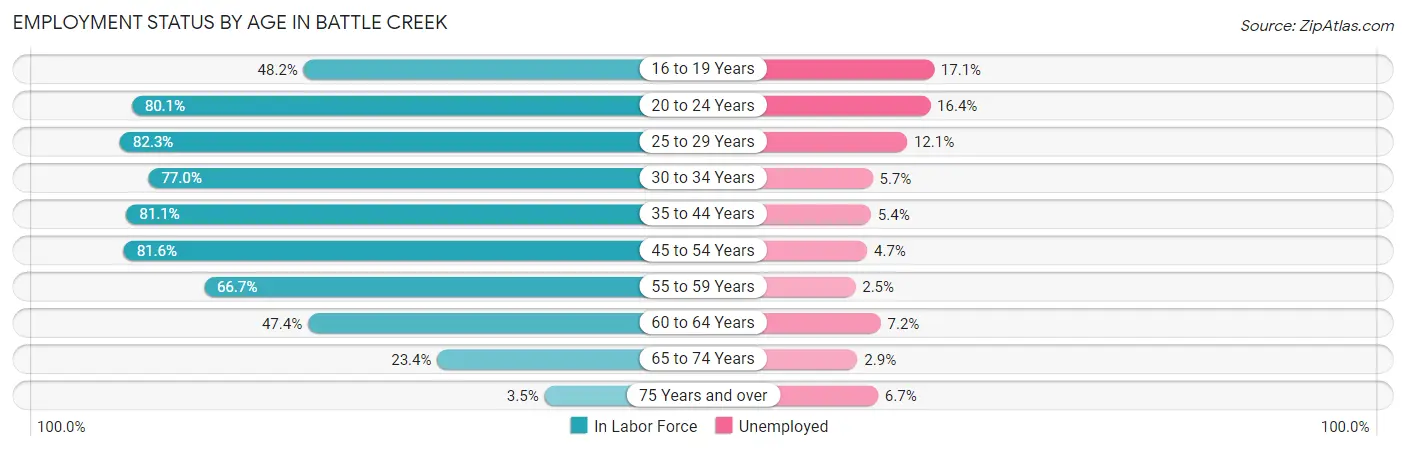
| Age Bracket | In Labor Force | Unemployed |
| 16 to 19 Years | 1,460 (48.2%) | 250 (17.1%) |
| 20 to 24 Years | 2,542 (80.1%) | 417 (16.4%) |
| 25 to 29 Years | 3,088 (82.3%) | 374 (12.1%) |
| 30 to 34 Years | 2,506 (77.0%) | 143 (5.7%) |
| 35 to 44 Years | 5,845 (81.1%) | 316 (5.4%) |
| 45 to 54 Years | 5,022 (81.6%) | 236 (4.7%) |
| 55 to 59 Years | 2,202 (66.7%) | 55 (2.5%) |
| 60 to 64 Years | 1,422 (47.4%) | 102 (7.2%) |
| 65 to 74 Years | 1,114 (23.4%) | 32 (2.9%) |
| 75 Years and over | 118 (3.5%) | 8 (6.7%) |
| Total | 25,307 (61.7%) | 1,923 (7.6%) |
Employment Status by Educational Attainment in Battle Creek
According to labor force statistics for Battle Creek, 75.3% of individuals (20,081) out of the total population between 25 and 64 years of age (26,668) are in the labor force, with 6.1% or 1,225 of them being unemployed. The group with the highest labor force participation rate are those with the educational attainment of bachelor's degree or higher, with 88.0% or 4,727 individuals in the labor force. Within the labor force, individuals with less than high school education have the highest percentage of unemployment, with 16.8% or 220 of them being unemployed.
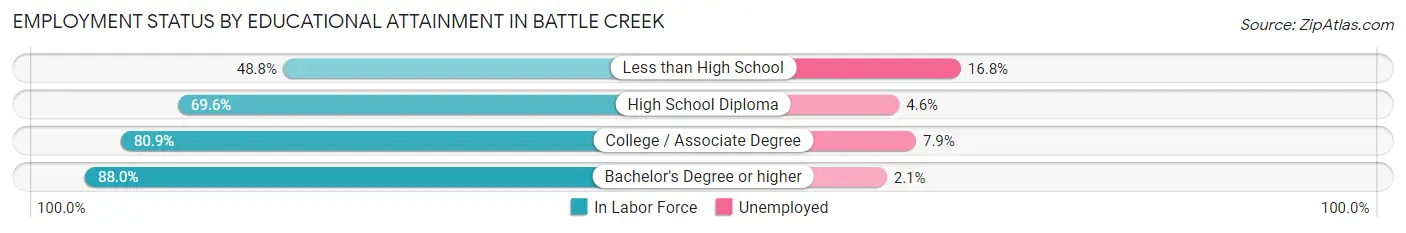
| Educational Attainment | In Labor Force | Unemployed |
| Less than High School | 1,307 (48.8%) | 450 (16.8%) |
| High School Diploma | 6,227 (69.6%) | 412 (4.6%) |
| College / Associate Degree | 7,824 (80.9%) | 764 (7.9%) |
| Bachelor's Degree or higher | 4,727 (88.0%) | 113 (2.1%) |
| Total | 20,081 (75.3%) | 1,627 (6.1%) |
Employment Occupations by Sex in Battle Creek
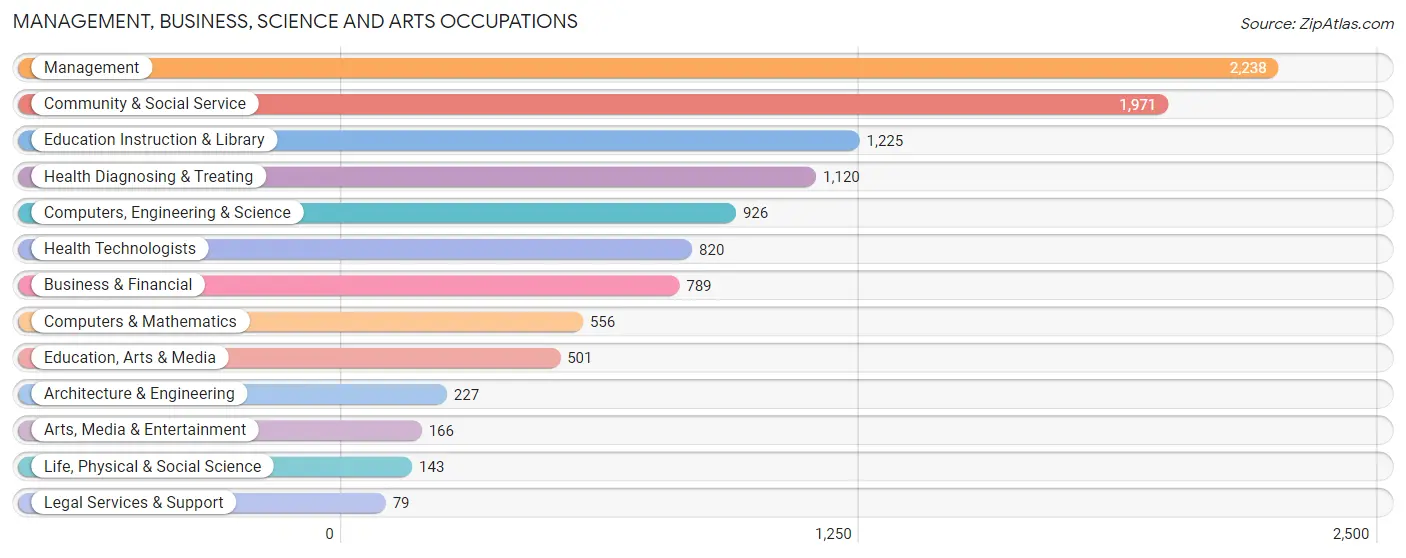
Management, Business, Science and Arts Occupations
The most common Management, Business, Science and Arts occupations in Battle Creek are Management (2,238 | 9.6%), Community & Social Service (1,971 | 8.5%), Education Instruction & Library (1,225 | 5.3%), Health Diagnosing & Treating (1,120 | 4.8%), and Computers, Engineering & Science (926 | 4.0%).
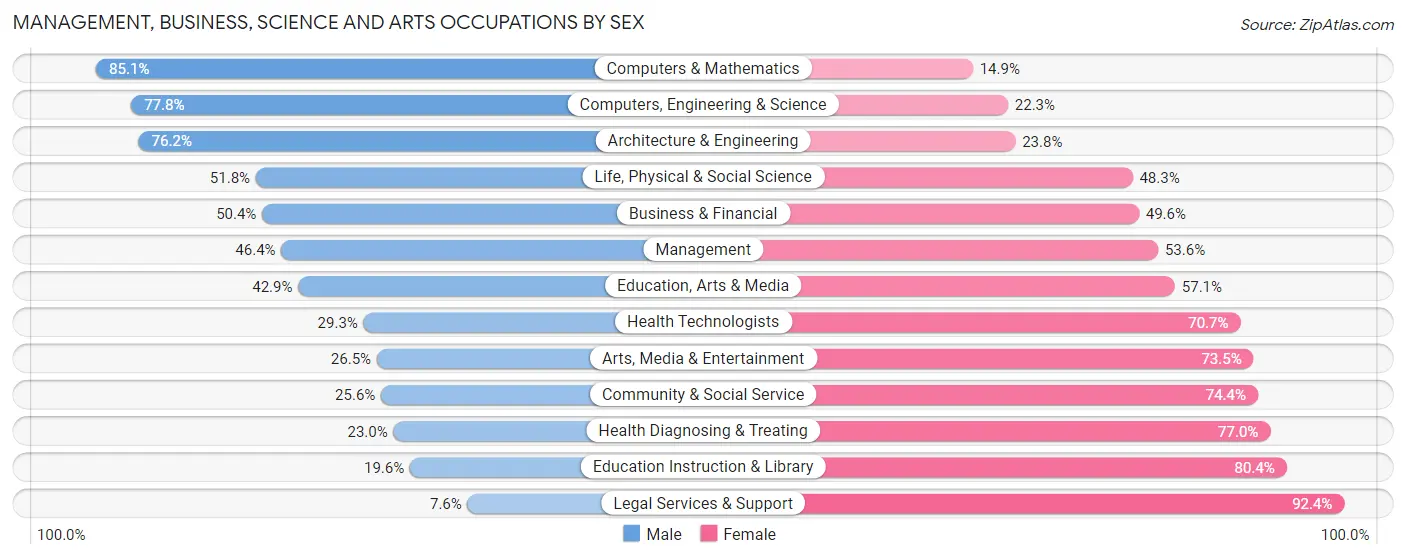
Management, Business, Science and Arts Occupations by Sex
Within the Management, Business, Science and Arts occupations in Battle Creek, the most male-oriented occupations are Computers & Mathematics (85.1%), Computers, Engineering & Science (77.7%), and Architecture & Engineering (76.2%), while the most female-oriented occupations are Legal Services & Support (92.4%), Education Instruction & Library (80.4%), and Health Diagnosing & Treating (77.0%).
| Occupation | Male | Female |
| Management | 1,039 (46.4%) | 1,199 (53.6%) |
| Business & Financial | 398 (50.4%) | 391 (49.6%) |
| Computers, Engineering & Science | 720 (77.7%) | 206 (22.3%) |
| Computers & Mathematics | 473 (85.1%) | 83 (14.9%) |
| Architecture & Engineering | 173 (76.2%) | 54 (23.8%) |
| Life, Physical & Social Science | 74 (51.7%) | 69 (48.2%) |
| Community & Social Service | 505 (25.6%) | 1,466 (74.4%) |
| Education, Arts & Media | 215 (42.9%) | 286 (57.1%) |
| Legal Services & Support | 6 (7.6%) | 73 (92.4%) |
| Education Instruction & Library | 240 (19.6%) | 985 (80.4%) |
| Arts, Media & Entertainment | 44 (26.5%) | 122 (73.5%) |
| Health Diagnosing & Treating | 258 (23.0%) | 862 (77.0%) |
| Health Technologists | 240 (29.3%) | 580 (70.7%) |
| Total (Category) | 2,920 (41.4%) | 4,124 (58.6%) |
| Total (Overall) | 11,579 (49.7%) | 11,718 (50.3%) |
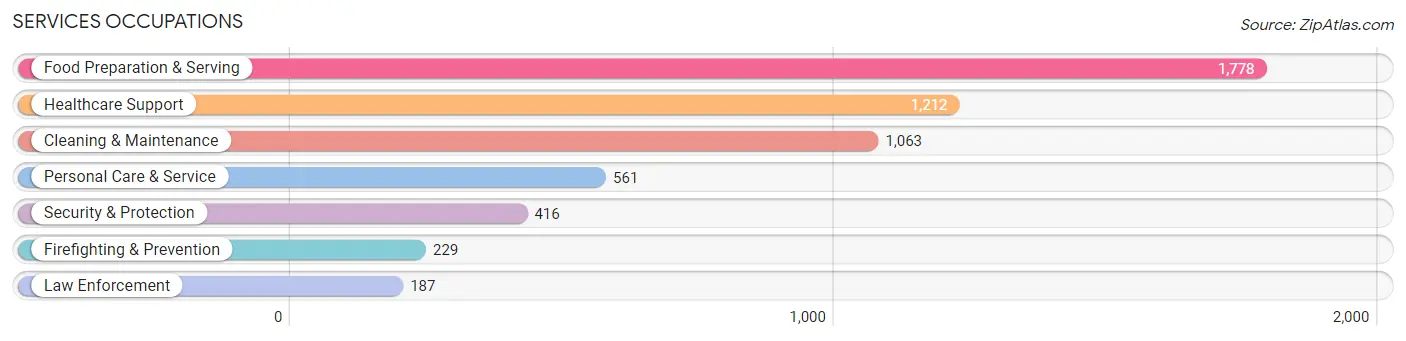
Services Occupations
The most common Services occupations in Battle Creek are Food Preparation & Serving (1,778 | 7.6%), Healthcare Support (1,212 | 5.2%), Cleaning & Maintenance (1,063 | 4.6%), Personal Care & Service (561 | 2.4%), and Security & Protection (416 | 1.8%).
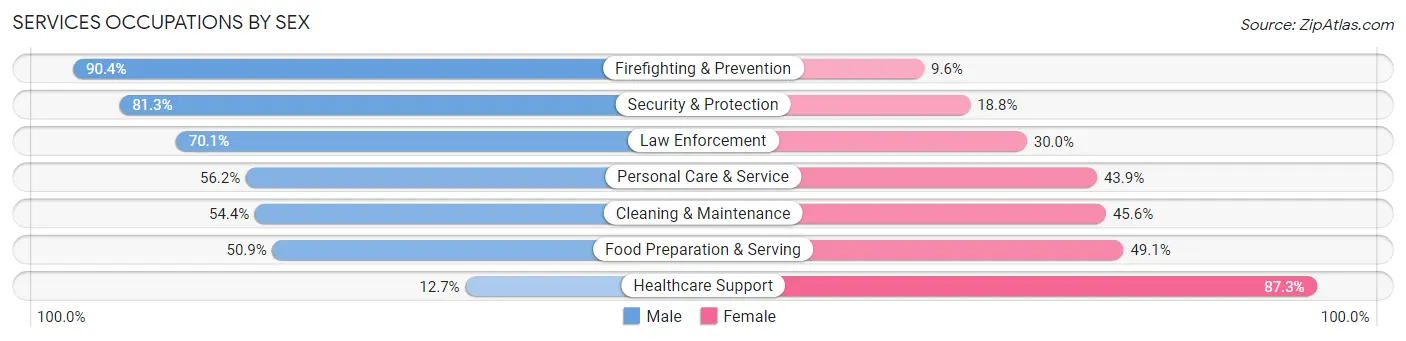
Services Occupations by Sex
Within the Services occupations in Battle Creek, the most male-oriented occupations are Firefighting & Prevention (90.4%), Security & Protection (81.2%), and Law Enforcement (70.1%), while the most female-oriented occupations are Healthcare Support (87.3%), Food Preparation & Serving (49.1%), and Cleaning & Maintenance (45.6%).
| Occupation | Male | Female |
| Healthcare Support | 154 (12.7%) | 1,058 (87.3%) |
| Security & Protection | 338 (81.2%) | 78 (18.8%) |
| Firefighting & Prevention | 207 (90.4%) | 22 (9.6%) |
| Law Enforcement | 131 (70.1%) | 56 (29.9%) |
| Food Preparation & Serving | 905 (50.9%) | 873 (49.1%) |
| Cleaning & Maintenance | 578 (54.4%) | 485 (45.6%) |
| Personal Care & Service | 315 (56.1%) | 246 (43.9%) |
| Total (Category) | 2,290 (45.5%) | 2,740 (54.5%) |
| Total (Overall) | 11,579 (49.7%) | 11,718 (50.3%) |
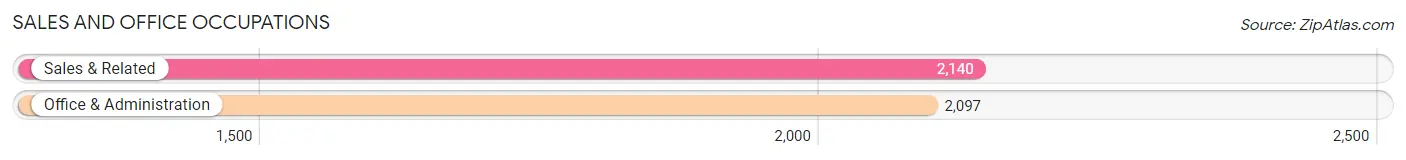
Sales and Office Occupations
The most common Sales and Office occupations in Battle Creek are Sales & Related (2,140 | 9.2%), and Office & Administration (2,097 | 9.0%).
Sales and Office Occupations by Sex
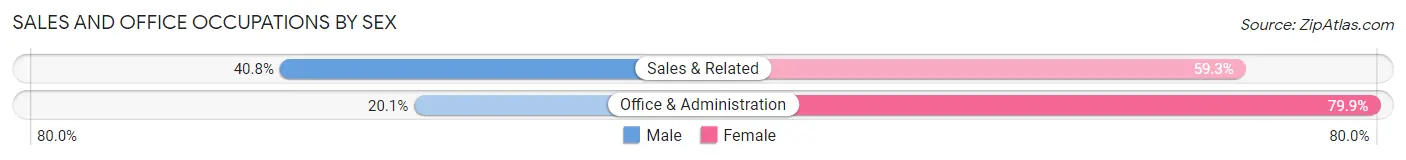
| Occupation | Male | Female |
| Sales & Related | 872 (40.7%) | 1,268 (59.3%) |
| Office & Administration | 421 (20.1%) | 1,676 (79.9%) |
| Total (Category) | 1,293 (30.5%) | 2,944 (69.5%) |
| Total (Overall) | 11,579 (49.7%) | 11,718 (50.3%) |
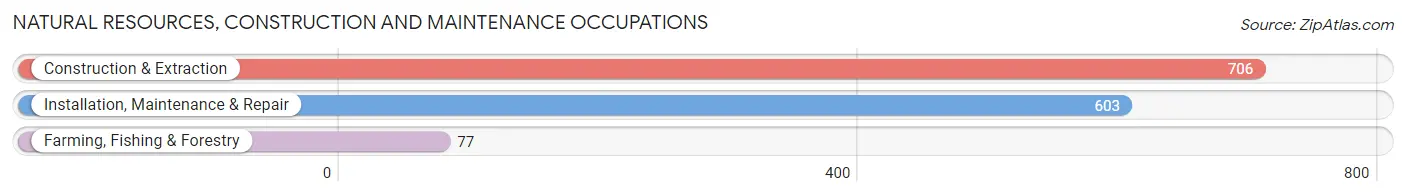
Natural Resources, Construction and Maintenance Occupations
The most common Natural Resources, Construction and Maintenance occupations in Battle Creek are Construction & Extraction (706 | 3.0%), Installation, Maintenance & Repair (603 | 2.6%), and Farming, Fishing & Forestry (77 | 0.3%).
Natural Resources, Construction and Maintenance Occupations by Sex
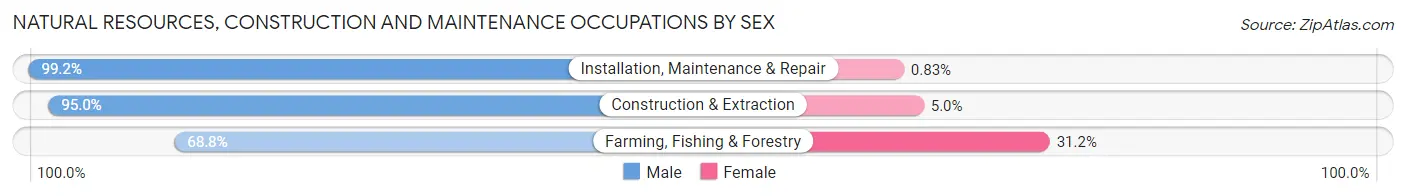
| Occupation | Male | Female |
| Farming, Fishing & Forestry | 53 (68.8%) | 24 (31.2%) |
| Construction & Extraction | 671 (95.0%) | 35 (5.0%) |
| Installation, Maintenance & Repair | 598 (99.2%) | 5 (0.8%) |
| Total (Category) | 1,322 (95.4%) | 64 (4.6%) |
| Total (Overall) | 11,579 (49.7%) | 11,718 (50.3%) |
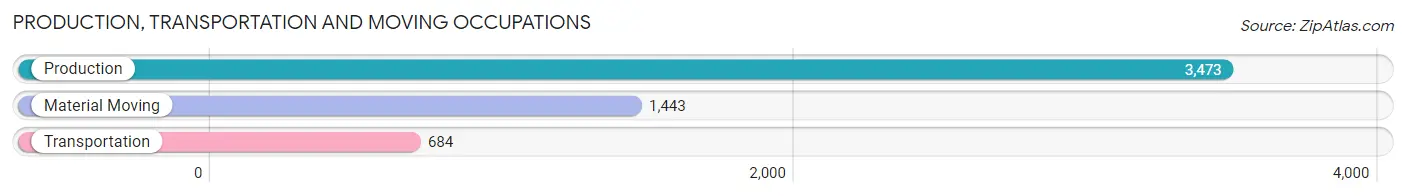
Production, Transportation and Moving Occupations
The most common Production, Transportation and Moving occupations in Battle Creek are Production (3,473 | 14.9%), Material Moving (1,443 | 6.2%), and Transportation (684 | 2.9%).
Production, Transportation and Moving Occupations by Sex
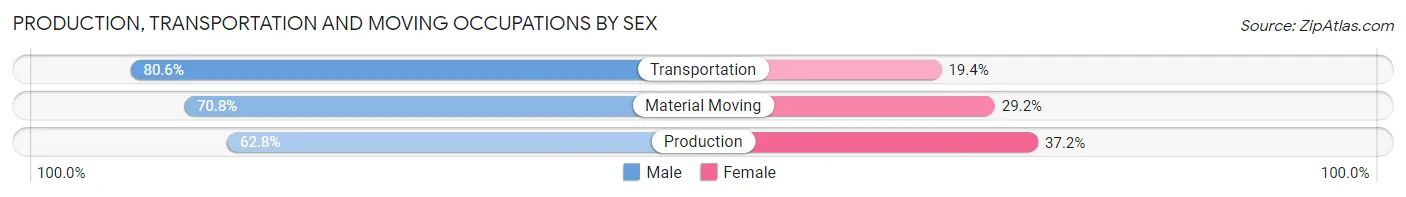
| Occupation | Male | Female |
| Production | 2,182 (62.8%) | 1,291 (37.2%) |
| Transportation | 551 (80.6%) | 133 (19.4%) |
| Material Moving | 1,021 (70.8%) | 422 (29.2%) |
| Total (Category) | 3,754 (67.0%) | 1,846 (33.0%) |
| Total (Overall) | 11,579 (49.7%) | 11,718 (50.3%) |
Employment Industries by Sex in Battle Creek
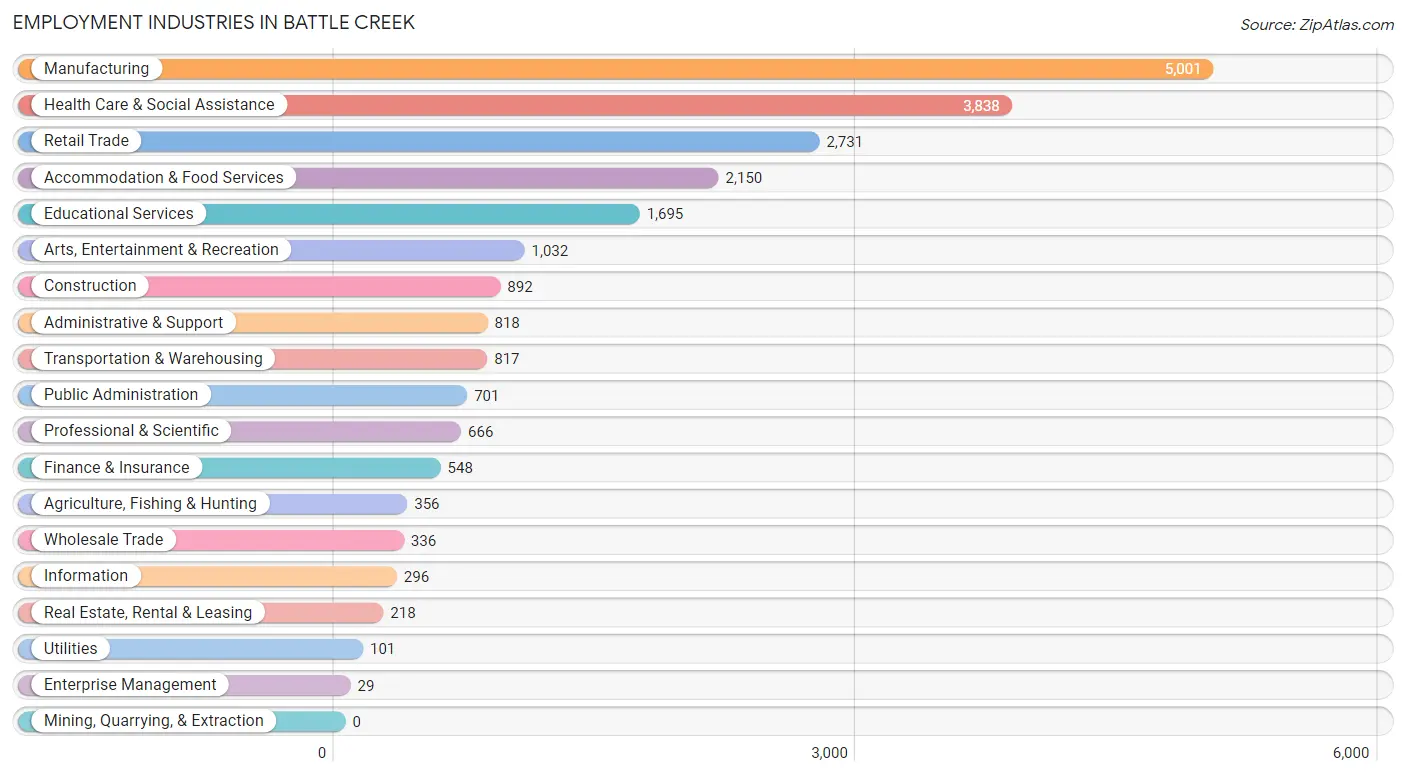
Employment Industries in Battle Creek
The major employment industries in Battle Creek include Manufacturing (5,001 | 21.5%), Health Care & Social Assistance (3,838 | 16.5%), Retail Trade (2,731 | 11.7%), Accommodation & Food Services (2,150 | 9.2%), and Educational Services (1,695 | 7.3%).
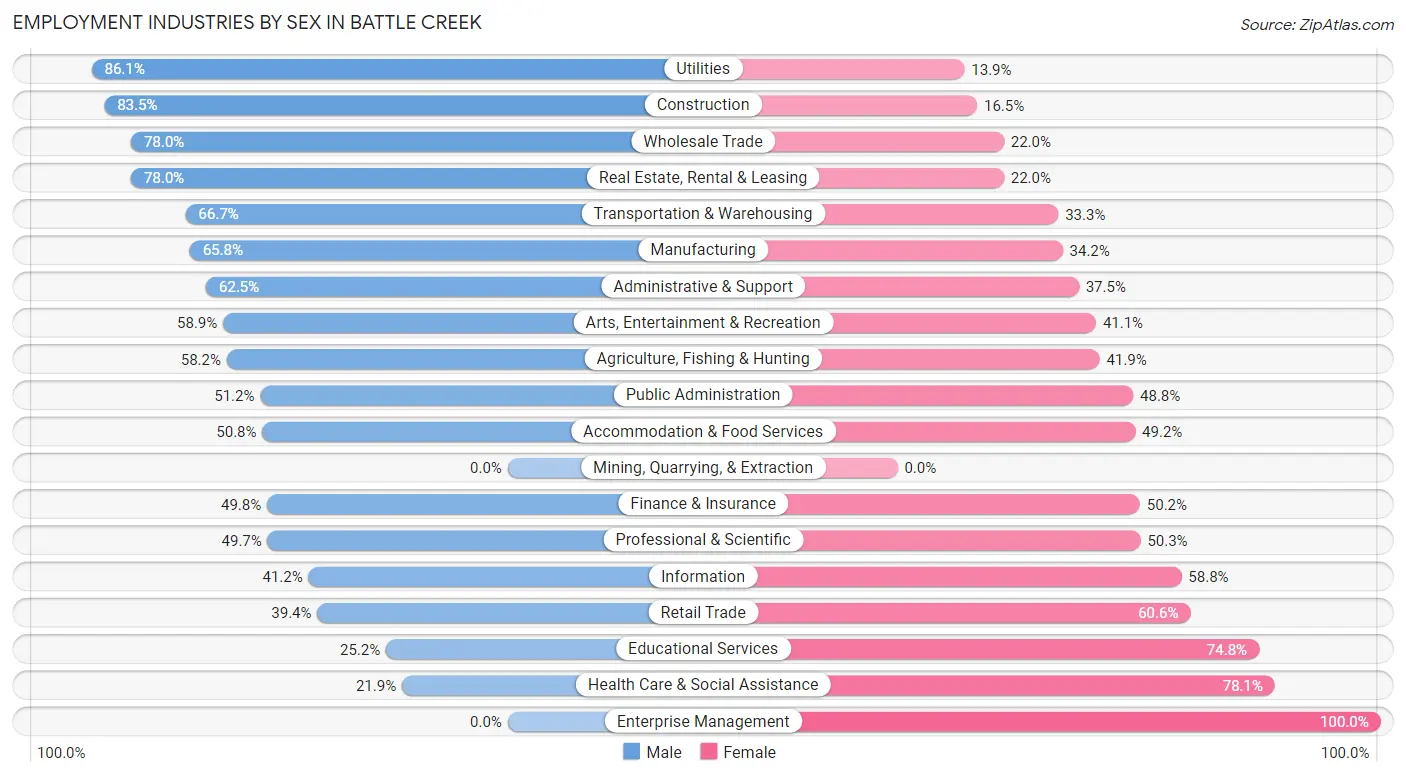
Employment Industries by Sex in Battle Creek
The Battle Creek industries that see more men than women are Utilities (86.1%), Construction (83.5%), and Wholesale Trade (78.0%), whereas the industries that tend to have a higher number of women are Enterprise Management (100.0%), Health Care & Social Assistance (78.1%), and Educational Services (74.8%).
| Industry | Male | Female |
| Agriculture, Fishing & Hunting | 207 (58.2%) | 149 (41.8%) |
| Mining, Quarrying, & Extraction | 0 (0.0%) | 0 (0.0%) |
| Construction | 745 (83.5%) | 147 (16.5%) |
| Manufacturing | 3,291 (65.8%) | 1,710 (34.2%) |
| Wholesale Trade | 262 (78.0%) | 74 (22.0%) |
| Retail Trade | 1,076 (39.4%) | 1,655 (60.6%) |
| Transportation & Warehousing | 545 (66.7%) | 272 (33.3%) |
| Utilities | 87 (86.1%) | 14 (13.9%) |
| Information | 122 (41.2%) | 174 (58.8%) |
| Finance & Insurance | 273 (49.8%) | 275 (50.2%) |
| Real Estate, Rental & Leasing | 170 (78.0%) | 48 (22.0%) |
| Professional & Scientific | 331 (49.7%) | 335 (50.3%) |
| Enterprise Management | 0 (0.0%) | 29 (100.0%) |
| Administrative & Support | 511 (62.5%) | 307 (37.5%) |
| Educational Services | 427 (25.2%) | 1,268 (74.8%) |
| Health Care & Social Assistance | 840 (21.9%) | 2,998 (78.1%) |
| Arts, Entertainment & Recreation | 608 (58.9%) | 424 (41.1%) |
| Accommodation & Food Services | 1,092 (50.8%) | 1,058 (49.2%) |
| Public Administration | 359 (51.2%) | 342 (48.8%) |
| Total | 11,579 (49.7%) | 11,718 (50.3%) |
Education in Battle Creek
School Enrollment in Battle Creek
The most common levels of schooling among the 12,448 students in Battle Creek are high school (3,290 | 26.4%), middle school (2,961 | 23.8%), and elementary school (2,547 | 20.5%).
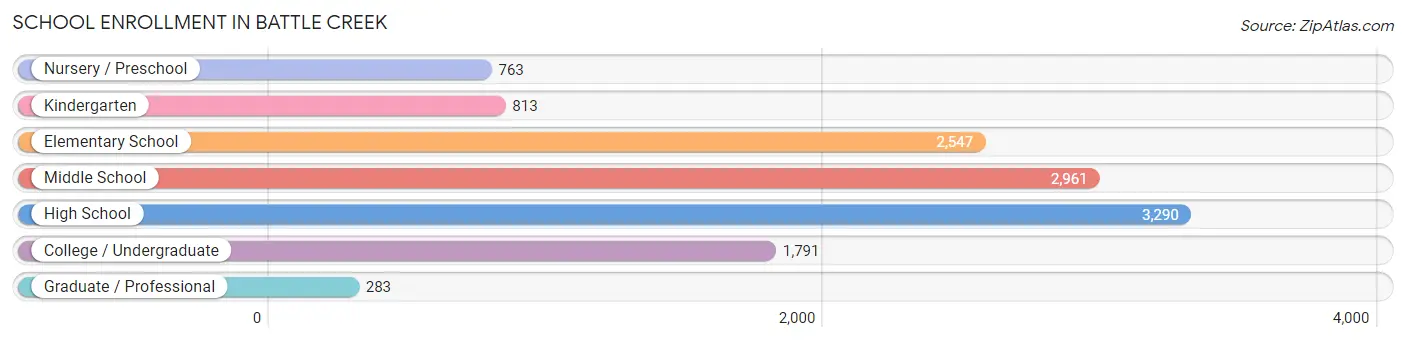
| School Level | # Students | % Students |
| Nursery / Preschool | 763 | 6.1% |
| Kindergarten | 813 | 6.5% |
| Elementary School | 2,547 | 20.5% |
| Middle School | 2,961 | 23.8% |
| High School | 3,290 | 26.4% |
| College / Undergraduate | 1,791 | 14.4% |
| Graduate / Professional | 283 | 2.3% |
| Total | 12,448 | 100.0% |
School Enrollment by Age by Funding Source in Battle Creek
Out of a total of 12,448 students who are enrolled in schools in Battle Creek, 1,071 (8.6%) attend a private institution, while the remaining 11,377 (91.4%) are enrolled in public schools. The age group of 35 years and over has the highest likelihood of being enrolled in private schools, with 114 (25.1% in the age bracket) enrolled. Conversely, the age group of 18 to 19 year olds has the lowest likelihood of being enrolled in a private school, with 575 (97.1% in the age bracket) attending a public institution.
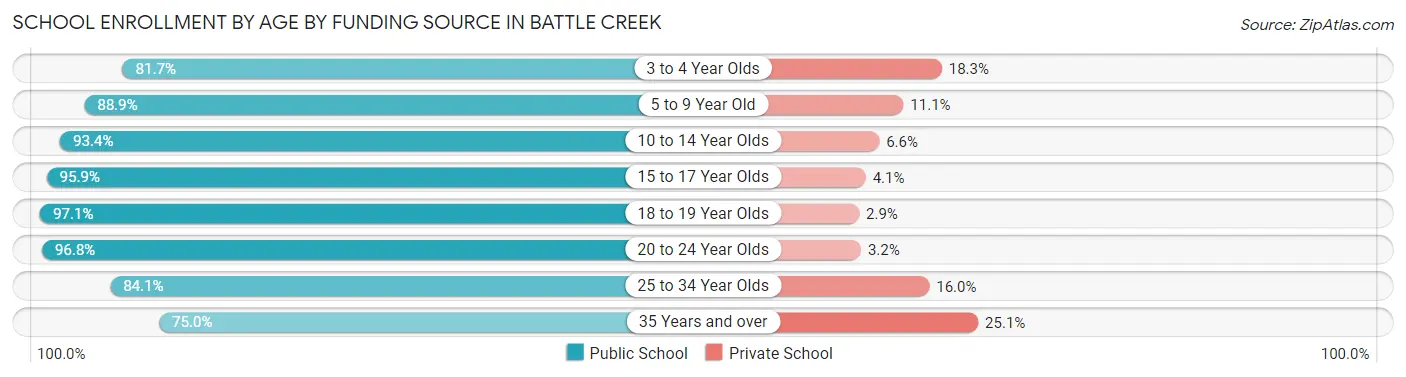
| Age Bracket | Public School | Private School |
| 3 to 4 Year Olds | 483 (81.7%) | 108 (18.3%) |
| 5 to 9 Year Old | 2,882 (88.9%) | 361 (11.1%) |
| 10 to 14 Year Olds | 3,300 (93.4%) | 234 (6.6%) |
| 15 to 17 Year Olds | 2,524 (95.9%) | 108 (4.1%) |
| 18 to 19 Year Olds | 575 (97.1%) | 17 (2.9%) |
| 20 to 24 Year Olds | 749 (96.8%) | 25 (3.2%) |
| 25 to 34 Year Olds | 527 (84.1%) | 100 (16.0%) |
| 35 Years and over | 341 (75.0%) | 114 (25.1%) |
| Total | 11,377 (91.4%) | 1,071 (8.6%) |
Educational Attainment by Field of Study in Battle Creek
Education (1,351 | 16.5%), business (1,311 | 16.0%), science & technology (981 | 12.0%), arts & humanities (770 | 9.4%), and engineering (636 | 7.8%) are the most common fields of study among 8,178 individuals in Battle Creek who have obtained a bachelor's degree or higher.
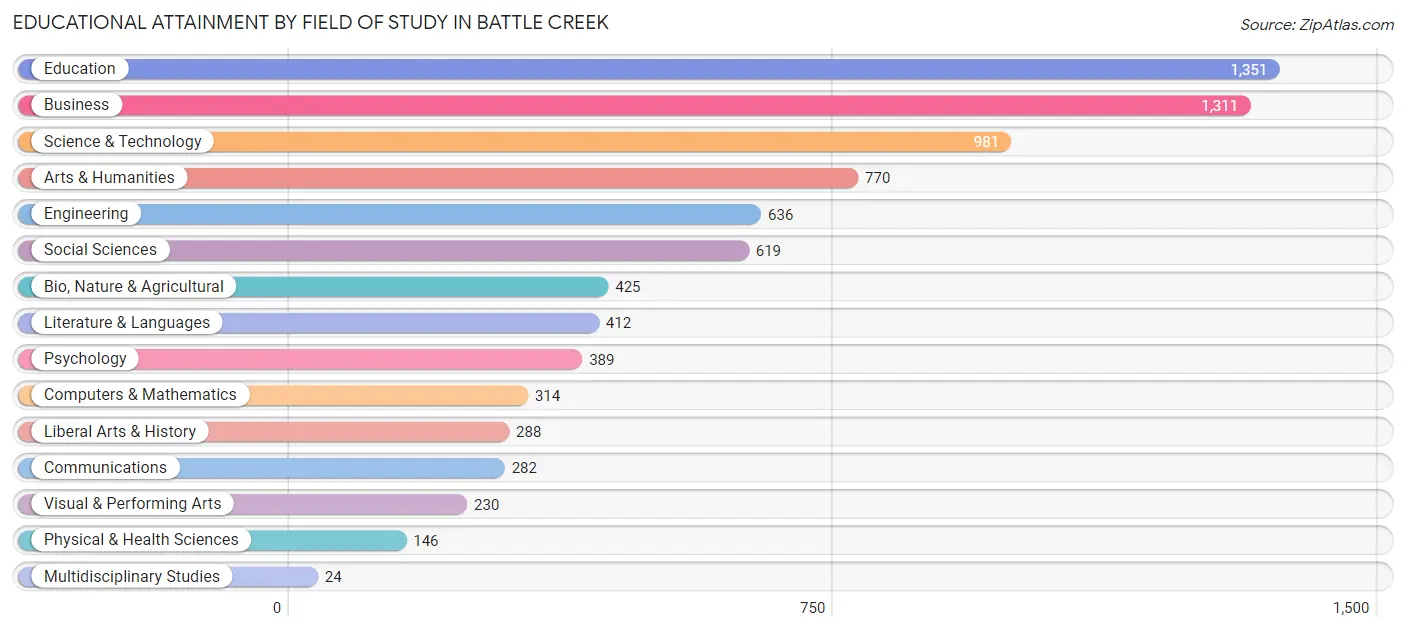
| Field of Study | # Graduates | % Graduates |
| Computers & Mathematics | 314 | 3.8% |
| Bio, Nature & Agricultural | 425 | 5.2% |
| Physical & Health Sciences | 146 | 1.8% |
| Psychology | 389 | 4.8% |
| Social Sciences | 619 | 7.6% |
| Engineering | 636 | 7.8% |
| Multidisciplinary Studies | 24 | 0.3% |
| Science & Technology | 981 | 12.0% |
| Business | 1,311 | 16.0% |
| Education | 1,351 | 16.5% |
| Literature & Languages | 412 | 5.0% |
| Liberal Arts & History | 288 | 3.5% |
| Visual & Performing Arts | 230 | 2.8% |
| Communications | 282 | 3.5% |
| Arts & Humanities | 770 | 9.4% |
| Total | 8,178 | 100.0% |
Transportation & Commute in Battle Creek
Vehicle Availability by Sex in Battle Creek
The most prevalent vehicle ownership categories in Battle Creek are males with 2 vehicles (4,969, accounting for 43.3%) and females with 2 vehicles (4,568, making up 44.4%).
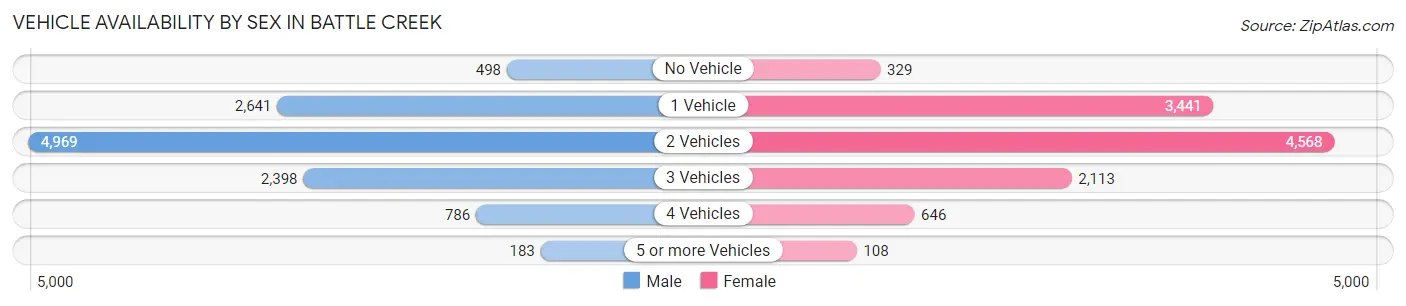
| Vehicles Available | Male | Female |
| No Vehicle | 498 (4.3%) | 329 (2.9%) |
| 1 Vehicle | 2,641 (23.0%) | 3,441 (30.7%) |
| 2 Vehicles | 4,969 (43.3%) | 4,568 (40.8%) |
| 3 Vehicles | 2,398 (20.9%) | 2,113 (18.9%) |
| 4 Vehicles | 786 (6.9%) | 646 (5.8%) |
| 5 or more Vehicles | 183 (1.6%) | 108 (1.0%) |
| Total | 11,475 (100.0%) | 11,205 (100.0%) |
Commute Time in Battle Creek
The most frequently occuring commute durations in Battle Creek are 10 to 14 minutes (5,422 commuters, 25.7%), 15 to 19 minutes (4,401 commuters, 20.9%), and 5 to 9 minutes (2,936 commuters, 13.9%).
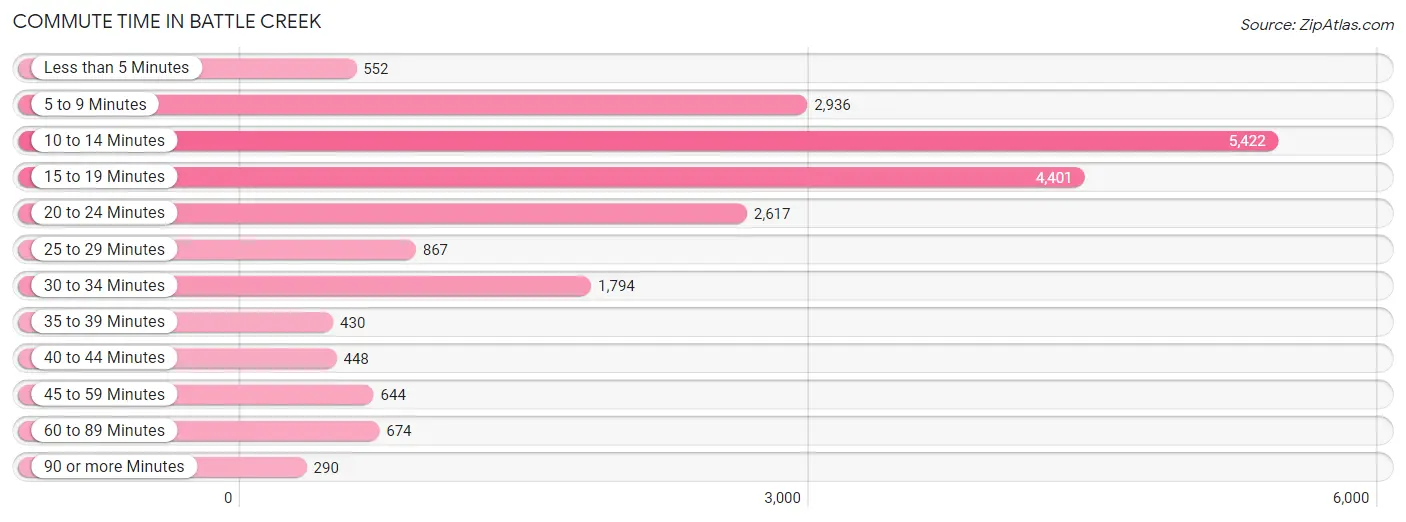
| Commute Time | # Commuters | % Commuters |
| Less than 5 Minutes | 552 | 2.6% |
| 5 to 9 Minutes | 2,936 | 13.9% |
| 10 to 14 Minutes | 5,422 | 25.7% |
| 15 to 19 Minutes | 4,401 | 20.9% |
| 20 to 24 Minutes | 2,617 | 12.4% |
| 25 to 29 Minutes | 867 | 4.1% |
| 30 to 34 Minutes | 1,794 | 8.5% |
| 35 to 39 Minutes | 430 | 2.0% |
| 40 to 44 Minutes | 448 | 2.1% |
| 45 to 59 Minutes | 644 | 3.1% |
| 60 to 89 Minutes | 674 | 3.2% |
| 90 or more Minutes | 290 | 1.4% |
Commute Time by Sex in Battle Creek
The most common commute times in Battle Creek are 10 to 14 minutes (2,538 commuters, 23.7%) for males and 10 to 14 minutes (2,884 commuters, 27.8%) for females.
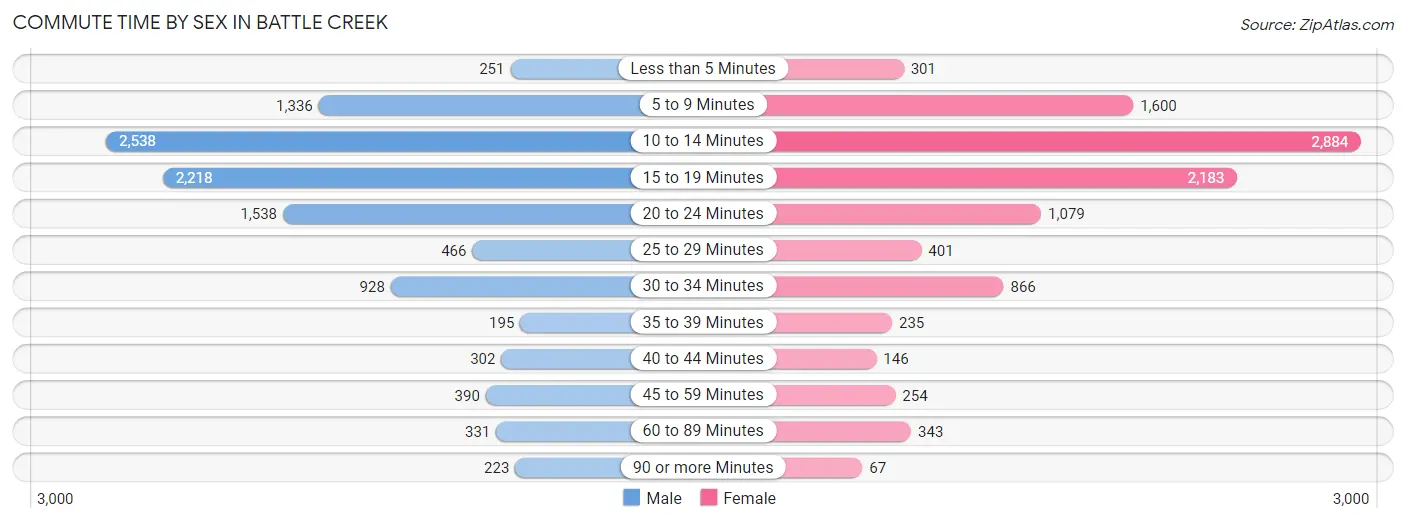
| Commute Time | Male | Female |
| Less than 5 Minutes | 251 (2.3%) | 301 (2.9%) |
| 5 to 9 Minutes | 1,336 (12.5%) | 1,600 (15.4%) |
| 10 to 14 Minutes | 2,538 (23.7%) | 2,884 (27.8%) |
| 15 to 19 Minutes | 2,218 (20.7%) | 2,183 (21.1%) |
| 20 to 24 Minutes | 1,538 (14.3%) | 1,079 (10.4%) |
| 25 to 29 Minutes | 466 (4.3%) | 401 (3.9%) |
| 30 to 34 Minutes | 928 (8.7%) | 866 (8.4%) |
| 35 to 39 Minutes | 195 (1.8%) | 235 (2.3%) |
| 40 to 44 Minutes | 302 (2.8%) | 146 (1.4%) |
| 45 to 59 Minutes | 390 (3.6%) | 254 (2.5%) |
| 60 to 89 Minutes | 331 (3.1%) | 343 (3.3%) |
| 90 or more Minutes | 223 (2.1%) | 67 (0.6%) |
Time of Departure to Work by Sex in Battle Creek
The most frequent times of departure to work in Battle Creek are 12:00 PM to 3:59 PM (1,464, 13.7%) for males and 12:00 PM to 3:59 PM (1,686, 16.3%) for females.
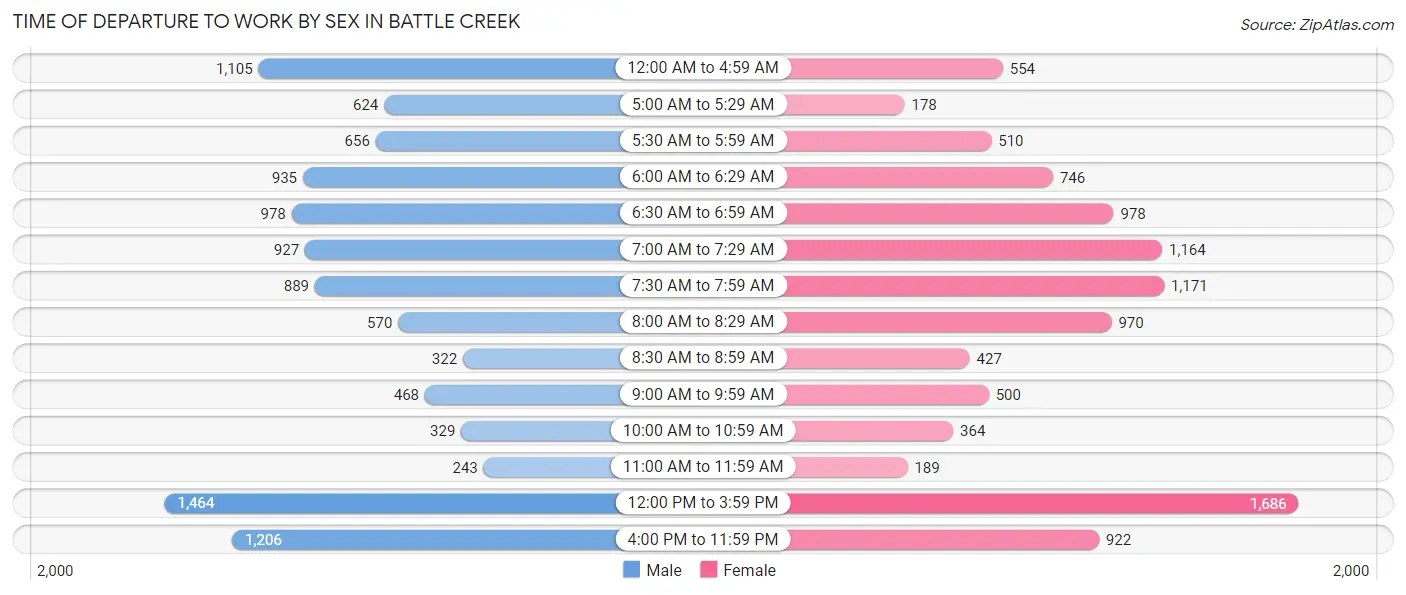
| Time of Departure | Male | Female |
| 12:00 AM to 4:59 AM | 1,105 (10.3%) | 554 (5.3%) |
| 5:00 AM to 5:29 AM | 624 (5.8%) | 178 (1.7%) |
| 5:30 AM to 5:59 AM | 656 (6.1%) | 510 (4.9%) |
| 6:00 AM to 6:29 AM | 935 (8.7%) | 746 (7.2%) |
| 6:30 AM to 6:59 AM | 978 (9.1%) | 978 (9.4%) |
| 7:00 AM to 7:29 AM | 927 (8.6%) | 1,164 (11.2%) |
| 7:30 AM to 7:59 AM | 889 (8.3%) | 1,171 (11.3%) |
| 8:00 AM to 8:29 AM | 570 (5.3%) | 970 (9.4%) |
| 8:30 AM to 8:59 AM | 322 (3.0%) | 427 (4.1%) |
| 9:00 AM to 9:59 AM | 468 (4.4%) | 500 (4.8%) |
| 10:00 AM to 10:59 AM | 329 (3.1%) | 364 (3.5%) |
| 11:00 AM to 11:59 AM | 243 (2.3%) | 189 (1.8%) |
| 12:00 PM to 3:59 PM | 1,464 (13.7%) | 1,686 (16.3%) |
| 4:00 PM to 11:59 PM | 1,206 (11.3%) | 922 (8.9%) |
| Total | 10,716 (100.0%) | 10,359 (100.0%) |
Housing Occupancy in Battle Creek
Occupancy by Ownership in Battle Creek
Of the total 21,140 dwellings in Battle Creek, owner-occupied units account for 13,494 (63.8%), while renter-occupied units make up 7,646 (36.2%).
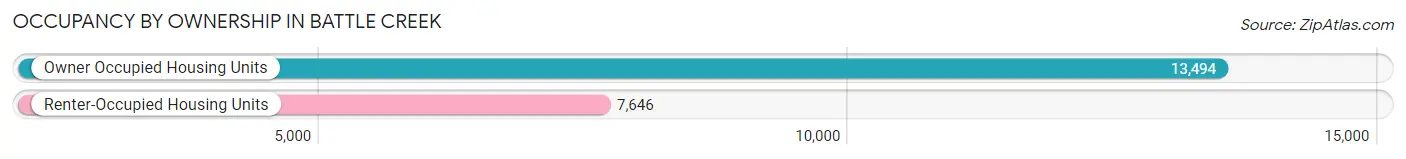
| Occupancy | # Housing Units | % Housing Units |
| Owner Occupied Housing Units | 13,494 | 63.8% |
| Renter-Occupied Housing Units | 7,646 | 36.2% |
| Total Occupied Housing Units | 21,140 | 100.0% |
Occupancy by Household Size in Battle Creek
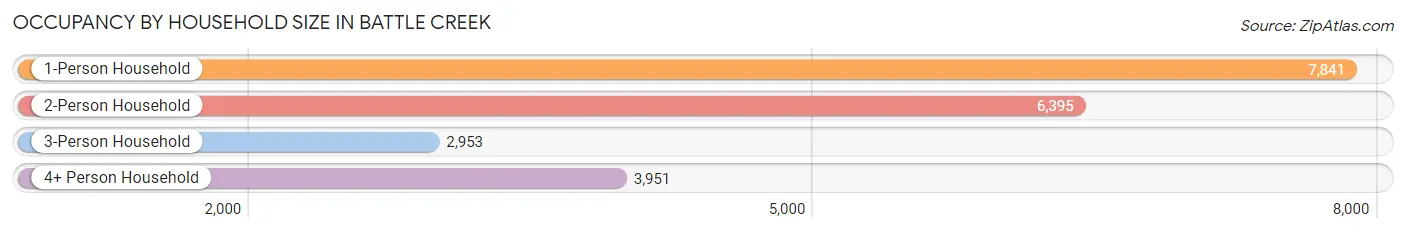
| Household Size | # Housing Units | % Housing Units |
| 1-Person Household | 7,841 | 37.1% |
| 2-Person Household | 6,395 | 30.2% |
| 3-Person Household | 2,953 | 14.0% |
| 4+ Person Household | 3,951 | 18.7% |
| Total Housing Units | 21,140 | 100.0% |
Occupancy by Ownership by Household Size in Battle Creek
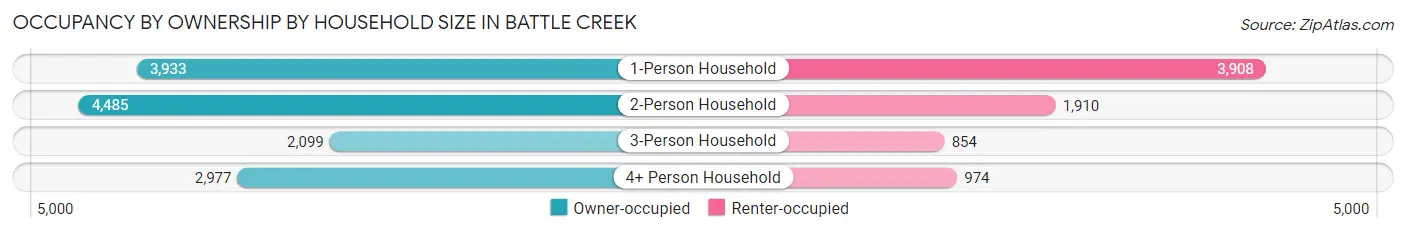
| Household Size | Owner-occupied | Renter-occupied |
| 1-Person Household | 3,933 (50.2%) | 3,908 (49.8%) |
| 2-Person Household | 4,485 (70.1%) | 1,910 (29.9%) |
| 3-Person Household | 2,099 (71.1%) | 854 (28.9%) |
| 4+ Person Household | 2,977 (75.3%) | 974 (24.6%) |
| Total Housing Units | 13,494 (63.8%) | 7,646 (36.2%) |
Occupancy by Educational Attainment in Battle Creek
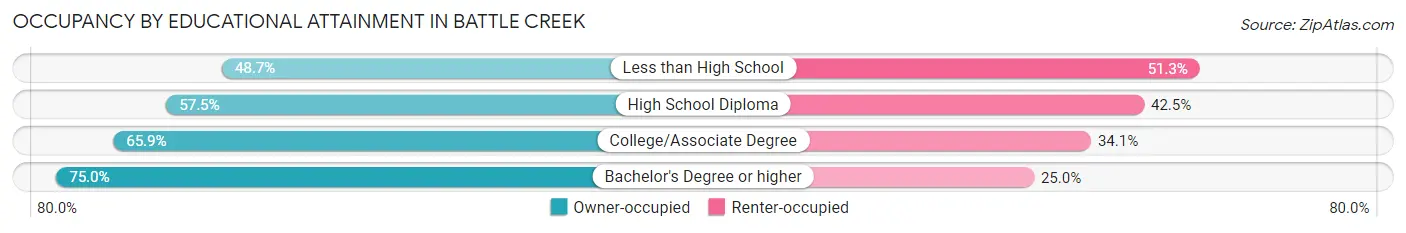
| Household Size | Owner-occupied | Renter-occupied |
| Less than High School | 965 (48.7%) | 1,017 (51.3%) |
| High School Diploma | 3,699 (57.5%) | 2,733 (42.5%) |
| College/Associate Degree | 5,184 (65.9%) | 2,679 (34.1%) |
| Bachelor's Degree or higher | 3,646 (75.0%) | 1,217 (25.0%) |
Occupancy by Age of Householder in Battle Creek
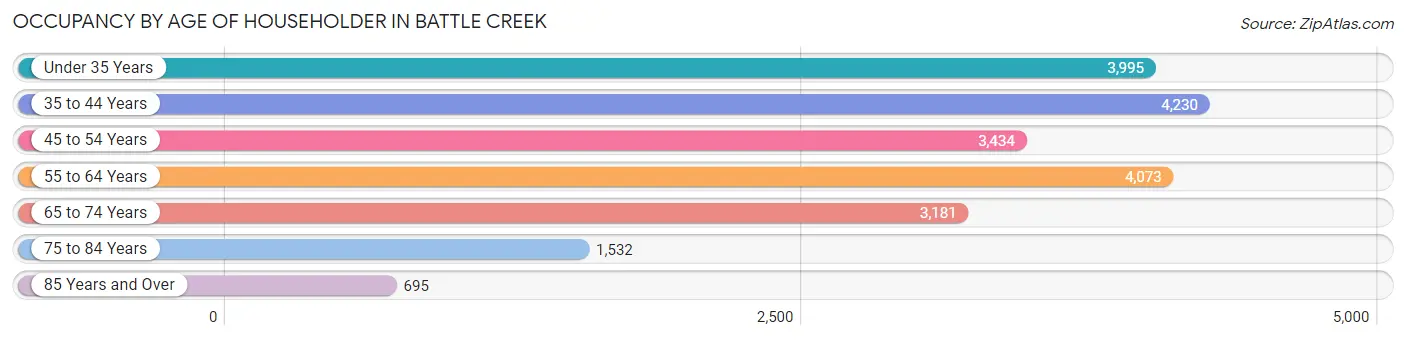
| Age Bracket | # Households | % Households |
| Under 35 Years | 3,995 | 18.9% |
| 35 to 44 Years | 4,230 | 20.0% |
| 45 to 54 Years | 3,434 | 16.2% |
| 55 to 64 Years | 4,073 | 19.3% |
| 65 to 74 Years | 3,181 | 15.0% |
| 75 to 84 Years | 1,532 | 7.2% |
| 85 Years and Over | 695 | 3.3% |
| Total | 21,140 | 100.0% |
Housing Finances in Battle Creek
Median Income by Occupancy in Battle Creek
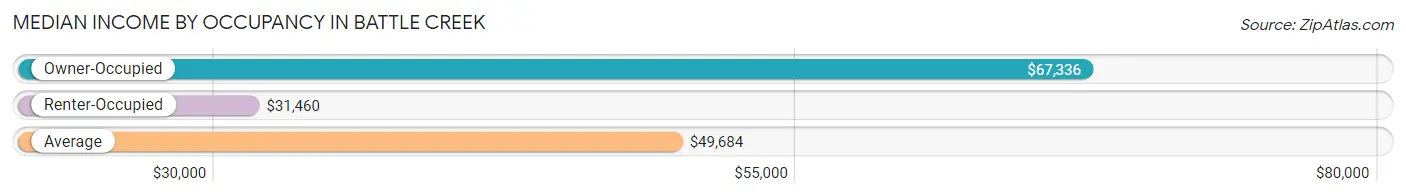
| Occupancy Type | # Households | Median Income |
| Owner-Occupied | 13,494 (63.8%) | $67,336 |
| Renter-Occupied | 7,646 (36.2%) | $31,460 |
| Average | 21,140 (100.0%) | $49,684 |
Occupancy by Householder Income Bracket in Battle Creek
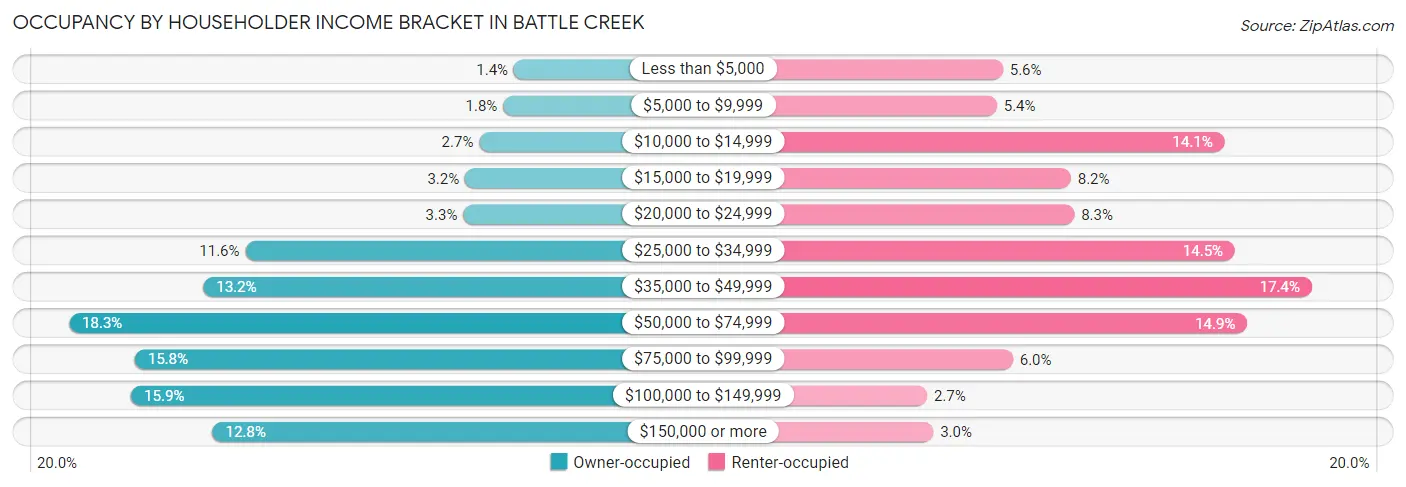
| Income Bracket | Owner-occupied | Renter-occupied |
| Less than $5,000 | 184 (1.4%) | 429 (5.6%) |
| $5,000 to $9,999 | 239 (1.8%) | 411 (5.4%) |
| $10,000 to $14,999 | 362 (2.7%) | 1,075 (14.1%) |
| $15,000 to $19,999 | 434 (3.2%) | 627 (8.2%) |
| $20,000 to $24,999 | 444 (3.3%) | 637 (8.3%) |
| $25,000 to $34,999 | 1,564 (11.6%) | 1,105 (14.4%) |
| $35,000 to $49,999 | 1,780 (13.2%) | 1,329 (17.4%) |
| $50,000 to $74,999 | 2,471 (18.3%) | 1,141 (14.9%) |
| $75,000 to $99,999 | 2,132 (15.8%) | 458 (6.0%) |
| $100,000 to $149,999 | 2,151 (15.9%) | 208 (2.7%) |
| $150,000 or more | 1,733 (12.8%) | 226 (3.0%) |
| Total | 13,494 (100.0%) | 7,646 (100.0%) |
Monthly Housing Cost Tiers in Battle Creek
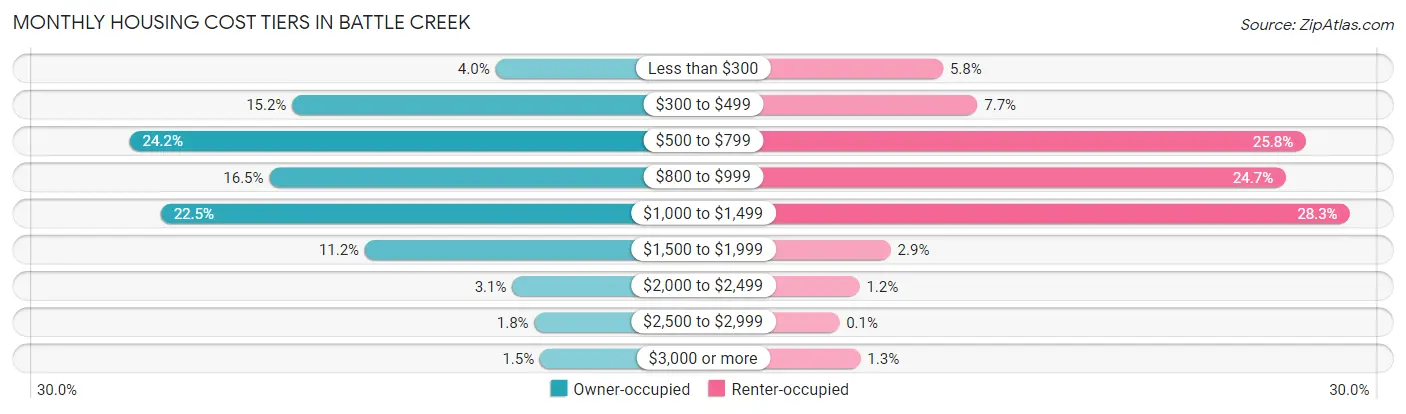
| Monthly Cost | Owner-occupied | Renter-occupied |
| Less than $300 | 538 (4.0%) | 446 (5.8%) |
| $300 to $499 | 2,054 (15.2%) | 591 (7.7%) |
| $500 to $799 | 3,265 (24.2%) | 1,975 (25.8%) |
| $800 to $999 | 2,224 (16.5%) | 1,890 (24.7%) |
| $1,000 to $1,499 | 3,033 (22.5%) | 2,162 (28.3%) |
| $1,500 to $1,999 | 1,512 (11.2%) | 225 (2.9%) |
| $2,000 to $2,499 | 413 (3.1%) | 93 (1.2%) |
| $2,500 to $2,999 | 248 (1.8%) | 8 (0.1%) |
| $3,000 or more | 207 (1.5%) | 97 (1.3%) |
| Total | 13,494 (100.0%) | 7,646 (100.0%) |
Physical Housing Characteristics in Battle Creek
Housing Structures in Battle Creek
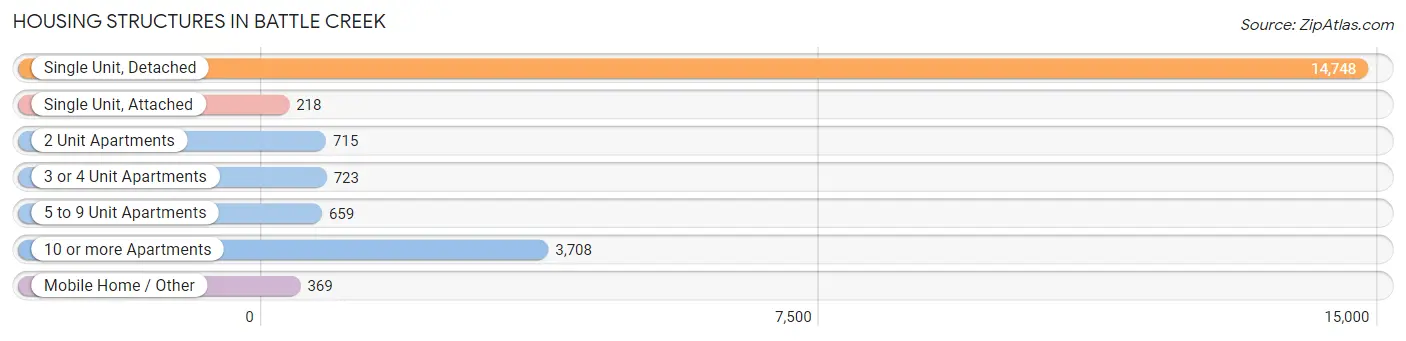
| Structure Type | # Housing Units | % Housing Units |
| Single Unit, Detached | 14,748 | 69.8% |
| Single Unit, Attached | 218 | 1.0% |
| 2 Unit Apartments | 715 | 3.4% |
| 3 or 4 Unit Apartments | 723 | 3.4% |
| 5 to 9 Unit Apartments | 659 | 3.1% |
| 10 or more Apartments | 3,708 | 17.5% |
| Mobile Home / Other | 369 | 1.8% |
| Total | 21,140 | 100.0% |
Housing Structures by Occupancy in Battle Creek
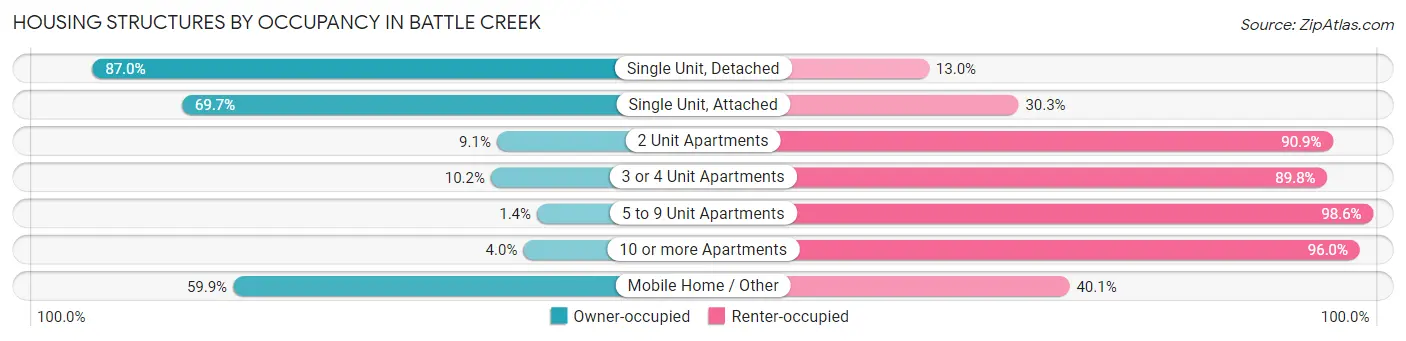
| Structure Type | Owner-occupied | Renter-occupied |
| Single Unit, Detached | 12,825 (87.0%) | 1,923 (13.0%) |
| Single Unit, Attached | 152 (69.7%) | 66 (30.3%) |
| 2 Unit Apartments | 65 (9.1%) | 650 (90.9%) |
| 3 or 4 Unit Apartments | 74 (10.2%) | 649 (89.8%) |
| 5 to 9 Unit Apartments | 9 (1.4%) | 650 (98.6%) |
| 10 or more Apartments | 148 (4.0%) | 3,560 (96.0%) |
| Mobile Home / Other | 221 (59.9%) | 148 (40.1%) |
| Total | 13,494 (63.8%) | 7,646 (36.2%) |
Housing Structures by Number of Rooms in Battle Creek
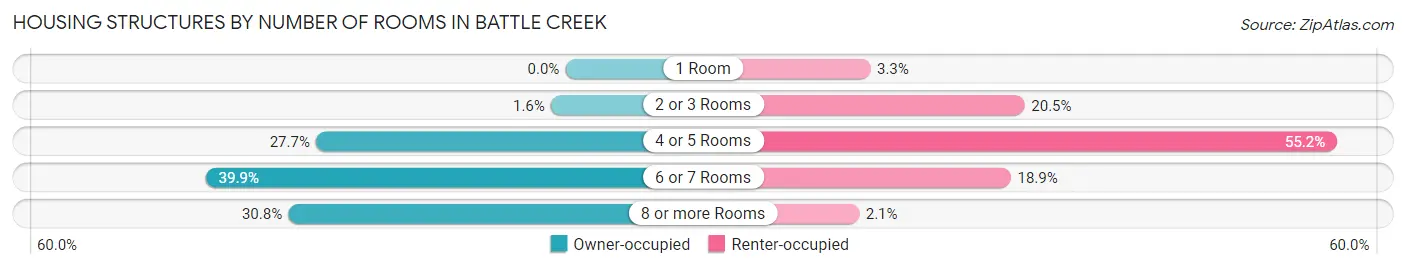
| Number of Rooms | Owner-occupied | Renter-occupied |
| 1 Room | 0 (0.0%) | 255 (3.3%) |
| 2 or 3 Rooms | 219 (1.6%) | 1,565 (20.5%) |
| 4 or 5 Rooms | 3,737 (27.7%) | 4,218 (55.2%) |
| 6 or 7 Rooms | 5,386 (39.9%) | 1,448 (18.9%) |
| 8 or more Rooms | 4,152 (30.8%) | 160 (2.1%) |
| Total | 13,494 (100.0%) | 7,646 (100.0%) |
Housing Structure by Heating Type in Battle Creek
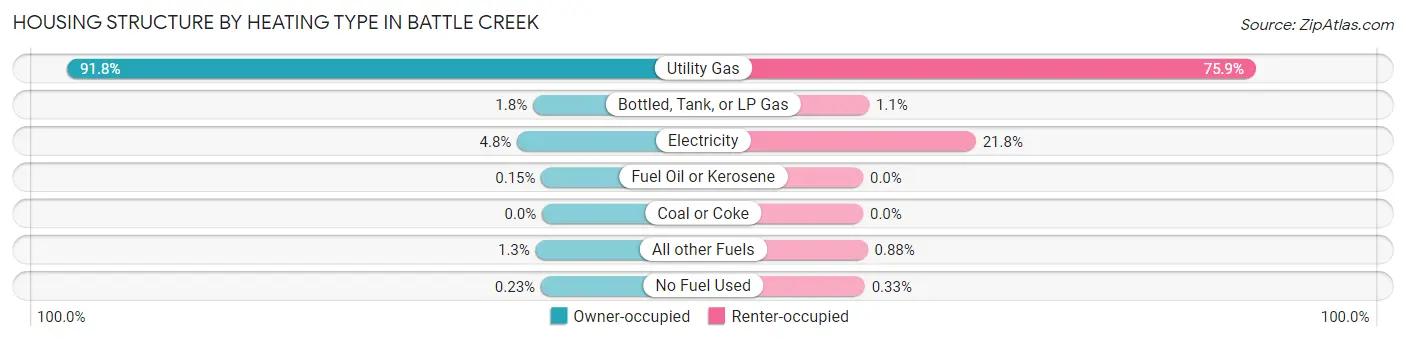
| Heating Type | Owner-occupied | Renter-occupied |
| Utility Gas | 12,385 (91.8%) | 5,802 (75.9%) |
| Bottled, Tank, or LP Gas | 238 (1.8%) | 87 (1.1%) |
| Electricity | 651 (4.8%) | 1,665 (21.8%) |
| Fuel Oil or Kerosene | 20 (0.2%) | 0 (0.0%) |
| Coal or Coke | 0 (0.0%) | 0 (0.0%) |
| All other Fuels | 169 (1.3%) | 67 (0.9%) |
| No Fuel Used | 31 (0.2%) | 25 (0.3%) |
| Total | 13,494 (100.0%) | 7,646 (100.0%) |
Household Vehicle Usage in Battle Creek
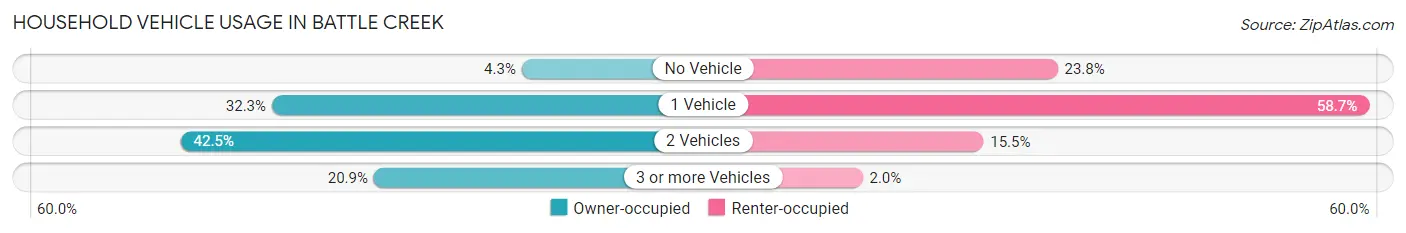
| Vehicles per Household | Owner-occupied | Renter-occupied |
| No Vehicle | 582 (4.3%) | 1,821 (23.8%) |
| 1 Vehicle | 4,358 (32.3%) | 4,489 (58.7%) |
| 2 Vehicles | 5,737 (42.5%) | 1,185 (15.5%) |
| 3 or more Vehicles | 2,817 (20.9%) | 151 (2.0%) |
| Total | 13,494 (100.0%) | 7,646 (100.0%) |
Real Estate & Mortgages in Battle Creek
Real Estate and Mortgage Overview in Battle Creek
| Characteristic | Without Mortgage | With Mortgage |
| Housing Units | 5,069 | 8,425 |
| Median Property Value | $95,300 | $128,300 |
| Median Household Income | $55,052 | $1,292 |
| Monthly Housing Costs | $518 | $207 |
| Real Estate Taxes | $1,763 | $212 |
Property Value by Mortgage Status in Battle Creek
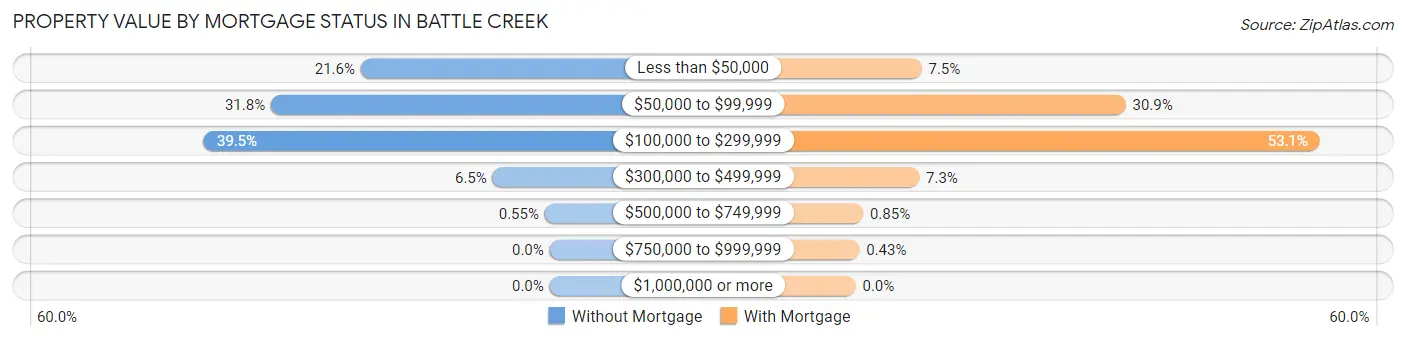
| Property Value | Without Mortgage | With Mortgage |
| Less than $50,000 | 1,094 (21.6%) | 635 (7.5%) |
| $50,000 to $99,999 | 1,614 (31.8%) | 2,600 (30.9%) |
| $100,000 to $299,999 | 2,003 (39.5%) | 4,470 (53.1%) |
| $300,000 to $499,999 | 330 (6.5%) | 612 (7.3%) |
| $500,000 to $749,999 | 28 (0.5%) | 72 (0.9%) |
| $750,000 to $999,999 | 0 (0.0%) | 36 (0.4%) |
| $1,000,000 or more | 0 (0.0%) | 0 (0.0%) |
| Total | 5,069 (100.0%) | 8,425 (100.0%) |
Household Income by Mortgage Status in Battle Creek
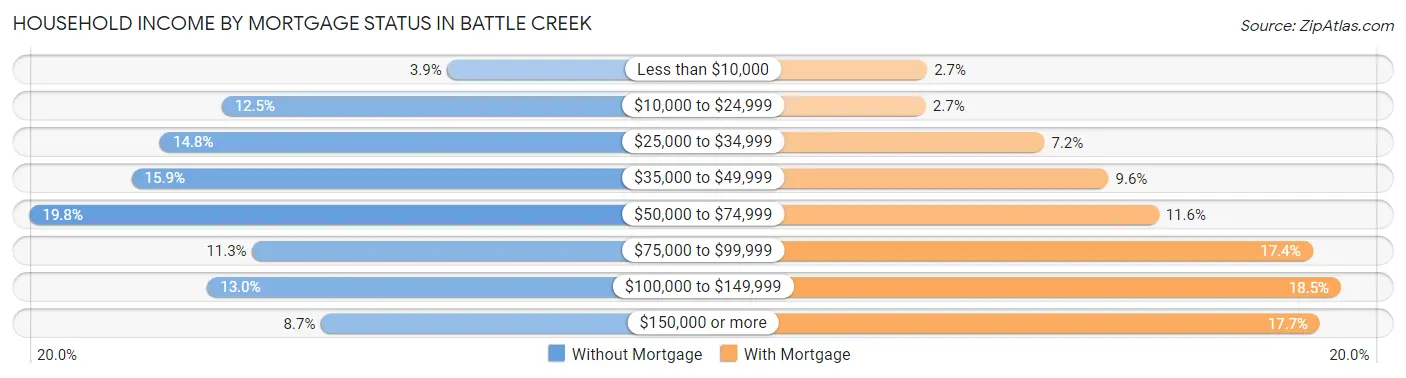
| Household Income | Without Mortgage | With Mortgage |
| Less than $10,000 | 197 (3.9%) | 230 (2.7%) |
| $10,000 to $24,999 | 633 (12.5%) | 226 (2.7%) |
| $25,000 to $34,999 | 752 (14.8%) | 607 (7.2%) |
| $35,000 to $49,999 | 807 (15.9%) | 812 (9.6%) |
| $50,000 to $74,999 | 1,004 (19.8%) | 973 (11.6%) |
| $75,000 to $99,999 | 574 (11.3%) | 1,467 (17.4%) |
| $100,000 to $149,999 | 661 (13.0%) | 1,558 (18.5%) |
| $150,000 or more | 441 (8.7%) | 1,490 (17.7%) |
| Total | 5,069 (100.0%) | 8,425 (100.0%) |
Property Value to Household Income Ratio in Battle Creek
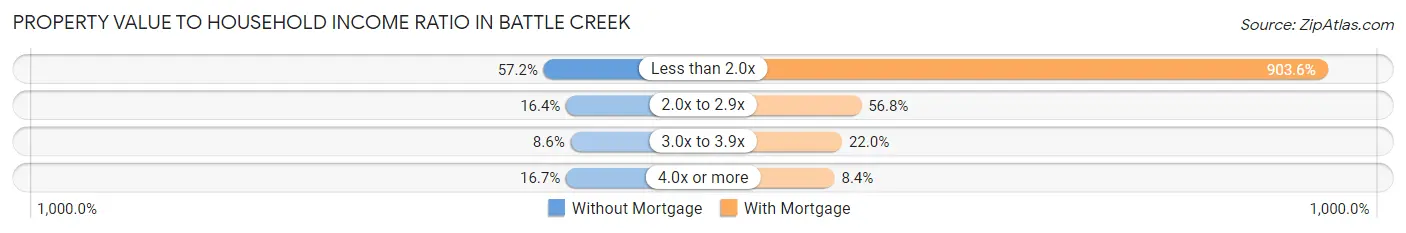
| Value-to-Income Ratio | Without Mortgage | With Mortgage |
| Less than 2.0x | 2,899 (57.2%) | 76,130 (903.6%) |
| 2.0x to 2.9x | 832 (16.4%) | 4,785 (56.8%) |
| 3.0x to 3.9x | 437 (8.6%) | 1,849 (22.0%) |
| 4.0x or more | 847 (16.7%) | 706 (8.4%) |
| Total | 5,069 (100.0%) | 8,425 (100.0%) |
Real Estate Taxes by Mortgage Status in Battle Creek
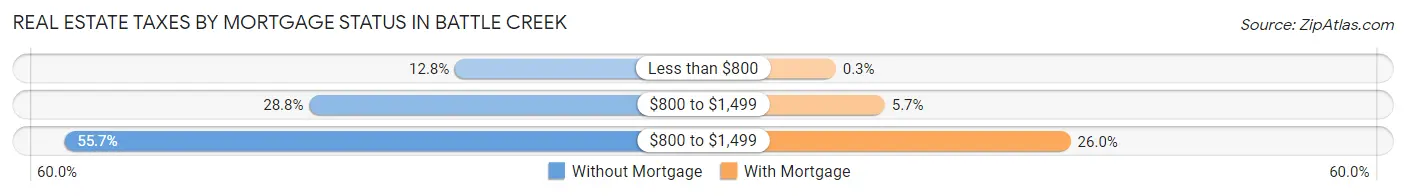
| Property Taxes | Without Mortgage | With Mortgage |
| Less than $800 | 650 (12.8%) | 25 (0.3%) |
| $800 to $1,499 | 1,460 (28.8%) | 478 (5.7%) |
| $800 to $1,499 | 2,821 (55.6%) | 2,194 (26.0%) |
| Total | 5,069 (100.0%) | 8,425 (100.0%) |
Health & Disability in Battle Creek
Health Insurance Coverage by Age in Battle Creek
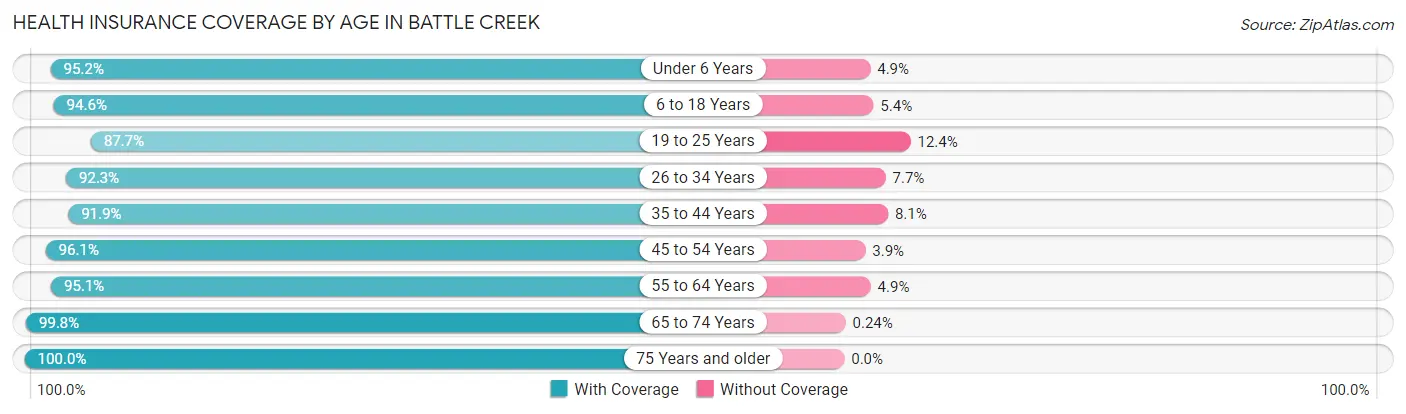
| Age Bracket | With Coverage | Without Coverage |
| Under 6 Years | 4,039 (95.2%) | 206 (4.9%) |
| 6 to 18 Years | 9,153 (94.6%) | 526 (5.4%) |
| 19 to 25 Years | 3,904 (87.6%) | 550 (12.3%) |
| 26 to 34 Years | 5,511 (92.3%) | 460 (7.7%) |
| 35 to 44 Years | 6,432 (91.9%) | 570 (8.1%) |
| 45 to 54 Years | 5,814 (96.1%) | 237 (3.9%) |
| 55 to 64 Years | 5,971 (95.1%) | 309 (4.9%) |
| 65 to 74 Years | 4,644 (99.8%) | 11 (0.2%) |
| 75 Years and older | 3,275 (100.0%) | 0 (0.0%) |
| Total | 48,743 (94.4%) | 2,869 (5.6%) |
Health Insurance Coverage by Citizenship Status in Battle Creek
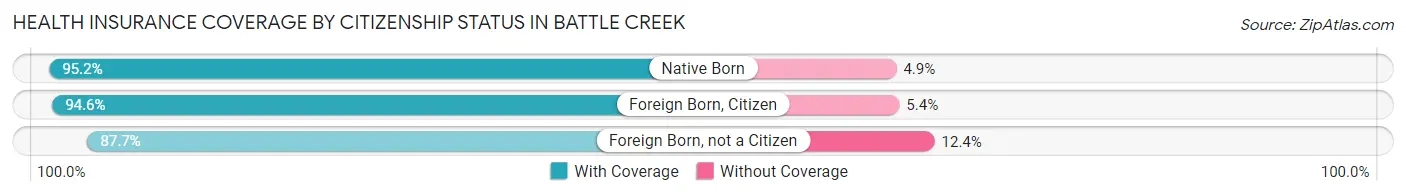
| Citizenship Status | With Coverage | Without Coverage |
| Native Born | 4,039 (95.2%) | 206 (4.9%) |
| Foreign Born, Citizen | 9,153 (94.6%) | 526 (5.4%) |
| Foreign Born, not a Citizen | 3,904 (87.6%) | 550 (12.3%) |
Health Insurance Coverage by Household Income in Battle Creek
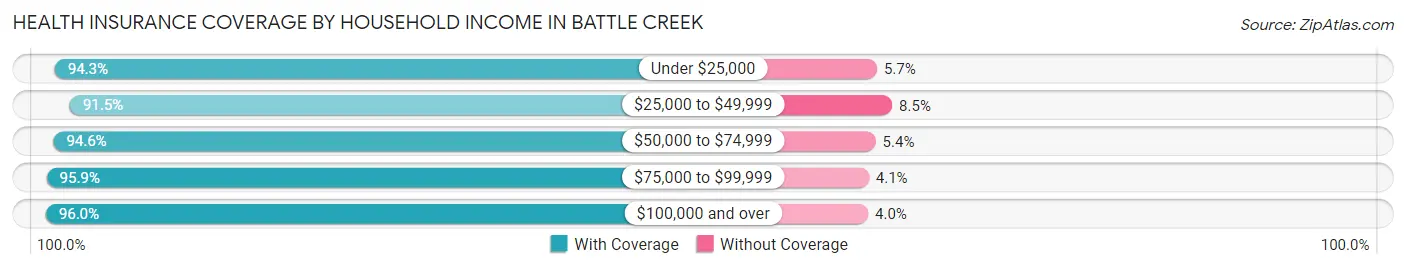
| Household Income | With Coverage | Without Coverage |
| Under $25,000 | 7,773 (94.3%) | 466 (5.7%) |
| $25,000 to $49,999 | 10,859 (91.5%) | 1,009 (8.5%) |
| $50,000 to $74,999 | 9,235 (94.6%) | 528 (5.4%) |
| $75,000 to $99,999 | 6,820 (95.9%) | 294 (4.1%) |
| $100,000 and over | 13,647 (96.0%) | 567 (4.0%) |
Public vs Private Health Insurance Coverage by Age in Battle Creek
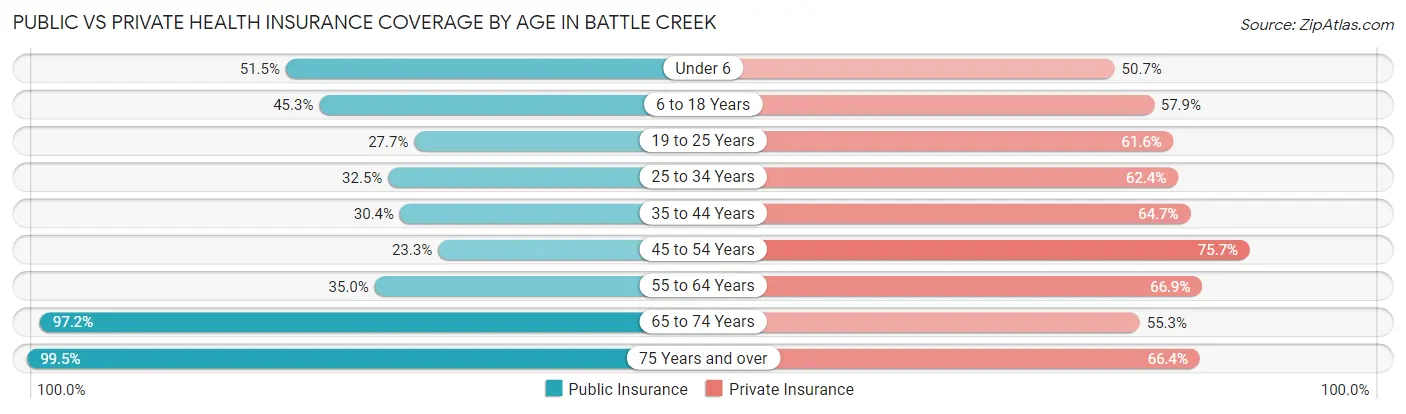
| Age Bracket | Public Insurance | Private Insurance |
| Under 6 | 2,187 (51.5%) | 2,150 (50.6%) |
| 6 to 18 Years | 4,386 (45.3%) | 5,605 (57.9%) |
| 19 to 25 Years | 1,233 (27.7%) | 2,743 (61.6%) |
| 25 to 34 Years | 1,942 (32.5%) | 3,727 (62.4%) |
| 35 to 44 Years | 2,125 (30.3%) | 4,530 (64.7%) |
| 45 to 54 Years | 1,408 (23.3%) | 4,583 (75.7%) |
| 55 to 64 Years | 2,200 (35.0%) | 4,202 (66.9%) |
| 65 to 74 Years | 4,523 (97.2%) | 2,575 (55.3%) |
| 75 Years and over | 3,259 (99.5%) | 2,176 (66.4%) |
| Total | 23,263 (45.1%) | 32,291 (62.6%) |
Disability Status by Sex by Age in Battle Creek
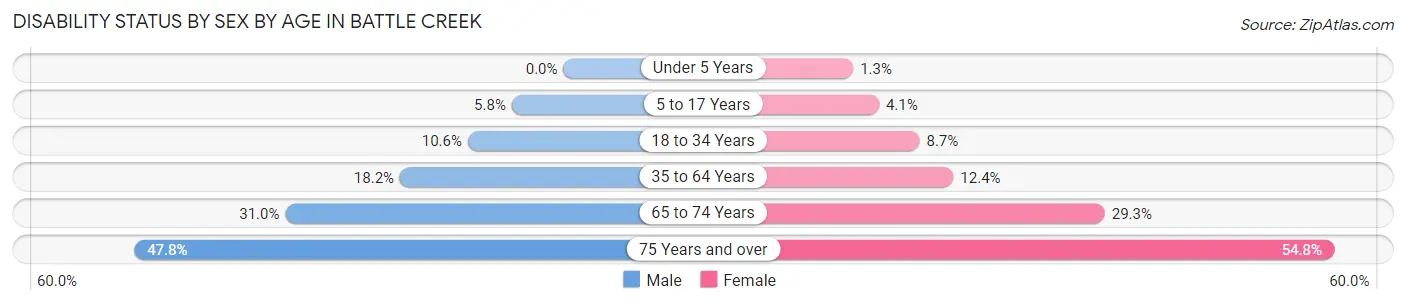
| Age Bracket | Male | Female |
| Under 5 Years | 0 (0.0%) | 21 (1.3%) |
| 5 to 17 Years | 281 (5.8%) | 207 (4.1%) |
| 18 to 34 Years | 578 (10.6%) | 476 (8.7%) |
| 35 to 64 Years | 1,689 (18.2%) | 1,250 (12.4%) |
| 65 to 74 Years | 652 (31.0%) | 747 (29.3%) |
| 75 Years and over | 638 (47.8%) | 1,063 (54.8%) |
Disability Class by Sex by Age in Battle Creek
Disability Class: Hearing Difficulty
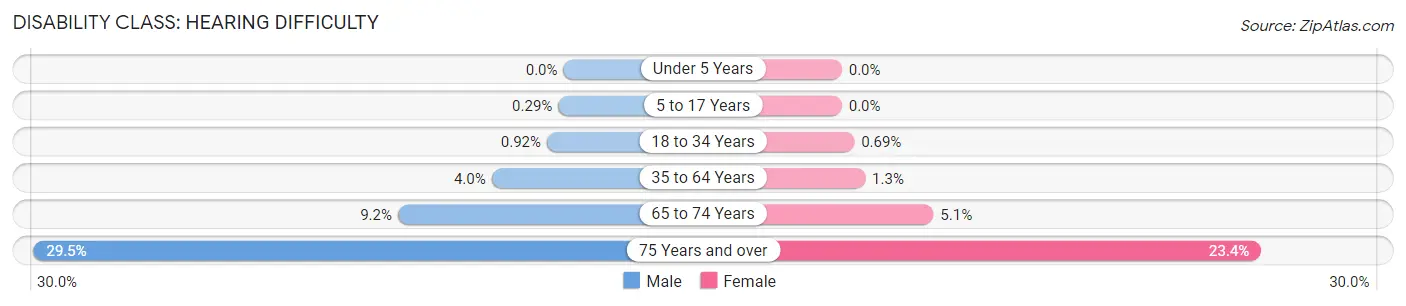
| Age Bracket | Male | Female |
| Under 5 Years | 0 (0.0%) | 0 (0.0%) |
| 5 to 17 Years | 14 (0.3%) | 0 (0.0%) |
| 18 to 34 Years | 50 (0.9%) | 38 (0.7%) |
| 35 to 64 Years | 371 (4.0%) | 131 (1.3%) |
| 65 to 74 Years | 194 (9.2%) | 130 (5.1%) |
| 75 Years and over | 394 (29.5%) | 453 (23.4%) |
Disability Class: Vision Difficulty
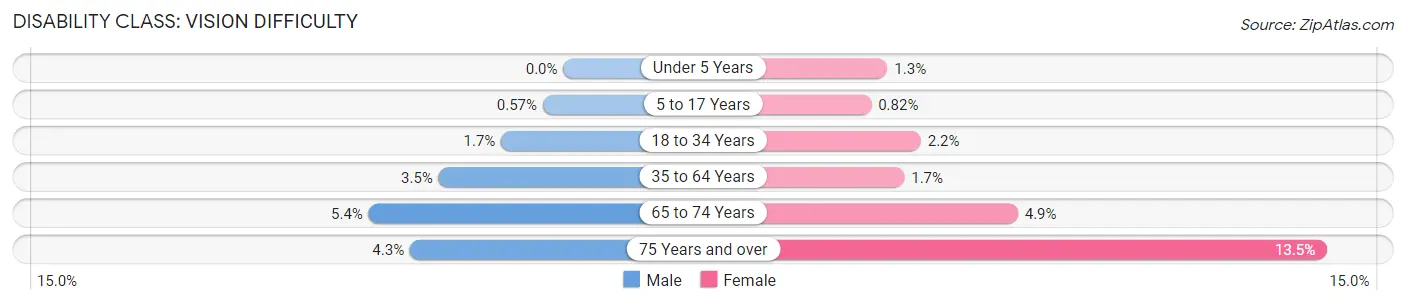
| Age Bracket | Male | Female |
| Under 5 Years | 0 (0.0%) | 21 (1.3%) |
| 5 to 17 Years | 28 (0.6%) | 41 (0.8%) |
| 18 to 34 Years | 94 (1.7%) | 121 (2.2%) |
| 35 to 64 Years | 322 (3.5%) | 175 (1.7%) |
| 65 to 74 Years | 114 (5.4%) | 125 (4.9%) |
| 75 Years and over | 57 (4.3%) | 262 (13.5%) |
Disability Class: Cognitive Difficulty
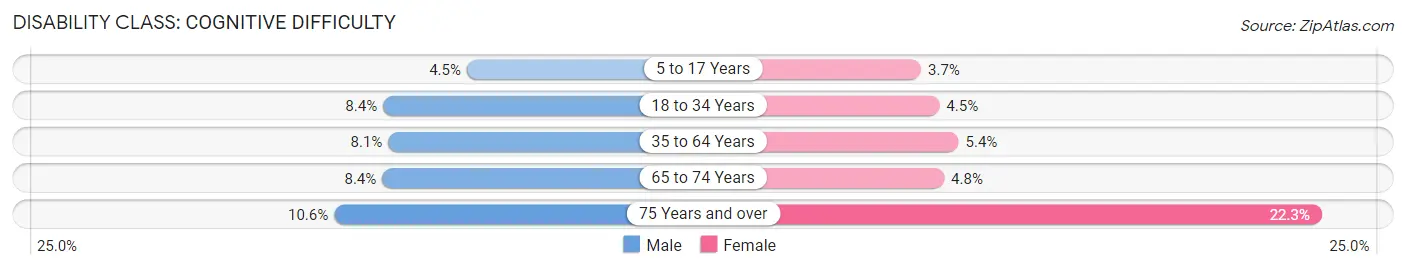
| Age Bracket | Male | Female |
| 5 to 17 Years | 219 (4.5%) | 184 (3.7%) |
| 18 to 34 Years | 455 (8.4%) | 249 (4.5%) |
| 35 to 64 Years | 754 (8.1%) | 545 (5.4%) |
| 65 to 74 Years | 177 (8.4%) | 121 (4.8%) |
| 75 Years and over | 142 (10.6%) | 432 (22.3%) |
Disability Class: Ambulatory Difficulty
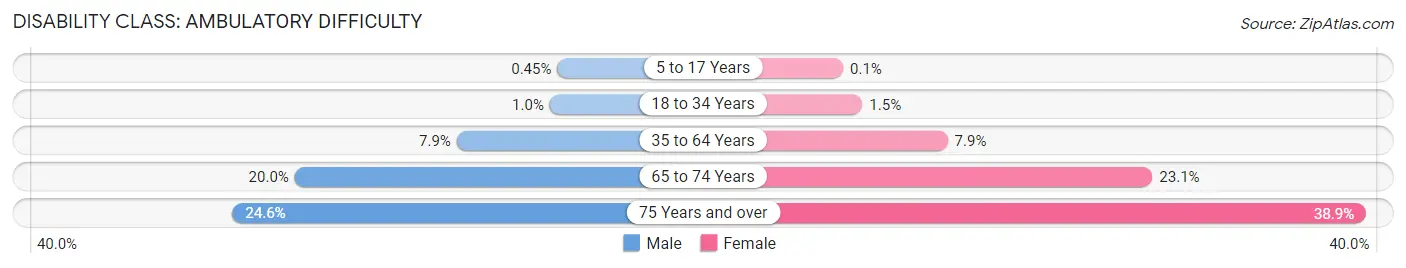
| Age Bracket | Male | Female |
| 5 to 17 Years | 22 (0.4%) | 5 (0.1%) |
| 18 to 34 Years | 55 (1.0%) | 84 (1.5%) |
| 35 to 64 Years | 735 (7.9%) | 790 (7.9%) |
| 65 to 74 Years | 420 (20.0%) | 588 (23.1%) |
| 75 Years and over | 328 (24.6%) | 755 (38.9%) |
Disability Class: Self-Care Difficulty
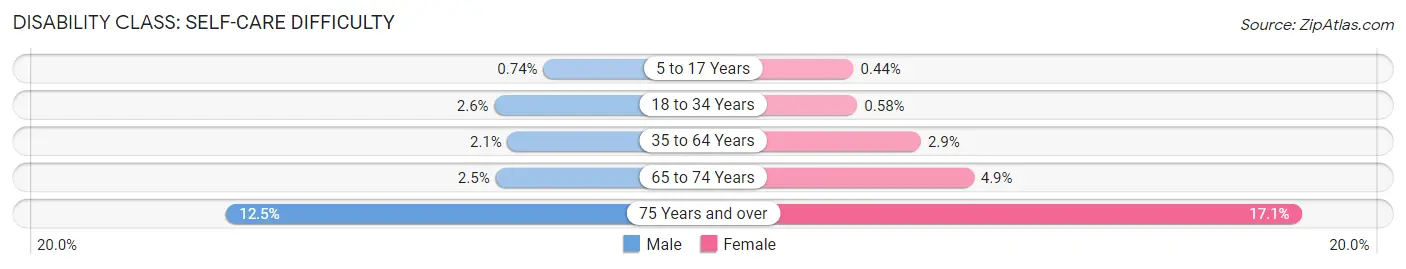
| Age Bracket | Male | Female |
| 5 to 17 Years | 36 (0.7%) | 22 (0.4%) |
| 18 to 34 Years | 139 (2.6%) | 32 (0.6%) |
| 35 to 64 Years | 192 (2.1%) | 296 (2.9%) |
| 65 to 74 Years | 53 (2.5%) | 125 (4.9%) |
| 75 Years and over | 167 (12.5%) | 331 (17.1%) |
Technology Access in Battle Creek
Computing Device Access in Battle Creek
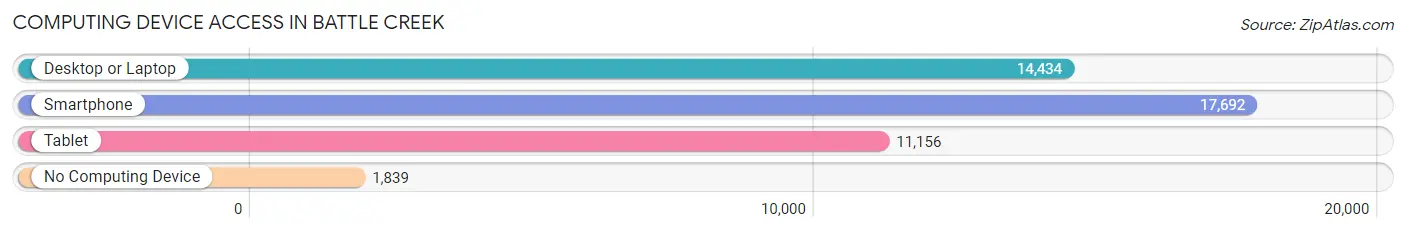
| Device Type | # Households | % Households |
| Desktop or Laptop | 14,434 | 68.3% |
| Smartphone | 17,692 | 83.7% |
| Tablet | 11,156 | 52.8% |
| No Computing Device | 1,839 | 8.7% |
| Total | 21,140 | 100.0% |
Internet Access in Battle Creek
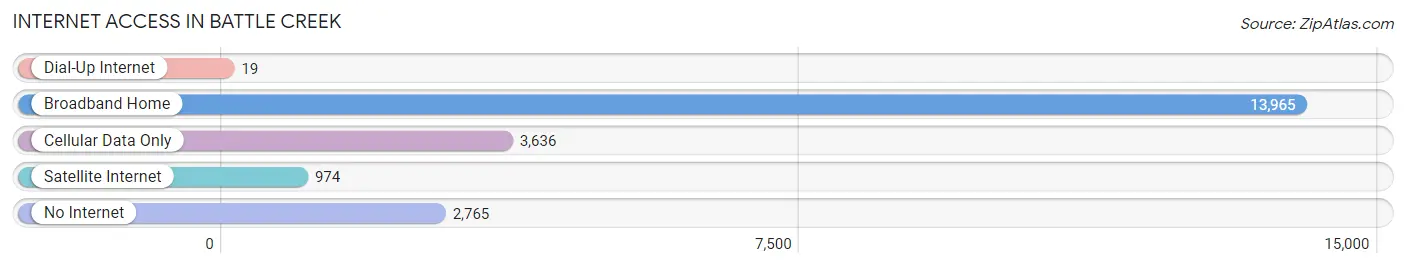
| Internet Type | # Households | % Households |
| Dial-Up Internet | 19 | 0.1% |
| Broadband Home | 13,965 | 66.1% |
| Cellular Data Only | 3,636 | 17.2% |
| Satellite Internet | 974 | 4.6% |
| No Internet | 2,765 | 13.1% |
| Total | 21,140 | 100.0% |
Battle Creek Summary
History
The city of Battle Creek, Michigan is located in the south-central portion of the state, approximately 90 miles west of Detroit. It is the county seat of Calhoun County and is situated along the Kalamazoo River. The city was founded in 1831 by a group of settlers led by Major John D. Pierce and was originally known as “The Post”. The name was changed to Battle Creek in 1836 after a skirmish between local Native Americans and settlers.
The city was an important stop on the Underground Railroad and was home to several abolitionists, including Sojourner Truth. During the Civil War, Battle Creek was a major supplier of food and other supplies to the Union Army. After the war, the city experienced a period of rapid growth and development, becoming an important industrial center.
The city was home to the first cereal factory in the world, the Battle Creek Toasted Corn Flake Company, which was founded in 1906 by Dr. John Harvey Kellogg. The company, now known as the Kellogg Company, is still headquartered in Battle Creek and is one of the city’s largest employers.
In the late 19th and early 20th centuries, Battle Creek was a popular tourist destination, known for its mineral springs and health spas. The city was also home to the Battle Creek Sanitarium, a health resort founded by Dr. John Harvey Kellogg in 1866. The sanitarium was a popular destination for celebrities and other wealthy individuals seeking health treatments.
Geography
Battle Creek is located in south-central Michigan, approximately 90 miles west of Detroit. The city is situated along the Kalamazoo River and is surrounded by several small lakes and ponds. The city has a total area of 16.3 square miles, of which 15.9 square miles is land and 0.4 square miles is water.
The city has a humid continental climate, with cold, snowy winters and hot, humid summers. The average annual temperature is 48°F, with an average high of 68°F in July and an average low of 28°F in January. The average annual precipitation is 33.3 inches, with an average of 43.3 inches of snowfall per year.
Economy
Battle Creek’s economy is largely based on manufacturing and healthcare. The city is home to several large employers, including the Kellogg Company, Denso Manufacturing, and Bronson Healthcare Group. The city is also home to several smaller businesses, including restaurants, retail stores, and service providers.
The city’s unemployment rate was 4.2% in 2019, slightly lower than the national average of 3.7%. The median household income in Battle Creek was $41,845 in 2019, slightly lower than the national median of $61,937.
Demographics
As of 2019, the population of Battle Creek was 52,347, making it the second-largest city in Calhoun County. The city has a population density of 3,200 people per square mile. The racial makeup of the city is 79.2% White, 14.2% African American, 2.2% Hispanic or Latino, 1.7% Asian, and 2.7% other.
The median age in Battle Creek is 37.3 years, slightly lower than the national median of 38.2 years. The city’s population is fairly evenly split between males and females, with 50.3% of the population being male and 49.7% being female. The city’s population is also fairly evenly split between married and unmarried individuals, with 48.3% of the population being married and 51.7% being unmarried.
Common Questions
What is Per Capita Income in Battle Creek?
Per Capita income in Battle Creek is $28,689.
What is the Median Family Income in Battle Creek?
Median Family Income in Battle Creek is $67,665.
What is the Median Household income in Battle Creek?
Median Household Income in Battle Creek is $49,684.
What is Income or Wage Gap in Battle Creek?
Income or Wage Gap in Battle Creek is 16.7%.
Women in Battle Creek earn 83.3 cents for every dollar earned by a man.
What is Family Income Deficit in Battle Creek?
Family Income Deficit in Battle Creek is $10,323.
Families that are below poverty line in Battle Creek earn $10,323 less on average than the poverty threshold level.
What is Inequality or Gini Index in Battle Creek?
Inequality or Gini Index in Battle Creek is 0.45.
What is the Total Population of Battle Creek?
Total Population of Battle Creek is 52,469.
What is the Total Male Population of Battle Creek?
Total Male Population of Battle Creek is 25,531.
What is the Total Female Population of Battle Creek?
Total Female Population of Battle Creek is 26,938.
What is the Ratio of Males per 100 Females in Battle Creek?
There are 94.78 Males per 100 Females in Battle Creek.
What is the Ratio of Females per 100 Males in Battle Creek?
There are 105.51 Females per 100 Males in Battle Creek.
What is the Median Population Age in Battle Creek?
Median Population Age in Battle Creek is 37.0 Years.
What is the Average Family Size in Battle Creek
Average Family Size in Battle Creek is 3.2 People.
What is the Average Household Size in Battle Creek
Average Household Size in Battle Creek is 2.4 People.
How Large is the Labor Force in Battle Creek?
There are 25,307 People in the Labor Forcein in Battle Creek.
What is the Percentage of People in the Labor Force in Battle Creek?
61.7% of People are in the Labor Force in Battle Creek.
What is the Unemployment Rate in Battle Creek?
Unemployment Rate in Battle Creek is 7.6%.