Carlton, GA Map & Demographics
Carlton Map
Carlton Overview
$17,897
PER CAPITA INCOME
$48,750
AVG FAMILY INCOME
$43,409
AVG HOUSEHOLD INCOME
0.37
INEQUALITY / GINI INDEX
403
TOTAL POPULATION
224
MALE POPULATION
179
FEMALE POPULATION
125.14
MALES / 100 FEMALES
79.91
FEMALES / 100 MALES
34.1
MEDIAN AGE
4.1
AVG FAMILY SIZE
3.7
AVG HOUSEHOLD SIZE
154
LABOR FORCE [ PEOPLE ]
44.3%
PERCENT IN LABOR FORCE
13.0%
UNEMPLOYMENT RATE
Carlton Zip Codes
Carlton Area Codes
Income in Carlton
Income Overview in Carlton
Per Capita Income in Carlton is $17,897, while median incomes of families and households are $48,750 and $43,409 respectively.
| Characteristic | Number | Measure |
| Per Capita Income | 403 | $17,897 |
| Median Family Income | 86 | $48,750 |
| Mean Family Income | 86 | $62,988 |
| Median Household Income | 110 | $43,409 |
| Mean Household Income | 110 | $57,929 |
| Income Deficit | 86 | $0 |
| Wage / Income Gap (%) | 403 | 0.00% |
| Wage / Income Gap ($) | 403 | 100.00¢ per $1 |
| Gini / Inequality Index | 403 | 0.37 |
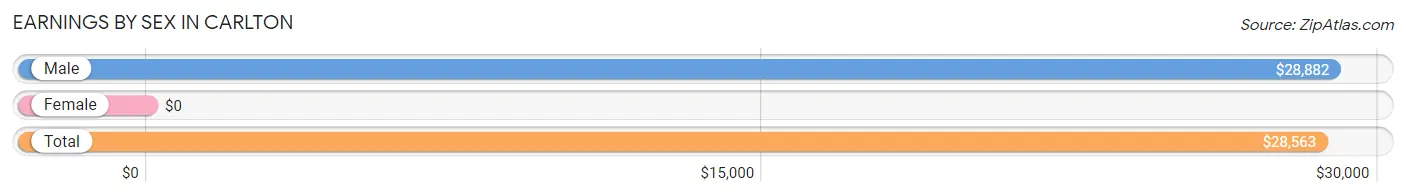
Earnings by Sex in Carlton
| Sex | Number | Average Earnings |
| Male | 89 (62.2%) | $28,882 |
| Female | 54 (37.8%) | $0 |
| Total | 143 (100.0%) | $28,563 |
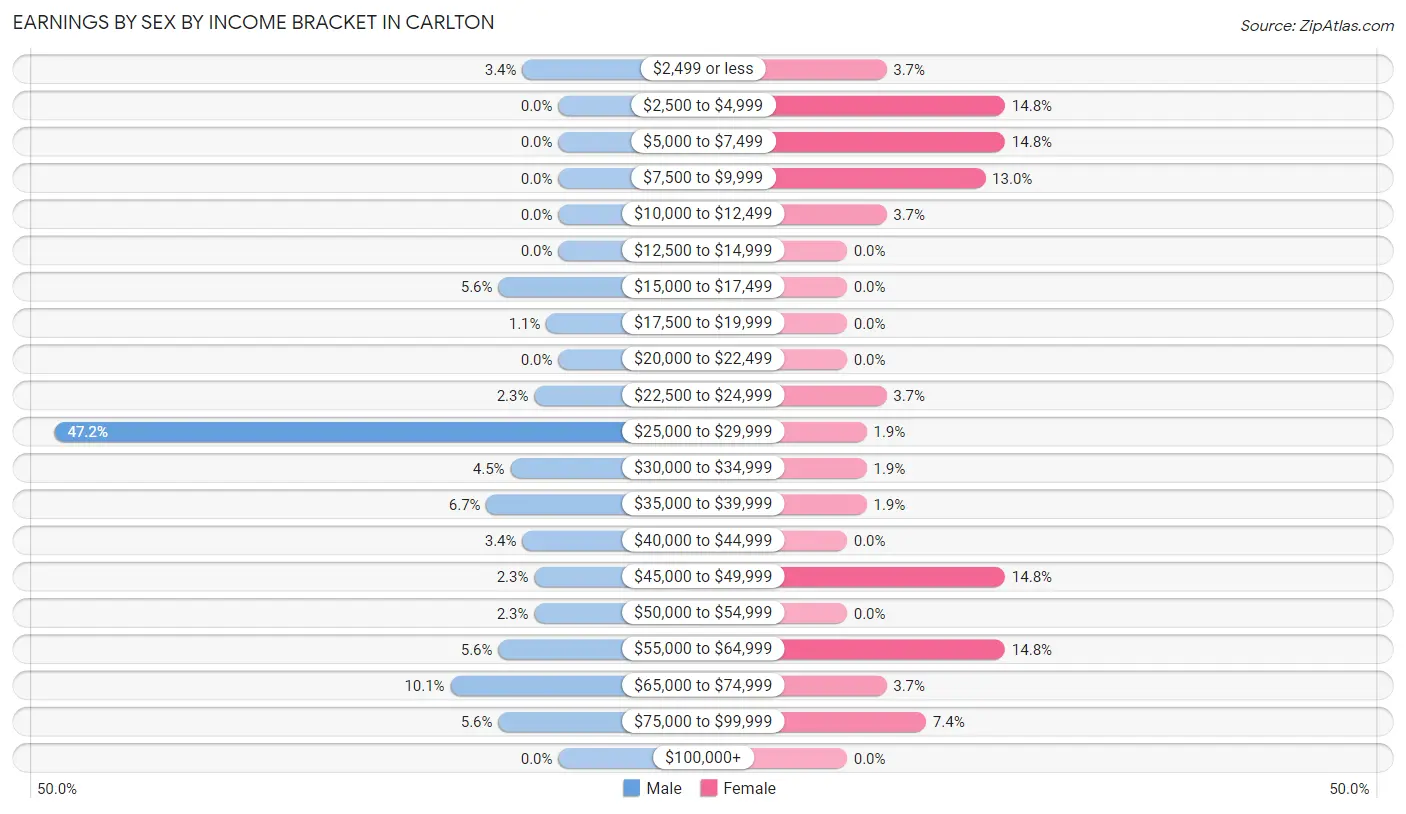
Earnings by Sex by Income Bracket in Carlton
The most common earnings brackets in Carlton are $25,000 to $29,999 for men (42 | 47.2%) and $2,500 to $4,999 for women (8 | 14.8%).
| Income | Male | Female |
| $2,499 or less | 3 (3.4%) | 2 (3.7%) |
| $2,500 to $4,999 | 0 (0.0%) | 8 (14.8%) |
| $5,000 to $7,499 | 0 (0.0%) | 8 (14.8%) |
| $7,500 to $9,999 | 0 (0.0%) | 7 (13.0%) |
| $10,000 to $12,499 | 0 (0.0%) | 2 (3.7%) |
| $12,500 to $14,999 | 0 (0.0%) | 0 (0.0%) |
| $15,000 to $17,499 | 5 (5.6%) | 0 (0.0%) |
| $17,500 to $19,999 | 1 (1.1%) | 0 (0.0%) |
| $20,000 to $22,499 | 0 (0.0%) | 0 (0.0%) |
| $22,500 to $24,999 | 2 (2.2%) | 2 (3.7%) |
| $25,000 to $29,999 | 42 (47.2%) | 1 (1.8%) |
| $30,000 to $34,999 | 4 (4.5%) | 1 (1.8%) |
| $35,000 to $39,999 | 6 (6.7%) | 1 (1.8%) |
| $40,000 to $44,999 | 3 (3.4%) | 0 (0.0%) |
| $45,000 to $49,999 | 2 (2.2%) | 8 (14.8%) |
| $50,000 to $54,999 | 2 (2.2%) | 0 (0.0%) |
| $55,000 to $64,999 | 5 (5.6%) | 8 (14.8%) |
| $65,000 to $74,999 | 9 (10.1%) | 2 (3.7%) |
| $75,000 to $99,999 | 5 (5.6%) | 4 (7.4%) |
| $100,000+ | 0 (0.0%) | 0 (0.0%) |
| Total | 89 (100.0%) | 54 (100.0%) |
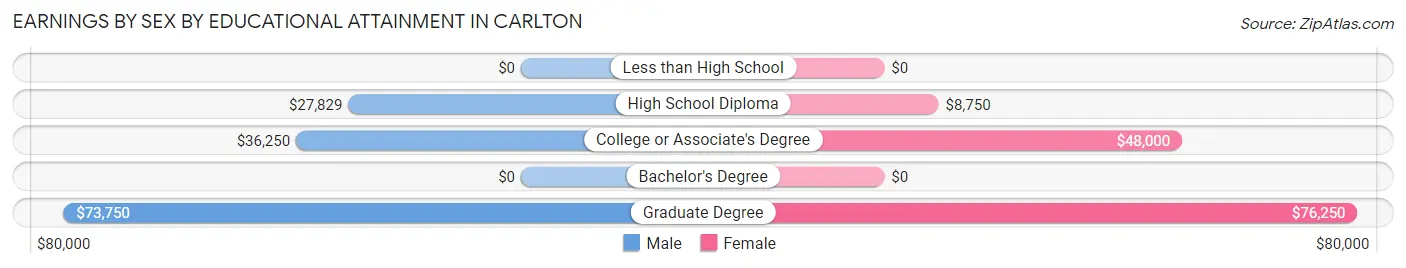
Earnings by Sex by Educational Attainment in Carlton
Average earnings in Carlton are $29,013 for men and $45,417 for women, a difference of 36.1%. Men with an educational attainment of graduate degree enjoy the highest average annual earnings of $73,750, while those with high school diploma education earn the least with $27,829. Women with an educational attainment of graduate degree earn the most with the average annual earnings of $76,250, while those with high school diploma education have the smallest earnings of $8,750.
| Educational Attainment | Male Income | Female Income |
| Less than High School | - | - |
| High School Diploma | $27,829 | $8,750 |
| College or Associate's Degree | $36,250 | $48,000 |
| Bachelor's Degree | - | - |
| Graduate Degree | $73,750 | $76,250 |
| Total | $29,013 | $45,417 |
Family Income in Carlton
Family Income Brackets in Carlton
According to the Carlton family income data, there are 25 families falling into the $25,000 to $34,999 income range, which is the most common income bracket and makes up 29.1% of all families. Conversely, the $10,000 to $14,999 income bracket is the least frequent group with only 1 families (1.2%) belonging to this category.
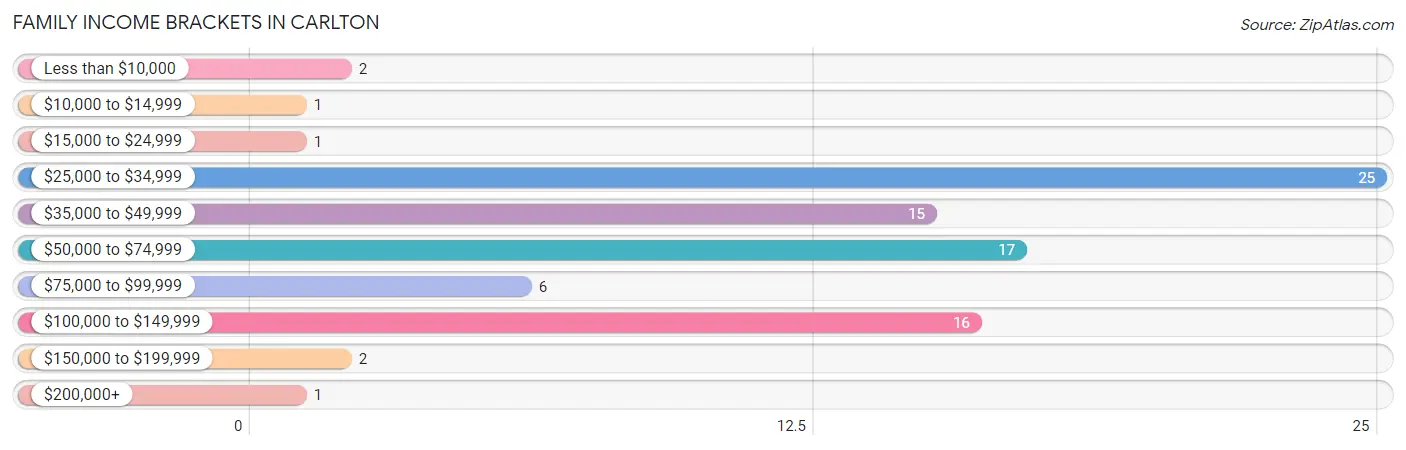
| Income Bracket | # Families | % Families |
| Less than $10,000 | 2 | 2.3% |
| $10,000 to $14,999 | 1 | 1.2% |
| $15,000 to $24,999 | 1 | 1.2% |
| $25,000 to $34,999 | 25 | 29.1% |
| $35,000 to $49,999 | 15 | 17.4% |
| $50,000 to $74,999 | 17 | 19.8% |
| $75,000 to $99,999 | 6 | 7.0% |
| $100,000 to $149,999 | 16 | 18.6% |
| $150,000 to $199,999 | 2 | 2.3% |
| $200,000+ | 1 | 1.2% |
Family Income by Famaliy Size in Carlton
3-person families (12 | 14.0%) account for the highest median family income in Carlton with $115,500 per family, while 3-person families (12 | 14.0%) have the highest median income of $38,500 per family member.
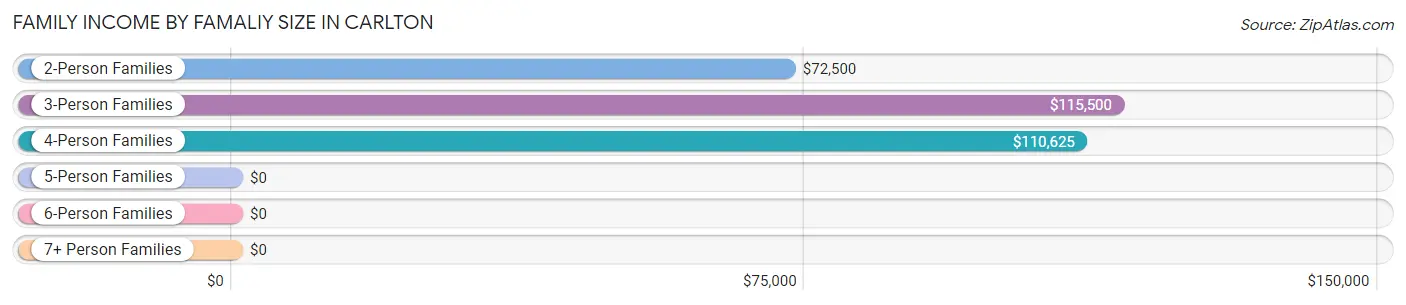
| Income Bracket | # Families | Median Income |
| 2-Person Families | 26 (30.2%) | $72,500 |
| 3-Person Families | 12 (14.0%) | $115,500 |
| 4-Person Families | 9 (10.5%) | $110,625 |
| 5-Person Families | 33 (38.4%) | $0 |
| 6-Person Families | 5 (5.8%) | $0 |
| 7+ Person Families | 1 (1.2%) | $0 |
| Total | 86 (100.0%) | $48,750 |
Family Income by Number of Earners in Carlton
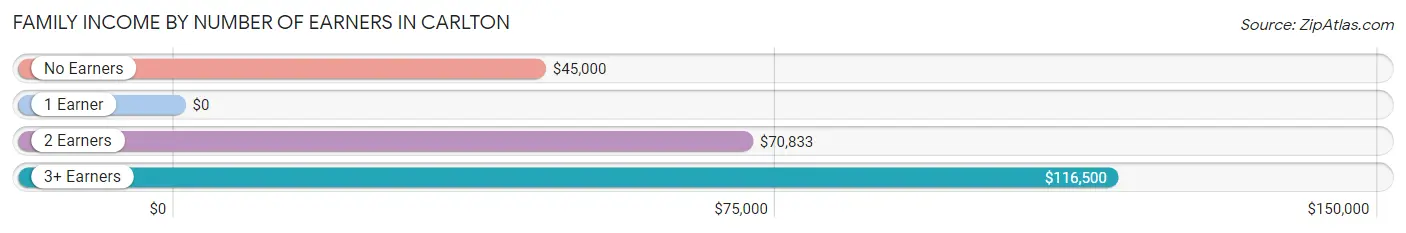
| Number of Earners | # Families | Median Income |
| No Earners | 16 (18.6%) | $45,000 |
| 1 Earner | 40 (46.5%) | $0 |
| 2 Earners | 20 (23.3%) | $70,833 |
| 3+ Earners | 10 (11.6%) | $116,500 |
| Total | 86 (100.0%) | $48,750 |
Household Income in Carlton
Household Income Brackets in Carlton
With 37 households falling in the category, the $25,000 to $34,999 income range is the most frequent in Carlton, accounting for 33.6% of all households.
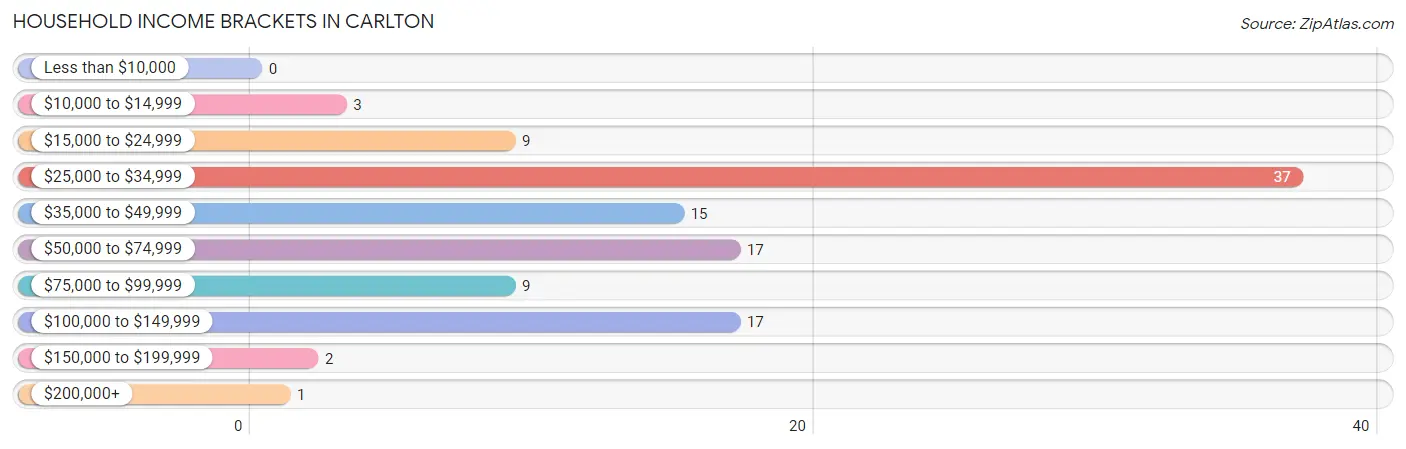
| Income Bracket | # Households | % Households |
| Less than $10,000 | 0 | 0.0% |
| $10,000 to $14,999 | 3 | 2.7% |
| $15,000 to $24,999 | 9 | 8.2% |
| $25,000 to $34,999 | 37 | 33.6% |
| $35,000 to $49,999 | 15 | 13.6% |
| $50,000 to $74,999 | 17 | 15.5% |
| $75,000 to $99,999 | 9 | 8.2% |
| $100,000 to $149,999 | 17 | 15.5% |
| $150,000 to $199,999 | 2 | 1.8% |
| $200,000+ | 1 | 0.9% |
Household Income by Householder Age in Carlton
The median household income in Carlton is $43,409, with the highest median household income of $118,125 found in the 25 to 44 years age bracket for the primary householder. A total of 9 households (8.2%) fall into this category. Meanwhile, the 65+ years age bracket for the primary householder has the lowest median household income of $29,861, with 33 households (30.0%) in this group.
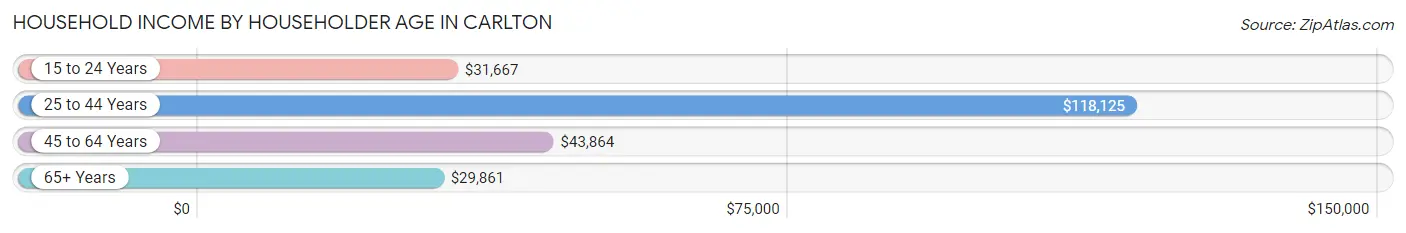
| Income Bracket | # Households | Median Income |
| 15 to 24 Years | 4 (3.6%) | $31,667 |
| 25 to 44 Years | 9 (8.2%) | $118,125 |
| 45 to 64 Years | 64 (58.2%) | $43,864 |
| 65+ Years | 33 (30.0%) | $29,861 |
| Total | 110 (100.0%) | $43,409 |
Poverty in Carlton
Income Below Poverty by Sex and Age in Carlton
With 48.7% poverty level for males and 20.7% for females among the residents of Carlton, 12 to 14 year old males and 45 to 54 year old females are the most vulnerable to poverty, with 2 males (100.0%) and 22 females (46.8%) in their respective age groups living below the poverty level.
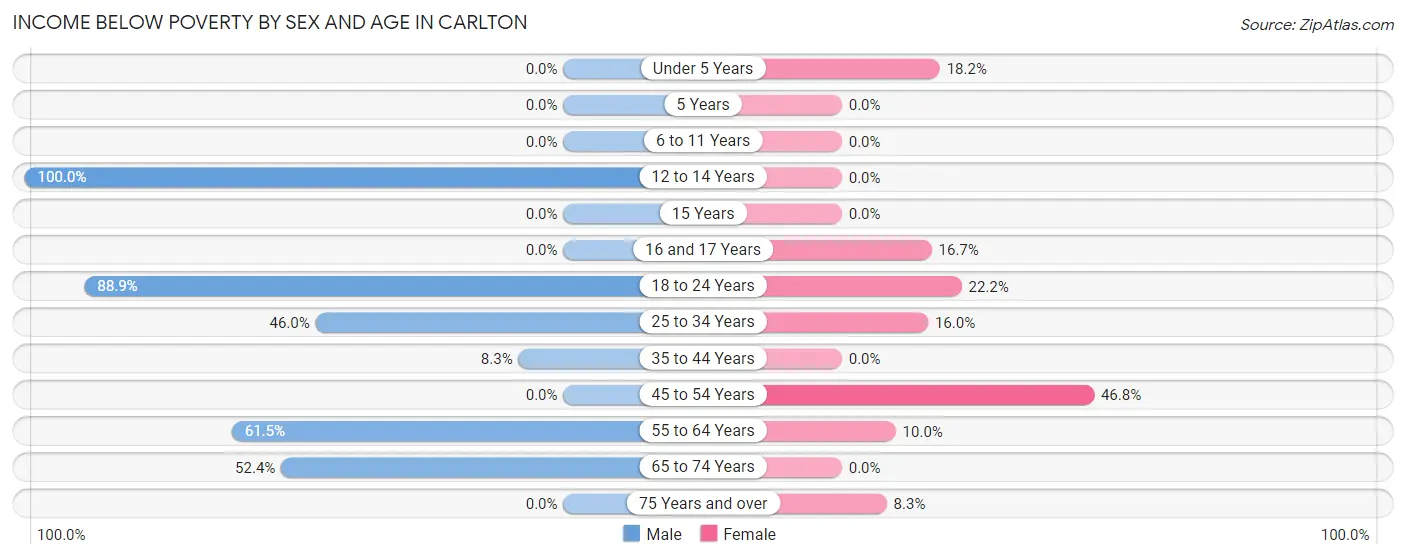
| Age Bracket | Male | Female |
| Under 5 Years | 0 (0.0%) | 4 (18.2%) |
| 5 Years | 0 (0.0%) | 0 (0.0%) |
| 6 to 11 Years | 0 (0.0%) | 0 (0.0%) |
| 12 to 14 Years | 2 (100.0%) | 0 (0.0%) |
| 15 Years | 0 (0.0%) | 0 (0.0%) |
| 16 and 17 Years | 0 (0.0%) | 2 (16.7%) |
| 18 to 24 Years | 48 (88.9%) | 2 (22.2%) |
| 25 to 34 Years | 23 (46.0%) | 4 (16.0%) |
| 35 to 44 Years | 1 (8.3%) | 0 (0.0%) |
| 45 to 54 Years | 0 (0.0%) | 22 (46.8%) |
| 55 to 64 Years | 24 (61.5%) | 2 (10.0%) |
| 65 to 74 Years | 11 (52.4%) | 0 (0.0%) |
| 75 Years and over | 0 (0.0%) | 1 (8.3%) |
| Total | 109 (48.7%) | 37 (20.7%) |
Income Above Poverty by Sex and Age in Carlton
According to the poverty statistics in Carlton, males aged under 5 years and females aged 6 to 11 years are the age groups that are most secure financially, with 100.0% of males and 100.0% of females in these age groups living above the poverty line.
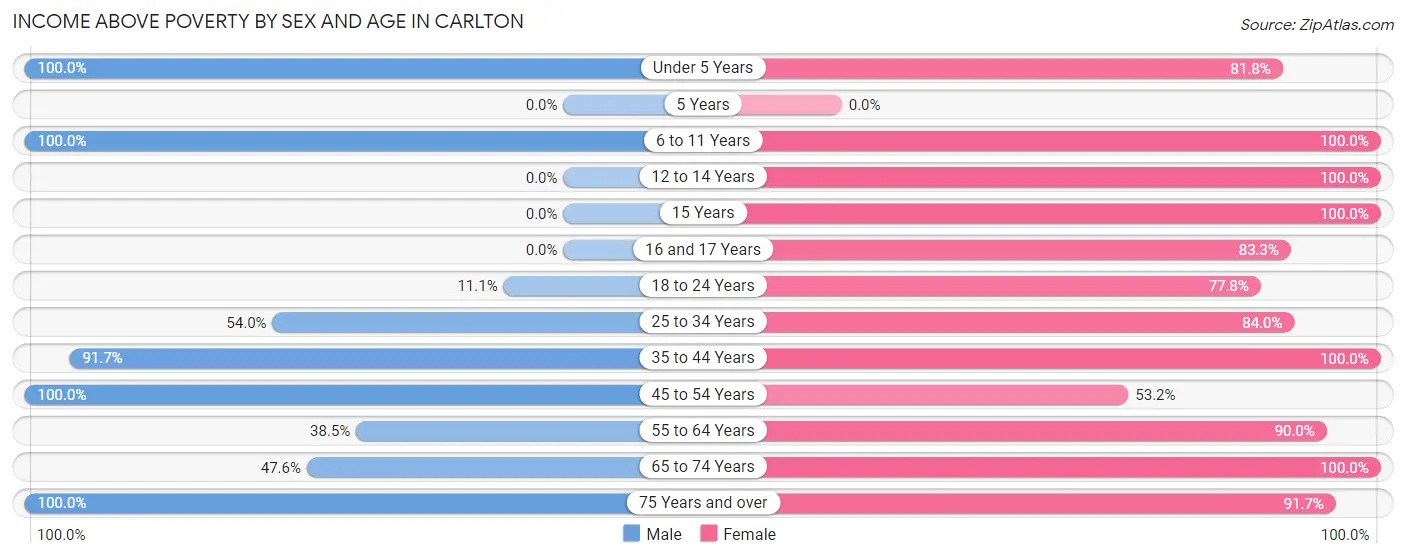
| Age Bracket | Male | Female |
| Under 5 Years | 10 (100.0%) | 18 (81.8%) |
| 5 Years | 0 (0.0%) | 0 (0.0%) |
| 6 to 11 Years | 13 (100.0%) | 4 (100.0%) |
| 12 to 14 Years | 0 (0.0%) | 2 (100.0%) |
| 15 Years | 0 (0.0%) | 2 (100.0%) |
| 16 and 17 Years | 0 (0.0%) | 10 (83.3%) |
| 18 to 24 Years | 6 (11.1%) | 7 (77.8%) |
| 25 to 34 Years | 27 (54.0%) | 21 (84.0%) |
| 35 to 44 Years | 11 (91.7%) | 9 (100.0%) |
| 45 to 54 Years | 21 (100.0%) | 25 (53.2%) |
| 55 to 64 Years | 15 (38.5%) | 18 (90.0%) |
| 65 to 74 Years | 10 (47.6%) | 15 (100.0%) |
| 75 Years and over | 2 (100.0%) | 11 (91.7%) |
| Total | 115 (51.3%) | 142 (79.3%) |
Income Below Poverty Among Married-Couple Families in Carlton
The poverty statistics for married-couple families in Carlton show that 33.8% or 23 of the total 68 families live below the poverty line. Families with no children have the highest poverty rate of 45.8%, comprising of 22 families. On the other hand, families with 3 or 4 children have the lowest poverty rate of 0.0%, which includes 0 families.
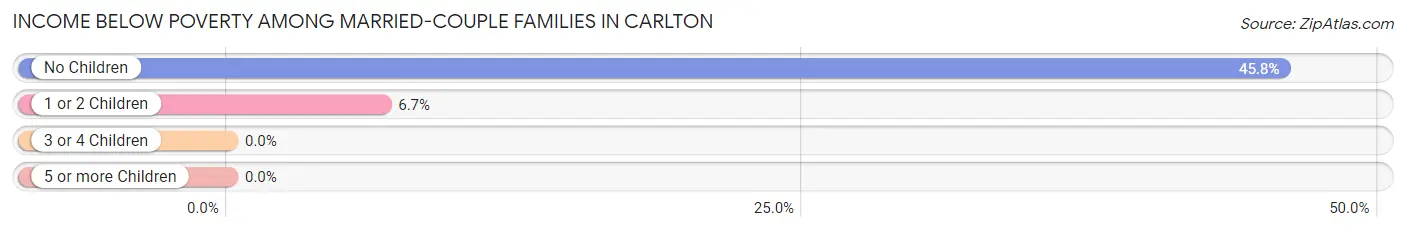
| Children | Above Poverty | Below Poverty |
| No Children | 26 (54.2%) | 22 (45.8%) |
| 1 or 2 Children | 14 (93.3%) | 1 (6.7%) |
| 3 or 4 Children | 5 (100.0%) | 0 (0.0%) |
| 5 or more Children | 0 (0.0%) | 0 (0.0%) |
| Total | 45 (66.2%) | 23 (33.8%) |
Income Below Poverty Among Single-Parent Households in Carlton
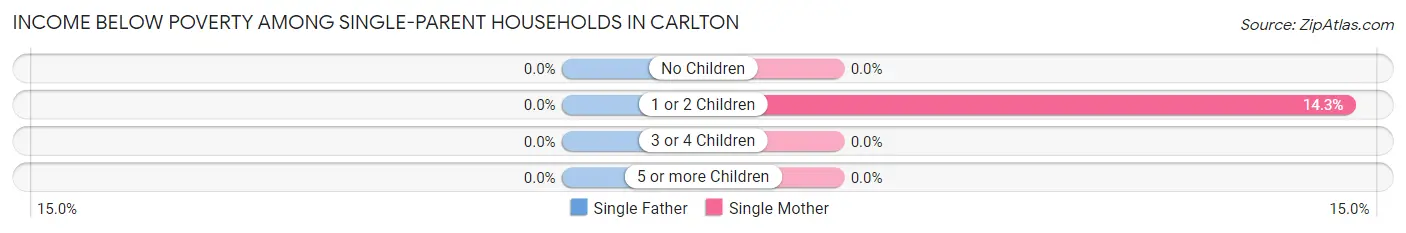
| Children | Single Father | Single Mother |
| No Children | 0 (0.0%) | 0 (0.0%) |
| 1 or 2 Children | 0 (0.0%) | 2 (14.3%) |
| 3 or 4 Children | 0 (0.0%) | 0 (0.0%) |
| 5 or more Children | 0 (0.0%) | 0 (0.0%) |
| Total | 0 (0.0%) | 2 (13.3%) |
Income Below Poverty Among Married-Couple vs Single-Parent Households in Carlton
The poverty data for Carlton shows that 23 of the married-couple family households (33.8%) and 2 of the single-parent households (11.1%) are living below the poverty level. Within the married-couple family households, those with no children have the highest poverty rate, with 22 households (45.8%) falling below the poverty line. Among the single-parent households, those with 1 or 2 children have the highest poverty rate, with 2 household (11.8%) living below poverty.
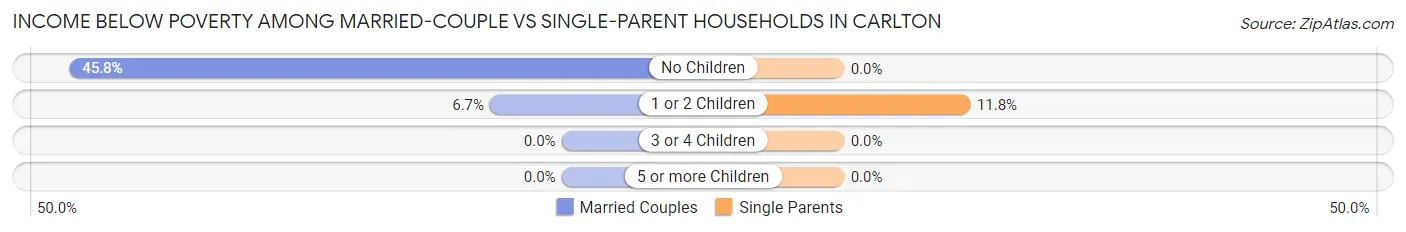
| Children | Married-Couple Families | Single-Parent Households |
| No Children | 22 (45.8%) | 0 (0.0%) |
| 1 or 2 Children | 1 (6.7%) | 2 (11.8%) |
| 3 or 4 Children | 0 (0.0%) | 0 (0.0%) |
| 5 or more Children | 0 (0.0%) | 0 (0.0%) |
| Total | 23 (33.8%) | 2 (11.1%) |
Race in Carlton
The most populous races in Carlton are White / Caucasian (199 | 49.4%), Asian (116 | 28.8%), and Black / African American (73 | 18.1%).
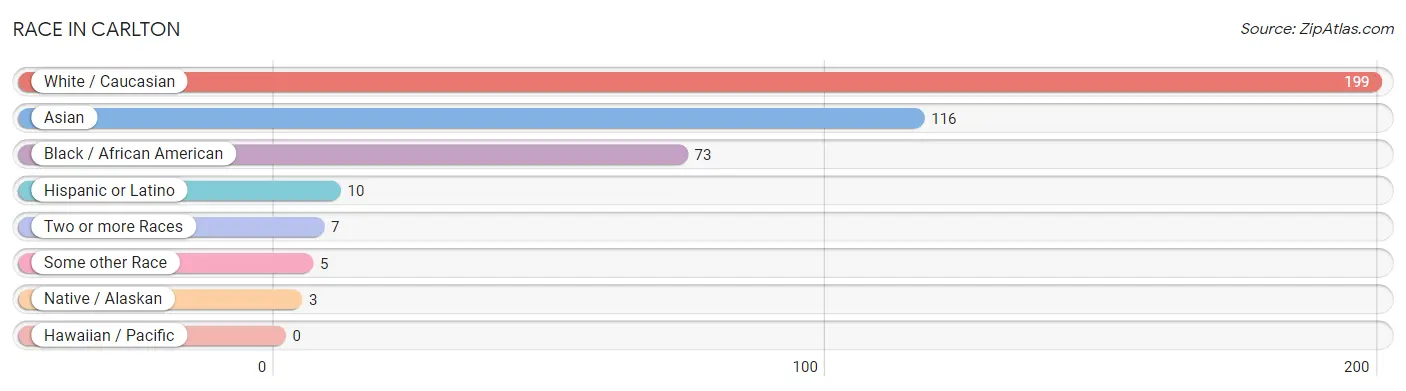
| Race | # Population | % Population |
| Asian | 116 | 28.8% |
| Black / African American | 73 | 18.1% |
| Hawaiian / Pacific | 0 | 0.0% |
| Hispanic or Latino | 10 | 2.5% |
| Native / Alaskan | 3 | 0.7% |
| White / Caucasian | 199 | 49.4% |
| Two or more Races | 7 | 1.7% |
| Some other Race | 5 | 1.2% |
| Total | 403 | 100.0% |
Ancestry in Carlton
The most populous ancestries reported in Carlton are Indonesian (116 | 28.8%), Finnish (23 | 5.7%), German (22 | 5.5%), American (20 | 5.0%), and Irish (19 | 4.7%), together accounting for 49.6% of all Carlton residents.
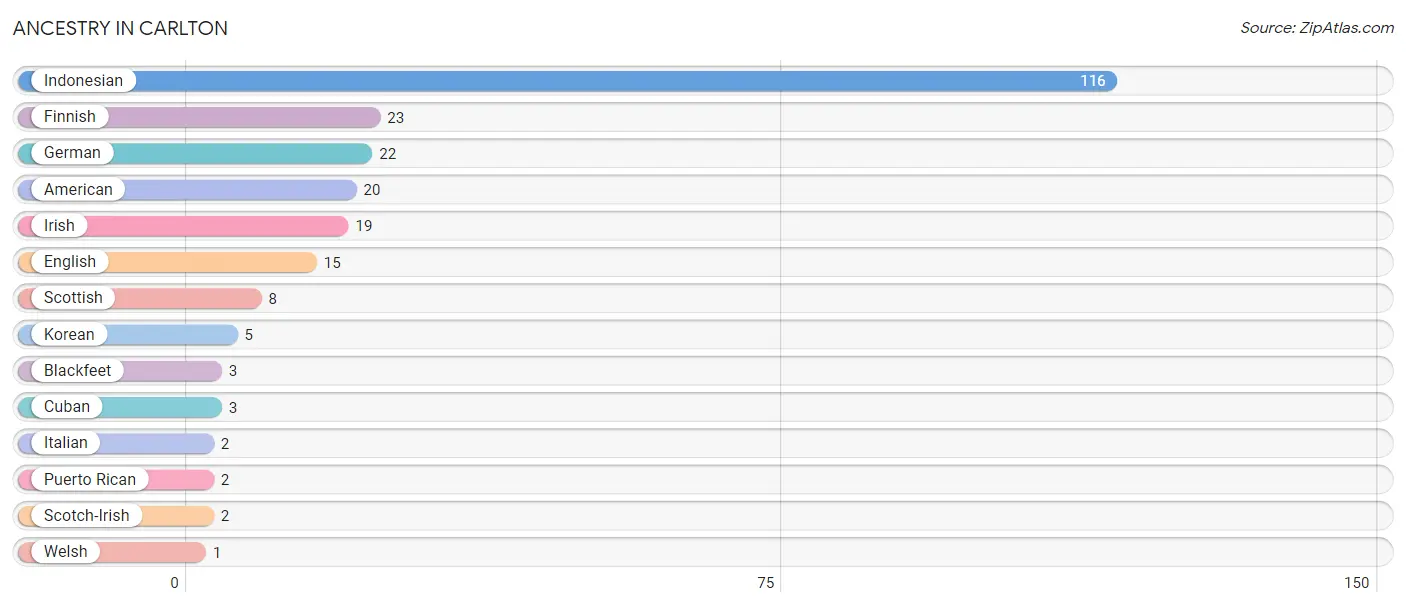
| Ancestry | # Population | % Population |
| American | 20 | 5.0% |
| Blackfeet | 3 | 0.7% |
| Cuban | 3 | 0.7% |
| English | 15 | 3.7% |
| Finnish | 23 | 5.7% |
| German | 22 | 5.5% |
| Indonesian | 116 | 28.8% |
| Irish | 19 | 4.7% |
| Italian | 2 | 0.5% |
| Korean | 5 | 1.2% |
| Puerto Rican | 2 | 0.5% |
| Scotch-Irish | 2 | 0.5% |
| Scottish | 8 | 2.0% |
| Welsh | 1 | 0.3% | View All 14 Rows |
Immigrants in Carlton
The most numerous immigrant groups reported in Carlton came from Asia (116 | 28.8%), South Eastern Asia (116 | 28.8%), Thailand (71 | 17.6%), Europe (4 | 1.0%), and Germany (4 | 1.0%), together accounting for 77.2% of all Carlton residents.
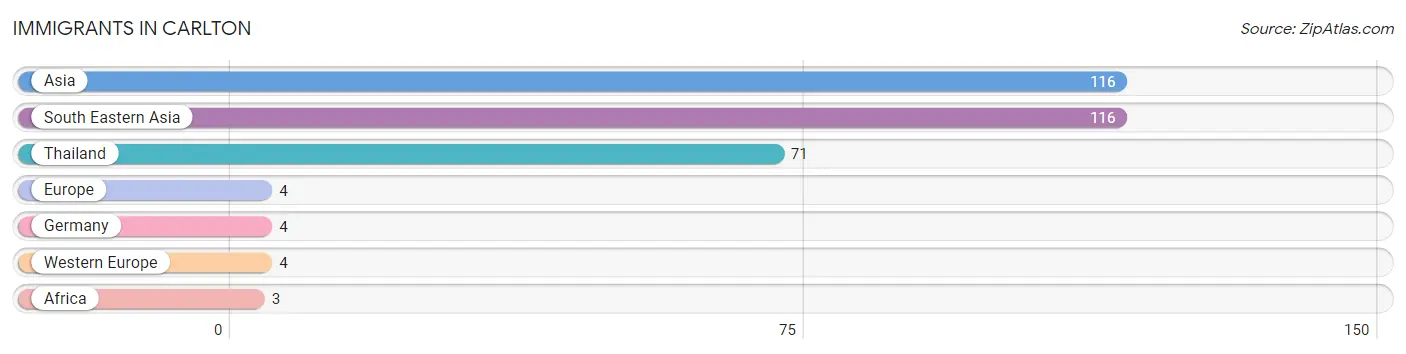
| Immigration Origin | # Population | % Population |
| Africa | 3 | 0.7% |
| Asia | 116 | 28.8% |
| Europe | 4 | 1.0% |
| Germany | 4 | 1.0% |
| South Eastern Asia | 116 | 28.8% |
| Thailand | 71 | 17.6% |
| Western Europe | 4 | 1.0% | View All 7 Rows |
Sex and Age in Carlton
Sex and Age in Carlton
The most populous age groups in Carlton are 60 to 64 Years (38 | 17.0%) for men and 50 to 54 Years (25 | 14.0%) for women.
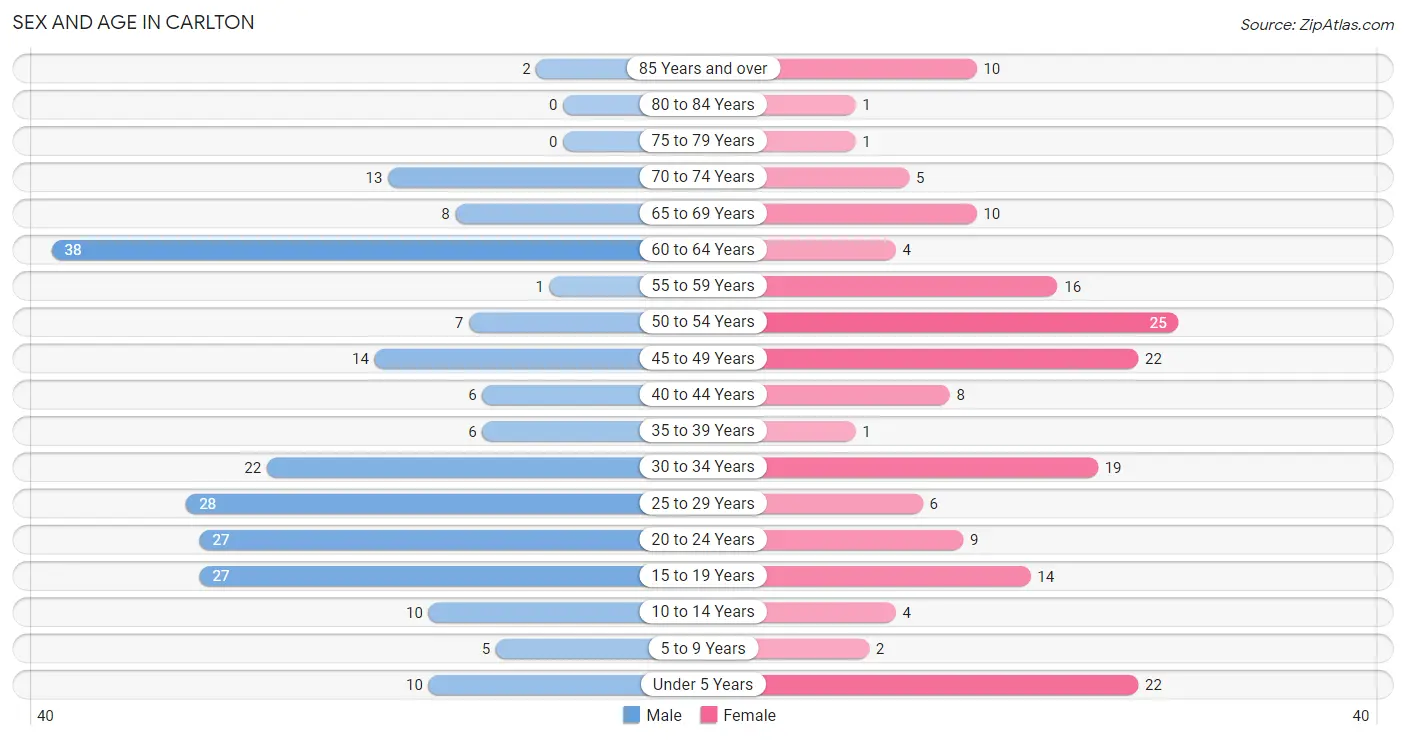
| Age Bracket | Male | Female |
| Under 5 Years | 10 (4.5%) | 22 (12.3%) |
| 5 to 9 Years | 5 (2.2%) | 2 (1.1%) |
| 10 to 14 Years | 10 (4.5%) | 4 (2.2%) |
| 15 to 19 Years | 27 (12.0%) | 14 (7.8%) |
| 20 to 24 Years | 27 (12.0%) | 9 (5.0%) |
| 25 to 29 Years | 28 (12.5%) | 6 (3.4%) |
| 30 to 34 Years | 22 (9.8%) | 19 (10.6%) |
| 35 to 39 Years | 6 (2.7%) | 1 (0.6%) |
| 40 to 44 Years | 6 (2.7%) | 8 (4.5%) |
| 45 to 49 Years | 14 (6.2%) | 22 (12.3%) |
| 50 to 54 Years | 7 (3.1%) | 25 (14.0%) |
| 55 to 59 Years | 1 (0.4%) | 16 (8.9%) |
| 60 to 64 Years | 38 (17.0%) | 4 (2.2%) |
| 65 to 69 Years | 8 (3.6%) | 10 (5.6%) |
| 70 to 74 Years | 13 (5.8%) | 5 (2.8%) |
| 75 to 79 Years | 0 (0.0%) | 1 (0.6%) |
| 80 to 84 Years | 0 (0.0%) | 1 (0.6%) |
| 85 Years and over | 2 (0.9%) | 10 (5.6%) |
| Total | 224 (100.0%) | 179 (100.0%) |
Families and Households in Carlton
Median Family Size in Carlton
The median family size in Carlton is 4.13 persons per family, with single female/mother families (15 | 17.4%) accounting for the largest median family size of 5.4 persons per family. On the other hand, single male/father families (3 | 3.5%) represent the smallest median family size with 3.33 persons per family.
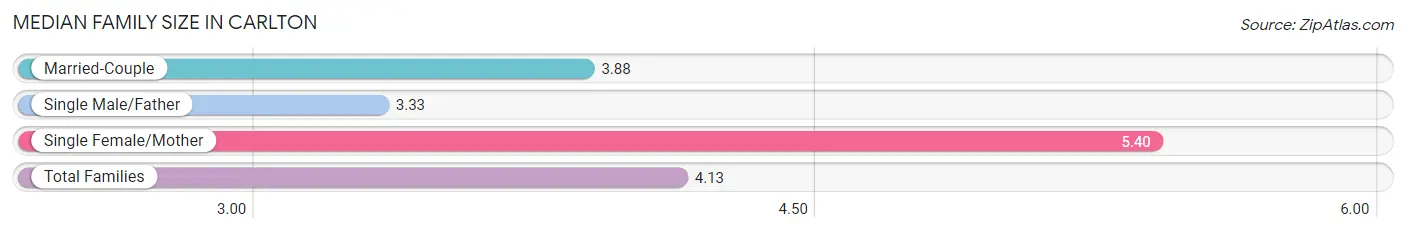
| Family Type | # Families | Family Size |
| Married-Couple | 68 (79.1%) | 3.88 |
| Single Male/Father | 3 (3.5%) | 3.33 |
| Single Female/Mother | 15 (17.4%) | 5.40 |
| Total Families | 86 (100.0%) | 4.13 |
Median Household Size in Carlton
The median household size in Carlton is 3.66 persons per household, with single female/mother households (15 | 13.6%) accounting for the largest median household size of 5.6 persons per household. non-family households (24 | 21.8%) represent the smallest median household size with 1.50 persons per household.
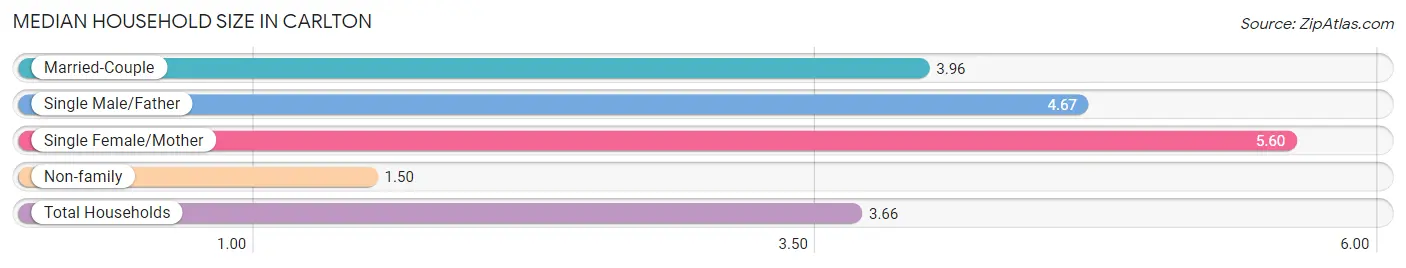
| Household Type | # Households | Household Size |
| Married-Couple | 68 (61.8%) | 3.96 |
| Single Male/Father | 3 (2.7%) | 4.67 |
| Single Female/Mother | 15 (13.6%) | 5.60 |
| Non-family | 24 (21.8%) | 1.50 |
| Total Households | 110 (100.0%) | 3.66 |
Household Size by Marriage Status in Carlton
Out of a total of 110 households in Carlton, 86 (78.2%) are family households, while 24 (21.8%) are nonfamily households. The most numerous type of family households are 5-person households, comprising 33, and the most common type of nonfamily households are 1-person households, comprising 14.
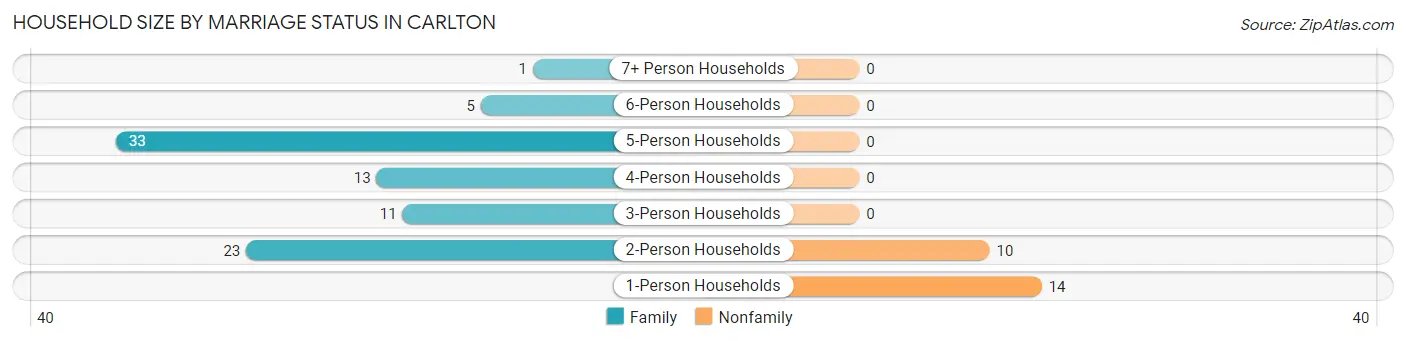
| Household Size | Family Households | Nonfamily Households |
| 1-Person Households | - | 14 (12.7%) |
| 2-Person Households | 23 (20.9%) | 10 (9.1%) |
| 3-Person Households | 11 (10.0%) | 0 (0.0%) |
| 4-Person Households | 13 (11.8%) | 0 (0.0%) |
| 5-Person Households | 33 (30.0%) | 0 (0.0%) |
| 6-Person Households | 5 (4.5%) | 0 (0.0%) |
| 7+ Person Households | 1 (0.9%) | 0 (0.0%) |
| Total | 86 (78.2%) | 24 (21.8%) |
Female Fertility in Carlton
Fertility by Age in Carlton
Average fertility rate in Carlton is 95.0 births per 1,000 women. Women in the age bracket of 20 to 34 years have the highest fertility rate with 235.0 births per 1,000 women. Women in the age bracket of 20 to 34 years acount for 100.0% of all women with births.
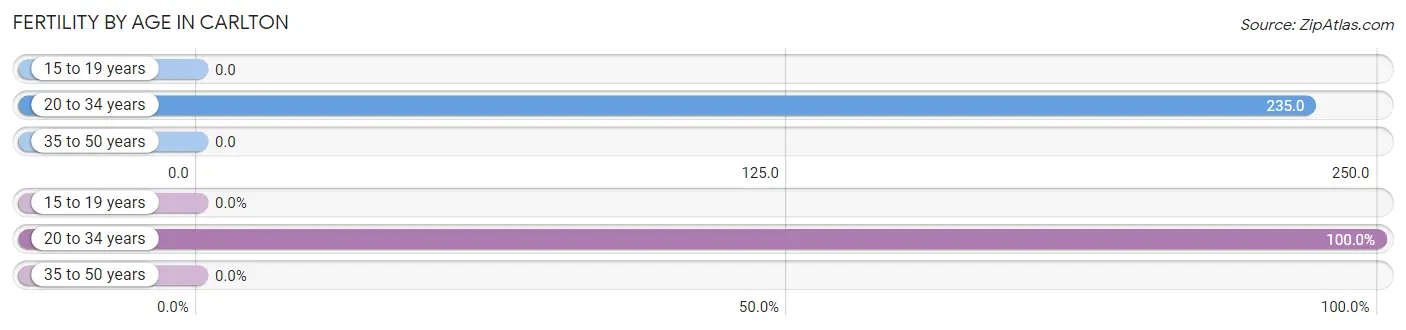
| Age Bracket | Women with Births | Births / 1,000 Women |
| 15 to 19 years | 0 (0.0%) | 0.0 |
| 20 to 34 years | 8 (100.0%) | 235.0 |
| 35 to 50 years | 0 (0.0%) | 0.0 |
| Total | 8 (100.0%) | 95.0 |
Fertility by Age by Marriage Status in Carlton
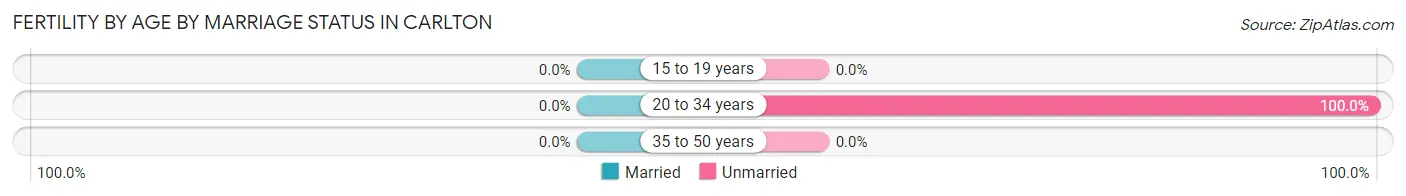
| Age Bracket | Married | Unmarried |
| 15 to 19 years | 0 (0.0%) | 0 (0.0%) |
| 20 to 34 years | 0 (0.0%) | 8 (100.0%) |
| 35 to 50 years | 0 (0.0%) | 0 (0.0%) |
| Total | 0 (0.0%) | 8 (100.0%) |
Fertility by Education in Carlton
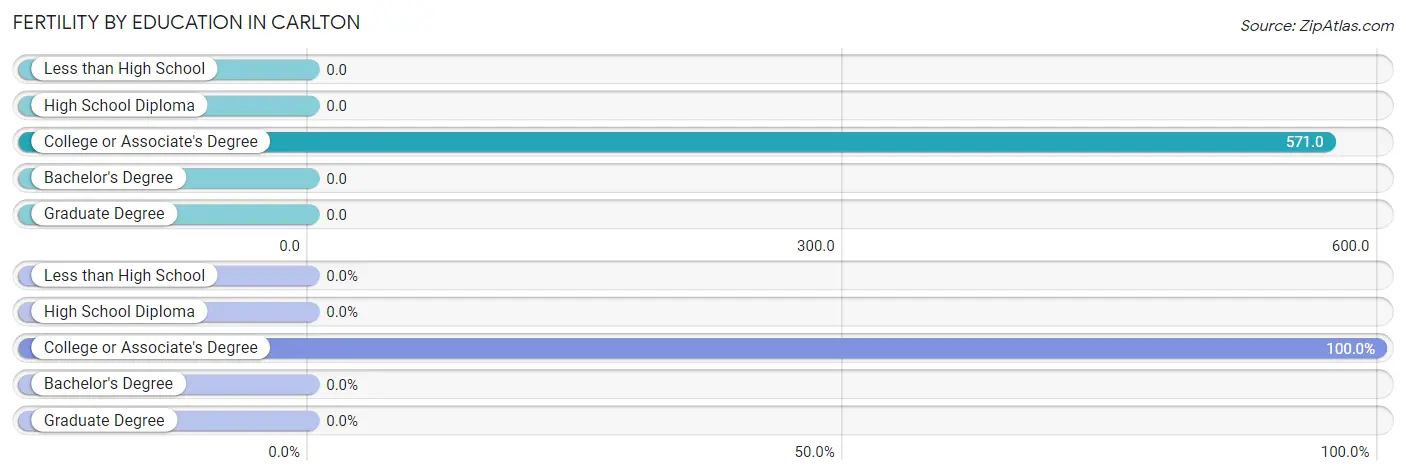
| Educational Attainment | Women with Births | Births / 1,000 Women |
| Less than High School | 0 (0.0%) | 0.0 |
| High School Diploma | 0 (0.0%) | 0.0 |
| College or Associate's Degree | 8 (100.0%) | 571.0 |
| Bachelor's Degree | 0 (0.0%) | 0.0 |
| Graduate Degree | 0 (0.0%) | 0.0 |
| Total | 8 (100.0%) | 95.0 |
Fertility by Education by Marriage Status in Carlton
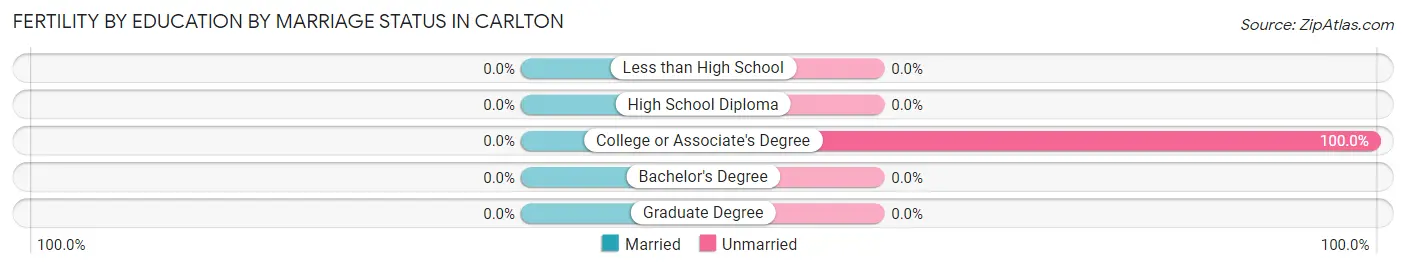
| Educational Attainment | Married | Unmarried |
| Less than High School | 0 (0.0%) | 0 (0.0%) |
| High School Diploma | 0 (0.0%) | 0 (0.0%) |
| College or Associate's Degree | 0 (0.0%) | 8 (100.0%) |
| Bachelor's Degree | 0 (0.0%) | 0 (0.0%) |
| Graduate Degree | 0 (0.0%) | 0 (0.0%) |
| Total | 0 (0.0%) | 8 (100.0%) |
Employment Characteristics in Carlton
Employment by Class of Employer in Carlton
Among the 128 employed individuals in Carlton, private company employees (102 | 79.7%), state government employees (12 | 9.4%), and local government employees (10 | 7.8%) make up the most common classes of employment.
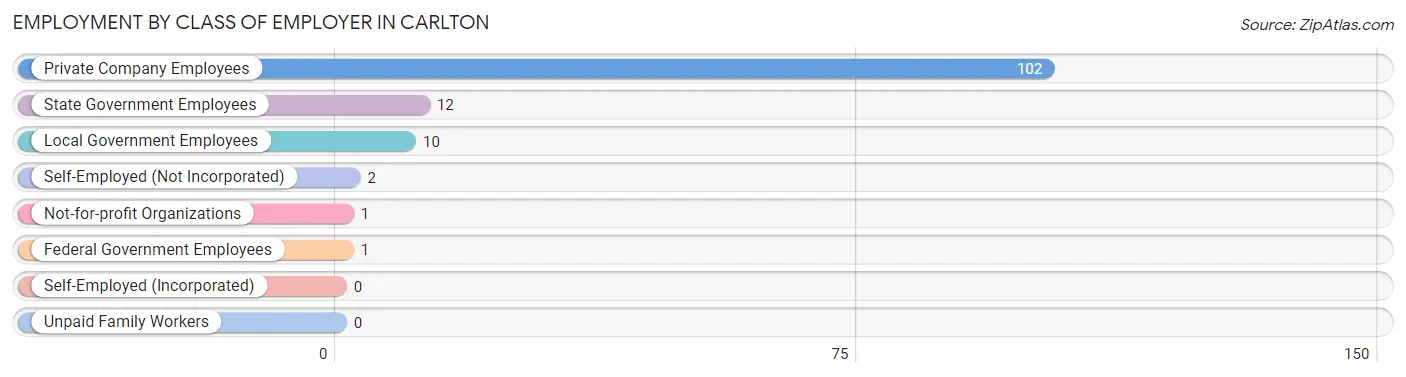
| Employer Class | # Employees | % Employees |
| Private Company Employees | 102 | 79.7% |
| Self-Employed (Incorporated) | 0 | 0.0% |
| Self-Employed (Not Incorporated) | 2 | 1.6% |
| Not-for-profit Organizations | 1 | 0.8% |
| Local Government Employees | 10 | 7.8% |
| State Government Employees | 12 | 9.4% |
| Federal Government Employees | 1 | 0.8% |
| Unpaid Family Workers | 0 | 0.0% |
| Total | 128 | 100.0% |
Employment Status by Age in Carlton
According to the labor force statistics for Carlton, out of the total population over 16 years of age (348), 44.3% or 154 individuals are in the labor force, with 13.0% or 20 of them unemployed. The age group with the highest labor force participation rate is 30 to 34 years, with 100.0% or 41 individuals in the labor force. Within the labor force, the 20 to 24 years age range has the highest percentage of unemployed individuals, with 66.7% or 6 of them being unemployed.
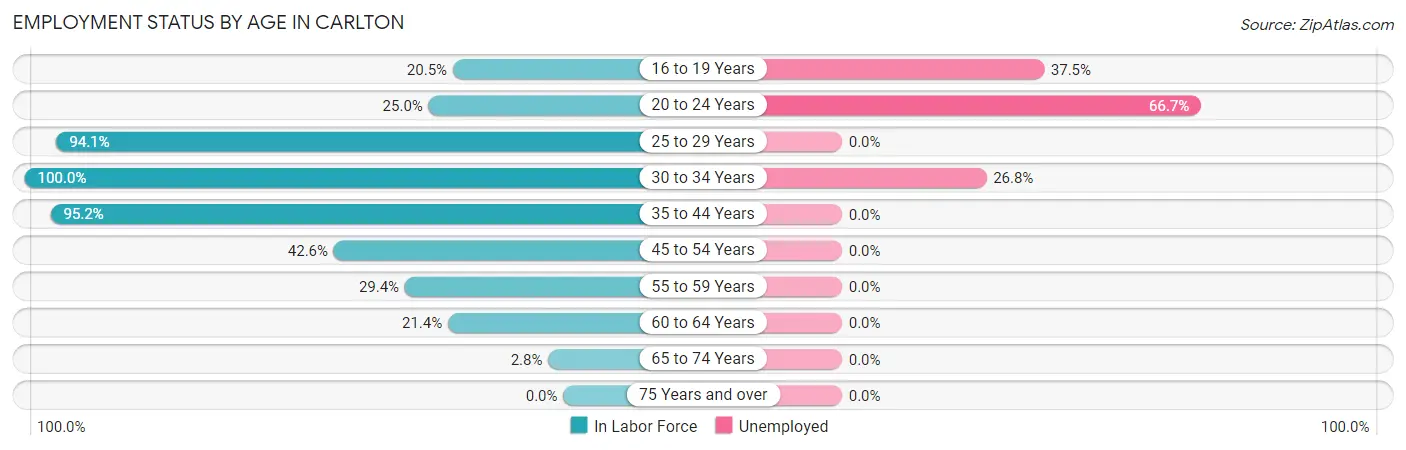
| Age Bracket | In Labor Force | Unemployed |
| 16 to 19 Years | 8 (20.5%) | 3 (37.5%) |
| 20 to 24 Years | 9 (25.0%) | 6 (66.7%) |
| 25 to 29 Years | 32 (94.1%) | 0 (0.0%) |
| 30 to 34 Years | 41 (100.0%) | 11 (26.8%) |
| 35 to 44 Years | 20 (95.2%) | 0 (0.0%) |
| 45 to 54 Years | 29 (42.6%) | 0 (0.0%) |
| 55 to 59 Years | 5 (29.4%) | 0 (0.0%) |
| 60 to 64 Years | 9 (21.4%) | 0 (0.0%) |
| 65 to 74 Years | 1 (2.8%) | 0 (0.0%) |
| 75 Years and over | 0 (0.0%) | 0 (0.0%) |
| Total | 154 (44.3%) | 20 (13.0%) |
Employment Status by Educational Attainment in Carlton
According to labor force statistics for Carlton, 61.0% of individuals (136) out of the total population between 25 and 64 years of age (223) are in the labor force, with 8.1% or 11 of them being unemployed. The group with the highest labor force participation rate are those with the educational attainment of college / associate degree, with 100.0% or 26 individuals in the labor force. Within the labor force, individuals with high school diploma education have the highest percentage of unemployment, with 13.8% or 11 of them being unemployed.
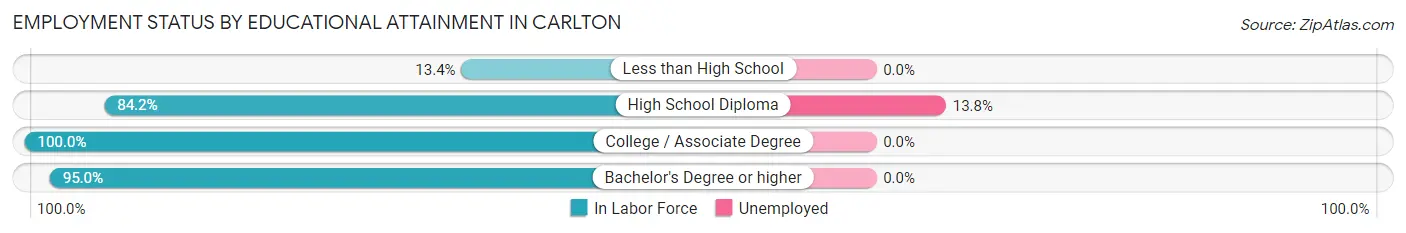
| Educational Attainment | In Labor Force | Unemployed |
| Less than High School | 11 (13.4%) | 0 (0.0%) |
| High School Diploma | 80 (84.2%) | 13 (13.8%) |
| College / Associate Degree | 26 (100.0%) | 0 (0.0%) |
| Bachelor's Degree or higher | 19 (95.0%) | 0 (0.0%) |
| Total | 136 (61.0%) | 18 (8.1%) |
Employment Occupations by Sex in Carlton
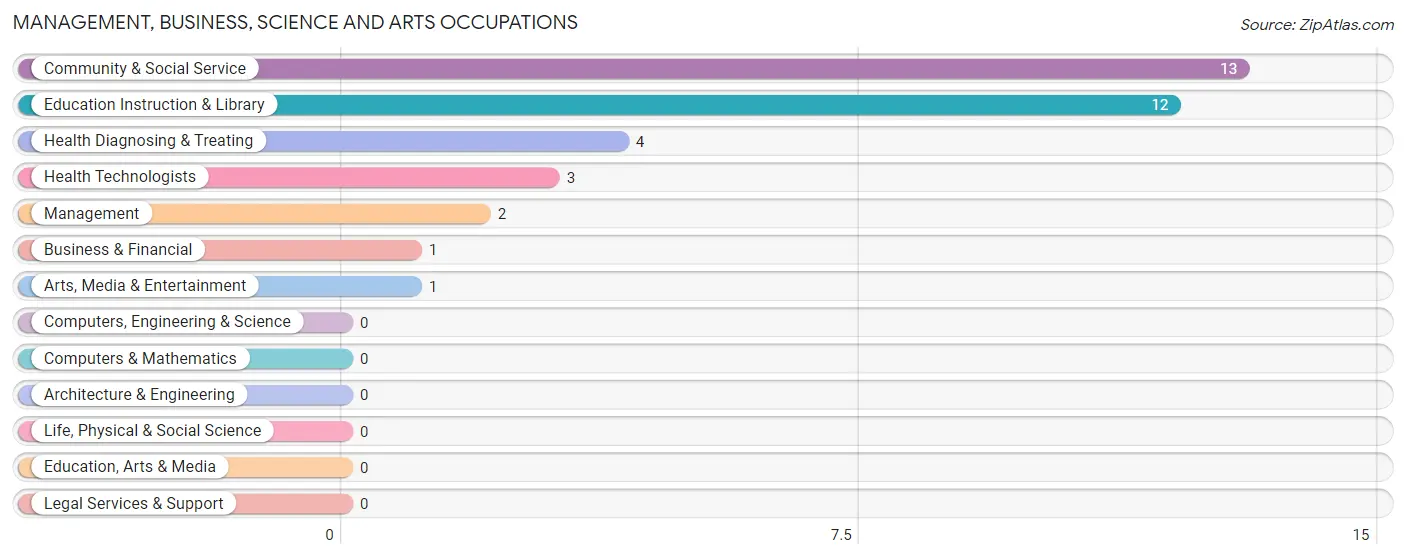
Management, Business, Science and Arts Occupations
The most common Management, Business, Science and Arts occupations in Carlton are Community & Social Service (13 | 9.7%), Education Instruction & Library (12 | 9.0%), Health Diagnosing & Treating (4 | 3.0%), Health Technologists (3 | 2.2%), and Management (2 | 1.5%).
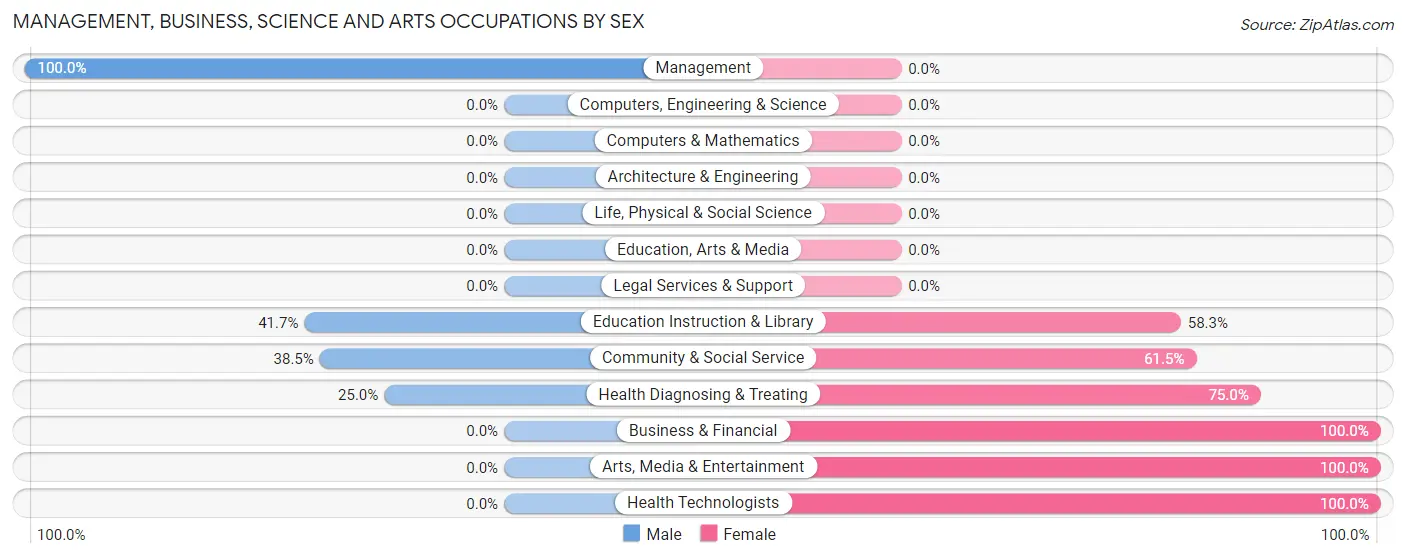
Management, Business, Science and Arts Occupations by Sex
Within the Management, Business, Science and Arts occupations in Carlton, the most male-oriented occupations are Management (100.0%), Education Instruction & Library (41.7%), and Community & Social Service (38.5%), while the most female-oriented occupations are Business & Financial (100.0%), Arts, Media & Entertainment (100.0%), and Health Technologists (100.0%).
| Occupation | Male | Female |
| Management | 2 (100.0%) | 0 (0.0%) |
| Business & Financial | 0 (0.0%) | 1 (100.0%) |
| Computers, Engineering & Science | 0 (0.0%) | 0 (0.0%) |
| Computers & Mathematics | 0 (0.0%) | 0 (0.0%) |
| Architecture & Engineering | 0 (0.0%) | 0 (0.0%) |
| Life, Physical & Social Science | 0 (0.0%) | 0 (0.0%) |
| Community & Social Service | 5 (38.5%) | 8 (61.5%) |
| Education, Arts & Media | 0 (0.0%) | 0 (0.0%) |
| Legal Services & Support | 0 (0.0%) | 0 (0.0%) |
| Education Instruction & Library | 5 (41.7%) | 7 (58.3%) |
| Arts, Media & Entertainment | 0 (0.0%) | 1 (100.0%) |
| Health Diagnosing & Treating | 1 (25.0%) | 3 (75.0%) |
| Health Technologists | 0 (0.0%) | 3 (100.0%) |
| Total (Category) | 8 (40.0%) | 12 (60.0%) |
| Total (Overall) | 86 (64.2%) | 48 (35.8%) |
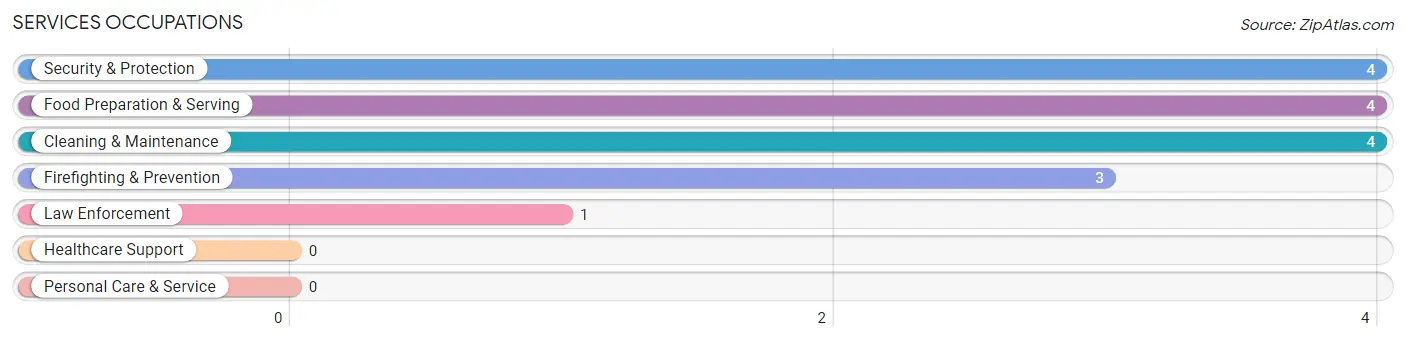
Services Occupations
The most common Services occupations in Carlton are Security & Protection (4 | 3.0%), Food Preparation & Serving (4 | 3.0%), Cleaning & Maintenance (4 | 3.0%), Firefighting & Prevention (3 | 2.2%), and Law Enforcement (1 | 0.7%).
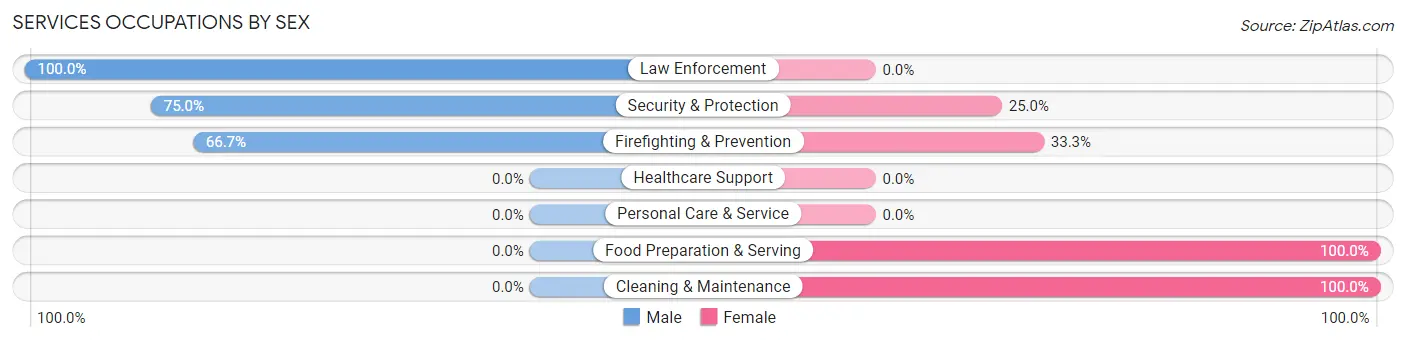
Services Occupations by Sex
Within the Services occupations in Carlton, the most male-oriented occupations are Law Enforcement (100.0%), Security & Protection (75.0%), and Firefighting & Prevention (66.7%), while the most female-oriented occupations are Food Preparation & Serving (100.0%), Cleaning & Maintenance (100.0%), and Firefighting & Prevention (33.3%).
| Occupation | Male | Female |
| Healthcare Support | 0 (0.0%) | 0 (0.0%) |
| Security & Protection | 3 (75.0%) | 1 (25.0%) |
| Firefighting & Prevention | 2 (66.7%) | 1 (33.3%) |
| Law Enforcement | 1 (100.0%) | 0 (0.0%) |
| Food Preparation & Serving | 0 (0.0%) | 4 (100.0%) |
| Cleaning & Maintenance | 0 (0.0%) | 4 (100.0%) |
| Personal Care & Service | 0 (0.0%) | 0 (0.0%) |
| Total (Category) | 3 (25.0%) | 9 (75.0%) |
| Total (Overall) | 86 (64.2%) | 48 (35.8%) |
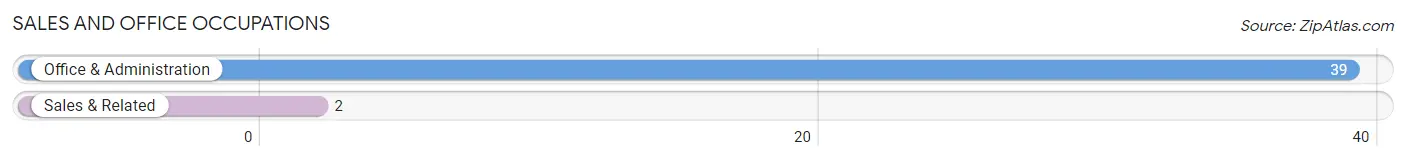
Sales and Office Occupations
The most common Sales and Office occupations in Carlton are Office & Administration (39 | 29.1%), and Sales & Related (2 | 1.5%).
Sales and Office Occupations by Sex
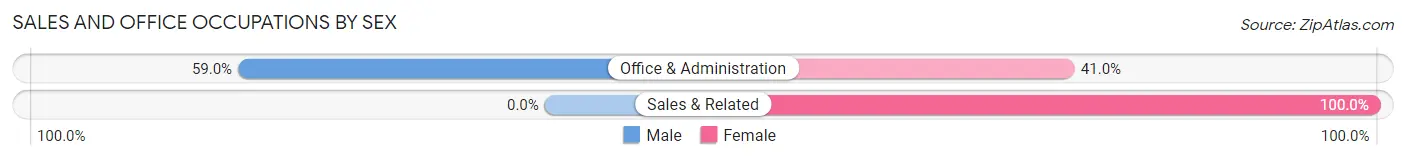
| Occupation | Male | Female |
| Sales & Related | 0 (0.0%) | 2 (100.0%) |
| Office & Administration | 23 (59.0%) | 16 (41.0%) |
| Total (Category) | 23 (56.1%) | 18 (43.9%) |
| Total (Overall) | 86 (64.2%) | 48 (35.8%) |
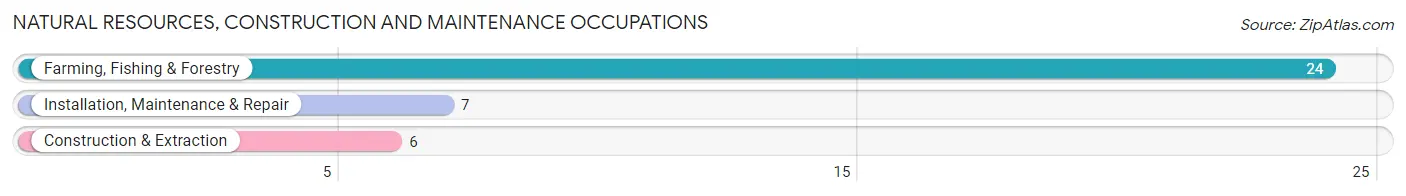
Natural Resources, Construction and Maintenance Occupations
The most common Natural Resources, Construction and Maintenance occupations in Carlton are Farming, Fishing & Forestry (24 | 17.9%), Installation, Maintenance & Repair (7 | 5.2%), and Construction & Extraction (6 | 4.5%).
Natural Resources, Construction and Maintenance Occupations by Sex
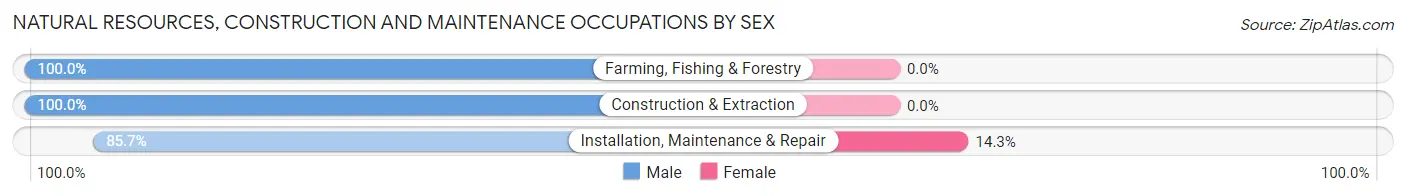
| Occupation | Male | Female |
| Farming, Fishing & Forestry | 24 (100.0%) | 0 (0.0%) |
| Construction & Extraction | 6 (100.0%) | 0 (0.0%) |
| Installation, Maintenance & Repair | 6 (85.7%) | 1 (14.3%) |
| Total (Category) | 36 (97.3%) | 1 (2.7%) |
| Total (Overall) | 86 (64.2%) | 48 (35.8%) |
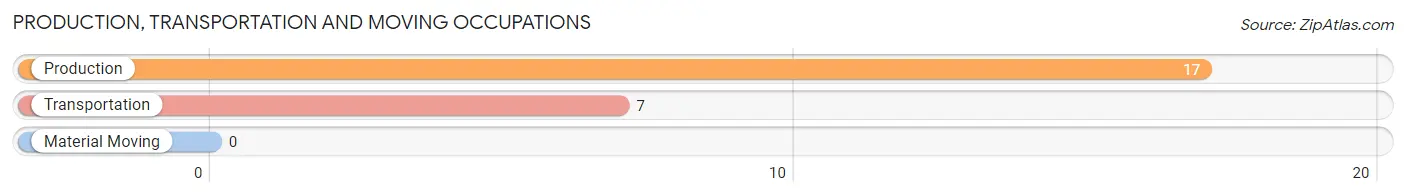
Production, Transportation and Moving Occupations
The most common Production, Transportation and Moving occupations in Carlton are Production (17 | 12.7%), and Transportation (7 | 5.2%).
Production, Transportation and Moving Occupations by Sex
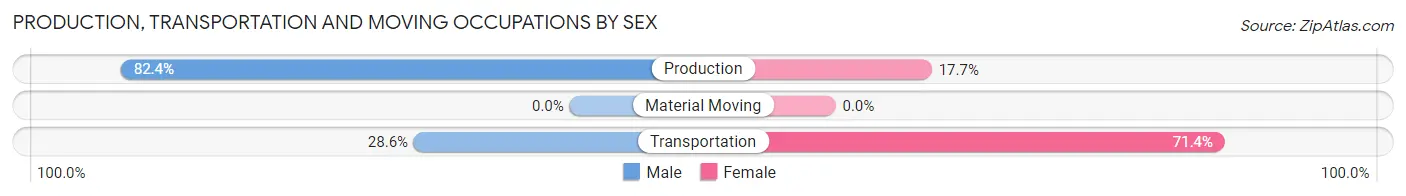
| Occupation | Male | Female |
| Production | 14 (82.4%) | 3 (17.6%) |
| Transportation | 2 (28.6%) | 5 (71.4%) |
| Material Moving | 0 (0.0%) | 0 (0.0%) |
| Total (Category) | 16 (66.7%) | 8 (33.3%) |
| Total (Overall) | 86 (64.2%) | 48 (35.8%) |
Employment Industries by Sex in Carlton
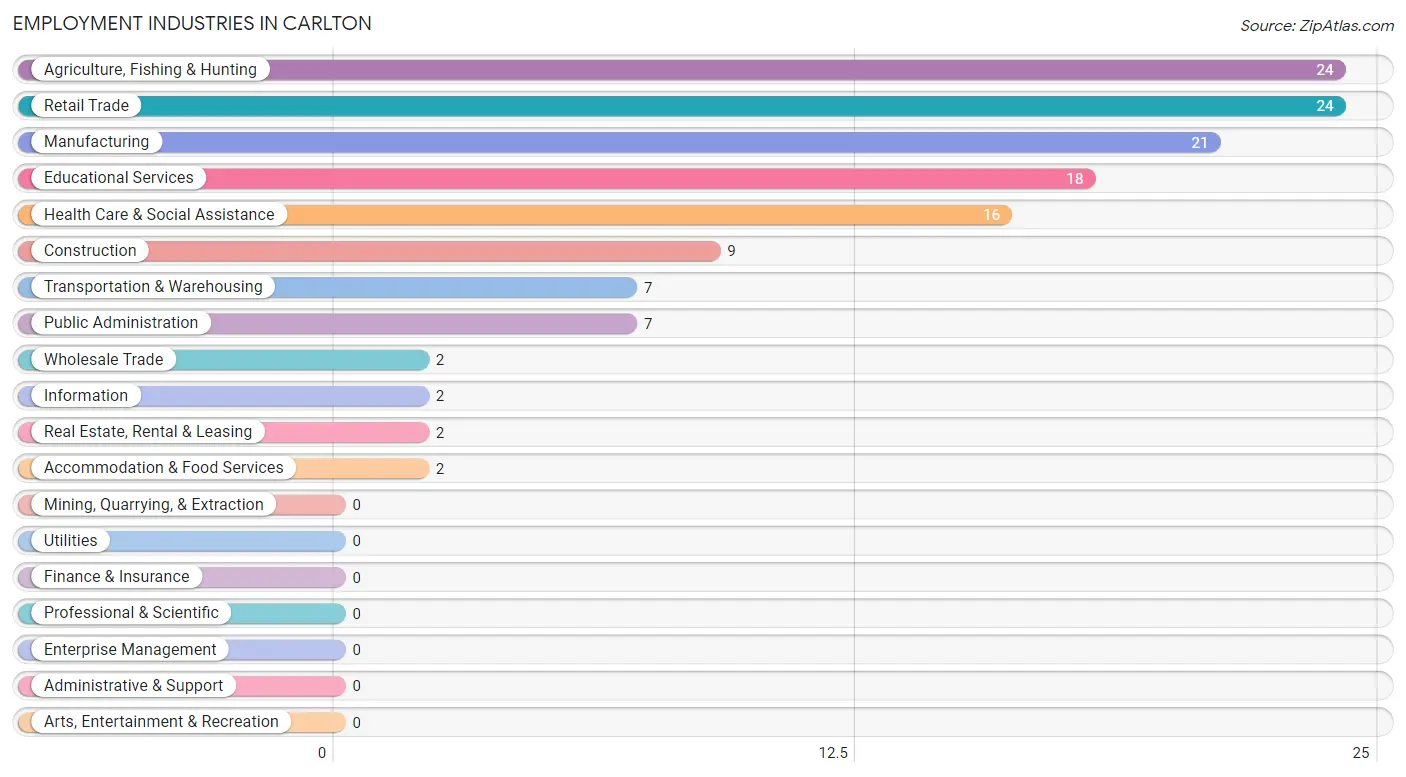
Employment Industries in Carlton
The major employment industries in Carlton include Agriculture, Fishing & Hunting (24 | 17.9%), Retail Trade (24 | 17.9%), Manufacturing (21 | 15.7%), Educational Services (18 | 13.4%), and Health Care & Social Assistance (16 | 11.9%).
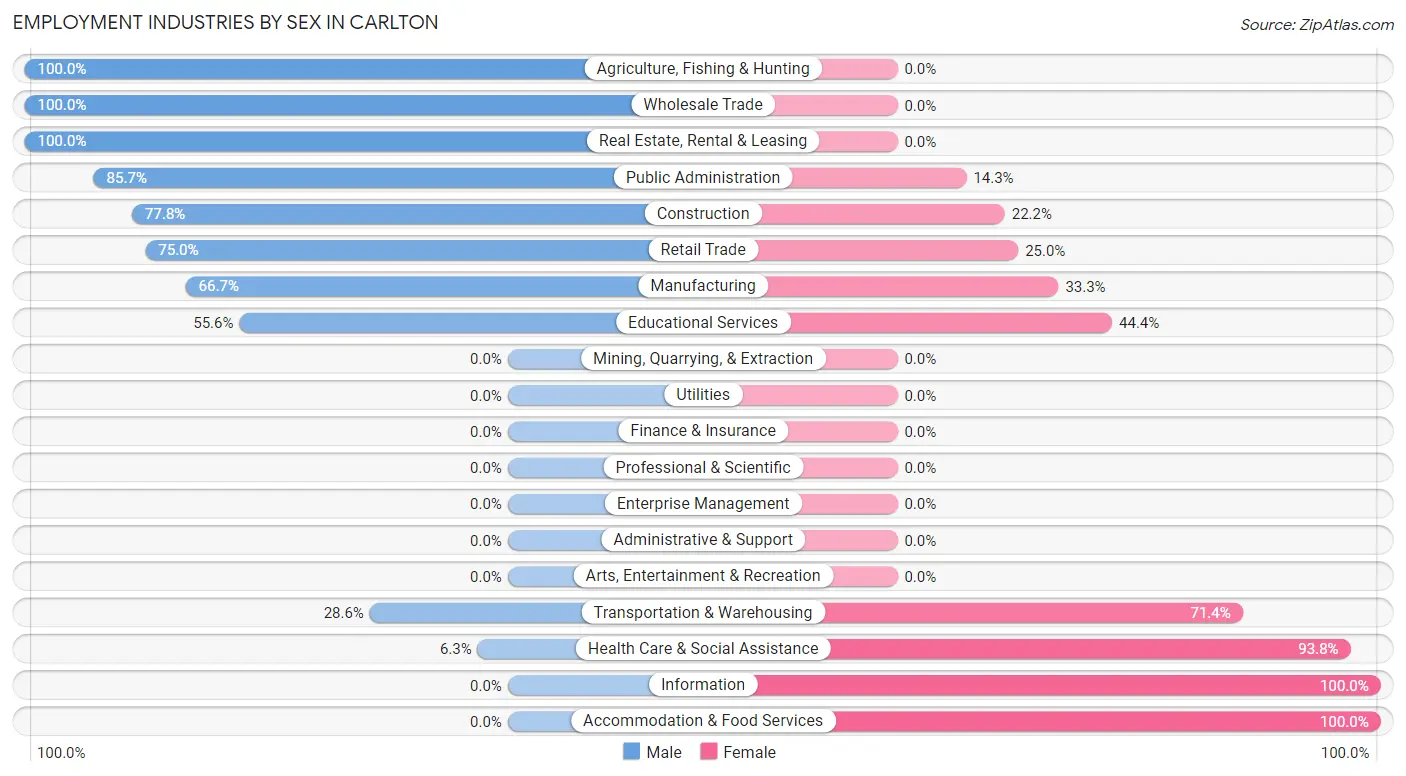
Employment Industries by Sex in Carlton
The Carlton industries that see more men than women are Agriculture, Fishing & Hunting (100.0%), Wholesale Trade (100.0%), and Real Estate, Rental & Leasing (100.0%), whereas the industries that tend to have a higher number of women are Information (100.0%), Accommodation & Food Services (100.0%), and Health Care & Social Assistance (93.8%).
| Industry | Male | Female |
| Agriculture, Fishing & Hunting | 24 (100.0%) | 0 (0.0%) |
| Mining, Quarrying, & Extraction | 0 (0.0%) | 0 (0.0%) |
| Construction | 7 (77.8%) | 2 (22.2%) |
| Manufacturing | 14 (66.7%) | 7 (33.3%) |
| Wholesale Trade | 2 (100.0%) | 0 (0.0%) |
| Retail Trade | 18 (75.0%) | 6 (25.0%) |
| Transportation & Warehousing | 2 (28.6%) | 5 (71.4%) |
| Utilities | 0 (0.0%) | 0 (0.0%) |
| Information | 0 (0.0%) | 2 (100.0%) |
| Finance & Insurance | 0 (0.0%) | 0 (0.0%) |
| Real Estate, Rental & Leasing | 2 (100.0%) | 0 (0.0%) |
| Professional & Scientific | 0 (0.0%) | 0 (0.0%) |
| Enterprise Management | 0 (0.0%) | 0 (0.0%) |
| Administrative & Support | 0 (0.0%) | 0 (0.0%) |
| Educational Services | 10 (55.6%) | 8 (44.4%) |
| Health Care & Social Assistance | 1 (6.2%) | 15 (93.8%) |
| Arts, Entertainment & Recreation | 0 (0.0%) | 0 (0.0%) |
| Accommodation & Food Services | 0 (0.0%) | 2 (100.0%) |
| Public Administration | 6 (85.7%) | 1 (14.3%) |
| Total | 86 (64.2%) | 48 (35.8%) |
Education in Carlton
School Enrollment in Carlton
The most common levels of schooling among the 97 students in Carlton are high school (62 | 63.9%), college / undergraduate (14 | 14.4%), and middle school (9 | 9.3%).
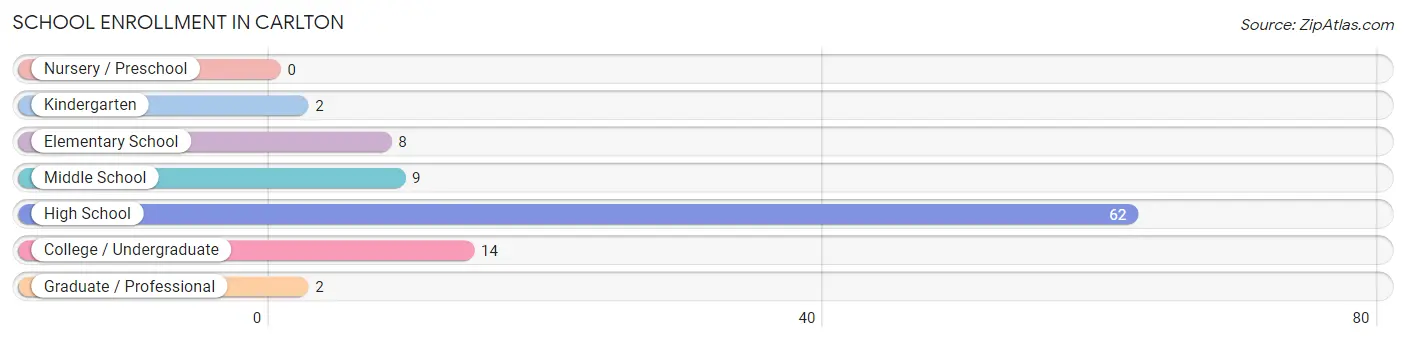
| School Level | # Students | % Students |
| Nursery / Preschool | 0 | 0.0% |
| Kindergarten | 2 | 2.1% |
| Elementary School | 8 | 8.3% |
| Middle School | 9 | 9.3% |
| High School | 62 | 63.9% |
| College / Undergraduate | 14 | 14.4% |
| Graduate / Professional | 2 | 2.1% |
| Total | 97 | 100.0% |
School Enrollment by Age by Funding Source in Carlton
Out of a total of 97 students who are enrolled in schools in Carlton, 4 (4.1%) attend a private institution, while the remaining 93 (95.9%) are enrolled in public schools. The age group of 10 to 14 year olds has the highest likelihood of being enrolled in private schools, with 2 (14.3% in the age bracket) enrolled. Conversely, the age group of 5 to 9 year old has the lowest likelihood of being enrolled in a private school, with 5 (100.0% in the age bracket) attending a public institution.
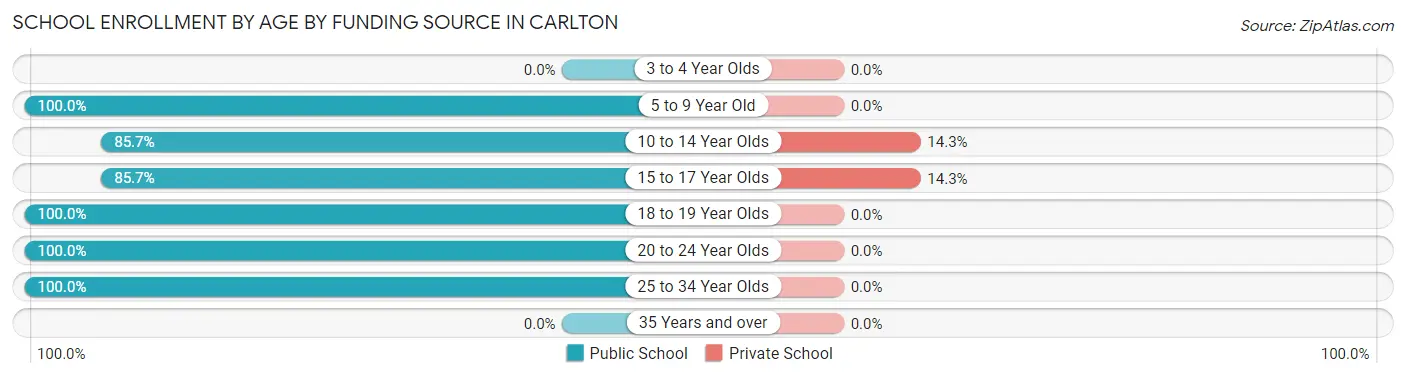
| Age Bracket | Public School | Private School |
| 3 to 4 Year Olds | 0 (0.0%) | 0 (0.0%) |
| 5 to 9 Year Old | 5 (100.0%) | 0 (0.0%) |
| 10 to 14 Year Olds | 12 (85.7%) | 2 (14.3%) |
| 15 to 17 Year Olds | 12 (85.7%) | 2 (14.3%) |
| 18 to 19 Year Olds | 27 (100.0%) | 0 (0.0%) |
| 20 to 24 Year Olds | 33 (100.0%) | 0 (0.0%) |
| 25 to 34 Year Olds | 4 (100.0%) | 0 (0.0%) |
| 35 Years and over | 0 (0.0%) | 0 (0.0%) |
| Total | 93 (95.9%) | 4 (4.1%) |
Educational Attainment by Field of Study in Carlton
Education (12 | 35.3%), business (6 | 17.6%), physical & health sciences (4 | 11.8%), visual & performing arts (4 | 11.8%), and computers & mathematics (3 | 8.8%) are the most common fields of study among 34 individuals in Carlton who have obtained a bachelor's degree or higher.
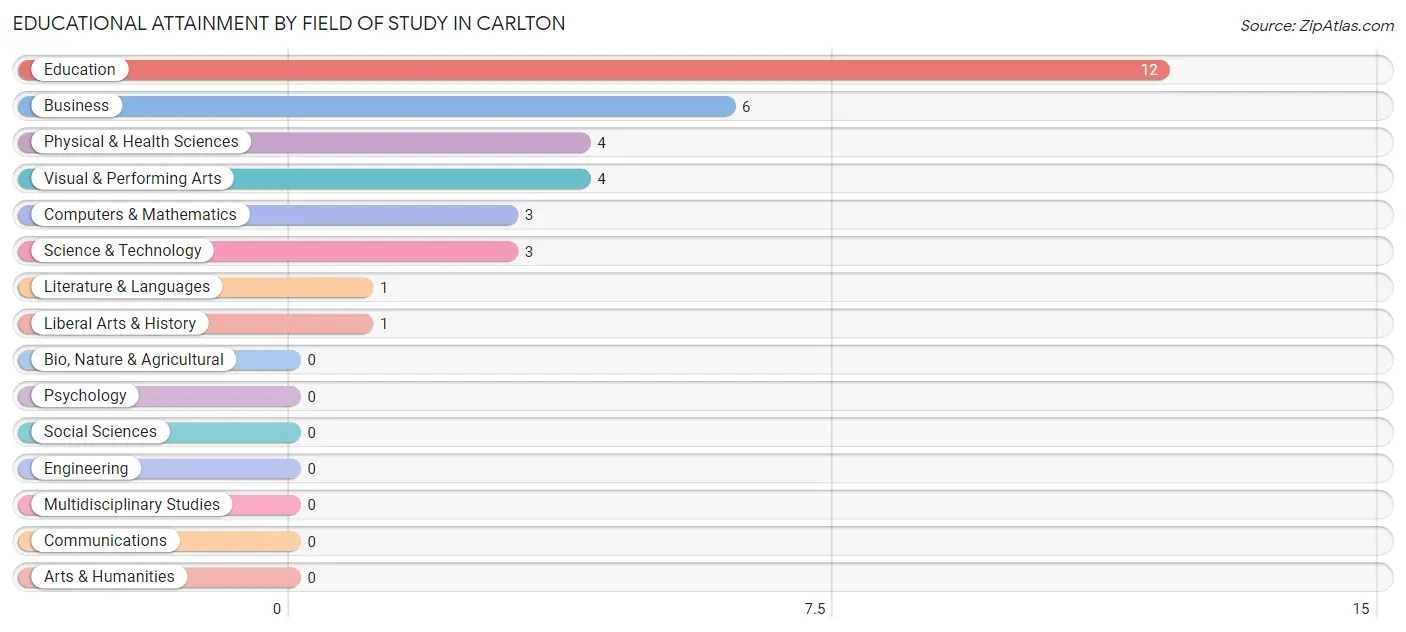
| Field of Study | # Graduates | % Graduates |
| Computers & Mathematics | 3 | 8.8% |
| Bio, Nature & Agricultural | 0 | 0.0% |
| Physical & Health Sciences | 4 | 11.8% |
| Psychology | 0 | 0.0% |
| Social Sciences | 0 | 0.0% |
| Engineering | 0 | 0.0% |
| Multidisciplinary Studies | 0 | 0.0% |
| Science & Technology | 3 | 8.8% |
| Business | 6 | 17.6% |
| Education | 12 | 35.3% |
| Literature & Languages | 1 | 2.9% |
| Liberal Arts & History | 1 | 2.9% |
| Visual & Performing Arts | 4 | 11.8% |
| Communications | 0 | 0.0% |
| Arts & Humanities | 0 | 0.0% |
| Total | 34 | 100.0% |
Transportation & Commute in Carlton
Vehicle Availability by Sex in Carlton
The most prevalent vehicle ownership categories in Carlton are males with 2 vehicles (58, accounting for 68.2%) and females with 2 vehicles (14, making up 134.9%).
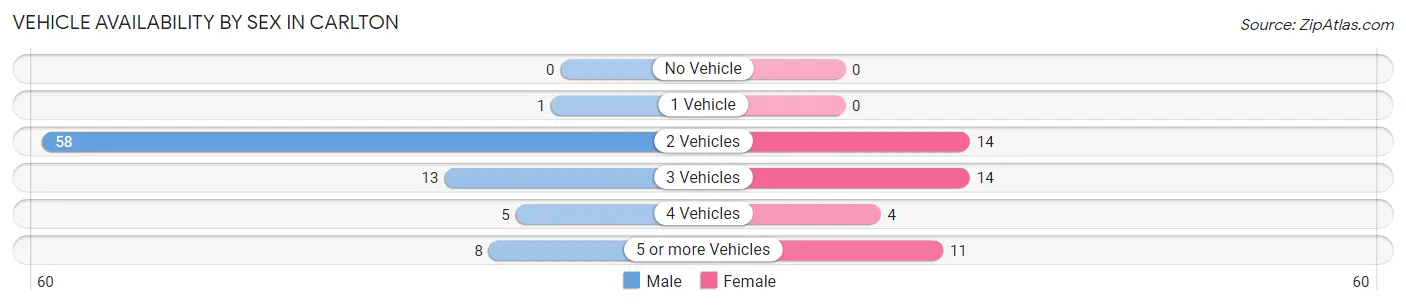
| Vehicles Available | Male | Female |
| No Vehicle | 0 (0.0%) | 0 (0.0%) |
| 1 Vehicle | 1 (1.2%) | 0 (0.0%) |
| 2 Vehicles | 58 (68.2%) | 14 (32.6%) |
| 3 Vehicles | 13 (15.3%) | 14 (32.6%) |
| 4 Vehicles | 5 (5.9%) | 4 (9.3%) |
| 5 or more Vehicles | 8 (9.4%) | 11 (25.6%) |
| Total | 85 (100.0%) | 43 (100.0%) |
Commute Time in Carlton
The most frequently occuring commute durations in Carlton are 45 to 59 minutes (60 commuters, 47.2%), 30 to 34 minutes (28 commuters, 22.1%), and 25 to 29 minutes (12 commuters, 9.5%).
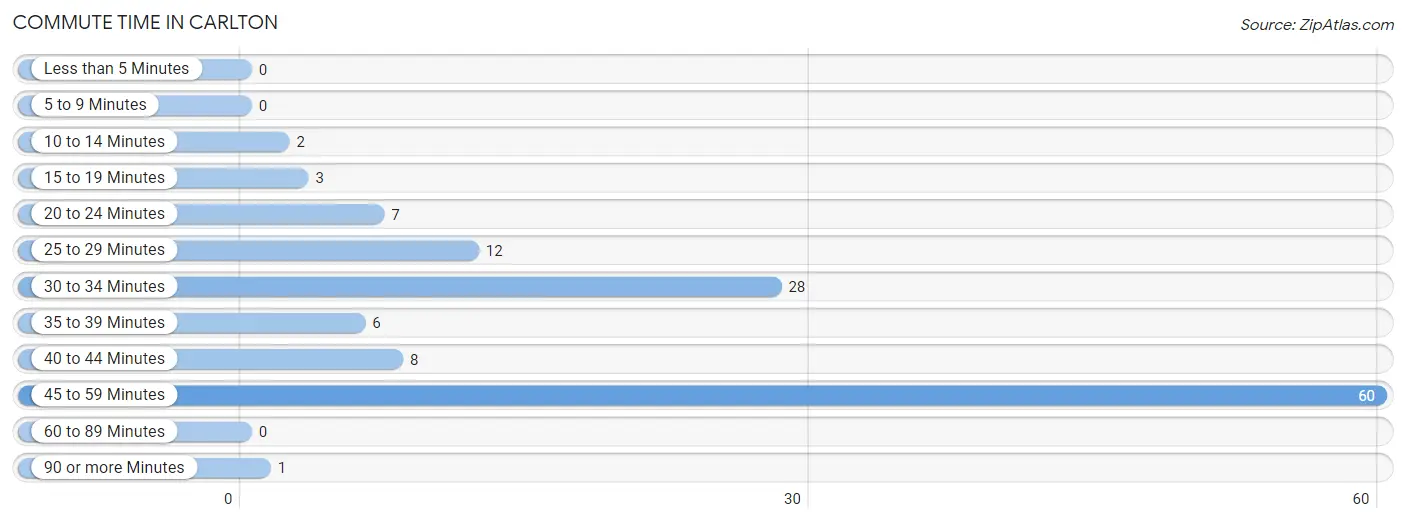
| Commute Time | # Commuters | % Commuters |
| Less than 5 Minutes | 0 | 0.0% |
| 5 to 9 Minutes | 0 | 0.0% |
| 10 to 14 Minutes | 2 | 1.6% |
| 15 to 19 Minutes | 3 | 2.4% |
| 20 to 24 Minutes | 7 | 5.5% |
| 25 to 29 Minutes | 12 | 9.5% |
| 30 to 34 Minutes | 28 | 22.1% |
| 35 to 39 Minutes | 6 | 4.7% |
| 40 to 44 Minutes | 8 | 6.3% |
| 45 to 59 Minutes | 60 | 47.2% |
| 60 to 89 Minutes | 0 | 0.0% |
| 90 or more Minutes | 1 | 0.8% |
Commute Time by Sex in Carlton
The most common commute times in Carlton are 45 to 59 minutes (46 commuters, 54.1%) for males and 45 to 59 minutes (14 commuters, 33.3%) for females.
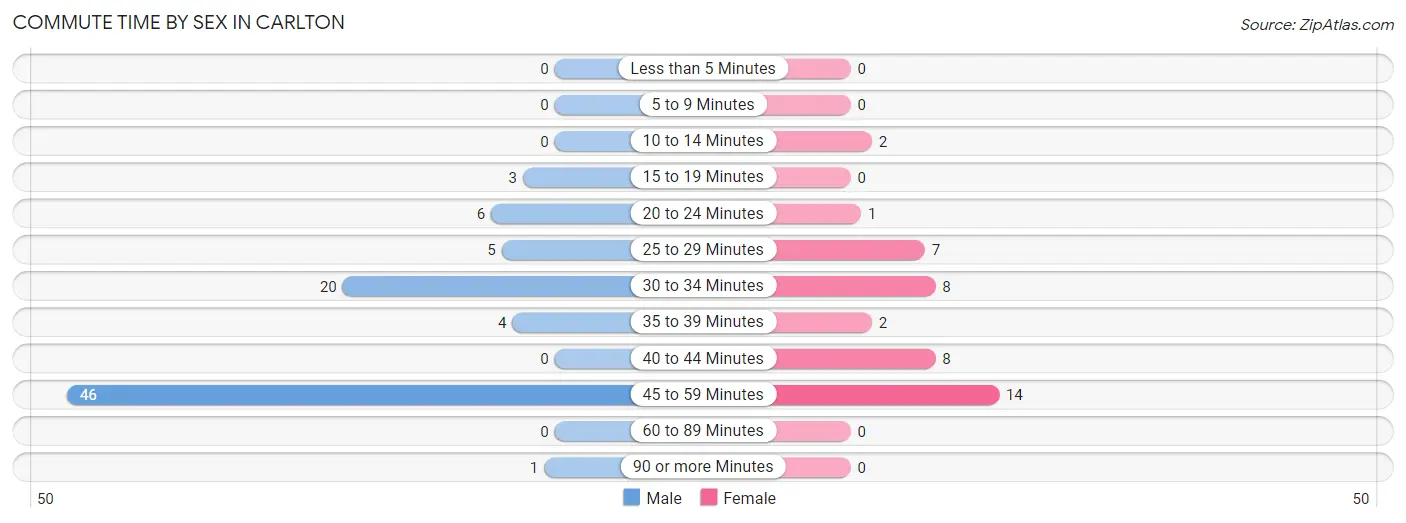
| Commute Time | Male | Female |
| Less than 5 Minutes | 0 (0.0%) | 0 (0.0%) |
| 5 to 9 Minutes | 0 (0.0%) | 0 (0.0%) |
| 10 to 14 Minutes | 0 (0.0%) | 2 (4.8%) |
| 15 to 19 Minutes | 3 (3.5%) | 0 (0.0%) |
| 20 to 24 Minutes | 6 (7.1%) | 1 (2.4%) |
| 25 to 29 Minutes | 5 (5.9%) | 7 (16.7%) |
| 30 to 34 Minutes | 20 (23.5%) | 8 (19.1%) |
| 35 to 39 Minutes | 4 (4.7%) | 2 (4.8%) |
| 40 to 44 Minutes | 0 (0.0%) | 8 (19.1%) |
| 45 to 59 Minutes | 46 (54.1%) | 14 (33.3%) |
| 60 to 89 Minutes | 0 (0.0%) | 0 (0.0%) |
| 90 or more Minutes | 1 (1.2%) | 0 (0.0%) |
Time of Departure to Work by Sex in Carlton
The most frequent times of departure to work in Carlton are 12:00 AM to 4:59 AM (26, 30.6%) for males and 7:30 AM to 7:59 AM (13, 30.9%) for females.
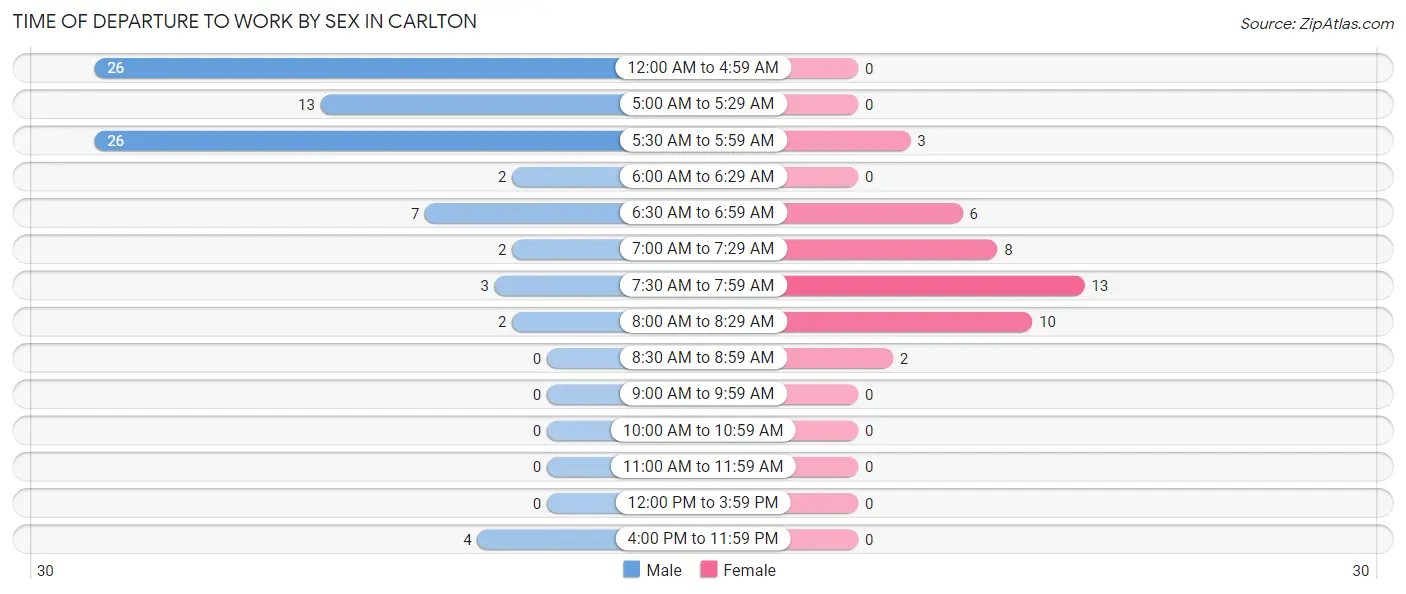
| Time of Departure | Male | Female |
| 12:00 AM to 4:59 AM | 26 (30.6%) | 0 (0.0%) |
| 5:00 AM to 5:29 AM | 13 (15.3%) | 0 (0.0%) |
| 5:30 AM to 5:59 AM | 26 (30.6%) | 3 (7.1%) |
| 6:00 AM to 6:29 AM | 2 (2.4%) | 0 (0.0%) |
| 6:30 AM to 6:59 AM | 7 (8.2%) | 6 (14.3%) |
| 7:00 AM to 7:29 AM | 2 (2.4%) | 8 (19.1%) |
| 7:30 AM to 7:59 AM | 3 (3.5%) | 13 (30.9%) |
| 8:00 AM to 8:29 AM | 2 (2.4%) | 10 (23.8%) |
| 8:30 AM to 8:59 AM | 0 (0.0%) | 2 (4.8%) |
| 9:00 AM to 9:59 AM | 0 (0.0%) | 0 (0.0%) |
| 10:00 AM to 10:59 AM | 0 (0.0%) | 0 (0.0%) |
| 11:00 AM to 11:59 AM | 0 (0.0%) | 0 (0.0%) |
| 12:00 PM to 3:59 PM | 0 (0.0%) | 0 (0.0%) |
| 4:00 PM to 11:59 PM | 4 (4.7%) | 0 (0.0%) |
| Total | 85 (100.0%) | 42 (100.0%) |
Housing Occupancy in Carlton
Occupancy by Ownership in Carlton
Of the total 110 dwellings in Carlton, owner-occupied units account for 86 (78.2%), while renter-occupied units make up 24 (21.8%).
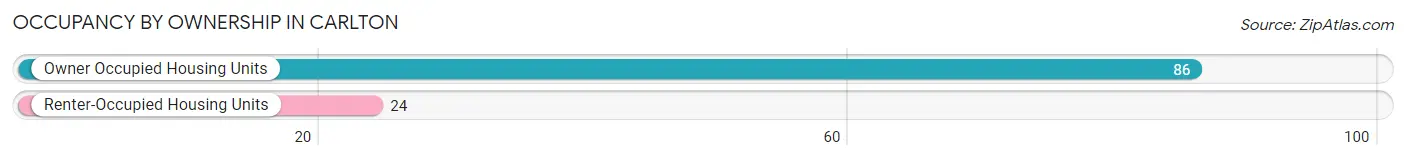
| Occupancy | # Housing Units | % Housing Units |
| Owner Occupied Housing Units | 86 | 78.2% |
| Renter-Occupied Housing Units | 24 | 21.8% |
| Total Occupied Housing Units | 110 | 100.0% |
Occupancy by Household Size in Carlton
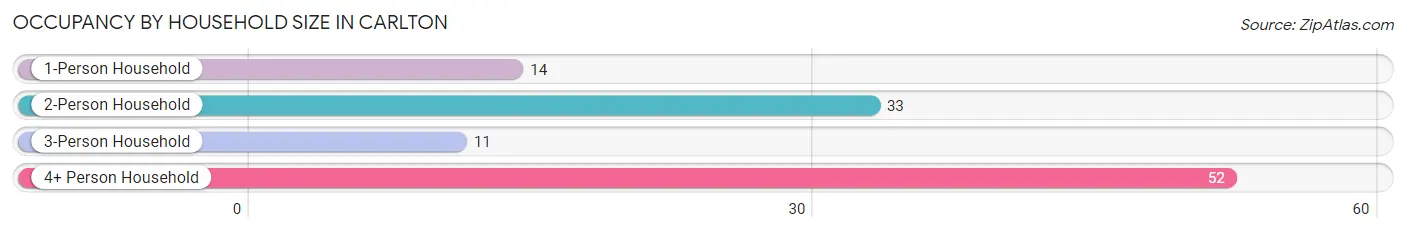
| Household Size | # Housing Units | % Housing Units |
| 1-Person Household | 14 | 12.7% |
| 2-Person Household | 33 | 30.0% |
| 3-Person Household | 11 | 10.0% |
| 4+ Person Household | 52 | 47.3% |
| Total Housing Units | 110 | 100.0% |
Occupancy by Ownership by Household Size in Carlton
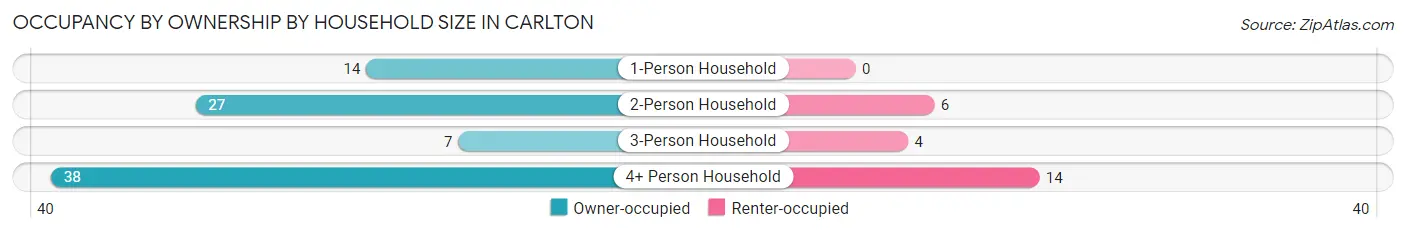
| Household Size | Owner-occupied | Renter-occupied |
| 1-Person Household | 14 (100.0%) | 0 (0.0%) |
| 2-Person Household | 27 (81.8%) | 6 (18.2%) |
| 3-Person Household | 7 (63.6%) | 4 (36.4%) |
| 4+ Person Household | 38 (73.1%) | 14 (26.9%) |
| Total Housing Units | 86 (78.2%) | 24 (21.8%) |
Occupancy by Educational Attainment in Carlton
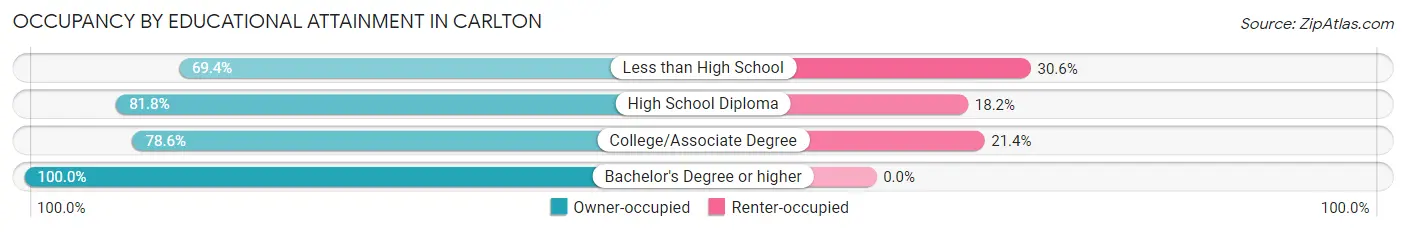
| Household Size | Owner-occupied | Renter-occupied |
| Less than High School | 34 (69.4%) | 15 (30.6%) |
| High School Diploma | 27 (81.8%) | 6 (18.2%) |
| College/Associate Degree | 11 (78.6%) | 3 (21.4%) |
| Bachelor's Degree or higher | 14 (100.0%) | 0 (0.0%) |
Occupancy by Age of Householder in Carlton
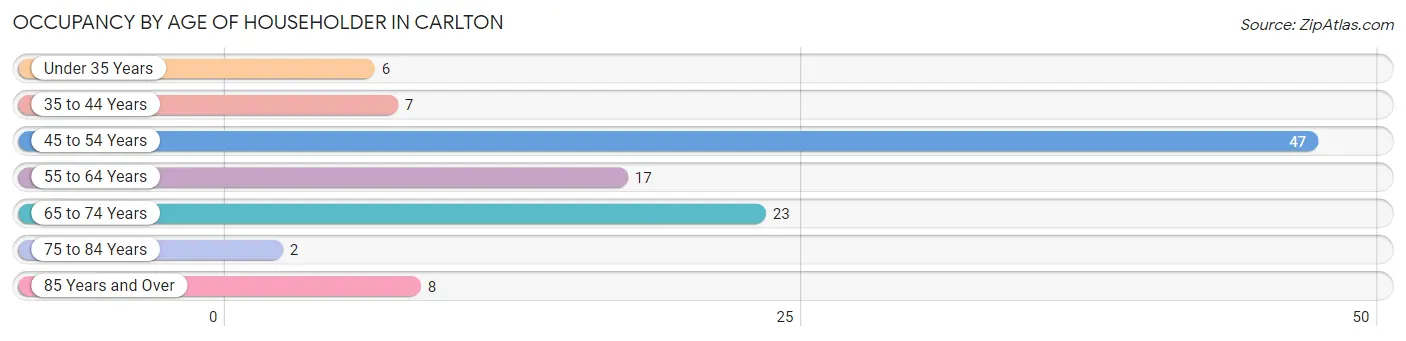
| Age Bracket | # Households | % Households |
| Under 35 Years | 6 | 5.4% |
| 35 to 44 Years | 7 | 6.4% |
| 45 to 54 Years | 47 | 42.7% |
| 55 to 64 Years | 17 | 15.4% |
| 65 to 74 Years | 23 | 20.9% |
| 75 to 84 Years | 2 | 1.8% |
| 85 Years and Over | 8 | 7.3% |
| Total | 110 | 100.0% |
Housing Finances in Carlton
Median Income by Occupancy in Carlton
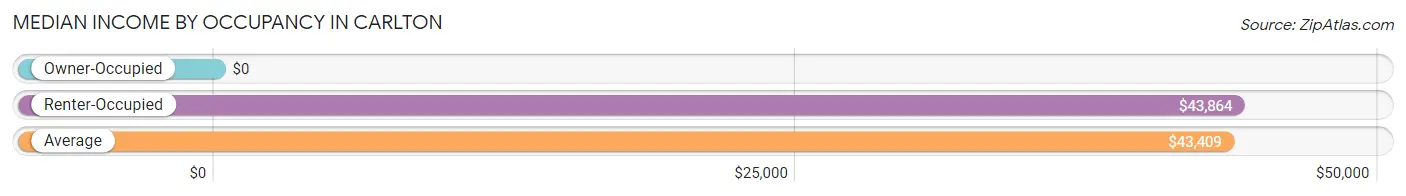
| Occupancy Type | # Households | Median Income |
| Owner-Occupied | 86 (78.2%) | $0 |
| Renter-Occupied | 24 (21.8%) | $43,864 |
| Average | 110 (100.0%) | $43,409 |
Occupancy by Householder Income Bracket in Carlton
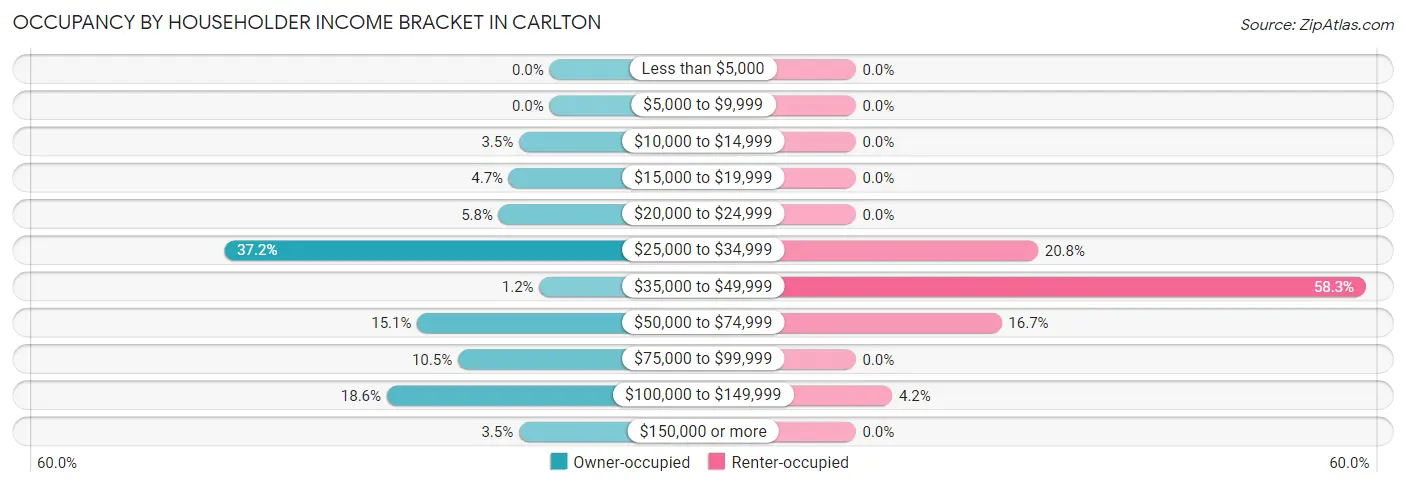
| Income Bracket | Owner-occupied | Renter-occupied |
| Less than $5,000 | 0 (0.0%) | 0 (0.0%) |
| $5,000 to $9,999 | 0 (0.0%) | 0 (0.0%) |
| $10,000 to $14,999 | 3 (3.5%) | 0 (0.0%) |
| $15,000 to $19,999 | 4 (4.6%) | 0 (0.0%) |
| $20,000 to $24,999 | 5 (5.8%) | 0 (0.0%) |
| $25,000 to $34,999 | 32 (37.2%) | 5 (20.8%) |
| $35,000 to $49,999 | 1 (1.2%) | 14 (58.3%) |
| $50,000 to $74,999 | 13 (15.1%) | 4 (16.7%) |
| $75,000 to $99,999 | 9 (10.5%) | 0 (0.0%) |
| $100,000 to $149,999 | 16 (18.6%) | 1 (4.2%) |
| $150,000 or more | 3 (3.5%) | 0 (0.0%) |
| Total | 86 (100.0%) | 24 (100.0%) |
Monthly Housing Cost Tiers in Carlton
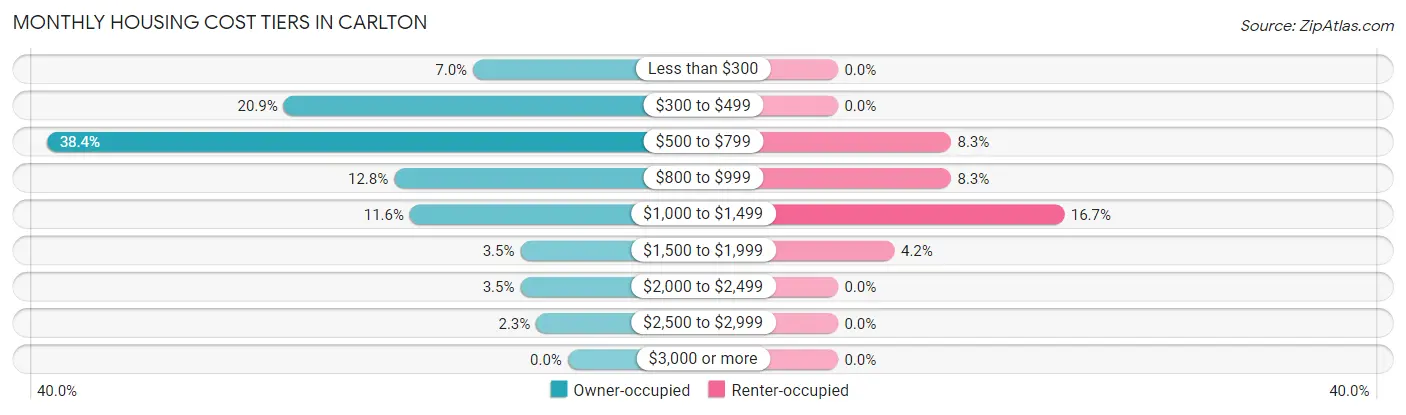
| Monthly Cost | Owner-occupied | Renter-occupied |
| Less than $300 | 6 (7.0%) | 0 (0.0%) |
| $300 to $499 | 18 (20.9%) | 0 (0.0%) |
| $500 to $799 | 33 (38.4%) | 2 (8.3%) |
| $800 to $999 | 11 (12.8%) | 2 (8.3%) |
| $1,000 to $1,499 | 10 (11.6%) | 4 (16.7%) |
| $1,500 to $1,999 | 3 (3.5%) | 1 (4.2%) |
| $2,000 to $2,499 | 3 (3.5%) | 0 (0.0%) |
| $2,500 to $2,999 | 2 (2.3%) | 0 (0.0%) |
| $3,000 or more | 0 (0.0%) | 0 (0.0%) |
| Total | 86 (100.0%) | 24 (100.0%) |
Physical Housing Characteristics in Carlton
Housing Structures in Carlton
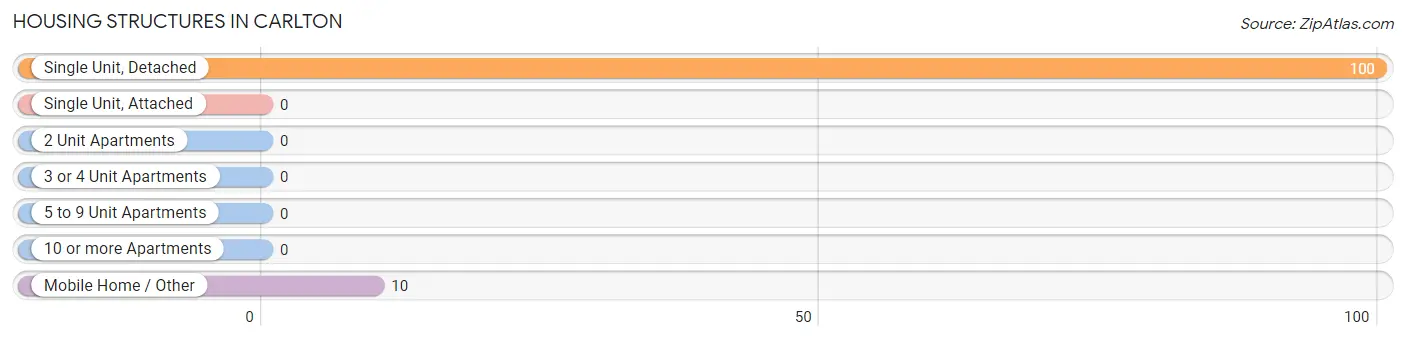
| Structure Type | # Housing Units | % Housing Units |
| Single Unit, Detached | 100 | 90.9% |
| Single Unit, Attached | 0 | 0.0% |
| 2 Unit Apartments | 0 | 0.0% |
| 3 or 4 Unit Apartments | 0 | 0.0% |
| 5 to 9 Unit Apartments | 0 | 0.0% |
| 10 or more Apartments | 0 | 0.0% |
| Mobile Home / Other | 10 | 9.1% |
| Total | 110 | 100.0% |
Housing Structures by Occupancy in Carlton
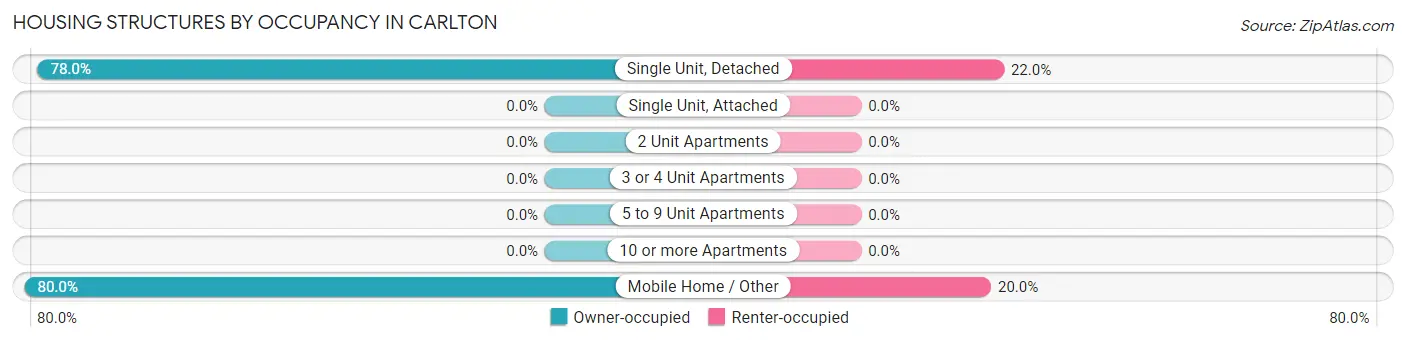
| Structure Type | Owner-occupied | Renter-occupied |
| Single Unit, Detached | 78 (78.0%) | 22 (22.0%) |
| Single Unit, Attached | 0 (0.0%) | 0 (0.0%) |
| 2 Unit Apartments | 0 (0.0%) | 0 (0.0%) |
| 3 or 4 Unit Apartments | 0 (0.0%) | 0 (0.0%) |
| 5 to 9 Unit Apartments | 0 (0.0%) | 0 (0.0%) |
| 10 or more Apartments | 0 (0.0%) | 0 (0.0%) |
| Mobile Home / Other | 8 (80.0%) | 2 (20.0%) |
| Total | 86 (78.2%) | 24 (21.8%) |
Housing Structures by Number of Rooms in Carlton
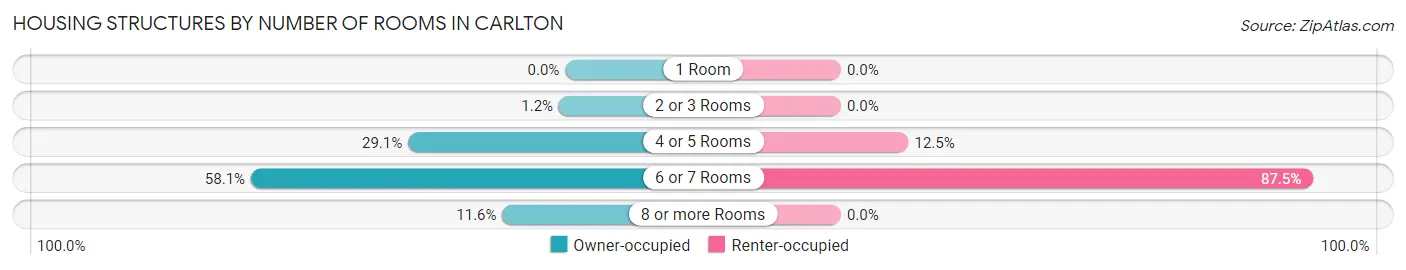
| Number of Rooms | Owner-occupied | Renter-occupied |
| 1 Room | 0 (0.0%) | 0 (0.0%) |
| 2 or 3 Rooms | 1 (1.2%) | 0 (0.0%) |
| 4 or 5 Rooms | 25 (29.1%) | 3 (12.5%) |
| 6 or 7 Rooms | 50 (58.1%) | 21 (87.5%) |
| 8 or more Rooms | 10 (11.6%) | 0 (0.0%) |
| Total | 86 (100.0%) | 24 (100.0%) |
Housing Structure by Heating Type in Carlton
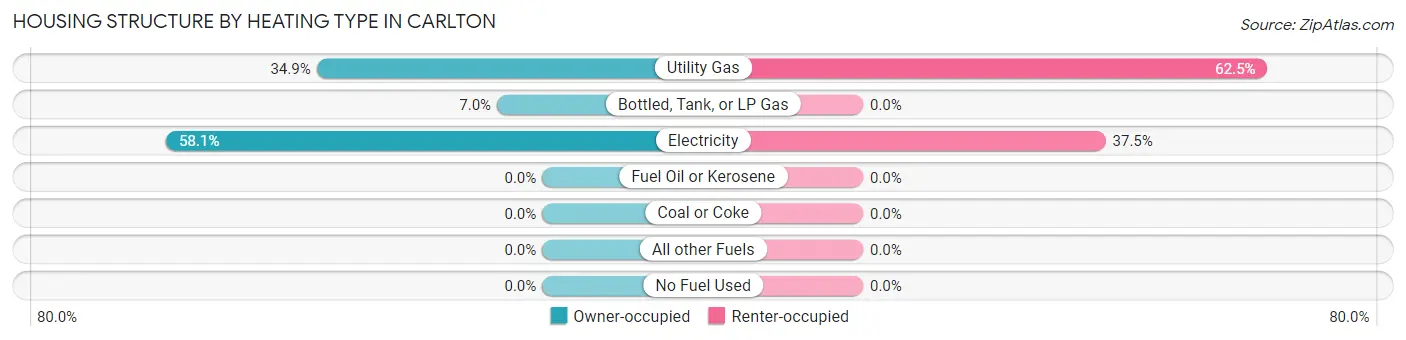
| Heating Type | Owner-occupied | Renter-occupied |
| Utility Gas | 30 (34.9%) | 15 (62.5%) |
| Bottled, Tank, or LP Gas | 6 (7.0%) | 0 (0.0%) |
| Electricity | 50 (58.1%) | 9 (37.5%) |
| Fuel Oil or Kerosene | 0 (0.0%) | 0 (0.0%) |
| Coal or Coke | 0 (0.0%) | 0 (0.0%) |
| All other Fuels | 0 (0.0%) | 0 (0.0%) |
| No Fuel Used | 0 (0.0%) | 0 (0.0%) |
| Total | 86 (100.0%) | 24 (100.0%) |
Household Vehicle Usage in Carlton
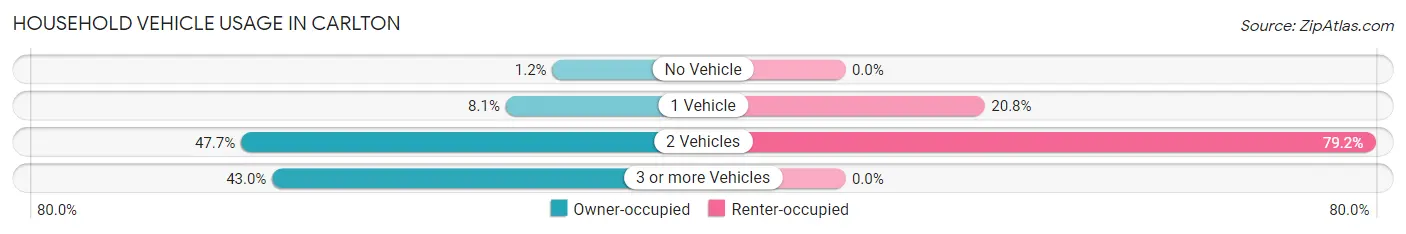
| Vehicles per Household | Owner-occupied | Renter-occupied |
| No Vehicle | 1 (1.2%) | 0 (0.0%) |
| 1 Vehicle | 7 (8.1%) | 5 (20.8%) |
| 2 Vehicles | 41 (47.7%) | 19 (79.2%) |
| 3 or more Vehicles | 37 (43.0%) | 0 (0.0%) |
| Total | 86 (100.0%) | 24 (100.0%) |
Real Estate & Mortgages in Carlton
Real Estate and Mortgage Overview in Carlton
| Characteristic | Without Mortgage | With Mortgage |
| Housing Units | 58 | 28 |
| Median Property Value | $123,000 | $200,000 |
| Median Household Income | $26,932 | $2 |
| Monthly Housing Costs | $516 | $0 |
| Real Estate Taxes | - | - |
Property Value by Mortgage Status in Carlton
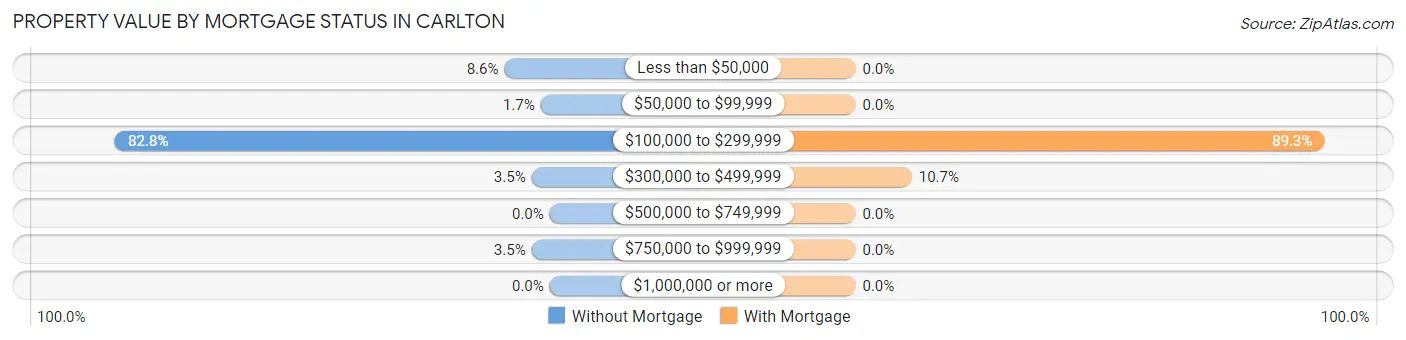
| Property Value | Without Mortgage | With Mortgage |
| Less than $50,000 | 5 (8.6%) | 0 (0.0%) |
| $50,000 to $99,999 | 1 (1.7%) | 0 (0.0%) |
| $100,000 to $299,999 | 48 (82.8%) | 25 (89.3%) |
| $300,000 to $499,999 | 2 (3.5%) | 3 (10.7%) |
| $500,000 to $749,999 | 0 (0.0%) | 0 (0.0%) |
| $750,000 to $999,999 | 2 (3.5%) | 0 (0.0%) |
| $1,000,000 or more | 0 (0.0%) | 0 (0.0%) |
| Total | 58 (100.0%) | 28 (100.0%) |
Household Income by Mortgage Status in Carlton
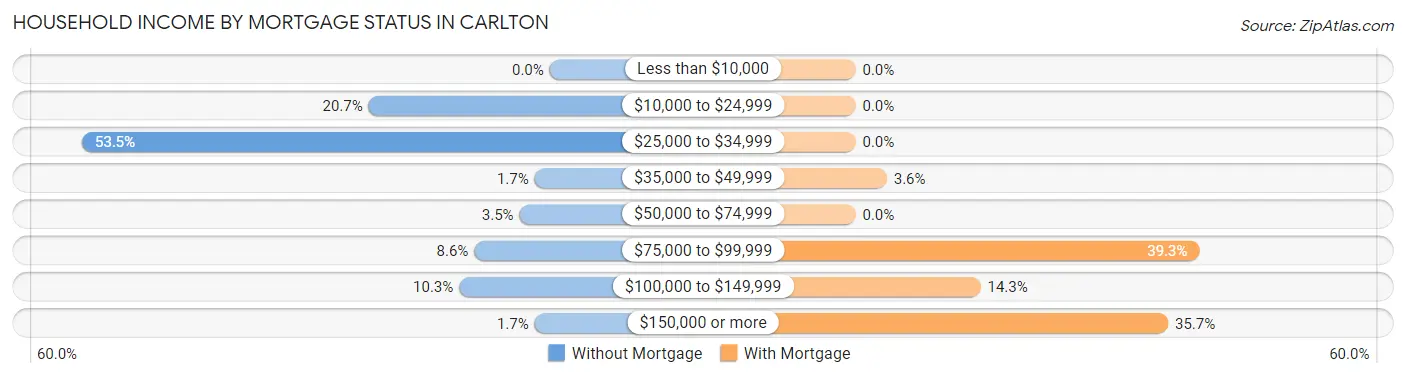
| Household Income | Without Mortgage | With Mortgage |
| Less than $10,000 | 0 (0.0%) | 0 (0.0%) |
| $10,000 to $24,999 | 12 (20.7%) | 0 (0.0%) |
| $25,000 to $34,999 | 31 (53.4%) | 0 (0.0%) |
| $35,000 to $49,999 | 1 (1.7%) | 1 (3.6%) |
| $50,000 to $74,999 | 2 (3.5%) | 0 (0.0%) |
| $75,000 to $99,999 | 5 (8.6%) | 11 (39.3%) |
| $100,000 to $149,999 | 6 (10.3%) | 4 (14.3%) |
| $150,000 or more | 1 (1.7%) | 10 (35.7%) |
| Total | 58 (100.0%) | 28 (100.0%) |
Property Value to Household Income Ratio in Carlton
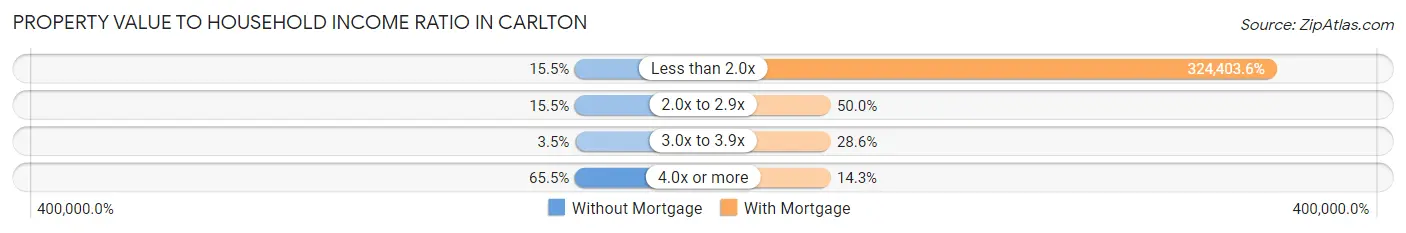
| Value-to-Income Ratio | Without Mortgage | With Mortgage |
| Less than 2.0x | 9 (15.5%) | 90,833 (324,403.6%) |
| 2.0x to 2.9x | 9 (15.5%) | 14 (50.0%) |
| 3.0x to 3.9x | 2 (3.5%) | 8 (28.6%) |
| 4.0x or more | 38 (65.5%) | 4 (14.3%) |
| Total | 58 (100.0%) | 28 (100.0%) |
Real Estate Taxes by Mortgage Status in Carlton
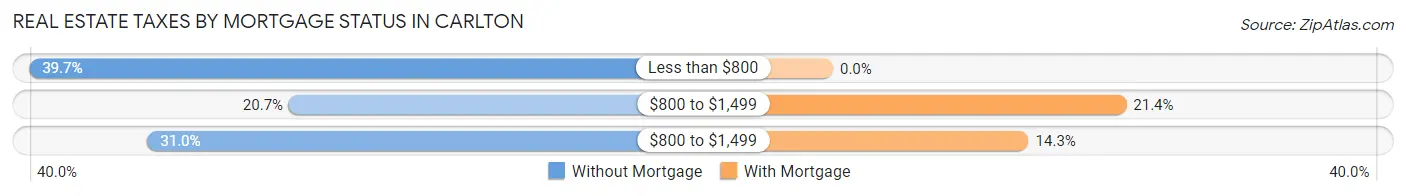
| Property Taxes | Without Mortgage | With Mortgage |
| Less than $800 | 23 (39.7%) | 0 (0.0%) |
| $800 to $1,499 | 12 (20.7%) | 6 (21.4%) |
| $800 to $1,499 | 18 (31.0%) | 4 (14.3%) |
| Total | 58 (100.0%) | 28 (100.0%) |
Health & Disability in Carlton
Health Insurance Coverage by Age in Carlton
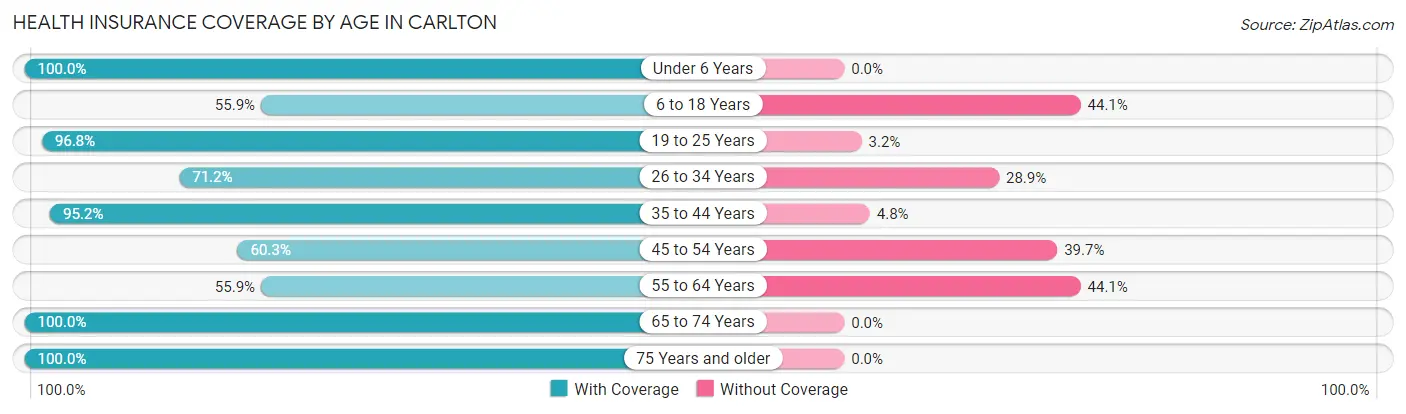
| Age Bracket | With Coverage | Without Coverage |
| Under 6 Years | 32 (100.0%) | 0 (0.0%) |
| 6 to 18 Years | 33 (55.9%) | 26 (44.1%) |
| 19 to 25 Years | 60 (96.8%) | 2 (3.2%) |
| 26 to 34 Years | 37 (71.2%) | 15 (28.8%) |
| 35 to 44 Years | 20 (95.2%) | 1 (4.8%) |
| 45 to 54 Years | 41 (60.3%) | 27 (39.7%) |
| 55 to 64 Years | 33 (55.9%) | 26 (44.1%) |
| 65 to 74 Years | 36 (100.0%) | 0 (0.0%) |
| 75 Years and older | 14 (100.0%) | 0 (0.0%) |
| Total | 306 (75.9%) | 97 (24.1%) |
Health Insurance Coverage by Citizenship Status in Carlton
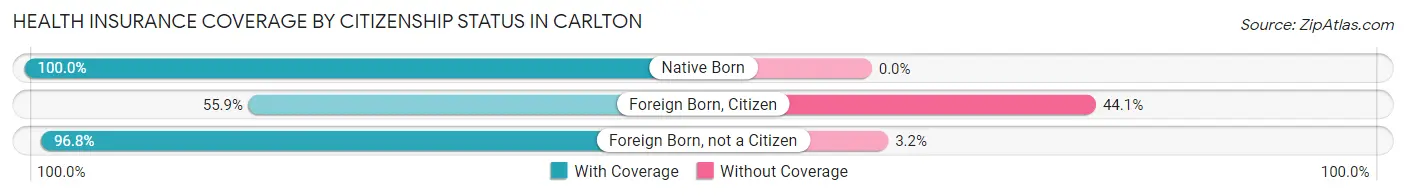
| Citizenship Status | With Coverage | Without Coverage |
| Native Born | 32 (100.0%) | 0 (0.0%) |
| Foreign Born, Citizen | 33 (55.9%) | 26 (44.1%) |
| Foreign Born, not a Citizen | 60 (96.8%) | 2 (3.2%) |
Health Insurance Coverage by Household Income in Carlton
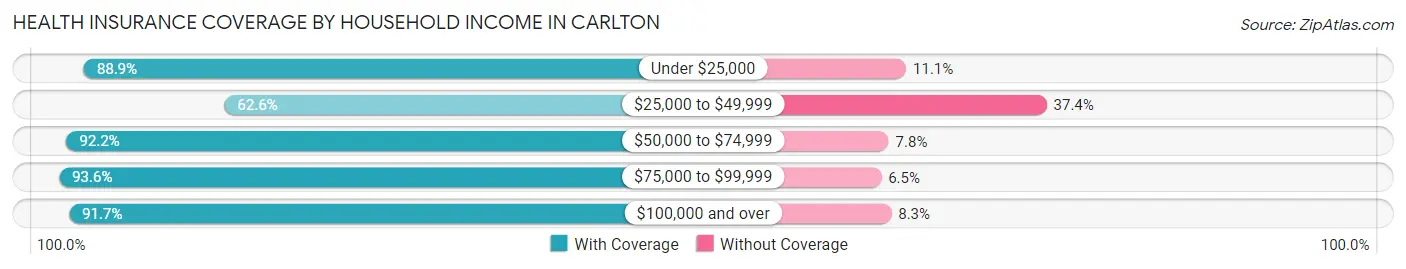
| Household Income | With Coverage | Without Coverage |
| Under $25,000 | 16 (88.9%) | 2 (11.1%) |
| $25,000 to $49,999 | 137 (62.6%) | 82 (37.4%) |
| $50,000 to $74,999 | 47 (92.2%) | 4 (7.8%) |
| $75,000 to $99,999 | 29 (93.5%) | 2 (6.5%) |
| $100,000 and over | 77 (91.7%) | 7 (8.3%) |
Public vs Private Health Insurance Coverage by Age in Carlton
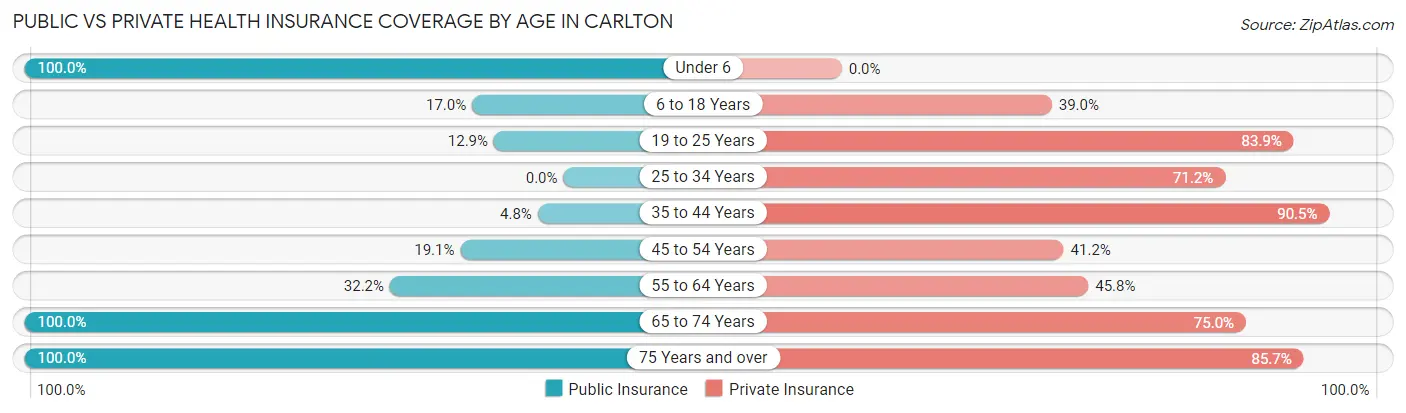
| Age Bracket | Public Insurance | Private Insurance |
| Under 6 | 32 (100.0%) | 0 (0.0%) |
| 6 to 18 Years | 10 (17.0%) | 23 (39.0%) |
| 19 to 25 Years | 8 (12.9%) | 52 (83.9%) |
| 25 to 34 Years | 0 (0.0%) | 37 (71.2%) |
| 35 to 44 Years | 1 (4.8%) | 19 (90.5%) |
| 45 to 54 Years | 13 (19.1%) | 28 (41.2%) |
| 55 to 64 Years | 19 (32.2%) | 27 (45.8%) |
| 65 to 74 Years | 36 (100.0%) | 27 (75.0%) |
| 75 Years and over | 14 (100.0%) | 12 (85.7%) |
| Total | 133 (33.0%) | 225 (55.8%) |
Disability Status by Sex by Age in Carlton
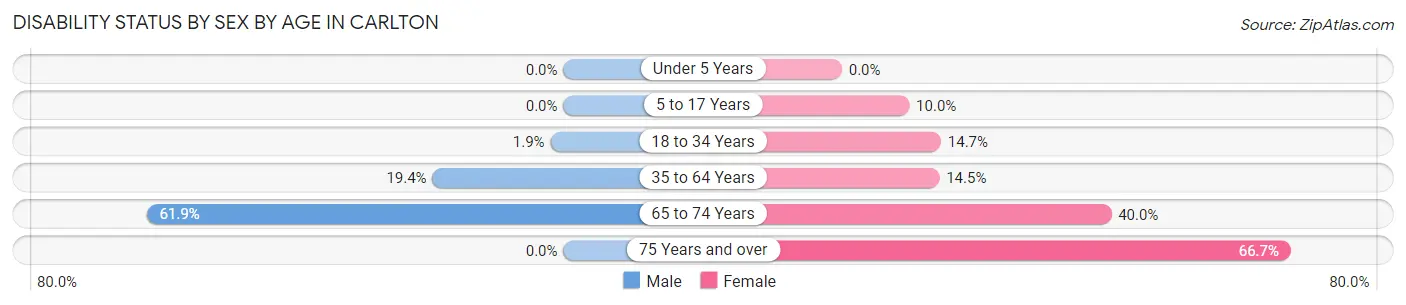
| Age Bracket | Male | Female |
| Under 5 Years | 0 (0.0%) | 0 (0.0%) |
| 5 to 17 Years | 0 (0.0%) | 2 (10.0%) |
| 18 to 34 Years | 2 (1.9%) | 5 (14.7%) |
| 35 to 64 Years | 14 (19.4%) | 11 (14.5%) |
| 65 to 74 Years | 13 (61.9%) | 6 (40.0%) |
| 75 Years and over | 0 (0.0%) | 8 (66.7%) |
Disability Class by Sex by Age in Carlton
Disability Class: Hearing Difficulty
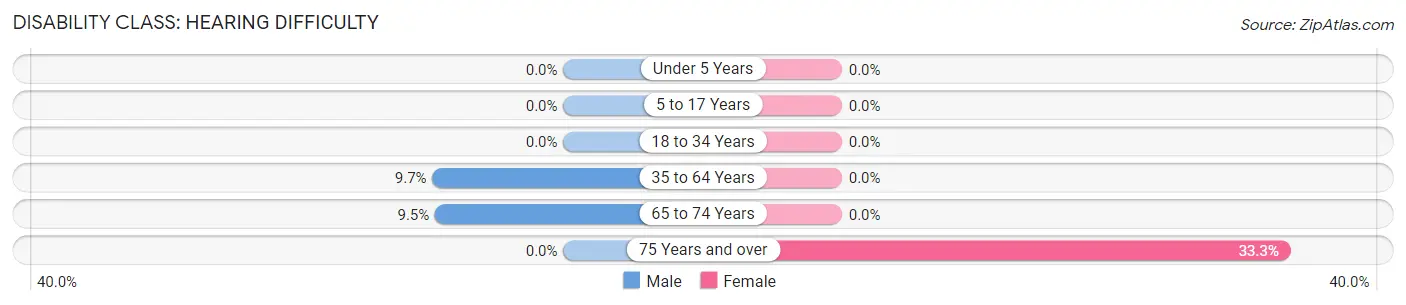
| Age Bracket | Male | Female |
| Under 5 Years | 0 (0.0%) | 0 (0.0%) |
| 5 to 17 Years | 0 (0.0%) | 0 (0.0%) |
| 18 to 34 Years | 0 (0.0%) | 0 (0.0%) |
| 35 to 64 Years | 7 (9.7%) | 0 (0.0%) |
| 65 to 74 Years | 2 (9.5%) | 0 (0.0%) |
| 75 Years and over | 0 (0.0%) | 4 (33.3%) |
Disability Class: Vision Difficulty
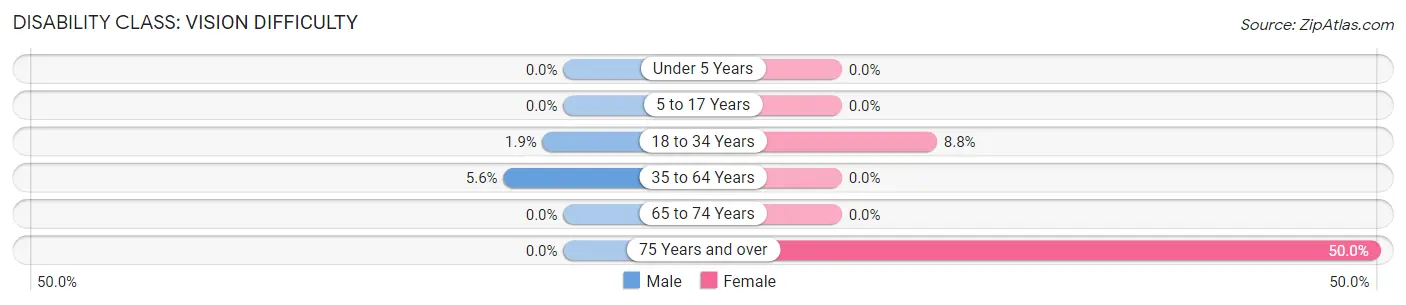
| Age Bracket | Male | Female |
| Under 5 Years | 0 (0.0%) | 0 (0.0%) |
| 5 to 17 Years | 0 (0.0%) | 0 (0.0%) |
| 18 to 34 Years | 2 (1.9%) | 3 (8.8%) |
| 35 to 64 Years | 4 (5.6%) | 0 (0.0%) |
| 65 to 74 Years | 0 (0.0%) | 0 (0.0%) |
| 75 Years and over | 0 (0.0%) | 6 (50.0%) |
Disability Class: Cognitive Difficulty
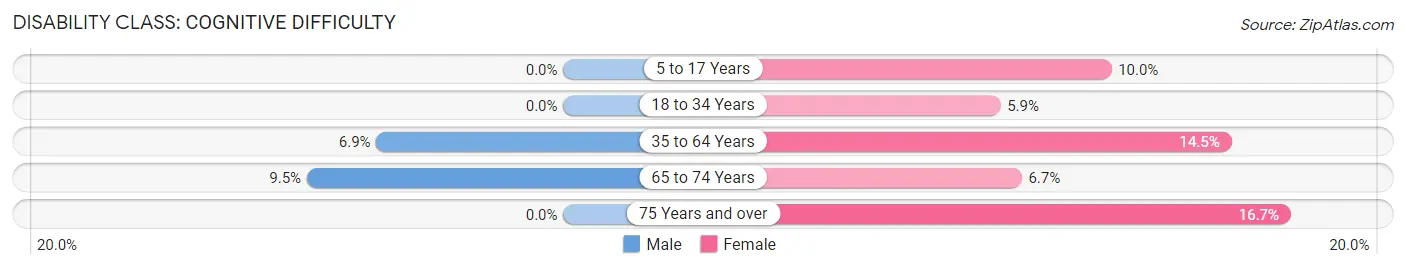
| Age Bracket | Male | Female |
| 5 to 17 Years | 0 (0.0%) | 2 (10.0%) |
| 18 to 34 Years | 0 (0.0%) | 2 (5.9%) |
| 35 to 64 Years | 5 (6.9%) | 11 (14.5%) |
| 65 to 74 Years | 2 (9.5%) | 1 (6.7%) |
| 75 Years and over | 0 (0.0%) | 2 (16.7%) |
Disability Class: Ambulatory Difficulty
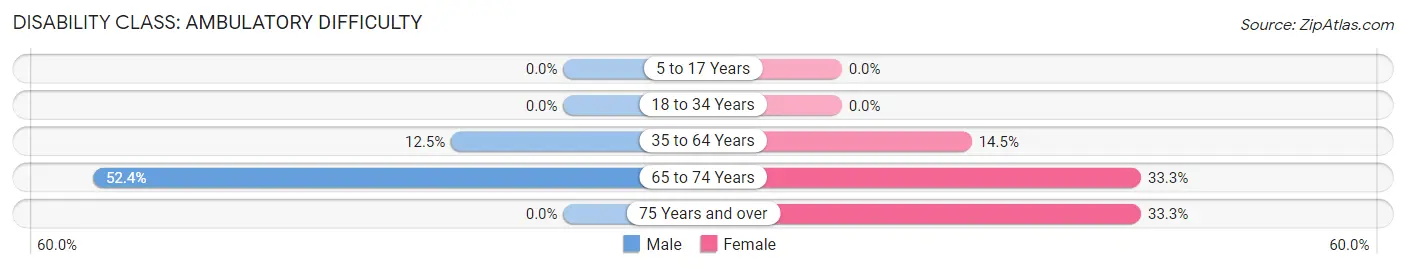
| Age Bracket | Male | Female |
| 5 to 17 Years | 0 (0.0%) | 0 (0.0%) |
| 18 to 34 Years | 0 (0.0%) | 0 (0.0%) |
| 35 to 64 Years | 9 (12.5%) | 11 (14.5%) |
| 65 to 74 Years | 11 (52.4%) | 5 (33.3%) |
| 75 Years and over | 0 (0.0%) | 4 (33.3%) |
Disability Class: Self-Care Difficulty
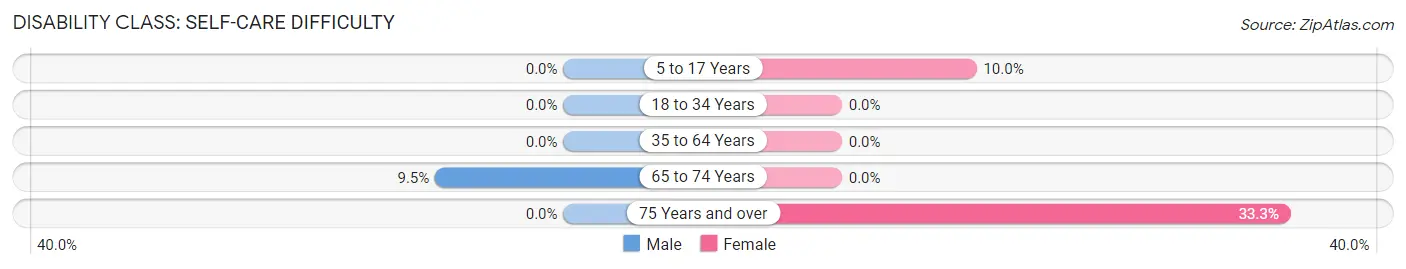
| Age Bracket | Male | Female |
| 5 to 17 Years | 0 (0.0%) | 2 (10.0%) |
| 18 to 34 Years | 0 (0.0%) | 0 (0.0%) |
| 35 to 64 Years | 0 (0.0%) | 0 (0.0%) |
| 65 to 74 Years | 2 (9.5%) | 0 (0.0%) |
| 75 Years and over | 0 (0.0%) | 4 (33.3%) |
Technology Access in Carlton
Computing Device Access in Carlton
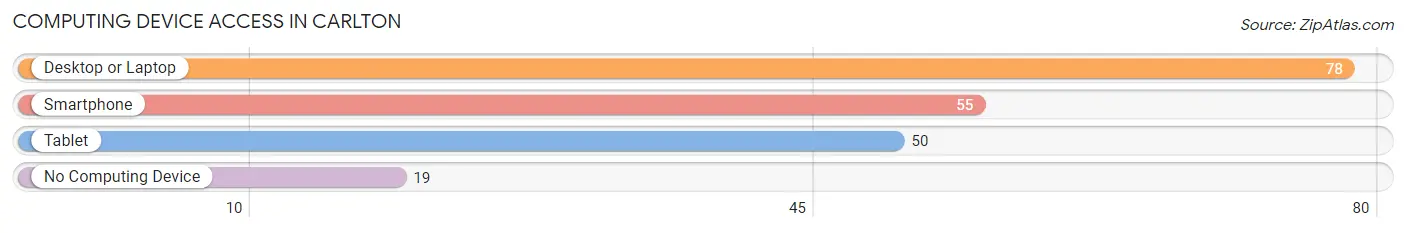
| Device Type | # Households | % Households |
| Desktop or Laptop | 78 | 70.9% |
| Smartphone | 55 | 50.0% |
| Tablet | 50 | 45.5% |
| No Computing Device | 19 | 17.3% |
| Total | 110 | 100.0% |
Internet Access in Carlton
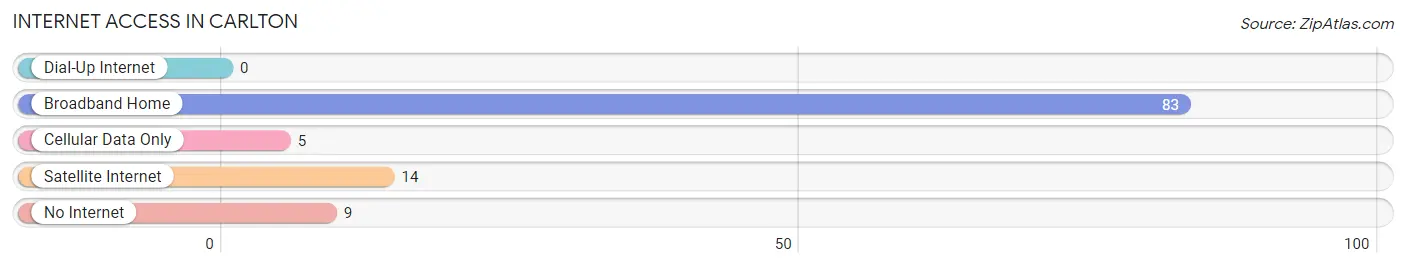
| Internet Type | # Households | % Households |
| Dial-Up Internet | 0 | 0.0% |
| Broadband Home | 83 | 75.4% |
| Cellular Data Only | 5 | 4.5% |
| Satellite Internet | 14 | 12.7% |
| No Internet | 9 | 8.2% |
| Total | 110 | 100.0% |
Carlton Summary
Carlton, Georgia is a small town located in the northwest corner of Georgia, in the foothills of the Appalachian Mountains. It is situated in the Chattahoochee National Forest, and is part of the larger metropolitan area of Dalton-Chattanooga. The town has a population of just over 1,000 people, and is known for its rural charm and small-town atmosphere.
History
The area that is now Carlton was first settled in the early 1800s by settlers from North Carolina. The town was originally known as “Cartersville”, after the Carter family who were among the first settlers. In 1845, the town was renamed “Carlton” after the local postmaster, William Carlton.
The town was incorporated in 1887, and the first mayor was elected in 1888. During the late 19th century, the town was a thriving agricultural center, with cotton, corn, and tobacco being the main crops. The town also had a thriving timber industry, and was home to several sawmills.
In the early 20th century, the town began to decline as the timber industry declined and the agricultural industry shifted to larger cities. The town was hit hard by the Great Depression, and many of the businesses in town closed.
In the 1950s, the town began to experience a resurgence as the timber industry began to recover and the town began to attract new businesses. The town was also home to several manufacturing plants, including a furniture factory and a textile mill.
Geography
Carlton is located in the northwest corner of Georgia, in the foothills of the Appalachian Mountains. The town is situated in the Chattahoochee National Forest, and is part of the larger metropolitan area of Dalton-Chattanooga. The town is located at the intersection of US Highway 41 and Georgia State Route 2.
The town is surrounded by rolling hills and forests, and is home to several small lakes and streams. The town is located approximately 30 miles from Chattanooga, Tennessee, and is about an hour’s drive from Atlanta.
Economy
The economy of Carlton is largely based on agriculture and tourism. The town is home to several small farms, and the surrounding area is known for its production of corn, cotton, and tobacco. The town is also home to several small businesses, including restaurants, shops, and a few manufacturing plants.
The town is also a popular tourist destination, and is home to several attractions, including the historic Carlton House, the Carlton Museum, and the Carlton Country Club. The town is also home to several outdoor recreation areas, including the Chattahoochee National Forest and the nearby Cohutta Wilderness.
Demographics
As of the 2010 census, the population of Carlton was 1,039. The town is predominantly white, with a small African American population. The median household income is $37,000, and the median home value is $90,000. The town has a low unemployment rate, and the poverty rate is below the national average.
Common Questions
What is Per Capita Income in Carlton?
Per Capita income in Carlton is $17,897.
What is the Median Family Income in Carlton?
Median Family Income in Carlton is $48,750.
What is the Median Household income in Carlton?
Median Household Income in Carlton is $43,409.
What is Inequality or Gini Index in Carlton?
Inequality or Gini Index in Carlton is 0.37.
What is the Total Population of Carlton?
Total Population of Carlton is 403.
What is the Total Male Population of Carlton?
Total Male Population of Carlton is 224.
What is the Total Female Population of Carlton?
Total Female Population of Carlton is 179.
What is the Ratio of Males per 100 Females in Carlton?
There are 125.14 Males per 100 Females in Carlton.
What is the Ratio of Females per 100 Males in Carlton?
There are 79.91 Females per 100 Males in Carlton.
What is the Median Population Age in Carlton?
Median Population Age in Carlton is 34.1 Years.
What is the Average Family Size in Carlton
Average Family Size in Carlton is 4.1 People.
What is the Average Household Size in Carlton
Average Household Size in Carlton is 3.7 People.
How Large is the Labor Force in Carlton?
There are 154 People in the Labor Forcein in Carlton.
What is the Percentage of People in the Labor Force in Carlton?
44.3% of People are in the Labor Force in Carlton.
What is the Unemployment Rate in Carlton?
Unemployment Rate in Carlton is 13.0%.