Worthington, MN Map & Demographics
Worthington Map
Worthington Overview
$25,822
PER CAPITA INCOME
$70,082
AVG FAMILY INCOME
$58,690
AVG HOUSEHOLD INCOME
17.5%
WAGE / INCOME GAP [ % ]
82.5¢/ $1
WAGE / INCOME GAP [ $ ]
$13,833
FAMILY INCOME DEFICIT
0.41
INEQUALITY / GINI INDEX
13,838
TOTAL POPULATION
6,960
MALE POPULATION
6,878
FEMALE POPULATION
101.19
MALES / 100 FEMALES
98.82
FEMALES / 100 MALES
33.1
MEDIAN AGE
3.7
AVG FAMILY SIZE
2.9
AVG HOUSEHOLD SIZE
6,641
LABOR FORCE [ PEOPLE ]
64.6%
PERCENT IN LABOR FORCE
3.5%
UNEMPLOYMENT RATE
Worthington Zip Codes
Worthington Area Codes
Income in Worthington
Income Overview in Worthington
Per Capita Income in Worthington is $25,822, while median incomes of families and households are $70,082 and $58,690 respectively.
| Characteristic | Number | Measure |
| Per Capita Income | 13,838 | $25,822 |
| Median Family Income | 2,933 | $70,082 |
| Mean Family Income | 2,933 | $82,762 |
| Median Household Income | 4,570 | $58,690 |
| Mean Household Income | 4,570 | $71,854 |
| Income Deficit | 2,933 | $13,833 |
| Wage / Income Gap (%) | 13,838 | 17.46% |
| Wage / Income Gap ($) | 13,838 | 82.54¢ per $1 |
| Gini / Inequality Index | 13,838 | 0.41 |
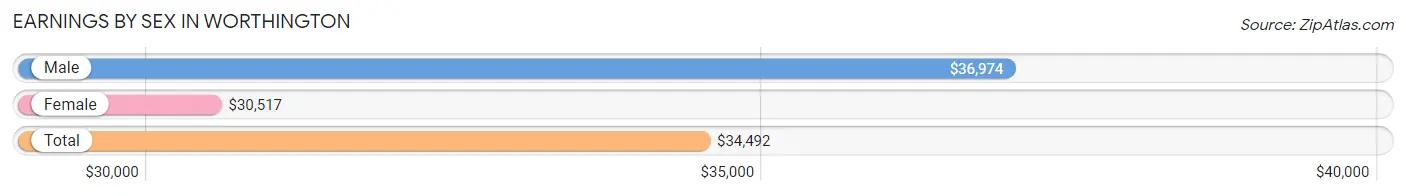
Earnings by Sex in Worthington
Average Earnings in Worthington are $34,492, $36,974 for men and $30,517 for women, a difference of 17.5%.
| Sex | Number | Average Earnings |
| Male | 3,979 (55.1%) | $36,974 |
| Female | 3,247 (44.9%) | $30,517 |
| Total | 7,226 (100.0%) | $34,492 |
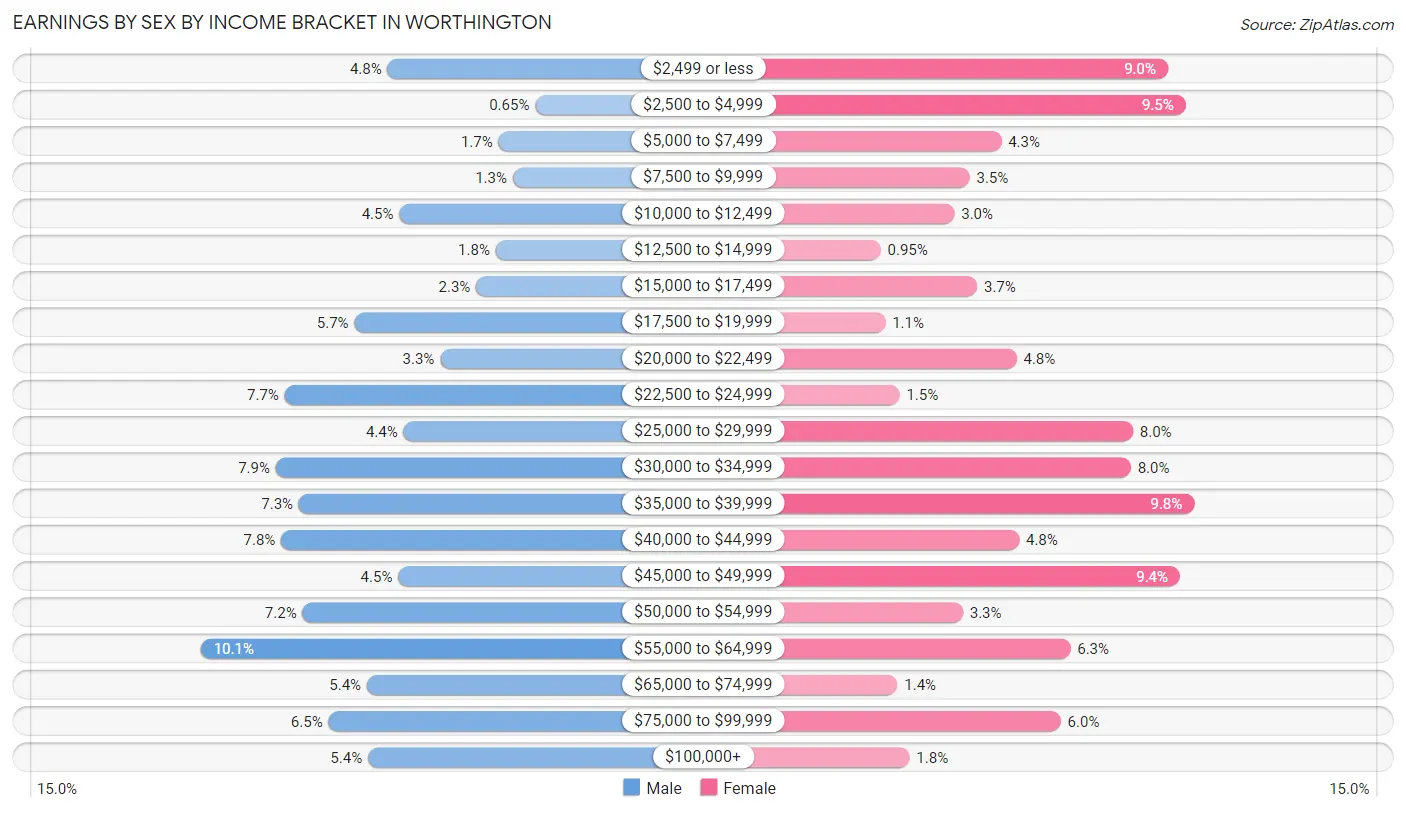
Earnings by Sex by Income Bracket in Worthington
The most common earnings brackets in Worthington are $55,000 to $64,999 for men (400 | 10.1%) and $35,000 to $39,999 for women (317 | 9.8%).
| Income | Male | Female |
| $2,499 or less | 191 (4.8%) | 293 (9.0%) |
| $2,500 to $4,999 | 26 (0.6%) | 309 (9.5%) |
| $5,000 to $7,499 | 67 (1.7%) | 141 (4.3%) |
| $7,500 to $9,999 | 51 (1.3%) | 112 (3.5%) |
| $10,000 to $12,499 | 178 (4.5%) | 98 (3.0%) |
| $12,500 to $14,999 | 70 (1.8%) | 31 (0.9%) |
| $15,000 to $17,499 | 92 (2.3%) | 119 (3.7%) |
| $17,500 to $19,999 | 228 (5.7%) | 35 (1.1%) |
| $20,000 to $22,499 | 132 (3.3%) | 155 (4.8%) |
| $22,500 to $24,999 | 306 (7.7%) | 48 (1.5%) |
| $25,000 to $29,999 | 173 (4.3%) | 261 (8.0%) |
| $30,000 to $34,999 | 316 (7.9%) | 259 (8.0%) |
| $35,000 to $39,999 | 290 (7.3%) | 317 (9.8%) |
| $40,000 to $44,999 | 310 (7.8%) | 157 (4.8%) |
| $45,000 to $49,999 | 179 (4.5%) | 304 (9.4%) |
| $50,000 to $54,999 | 286 (7.2%) | 106 (3.3%) |
| $55,000 to $64,999 | 400 (10.1%) | 204 (6.3%) |
| $65,000 to $74,999 | 214 (5.4%) | 46 (1.4%) |
| $75,000 to $99,999 | 257 (6.5%) | 195 (6.0%) |
| $100,000+ | 213 (5.3%) | 57 (1.8%) |
| Total | 3,979 (100.0%) | 3,247 (100.0%) |
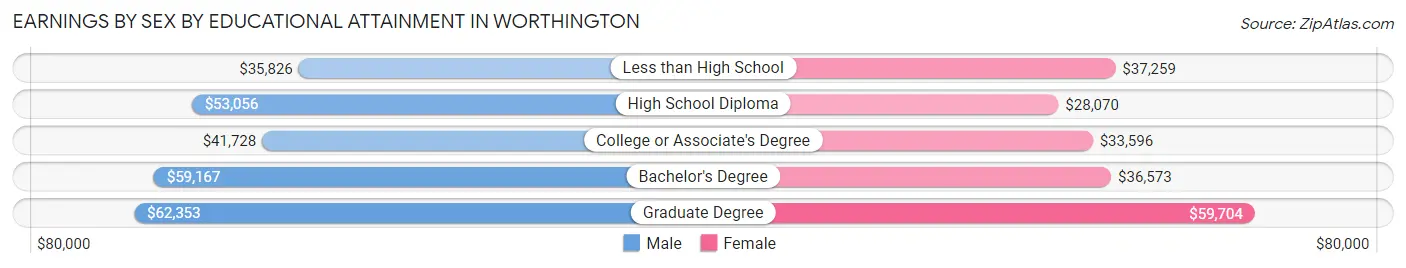
Earnings by Sex by Educational Attainment in Worthington
Average earnings in Worthington are $41,438 for men and $35,533 for women, a difference of 14.2%. Men with an educational attainment of graduate degree enjoy the highest average annual earnings of $62,353, while those with less than high school education earn the least with $35,826. Women with an educational attainment of graduate degree earn the most with the average annual earnings of $59,704, while those with high school diploma education have the smallest earnings of $28,070.
| Educational Attainment | Male Income | Female Income |
| Less than High School | $35,826 | $37,259 |
| High School Diploma | $53,056 | $28,070 |
| College or Associate's Degree | $41,728 | $33,596 |
| Bachelor's Degree | $59,167 | $36,573 |
| Graduate Degree | $62,353 | $59,704 |
| Total | $41,438 | $35,533 |
Family Income in Worthington
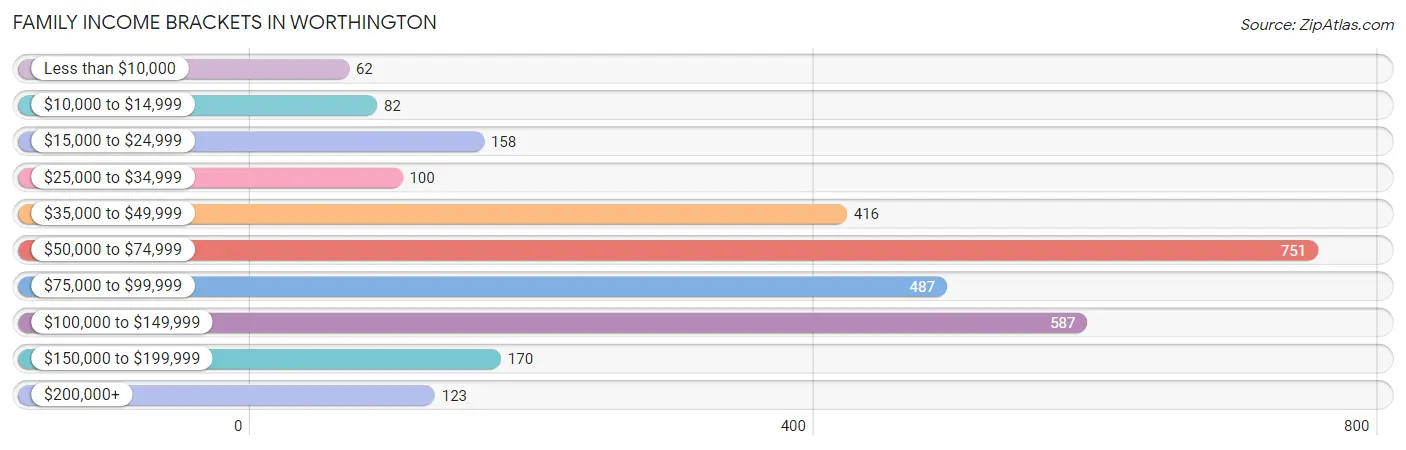
Family Income Brackets in Worthington
According to the Worthington family income data, there are 751 families falling into the $50,000 to $74,999 income range, which is the most common income bracket and makes up 25.6% of all families. Conversely, the less than $10,000 income bracket is the least frequent group with only 62 families (2.1%) belonging to this category.
| Income Bracket | # Families | % Families |
| Less than $10,000 | 62 | 2.1% |
| $10,000 to $14,999 | 82 | 2.8% |
| $15,000 to $24,999 | 158 | 5.4% |
| $25,000 to $34,999 | 100 | 3.4% |
| $35,000 to $49,999 | 416 | 14.2% |
| $50,000 to $74,999 | 751 | 25.6% |
| $75,000 to $99,999 | 487 | 16.6% |
| $100,000 to $149,999 | 587 | 20.0% |
| $150,000 to $199,999 | 170 | 5.8% |
| $200,000+ | 123 | 4.2% |
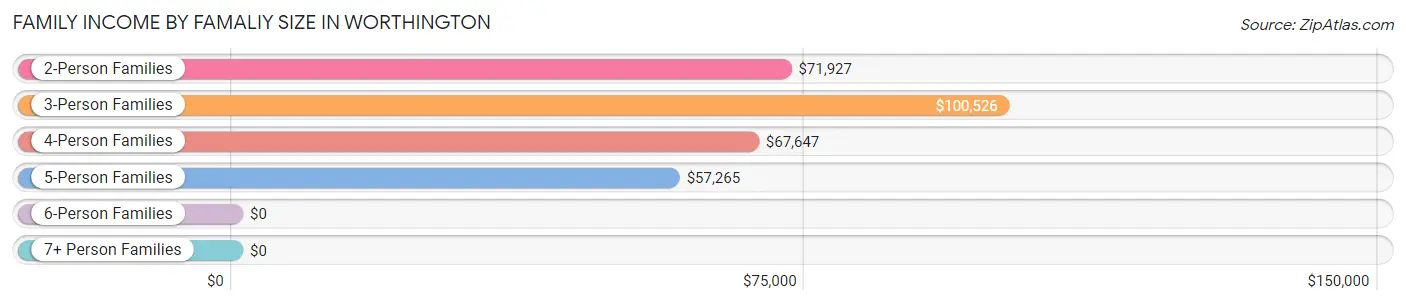
Family Income by Famaliy Size in Worthington
3-person families (712 | 24.3%) account for the highest median family income in Worthington with $100,526 per family, while 2-person families (1,120 | 38.2%) have the highest median income of $35,964 per family member.
| Income Bracket | # Families | Median Income |
| 2-Person Families | 1,120 (38.2%) | $71,927 |
| 3-Person Families | 712 (24.3%) | $100,526 |
| 4-Person Families | 480 (16.4%) | $67,647 |
| 5-Person Families | 351 (12.0%) | $57,265 |
| 6-Person Families | 158 (5.4%) | $0 |
| 7+ Person Families | 112 (3.8%) | $0 |
| Total | 2,933 (100.0%) | $70,082 |
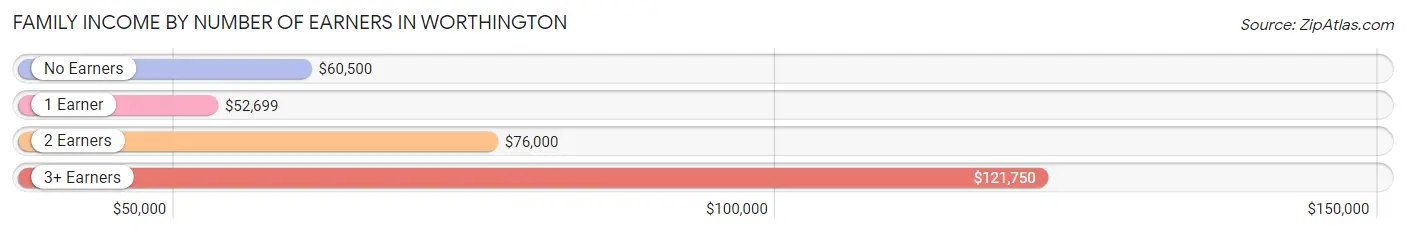
Family Income by Number of Earners in Worthington
The median family income in Worthington is $70,082, with families comprising 3+ earners (474) having the highest median family income of $121,750, while families with 1 earner (821) have the lowest median family income of $52,699, accounting for 16.2% and 28.0% of families, respectively.
| Number of Earners | # Families | Median Income |
| No Earners | 320 (10.9%) | $60,500 |
| 1 Earner | 821 (28.0%) | $52,699 |
| 2 Earners | 1,318 (44.9%) | $76,000 |
| 3+ Earners | 474 (16.2%) | $121,750 |
| Total | 2,933 (100.0%) | $70,082 |
Household Income in Worthington
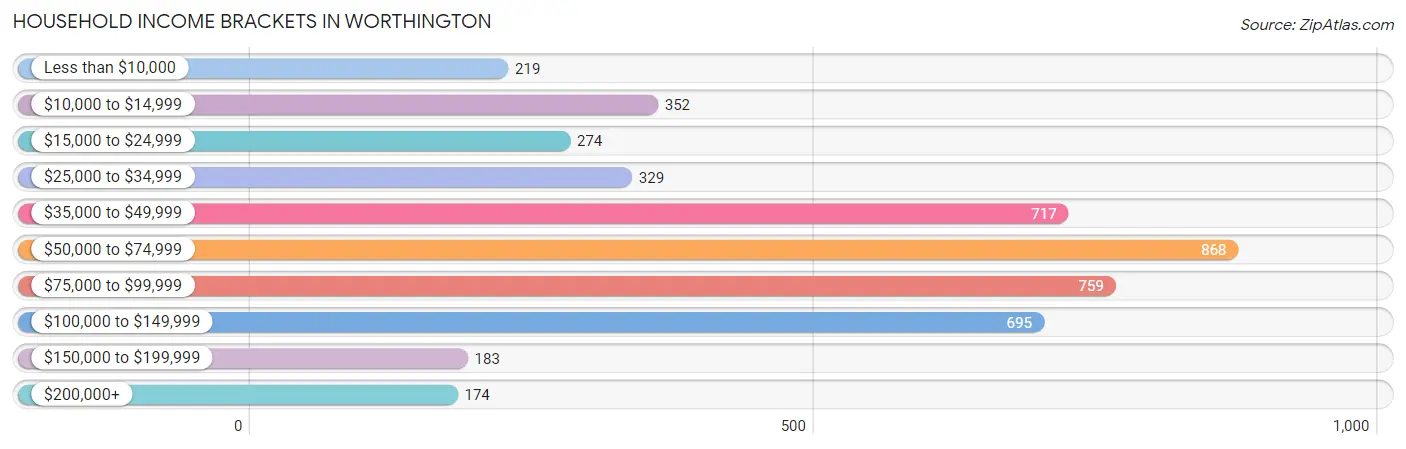
Household Income Brackets in Worthington
With 868 households falling in the category, the $50,000 to $74,999 income range is the most frequent in Worthington, accounting for 19.0% of all households. In contrast, only 174 households (3.8%) fall into the $200,000+ income bracket, making it the least populous group.
| Income Bracket | # Households | % Households |
| Less than $10,000 | 219 | 4.8% |
| $10,000 to $14,999 | 352 | 7.7% |
| $15,000 to $24,999 | 274 | 6.0% |
| $25,000 to $34,999 | 329 | 7.2% |
| $35,000 to $49,999 | 717 | 15.7% |
| $50,000 to $74,999 | 868 | 19.0% |
| $75,000 to $99,999 | 759 | 16.6% |
| $100,000 to $149,999 | 695 | 15.2% |
| $150,000 to $199,999 | 183 | 4.0% |
| $200,000+ | 174 | 3.8% |
Household Income by Householder Age in Worthington
The median household income in Worthington is $58,690, with the highest median household income of $68,305 found in the 45 to 64 years age bracket for the primary householder. A total of 1,644 households (36.0%) fall into this category. Meanwhile, the 15 to 24 years age bracket for the primary householder has the lowest median household income of $0, with 250 households (5.5%) in this group.
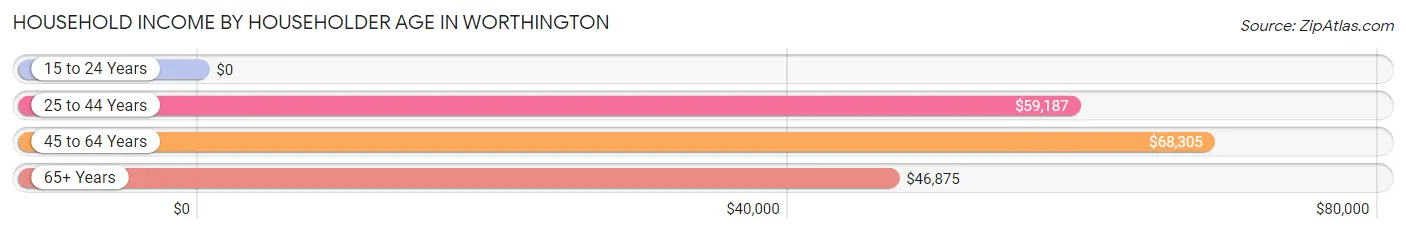
| Income Bracket | # Households | Median Income |
| 15 to 24 Years | 250 (5.5%) | $0 |
| 25 to 44 Years | 1,406 (30.8%) | $59,187 |
| 45 to 64 Years | 1,644 (36.0%) | $68,305 |
| 65+ Years | 1,270 (27.8%) | $46,875 |
| Total | 4,570 (100.0%) | $58,690 |
Poverty in Worthington
Income Below Poverty by Sex and Age in Worthington
With 11.9% poverty level for males and 19.0% for females among the residents of Worthington, under 5 year old males and 12 to 14 year old females are the most vulnerable to poverty, with 135 males (25.2%) and 137 females (63.1%) in their respective age groups living below the poverty level.
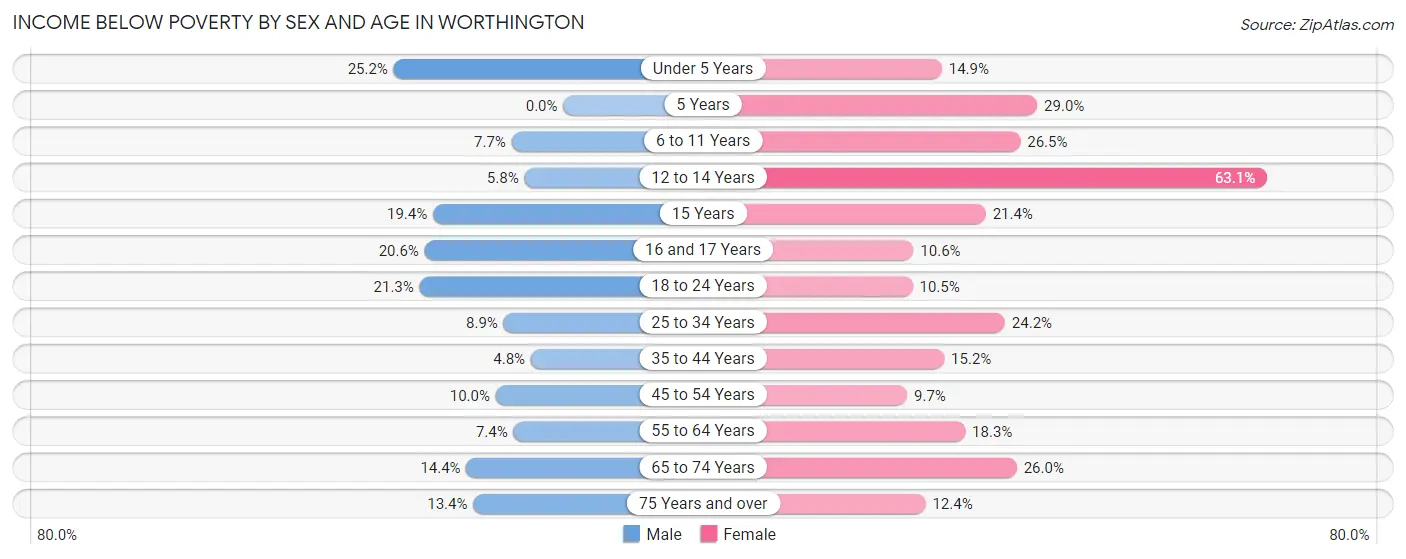
| Age Bracket | Male | Female |
| Under 5 Years | 135 (25.2%) | 101 (14.8%) |
| 5 Years | 0 (0.0%) | 38 (29.0%) |
| 6 to 11 Years | 47 (7.7%) | 172 (26.5%) |
| 12 to 14 Years | 22 (5.8%) | 137 (63.1%) |
| 15 Years | 30 (19.4%) | 25 (21.4%) |
| 16 and 17 Years | 42 (20.6%) | 27 (10.6%) |
| 18 to 24 Years | 159 (21.3%) | 71 (10.5%) |
| 25 to 34 Years | 77 (8.9%) | 203 (24.2%) |
| 35 to 44 Years | 40 (4.8%) | 128 (15.2%) |
| 45 to 54 Years | 76 (10.0%) | 61 (9.7%) |
| 55 to 64 Years | 53 (7.4%) | 118 (18.3%) |
| 65 to 74 Years | 80 (14.4%) | 126 (26.0%) |
| 75 Years and over | 56 (13.4%) | 63 (12.4%) |
| Total | 817 (11.9%) | 1,270 (19.0%) |
Income Above Poverty by Sex and Age in Worthington
According to the poverty statistics in Worthington, males aged 5 years and females aged 45 to 54 years are the age groups that are most secure financially, with 100.0% of males and 90.3% of females in these age groups living above the poverty line.
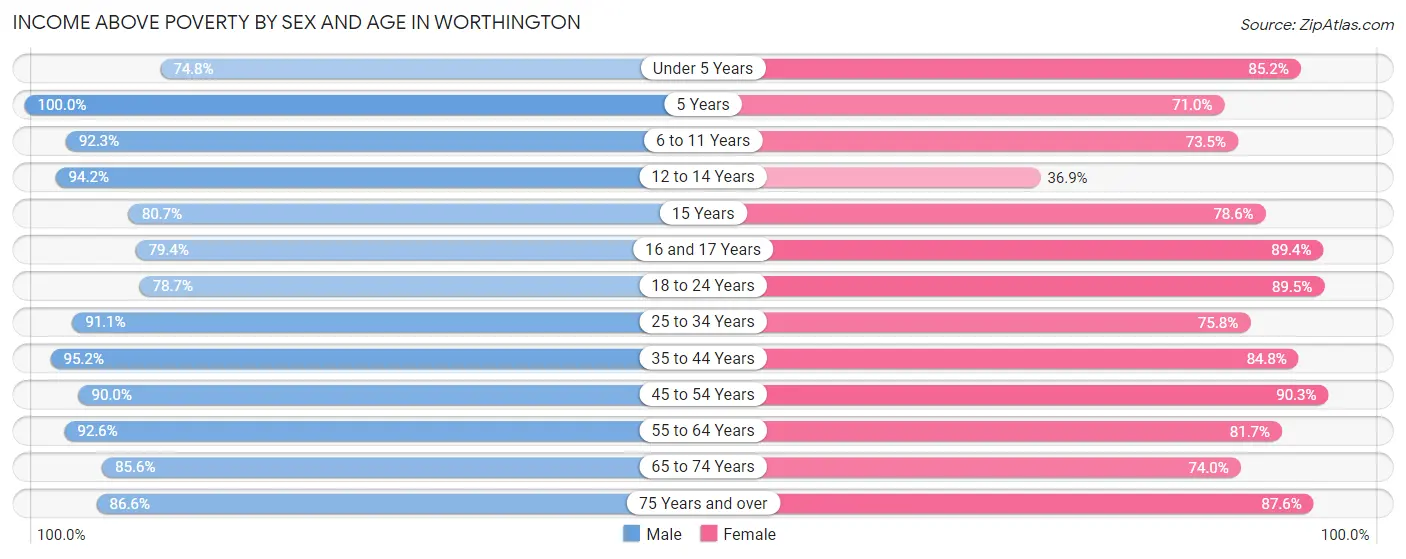
| Age Bracket | Male | Female |
| Under 5 Years | 401 (74.8%) | 579 (85.2%) |
| 5 Years | 62 (100.0%) | 93 (71.0%) |
| 6 to 11 Years | 566 (92.3%) | 477 (73.5%) |
| 12 to 14 Years | 359 (94.2%) | 80 (36.9%) |
| 15 Years | 125 (80.6%) | 92 (78.6%) |
| 16 and 17 Years | 162 (79.4%) | 227 (89.4%) |
| 18 to 24 Years | 586 (78.7%) | 605 (89.5%) |
| 25 to 34 Years | 792 (91.1%) | 635 (75.8%) |
| 35 to 44 Years | 790 (95.2%) | 714 (84.8%) |
| 45 to 54 Years | 682 (90.0%) | 568 (90.3%) |
| 55 to 64 Years | 664 (92.6%) | 526 (81.7%) |
| 65 to 74 Years | 476 (85.6%) | 359 (74.0%) |
| 75 Years and over | 363 (86.6%) | 444 (87.6%) |
| Total | 6,028 (88.1%) | 5,399 (81.0%) |
Income Below Poverty Among Married-Couple Families in Worthington
The poverty statistics for married-couple families in Worthington show that 6.7% or 112 of the total 1,665 families live below the poverty line. Families with 3 or 4 children have the highest poverty rate of 34.2%, comprising of 70 families. On the other hand, families with 5 or more children have the lowest poverty rate of 0.0%, which includes 0 families.
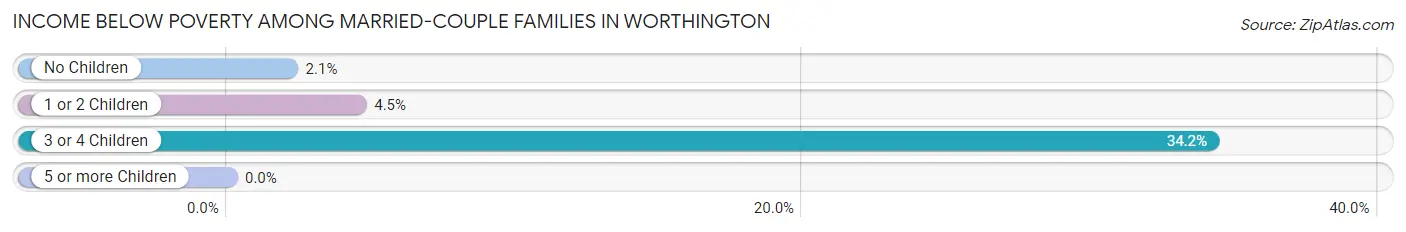
| Children | Above Poverty | Below Poverty |
| No Children | 930 (97.9%) | 20 (2.1%) |
| 1 or 2 Children | 467 (95.5%) | 22 (4.5%) |
| 3 or 4 Children | 135 (65.8%) | 70 (34.2%) |
| 5 or more Children | 21 (100.0%) | 0 (0.0%) |
| Total | 1,553 (93.3%) | 112 (6.7%) |
Income Below Poverty Among Single-Parent Households in Worthington
According to the poverty data in Worthington, 7.9% or 45 single-father households and 18.6% or 130 single-mother households are living below the poverty line. Among single-father households, those with 1 or 2 children have the highest poverty rate, with 24 households (9.2%) experiencing poverty. Likewise, among single-mother households, those with 3 or 4 children have the highest poverty rate, with 69 households (35.4%) falling below the poverty line.
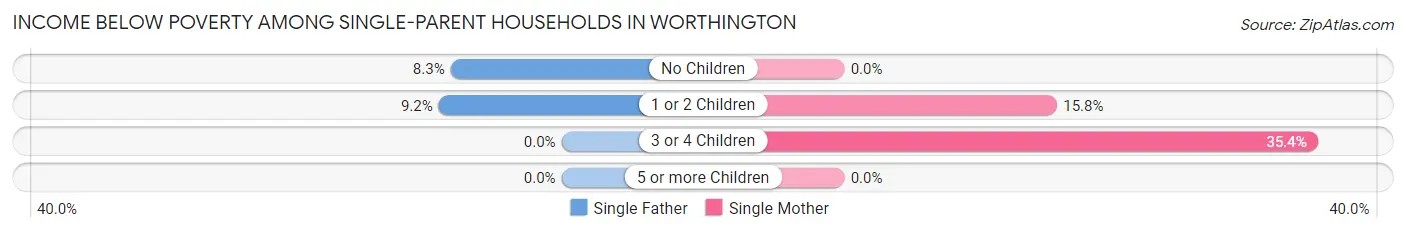
| Children | Single Father | Single Mother |
| No Children | 21 (8.3%) | 0 (0.0%) |
| 1 or 2 Children | 24 (9.2%) | 61 (15.8%) |
| 3 or 4 Children | 0 (0.0%) | 69 (35.4%) |
| 5 or more Children | 0 (0.0%) | 0 (0.0%) |
| Total | 45 (7.9%) | 130 (18.6%) |
Income Below Poverty Among Married-Couple vs Single-Parent Households in Worthington
The poverty data for Worthington shows that 112 of the married-couple family households (6.7%) and 175 of the single-parent households (13.8%) are living below the poverty level. Within the married-couple family households, those with 3 or 4 children have the highest poverty rate, with 70 households (34.2%) falling below the poverty line. Among the single-parent households, those with 3 or 4 children have the highest poverty rate, with 69 household (27.9%) living below poverty.
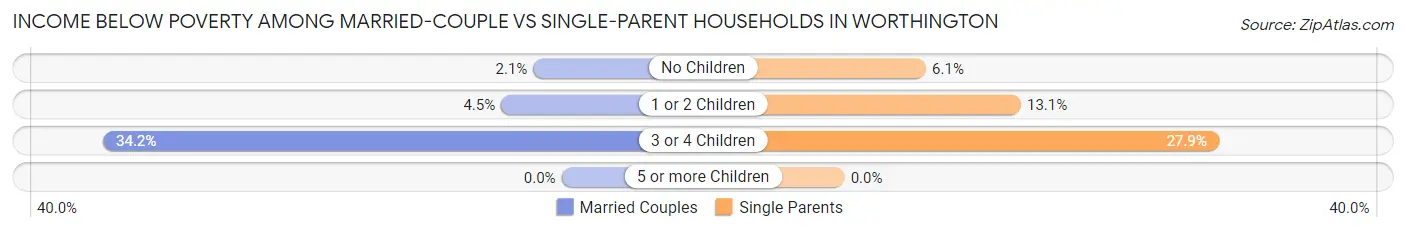
| Children | Married-Couple Families | Single-Parent Households |
| No Children | 20 (2.1%) | 21 (6.1%) |
| 1 or 2 Children | 22 (4.5%) | 85 (13.1%) |
| 3 or 4 Children | 70 (34.2%) | 69 (27.9%) |
| 5 or more Children | 0 (0.0%) | 0 (0.0%) |
| Total | 112 (6.7%) | 175 (13.8%) |
Race in Worthington
The most populous races in Worthington are White / Caucasian (7,774 | 56.2%), Hispanic or Latino (5,671 | 41.0%), and Some other Race (1,964 | 14.2%).
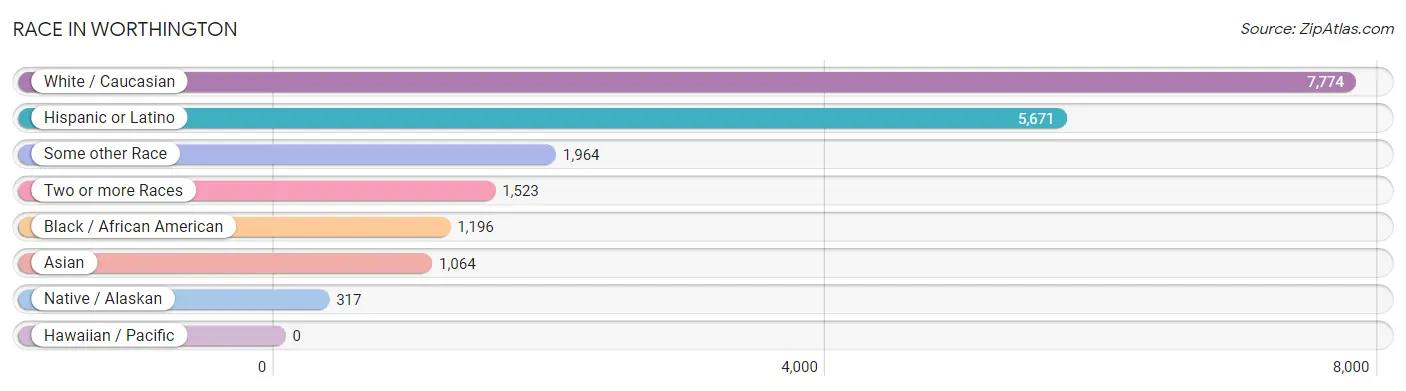
| Race | # Population | % Population |
| Asian | 1,064 | 7.7% |
| Black / African American | 1,196 | 8.6% |
| Hawaiian / Pacific | 0 | 0.0% |
| Hispanic or Latino | 5,671 | 41.0% |
| Native / Alaskan | 317 | 2.3% |
| White / Caucasian | 7,774 | 56.2% |
| Two or more Races | 1,523 | 11.0% |
| Some other Race | 1,964 | 14.2% |
| Total | 13,838 | 100.0% |
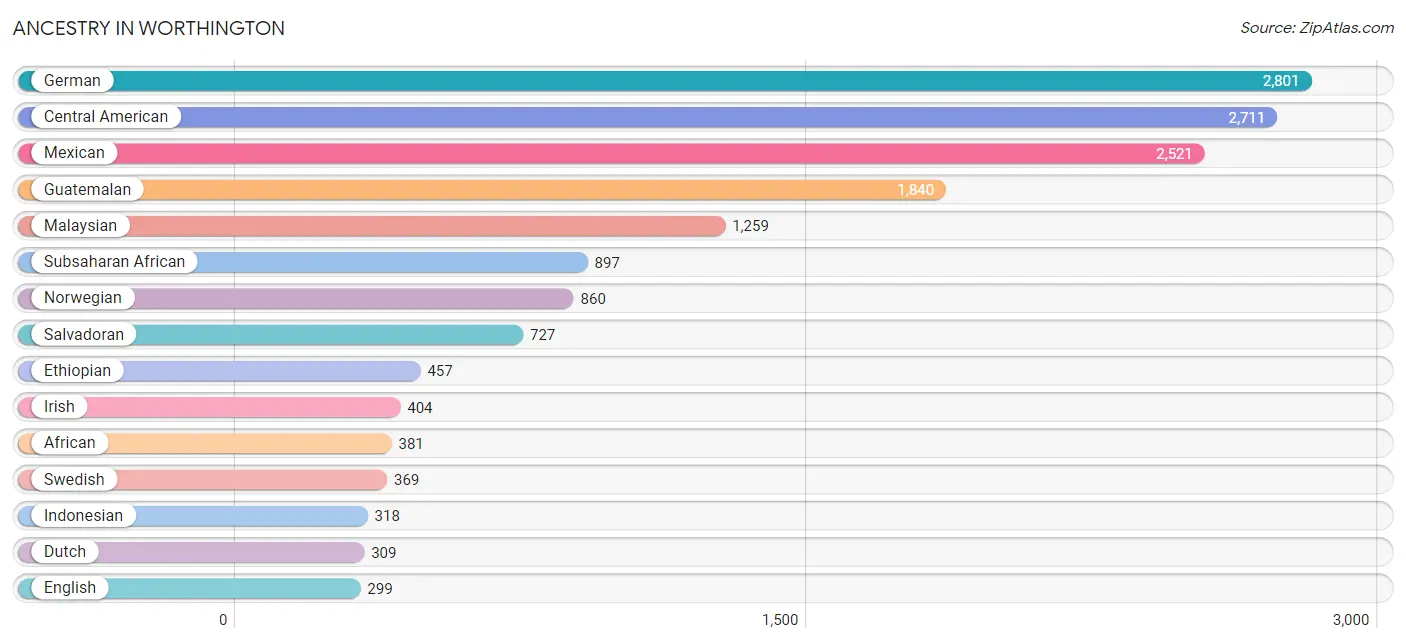
Ancestry in Worthington
The most populous ancestries reported in Worthington are German (2,801 | 20.2%), Central American (2,711 | 19.6%), Mexican (2,521 | 18.2%), Guatemalan (1,840 | 13.3%), and Malaysian (1,259 | 9.1%), together accounting for 80.4% of all Worthington residents.
| Ancestry | # Population | % Population |
| African | 381 | 2.8% |
| American | 186 | 1.3% |
| Belgian | 8 | 0.1% |
| Canadian | 8 | 0.1% |
| Central American | 2,711 | 19.6% |
| Central American Indian | 250 | 1.8% |
| Colombian | 31 | 0.2% |
| Czech | 65 | 0.5% |
| Danish | 174 | 1.3% |
| Dominican | 27 | 0.2% |
| Dutch | 309 | 2.2% |
| Ecuadorian | 3 | 0.0% |
| English | 299 | 2.2% |
| Ethiopian | 457 | 3.3% |
| European | 50 | 0.4% |
| Finnish | 58 | 0.4% |
| French | 65 | 0.5% |
| French Canadian | 42 | 0.3% |
| German | 2,801 | 20.2% |
| Guatemalan | 1,840 | 13.3% |
| Haitian | 23 | 0.2% |
| Honduran | 144 | 1.0% |
| Indonesian | 318 | 2.3% |
| Irish | 404 | 2.9% |
| Italian | 49 | 0.4% |
| Japanese | 32 | 0.2% |
| Kenyan | 30 | 0.2% |
| Korean | 13 | 0.1% |
| Luxembourger | 125 | 0.9% |
| Malaysian | 1,259 | 9.1% |
| Mexican | 2,521 | 18.2% |
| Northern European | 20 | 0.1% |
| Norwegian | 860 | 6.2% |
| Pakistani | 165 | 1.2% |
| Polish | 22 | 0.2% |
| Puerto Rican | 45 | 0.3% |
| Russian | 7 | 0.1% |
| Salvadoran | 727 | 5.2% |
| Scandinavian | 9 | 0.1% |
| Scotch-Irish | 18 | 0.1% |
| Scottish | 134 | 1.0% |
| Serbian | 11 | 0.1% |
| Sioux | 31 | 0.2% |
| South American | 34 | 0.3% |
| Spanish | 29 | 0.2% |
| Sri Lankan | 75 | 0.5% |
| Subsaharan African | 897 | 6.5% |
| Sudanese | 81 | 0.6% |
| Swedish | 369 | 2.7% |
| Swiss | 38 | 0.3% |
| Thai | 47 | 0.3% |
| Welsh | 61 | 0.4% |
| Yugoslavian | 9 | 0.1% | View All 53 Rows |
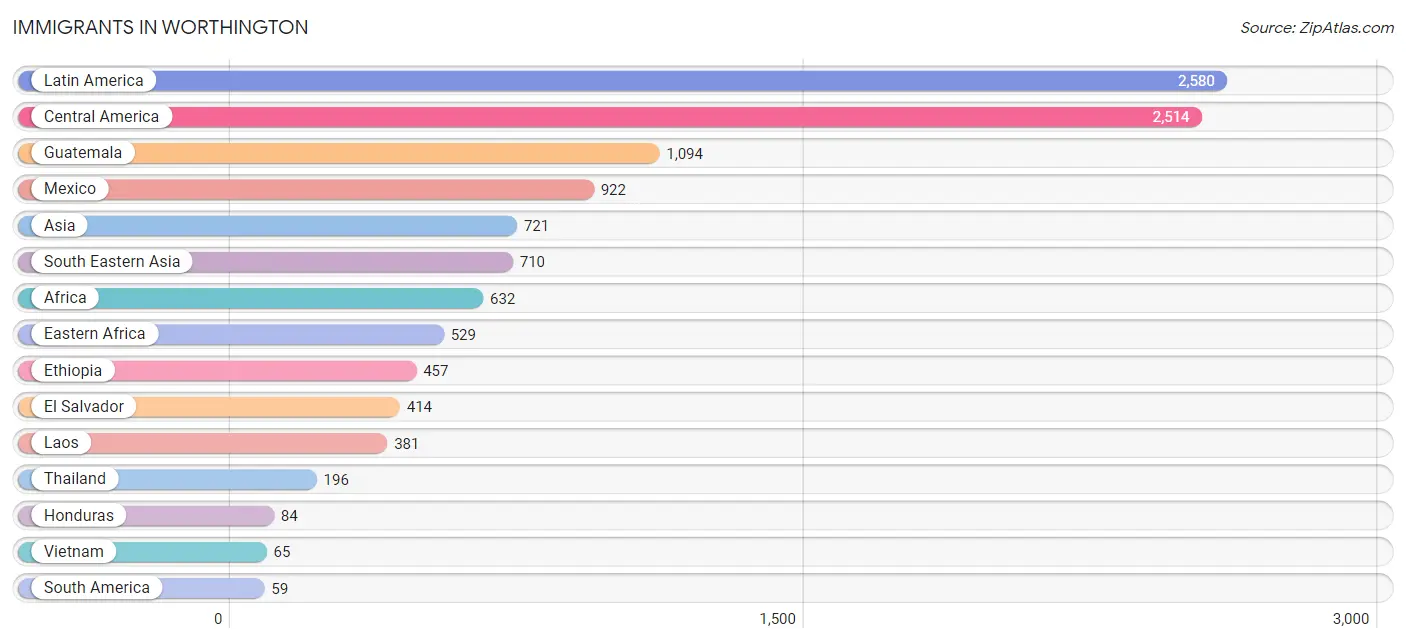
Immigrants in Worthington
The most numerous immigrant groups reported in Worthington came from Latin America (2,580 | 18.6%), Central America (2,514 | 18.2%), Guatemala (1,094 | 7.9%), Mexico (922 | 6.7%), and Asia (721 | 5.2%), together accounting for 56.6% of all Worthington residents.
| Immigration Origin | # Population | % Population |
| Africa | 632 | 4.6% |
| Asia | 721 | 5.2% |
| Cambodia | 4 | 0.0% |
| Caribbean | 7 | 0.1% |
| Central America | 2,514 | 18.2% |
| Colombia | 31 | 0.2% |
| Dominican Republic | 7 | 0.1% |
| Eastern Africa | 529 | 3.8% |
| Eastern Asia | 11 | 0.1% |
| Eastern Europe | 10 | 0.1% |
| Ecuador | 28 | 0.2% |
| El Salvador | 414 | 3.0% |
| Eritrea | 22 | 0.2% |
| Ethiopia | 457 | 3.3% |
| Europe | 10 | 0.1% |
| Guatemala | 1,094 | 7.9% |
| Honduras | 84 | 0.6% |
| Korea | 11 | 0.1% |
| Laos | 381 | 2.8% |
| Latin America | 2,580 | 18.6% |
| Mexico | 922 | 6.7% |
| Nigeria | 15 | 0.1% |
| Northern Africa | 38 | 0.3% |
| Poland | 10 | 0.1% |
| South America | 59 | 0.4% |
| South Eastern Asia | 710 | 5.1% |
| Sudan | 38 | 0.3% |
| Thailand | 196 | 1.4% |
| Vietnam | 65 | 0.5% |
| Western Africa | 15 | 0.1% | View All 30 Rows |
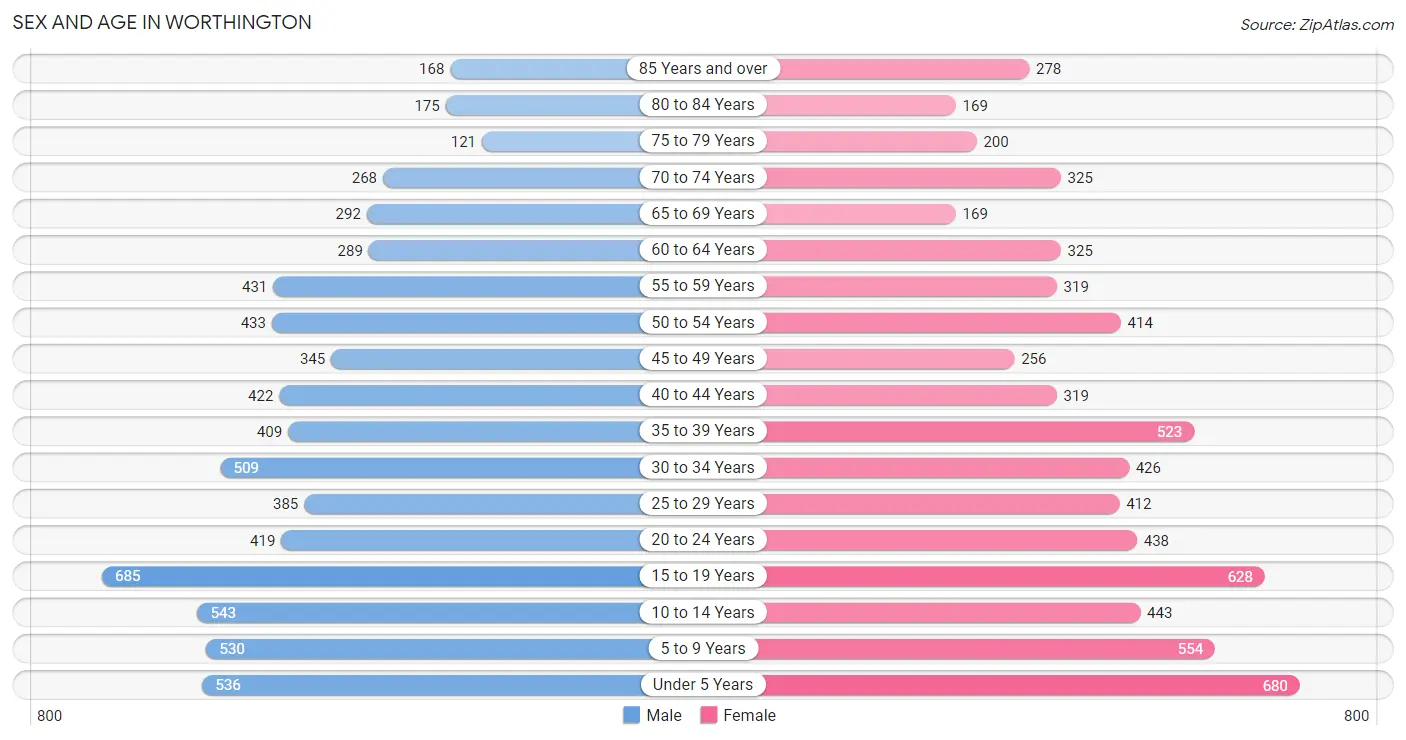
Sex and Age in Worthington
Sex and Age in Worthington
The most populous age groups in Worthington are 15 to 19 Years (685 | 9.8%) for men and Under 5 Years (680 | 9.9%) for women.
| Age Bracket | Male | Female |
| Under 5 Years | 536 (7.7%) | 680 (9.9%) |
| 5 to 9 Years | 530 (7.6%) | 554 (8.1%) |
| 10 to 14 Years | 543 (7.8%) | 443 (6.4%) |
| 15 to 19 Years | 685 (9.8%) | 628 (9.1%) |
| 20 to 24 Years | 419 (6.0%) | 438 (6.4%) |
| 25 to 29 Years | 385 (5.5%) | 412 (6.0%) |
| 30 to 34 Years | 509 (7.3%) | 426 (6.2%) |
| 35 to 39 Years | 409 (5.9%) | 523 (7.6%) |
| 40 to 44 Years | 422 (6.1%) | 319 (4.6%) |
| 45 to 49 Years | 345 (5.0%) | 256 (3.7%) |
| 50 to 54 Years | 433 (6.2%) | 414 (6.0%) |
| 55 to 59 Years | 431 (6.2%) | 319 (4.6%) |
| 60 to 64 Years | 289 (4.2%) | 325 (4.7%) |
| 65 to 69 Years | 292 (4.2%) | 169 (2.5%) |
| 70 to 74 Years | 268 (3.8%) | 325 (4.7%) |
| 75 to 79 Years | 121 (1.7%) | 200 (2.9%) |
| 80 to 84 Years | 175 (2.5%) | 169 (2.5%) |
| 85 Years and over | 168 (2.4%) | 278 (4.0%) |
| Total | 6,960 (100.0%) | 6,878 (100.0%) |
Families and Households in Worthington
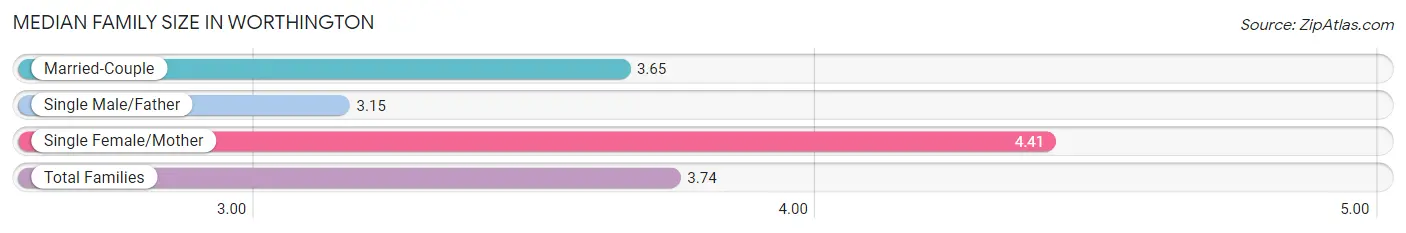
Median Family Size in Worthington
The median family size in Worthington is 3.74 persons per family, with single female/mother families (700 | 23.9%) accounting for the largest median family size of 4.41 persons per family. On the other hand, single male/father families (568 | 19.4%) represent the smallest median family size with 3.15 persons per family.
| Family Type | # Families | Family Size |
| Married-Couple | 1,665 (56.8%) | 3.65 |
| Single Male/Father | 568 (19.4%) | 3.15 |
| Single Female/Mother | 700 (23.9%) | 4.41 |
| Total Families | 2,933 (100.0%) | 3.74 |
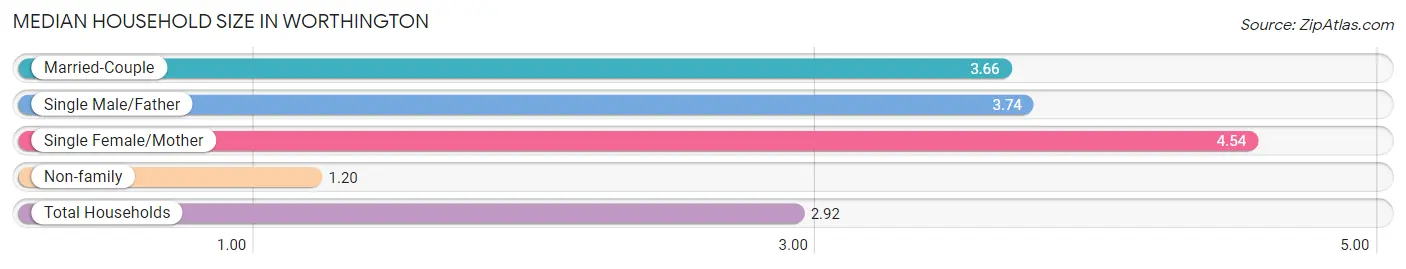
Median Household Size in Worthington
The median household size in Worthington is 2.92 persons per household, with single female/mother households (700 | 15.3%) accounting for the largest median household size of 4.54 persons per household. non-family households (1,637 | 35.8%) represent the smallest median household size with 1.20 persons per household.
| Household Type | # Households | Household Size |
| Married-Couple | 1,665 (36.4%) | 3.66 |
| Single Male/Father | 568 (12.4%) | 3.74 |
| Single Female/Mother | 700 (15.3%) | 4.54 |
| Non-family | 1,637 (35.8%) | 1.20 |
| Total Households | 4,570 (100.0%) | 2.92 |
Household Size by Marriage Status in Worthington
Out of a total of 4,570 households in Worthington, 2,933 (64.2%) are family households, while 1,637 (35.8%) are nonfamily households. The most numerous type of family households are 2-person households, comprising 931, and the most common type of nonfamily households are 1-person households, comprising 1,372.
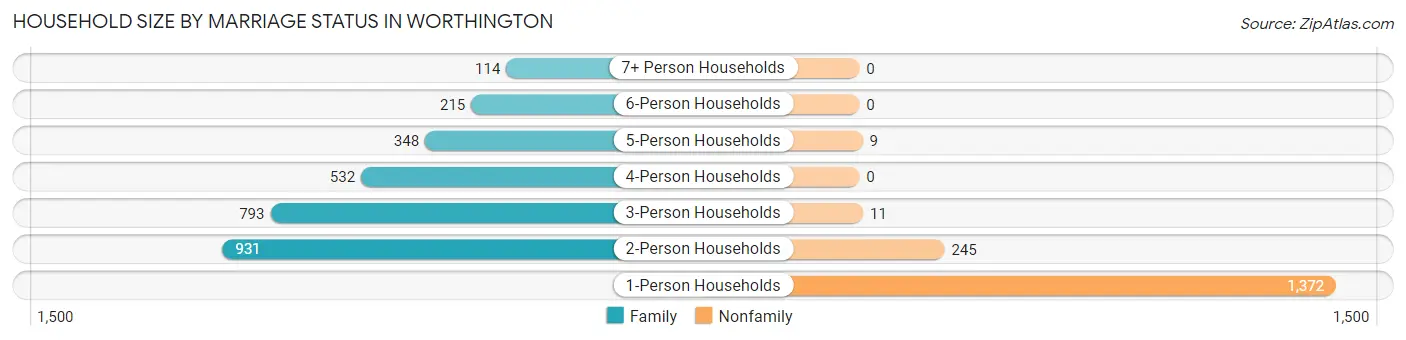
| Household Size | Family Households | Nonfamily Households |
| 1-Person Households | - | 1,372 (30.0%) |
| 2-Person Households | 931 (20.4%) | 245 (5.4%) |
| 3-Person Households | 793 (17.3%) | 11 (0.2%) |
| 4-Person Households | 532 (11.6%) | 0 (0.0%) |
| 5-Person Households | 348 (7.6%) | 9 (0.2%) |
| 6-Person Households | 215 (4.7%) | 0 (0.0%) |
| 7+ Person Households | 114 (2.5%) | 0 (0.0%) |
| Total | 2,933 (64.2%) | 1,637 (35.8%) |
Female Fertility in Worthington
Fertility by Age in Worthington
Average fertility rate in Worthington is 59.0 births per 1,000 women. Women in the age bracket of 20 to 34 years have the highest fertility rate with 97.0 births per 1,000 women. Women in the age bracket of 20 to 34 years acount for 67.0% of all women with births.
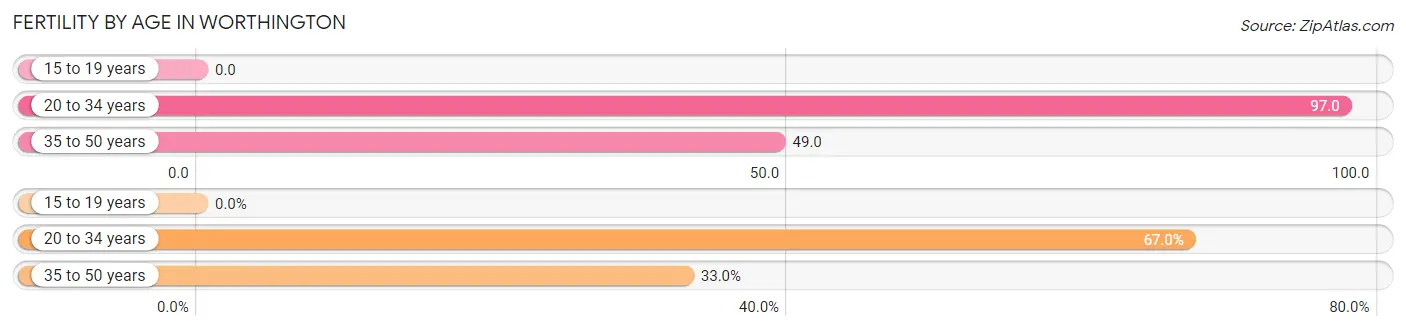
| Age Bracket | Women with Births | Births / 1,000 Women |
| 15 to 19 years | 0 (0.0%) | 0.0 |
| 20 to 34 years | 124 (67.0%) | 97.0 |
| 35 to 50 years | 61 (33.0%) | 49.0 |
| Total | 185 (100.0%) | 59.0 |
Fertility by Age by Marriage Status in Worthington
42.7% of women with births (185) in Worthington are married. The highest percentage of unmarried women with births falls into 20 to 34 years age bracket with 65.3% of them unmarried at the time of birth, while the lowest percentage of unmarried women with births belong to 35 to 50 years age bracket with 41.0% of them unmarried.
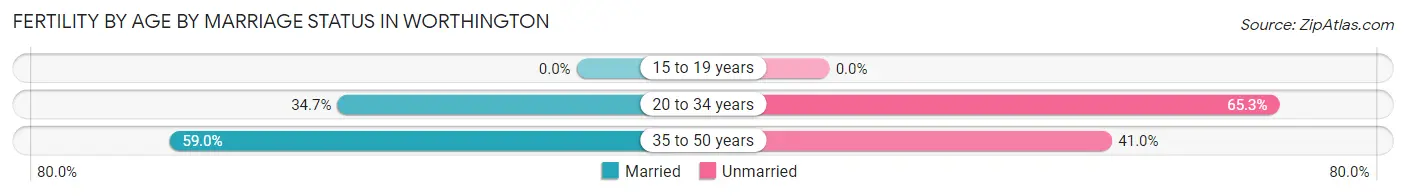
| Age Bracket | Married | Unmarried |
| 15 to 19 years | 0 (0.0%) | 0 (0.0%) |
| 20 to 34 years | 43 (34.7%) | 81 (65.3%) |
| 35 to 50 years | 36 (59.0%) | 25 (41.0%) |
| Total | 79 (42.7%) | 106 (57.3%) |
Fertility by Education in Worthington
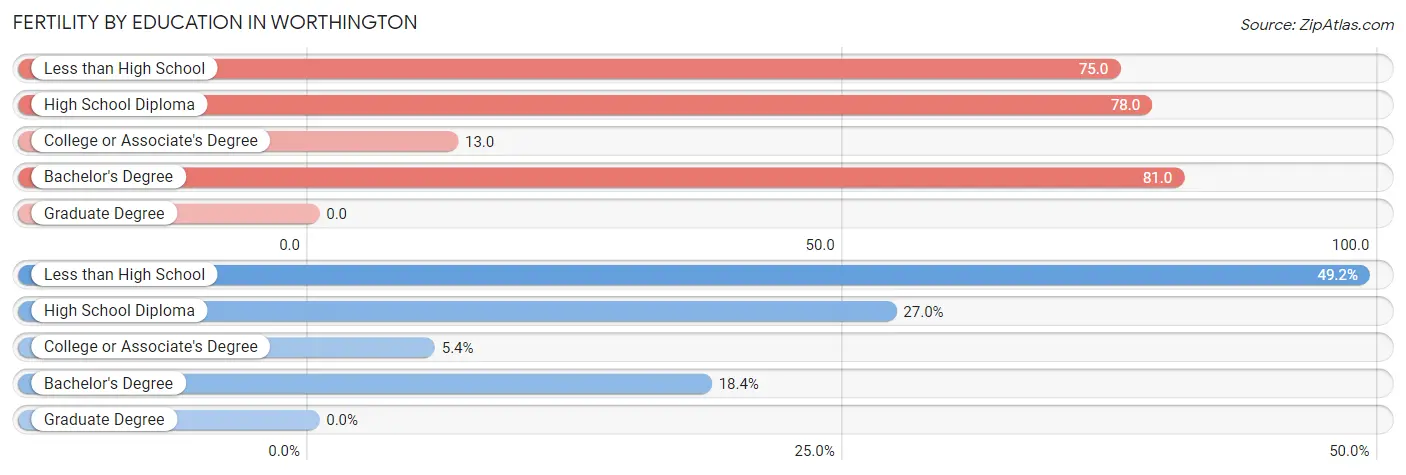
| Educational Attainment | Women with Births | Births / 1,000 Women |
| Less than High School | 91 (49.2%) | 75.0 |
| High School Diploma | 50 (27.0%) | 78.0 |
| College or Associate's Degree | 10 (5.4%) | 13.0 |
| Bachelor's Degree | 34 (18.4%) | 81.0 |
| Graduate Degree | 0 (0.0%) | 0.0 |
| Total | 185 (100.0%) | 59.0 |
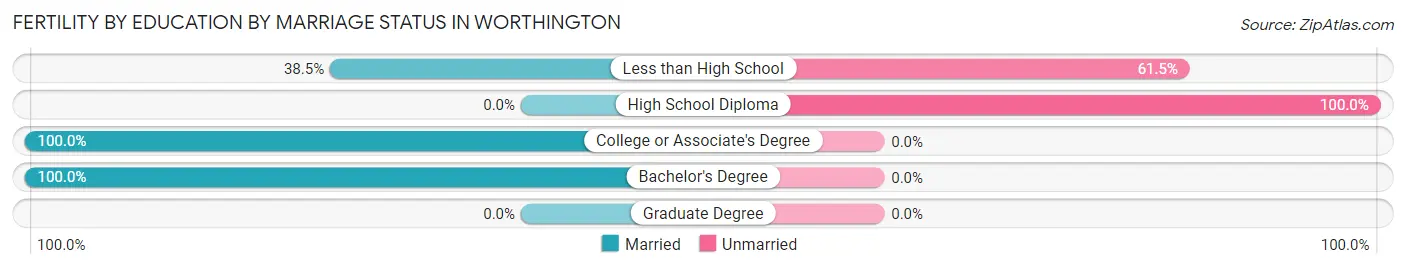
Fertility by Education by Marriage Status in Worthington
57.3% of women with births in Worthington are unmarried. Women with the educational attainment of college or associate's degree are most likely to be married with 100.0% of them married at childbirth, while women with the educational attainment of high school diploma are least likely to be married with 100.0% of them unmarried at childbirth.
| Educational Attainment | Married | Unmarried |
| Less than High School | 35 (38.5%) | 56 (61.5%) |
| High School Diploma | 0 (0.0%) | 50 (100.0%) |
| College or Associate's Degree | 10 (100.0%) | 0 (0.0%) |
| Bachelor's Degree | 34 (100.0%) | 0 (0.0%) |
| Graduate Degree | 0 (0.0%) | 0 (0.0%) |
| Total | 79 (42.7%) | 106 (57.3%) |
Employment Characteristics in Worthington
Employment by Class of Employer in Worthington
Among the 6,185 employed individuals in Worthington, private company employees (4,180 | 67.6%), local government employees (735 | 11.9%), and not-for-profit organizations (634 | 10.2%) make up the most common classes of employment.
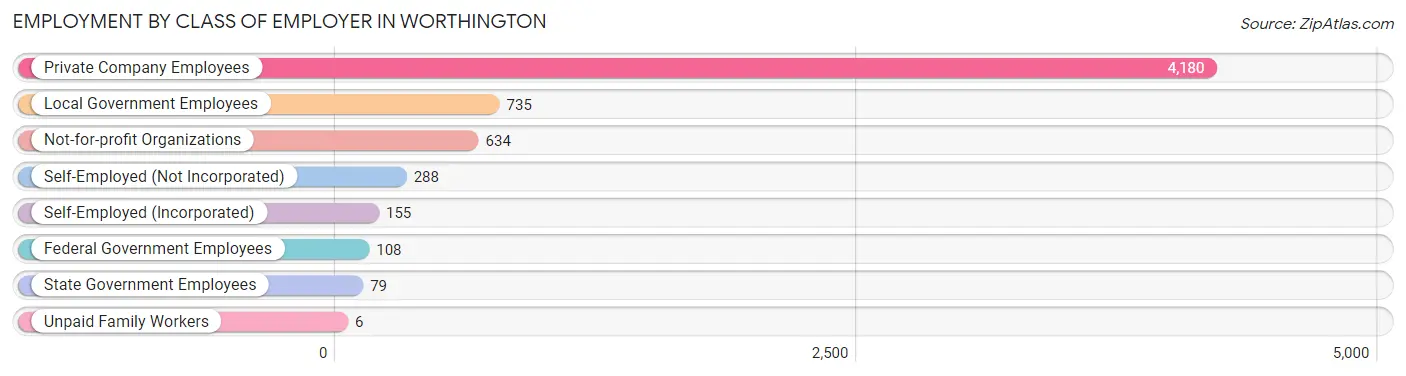
| Employer Class | # Employees | % Employees |
| Private Company Employees | 4,180 | 67.6% |
| Self-Employed (Incorporated) | 155 | 2.5% |
| Self-Employed (Not Incorporated) | 288 | 4.7% |
| Not-for-profit Organizations | 634 | 10.2% |
| Local Government Employees | 735 | 11.9% |
| State Government Employees | 79 | 1.3% |
| Federal Government Employees | 108 | 1.8% |
| Unpaid Family Workers | 6 | 0.1% |
| Total | 6,185 | 100.0% |
Employment Status by Age in Worthington
According to the labor force statistics for Worthington, out of the total population over 16 years of age (10,280), 64.6% or 6,641 individuals are in the labor force, with 3.5% or 232 of them unemployed. The age group with the highest labor force participation rate is 20 to 24 years, with 90.8% or 778 individuals in the labor force. Within the labor force, the 65 to 74 years age range has the highest percentage of unemployed individuals, with 23.6% or 91 of them being unemployed.
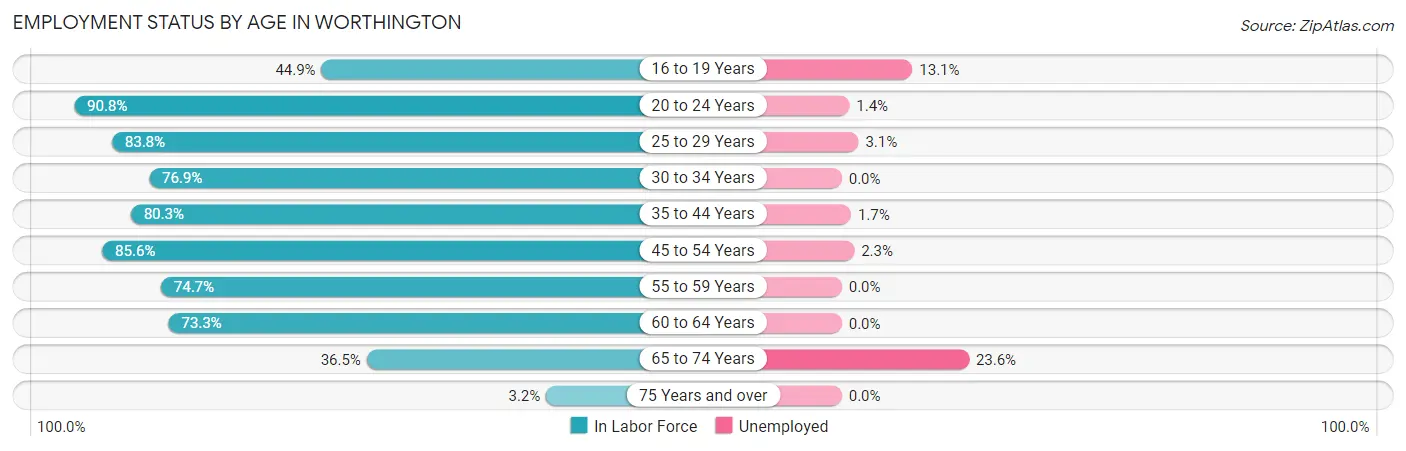
| Age Bracket | In Labor Force | Unemployed |
| 16 to 19 Years | 467 (44.9%) | 61 (13.1%) |
| 20 to 24 Years | 778 (90.8%) | 11 (1.4%) |
| 25 to 29 Years | 668 (83.8%) | 21 (3.1%) |
| 30 to 34 Years | 719 (76.9%) | 0 (0.0%) |
| 35 to 44 Years | 1,343 (80.3%) | 23 (1.7%) |
| 45 to 54 Years | 1,239 (85.6%) | 28 (2.3%) |
| 55 to 59 Years | 560 (74.7%) | 0 (0.0%) |
| 60 to 64 Years | 450 (73.3%) | 0 (0.0%) |
| 65 to 74 Years | 385 (36.5%) | 91 (23.6%) |
| 75 Years and over | 36 (3.2%) | 0 (0.0%) |
| Total | 6,641 (64.6%) | 232 (3.5%) |
Employment Status by Educational Attainment in Worthington
According to labor force statistics for Worthington, 80.1% of individuals (4,980) out of the total population between 25 and 64 years of age (6,217) are in the labor force, with 1.4% or 70 of them being unemployed. The group with the highest labor force participation rate are those with the educational attainment of bachelor's degree or higher, with 86.1% or 884 individuals in the labor force. Within the labor force, individuals with college / associate degree education have the highest percentage of unemployment, with 3.1% or 44 of them being unemployed.
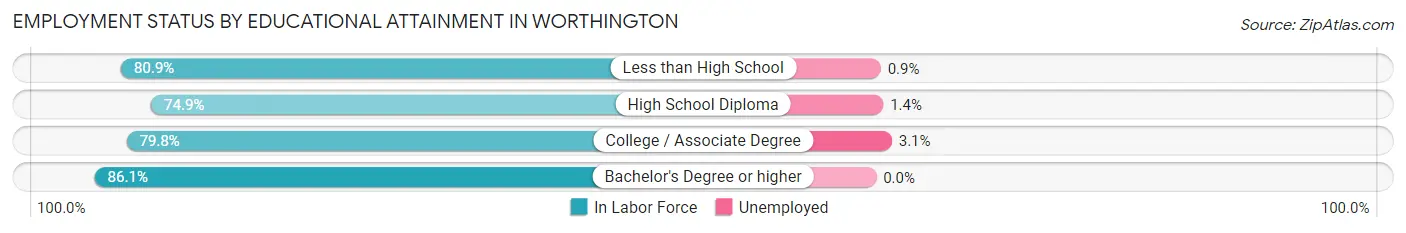
| Educational Attainment | In Labor Force | Unemployed |
| Less than High School | 1,622 (80.9%) | 18 (0.9%) |
| High School Diploma | 1,067 (74.9%) | 20 (1.4%) |
| College / Associate Degree | 1,405 (79.8%) | 55 (3.1%) |
| Bachelor's Degree or higher | 884 (86.1%) | 0 (0.0%) |
| Total | 4,980 (80.1%) | 87 (1.4%) |
Employment Occupations by Sex in Worthington
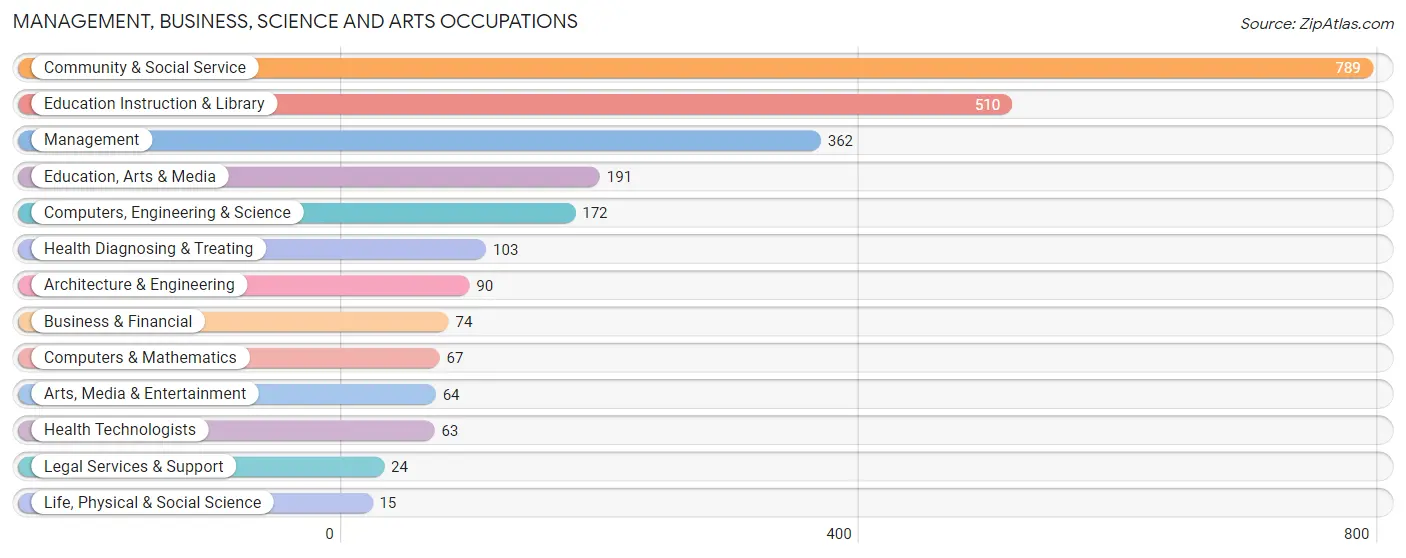
Management, Business, Science and Arts Occupations
The most common Management, Business, Science and Arts occupations in Worthington are Community & Social Service (789 | 12.3%), Education Instruction & Library (510 | 8.0%), Management (362 | 5.7%), Education, Arts & Media (191 | 3.0%), and Computers, Engineering & Science (172 | 2.7%).
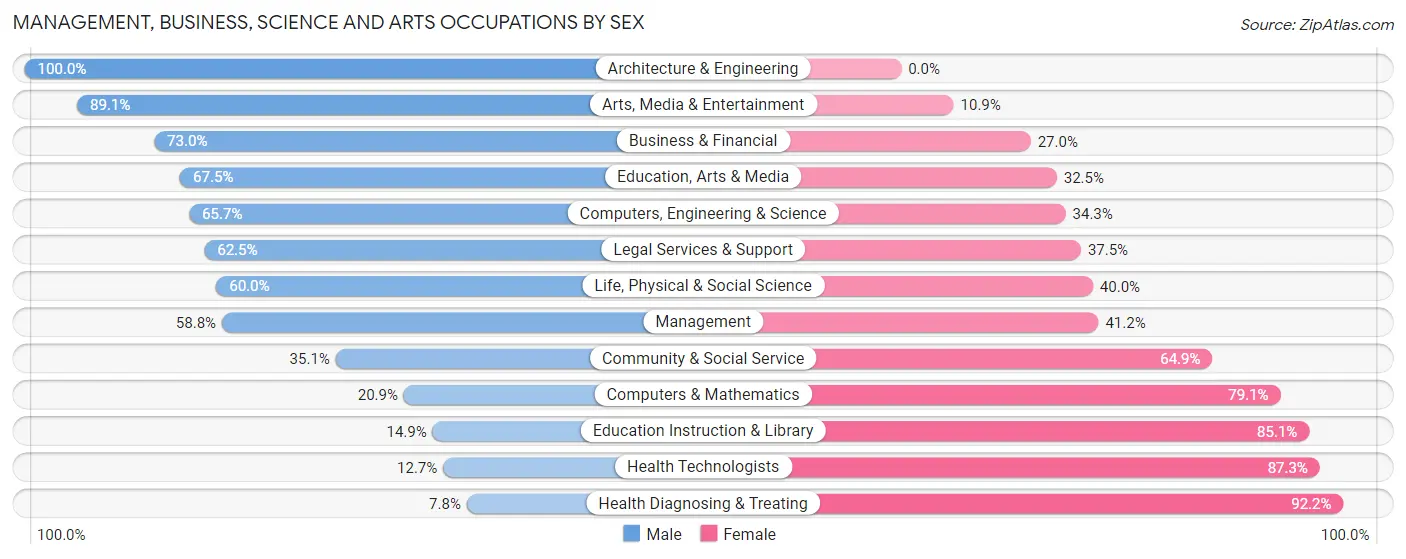
Management, Business, Science and Arts Occupations by Sex
Within the Management, Business, Science and Arts occupations in Worthington, the most male-oriented occupations are Architecture & Engineering (100.0%), Arts, Media & Entertainment (89.1%), and Business & Financial (73.0%), while the most female-oriented occupations are Health Diagnosing & Treating (92.2%), Health Technologists (87.3%), and Education Instruction & Library (85.1%).
| Occupation | Male | Female |
| Management | 213 (58.8%) | 149 (41.2%) |
| Business & Financial | 54 (73.0%) | 20 (27.0%) |
| Computers, Engineering & Science | 113 (65.7%) | 59 (34.3%) |
| Computers & Mathematics | 14 (20.9%) | 53 (79.1%) |
| Architecture & Engineering | 90 (100.0%) | 0 (0.0%) |
| Life, Physical & Social Science | 9 (60.0%) | 6 (40.0%) |
| Community & Social Service | 277 (35.1%) | 512 (64.9%) |
| Education, Arts & Media | 129 (67.5%) | 62 (32.5%) |
| Legal Services & Support | 15 (62.5%) | 9 (37.5%) |
| Education Instruction & Library | 76 (14.9%) | 434 (85.1%) |
| Arts, Media & Entertainment | 57 (89.1%) | 7 (10.9%) |
| Health Diagnosing & Treating | 8 (7.8%) | 95 (92.2%) |
| Health Technologists | 8 (12.7%) | 55 (87.3%) |
| Total (Category) | 665 (44.3%) | 835 (55.7%) |
| Total (Overall) | 3,546 (55.3%) | 2,864 (44.7%) |
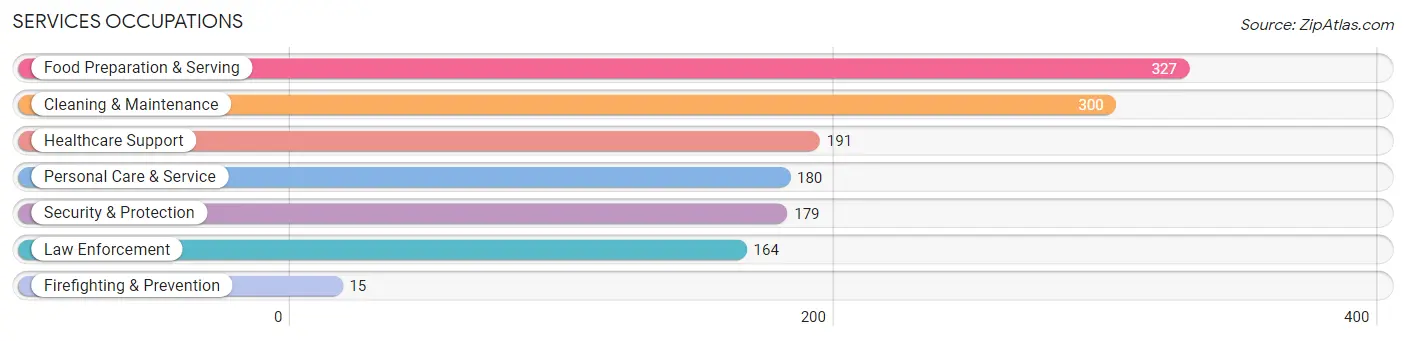
Services Occupations
The most common Services occupations in Worthington are Food Preparation & Serving (327 | 5.1%), Cleaning & Maintenance (300 | 4.7%), Healthcare Support (191 | 3.0%), Personal Care & Service (180 | 2.8%), and Security & Protection (179 | 2.8%).
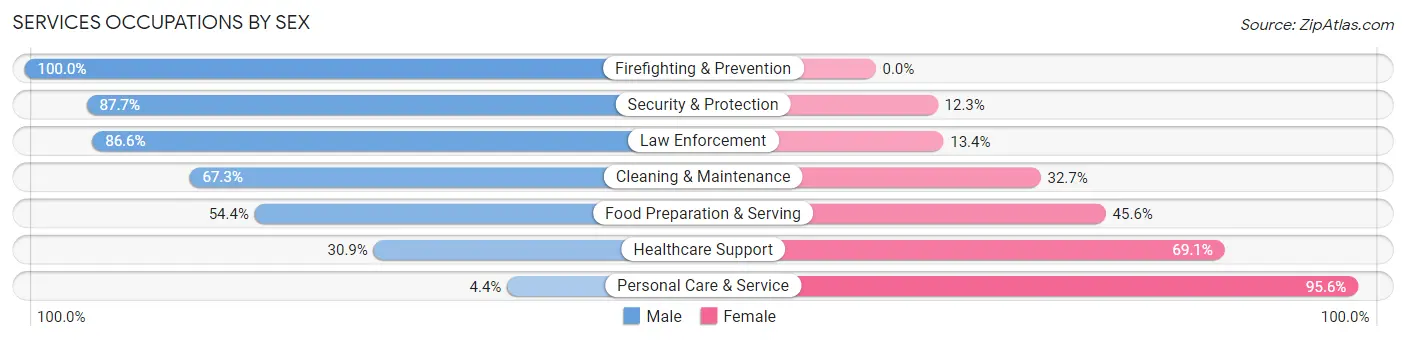
Services Occupations by Sex
Within the Services occupations in Worthington, the most male-oriented occupations are Firefighting & Prevention (100.0%), Security & Protection (87.7%), and Law Enforcement (86.6%), while the most female-oriented occupations are Personal Care & Service (95.6%), Healthcare Support (69.1%), and Food Preparation & Serving (45.6%).
| Occupation | Male | Female |
| Healthcare Support | 59 (30.9%) | 132 (69.1%) |
| Security & Protection | 157 (87.7%) | 22 (12.3%) |
| Firefighting & Prevention | 15 (100.0%) | 0 (0.0%) |
| Law Enforcement | 142 (86.6%) | 22 (13.4%) |
| Food Preparation & Serving | 178 (54.4%) | 149 (45.6%) |
| Cleaning & Maintenance | 202 (67.3%) | 98 (32.7%) |
| Personal Care & Service | 8 (4.4%) | 172 (95.6%) |
| Total (Category) | 604 (51.3%) | 573 (48.7%) |
| Total (Overall) | 3,546 (55.3%) | 2,864 (44.7%) |
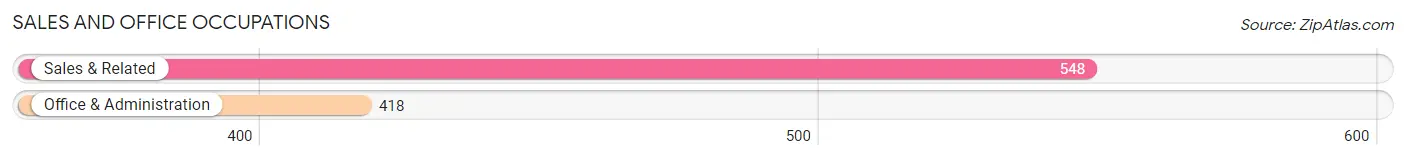
Sales and Office Occupations
The most common Sales and Office occupations in Worthington are Sales & Related (548 | 8.6%), and Office & Administration (418 | 6.5%).
Sales and Office Occupations by Sex
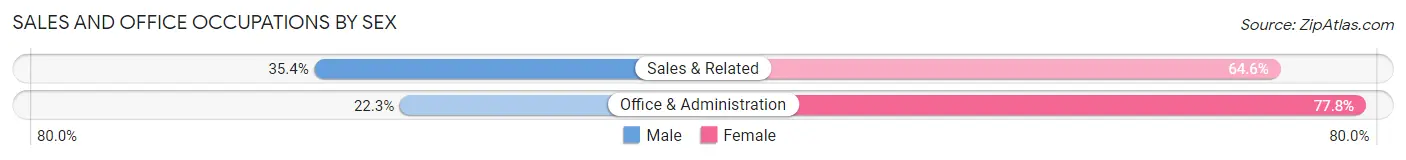
| Occupation | Male | Female |
| Sales & Related | 194 (35.4%) | 354 (64.6%) |
| Office & Administration | 93 (22.3%) | 325 (77.7%) |
| Total (Category) | 287 (29.7%) | 679 (70.3%) |
| Total (Overall) | 3,546 (55.3%) | 2,864 (44.7%) |
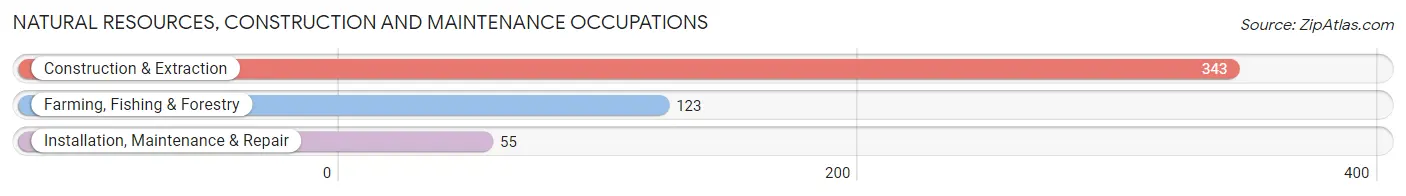
Natural Resources, Construction and Maintenance Occupations
The most common Natural Resources, Construction and Maintenance occupations in Worthington are Construction & Extraction (343 | 5.3%), Farming, Fishing & Forestry (123 | 1.9%), and Installation, Maintenance & Repair (55 | 0.9%).
Natural Resources, Construction and Maintenance Occupations by Sex
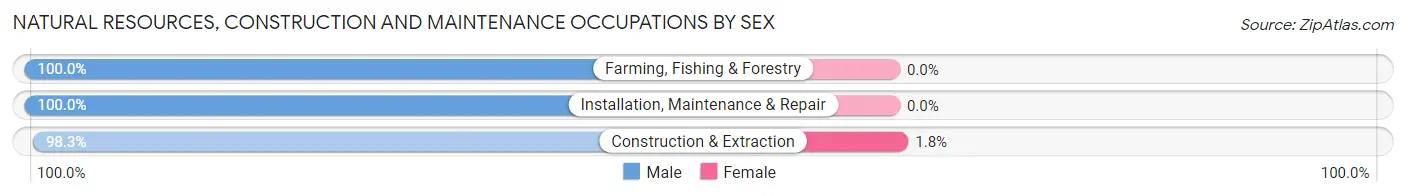
| Occupation | Male | Female |
| Farming, Fishing & Forestry | 123 (100.0%) | 0 (0.0%) |
| Construction & Extraction | 337 (98.3%) | 6 (1.8%) |
| Installation, Maintenance & Repair | 55 (100.0%) | 0 (0.0%) |
| Total (Category) | 515 (98.9%) | 6 (1.1%) |
| Total (Overall) | 3,546 (55.3%) | 2,864 (44.7%) |
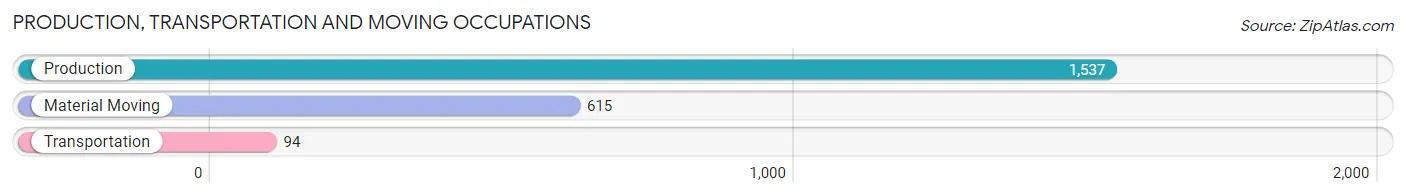
Production, Transportation and Moving Occupations
The most common Production, Transportation and Moving occupations in Worthington are Production (1,537 | 24.0%), Material Moving (615 | 9.6%), and Transportation (94 | 1.5%).
Production, Transportation and Moving Occupations by Sex
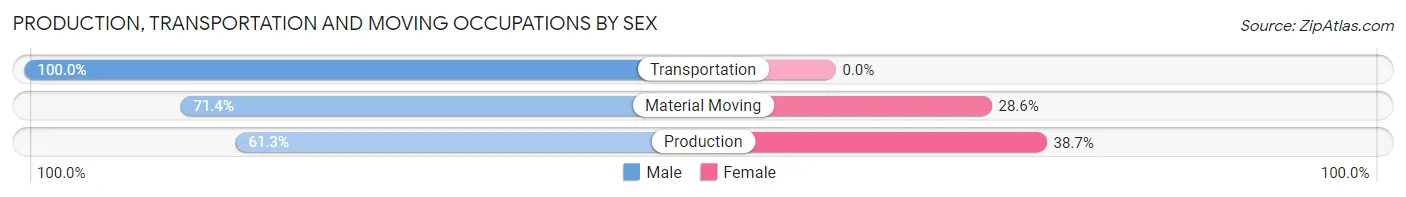
| Occupation | Male | Female |
| Production | 942 (61.3%) | 595 (38.7%) |
| Transportation | 94 (100.0%) | 0 (0.0%) |
| Material Moving | 439 (71.4%) | 176 (28.6%) |
| Total (Category) | 1,475 (65.7%) | 771 (34.3%) |
| Total (Overall) | 3,546 (55.3%) | 2,864 (44.7%) |
Employment Industries by Sex in Worthington
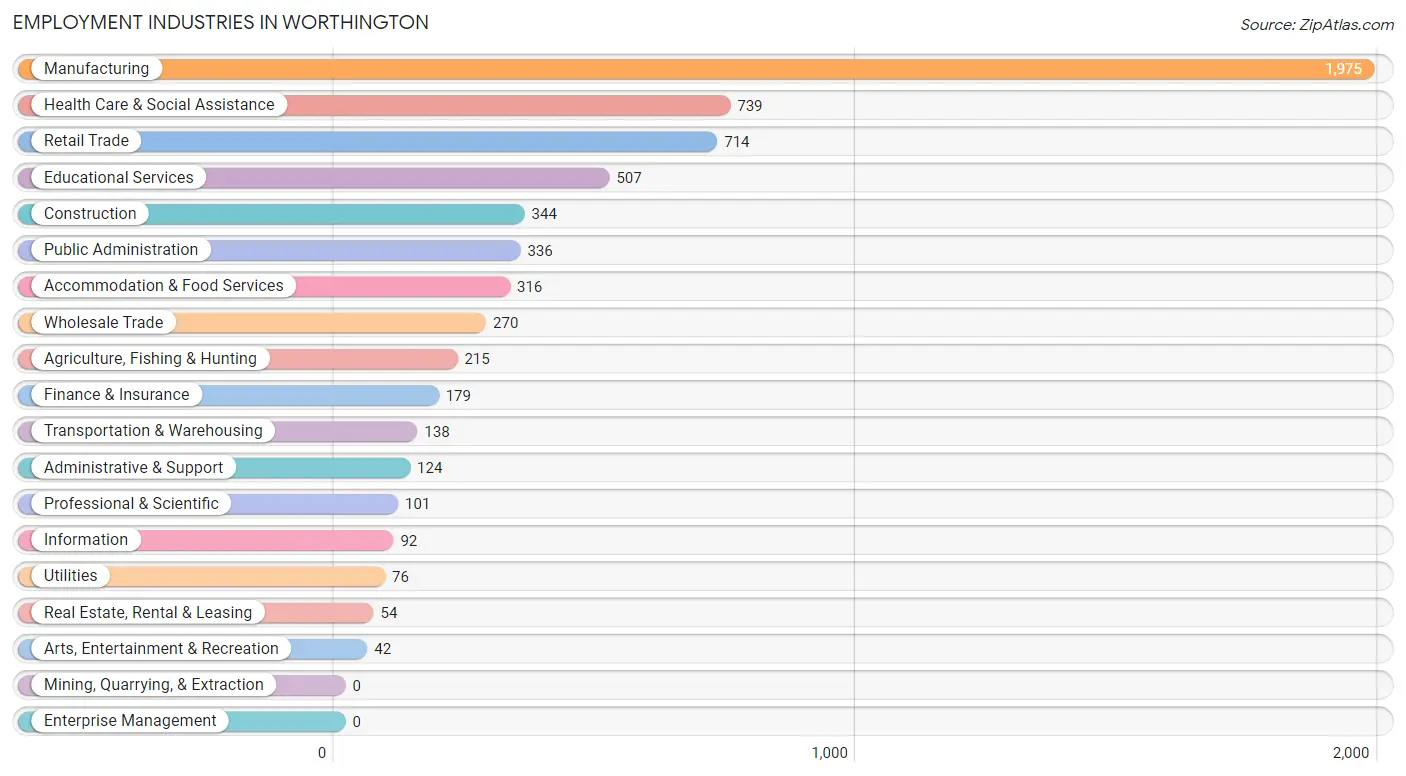
Employment Industries in Worthington
The major employment industries in Worthington include Manufacturing (1,975 | 30.8%), Health Care & Social Assistance (739 | 11.5%), Retail Trade (714 | 11.1%), Educational Services (507 | 7.9%), and Construction (344 | 5.4%).
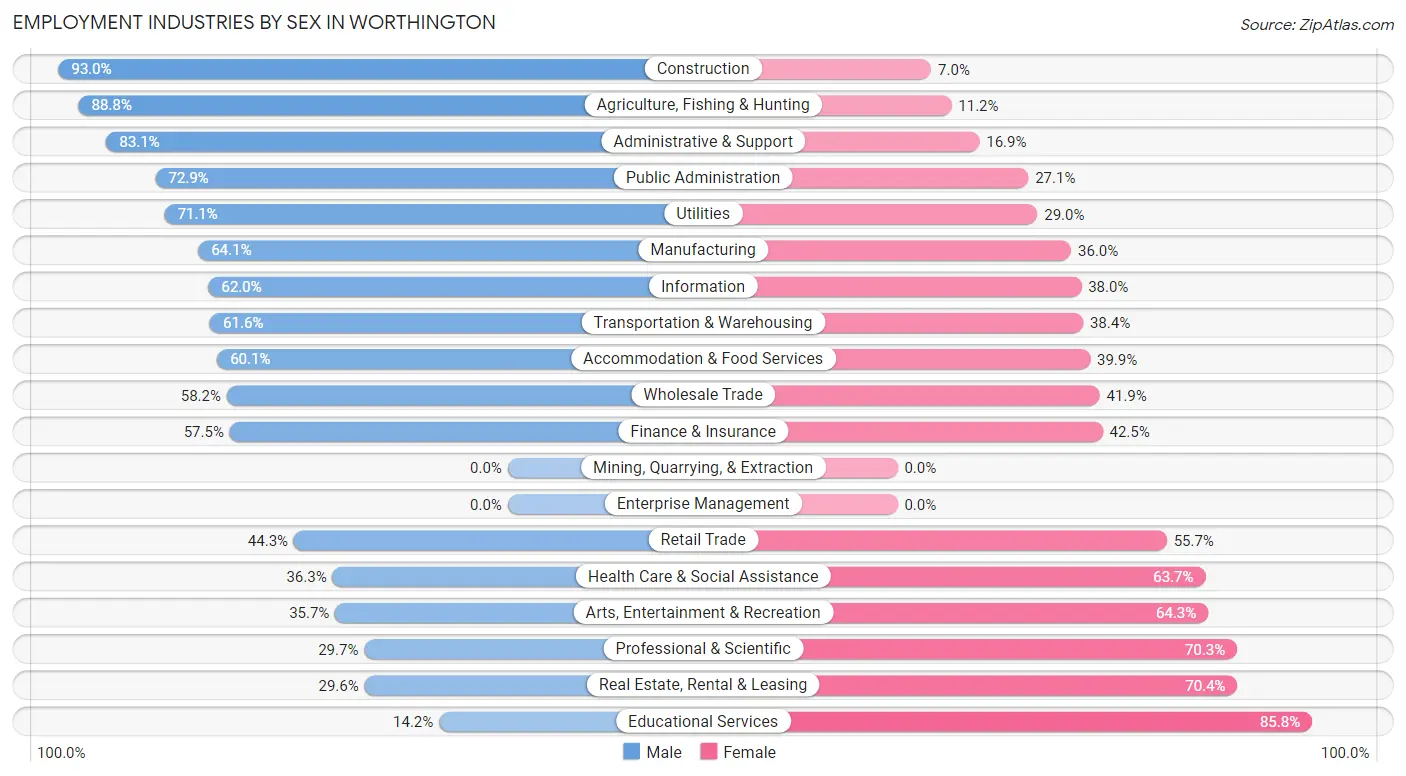
Employment Industries by Sex in Worthington
The Worthington industries that see more men than women are Construction (93.0%), Agriculture, Fishing & Hunting (88.8%), and Administrative & Support (83.1%), whereas the industries that tend to have a higher number of women are Educational Services (85.8%), Real Estate, Rental & Leasing (70.4%), and Professional & Scientific (70.3%).
| Industry | Male | Female |
| Agriculture, Fishing & Hunting | 191 (88.8%) | 24 (11.2%) |
| Mining, Quarrying, & Extraction | 0 (0.0%) | 0 (0.0%) |
| Construction | 320 (93.0%) | 24 (7.0%) |
| Manufacturing | 1,265 (64.0%) | 710 (35.9%) |
| Wholesale Trade | 157 (58.2%) | 113 (41.8%) |
| Retail Trade | 316 (44.3%) | 398 (55.7%) |
| Transportation & Warehousing | 85 (61.6%) | 53 (38.4%) |
| Utilities | 54 (71.1%) | 22 (28.9%) |
| Information | 57 (62.0%) | 35 (38.0%) |
| Finance & Insurance | 103 (57.5%) | 76 (42.5%) |
| Real Estate, Rental & Leasing | 16 (29.6%) | 38 (70.4%) |
| Professional & Scientific | 30 (29.7%) | 71 (70.3%) |
| Enterprise Management | 0 (0.0%) | 0 (0.0%) |
| Administrative & Support | 103 (83.1%) | 21 (16.9%) |
| Educational Services | 72 (14.2%) | 435 (85.8%) |
| Health Care & Social Assistance | 268 (36.3%) | 471 (63.7%) |
| Arts, Entertainment & Recreation | 15 (35.7%) | 27 (64.3%) |
| Accommodation & Food Services | 190 (60.1%) | 126 (39.9%) |
| Public Administration | 245 (72.9%) | 91 (27.1%) |
| Total | 3,546 (55.3%) | 2,864 (44.7%) |
Education in Worthington
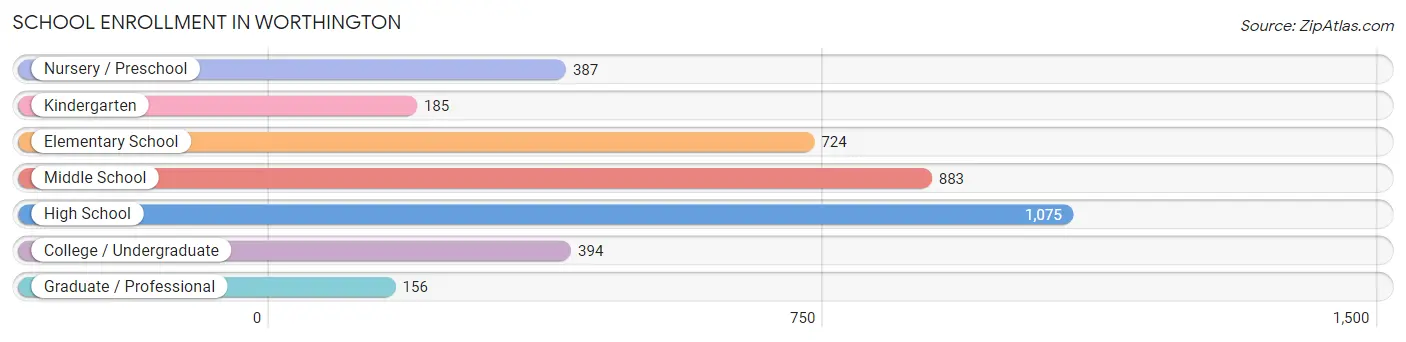
School Enrollment in Worthington
The most common levels of schooling among the 3,804 students in Worthington are high school (1,075 | 28.3%), middle school (883 | 23.2%), and elementary school (724 | 19.0%).
| School Level | # Students | % Students |
| Nursery / Preschool | 387 | 10.2% |
| Kindergarten | 185 | 4.9% |
| Elementary School | 724 | 19.0% |
| Middle School | 883 | 23.2% |
| High School | 1,075 | 28.3% |
| College / Undergraduate | 394 | 10.4% |
| Graduate / Professional | 156 | 4.1% |
| Total | 3,804 | 100.0% |
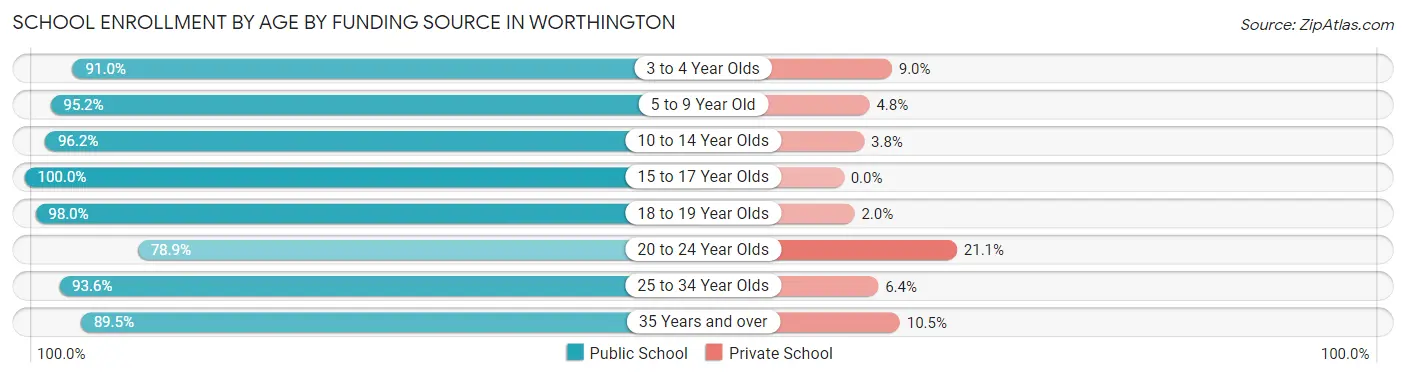
School Enrollment by Age by Funding Source in Worthington
Out of a total of 3,804 students who are enrolled in schools in Worthington, 183 (4.8%) attend a private institution, while the remaining 3,621 (95.2%) are enrolled in public schools. The age group of 20 to 24 year olds has the highest likelihood of being enrolled in private schools, with 39 (21.1% in the age bracket) enrolled. Conversely, the age group of 15 to 17 year olds has the lowest likelihood of being enrolled in a private school, with 705 (100.0% in the age bracket) attending a public institution.
| Age Bracket | Public School | Private School |
| 3 to 4 Year Olds | 254 (91.0%) | 25 (9.0%) |
| 5 to 9 Year Old | 971 (95.2%) | 49 (4.8%) |
| 10 to 14 Year Olds | 936 (96.2%) | 37 (3.8%) |
| 15 to 17 Year Olds | 705 (100.0%) | 0 (0.0%) |
| 18 to 19 Year Olds | 342 (98.0%) | 7 (2.0%) |
| 20 to 24 Year Olds | 146 (78.9%) | 39 (21.1%) |
| 25 to 34 Year Olds | 131 (93.6%) | 9 (6.4%) |
| 35 Years and over | 137 (89.5%) | 16 (10.5%) |
| Total | 3,621 (95.2%) | 183 (4.8%) |
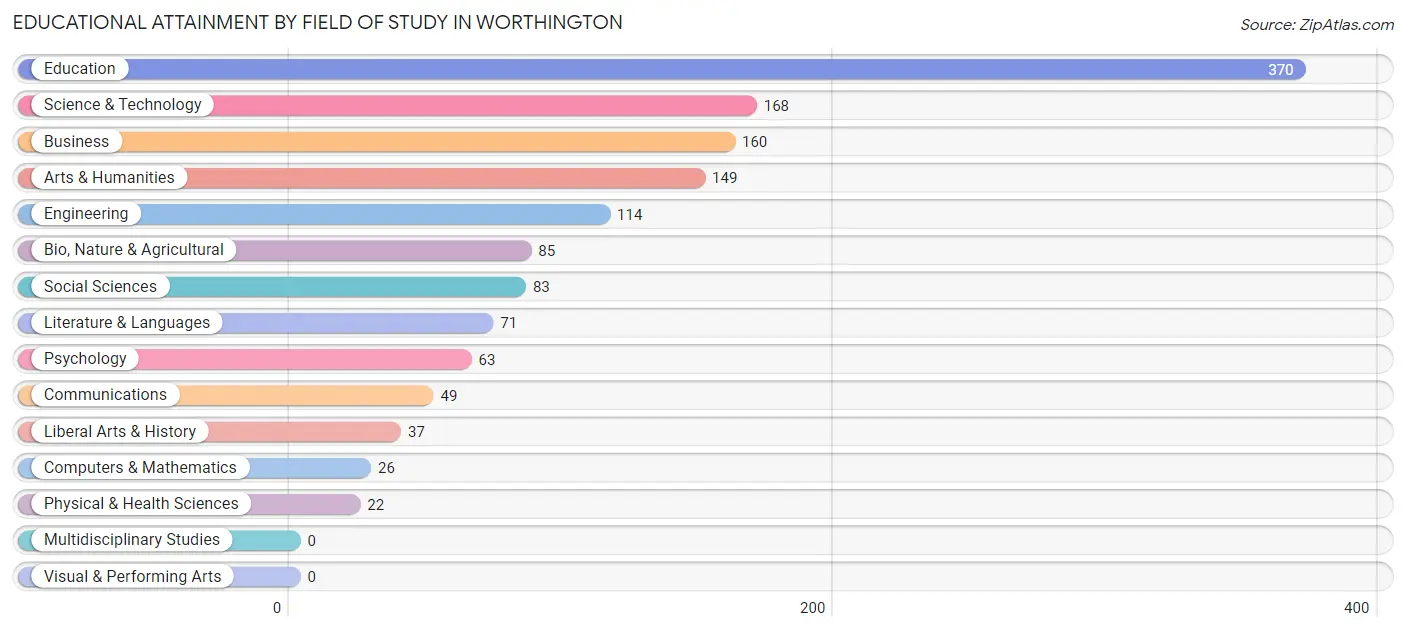
Educational Attainment by Field of Study in Worthington
Education (370 | 26.5%), science & technology (168 | 12.0%), business (160 | 11.5%), arts & humanities (149 | 10.7%), and engineering (114 | 8.2%) are the most common fields of study among 1,397 individuals in Worthington who have obtained a bachelor's degree or higher.
| Field of Study | # Graduates | % Graduates |
| Computers & Mathematics | 26 | 1.9% |
| Bio, Nature & Agricultural | 85 | 6.1% |
| Physical & Health Sciences | 22 | 1.6% |
| Psychology | 63 | 4.5% |
| Social Sciences | 83 | 5.9% |
| Engineering | 114 | 8.2% |
| Multidisciplinary Studies | 0 | 0.0% |
| Science & Technology | 168 | 12.0% |
| Business | 160 | 11.5% |
| Education | 370 | 26.5% |
| Literature & Languages | 71 | 5.1% |
| Liberal Arts & History | 37 | 2.6% |
| Visual & Performing Arts | 0 | 0.0% |
| Communications | 49 | 3.5% |
| Arts & Humanities | 149 | 10.7% |
| Total | 1,397 | 100.0% |
Transportation & Commute in Worthington
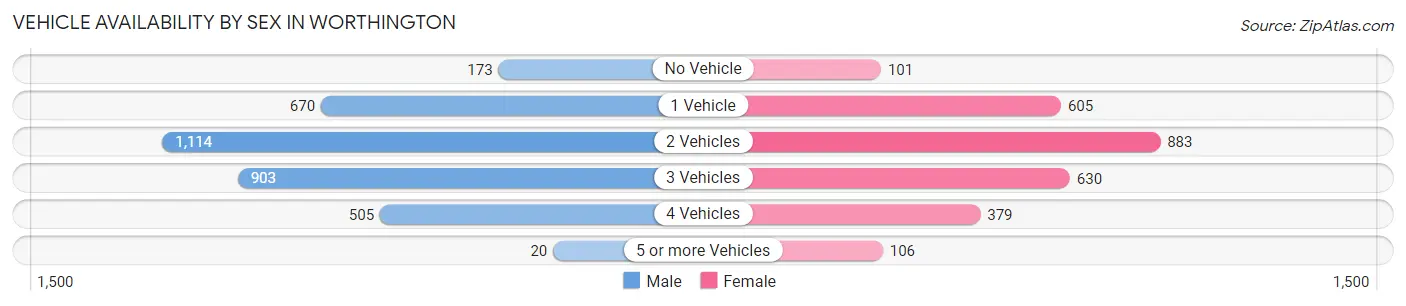
Vehicle Availability by Sex in Worthington
The most prevalent vehicle ownership categories in Worthington are males with 2 vehicles (1,114, accounting for 32.9%) and females with 2 vehicles (883, making up 41.2%).
| Vehicles Available | Male | Female |
| No Vehicle | 173 (5.1%) | 101 (3.7%) |
| 1 Vehicle | 670 (19.8%) | 605 (22.4%) |
| 2 Vehicles | 1,114 (32.9%) | 883 (32.7%) |
| 3 Vehicles | 903 (26.7%) | 630 (23.3%) |
| 4 Vehicles | 505 (14.9%) | 379 (14.0%) |
| 5 or more Vehicles | 20 (0.6%) | 106 (3.9%) |
| Total | 3,385 (100.0%) | 2,704 (100.0%) |
Commute Time in Worthington
The most frequently occuring commute durations in Worthington are 5 to 9 minutes (1,784 commuters, 29.6%), 10 to 14 minutes (1,526 commuters, 25.3%), and less than 5 minutes (597 commuters, 9.9%).
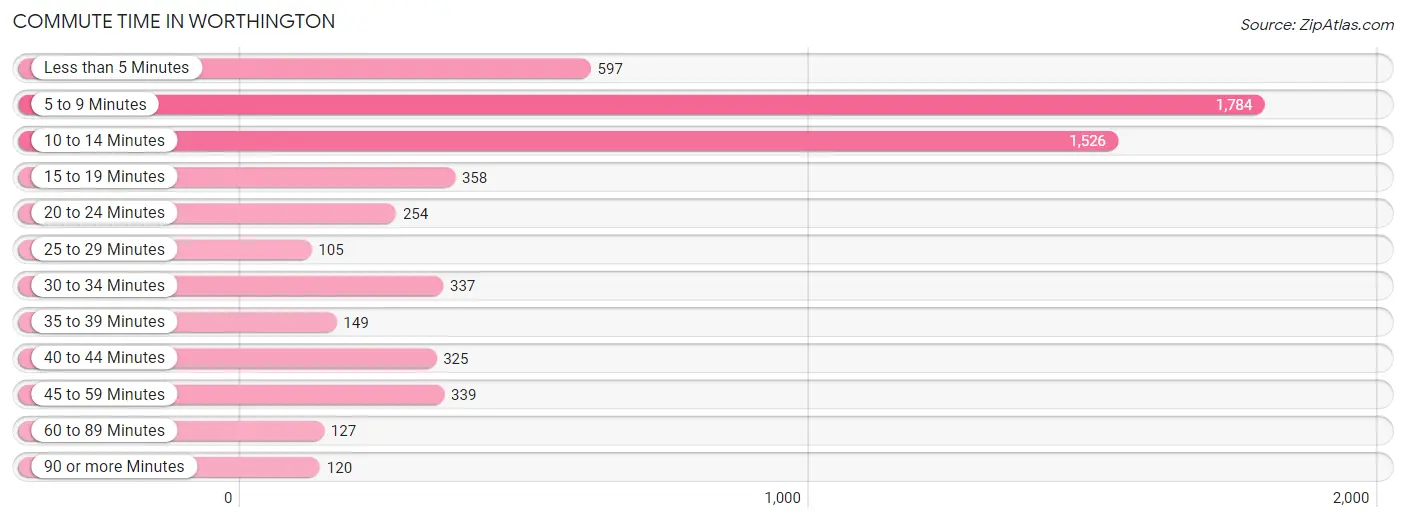
| Commute Time | # Commuters | % Commuters |
| Less than 5 Minutes | 597 | 9.9% |
| 5 to 9 Minutes | 1,784 | 29.6% |
| 10 to 14 Minutes | 1,526 | 25.3% |
| 15 to 19 Minutes | 358 | 5.9% |
| 20 to 24 Minutes | 254 | 4.2% |
| 25 to 29 Minutes | 105 | 1.7% |
| 30 to 34 Minutes | 337 | 5.6% |
| 35 to 39 Minutes | 149 | 2.5% |
| 40 to 44 Minutes | 325 | 5.4% |
| 45 to 59 Minutes | 339 | 5.6% |
| 60 to 89 Minutes | 127 | 2.1% |
| 90 or more Minutes | 120 | 2.0% |
Commute Time by Sex in Worthington
The most common commute times in Worthington are 10 to 14 minutes (868 commuters, 25.4%) for males and 5 to 9 minutes (1,007 commuters, 38.7%) for females.
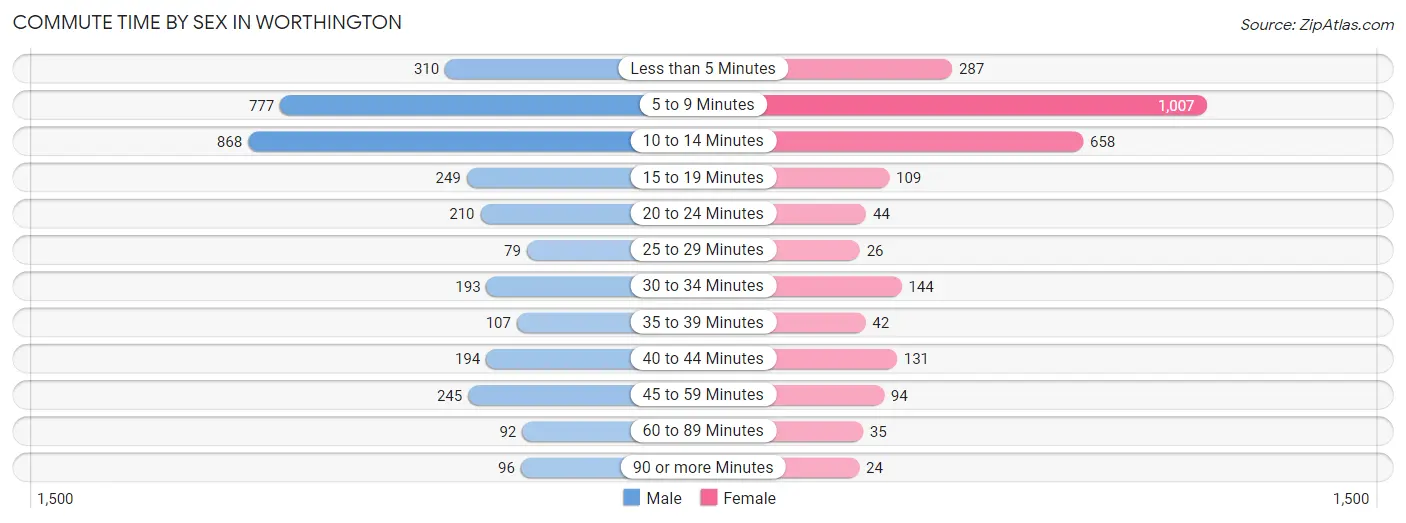
| Commute Time | Male | Female |
| Less than 5 Minutes | 310 (9.1%) | 287 (11.0%) |
| 5 to 9 Minutes | 777 (22.7%) | 1,007 (38.7%) |
| 10 to 14 Minutes | 868 (25.4%) | 658 (25.3%) |
| 15 to 19 Minutes | 249 (7.3%) | 109 (4.2%) |
| 20 to 24 Minutes | 210 (6.1%) | 44 (1.7%) |
| 25 to 29 Minutes | 79 (2.3%) | 26 (1.0%) |
| 30 to 34 Minutes | 193 (5.6%) | 144 (5.5%) |
| 35 to 39 Minutes | 107 (3.1%) | 42 (1.6%) |
| 40 to 44 Minutes | 194 (5.7%) | 131 (5.0%) |
| 45 to 59 Minutes | 245 (7.2%) | 94 (3.6%) |
| 60 to 89 Minutes | 92 (2.7%) | 35 (1.3%) |
| 90 or more Minutes | 96 (2.8%) | 24 (0.9%) |
Time of Departure to Work by Sex in Worthington
The most frequent times of departure to work in Worthington are 7:30 AM to 7:59 AM (457, 13.4%) for males and 7:00 AM to 7:29 AM (505, 19.4%) for females.
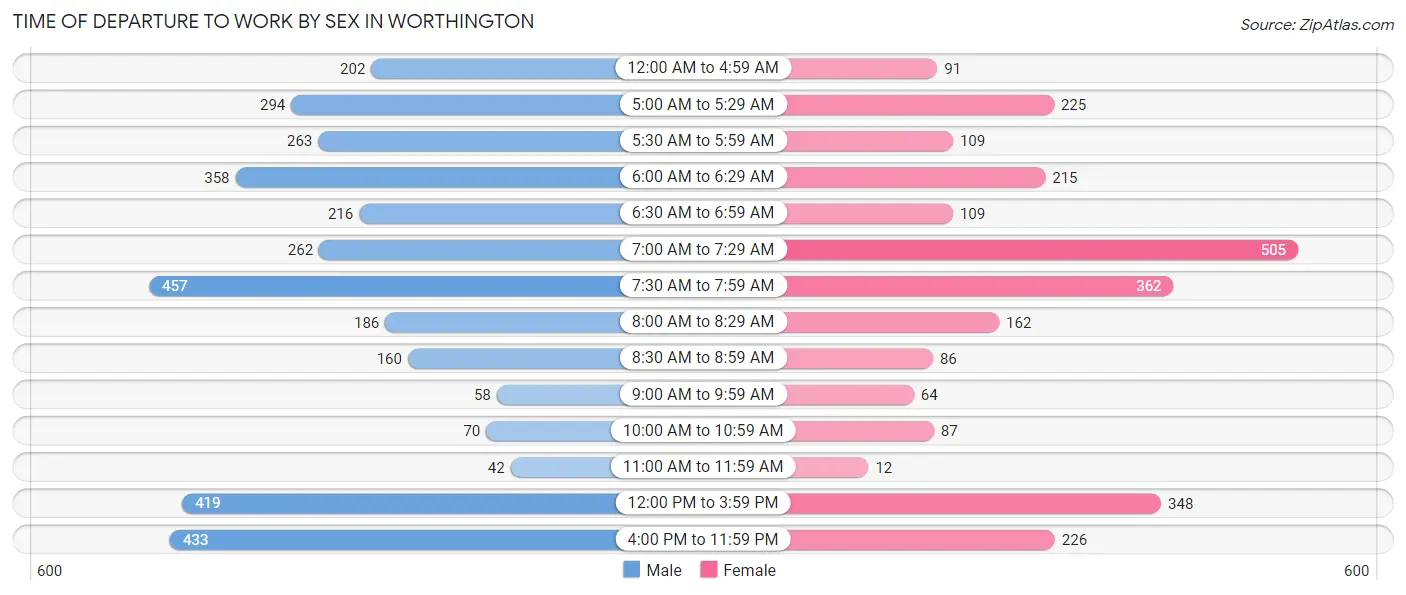
| Time of Departure | Male | Female |
| 12:00 AM to 4:59 AM | 202 (5.9%) | 91 (3.5%) |
| 5:00 AM to 5:29 AM | 294 (8.6%) | 225 (8.6%) |
| 5:30 AM to 5:59 AM | 263 (7.7%) | 109 (4.2%) |
| 6:00 AM to 6:29 AM | 358 (10.5%) | 215 (8.3%) |
| 6:30 AM to 6:59 AM | 216 (6.3%) | 109 (4.2%) |
| 7:00 AM to 7:29 AM | 262 (7.7%) | 505 (19.4%) |
| 7:30 AM to 7:59 AM | 457 (13.4%) | 362 (13.9%) |
| 8:00 AM to 8:29 AM | 186 (5.4%) | 162 (6.2%) |
| 8:30 AM to 8:59 AM | 160 (4.7%) | 86 (3.3%) |
| 9:00 AM to 9:59 AM | 58 (1.7%) | 64 (2.5%) |
| 10:00 AM to 10:59 AM | 70 (2.1%) | 87 (3.3%) |
| 11:00 AM to 11:59 AM | 42 (1.2%) | 12 (0.5%) |
| 12:00 PM to 3:59 PM | 419 (12.2%) | 348 (13.4%) |
| 4:00 PM to 11:59 PM | 433 (12.7%) | 226 (8.7%) |
| Total | 3,420 (100.0%) | 2,601 (100.0%) |
Housing Occupancy in Worthington
Occupancy by Ownership in Worthington
Of the total 4,570 dwellings in Worthington, owner-occupied units account for 3,036 (66.4%), while renter-occupied units make up 1,534 (33.6%).
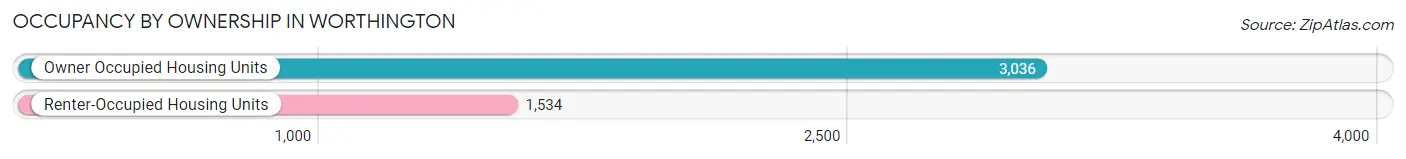
| Occupancy | # Housing Units | % Housing Units |
| Owner Occupied Housing Units | 3,036 | 66.4% |
| Renter-Occupied Housing Units | 1,534 | 33.6% |
| Total Occupied Housing Units | 4,570 | 100.0% |
Occupancy by Household Size in Worthington
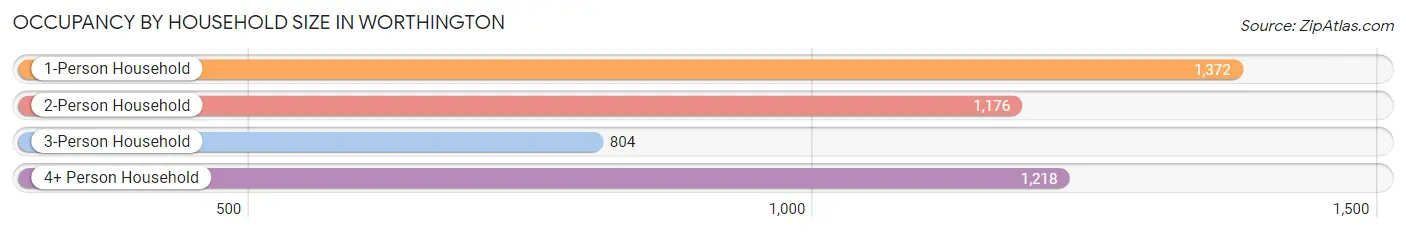
| Household Size | # Housing Units | % Housing Units |
| 1-Person Household | 1,372 | 30.0% |
| 2-Person Household | 1,176 | 25.7% |
| 3-Person Household | 804 | 17.6% |
| 4+ Person Household | 1,218 | 26.7% |
| Total Housing Units | 4,570 | 100.0% |
Occupancy by Ownership by Household Size in Worthington
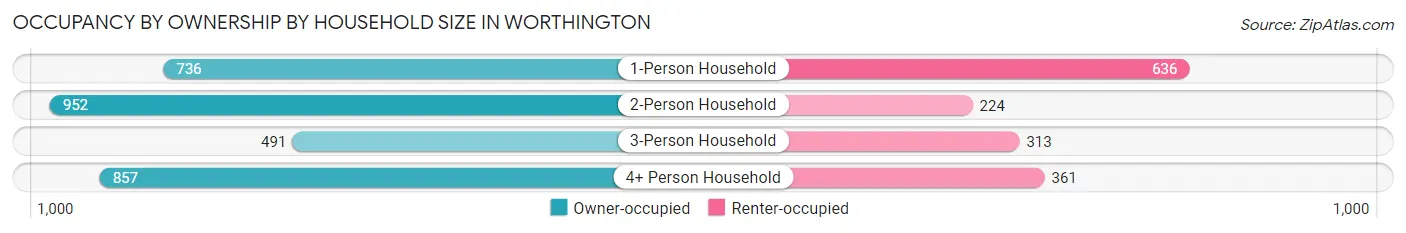
| Household Size | Owner-occupied | Renter-occupied |
| 1-Person Household | 736 (53.6%) | 636 (46.4%) |
| 2-Person Household | 952 (80.9%) | 224 (19.1%) |
| 3-Person Household | 491 (61.1%) | 313 (38.9%) |
| 4+ Person Household | 857 (70.4%) | 361 (29.6%) |
| Total Housing Units | 3,036 (66.4%) | 1,534 (33.6%) |
Occupancy by Educational Attainment in Worthington
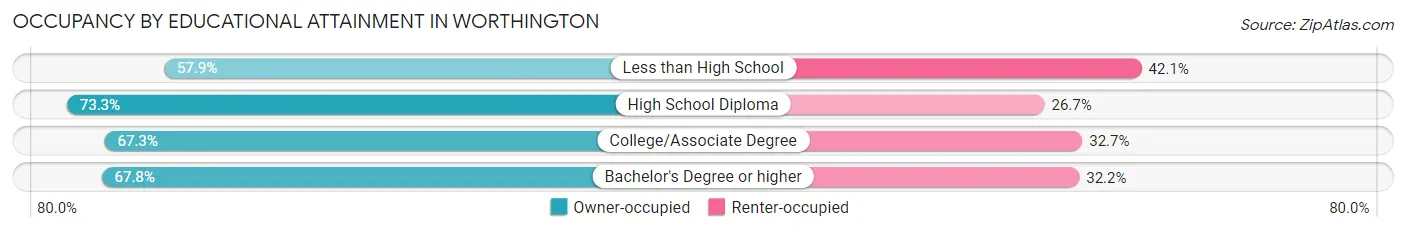
| Household Size | Owner-occupied | Renter-occupied |
| Less than High School | 730 (57.9%) | 531 (42.1%) |
| High School Diploma | 922 (73.3%) | 336 (26.7%) |
| College/Associate Degree | 875 (67.3%) | 425 (32.7%) |
| Bachelor's Degree or higher | 509 (67.8%) | 242 (32.2%) |
Occupancy by Age of Householder in Worthington
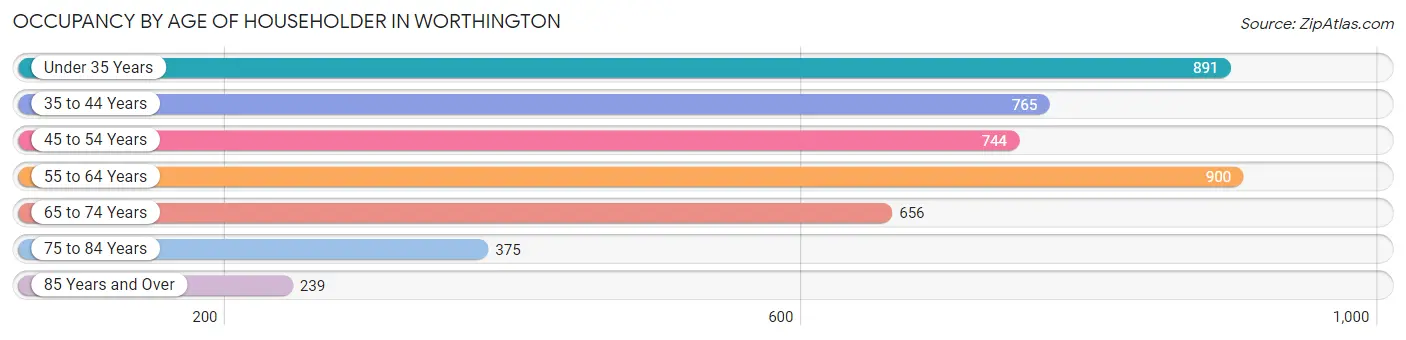
| Age Bracket | # Households | % Households |
| Under 35 Years | 891 | 19.5% |
| 35 to 44 Years | 765 | 16.7% |
| 45 to 54 Years | 744 | 16.3% |
| 55 to 64 Years | 900 | 19.7% |
| 65 to 74 Years | 656 | 14.3% |
| 75 to 84 Years | 375 | 8.2% |
| 85 Years and Over | 239 | 5.2% |
| Total | 4,570 | 100.0% |
Housing Finances in Worthington
Median Income by Occupancy in Worthington
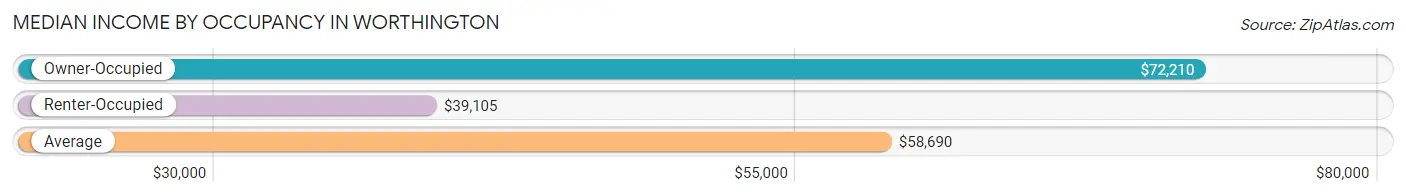
| Occupancy Type | # Households | Median Income |
| Owner-Occupied | 3,036 (66.4%) | $72,210 |
| Renter-Occupied | 1,534 (33.6%) | $39,105 |
| Average | 4,570 (100.0%) | $58,690 |
Occupancy by Householder Income Bracket in Worthington
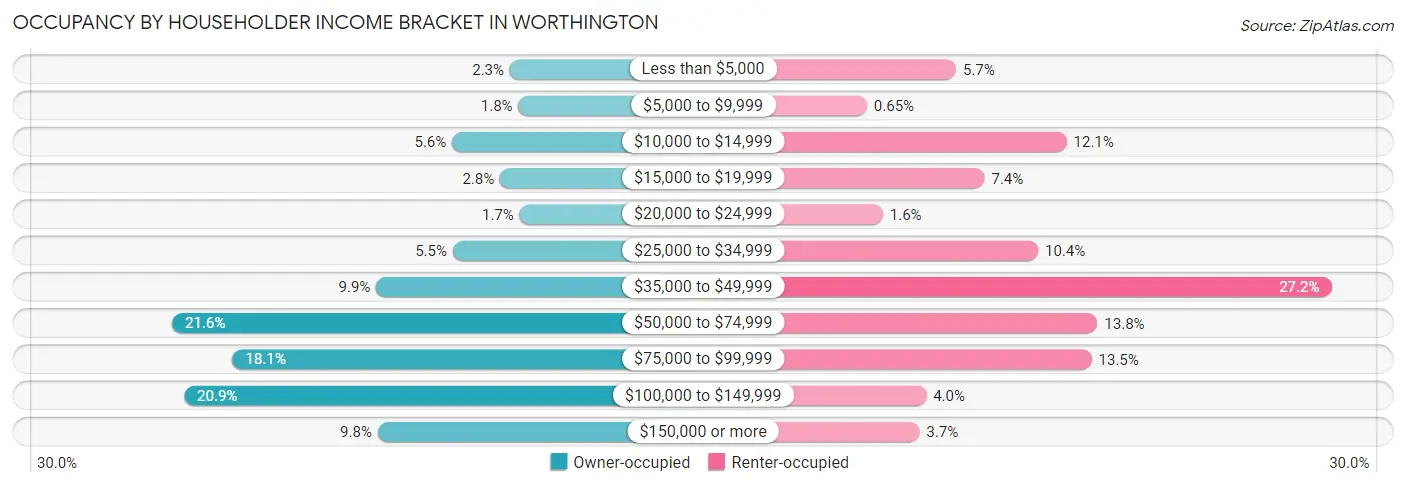
| Income Bracket | Owner-occupied | Renter-occupied |
| Less than $5,000 | 69 (2.3%) | 88 (5.7%) |
| $5,000 to $9,999 | 54 (1.8%) | 10 (0.6%) |
| $10,000 to $14,999 | 169 (5.6%) | 185 (12.1%) |
| $15,000 to $19,999 | 86 (2.8%) | 113 (7.4%) |
| $20,000 to $24,999 | 52 (1.7%) | 24 (1.6%) |
| $25,000 to $34,999 | 168 (5.5%) | 160 (10.4%) |
| $35,000 to $49,999 | 301 (9.9%) | 417 (27.2%) |
| $50,000 to $74,999 | 655 (21.6%) | 212 (13.8%) |
| $75,000 to $99,999 | 550 (18.1%) | 207 (13.5%) |
| $100,000 to $149,999 | 634 (20.9%) | 62 (4.0%) |
| $150,000 or more | 298 (9.8%) | 56 (3.6%) |
| Total | 3,036 (100.0%) | 1,534 (100.0%) |
Monthly Housing Cost Tiers in Worthington
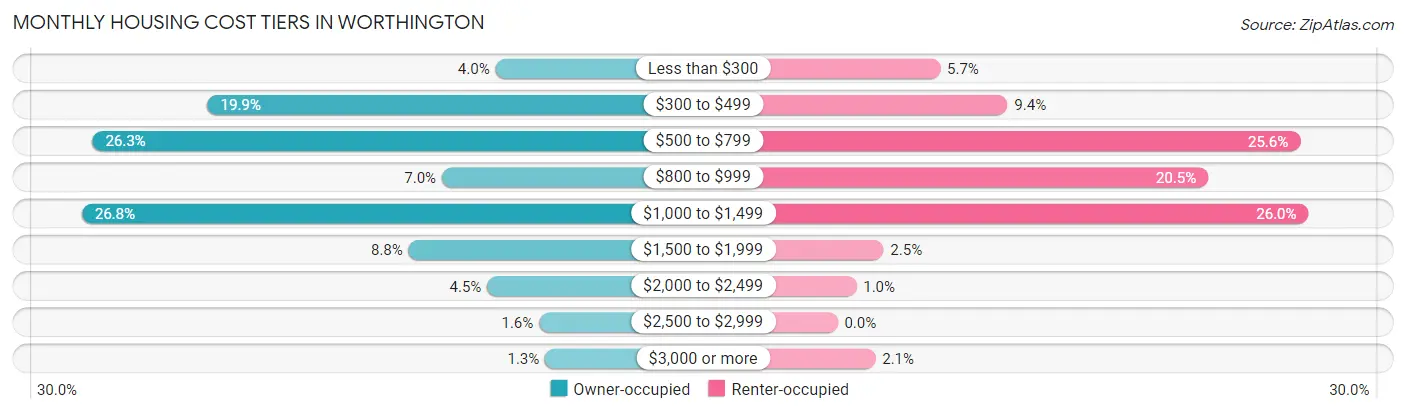
| Monthly Cost | Owner-occupied | Renter-occupied |
| Less than $300 | 121 (4.0%) | 87 (5.7%) |
| $300 to $499 | 604 (19.9%) | 144 (9.4%) |
| $500 to $799 | 797 (26.3%) | 392 (25.6%) |
| $800 to $999 | 211 (7.0%) | 314 (20.5%) |
| $1,000 to $1,499 | 815 (26.8%) | 399 (26.0%) |
| $1,500 to $1,999 | 267 (8.8%) | 39 (2.5%) |
| $2,000 to $2,499 | 135 (4.4%) | 16 (1.0%) |
| $2,500 to $2,999 | 48 (1.6%) | 0 (0.0%) |
| $3,000 or more | 38 (1.3%) | 32 (2.1%) |
| Total | 3,036 (100.0%) | 1,534 (100.0%) |
Physical Housing Characteristics in Worthington
Housing Structures in Worthington
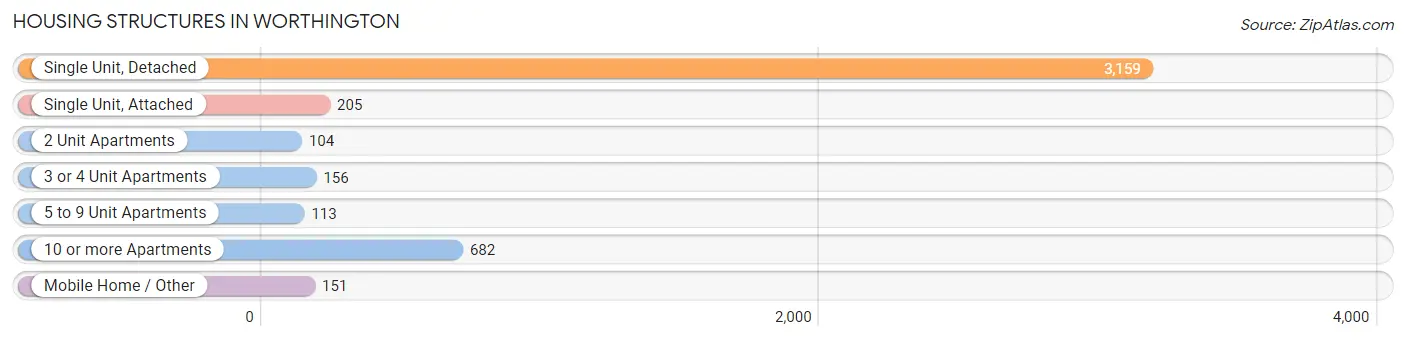
| Structure Type | # Housing Units | % Housing Units |
| Single Unit, Detached | 3,159 | 69.1% |
| Single Unit, Attached | 205 | 4.5% |
| 2 Unit Apartments | 104 | 2.3% |
| 3 or 4 Unit Apartments | 156 | 3.4% |
| 5 to 9 Unit Apartments | 113 | 2.5% |
| 10 or more Apartments | 682 | 14.9% |
| Mobile Home / Other | 151 | 3.3% |
| Total | 4,570 | 100.0% |
Housing Structures by Occupancy in Worthington
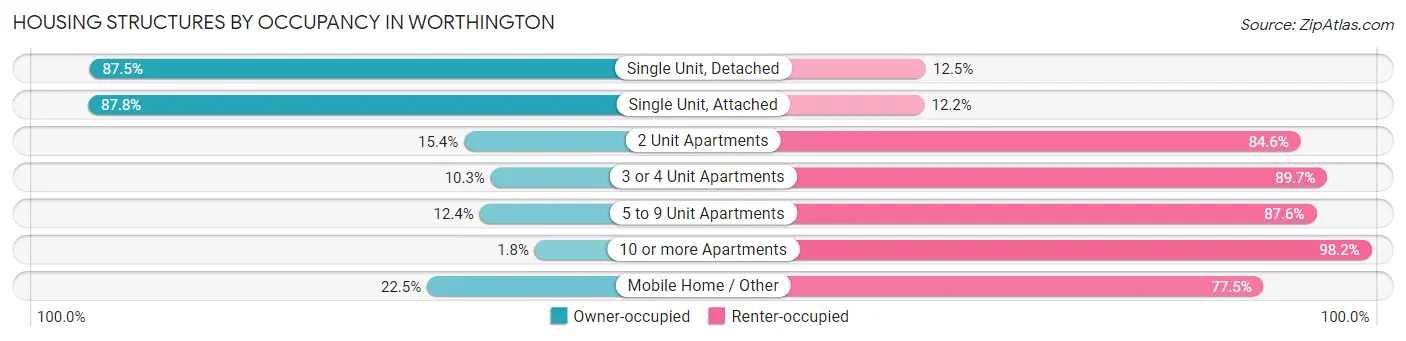
| Structure Type | Owner-occupied | Renter-occupied |
| Single Unit, Detached | 2,764 (87.5%) | 395 (12.5%) |
| Single Unit, Attached | 180 (87.8%) | 25 (12.2%) |
| 2 Unit Apartments | 16 (15.4%) | 88 (84.6%) |
| 3 or 4 Unit Apartments | 16 (10.3%) | 140 (89.7%) |
| 5 to 9 Unit Apartments | 14 (12.4%) | 99 (87.6%) |
| 10 or more Apartments | 12 (1.8%) | 670 (98.2%) |
| Mobile Home / Other | 34 (22.5%) | 117 (77.5%) |
| Total | 3,036 (66.4%) | 1,534 (33.6%) |
Housing Structures by Number of Rooms in Worthington
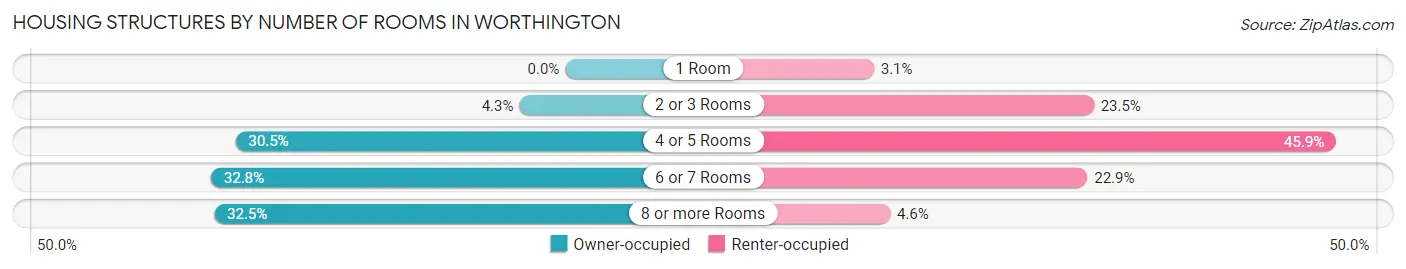
| Number of Rooms | Owner-occupied | Renter-occupied |
| 1 Room | 0 (0.0%) | 48 (3.1%) |
| 2 or 3 Rooms | 129 (4.3%) | 360 (23.5%) |
| 4 or 5 Rooms | 926 (30.5%) | 704 (45.9%) |
| 6 or 7 Rooms | 995 (32.8%) | 351 (22.9%) |
| 8 or more Rooms | 986 (32.5%) | 71 (4.6%) |
| Total | 3,036 (100.0%) | 1,534 (100.0%) |
Housing Structure by Heating Type in Worthington
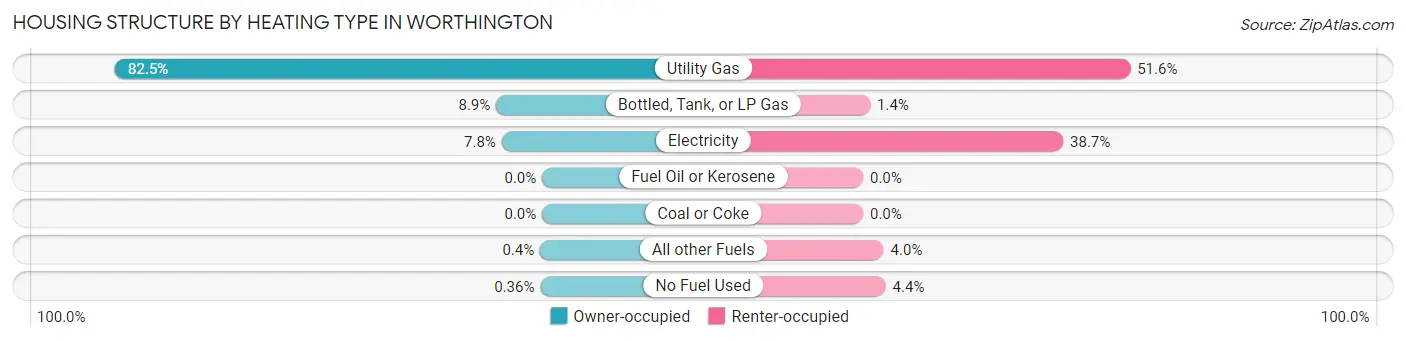
| Heating Type | Owner-occupied | Renter-occupied |
| Utility Gas | 2,506 (82.5%) | 792 (51.6%) |
| Bottled, Tank, or LP Gas | 270 (8.9%) | 21 (1.4%) |
| Electricity | 237 (7.8%) | 593 (38.7%) |
| Fuel Oil or Kerosene | 0 (0.0%) | 0 (0.0%) |
| Coal or Coke | 0 (0.0%) | 0 (0.0%) |
| All other Fuels | 12 (0.4%) | 61 (4.0%) |
| No Fuel Used | 11 (0.4%) | 67 (4.4%) |
| Total | 3,036 (100.0%) | 1,534 (100.0%) |
Household Vehicle Usage in Worthington
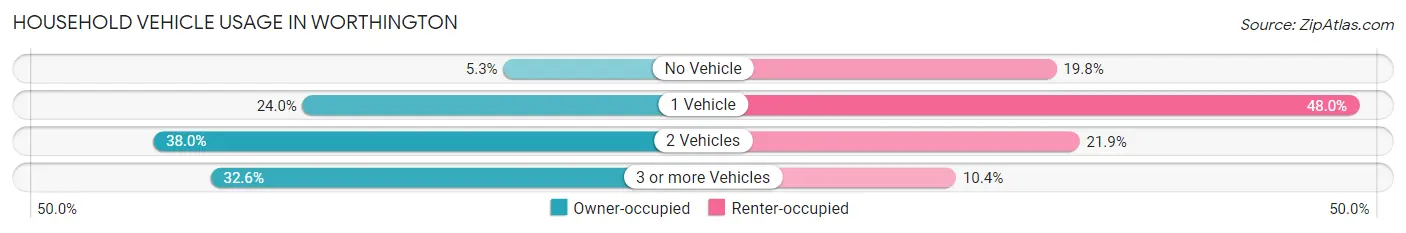
| Vehicles per Household | Owner-occupied | Renter-occupied |
| No Vehicle | 161 (5.3%) | 303 (19.8%) |
| 1 Vehicle | 730 (24.0%) | 736 (48.0%) |
| 2 Vehicles | 1,154 (38.0%) | 336 (21.9%) |
| 3 or more Vehicles | 991 (32.6%) | 159 (10.4%) |
| Total | 3,036 (100.0%) | 1,534 (100.0%) |
Real Estate & Mortgages in Worthington
Real Estate and Mortgage Overview in Worthington
| Characteristic | Without Mortgage | With Mortgage |
| Housing Units | 1,512 | 1,524 |
| Median Property Value | $158,200 | $165,600 |
| Median Household Income | $58,555 | $196 |
| Monthly Housing Costs | $511 | $20 |
| Real Estate Taxes | $1,637 | $30 |
Property Value by Mortgage Status in Worthington
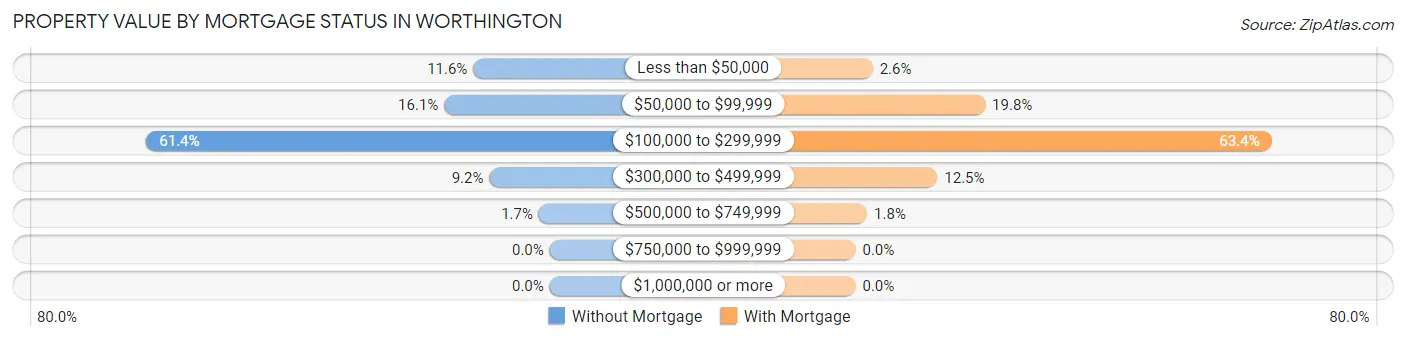
| Property Value | Without Mortgage | With Mortgage |
| Less than $50,000 | 176 (11.6%) | 40 (2.6%) |
| $50,000 to $99,999 | 243 (16.1%) | 301 (19.8%) |
| $100,000 to $299,999 | 929 (61.4%) | 966 (63.4%) |
| $300,000 to $499,999 | 139 (9.2%) | 190 (12.5%) |
| $500,000 to $749,999 | 25 (1.7%) | 27 (1.8%) |
| $750,000 to $999,999 | 0 (0.0%) | 0 (0.0%) |
| $1,000,000 or more | 0 (0.0%) | 0 (0.0%) |
| Total | 1,512 (100.0%) | 1,524 (100.0%) |
Household Income by Mortgage Status in Worthington
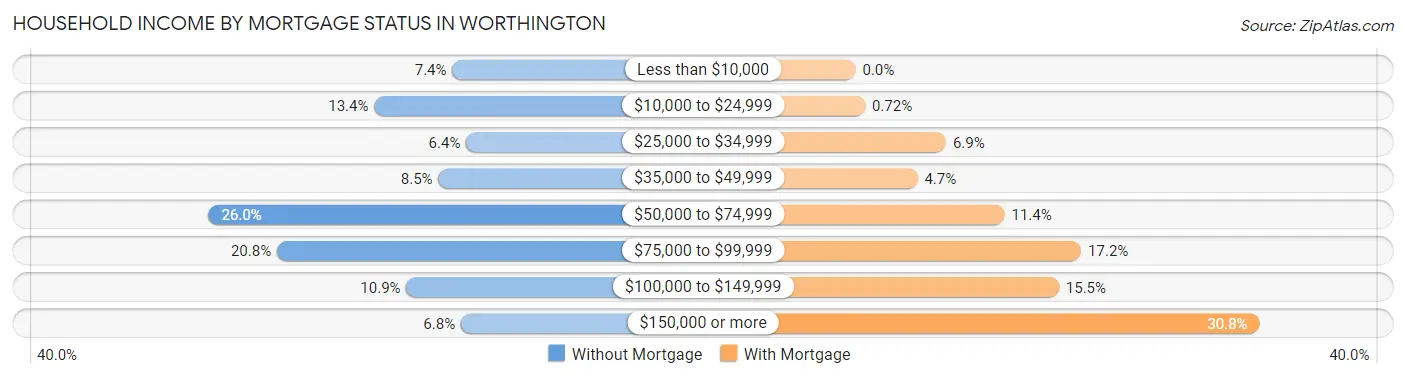
| Household Income | Without Mortgage | With Mortgage |
| Less than $10,000 | 112 (7.4%) | 0 (0.0%) |
| $10,000 to $24,999 | 202 (13.4%) | 11 (0.7%) |
| $25,000 to $34,999 | 96 (6.4%) | 105 (6.9%) |
| $35,000 to $49,999 | 128 (8.5%) | 72 (4.7%) |
| $50,000 to $74,999 | 393 (26.0%) | 173 (11.4%) |
| $75,000 to $99,999 | 314 (20.8%) | 262 (17.2%) |
| $100,000 to $149,999 | 165 (10.9%) | 236 (15.5%) |
| $150,000 or more | 102 (6.8%) | 469 (30.8%) |
| Total | 1,512 (100.0%) | 1,524 (100.0%) |
Property Value to Household Income Ratio in Worthington
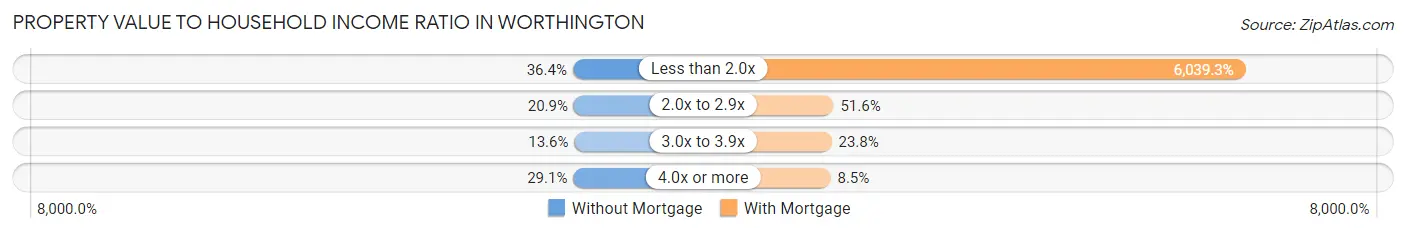
| Value-to-Income Ratio | Without Mortgage | With Mortgage |
| Less than 2.0x | 551 (36.4%) | 92,039 (6,039.3%) |
| 2.0x to 2.9x | 316 (20.9%) | 787 (51.6%) |
| 3.0x to 3.9x | 205 (13.6%) | 362 (23.7%) |
| 4.0x or more | 440 (29.1%) | 130 (8.5%) |
| Total | 1,512 (100.0%) | 1,524 (100.0%) |
Real Estate Taxes by Mortgage Status in Worthington
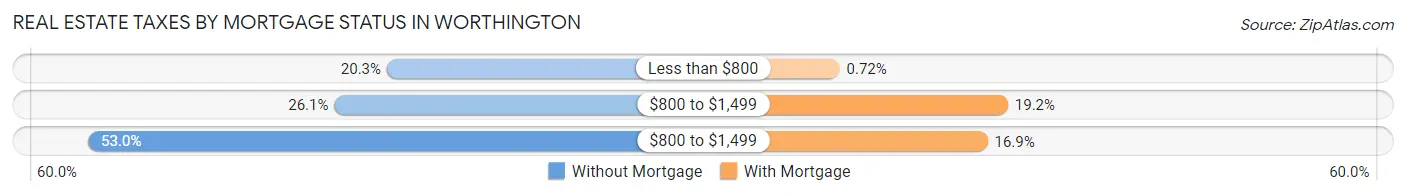
| Property Taxes | Without Mortgage | With Mortgage |
| Less than $800 | 307 (20.3%) | 11 (0.7%) |
| $800 to $1,499 | 394 (26.1%) | 292 (19.2%) |
| $800 to $1,499 | 802 (53.0%) | 258 (16.9%) |
| Total | 1,512 (100.0%) | 1,524 (100.0%) |
Health & Disability in Worthington
Health Insurance Coverage by Age in Worthington
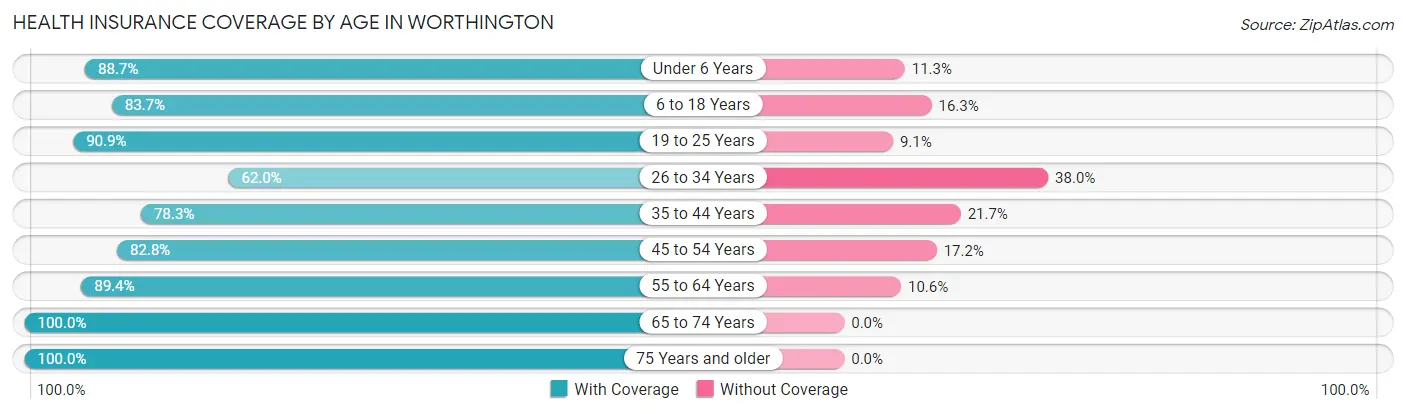
| Age Bracket | With Coverage | Without Coverage |
| Under 6 Years | 1,250 (88.7%) | 159 (11.3%) |
| 6 to 18 Years | 2,511 (83.7%) | 488 (16.3%) |
| 19 to 25 Years | 1,063 (90.9%) | 106 (9.1%) |
| 26 to 34 Years | 983 (62.0%) | 603 (38.0%) |
| 35 to 44 Years | 1,309 (78.3%) | 363 (21.7%) |
| 45 to 54 Years | 1,148 (82.8%) | 239 (17.2%) |
| 55 to 64 Years | 1,217 (89.4%) | 144 (10.6%) |
| 65 to 74 Years | 1,041 (100.0%) | 0 (0.0%) |
| 75 Years and older | 926 (100.0%) | 0 (0.0%) |
| Total | 11,448 (84.5%) | 2,102 (15.5%) |
Health Insurance Coverage by Citizenship Status in Worthington
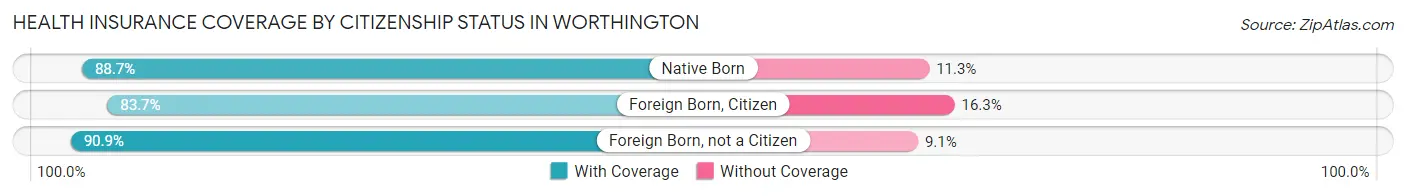
| Citizenship Status | With Coverage | Without Coverage |
| Native Born | 1,250 (88.7%) | 159 (11.3%) |
| Foreign Born, Citizen | 2,511 (83.7%) | 488 (16.3%) |
| Foreign Born, not a Citizen | 1,063 (90.9%) | 106 (9.1%) |
Health Insurance Coverage by Household Income in Worthington
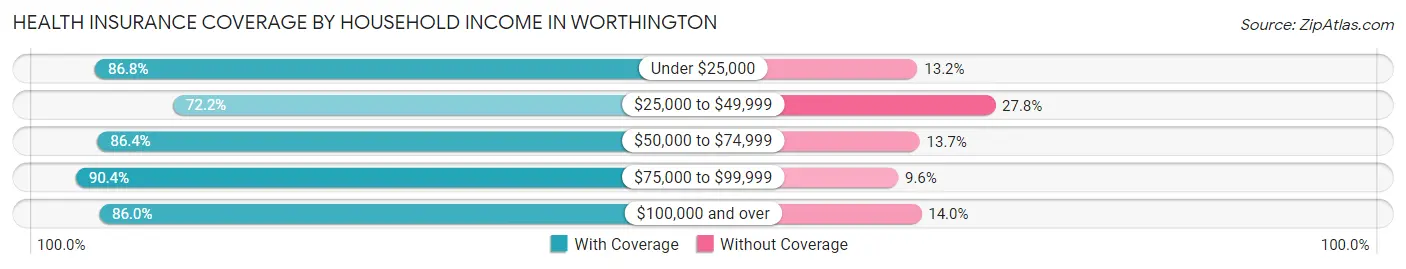
| Household Income | With Coverage | Without Coverage |
| Under $25,000 | 1,490 (86.8%) | 227 (13.2%) |
| $25,000 to $49,999 | 1,853 (72.2%) | 713 (27.8%) |
| $50,000 to $74,999 | 2,384 (86.4%) | 377 (13.7%) |
| $75,000 to $99,999 | 2,005 (90.4%) | 213 (9.6%) |
| $100,000 and over | 3,525 (86.0%) | 572 (14.0%) |
Public vs Private Health Insurance Coverage by Age in Worthington
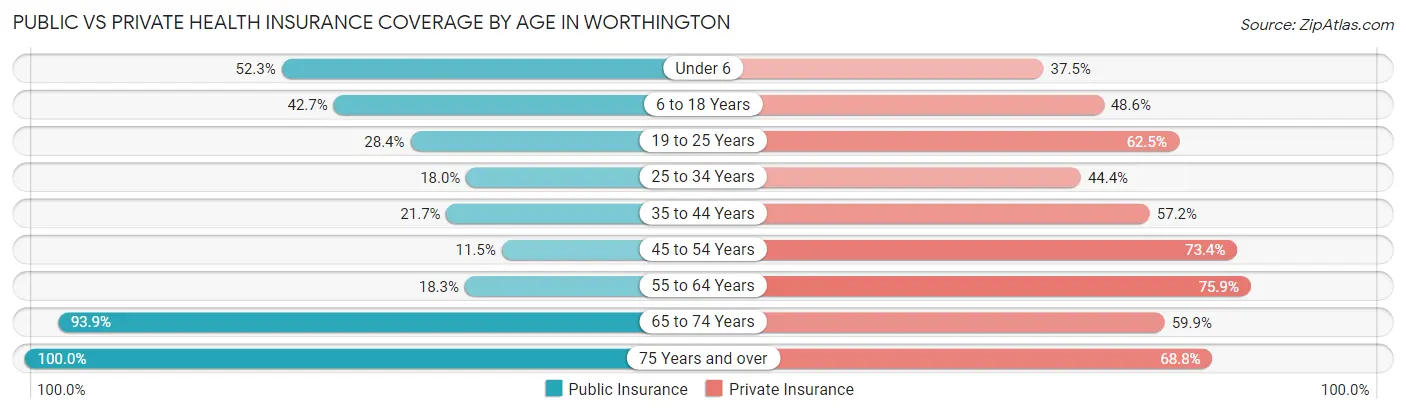
| Age Bracket | Public Insurance | Private Insurance |
| Under 6 | 737 (52.3%) | 528 (37.5%) |
| 6 to 18 Years | 1,279 (42.6%) | 1,458 (48.6%) |
| 19 to 25 Years | 332 (28.4%) | 731 (62.5%) |
| 25 to 34 Years | 286 (18.0%) | 704 (44.4%) |
| 35 to 44 Years | 363 (21.7%) | 956 (57.2%) |
| 45 to 54 Years | 159 (11.5%) | 1,018 (73.4%) |
| 55 to 64 Years | 249 (18.3%) | 1,033 (75.9%) |
| 65 to 74 Years | 977 (93.9%) | 624 (59.9%) |
| 75 Years and over | 926 (100.0%) | 637 (68.8%) |
| Total | 5,308 (39.2%) | 7,689 (56.8%) |
Disability Status by Sex by Age in Worthington
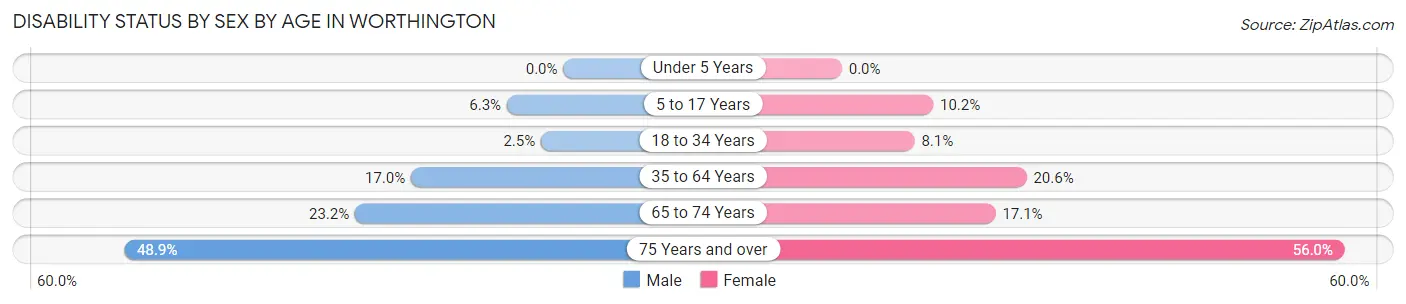
| Age Bracket | Male | Female |
| Under 5 Years | 0 (0.0%) | 0 (0.0%) |
| 5 to 17 Years | 90 (6.3%) | 139 (10.2%) |
| 18 to 34 Years | 40 (2.5%) | 124 (8.1%) |
| 35 to 64 Years | 391 (17.0%) | 435 (20.6%) |
| 65 to 74 Years | 129 (23.2%) | 83 (17.1%) |
| 75 Years and over | 205 (48.9%) | 284 (56.0%) |
Disability Class by Sex by Age in Worthington
Disability Class: Hearing Difficulty
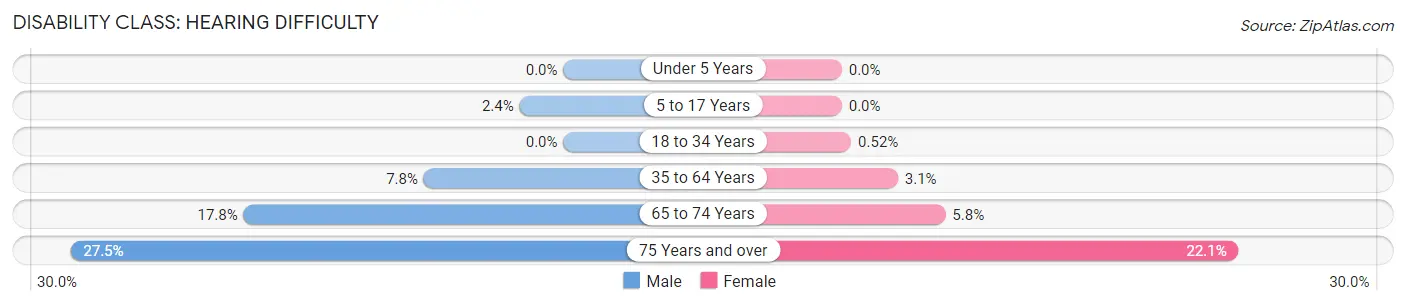
| Age Bracket | Male | Female |
| Under 5 Years | 0 (0.0%) | 0 (0.0%) |
| 5 to 17 Years | 35 (2.4%) | 0 (0.0%) |
| 18 to 34 Years | 0 (0.0%) | 8 (0.5%) |
| 35 to 64 Years | 179 (7.8%) | 66 (3.1%) |
| 65 to 74 Years | 99 (17.8%) | 28 (5.8%) |
| 75 Years and over | 115 (27.5%) | 112 (22.1%) |
Disability Class: Vision Difficulty
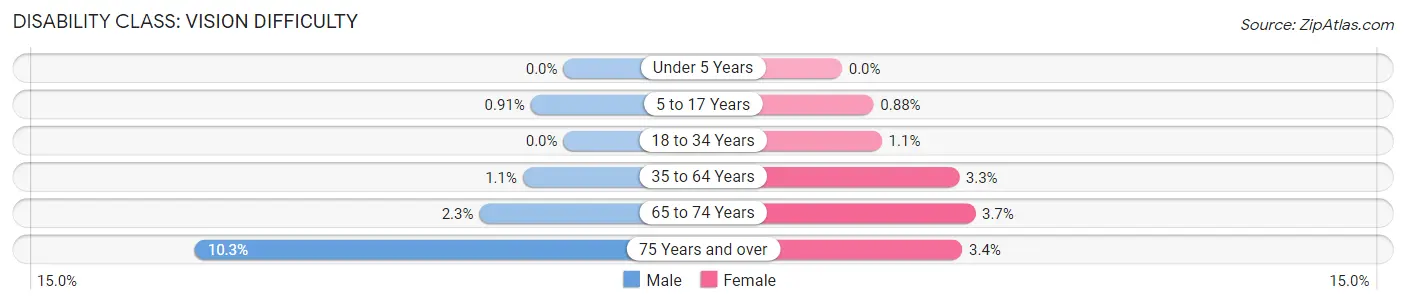
| Age Bracket | Male | Female |
| Under 5 Years | 0 (0.0%) | 0 (0.0%) |
| 5 to 17 Years | 13 (0.9%) | 12 (0.9%) |
| 18 to 34 Years | 0 (0.0%) | 17 (1.1%) |
| 35 to 64 Years | 26 (1.1%) | 69 (3.3%) |
| 65 to 74 Years | 13 (2.3%) | 18 (3.7%) |
| 75 Years and over | 43 (10.3%) | 17 (3.4%) |
Disability Class: Cognitive Difficulty
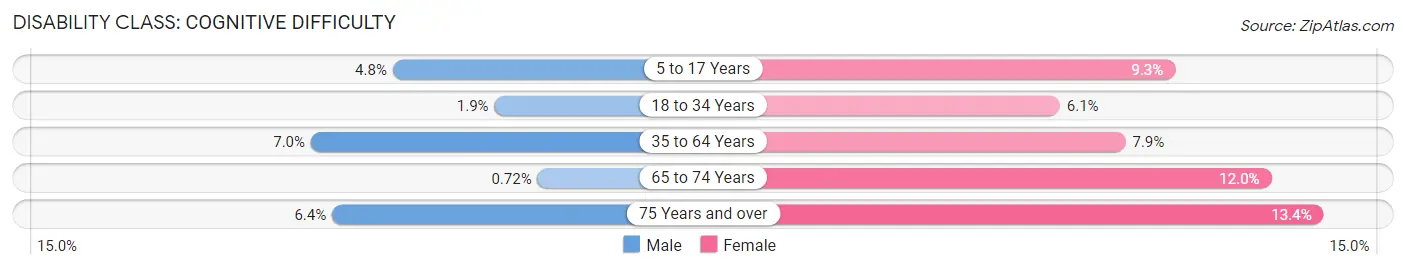
| Age Bracket | Male | Female |
| 5 to 17 Years | 68 (4.8%) | 127 (9.3%) |
| 18 to 34 Years | 31 (1.9%) | 93 (6.1%) |
| 35 to 64 Years | 162 (7.0%) | 167 (7.9%) |
| 65 to 74 Years | 4 (0.7%) | 58 (12.0%) |
| 75 Years and over | 27 (6.4%) | 68 (13.4%) |
Disability Class: Ambulatory Difficulty
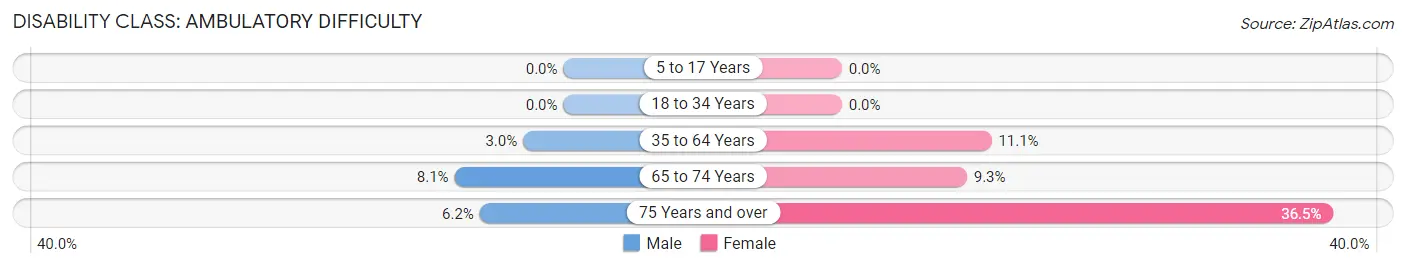
| Age Bracket | Male | Female |
| 5 to 17 Years | 0 (0.0%) | 0 (0.0%) |
| 18 to 34 Years | 0 (0.0%) | 0 (0.0%) |
| 35 to 64 Years | 69 (3.0%) | 235 (11.1%) |
| 65 to 74 Years | 45 (8.1%) | 45 (9.3%) |
| 75 Years and over | 26 (6.2%) | 185 (36.5%) |
Disability Class: Self-Care Difficulty
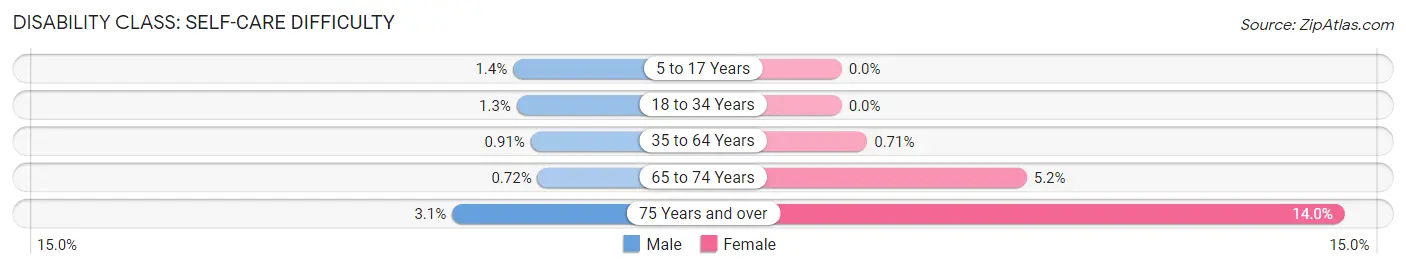
| Age Bracket | Male | Female |
| 5 to 17 Years | 20 (1.4%) | 0 (0.0%) |
| 18 to 34 Years | 21 (1.3%) | 0 (0.0%) |
| 35 to 64 Years | 21 (0.9%) | 15 (0.7%) |
| 65 to 74 Years | 4 (0.7%) | 25 (5.1%) |
| 75 Years and over | 13 (3.1%) | 71 (14.0%) |
Technology Access in Worthington
Computing Device Access in Worthington
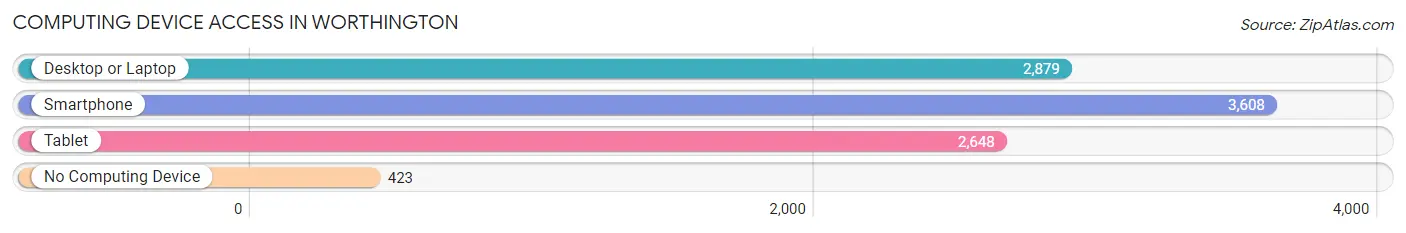
| Device Type | # Households | % Households |
| Desktop or Laptop | 2,879 | 63.0% |
| Smartphone | 3,608 | 78.9% |
| Tablet | 2,648 | 57.9% |
| No Computing Device | 423 | 9.3% |
| Total | 4,570 | 100.0% |
Internet Access in Worthington
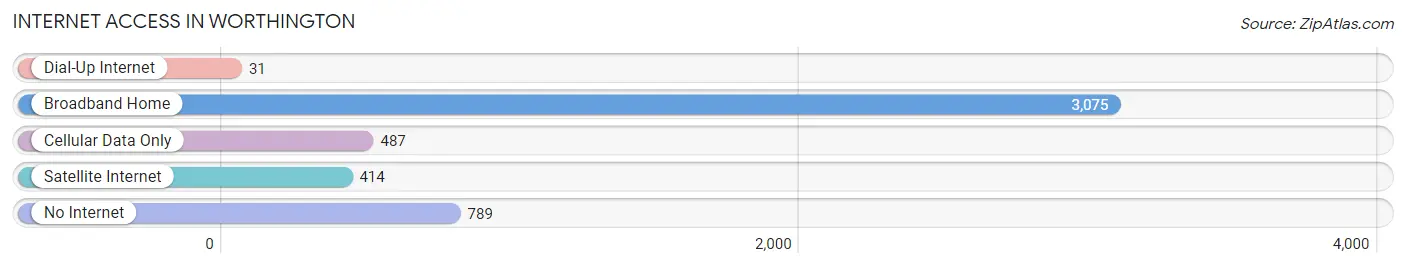
| Internet Type | # Households | % Households |
| Dial-Up Internet | 31 | 0.7% |
| Broadband Home | 3,075 | 67.3% |
| Cellular Data Only | 487 | 10.7% |
| Satellite Internet | 414 | 9.1% |
| No Internet | 789 | 17.3% |
| Total | 4,570 | 100.0% |
Worthington Summary
Worthington, Minnesota is a city located in Nobles County in the southwestern corner of the state. It is the county seat and the largest city in the county. The city is located along the Minnesota-Iowa border and is approximately 60 miles from Sioux Falls, South Dakota. The population of Worthington was 12,764 at the 2010 census.
History
The area that is now Worthington was first settled in 1871 by settlers from Ohio. The city was named after the Worthington family, who were among the first settlers. The city was incorporated in 1881 and was designated as the county seat in 1883.
The city grew rapidly in the late 19th and early 20th centuries, due to its location on the Chicago, Milwaukee, St. Paul and Pacific Railroad. The city was also a major center for the agricultural industry, with many farmers and ranchers in the area.
Geography
Worthington is located at the intersection of Interstate 90 and U.S. Route 59. The city is situated on the Minnesota-Iowa border, with the Des Moines River running through the city. The city is located in a flat, open area, with the highest point in the city being only 1,068 feet above sea level.
The climate in Worthington is classified as humid continental, with hot summers and cold winters. The average annual temperature is 48.2°F, with an average high of 68.2°F in July and an average low of 28.2°F in January.
Economy
The economy of Worthington is largely based on agriculture and manufacturing. The city is home to several large agricultural companies, including JBS USA, a pork processing plant, and Cargill, a grain processing plant. The city is also home to several manufacturing companies, including Worthington Industries, a steel processing plant, and Worthington Foods, a food processing plant.
The city is also home to several retail stores, restaurants, and other businesses. The city is served by the Worthington Regional Airport, which provides air service to the city and the surrounding area.
Demographics
As of the 2010 census, the population of Worthington was 12,764. The racial makeup of the city was 87.3% White, 0.7% African American, 0.3% Native American, 0.7% Asian, 0.1% Pacific Islander, 8.7% from other races, and 2.1% from two or more races. Hispanic or Latino of any race were 16.2% of the population.
The median income for a household in the city was $41,945, and the median income for a family was $50,945. The per capita income for the city was $20,945. About 11.2% of families and 14.2% of the population were below the poverty line, including 19.2% of those under age 18 and 8.2% of those age 65 or over.
Worthington is a diverse city, with a variety of cultures and backgrounds represented in the population. The city is home to a large Hispanic population, as well as a large Somali population. The city is also home to a large number of immigrants from other countries, including Mexico, India, and China.
Common Questions
What is Per Capita Income in Worthington?
Per Capita income in Worthington is $25,822.
What is the Median Family Income in Worthington?
Median Family Income in Worthington is $70,082.
What is the Median Household income in Worthington?
Median Household Income in Worthington is $58,690.
What is Income or Wage Gap in Worthington?
Income or Wage Gap in Worthington is 17.5%.
Women in Worthington earn 82.5 cents for every dollar earned by a man.
What is Family Income Deficit in Worthington?
Family Income Deficit in Worthington is $13,833.
Families that are below poverty line in Worthington earn $13,833 less on average than the poverty threshold level.
What is Inequality or Gini Index in Worthington?
Inequality or Gini Index in Worthington is 0.41.
What is the Total Population of Worthington?
Total Population of Worthington is 13,838.
What is the Total Male Population of Worthington?
Total Male Population of Worthington is 6,960.
What is the Total Female Population of Worthington?
Total Female Population of Worthington is 6,878.
What is the Ratio of Males per 100 Females in Worthington?
There are 101.19 Males per 100 Females in Worthington.
What is the Ratio of Females per 100 Males in Worthington?
There are 98.82 Females per 100 Males in Worthington.
What is the Median Population Age in Worthington?
Median Population Age in Worthington is 33.1 Years.
What is the Average Family Size in Worthington
Average Family Size in Worthington is 3.7 People.
What is the Average Household Size in Worthington
Average Household Size in Worthington is 2.9 People.
How Large is the Labor Force in Worthington?
There are 6,641 People in the Labor Forcein in Worthington.
What is the Percentage of People in the Labor Force in Worthington?
64.6% of People are in the Labor Force in Worthington.
What is the Unemployment Rate in Worthington?
Unemployment Rate in Worthington is 3.5%.