Huntertown, IN Map & Demographics
Huntertown Map
Huntertown Overview
$38,236
PER CAPITA INCOME
$106,667
AVG FAMILY INCOME
$102,067
AVG HOUSEHOLD INCOME
38.4%
WAGE / INCOME GAP [ % ]
61.6¢/ $1
WAGE / INCOME GAP [ $ ]
0.35
INEQUALITY / GINI INDEX
9,090
TOTAL POPULATION
4,661
MALE POPULATION
4,429
FEMALE POPULATION
105.24
MALES / 100 FEMALES
95.02
FEMALES / 100 MALES
32.0
MEDIAN AGE
3.4
AVG FAMILY SIZE
3.1
AVG HOUSEHOLD SIZE
4,706
LABOR FORCE [ PEOPLE ]
75.6%
PERCENT IN LABOR FORCE
1.0%
UNEMPLOYMENT RATE
Huntertown Zip Codes
Huntertown Area Codes
Income in Huntertown
Income Overview in Huntertown
Per Capita Income in Huntertown is $38,236, while median incomes of families and households are $106,667 and $102,067 respectively.
| Characteristic | Number | Measure |
| Per Capita Income | 9,090 | $38,236 |
| Median Family Income | 2,422 | $106,667 |
| Mean Family Income | 2,422 | $124,333 |
| Median Household Income | 2,848 | $102,067 |
| Mean Household Income | 2,848 | $120,670 |
| Income Deficit | 2,422 | $0 |
| Wage / Income Gap (%) | 9,090 | 38.44% |
| Wage / Income Gap ($) | 9,090 | 61.56¢ per $1 |
| Gini / Inequality Index | 9,090 | 0.35 |
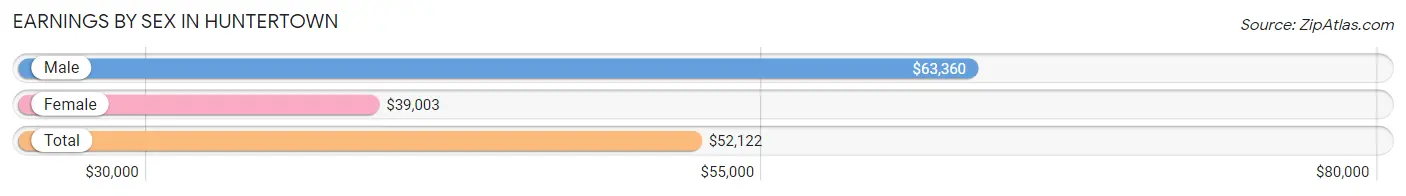
Earnings by Sex in Huntertown
Average Earnings in Huntertown are $52,122, $63,360 for men and $39,003 for women, a difference of 38.4%.
| Sex | Number | Average Earnings |
| Male | 2,627 (52.4%) | $63,360 |
| Female | 2,387 (47.6%) | $39,003 |
| Total | 5,014 (100.0%) | $52,122 |
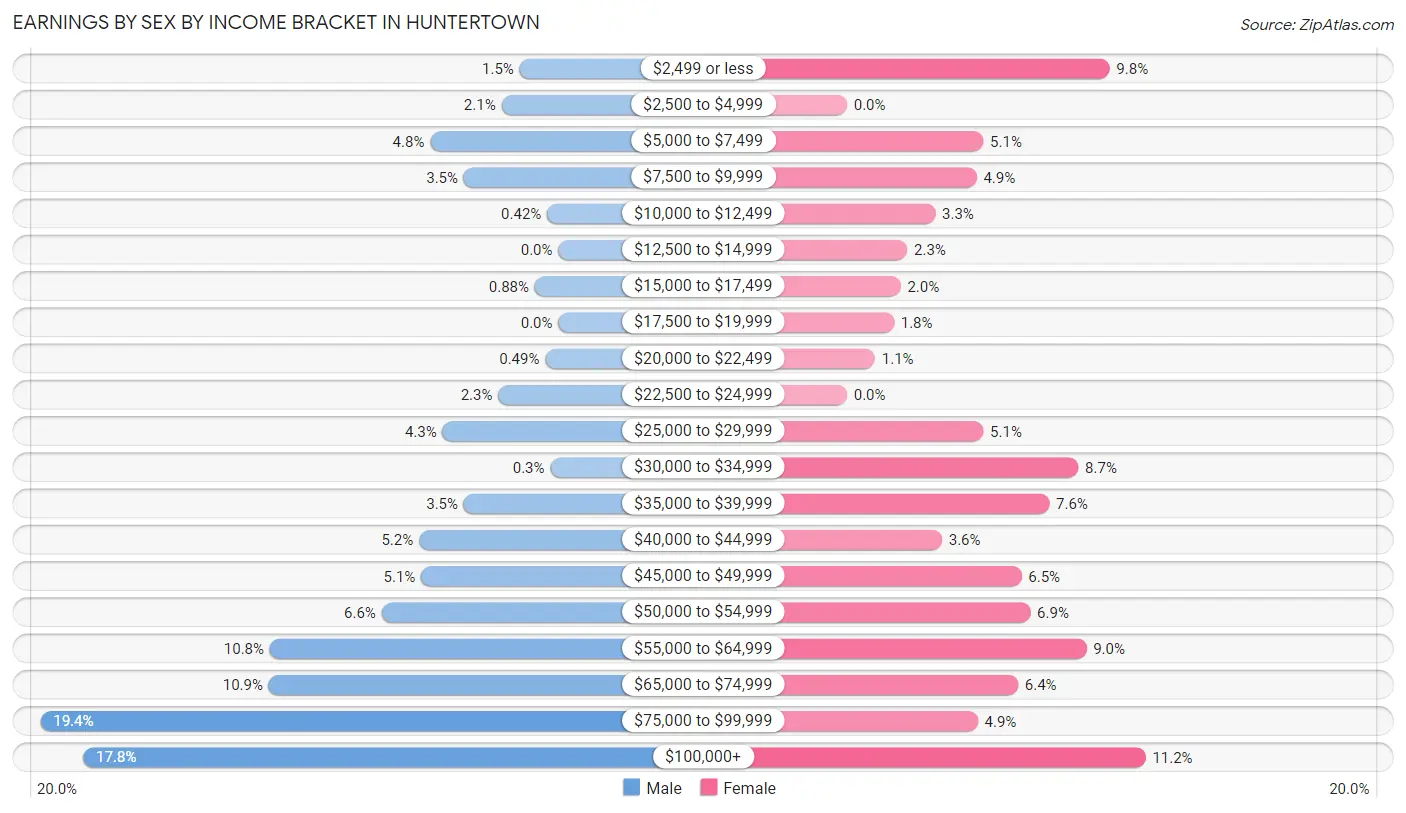
Earnings by Sex by Income Bracket in Huntertown
The most common earnings brackets in Huntertown are $75,000 to $99,999 for men (510 | 19.4%) and $100,000+ for women (267 | 11.2%).
| Income | Male | Female |
| $2,499 or less | 38 (1.5%) | 235 (9.8%) |
| $2,500 to $4,999 | 56 (2.1%) | 0 (0.0%) |
| $5,000 to $7,499 | 126 (4.8%) | 122 (5.1%) |
| $7,500 to $9,999 | 93 (3.5%) | 116 (4.9%) |
| $10,000 to $12,499 | 11 (0.4%) | 79 (3.3%) |
| $12,500 to $14,999 | 0 (0.0%) | 54 (2.3%) |
| $15,000 to $17,499 | 23 (0.9%) | 48 (2.0%) |
| $17,500 to $19,999 | 0 (0.0%) | 42 (1.8%) |
| $20,000 to $22,499 | 13 (0.5%) | 25 (1.1%) |
| $22,500 to $24,999 | 59 (2.2%) | 0 (0.0%) |
| $25,000 to $29,999 | 114 (4.3%) | 122 (5.1%) |
| $30,000 to $34,999 | 8 (0.3%) | 207 (8.7%) |
| $35,000 to $39,999 | 93 (3.5%) | 181 (7.6%) |
| $40,000 to $44,999 | 137 (5.2%) | 85 (3.6%) |
| $45,000 to $49,999 | 135 (5.1%) | 156 (6.5%) |
| $50,000 to $54,999 | 174 (6.6%) | 164 (6.9%) |
| $55,000 to $64,999 | 284 (10.8%) | 214 (9.0%) |
| $65,000 to $74,999 | 285 (10.8%) | 153 (6.4%) |
| $75,000 to $99,999 | 510 (19.4%) | 117 (4.9%) |
| $100,000+ | 468 (17.8%) | 267 (11.2%) |
| Total | 2,627 (100.0%) | 2,387 (100.0%) |
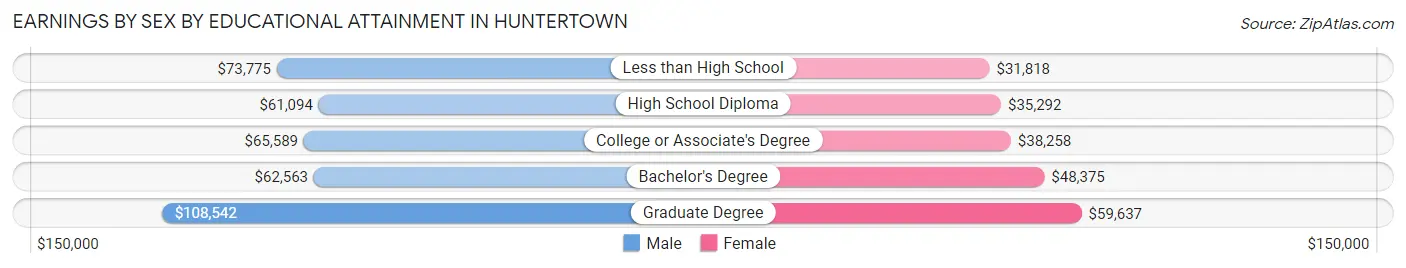
Earnings by Sex by Educational Attainment in Huntertown
Average earnings in Huntertown are $67,005 for men and $46,022 for women, a difference of 31.3%. Men with an educational attainment of graduate degree enjoy the highest average annual earnings of $108,542, while those with high school diploma education earn the least with $61,094. Women with an educational attainment of graduate degree earn the most with the average annual earnings of $59,637, while those with less than high school education have the smallest earnings of $31,818.
| Educational Attainment | Male Income | Female Income |
| Less than High School | $73,775 | $31,818 |
| High School Diploma | $61,094 | $35,292 |
| College or Associate's Degree | $65,589 | $38,258 |
| Bachelor's Degree | $62,563 | $48,375 |
| Graduate Degree | $108,542 | $59,637 |
| Total | $67,005 | $46,022 |
Family Income in Huntertown
Family Income Brackets in Huntertown
According to the Huntertown family income data, there are 690 families falling into the $100,000 to $149,999 income range, which is the most common income bracket and makes up 28.5% of all families. Conversely, the less than $10,000 income bracket is the least frequent group with only 12 families (0.5%) belonging to this category.
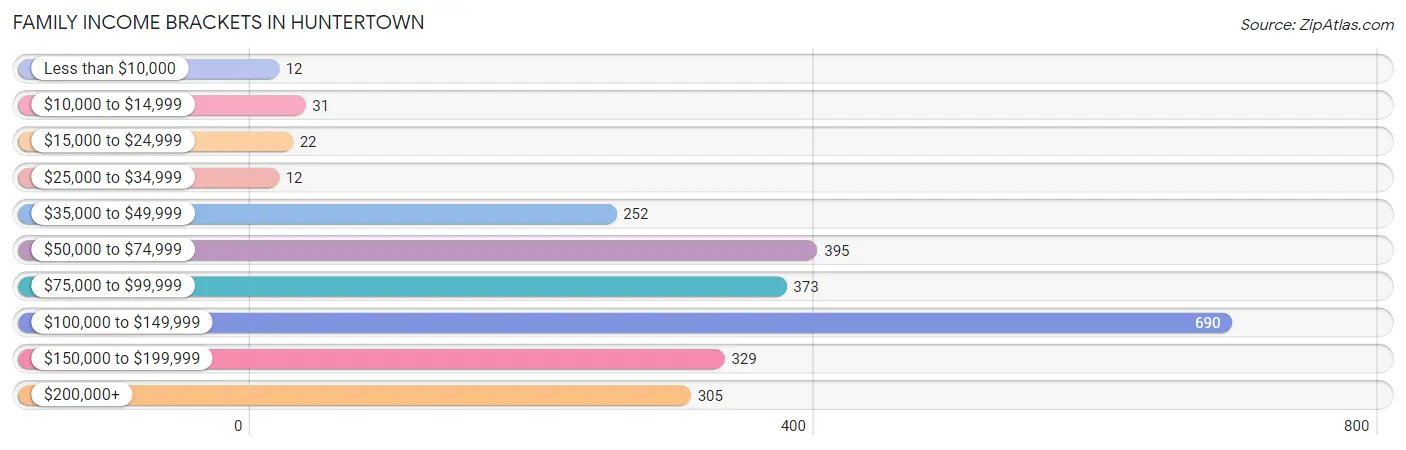
| Income Bracket | # Families | % Families |
| Less than $10,000 | 12 | 0.5% |
| $10,000 to $14,999 | 31 | 1.3% |
| $15,000 to $24,999 | 22 | 0.9% |
| $25,000 to $34,999 | 12 | 0.5% |
| $35,000 to $49,999 | 252 | 10.4% |
| $50,000 to $74,999 | 395 | 16.3% |
| $75,000 to $99,999 | 373 | 15.4% |
| $100,000 to $149,999 | 690 | 28.5% |
| $150,000 to $199,999 | 329 | 13.6% |
| $200,000+ | 305 | 12.6% |
Family Income by Famaliy Size in Huntertown
7+ person families (81 | 3.3%) account for the highest median family income in Huntertown with $177,813 per family, while 2-person families (912 | 37.7%) have the highest median income of $48,000 per family member.
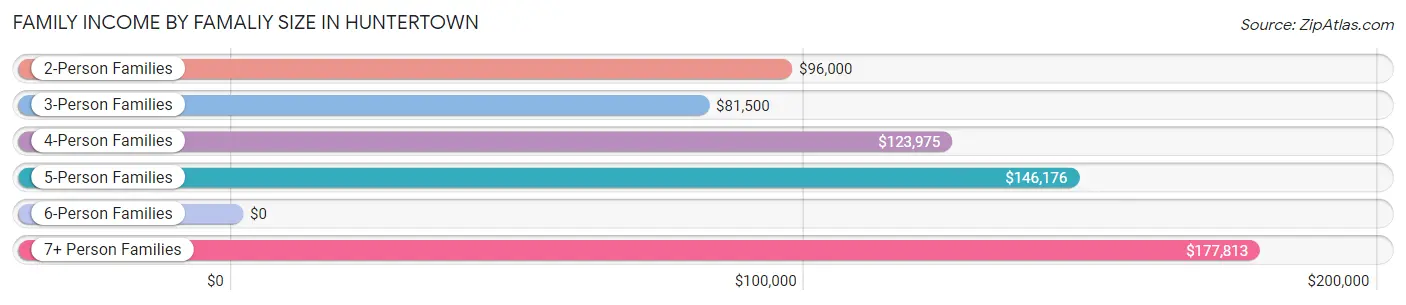
| Income Bracket | # Families | Median Income |
| 2-Person Families | 912 (37.7%) | $96,000 |
| 3-Person Families | 480 (19.8%) | $81,500 |
| 4-Person Families | 438 (18.1%) | $123,975 |
| 5-Person Families | 434 (17.9%) | $146,176 |
| 6-Person Families | 77 (3.2%) | $0 |
| 7+ Person Families | 81 (3.3%) | $177,813 |
| Total | 2,422 (100.0%) | $106,667 |
Family Income by Number of Earners in Huntertown
The median family income in Huntertown is $106,667, with families comprising 3+ earners (341) having the highest median family income of $164,479, while families with no earners (158) have the lowest median family income of $57,143, accounting for 14.1% and 6.5% of families, respectively.
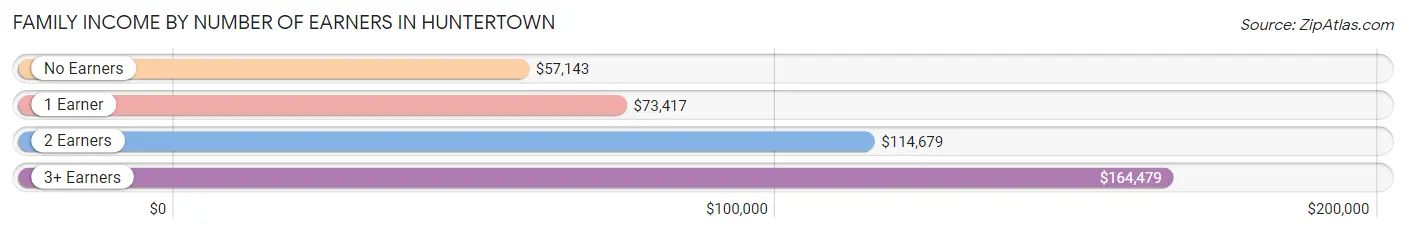
| Number of Earners | # Families | Median Income |
| No Earners | 158 (6.5%) | $57,143 |
| 1 Earner | 531 (21.9%) | $73,417 |
| 2 Earners | 1,392 (57.5%) | $114,679 |
| 3+ Earners | 341 (14.1%) | $164,479 |
| Total | 2,422 (100.0%) | $106,667 |
Household Income in Huntertown
Household Income Brackets in Huntertown
With 740 households falling in the category, the $100,000 to $149,999 income range is the most frequent in Huntertown, accounting for 26.0% of all households. In contrast, only 14 households (0.5%) fall into the less than $10,000 income bracket, making it the least populous group.
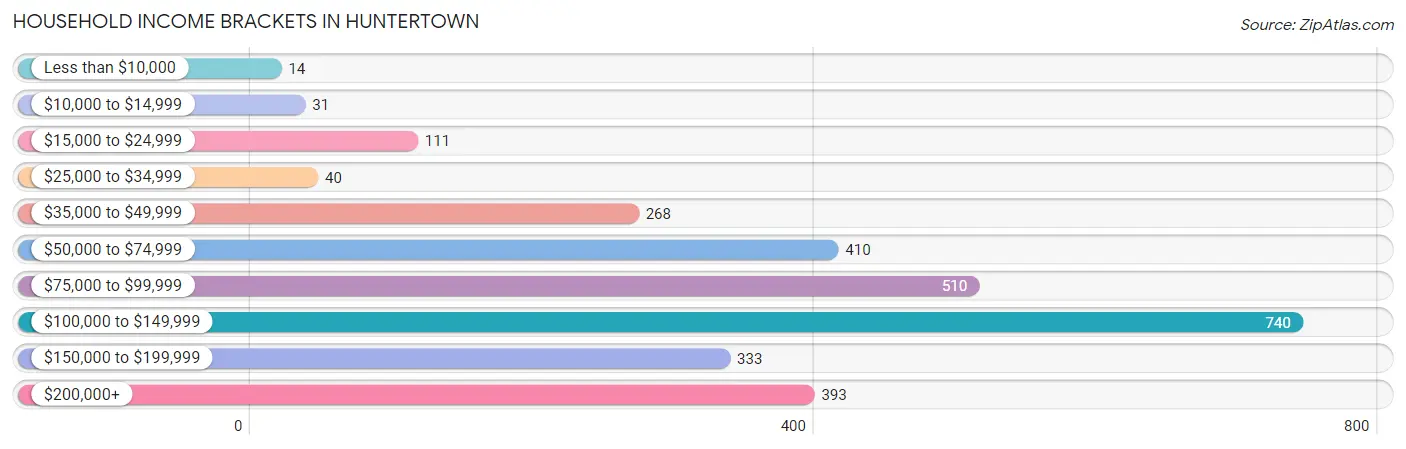
| Income Bracket | # Households | % Households |
| Less than $10,000 | 14 | 0.5% |
| $10,000 to $14,999 | 31 | 1.1% |
| $15,000 to $24,999 | 111 | 3.9% |
| $25,000 to $34,999 | 40 | 1.4% |
| $35,000 to $49,999 | 268 | 9.4% |
| $50,000 to $74,999 | 410 | 14.4% |
| $75,000 to $99,999 | 510 | 17.9% |
| $100,000 to $149,999 | 740 | 26.0% |
| $150,000 to $199,999 | 333 | 11.7% |
| $200,000+ | 393 | 13.8% |
Household Income by Householder Age in Huntertown
The median household income in Huntertown is $102,067, with the highest median household income of $140,063 found in the 45 to 64 years age bracket for the primary householder. A total of 993 households (34.9%) fall into this category. Meanwhile, the 15 to 24 years age bracket for the primary householder has the lowest median household income of $0, with 31 households (1.1%) in this group.
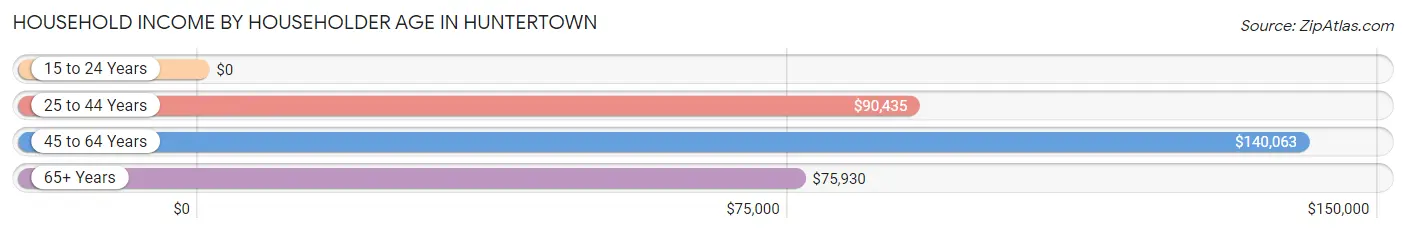
| Income Bracket | # Households | Median Income |
| 15 to 24 Years | 31 (1.1%) | $0 |
| 25 to 44 Years | 1,360 (47.7%) | $90,435 |
| 45 to 64 Years | 993 (34.9%) | $140,063 |
| 65+ Years | 464 (16.3%) | $75,930 |
| Total | 2,848 (100.0%) | $102,067 |
Poverty in Huntertown
Income Below Poverty by Sex and Age in Huntertown
With 0.8% poverty level for males and 2.6% for females among the residents of Huntertown, 25 to 34 year old males and 18 to 24 year old females are the most vulnerable to poverty, with 23 males (3.6%) and 31 females (15.3%) in their respective age groups living below the poverty level.
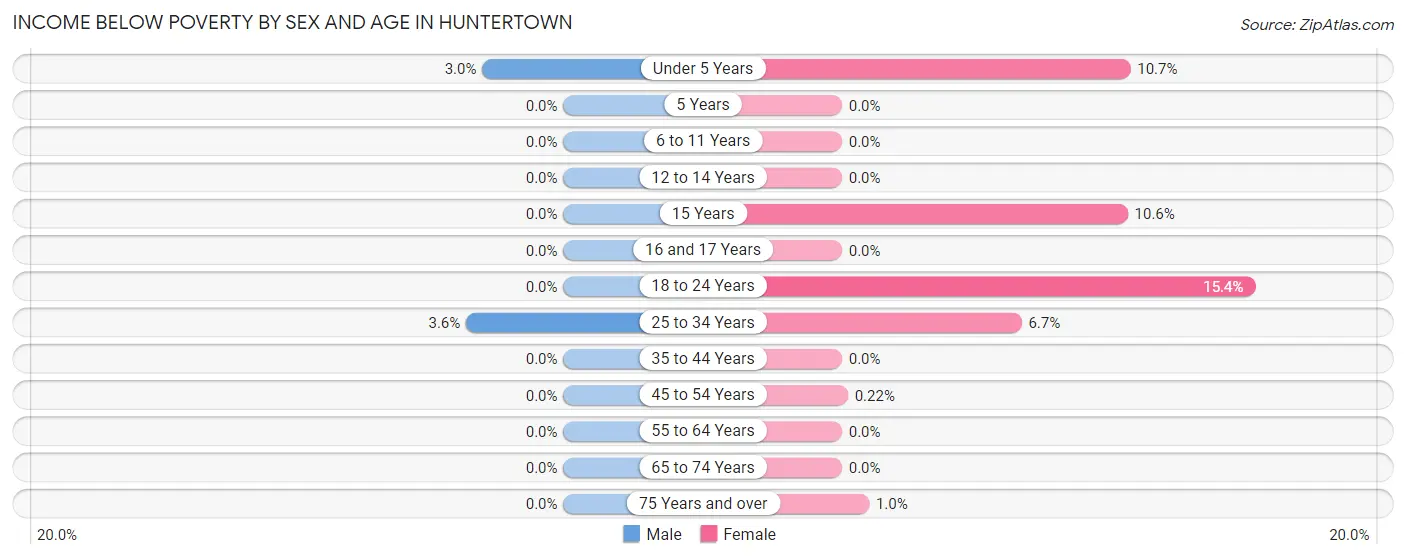
| Age Bracket | Male | Female |
| Under 5 Years | 14 (3.0%) | 27 (10.7%) |
| 5 Years | 0 (0.0%) | 0 (0.0%) |
| 6 to 11 Years | 0 (0.0%) | 0 (0.0%) |
| 12 to 14 Years | 0 (0.0%) | 0 (0.0%) |
| 15 Years | 0 (0.0%) | 14 (10.6%) |
| 16 and 17 Years | 0 (0.0%) | 0 (0.0%) |
| 18 to 24 Years | 0 (0.0%) | 31 (15.3%) |
| 25 to 34 Years | 23 (3.6%) | 40 (6.7%) |
| 35 to 44 Years | 0 (0.0%) | 0 (0.0%) |
| 45 to 54 Years | 0 (0.0%) | 1 (0.2%) |
| 55 to 64 Years | 0 (0.0%) | 0 (0.0%) |
| 65 to 74 Years | 0 (0.0%) | 0 (0.0%) |
| 75 Years and over | 0 (0.0%) | 1 (1.0%) |
| Total | 37 (0.8%) | 114 (2.6%) |
Income Above Poverty by Sex and Age in Huntertown
According to the poverty statistics in Huntertown, males aged 5 years and females aged 5 years are the age groups that are most secure financially, with 100.0% of males and 100.0% of females in these age groups living above the poverty line.
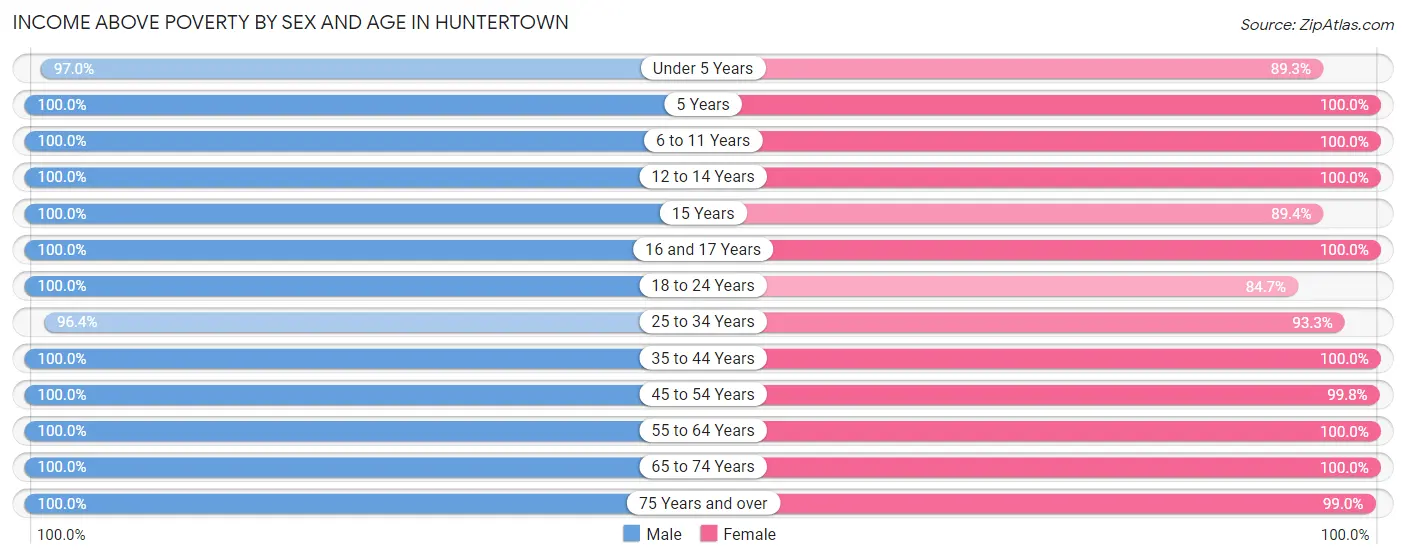
| Age Bracket | Male | Female |
| Under 5 Years | 451 (97.0%) | 225 (89.3%) |
| 5 Years | 12 (100.0%) | 9 (100.0%) |
| 6 to 11 Years | 545 (100.0%) | 670 (100.0%) |
| 12 to 14 Years | 335 (100.0%) | 232 (100.0%) |
| 15 Years | 149 (100.0%) | 118 (89.4%) |
| 16 and 17 Years | 137 (100.0%) | 253 (100.0%) |
| 18 to 24 Years | 250 (100.0%) | 171 (84.7%) |
| 25 to 34 Years | 615 (96.4%) | 560 (93.3%) |
| 35 to 44 Years | 671 (100.0%) | 771 (100.0%) |
| 45 to 54 Years | 526 (100.0%) | 457 (99.8%) |
| 55 to 64 Years | 427 (100.0%) | 347 (100.0%) |
| 65 to 74 Years | 256 (100.0%) | 308 (100.0%) |
| 75 Years and over | 86 (100.0%) | 98 (99.0%) |
| Total | 4,460 (99.2%) | 4,219 (97.4%) |
Income Below Poverty Among Married-Couple Families in Huntertown
The poverty statistics for married-couple families in Huntertown show that 1.1% or 23 of the total 2,021 families live below the poverty line. Families with no children have the highest poverty rate of 2.8%, comprising of 23 families. On the other hand, families with 1 or 2 children have the lowest poverty rate of 0.0%, which includes 0 families.
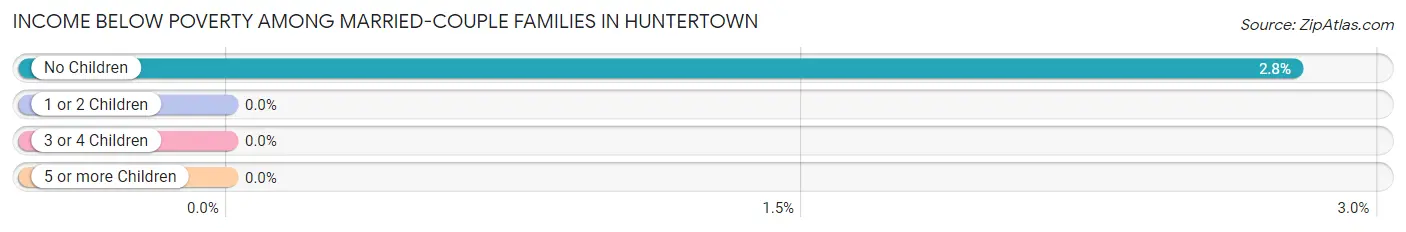
| Children | Above Poverty | Below Poverty |
| No Children | 805 (97.2%) | 23 (2.8%) |
| 1 or 2 Children | 787 (100.0%) | 0 (0.0%) |
| 3 or 4 Children | 334 (100.0%) | 0 (0.0%) |
| 5 or more Children | 72 (100.0%) | 0 (0.0%) |
| Total | 1,998 (98.9%) | 23 (1.1%) |
Income Below Poverty Among Single-Parent Households in Huntertown
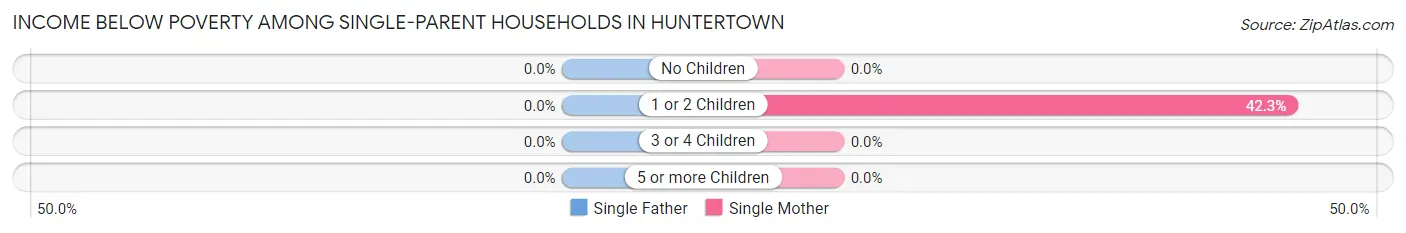
| Children | Single Father | Single Mother |
| No Children | 0 (0.0%) | 0 (0.0%) |
| 1 or 2 Children | 0 (0.0%) | 44 (42.3%) |
| 3 or 4 Children | 0 (0.0%) | 0 (0.0%) |
| 5 or more Children | 0 (0.0%) | 0 (0.0%) |
| Total | 0 (0.0%) | 44 (22.9%) |
Income Below Poverty Among Married-Couple vs Single-Parent Households in Huntertown
The poverty data for Huntertown shows that 23 of the married-couple family households (1.1%) and 44 of the single-parent households (11.0%) are living below the poverty level. Within the married-couple family households, those with no children have the highest poverty rate, with 23 households (2.8%) falling below the poverty line. Among the single-parent households, those with 1 or 2 children have the highest poverty rate, with 44 household (18.6%) living below poverty.
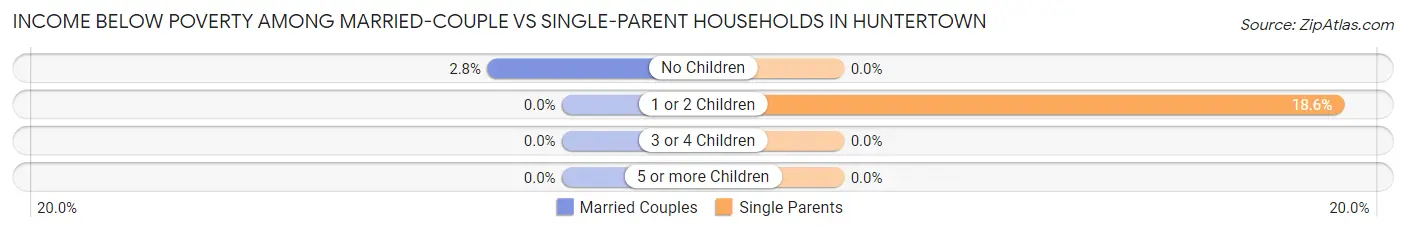
| Children | Married-Couple Families | Single-Parent Households |
| No Children | 23 (2.8%) | 0 (0.0%) |
| 1 or 2 Children | 0 (0.0%) | 44 (18.6%) |
| 3 or 4 Children | 0 (0.0%) | 0 (0.0%) |
| 5 or more Children | 0 (0.0%) | 0 (0.0%) |
| Total | 23 (1.1%) | 44 (11.0%) |
Race in Huntertown
The most populous races in Huntertown are White / Caucasian (7,937 | 87.3%), Asian (488 | 5.4%), and Black / African American (255 | 2.8%).
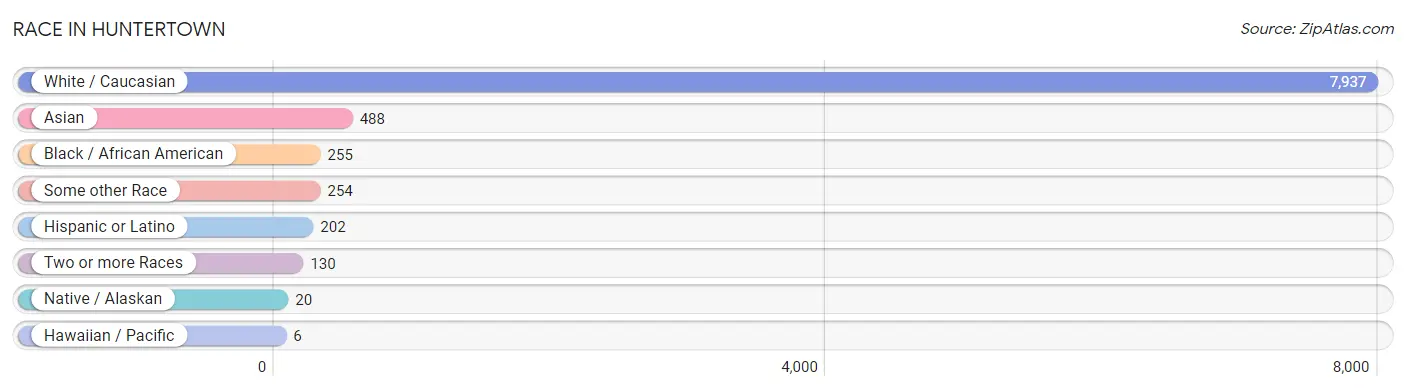
| Race | # Population | % Population |
| Asian | 488 | 5.4% |
| Black / African American | 255 | 2.8% |
| Hawaiian / Pacific | 6 | 0.1% |
| Hispanic or Latino | 202 | 2.2% |
| Native / Alaskan | 20 | 0.2% |
| White / Caucasian | 7,937 | 87.3% |
| Two or more Races | 130 | 1.4% |
| Some other Race | 254 | 2.8% |
| Total | 9,090 | 100.0% |
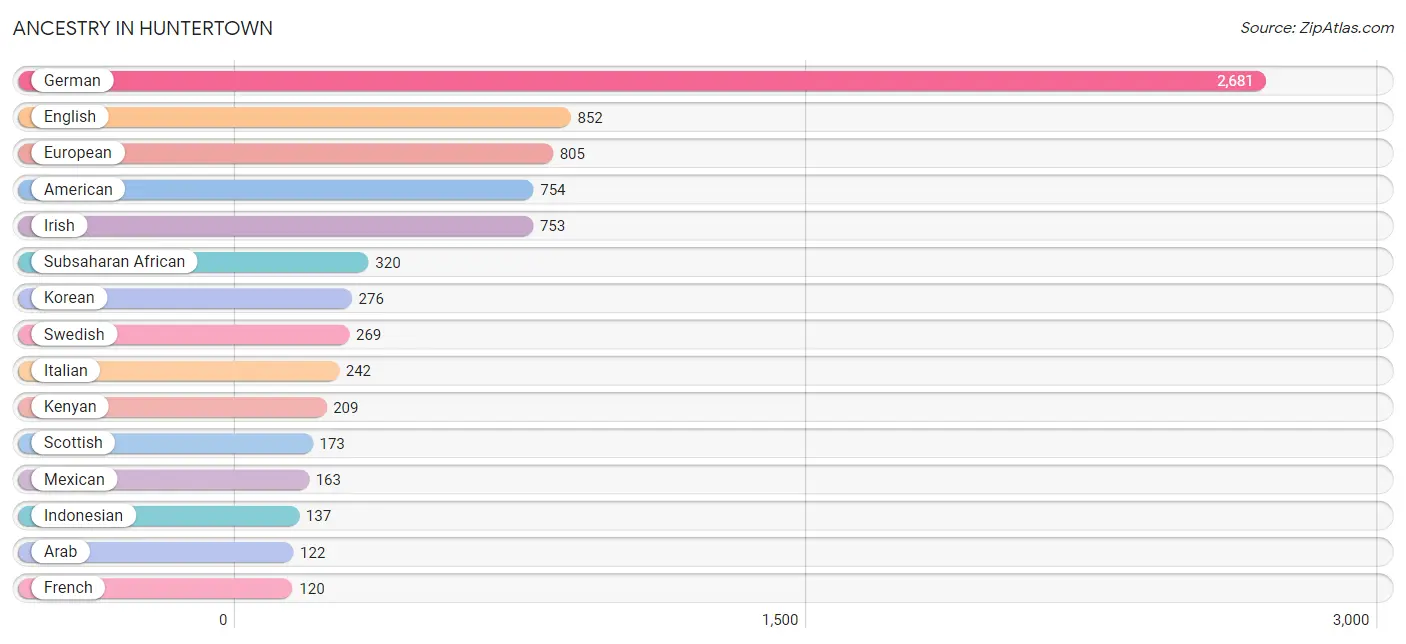
Ancestry in Huntertown
The most populous ancestries reported in Huntertown are German (2,681 | 29.5%), English (852 | 9.4%), European (805 | 8.9%), American (754 | 8.3%), and Irish (753 | 8.3%), together accounting for 64.3% of all Huntertown residents.
| Ancestry | # Population | % Population |
| African | 20 | 0.2% |
| American | 754 | 8.3% |
| Apache | 29 | 0.3% |
| Arab | 122 | 1.3% |
| Australian | 14 | 0.2% |
| British | 78 | 0.9% |
| Canadian | 59 | 0.6% |
| Celtic | 8 | 0.1% |
| Central American | 39 | 0.4% |
| Cherokee | 11 | 0.1% |
| Chippewa | 3 | 0.0% |
| Dutch | 43 | 0.5% |
| Eastern European | 25 | 0.3% |
| English | 852 | 9.4% |
| European | 805 | 8.9% |
| French | 120 | 1.3% |
| German | 2,681 | 29.5% |
| Greek | 15 | 0.2% |
| Honduran | 39 | 0.4% |
| Hungarian | 41 | 0.4% |
| Indonesian | 137 | 1.5% |
| Irish | 753 | 8.3% |
| Italian | 242 | 2.7% |
| Kenyan | 209 | 2.3% |
| Korean | 276 | 3.0% |
| Lebanese | 113 | 1.2% |
| Malaysian | 4 | 0.0% |
| Mexican | 163 | 1.8% |
| Mexican American Indian | 17 | 0.2% |
| Native Hawaiian | 6 | 0.1% |
| Navajo | 9 | 0.1% |
| Nigerian | 91 | 1.0% |
| Norwegian | 20 | 0.2% |
| Pennsylvania German | 20 | 0.2% |
| Polish | 74 | 0.8% |
| Romanian | 11 | 0.1% |
| Russian | 75 | 0.8% |
| Scotch-Irish | 19 | 0.2% |
| Scottish | 173 | 1.9% |
| Slovene | 12 | 0.1% |
| Sri Lankan | 71 | 0.8% |
| Subsaharan African | 320 | 3.5% |
| Swedish | 269 | 3.0% |
| Swiss | 107 | 1.2% |
| Syrian | 9 | 0.1% |
| Turkish | 15 | 0.2% |
| Ukrainian | 70 | 0.8% |
| Yugoslavian | 74 | 0.8% | View All 48 Rows |
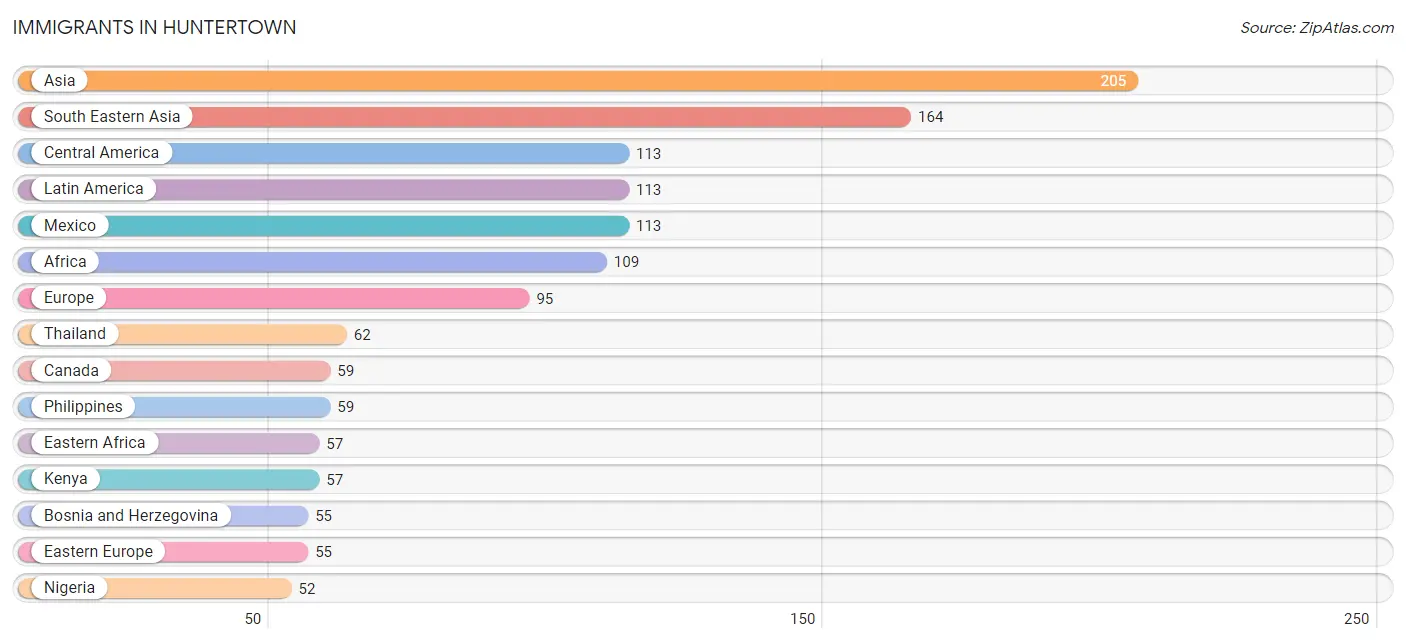
Immigrants in Huntertown
The most numerous immigrant groups reported in Huntertown came from Asia (205 | 2.3%), South Eastern Asia (164 | 1.8%), Central America (113 | 1.2%), Latin America (113 | 1.2%), and Mexico (113 | 1.2%), together accounting for 7.8% of all Huntertown residents.
| Immigration Origin | # Population | % Population |
| Africa | 109 | 1.2% |
| Asia | 205 | 2.3% |
| Bosnia and Herzegovina | 55 | 0.6% |
| Canada | 59 | 0.6% |
| Central America | 113 | 1.2% |
| China | 24 | 0.3% |
| Eastern Africa | 57 | 0.6% |
| Eastern Asia | 41 | 0.4% |
| Eastern Europe | 55 | 0.6% |
| Europe | 95 | 1.1% |
| Germany | 4 | 0.0% |
| Italy | 36 | 0.4% |
| Kenya | 57 | 0.6% |
| Korea | 17 | 0.2% |
| Laos | 4 | 0.0% |
| Latin America | 113 | 1.2% |
| Mexico | 113 | 1.2% |
| Nigeria | 52 | 0.6% |
| Philippines | 59 | 0.6% |
| South Eastern Asia | 164 | 1.8% |
| Southern Europe | 36 | 0.4% |
| Thailand | 62 | 0.7% |
| Vietnam | 5 | 0.1% |
| Western Africa | 52 | 0.6% |
| Western Europe | 4 | 0.0% | View All 25 Rows |
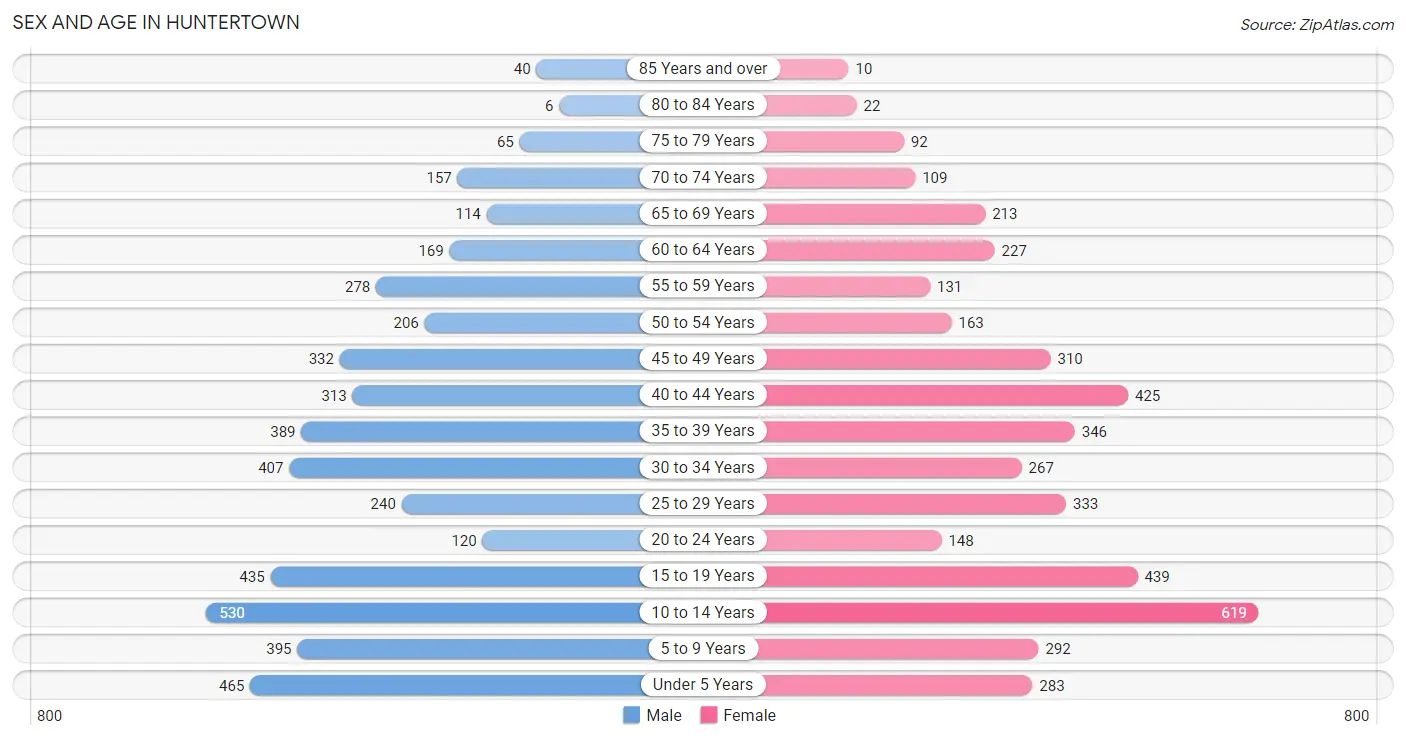
Sex and Age in Huntertown
Sex and Age in Huntertown
The most populous age groups in Huntertown are 10 to 14 Years (530 | 11.4%) for men and 10 to 14 Years (619 | 14.0%) for women.
| Age Bracket | Male | Female |
| Under 5 Years | 465 (10.0%) | 283 (6.4%) |
| 5 to 9 Years | 395 (8.5%) | 292 (6.6%) |
| 10 to 14 Years | 530 (11.4%) | 619 (14.0%) |
| 15 to 19 Years | 435 (9.3%) | 439 (9.9%) |
| 20 to 24 Years | 120 (2.6%) | 148 (3.3%) |
| 25 to 29 Years | 240 (5.1%) | 333 (7.5%) |
| 30 to 34 Years | 407 (8.7%) | 267 (6.0%) |
| 35 to 39 Years | 389 (8.4%) | 346 (7.8%) |
| 40 to 44 Years | 313 (6.7%) | 425 (9.6%) |
| 45 to 49 Years | 332 (7.1%) | 310 (7.0%) |
| 50 to 54 Years | 206 (4.4%) | 163 (3.7%) |
| 55 to 59 Years | 278 (6.0%) | 131 (3.0%) |
| 60 to 64 Years | 169 (3.6%) | 227 (5.1%) |
| 65 to 69 Years | 114 (2.5%) | 213 (4.8%) |
| 70 to 74 Years | 157 (3.4%) | 109 (2.5%) |
| 75 to 79 Years | 65 (1.4%) | 92 (2.1%) |
| 80 to 84 Years | 6 (0.1%) | 22 (0.5%) |
| 85 Years and over | 40 (0.9%) | 10 (0.2%) |
| Total | 4,661 (100.0%) | 4,429 (100.0%) |
Families and Households in Huntertown
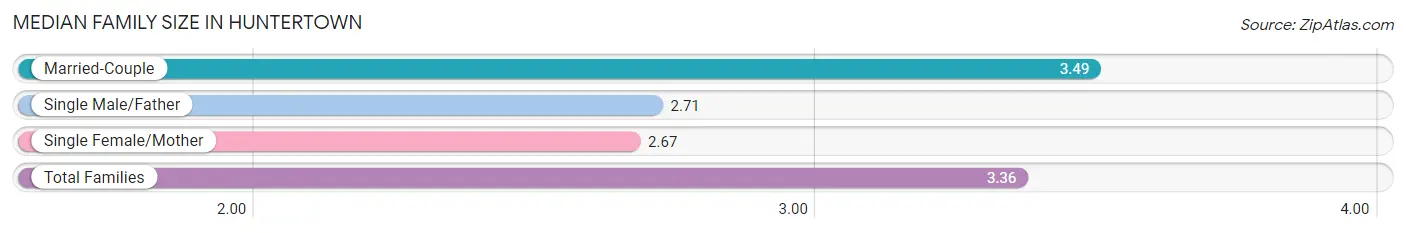
Median Family Size in Huntertown
The median family size in Huntertown is 3.36 persons per family, with married-couple families (2,021 | 83.4%) accounting for the largest median family size of 3.49 persons per family. On the other hand, single female/mother families (192 | 7.9%) represent the smallest median family size with 2.67 persons per family.
| Family Type | # Families | Family Size |
| Married-Couple | 2,021 (83.4%) | 3.49 |
| Single Male/Father | 209 (8.6%) | 2.71 |
| Single Female/Mother | 192 (7.9%) | 2.67 |
| Total Families | 2,422 (100.0%) | 3.36 |
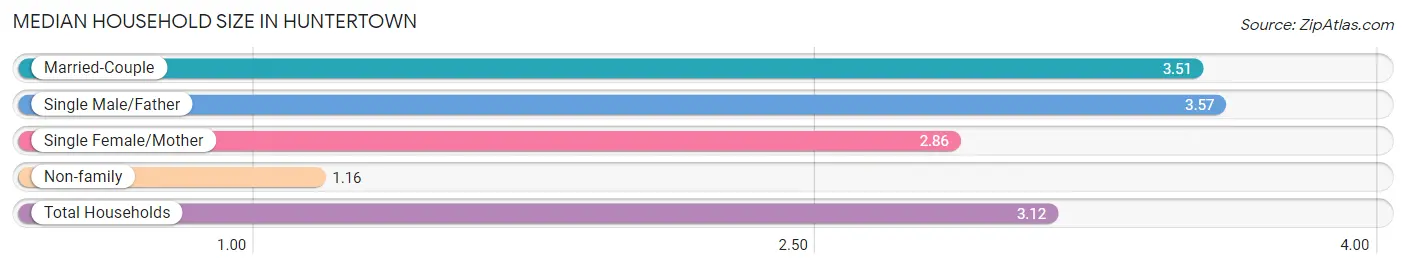
Median Household Size in Huntertown
The median household size in Huntertown is 3.12 persons per household, with single male/father households (209 | 7.3%) accounting for the largest median household size of 3.57 persons per household. non-family households (426 | 15.0%) represent the smallest median household size with 1.16 persons per household.
| Household Type | # Households | Household Size |
| Married-Couple | 2,021 (71.0%) | 3.51 |
| Single Male/Father | 209 (7.3%) | 3.57 |
| Single Female/Mother | 192 (6.7%) | 2.86 |
| Non-family | 426 (15.0%) | 1.16 |
| Total Households | 2,848 (100.0%) | 3.12 |
Household Size by Marriage Status in Huntertown
Out of a total of 2,848 households in Huntertown, 2,422 (85.0%) are family households, while 426 (15.0%) are nonfamily households. The most numerous type of family households are 2-person households, comprising 867, and the most common type of nonfamily households are 1-person households, comprising 376.
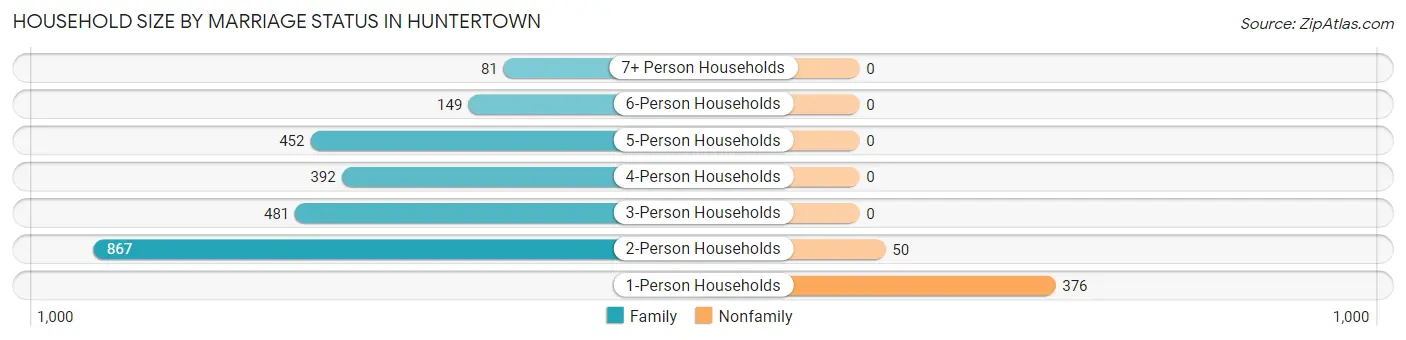
| Household Size | Family Households | Nonfamily Households |
| 1-Person Households | - | 376 (13.2%) |
| 2-Person Households | 867 (30.4%) | 50 (1.8%) |
| 3-Person Households | 481 (16.9%) | 0 (0.0%) |
| 4-Person Households | 392 (13.8%) | 0 (0.0%) |
| 5-Person Households | 452 (15.9%) | 0 (0.0%) |
| 6-Person Households | 149 (5.2%) | 0 (0.0%) |
| 7+ Person Households | 81 (2.8%) | 0 (0.0%) |
| Total | 2,422 (85.0%) | 426 (15.0%) |
Female Fertility in Huntertown
Fertility by Age in Huntertown
Average fertility rate in Huntertown is 60.0 births per 1,000 women. Women in the age bracket of 20 to 34 years have the highest fertility rate with 130.0 births per 1,000 women. Women in the age bracket of 20 to 34 years acount for 70.8% of all women with births.
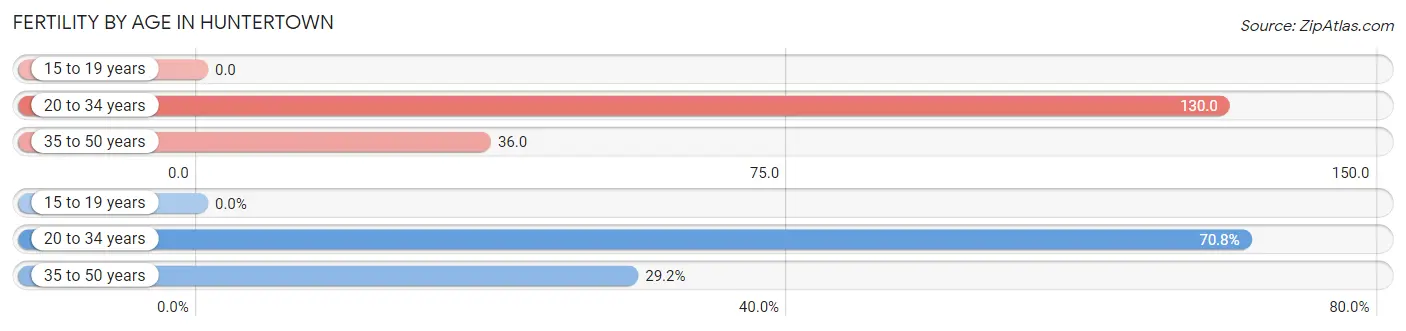
| Age Bracket | Women with Births | Births / 1,000 Women |
| 15 to 19 years | 0 (0.0%) | 0.0 |
| 20 to 34 years | 97 (70.8%) | 130.0 |
| 35 to 50 years | 40 (29.2%) | 36.0 |
| Total | 137 (100.0%) | 60.0 |
Fertility by Age by Marriage Status in Huntertown
89.1% of women with births (137) in Huntertown are married. The highest percentage of unmarried women with births falls into 35 to 50 years age bracket with 37.5% of them unmarried at the time of birth, while the lowest percentage of unmarried women with births belong to 20 to 34 years age bracket with 0.0% of them unmarried.
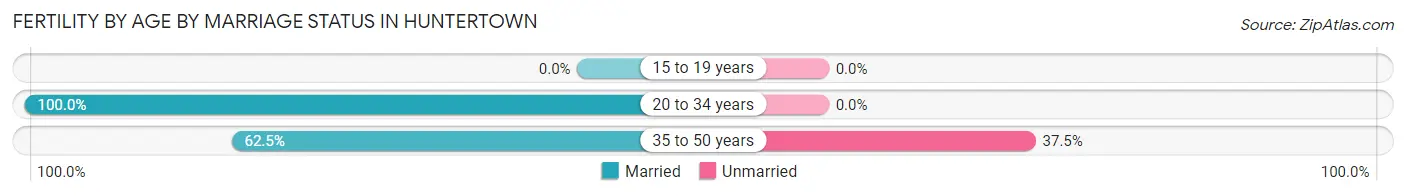
| Age Bracket | Married | Unmarried |
| 15 to 19 years | 0 (0.0%) | 0 (0.0%) |
| 20 to 34 years | 97 (100.0%) | 0 (0.0%) |
| 35 to 50 years | 25 (62.5%) | 15 (37.5%) |
| Total | 122 (89.0%) | 15 (11.0%) |
Fertility by Education in Huntertown
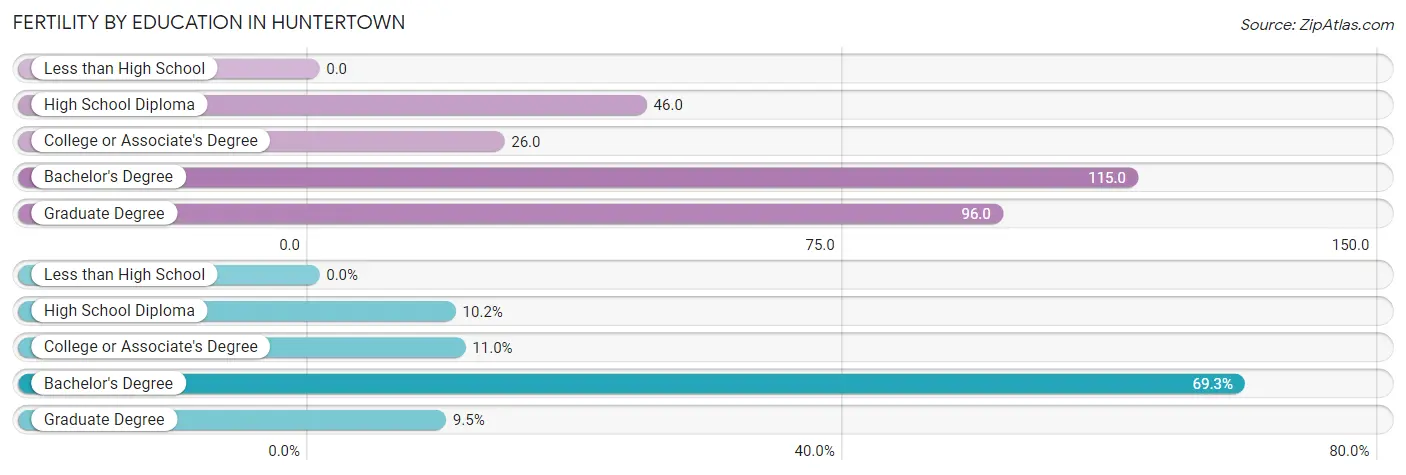
| Educational Attainment | Women with Births | Births / 1,000 Women |
| Less than High School | 0 (0.0%) | 0.0 |
| High School Diploma | 14 (10.2%) | 46.0 |
| College or Associate's Degree | 15 (11.0%) | 26.0 |
| Bachelor's Degree | 95 (69.3%) | 115.0 |
| Graduate Degree | 13 (9.5%) | 96.0 |
| Total | 137 (100.0%) | 60.0 |
Fertility by Education by Marriage Status in Huntertown
11.0% of women with births in Huntertown are unmarried. Women with the educational attainment of high school diploma are most likely to be married with 100.0% of them married at childbirth, while women with the educational attainment of college or associate's degree are least likely to be married with 100.0% of them unmarried at childbirth.
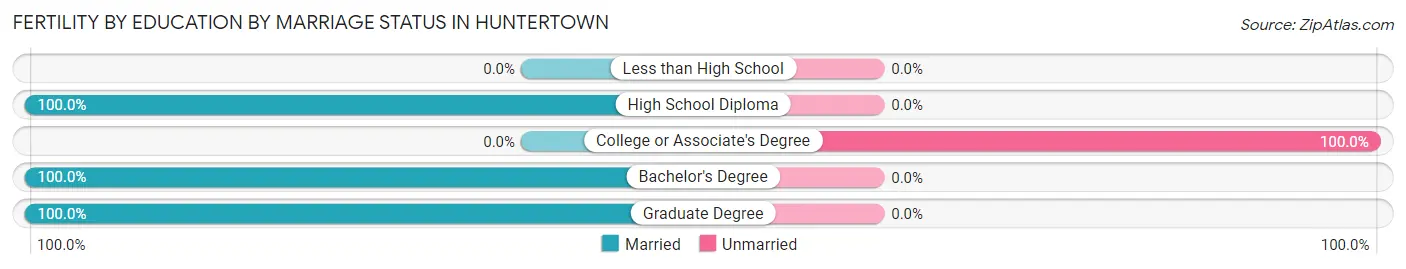
| Educational Attainment | Married | Unmarried |
| Less than High School | 0 (0.0%) | 0 (0.0%) |
| High School Diploma | 14 (100.0%) | 0 (0.0%) |
| College or Associate's Degree | 0 (0.0%) | 15 (100.0%) |
| Bachelor's Degree | 95 (100.0%) | 0 (0.0%) |
| Graduate Degree | 13 (100.0%) | 0 (0.0%) |
| Total | 122 (89.0%) | 15 (11.0%) |
Employment Characteristics in Huntertown
Employment by Class of Employer in Huntertown
Among the 4,547 employed individuals in Huntertown, private company employees (3,330 | 73.2%), not-for-profit organizations (523 | 11.5%), and self-employed (not incorporated) (311 | 6.8%) make up the most common classes of employment.
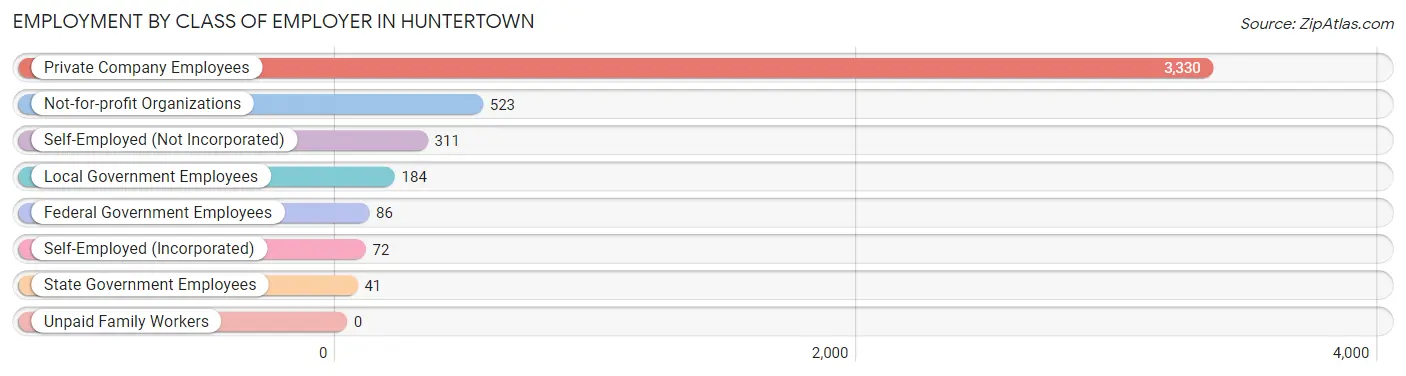
| Employer Class | # Employees | % Employees |
| Private Company Employees | 3,330 | 73.2% |
| Self-Employed (Incorporated) | 72 | 1.6% |
| Self-Employed (Not Incorporated) | 311 | 6.8% |
| Not-for-profit Organizations | 523 | 11.5% |
| Local Government Employees | 184 | 4.1% |
| State Government Employees | 41 | 0.9% |
| Federal Government Employees | 86 | 1.9% |
| Unpaid Family Workers | 0 | 0.0% |
| Total | 4,547 | 100.0% |
Employment Status by Age in Huntertown
According to the labor force statistics for Huntertown, out of the total population over 16 years of age (6,225), 75.6% or 4,706 individuals are in the labor force, with 1.0% or 47 of them unemployed. The age group with the highest labor force participation rate is 30 to 34 years, with 98.7% or 665 individuals in the labor force. Within the labor force, the 65 to 74 years age range has the highest percentage of unemployed individuals, with 6.4% or 9 of them being unemployed.
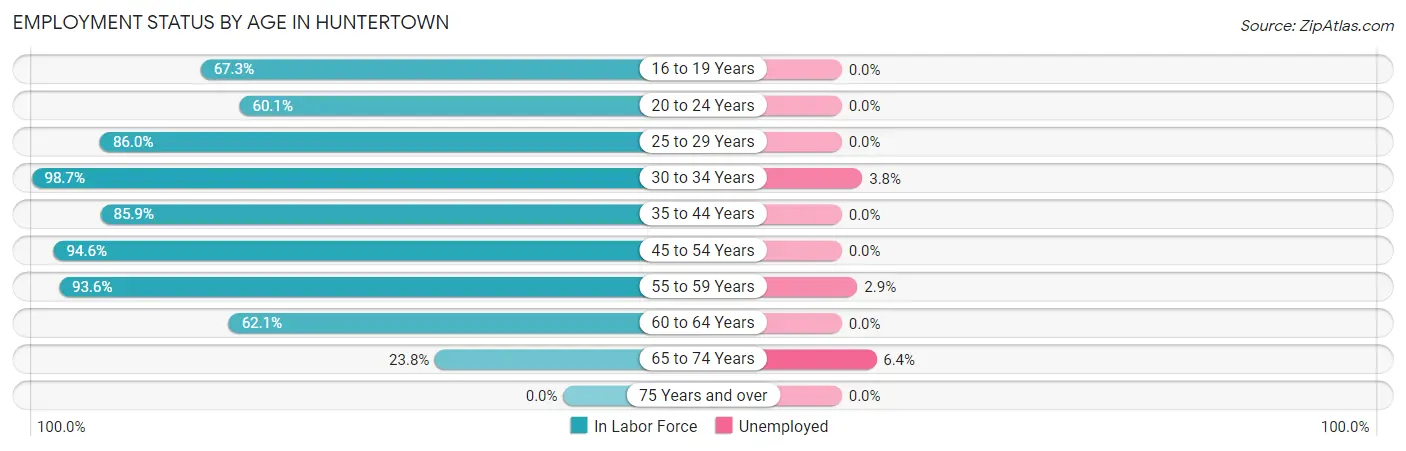
| Age Bracket | In Labor Force | Unemployed |
| 16 to 19 Years | 399 (67.3%) | 0 (0.0%) |
| 20 to 24 Years | 161 (60.1%) | 0 (0.0%) |
| 25 to 29 Years | 493 (86.0%) | 0 (0.0%) |
| 30 to 34 Years | 665 (98.7%) | 25 (3.8%) |
| 35 to 44 Years | 1,265 (85.9%) | 0 (0.0%) |
| 45 to 54 Years | 956 (94.6%) | 0 (0.0%) |
| 55 to 59 Years | 383 (93.6%) | 11 (2.9%) |
| 60 to 64 Years | 246 (62.1%) | 0 (0.0%) |
| 65 to 74 Years | 141 (23.8%) | 9 (6.4%) |
| 75 Years and over | 0 (0.0%) | 0 (0.0%) |
| Total | 4,706 (75.6%) | 47 (1.0%) |
Employment Status by Educational Attainment in Huntertown
According to labor force statistics for Huntertown, 88.4% of individuals (4,010) out of the total population between 25 and 64 years of age (4,536) are in the labor force, with 0.9% or 36 of them being unemployed. The group with the highest labor force participation rate are those with the educational attainment of bachelor's degree or higher, with 93.4% or 1,780 individuals in the labor force. Within the labor force, individuals with college / associate degree education have the highest percentage of unemployment, with 1.6% or 25 of them being unemployed.
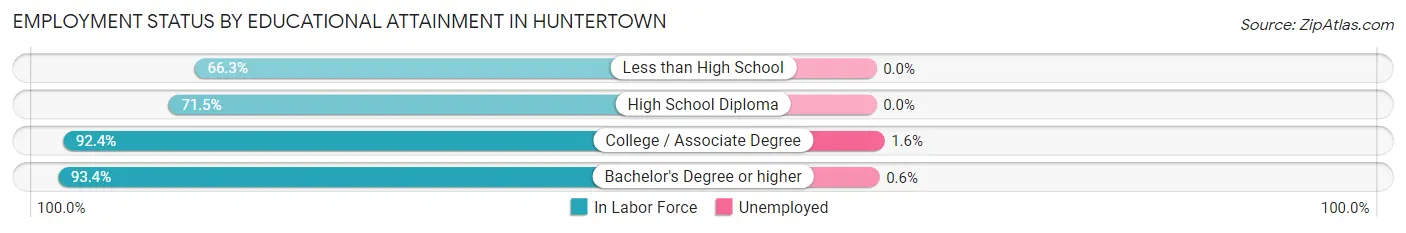
| Educational Attainment | In Labor Force | Unemployed |
| Less than High School | 124 (66.3%) | 0 (0.0%) |
| High School Diploma | 527 (71.5%) | 0 (0.0%) |
| College / Associate Degree | 1,576 (92.4%) | 27 (1.6%) |
| Bachelor's Degree or higher | 1,780 (93.4%) | 11 (0.6%) |
| Total | 4,010 (88.4%) | 41 (0.9%) |
Employment Occupations by Sex in Huntertown
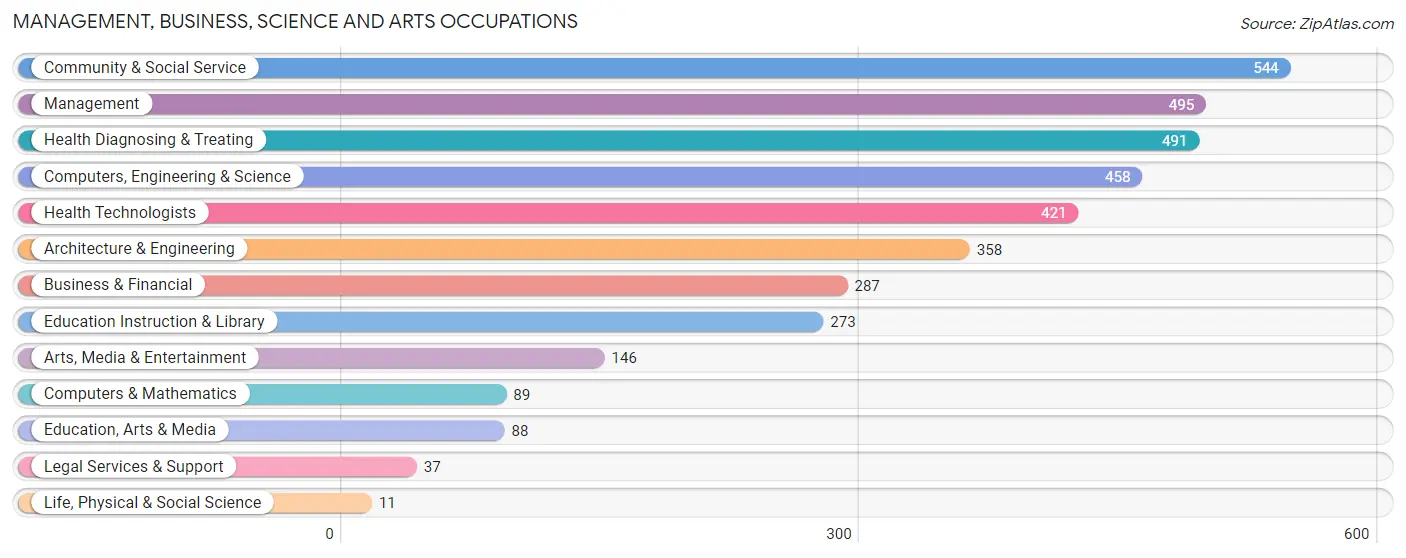
Management, Business, Science and Arts Occupations
The most common Management, Business, Science and Arts occupations in Huntertown are Community & Social Service (544 | 11.7%), Management (495 | 10.6%), Health Diagnosing & Treating (491 | 10.5%), Computers, Engineering & Science (458 | 9.8%), and Health Technologists (421 | 9.0%).
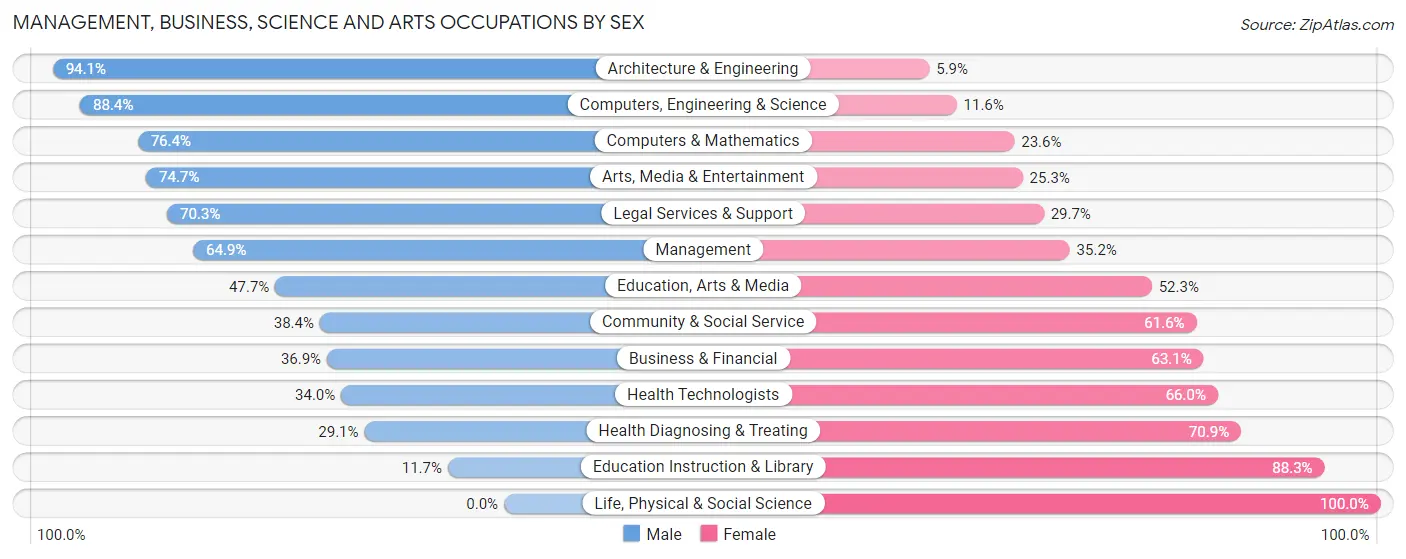
Management, Business, Science and Arts Occupations by Sex
Within the Management, Business, Science and Arts occupations in Huntertown, the most male-oriented occupations are Architecture & Engineering (94.1%), Computers, Engineering & Science (88.4%), and Computers & Mathematics (76.4%), while the most female-oriented occupations are Life, Physical & Social Science (100.0%), Education Instruction & Library (88.3%), and Health Diagnosing & Treating (70.9%).
| Occupation | Male | Female |
| Management | 321 (64.8%) | 174 (35.1%) |
| Business & Financial | 106 (36.9%) | 181 (63.1%) |
| Computers, Engineering & Science | 405 (88.4%) | 53 (11.6%) |
| Computers & Mathematics | 68 (76.4%) | 21 (23.6%) |
| Architecture & Engineering | 337 (94.1%) | 21 (5.9%) |
| Life, Physical & Social Science | 0 (0.0%) | 11 (100.0%) |
| Community & Social Service | 209 (38.4%) | 335 (61.6%) |
| Education, Arts & Media | 42 (47.7%) | 46 (52.3%) |
| Legal Services & Support | 26 (70.3%) | 11 (29.7%) |
| Education Instruction & Library | 32 (11.7%) | 241 (88.3%) |
| Arts, Media & Entertainment | 109 (74.7%) | 37 (25.3%) |
| Health Diagnosing & Treating | 143 (29.1%) | 348 (70.9%) |
| Health Technologists | 143 (34.0%) | 278 (66.0%) |
| Total (Category) | 1,184 (52.0%) | 1,091 (48.0%) |
| Total (Overall) | 2,496 (53.5%) | 2,168 (46.5%) |
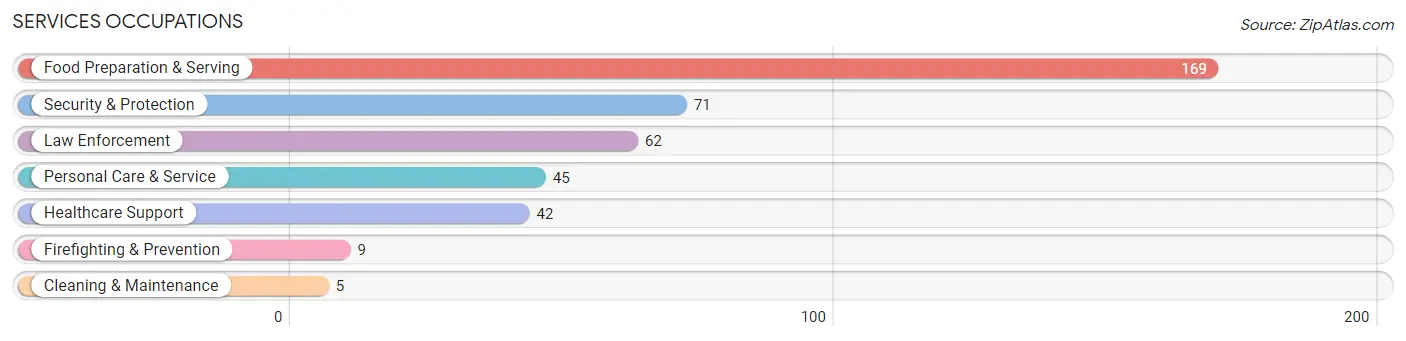
Services Occupations
The most common Services occupations in Huntertown are Food Preparation & Serving (169 | 3.6%), Security & Protection (71 | 1.5%), Law Enforcement (62 | 1.3%), Personal Care & Service (45 | 1.0%), and Healthcare Support (42 | 0.9%).
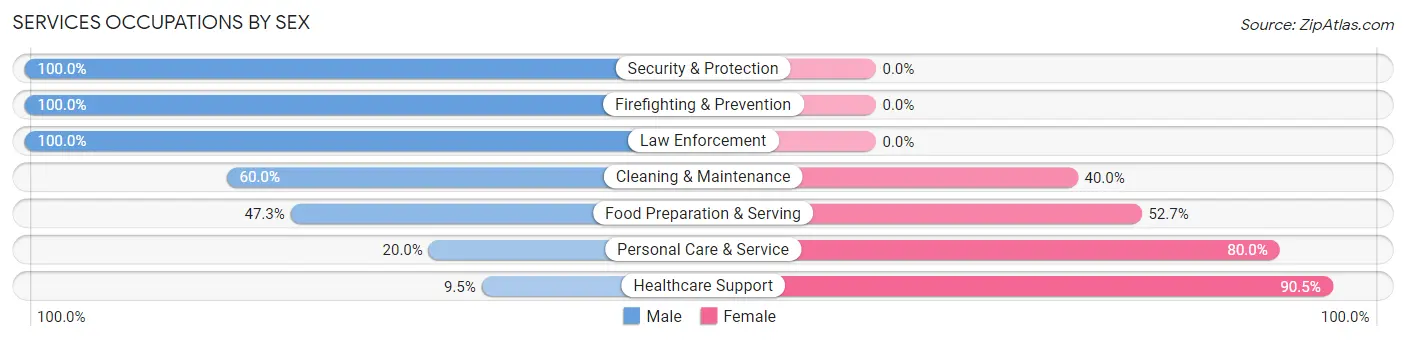
Services Occupations by Sex
Within the Services occupations in Huntertown, the most male-oriented occupations are Security & Protection (100.0%), Firefighting & Prevention (100.0%), and Law Enforcement (100.0%), while the most female-oriented occupations are Healthcare Support (90.5%), Personal Care & Service (80.0%), and Food Preparation & Serving (52.7%).
| Occupation | Male | Female |
| Healthcare Support | 4 (9.5%) | 38 (90.5%) |
| Security & Protection | 71 (100.0%) | 0 (0.0%) |
| Firefighting & Prevention | 9 (100.0%) | 0 (0.0%) |
| Law Enforcement | 62 (100.0%) | 0 (0.0%) |
| Food Preparation & Serving | 80 (47.3%) | 89 (52.7%) |
| Cleaning & Maintenance | 3 (60.0%) | 2 (40.0%) |
| Personal Care & Service | 9 (20.0%) | 36 (80.0%) |
| Total (Category) | 167 (50.3%) | 165 (49.7%) |
| Total (Overall) | 2,496 (53.5%) | 2,168 (46.5%) |
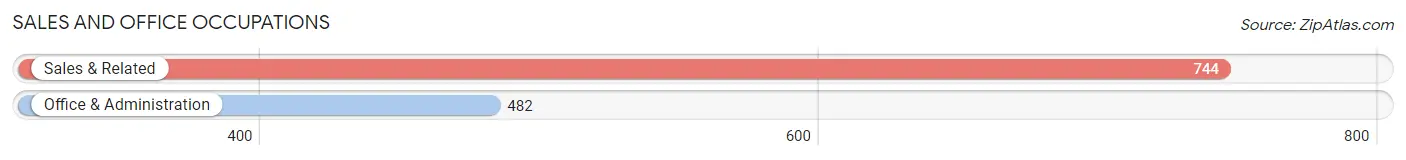
Sales and Office Occupations
The most common Sales and Office occupations in Huntertown are Sales & Related (744 | 16.0%), and Office & Administration (482 | 10.3%).
Sales and Office Occupations by Sex
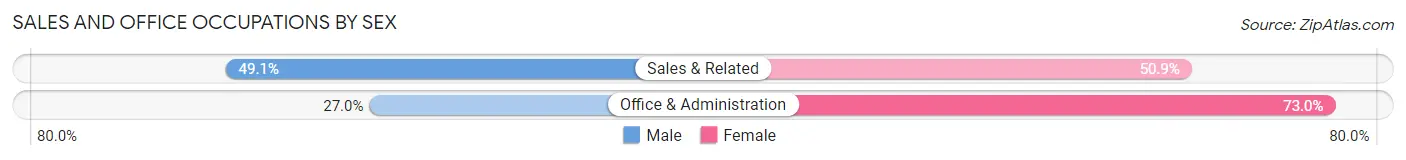
| Occupation | Male | Female |
| Sales & Related | 365 (49.1%) | 379 (50.9%) |
| Office & Administration | 130 (27.0%) | 352 (73.0%) |
| Total (Category) | 495 (40.4%) | 731 (59.6%) |
| Total (Overall) | 2,496 (53.5%) | 2,168 (46.5%) |
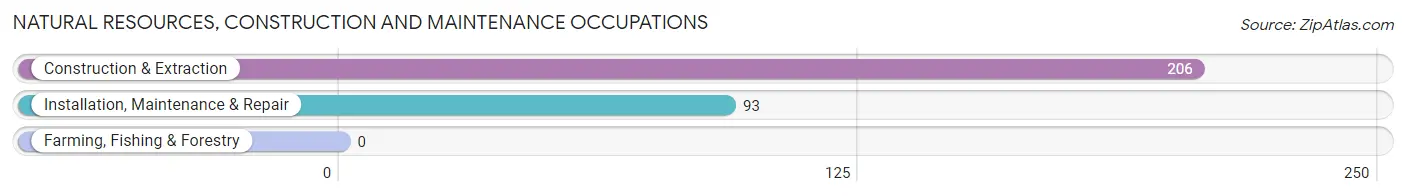
Natural Resources, Construction and Maintenance Occupations
The most common Natural Resources, Construction and Maintenance occupations in Huntertown are Construction & Extraction (206 | 4.4%), and Installation, Maintenance & Repair (93 | 2.0%).
Natural Resources, Construction and Maintenance Occupations by Sex
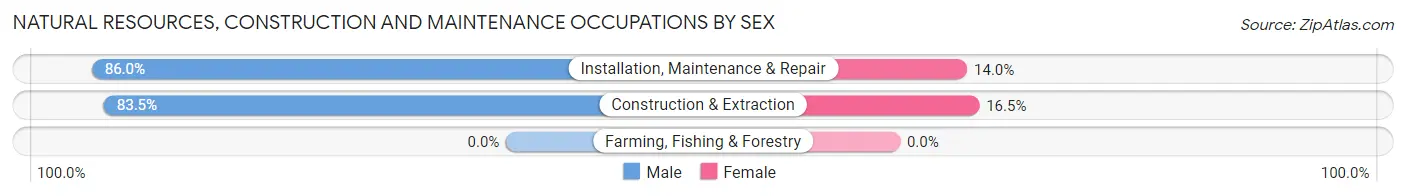
| Occupation | Male | Female |
| Farming, Fishing & Forestry | 0 (0.0%) | 0 (0.0%) |
| Construction & Extraction | 172 (83.5%) | 34 (16.5%) |
| Installation, Maintenance & Repair | 80 (86.0%) | 13 (14.0%) |
| Total (Category) | 252 (84.3%) | 47 (15.7%) |
| Total (Overall) | 2,496 (53.5%) | 2,168 (46.5%) |
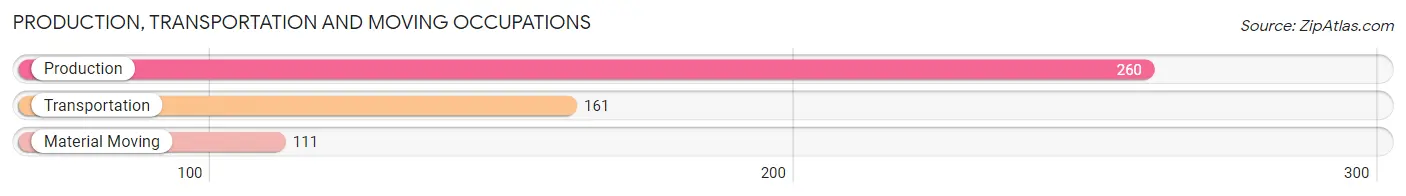
Production, Transportation and Moving Occupations
The most common Production, Transportation and Moving occupations in Huntertown are Production (260 | 5.6%), Transportation (161 | 3.5%), and Material Moving (111 | 2.4%).
Production, Transportation and Moving Occupations by Sex
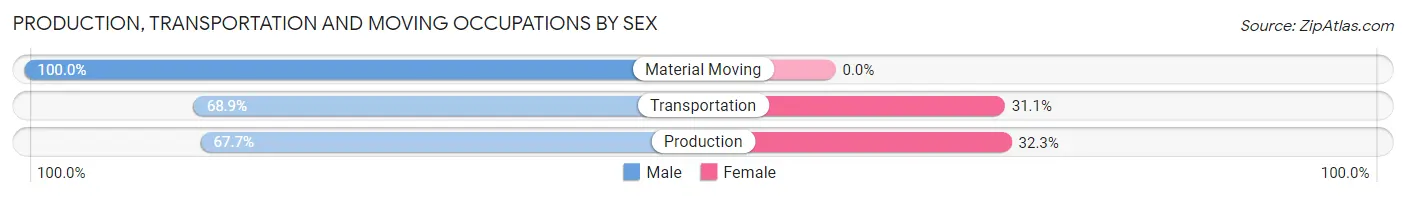
| Occupation | Male | Female |
| Production | 176 (67.7%) | 84 (32.3%) |
| Transportation | 111 (68.9%) | 50 (31.1%) |
| Material Moving | 111 (100.0%) | 0 (0.0%) |
| Total (Category) | 398 (74.8%) | 134 (25.2%) |
| Total (Overall) | 2,496 (53.5%) | 2,168 (46.5%) |
Employment Industries by Sex in Huntertown
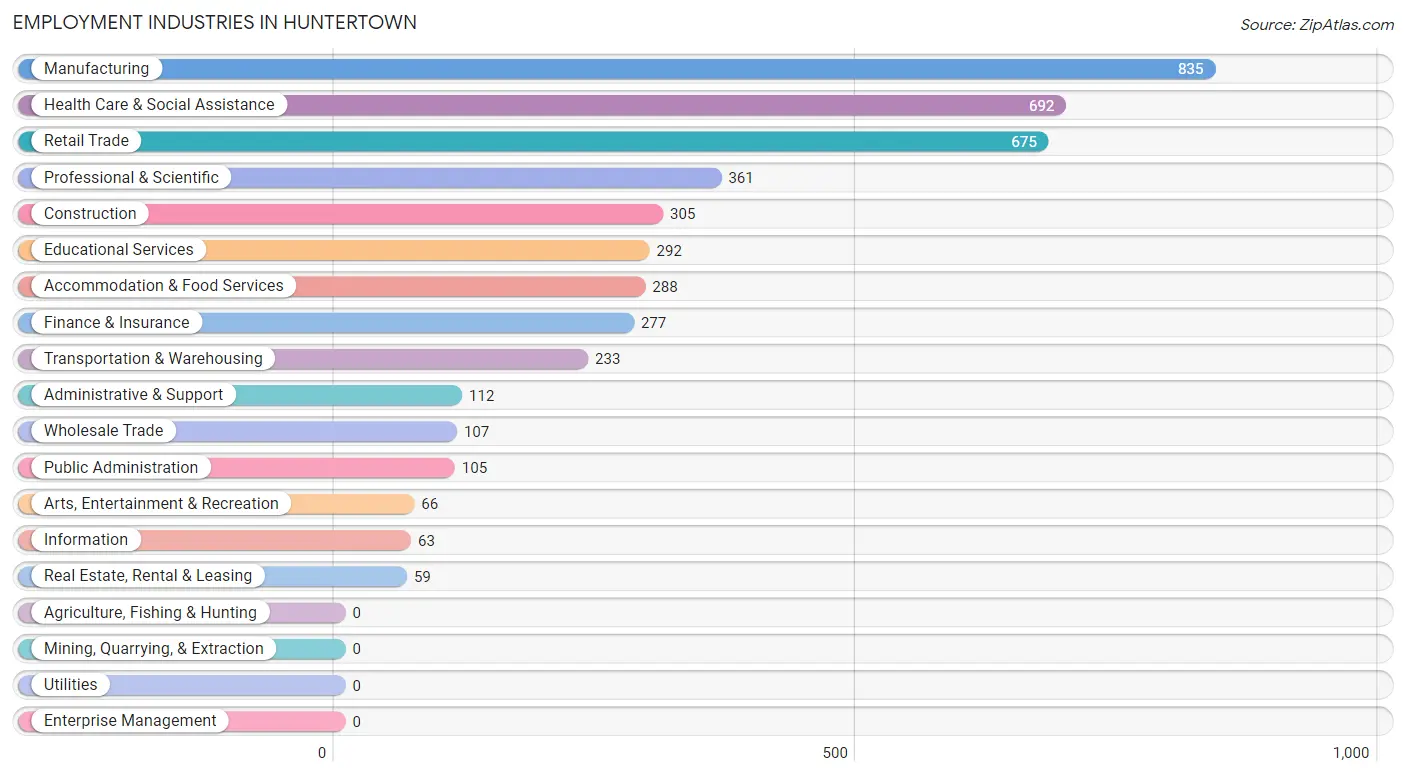
Employment Industries in Huntertown
The major employment industries in Huntertown include Manufacturing (835 | 17.9%), Health Care & Social Assistance (692 | 14.8%), Retail Trade (675 | 14.5%), Professional & Scientific (361 | 7.7%), and Construction (305 | 6.5%).
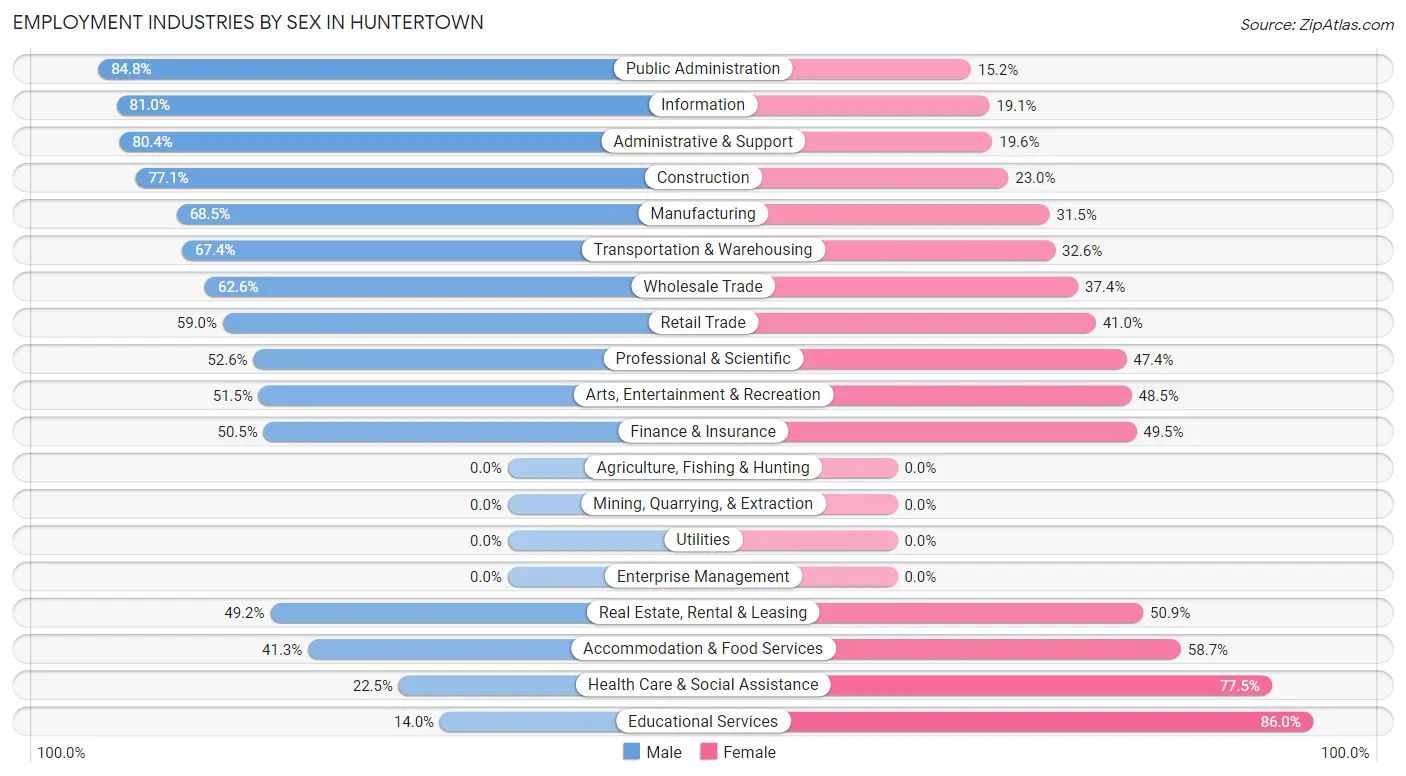
Employment Industries by Sex in Huntertown
The Huntertown industries that see more men than women are Public Administration (84.8%), Information (80.9%), and Administrative & Support (80.4%), whereas the industries that tend to have a higher number of women are Educational Services (86.0%), Health Care & Social Assistance (77.5%), and Accommodation & Food Services (58.7%).
| Industry | Male | Female |
| Agriculture, Fishing & Hunting | 0 (0.0%) | 0 (0.0%) |
| Mining, Quarrying, & Extraction | 0 (0.0%) | 0 (0.0%) |
| Construction | 235 (77.0%) | 70 (23.0%) |
| Manufacturing | 572 (68.5%) | 263 (31.5%) |
| Wholesale Trade | 67 (62.6%) | 40 (37.4%) |
| Retail Trade | 398 (59.0%) | 277 (41.0%) |
| Transportation & Warehousing | 157 (67.4%) | 76 (32.6%) |
| Utilities | 0 (0.0%) | 0 (0.0%) |
| Information | 51 (80.9%) | 12 (19.1%) |
| Finance & Insurance | 140 (50.5%) | 137 (49.5%) |
| Real Estate, Rental & Leasing | 29 (49.1%) | 30 (50.8%) |
| Professional & Scientific | 190 (52.6%) | 171 (47.4%) |
| Enterprise Management | 0 (0.0%) | 0 (0.0%) |
| Administrative & Support | 90 (80.4%) | 22 (19.6%) |
| Educational Services | 41 (14.0%) | 251 (86.0%) |
| Health Care & Social Assistance | 156 (22.5%) | 536 (77.5%) |
| Arts, Entertainment & Recreation | 34 (51.5%) | 32 (48.5%) |
| Accommodation & Food Services | 119 (41.3%) | 169 (58.7%) |
| Public Administration | 89 (84.8%) | 16 (15.2%) |
| Total | 2,496 (53.5%) | 2,168 (46.5%) |
Education in Huntertown
School Enrollment in Huntertown
The most common levels of schooling among the 2,945 students in Huntertown are middle school (901 | 30.6%), high school (815 | 27.7%), and elementary school (589 | 20.0%).
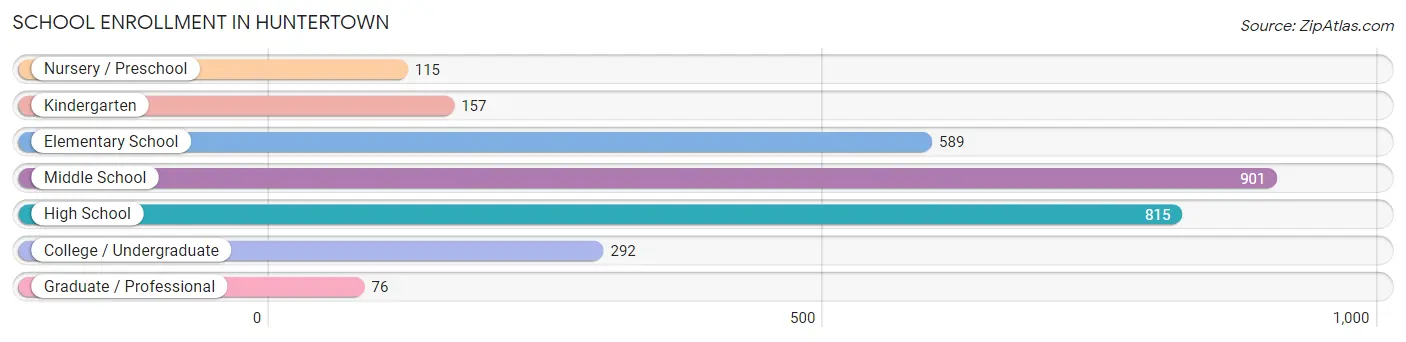
| School Level | # Students | % Students |
| Nursery / Preschool | 115 | 3.9% |
| Kindergarten | 157 | 5.3% |
| Elementary School | 589 | 20.0% |
| Middle School | 901 | 30.6% |
| High School | 815 | 27.7% |
| College / Undergraduate | 292 | 9.9% |
| Graduate / Professional | 76 | 2.6% |
| Total | 2,945 | 100.0% |
School Enrollment by Age by Funding Source in Huntertown
Out of a total of 2,945 students who are enrolled in schools in Huntertown, 241 (8.2%) attend a private institution, while the remaining 2,704 (91.8%) are enrolled in public schools. The age group of 3 to 4 year olds has the highest likelihood of being enrolled in private schools, with 71 (68.3% in the age bracket) enrolled. Conversely, the age group of 25 to 34 year olds has the lowest likelihood of being enrolled in a private school, with 87 (100.0% in the age bracket) attending a public institution.
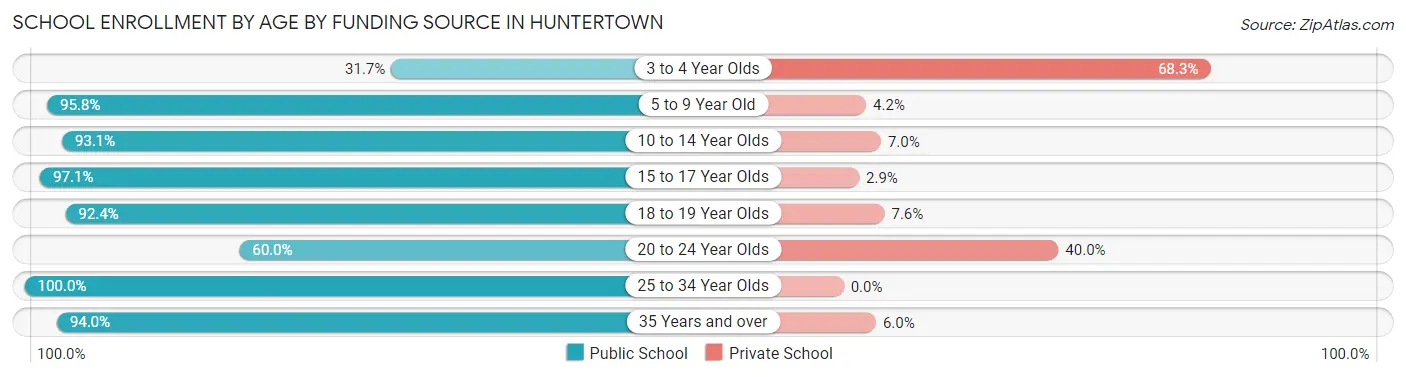
| Age Bracket | Public School | Private School |
| 3 to 4 Year Olds | 33 (31.7%) | 71 (68.3%) |
| 5 to 9 Year Old | 617 (95.8%) | 27 (4.2%) |
| 10 to 14 Year Olds | 991 (93.0%) | 74 (7.0%) |
| 15 to 17 Year Olds | 607 (97.1%) | 18 (2.9%) |
| 18 to 19 Year Olds | 170 (92.4%) | 14 (7.6%) |
| 20 to 24 Year Olds | 42 (60.0%) | 28 (40.0%) |
| 25 to 34 Year Olds | 87 (100.0%) | 0 (0.0%) |
| 35 Years and over | 156 (94.0%) | 10 (6.0%) |
| Total | 2,704 (91.8%) | 241 (8.2%) |
Educational Attainment by Field of Study in Huntertown
Business (627 | 28.2%), education (316 | 14.2%), science & technology (308 | 13.8%), arts & humanities (133 | 6.0%), and social sciences (128 | 5.8%) are the most common fields of study among 2,226 individuals in Huntertown who have obtained a bachelor's degree or higher.
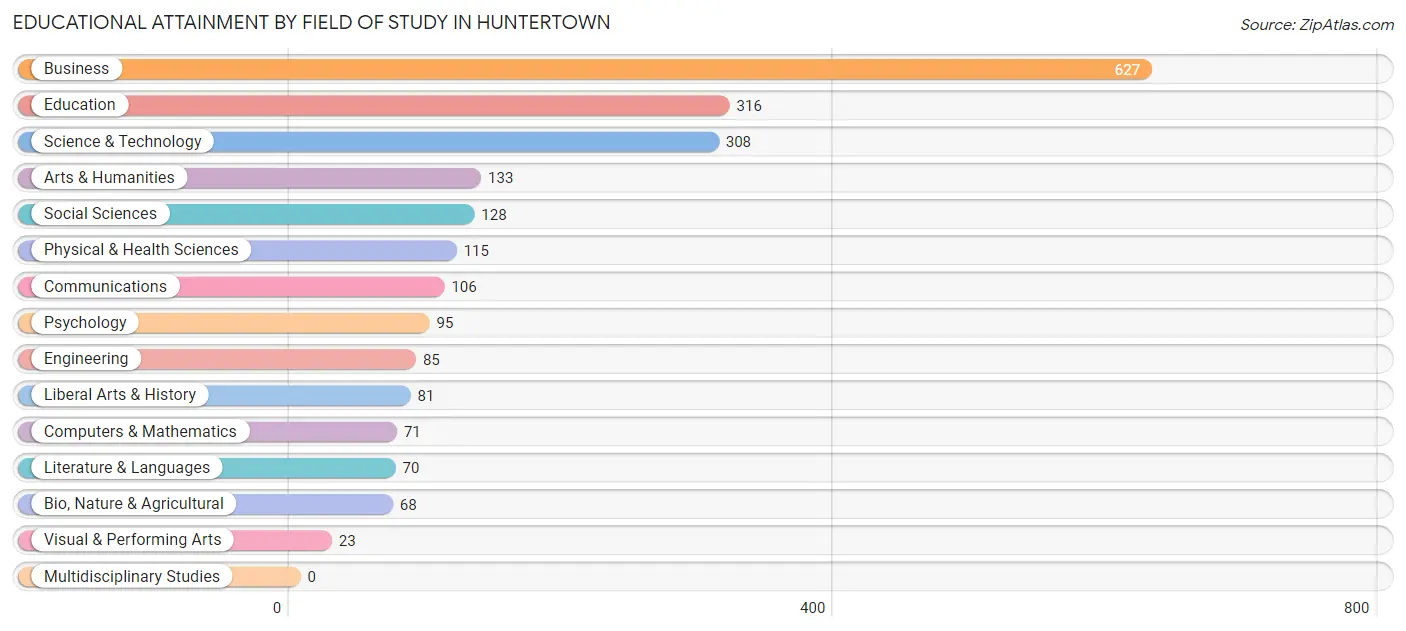
| Field of Study | # Graduates | % Graduates |
| Computers & Mathematics | 71 | 3.2% |
| Bio, Nature & Agricultural | 68 | 3.0% |
| Physical & Health Sciences | 115 | 5.2% |
| Psychology | 95 | 4.3% |
| Social Sciences | 128 | 5.8% |
| Engineering | 85 | 3.8% |
| Multidisciplinary Studies | 0 | 0.0% |
| Science & Technology | 308 | 13.8% |
| Business | 627 | 28.2% |
| Education | 316 | 14.2% |
| Literature & Languages | 70 | 3.1% |
| Liberal Arts & History | 81 | 3.6% |
| Visual & Performing Arts | 23 | 1.0% |
| Communications | 106 | 4.8% |
| Arts & Humanities | 133 | 6.0% |
| Total | 2,226 | 100.0% |
Transportation & Commute in Huntertown
Vehicle Availability by Sex in Huntertown
The most prevalent vehicle ownership categories in Huntertown are males with 2 vehicles (1,318, accounting for 53.2%) and females with 2 vehicles (1,117, making up 63.9%).
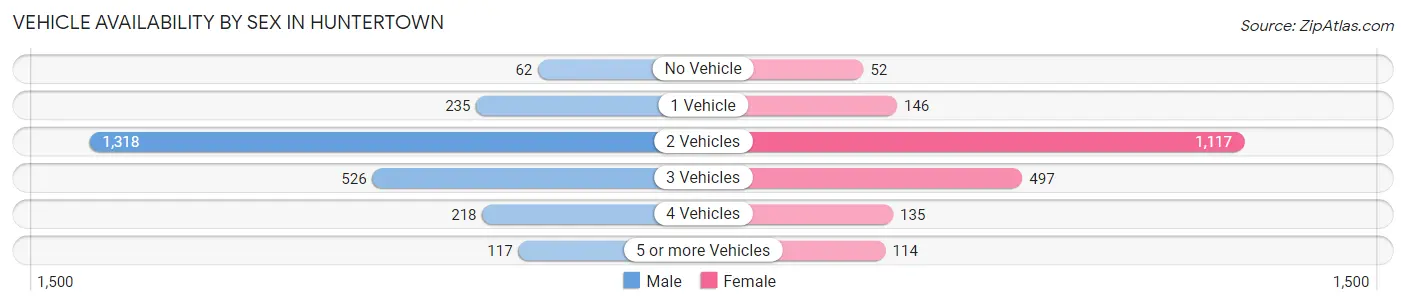
| Vehicles Available | Male | Female |
| No Vehicle | 62 (2.5%) | 52 (2.5%) |
| 1 Vehicle | 235 (9.5%) | 146 (7.1%) |
| 2 Vehicles | 1,318 (53.2%) | 1,117 (54.2%) |
| 3 Vehicles | 526 (21.2%) | 497 (24.1%) |
| 4 Vehicles | 218 (8.8%) | 135 (6.6%) |
| 5 or more Vehicles | 117 (4.7%) | 114 (5.5%) |
| Total | 2,476 (100.0%) | 2,061 (100.0%) |
Commute Time in Huntertown
The most frequently occuring commute durations in Huntertown are 15 to 19 minutes (1,198 commuters, 29.3%), 20 to 24 minutes (920 commuters, 22.5%), and 25 to 29 minutes (434 commuters, 10.6%).
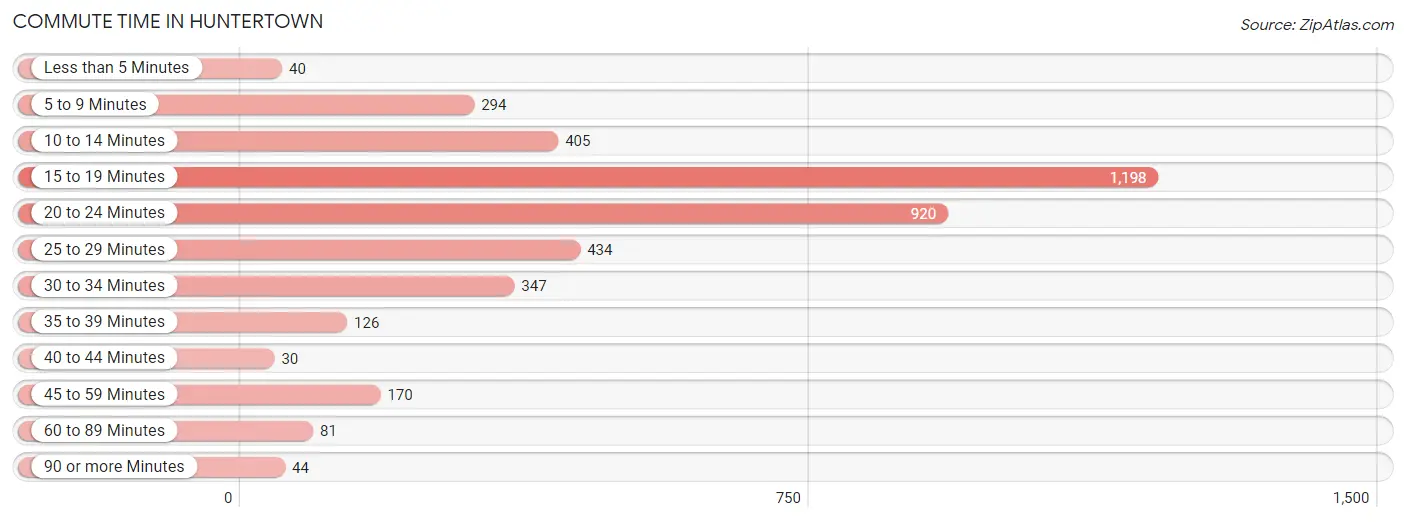
| Commute Time | # Commuters | % Commuters |
| Less than 5 Minutes | 40 | 1.0% |
| 5 to 9 Minutes | 294 | 7.2% |
| 10 to 14 Minutes | 405 | 9.9% |
| 15 to 19 Minutes | 1,198 | 29.3% |
| 20 to 24 Minutes | 920 | 22.5% |
| 25 to 29 Minutes | 434 | 10.6% |
| 30 to 34 Minutes | 347 | 8.5% |
| 35 to 39 Minutes | 126 | 3.1% |
| 40 to 44 Minutes | 30 | 0.7% |
| 45 to 59 Minutes | 170 | 4.2% |
| 60 to 89 Minutes | 81 | 2.0% |
| 90 or more Minutes | 44 | 1.1% |
Commute Time by Sex in Huntertown
The most common commute times in Huntertown are 15 to 19 minutes (643 commuters, 28.1%) for males and 15 to 19 minutes (555 commuters, 30.9%) for females.
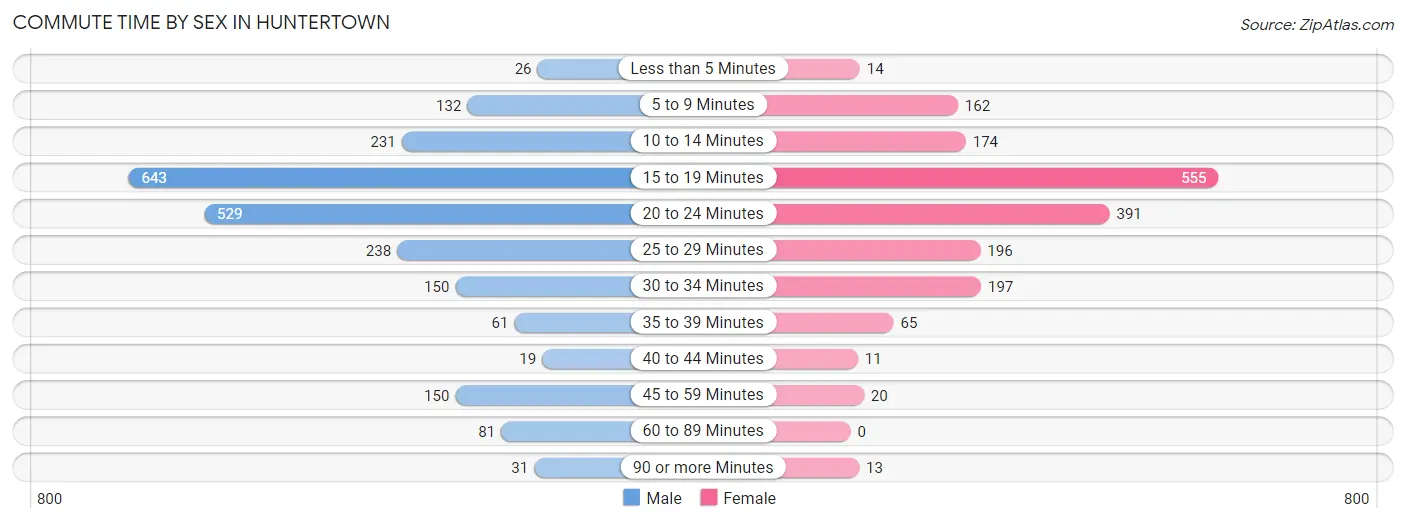
| Commute Time | Male | Female |
| Less than 5 Minutes | 26 (1.1%) | 14 (0.8%) |
| 5 to 9 Minutes | 132 (5.8%) | 162 (9.0%) |
| 10 to 14 Minutes | 231 (10.1%) | 174 (9.7%) |
| 15 to 19 Minutes | 643 (28.1%) | 555 (30.9%) |
| 20 to 24 Minutes | 529 (23.1%) | 391 (21.7%) |
| 25 to 29 Minutes | 238 (10.4%) | 196 (10.9%) |
| 30 to 34 Minutes | 150 (6.6%) | 197 (11.0%) |
| 35 to 39 Minutes | 61 (2.7%) | 65 (3.6%) |
| 40 to 44 Minutes | 19 (0.8%) | 11 (0.6%) |
| 45 to 59 Minutes | 150 (6.6%) | 20 (1.1%) |
| 60 to 89 Minutes | 81 (3.5%) | 0 (0.0%) |
| 90 or more Minutes | 31 (1.3%) | 13 (0.7%) |
Time of Departure to Work by Sex in Huntertown
The most frequent times of departure to work in Huntertown are 8:00 AM to 8:29 AM (350, 15.3%) for males and 7:30 AM to 7:59 AM (358, 19.9%) for females.
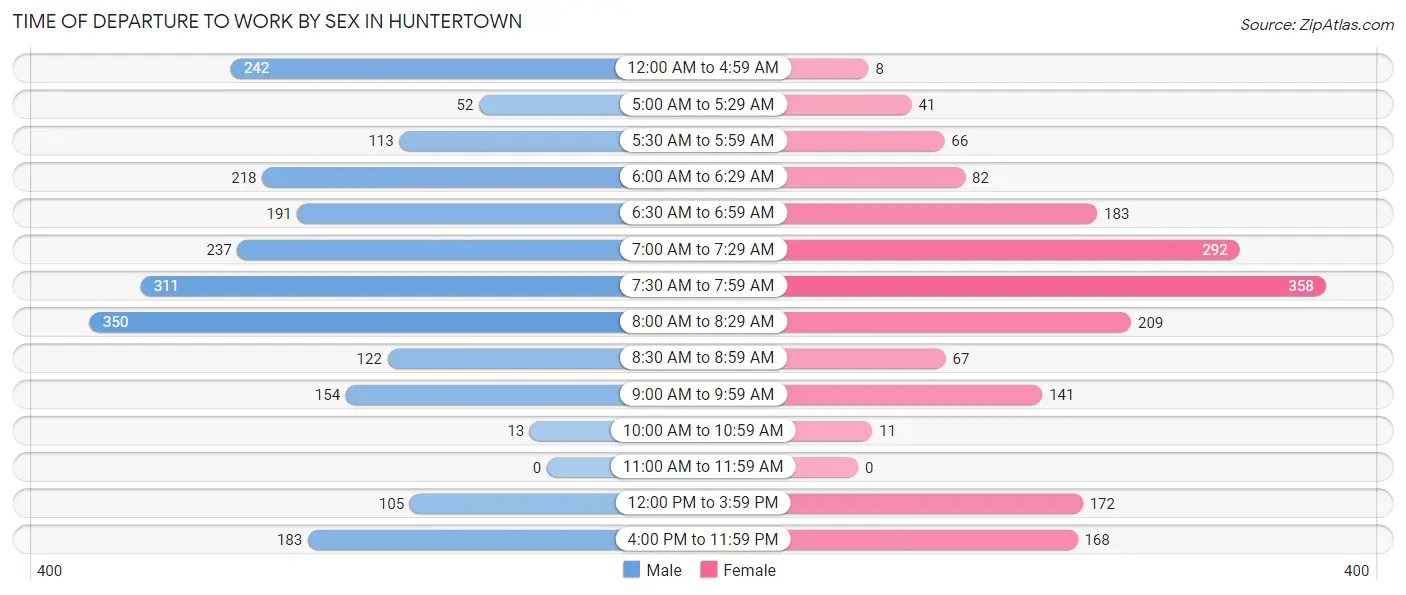
| Time of Departure | Male | Female |
| 12:00 AM to 4:59 AM | 242 (10.6%) | 8 (0.4%) |
| 5:00 AM to 5:29 AM | 52 (2.3%) | 41 (2.3%) |
| 5:30 AM to 5:59 AM | 113 (4.9%) | 66 (3.7%) |
| 6:00 AM to 6:29 AM | 218 (9.5%) | 82 (4.6%) |
| 6:30 AM to 6:59 AM | 191 (8.3%) | 183 (10.2%) |
| 7:00 AM to 7:29 AM | 237 (10.3%) | 292 (16.2%) |
| 7:30 AM to 7:59 AM | 311 (13.6%) | 358 (19.9%) |
| 8:00 AM to 8:29 AM | 350 (15.3%) | 209 (11.6%) |
| 8:30 AM to 8:59 AM | 122 (5.3%) | 67 (3.7%) |
| 9:00 AM to 9:59 AM | 154 (6.7%) | 141 (7.8%) |
| 10:00 AM to 10:59 AM | 13 (0.6%) | 11 (0.6%) |
| 11:00 AM to 11:59 AM | 0 (0.0%) | 0 (0.0%) |
| 12:00 PM to 3:59 PM | 105 (4.6%) | 172 (9.6%) |
| 4:00 PM to 11:59 PM | 183 (8.0%) | 168 (9.3%) |
| Total | 2,291 (100.0%) | 1,798 (100.0%) |
Housing Occupancy in Huntertown
Occupancy by Ownership in Huntertown
Of the total 2,848 dwellings in Huntertown, owner-occupied units account for 2,605 (91.5%), while renter-occupied units make up 243 (8.5%).
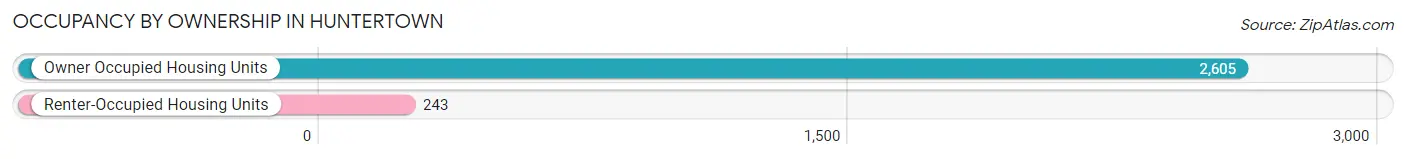
| Occupancy | # Housing Units | % Housing Units |
| Owner Occupied Housing Units | 2,605 | 91.5% |
| Renter-Occupied Housing Units | 243 | 8.5% |
| Total Occupied Housing Units | 2,848 | 100.0% |
Occupancy by Household Size in Huntertown
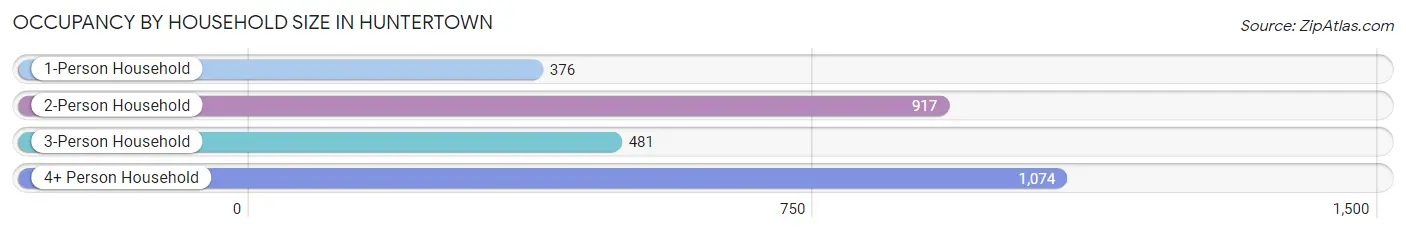
| Household Size | # Housing Units | % Housing Units |
| 1-Person Household | 376 | 13.2% |
| 2-Person Household | 917 | 32.2% |
| 3-Person Household | 481 | 16.9% |
| 4+ Person Household | 1,074 | 37.7% |
| Total Housing Units | 2,848 | 100.0% |
Occupancy by Ownership by Household Size in Huntertown
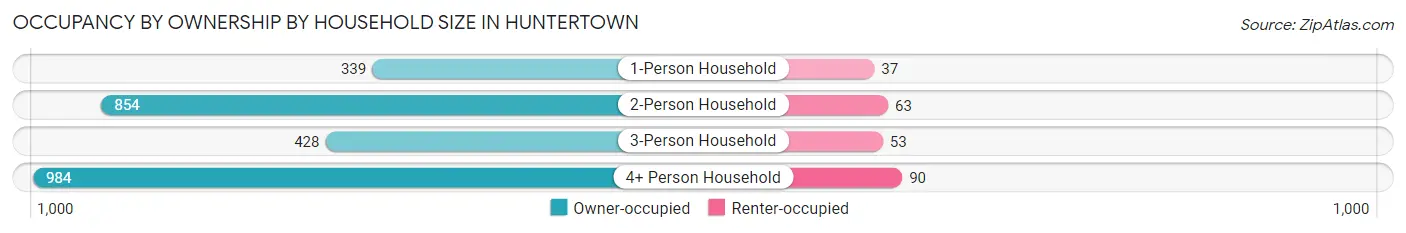
| Household Size | Owner-occupied | Renter-occupied |
| 1-Person Household | 339 (90.2%) | 37 (9.8%) |
| 2-Person Household | 854 (93.1%) | 63 (6.9%) |
| 3-Person Household | 428 (89.0%) | 53 (11.0%) |
| 4+ Person Household | 984 (91.6%) | 90 (8.4%) |
| Total Housing Units | 2,605 (91.5%) | 243 (8.5%) |
Occupancy by Educational Attainment in Huntertown
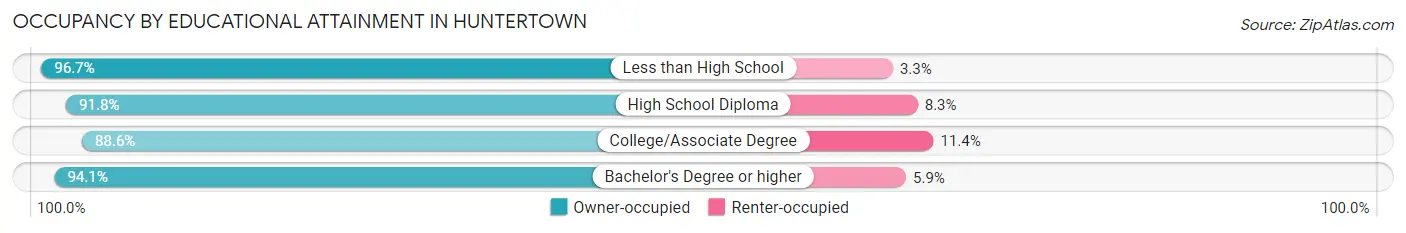
| Household Size | Owner-occupied | Renter-occupied |
| Less than High School | 116 (96.7%) | 4 (3.3%) |
| High School Diploma | 445 (91.7%) | 40 (8.3%) |
| College/Associate Degree | 1,076 (88.6%) | 138 (11.4%) |
| Bachelor's Degree or higher | 968 (94.1%) | 61 (5.9%) |
Occupancy by Age of Householder in Huntertown
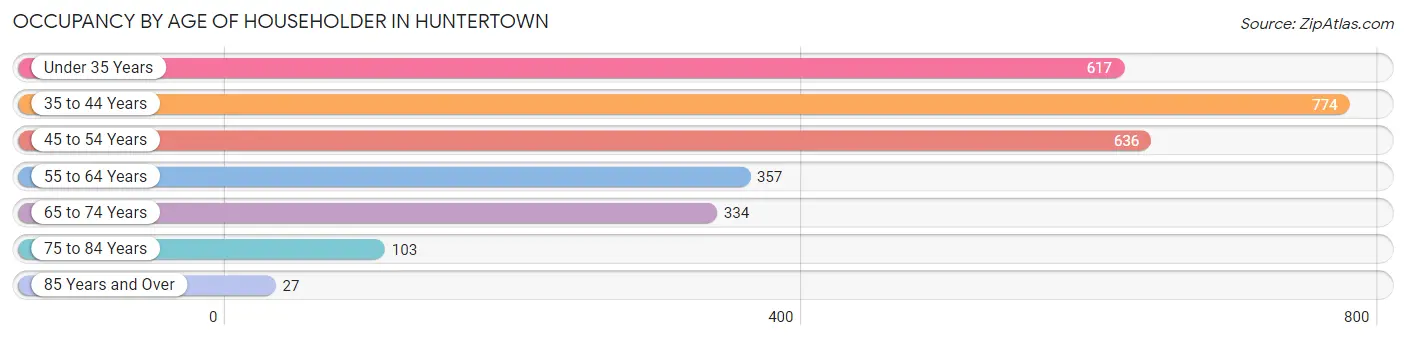
| Age Bracket | # Households | % Households |
| Under 35 Years | 617 | 21.7% |
| 35 to 44 Years | 774 | 27.2% |
| 45 to 54 Years | 636 | 22.3% |
| 55 to 64 Years | 357 | 12.5% |
| 65 to 74 Years | 334 | 11.7% |
| 75 to 84 Years | 103 | 3.6% |
| 85 Years and Over | 27 | 0.9% |
| Total | 2,848 | 100.0% |
Housing Finances in Huntertown
Median Income by Occupancy in Huntertown
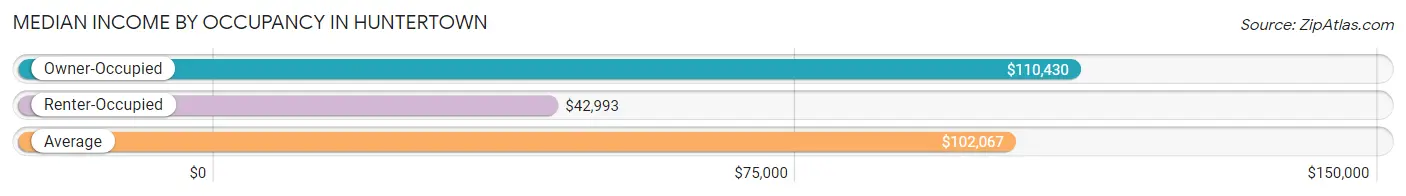
| Occupancy Type | # Households | Median Income |
| Owner-Occupied | 2,605 (91.5%) | $110,430 |
| Renter-Occupied | 243 (8.5%) | $42,993 |
| Average | 2,848 (100.0%) | $102,067 |
Occupancy by Householder Income Bracket in Huntertown
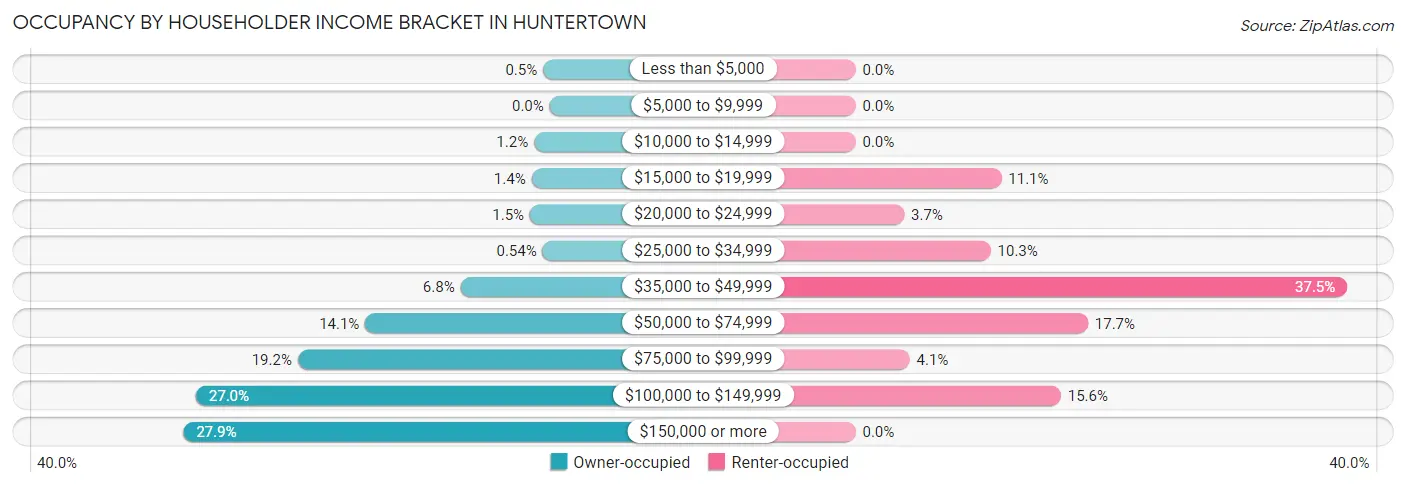
| Income Bracket | Owner-occupied | Renter-occupied |
| Less than $5,000 | 13 (0.5%) | 0 (0.0%) |
| $5,000 to $9,999 | 0 (0.0%) | 0 (0.0%) |
| $10,000 to $14,999 | 31 (1.2%) | 0 (0.0%) |
| $15,000 to $19,999 | 36 (1.4%) | 27 (11.1%) |
| $20,000 to $24,999 | 39 (1.5%) | 9 (3.7%) |
| $25,000 to $34,999 | 14 (0.5%) | 25 (10.3%) |
| $35,000 to $49,999 | 177 (6.8%) | 91 (37.4%) |
| $50,000 to $74,999 | 366 (14.1%) | 43 (17.7%) |
| $75,000 to $99,999 | 500 (19.2%) | 10 (4.1%) |
| $100,000 to $149,999 | 702 (27.0%) | 38 (15.6%) |
| $150,000 or more | 727 (27.9%) | 0 (0.0%) |
| Total | 2,605 (100.0%) | 243 (100.0%) |
Monthly Housing Cost Tiers in Huntertown
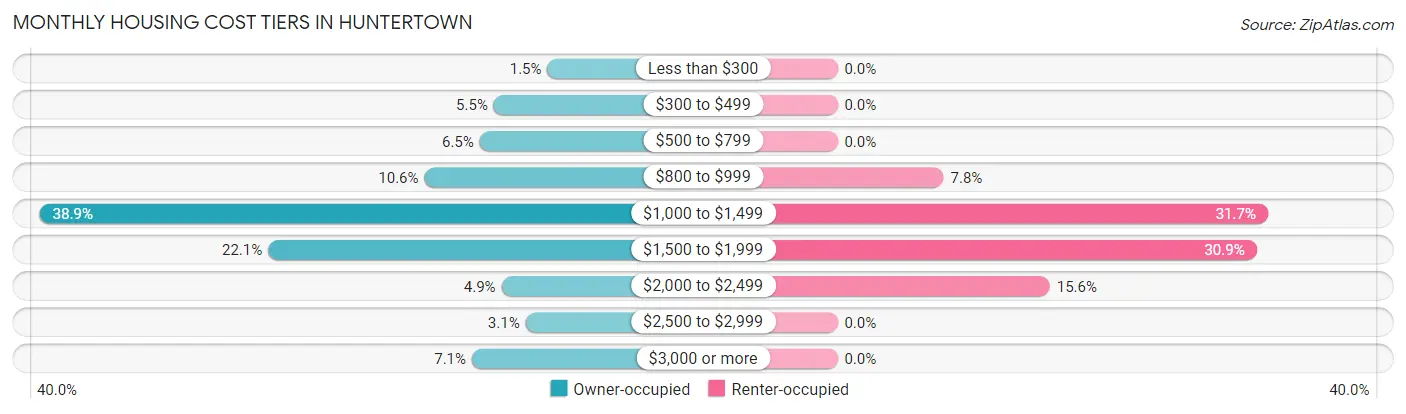
| Monthly Cost | Owner-occupied | Renter-occupied |
| Less than $300 | 39 (1.5%) | 0 (0.0%) |
| $300 to $499 | 142 (5.4%) | 0 (0.0%) |
| $500 to $799 | 169 (6.5%) | 0 (0.0%) |
| $800 to $999 | 275 (10.6%) | 19 (7.8%) |
| $1,000 to $1,499 | 1,013 (38.9%) | 77 (31.7%) |
| $1,500 to $1,999 | 575 (22.1%) | 75 (30.9%) |
| $2,000 to $2,499 | 127 (4.9%) | 38 (15.6%) |
| $2,500 to $2,999 | 81 (3.1%) | 0 (0.0%) |
| $3,000 or more | 184 (7.1%) | 0 (0.0%) |
| Total | 2,605 (100.0%) | 243 (100.0%) |
Physical Housing Characteristics in Huntertown
Housing Structures in Huntertown
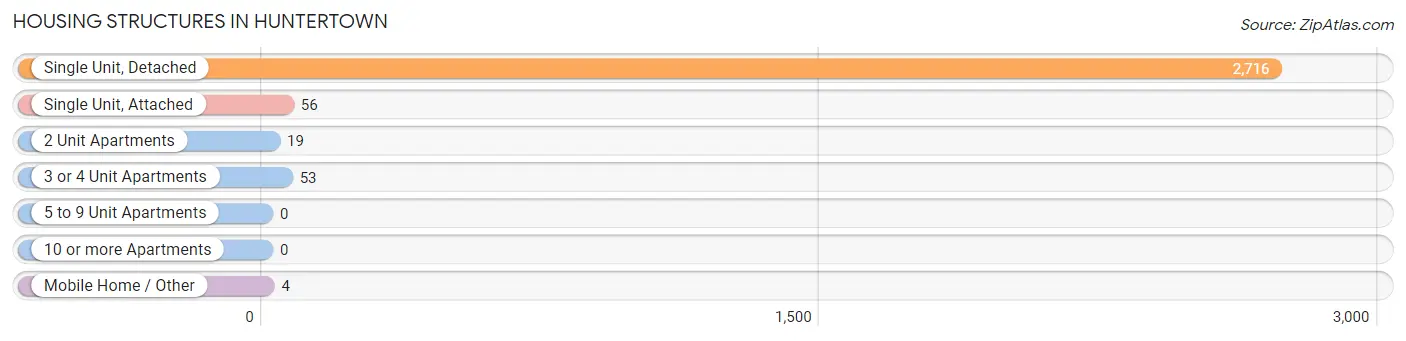
| Structure Type | # Housing Units | % Housing Units |
| Single Unit, Detached | 2,716 | 95.4% |
| Single Unit, Attached | 56 | 2.0% |
| 2 Unit Apartments | 19 | 0.7% |
| 3 or 4 Unit Apartments | 53 | 1.9% |
| 5 to 9 Unit Apartments | 0 | 0.0% |
| 10 or more Apartments | 0 | 0.0% |
| Mobile Home / Other | 4 | 0.1% |
| Total | 2,848 | 100.0% |
Housing Structures by Occupancy in Huntertown
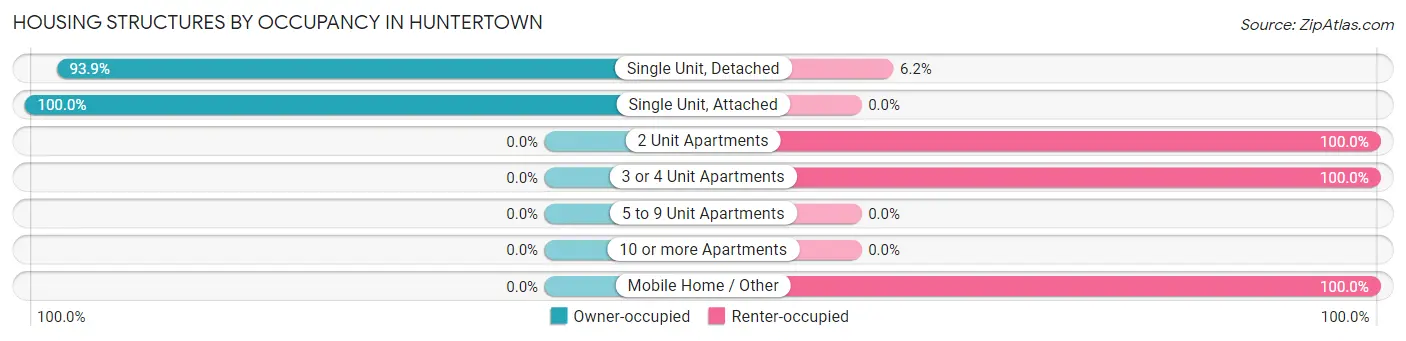
| Structure Type | Owner-occupied | Renter-occupied |
| Single Unit, Detached | 2,549 (93.9%) | 167 (6.1%) |
| Single Unit, Attached | 56 (100.0%) | 0 (0.0%) |
| 2 Unit Apartments | 0 (0.0%) | 19 (100.0%) |
| 3 or 4 Unit Apartments | 0 (0.0%) | 53 (100.0%) |
| 5 to 9 Unit Apartments | 0 (0.0%) | 0 (0.0%) |
| 10 or more Apartments | 0 (0.0%) | 0 (0.0%) |
| Mobile Home / Other | 0 (0.0%) | 4 (100.0%) |
| Total | 2,605 (91.5%) | 243 (8.5%) |
Housing Structures by Number of Rooms in Huntertown
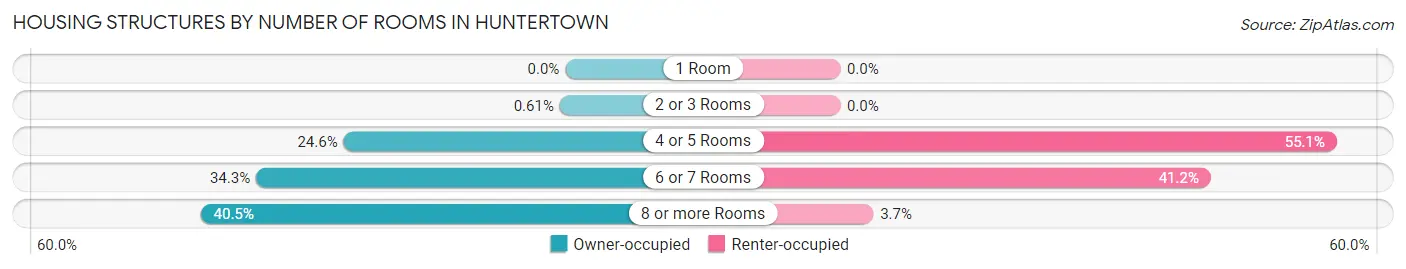
| Number of Rooms | Owner-occupied | Renter-occupied |
| 1 Room | 0 (0.0%) | 0 (0.0%) |
| 2 or 3 Rooms | 16 (0.6%) | 0 (0.0%) |
| 4 or 5 Rooms | 641 (24.6%) | 134 (55.1%) |
| 6 or 7 Rooms | 894 (34.3%) | 100 (41.1%) |
| 8 or more Rooms | 1,054 (40.5%) | 9 (3.7%) |
| Total | 2,605 (100.0%) | 243 (100.0%) |
Housing Structure by Heating Type in Huntertown
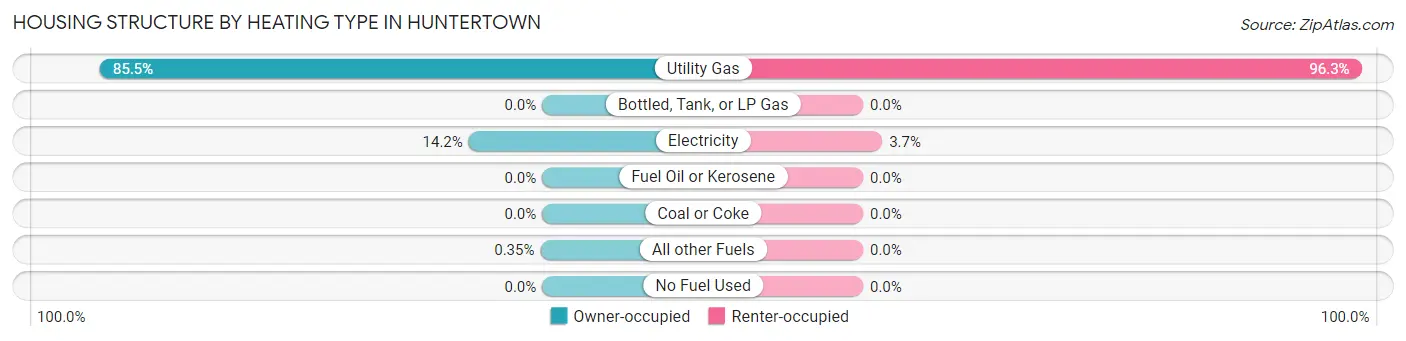
| Heating Type | Owner-occupied | Renter-occupied |
| Utility Gas | 2,226 (85.5%) | 234 (96.3%) |
| Bottled, Tank, or LP Gas | 0 (0.0%) | 0 (0.0%) |
| Electricity | 370 (14.2%) | 9 (3.7%) |
| Fuel Oil or Kerosene | 0 (0.0%) | 0 (0.0%) |
| Coal or Coke | 0 (0.0%) | 0 (0.0%) |
| All other Fuels | 9 (0.4%) | 0 (0.0%) |
| No Fuel Used | 0 (0.0%) | 0 (0.0%) |
| Total | 2,605 (100.0%) | 243 (100.0%) |
Household Vehicle Usage in Huntertown
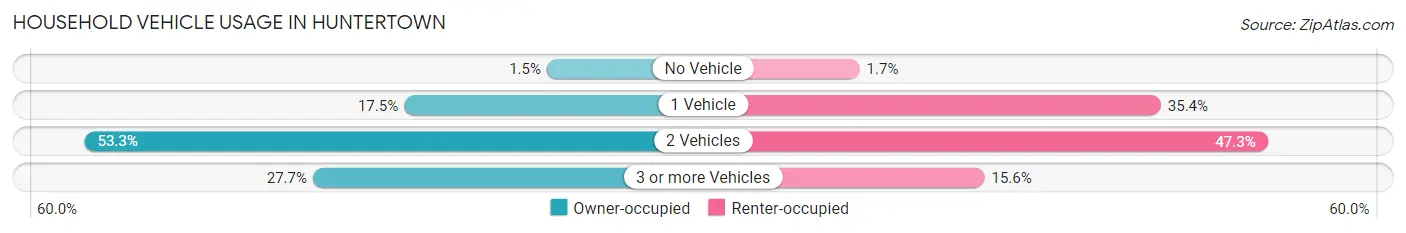
| Vehicles per Household | Owner-occupied | Renter-occupied |
| No Vehicle | 39 (1.5%) | 4 (1.7%) |
| 1 Vehicle | 456 (17.5%) | 86 (35.4%) |
| 2 Vehicles | 1,388 (53.3%) | 115 (47.3%) |
| 3 or more Vehicles | 722 (27.7%) | 38 (15.6%) |
| Total | 2,605 (100.0%) | 243 (100.0%) |
Real Estate & Mortgages in Huntertown
Real Estate and Mortgage Overview in Huntertown
| Characteristic | Without Mortgage | With Mortgage |
| Housing Units | 396 | 2,209 |
| Median Property Value | $181,100 | $233,700 |
| Median Household Income | $79,327 | $693 |
| Monthly Housing Costs | $520 | $184 |
| Real Estate Taxes | $1,318 | $84 |
Property Value by Mortgage Status in Huntertown
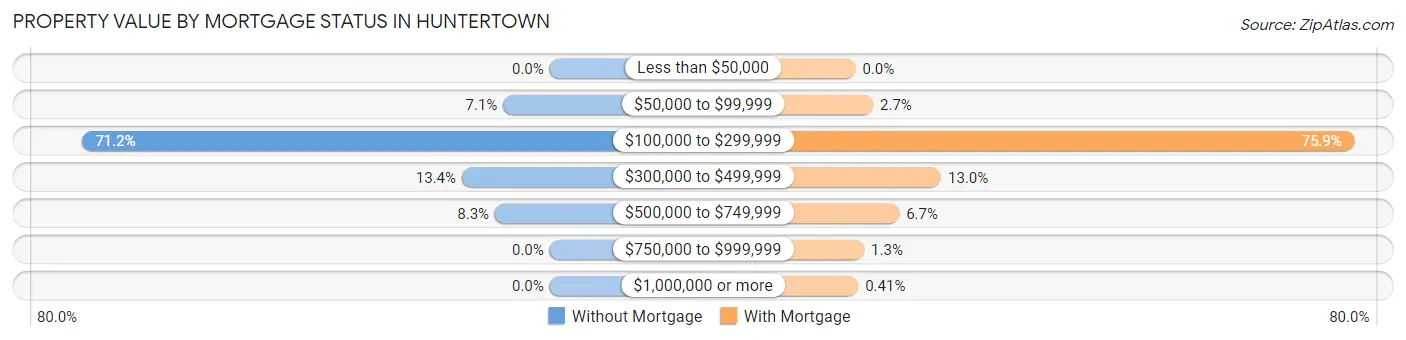
| Property Value | Without Mortgage | With Mortgage |
| Less than $50,000 | 0 (0.0%) | 0 (0.0%) |
| $50,000 to $99,999 | 28 (7.1%) | 59 (2.7%) |
| $100,000 to $299,999 | 282 (71.2%) | 1,677 (75.9%) |
| $300,000 to $499,999 | 53 (13.4%) | 288 (13.0%) |
| $500,000 to $749,999 | 33 (8.3%) | 147 (6.7%) |
| $750,000 to $999,999 | 0 (0.0%) | 29 (1.3%) |
| $1,000,000 or more | 0 (0.0%) | 9 (0.4%) |
| Total | 396 (100.0%) | 2,209 (100.0%) |
Household Income by Mortgage Status in Huntertown
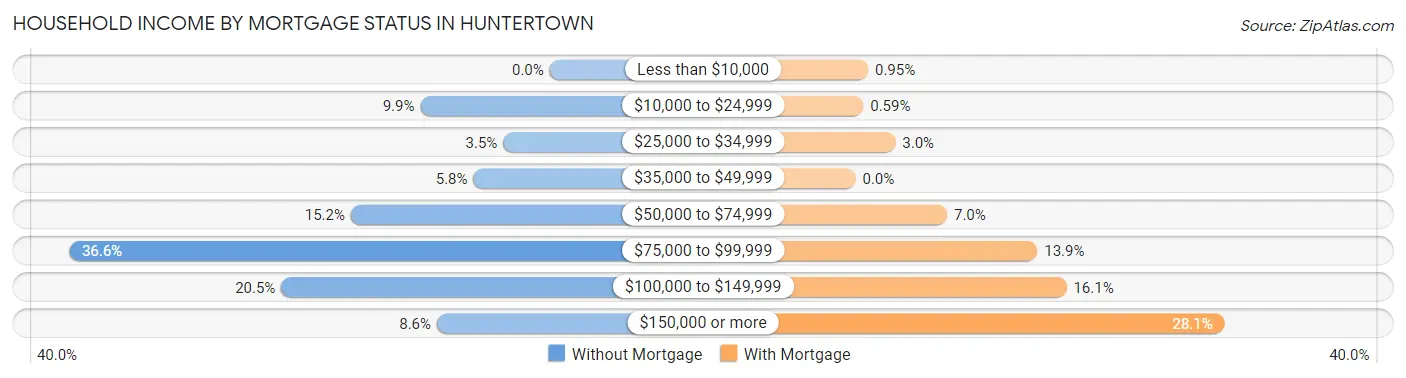
| Household Income | Without Mortgage | With Mortgage |
| Less than $10,000 | 0 (0.0%) | 21 (0.9%) |
| $10,000 to $24,999 | 39 (9.9%) | 13 (0.6%) |
| $25,000 to $34,999 | 14 (3.5%) | 67 (3.0%) |
| $35,000 to $49,999 | 23 (5.8%) | 0 (0.0%) |
| $50,000 to $74,999 | 60 (15.1%) | 154 (7.0%) |
| $75,000 to $99,999 | 145 (36.6%) | 306 (13.9%) |
| $100,000 to $149,999 | 81 (20.4%) | 355 (16.1%) |
| $150,000 or more | 34 (8.6%) | 621 (28.1%) |
| Total | 396 (100.0%) | 2,209 (100.0%) |
Property Value to Household Income Ratio in Huntertown
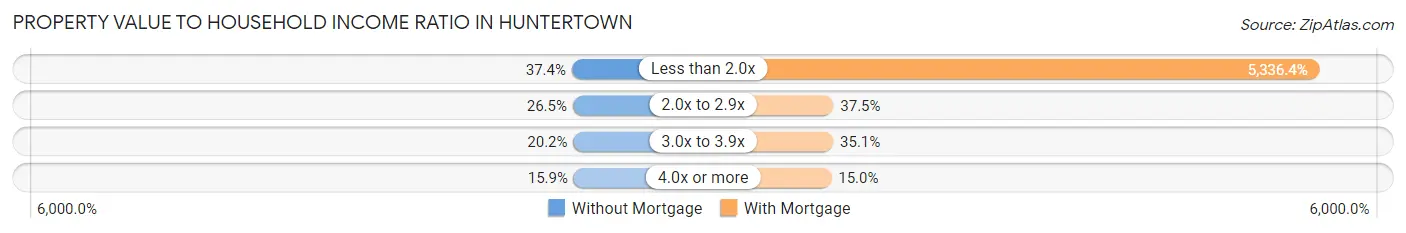
| Value-to-Income Ratio | Without Mortgage | With Mortgage |
| Less than 2.0x | 148 (37.4%) | 117,880 (5,336.4%) |
| 2.0x to 2.9x | 105 (26.5%) | 829 (37.5%) |
| 3.0x to 3.9x | 80 (20.2%) | 775 (35.1%) |
| 4.0x or more | 63 (15.9%) | 332 (15.0%) |
| Total | 396 (100.0%) | 2,209 (100.0%) |
Real Estate Taxes by Mortgage Status in Huntertown
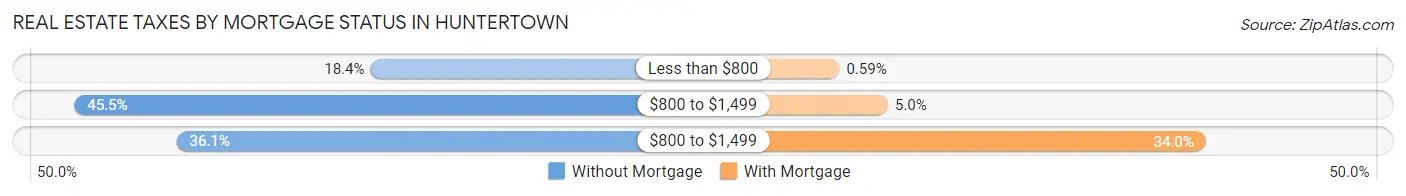
| Property Taxes | Without Mortgage | With Mortgage |
| Less than $800 | 73 (18.4%) | 13 (0.6%) |
| $800 to $1,499 | 180 (45.5%) | 111 (5.0%) |
| $800 to $1,499 | 143 (36.1%) | 752 (34.0%) |
| Total | 396 (100.0%) | 2,209 (100.0%) |
Health & Disability in Huntertown
Health Insurance Coverage by Age in Huntertown
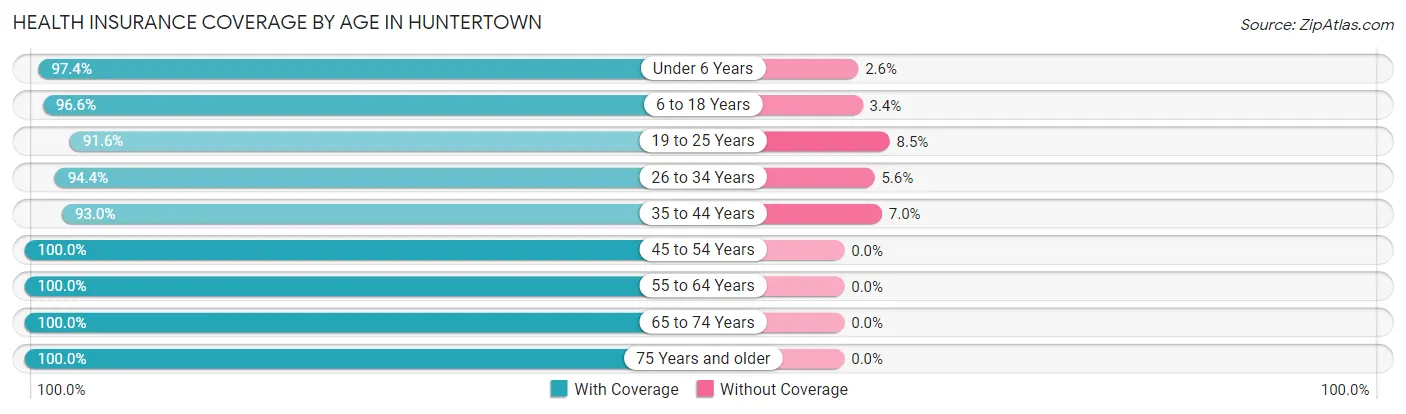
| Age Bracket | With Coverage | Without Coverage |
| Under 6 Years | 749 (97.4%) | 20 (2.6%) |
| 6 to 18 Years | 2,529 (96.6%) | 89 (3.4%) |
| 19 to 25 Years | 336 (91.5%) | 31 (8.5%) |
| 26 to 34 Years | 1,124 (94.4%) | 67 (5.6%) |
| 35 to 44 Years | 1,341 (93.0%) | 101 (7.0%) |
| 45 to 54 Years | 984 (100.0%) | 0 (0.0%) |
| 55 to 64 Years | 774 (100.0%) | 0 (0.0%) |
| 65 to 74 Years | 564 (100.0%) | 0 (0.0%) |
| 75 Years and older | 185 (100.0%) | 0 (0.0%) |
| Total | 8,586 (96.5%) | 308 (3.5%) |
Health Insurance Coverage by Citizenship Status in Huntertown
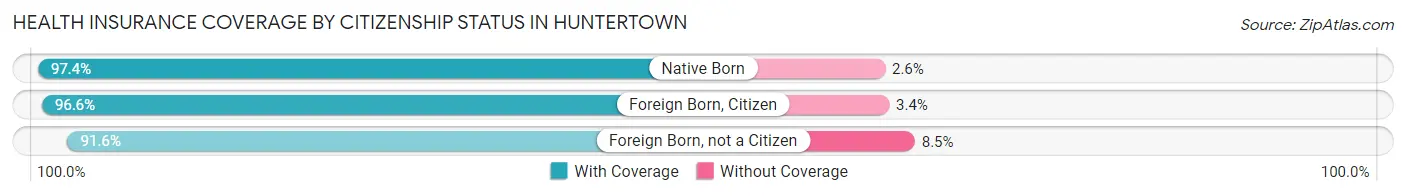
| Citizenship Status | With Coverage | Without Coverage |
| Native Born | 749 (97.4%) | 20 (2.6%) |
| Foreign Born, Citizen | 2,529 (96.6%) | 89 (3.4%) |
| Foreign Born, not a Citizen | 336 (91.5%) | 31 (8.5%) |
Health Insurance Coverage by Household Income in Huntertown
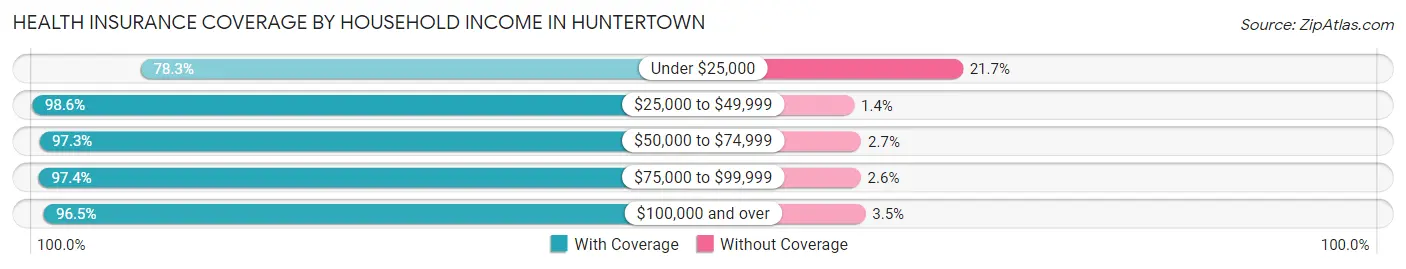
| Household Income | With Coverage | Without Coverage |
| Under $25,000 | 173 (78.3%) | 48 (21.7%) |
| $25,000 to $49,999 | 867 (98.6%) | 12 (1.4%) |
| $50,000 to $74,999 | 1,123 (97.3%) | 31 (2.7%) |
| $75,000 to $99,999 | 1,424 (97.4%) | 38 (2.6%) |
| $100,000 and over | 4,984 (96.5%) | 179 (3.5%) |
Public vs Private Health Insurance Coverage by Age in Huntertown
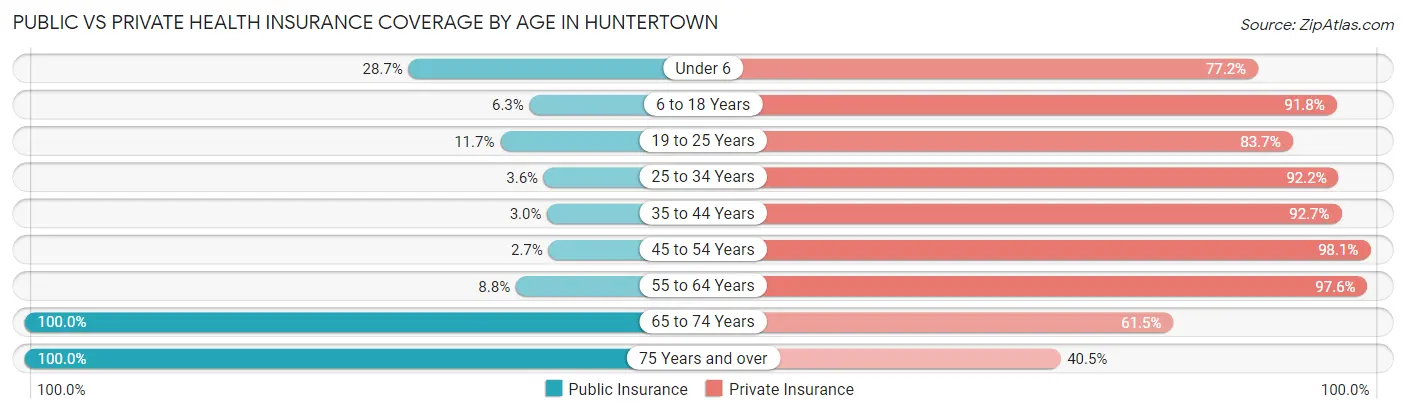
| Age Bracket | Public Insurance | Private Insurance |
| Under 6 | 221 (28.7%) | 594 (77.2%) |
| 6 to 18 Years | 164 (6.3%) | 2,404 (91.8%) |
| 19 to 25 Years | 43 (11.7%) | 307 (83.7%) |
| 25 to 34 Years | 43 (3.6%) | 1,098 (92.2%) |
| 35 to 44 Years | 43 (3.0%) | 1,337 (92.7%) |
| 45 to 54 Years | 27 (2.7%) | 965 (98.1%) |
| 55 to 64 Years | 68 (8.8%) | 755 (97.6%) |
| 65 to 74 Years | 564 (100.0%) | 347 (61.5%) |
| 75 Years and over | 185 (100.0%) | 75 (40.5%) |
| Total | 1,358 (15.3%) | 7,882 (88.6%) |
Disability Status by Sex by Age in Huntertown
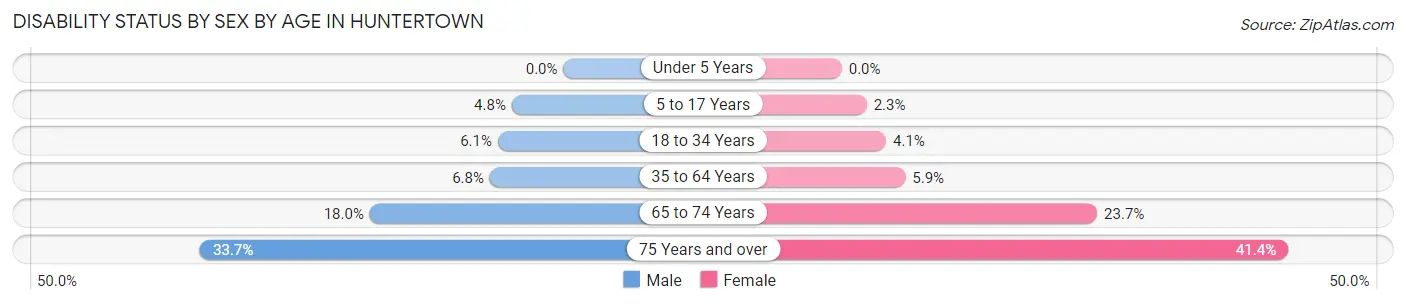
| Age Bracket | Male | Female |
| Under 5 Years | 0 (0.0%) | 0 (0.0%) |
| 5 to 17 Years | 58 (4.8%) | 30 (2.3%) |
| 18 to 34 Years | 54 (6.1%) | 33 (4.1%) |
| 35 to 64 Years | 111 (6.8%) | 93 (5.9%) |
| 65 to 74 Years | 46 (18.0%) | 73 (23.7%) |
| 75 Years and over | 29 (33.7%) | 41 (41.4%) |
Disability Class by Sex by Age in Huntertown
Disability Class: Hearing Difficulty
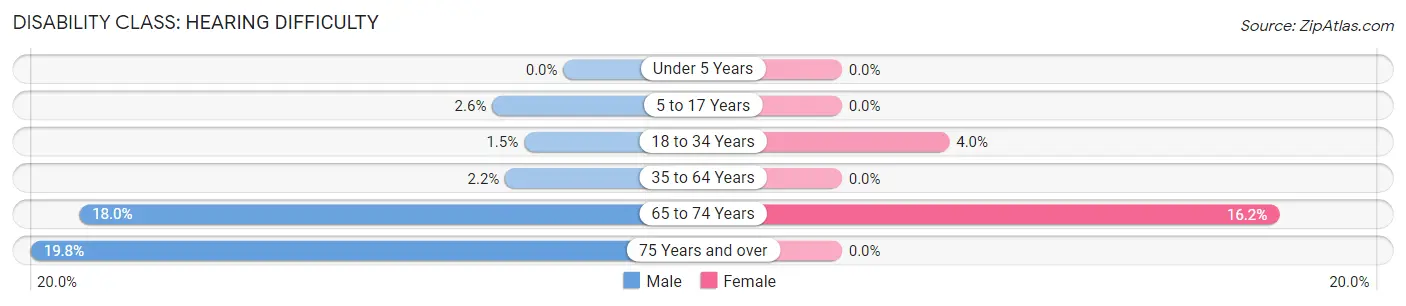
| Age Bracket | Male | Female |
| Under 5 Years | 0 (0.0%) | 0 (0.0%) |
| 5 to 17 Years | 32 (2.6%) | 0 (0.0%) |
| 18 to 34 Years | 13 (1.5%) | 32 (4.0%) |
| 35 to 64 Years | 35 (2.2%) | 0 (0.0%) |
| 65 to 74 Years | 46 (18.0%) | 50 (16.2%) |
| 75 Years and over | 17 (19.8%) | 0 (0.0%) |
Disability Class: Vision Difficulty
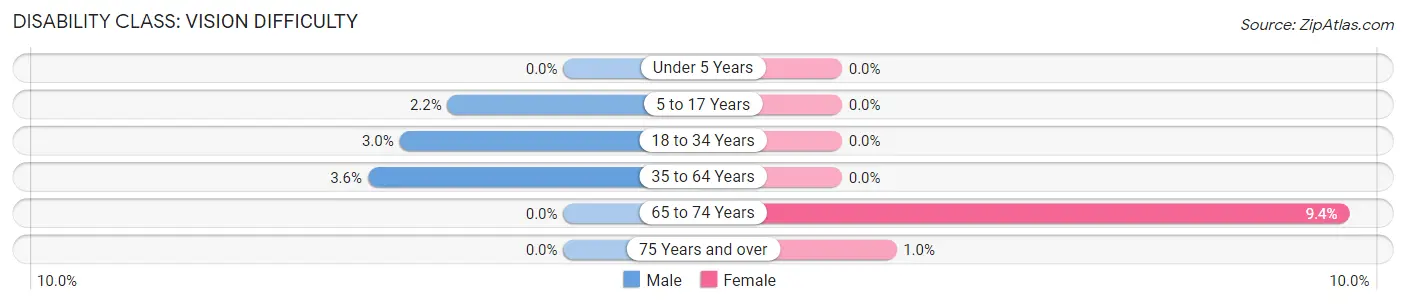
| Age Bracket | Male | Female |
| Under 5 Years | 0 (0.0%) | 0 (0.0%) |
| 5 to 17 Years | 26 (2.1%) | 0 (0.0%) |
| 18 to 34 Years | 27 (3.0%) | 0 (0.0%) |
| 35 to 64 Years | 59 (3.6%) | 0 (0.0%) |
| 65 to 74 Years | 0 (0.0%) | 29 (9.4%) |
| 75 Years and over | 0 (0.0%) | 1 (1.0%) |
Disability Class: Cognitive Difficulty
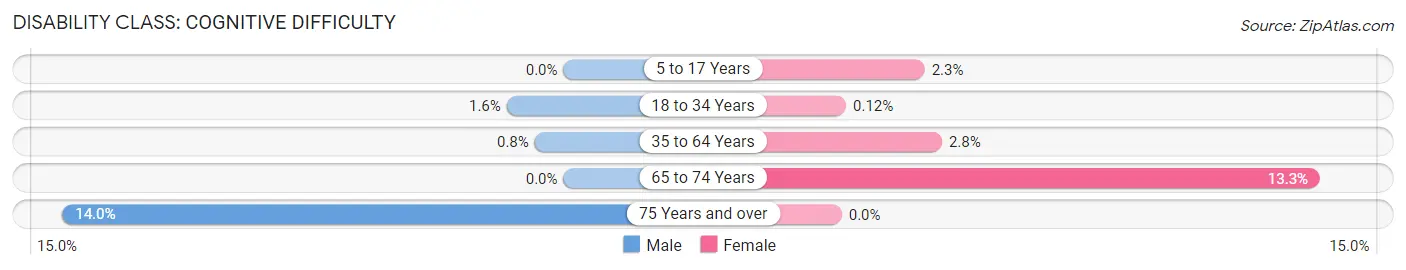
| Age Bracket | Male | Female |
| 5 to 17 Years | 0 (0.0%) | 30 (2.3%) |
| 18 to 34 Years | 14 (1.6%) | 1 (0.1%) |
| 35 to 64 Years | 13 (0.8%) | 44 (2.8%) |
| 65 to 74 Years | 0 (0.0%) | 41 (13.3%) |
| 75 Years and over | 12 (14.0%) | 0 (0.0%) |
Disability Class: Ambulatory Difficulty
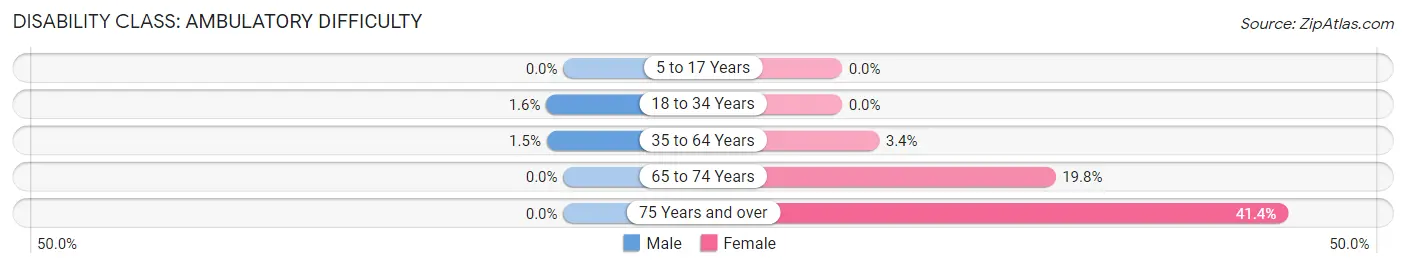
| Age Bracket | Male | Female |
| 5 to 17 Years | 0 (0.0%) | 0 (0.0%) |
| 18 to 34 Years | 14 (1.6%) | 0 (0.0%) |
| 35 to 64 Years | 25 (1.5%) | 54 (3.4%) |
| 65 to 74 Years | 0 (0.0%) | 61 (19.8%) |
| 75 Years and over | 0 (0.0%) | 41 (41.4%) |
Disability Class: Self-Care Difficulty
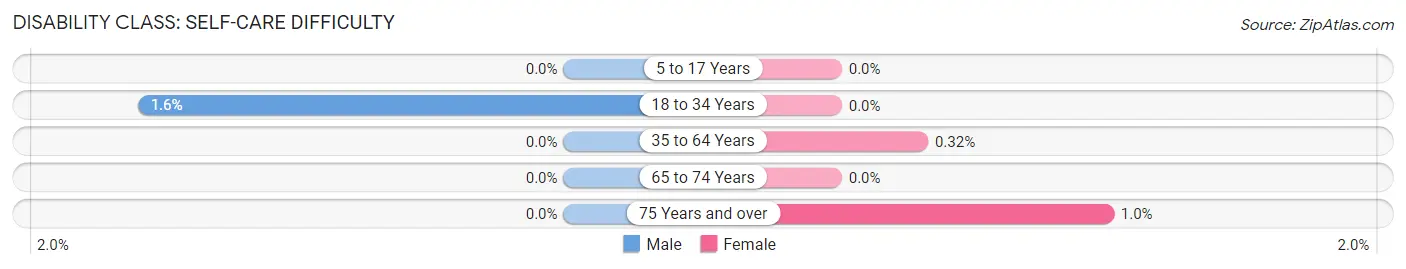
| Age Bracket | Male | Female |
| 5 to 17 Years | 0 (0.0%) | 0 (0.0%) |
| 18 to 34 Years | 14 (1.6%) | 0 (0.0%) |
| 35 to 64 Years | 0 (0.0%) | 5 (0.3%) |
| 65 to 74 Years | 0 (0.0%) | 0 (0.0%) |
| 75 Years and over | 0 (0.0%) | 1 (1.0%) |
Technology Access in Huntertown
Computing Device Access in Huntertown
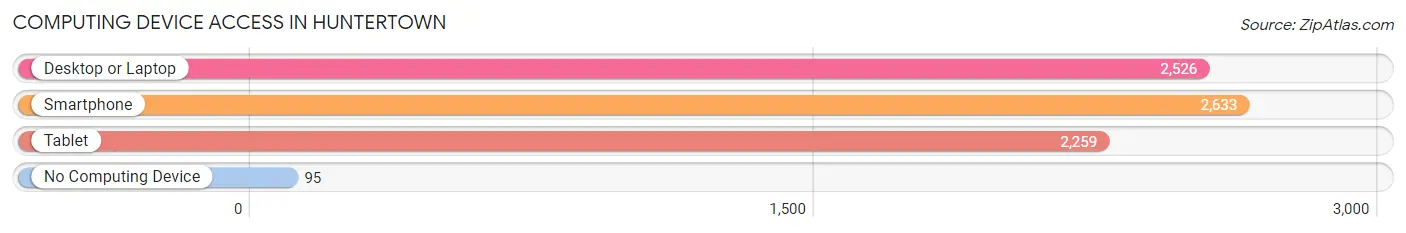
| Device Type | # Households | % Households |
| Desktop or Laptop | 2,526 | 88.7% |
| Smartphone | 2,633 | 92.4% |
| Tablet | 2,259 | 79.3% |
| No Computing Device | 95 | 3.3% |
| Total | 2,848 | 100.0% |
Internet Access in Huntertown
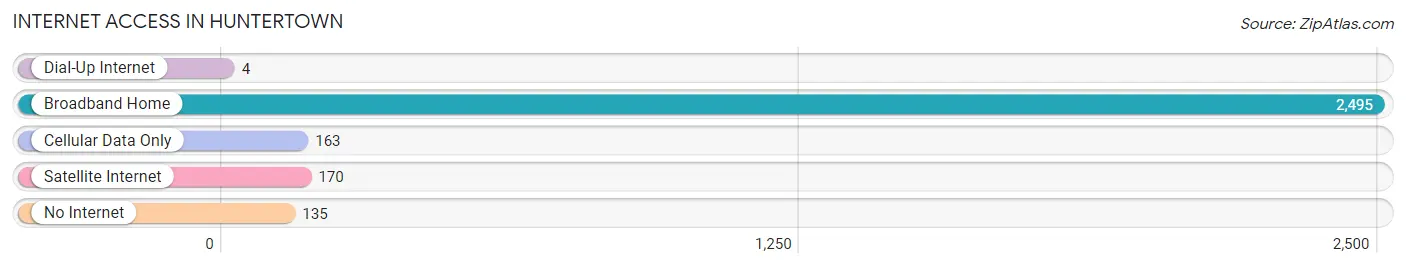
| Internet Type | # Households | % Households |
| Dial-Up Internet | 4 | 0.1% |
| Broadband Home | 2,495 | 87.6% |
| Cellular Data Only | 163 | 5.7% |
| Satellite Internet | 170 | 6.0% |
| No Internet | 135 | 4.7% |
| Total | 2,848 | 100.0% |
Huntertown Summary
Town History
Huntertown is a small town located in Allen County, Indiana. It was founded in 1837 by William Hunter, a local farmer and businessman. The town was originally known as Huntersville, but the name was changed to Huntertown in 1876.
The town was originally a farming community, but it soon became a center for industry. In the late 19th century, Huntertown was home to several factories, including a sawmill, a grist mill, a brickyard, and a furniture factory. The town also had a railroad station, which allowed for the transportation of goods and people.
In the early 20th century, Huntertown experienced a period of growth and prosperity. The town was home to several businesses, including a bank, a hotel, a movie theater, and a variety of stores. The town also had a public library, which was established in 1915.
In the mid-20th century, Huntertown began to decline. The factories closed, and the railroad station was abandoned. The town's population decreased, and many of the businesses closed. In the late 20th century, the town experienced a resurgence, as new businesses opened and the population began to grow again.
Geography
Huntertown is located in Allen County, Indiana, in the northeastern part of the state. The town is situated on the banks of the St. Joseph River, and is surrounded by farmland. The town is located approximately 20 miles north of Fort Wayne, the county seat.
The town has a total area of 1.2 square miles, all of which is land. The town is located at an elevation of 845 feet above sea level.
Economy
The economy of Huntertown is largely based on agriculture and manufacturing. The town is home to several farms, which produce a variety of crops, including corn, soybeans, and wheat. The town is also home to several factories, which produce a variety of products, including furniture, clothing, and automotive parts.
The town is also home to several small businesses, including restaurants, retail stores, and service providers. The town is also home to a branch of the Allen County Public Library.
Demographics
As of the 2010 census, the population of Huntertown was 2,845. The town has a population density of 2,346 people per square mile. The median age of the population is 38.7 years, and the median household income is $50,945.
The town is predominantly white, with 92.3% of the population identifying as such. The town also has a small Hispanic population, with 4.2% of the population identifying as such. The town also has a small African American population, with 1.3% of the population identifying as such.
Conclusion
Huntertown is a small town located in Allen County, Indiana. It was founded in 1837 by William Hunter, and was originally a farming community. In the late 19th century, the town became a center for industry, and experienced a period of growth and prosperity in the early 20th century. In the mid-20th century, the town began to decline, but has since experienced a resurgence. The town is largely based on agriculture and manufacturing, and has a population of 2,845 as of the 2010 census.
Common Questions
What is Per Capita Income in Huntertown?
Per Capita income in Huntertown is $38,236.
What is the Median Family Income in Huntertown?
Median Family Income in Huntertown is $106,667.
What is the Median Household income in Huntertown?
Median Household Income in Huntertown is $102,067.
What is Income or Wage Gap in Huntertown?
Income or Wage Gap in Huntertown is 38.4%.
Women in Huntertown earn 61.6 cents for every dollar earned by a man.
What is Inequality or Gini Index in Huntertown?
Inequality or Gini Index in Huntertown is 0.35.
What is the Total Population of Huntertown?
Total Population of Huntertown is 9,090.
What is the Total Male Population of Huntertown?
Total Male Population of Huntertown is 4,661.
What is the Total Female Population of Huntertown?
Total Female Population of Huntertown is 4,429.
What is the Ratio of Males per 100 Females in Huntertown?
There are 105.24 Males per 100 Females in Huntertown.
What is the Ratio of Females per 100 Males in Huntertown?
There are 95.02 Females per 100 Males in Huntertown.
What is the Median Population Age in Huntertown?
Median Population Age in Huntertown is 32.0 Years.
What is the Average Family Size in Huntertown
Average Family Size in Huntertown is 3.4 People.
What is the Average Household Size in Huntertown
Average Household Size in Huntertown is 3.1 People.
How Large is the Labor Force in Huntertown?
There are 4,706 People in the Labor Forcein in Huntertown.
What is the Percentage of People in the Labor Force in Huntertown?
75.6% of People are in the Labor Force in Huntertown.
What is the Unemployment Rate in Huntertown?
Unemployment Rate in Huntertown is 1.0%.