Leesburg, IN Map & Demographics
Leesburg Map
Leesburg Overview
$26,857
PER CAPITA INCOME
$94,583
AVG FAMILY INCOME
$97,083
AVG HOUSEHOLD INCOME
52.7%
WAGE / INCOME GAP [ % ]
47.3¢/ $1
WAGE / INCOME GAP [ $ ]
0.31
INEQUALITY / GINI INDEX
942
TOTAL POPULATION
494
MALE POPULATION
448
FEMALE POPULATION
110.27
MALES / 100 FEMALES
90.69
FEMALES / 100 MALES
27.7
MEDIAN AGE
4.2
AVG FAMILY SIZE
4.0
AVG HOUSEHOLD SIZE
422
LABOR FORCE [ PEOPLE ]
73.6%
PERCENT IN LABOR FORCE
2.1%
UNEMPLOYMENT RATE
Leesburg Zip Codes
Leesburg Area Codes
Income in Leesburg
Income Overview in Leesburg
Per Capita Income in Leesburg is $26,857, while median incomes of families and households are $94,583 and $97,083 respectively.
| Characteristic | Number | Measure |
| Per Capita Income | 942 | $26,857 |
| Median Family Income | 207 | $94,583 |
| Mean Family Income | 207 | $103,955 |
| Median Household Income | 238 | $97,083 |
| Mean Household Income | 238 | $99,826 |
| Income Deficit | 207 | $0 |
| Wage / Income Gap (%) | 942 | 52.72% |
| Wage / Income Gap ($) | 942 | 47.28¢ per $1 |
| Gini / Inequality Index | 942 | 0.31 |
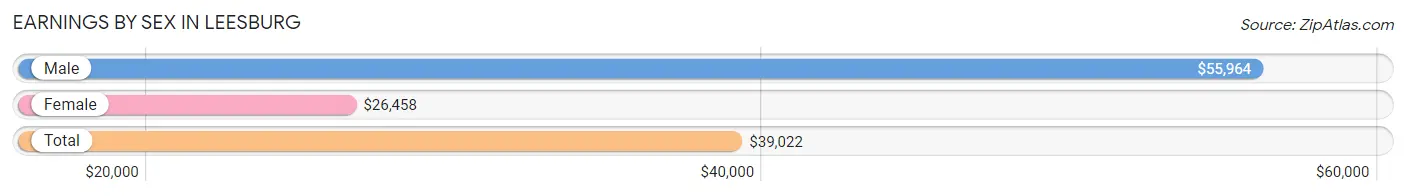
Earnings by Sex in Leesburg
Average Earnings in Leesburg are $39,022, $55,964 for men and $26,458 for women, a difference of 52.7%.
| Sex | Number | Average Earnings |
| Male | 263 (58.2%) | $55,964 |
| Female | 189 (41.8%) | $26,458 |
| Total | 452 (100.0%) | $39,022 |
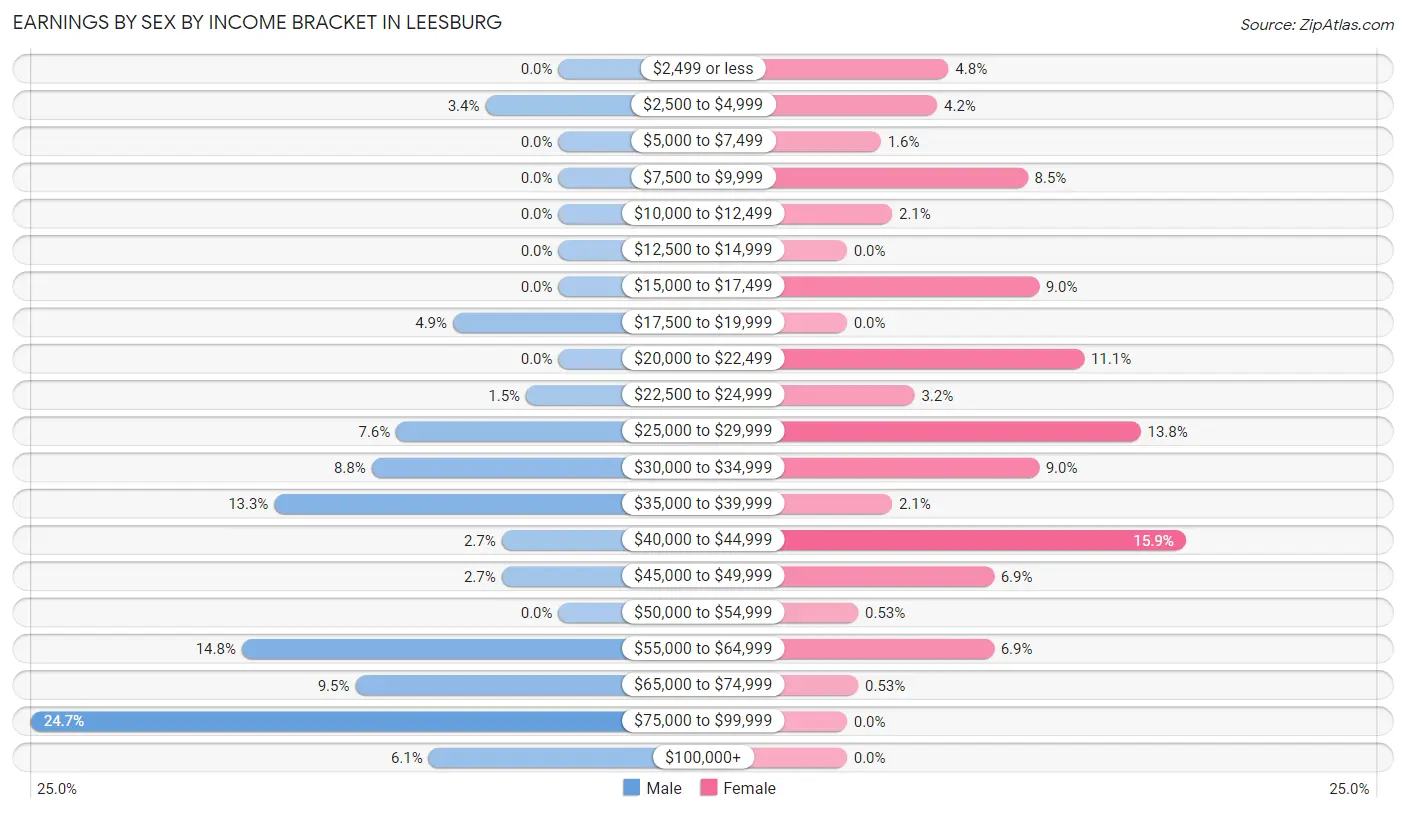
Earnings by Sex by Income Bracket in Leesburg
The most common earnings brackets in Leesburg are $75,000 to $99,999 for men (65 | 24.7%) and $40,000 to $44,999 for women (30 | 15.9%).
| Income | Male | Female |
| $2,499 or less | 0 (0.0%) | 9 (4.8%) |
| $2,500 to $4,999 | 9 (3.4%) | 8 (4.2%) |
| $5,000 to $7,499 | 0 (0.0%) | 3 (1.6%) |
| $7,500 to $9,999 | 0 (0.0%) | 16 (8.5%) |
| $10,000 to $12,499 | 0 (0.0%) | 4 (2.1%) |
| $12,500 to $14,999 | 0 (0.0%) | 0 (0.0%) |
| $15,000 to $17,499 | 0 (0.0%) | 17 (9.0%) |
| $17,500 to $19,999 | 13 (4.9%) | 0 (0.0%) |
| $20,000 to $22,499 | 0 (0.0%) | 21 (11.1%) |
| $22,500 to $24,999 | 4 (1.5%) | 6 (3.2%) |
| $25,000 to $29,999 | 20 (7.6%) | 26 (13.8%) |
| $30,000 to $34,999 | 23 (8.7%) | 17 (9.0%) |
| $35,000 to $39,999 | 35 (13.3%) | 4 (2.1%) |
| $40,000 to $44,999 | 7 (2.7%) | 30 (15.9%) |
| $45,000 to $49,999 | 7 (2.7%) | 13 (6.9%) |
| $50,000 to $54,999 | 0 (0.0%) | 1 (0.5%) |
| $55,000 to $64,999 | 39 (14.8%) | 13 (6.9%) |
| $65,000 to $74,999 | 25 (9.5%) | 1 (0.5%) |
| $75,000 to $99,999 | 65 (24.7%) | 0 (0.0%) |
| $100,000+ | 16 (6.1%) | 0 (0.0%) |
| Total | 263 (100.0%) | 189 (100.0%) |
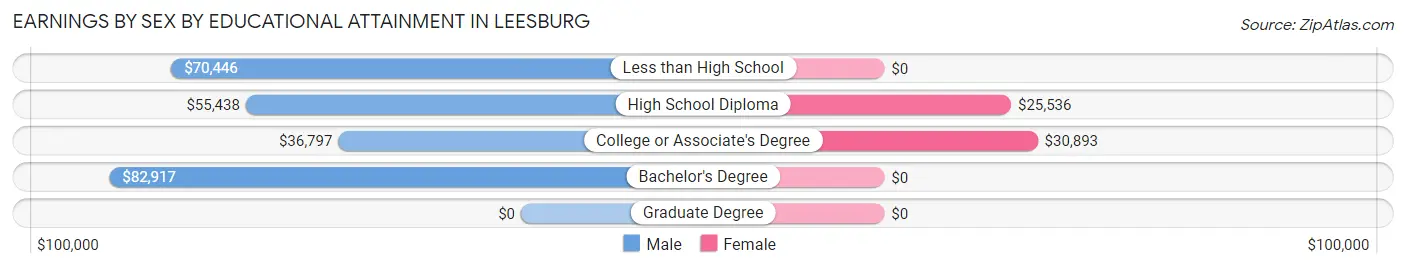
Earnings by Sex by Educational Attainment in Leesburg
Average earnings in Leesburg are $55,464 for men and $26,875 for women, a difference of 51.5%. Men with an educational attainment of bachelor's degree enjoy the highest average annual earnings of $82,917, while those with college or associate's degree education earn the least with $36,797. Women with an educational attainment of college or associate's degree earn the most with the average annual earnings of $30,893, while those with high school diploma education have the smallest earnings of $25,536.
| Educational Attainment | Male Income | Female Income |
| Less than High School | $70,446 | $0 |
| High School Diploma | $55,438 | $25,536 |
| College or Associate's Degree | $36,797 | $30,893 |
| Bachelor's Degree | $82,917 | $0 |
| Graduate Degree | - | - |
| Total | $55,464 | $26,875 |
Family Income in Leesburg
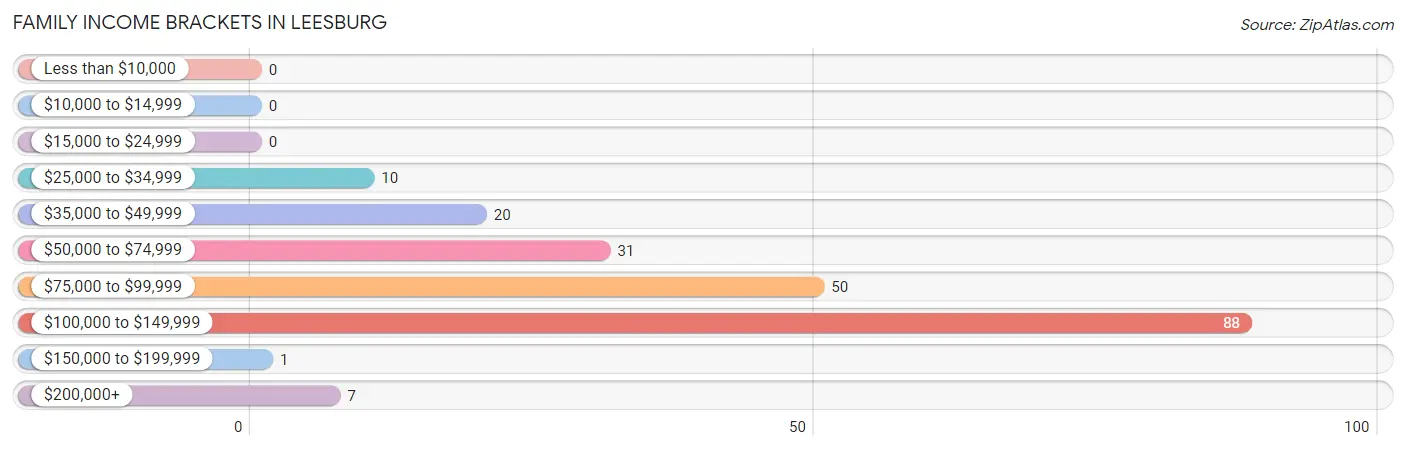
Family Income Brackets in Leesburg
According to the Leesburg family income data, there are 88 families falling into the $100,000 to $149,999 income range, which is the most common income bracket and makes up 42.5% of all families.
| Income Bracket | # Families | % Families |
| Less than $10,000 | 0 | 0.0% |
| $10,000 to $14,999 | 0 | 0.0% |
| $15,000 to $24,999 | 0 | 0.0% |
| $25,000 to $34,999 | 10 | 4.8% |
| $35,000 to $49,999 | 20 | 9.7% |
| $50,000 to $74,999 | 31 | 15.0% |
| $75,000 to $99,999 | 50 | 24.2% |
| $100,000 to $149,999 | 88 | 42.5% |
| $150,000 to $199,999 | 1 | 0.5% |
| $200,000+ | 7 | 3.4% |
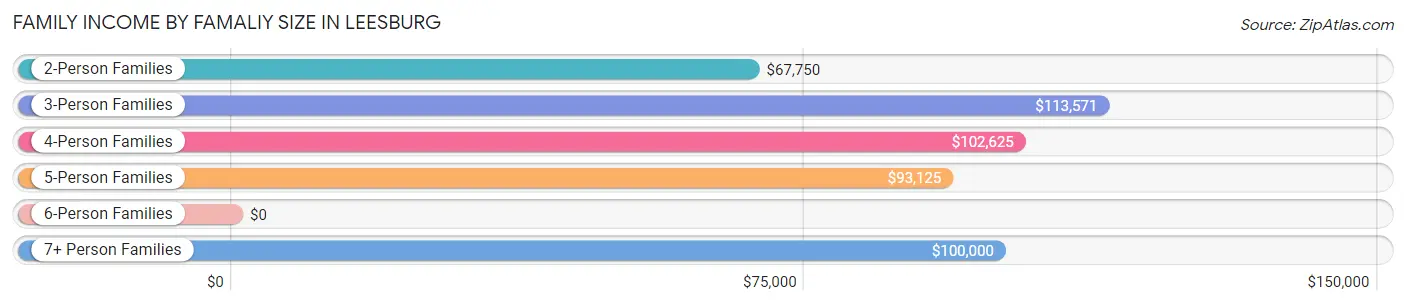
Family Income by Famaliy Size in Leesburg
3-person families (20 | 9.7%) account for the highest median family income in Leesburg with $113,571 per family, while 3-person families (20 | 9.7%) have the highest median income of $37,857 per family member.
| Income Bracket | # Families | Median Income |
| 2-Person Families | 33 (15.9%) | $67,750 |
| 3-Person Families | 20 (9.7%) | $113,571 |
| 4-Person Families | 83 (40.1%) | $102,625 |
| 5-Person Families | 44 (21.3%) | $93,125 |
| 6-Person Families | 9 (4.3%) | $0 |
| 7+ Person Families | 18 (8.7%) | $100,000 |
| Total | 207 (100.0%) | $94,583 |
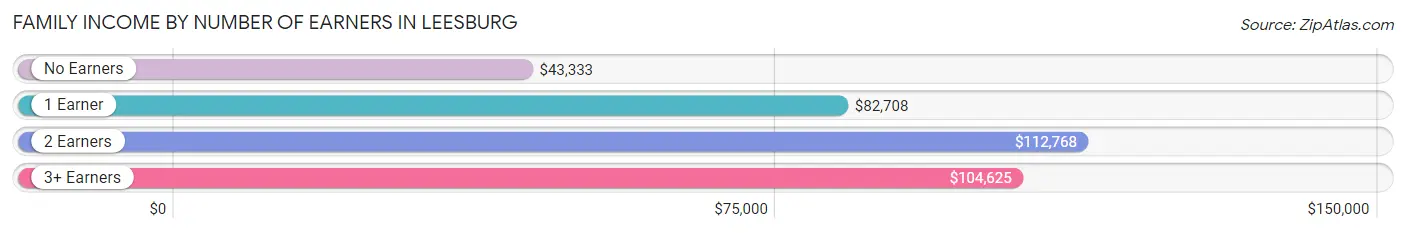
Family Income by Number of Earners in Leesburg
The median family income in Leesburg is $94,583, with families comprising 2 earners (115) having the highest median family income of $112,768, while families with no earners (14) have the lowest median family income of $43,333, accounting for 55.6% and 6.8% of families, respectively.
| Number of Earners | # Families | Median Income |
| No Earners | 14 (6.8%) | $43,333 |
| 1 Earner | 43 (20.8%) | $82,708 |
| 2 Earners | 115 (55.6%) | $112,768 |
| 3+ Earners | 35 (16.9%) | $104,625 |
| Total | 207 (100.0%) | $94,583 |
Household Income in Leesburg
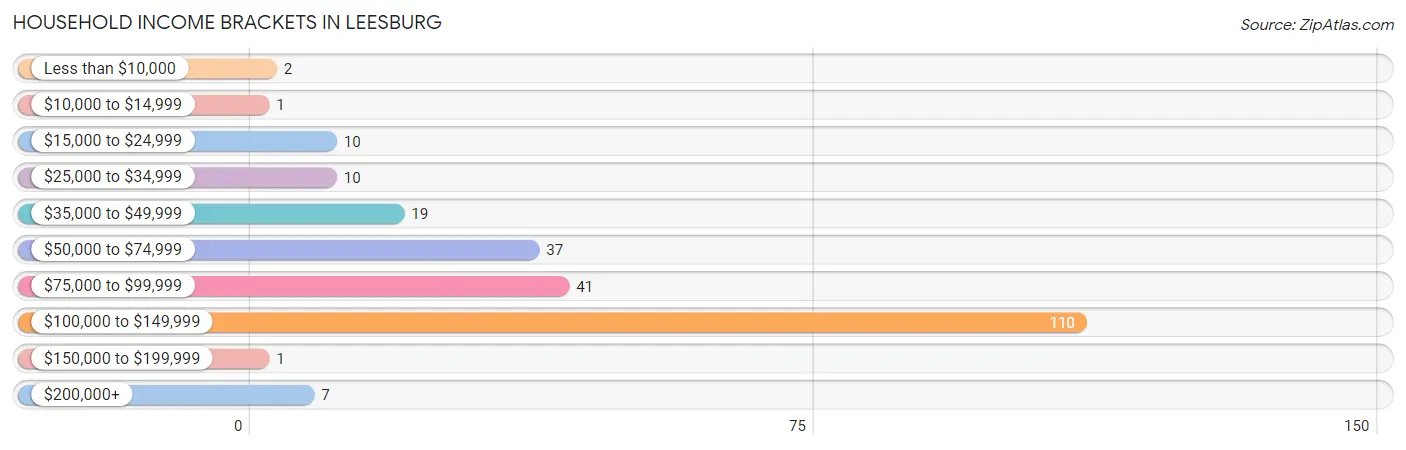
Household Income Brackets in Leesburg
With 110 households falling in the category, the $100,000 to $149,999 income range is the most frequent in Leesburg, accounting for 46.2% of all households. In contrast, only 1 households (0.4%) fall into the $10,000 to $14,999 income bracket, making it the least populous group.
| Income Bracket | # Households | % Households |
| Less than $10,000 | 2 | 0.8% |
| $10,000 to $14,999 | 1 | 0.4% |
| $15,000 to $24,999 | 10 | 4.2% |
| $25,000 to $34,999 | 10 | 4.2% |
| $35,000 to $49,999 | 19 | 8.0% |
| $50,000 to $74,999 | 37 | 15.5% |
| $75,000 to $99,999 | 41 | 17.2% |
| $100,000 to $149,999 | 110 | 46.2% |
| $150,000 to $199,999 | 1 | 0.4% |
| $200,000+ | 7 | 2.9% |
Household Income by Householder Age in Leesburg
The median household income in Leesburg is $97,083, with the highest median household income of $101,875 found in the 45 to 64 years age bracket for the primary householder. A total of 60 households (25.2%) fall into this category. Meanwhile, the 15 to 24 years age bracket for the primary householder has the lowest median household income of $0, with 27 households (11.3%) in this group.
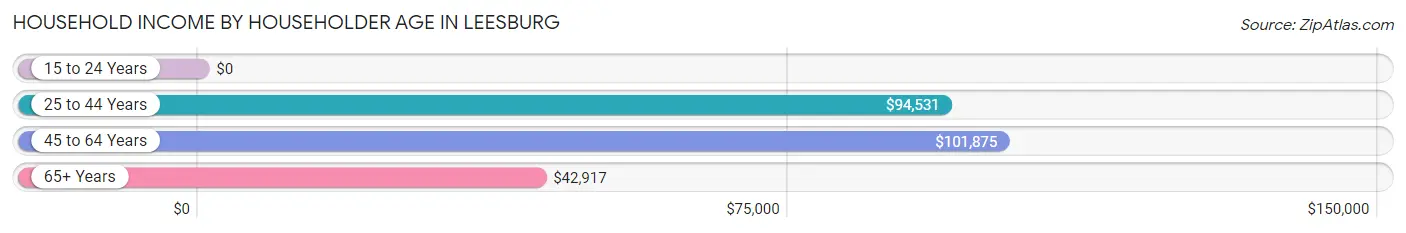
| Income Bracket | # Households | Median Income |
| 15 to 24 Years | 27 (11.3%) | $0 |
| 25 to 44 Years | 127 (53.4%) | $94,531 |
| 45 to 64 Years | 60 (25.2%) | $101,875 |
| 65+ Years | 24 (10.1%) | $42,917 |
| Total | 238 (100.0%) | $97,083 |
Poverty in Leesburg
Income Below Poverty by Sex and Age in Leesburg
With 3.2% poverty level for males and 4.3% for females among the residents of Leesburg, 65 to 74 year old males and 75 year old and over females are the most vulnerable to poverty, with 1 males (14.3%) and 2 females (18.2%) in their respective age groups living below the poverty level.
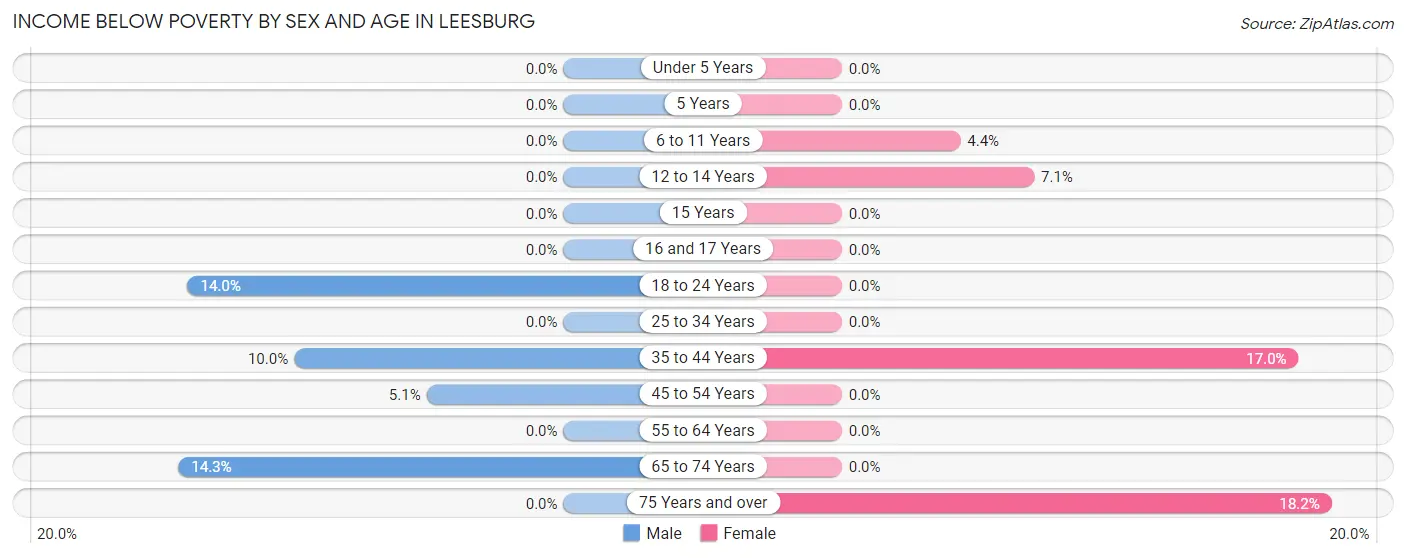
| Age Bracket | Male | Female |
| Under 5 Years | 0 (0.0%) | 0 (0.0%) |
| 5 Years | 0 (0.0%) | 0 (0.0%) |
| 6 to 11 Years | 0 (0.0%) | 4 (4.4%) |
| 12 to 14 Years | 0 (0.0%) | 3 (7.1%) |
| 15 Years | 0 (0.0%) | 0 (0.0%) |
| 16 and 17 Years | 0 (0.0%) | 0 (0.0%) |
| 18 to 24 Years | 6 (14.0%) | 0 (0.0%) |
| 25 to 34 Years | 0 (0.0%) | 0 (0.0%) |
| 35 to 44 Years | 6 (10.0%) | 10 (17.0%) |
| 45 to 54 Years | 3 (5.1%) | 0 (0.0%) |
| 55 to 64 Years | 0 (0.0%) | 0 (0.0%) |
| 65 to 74 Years | 1 (14.3%) | 0 (0.0%) |
| 75 Years and over | 0 (0.0%) | 2 (18.2%) |
| Total | 16 (3.2%) | 19 (4.3%) |
Income Above Poverty by Sex and Age in Leesburg
According to the poverty statistics in Leesburg, males aged under 5 years and females aged under 5 years are the age groups that are most secure financially, with 100.0% of males and 100.0% of females in these age groups living above the poverty line.
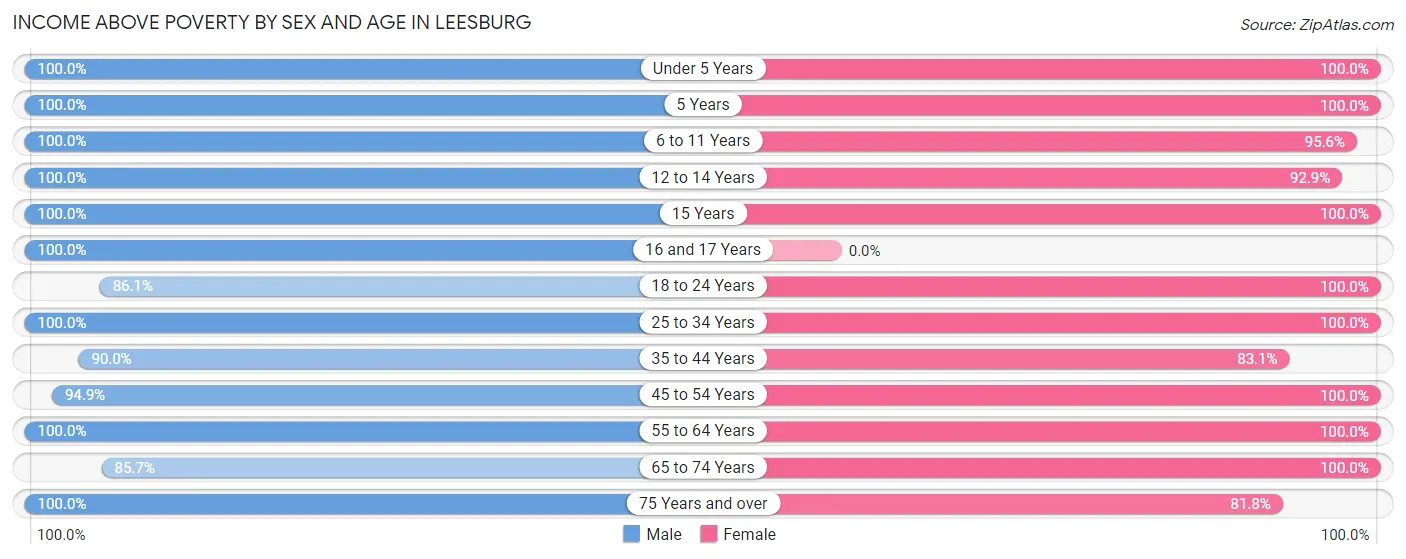
| Age Bracket | Male | Female |
| Under 5 Years | 88 (100.0%) | 33 (100.0%) |
| 5 Years | 20 (100.0%) | 5 (100.0%) |
| 6 to 11 Years | 56 (100.0%) | 87 (95.6%) |
| 12 to 14 Years | 21 (100.0%) | 39 (92.9%) |
| 15 Years | 4 (100.0%) | 5 (100.0%) |
| 16 and 17 Years | 14 (100.0%) | 0 (0.0%) |
| 18 to 24 Years | 37 (86.1%) | 6 (100.0%) |
| 25 to 34 Years | 91 (100.0%) | 115 (100.0%) |
| 35 to 44 Years | 54 (90.0%) | 49 (83.1%) |
| 45 to 54 Years | 56 (94.9%) | 34 (100.0%) |
| 55 to 64 Years | 24 (100.0%) | 28 (100.0%) |
| 65 to 74 Years | 6 (85.7%) | 15 (100.0%) |
| 75 Years and over | 7 (100.0%) | 9 (81.8%) |
| Total | 478 (96.8%) | 425 (95.7%) |
Income Below Poverty Among Married-Couple Families in Leesburg
The poverty statistics for married-couple families in Leesburg show that 1.6% or 3 of the total 186 families live below the poverty line. Families with 1 or 2 children have the highest poverty rate of 3.1%, comprising of 3 families. On the other hand, families with no children have the lowest poverty rate of 0.0%, which includes 0 families.
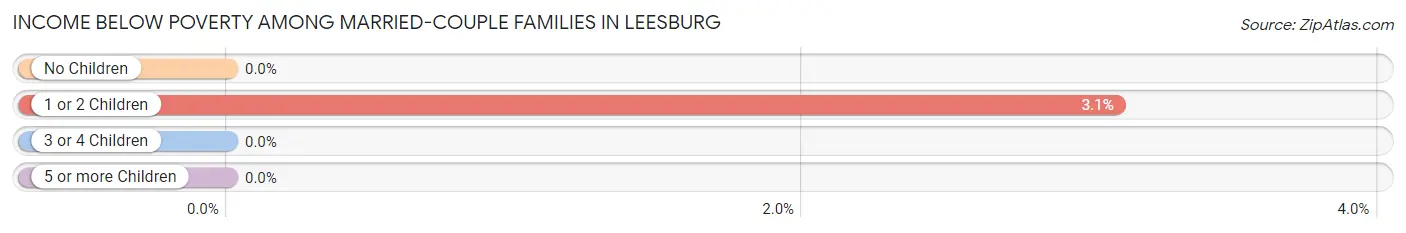
| Children | Above Poverty | Below Poverty |
| No Children | 40 (100.0%) | 0 (0.0%) |
| 1 or 2 Children | 94 (96.9%) | 3 (3.1%) |
| 3 or 4 Children | 45 (100.0%) | 0 (0.0%) |
| 5 or more Children | 4 (100.0%) | 0 (0.0%) |
| Total | 183 (98.4%) | 3 (1.6%) |
Income Below Poverty Among Single-Parent Households in Leesburg
| Children | Single Father | Single Mother |
| No Children | 0 (0.0%) | 0 (0.0%) |
| 1 or 2 Children | 0 (0.0%) | 0 (0.0%) |
| 3 or 4 Children | 0 (0.0%) | 0 (0.0%) |
| 5 or more Children | 0 (0.0%) | 0 (0.0%) |
| Total | 0 (0.0%) | 0 (0.0%) |
Income Below Poverty Among Married-Couple vs Single-Parent Households in Leesburg
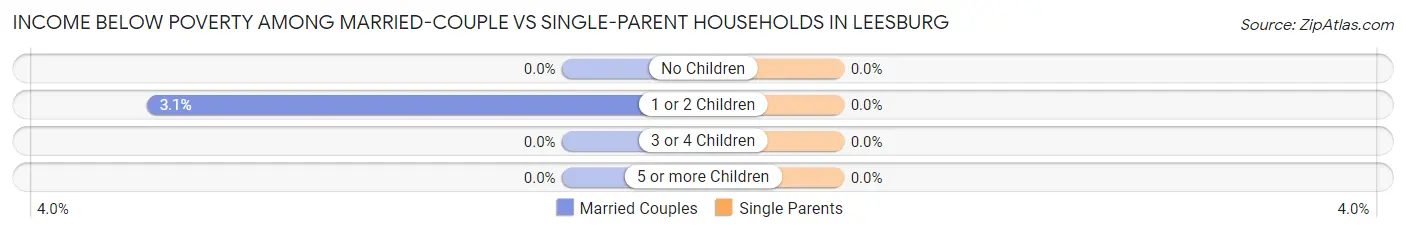
| Children | Married-Couple Families | Single-Parent Households |
| No Children | 0 (0.0%) | 0 (0.0%) |
| 1 or 2 Children | 3 (3.1%) | 0 (0.0%) |
| 3 or 4 Children | 0 (0.0%) | 0 (0.0%) |
| 5 or more Children | 0 (0.0%) | 0 (0.0%) |
| Total | 3 (1.6%) | 0 (0.0%) |
Race in Leesburg
The most populous races in Leesburg are White / Caucasian (805 | 85.5%), Two or more Races (92 | 9.8%), and Hispanic or Latino (87 | 9.2%).
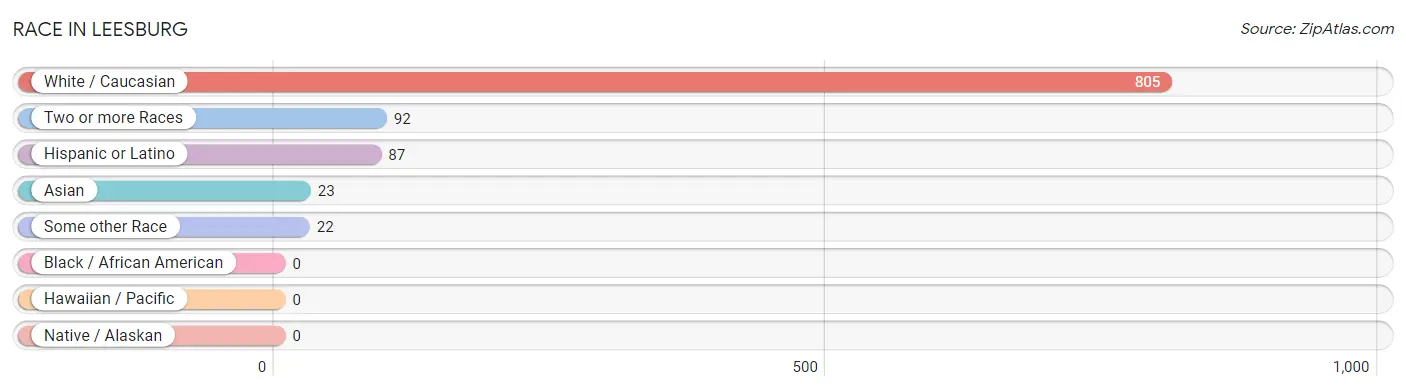
| Race | # Population | % Population |
| Asian | 23 | 2.4% |
| Black / African American | 0 | 0.0% |
| Hawaiian / Pacific | 0 | 0.0% |
| Hispanic or Latino | 87 | 9.2% |
| Native / Alaskan | 0 | 0.0% |
| White / Caucasian | 805 | 85.5% |
| Two or more Races | 92 | 9.8% |
| Some other Race | 22 | 2.3% |
| Total | 942 | 100.0% |
Ancestry in Leesburg
The most populous ancestries reported in Leesburg are German (241 | 25.6%), Irish (200 | 21.2%), Mexican (78 | 8.3%), English (70 | 7.4%), and Italian (58 | 6.2%), together accounting for 68.7% of all Leesburg residents.
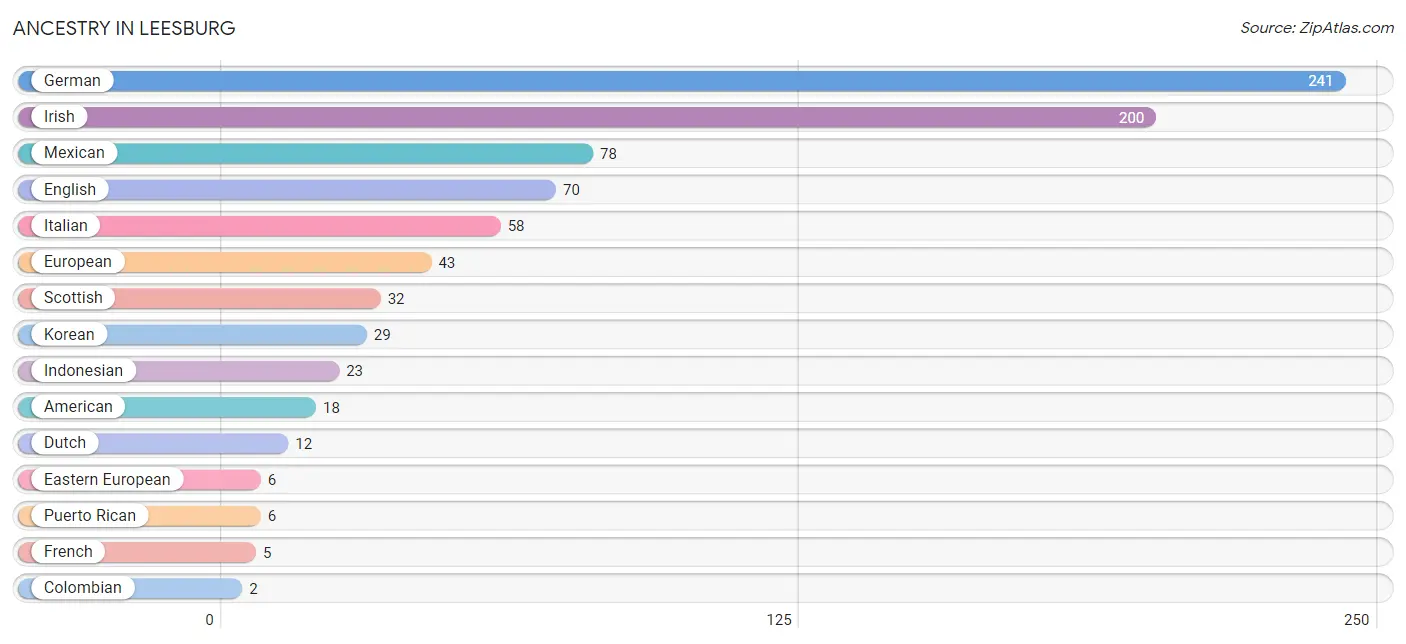
| Ancestry | # Population | % Population |
| American | 18 | 1.9% |
| Central American | 1 | 0.1% |
| Colombian | 2 | 0.2% |
| Dutch | 12 | 1.3% |
| Eastern European | 6 | 0.6% |
| English | 70 | 7.4% |
| European | 43 | 4.6% |
| French | 5 | 0.5% |
| German | 241 | 25.6% |
| Indonesian | 23 | 2.4% |
| Irish | 200 | 21.2% |
| Italian | 58 | 6.2% |
| Korean | 29 | 3.1% |
| Mexican | 78 | 8.3% |
| Pennsylvania German | 1 | 0.1% |
| Puerto Rican | 6 | 0.6% |
| Salvadoran | 1 | 0.1% |
| Scottish | 32 | 3.4% |
| South American | 2 | 0.2% | View All 19 Rows |
Immigrants in Leesburg
The most numerous immigrant groups reported in Leesburg came from Latin America (40 | 4.3%), Central America (38 | 4.0%), Mexico (37 | 3.9%), Asia (23 | 2.4%), and South Eastern Asia (23 | 2.4%), together accounting for 17.1% of all Leesburg residents.
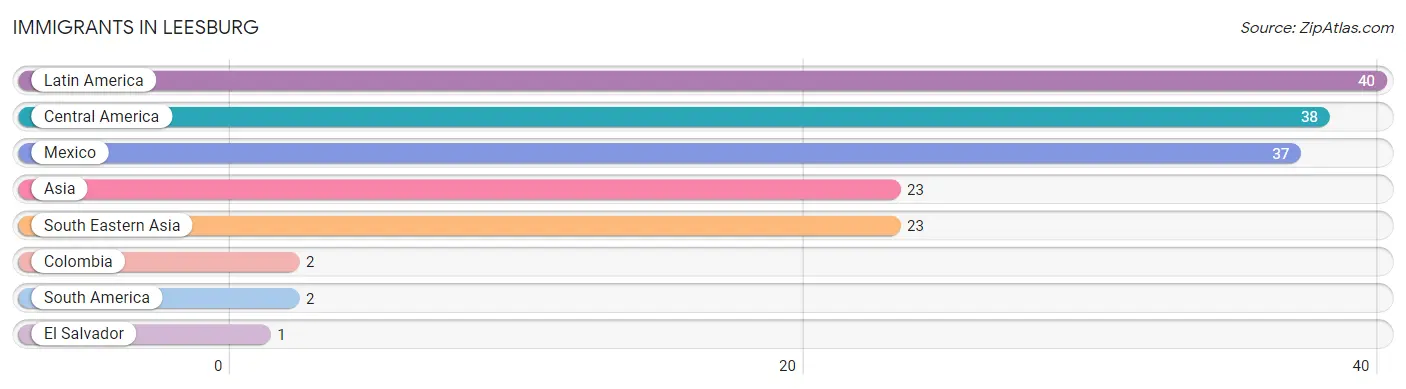
| Immigration Origin | # Population | % Population |
| Asia | 23 | 2.4% |
| Central America | 38 | 4.0% |
| Colombia | 2 | 0.2% |
| El Salvador | 1 | 0.1% |
| Latin America | 40 | 4.3% |
| Mexico | 37 | 3.9% |
| South America | 2 | 0.2% |
| South Eastern Asia | 23 | 2.4% | View All 8 Rows |
Sex and Age in Leesburg
Sex and Age in Leesburg
The most populous age groups in Leesburg are Under 5 Years (88 | 17.8%) for men and 5 to 9 Years (81 | 18.1%) for women.
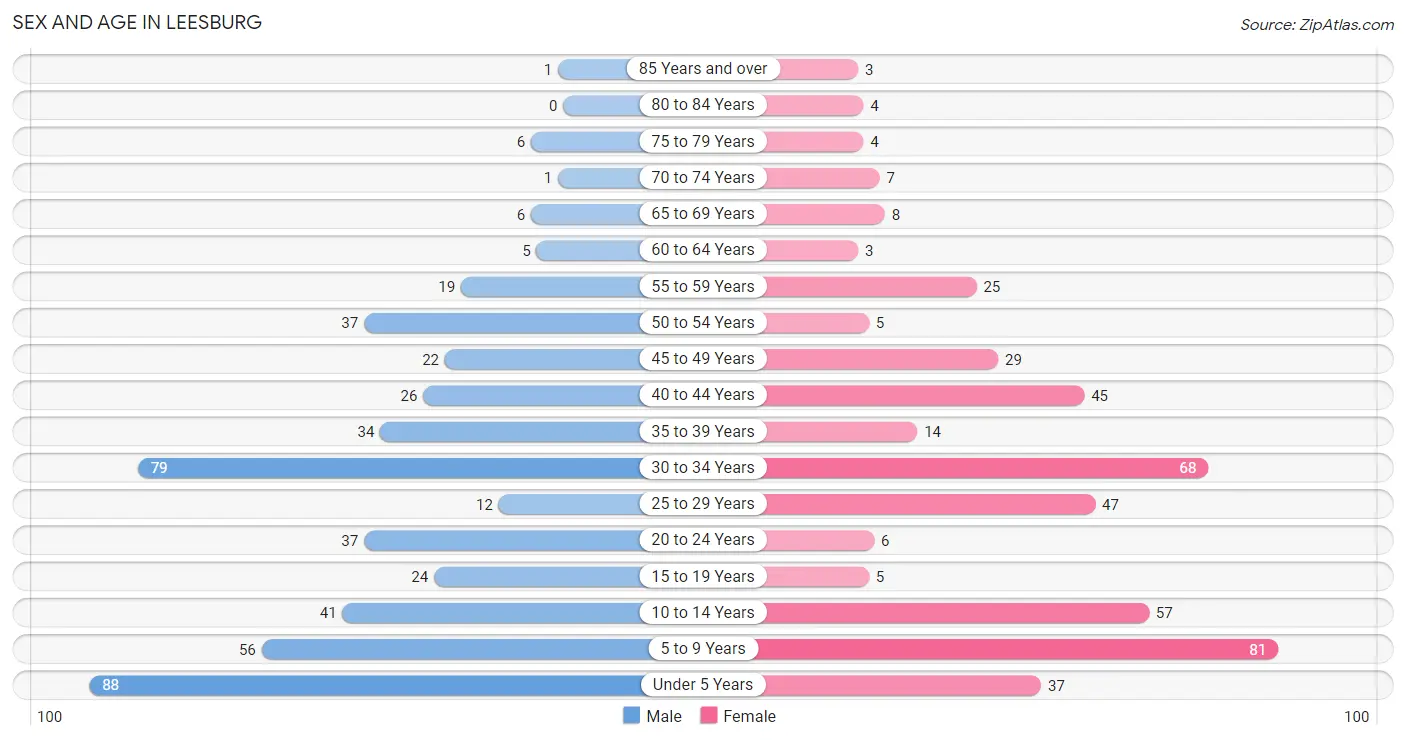
| Age Bracket | Male | Female |
| Under 5 Years | 88 (17.8%) | 37 (8.3%) |
| 5 to 9 Years | 56 (11.3%) | 81 (18.1%) |
| 10 to 14 Years | 41 (8.3%) | 57 (12.7%) |
| 15 to 19 Years | 24 (4.9%) | 5 (1.1%) |
| 20 to 24 Years | 37 (7.5%) | 6 (1.3%) |
| 25 to 29 Years | 12 (2.4%) | 47 (10.5%) |
| 30 to 34 Years | 79 (16.0%) | 68 (15.2%) |
| 35 to 39 Years | 34 (6.9%) | 14 (3.1%) |
| 40 to 44 Years | 26 (5.3%) | 45 (10.0%) |
| 45 to 49 Years | 22 (4.4%) | 29 (6.5%) |
| 50 to 54 Years | 37 (7.5%) | 5 (1.1%) |
| 55 to 59 Years | 19 (3.8%) | 25 (5.6%) |
| 60 to 64 Years | 5 (1.0%) | 3 (0.7%) |
| 65 to 69 Years | 6 (1.2%) | 8 (1.8%) |
| 70 to 74 Years | 1 (0.2%) | 7 (1.6%) |
| 75 to 79 Years | 6 (1.2%) | 4 (0.9%) |
| 80 to 84 Years | 0 (0.0%) | 4 (0.9%) |
| 85 Years and over | 1 (0.2%) | 3 (0.7%) |
| Total | 494 (100.0%) | 448 (100.0%) |
Families and Households in Leesburg
Median Family Size in Leesburg
The median family size in Leesburg is 4.22 persons per family, with single male/father families (9 | 4.3%) accounting for the largest median family size of 8.67 persons per family. On the other hand, single female/mother families (12 | 5.8%) represent the smallest median family size with 3.75 persons per family.
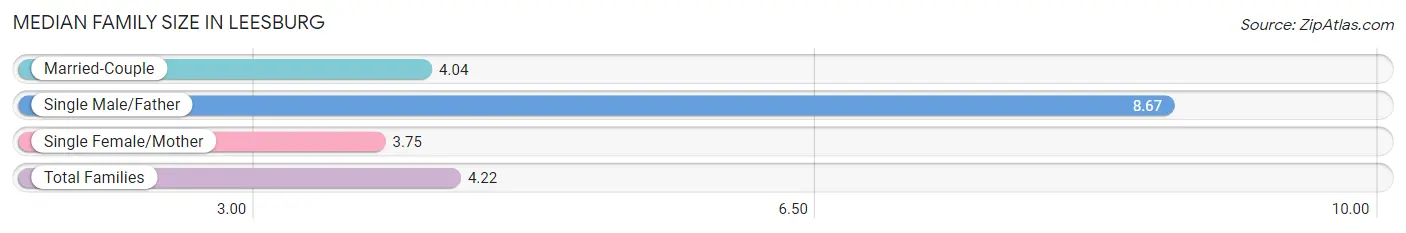
| Family Type | # Families | Family Size |
| Married-Couple | 186 (89.9%) | 4.04 |
| Single Male/Father | 9 (4.3%) | 8.67 |
| Single Female/Mother | 12 (5.8%) | 3.75 |
| Total Families | 207 (100.0%) | 4.22 |
Median Household Size in Leesburg
The median household size in Leesburg is 3.96 persons per household, with single male/father households (9 | 3.8%) accounting for the largest median household size of 8.67 persons per household. non-family households (31 | 13.0%) represent the smallest median household size with 1.42 persons per household.
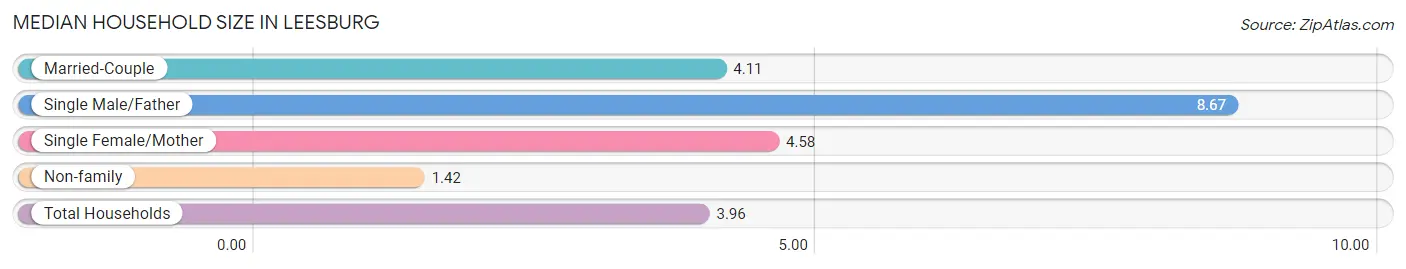
| Household Type | # Households | Household Size |
| Married-Couple | 186 (78.1%) | 4.11 |
| Single Male/Father | 9 (3.8%) | 8.67 |
| Single Female/Mother | 12 (5.0%) | 4.58 |
| Non-family | 31 (13.0%) | 1.42 |
| Total Households | 238 (100.0%) | 3.96 |
Household Size by Marriage Status in Leesburg
Out of a total of 238 households in Leesburg, 207 (87.0%) are family households, while 31 (13.0%) are nonfamily households. The most numerous type of family households are 4-person households, comprising 67, and the most common type of nonfamily households are 1-person households, comprising 27.
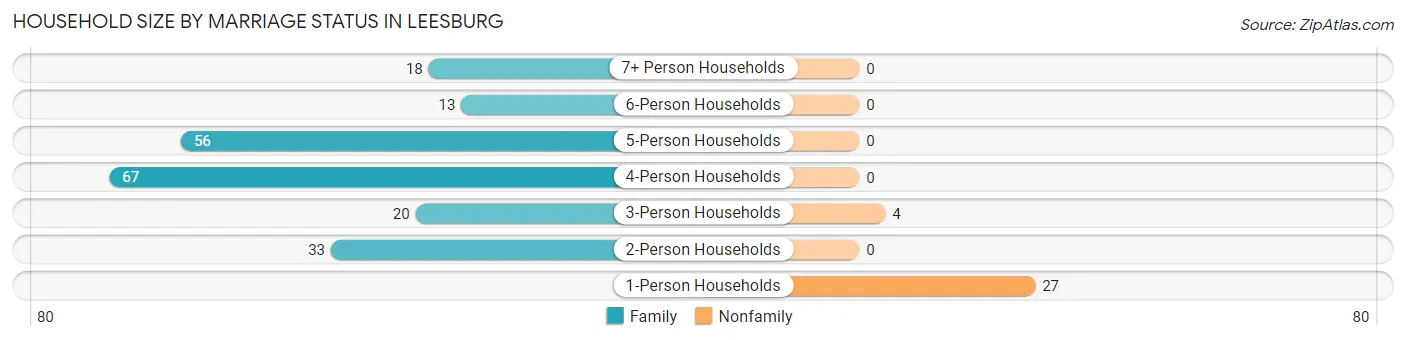
| Household Size | Family Households | Nonfamily Households |
| 1-Person Households | - | 27 (11.3%) |
| 2-Person Households | 33 (13.9%) | 0 (0.0%) |
| 3-Person Households | 20 (8.4%) | 4 (1.7%) |
| 4-Person Households | 67 (28.1%) | 0 (0.0%) |
| 5-Person Households | 56 (23.5%) | 0 (0.0%) |
| 6-Person Households | 13 (5.5%) | 0 (0.0%) |
| 7+ Person Households | 18 (7.6%) | 0 (0.0%) |
| Total | 207 (87.0%) | 31 (13.0%) |
Female Fertility in Leesburg
Fertility by Age in Leesburg
Average fertility rate in Leesburg is 55.0 births per 1,000 women. Women in the age bracket of 20 to 34 years have the highest fertility rate with 99.0 births per 1,000 women. Women in the age bracket of 20 to 34 years acount for 100.0% of all women with births.
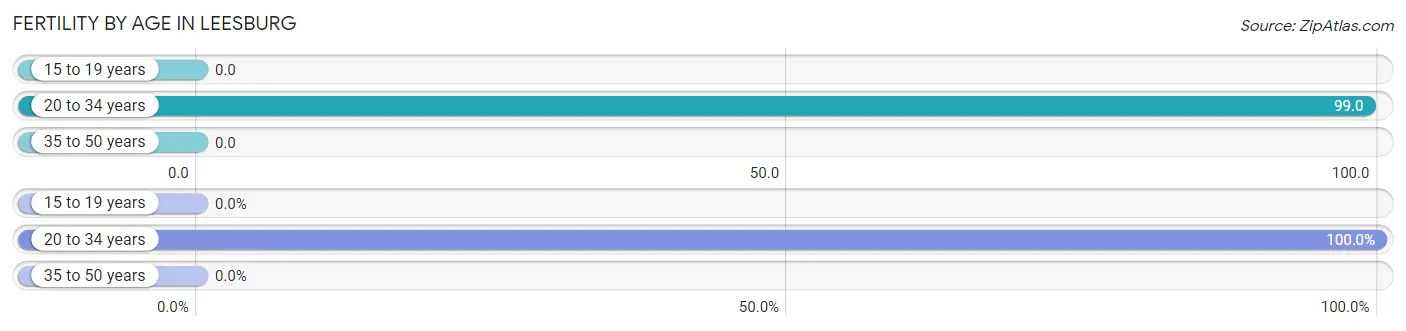
| Age Bracket | Women with Births | Births / 1,000 Women |
| 15 to 19 years | 0 (0.0%) | 0.0 |
| 20 to 34 years | 12 (100.0%) | 99.0 |
| 35 to 50 years | 0 (0.0%) | 0.0 |
| Total | 12 (100.0%) | 55.0 |
Fertility by Age by Marriage Status in Leesburg
91.7% of women with births (12) in Leesburg are married. The highest percentage of unmarried women with births falls into 20 to 34 years age bracket with 8.3% of them unmarried at the time of birth, while the lowest percentage of unmarried women with births belong to 20 to 34 years age bracket with 8.3% of them unmarried.
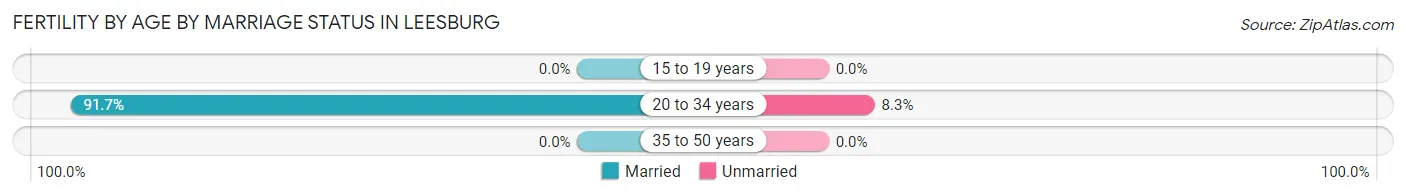
| Age Bracket | Married | Unmarried |
| 15 to 19 years | 0 (0.0%) | 0 (0.0%) |
| 20 to 34 years | 11 (91.7%) | 1 (8.3%) |
| 35 to 50 years | 0 (0.0%) | 0 (0.0%) |
| Total | 11 (91.7%) | 1 (8.3%) |
Fertility by Education in Leesburg
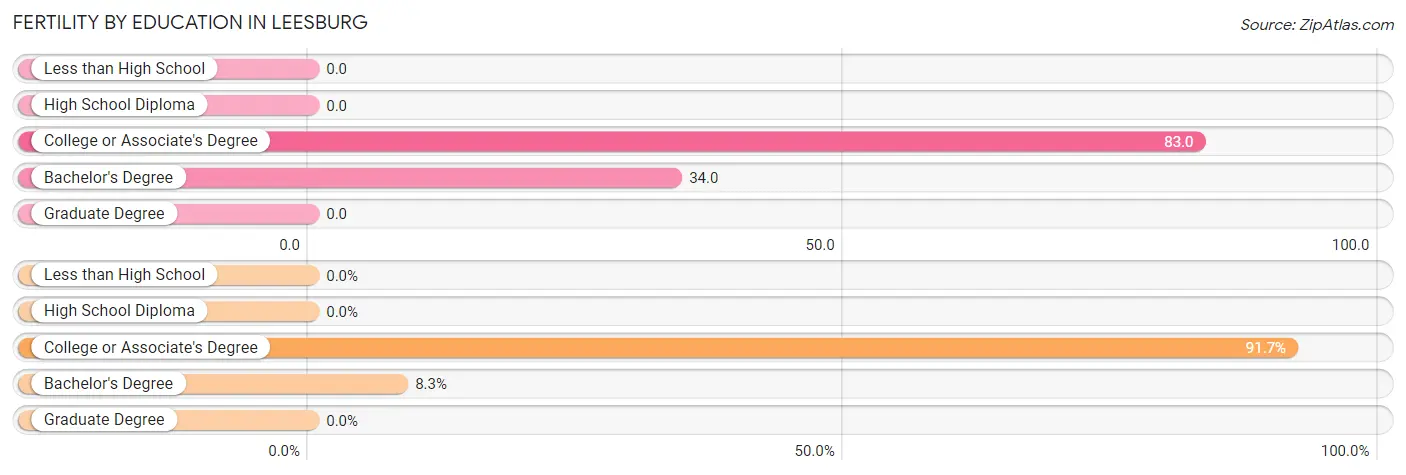
| Educational Attainment | Women with Births | Births / 1,000 Women |
| Less than High School | 0 (0.0%) | 0.0 |
| High School Diploma | 0 (0.0%) | 0.0 |
| College or Associate's Degree | 11 (91.7%) | 83.0 |
| Bachelor's Degree | 1 (8.3%) | 34.0 |
| Graduate Degree | 0 (0.0%) | 0.0 |
| Total | 12 (100.0%) | 55.0 |
Fertility by Education by Marriage Status in Leesburg
8.3% of women with births in Leesburg are unmarried. Women with the educational attainment of college or associate's degree are most likely to be married with 100.0% of them married at childbirth, while women with the educational attainment of bachelor's degree are least likely to be married with 100.0% of them unmarried at childbirth.
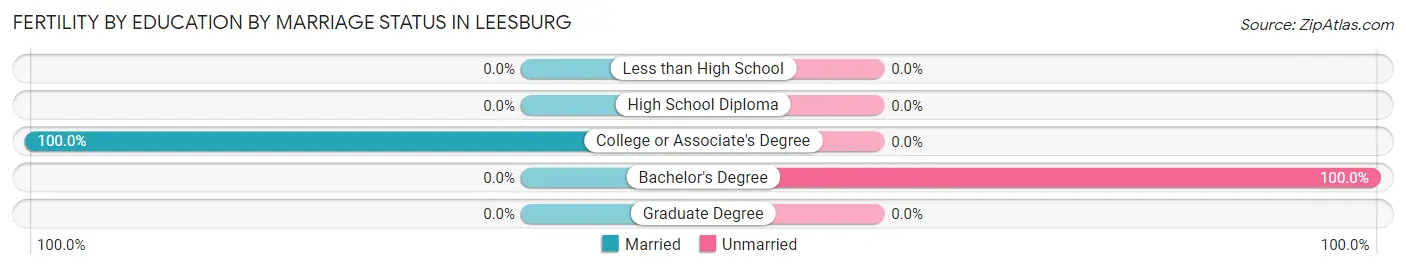
| Educational Attainment | Married | Unmarried |
| Less than High School | 0 (0.0%) | 0 (0.0%) |
| High School Diploma | 0 (0.0%) | 0 (0.0%) |
| College or Associate's Degree | 11 (100.0%) | 0 (0.0%) |
| Bachelor's Degree | 0 (0.0%) | 1 (100.0%) |
| Graduate Degree | 0 (0.0%) | 0 (0.0%) |
| Total | 11 (91.7%) | 1 (8.3%) |
Employment Characteristics in Leesburg
Employment by Class of Employer in Leesburg
Among the 391 employed individuals in Leesburg, private company employees (305 | 78.0%), local government employees (29 | 7.4%), and self-employed (not incorporated) (27 | 6.9%) make up the most common classes of employment.
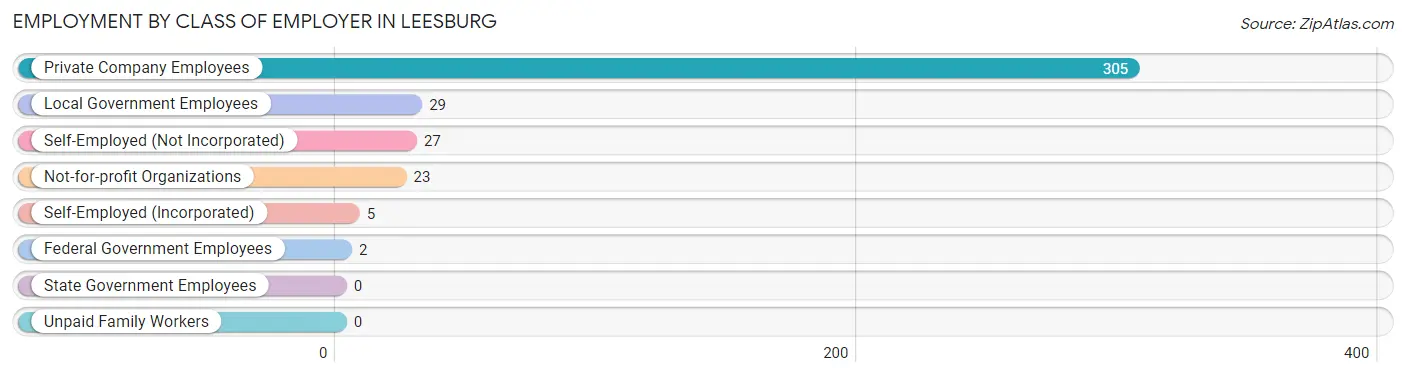
| Employer Class | # Employees | % Employees |
| Private Company Employees | 305 | 78.0% |
| Self-Employed (Incorporated) | 5 | 1.3% |
| Self-Employed (Not Incorporated) | 27 | 6.9% |
| Not-for-profit Organizations | 23 | 5.9% |
| Local Government Employees | 29 | 7.4% |
| State Government Employees | 0 | 0.0% |
| Federal Government Employees | 2 | 0.5% |
| Unpaid Family Workers | 0 | 0.0% |
| Total | 391 | 100.0% |
Employment Status by Age in Leesburg
According to the labor force statistics for Leesburg, out of the total population over 16 years of age (573), 73.6% or 422 individuals are in the labor force, with 2.1% or 9 of them unemployed. The age group with the highest labor force participation rate is 20 to 24 years, with 100.0% or 43 individuals in the labor force. Within the labor force, the 20 to 24 years age range has the highest percentage of unemployed individuals, with 7.0% or 3 of them being unemployed.
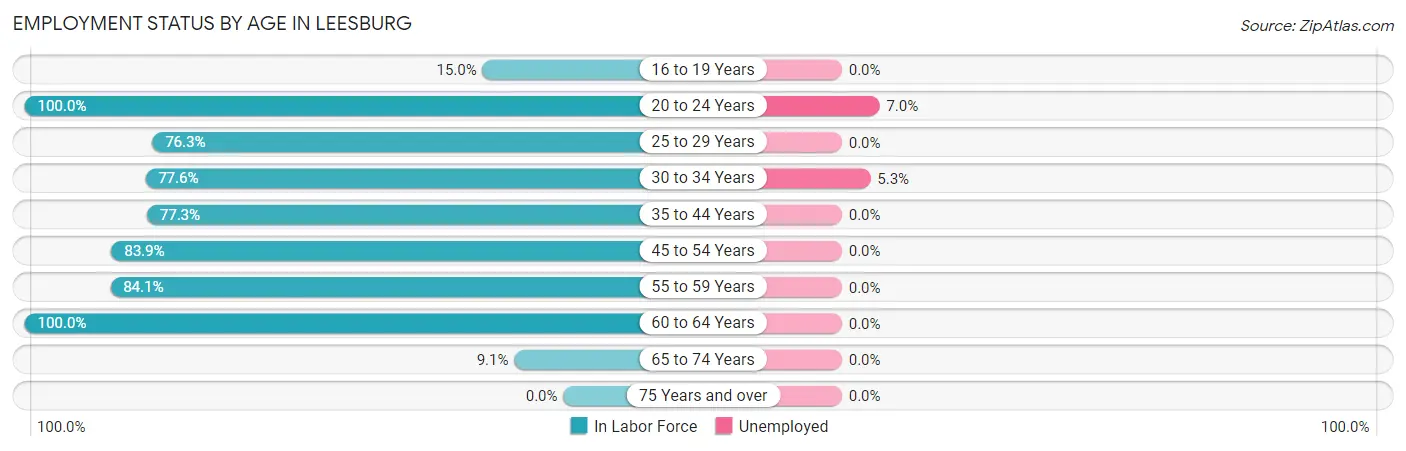
| Age Bracket | In Labor Force | Unemployed |
| 16 to 19 Years | 3 (15.0%) | 0 (0.0%) |
| 20 to 24 Years | 43 (100.0%) | 3 (7.0%) |
| 25 to 29 Years | 45 (76.3%) | 0 (0.0%) |
| 30 to 34 Years | 114 (77.6%) | 6 (5.3%) |
| 35 to 44 Years | 92 (77.3%) | 0 (0.0%) |
| 45 to 54 Years | 78 (83.9%) | 0 (0.0%) |
| 55 to 59 Years | 37 (84.1%) | 0 (0.0%) |
| 60 to 64 Years | 8 (100.0%) | 0 (0.0%) |
| 65 to 74 Years | 2 (9.1%) | 0 (0.0%) |
| 75 Years and over | 0 (0.0%) | 0 (0.0%) |
| Total | 422 (73.6%) | 9 (2.1%) |
Employment Status by Educational Attainment in Leesburg
According to labor force statistics for Leesburg, 79.6% of individuals (374) out of the total population between 25 and 64 years of age (470) are in the labor force, with 1.6% or 6 of them being unemployed. The group with the highest labor force participation rate are those with the educational attainment of college / associate degree, with 83.8% or 166 individuals in the labor force. Within the labor force, individuals with bachelor's degree or higher education have the highest percentage of unemployment, with 12.0% or 6 of them being unemployed.
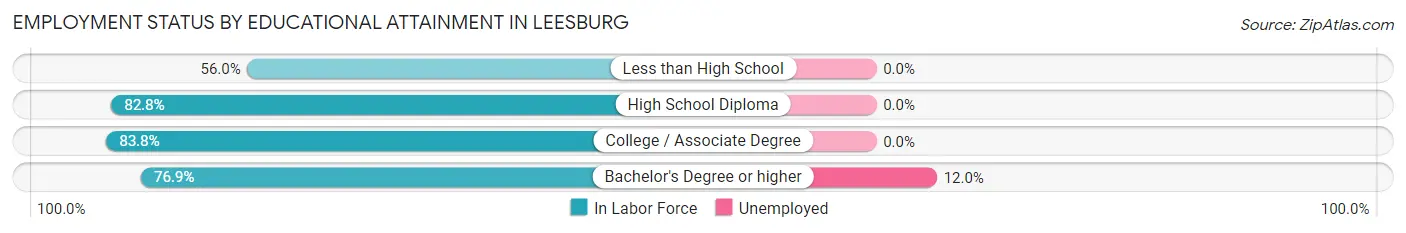
| Educational Attainment | In Labor Force | Unemployed |
| Less than High School | 28 (56.0%) | 0 (0.0%) |
| High School Diploma | 130 (82.8%) | 0 (0.0%) |
| College / Associate Degree | 166 (83.8%) | 0 (0.0%) |
| Bachelor's Degree or higher | 50 (76.9%) | 8 (12.0%) |
| Total | 374 (79.6%) | 8 (1.6%) |
Employment Occupations by Sex in Leesburg
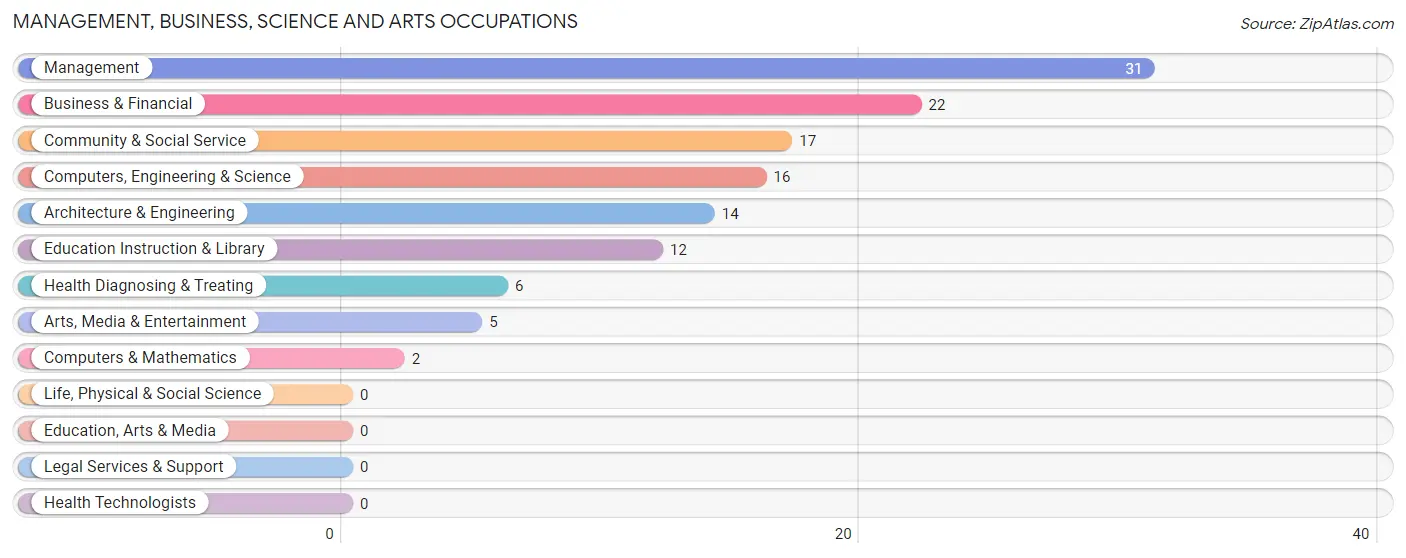
Management, Business, Science and Arts Occupations
The most common Management, Business, Science and Arts occupations in Leesburg are Management (31 | 7.5%), Business & Financial (22 | 5.3%), Community & Social Service (17 | 4.1%), Computers, Engineering & Science (16 | 3.9%), and Architecture & Engineering (14 | 3.4%).
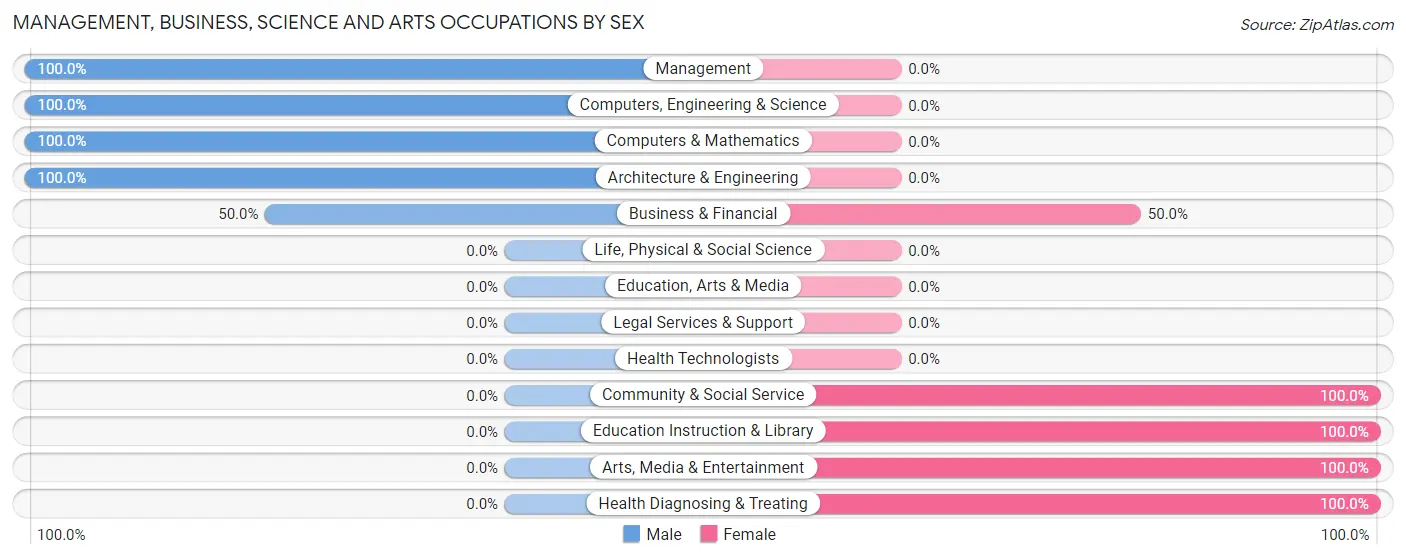
Management, Business, Science and Arts Occupations by Sex
Within the Management, Business, Science and Arts occupations in Leesburg, the most male-oriented occupations are Management (100.0%), Computers, Engineering & Science (100.0%), and Computers & Mathematics (100.0%), while the most female-oriented occupations are Community & Social Service (100.0%), Education Instruction & Library (100.0%), and Arts, Media & Entertainment (100.0%).
| Occupation | Male | Female |
| Management | 31 (100.0%) | 0 (0.0%) |
| Business & Financial | 11 (50.0%) | 11 (50.0%) |
| Computers, Engineering & Science | 16 (100.0%) | 0 (0.0%) |
| Computers & Mathematics | 2 (100.0%) | 0 (0.0%) |
| Architecture & Engineering | 14 (100.0%) | 0 (0.0%) |
| Life, Physical & Social Science | 0 (0.0%) | 0 (0.0%) |
| Community & Social Service | 0 (0.0%) | 17 (100.0%) |
| Education, Arts & Media | 0 (0.0%) | 0 (0.0%) |
| Legal Services & Support | 0 (0.0%) | 0 (0.0%) |
| Education Instruction & Library | 0 (0.0%) | 12 (100.0%) |
| Arts, Media & Entertainment | 0 (0.0%) | 5 (100.0%) |
| Health Diagnosing & Treating | 0 (0.0%) | 6 (100.0%) |
| Health Technologists | 0 (0.0%) | 0 (0.0%) |
| Total (Category) | 58 (63.0%) | 34 (37.0%) |
| Total (Overall) | 254 (61.5%) | 159 (38.5%) |
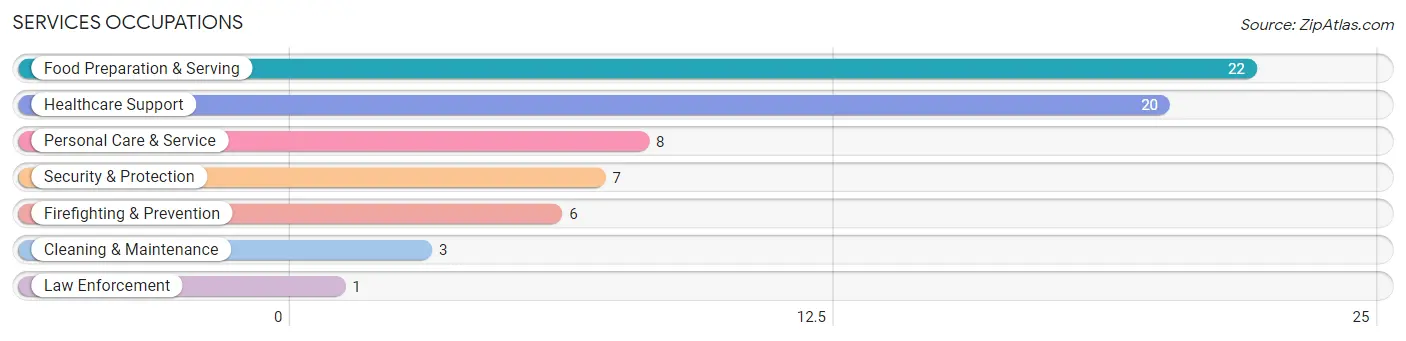
Services Occupations
The most common Services occupations in Leesburg are Food Preparation & Serving (22 | 5.3%), Healthcare Support (20 | 4.8%), Personal Care & Service (8 | 1.9%), Security & Protection (7 | 1.7%), and Firefighting & Prevention (6 | 1.5%).
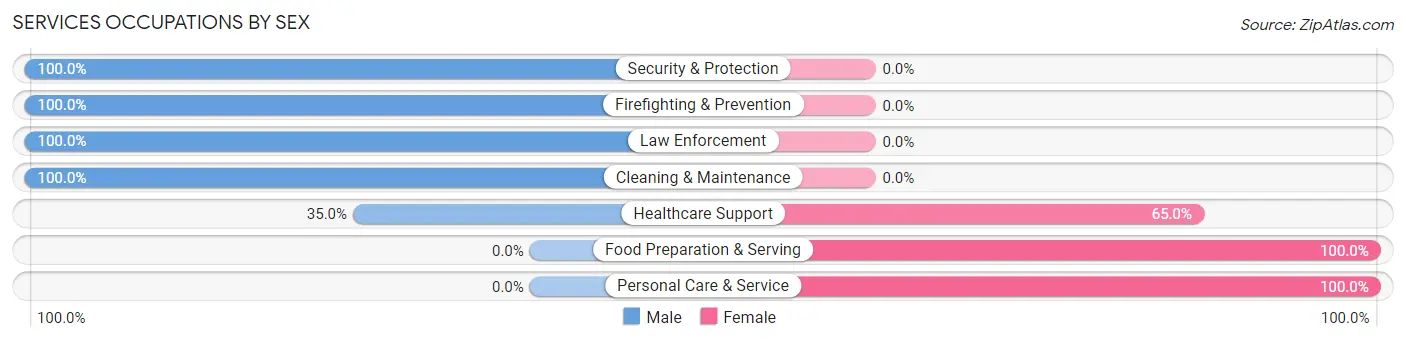
Services Occupations by Sex
Within the Services occupations in Leesburg, the most male-oriented occupations are Security & Protection (100.0%), Firefighting & Prevention (100.0%), and Law Enforcement (100.0%), while the most female-oriented occupations are Food Preparation & Serving (100.0%), Personal Care & Service (100.0%), and Healthcare Support (65.0%).
| Occupation | Male | Female |
| Healthcare Support | 7 (35.0%) | 13 (65.0%) |
| Security & Protection | 7 (100.0%) | 0 (0.0%) |
| Firefighting & Prevention | 6 (100.0%) | 0 (0.0%) |
| Law Enforcement | 1 (100.0%) | 0 (0.0%) |
| Food Preparation & Serving | 0 (0.0%) | 22 (100.0%) |
| Cleaning & Maintenance | 3 (100.0%) | 0 (0.0%) |
| Personal Care & Service | 0 (0.0%) | 8 (100.0%) |
| Total (Category) | 17 (28.3%) | 43 (71.7%) |
| Total (Overall) | 254 (61.5%) | 159 (38.5%) |
Sales and Office Occupations
The most common Sales and Office occupations in Leesburg are Office & Administration (45 | 10.9%), and Sales & Related (14 | 3.4%).

Sales and Office Occupations by Sex

| Occupation | Male | Female |
| Sales & Related | 7 (50.0%) | 7 (50.0%) |
| Office & Administration | 0 (0.0%) | 45 (100.0%) |
| Total (Category) | 7 (11.9%) | 52 (88.1%) |
| Total (Overall) | 254 (61.5%) | 159 (38.5%) |
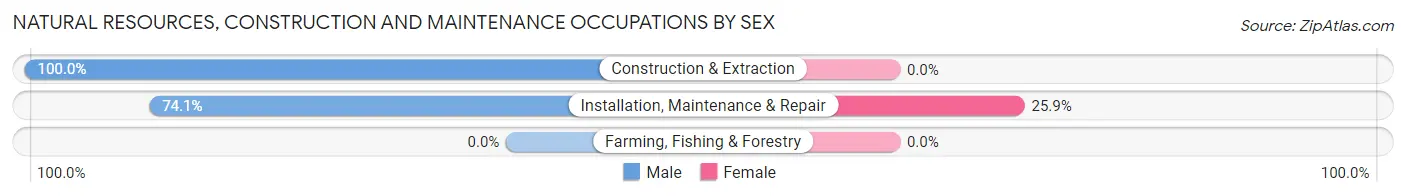
Natural Resources, Construction and Maintenance Occupations
The most common Natural Resources, Construction and Maintenance occupations in Leesburg are Installation, Maintenance & Repair (54 | 13.1%), and Construction & Extraction (31 | 7.5%).

Natural Resources, Construction and Maintenance Occupations by Sex
| Occupation | Male | Female |
| Farming, Fishing & Forestry | 0 (0.0%) | 0 (0.0%) |
| Construction & Extraction | 31 (100.0%) | 0 (0.0%) |
| Installation, Maintenance & Repair | 40 (74.1%) | 14 (25.9%) |
| Total (Category) | 71 (83.5%) | 14 (16.5%) |
| Total (Overall) | 254 (61.5%) | 159 (38.5%) |
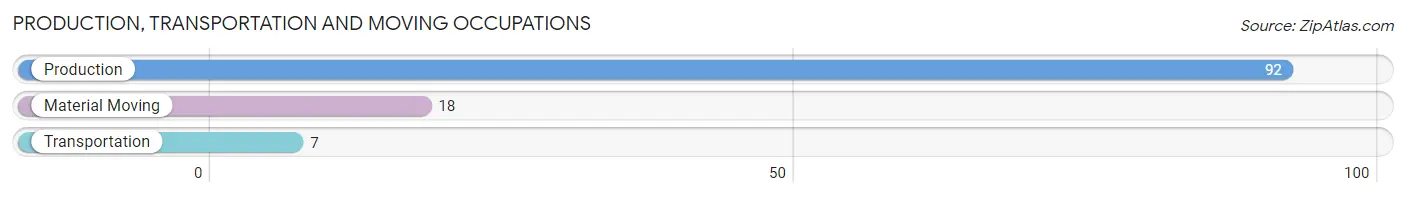
Production, Transportation and Moving Occupations
The most common Production, Transportation and Moving occupations in Leesburg are Production (92 | 22.3%), Material Moving (18 | 4.4%), and Transportation (7 | 1.7%).
Production, Transportation and Moving Occupations by Sex
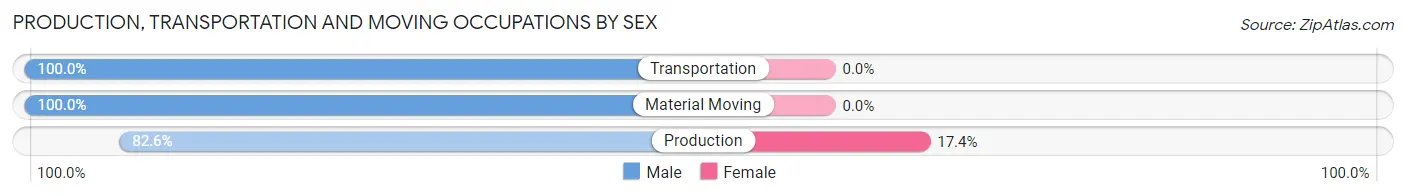
| Occupation | Male | Female |
| Production | 76 (82.6%) | 16 (17.4%) |
| Transportation | 7 (100.0%) | 0 (0.0%) |
| Material Moving | 18 (100.0%) | 0 (0.0%) |
| Total (Category) | 101 (86.3%) | 16 (13.7%) |
| Total (Overall) | 254 (61.5%) | 159 (38.5%) |
Employment Industries by Sex in Leesburg
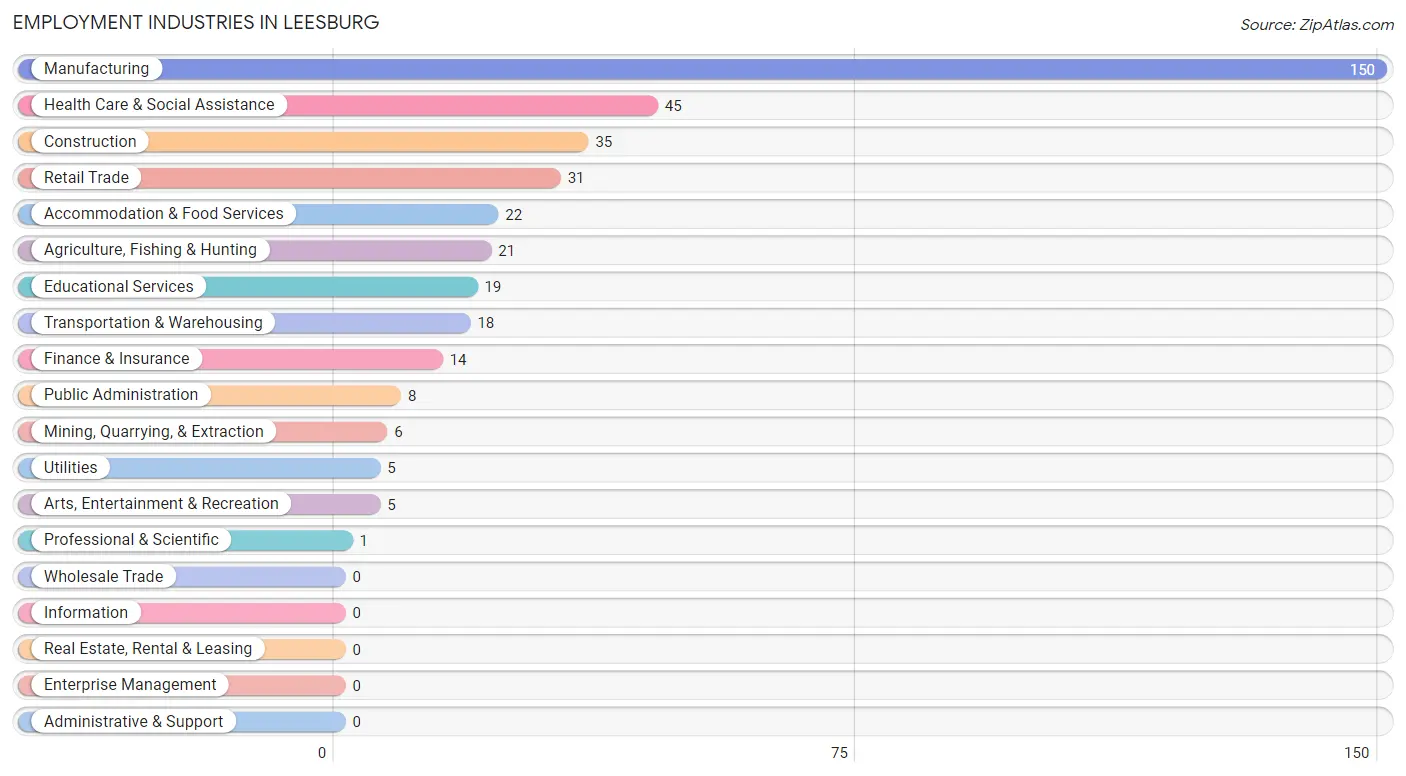
Employment Industries in Leesburg
The major employment industries in Leesburg include Manufacturing (150 | 36.3%), Health Care & Social Assistance (45 | 10.9%), Construction (35 | 8.5%), Retail Trade (31 | 7.5%), and Accommodation & Food Services (22 | 5.3%).
Employment Industries by Sex in Leesburg
The Leesburg industries that see more men than women are Mining, Quarrying, & Extraction (100.0%), Construction (100.0%), and Utilities (100.0%), whereas the industries that tend to have a higher number of women are Finance & Insurance (100.0%), Professional & Scientific (100.0%), and Arts, Entertainment & Recreation (100.0%).
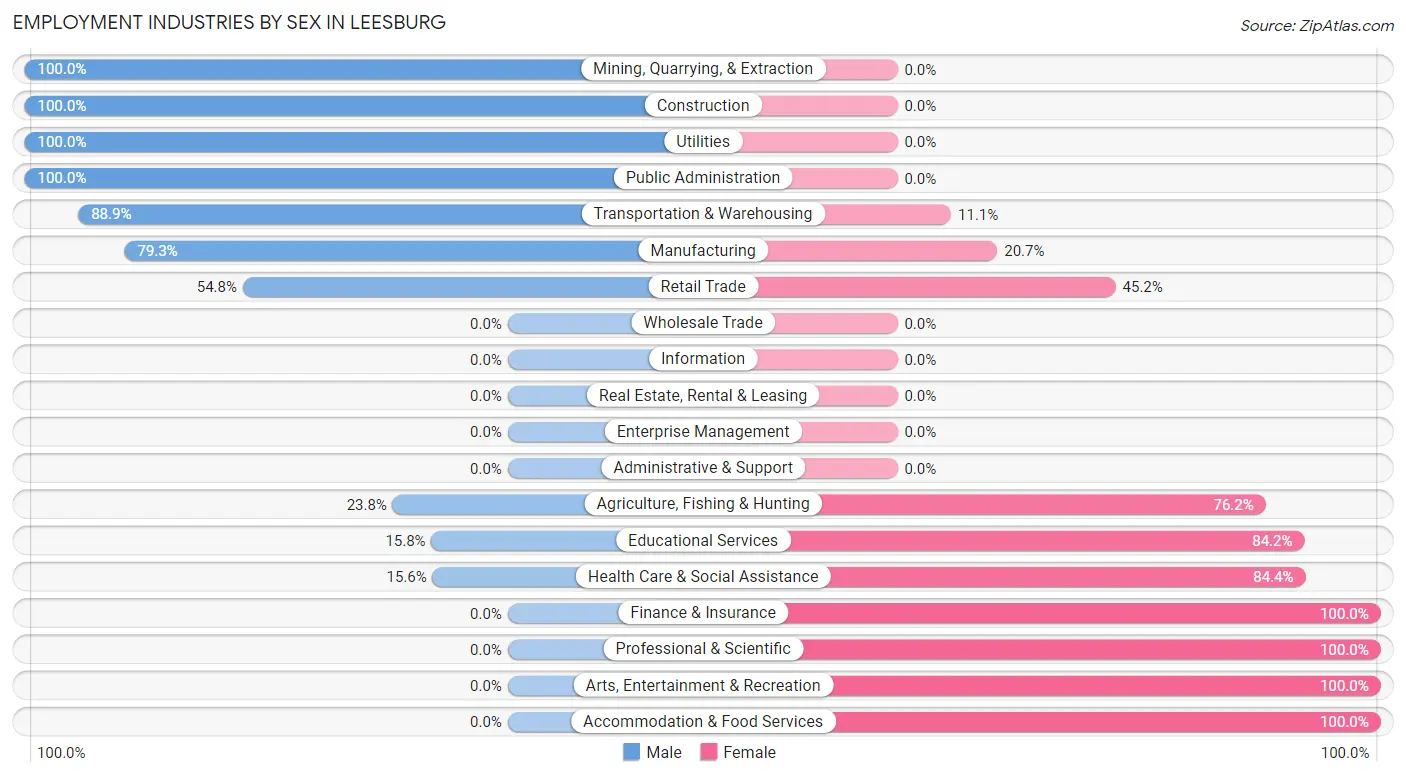
| Industry | Male | Female |
| Agriculture, Fishing & Hunting | 5 (23.8%) | 16 (76.2%) |
| Mining, Quarrying, & Extraction | 6 (100.0%) | 0 (0.0%) |
| Construction | 35 (100.0%) | 0 (0.0%) |
| Manufacturing | 119 (79.3%) | 31 (20.7%) |
| Wholesale Trade | 0 (0.0%) | 0 (0.0%) |
| Retail Trade | 17 (54.8%) | 14 (45.2%) |
| Transportation & Warehousing | 16 (88.9%) | 2 (11.1%) |
| Utilities | 5 (100.0%) | 0 (0.0%) |
| Information | 0 (0.0%) | 0 (0.0%) |
| Finance & Insurance | 0 (0.0%) | 14 (100.0%) |
| Real Estate, Rental & Leasing | 0 (0.0%) | 0 (0.0%) |
| Professional & Scientific | 0 (0.0%) | 1 (100.0%) |
| Enterprise Management | 0 (0.0%) | 0 (0.0%) |
| Administrative & Support | 0 (0.0%) | 0 (0.0%) |
| Educational Services | 3 (15.8%) | 16 (84.2%) |
| Health Care & Social Assistance | 7 (15.6%) | 38 (84.4%) |
| Arts, Entertainment & Recreation | 0 (0.0%) | 5 (100.0%) |
| Accommodation & Food Services | 0 (0.0%) | 22 (100.0%) |
| Public Administration | 8 (100.0%) | 0 (0.0%) |
| Total | 254 (61.5%) | 159 (38.5%) |
Education in Leesburg
School Enrollment in Leesburg
The most common levels of schooling among the 282 students in Leesburg are elementary school (125 | 44.3%), middle school (72 | 25.5%), and nursery / preschool (35 | 12.4%).
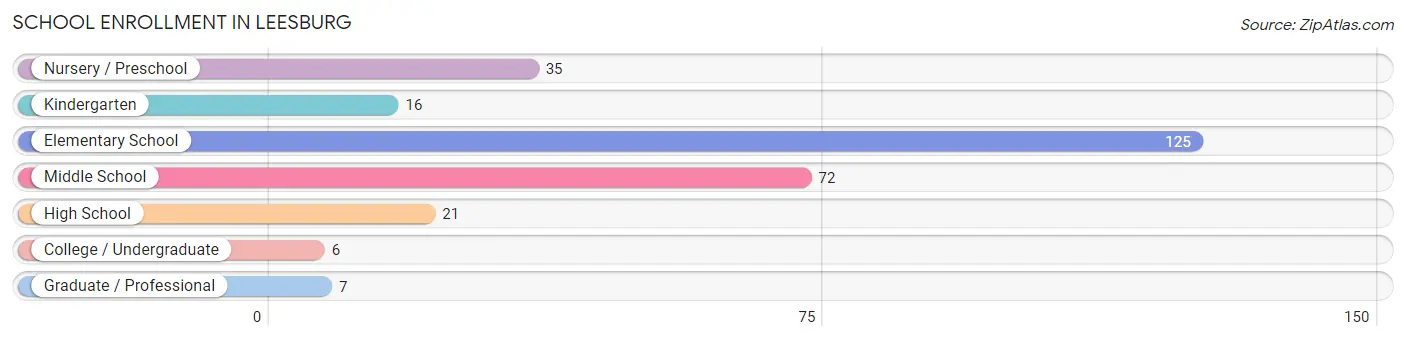
| School Level | # Students | % Students |
| Nursery / Preschool | 35 | 12.4% |
| Kindergarten | 16 | 5.7% |
| Elementary School | 125 | 44.3% |
| Middle School | 72 | 25.5% |
| High School | 21 | 7.4% |
| College / Undergraduate | 6 | 2.1% |
| Graduate / Professional | 7 | 2.5% |
| Total | 282 | 100.0% |
School Enrollment by Age by Funding Source in Leesburg
Out of a total of 282 students who are enrolled in schools in Leesburg, 16 (5.7%) attend a private institution, while the remaining 266 (94.3%) are enrolled in public schools. The age group of 20 to 24 year olds has the highest likelihood of being enrolled in private schools, with 6 (100.0% in the age bracket) enrolled. Conversely, the age group of 10 to 14 year olds has the lowest likelihood of being enrolled in a private school, with 98 (100.0% in the age bracket) attending a public institution.
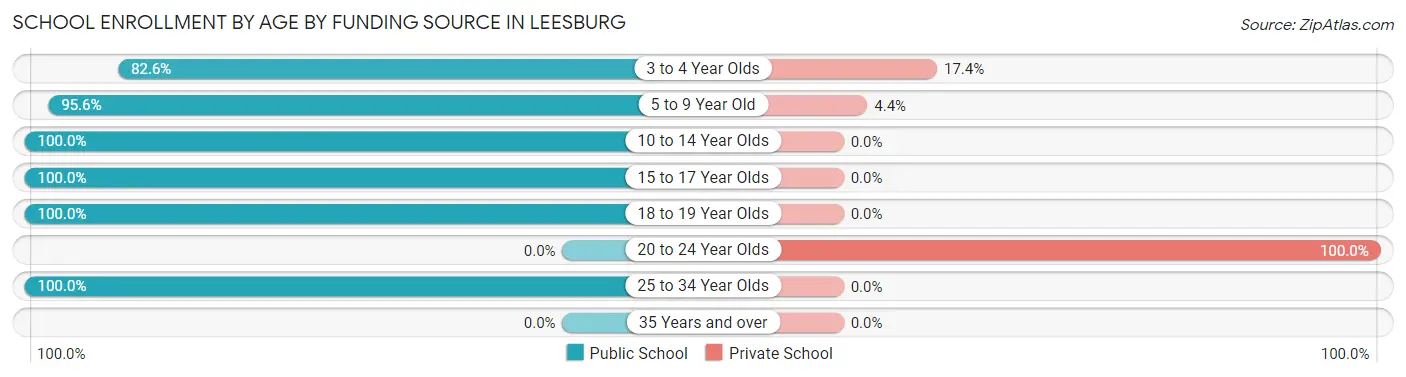
| Age Bracket | Public School | Private School |
| 3 to 4 Year Olds | 19 (82.6%) | 4 (17.4%) |
| 5 to 9 Year Old | 130 (95.6%) | 6 (4.4%) |
| 10 to 14 Year Olds | 98 (100.0%) | 0 (0.0%) |
| 15 to 17 Year Olds | 9 (100.0%) | 0 (0.0%) |
| 18 to 19 Year Olds | 3 (100.0%) | 0 (0.0%) |
| 20 to 24 Year Olds | 0 (0.0%) | 6 (100.0%) |
| 25 to 34 Year Olds | 7 (100.0%) | 0 (0.0%) |
| 35 Years and over | 0 (0.0%) | 0 (0.0%) |
| Total | 266 (94.3%) | 16 (5.7%) |
Educational Attainment by Field of Study in Leesburg
Business (17 | 18.9%), education (16 | 17.8%), arts & humanities (14 | 15.6%), liberal arts & history (12 | 13.3%), and psychology (10 | 11.1%) are the most common fields of study among 90 individuals in Leesburg who have obtained a bachelor's degree or higher.
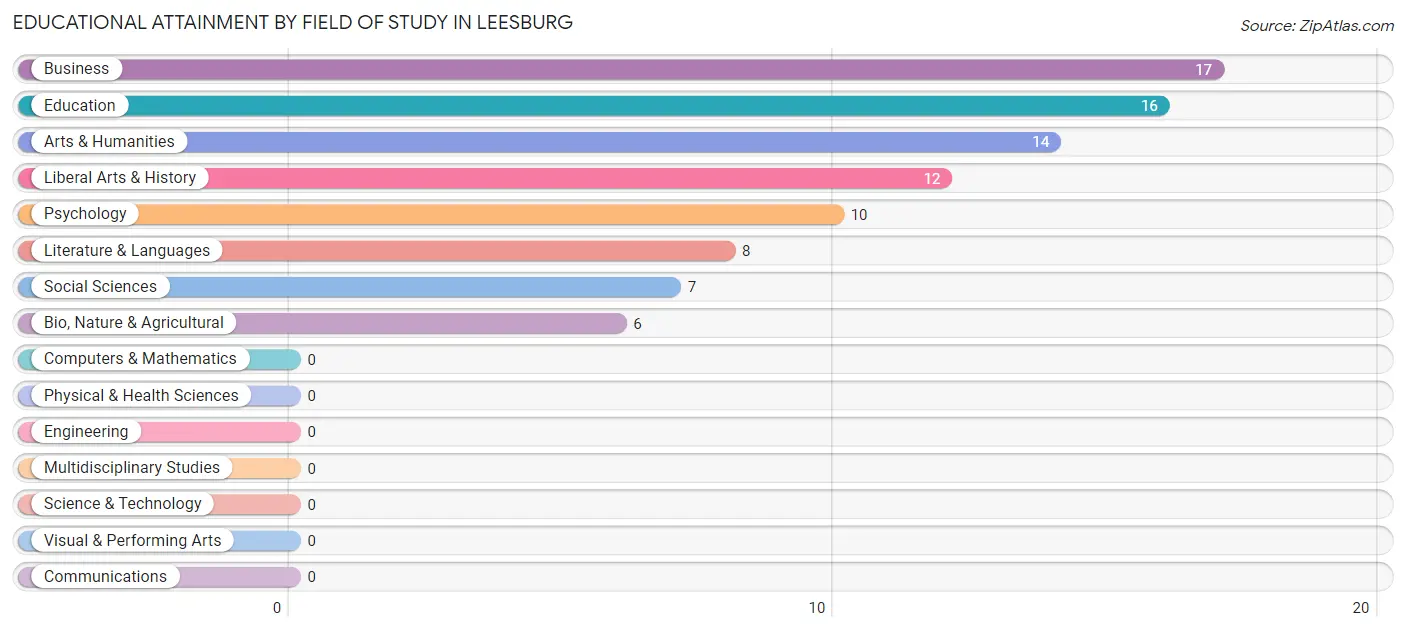
| Field of Study | # Graduates | % Graduates |
| Computers & Mathematics | 0 | 0.0% |
| Bio, Nature & Agricultural | 6 | 6.7% |
| Physical & Health Sciences | 0 | 0.0% |
| Psychology | 10 | 11.1% |
| Social Sciences | 7 | 7.8% |
| Engineering | 0 | 0.0% |
| Multidisciplinary Studies | 0 | 0.0% |
| Science & Technology | 0 | 0.0% |
| Business | 17 | 18.9% |
| Education | 16 | 17.8% |
| Literature & Languages | 8 | 8.9% |
| Liberal Arts & History | 12 | 13.3% |
| Visual & Performing Arts | 0 | 0.0% |
| Communications | 0 | 0.0% |
| Arts & Humanities | 14 | 15.6% |
| Total | 90 | 100.0% |
Transportation & Commute in Leesburg
Vehicle Availability by Sex in Leesburg
The most prevalent vehicle ownership categories in Leesburg are males with 2 vehicles (125, accounting for 49.2%) and females with 2 vehicles (52, making up 91.2%).
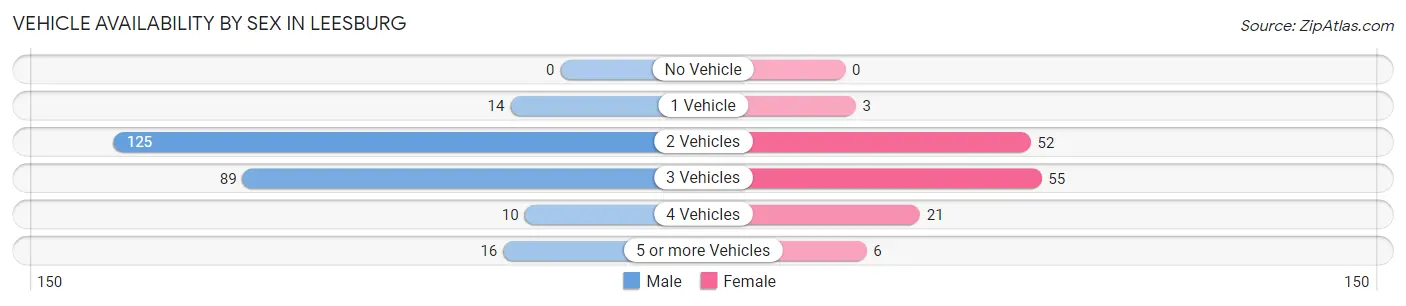
| Vehicles Available | Male | Female |
| No Vehicle | 0 (0.0%) | 0 (0.0%) |
| 1 Vehicle | 14 (5.5%) | 3 (2.2%) |
| 2 Vehicles | 125 (49.2%) | 52 (38.0%) |
| 3 Vehicles | 89 (35.0%) | 55 (40.2%) |
| 4 Vehicles | 10 (3.9%) | 21 (15.3%) |
| 5 or more Vehicles | 16 (6.3%) | 6 (4.4%) |
| Total | 254 (100.0%) | 137 (100.0%) |
Commute Time in Leesburg
The most frequently occuring commute durations in Leesburg are 15 to 19 minutes (68 commuters, 19.4%), 10 to 14 minutes (62 commuters, 17.7%), and 20 to 24 minutes (56 commuters, 16.0%).
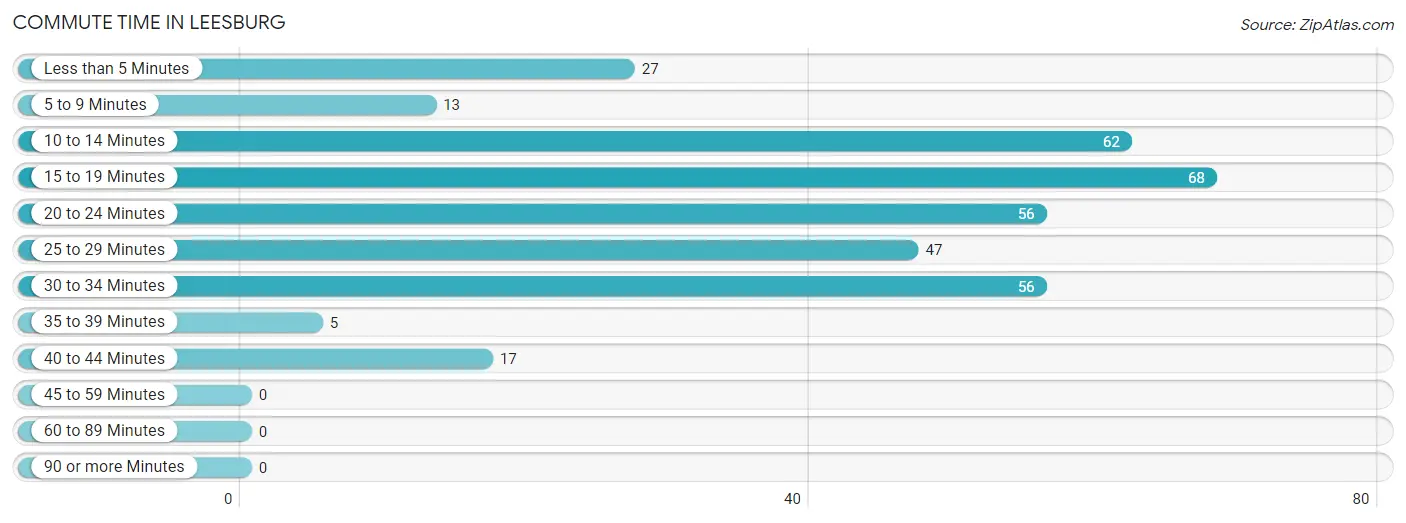
| Commute Time | # Commuters | % Commuters |
| Less than 5 Minutes | 27 | 7.7% |
| 5 to 9 Minutes | 13 | 3.7% |
| 10 to 14 Minutes | 62 | 17.7% |
| 15 to 19 Minutes | 68 | 19.4% |
| 20 to 24 Minutes | 56 | 16.0% |
| 25 to 29 Minutes | 47 | 13.4% |
| 30 to 34 Minutes | 56 | 16.0% |
| 35 to 39 Minutes | 5 | 1.4% |
| 40 to 44 Minutes | 17 | 4.8% |
| 45 to 59 Minutes | 0 | 0.0% |
| 60 to 89 Minutes | 0 | 0.0% |
| 90 or more Minutes | 0 | 0.0% |
Commute Time by Sex in Leesburg
The most common commute times in Leesburg are 25 to 29 minutes (47 commuters, 19.8%) for males and 15 to 19 minutes (31 commuters, 27.4%) for females.
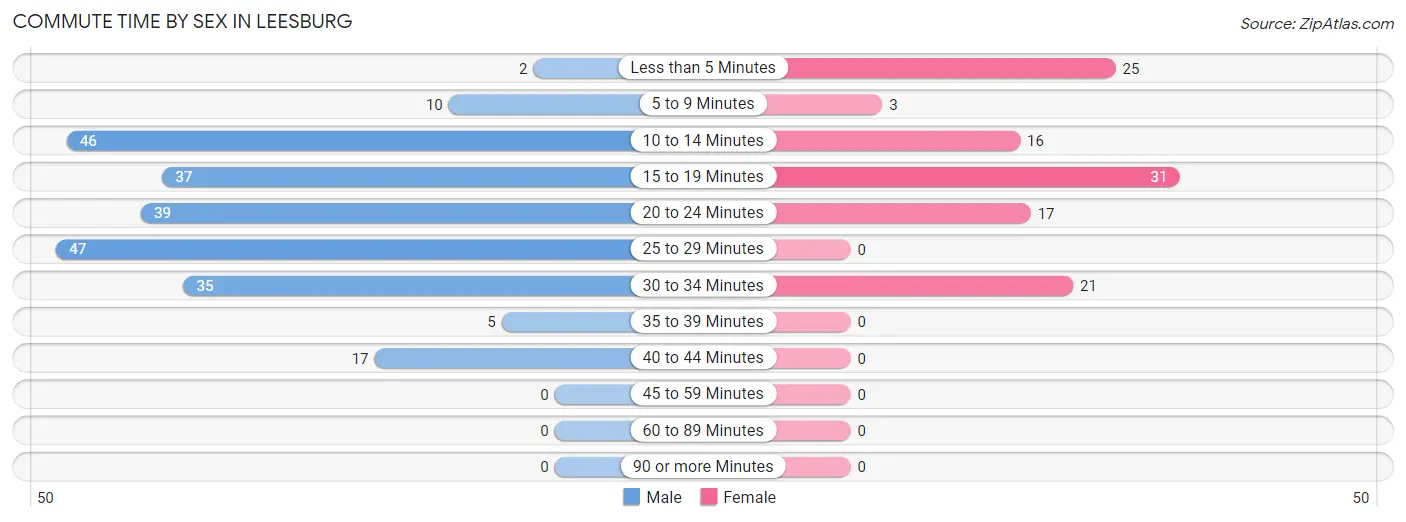
| Commute Time | Male | Female |
| Less than 5 Minutes | 2 (0.8%) | 25 (22.1%) |
| 5 to 9 Minutes | 10 (4.2%) | 3 (2.6%) |
| 10 to 14 Minutes | 46 (19.3%) | 16 (14.2%) |
| 15 to 19 Minutes | 37 (15.5%) | 31 (27.4%) |
| 20 to 24 Minutes | 39 (16.4%) | 17 (15.0%) |
| 25 to 29 Minutes | 47 (19.8%) | 0 (0.0%) |
| 30 to 34 Minutes | 35 (14.7%) | 21 (18.6%) |
| 35 to 39 Minutes | 5 (2.1%) | 0 (0.0%) |
| 40 to 44 Minutes | 17 (7.1%) | 0 (0.0%) |
| 45 to 59 Minutes | 0 (0.0%) | 0 (0.0%) |
| 60 to 89 Minutes | 0 (0.0%) | 0 (0.0%) |
| 90 or more Minutes | 0 (0.0%) | 0 (0.0%) |
Time of Departure to Work by Sex in Leesburg
The most frequent times of departure to work in Leesburg are 4:00 PM to 11:59 PM (46, 19.3%) for males and 6:30 AM to 6:59 AM (19, 16.8%) for females.
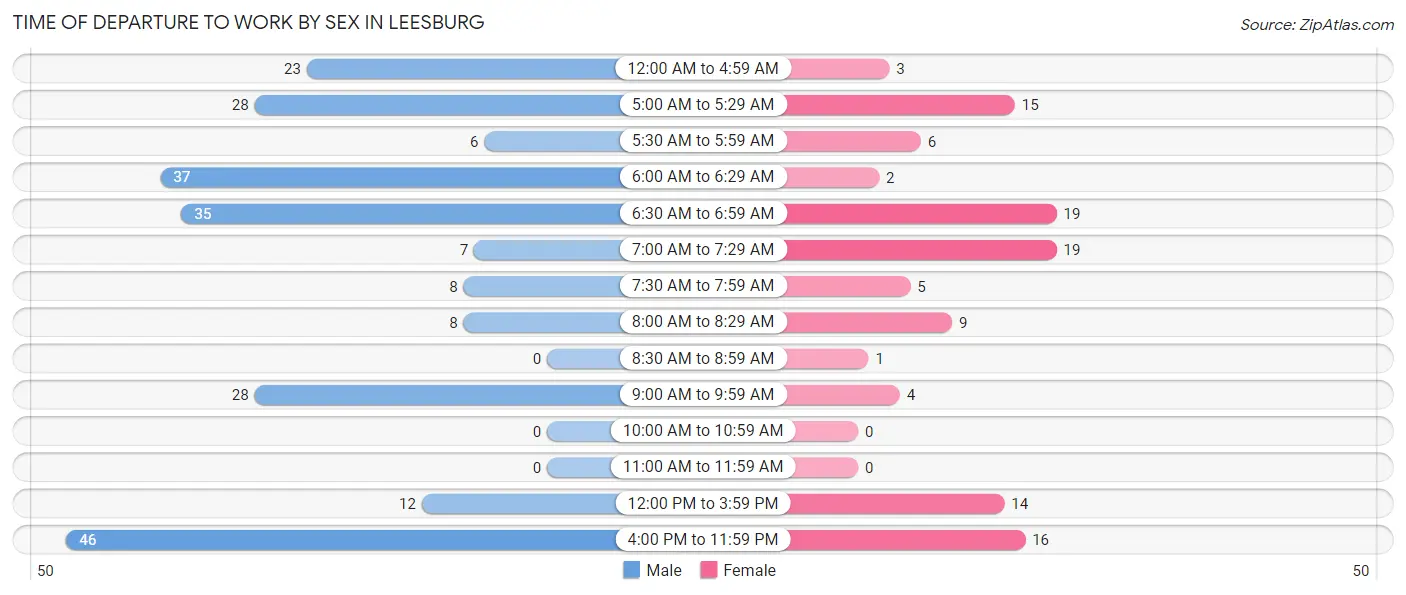
| Time of Departure | Male | Female |
| 12:00 AM to 4:59 AM | 23 (9.7%) | 3 (2.6%) |
| 5:00 AM to 5:29 AM | 28 (11.8%) | 15 (13.3%) |
| 5:30 AM to 5:59 AM | 6 (2.5%) | 6 (5.3%) |
| 6:00 AM to 6:29 AM | 37 (15.5%) | 2 (1.8%) |
| 6:30 AM to 6:59 AM | 35 (14.7%) | 19 (16.8%) |
| 7:00 AM to 7:29 AM | 7 (2.9%) | 19 (16.8%) |
| 7:30 AM to 7:59 AM | 8 (3.4%) | 5 (4.4%) |
| 8:00 AM to 8:29 AM | 8 (3.4%) | 9 (8.0%) |
| 8:30 AM to 8:59 AM | 0 (0.0%) | 1 (0.9%) |
| 9:00 AM to 9:59 AM | 28 (11.8%) | 4 (3.5%) |
| 10:00 AM to 10:59 AM | 0 (0.0%) | 0 (0.0%) |
| 11:00 AM to 11:59 AM | 0 (0.0%) | 0 (0.0%) |
| 12:00 PM to 3:59 PM | 12 (5.0%) | 14 (12.4%) |
| 4:00 PM to 11:59 PM | 46 (19.3%) | 16 (14.2%) |
| Total | 238 (100.0%) | 113 (100.0%) |
Housing Occupancy in Leesburg
Occupancy by Ownership in Leesburg
Of the total 238 dwellings in Leesburg, owner-occupied units account for 190 (79.8%), while renter-occupied units make up 48 (20.2%).
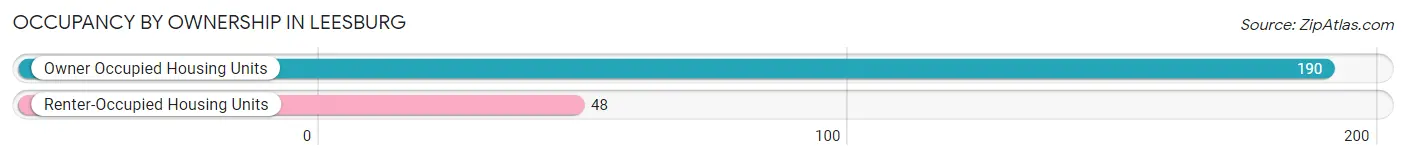
| Occupancy | # Housing Units | % Housing Units |
| Owner Occupied Housing Units | 190 | 79.8% |
| Renter-Occupied Housing Units | 48 | 20.2% |
| Total Occupied Housing Units | 238 | 100.0% |
Occupancy by Household Size in Leesburg
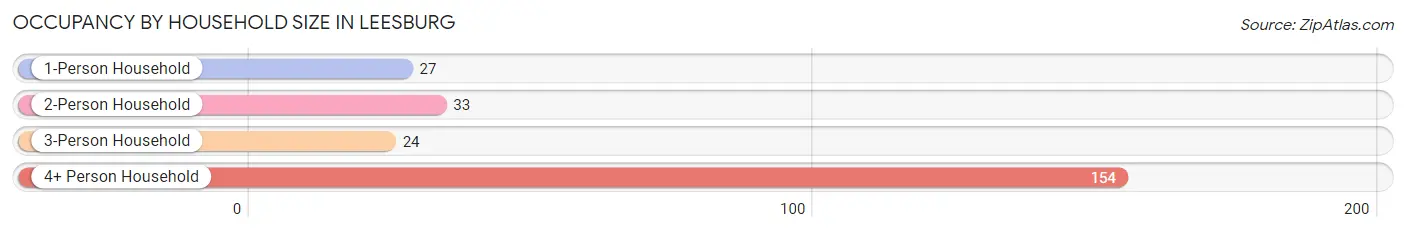
| Household Size | # Housing Units | % Housing Units |
| 1-Person Household | 27 | 11.3% |
| 2-Person Household | 33 | 13.9% |
| 3-Person Household | 24 | 10.1% |
| 4+ Person Household | 154 | 64.7% |
| Total Housing Units | 238 | 100.0% |
Occupancy by Ownership by Household Size in Leesburg
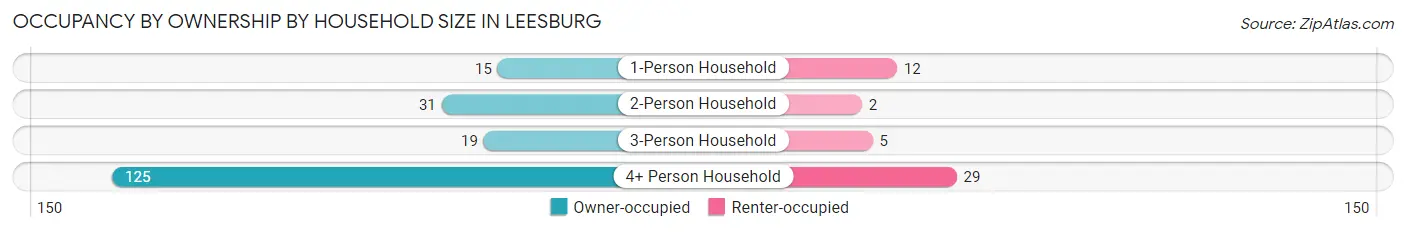
| Household Size | Owner-occupied | Renter-occupied |
| 1-Person Household | 15 (55.6%) | 12 (44.4%) |
| 2-Person Household | 31 (93.9%) | 2 (6.1%) |
| 3-Person Household | 19 (79.2%) | 5 (20.8%) |
| 4+ Person Household | 125 (81.2%) | 29 (18.8%) |
| Total Housing Units | 190 (79.8%) | 48 (20.2%) |
Occupancy by Educational Attainment in Leesburg
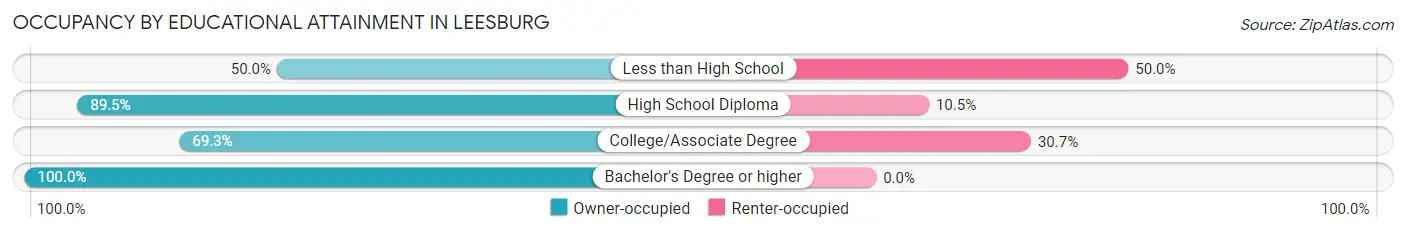
| Household Size | Owner-occupied | Renter-occupied |
| Less than High School | 8 (50.0%) | 8 (50.0%) |
| High School Diploma | 77 (89.5%) | 9 (10.5%) |
| College/Associate Degree | 70 (69.3%) | 31 (30.7%) |
| Bachelor's Degree or higher | 35 (100.0%) | 0 (0.0%) |
Occupancy by Age of Householder in Leesburg
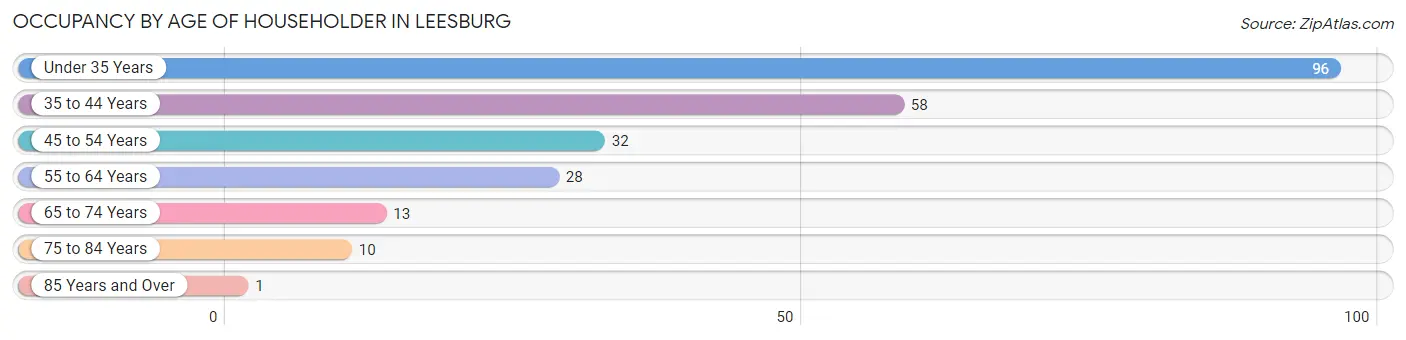
| Age Bracket | # Households | % Households |
| Under 35 Years | 96 | 40.3% |
| 35 to 44 Years | 58 | 24.4% |
| 45 to 54 Years | 32 | 13.5% |
| 55 to 64 Years | 28 | 11.8% |
| 65 to 74 Years | 13 | 5.5% |
| 75 to 84 Years | 10 | 4.2% |
| 85 Years and Over | 1 | 0.4% |
| Total | 238 | 100.0% |
Housing Finances in Leesburg
Median Income by Occupancy in Leesburg
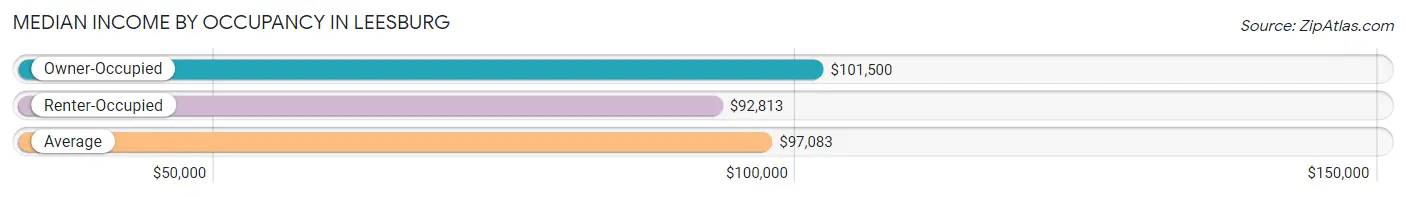
| Occupancy Type | # Households | Median Income |
| Owner-Occupied | 190 (79.8%) | $101,500 |
| Renter-Occupied | 48 (20.2%) | $92,813 |
| Average | 238 (100.0%) | $97,083 |
Occupancy by Householder Income Bracket in Leesburg
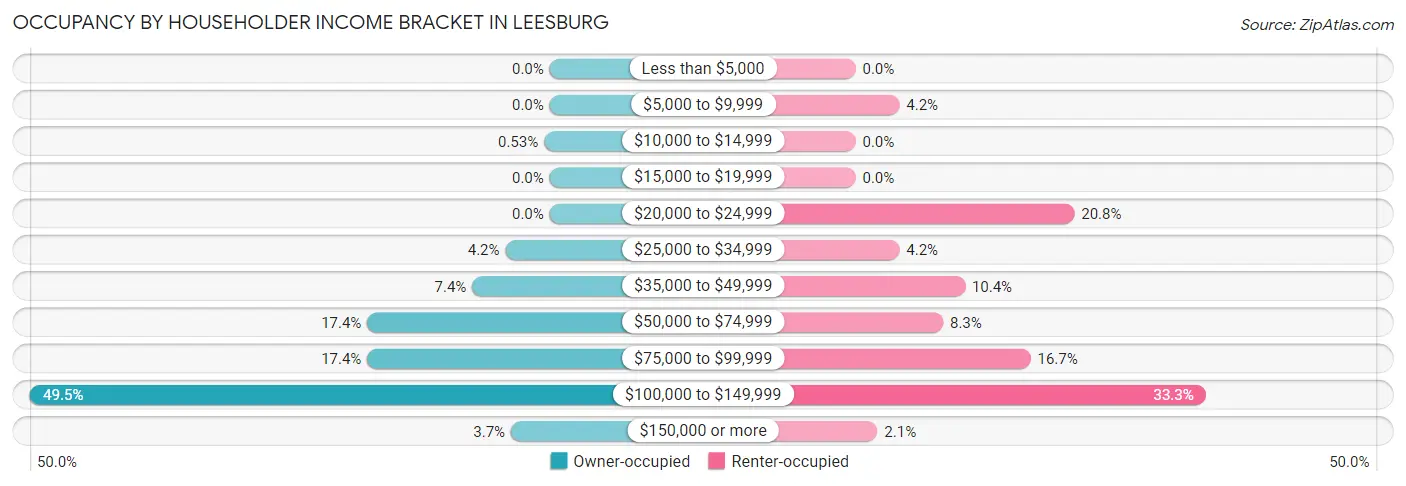
| Income Bracket | Owner-occupied | Renter-occupied |
| Less than $5,000 | 0 (0.0%) | 0 (0.0%) |
| $5,000 to $9,999 | 0 (0.0%) | 2 (4.2%) |
| $10,000 to $14,999 | 1 (0.5%) | 0 (0.0%) |
| $15,000 to $19,999 | 0 (0.0%) | 0 (0.0%) |
| $20,000 to $24,999 | 0 (0.0%) | 10 (20.8%) |
| $25,000 to $34,999 | 8 (4.2%) | 2 (4.2%) |
| $35,000 to $49,999 | 14 (7.4%) | 5 (10.4%) |
| $50,000 to $74,999 | 33 (17.4%) | 4 (8.3%) |
| $75,000 to $99,999 | 33 (17.4%) | 8 (16.7%) |
| $100,000 to $149,999 | 94 (49.5%) | 16 (33.3%) |
| $150,000 or more | 7 (3.7%) | 1 (2.1%) |
| Total | 190 (100.0%) | 48 (100.0%) |
Monthly Housing Cost Tiers in Leesburg
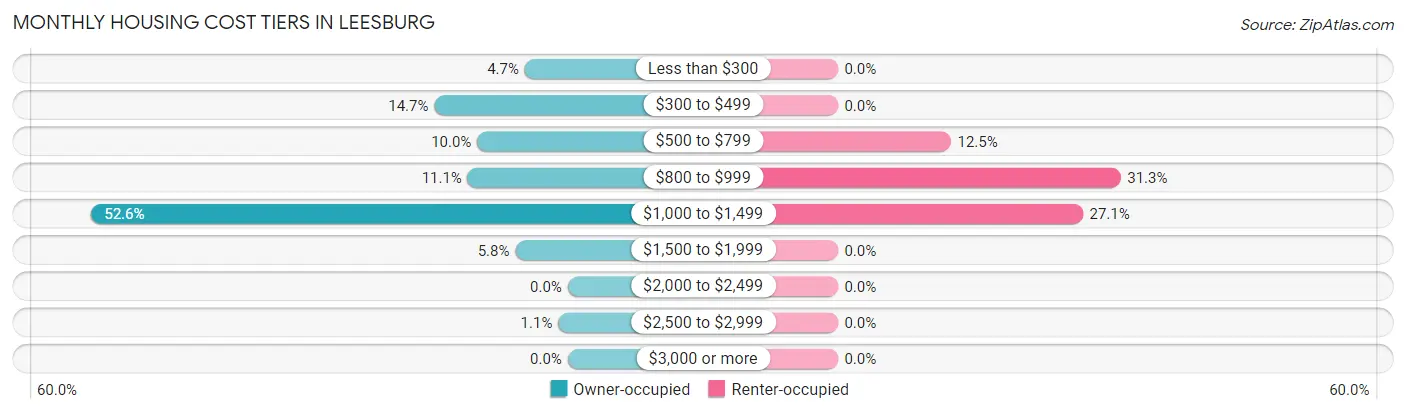
| Monthly Cost | Owner-occupied | Renter-occupied |
| Less than $300 | 9 (4.7%) | 0 (0.0%) |
| $300 to $499 | 28 (14.7%) | 0 (0.0%) |
| $500 to $799 | 19 (10.0%) | 6 (12.5%) |
| $800 to $999 | 21 (11.1%) | 15 (31.2%) |
| $1,000 to $1,499 | 100 (52.6%) | 13 (27.1%) |
| $1,500 to $1,999 | 11 (5.8%) | 0 (0.0%) |
| $2,000 to $2,499 | 0 (0.0%) | 0 (0.0%) |
| $2,500 to $2,999 | 2 (1.1%) | 0 (0.0%) |
| $3,000 or more | 0 (0.0%) | 0 (0.0%) |
| Total | 190 (100.0%) | 48 (100.0%) |
Physical Housing Characteristics in Leesburg
Housing Structures in Leesburg
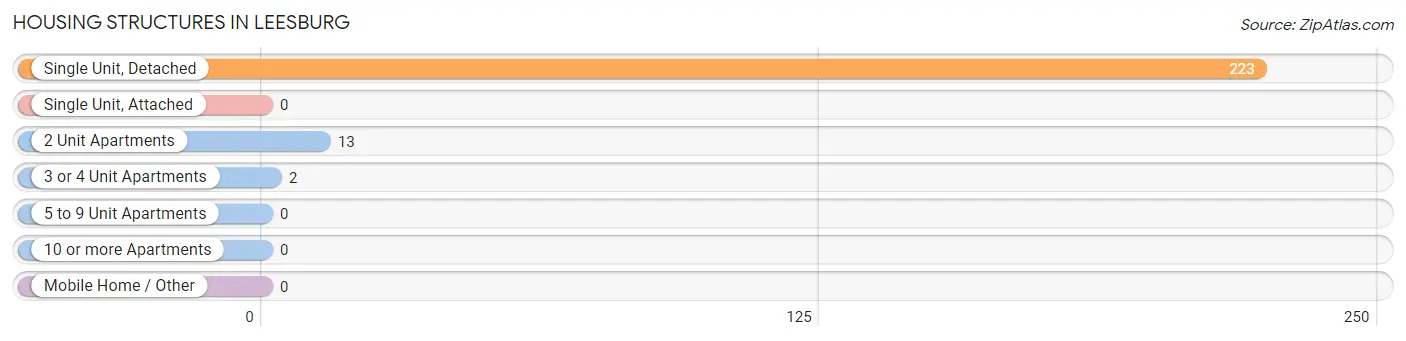
| Structure Type | # Housing Units | % Housing Units |
| Single Unit, Detached | 223 | 93.7% |
| Single Unit, Attached | 0 | 0.0% |
| 2 Unit Apartments | 13 | 5.5% |
| 3 or 4 Unit Apartments | 2 | 0.8% |
| 5 to 9 Unit Apartments | 0 | 0.0% |
| 10 or more Apartments | 0 | 0.0% |
| Mobile Home / Other | 0 | 0.0% |
| Total | 238 | 100.0% |
Housing Structures by Occupancy in Leesburg
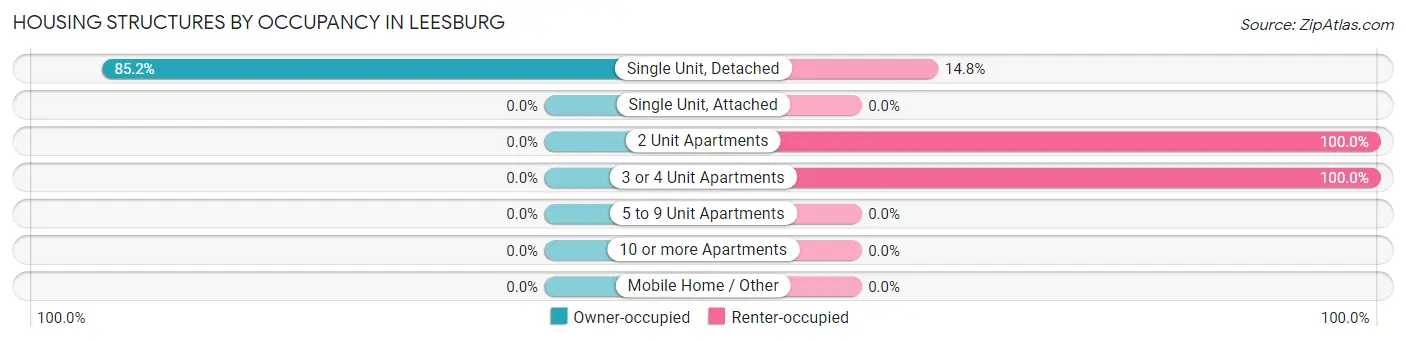
| Structure Type | Owner-occupied | Renter-occupied |
| Single Unit, Detached | 190 (85.2%) | 33 (14.8%) |
| Single Unit, Attached | 0 (0.0%) | 0 (0.0%) |
| 2 Unit Apartments | 0 (0.0%) | 13 (100.0%) |
| 3 or 4 Unit Apartments | 0 (0.0%) | 2 (100.0%) |
| 5 to 9 Unit Apartments | 0 (0.0%) | 0 (0.0%) |
| 10 or more Apartments | 0 (0.0%) | 0 (0.0%) |
| Mobile Home / Other | 0 (0.0%) | 0 (0.0%) |
| Total | 190 (79.8%) | 48 (20.2%) |
Housing Structures by Number of Rooms in Leesburg
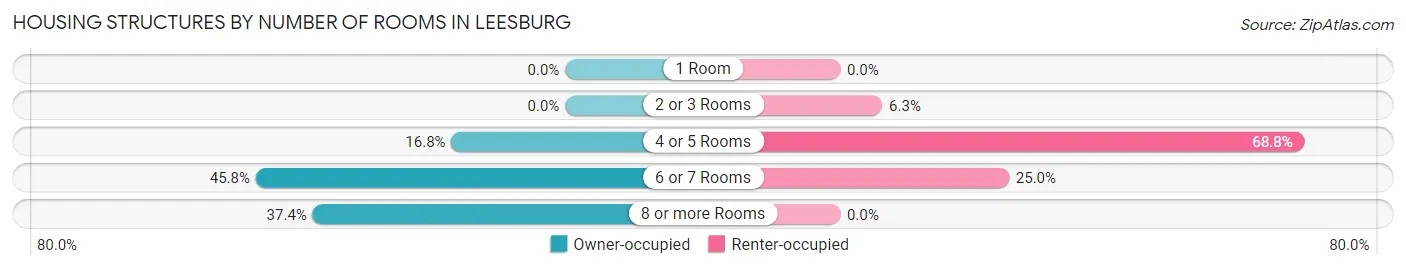
| Number of Rooms | Owner-occupied | Renter-occupied |
| 1 Room | 0 (0.0%) | 0 (0.0%) |
| 2 or 3 Rooms | 0 (0.0%) | 3 (6.2%) |
| 4 or 5 Rooms | 32 (16.8%) | 33 (68.8%) |
| 6 or 7 Rooms | 87 (45.8%) | 12 (25.0%) |
| 8 or more Rooms | 71 (37.4%) | 0 (0.0%) |
| Total | 190 (100.0%) | 48 (100.0%) |
Housing Structure by Heating Type in Leesburg
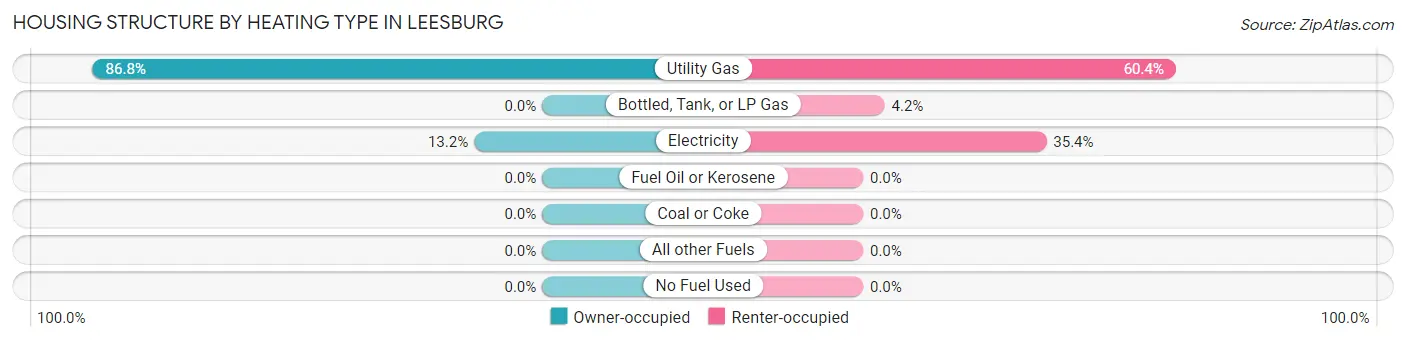
| Heating Type | Owner-occupied | Renter-occupied |
| Utility Gas | 165 (86.8%) | 29 (60.4%) |
| Bottled, Tank, or LP Gas | 0 (0.0%) | 2 (4.2%) |
| Electricity | 25 (13.2%) | 17 (35.4%) |
| Fuel Oil or Kerosene | 0 (0.0%) | 0 (0.0%) |
| Coal or Coke | 0 (0.0%) | 0 (0.0%) |
| All other Fuels | 0 (0.0%) | 0 (0.0%) |
| No Fuel Used | 0 (0.0%) | 0 (0.0%) |
| Total | 190 (100.0%) | 48 (100.0%) |
Household Vehicle Usage in Leesburg
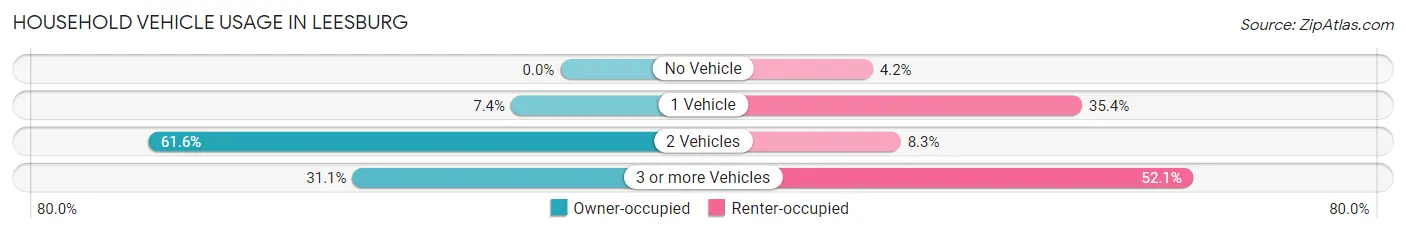
| Vehicles per Household | Owner-occupied | Renter-occupied |
| No Vehicle | 0 (0.0%) | 2 (4.2%) |
| 1 Vehicle | 14 (7.4%) | 17 (35.4%) |
| 2 Vehicles | 117 (61.6%) | 4 (8.3%) |
| 3 or more Vehicles | 59 (31.0%) | 25 (52.1%) |
| Total | 190 (100.0%) | 48 (100.0%) |
Real Estate & Mortgages in Leesburg
Real Estate and Mortgage Overview in Leesburg
| Characteristic | Without Mortgage | With Mortgage |
| Housing Units | 60 | 130 |
| Median Property Value | $121,100 | $171,300 |
| Median Household Income | $76,389 | $1 |
| Monthly Housing Costs | $461 | $0 |
| Real Estate Taxes | $840 | $0 |
Property Value by Mortgage Status in Leesburg
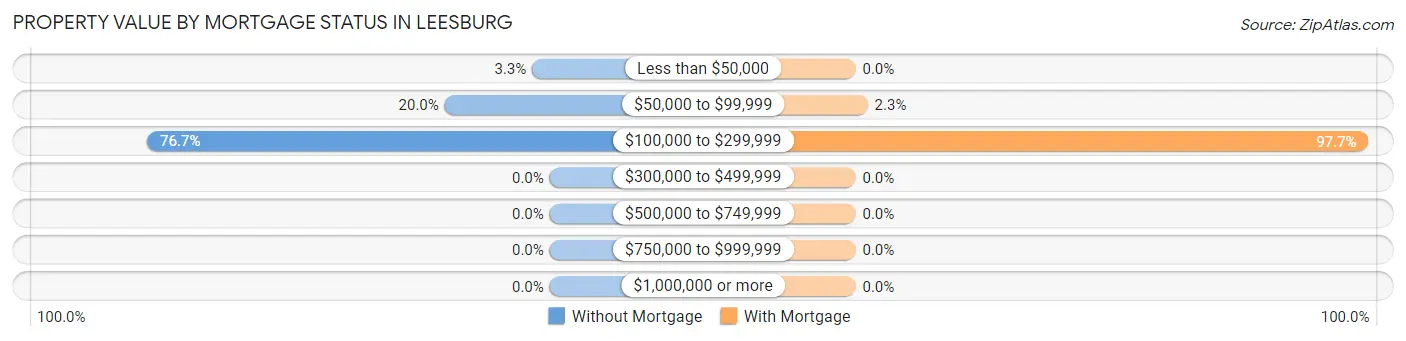
| Property Value | Without Mortgage | With Mortgage |
| Less than $50,000 | 2 (3.3%) | 0 (0.0%) |
| $50,000 to $99,999 | 12 (20.0%) | 3 (2.3%) |
| $100,000 to $299,999 | 46 (76.7%) | 127 (97.7%) |
| $300,000 to $499,999 | 0 (0.0%) | 0 (0.0%) |
| $500,000 to $749,999 | 0 (0.0%) | 0 (0.0%) |
| $750,000 to $999,999 | 0 (0.0%) | 0 (0.0%) |
| $1,000,000 or more | 0 (0.0%) | 0 (0.0%) |
| Total | 60 (100.0%) | 130 (100.0%) |
Household Income by Mortgage Status in Leesburg
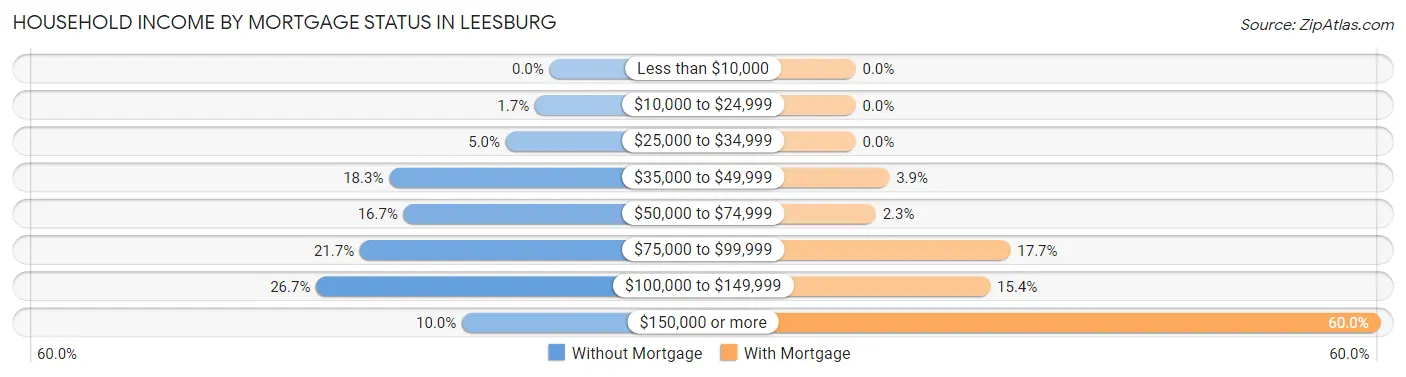
| Household Income | Without Mortgage | With Mortgage |
| Less than $10,000 | 0 (0.0%) | 0 (0.0%) |
| $10,000 to $24,999 | 1 (1.7%) | 0 (0.0%) |
| $25,000 to $34,999 | 3 (5.0%) | 0 (0.0%) |
| $35,000 to $49,999 | 11 (18.3%) | 5 (3.8%) |
| $50,000 to $74,999 | 10 (16.7%) | 3 (2.3%) |
| $75,000 to $99,999 | 13 (21.7%) | 23 (17.7%) |
| $100,000 to $149,999 | 16 (26.7%) | 20 (15.4%) |
| $150,000 or more | 6 (10.0%) | 78 (60.0%) |
| Total | 60 (100.0%) | 130 (100.0%) |
Property Value to Household Income Ratio in Leesburg
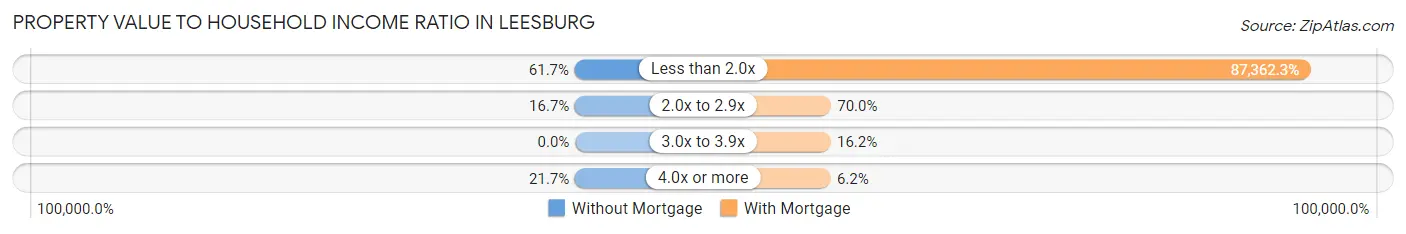
| Value-to-Income Ratio | Without Mortgage | With Mortgage |
| Less than 2.0x | 37 (61.7%) | 113,571 (87,362.3%) |
| 2.0x to 2.9x | 10 (16.7%) | 91 (70.0%) |
| 3.0x to 3.9x | 0 (0.0%) | 21 (16.2%) |
| 4.0x or more | 13 (21.7%) | 8 (6.1%) |
| Total | 60 (100.0%) | 130 (100.0%) |
Real Estate Taxes by Mortgage Status in Leesburg
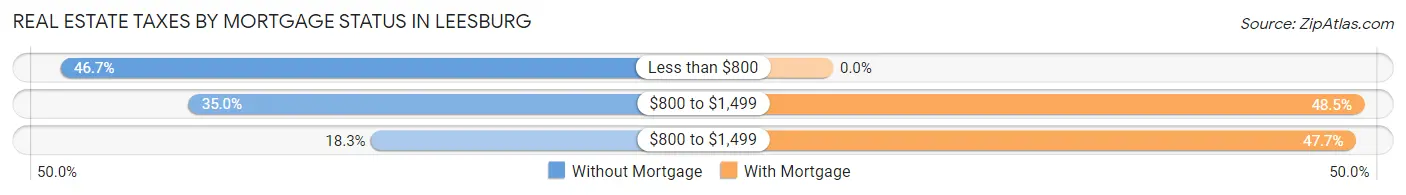
| Property Taxes | Without Mortgage | With Mortgage |
| Less than $800 | 28 (46.7%) | 0 (0.0%) |
| $800 to $1,499 | 21 (35.0%) | 63 (48.5%) |
| $800 to $1,499 | 11 (18.3%) | 62 (47.7%) |
| Total | 60 (100.0%) | 130 (100.0%) |
Health & Disability in Leesburg
Health Insurance Coverage by Age in Leesburg
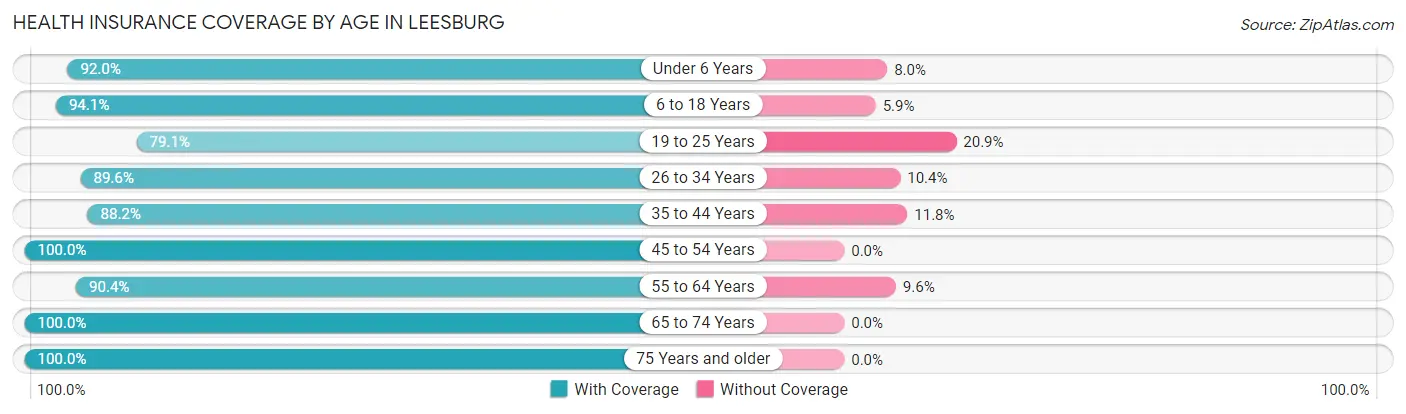
| Age Bracket | With Coverage | Without Coverage |
| Under 6 Years | 138 (92.0%) | 12 (8.0%) |
| 6 to 18 Years | 225 (94.1%) | 14 (5.9%) |
| 19 to 25 Years | 53 (79.1%) | 14 (20.9%) |
| 26 to 34 Years | 163 (89.6%) | 19 (10.4%) |
| 35 to 44 Years | 105 (88.2%) | 14 (11.8%) |
| 45 to 54 Years | 93 (100.0%) | 0 (0.0%) |
| 55 to 64 Years | 47 (90.4%) | 5 (9.6%) |
| 65 to 74 Years | 22 (100.0%) | 0 (0.0%) |
| 75 Years and older | 18 (100.0%) | 0 (0.0%) |
| Total | 864 (91.7%) | 78 (8.3%) |
Health Insurance Coverage by Citizenship Status in Leesburg
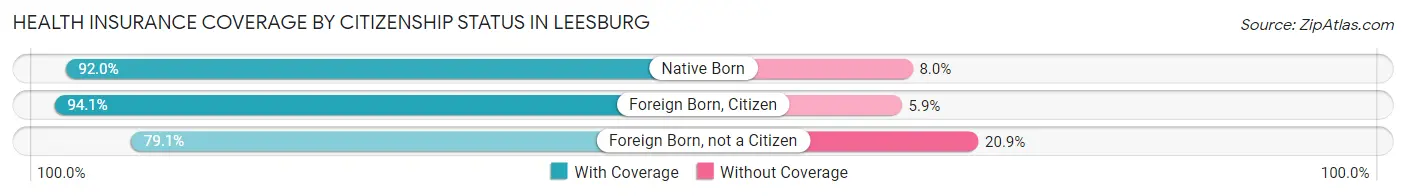
| Citizenship Status | With Coverage | Without Coverage |
| Native Born | 138 (92.0%) | 12 (8.0%) |
| Foreign Born, Citizen | 225 (94.1%) | 14 (5.9%) |
| Foreign Born, not a Citizen | 53 (79.1%) | 14 (20.9%) |
Health Insurance Coverage by Household Income in Leesburg
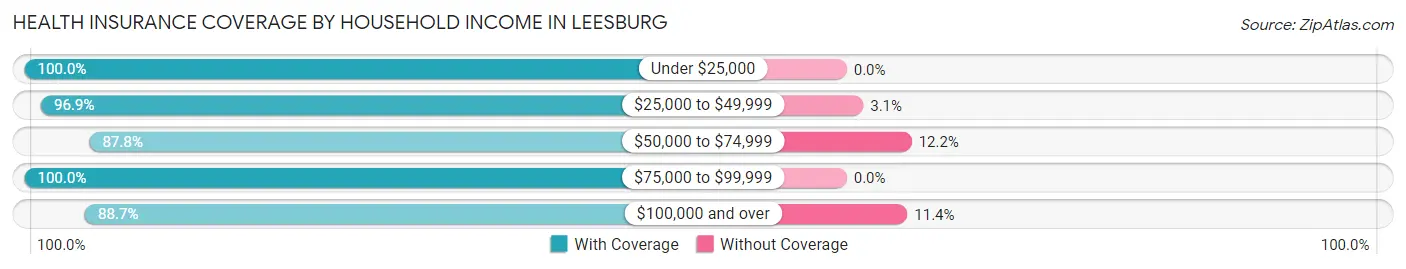
| Household Income | With Coverage | Without Coverage |
| Under $25,000 | 13 (100.0%) | 0 (0.0%) |
| $25,000 to $49,999 | 94 (96.9%) | 3 (3.1%) |
| $50,000 to $74,999 | 130 (87.8%) | 18 (12.2%) |
| $75,000 to $99,999 | 182 (100.0%) | 0 (0.0%) |
| $100,000 and over | 445 (88.6%) | 57 (11.4%) |
Public vs Private Health Insurance Coverage by Age in Leesburg
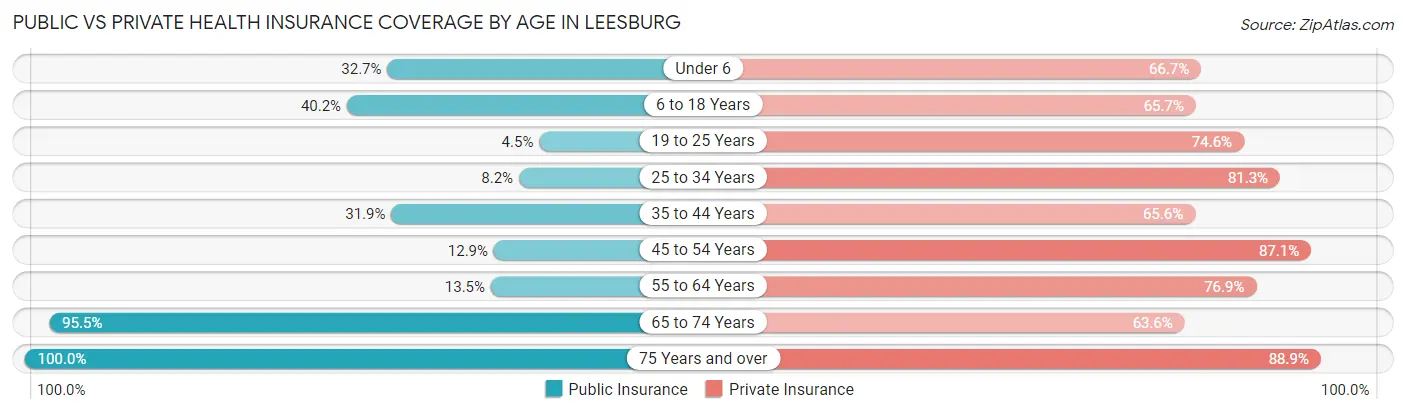
| Age Bracket | Public Insurance | Private Insurance |
| Under 6 | 49 (32.7%) | 100 (66.7%) |
| 6 to 18 Years | 96 (40.2%) | 157 (65.7%) |
| 19 to 25 Years | 3 (4.5%) | 50 (74.6%) |
| 25 to 34 Years | 15 (8.2%) | 148 (81.3%) |
| 35 to 44 Years | 38 (31.9%) | 78 (65.5%) |
| 45 to 54 Years | 12 (12.9%) | 81 (87.1%) |
| 55 to 64 Years | 7 (13.5%) | 40 (76.9%) |
| 65 to 74 Years | 21 (95.5%) | 14 (63.6%) |
| 75 Years and over | 18 (100.0%) | 16 (88.9%) |
| Total | 259 (27.5%) | 684 (72.6%) |
Disability Status by Sex by Age in Leesburg
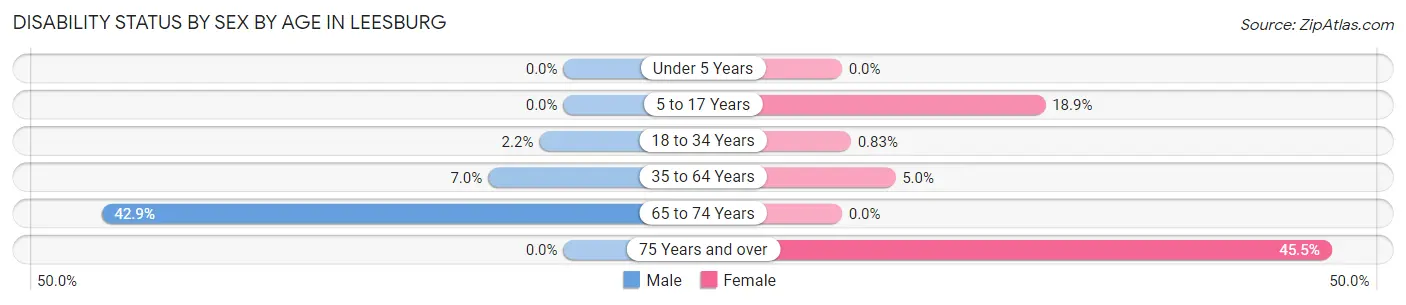
| Age Bracket | Male | Female |
| Under 5 Years | 0 (0.0%) | 0 (0.0%) |
| 5 to 17 Years | 0 (0.0%) | 27 (18.9%) |
| 18 to 34 Years | 3 (2.2%) | 1 (0.8%) |
| 35 to 64 Years | 10 (7.0%) | 6 (5.0%) |
| 65 to 74 Years | 3 (42.9%) | 0 (0.0%) |
| 75 Years and over | 0 (0.0%) | 5 (45.5%) |
Disability Class by Sex by Age in Leesburg
Disability Class: Hearing Difficulty
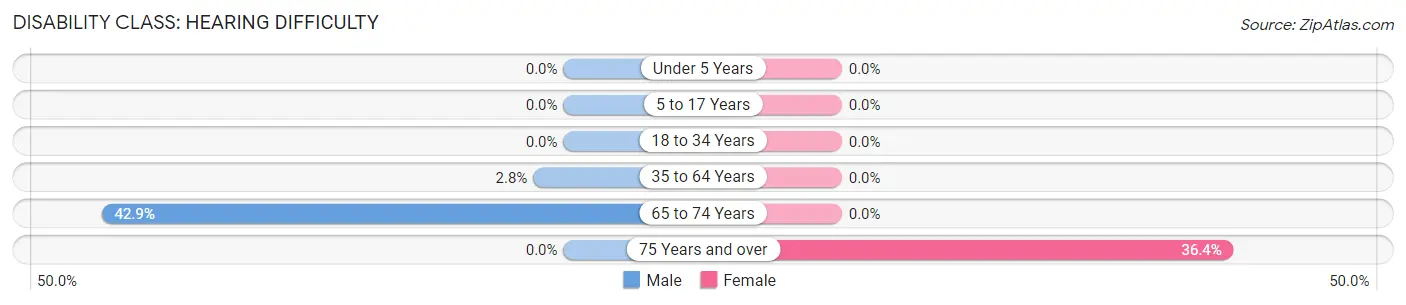
| Age Bracket | Male | Female |
| Under 5 Years | 0 (0.0%) | 0 (0.0%) |
| 5 to 17 Years | 0 (0.0%) | 0 (0.0%) |
| 18 to 34 Years | 0 (0.0%) | 0 (0.0%) |
| 35 to 64 Years | 4 (2.8%) | 0 (0.0%) |
| 65 to 74 Years | 3 (42.9%) | 0 (0.0%) |
| 75 Years and over | 0 (0.0%) | 4 (36.4%) |
Disability Class: Vision Difficulty
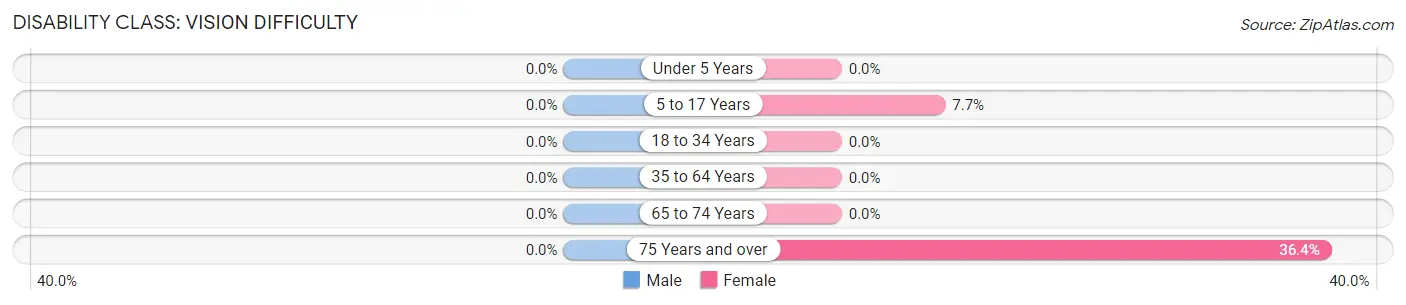
| Age Bracket | Male | Female |
| Under 5 Years | 0 (0.0%) | 0 (0.0%) |
| 5 to 17 Years | 0 (0.0%) | 11 (7.7%) |
| 18 to 34 Years | 0 (0.0%) | 0 (0.0%) |
| 35 to 64 Years | 0 (0.0%) | 0 (0.0%) |
| 65 to 74 Years | 0 (0.0%) | 0 (0.0%) |
| 75 Years and over | 0 (0.0%) | 4 (36.4%) |
Disability Class: Cognitive Difficulty
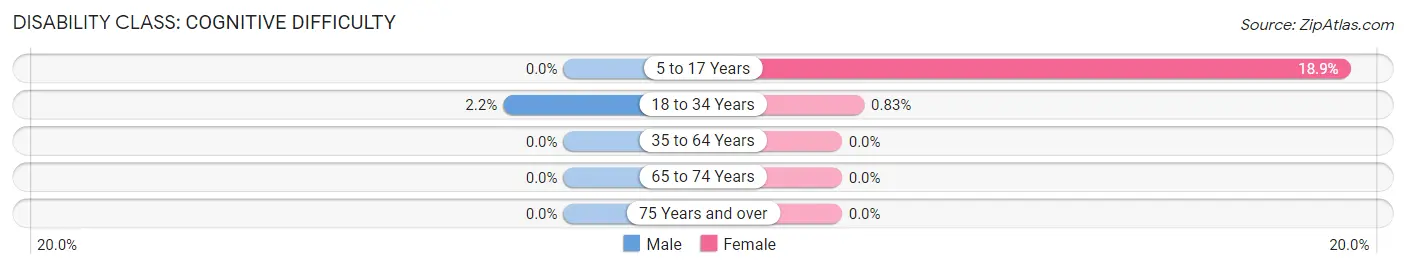
| Age Bracket | Male | Female |
| 5 to 17 Years | 0 (0.0%) | 27 (18.9%) |
| 18 to 34 Years | 3 (2.2%) | 1 (0.8%) |
| 35 to 64 Years | 0 (0.0%) | 0 (0.0%) |
| 65 to 74 Years | 0 (0.0%) | 0 (0.0%) |
| 75 Years and over | 0 (0.0%) | 0 (0.0%) |
Disability Class: Ambulatory Difficulty
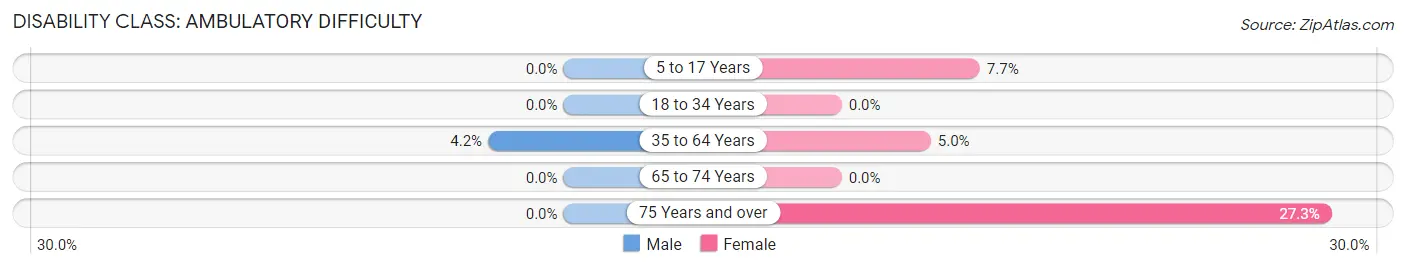
| Age Bracket | Male | Female |
| 5 to 17 Years | 0 (0.0%) | 11 (7.7%) |
| 18 to 34 Years | 0 (0.0%) | 0 (0.0%) |
| 35 to 64 Years | 6 (4.2%) | 6 (5.0%) |
| 65 to 74 Years | 0 (0.0%) | 0 (0.0%) |
| 75 Years and over | 0 (0.0%) | 3 (27.3%) |
Disability Class: Self-Care Difficulty
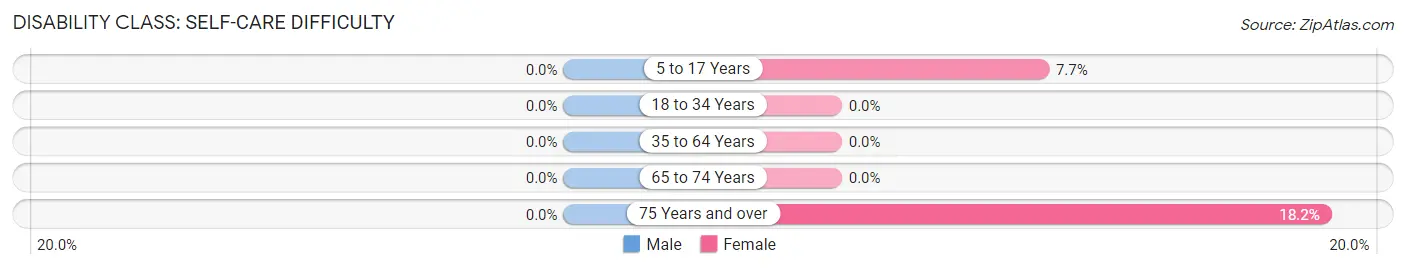
| Age Bracket | Male | Female |
| 5 to 17 Years | 0 (0.0%) | 11 (7.7%) |
| 18 to 34 Years | 0 (0.0%) | 0 (0.0%) |
| 35 to 64 Years | 0 (0.0%) | 0 (0.0%) |
| 65 to 74 Years | 0 (0.0%) | 0 (0.0%) |
| 75 Years and over | 0 (0.0%) | 2 (18.2%) |
Technology Access in Leesburg
Computing Device Access in Leesburg
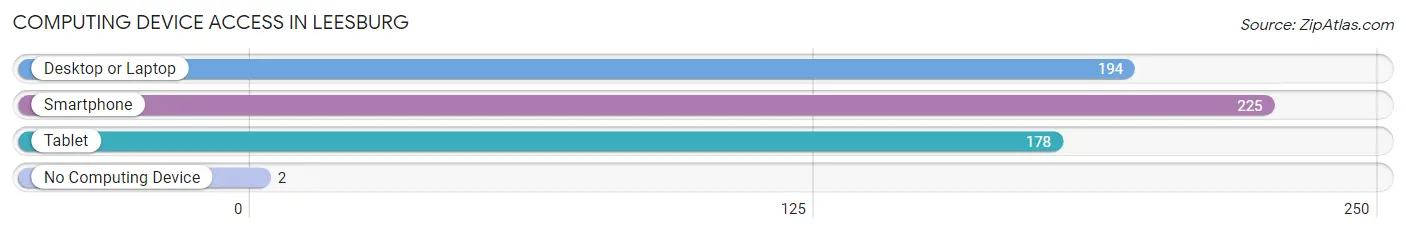
| Device Type | # Households | % Households |
| Desktop or Laptop | 194 | 81.5% |
| Smartphone | 225 | 94.5% |
| Tablet | 178 | 74.8% |
| No Computing Device | 2 | 0.8% |
| Total | 238 | 100.0% |
Internet Access in Leesburg
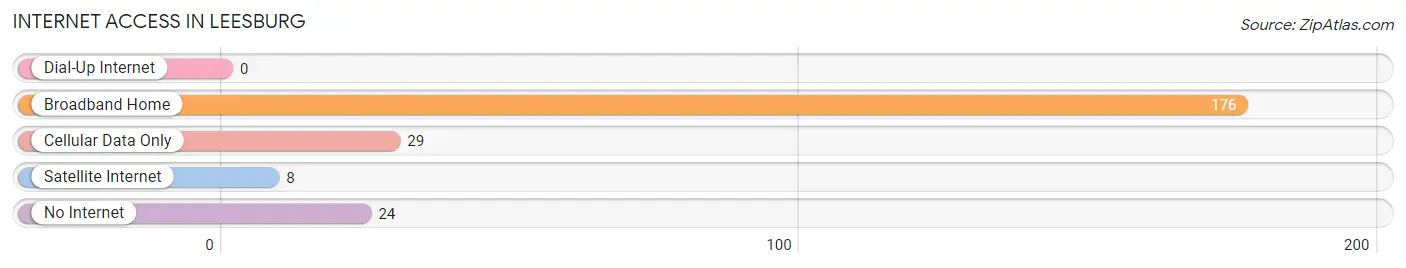
| Internet Type | # Households | % Households |
| Dial-Up Internet | 0 | 0.0% |
| Broadband Home | 176 | 74.0% |
| Cellular Data Only | 29 | 12.2% |
| Satellite Internet | 8 | 3.4% |
| No Internet | 24 | 10.1% |
| Total | 238 | 100.0% |
Leesburg Summary
Leesburg is a small town located in Kosciusko County, Indiana. It is situated in the northern part of the state, about 20 miles south of the Michigan border. The town was founded in 1837 and has a population of approximately 1,500 people.
History
Leesburg was founded in 1837 by a group of settlers from Ohio. The town was named after the Leesburg family, who were among the first settlers. The town was originally a farming community, but it soon developed into a small manufacturing center. The first industry in the town was a sawmill, which was built in 1845. This was followed by a gristmill, a woolen mill, and a furniture factory.
In the late 19th century, Leesburg became a popular tourist destination. The town was known for its beautiful scenery and its many lakes. It was also home to a number of resorts, which attracted visitors from all over the Midwest.
Geography
Leesburg is located in northern Indiana, about 20 miles south of the Michigan border. The town is situated in Kosciusko County, which is part of the Wabash Valley region. The town is surrounded by rolling hills and is located near several lakes, including Lake Wawasee, Lake Tippecanoe, and Lake Webster.
The climate in Leesburg is humid continental, with hot summers and cold winters. The average annual temperature is around 50 degrees Fahrenheit. The town receives an average of 40 inches of precipitation each year.
Economy
Leesburg’s economy is largely based on agriculture and manufacturing. The town is home to several large farms, which produce corn, soybeans, and other crops. The town is also home to several manufacturing companies, including a furniture factory, a plastics factory, and a metal fabrication plant.
The town is also home to several small businesses, including restaurants, shops, and other services. The town is also home to a number of tourist attractions, including a golf course, a water park, and a museum.
Demographics
As of the 2010 census, the population of Leesburg was 1,521. The town is predominantly white, with a small African American population. The median household income in the town is $41,000, and the median home value is $90,000. The town has a low unemployment rate of 4.2%.
The town is served by the Wawasee Community School Corporation, which includes two elementary schools, a middle school, and a high school. The town is also home to a branch of Ivy Tech Community College.
Leesburg is a small town with a rich history and a vibrant economy. The town is home to a diverse population and offers a variety of attractions and activities. The town is a great place to live, work, and raise a family.
Common Questions
What is Per Capita Income in Leesburg?
Per Capita income in Leesburg is $26,857.
What is the Median Family Income in Leesburg?
Median Family Income in Leesburg is $94,583.
What is the Median Household income in Leesburg?
Median Household Income in Leesburg is $97,083.
What is Income or Wage Gap in Leesburg?
Income or Wage Gap in Leesburg is 52.7%.
Women in Leesburg earn 47.3 cents for every dollar earned by a man.
What is Inequality or Gini Index in Leesburg?
Inequality or Gini Index in Leesburg is 0.31.
What is the Total Population of Leesburg?
Total Population of Leesburg is 942.
What is the Total Male Population of Leesburg?
Total Male Population of Leesburg is 494.
What is the Total Female Population of Leesburg?
Total Female Population of Leesburg is 448.
What is the Ratio of Males per 100 Females in Leesburg?
There are 110.27 Males per 100 Females in Leesburg.
What is the Ratio of Females per 100 Males in Leesburg?
There are 90.69 Females per 100 Males in Leesburg.
What is the Median Population Age in Leesburg?
Median Population Age in Leesburg is 27.7 Years.
What is the Average Family Size in Leesburg
Average Family Size in Leesburg is 4.2 People.
What is the Average Household Size in Leesburg
Average Household Size in Leesburg is 4.0 People.
How Large is the Labor Force in Leesburg?
There are 422 People in the Labor Forcein in Leesburg.
What is the Percentage of People in the Labor Force in Leesburg?
73.6% of People are in the Labor Force in Leesburg.
What is the Unemployment Rate in Leesburg?
Unemployment Rate in Leesburg is 2.1%.