Goodman, MO Map & Demographics
Goodman Map
Goodman Overview
$18,371
PER CAPITA INCOME
$42,115
AVG FAMILY INCOME
$40,913
AVG HOUSEHOLD INCOME
22.6%
WAGE / INCOME GAP [ % ]
77.4¢/ $1
WAGE / INCOME GAP [ $ ]
0.38
INEQUALITY / GINI INDEX
1,207
TOTAL POPULATION
573
MALE POPULATION
634
FEMALE POPULATION
90.38
MALES / 100 FEMALES
110.65
FEMALES / 100 MALES
28.6
MEDIAN AGE
3.8
AVG FAMILY SIZE
2.8
AVG HOUSEHOLD SIZE
452
LABOR FORCE [ PEOPLE ]
51.0%
PERCENT IN LABOR FORCE
3.5%
UNEMPLOYMENT RATE
Goodman Zip Codes
Goodman Area Codes
Income in Goodman
Income Overview in Goodman
Per Capita Income in Goodman is $18,371, while median incomes of families and households are $42,115 and $40,913 respectively.
| Characteristic | Number | Measure |
| Per Capita Income | 1,207 | $18,371 |
| Median Family Income | 250 | $42,115 |
| Mean Family Income | 250 | $56,784 |
| Median Household Income | 423 | $40,913 |
| Mean Household Income | 423 | $50,711 |
| Income Deficit | 250 | $0 |
| Wage / Income Gap (%) | 1,207 | 22.64% |
| Wage / Income Gap ($) | 1,207 | 77.36¢ per $1 |
| Gini / Inequality Index | 1,207 | 0.38 |
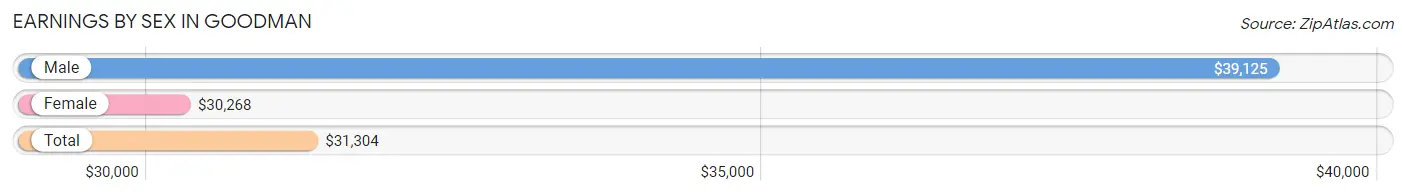
Earnings by Sex in Goodman
Average Earnings in Goodman are $31,304, $39,125 for men and $30,268 for women, a difference of 22.6%.
| Sex | Number | Average Earnings |
| Male | 257 (54.2%) | $39,125 |
| Female | 217 (45.8%) | $30,268 |
| Total | 474 (100.0%) | $31,304 |
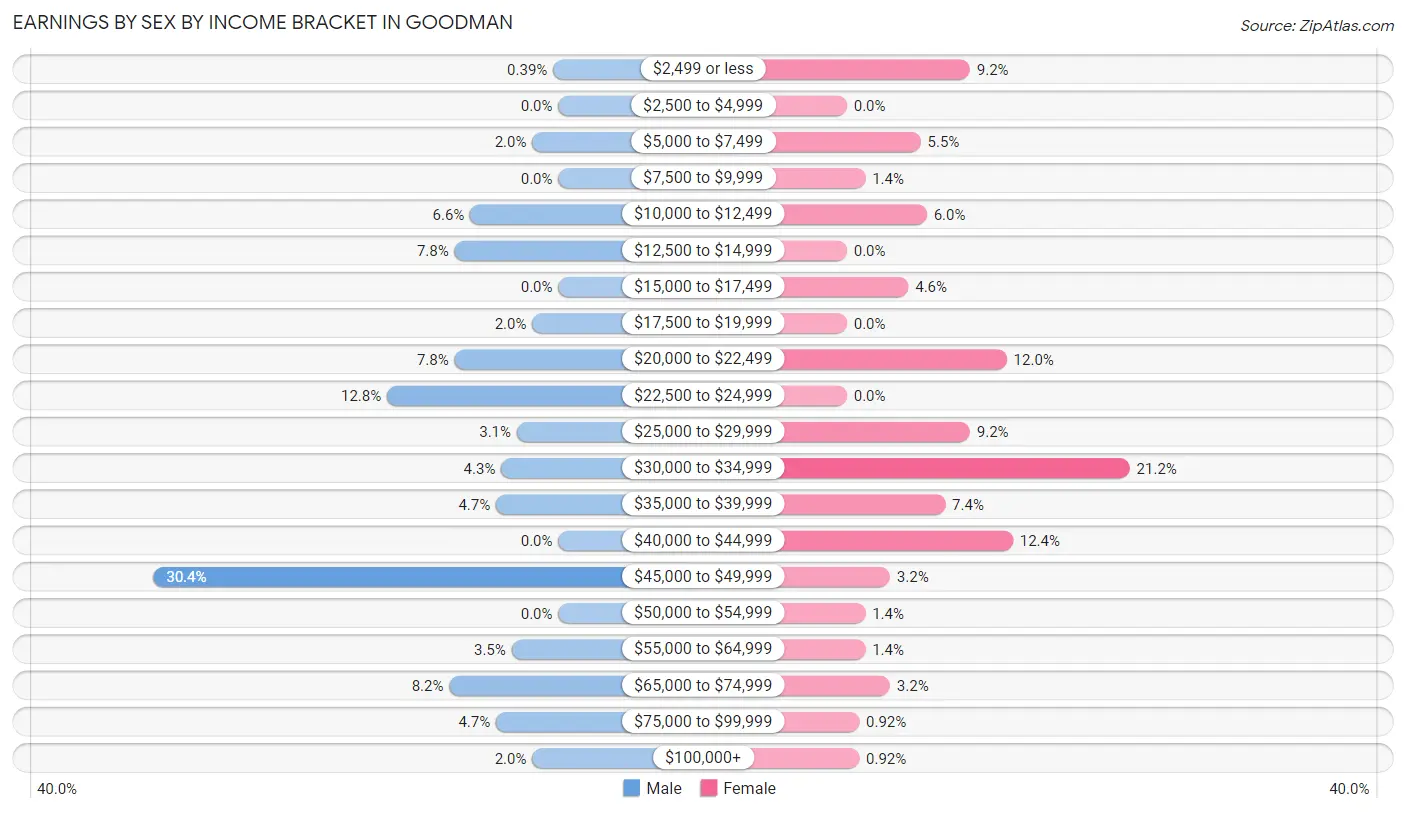
Earnings by Sex by Income Bracket in Goodman
The most common earnings brackets in Goodman are $45,000 to $49,999 for men (78 | 30.3%) and $30,000 to $34,999 for women (46 | 21.2%).
| Income | Male | Female |
| $2,499 or less | 1 (0.4%) | 20 (9.2%) |
| $2,500 to $4,999 | 0 (0.0%) | 0 (0.0%) |
| $5,000 to $7,499 | 5 (1.9%) | 12 (5.5%) |
| $7,500 to $9,999 | 0 (0.0%) | 3 (1.4%) |
| $10,000 to $12,499 | 17 (6.6%) | 13 (6.0%) |
| $12,500 to $14,999 | 20 (7.8%) | 0 (0.0%) |
| $15,000 to $17,499 | 0 (0.0%) | 10 (4.6%) |
| $17,500 to $19,999 | 5 (1.9%) | 0 (0.0%) |
| $20,000 to $22,499 | 20 (7.8%) | 26 (12.0%) |
| $22,500 to $24,999 | 33 (12.8%) | 0 (0.0%) |
| $25,000 to $29,999 | 8 (3.1%) | 20 (9.2%) |
| $30,000 to $34,999 | 11 (4.3%) | 46 (21.2%) |
| $35,000 to $39,999 | 12 (4.7%) | 16 (7.4%) |
| $40,000 to $44,999 | 0 (0.0%) | 27 (12.4%) |
| $45,000 to $49,999 | 78 (30.3%) | 7 (3.2%) |
| $50,000 to $54,999 | 0 (0.0%) | 3 (1.4%) |
| $55,000 to $64,999 | 9 (3.5%) | 3 (1.4%) |
| $65,000 to $74,999 | 21 (8.2%) | 7 (3.2%) |
| $75,000 to $99,999 | 12 (4.7%) | 2 (0.9%) |
| $100,000+ | 5 (1.9%) | 2 (0.9%) |
| Total | 257 (100.0%) | 217 (100.0%) |
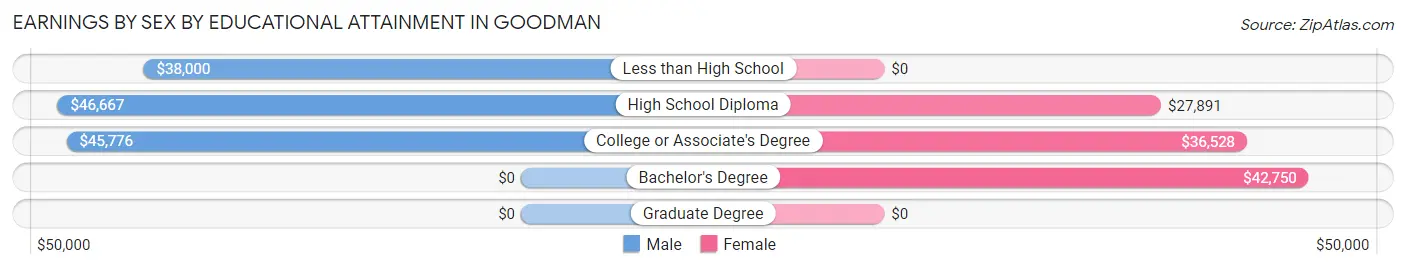
Earnings by Sex by Educational Attainment in Goodman
Average earnings in Goodman are $45,607 for men and $31,506 for women, a difference of 30.9%. Men with an educational attainment of high school diploma enjoy the highest average annual earnings of $46,667, while those with less than high school education earn the least with $38,000. Women with an educational attainment of bachelor's degree earn the most with the average annual earnings of $42,750, while those with high school diploma education have the smallest earnings of $27,891.
| Educational Attainment | Male Income | Female Income |
| Less than High School | $38,000 | $0 |
| High School Diploma | $46,667 | $27,891 |
| College or Associate's Degree | $45,776 | $36,528 |
| Bachelor's Degree | - | - |
| Graduate Degree | - | - |
| Total | $45,607 | $31,506 |
Family Income in Goodman
Family Income Brackets in Goodman
According to the Goodman family income data, there are 53 families falling into the $35,000 to $49,999 income range, which is the most common income bracket and makes up 21.2% of all families. Conversely, the $150,000 to $199,999 income bracket is the least frequent group with only 2 families (0.8%) belonging to this category.
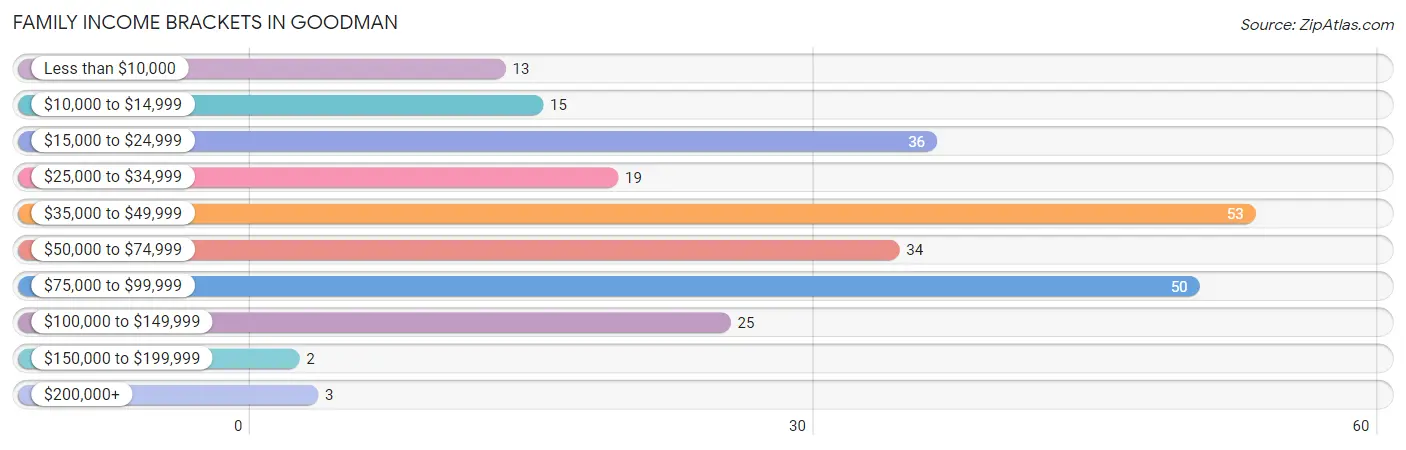
| Income Bracket | # Families | % Families |
| Less than $10,000 | 13 | 5.2% |
| $10,000 to $14,999 | 15 | 6.0% |
| $15,000 to $24,999 | 36 | 14.4% |
| $25,000 to $34,999 | 19 | 7.6% |
| $35,000 to $49,999 | 53 | 21.2% |
| $50,000 to $74,999 | 34 | 13.6% |
| $75,000 to $99,999 | 50 | 20.0% |
| $100,000 to $149,999 | 25 | 10.0% |
| $150,000 to $199,999 | 2 | 0.8% |
| $200,000+ | 3 | 1.2% |
Family Income by Famaliy Size in Goodman
6-person families (13 | 5.2%) account for the highest median family income in Goodman with $84,063 per family, while 4-person families (64 | 25.6%) have the highest median income of $19,671 per family member.
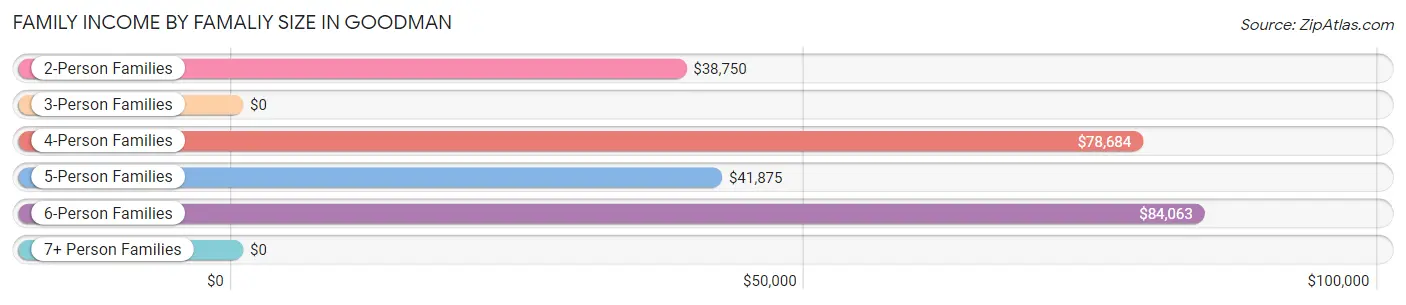
| Income Bracket | # Families | Median Income |
| 2-Person Families | 88 (35.2%) | $38,750 |
| 3-Person Families | 43 (17.2%) | $0 |
| 4-Person Families | 64 (25.6%) | $78,684 |
| 5-Person Families | 34 (13.6%) | $41,875 |
| 6-Person Families | 13 (5.2%) | $84,063 |
| 7+ Person Families | 8 (3.2%) | $0 |
| Total | 250 (100.0%) | $42,115 |
Family Income by Number of Earners in Goodman
The median family income in Goodman is $42,115, with families comprising 3+ earners (23) having the highest median family income of $97,188, while families with no earners (76) have the lowest median family income of $22,273, accounting for 9.2% and 30.4% of families, respectively.
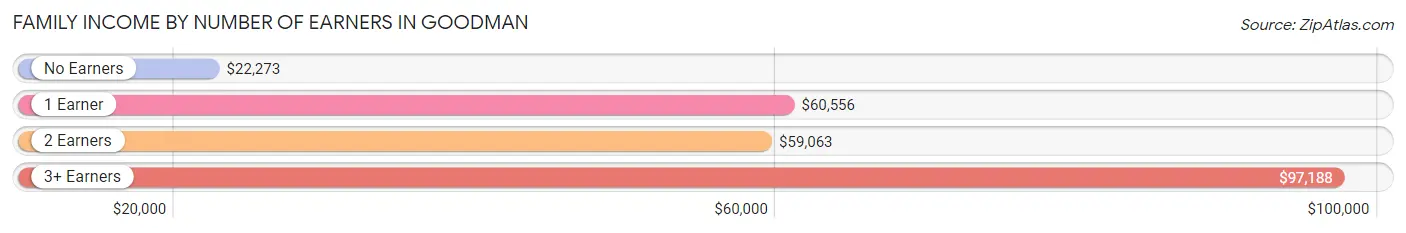
| Number of Earners | # Families | Median Income |
| No Earners | 76 (30.4%) | $22,273 |
| 1 Earner | 44 (17.6%) | $60,556 |
| 2 Earners | 107 (42.8%) | $59,063 |
| 3+ Earners | 23 (9.2%) | $97,188 |
| Total | 250 (100.0%) | $42,115 |
Household Income in Goodman
Household Income Brackets in Goodman
With 101 households falling in the category, the $15,000 to $24,999 income range is the most frequent in Goodman, accounting for 23.9% of all households. In contrast, only 1 households (0.2%) fall into the less than $10,000 income bracket, making it the least populous group.

| Income Bracket | # Households | % Households |
| Less than $10,000 | 1 | 0.2% |
| $10,000 to $14,999 | 42 | 9.9% |
| $15,000 to $24,999 | 101 | 23.9% |
| $25,000 to $34,999 | 27 | 6.4% |
| $35,000 to $49,999 | 85 | 20.1% |
| $50,000 to $74,999 | 46 | 10.9% |
| $75,000 to $99,999 | 91 | 21.5% |
| $100,000 to $149,999 | 25 | 5.9% |
| $150,000 to $199,999 | 2 | 0.5% |
| $200,000+ | 3 | 0.7% |
Household Income by Householder Age in Goodman
The median household income in Goodman is $40,913, with the highest median household income of $46,250 found in the 25 to 44 years age bracket for the primary householder. A total of 173 households (40.9%) fall into this category. Meanwhile, the 45 to 64 years age bracket for the primary householder has the lowest median household income of $0, with 118 households (27.9%) in this group.
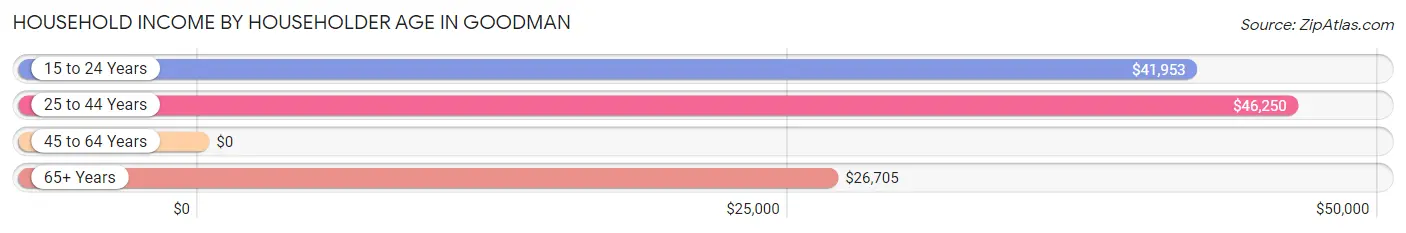
| Income Bracket | # Households | Median Income |
| 15 to 24 Years | 25 (5.9%) | $41,953 |
| 25 to 44 Years | 173 (40.9%) | $46,250 |
| 45 to 64 Years | 118 (27.9%) | $0 |
| 65+ Years | 107 (25.3%) | $26,705 |
| Total | 423 (100.0%) | $40,913 |
Poverty in Goodman
Income Below Poverty by Sex and Age in Goodman
With 29.7% poverty level for males and 17.0% for females among the residents of Goodman, 15 year old males and 45 to 54 year old females are the most vulnerable to poverty, with 25 males (86.2%) and 15 females (48.4%) in their respective age groups living below the poverty level.
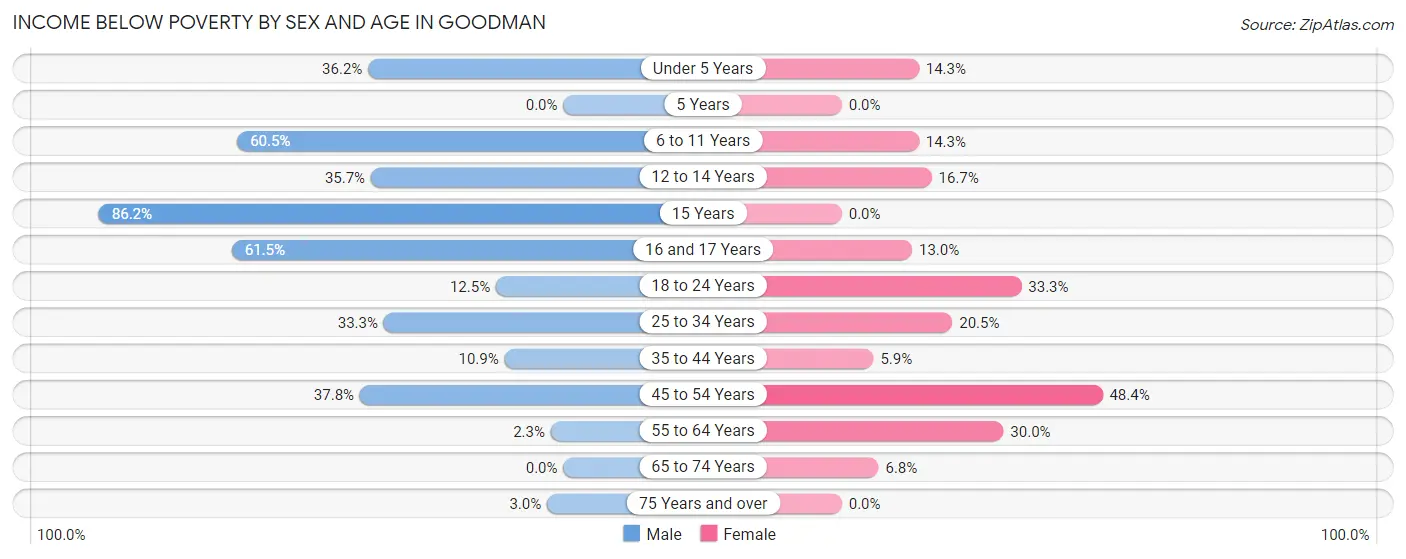
| Age Bracket | Male | Female |
| Under 5 Years | 25 (36.2%) | 4 (14.3%) |
| 5 Years | 0 (0.0%) | 0 (0.0%) |
| 6 to 11 Years | 23 (60.5%) | 4 (14.3%) |
| 12 to 14 Years | 10 (35.7%) | 11 (16.7%) |
| 15 Years | 25 (86.2%) | 0 (0.0%) |
| 16 and 17 Years | 8 (61.5%) | 3 (13.0%) |
| 18 to 24 Years | 8 (12.5%) | 27 (33.3%) |
| 25 to 34 Years | 24 (33.3%) | 24 (20.5%) |
| 35 to 44 Years | 6 (10.9%) | 4 (5.9%) |
| 45 to 54 Years | 37 (37.8%) | 15 (48.4%) |
| 55 to 64 Years | 1 (2.3%) | 12 (30.0%) |
| 65 to 74 Years | 0 (0.0%) | 3 (6.8%) |
| 75 Years and over | 1 (3.0%) | 0 (0.0%) |
| Total | 168 (29.7%) | 107 (17.0%) |
Income Above Poverty by Sex and Age in Goodman
According to the poverty statistics in Goodman, males aged 5 years and females aged 5 years are the age groups that are most secure financially, with 100.0% of males and 100.0% of females in these age groups living above the poverty line.
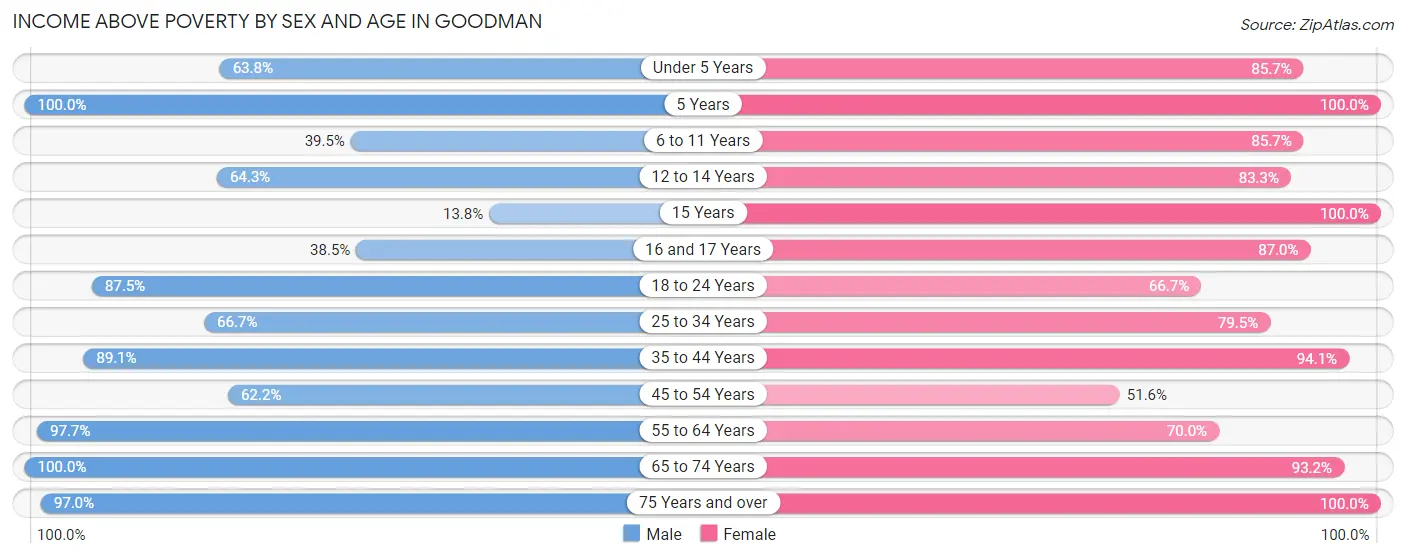
| Age Bracket | Male | Female |
| Under 5 Years | 44 (63.8%) | 24 (85.7%) |
| 5 Years | 3 (100.0%) | 14 (100.0%) |
| 6 to 11 Years | 15 (39.5%) | 24 (85.7%) |
| 12 to 14 Years | 18 (64.3%) | 55 (83.3%) |
| 15 Years | 4 (13.8%) | 6 (100.0%) |
| 16 and 17 Years | 5 (38.5%) | 20 (87.0%) |
| 18 to 24 Years | 56 (87.5%) | 54 (66.7%) |
| 25 to 34 Years | 48 (66.7%) | 93 (79.5%) |
| 35 to 44 Years | 49 (89.1%) | 64 (94.1%) |
| 45 to 54 Years | 61 (62.2%) | 16 (51.6%) |
| 55 to 64 Years | 42 (97.7%) | 28 (70.0%) |
| 65 to 74 Years | 21 (100.0%) | 41 (93.2%) |
| 75 Years and over | 32 (97.0%) | 84 (100.0%) |
| Total | 398 (70.3%) | 523 (83.0%) |
Income Below Poverty Among Married-Couple Families in Goodman
The poverty statistics for married-couple families in Goodman show that 16.5% or 31 of the total 188 families live below the poverty line. Families with 1 or 2 children have the highest poverty rate of 37.0%, comprising of 30 families. On the other hand, families with 3 or 4 children have the lowest poverty rate of 0.0%, which includes 0 families.
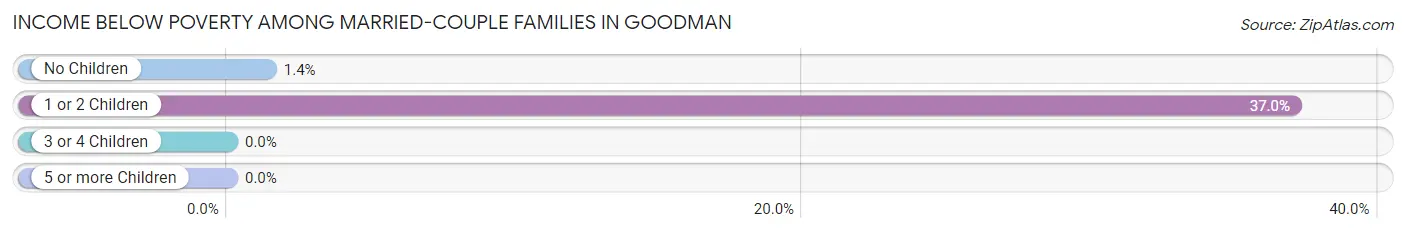
| Children | Above Poverty | Below Poverty |
| No Children | 73 (98.7%) | 1 (1.3%) |
| 1 or 2 Children | 51 (63.0%) | 30 (37.0%) |
| 3 or 4 Children | 29 (100.0%) | 0 (0.0%) |
| 5 or more Children | 4 (100.0%) | 0 (0.0%) |
| Total | 157 (83.5%) | 31 (16.5%) |
Income Below Poverty Among Single-Parent Households in Goodman
According to the poverty data in Goodman, 16.1% or 5 single-father households and 64.5% or 20 single-mother households are living below the poverty line. Among single-father households, those with 3 or 4 children have the highest poverty rate, with 4 households (44.4%) experiencing poverty. Likewise, among single-mother households, those with 3 or 4 children have the highest poverty rate, with 4 households (100.0%) falling below the poverty line.
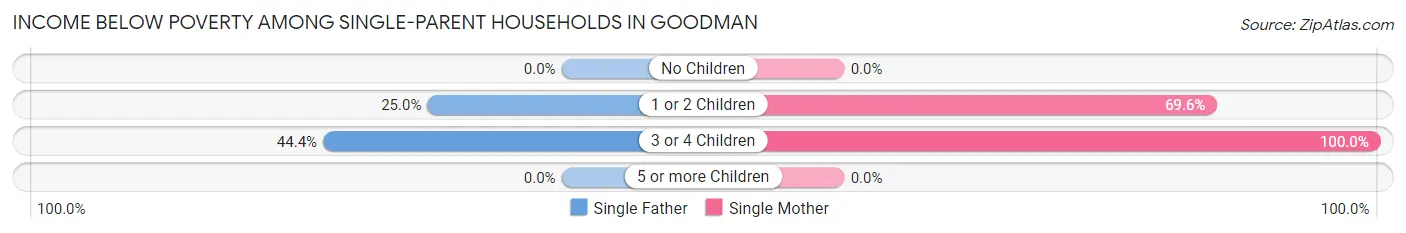
| Children | Single Father | Single Mother |
| No Children | 0 (0.0%) | 0 (0.0%) |
| 1 or 2 Children | 1 (25.0%) | 16 (69.6%) |
| 3 or 4 Children | 4 (44.4%) | 4 (100.0%) |
| 5 or more Children | 0 (0.0%) | 0 (0.0%) |
| Total | 5 (16.1%) | 20 (64.5%) |
Income Below Poverty Among Married-Couple vs Single-Parent Households in Goodman
The poverty data for Goodman shows that 31 of the married-couple family households (16.5%) and 25 of the single-parent households (40.3%) are living below the poverty level. Within the married-couple family households, those with 1 or 2 children have the highest poverty rate, with 30 households (37.0%) falling below the poverty line. Among the single-parent households, those with 1 or 2 children have the highest poverty rate, with 17 household (63.0%) living below poverty.
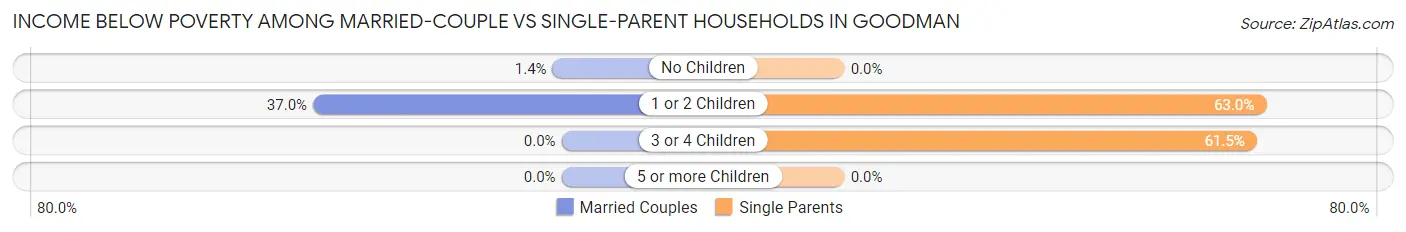
| Children | Married-Couple Families | Single-Parent Households |
| No Children | 1 (1.3%) | 0 (0.0%) |
| 1 or 2 Children | 30 (37.0%) | 17 (63.0%) |
| 3 or 4 Children | 0 (0.0%) | 8 (61.5%) |
| 5 or more Children | 0 (0.0%) | 0 (0.0%) |
| Total | 31 (16.5%) | 25 (40.3%) |
Race in Goodman
The most populous races in Goodman are White / Caucasian (936 | 77.5%), Hispanic or Latino (84 | 7.0%), and Hawaiian / Pacific (74 | 6.1%).
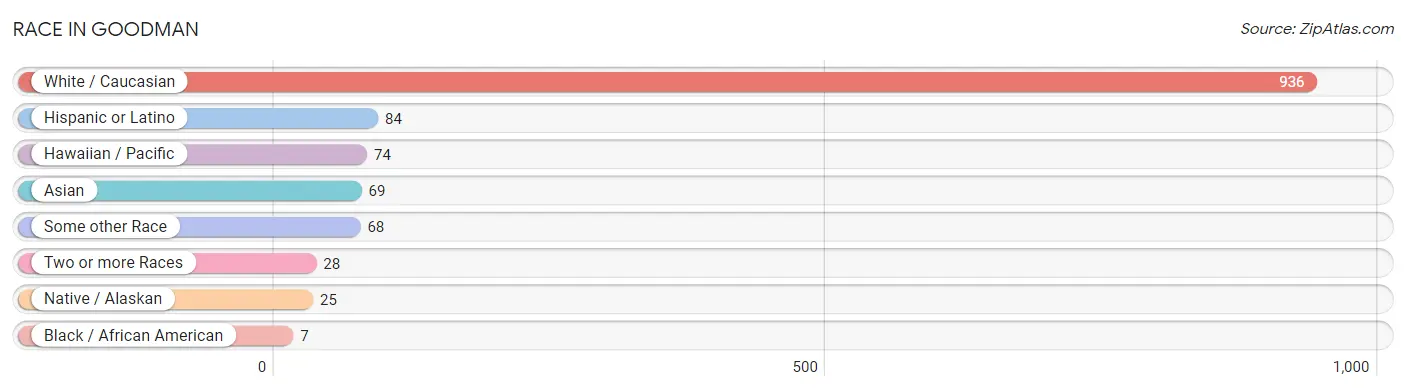
| Race | # Population | % Population |
| Asian | 69 | 5.7% |
| Black / African American | 7 | 0.6% |
| Hawaiian / Pacific | 74 | 6.1% |
| Hispanic or Latino | 84 | 7.0% |
| Native / Alaskan | 25 | 2.1% |
| White / Caucasian | 936 | 77.5% |
| Two or more Races | 28 | 2.3% |
| Some other Race | 68 | 5.6% |
| Total | 1,207 | 100.0% |
Ancestry in Goodman
The most populous ancestries reported in Goodman are German (109 | 9.0%), Irish (82 | 6.8%), Indonesian (69 | 5.7%), French (60 | 5.0%), and American (58 | 4.8%), together accounting for 31.3% of all Goodman residents.
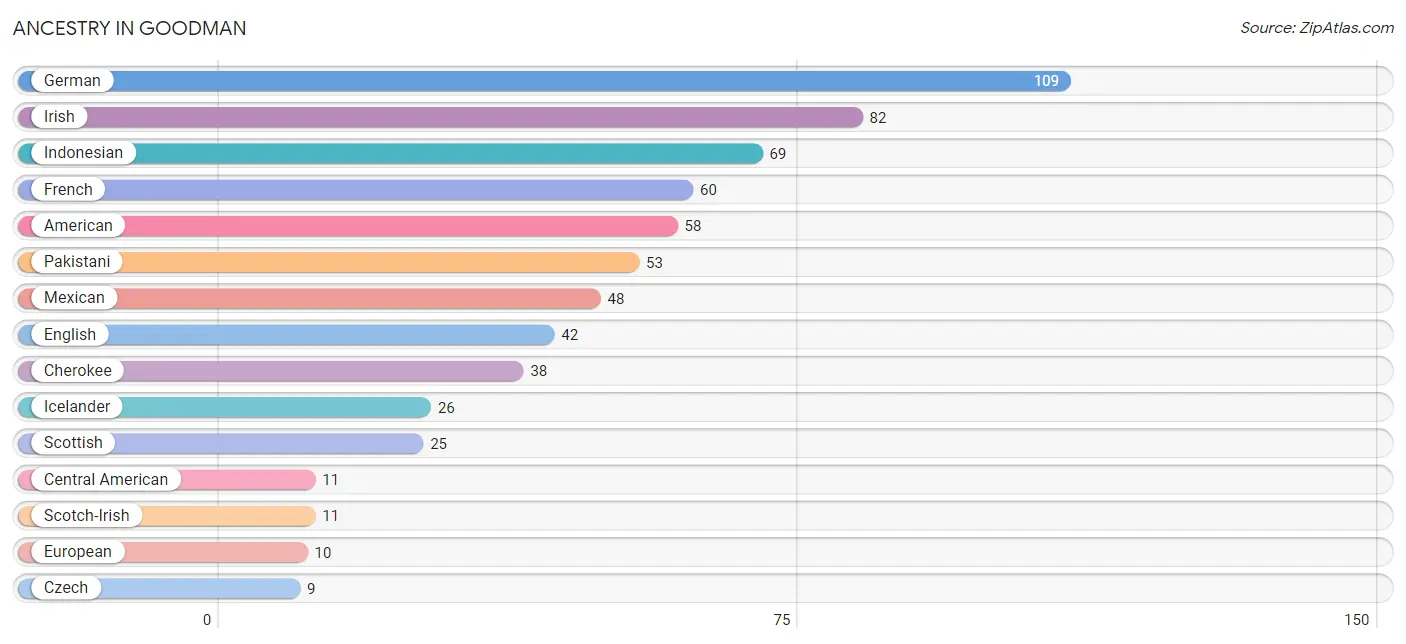
| Ancestry | # Population | % Population |
| American | 58 | 4.8% |
| Central American | 11 | 0.9% |
| Cherokee | 38 | 3.2% |
| Choctaw | 2 | 0.2% |
| Czech | 9 | 0.7% |
| English | 42 | 3.5% |
| European | 10 | 0.8% |
| French | 60 | 5.0% |
| French Canadian | 5 | 0.4% |
| German | 109 | 9.0% |
| Guatemalan | 3 | 0.3% |
| Icelander | 26 | 2.1% |
| Indonesian | 69 | 5.7% |
| Irish | 82 | 6.8% |
| Italian | 4 | 0.3% |
| Mexican | 48 | 4.0% |
| Norwegian | 5 | 0.4% |
| Ottawa | 9 | 0.7% |
| Pakistani | 53 | 4.4% |
| Polish | 2 | 0.2% |
| Salvadoran | 8 | 0.7% |
| Scotch-Irish | 11 | 0.9% |
| Scottish | 25 | 2.1% | View All 23 Rows |
Immigrants in Goodman
The most numerous immigrant groups reported in Goodman came from Asia (53 | 4.4%), South Eastern Asia (53 | 4.4%), Thailand (43 | 3.6%), Central America (22 | 1.8%), and Latin America (22 | 1.8%), together accounting for 16.0% of all Goodman residents.
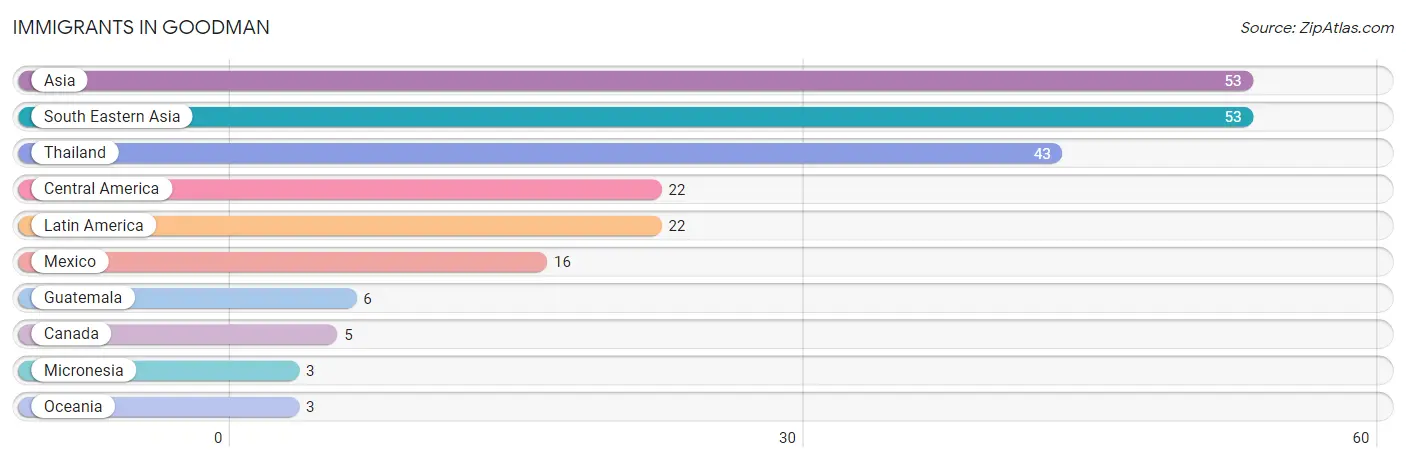
| Immigration Origin | # Population | % Population |
| Asia | 53 | 4.4% |
| Canada | 5 | 0.4% |
| Central America | 22 | 1.8% |
| Guatemala | 6 | 0.5% |
| Latin America | 22 | 1.8% |
| Mexico | 16 | 1.3% |
| Micronesia | 3 | 0.3% |
| Oceania | 3 | 0.3% |
| South Eastern Asia | 53 | 4.4% |
| Thailand | 43 | 3.6% | View All 10 Rows |
Sex and Age in Goodman
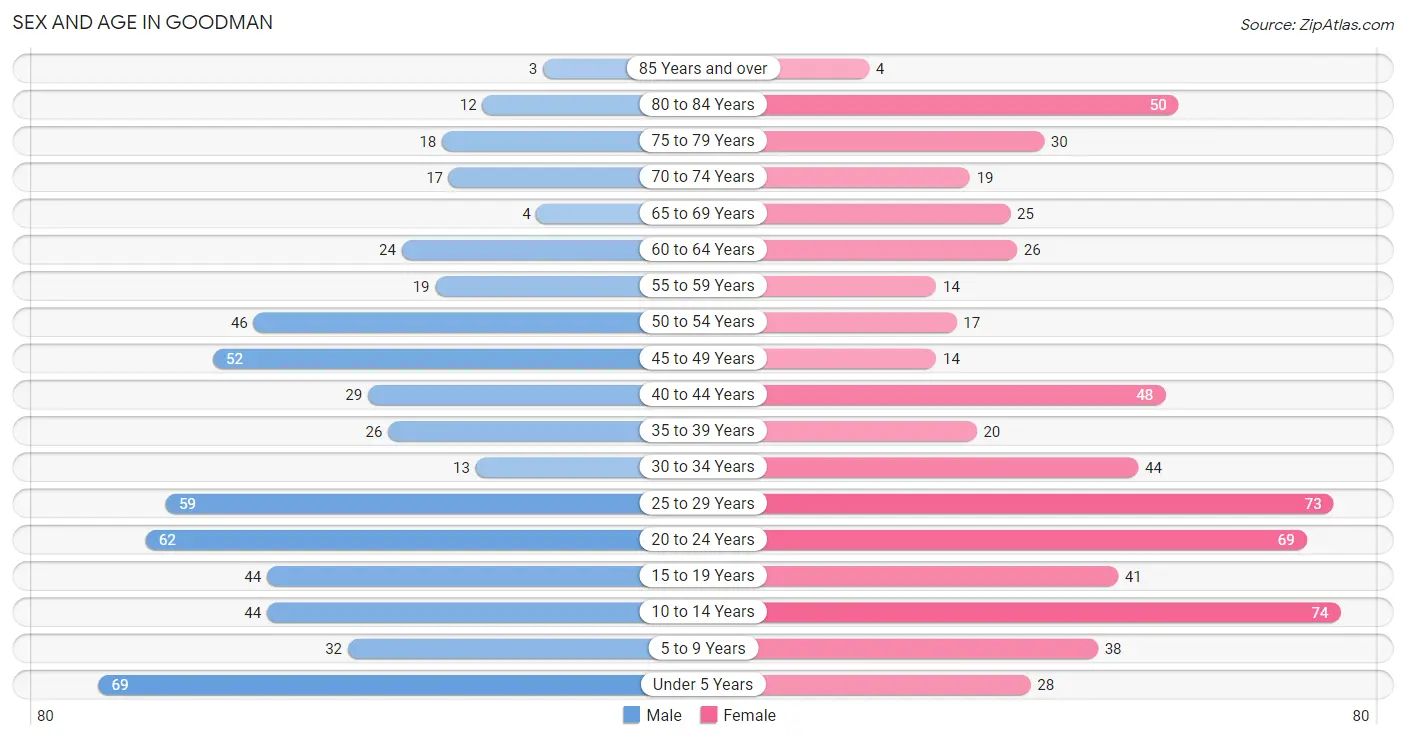
Sex and Age in Goodman
The most populous age groups in Goodman are Under 5 Years (69 | 12.0%) for men and 10 to 14 Years (74 | 11.7%) for women.
| Age Bracket | Male | Female |
| Under 5 Years | 69 (12.0%) | 28 (4.4%) |
| 5 to 9 Years | 32 (5.6%) | 38 (6.0%) |
| 10 to 14 Years | 44 (7.7%) | 74 (11.7%) |
| 15 to 19 Years | 44 (7.7%) | 41 (6.5%) |
| 20 to 24 Years | 62 (10.8%) | 69 (10.9%) |
| 25 to 29 Years | 59 (10.3%) | 73 (11.5%) |
| 30 to 34 Years | 13 (2.3%) | 44 (6.9%) |
| 35 to 39 Years | 26 (4.5%) | 20 (3.2%) |
| 40 to 44 Years | 29 (5.1%) | 48 (7.6%) |
| 45 to 49 Years | 52 (9.1%) | 14 (2.2%) |
| 50 to 54 Years | 46 (8.0%) | 17 (2.7%) |
| 55 to 59 Years | 19 (3.3%) | 14 (2.2%) |
| 60 to 64 Years | 24 (4.2%) | 26 (4.1%) |
| 65 to 69 Years | 4 (0.7%) | 25 (3.9%) |
| 70 to 74 Years | 17 (3.0%) | 19 (3.0%) |
| 75 to 79 Years | 18 (3.1%) | 30 (4.7%) |
| 80 to 84 Years | 12 (2.1%) | 50 (7.9%) |
| 85 Years and over | 3 (0.5%) | 4 (0.6%) |
| Total | 573 (100.0%) | 634 (100.0%) |
Families and Households in Goodman
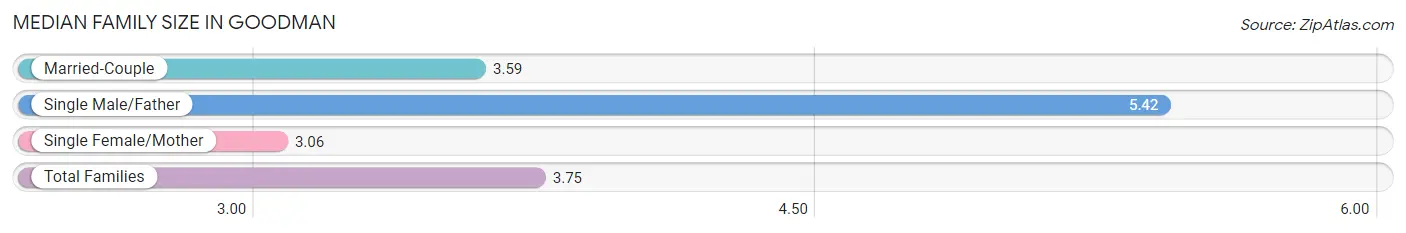
Median Family Size in Goodman
The median family size in Goodman is 3.75 persons per family, with single male/father families (31 | 12.4%) accounting for the largest median family size of 5.42 persons per family. On the other hand, single female/mother families (31 | 12.4%) represent the smallest median family size with 3.06 persons per family.
| Family Type | # Families | Family Size |
| Married-Couple | 188 (75.2%) | 3.59 |
| Single Male/Father | 31 (12.4%) | 5.42 |
| Single Female/Mother | 31 (12.4%) | 3.06 |
| Total Families | 250 (100.0%) | 3.75 |
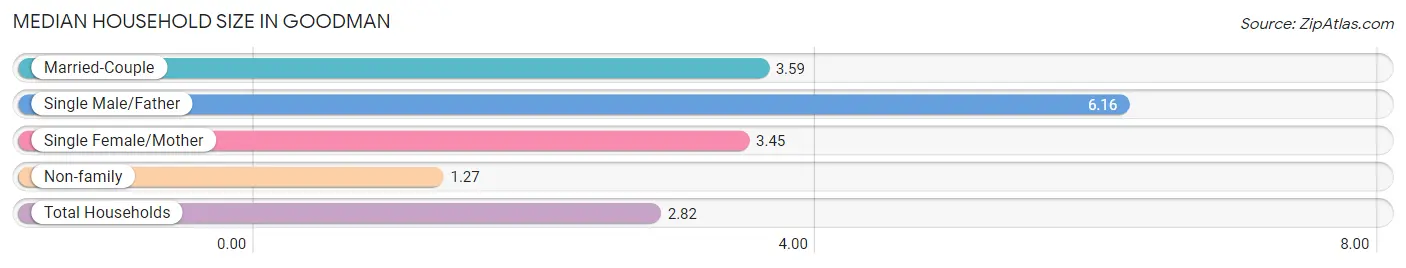
Median Household Size in Goodman
The median household size in Goodman is 2.82 persons per household, with single male/father households (31 | 7.3%) accounting for the largest median household size of 6.16 persons per household. non-family households (173 | 40.9%) represent the smallest median household size with 1.27 persons per household.
| Household Type | # Households | Household Size |
| Married-Couple | 188 (44.4%) | 3.59 |
| Single Male/Father | 31 (7.3%) | 6.16 |
| Single Female/Mother | 31 (7.3%) | 3.45 |
| Non-family | 173 (40.9%) | 1.27 |
| Total Households | 423 (100.0%) | 2.82 |
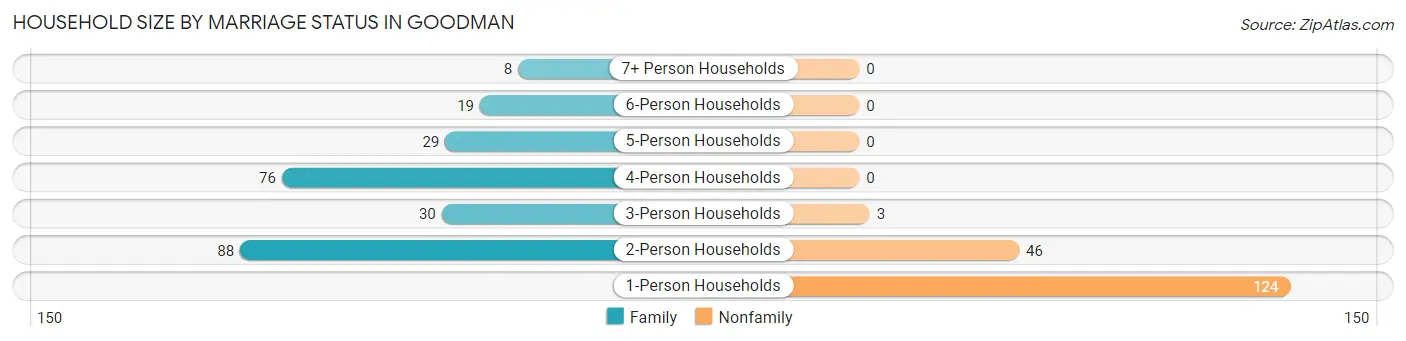
Household Size by Marriage Status in Goodman
Out of a total of 423 households in Goodman, 250 (59.1%) are family households, while 173 (40.9%) are nonfamily households. The most numerous type of family households are 2-person households, comprising 88, and the most common type of nonfamily households are 1-person households, comprising 124.
| Household Size | Family Households | Nonfamily Households |
| 1-Person Households | - | 124 (29.3%) |
| 2-Person Households | 88 (20.8%) | 46 (10.9%) |
| 3-Person Households | 30 (7.1%) | 3 (0.7%) |
| 4-Person Households | 76 (18.0%) | 0 (0.0%) |
| 5-Person Households | 29 (6.9%) | 0 (0.0%) |
| 6-Person Households | 19 (4.5%) | 0 (0.0%) |
| 7+ Person Households | 8 (1.9%) | 0 (0.0%) |
| Total | 250 (59.1%) | 173 (40.9%) |
Female Fertility in Goodman
Fertility by Age in Goodman
Average fertility rate in Goodman is 36.0 births per 1,000 women. Women in the age bracket of 20 to 34 years have the highest fertility rate with 59.0 births per 1,000 women. Women in the age bracket of 20 to 34 years acount for 100.0% of all women with births.
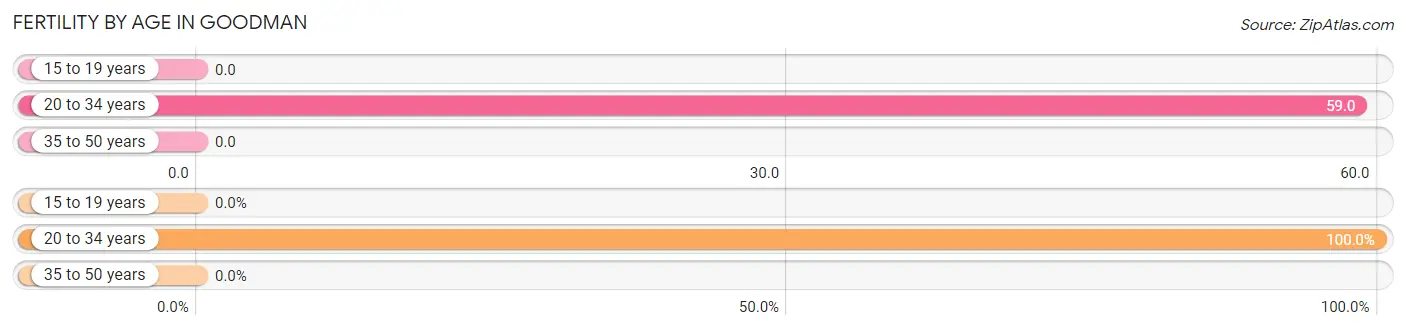
| Age Bracket | Women with Births | Births / 1,000 Women |
| 15 to 19 years | 0 (0.0%) | 0.0 |
| 20 to 34 years | 11 (100.0%) | 59.0 |
| 35 to 50 years | 0 (0.0%) | 0.0 |
| Total | 11 (100.0%) | 36.0 |
Fertility by Age by Marriage Status in Goodman
45.5% of women with births (11) in Goodman are married. The highest percentage of unmarried women with births falls into 20 to 34 years age bracket with 54.5% of them unmarried at the time of birth, while the lowest percentage of unmarried women with births belong to 20 to 34 years age bracket with 54.5% of them unmarried.
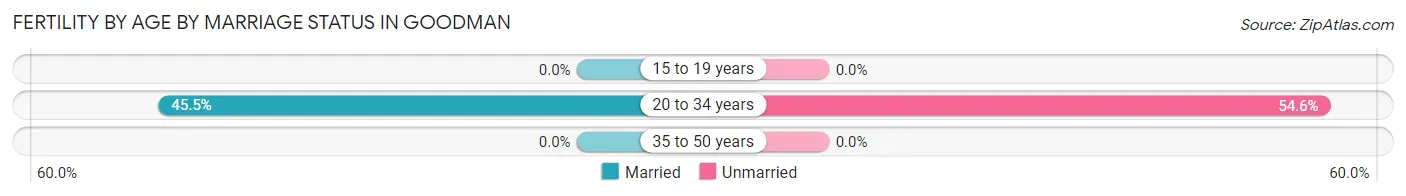
| Age Bracket | Married | Unmarried |
| 15 to 19 years | 0 (0.0%) | 0 (0.0%) |
| 20 to 34 years | 5 (45.5%) | 6 (54.5%) |
| 35 to 50 years | 0 (0.0%) | 0 (0.0%) |
| Total | 5 (45.5%) | 6 (54.5%) |
Fertility by Education in Goodman
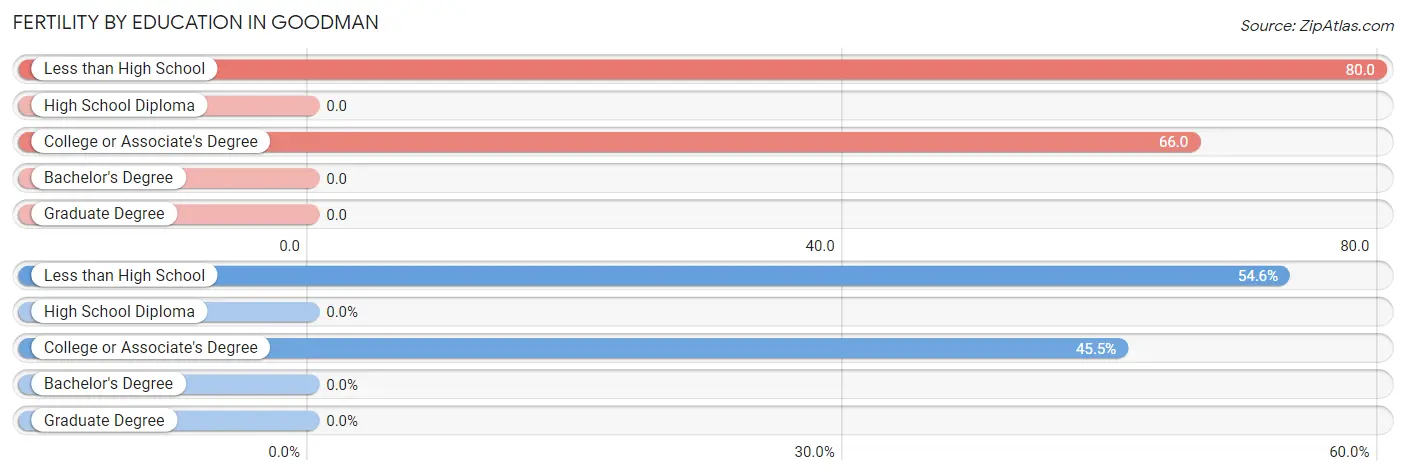
| Educational Attainment | Women with Births | Births / 1,000 Women |
| Less than High School | 6 (54.5%) | 80.0 |
| High School Diploma | 0 (0.0%) | 0.0 |
| College or Associate's Degree | 5 (45.5%) | 66.0 |
| Bachelor's Degree | 0 (0.0%) | 0.0 |
| Graduate Degree | 0 (0.0%) | 0.0 |
| Total | 11 (100.0%) | 36.0 |
Fertility by Education by Marriage Status in Goodman
54.5% of women with births in Goodman are unmarried. Women with the educational attainment of college or associate's degree are most likely to be married with 100.0% of them married at childbirth, while women with the educational attainment of less than high school are least likely to be married with 100.0% of them unmarried at childbirth.
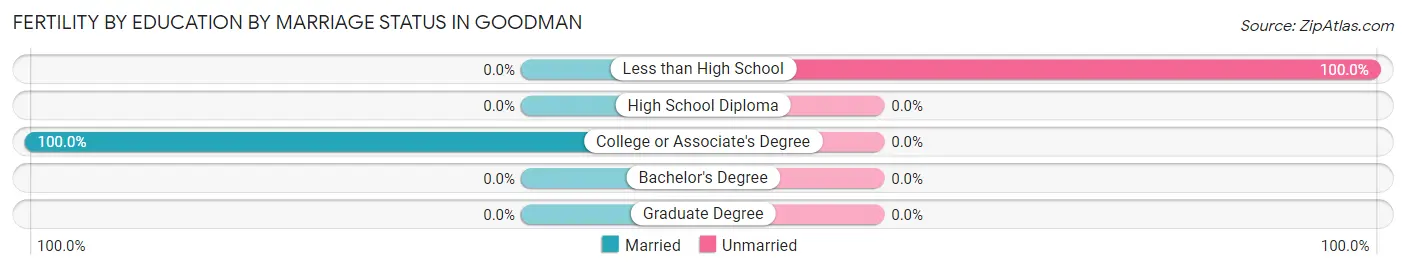
| Educational Attainment | Married | Unmarried |
| Less than High School | 0 (0.0%) | 6 (100.0%) |
| High School Diploma | 0 (0.0%) | 0 (0.0%) |
| College or Associate's Degree | 5 (100.0%) | 0 (0.0%) |
| Bachelor's Degree | 0 (0.0%) | 0 (0.0%) |
| Graduate Degree | 0 (0.0%) | 0 (0.0%) |
| Total | 5 (45.5%) | 6 (54.5%) |
Employment Characteristics in Goodman
Employment by Class of Employer in Goodman
Among the 433 employed individuals in Goodman, private company employees (301 | 69.5%), not-for-profit organizations (56 | 12.9%), and local government employees (41 | 9.5%) make up the most common classes of employment.
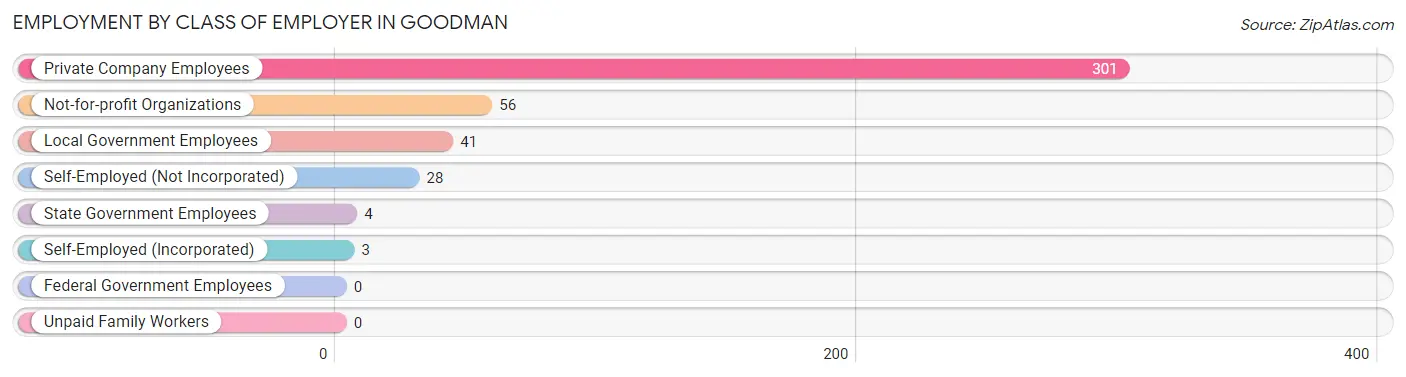
| Employer Class | # Employees | % Employees |
| Private Company Employees | 301 | 69.5% |
| Self-Employed (Incorporated) | 3 | 0.7% |
| Self-Employed (Not Incorporated) | 28 | 6.5% |
| Not-for-profit Organizations | 56 | 12.9% |
| Local Government Employees | 41 | 9.5% |
| State Government Employees | 4 | 0.9% |
| Federal Government Employees | 0 | 0.0% |
| Unpaid Family Workers | 0 | 0.0% |
| Total | 433 | 100.0% |
Employment Status by Age in Goodman
According to the labor force statistics for Goodman, out of the total population over 16 years of age (887), 51.0% or 452 individuals are in the labor force, with 3.5% or 16 of them unemployed. The age group with the highest labor force participation rate is 25 to 29 years, with 95.5% or 126 individuals in the labor force. Within the labor force, the 30 to 34 years age range has the highest percentage of unemployed individuals, with 15.8% or 6 of them being unemployed.
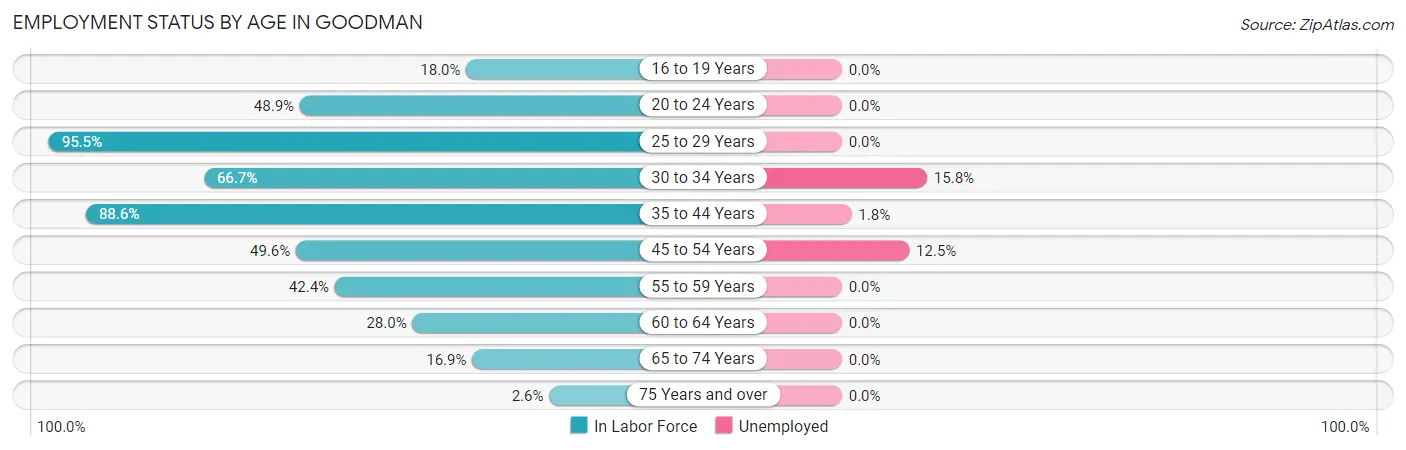
| Age Bracket | In Labor Force | Unemployed |
| 16 to 19 Years | 9 (18.0%) | 0 (0.0%) |
| 20 to 24 Years | 64 (48.9%) | 0 (0.0%) |
| 25 to 29 Years | 126 (95.5%) | 0 (0.0%) |
| 30 to 34 Years | 38 (66.7%) | 6 (15.8%) |
| 35 to 44 Years | 109 (88.6%) | 2 (1.8%) |
| 45 to 54 Years | 64 (49.6%) | 8 (12.5%) |
| 55 to 59 Years | 14 (42.4%) | 0 (0.0%) |
| 60 to 64 Years | 14 (28.0%) | 0 (0.0%) |
| 65 to 74 Years | 11 (16.9%) | 0 (0.0%) |
| 75 Years and over | 3 (2.6%) | 0 (0.0%) |
| Total | 452 (51.0%) | 16 (3.5%) |
Employment Status by Educational Attainment in Goodman
According to labor force statistics for Goodman, 69.7% of individuals (365) out of the total population between 25 and 64 years of age (524) are in the labor force, with 4.4% or 16 of them being unemployed. The group with the highest labor force participation rate are those with the educational attainment of bachelor's degree or higher, with 84.0% or 89 individuals in the labor force. Within the labor force, individuals with high school diploma education have the highest percentage of unemployment, with 13.9% or 16 of them being unemployed.
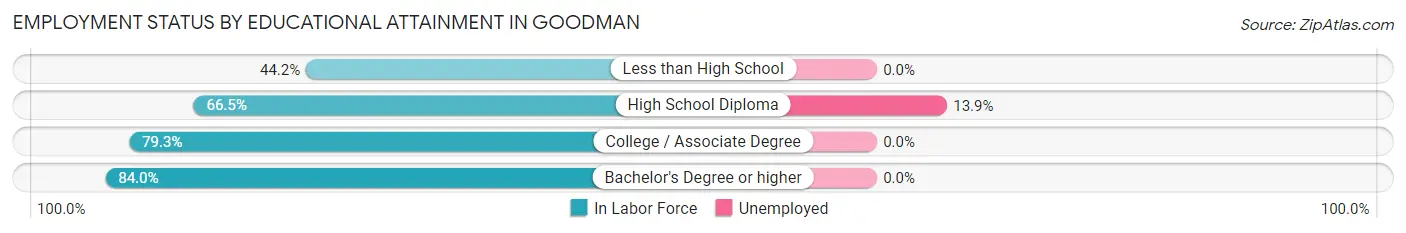
| Educational Attainment | In Labor Force | Unemployed |
| Less than High School | 42 (44.2%) | 0 (0.0%) |
| High School Diploma | 115 (66.5%) | 24 (13.9%) |
| College / Associate Degree | 119 (79.3%) | 0 (0.0%) |
| Bachelor's Degree or higher | 89 (84.0%) | 0 (0.0%) |
| Total | 365 (69.7%) | 23 (4.4%) |
Employment Occupations by Sex in Goodman
Management, Business, Science and Arts Occupations
The most common Management, Business, Science and Arts occupations in Goodman are Community & Social Service (83 | 19.0%), Education Instruction & Library (76 | 17.4%), Management (19 | 4.4%), Health Diagnosing & Treating (12 | 2.8%), and Computers, Engineering & Science (4 | 0.9%).
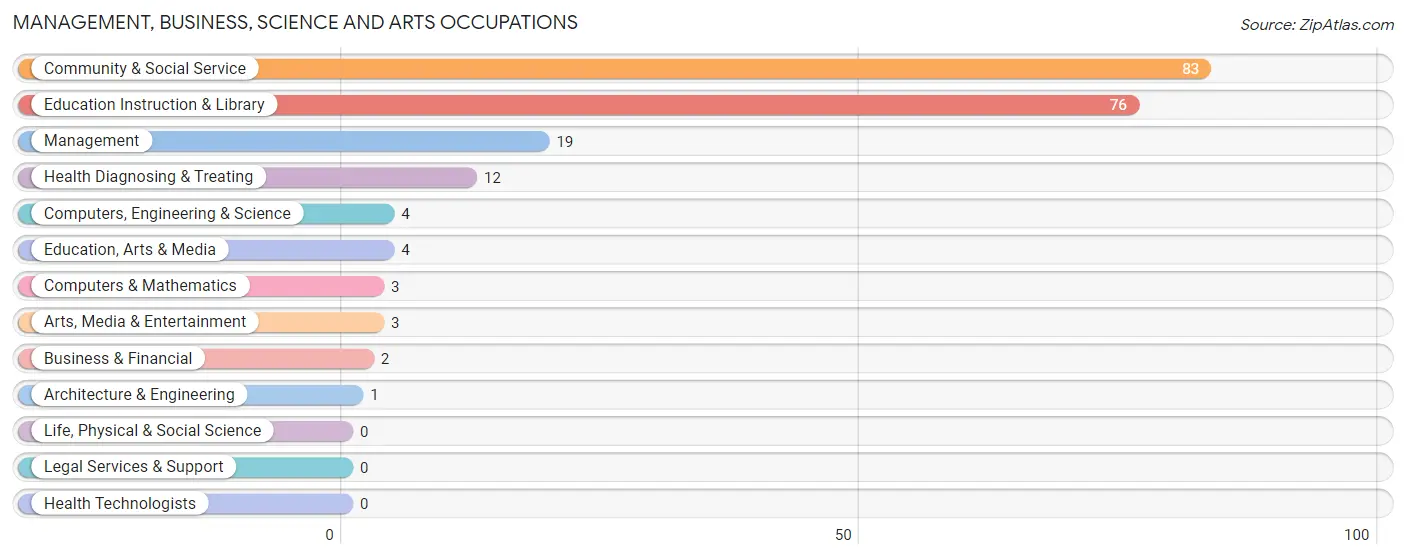
Management, Business, Science and Arts Occupations by Sex
Within the Management, Business, Science and Arts occupations in Goodman, the most male-oriented occupations are Computers, Engineering & Science (100.0%), Computers & Mathematics (100.0%), and Architecture & Engineering (100.0%), while the most female-oriented occupations are Business & Financial (100.0%), Education Instruction & Library (100.0%), and Arts, Media & Entertainment (100.0%).
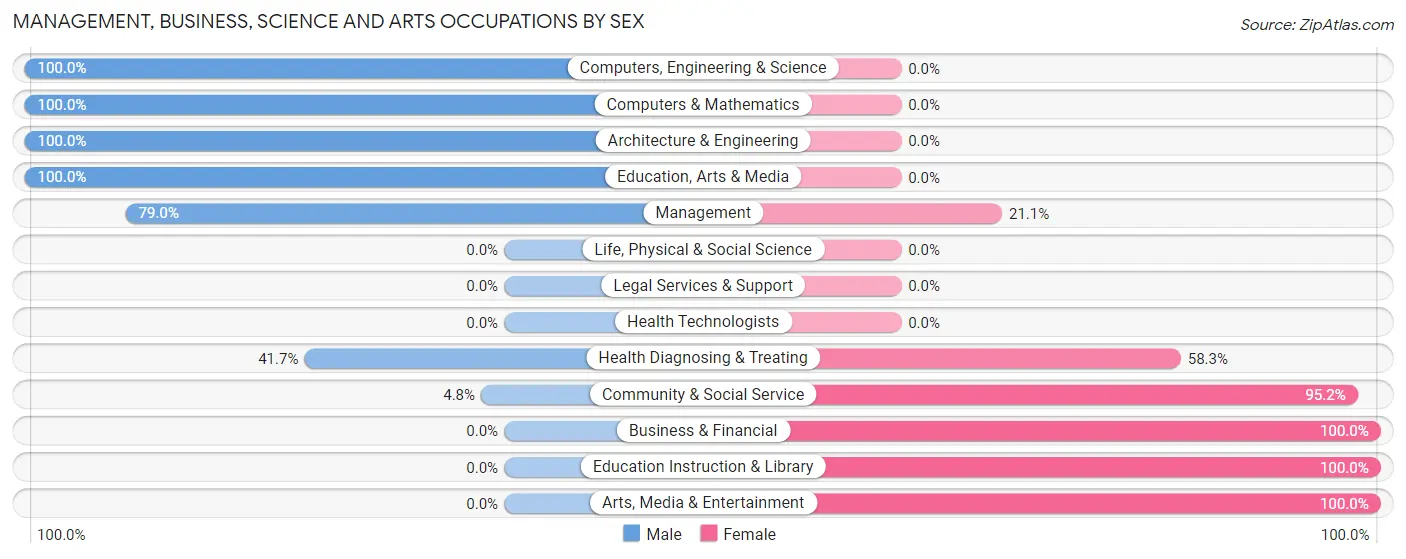
| Occupation | Male | Female |
| Management | 15 (78.9%) | 4 (21.0%) |
| Business & Financial | 0 (0.0%) | 2 (100.0%) |
| Computers, Engineering & Science | 4 (100.0%) | 0 (0.0%) |
| Computers & Mathematics | 3 (100.0%) | 0 (0.0%) |
| Architecture & Engineering | 1 (100.0%) | 0 (0.0%) |
| Life, Physical & Social Science | 0 (0.0%) | 0 (0.0%) |
| Community & Social Service | 4 (4.8%) | 79 (95.2%) |
| Education, Arts & Media | 4 (100.0%) | 0 (0.0%) |
| Legal Services & Support | 0 (0.0%) | 0 (0.0%) |
| Education Instruction & Library | 0 (0.0%) | 76 (100.0%) |
| Arts, Media & Entertainment | 0 (0.0%) | 3 (100.0%) |
| Health Diagnosing & Treating | 5 (41.7%) | 7 (58.3%) |
| Health Technologists | 0 (0.0%) | 0 (0.0%) |
| Total (Category) | 28 (23.3%) | 92 (76.7%) |
| Total (Overall) | 243 (55.7%) | 193 (44.3%) |
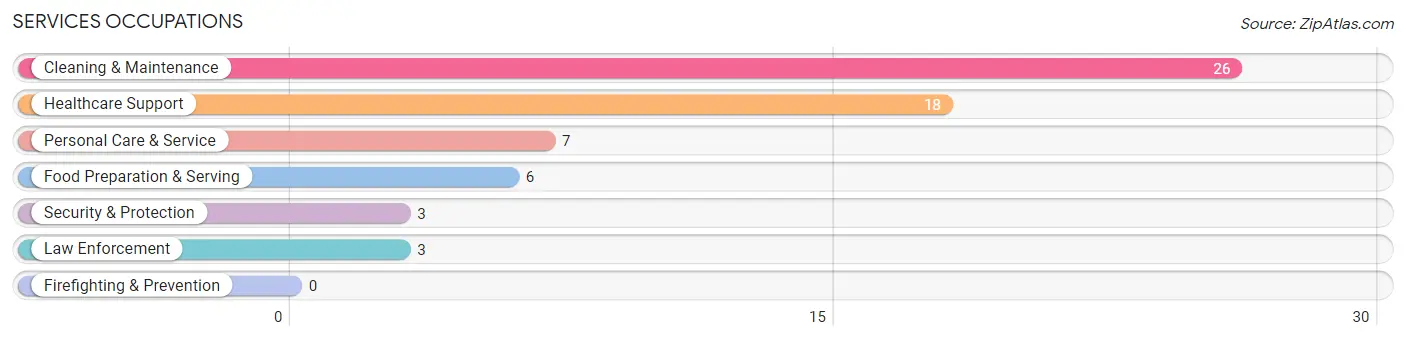
Services Occupations
The most common Services occupations in Goodman are Cleaning & Maintenance (26 | 6.0%), Healthcare Support (18 | 4.1%), Personal Care & Service (7 | 1.6%), Food Preparation & Serving (6 | 1.4%), and Security & Protection (3 | 0.7%).
Services Occupations by Sex
Within the Services occupations in Goodman, the most male-oriented occupations are Security & Protection (100.0%), Law Enforcement (100.0%), and Cleaning & Maintenance (69.2%), while the most female-oriented occupations are Food Preparation & Serving (100.0%), Personal Care & Service (100.0%), and Healthcare Support (72.2%).
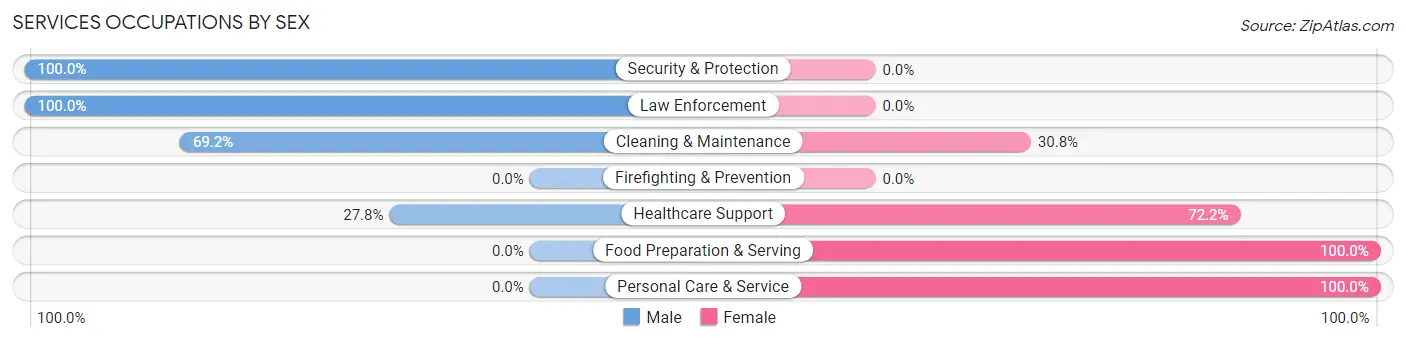
| Occupation | Male | Female |
| Healthcare Support | 5 (27.8%) | 13 (72.2%) |
| Security & Protection | 3 (100.0%) | 0 (0.0%) |
| Firefighting & Prevention | 0 (0.0%) | 0 (0.0%) |
| Law Enforcement | 3 (100.0%) | 0 (0.0%) |
| Food Preparation & Serving | 0 (0.0%) | 6 (100.0%) |
| Cleaning & Maintenance | 18 (69.2%) | 8 (30.8%) |
| Personal Care & Service | 0 (0.0%) | 7 (100.0%) |
| Total (Category) | 26 (43.3%) | 34 (56.7%) |
| Total (Overall) | 243 (55.7%) | 193 (44.3%) |
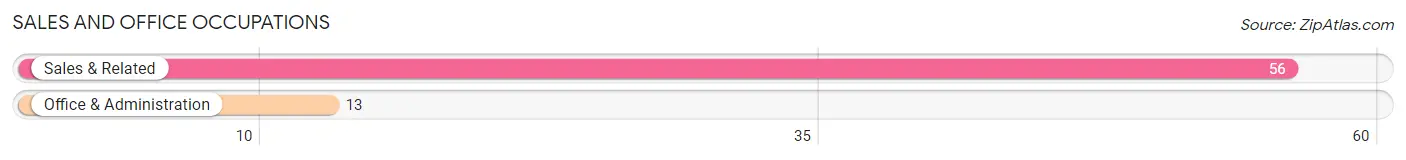
Sales and Office Occupations
The most common Sales and Office occupations in Goodman are Sales & Related (56 | 12.8%), and Office & Administration (13 | 3.0%).
Sales and Office Occupations by Sex
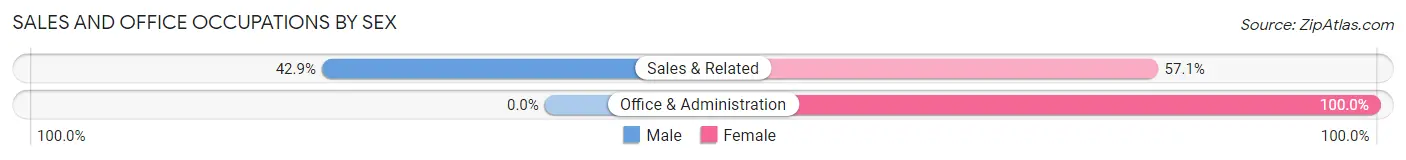
| Occupation | Male | Female |
| Sales & Related | 24 (42.9%) | 32 (57.1%) |
| Office & Administration | 0 (0.0%) | 13 (100.0%) |
| Total (Category) | 24 (34.8%) | 45 (65.2%) |
| Total (Overall) | 243 (55.7%) | 193 (44.3%) |
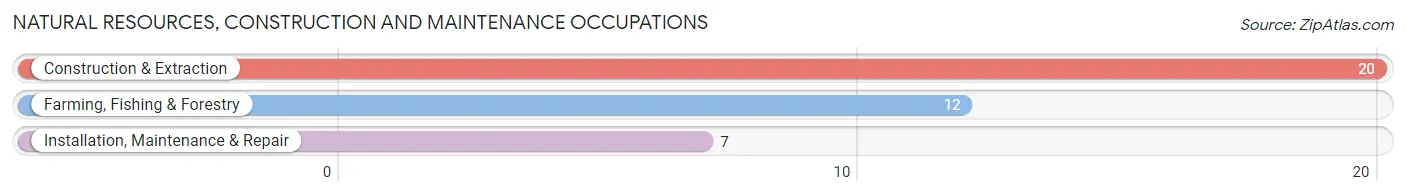
Natural Resources, Construction and Maintenance Occupations
The most common Natural Resources, Construction and Maintenance occupations in Goodman are Construction & Extraction (20 | 4.6%), Farming, Fishing & Forestry (12 | 2.8%), and Installation, Maintenance & Repair (7 | 1.6%).
Natural Resources, Construction and Maintenance Occupations by Sex
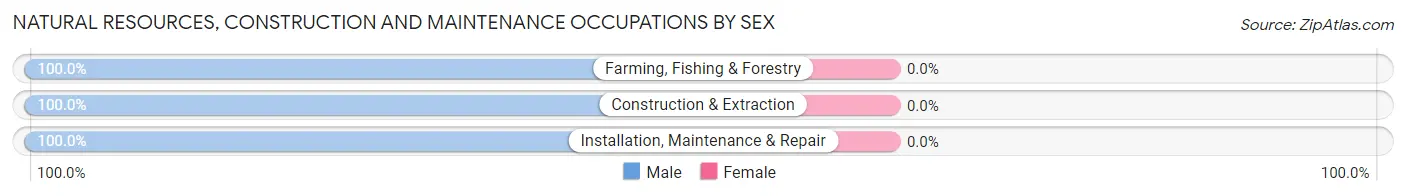
| Occupation | Male | Female |
| Farming, Fishing & Forestry | 12 (100.0%) | 0 (0.0%) |
| Construction & Extraction | 20 (100.0%) | 0 (0.0%) |
| Installation, Maintenance & Repair | 7 (100.0%) | 0 (0.0%) |
| Total (Category) | 39 (100.0%) | 0 (0.0%) |
| Total (Overall) | 243 (55.7%) | 193 (44.3%) |
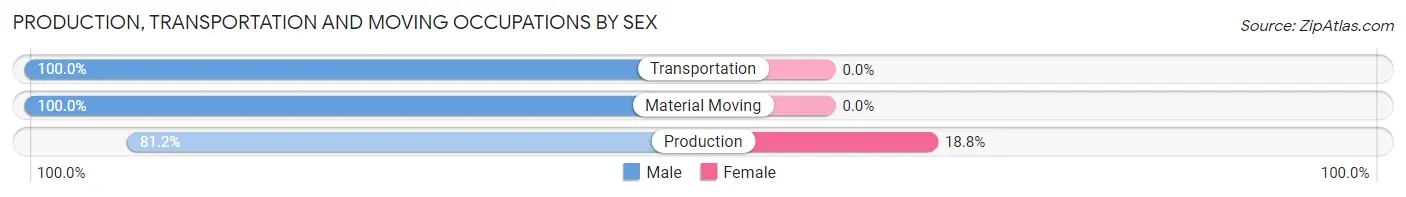
Production, Transportation and Moving Occupations
The most common Production, Transportation and Moving occupations in Goodman are Production (117 | 26.8%), Transportation (16 | 3.7%), and Material Moving (15 | 3.4%).
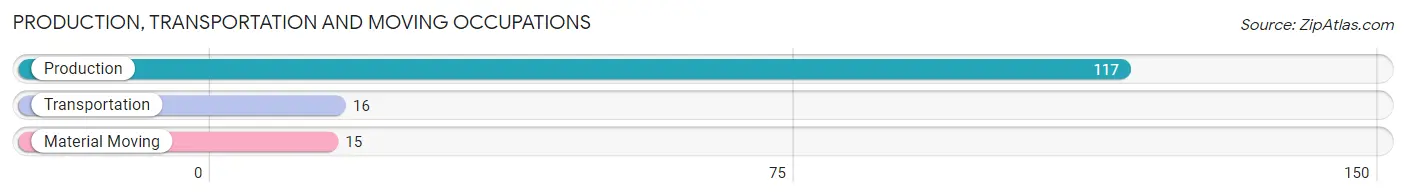
Production, Transportation and Moving Occupations by Sex
| Occupation | Male | Female |
| Production | 95 (81.2%) | 22 (18.8%) |
| Transportation | 16 (100.0%) | 0 (0.0%) |
| Material Moving | 15 (100.0%) | 0 (0.0%) |
| Total (Category) | 126 (85.1%) | 22 (14.9%) |
| Total (Overall) | 243 (55.7%) | 193 (44.3%) |
Employment Industries by Sex in Goodman
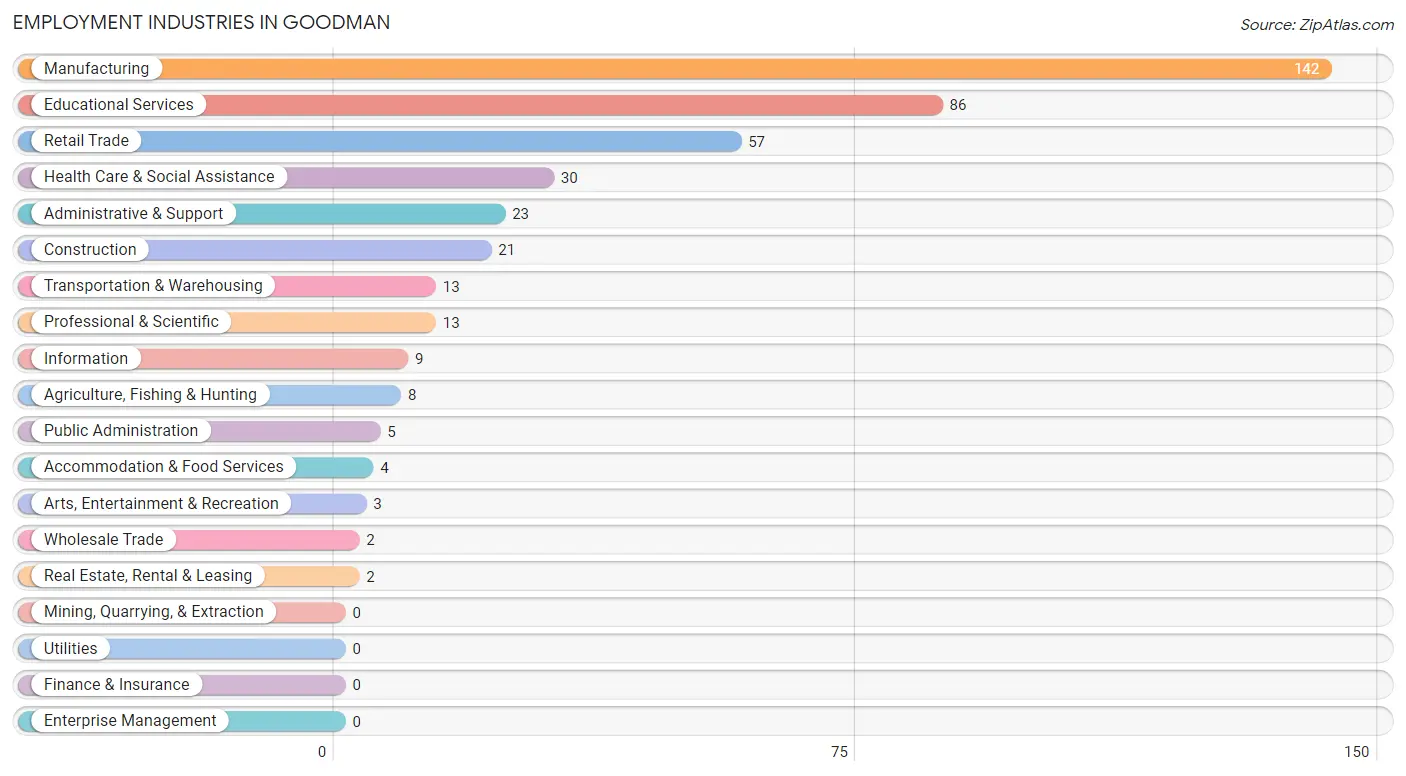
Employment Industries in Goodman
The major employment industries in Goodman include Manufacturing (142 | 32.6%), Educational Services (86 | 19.7%), Retail Trade (57 | 13.1%), Health Care & Social Assistance (30 | 6.9%), and Administrative & Support (23 | 5.3%).
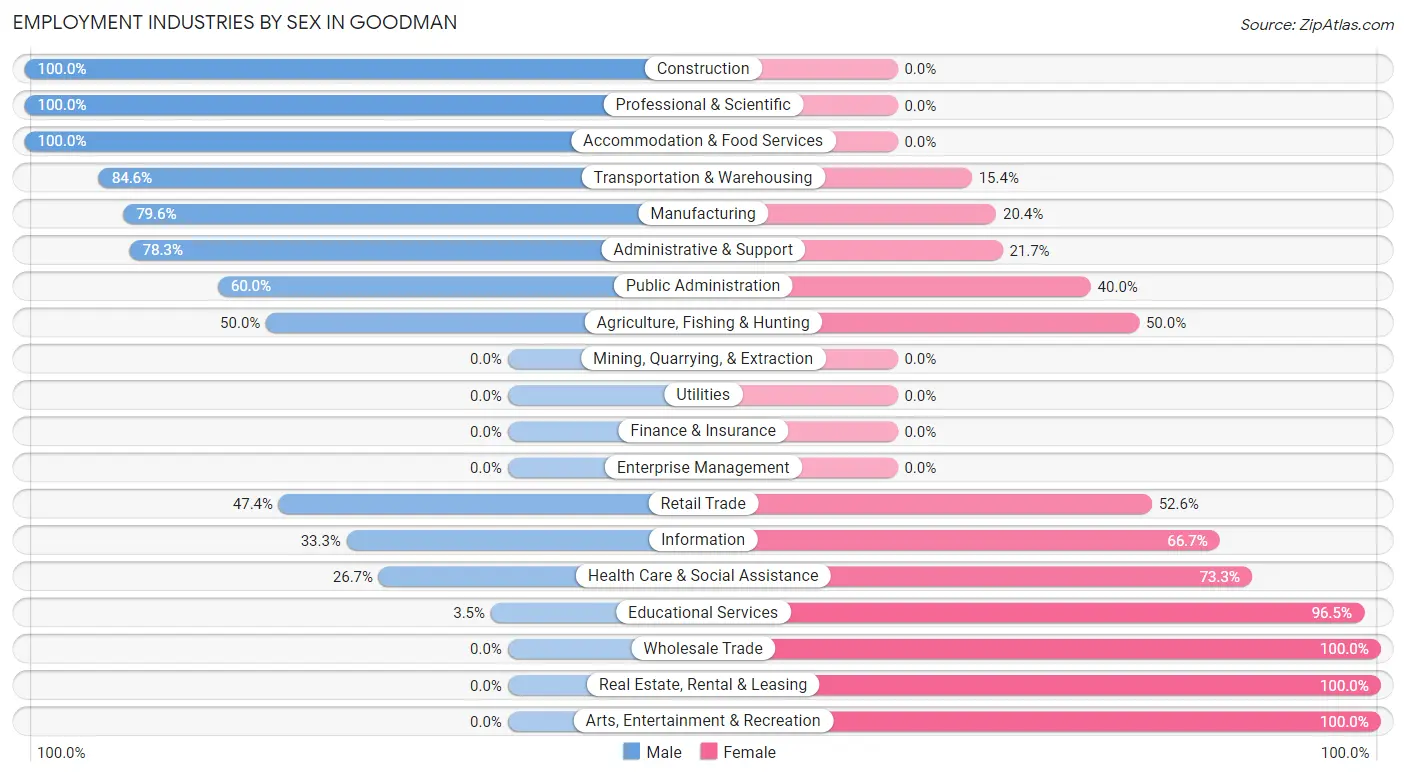
Employment Industries by Sex in Goodman
The Goodman industries that see more men than women are Construction (100.0%), Professional & Scientific (100.0%), and Accommodation & Food Services (100.0%), whereas the industries that tend to have a higher number of women are Wholesale Trade (100.0%), Real Estate, Rental & Leasing (100.0%), and Arts, Entertainment & Recreation (100.0%).
| Industry | Male | Female |
| Agriculture, Fishing & Hunting | 4 (50.0%) | 4 (50.0%) |
| Mining, Quarrying, & Extraction | 0 (0.0%) | 0 (0.0%) |
| Construction | 21 (100.0%) | 0 (0.0%) |
| Manufacturing | 113 (79.6%) | 29 (20.4%) |
| Wholesale Trade | 0 (0.0%) | 2 (100.0%) |
| Retail Trade | 27 (47.4%) | 30 (52.6%) |
| Transportation & Warehousing | 11 (84.6%) | 2 (15.4%) |
| Utilities | 0 (0.0%) | 0 (0.0%) |
| Information | 3 (33.3%) | 6 (66.7%) |
| Finance & Insurance | 0 (0.0%) | 0 (0.0%) |
| Real Estate, Rental & Leasing | 0 (0.0%) | 2 (100.0%) |
| Professional & Scientific | 13 (100.0%) | 0 (0.0%) |
| Enterprise Management | 0 (0.0%) | 0 (0.0%) |
| Administrative & Support | 18 (78.3%) | 5 (21.7%) |
| Educational Services | 3 (3.5%) | 83 (96.5%) |
| Health Care & Social Assistance | 8 (26.7%) | 22 (73.3%) |
| Arts, Entertainment & Recreation | 0 (0.0%) | 3 (100.0%) |
| Accommodation & Food Services | 4 (100.0%) | 0 (0.0%) |
| Public Administration | 3 (60.0%) | 2 (40.0%) |
| Total | 243 (55.7%) | 193 (44.3%) |
Education in Goodman
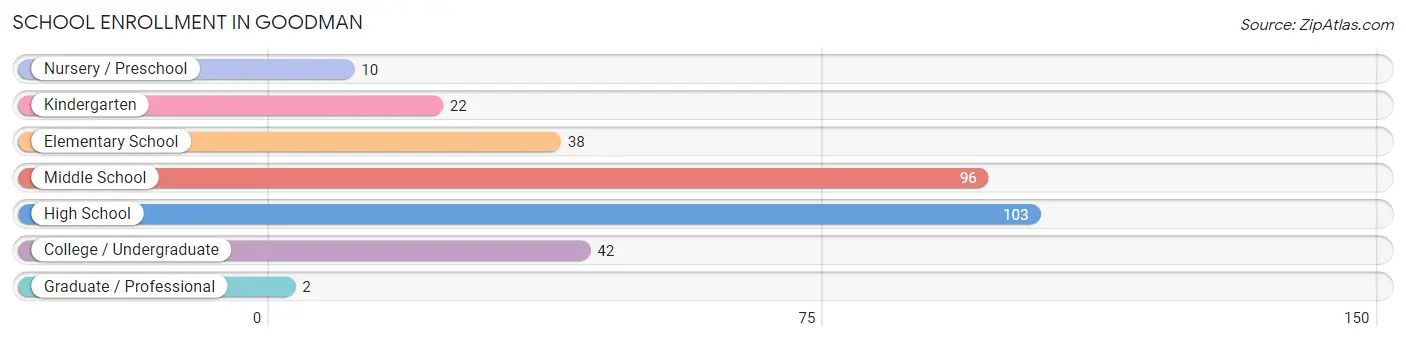
School Enrollment in Goodman
The most common levels of schooling among the 313 students in Goodman are high school (103 | 32.9%), middle school (96 | 30.7%), and college / undergraduate (42 | 13.4%).
| School Level | # Students | % Students |
| Nursery / Preschool | 10 | 3.2% |
| Kindergarten | 22 | 7.0% |
| Elementary School | 38 | 12.1% |
| Middle School | 96 | 30.7% |
| High School | 103 | 32.9% |
| College / Undergraduate | 42 | 13.4% |
| Graduate / Professional | 2 | 0.6% |
| Total | 313 | 100.0% |
School Enrollment by Age by Funding Source in Goodman
Out of a total of 313 students who are enrolled in schools in Goodman, 2 (0.6%) attend a private institution, while the remaining 311 (99.4%) are enrolled in public schools. The age group of 35 years and over has the highest likelihood of being enrolled in private schools, with 2 (100.0% in the age bracket) enrolled. Conversely, the age group of 3 to 4 year olds has the lowest likelihood of being enrolled in a private school, with 10 (100.0% in the age bracket) attending a public institution.
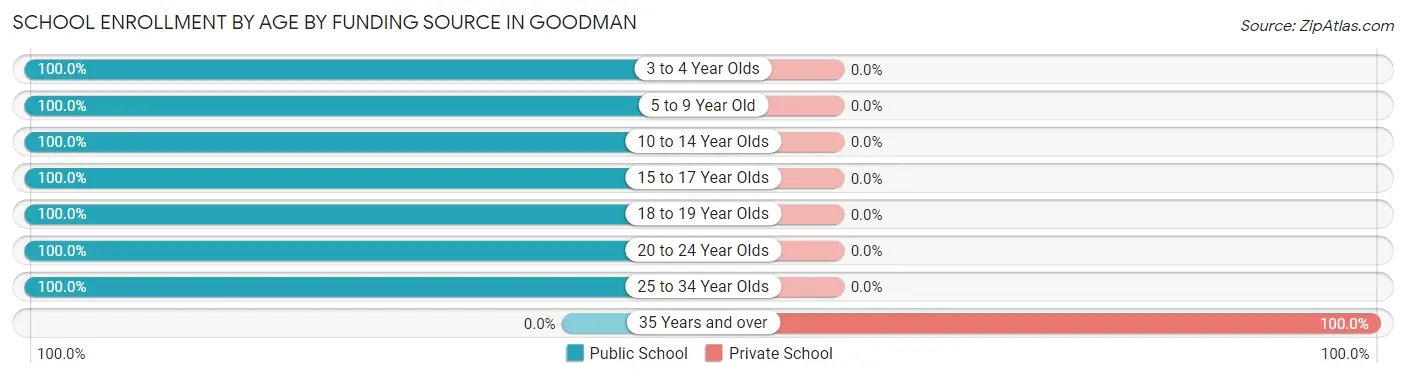
| Age Bracket | Public School | Private School |
| 3 to 4 Year Olds | 10 (100.0%) | 0 (0.0%) |
| 5 to 9 Year Old | 60 (100.0%) | 0 (0.0%) |
| 10 to 14 Year Olds | 118 (100.0%) | 0 (0.0%) |
| 15 to 17 Year Olds | 71 (100.0%) | 0 (0.0%) |
| 18 to 19 Year Olds | 14 (100.0%) | 0 (0.0%) |
| 20 to 24 Year Olds | 23 (100.0%) | 0 (0.0%) |
| 25 to 34 Year Olds | 15 (100.0%) | 0 (0.0%) |
| 35 Years and over | 0 (0.0%) | 2 (100.0%) |
| Total | 311 (99.4%) | 2 (0.6%) |
Educational Attainment by Field of Study in Goodman
Education (69 | 44.2%), psychology (30 | 19.2%), literature & languages (18 | 11.5%), bio, nature & agricultural (11 | 7.0%), and business (11 | 7.0%) are the most common fields of study among 156 individuals in Goodman who have obtained a bachelor's degree or higher.
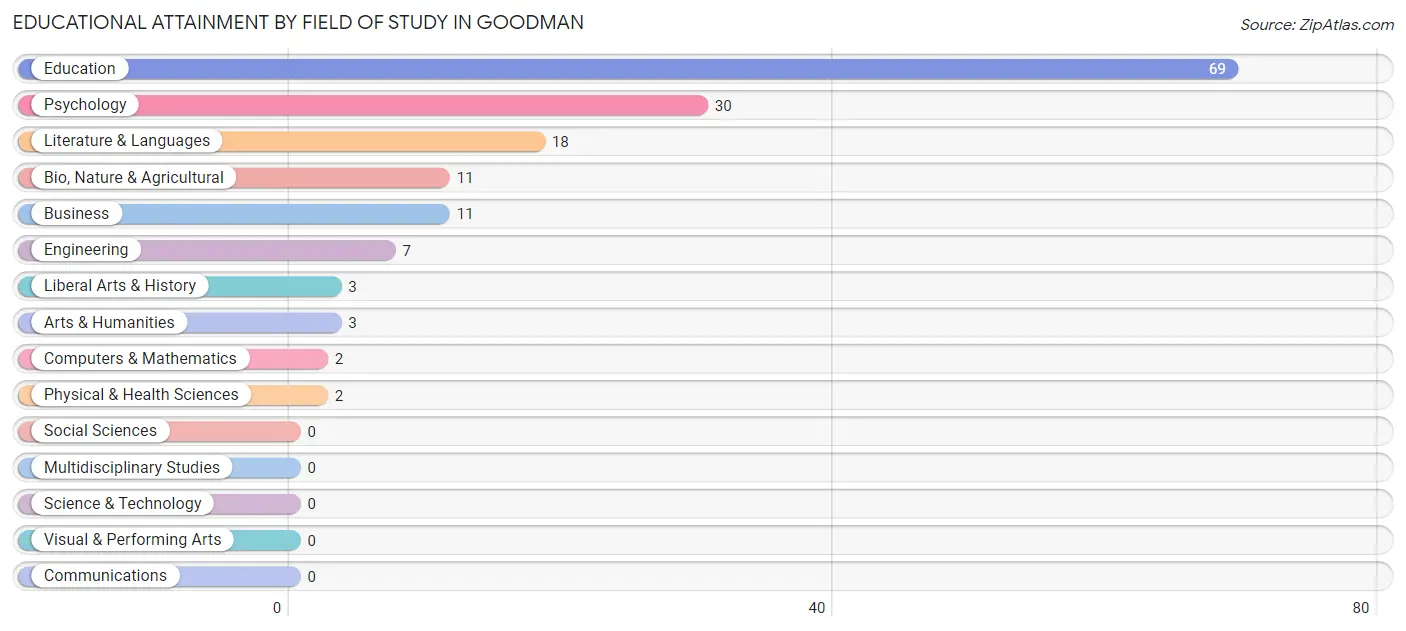
| Field of Study | # Graduates | % Graduates |
| Computers & Mathematics | 2 | 1.3% |
| Bio, Nature & Agricultural | 11 | 7.0% |
| Physical & Health Sciences | 2 | 1.3% |
| Psychology | 30 | 19.2% |
| Social Sciences | 0 | 0.0% |
| Engineering | 7 | 4.5% |
| Multidisciplinary Studies | 0 | 0.0% |
| Science & Technology | 0 | 0.0% |
| Business | 11 | 7.0% |
| Education | 69 | 44.2% |
| Literature & Languages | 18 | 11.5% |
| Liberal Arts & History | 3 | 1.9% |
| Visual & Performing Arts | 0 | 0.0% |
| Communications | 0 | 0.0% |
| Arts & Humanities | 3 | 1.9% |
| Total | 156 | 100.0% |
Transportation & Commute in Goodman
Vehicle Availability by Sex in Goodman
The most prevalent vehicle ownership categories in Goodman are males with 2 vehicles (87, accounting for 35.8%) and females with 2 vehicles (67, making up 45.8%).
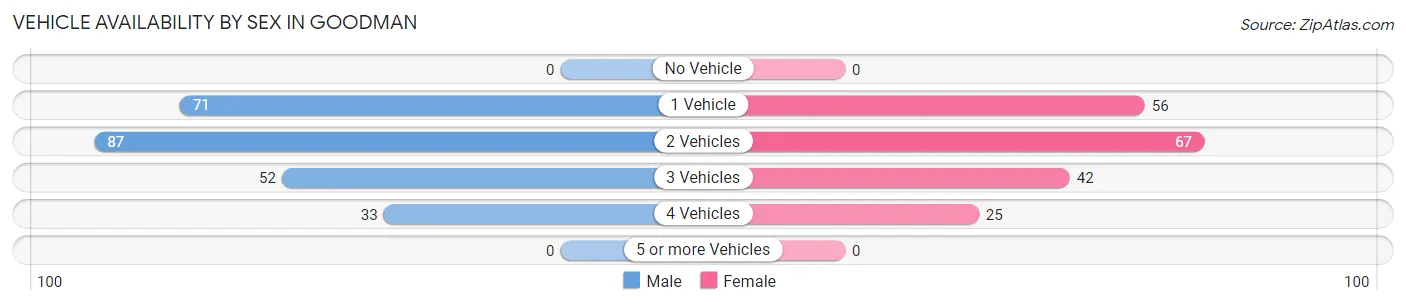
| Vehicles Available | Male | Female |
| No Vehicle | 0 (0.0%) | 0 (0.0%) |
| 1 Vehicle | 71 (29.2%) | 56 (29.5%) |
| 2 Vehicles | 87 (35.8%) | 67 (35.3%) |
| 3 Vehicles | 52 (21.4%) | 42 (22.1%) |
| 4 Vehicles | 33 (13.6%) | 25 (13.2%) |
| 5 or more Vehicles | 0 (0.0%) | 0 (0.0%) |
| Total | 243 (100.0%) | 190 (100.0%) |
Commute Time in Goodman
The most frequently occuring commute durations in Goodman are 20 to 24 minutes (113 commuters, 29.1%), 45 to 59 minutes (47 commuters, 12.1%), and 30 to 34 minutes (42 commuters, 10.8%).
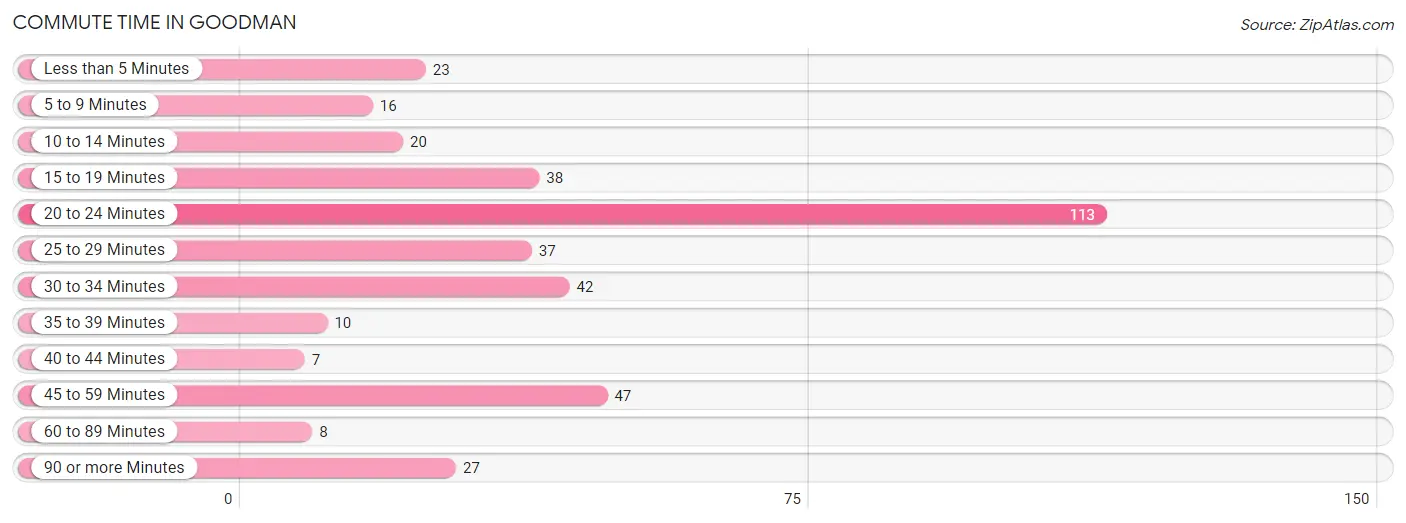
| Commute Time | # Commuters | % Commuters |
| Less than 5 Minutes | 23 | 5.9% |
| 5 to 9 Minutes | 16 | 4.1% |
| 10 to 14 Minutes | 20 | 5.1% |
| 15 to 19 Minutes | 38 | 9.8% |
| 20 to 24 Minutes | 113 | 29.1% |
| 25 to 29 Minutes | 37 | 9.5% |
| 30 to 34 Minutes | 42 | 10.8% |
| 35 to 39 Minutes | 10 | 2.6% |
| 40 to 44 Minutes | 7 | 1.8% |
| 45 to 59 Minutes | 47 | 12.1% |
| 60 to 89 Minutes | 8 | 2.1% |
| 90 or more Minutes | 27 | 7.0% |
Commute Time by Sex in Goodman
The most common commute times in Goodman are 20 to 24 minutes (59 commuters, 24.5%) for males and 20 to 24 minutes (54 commuters, 36.7%) for females.
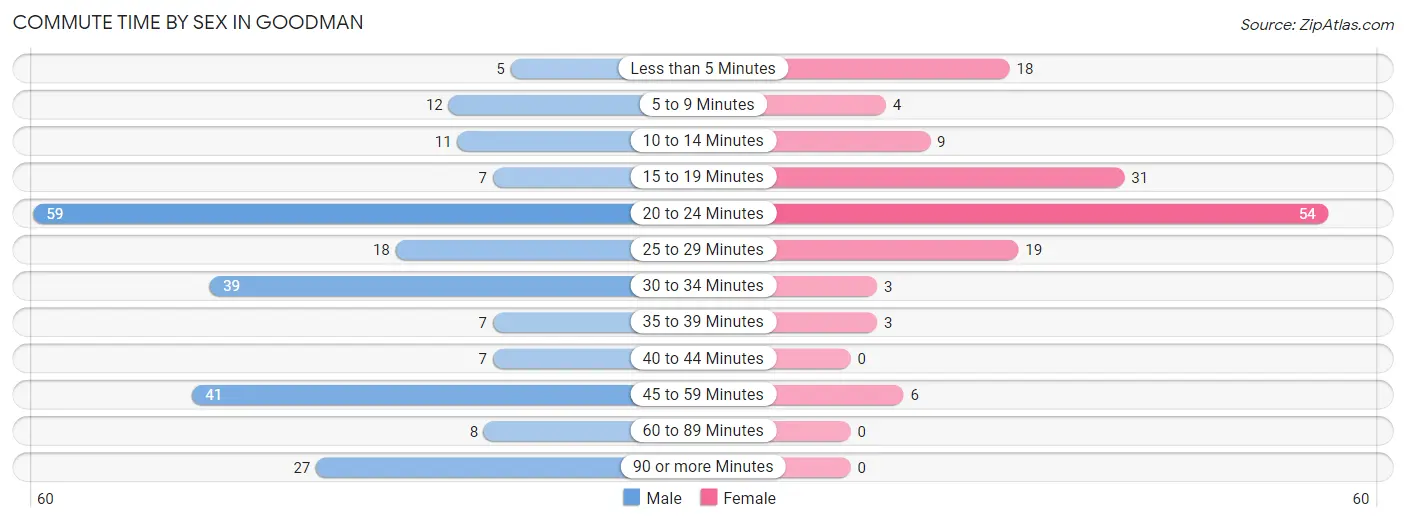
| Commute Time | Male | Female |
| Less than 5 Minutes | 5 (2.1%) | 18 (12.2%) |
| 5 to 9 Minutes | 12 (5.0%) | 4 (2.7%) |
| 10 to 14 Minutes | 11 (4.6%) | 9 (6.1%) |
| 15 to 19 Minutes | 7 (2.9%) | 31 (21.1%) |
| 20 to 24 Minutes | 59 (24.5%) | 54 (36.7%) |
| 25 to 29 Minutes | 18 (7.5%) | 19 (12.9%) |
| 30 to 34 Minutes | 39 (16.2%) | 3 (2.0%) |
| 35 to 39 Minutes | 7 (2.9%) | 3 (2.0%) |
| 40 to 44 Minutes | 7 (2.9%) | 0 (0.0%) |
| 45 to 59 Minutes | 41 (17.0%) | 6 (4.1%) |
| 60 to 89 Minutes | 8 (3.3%) | 0 (0.0%) |
| 90 or more Minutes | 27 (11.2%) | 0 (0.0%) |
Time of Departure to Work by Sex in Goodman
The most frequent times of departure to work in Goodman are 12:00 PM to 3:59 PM (43, 17.8%) for males and 6:30 AM to 6:59 AM (44, 29.9%) for females.
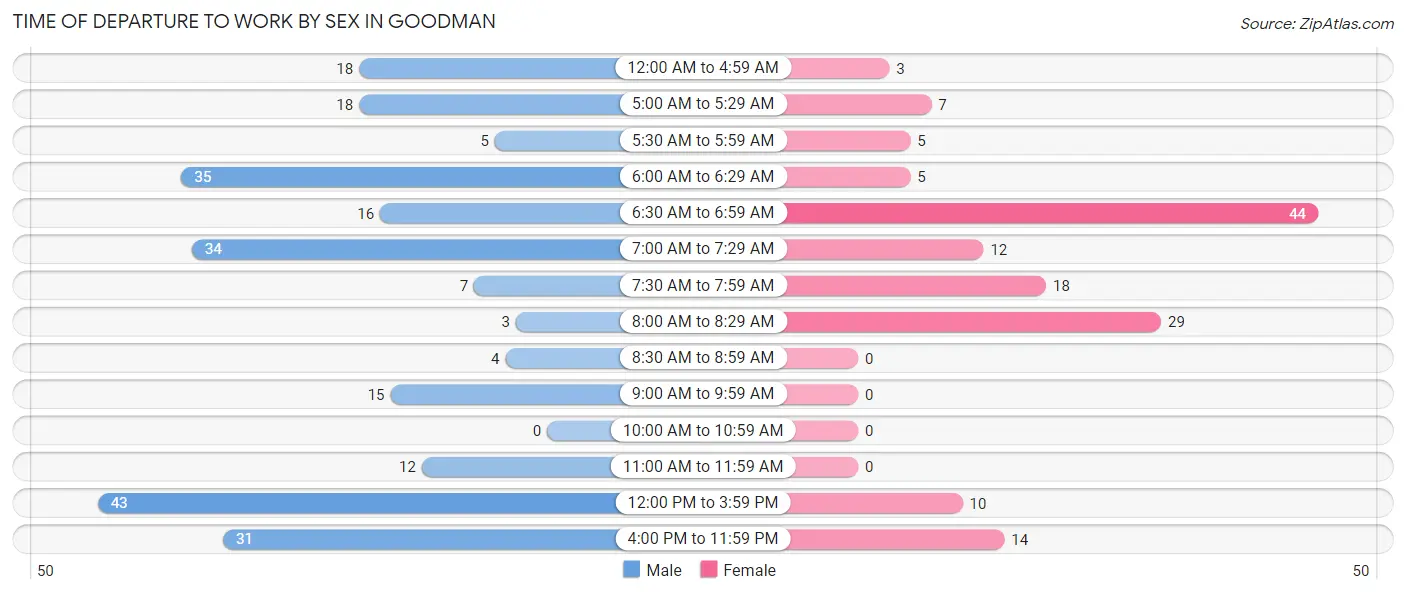
| Time of Departure | Male | Female |
| 12:00 AM to 4:59 AM | 18 (7.5%) | 3 (2.0%) |
| 5:00 AM to 5:29 AM | 18 (7.5%) | 7 (4.8%) |
| 5:30 AM to 5:59 AM | 5 (2.1%) | 5 (3.4%) |
| 6:00 AM to 6:29 AM | 35 (14.5%) | 5 (3.4%) |
| 6:30 AM to 6:59 AM | 16 (6.6%) | 44 (29.9%) |
| 7:00 AM to 7:29 AM | 34 (14.1%) | 12 (8.2%) |
| 7:30 AM to 7:59 AM | 7 (2.9%) | 18 (12.2%) |
| 8:00 AM to 8:29 AM | 3 (1.2%) | 29 (19.7%) |
| 8:30 AM to 8:59 AM | 4 (1.7%) | 0 (0.0%) |
| 9:00 AM to 9:59 AM | 15 (6.2%) | 0 (0.0%) |
| 10:00 AM to 10:59 AM | 0 (0.0%) | 0 (0.0%) |
| 11:00 AM to 11:59 AM | 12 (5.0%) | 0 (0.0%) |
| 12:00 PM to 3:59 PM | 43 (17.8%) | 10 (6.8%) |
| 4:00 PM to 11:59 PM | 31 (12.9%) | 14 (9.5%) |
| Total | 241 (100.0%) | 147 (100.0%) |
Housing Occupancy in Goodman
Occupancy by Ownership in Goodman
Of the total 423 dwellings in Goodman, owner-occupied units account for 344 (81.3%), while renter-occupied units make up 79 (18.7%).
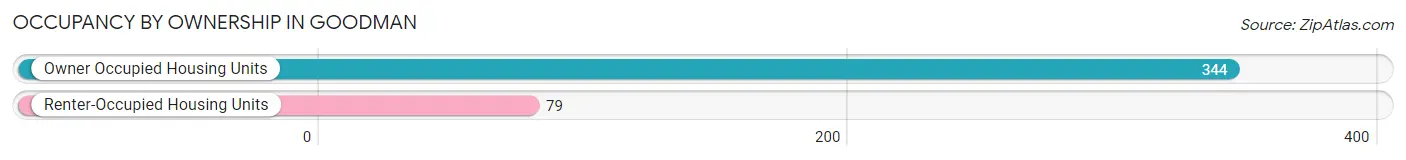
| Occupancy | # Housing Units | % Housing Units |
| Owner Occupied Housing Units | 344 | 81.3% |
| Renter-Occupied Housing Units | 79 | 18.7% |
| Total Occupied Housing Units | 423 | 100.0% |
Occupancy by Household Size in Goodman
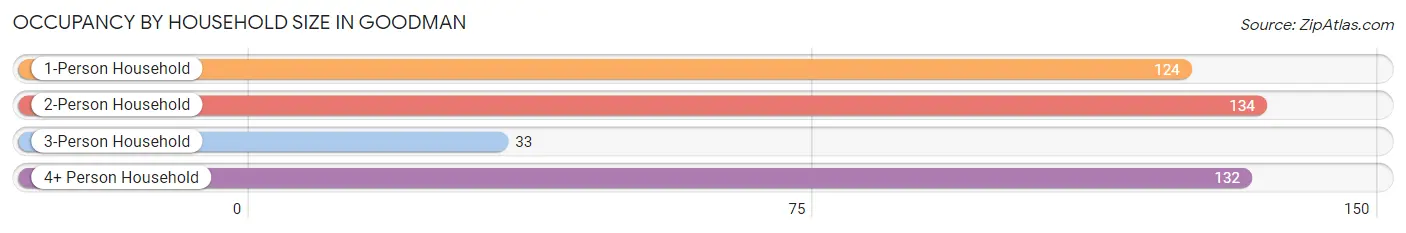
| Household Size | # Housing Units | % Housing Units |
| 1-Person Household | 124 | 29.3% |
| 2-Person Household | 134 | 31.7% |
| 3-Person Household | 33 | 7.8% |
| 4+ Person Household | 132 | 31.2% |
| Total Housing Units | 423 | 100.0% |
Occupancy by Ownership by Household Size in Goodman
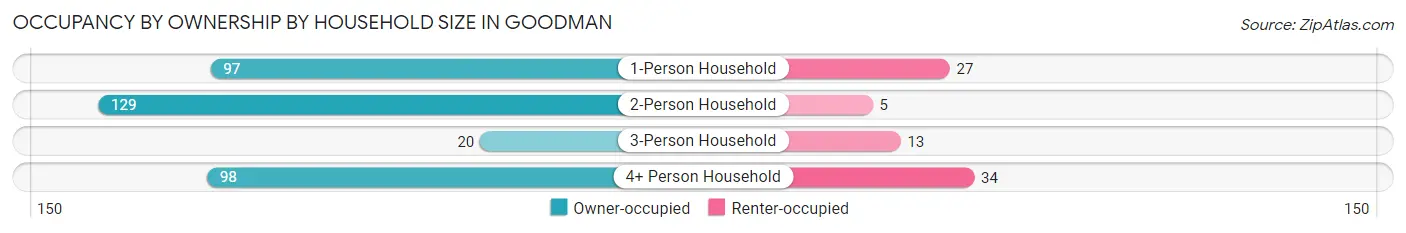
| Household Size | Owner-occupied | Renter-occupied |
| 1-Person Household | 97 (78.2%) | 27 (21.8%) |
| 2-Person Household | 129 (96.3%) | 5 (3.7%) |
| 3-Person Household | 20 (60.6%) | 13 (39.4%) |
| 4+ Person Household | 98 (74.2%) | 34 (25.8%) |
| Total Housing Units | 344 (81.3%) | 79 (18.7%) |
Occupancy by Educational Attainment in Goodman
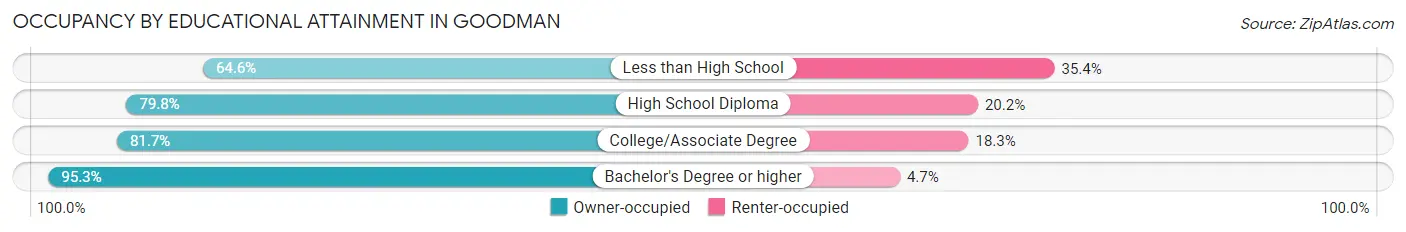
| Household Size | Owner-occupied | Renter-occupied |
| Less than High School | 53 (64.6%) | 29 (35.4%) |
| High School Diploma | 83 (79.8%) | 21 (20.2%) |
| College/Associate Degree | 107 (81.7%) | 24 (18.3%) |
| Bachelor's Degree or higher | 101 (95.3%) | 5 (4.7%) |
Occupancy by Age of Householder in Goodman
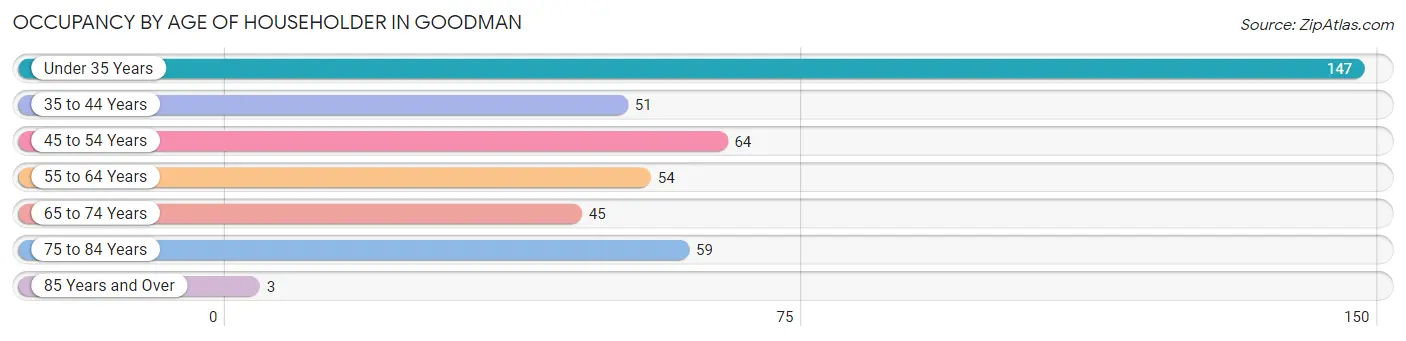
| Age Bracket | # Households | % Households |
| Under 35 Years | 147 | 34.7% |
| 35 to 44 Years | 51 | 12.1% |
| 45 to 54 Years | 64 | 15.1% |
| 55 to 64 Years | 54 | 12.8% |
| 65 to 74 Years | 45 | 10.6% |
| 75 to 84 Years | 59 | 14.0% |
| 85 Years and Over | 3 | 0.7% |
| Total | 423 | 100.0% |
Housing Finances in Goodman
Median Income by Occupancy in Goodman
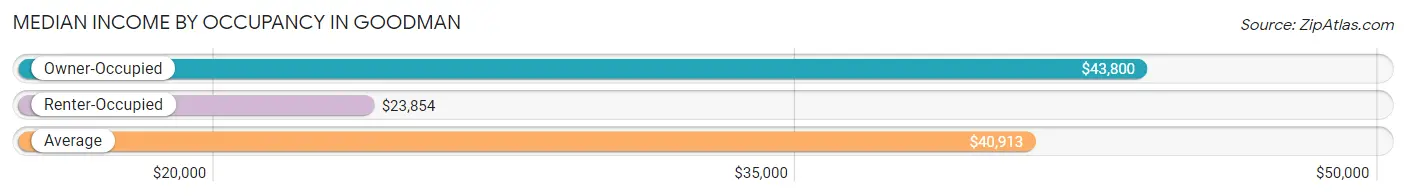
| Occupancy Type | # Households | Median Income |
| Owner-Occupied | 344 (81.3%) | $43,800 |
| Renter-Occupied | 79 (18.7%) | $23,854 |
| Average | 423 (100.0%) | $40,913 |
Occupancy by Householder Income Bracket in Goodman
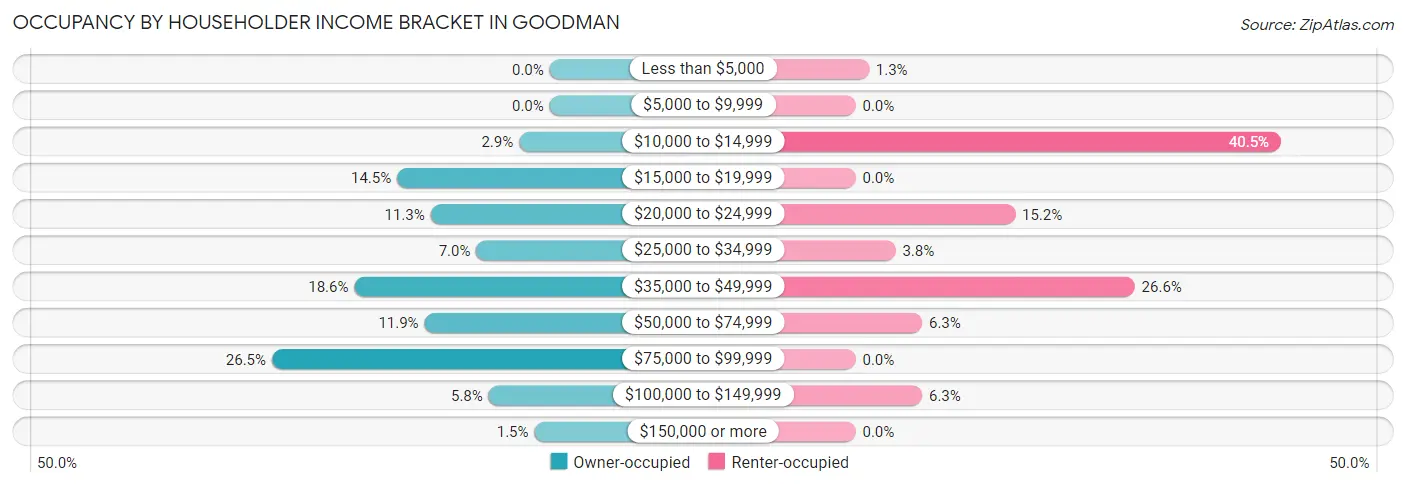
| Income Bracket | Owner-occupied | Renter-occupied |
| Less than $5,000 | 0 (0.0%) | 1 (1.3%) |
| $5,000 to $9,999 | 0 (0.0%) | 0 (0.0%) |
| $10,000 to $14,999 | 10 (2.9%) | 32 (40.5%) |
| $15,000 to $19,999 | 50 (14.5%) | 0 (0.0%) |
| $20,000 to $24,999 | 39 (11.3%) | 12 (15.2%) |
| $25,000 to $34,999 | 24 (7.0%) | 3 (3.8%) |
| $35,000 to $49,999 | 64 (18.6%) | 21 (26.6%) |
| $50,000 to $74,999 | 41 (11.9%) | 5 (6.3%) |
| $75,000 to $99,999 | 91 (26.5%) | 0 (0.0%) |
| $100,000 to $149,999 | 20 (5.8%) | 5 (6.3%) |
| $150,000 or more | 5 (1.5%) | 0 (0.0%) |
| Total | 344 (100.0%) | 79 (100.0%) |
Monthly Housing Cost Tiers in Goodman
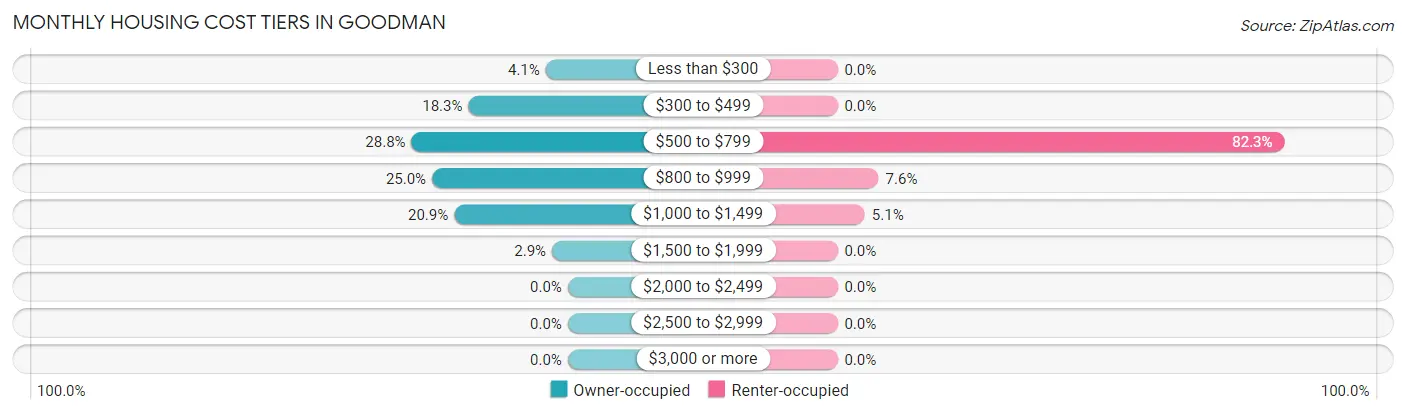
| Monthly Cost | Owner-occupied | Renter-occupied |
| Less than $300 | 14 (4.1%) | 0 (0.0%) |
| $300 to $499 | 63 (18.3%) | 0 (0.0%) |
| $500 to $799 | 99 (28.8%) | 65 (82.3%) |
| $800 to $999 | 86 (25.0%) | 6 (7.6%) |
| $1,000 to $1,499 | 72 (20.9%) | 4 (5.1%) |
| $1,500 to $1,999 | 10 (2.9%) | 0 (0.0%) |
| $2,000 to $2,499 | 0 (0.0%) | 0 (0.0%) |
| $2,500 to $2,999 | 0 (0.0%) | 0 (0.0%) |
| $3,000 or more | 0 (0.0%) | 0 (0.0%) |
| Total | 344 (100.0%) | 79 (100.0%) |
Physical Housing Characteristics in Goodman
Housing Structures in Goodman
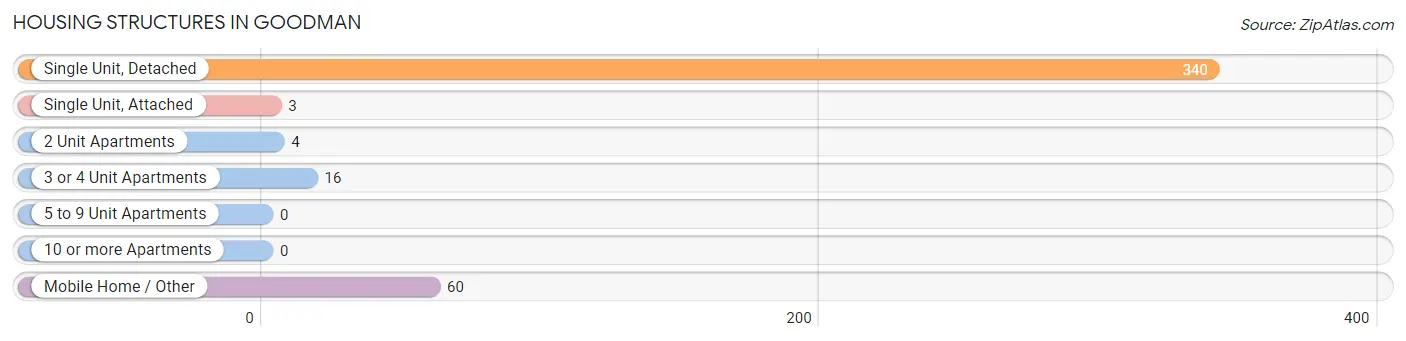
| Structure Type | # Housing Units | % Housing Units |
| Single Unit, Detached | 340 | 80.4% |
| Single Unit, Attached | 3 | 0.7% |
| 2 Unit Apartments | 4 | 0.9% |
| 3 or 4 Unit Apartments | 16 | 3.8% |
| 5 to 9 Unit Apartments | 0 | 0.0% |
| 10 or more Apartments | 0 | 0.0% |
| Mobile Home / Other | 60 | 14.2% |
| Total | 423 | 100.0% |
Housing Structures by Occupancy in Goodman
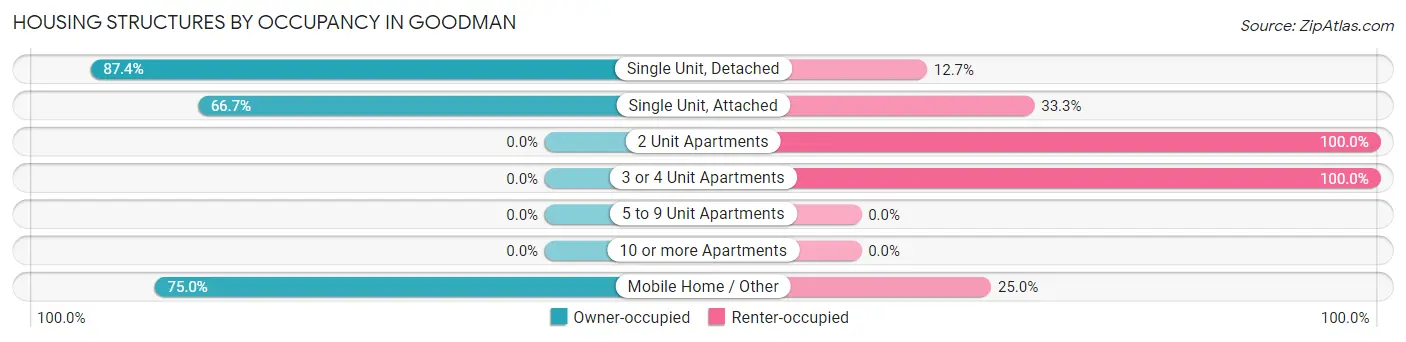
| Structure Type | Owner-occupied | Renter-occupied |
| Single Unit, Detached | 297 (87.4%) | 43 (12.7%) |
| Single Unit, Attached | 2 (66.7%) | 1 (33.3%) |
| 2 Unit Apartments | 0 (0.0%) | 4 (100.0%) |
| 3 or 4 Unit Apartments | 0 (0.0%) | 16 (100.0%) |
| 5 to 9 Unit Apartments | 0 (0.0%) | 0 (0.0%) |
| 10 or more Apartments | 0 (0.0%) | 0 (0.0%) |
| Mobile Home / Other | 45 (75.0%) | 15 (25.0%) |
| Total | 344 (81.3%) | 79 (18.7%) |
Housing Structures by Number of Rooms in Goodman
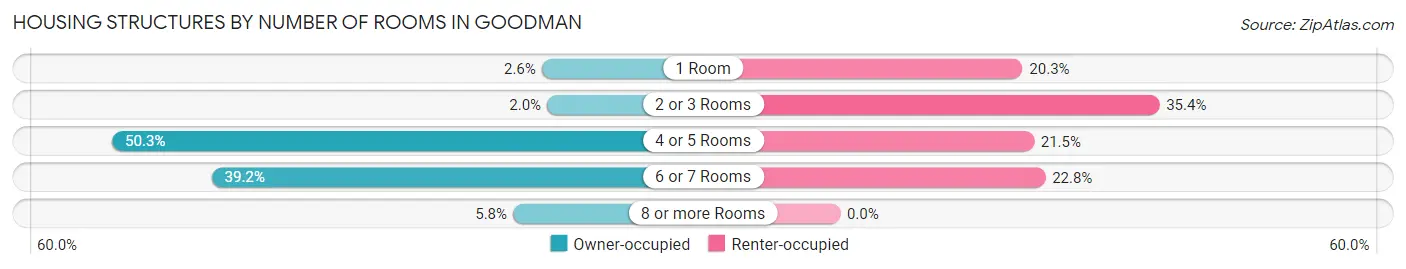
| Number of Rooms | Owner-occupied | Renter-occupied |
| 1 Room | 9 (2.6%) | 16 (20.3%) |
| 2 or 3 Rooms | 7 (2.0%) | 28 (35.4%) |
| 4 or 5 Rooms | 173 (50.3%) | 17 (21.5%) |
| 6 or 7 Rooms | 135 (39.2%) | 18 (22.8%) |
| 8 or more Rooms | 20 (5.8%) | 0 (0.0%) |
| Total | 344 (100.0%) | 79 (100.0%) |
Housing Structure by Heating Type in Goodman
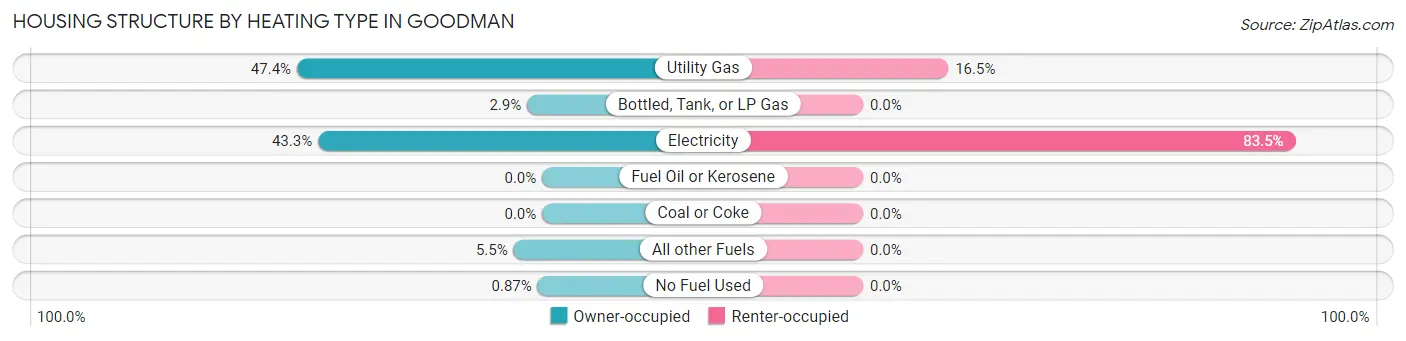
| Heating Type | Owner-occupied | Renter-occupied |
| Utility Gas | 163 (47.4%) | 13 (16.5%) |
| Bottled, Tank, or LP Gas | 10 (2.9%) | 0 (0.0%) |
| Electricity | 149 (43.3%) | 66 (83.5%) |
| Fuel Oil or Kerosene | 0 (0.0%) | 0 (0.0%) |
| Coal or Coke | 0 (0.0%) | 0 (0.0%) |
| All other Fuels | 19 (5.5%) | 0 (0.0%) |
| No Fuel Used | 3 (0.9%) | 0 (0.0%) |
| Total | 344 (100.0%) | 79 (100.0%) |
Household Vehicle Usage in Goodman
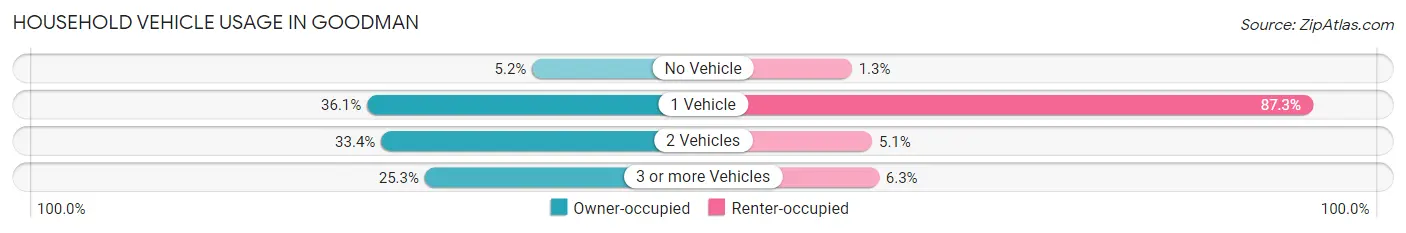
| Vehicles per Household | Owner-occupied | Renter-occupied |
| No Vehicle | 18 (5.2%) | 1 (1.3%) |
| 1 Vehicle | 124 (36.0%) | 69 (87.3%) |
| 2 Vehicles | 115 (33.4%) | 4 (5.1%) |
| 3 or more Vehicles | 87 (25.3%) | 5 (6.3%) |
| Total | 344 (100.0%) | 79 (100.0%) |
Real Estate & Mortgages in Goodman
Real Estate and Mortgage Overview in Goodman
| Characteristic | Without Mortgage | With Mortgage |
| Housing Units | 91 | 253 |
| Median Property Value | $72,500 | $89,800 |
| Median Household Income | $22,639 | $5 |
| Monthly Housing Costs | $358 | $0 |
| Real Estate Taxes | $500 | $5 |
Property Value by Mortgage Status in Goodman
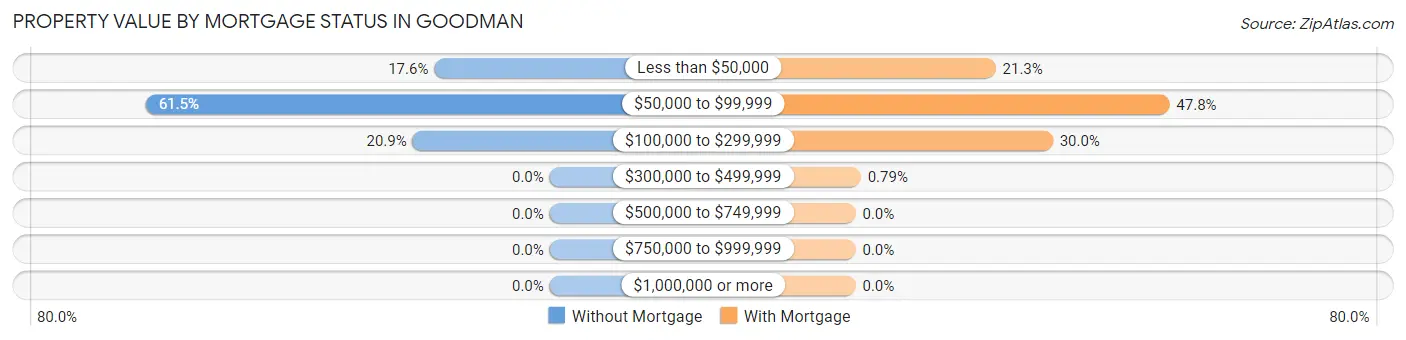
| Property Value | Without Mortgage | With Mortgage |
| Less than $50,000 | 16 (17.6%) | 54 (21.3%) |
| $50,000 to $99,999 | 56 (61.5%) | 121 (47.8%) |
| $100,000 to $299,999 | 19 (20.9%) | 76 (30.0%) |
| $300,000 to $499,999 | 0 (0.0%) | 2 (0.8%) |
| $500,000 to $749,999 | 0 (0.0%) | 0 (0.0%) |
| $750,000 to $999,999 | 0 (0.0%) | 0 (0.0%) |
| $1,000,000 or more | 0 (0.0%) | 0 (0.0%) |
| Total | 91 (100.0%) | 253 (100.0%) |
Household Income by Mortgage Status in Goodman
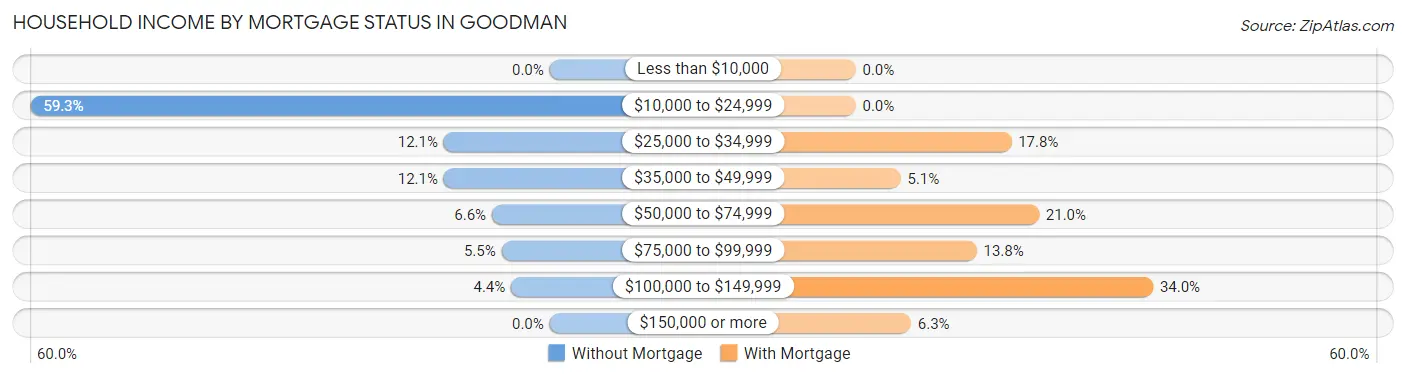
| Household Income | Without Mortgage | With Mortgage |
| Less than $10,000 | 0 (0.0%) | 0 (0.0%) |
| $10,000 to $24,999 | 54 (59.3%) | 0 (0.0%) |
| $25,000 to $34,999 | 11 (12.1%) | 45 (17.8%) |
| $35,000 to $49,999 | 11 (12.1%) | 13 (5.1%) |
| $50,000 to $74,999 | 6 (6.6%) | 53 (20.9%) |
| $75,000 to $99,999 | 5 (5.5%) | 35 (13.8%) |
| $100,000 to $149,999 | 4 (4.4%) | 86 (34.0%) |
| $150,000 or more | 0 (0.0%) | 16 (6.3%) |
| Total | 91 (100.0%) | 253 (100.0%) |
Property Value to Household Income Ratio in Goodman
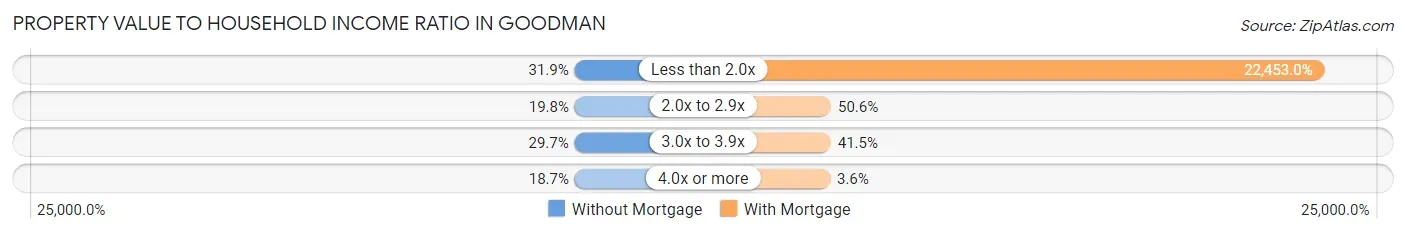
| Value-to-Income Ratio | Without Mortgage | With Mortgage |
| Less than 2.0x | 29 (31.9%) | 56,806 (22,453.0%) |
| 2.0x to 2.9x | 18 (19.8%) | 128 (50.6%) |
| 3.0x to 3.9x | 27 (29.7%) | 105 (41.5%) |
| 4.0x or more | 17 (18.7%) | 9 (3.6%) |
| Total | 91 (100.0%) | 253 (100.0%) |
Real Estate Taxes by Mortgage Status in Goodman
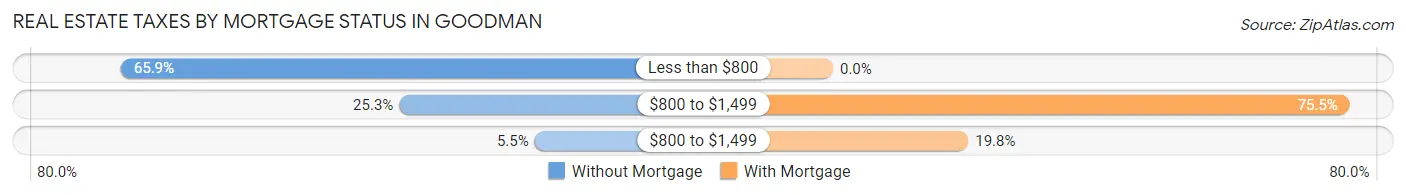
| Property Taxes | Without Mortgage | With Mortgage |
| Less than $800 | 60 (65.9%) | 0 (0.0%) |
| $800 to $1,499 | 23 (25.3%) | 191 (75.5%) |
| $800 to $1,499 | 5 (5.5%) | 50 (19.8%) |
| Total | 91 (100.0%) | 253 (100.0%) |
Health & Disability in Goodman
Health Insurance Coverage by Age in Goodman
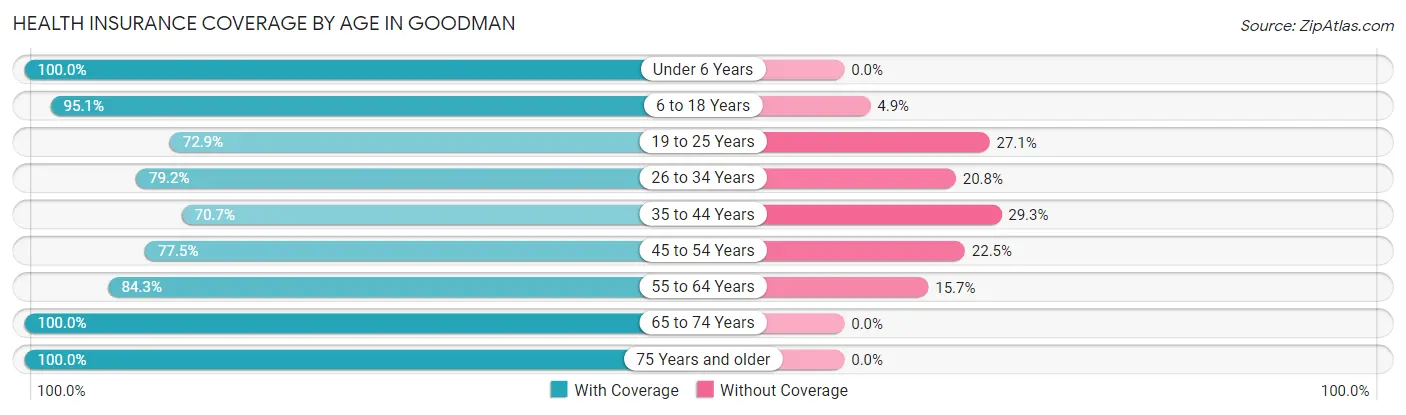
| Age Bracket | With Coverage | Without Coverage |
| Under 6 Years | 121 (100.0%) | 0 (0.0%) |
| 6 to 18 Years | 235 (95.1%) | 12 (4.9%) |
| 19 to 25 Years | 105 (72.9%) | 39 (27.1%) |
| 26 to 34 Years | 141 (79.2%) | 37 (20.8%) |
| 35 to 44 Years | 87 (70.7%) | 36 (29.3%) |
| 45 to 54 Years | 100 (77.5%) | 29 (22.5%) |
| 55 to 64 Years | 70 (84.3%) | 13 (15.7%) |
| 65 to 74 Years | 65 (100.0%) | 0 (0.0%) |
| 75 Years and older | 117 (100.0%) | 0 (0.0%) |
| Total | 1,041 (86.3%) | 166 (13.8%) |
Health Insurance Coverage by Citizenship Status in Goodman
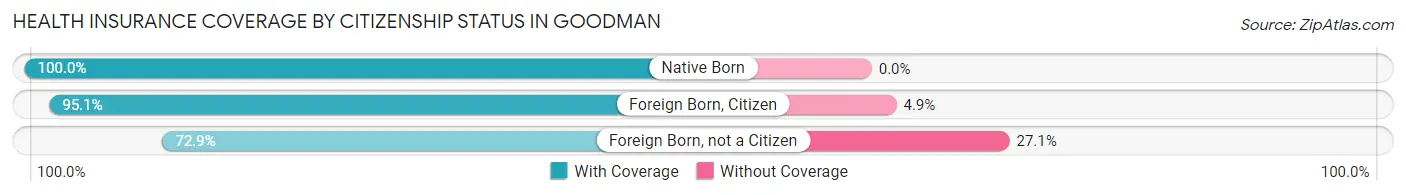
| Citizenship Status | With Coverage | Without Coverage |
| Native Born | 121 (100.0%) | 0 (0.0%) |
| Foreign Born, Citizen | 235 (95.1%) | 12 (4.9%) |
| Foreign Born, not a Citizen | 105 (72.9%) | 39 (27.1%) |
Health Insurance Coverage by Household Income in Goodman
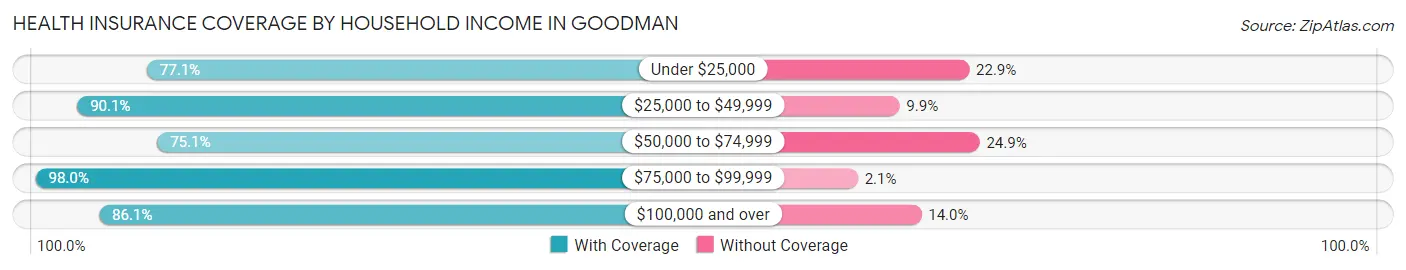
| Household Income | With Coverage | Without Coverage |
| Under $25,000 | 232 (77.1%) | 69 (22.9%) |
| $25,000 to $49,999 | 265 (90.1%) | 29 (9.9%) |
| $50,000 to $74,999 | 133 (75.1%) | 44 (24.9%) |
| $75,000 to $99,999 | 286 (98.0%) | 6 (2.1%) |
| $100,000 and over | 111 (86.1%) | 18 (14.0%) |
Public vs Private Health Insurance Coverage by Age in Goodman
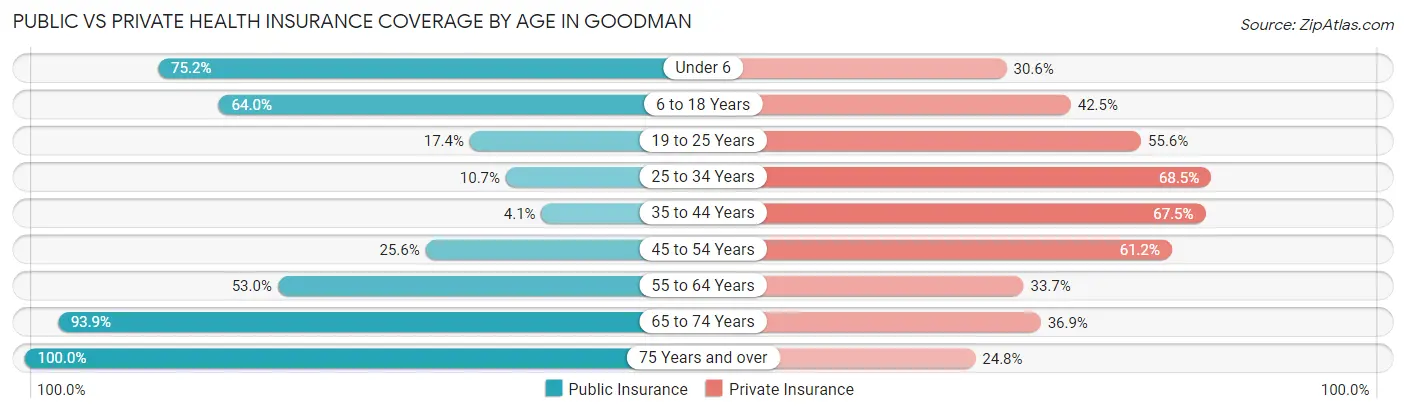
| Age Bracket | Public Insurance | Private Insurance |
| Under 6 | 91 (75.2%) | 37 (30.6%) |
| 6 to 18 Years | 158 (64.0%) | 105 (42.5%) |
| 19 to 25 Years | 25 (17.4%) | 80 (55.6%) |
| 25 to 34 Years | 19 (10.7%) | 122 (68.5%) |
| 35 to 44 Years | 5 (4.1%) | 83 (67.5%) |
| 45 to 54 Years | 33 (25.6%) | 79 (61.2%) |
| 55 to 64 Years | 44 (53.0%) | 28 (33.7%) |
| 65 to 74 Years | 61 (93.9%) | 24 (36.9%) |
| 75 Years and over | 117 (100.0%) | 29 (24.8%) |
| Total | 553 (45.8%) | 587 (48.6%) |
Disability Status by Sex by Age in Goodman
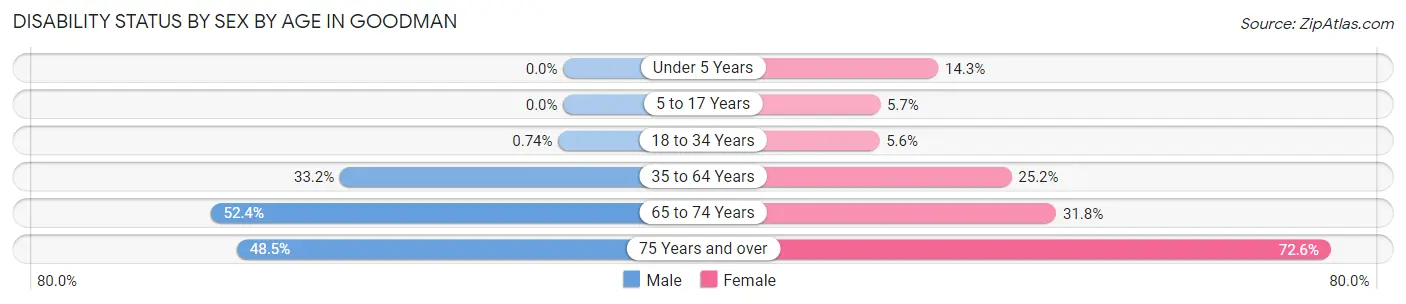
| Age Bracket | Male | Female |
| Under 5 Years | 0 (0.0%) | 4 (14.3%) |
| 5 to 17 Years | 0 (0.0%) | 8 (5.7%) |
| 18 to 34 Years | 1 (0.7%) | 11 (5.6%) |
| 35 to 64 Years | 65 (33.2%) | 35 (25.2%) |
| 65 to 74 Years | 11 (52.4%) | 14 (31.8%) |
| 75 Years and over | 16 (48.5%) | 61 (72.6%) |
Disability Class by Sex by Age in Goodman
Disability Class: Hearing Difficulty
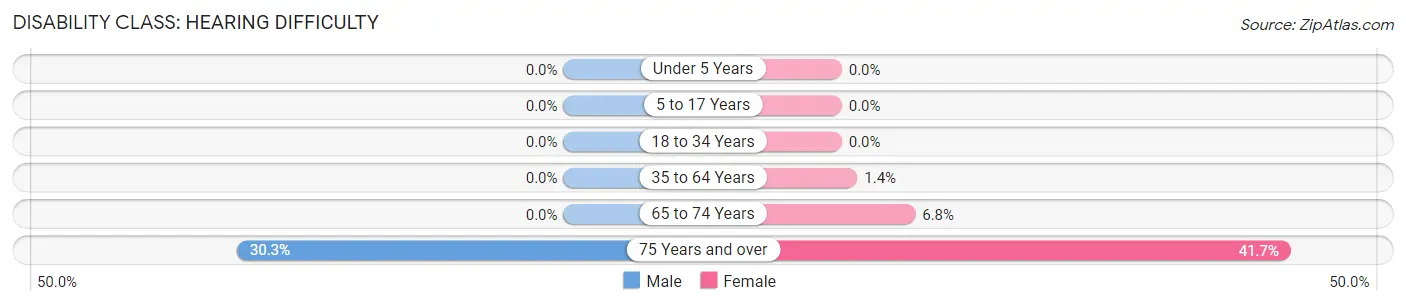
| Age Bracket | Male | Female |
| Under 5 Years | 0 (0.0%) | 0 (0.0%) |
| 5 to 17 Years | 0 (0.0%) | 0 (0.0%) |
| 18 to 34 Years | 0 (0.0%) | 0 (0.0%) |
| 35 to 64 Years | 0 (0.0%) | 2 (1.4%) |
| 65 to 74 Years | 0 (0.0%) | 3 (6.8%) |
| 75 Years and over | 10 (30.3%) | 35 (41.7%) |
Disability Class: Vision Difficulty
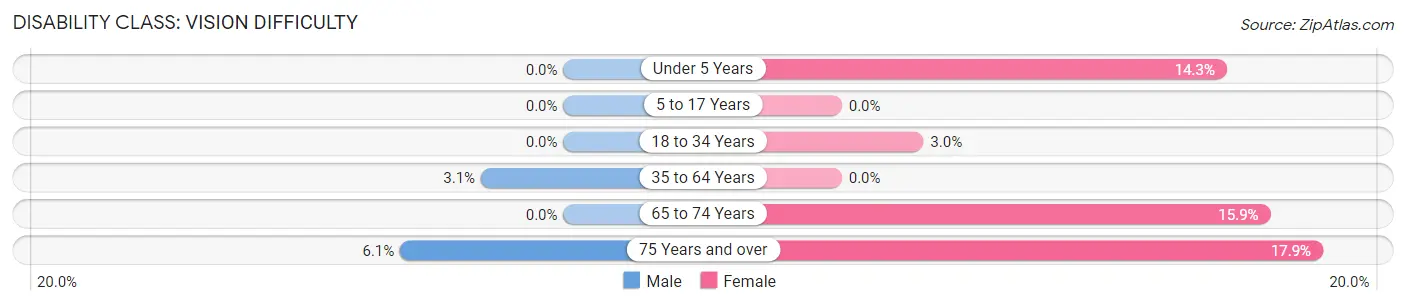
| Age Bracket | Male | Female |
| Under 5 Years | 0 (0.0%) | 4 (14.3%) |
| 5 to 17 Years | 0 (0.0%) | 0 (0.0%) |
| 18 to 34 Years | 0 (0.0%) | 6 (3.0%) |
| 35 to 64 Years | 6 (3.1%) | 0 (0.0%) |
| 65 to 74 Years | 0 (0.0%) | 7 (15.9%) |
| 75 Years and over | 2 (6.1%) | 15 (17.9%) |
Disability Class: Cognitive Difficulty
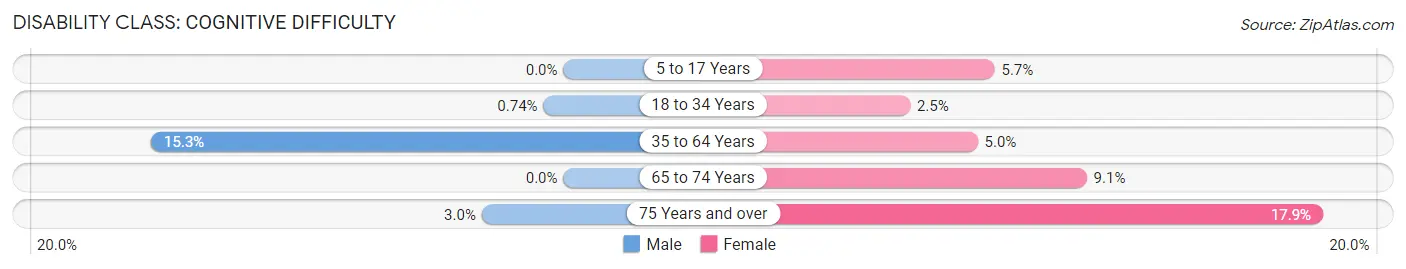
| Age Bracket | Male | Female |
| 5 to 17 Years | 0 (0.0%) | 8 (5.7%) |
| 18 to 34 Years | 1 (0.7%) | 5 (2.5%) |
| 35 to 64 Years | 30 (15.3%) | 7 (5.0%) |
| 65 to 74 Years | 0 (0.0%) | 4 (9.1%) |
| 75 Years and over | 1 (3.0%) | 15 (17.9%) |
Disability Class: Ambulatory Difficulty
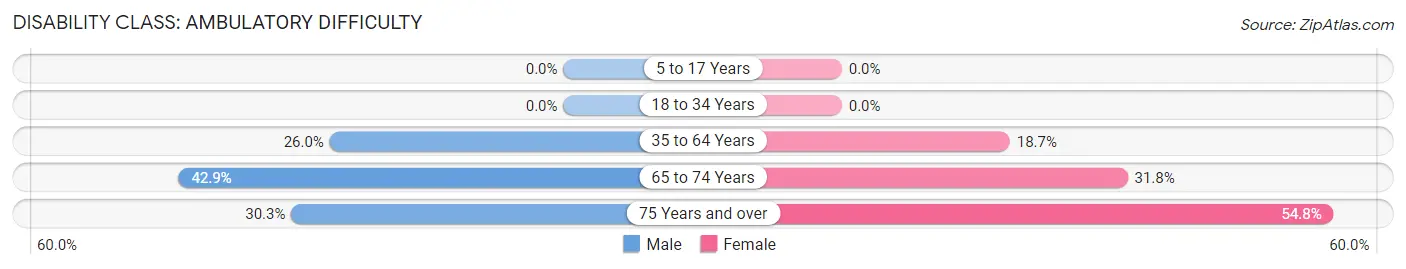
| Age Bracket | Male | Female |
| 5 to 17 Years | 0 (0.0%) | 0 (0.0%) |
| 18 to 34 Years | 0 (0.0%) | 0 (0.0%) |
| 35 to 64 Years | 51 (26.0%) | 26 (18.7%) |
| 65 to 74 Years | 9 (42.9%) | 14 (31.8%) |
| 75 Years and over | 10 (30.3%) | 46 (54.8%) |
Disability Class: Self-Care Difficulty
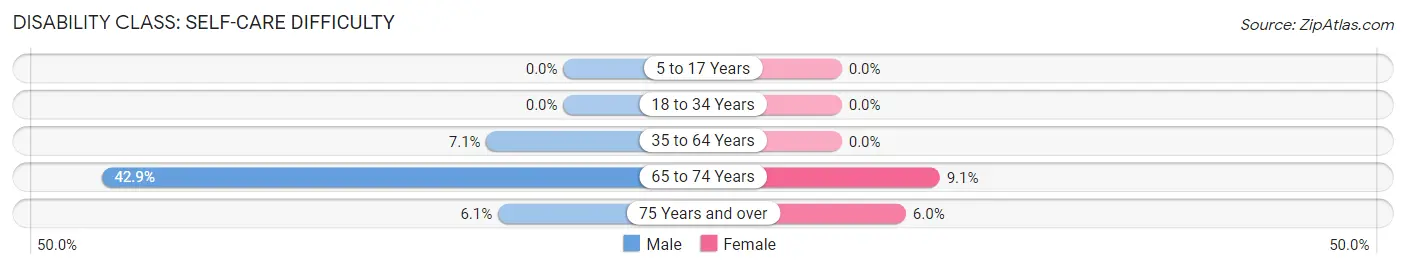
| Age Bracket | Male | Female |
| 5 to 17 Years | 0 (0.0%) | 0 (0.0%) |
| 18 to 34 Years | 0 (0.0%) | 0 (0.0%) |
| 35 to 64 Years | 14 (7.1%) | 0 (0.0%) |
| 65 to 74 Years | 9 (42.9%) | 4 (9.1%) |
| 75 Years and over | 2 (6.1%) | 5 (5.9%) |
Technology Access in Goodman
Computing Device Access in Goodman
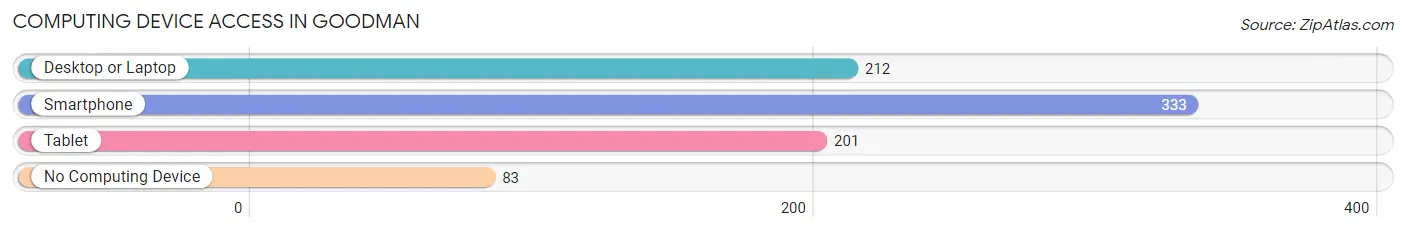
| Device Type | # Households | % Households |
| Desktop or Laptop | 212 | 50.1% |
| Smartphone | 333 | 78.7% |
| Tablet | 201 | 47.5% |
| No Computing Device | 83 | 19.6% |
| Total | 423 | 100.0% |
Internet Access in Goodman
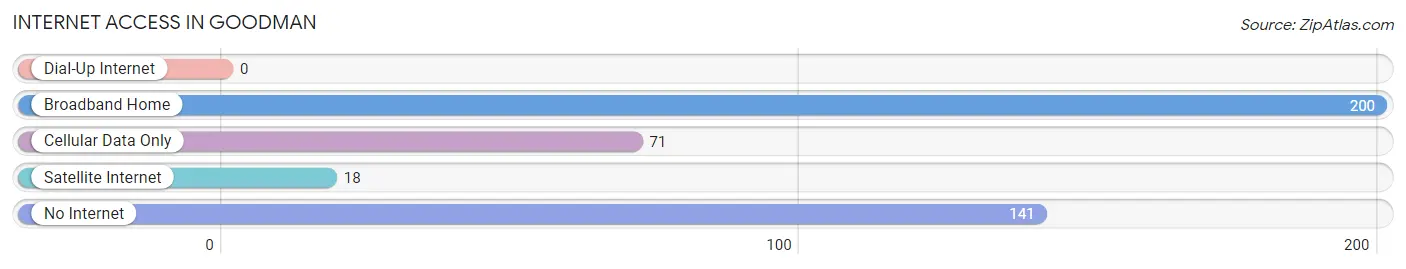
| Internet Type | # Households | % Households |
| Dial-Up Internet | 0 | 0.0% |
| Broadband Home | 200 | 47.3% |
| Cellular Data Only | 71 | 16.8% |
| Satellite Internet | 18 | 4.3% |
| No Internet | 141 | 33.3% |
| Total | 423 | 100.0% |
Goodman Summary
Goodman is a small city located in McDonald County, Missouri. It is situated in the southwestern corner of the state, near the Arkansas border. The city has a population of 1,845 people, according to the 2010 census. Goodman is part of the Fayetteville-Springdale-Rogers Metropolitan Statistical Area.
History
Goodman was founded in 1883 by a group of settlers from Arkansas. The city was named after a local landowner, John Goodman. The city was incorporated in 1887 and was the first incorporated city in McDonald County.
In the early 1900s, Goodman was a thriving agricultural community. The city was home to several cotton gins, a grist mill, and a sawmill. The city also had a hotel, a bank, and several stores.
In the 1950s, Goodman began to experience a decline in population as people moved away to larger cities. The city's population dropped from 1,845 in 1950 to 1,619 in 2000.
Geography
Goodman is located in the Ozark Mountains of southwestern Missouri. The city is situated at the intersection of U.S. Route 71 and Missouri Route 59. The city is located about 25 miles south of Joplin and about 40 miles north of Fayetteville, Arkansas.
The city has a total area of 1.3 square miles, all of which is land. The city is located at an elevation of 1,068 feet above sea level.
Economy
Goodman's economy is largely based on agriculture. The city is home to several farms that produce corn, soybeans, wheat, and hay. The city also has several businesses that provide services to the local agricultural industry, such as feed stores, equipment dealers, and fertilizer suppliers.
The city also has several small businesses, including restaurants, retail stores, and auto repair shops. The city is home to a branch of the McDonald County Library.
Demographics
According to the 2010 census, Goodman has a population of 1,845 people. The city has a median household income of $31,250 and a median family income of $37,500. The city has a poverty rate of 22.3%.
The city is predominantly white, with 92.3% of the population identifying as white. The city also has a small Hispanic population, with 4.2% of the population identifying as Hispanic or Latino.
The city has a high school graduation rate of 81.3%, which is higher than the national average. The city also has a low crime rate, with only 0.3 violent crimes per 1,000 people.
Common Questions
What is Per Capita Income in Goodman?
Per Capita income in Goodman is $18,371.
What is the Median Family Income in Goodman?
Median Family Income in Goodman is $42,115.
What is the Median Household income in Goodman?
Median Household Income in Goodman is $40,913.
What is Income or Wage Gap in Goodman?
Income or Wage Gap in Goodman is 22.6%.
Women in Goodman earn 77.4 cents for every dollar earned by a man.
What is Inequality or Gini Index in Goodman?
Inequality or Gini Index in Goodman is 0.38.
What is the Total Population of Goodman?
Total Population of Goodman is 1,207.
What is the Total Male Population of Goodman?
Total Male Population of Goodman is 573.
What is the Total Female Population of Goodman?
Total Female Population of Goodman is 634.
What is the Ratio of Males per 100 Females in Goodman?
There are 90.38 Males per 100 Females in Goodman.
What is the Ratio of Females per 100 Males in Goodman?
There are 110.65 Females per 100 Males in Goodman.
What is the Median Population Age in Goodman?
Median Population Age in Goodman is 28.6 Years.
What is the Average Family Size in Goodman
Average Family Size in Goodman is 3.8 People.
What is the Average Household Size in Goodman
Average Household Size in Goodman is 2.8 People.
How Large is the Labor Force in Goodman?
There are 452 People in the Labor Forcein in Goodman.
What is the Percentage of People in the Labor Force in Goodman?
51.0% of People are in the Labor Force in Goodman.
What is the Unemployment Rate in Goodman?
Unemployment Rate in Goodman is 3.5%.