Lyman, SC Map & Demographics
Lyman Map
Lyman Overview
$29,328
PER CAPITA INCOME
$86,696
AVG FAMILY INCOME
$76,723
AVG HOUSEHOLD INCOME
5.2%
WAGE / INCOME GAP [ % ]
94.8¢/ $1
WAGE / INCOME GAP [ $ ]
0.33
INEQUALITY / GINI INDEX
6,099
TOTAL POPULATION
3,238
MALE POPULATION
2,861
FEMALE POPULATION
113.18
MALES / 100 FEMALES
88.36
FEMALES / 100 MALES
30.2
MEDIAN AGE
3.2
AVG FAMILY SIZE
2.8
AVG HOUSEHOLD SIZE
3,061
LABOR FORCE [ PEOPLE ]
69.1%
PERCENT IN LABOR FORCE
3.8%
UNEMPLOYMENT RATE
Lyman Zip Codes
Lyman Area Codes
Income in Lyman
Income Overview in Lyman
Per Capita Income in Lyman is $29,328, while median incomes of families and households are $86,696 and $76,723 respectively.
| Characteristic | Number | Measure |
| Per Capita Income | 6,099 | $29,328 |
| Median Family Income | 1,678 | $86,696 |
| Mean Family Income | 1,678 | $89,260 |
| Median Household Income | 2,146 | $76,723 |
| Mean Household Income | 2,146 | $80,594 |
| Income Deficit | 1,678 | $0 |
| Wage / Income Gap (%) | 6,099 | 5.22% |
| Wage / Income Gap ($) | 6,099 | 94.78¢ per $1 |
| Gini / Inequality Index | 6,099 | 0.33 |
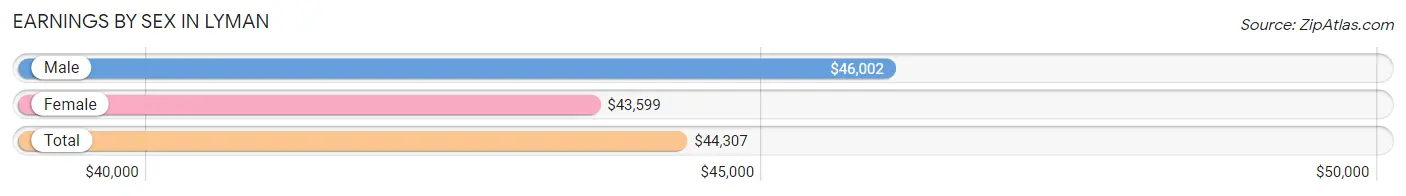
Earnings by Sex in Lyman
Average Earnings in Lyman are $44,307, $46,002 for men and $43,599 for women, a difference of 5.2%.
| Sex | Number | Average Earnings |
| Male | 1,739 (54.9%) | $46,002 |
| Female | 1,428 (45.1%) | $43,599 |
| Total | 3,167 (100.0%) | $44,307 |
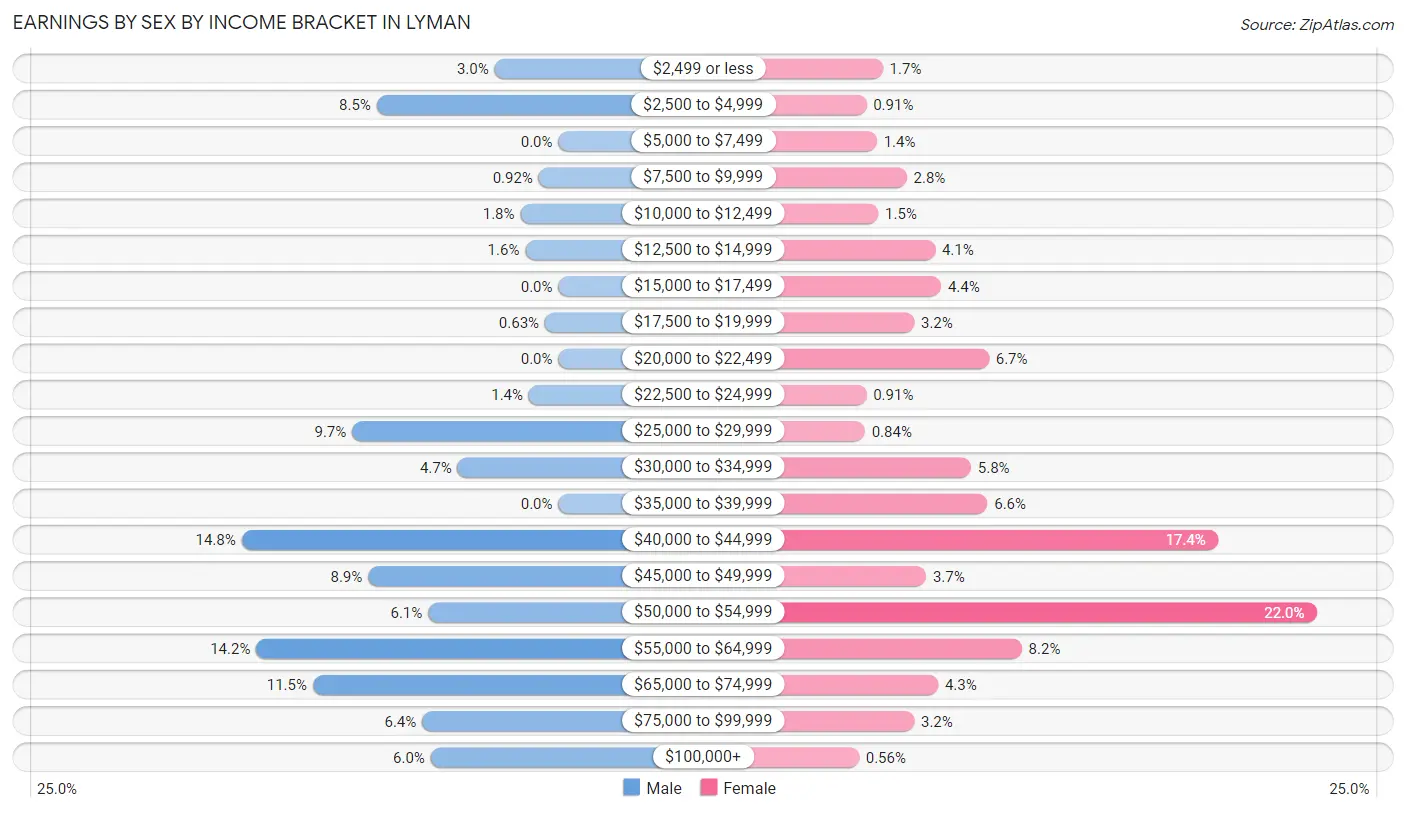
Earnings by Sex by Income Bracket in Lyman
The most common earnings brackets in Lyman are $40,000 to $44,999 for men (258 | 14.8%) and $50,000 to $54,999 for women (314 | 22.0%).
| Income | Male | Female |
| $2,499 or less | 52 (3.0%) | 24 (1.7%) |
| $2,500 to $4,999 | 148 (8.5%) | 13 (0.9%) |
| $5,000 to $7,499 | 0 (0.0%) | 20 (1.4%) |
| $7,500 to $9,999 | 16 (0.9%) | 40 (2.8%) |
| $10,000 to $12,499 | 31 (1.8%) | 21 (1.5%) |
| $12,500 to $14,999 | 27 (1.5%) | 59 (4.1%) |
| $15,000 to $17,499 | 0 (0.0%) | 63 (4.4%) |
| $17,500 to $19,999 | 11 (0.6%) | 45 (3.2%) |
| $20,000 to $22,499 | 0 (0.0%) | 95 (6.7%) |
| $22,500 to $24,999 | 24 (1.4%) | 13 (0.9%) |
| $25,000 to $29,999 | 168 (9.7%) | 12 (0.8%) |
| $30,000 to $34,999 | 82 (4.7%) | 83 (5.8%) |
| $35,000 to $39,999 | 0 (0.0%) | 94 (6.6%) |
| $40,000 to $44,999 | 258 (14.8%) | 248 (17.4%) |
| $45,000 to $49,999 | 155 (8.9%) | 53 (3.7%) |
| $50,000 to $54,999 | 106 (6.1%) | 314 (22.0%) |
| $55,000 to $64,999 | 246 (14.1%) | 117 (8.2%) |
| $65,000 to $74,999 | 200 (11.5%) | 61 (4.3%) |
| $75,000 to $99,999 | 111 (6.4%) | 45 (3.2%) |
| $100,000+ | 104 (6.0%) | 8 (0.6%) |
| Total | 1,739 (100.0%) | 1,428 (100.0%) |
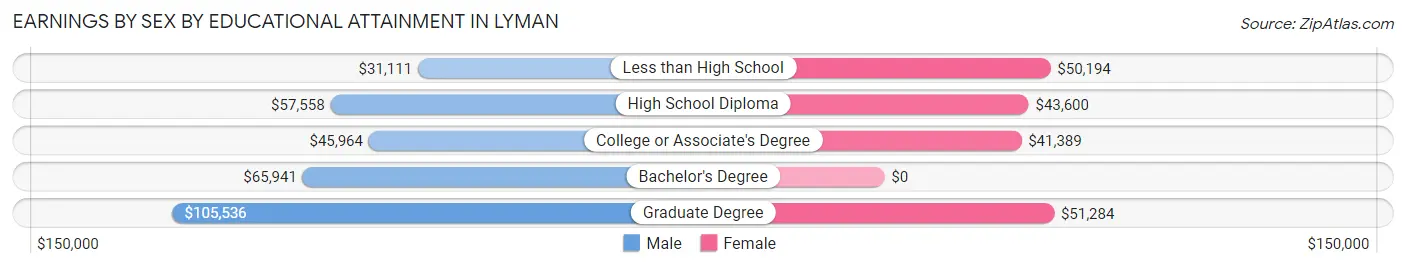
Earnings by Sex by Educational Attainment in Lyman
Average earnings in Lyman are $53,726 for men and $45,813 for women, a difference of 14.7%. Men with an educational attainment of graduate degree enjoy the highest average annual earnings of $105,536, while those with less than high school education earn the least with $31,111. Women with an educational attainment of graduate degree earn the most with the average annual earnings of $51,284, while those with college or associate's degree education have the smallest earnings of $41,389.
| Educational Attainment | Male Income | Female Income |
| Less than High School | $31,111 | $50,194 |
| High School Diploma | $57,558 | $43,600 |
| College or Associate's Degree | $45,964 | $41,389 |
| Bachelor's Degree | $65,941 | $0 |
| Graduate Degree | $105,536 | $51,284 |
| Total | $53,726 | $45,813 |
Family Income in Lyman
Family Income Brackets in Lyman
According to the Lyman family income data, there are 500 families falling into the $100,000 to $149,999 income range, which is the most common income bracket and makes up 29.8% of all families. Conversely, the $200,000+ income bracket is the least frequent group with only 7 families (0.4%) belonging to this category.
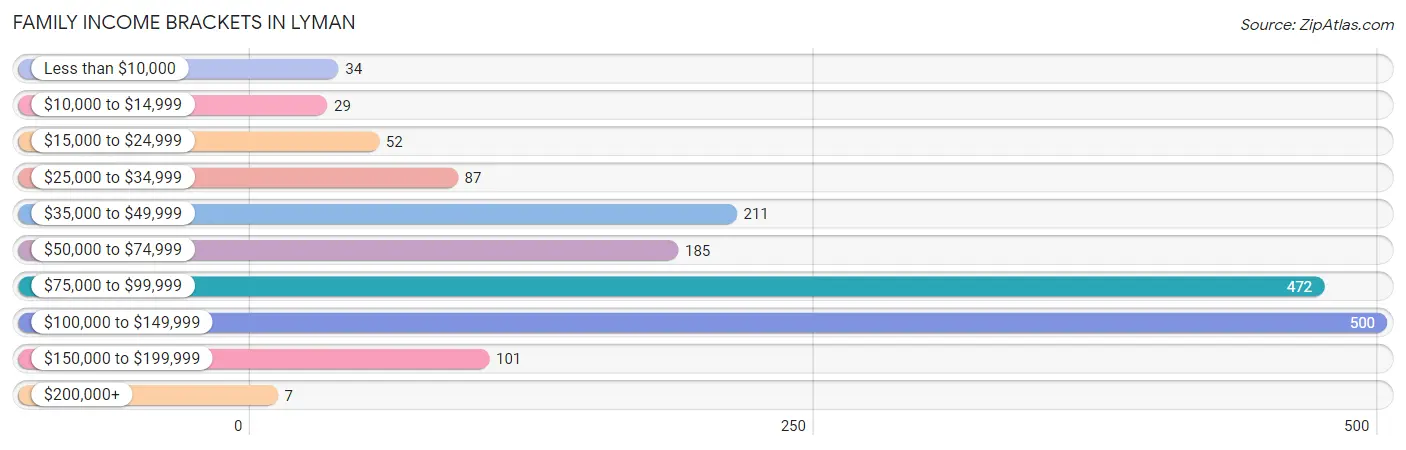
| Income Bracket | # Families | % Families |
| Less than $10,000 | 34 | 2.0% |
| $10,000 to $14,999 | 29 | 1.7% |
| $15,000 to $24,999 | 52 | 3.1% |
| $25,000 to $34,999 | 87 | 5.2% |
| $35,000 to $49,999 | 211 | 12.6% |
| $50,000 to $74,999 | 185 | 11.0% |
| $75,000 to $99,999 | 472 | 28.1% |
| $100,000 to $149,999 | 500 | 29.8% |
| $150,000 to $199,999 | 101 | 6.0% |
| $200,000+ | 7 | 0.4% |
Family Income by Famaliy Size in Lyman
5-person families (192 | 11.4%) account for the highest median family income in Lyman with $133,045 per family, while 2-person families (838 | 49.9%) have the highest median income of $41,186 per family member.
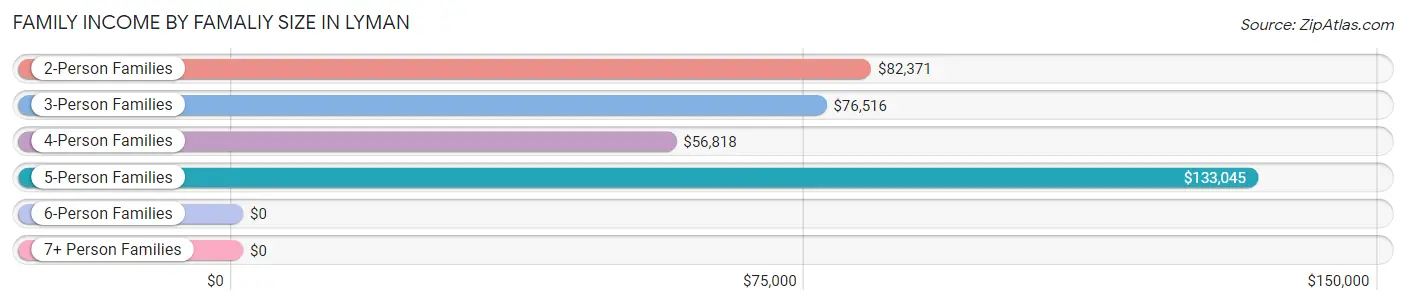
| Income Bracket | # Families | Median Income |
| 2-Person Families | 838 (49.9%) | $82,371 |
| 3-Person Families | 257 (15.3%) | $76,516 |
| 4-Person Families | 254 (15.1%) | $56,818 |
| 5-Person Families | 192 (11.4%) | $133,045 |
| 6-Person Families | 0 (0.0%) | $0 |
| 7+ Person Families | 137 (8.2%) | $0 |
| Total | 1,678 (100.0%) | $86,696 |
Family Income by Number of Earners in Lyman
The median family income in Lyman is $86,696, with families comprising 3+ earners (182) having the highest median family income of $133,589, while families with 1 earner (460) have the lowest median family income of $46,981, accounting for 10.8% and 27.4% of families, respectively.
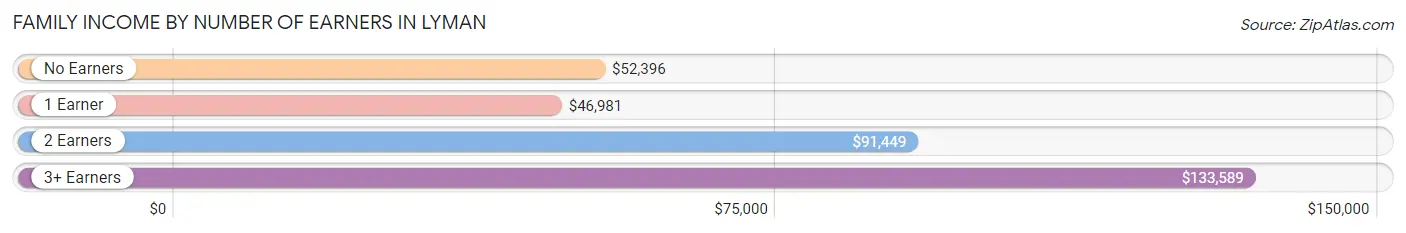
| Number of Earners | # Families | Median Income |
| No Earners | 218 (13.0%) | $52,396 |
| 1 Earner | 460 (27.4%) | $46,981 |
| 2 Earners | 818 (48.7%) | $91,449 |
| 3+ Earners | 182 (10.8%) | $133,589 |
| Total | 1,678 (100.0%) | $86,696 |
Household Income in Lyman
Household Income Brackets in Lyman
With 515 households falling in the category, the $100,000 to $149,999 income range is the most frequent in Lyman, accounting for 24.0% of all households. In contrast, only 6 households (0.3%) fall into the $200,000+ income bracket, making it the least populous group.
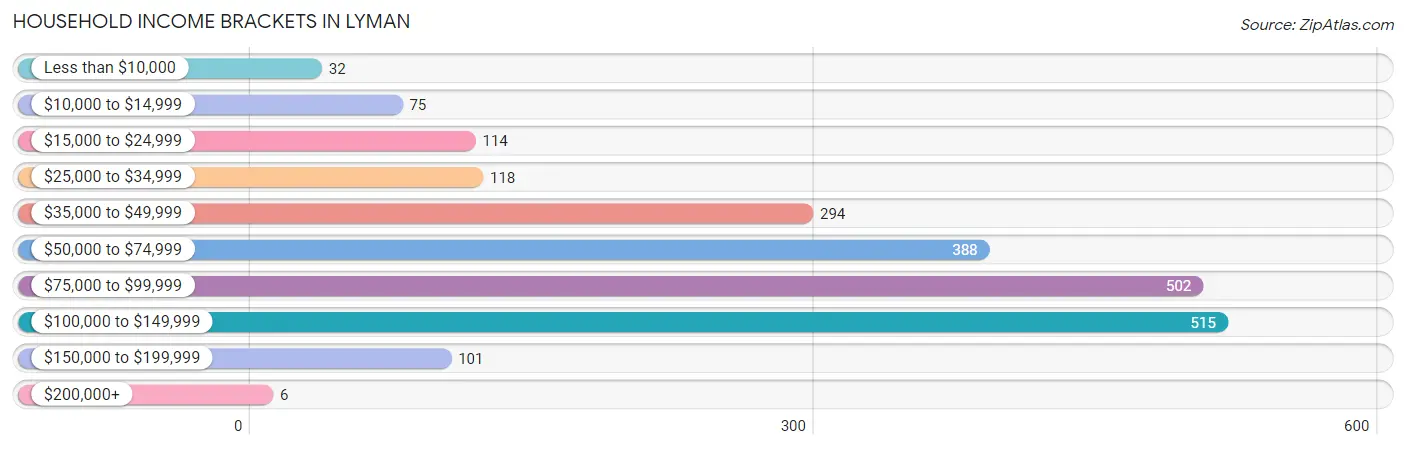
| Income Bracket | # Households | % Households |
| Less than $10,000 | 32 | 1.5% |
| $10,000 to $14,999 | 75 | 3.5% |
| $15,000 to $24,999 | 114 | 5.3% |
| $25,000 to $34,999 | 118 | 5.5% |
| $35,000 to $49,999 | 294 | 13.7% |
| $50,000 to $74,999 | 388 | 18.1% |
| $75,000 to $99,999 | 502 | 23.4% |
| $100,000 to $149,999 | 515 | 24.0% |
| $150,000 to $199,999 | 101 | 4.7% |
| $200,000+ | 6 | 0.3% |
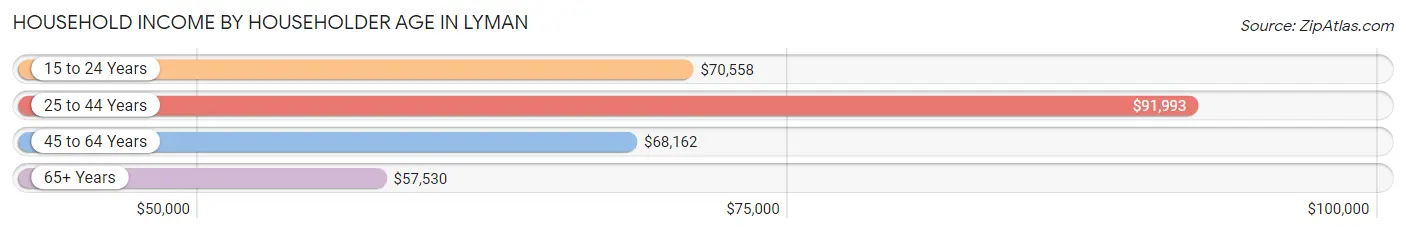
Household Income by Householder Age in Lyman
The median household income in Lyman is $76,723, with the highest median household income of $91,993 found in the 25 to 44 years age bracket for the primary householder. A total of 1,031 households (48.0%) fall into this category. Meanwhile, the 65+ years age bracket for the primary householder has the lowest median household income of $57,530, with 423 households (19.7%) in this group.
| Income Bracket | # Households | Median Income |
| 15 to 24 Years | 101 (4.7%) | $70,558 |
| 25 to 44 Years | 1,031 (48.0%) | $91,993 |
| 45 to 64 Years | 591 (27.5%) | $68,162 |
| 65+ Years | 423 (19.7%) | $57,530 |
| Total | 2,146 (100.0%) | $76,723 |
Poverty in Lyman
Income Below Poverty by Sex and Age in Lyman
With 5.2% poverty level for males and 8.0% for females among the residents of Lyman, 55 to 64 year old males and 6 to 11 year old females are the most vulnerable to poverty, with 48 males (21.8%) and 56 females (34.8%) in their respective age groups living below the poverty level.
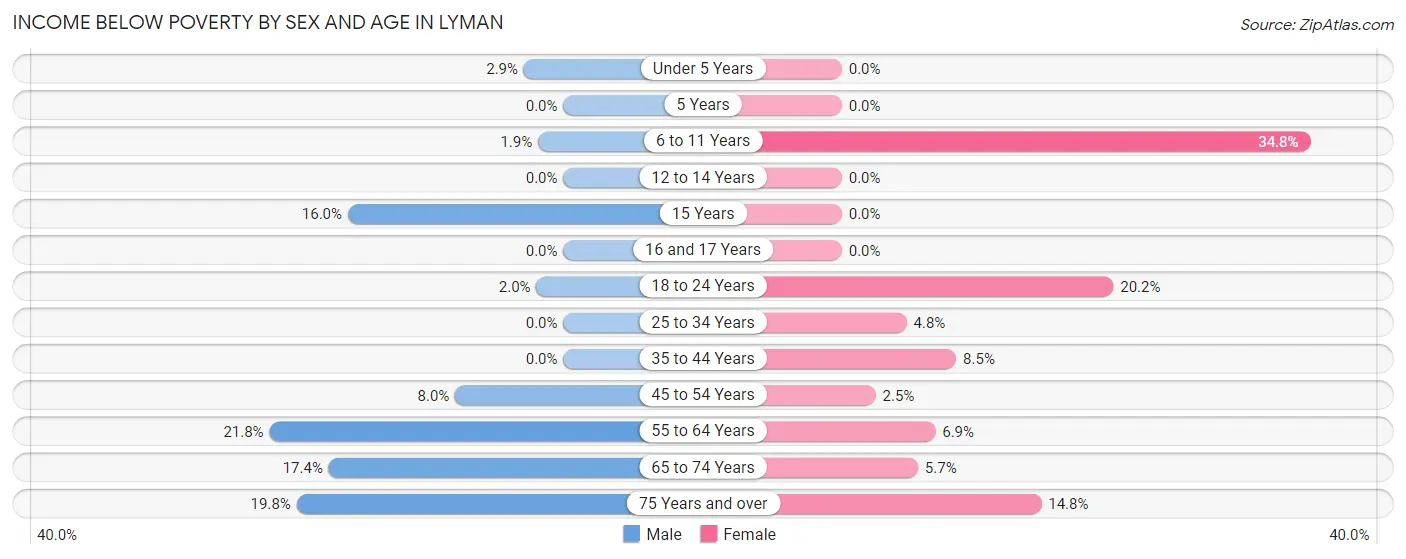
| Age Bracket | Male | Female |
| Under 5 Years | 17 (2.9%) | 0 (0.0%) |
| 5 Years | 0 (0.0%) | 0 (0.0%) |
| 6 to 11 Years | 6 (1.9%) | 56 (34.8%) |
| 12 to 14 Years | 0 (0.0%) | 0 (0.0%) |
| 15 Years | 8 (16.0%) | 0 (0.0%) |
| 16 and 17 Years | 0 (0.0%) | 0 (0.0%) |
| 18 to 24 Years | 6 (2.0%) | 50 (20.2%) |
| 25 to 34 Years | 0 (0.0%) | 33 (4.8%) |
| 35 to 44 Years | 0 (0.0%) | 27 (8.5%) |
| 45 to 54 Years | 20 (8.0%) | 5 (2.5%) |
| 55 to 64 Years | 48 (21.8%) | 22 (6.9%) |
| 65 to 74 Years | 23 (17.4%) | 13 (5.7%) |
| 75 Years and over | 39 (19.8%) | 24 (14.8%) |
| Total | 167 (5.2%) | 230 (8.0%) |
Income Above Poverty by Sex and Age in Lyman
According to the poverty statistics in Lyman, males aged 12 to 14 years and females aged under 5 years are the age groups that are most secure financially, with 100.0% of males and 100.0% of females in these age groups living above the poverty line.
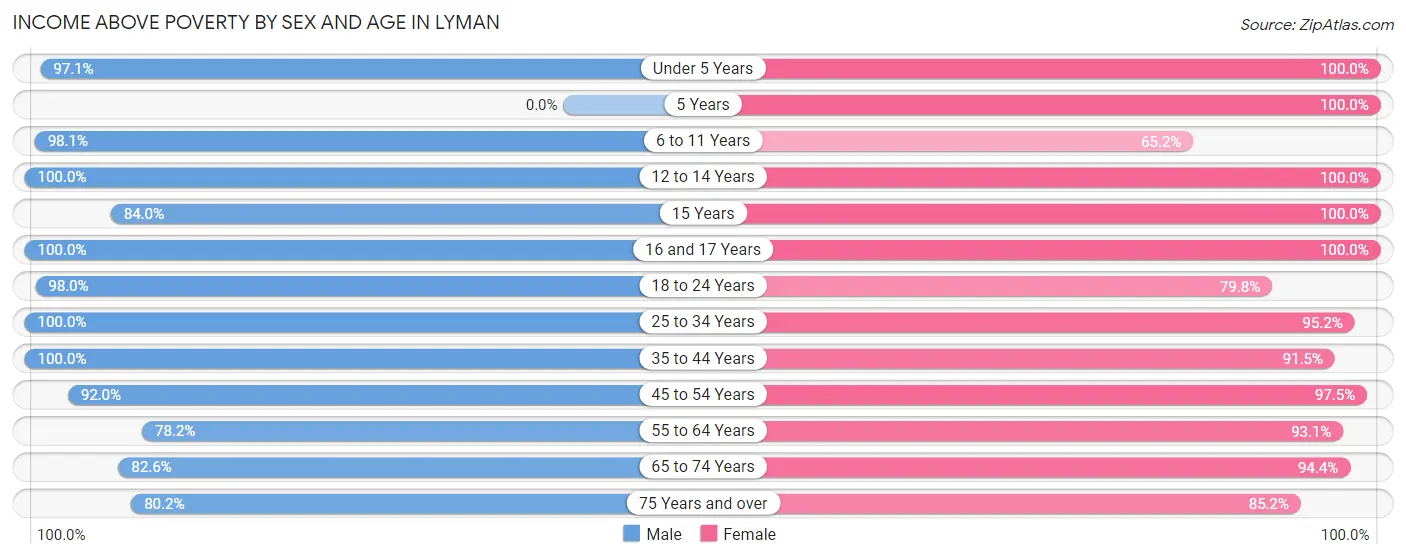
| Age Bracket | Male | Female |
| Under 5 Years | 563 (97.1%) | 295 (100.0%) |
| 5 Years | 0 (0.0%) | 18 (100.0%) |
| 6 to 11 Years | 313 (98.1%) | 105 (65.2%) |
| 12 to 14 Years | 60 (100.0%) | 122 (100.0%) |
| 15 Years | 42 (84.0%) | 64 (100.0%) |
| 16 and 17 Years | 75 (100.0%) | 41 (100.0%) |
| 18 to 24 Years | 294 (98.0%) | 198 (79.8%) |
| 25 to 34 Years | 722 (100.0%) | 653 (95.2%) |
| 35 to 44 Years | 334 (100.0%) | 291 (91.5%) |
| 45 to 54 Years | 229 (92.0%) | 194 (97.5%) |
| 55 to 64 Years | 172 (78.2%) | 295 (93.1%) |
| 65 to 74 Years | 109 (82.6%) | 217 (94.4%) |
| 75 Years and over | 158 (80.2%) | 138 (85.2%) |
| Total | 3,071 (94.8%) | 2,631 (92.0%) |
Income Below Poverty Among Married-Couple Families in Lyman
The poverty statistics for married-couple families in Lyman show that 3.3% or 46 of the total 1,411 families live below the poverty line. Families with no children have the highest poverty rate of 5.6%, comprising of 39 families. On the other hand, families with 3 or 4 children have the lowest poverty rate of 0.0%, which includes 0 families.
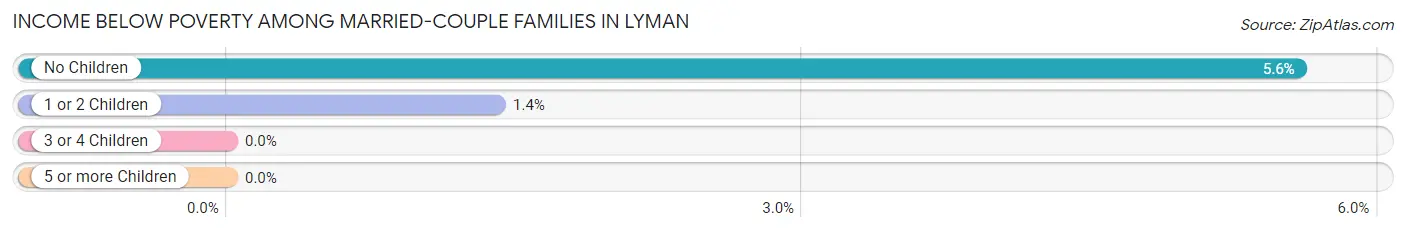
| Children | Above Poverty | Below Poverty |
| No Children | 660 (94.4%) | 39 (5.6%) |
| 1 or 2 Children | 493 (98.6%) | 7 (1.4%) |
| 3 or 4 Children | 98 (100.0%) | 0 (0.0%) |
| 5 or more Children | 114 (100.0%) | 0 (0.0%) |
| Total | 1,365 (96.7%) | 46 (3.3%) |
Income Below Poverty Among Single-Parent Households in Lyman
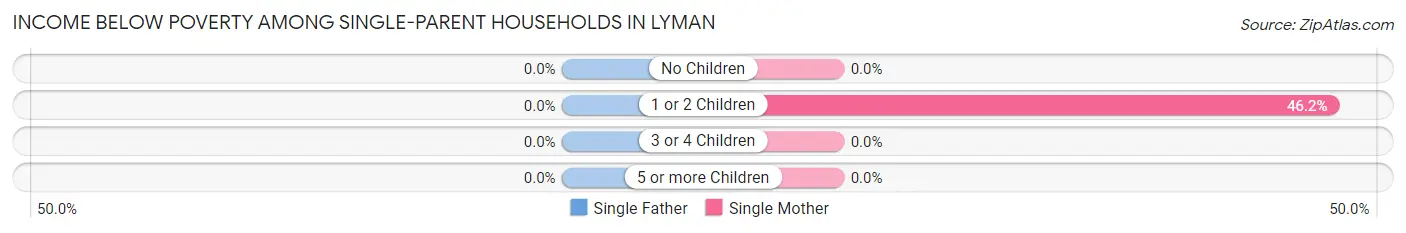
| Children | Single Father | Single Mother |
| No Children | 0 (0.0%) | 0 (0.0%) |
| 1 or 2 Children | 0 (0.0%) | 42 (46.2%) |
| 3 or 4 Children | 0 (0.0%) | 0 (0.0%) |
| 5 or more Children | 0 (0.0%) | 0 (0.0%) |
| Total | 0 (0.0%) | 42 (18.1%) |
Income Below Poverty Among Married-Couple vs Single-Parent Households in Lyman
The poverty data for Lyman shows that 46 of the married-couple family households (3.3%) and 42 of the single-parent households (15.7%) are living below the poverty level. Within the married-couple family households, those with no children have the highest poverty rate, with 39 households (5.6%) falling below the poverty line. Among the single-parent households, those with 1 or 2 children have the highest poverty rate, with 42 household (37.5%) living below poverty.
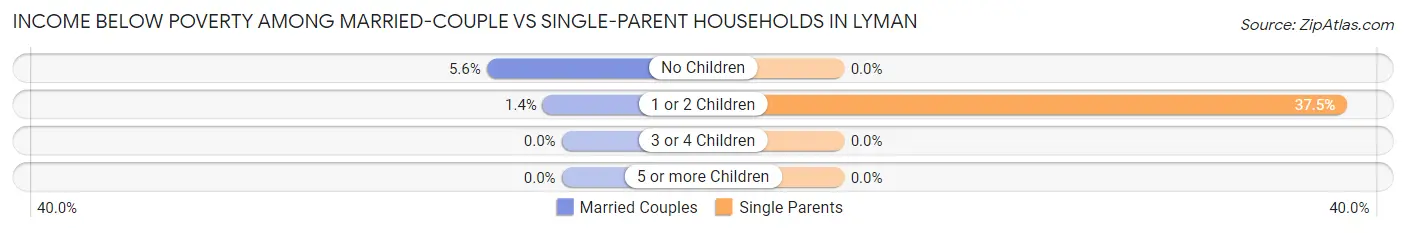
| Children | Married-Couple Families | Single-Parent Households |
| No Children | 39 (5.6%) | 0 (0.0%) |
| 1 or 2 Children | 7 (1.4%) | 42 (37.5%) |
| 3 or 4 Children | 0 (0.0%) | 0 (0.0%) |
| 5 or more Children | 0 (0.0%) | 0 (0.0%) |
| Total | 46 (3.3%) | 42 (15.7%) |
Race in Lyman
The most populous races in Lyman are White / Caucasian (4,011 | 65.8%), Black / African American (1,063 | 17.4%), and Two or more Races (422 | 6.9%).
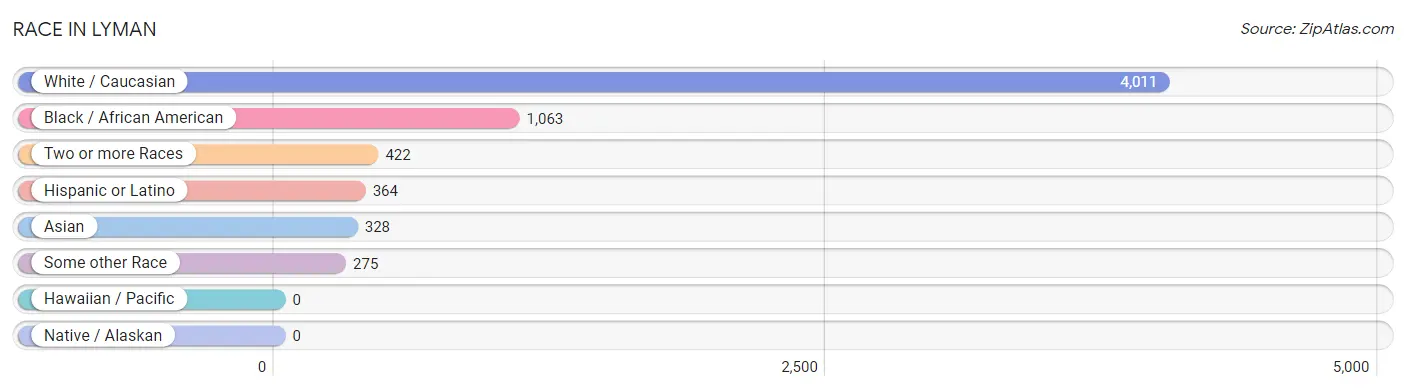
| Race | # Population | % Population |
| Asian | 328 | 5.4% |
| Black / African American | 1,063 | 17.4% |
| Hawaiian / Pacific | 0 | 0.0% |
| Hispanic or Latino | 364 | 6.0% |
| Native / Alaskan | 0 | 0.0% |
| White / Caucasian | 4,011 | 65.8% |
| Two or more Races | 422 | 6.9% |
| Some other Race | 275 | 4.5% |
| Total | 6,099 | 100.0% |
Ancestry in Lyman
The most populous ancestries reported in Lyman are English (962 | 15.8%), American (627 | 10.3%), Irish (598 | 9.8%), German (458 | 7.5%), and Indonesian (241 | 4.0%), together accounting for 47.3% of all Lyman residents.
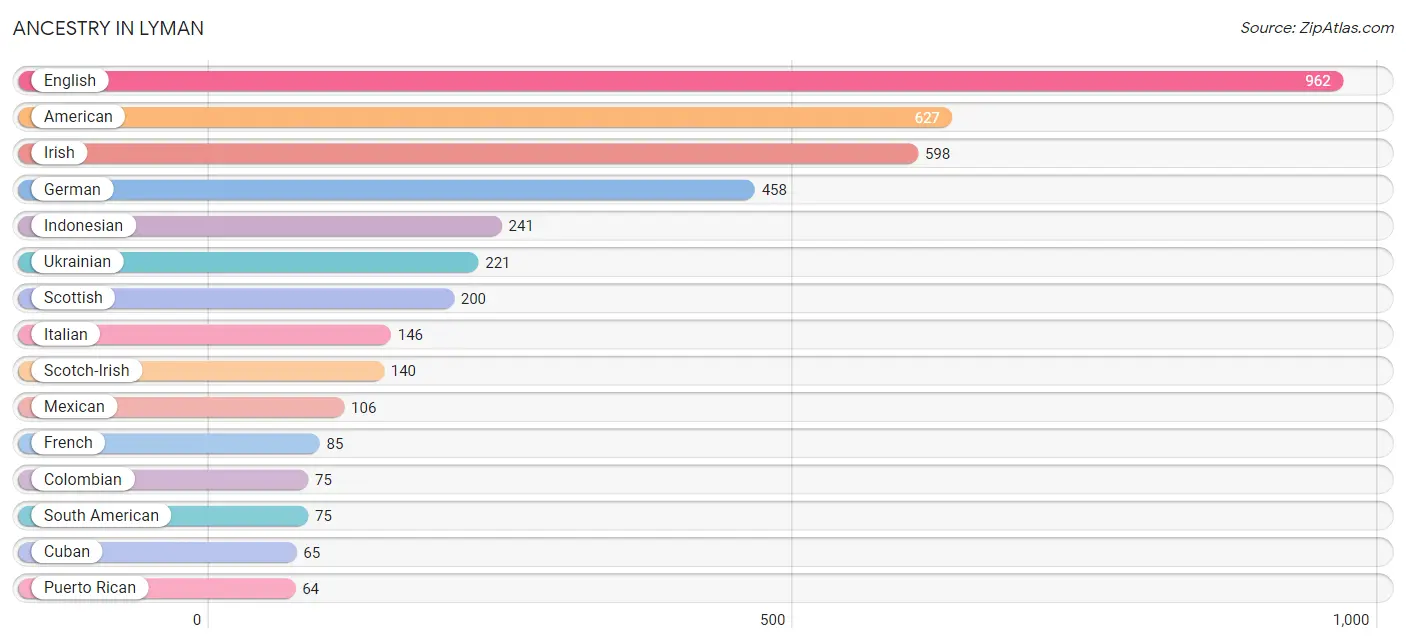
| Ancestry | # Population | % Population |
| American | 627 | 10.3% |
| Belgian | 22 | 0.4% |
| Bhutanese | 33 | 0.5% |
| Burmese | 31 | 0.5% |
| Central American | 54 | 0.9% |
| Cherokee | 14 | 0.2% |
| Colombian | 75 | 1.2% |
| Cuban | 65 | 1.1% |
| Czech | 24 | 0.4% |
| Dutch | 47 | 0.8% |
| English | 962 | 15.8% |
| European | 58 | 0.9% |
| French | 85 | 1.4% |
| French Canadian | 42 | 0.7% |
| German | 458 | 7.5% |
| Guatemalan | 54 | 0.9% |
| Hungarian | 19 | 0.3% |
| Indian (Asian) | 56 | 0.9% |
| Indonesian | 241 | 4.0% |
| Irish | 598 | 9.8% |
| Italian | 146 | 2.4% |
| Mexican | 106 | 1.7% |
| Pakistani | 36 | 0.6% |
| Pennsylvania German | 40 | 0.7% |
| Puerto Rican | 64 | 1.1% |
| Russian | 31 | 0.5% |
| Scotch-Irish | 140 | 2.3% |
| Scottish | 200 | 3.3% |
| South American | 75 | 1.2% |
| Ukrainian | 221 | 3.6% |
| Welsh | 12 | 0.2% | View All 31 Rows |
Immigrants in Lyman
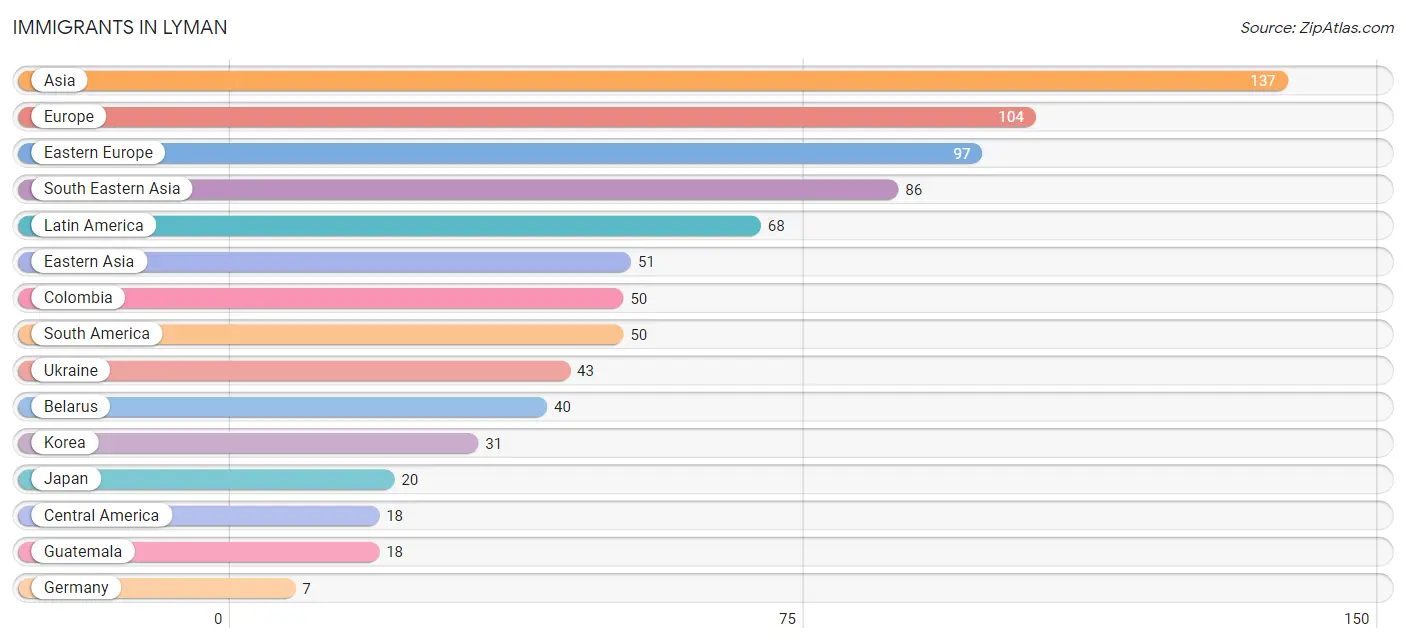
The most numerous immigrant groups reported in Lyman came from Asia (137 | 2.2%), Europe (104 | 1.7%), Eastern Europe (97 | 1.6%), South Eastern Asia (86 | 1.4%), and Latin America (68 | 1.1%), together accounting for 8.1% of all Lyman residents.
| Immigration Origin | # Population | % Population |
| Asia | 137 | 2.2% |
| Belarus | 40 | 0.7% |
| Central America | 18 | 0.3% |
| Colombia | 50 | 0.8% |
| Eastern Asia | 51 | 0.8% |
| Eastern Europe | 97 | 1.6% |
| Europe | 104 | 1.7% |
| Germany | 7 | 0.1% |
| Guatemala | 18 | 0.3% |
| Japan | 20 | 0.3% |
| Korea | 31 | 0.5% |
| Latin America | 68 | 1.1% |
| South America | 50 | 0.8% |
| South Eastern Asia | 86 | 1.4% |
| Ukraine | 43 | 0.7% |
| Western Europe | 7 | 0.1% | View All 16 Rows |
Sex and Age in Lyman
Sex and Age in Lyman
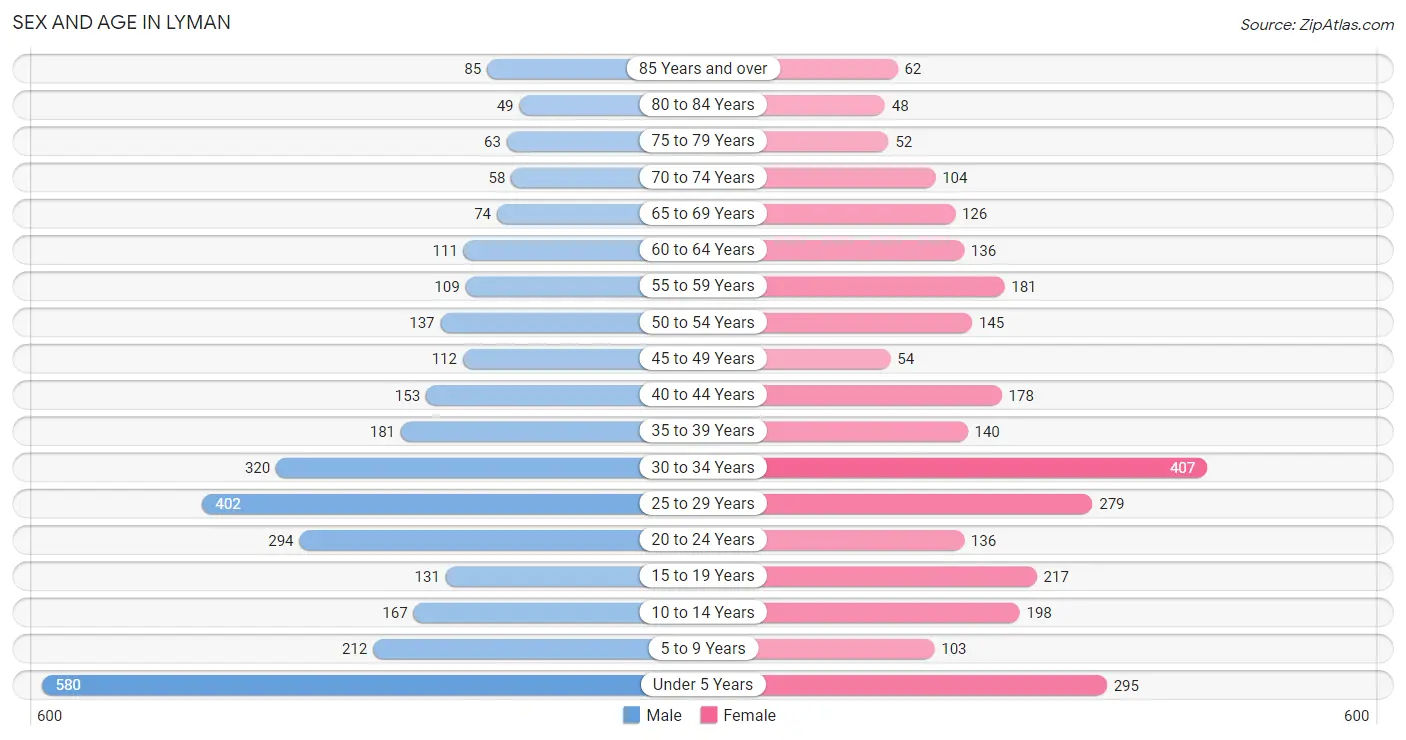
The most populous age groups in Lyman are Under 5 Years (580 | 17.9%) for men and 30 to 34 Years (407 | 14.2%) for women.
| Age Bracket | Male | Female |
| Under 5 Years | 580 (17.9%) | 295 (10.3%) |
| 5 to 9 Years | 212 (6.6%) | 103 (3.6%) |
| 10 to 14 Years | 167 (5.2%) | 198 (6.9%) |
| 15 to 19 Years | 131 (4.1%) | 217 (7.6%) |
| 20 to 24 Years | 294 (9.1%) | 136 (4.8%) |
| 25 to 29 Years | 402 (12.4%) | 279 (9.8%) |
| 30 to 34 Years | 320 (9.9%) | 407 (14.2%) |
| 35 to 39 Years | 181 (5.6%) | 140 (4.9%) |
| 40 to 44 Years | 153 (4.7%) | 178 (6.2%) |
| 45 to 49 Years | 112 (3.5%) | 54 (1.9%) |
| 50 to 54 Years | 137 (4.2%) | 145 (5.1%) |
| 55 to 59 Years | 109 (3.4%) | 181 (6.3%) |
| 60 to 64 Years | 111 (3.4%) | 136 (4.8%) |
| 65 to 69 Years | 74 (2.3%) | 126 (4.4%) |
| 70 to 74 Years | 58 (1.8%) | 104 (3.6%) |
| 75 to 79 Years | 63 (1.9%) | 52 (1.8%) |
| 80 to 84 Years | 49 (1.5%) | 48 (1.7%) |
| 85 Years and over | 85 (2.6%) | 62 (2.2%) |
| Total | 3,238 (100.0%) | 2,861 (100.0%) |
Families and Households in Lyman
Median Family Size in Lyman
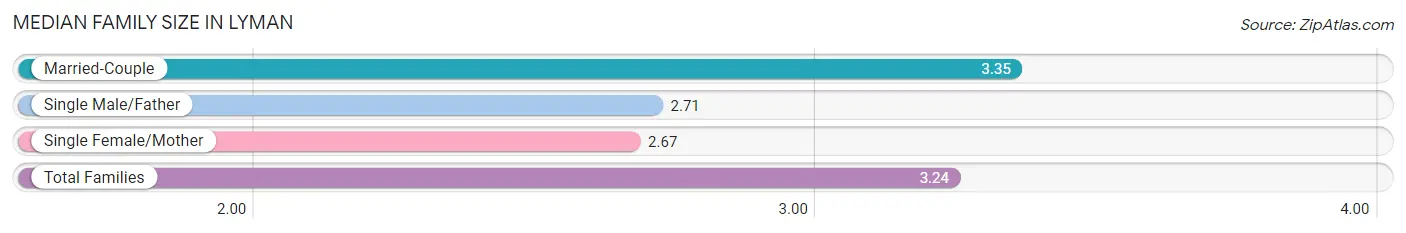
The median family size in Lyman is 3.24 persons per family, with married-couple families (1,411 | 84.1%) accounting for the largest median family size of 3.35 persons per family. On the other hand, single female/mother families (232 | 13.8%) represent the smallest median family size with 2.67 persons per family.
| Family Type | # Families | Family Size |
| Married-Couple | 1,411 (84.1%) | 3.35 |
| Single Male/Father | 35 (2.1%) | 2.71 |
| Single Female/Mother | 232 (13.8%) | 2.67 |
| Total Families | 1,678 (100.0%) | 3.24 |
Median Household Size in Lyman
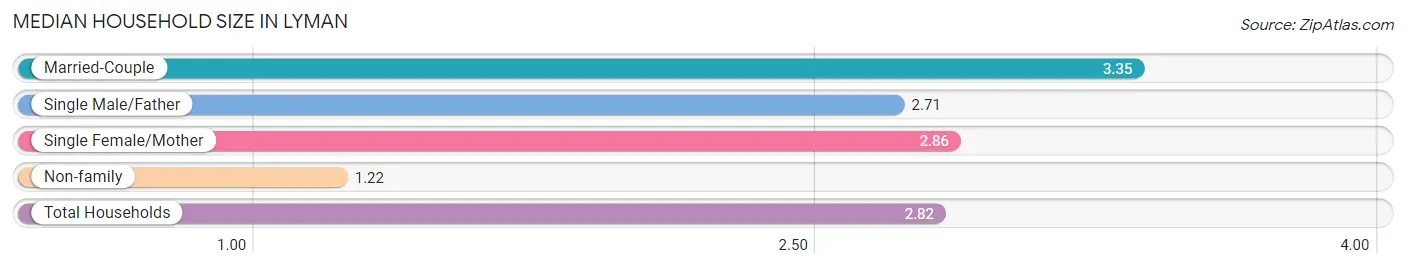
The median household size in Lyman is 2.82 persons per household, with married-couple households (1,411 | 65.7%) accounting for the largest median household size of 3.35 persons per household. non-family households (468 | 21.8%) represent the smallest median household size with 1.22 persons per household.
| Household Type | # Households | Household Size |
| Married-Couple | 1,411 (65.7%) | 3.35 |
| Single Male/Father | 35 (1.6%) | 2.71 |
| Single Female/Mother | 232 (10.8%) | 2.86 |
| Non-family | 468 (21.8%) | 1.22 |
| Total Households | 2,146 (100.0%) | 2.82 |
Household Size by Marriage Status in Lyman
Out of a total of 2,146 households in Lyman, 1,678 (78.2%) are family households, while 468 (21.8%) are nonfamily households. The most numerous type of family households are 2-person households, comprising 801, and the most common type of nonfamily households are 1-person households, comprising 368.
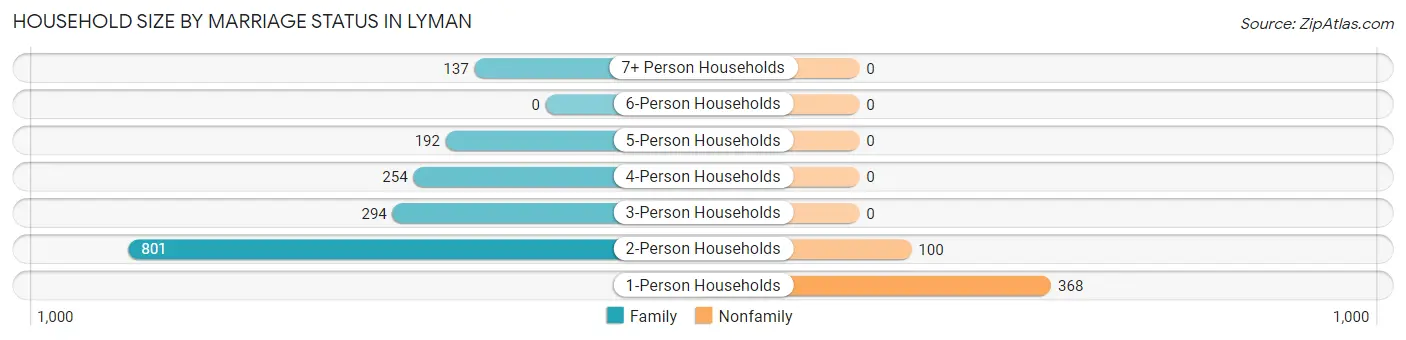
| Household Size | Family Households | Nonfamily Households |
| 1-Person Households | - | 368 (17.2%) |
| 2-Person Households | 801 (37.3%) | 100 (4.7%) |
| 3-Person Households | 294 (13.7%) | 0 (0.0%) |
| 4-Person Households | 254 (11.8%) | 0 (0.0%) |
| 5-Person Households | 192 (8.9%) | 0 (0.0%) |
| 6-Person Households | 0 (0.0%) | 0 (0.0%) |
| 7+ Person Households | 137 (6.4%) | 0 (0.0%) |
| Total | 1,678 (78.2%) | 468 (21.8%) |
Female Fertility in Lyman
Fertility by Age in Lyman
Average fertility rate in Lyman is 90.0 births per 1,000 women. Women in the age bracket of 20 to 34 years have the highest fertility rate with 156.0 births per 1,000 women. Women in the age bracket of 20 to 34 years acount for 100.0% of all women with births.
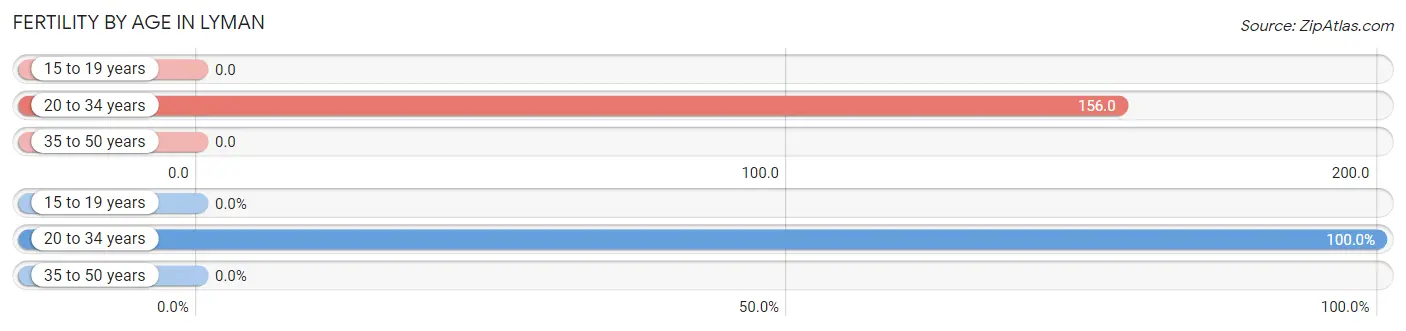
| Age Bracket | Women with Births | Births / 1,000 Women |
| 15 to 19 years | 0 (0.0%) | 0.0 |
| 20 to 34 years | 128 (100.0%) | 156.0 |
| 35 to 50 years | 0 (0.0%) | 0.0 |
| Total | 128 (100.0%) | 90.0 |
Fertility by Age by Marriage Status in Lyman
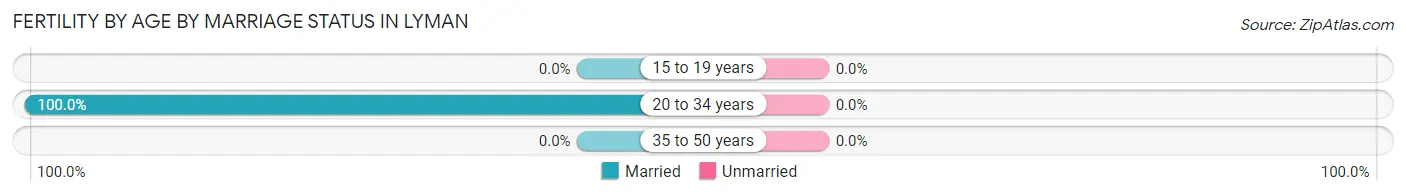
| Age Bracket | Married | Unmarried |
| 15 to 19 years | 0 (0.0%) | 0 (0.0%) |
| 20 to 34 years | 128 (100.0%) | 0 (0.0%) |
| 35 to 50 years | 0 (0.0%) | 0 (0.0%) |
| Total | 128 (100.0%) | 0 (0.0%) |
Fertility by Education in Lyman
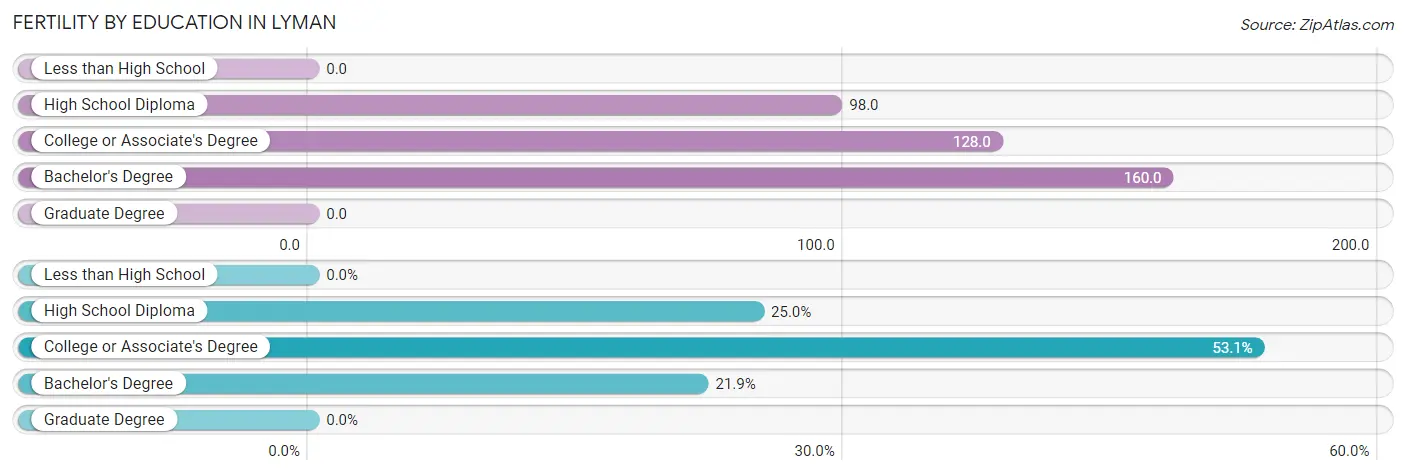
| Educational Attainment | Women with Births | Births / 1,000 Women |
| Less than High School | 0 (0.0%) | 0.0 |
| High School Diploma | 32 (25.0%) | 98.0 |
| College or Associate's Degree | 68 (53.1%) | 128.0 |
| Bachelor's Degree | 28 (21.9%) | 160.0 |
| Graduate Degree | 0 (0.0%) | 0.0 |
| Total | 128 (100.0%) | 90.0 |
Fertility by Education by Marriage Status in Lyman
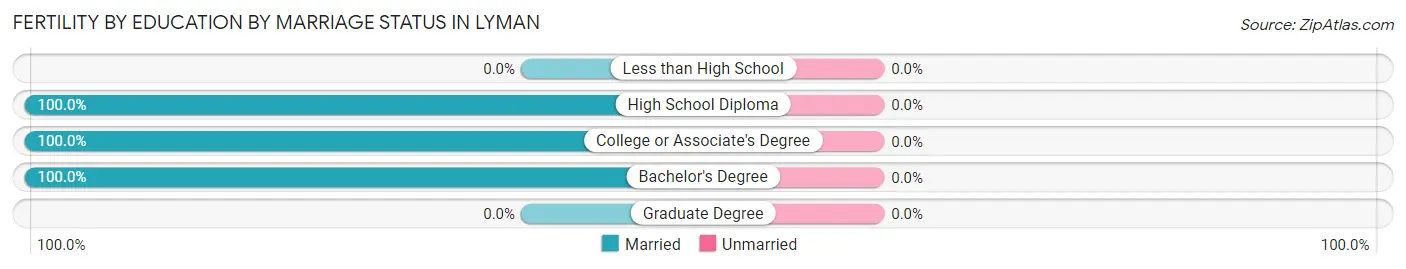
| Educational Attainment | Married | Unmarried |
| Less than High School | 0 (0.0%) | 0 (0.0%) |
| High School Diploma | 32 (100.0%) | 0 (0.0%) |
| College or Associate's Degree | 68 (100.0%) | 0 (0.0%) |
| Bachelor's Degree | 28 (100.0%) | 0 (0.0%) |
| Graduate Degree | 0 (0.0%) | 0 (0.0%) |
| Total | 128 (100.0%) | 0 (0.0%) |
Employment Characteristics in Lyman
Employment by Class of Employer in Lyman
Among the 2,914 employed individuals in Lyman, private company employees (2,417 | 82.9%), local government employees (185 | 6.4%), and not-for-profit organizations (117 | 4.0%) make up the most common classes of employment.
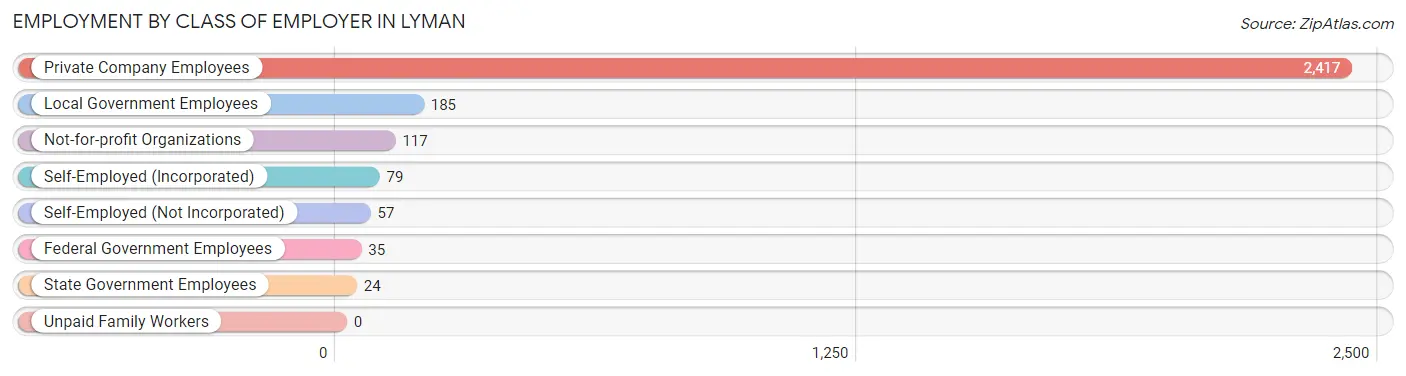
| Employer Class | # Employees | % Employees |
| Private Company Employees | 2,417 | 82.9% |
| Self-Employed (Incorporated) | 79 | 2.7% |
| Self-Employed (Not Incorporated) | 57 | 2.0% |
| Not-for-profit Organizations | 117 | 4.0% |
| Local Government Employees | 185 | 6.4% |
| State Government Employees | 24 | 0.8% |
| Federal Government Employees | 35 | 1.2% |
| Unpaid Family Workers | 0 | 0.0% |
| Total | 2,914 | 100.0% |
Employment Status by Age in Lyman
According to the labor force statistics for Lyman, out of the total population over 16 years of age (4,430), 69.1% or 3,061 individuals are in the labor force, with 3.8% or 116 of them unemployed. The age group with the highest labor force participation rate is 20 to 24 years, with 95.1% or 409 individuals in the labor force. Within the labor force, the 30 to 34 years age range has the highest percentage of unemployed individuals, with 17.7% or 106 of them being unemployed.
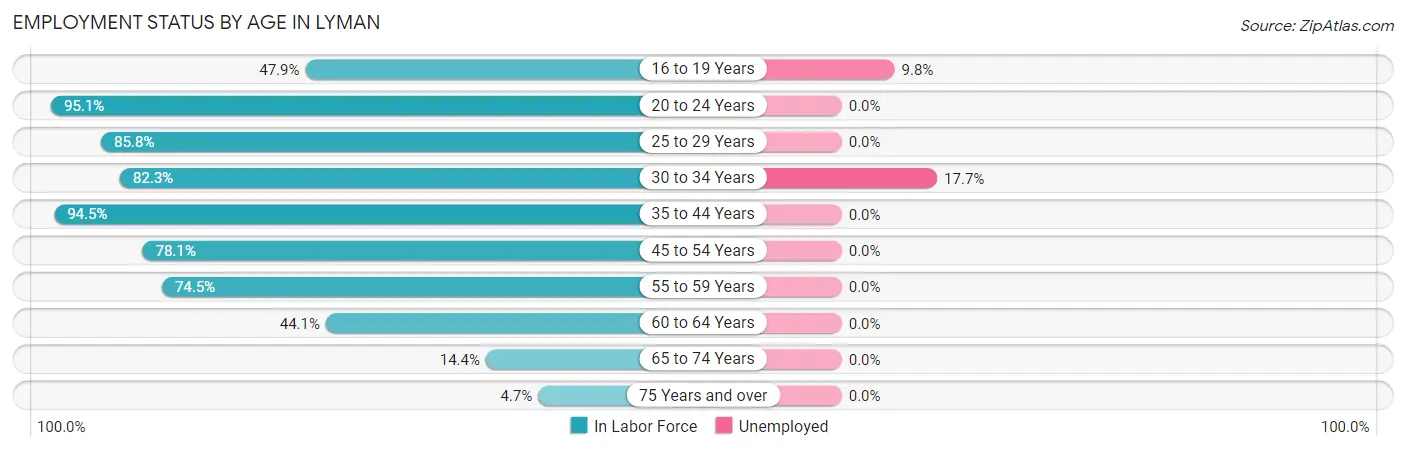
| Age Bracket | In Labor Force | Unemployed |
| 16 to 19 Years | 112 (47.9%) | 11 (9.8%) |
| 20 to 24 Years | 409 (95.1%) | 0 (0.0%) |
| 25 to 29 Years | 584 (85.8%) | 0 (0.0%) |
| 30 to 34 Years | 598 (82.3%) | 106 (17.7%) |
| 35 to 44 Years | 616 (94.5%) | 0 (0.0%) |
| 45 to 54 Years | 350 (78.1%) | 0 (0.0%) |
| 55 to 59 Years | 216 (74.5%) | 0 (0.0%) |
| 60 to 64 Years | 109 (44.1%) | 0 (0.0%) |
| 65 to 74 Years | 52 (14.4%) | 0 (0.0%) |
| 75 Years and over | 17 (4.7%) | 0 (0.0%) |
| Total | 3,061 (69.1%) | 116 (3.8%) |
Employment Status by Educational Attainment in Lyman
According to labor force statistics for Lyman, 81.2% of individuals (2,473) out of the total population between 25 and 64 years of age (3,045) are in the labor force, with 4.3% or 106 of them being unemployed. The group with the highest labor force participation rate are those with the educational attainment of college / associate degree, with 82.0% or 1,023 individuals in the labor force. Within the labor force, individuals with high school diploma education have the highest percentage of unemployment, with 17.8% or 106 of them being unemployed.
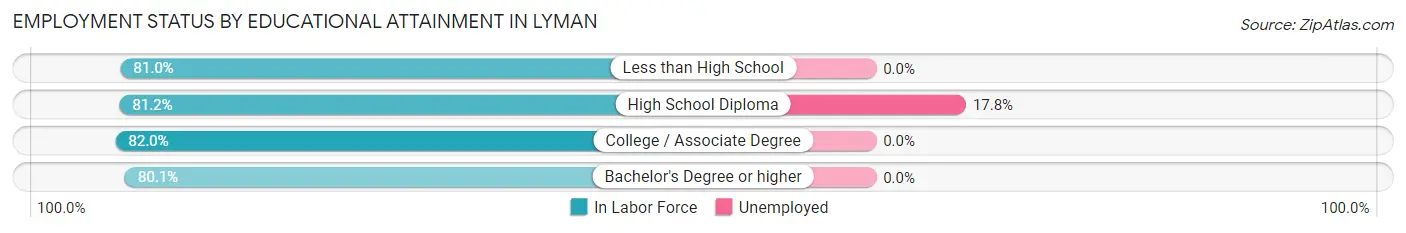
| Educational Attainment | In Labor Force | Unemployed |
| Less than High School | 171 (81.0%) | 0 (0.0%) |
| High School Diploma | 597 (81.2%) | 131 (17.8%) |
| College / Associate Degree | 1,023 (82.0%) | 0 (0.0%) |
| Bachelor's Degree or higher | 682 (80.1%) | 0 (0.0%) |
| Total | 2,473 (81.2%) | 131 (4.3%) |
Employment Occupations by Sex in Lyman
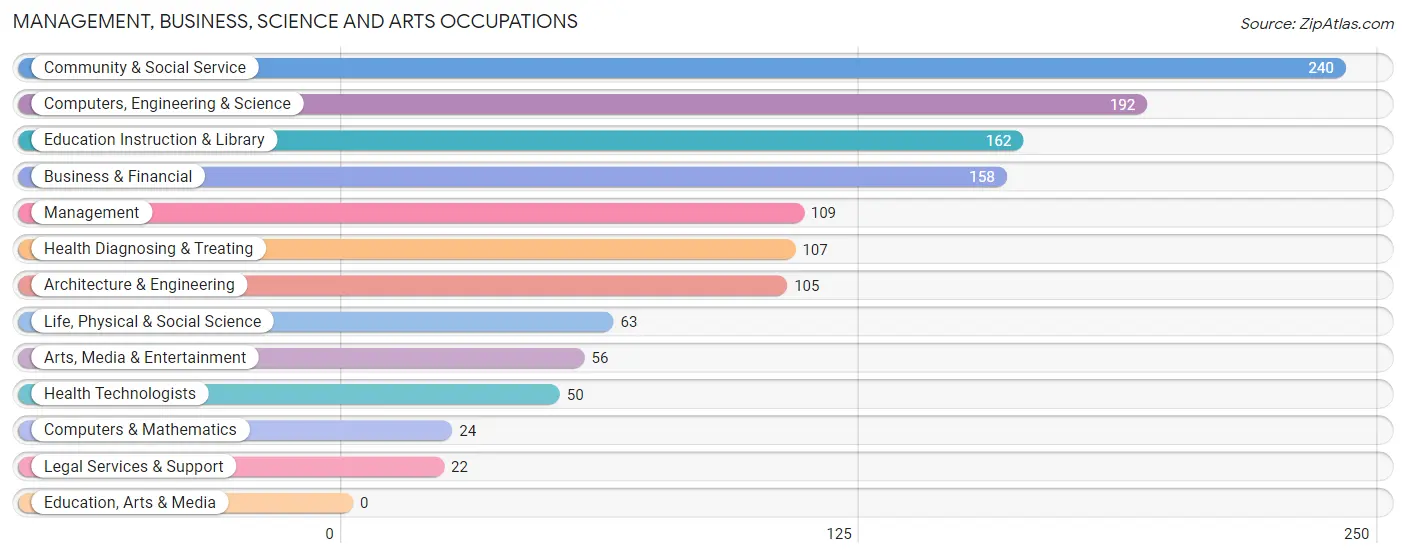
Management, Business, Science and Arts Occupations
The most common Management, Business, Science and Arts occupations in Lyman are Community & Social Service (240 | 8.2%), Computers, Engineering & Science (192 | 6.5%), Education Instruction & Library (162 | 5.5%), Business & Financial (158 | 5.4%), and Management (109 | 3.7%).
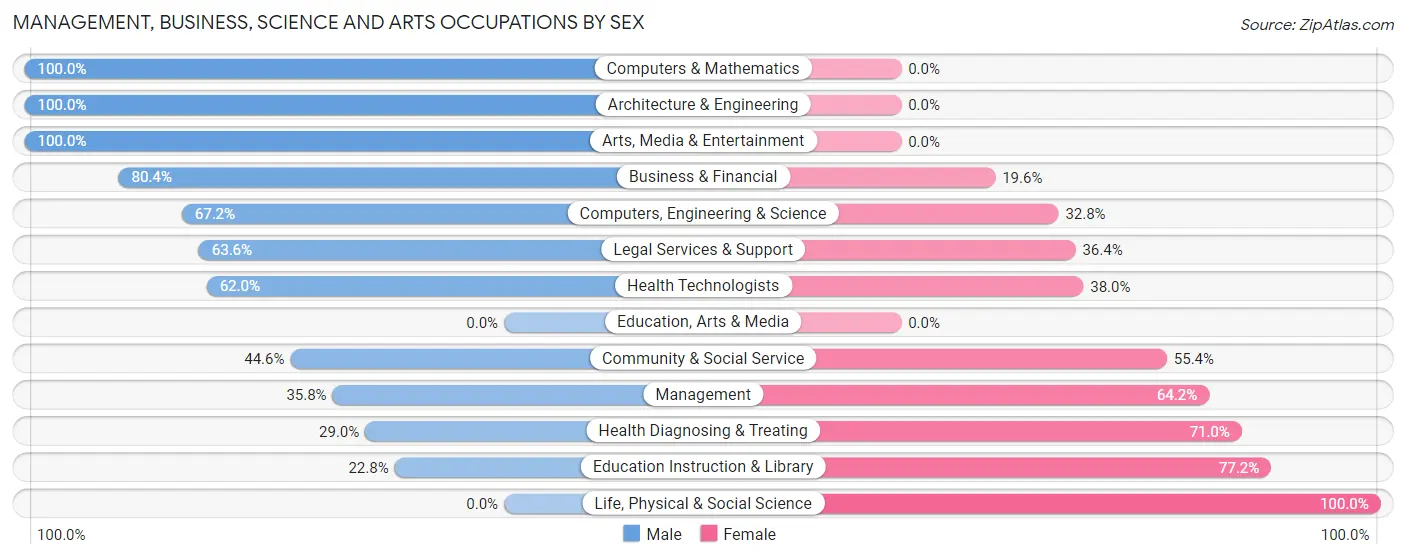
Management, Business, Science and Arts Occupations by Sex
Within the Management, Business, Science and Arts occupations in Lyman, the most male-oriented occupations are Computers & Mathematics (100.0%), Architecture & Engineering (100.0%), and Arts, Media & Entertainment (100.0%), while the most female-oriented occupations are Life, Physical & Social Science (100.0%), Education Instruction & Library (77.2%), and Health Diagnosing & Treating (71.0%).
| Occupation | Male | Female |
| Management | 39 (35.8%) | 70 (64.2%) |
| Business & Financial | 127 (80.4%) | 31 (19.6%) |
| Computers, Engineering & Science | 129 (67.2%) | 63 (32.8%) |
| Computers & Mathematics | 24 (100.0%) | 0 (0.0%) |
| Architecture & Engineering | 105 (100.0%) | 0 (0.0%) |
| Life, Physical & Social Science | 0 (0.0%) | 63 (100.0%) |
| Community & Social Service | 107 (44.6%) | 133 (55.4%) |
| Education, Arts & Media | 0 (0.0%) | 0 (0.0%) |
| Legal Services & Support | 14 (63.6%) | 8 (36.4%) |
| Education Instruction & Library | 37 (22.8%) | 125 (77.2%) |
| Arts, Media & Entertainment | 56 (100.0%) | 0 (0.0%) |
| Health Diagnosing & Treating | 31 (29.0%) | 76 (71.0%) |
| Health Technologists | 31 (62.0%) | 19 (38.0%) |
| Total (Category) | 433 (53.7%) | 373 (46.3%) |
| Total (Overall) | 1,587 (53.9%) | 1,359 (46.1%) |
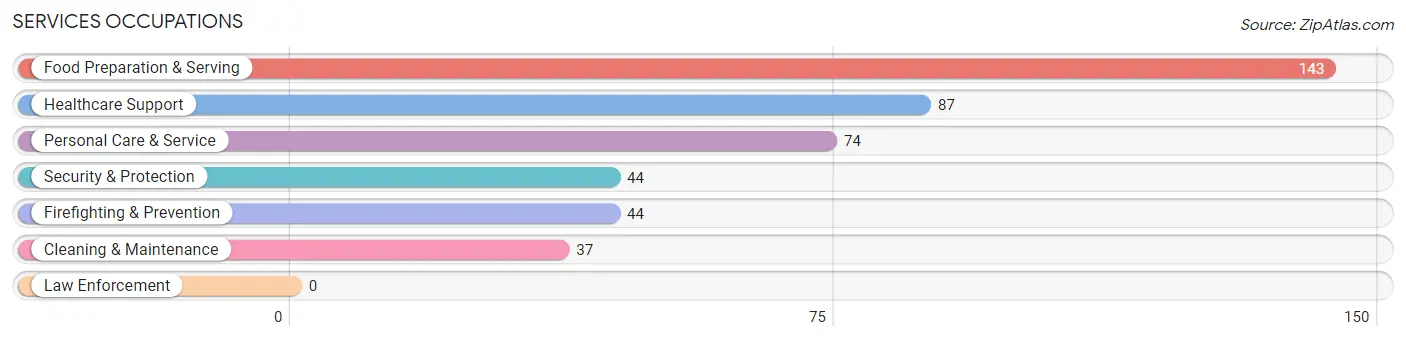
Services Occupations
The most common Services occupations in Lyman are Food Preparation & Serving (143 | 4.9%), Healthcare Support (87 | 2.9%), Personal Care & Service (74 | 2.5%), Security & Protection (44 | 1.5%), and Firefighting & Prevention (44 | 1.5%).
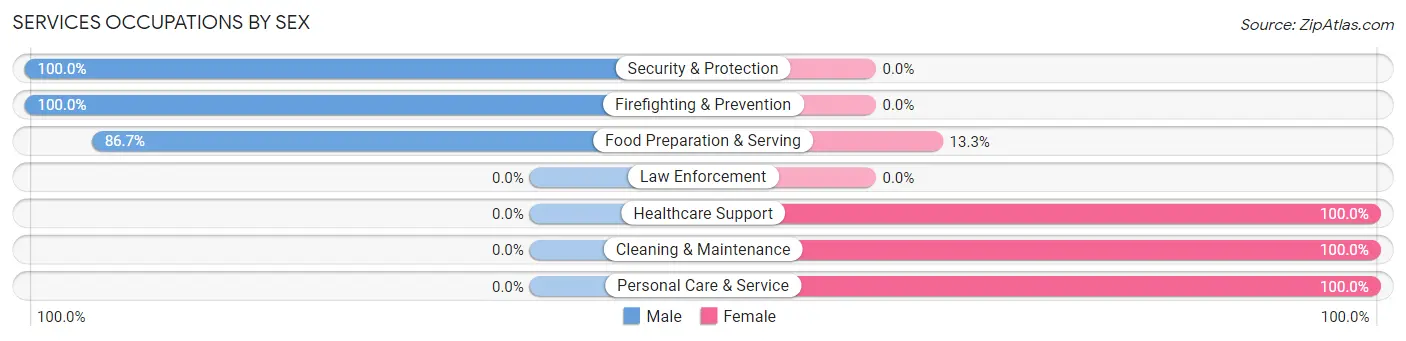
Services Occupations by Sex
Within the Services occupations in Lyman, the most male-oriented occupations are Security & Protection (100.0%), Firefighting & Prevention (100.0%), and Food Preparation & Serving (86.7%), while the most female-oriented occupations are Healthcare Support (100.0%), Cleaning & Maintenance (100.0%), and Personal Care & Service (100.0%).
| Occupation | Male | Female |
| Healthcare Support | 0 (0.0%) | 87 (100.0%) |
| Security & Protection | 44 (100.0%) | 0 (0.0%) |
| Firefighting & Prevention | 44 (100.0%) | 0 (0.0%) |
| Law Enforcement | 0 (0.0%) | 0 (0.0%) |
| Food Preparation & Serving | 124 (86.7%) | 19 (13.3%) |
| Cleaning & Maintenance | 0 (0.0%) | 37 (100.0%) |
| Personal Care & Service | 0 (0.0%) | 74 (100.0%) |
| Total (Category) | 168 (43.6%) | 217 (56.4%) |
| Total (Overall) | 1,587 (53.9%) | 1,359 (46.1%) |
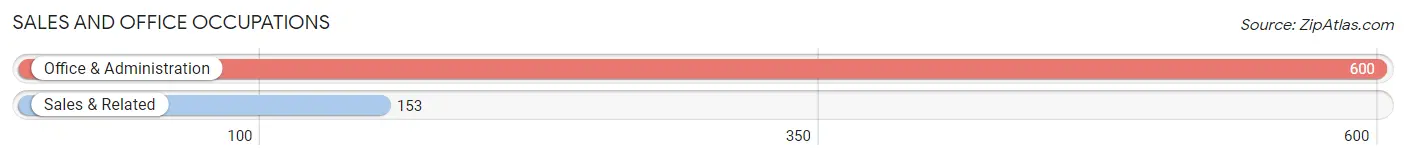
Sales and Office Occupations
The most common Sales and Office occupations in Lyman are Office & Administration (600 | 20.4%), and Sales & Related (153 | 5.2%).
Sales and Office Occupations by Sex
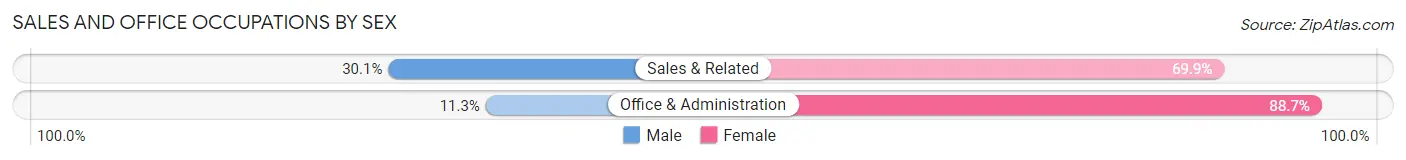
| Occupation | Male | Female |
| Sales & Related | 46 (30.1%) | 107 (69.9%) |
| Office & Administration | 68 (11.3%) | 532 (88.7%) |
| Total (Category) | 114 (15.1%) | 639 (84.9%) |
| Total (Overall) | 1,587 (53.9%) | 1,359 (46.1%) |
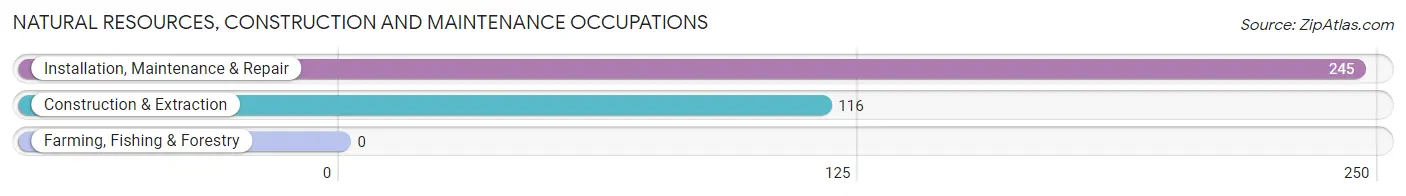
Natural Resources, Construction and Maintenance Occupations
The most common Natural Resources, Construction and Maintenance occupations in Lyman are Installation, Maintenance & Repair (245 | 8.3%), and Construction & Extraction (116 | 3.9%).
Natural Resources, Construction and Maintenance Occupations by Sex
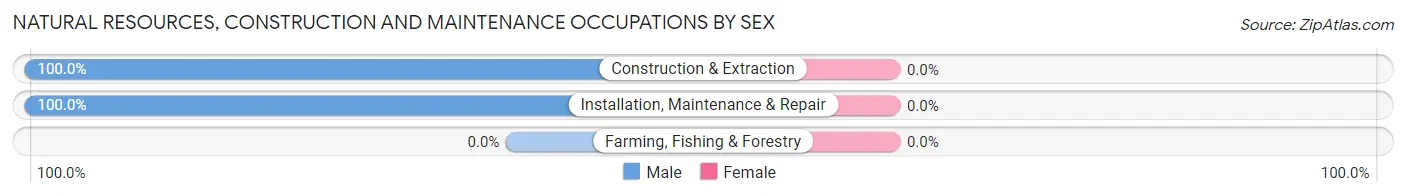
| Occupation | Male | Female |
| Farming, Fishing & Forestry | 0 (0.0%) | 0 (0.0%) |
| Construction & Extraction | 116 (100.0%) | 0 (0.0%) |
| Installation, Maintenance & Repair | 245 (100.0%) | 0 (0.0%) |
| Total (Category) | 361 (100.0%) | 0 (0.0%) |
| Total (Overall) | 1,587 (53.9%) | 1,359 (46.1%) |
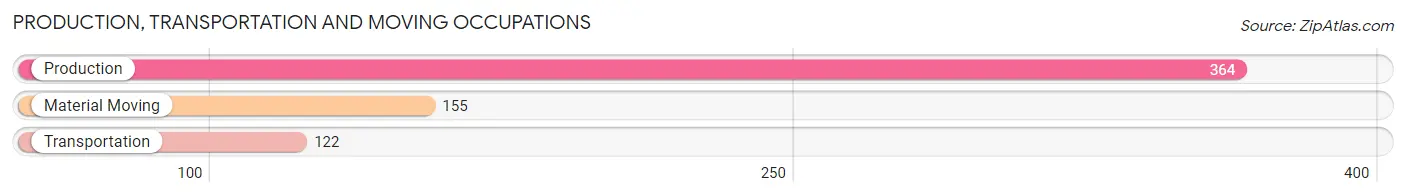
Production, Transportation and Moving Occupations
The most common Production, Transportation and Moving occupations in Lyman are Production (364 | 12.4%), Material Moving (155 | 5.3%), and Transportation (122 | 4.1%).
Production, Transportation and Moving Occupations by Sex
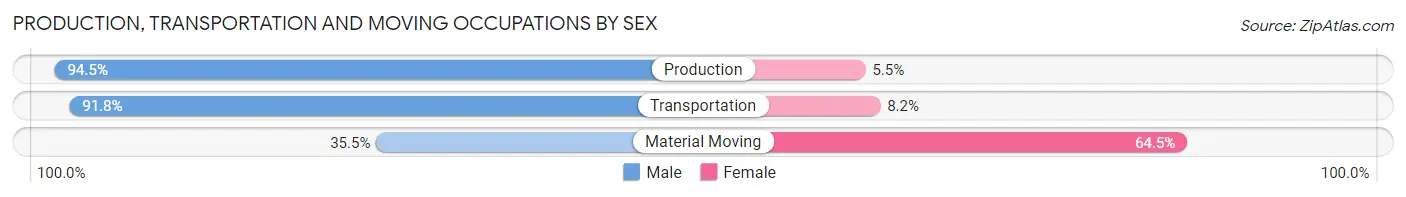
| Occupation | Male | Female |
| Production | 344 (94.5%) | 20 (5.5%) |
| Transportation | 112 (91.8%) | 10 (8.2%) |
| Material Moving | 55 (35.5%) | 100 (64.5%) |
| Total (Category) | 511 (79.7%) | 130 (20.3%) |
| Total (Overall) | 1,587 (53.9%) | 1,359 (46.1%) |
Employment Industries by Sex in Lyman
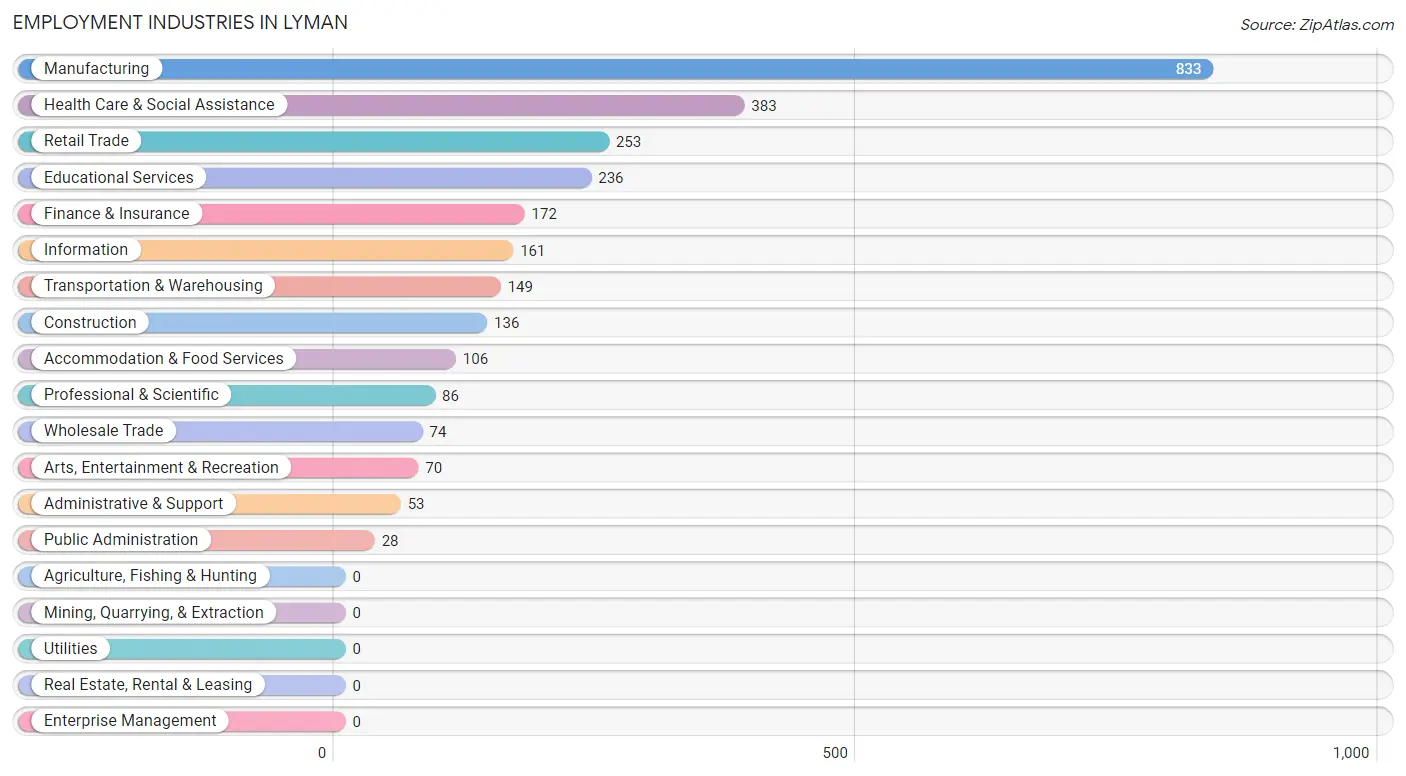
Employment Industries in Lyman
The major employment industries in Lyman include Manufacturing (833 | 28.3%), Health Care & Social Assistance (383 | 13.0%), Retail Trade (253 | 8.6%), Educational Services (236 | 8.0%), and Finance & Insurance (172 | 5.8%).
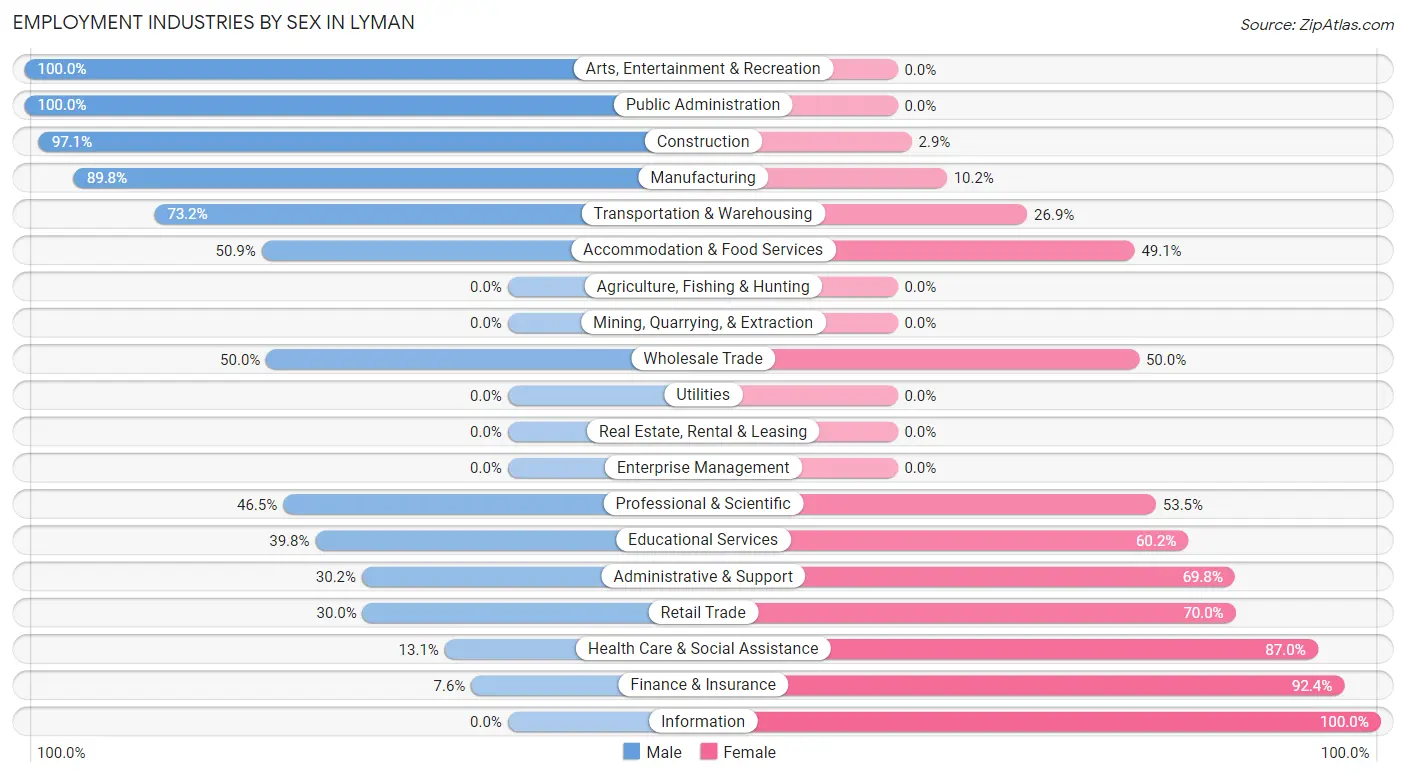
Employment Industries by Sex in Lyman
The Lyman industries that see more men than women are Arts, Entertainment & Recreation (100.0%), Public Administration (100.0%), and Construction (97.1%), whereas the industries that tend to have a higher number of women are Information (100.0%), Finance & Insurance (92.4%), and Health Care & Social Assistance (87.0%).
| Industry | Male | Female |
| Agriculture, Fishing & Hunting | 0 (0.0%) | 0 (0.0%) |
| Mining, Quarrying, & Extraction | 0 (0.0%) | 0 (0.0%) |
| Construction | 132 (97.1%) | 4 (2.9%) |
| Manufacturing | 748 (89.8%) | 85 (10.2%) |
| Wholesale Trade | 37 (50.0%) | 37 (50.0%) |
| Retail Trade | 76 (30.0%) | 177 (70.0%) |
| Transportation & Warehousing | 109 (73.2%) | 40 (26.9%) |
| Utilities | 0 (0.0%) | 0 (0.0%) |
| Information | 0 (0.0%) | 161 (100.0%) |
| Finance & Insurance | 13 (7.6%) | 159 (92.4%) |
| Real Estate, Rental & Leasing | 0 (0.0%) | 0 (0.0%) |
| Professional & Scientific | 40 (46.5%) | 46 (53.5%) |
| Enterprise Management | 0 (0.0%) | 0 (0.0%) |
| Administrative & Support | 16 (30.2%) | 37 (69.8%) |
| Educational Services | 94 (39.8%) | 142 (60.2%) |
| Health Care & Social Assistance | 50 (13.1%) | 333 (87.0%) |
| Arts, Entertainment & Recreation | 70 (100.0%) | 0 (0.0%) |
| Accommodation & Food Services | 54 (50.9%) | 52 (49.1%) |
| Public Administration | 28 (100.0%) | 0 (0.0%) |
| Total | 1,587 (53.9%) | 1,359 (46.1%) |
Education in Lyman
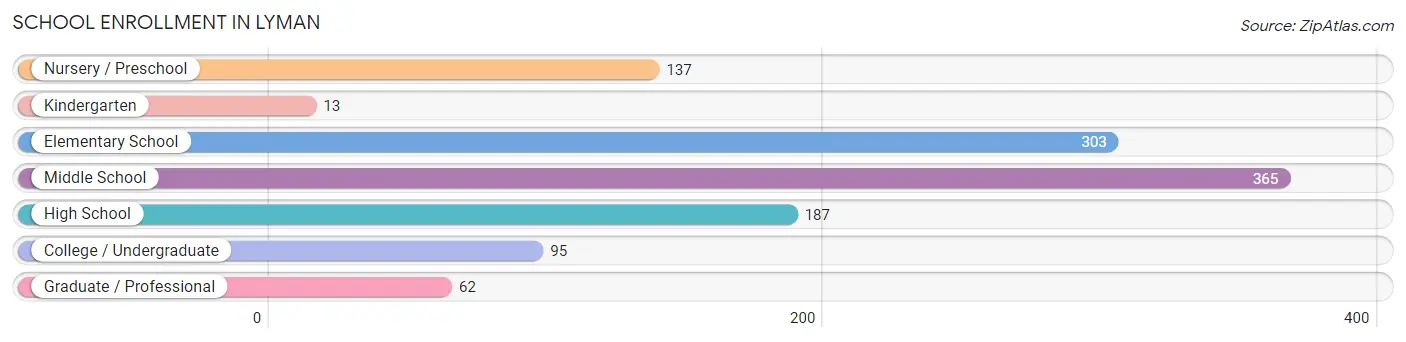
School Enrollment in Lyman
The most common levels of schooling among the 1,162 students in Lyman are middle school (365 | 31.4%), elementary school (303 | 26.1%), and high school (187 | 16.1%).
| School Level | # Students | % Students |
| Nursery / Preschool | 137 | 11.8% |
| Kindergarten | 13 | 1.1% |
| Elementary School | 303 | 26.1% |
| Middle School | 365 | 31.4% |
| High School | 187 | 16.1% |
| College / Undergraduate | 95 | 8.2% |
| Graduate / Professional | 62 | 5.3% |
| Total | 1,162 | 100.0% |
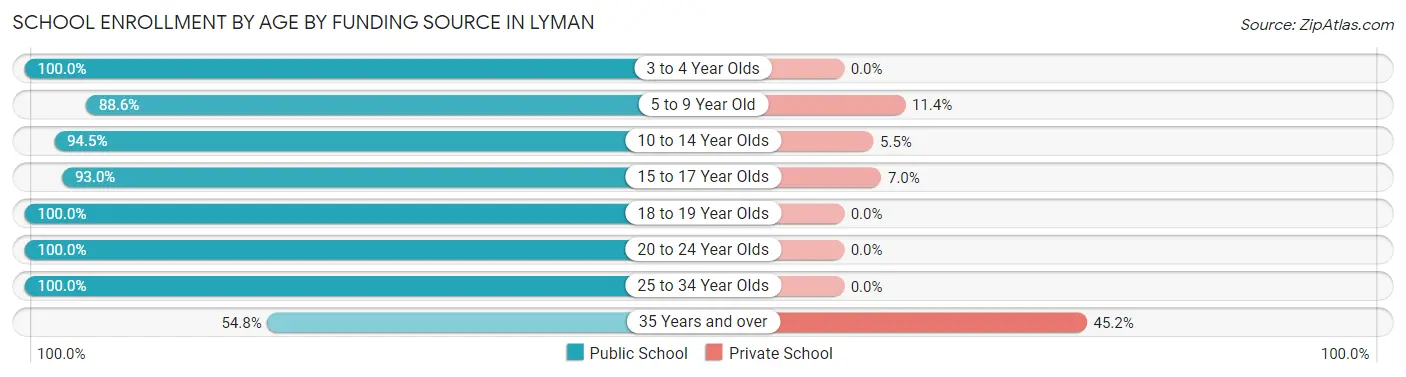
School Enrollment by Age by Funding Source in Lyman
Out of a total of 1,162 students who are enrolled in schools in Lyman, 91 (7.8%) attend a private institution, while the remaining 1,071 (92.2%) are enrolled in public schools. The age group of 35 years and over has the highest likelihood of being enrolled in private schools, with 19 (45.2% in the age bracket) enrolled. Conversely, the age group of 3 to 4 year olds has the lowest likelihood of being enrolled in a private school, with 119 (100.0% in the age bracket) attending a public institution.
| Age Bracket | Public School | Private School |
| 3 to 4 Year Olds | 119 (100.0%) | 0 (0.0%) |
| 5 to 9 Year Old | 279 (88.6%) | 36 (11.4%) |
| 10 to 14 Year Olds | 345 (94.5%) | 20 (5.5%) |
| 15 to 17 Year Olds | 214 (93.0%) | 16 (7.0%) |
| 18 to 19 Year Olds | 18 (100.0%) | 0 (0.0%) |
| 20 to 24 Year Olds | 30 (100.0%) | 0 (0.0%) |
| 25 to 34 Year Olds | 43 (100.0%) | 0 (0.0%) |
| 35 Years and over | 23 (54.8%) | 19 (45.2%) |
| Total | 1,071 (92.2%) | 91 (7.8%) |
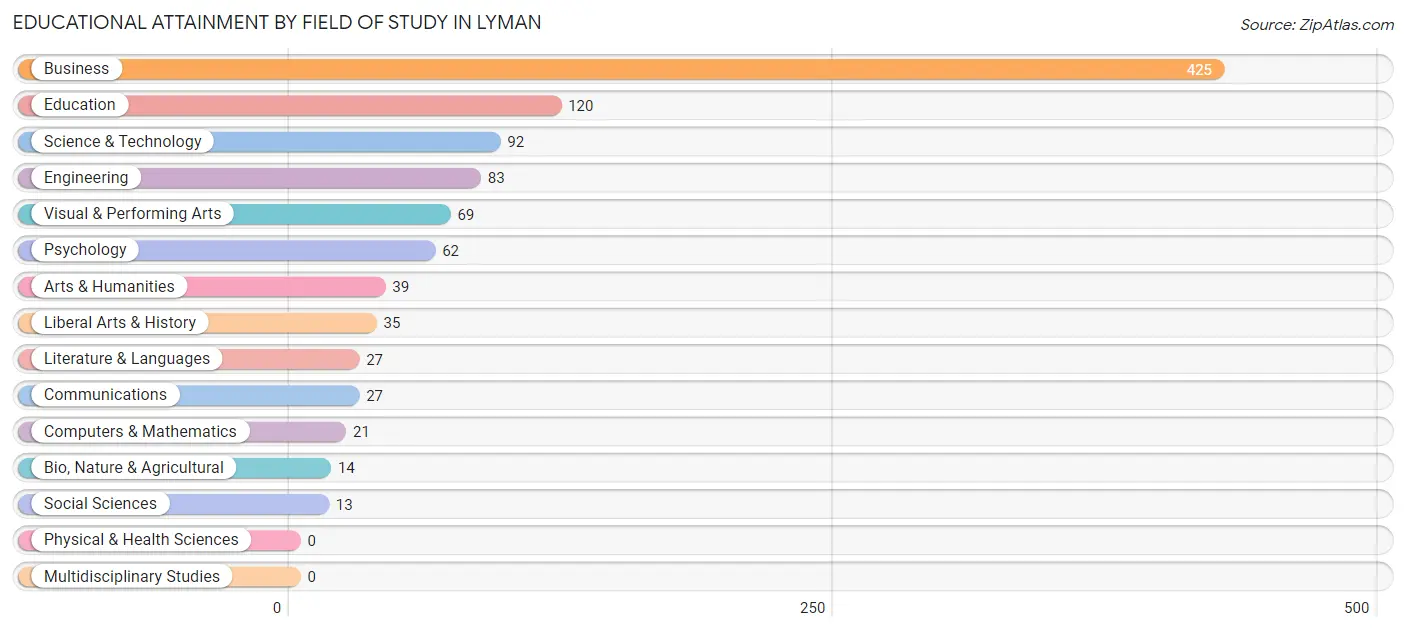
Educational Attainment by Field of Study in Lyman
Business (425 | 41.4%), education (120 | 11.7%), science & technology (92 | 9.0%), engineering (83 | 8.1%), and visual & performing arts (69 | 6.7%) are the most common fields of study among 1,027 individuals in Lyman who have obtained a bachelor's degree or higher.
| Field of Study | # Graduates | % Graduates |
| Computers & Mathematics | 21 | 2.0% |
| Bio, Nature & Agricultural | 14 | 1.4% |
| Physical & Health Sciences | 0 | 0.0% |
| Psychology | 62 | 6.0% |
| Social Sciences | 13 | 1.3% |
| Engineering | 83 | 8.1% |
| Multidisciplinary Studies | 0 | 0.0% |
| Science & Technology | 92 | 9.0% |
| Business | 425 | 41.4% |
| Education | 120 | 11.7% |
| Literature & Languages | 27 | 2.6% |
| Liberal Arts & History | 35 | 3.4% |
| Visual & Performing Arts | 69 | 6.7% |
| Communications | 27 | 2.6% |
| Arts & Humanities | 39 | 3.8% |
| Total | 1,027 | 100.0% |
Transportation & Commute in Lyman
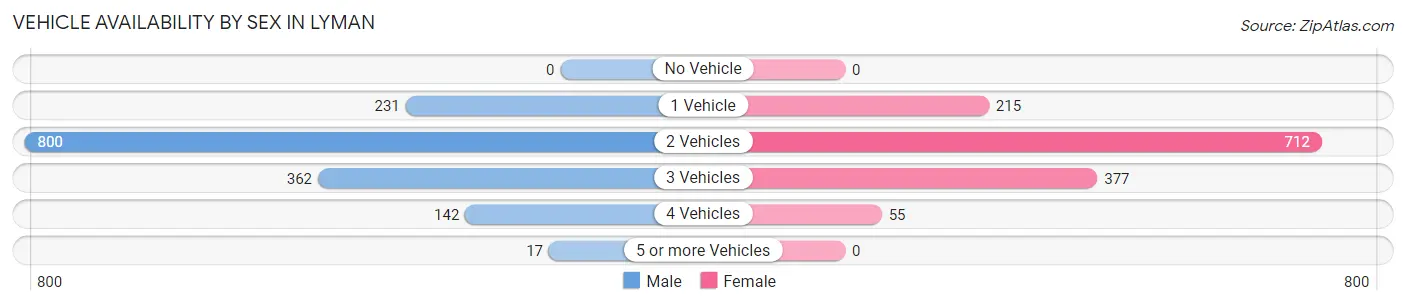
Vehicle Availability by Sex in Lyman
The most prevalent vehicle ownership categories in Lyman are males with 2 vehicles (800, accounting for 51.5%) and females with 2 vehicles (712, making up 58.9%).
| Vehicles Available | Male | Female |
| No Vehicle | 0 (0.0%) | 0 (0.0%) |
| 1 Vehicle | 231 (14.9%) | 215 (15.8%) |
| 2 Vehicles | 800 (51.5%) | 712 (52.4%) |
| 3 Vehicles | 362 (23.3%) | 377 (27.7%) |
| 4 Vehicles | 142 (9.1%) | 55 (4.1%) |
| 5 or more Vehicles | 17 (1.1%) | 0 (0.0%) |
| Total | 1,552 (100.0%) | 1,359 (100.0%) |
Commute Time in Lyman
The most frequently occuring commute durations in Lyman are 15 to 19 minutes (764 commuters, 28.3%), 20 to 24 minutes (528 commuters, 19.6%), and 10 to 14 minutes (248 commuters, 9.2%).
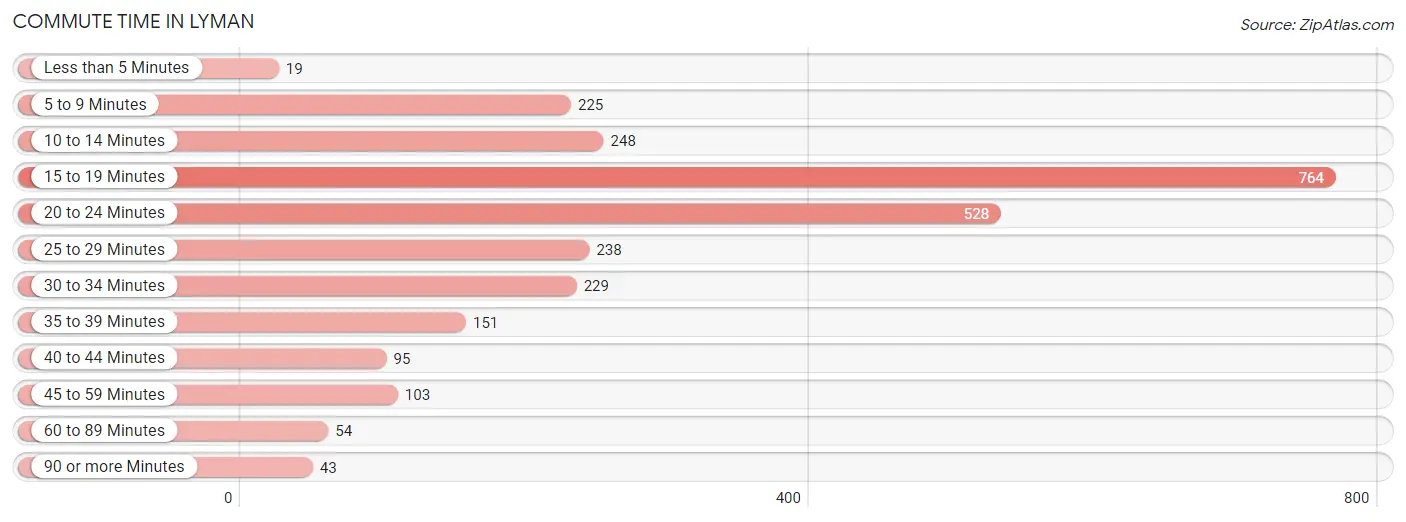
| Commute Time | # Commuters | % Commuters |
| Less than 5 Minutes | 19 | 0.7% |
| 5 to 9 Minutes | 225 | 8.3% |
| 10 to 14 Minutes | 248 | 9.2% |
| 15 to 19 Minutes | 764 | 28.3% |
| 20 to 24 Minutes | 528 | 19.6% |
| 25 to 29 Minutes | 238 | 8.8% |
| 30 to 34 Minutes | 229 | 8.5% |
| 35 to 39 Minutes | 151 | 5.6% |
| 40 to 44 Minutes | 95 | 3.5% |
| 45 to 59 Minutes | 103 | 3.8% |
| 60 to 89 Minutes | 54 | 2.0% |
| 90 or more Minutes | 43 | 1.6% |
Commute Time by Sex in Lyman
The most common commute times in Lyman are 15 to 19 minutes (407 commuters, 29.3%) for males and 20 to 24 minutes (358 commuters, 27.4%) for females.
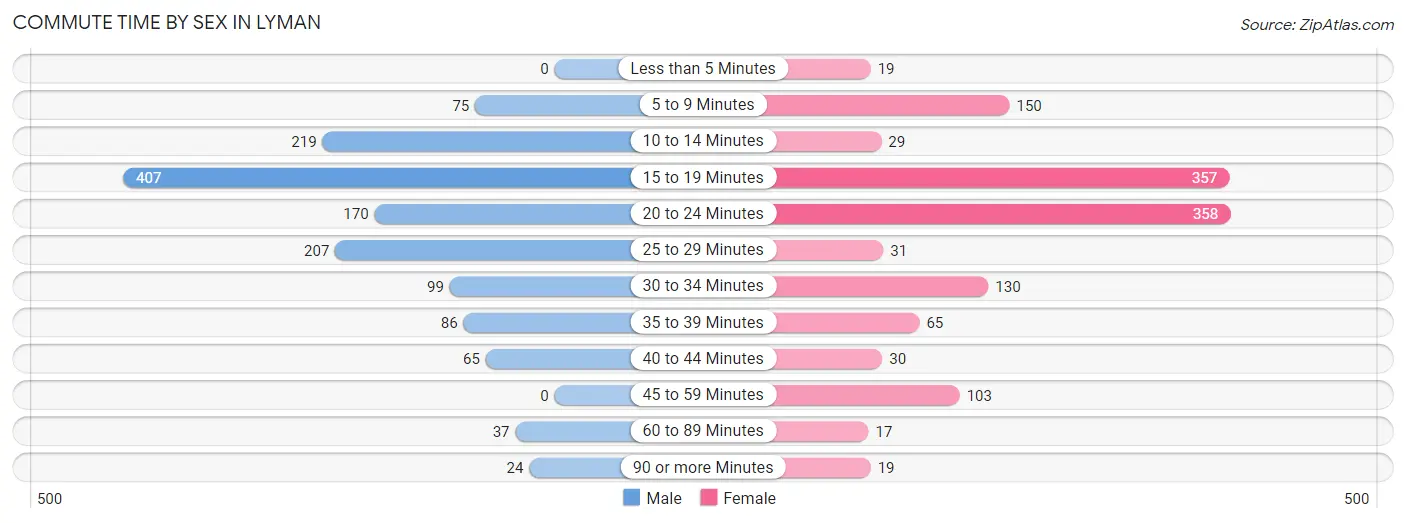
| Commute Time | Male | Female |
| Less than 5 Minutes | 0 (0.0%) | 19 (1.5%) |
| 5 to 9 Minutes | 75 (5.4%) | 150 (11.5%) |
| 10 to 14 Minutes | 219 (15.8%) | 29 (2.2%) |
| 15 to 19 Minutes | 407 (29.3%) | 357 (27.3%) |
| 20 to 24 Minutes | 170 (12.2%) | 358 (27.4%) |
| 25 to 29 Minutes | 207 (14.9%) | 31 (2.4%) |
| 30 to 34 Minutes | 99 (7.1%) | 130 (9.9%) |
| 35 to 39 Minutes | 86 (6.2%) | 65 (5.0%) |
| 40 to 44 Minutes | 65 (4.7%) | 30 (2.3%) |
| 45 to 59 Minutes | 0 (0.0%) | 103 (7.9%) |
| 60 to 89 Minutes | 37 (2.7%) | 17 (1.3%) |
| 90 or more Minutes | 24 (1.7%) | 19 (1.5%) |
Time of Departure to Work by Sex in Lyman
The most frequent times of departure to work in Lyman are 6:00 AM to 6:29 AM (257, 18.5%) for males and 7:00 AM to 7:29 AM (320, 24.5%) for females.
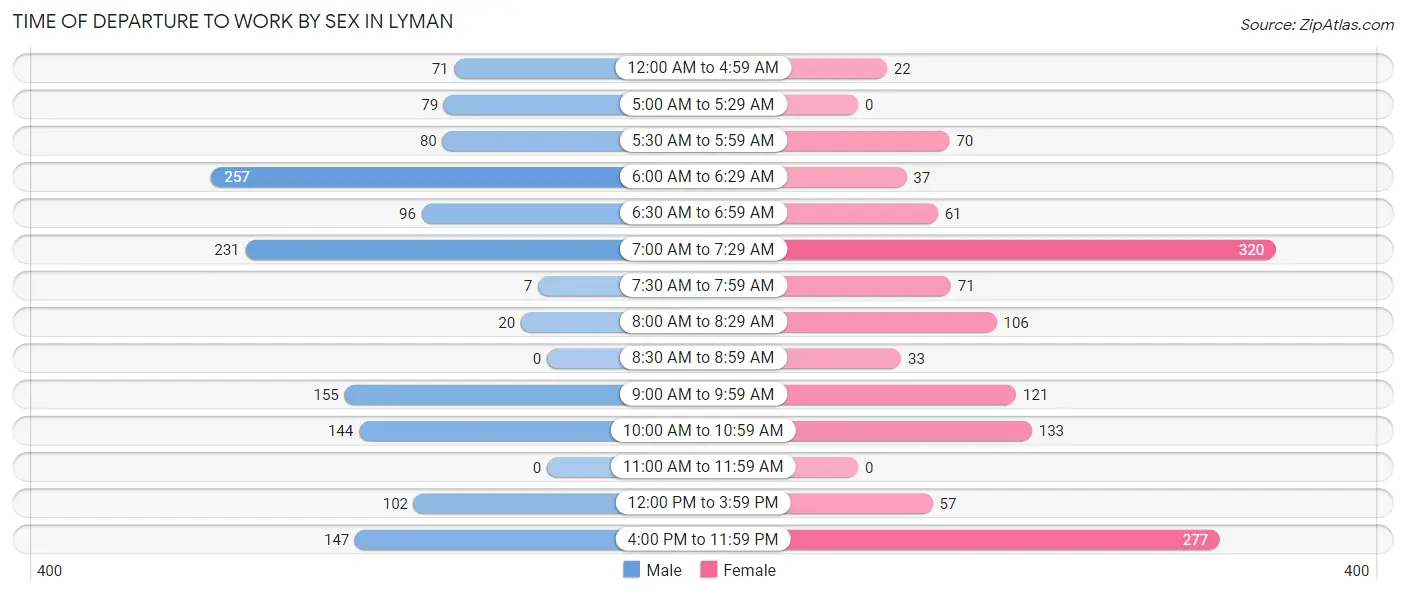
| Time of Departure | Male | Female |
| 12:00 AM to 4:59 AM | 71 (5.1%) | 22 (1.7%) |
| 5:00 AM to 5:29 AM | 79 (5.7%) | 0 (0.0%) |
| 5:30 AM to 5:59 AM | 80 (5.8%) | 70 (5.3%) |
| 6:00 AM to 6:29 AM | 257 (18.5%) | 37 (2.8%) |
| 6:30 AM to 6:59 AM | 96 (6.9%) | 61 (4.7%) |
| 7:00 AM to 7:29 AM | 231 (16.6%) | 320 (24.5%) |
| 7:30 AM to 7:59 AM | 7 (0.5%) | 71 (5.4%) |
| 8:00 AM to 8:29 AM | 20 (1.4%) | 106 (8.1%) |
| 8:30 AM to 8:59 AM | 0 (0.0%) | 33 (2.5%) |
| 9:00 AM to 9:59 AM | 155 (11.2%) | 121 (9.2%) |
| 10:00 AM to 10:59 AM | 144 (10.4%) | 133 (10.2%) |
| 11:00 AM to 11:59 AM | 0 (0.0%) | 0 (0.0%) |
| 12:00 PM to 3:59 PM | 102 (7.3%) | 57 (4.4%) |
| 4:00 PM to 11:59 PM | 147 (10.6%) | 277 (21.2%) |
| Total | 1,389 (100.0%) | 1,308 (100.0%) |
Housing Occupancy in Lyman
Occupancy by Ownership in Lyman
Of the total 2,146 dwellings in Lyman, owner-occupied units account for 1,955 (91.1%), while renter-occupied units make up 191 (8.9%).
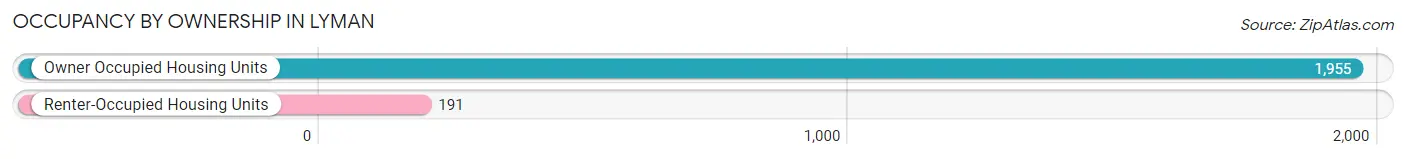
| Occupancy | # Housing Units | % Housing Units |
| Owner Occupied Housing Units | 1,955 | 91.1% |
| Renter-Occupied Housing Units | 191 | 8.9% |
| Total Occupied Housing Units | 2,146 | 100.0% |
Occupancy by Household Size in Lyman
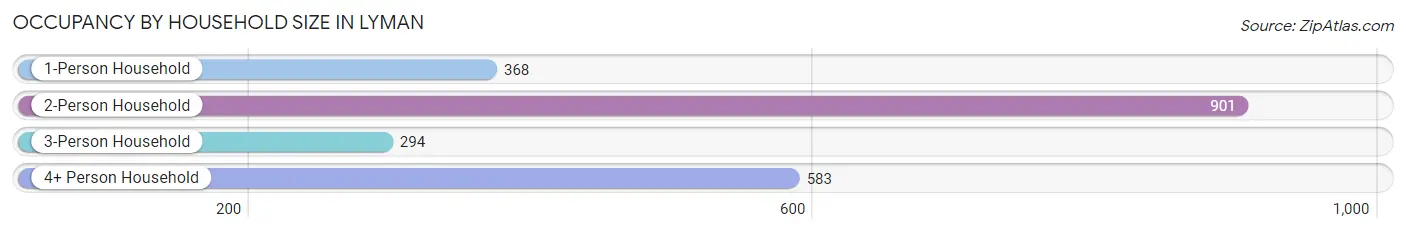
| Household Size | # Housing Units | % Housing Units |
| 1-Person Household | 368 | 17.2% |
| 2-Person Household | 901 | 42.0% |
| 3-Person Household | 294 | 13.7% |
| 4+ Person Household | 583 | 27.2% |
| Total Housing Units | 2,146 | 100.0% |
Occupancy by Ownership by Household Size in Lyman
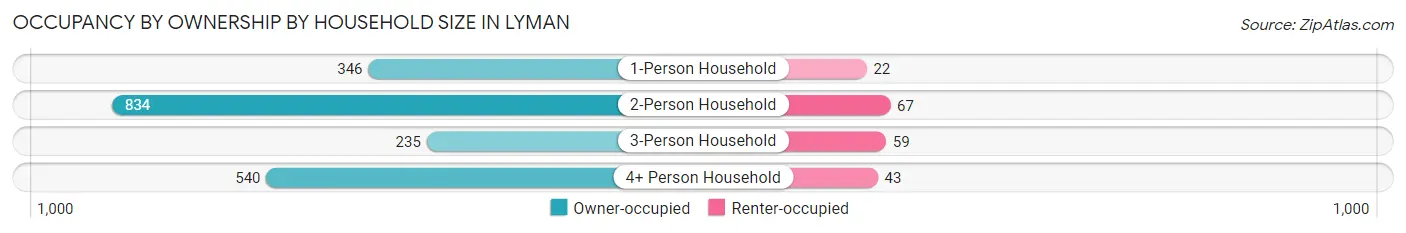
| Household Size | Owner-occupied | Renter-occupied |
| 1-Person Household | 346 (94.0%) | 22 (6.0%) |
| 2-Person Household | 834 (92.6%) | 67 (7.4%) |
| 3-Person Household | 235 (79.9%) | 59 (20.1%) |
| 4+ Person Household | 540 (92.6%) | 43 (7.4%) |
| Total Housing Units | 1,955 (91.1%) | 191 (8.9%) |
Occupancy by Educational Attainment in Lyman
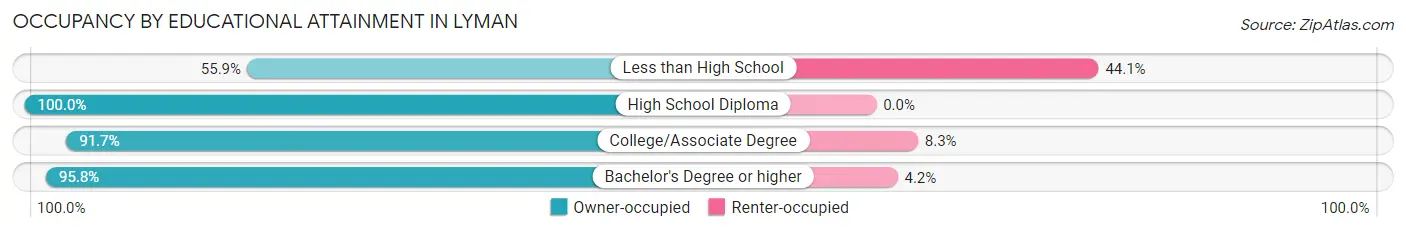
| Household Size | Owner-occupied | Renter-occupied |
| Less than High School | 132 (55.9%) | 104 (44.1%) |
| High School Diploma | 604 (100.0%) | 0 (0.0%) |
| College/Associate Degree | 721 (91.7%) | 65 (8.3%) |
| Bachelor's Degree or higher | 498 (95.8%) | 22 (4.2%) |
Occupancy by Age of Householder in Lyman
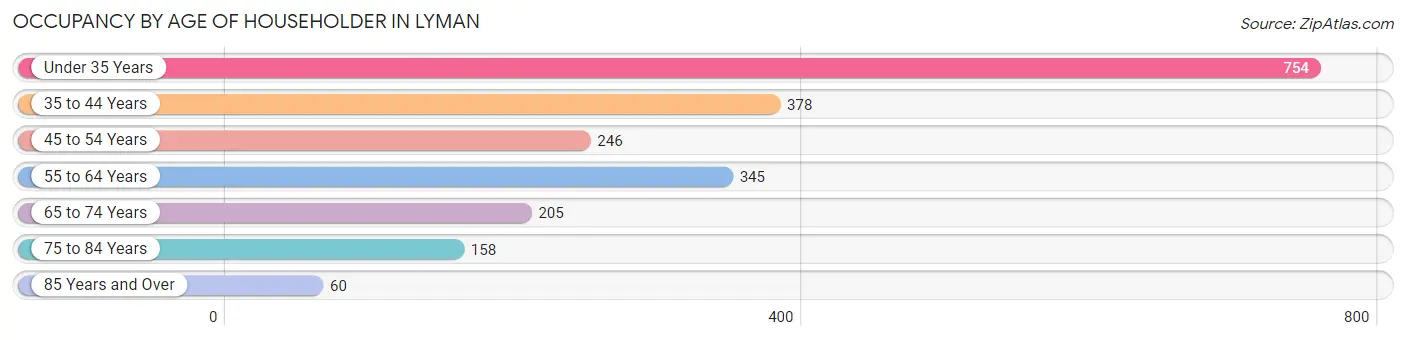
| Age Bracket | # Households | % Households |
| Under 35 Years | 754 | 35.1% |
| 35 to 44 Years | 378 | 17.6% |
| 45 to 54 Years | 246 | 11.5% |
| 55 to 64 Years | 345 | 16.1% |
| 65 to 74 Years | 205 | 9.6% |
| 75 to 84 Years | 158 | 7.4% |
| 85 Years and Over | 60 | 2.8% |
| Total | 2,146 | 100.0% |
Housing Finances in Lyman
Median Income by Occupancy in Lyman
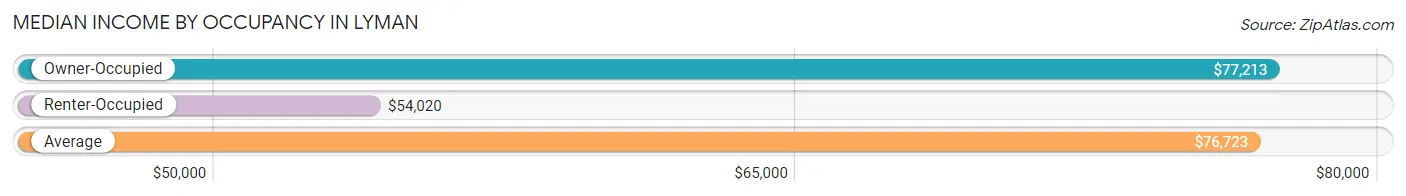
| Occupancy Type | # Households | Median Income |
| Owner-Occupied | 1,955 (91.1%) | $77,213 |
| Renter-Occupied | 191 (8.9%) | $54,020 |
| Average | 2,146 (100.0%) | $76,723 |
Occupancy by Householder Income Bracket in Lyman
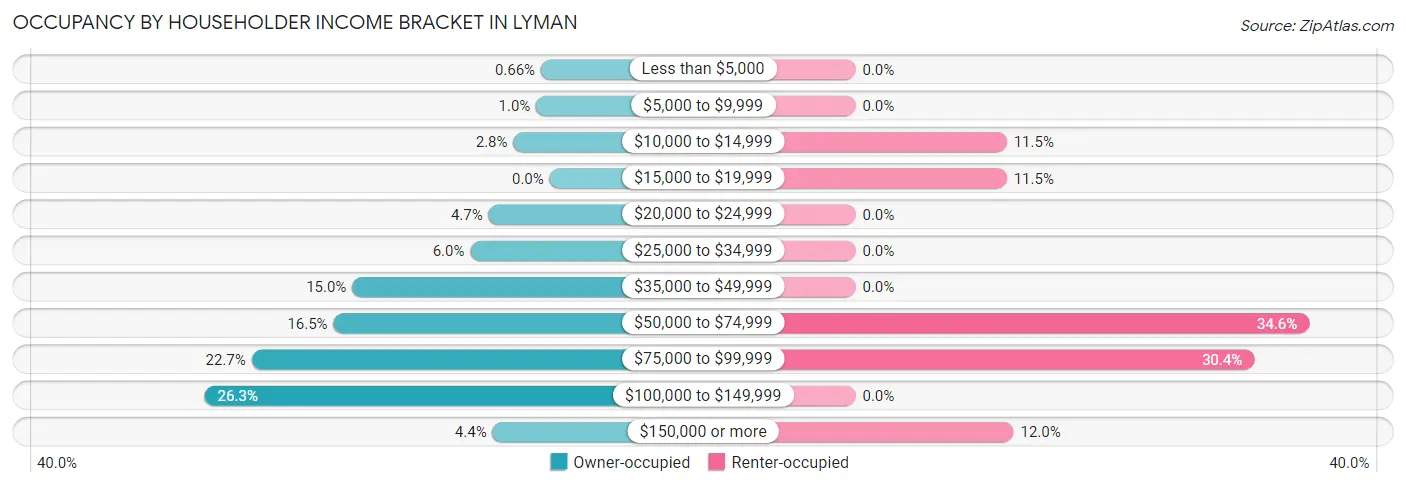
| Income Bracket | Owner-occupied | Renter-occupied |
| Less than $5,000 | 13 (0.7%) | 0 (0.0%) |
| $5,000 to $9,999 | 20 (1.0%) | 0 (0.0%) |
| $10,000 to $14,999 | 54 (2.8%) | 22 (11.5%) |
| $15,000 to $19,999 | 0 (0.0%) | 22 (11.5%) |
| $20,000 to $24,999 | 91 (4.6%) | 0 (0.0%) |
| $25,000 to $34,999 | 118 (6.0%) | 0 (0.0%) |
| $35,000 to $49,999 | 294 (15.0%) | 0 (0.0%) |
| $50,000 to $74,999 | 322 (16.5%) | 66 (34.5%) |
| $75,000 to $99,999 | 444 (22.7%) | 58 (30.4%) |
| $100,000 to $149,999 | 514 (26.3%) | 0 (0.0%) |
| $150,000 or more | 85 (4.3%) | 23 (12.0%) |
| Total | 1,955 (100.0%) | 191 (100.0%) |
Monthly Housing Cost Tiers in Lyman
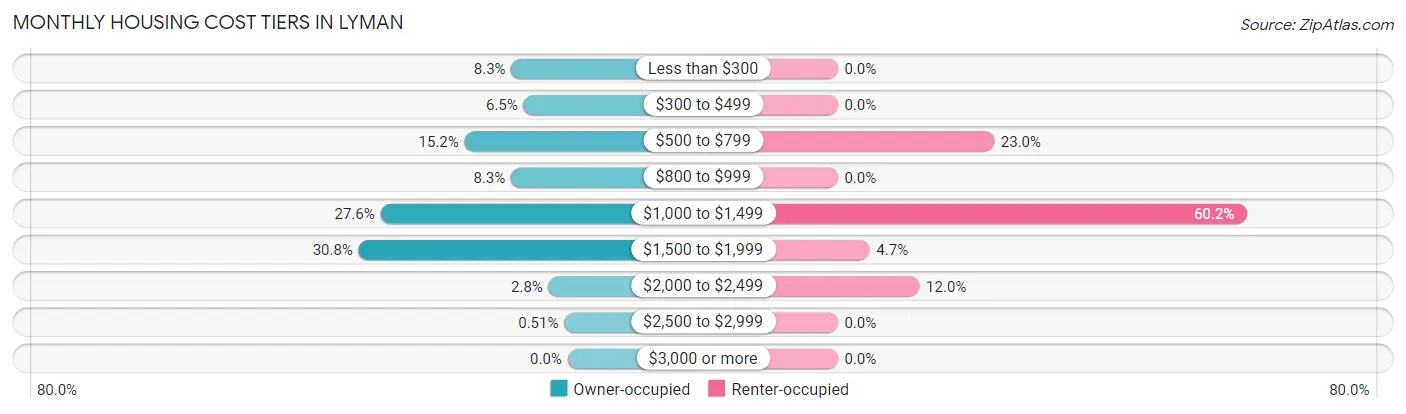
| Monthly Cost | Owner-occupied | Renter-occupied |
| Less than $300 | 162 (8.3%) | 0 (0.0%) |
| $300 to $499 | 127 (6.5%) | 0 (0.0%) |
| $500 to $799 | 297 (15.2%) | 44 (23.0%) |
| $800 to $999 | 163 (8.3%) | 0 (0.0%) |
| $1,000 to $1,499 | 539 (27.6%) | 115 (60.2%) |
| $1,500 to $1,999 | 602 (30.8%) | 9 (4.7%) |
| $2,000 to $2,499 | 55 (2.8%) | 23 (12.0%) |
| $2,500 to $2,999 | 10 (0.5%) | 0 (0.0%) |
| $3,000 or more | 0 (0.0%) | 0 (0.0%) |
| Total | 1,955 (100.0%) | 191 (100.0%) |
Physical Housing Characteristics in Lyman
Housing Structures in Lyman
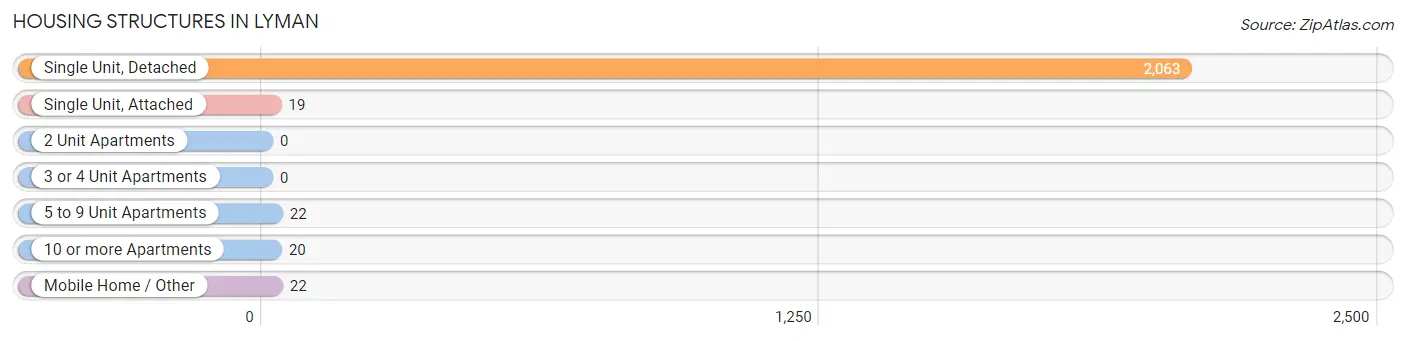
| Structure Type | # Housing Units | % Housing Units |
| Single Unit, Detached | 2,063 | 96.1% |
| Single Unit, Attached | 19 | 0.9% |
| 2 Unit Apartments | 0 | 0.0% |
| 3 or 4 Unit Apartments | 0 | 0.0% |
| 5 to 9 Unit Apartments | 22 | 1.0% |
| 10 or more Apartments | 20 | 0.9% |
| Mobile Home / Other | 22 | 1.0% |
| Total | 2,146 | 100.0% |
Housing Structures by Occupancy in Lyman
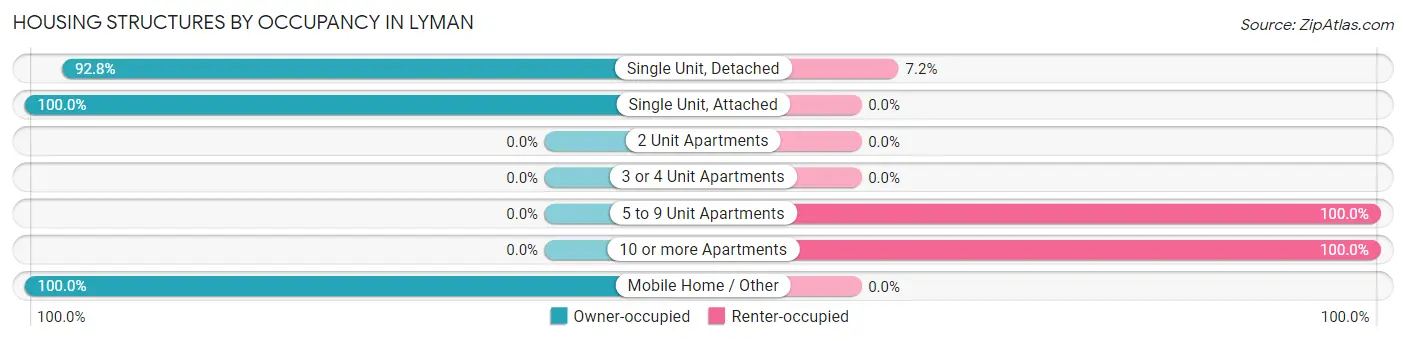
| Structure Type | Owner-occupied | Renter-occupied |
| Single Unit, Detached | 1,914 (92.8%) | 149 (7.2%) |
| Single Unit, Attached | 19 (100.0%) | 0 (0.0%) |
| 2 Unit Apartments | 0 (0.0%) | 0 (0.0%) |
| 3 or 4 Unit Apartments | 0 (0.0%) | 0 (0.0%) |
| 5 to 9 Unit Apartments | 0 (0.0%) | 22 (100.0%) |
| 10 or more Apartments | 0 (0.0%) | 20 (100.0%) |
| Mobile Home / Other | 22 (100.0%) | 0 (0.0%) |
| Total | 1,955 (91.1%) | 191 (8.9%) |
Housing Structures by Number of Rooms in Lyman
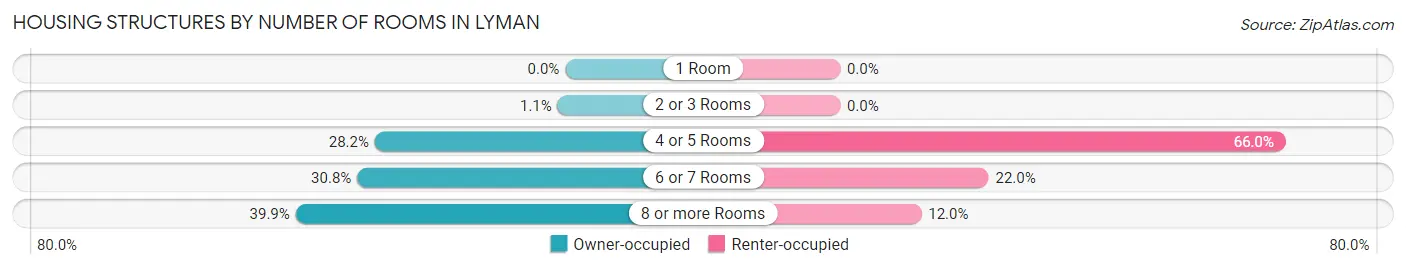
| Number of Rooms | Owner-occupied | Renter-occupied |
| 1 Room | 0 (0.0%) | 0 (0.0%) |
| 2 or 3 Rooms | 22 (1.1%) | 0 (0.0%) |
| 4 or 5 Rooms | 551 (28.2%) | 126 (66.0%) |
| 6 or 7 Rooms | 602 (30.8%) | 42 (22.0%) |
| 8 or more Rooms | 780 (39.9%) | 23 (12.0%) |
| Total | 1,955 (100.0%) | 191 (100.0%) |
Housing Structure by Heating Type in Lyman
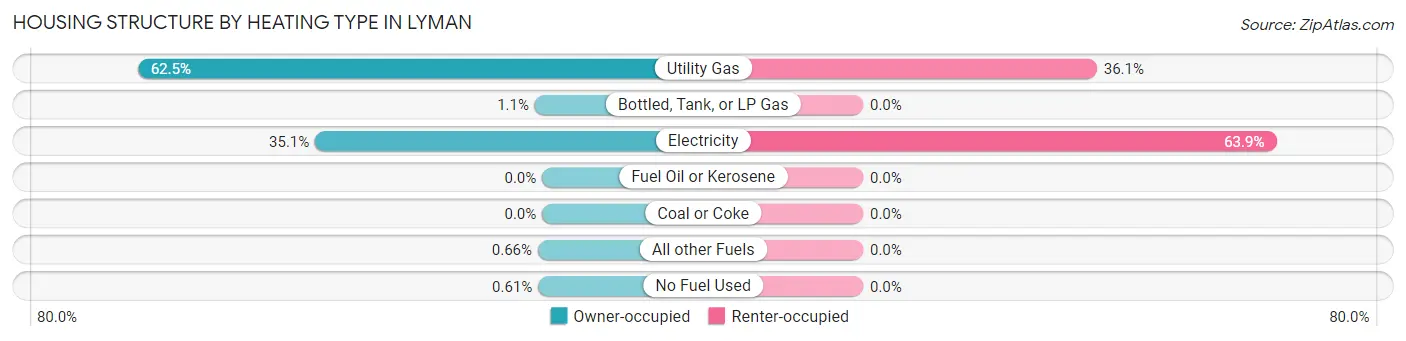
| Heating Type | Owner-occupied | Renter-occupied |
| Utility Gas | 1,222 (62.5%) | 69 (36.1%) |
| Bottled, Tank, or LP Gas | 22 (1.1%) | 0 (0.0%) |
| Electricity | 686 (35.1%) | 122 (63.9%) |
| Fuel Oil or Kerosene | 0 (0.0%) | 0 (0.0%) |
| Coal or Coke | 0 (0.0%) | 0 (0.0%) |
| All other Fuels | 13 (0.7%) | 0 (0.0%) |
| No Fuel Used | 12 (0.6%) | 0 (0.0%) |
| Total | 1,955 (100.0%) | 191 (100.0%) |
Household Vehicle Usage in Lyman
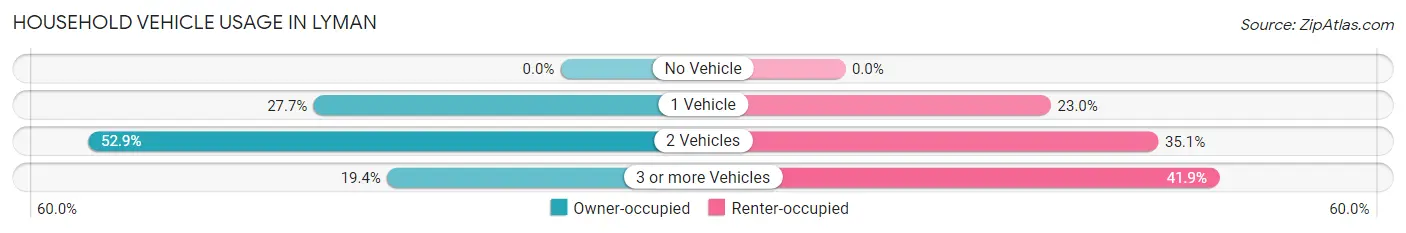
| Vehicles per Household | Owner-occupied | Renter-occupied |
| No Vehicle | 0 (0.0%) | 0 (0.0%) |
| 1 Vehicle | 541 (27.7%) | 44 (23.0%) |
| 2 Vehicles | 1,034 (52.9%) | 67 (35.1%) |
| 3 or more Vehicles | 380 (19.4%) | 80 (41.9%) |
| Total | 1,955 (100.0%) | 191 (100.0%) |
Real Estate & Mortgages in Lyman
Real Estate and Mortgage Overview in Lyman
| Characteristic | Without Mortgage | With Mortgage |
| Housing Units | 385 | 1,570 |
| Median Property Value | $168,500 | $239,100 |
| Median Household Income | $42,054 | $70 |
| Monthly Housing Costs | $395 | $0 |
| Real Estate Taxes | $908 | $22 |
Property Value by Mortgage Status in Lyman
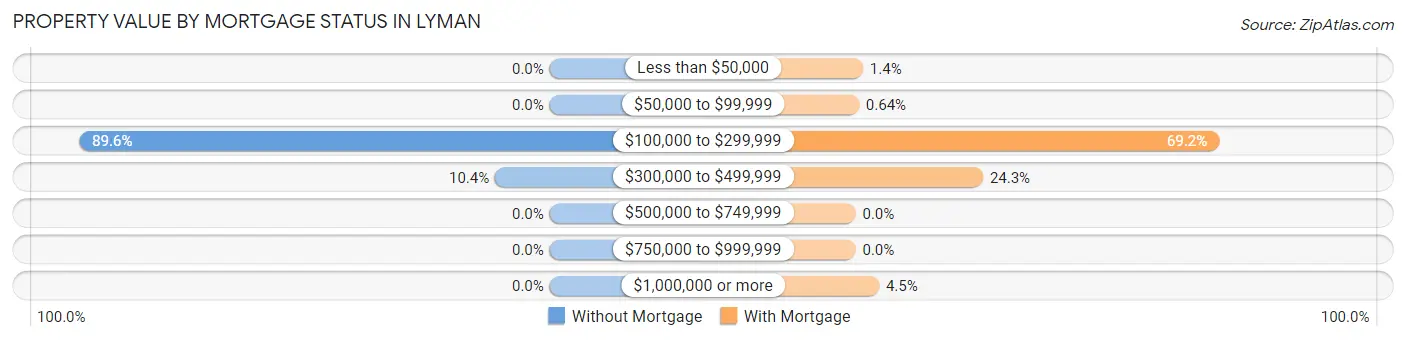
| Property Value | Without Mortgage | With Mortgage |
| Less than $50,000 | 0 (0.0%) | 22 (1.4%) |
| $50,000 to $99,999 | 0 (0.0%) | 10 (0.6%) |
| $100,000 to $299,999 | 345 (89.6%) | 1,087 (69.2%) |
| $300,000 to $499,999 | 40 (10.4%) | 381 (24.3%) |
| $500,000 to $749,999 | 0 (0.0%) | 0 (0.0%) |
| $750,000 to $999,999 | 0 (0.0%) | 0 (0.0%) |
| $1,000,000 or more | 0 (0.0%) | 70 (4.5%) |
| Total | 385 (100.0%) | 1,570 (100.0%) |
Household Income by Mortgage Status in Lyman
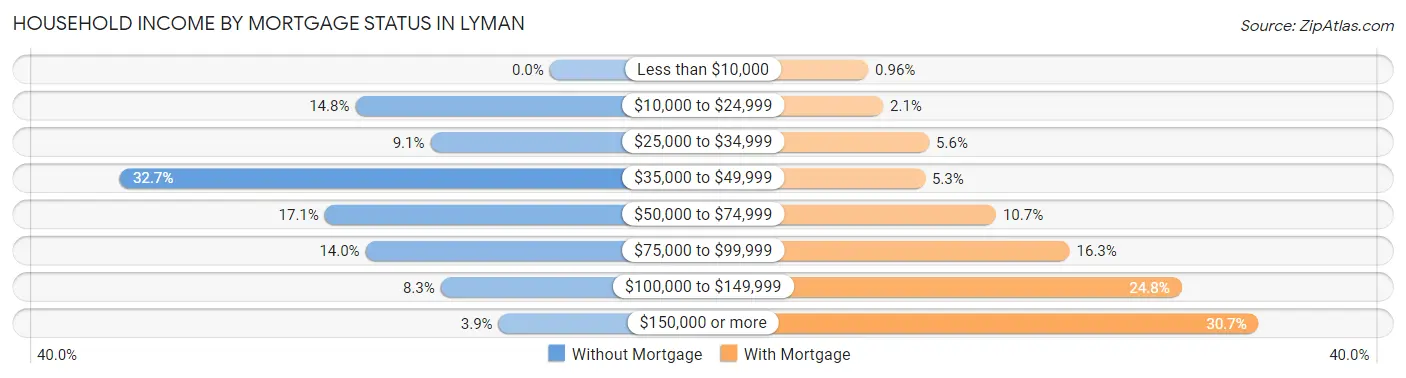
| Household Income | Without Mortgage | With Mortgage |
| Less than $10,000 | 0 (0.0%) | 15 (1.0%) |
| $10,000 to $24,999 | 57 (14.8%) | 33 (2.1%) |
| $25,000 to $34,999 | 35 (9.1%) | 88 (5.6%) |
| $35,000 to $49,999 | 126 (32.7%) | 83 (5.3%) |
| $50,000 to $74,999 | 66 (17.1%) | 168 (10.7%) |
| $75,000 to $99,999 | 54 (14.0%) | 256 (16.3%) |
| $100,000 to $149,999 | 32 (8.3%) | 390 (24.8%) |
| $150,000 or more | 15 (3.9%) | 482 (30.7%) |
| Total | 385 (100.0%) | 1,570 (100.0%) |
Property Value to Household Income Ratio in Lyman
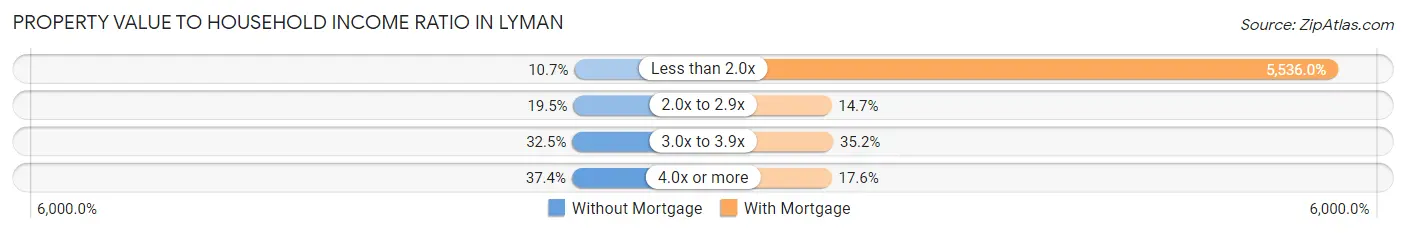
| Value-to-Income Ratio | Without Mortgage | With Mortgage |
| Less than 2.0x | 41 (10.6%) | 86,915 (5,536.0%) |
| 2.0x to 2.9x | 75 (19.5%) | 231 (14.7%) |
| 3.0x to 3.9x | 125 (32.5%) | 552 (35.2%) |
| 4.0x or more | 144 (37.4%) | 277 (17.6%) |
| Total | 385 (100.0%) | 1,570 (100.0%) |
Real Estate Taxes by Mortgage Status in Lyman
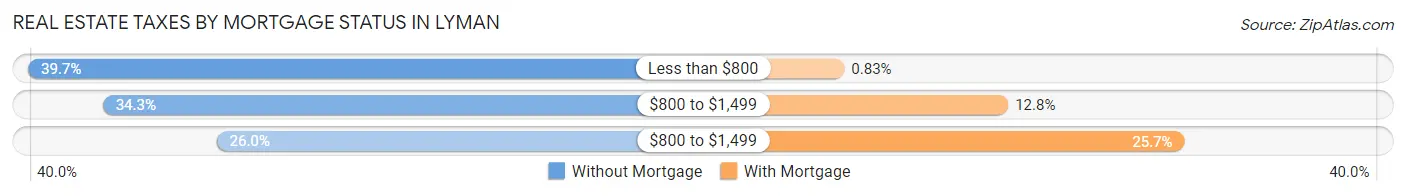
| Property Taxes | Without Mortgage | With Mortgage |
| Less than $800 | 153 (39.7%) | 13 (0.8%) |
| $800 to $1,499 | 132 (34.3%) | 201 (12.8%) |
| $800 to $1,499 | 100 (26.0%) | 403 (25.7%) |
| Total | 385 (100.0%) | 1,570 (100.0%) |
Health & Disability in Lyman
Health Insurance Coverage by Age in Lyman
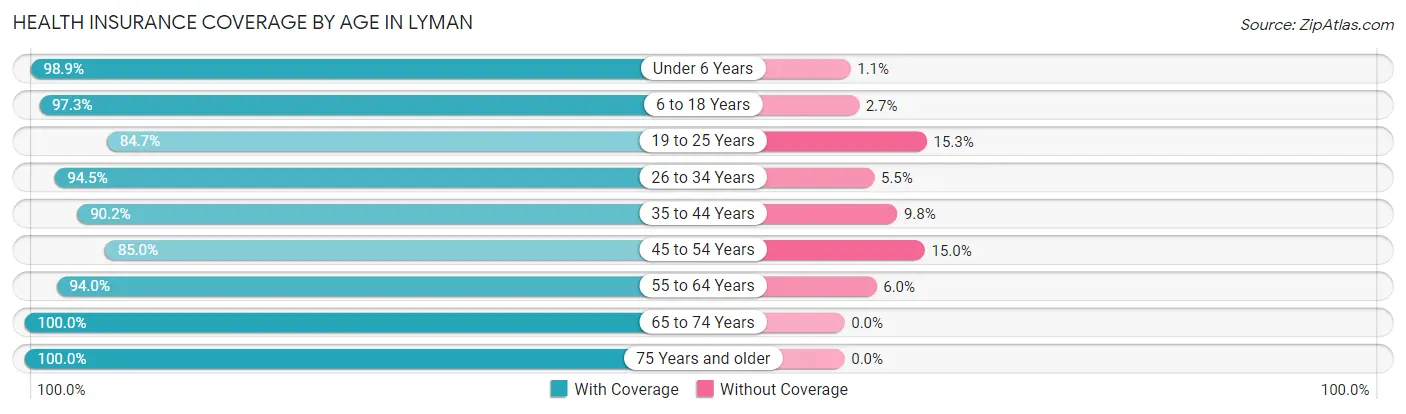
| Age Bracket | With Coverage | Without Coverage |
| Under 6 Years | 883 (98.9%) | 10 (1.1%) |
| 6 to 18 Years | 868 (97.3%) | 24 (2.7%) |
| 19 to 25 Years | 464 (84.7%) | 84 (15.3%) |
| 26 to 34 Years | 1,330 (94.5%) | 78 (5.5%) |
| 35 to 44 Years | 588 (90.2%) | 64 (9.8%) |
| 45 to 54 Years | 381 (85.0%) | 67 (15.0%) |
| 55 to 64 Years | 505 (94.0%) | 32 (6.0%) |
| 65 to 74 Years | 362 (100.0%) | 0 (0.0%) |
| 75 Years and older | 359 (100.0%) | 0 (0.0%) |
| Total | 5,740 (94.1%) | 359 (5.9%) |
Health Insurance Coverage by Citizenship Status in Lyman
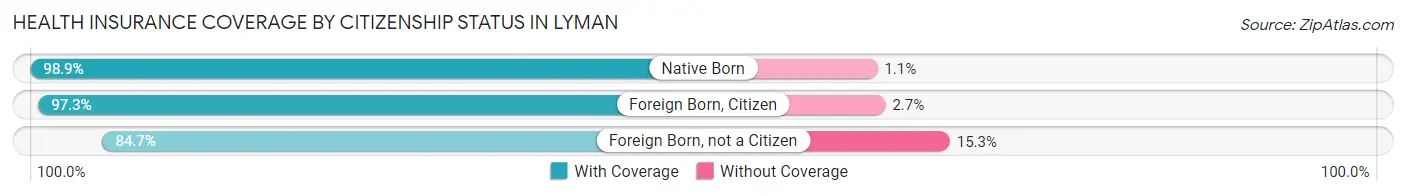
| Citizenship Status | With Coverage | Without Coverage |
| Native Born | 883 (98.9%) | 10 (1.1%) |
| Foreign Born, Citizen | 868 (97.3%) | 24 (2.7%) |
| Foreign Born, not a Citizen | 464 (84.7%) | 84 (15.3%) |
Health Insurance Coverage by Household Income in Lyman
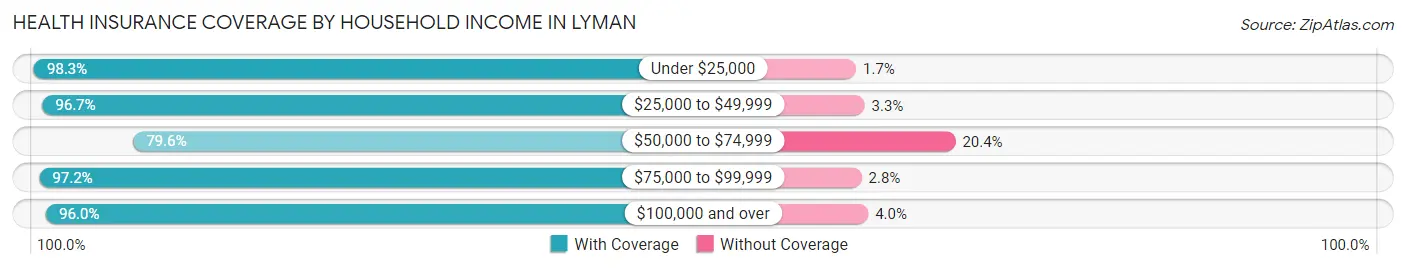
| Household Income | With Coverage | Without Coverage |
| Under $25,000 | 396 (98.3%) | 7 (1.7%) |
| $25,000 to $49,999 | 1,015 (96.7%) | 35 (3.3%) |
| $50,000 to $74,999 | 704 (79.6%) | 180 (20.4%) |
| $75,000 to $99,999 | 1,292 (97.2%) | 37 (2.8%) |
| $100,000 and over | 2,294 (96.0%) | 96 (4.0%) |
Public vs Private Health Insurance Coverage by Age in Lyman
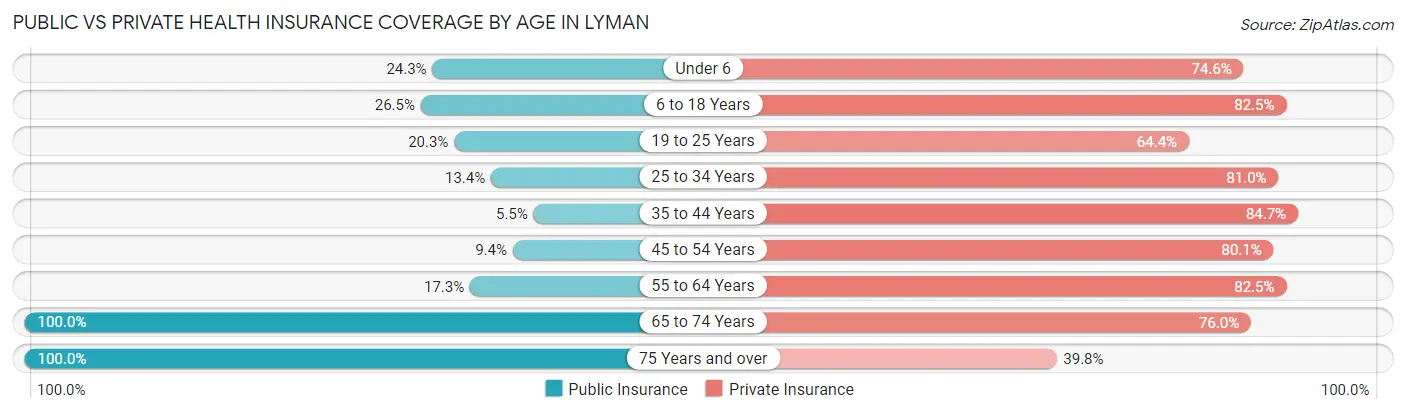
| Age Bracket | Public Insurance | Private Insurance |
| Under 6 | 217 (24.3%) | 666 (74.6%) |
| 6 to 18 Years | 236 (26.5%) | 736 (82.5%) |
| 19 to 25 Years | 111 (20.3%) | 353 (64.4%) |
| 25 to 34 Years | 189 (13.4%) | 1,141 (81.0%) |
| 35 to 44 Years | 36 (5.5%) | 552 (84.7%) |
| 45 to 54 Years | 42 (9.4%) | 359 (80.1%) |
| 55 to 64 Years | 93 (17.3%) | 443 (82.5%) |
| 65 to 74 Years | 362 (100.0%) | 275 (76.0%) |
| 75 Years and over | 359 (100.0%) | 143 (39.8%) |
| Total | 1,645 (27.0%) | 4,668 (76.5%) |
Disability Status by Sex by Age in Lyman
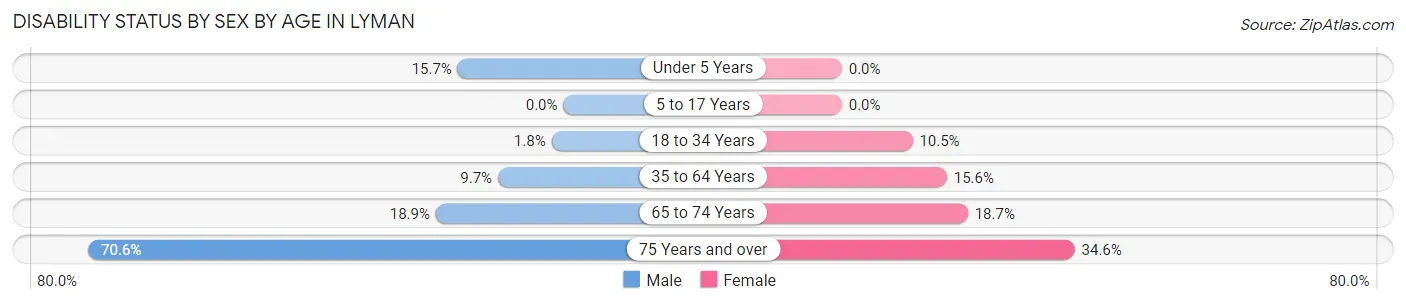
| Age Bracket | Male | Female |
| Under 5 Years | 91 (15.7%) | 0 (0.0%) |
| 5 to 17 Years | 0 (0.0%) | 0 (0.0%) |
| 18 to 34 Years | 18 (1.8%) | 98 (10.5%) |
| 35 to 64 Years | 78 (9.7%) | 130 (15.6%) |
| 65 to 74 Years | 25 (18.9%) | 43 (18.7%) |
| 75 Years and over | 139 (70.6%) | 56 (34.6%) |
Disability Class by Sex by Age in Lyman
Disability Class: Hearing Difficulty
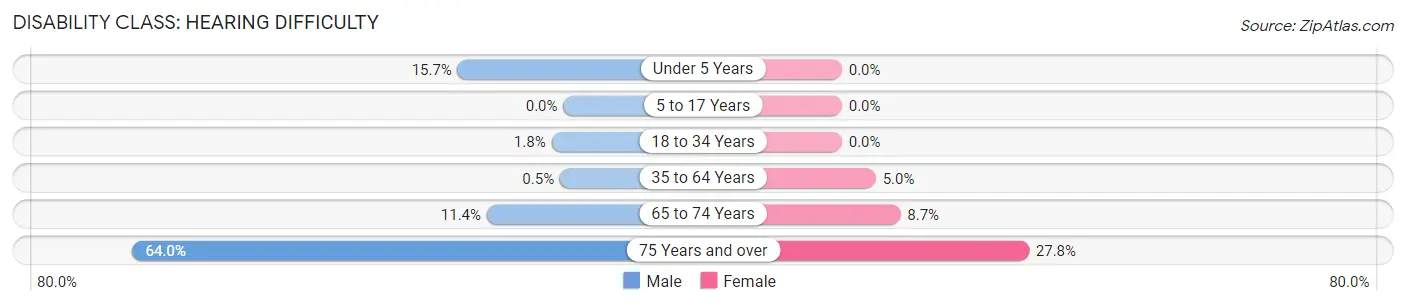
| Age Bracket | Male | Female |
| Under 5 Years | 91 (15.7%) | 0 (0.0%) |
| 5 to 17 Years | 0 (0.0%) | 0 (0.0%) |
| 18 to 34 Years | 18 (1.8%) | 0 (0.0%) |
| 35 to 64 Years | 4 (0.5%) | 42 (5.0%) |
| 65 to 74 Years | 15 (11.4%) | 20 (8.7%) |
| 75 Years and over | 126 (64.0%) | 45 (27.8%) |
Disability Class: Vision Difficulty
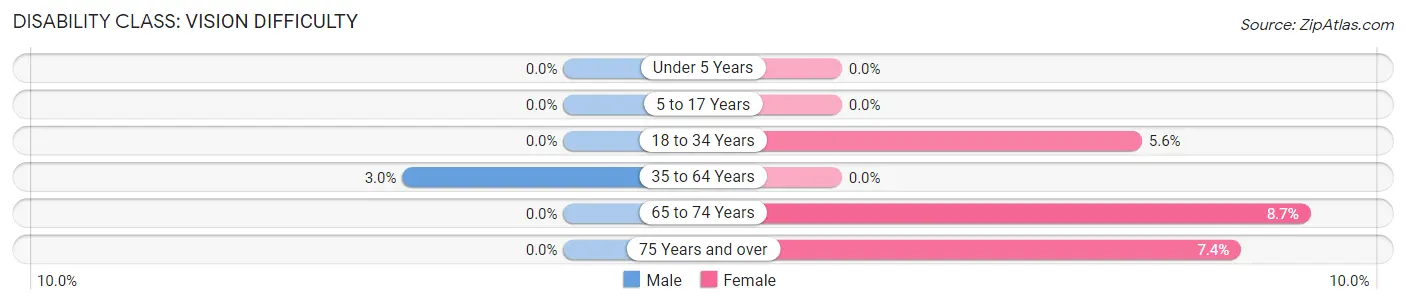
| Age Bracket | Male | Female |
| Under 5 Years | 0 (0.0%) | 0 (0.0%) |
| 5 to 17 Years | 0 (0.0%) | 0 (0.0%) |
| 18 to 34 Years | 0 (0.0%) | 52 (5.6%) |
| 35 to 64 Years | 24 (3.0%) | 0 (0.0%) |
| 65 to 74 Years | 0 (0.0%) | 20 (8.7%) |
| 75 Years and over | 0 (0.0%) | 12 (7.4%) |
Disability Class: Cognitive Difficulty
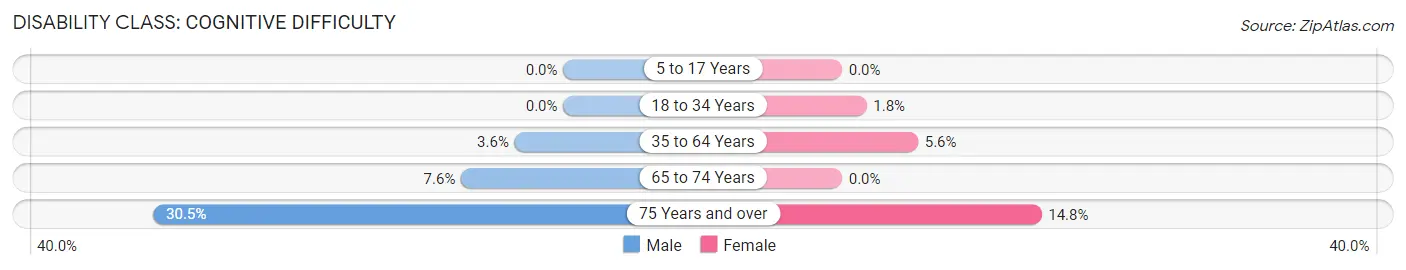
| Age Bracket | Male | Female |
| 5 to 17 Years | 0 (0.0%) | 0 (0.0%) |
| 18 to 34 Years | 0 (0.0%) | 17 (1.8%) |
| 35 to 64 Years | 29 (3.6%) | 47 (5.6%) |
| 65 to 74 Years | 10 (7.6%) | 0 (0.0%) |
| 75 Years and over | 60 (30.5%) | 24 (14.8%) |
Disability Class: Ambulatory Difficulty
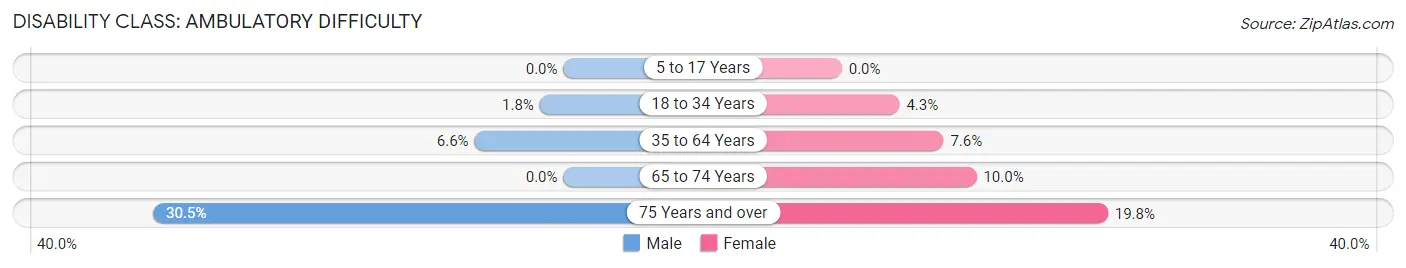
| Age Bracket | Male | Female |
| 5 to 17 Years | 0 (0.0%) | 0 (0.0%) |
| 18 to 34 Years | 18 (1.8%) | 40 (4.3%) |
| 35 to 64 Years | 53 (6.6%) | 63 (7.5%) |
| 65 to 74 Years | 0 (0.0%) | 23 (10.0%) |
| 75 Years and over | 60 (30.5%) | 32 (19.8%) |
Disability Class: Self-Care Difficulty
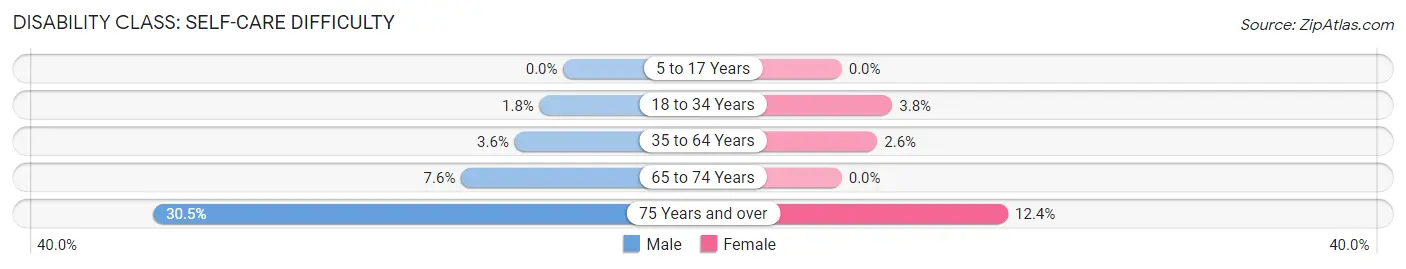
| Age Bracket | Male | Female |
| 5 to 17 Years | 0 (0.0%) | 0 (0.0%) |
| 18 to 34 Years | 18 (1.8%) | 35 (3.7%) |
| 35 to 64 Years | 29 (3.6%) | 22 (2.6%) |
| 65 to 74 Years | 10 (7.6%) | 0 (0.0%) |
| 75 Years and over | 60 (30.5%) | 20 (12.3%) |
Technology Access in Lyman
Computing Device Access in Lyman
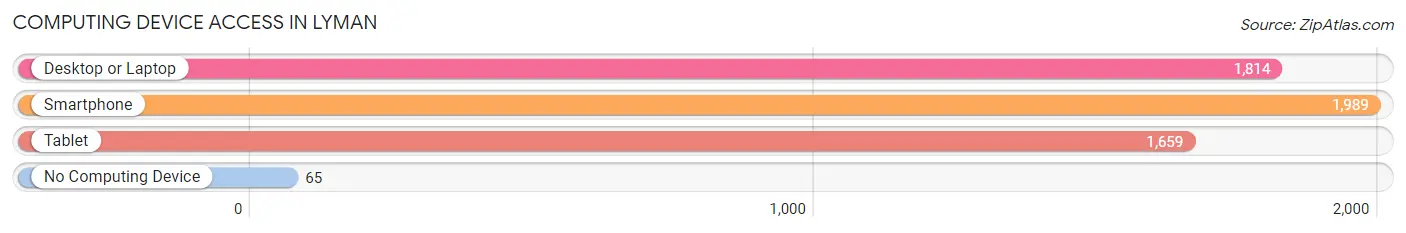
| Device Type | # Households | % Households |
| Desktop or Laptop | 1,814 | 84.5% |
| Smartphone | 1,989 | 92.7% |
| Tablet | 1,659 | 77.3% |
| No Computing Device | 65 | 3.0% |
| Total | 2,146 | 100.0% |
Internet Access in Lyman
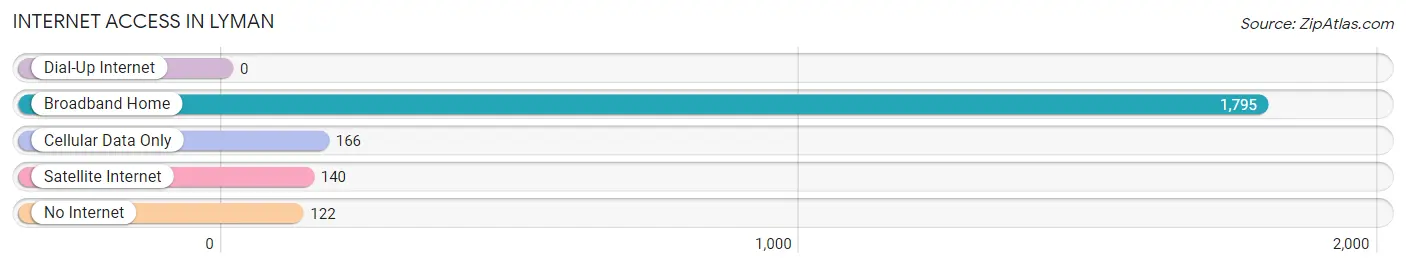
| Internet Type | # Households | % Households |
| Dial-Up Internet | 0 | 0.0% |
| Broadband Home | 1,795 | 83.6% |
| Cellular Data Only | 166 | 7.7% |
| Satellite Internet | 140 | 6.5% |
| No Internet | 122 | 5.7% |
| Total | 2,146 | 100.0% |
Lyman Summary
Lyman, South Carolina is a small town located in Spartanburg County, in the Upstate region of the state. The town was founded in 1882 and is named after the Lyman family, who were early settlers in the area. The town has a population of approximately 5,000 people and is located just north of Spartanburg.
Geography
Lyman is located in the foothills of the Blue Ridge Mountains, and is situated in the Piedmont region of South Carolina. The town is located at an elevation of 830 feet above sea level. The town is located on the banks of the Pacolet River, which is a tributary of the Broad River. The town is located in a rural area, and is surrounded by farmland and forests.
The climate in Lyman is humid subtropical, with hot, humid summers and mild winters. The average annual temperature is around 60 degrees Fahrenheit, and the average annual precipitation is around 45 inches.
Economy
The economy of Lyman is largely based on agriculture and manufacturing. The town is home to several large farms, which produce a variety of crops, including corn, soybeans, and cotton. The town is also home to several manufacturing companies, which produce a variety of products, including furniture, textiles, and automotive parts.
The town is also home to several small businesses, including restaurants, retail stores, and service providers. The town is also home to several educational institutions, including a community college and a technical college.
Demographics
As of the 2010 census, the population of Lyman was 5,077. The racial makeup of the town was 87.3% White, 8.2% African American, 0.4% Native American, 0.7% Asian, 0.1% Pacific Islander, 1.2% from other races, and 2.1% from two or more races. Hispanic or Latino of any race were 3.2% of the population.
The median household income in Lyman was $41,944, and the median family income was $50,917. The per capita income in Lyman was $20,845. About 11.2% of families and 14.2% of the population were below the poverty line, including 19.2% of those under age 18 and 8.2% of those age 65 or over.
Lyman is a small town with a rich history and a diverse population. The town is home to a variety of businesses and educational institutions, and is a great place to live and work. The town is also home to a variety of recreational activities, including fishing, camping, and hiking. Lyman is a great place to call home.
Common Questions
What is Per Capita Income in Lyman?
Per Capita income in Lyman is $29,328.
What is the Median Family Income in Lyman?
Median Family Income in Lyman is $86,696.
What is the Median Household income in Lyman?
Median Household Income in Lyman is $76,723.
What is Income or Wage Gap in Lyman?
Income or Wage Gap in Lyman is 5.2%.
Women in Lyman earn 94.8 cents for every dollar earned by a man.
What is Inequality or Gini Index in Lyman?
Inequality or Gini Index in Lyman is 0.33.
What is the Total Population of Lyman?
Total Population of Lyman is 6,099.
What is the Total Male Population of Lyman?
Total Male Population of Lyman is 3,238.
What is the Total Female Population of Lyman?
Total Female Population of Lyman is 2,861.
What is the Ratio of Males per 100 Females in Lyman?
There are 113.18 Males per 100 Females in Lyman.
What is the Ratio of Females per 100 Males in Lyman?
There are 88.36 Females per 100 Males in Lyman.
What is the Median Population Age in Lyman?
Median Population Age in Lyman is 30.2 Years.
What is the Average Family Size in Lyman
Average Family Size in Lyman is 3.2 People.
What is the Average Household Size in Lyman
Average Household Size in Lyman is 2.8 People.
How Large is the Labor Force in Lyman?
There are 3,061 People in the Labor Forcein in Lyman.
What is the Percentage of People in the Labor Force in Lyman?
69.1% of People are in the Labor Force in Lyman.
What is the Unemployment Rate in Lyman?
Unemployment Rate in Lyman is 3.8%.