Roseland, NE Map & Demographics
Roseland Map
Roseland Overview
$30,306
PER CAPITA INCOME
$88,750
AVG FAMILY INCOME
$68,750
AVG HOUSEHOLD INCOME
48.0%
WAGE / INCOME GAP [ % ]
52.0¢/ $1
WAGE / INCOME GAP [ $ ]
0.32
INEQUALITY / GINI INDEX
258
TOTAL POPULATION
151
MALE POPULATION
107
FEMALE POPULATION
141.12
MALES / 100 FEMALES
70.86
FEMALES / 100 MALES
37.3
MEDIAN AGE
3.2
AVG FAMILY SIZE
2.7
AVG HOUSEHOLD SIZE
120
LABOR FORCE [ PEOPLE ]
72.3%
PERCENT IN LABOR FORCE
0.8%
UNEMPLOYMENT RATE
Roseland Zip Codes
Roseland Area Codes
Income in Roseland
Income Overview in Roseland
Per Capita Income in Roseland is $30,306, while median incomes of families and households are $88,750 and $68,750 respectively.
| Characteristic | Number | Measure |
| Per Capita Income | 258 | $30,306 |
| Median Family Income | 73 | $88,750 |
| Mean Family Income | 73 | $98,842 |
| Median Household Income | 96 | $68,750 |
| Mean Household Income | 96 | $84,808 |
| Income Deficit | 73 | $0 |
| Wage / Income Gap (%) | 258 | 48.05% |
| Wage / Income Gap ($) | 258 | 51.95¢ per $1 |
| Gini / Inequality Index | 258 | 0.32 |
Earnings by Sex in Roseland
Average Earnings in Roseland are $40,313, $53,333 for men and $27,708 for women, a difference of 48.0%.
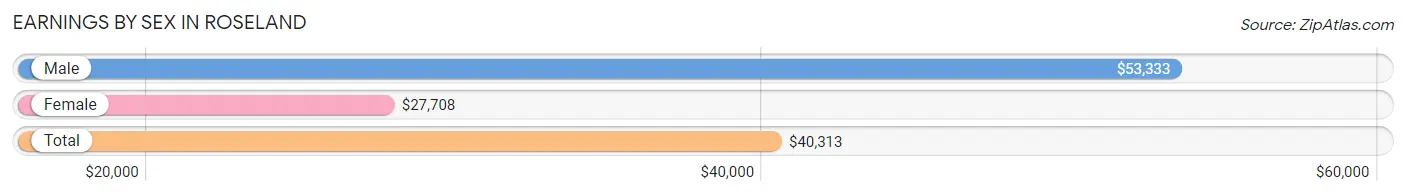
| Sex | Number | Average Earnings |
| Male | 68 (54.4%) | $53,333 |
| Female | 57 (45.6%) | $27,708 |
| Total | 125 (100.0%) | $40,313 |
Earnings by Sex by Income Bracket in Roseland
The most common earnings brackets in Roseland are $30,000 to $34,999 for men (11 | 16.2%) and $5,000 to $7,499 for women (6 | 10.5%).
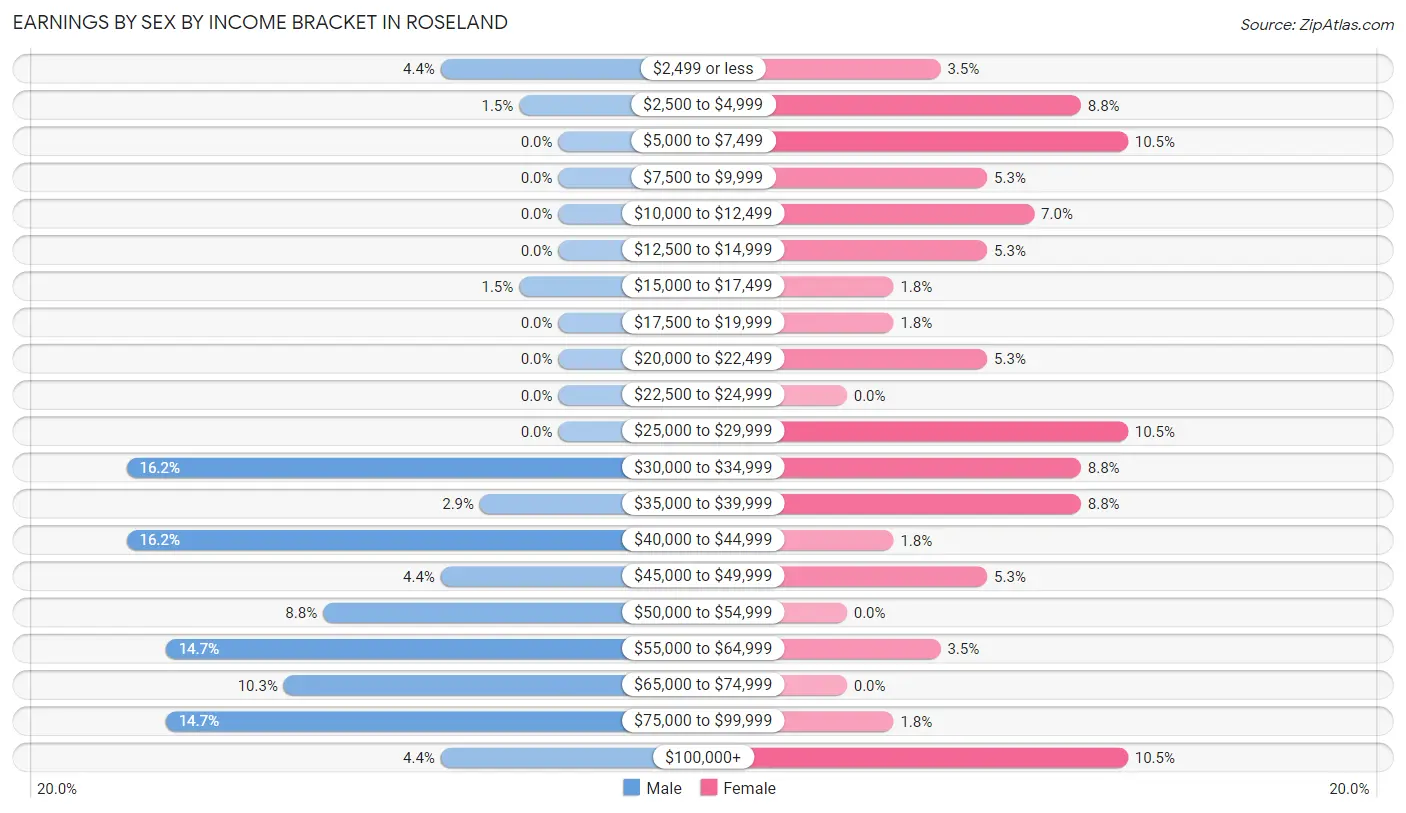
| Income | Male | Female |
| $2,499 or less | 3 (4.4%) | 2 (3.5%) |
| $2,500 to $4,999 | 1 (1.5%) | 5 (8.8%) |
| $5,000 to $7,499 | 0 (0.0%) | 6 (10.5%) |
| $7,500 to $9,999 | 0 (0.0%) | 3 (5.3%) |
| $10,000 to $12,499 | 0 (0.0%) | 4 (7.0%) |
| $12,500 to $14,999 | 0 (0.0%) | 3 (5.3%) |
| $15,000 to $17,499 | 1 (1.5%) | 1 (1.8%) |
| $17,500 to $19,999 | 0 (0.0%) | 1 (1.8%) |
| $20,000 to $22,499 | 0 (0.0%) | 3 (5.3%) |
| $22,500 to $24,999 | 0 (0.0%) | 0 (0.0%) |
| $25,000 to $29,999 | 0 (0.0%) | 6 (10.5%) |
| $30,000 to $34,999 | 11 (16.2%) | 5 (8.8%) |
| $35,000 to $39,999 | 2 (2.9%) | 5 (8.8%) |
| $40,000 to $44,999 | 11 (16.2%) | 1 (1.8%) |
| $45,000 to $49,999 | 3 (4.4%) | 3 (5.3%) |
| $50,000 to $54,999 | 6 (8.8%) | 0 (0.0%) |
| $55,000 to $64,999 | 10 (14.7%) | 2 (3.5%) |
| $65,000 to $74,999 | 7 (10.3%) | 0 (0.0%) |
| $75,000 to $99,999 | 10 (14.7%) | 1 (1.8%) |
| $100,000+ | 3 (4.4%) | 6 (10.5%) |
| Total | 68 (100.0%) | 57 (100.0%) |
Earnings by Sex by Educational Attainment in Roseland
Average earnings in Roseland are $53,958 for men and $28,542 for women, a difference of 47.1%. Men with an educational attainment of bachelor's degree enjoy the highest average annual earnings of $68,750, while those with less than high school education earn the least with $41,250. Women with an educational attainment of high school diploma earn the most with the average annual earnings of $35,000, while those with bachelor's degree education have the smallest earnings of $20,625.
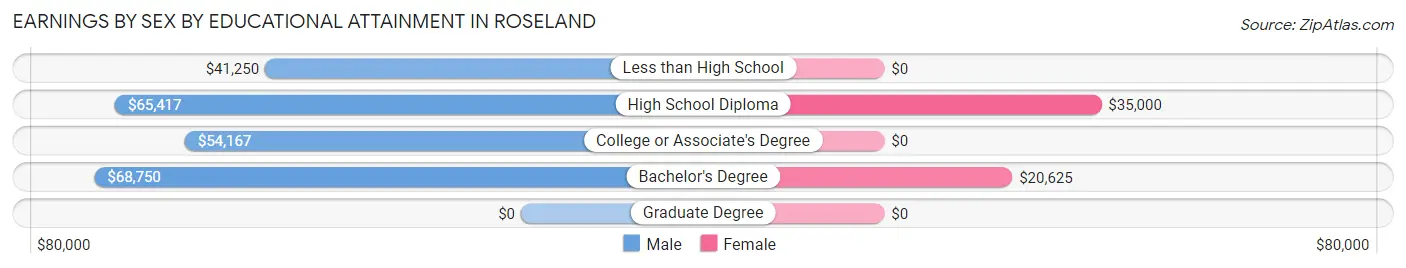
| Educational Attainment | Male Income | Female Income |
| Less than High School | $41,250 | $0 |
| High School Diploma | $65,417 | $35,000 |
| College or Associate's Degree | $54,167 | $0 |
| Bachelor's Degree | $68,750 | $20,625 |
| Graduate Degree | - | - |
| Total | $53,958 | $28,542 |
Family Income in Roseland
Family Income Brackets in Roseland
According to the Roseland family income data, there are 20 families falling into the $50,000 to $74,999 income range, which is the most common income bracket and makes up 27.4% of all families.
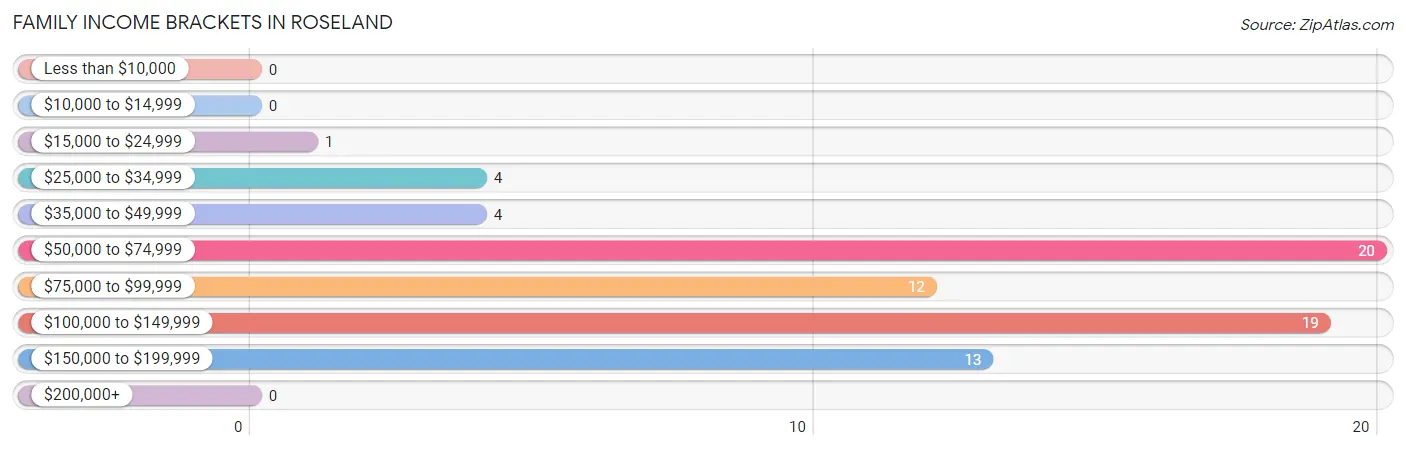
| Income Bracket | # Families | % Families |
| Less than $10,000 | 0 | 0.0% |
| $10,000 to $14,999 | 0 | 0.0% |
| $15,000 to $24,999 | 1 | 1.4% |
| $25,000 to $34,999 | 4 | 5.5% |
| $35,000 to $49,999 | 4 | 5.5% |
| $50,000 to $74,999 | 20 | 27.4% |
| $75,000 to $99,999 | 12 | 16.4% |
| $100,000 to $149,999 | 19 | 26.0% |
| $150,000 to $199,999 | 13 | 17.8% |
| $200,000+ | 0 | 0.0% |
Family Income by Famaliy Size in Roseland
3-person families (11 | 15.1%) account for the highest median family income in Roseland with $167,708 per family, while 2-person families (28 | 38.4%) have the highest median income of $57,812 per family member.
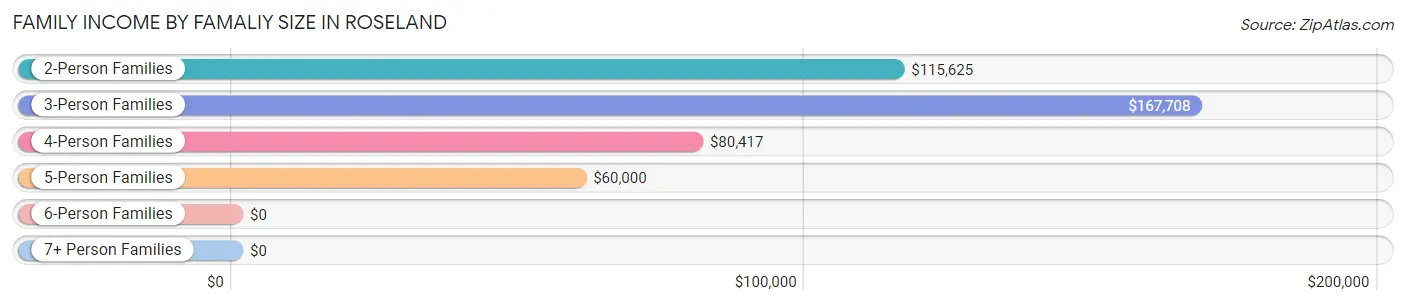
| Income Bracket | # Families | Median Income |
| 2-Person Families | 28 (38.4%) | $115,625 |
| 3-Person Families | 11 (15.1%) | $167,708 |
| 4-Person Families | 25 (34.3%) | $80,417 |
| 5-Person Families | 4 (5.5%) | $60,000 |
| 6-Person Families | 0 (0.0%) | $0 |
| 7+ Person Families | 5 (6.9%) | $0 |
| Total | 73 (100.0%) | $88,750 |
Family Income by Number of Earners in Roseland
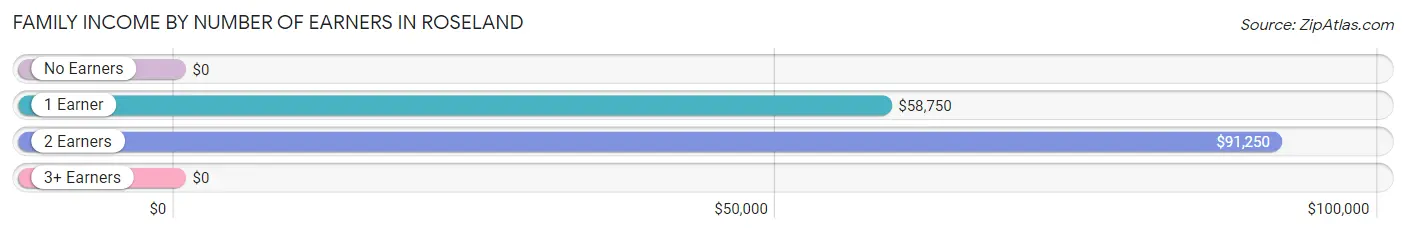
| Number of Earners | # Families | Median Income |
| No Earners | 9 (12.3%) | $0 |
| 1 Earner | 13 (17.8%) | $58,750 |
| 2 Earners | 46 (63.0%) | $91,250 |
| 3+ Earners | 5 (6.9%) | $0 |
| Total | 73 (100.0%) | $88,750 |
Household Income in Roseland
Household Income Brackets in Roseland
With 24 households falling in the category, the $50,000 to $74,999 income range is the most frequent in Roseland, accounting for 25.0% of all households.
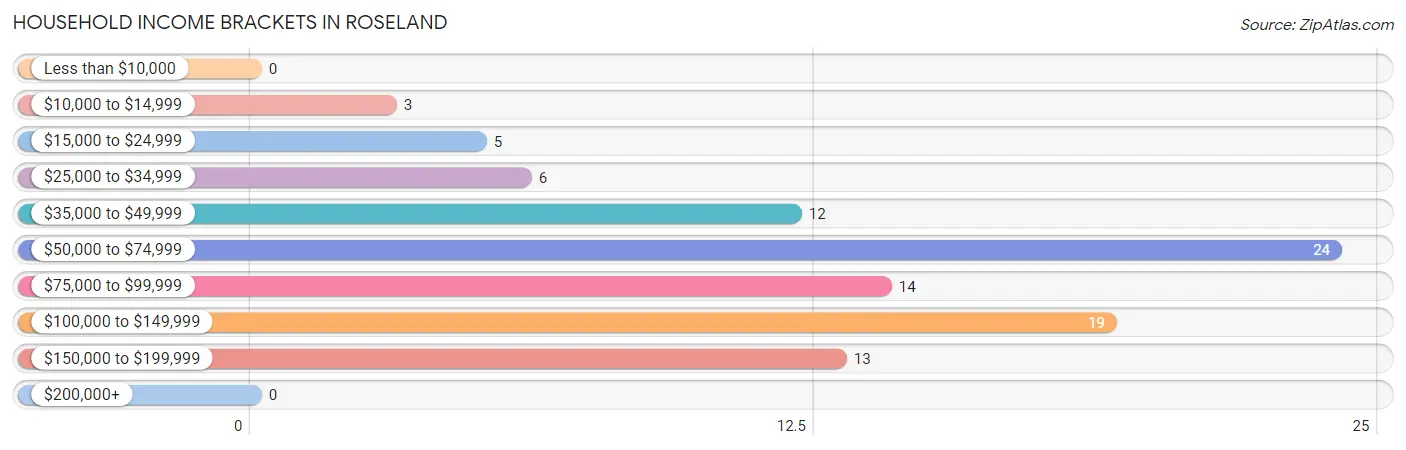
| Income Bracket | # Households | % Households |
| Less than $10,000 | 0 | 0.0% |
| $10,000 to $14,999 | 3 | 3.1% |
| $15,000 to $24,999 | 5 | 5.2% |
| $25,000 to $34,999 | 6 | 6.3% |
| $35,000 to $49,999 | 12 | 12.5% |
| $50,000 to $74,999 | 24 | 25.0% |
| $75,000 to $99,999 | 14 | 14.6% |
| $100,000 to $149,999 | 19 | 19.8% |
| $150,000 to $199,999 | 13 | 13.5% |
| $200,000+ | 0 | 0.0% |
Household Income by Householder Age in Roseland
The median household income in Roseland is $68,750, with the highest median household income of $99,167 found in the 45 to 64 years age bracket for the primary householder. A total of 24 households (25.0%) fall into this category.
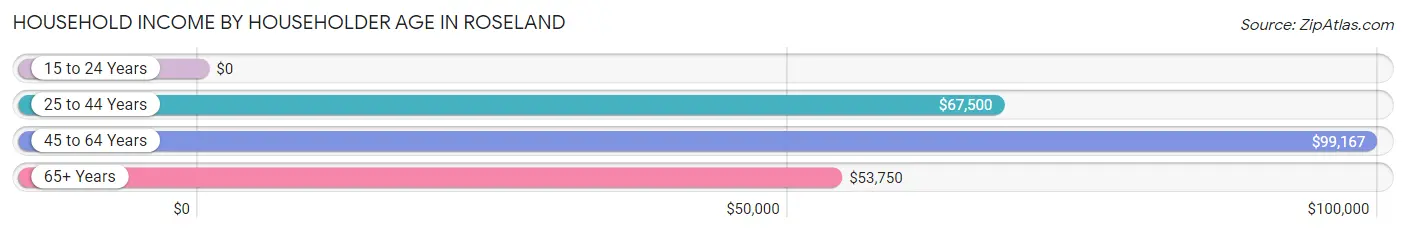
| Income Bracket | # Households | Median Income |
| 15 to 24 Years | 0 (0.0%) | $0 |
| 25 to 44 Years | 48 (50.0%) | $67,500 |
| 45 to 64 Years | 24 (25.0%) | $99,167 |
| 65+ Years | 24 (25.0%) | $53,750 |
| Total | 96 (100.0%) | $68,750 |
Poverty in Roseland
Income Below Poverty by Sex and Age in Roseland
| Age Bracket | Male | Female |
| Under 5 Years | 0 (0.0%) | 0 (0.0%) |
| 5 Years | 0 (0.0%) | 0 (0.0%) |
| 6 to 11 Years | 0 (0.0%) | 0 (0.0%) |
| 12 to 14 Years | 0 (0.0%) | 0 (0.0%) |
| 15 Years | 0 (0.0%) | 0 (0.0%) |
| 16 and 17 Years | 0 (0.0%) | 0 (0.0%) |
| 18 to 24 Years | 0 (0.0%) | 0 (0.0%) |
| 25 to 34 Years | 0 (0.0%) | 0 (0.0%) |
| 35 to 44 Years | 0 (0.0%) | 0 (0.0%) |
| 45 to 54 Years | 0 (0.0%) | 0 (0.0%) |
| 55 to 64 Years | 0 (0.0%) | 0 (0.0%) |
| 65 to 74 Years | 2 (28.6%) | 0 (0.0%) |
| 75 Years and over | 0 (0.0%) | 0 (0.0%) |
| Total | 2 (1.3%) | 0 (0.0%) |
Income Above Poverty by Sex and Age in Roseland
According to the poverty statistics in Roseland, males aged under 5 years and females aged under 5 years are the age groups that are most secure financially, with 100.0% of males and 100.0% of females in these age groups living above the poverty line.
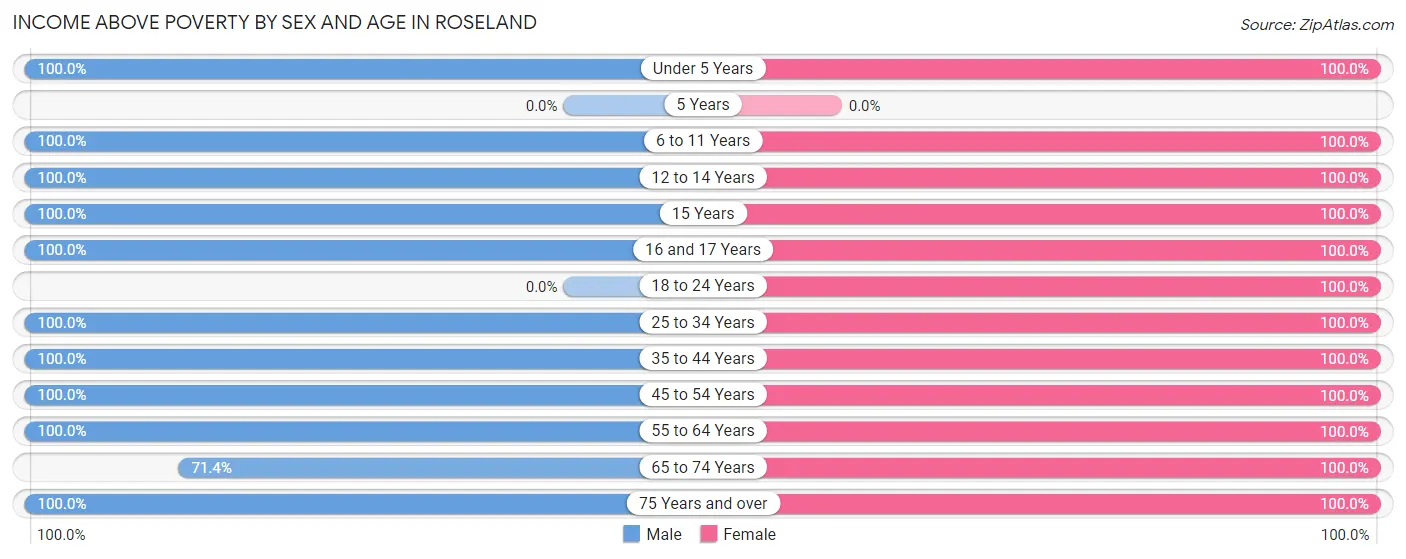
| Age Bracket | Male | Female |
| Under 5 Years | 12 (100.0%) | 4 (100.0%) |
| 5 Years | 0 (0.0%) | 0 (0.0%) |
| 6 to 11 Years | 25 (100.0%) | 16 (100.0%) |
| 12 to 14 Years | 27 (100.0%) | 3 (100.0%) |
| 15 Years | 2 (100.0%) | 3 (100.0%) |
| 16 and 17 Years | 3 (100.0%) | 2 (100.0%) |
| 18 to 24 Years | 0 (0.0%) | 4 (100.0%) |
| 25 to 34 Years | 13 (100.0%) | 8 (100.0%) |
| 35 to 44 Years | 30 (100.0%) | 31 (100.0%) |
| 45 to 54 Years | 9 (100.0%) | 6 (100.0%) |
| 55 to 64 Years | 15 (100.0%) | 13 (100.0%) |
| 65 to 74 Years | 5 (71.4%) | 13 (100.0%) |
| 75 Years and over | 8 (100.0%) | 4 (100.0%) |
| Total | 149 (98.7%) | 107 (100.0%) |
Income Below Poverty Among Married-Couple Families in Roseland
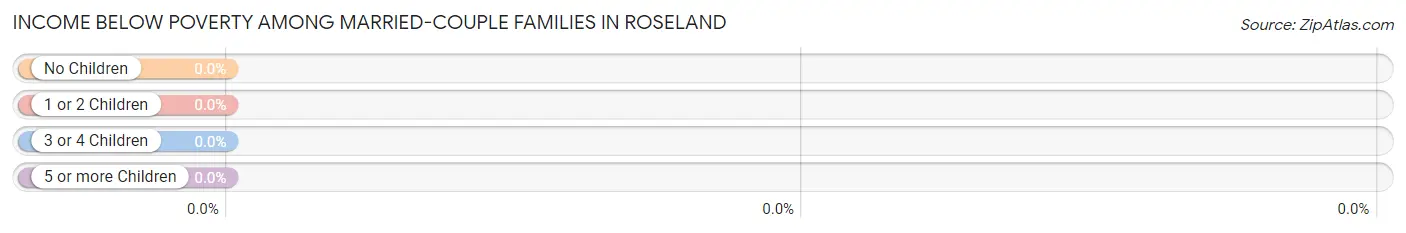
| Children | Above Poverty | Below Poverty |
| No Children | 24 (100.0%) | 0 (0.0%) |
| 1 or 2 Children | 33 (100.0%) | 0 (0.0%) |
| 3 or 4 Children | 7 (100.0%) | 0 (0.0%) |
| 5 or more Children | 2 (100.0%) | 0 (0.0%) |
| Total | 66 (100.0%) | 0 (0.0%) |
Income Below Poverty Among Single-Parent Households in Roseland
| Children | Single Father | Single Mother |
| No Children | 0 (0.0%) | 0 (0.0%) |
| 1 or 2 Children | 0 (0.0%) | 0 (0.0%) |
| 3 or 4 Children | 0 (0.0%) | 0 (0.0%) |
| 5 or more Children | 0 (0.0%) | 0 (0.0%) |
| Total | 0 (0.0%) | 0 (0.0%) |
Income Below Poverty Among Married-Couple vs Single-Parent Households in Roseland
| Children | Married-Couple Families | Single-Parent Households |
| No Children | 0 (0.0%) | 0 (0.0%) |
| 1 or 2 Children | 0 (0.0%) | 0 (0.0%) |
| 3 or 4 Children | 0 (0.0%) | 0 (0.0%) |
| 5 or more Children | 0 (0.0%) | 0 (0.0%) |
| Total | 0 (0.0%) | 0 (0.0%) |
Race in Roseland
The most populous races in Roseland are White / Caucasian (244 | 94.6%), Asian (11 | 4.3%), and Hispanic or Latino (7 | 2.7%).
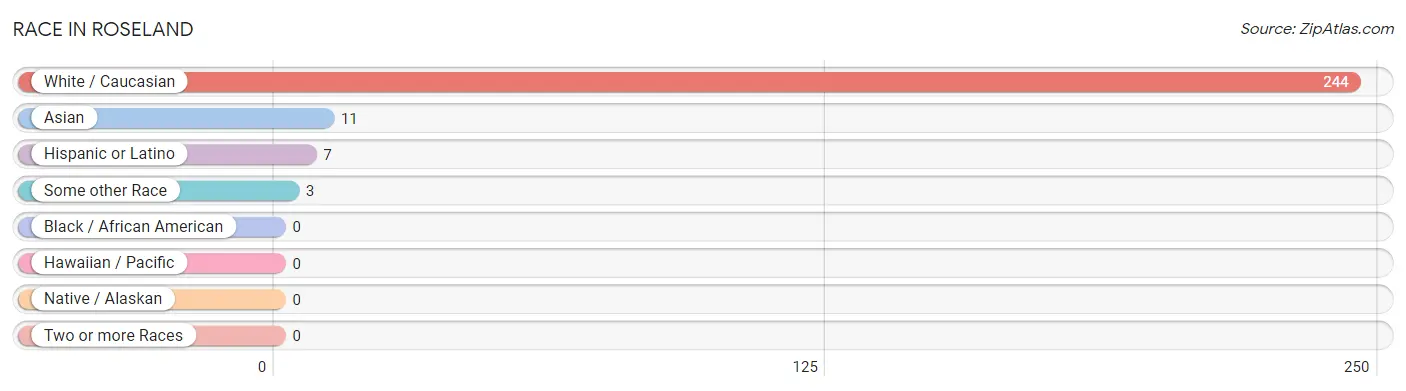
| Race | # Population | % Population |
| Asian | 11 | 4.3% |
| Black / African American | 0 | 0.0% |
| Hawaiian / Pacific | 0 | 0.0% |
| Hispanic or Latino | 7 | 2.7% |
| Native / Alaskan | 0 | 0.0% |
| White / Caucasian | 244 | 94.6% |
| Two or more Races | 0 | 0.0% |
| Some other Race | 3 | 1.2% |
| Total | 258 | 100.0% |
Ancestry in Roseland
The most populous ancestries reported in Roseland are German (104 | 40.3%), Irish (38 | 14.7%), English (14 | 5.4%), Danish (13 | 5.0%), and Indonesian (11 | 4.3%), together accounting for 69.8% of all Roseland residents.
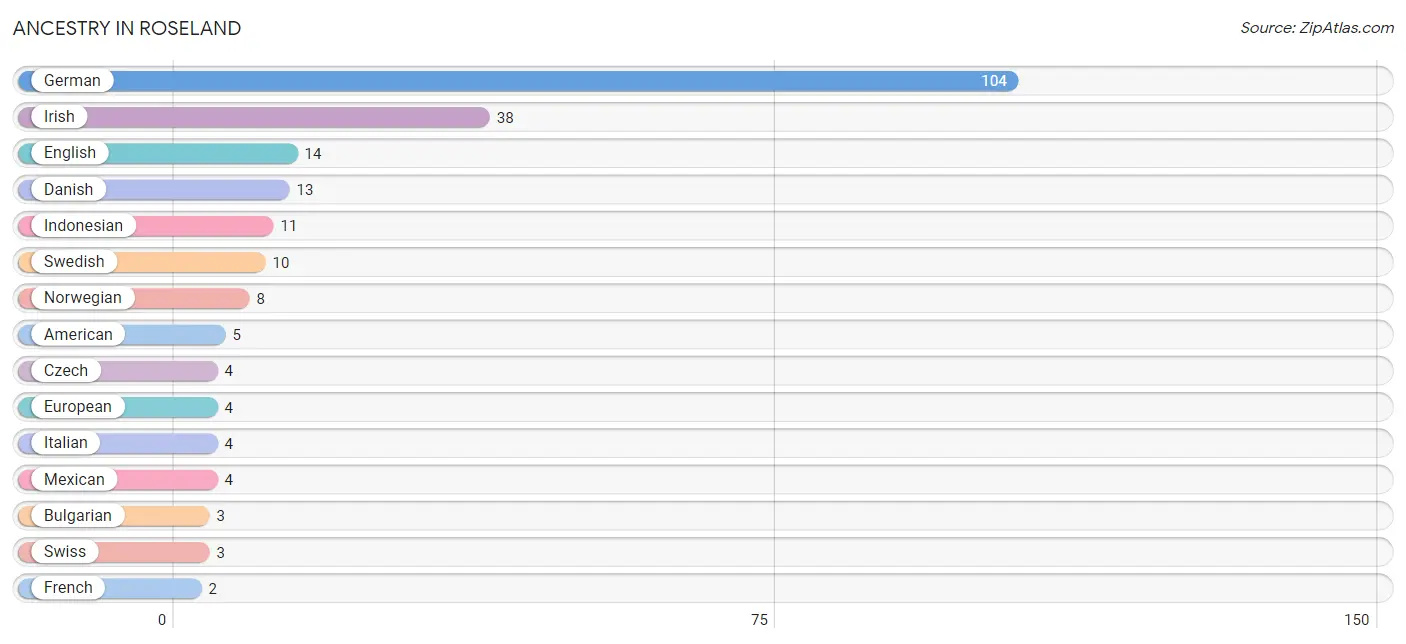
| Ancestry | # Population | % Population |
| American | 5 | 1.9% |
| British | 1 | 0.4% |
| Bulgarian | 3 | 1.2% |
| Czech | 4 | 1.5% |
| Danish | 13 | 5.0% |
| English | 14 | 5.4% |
| European | 4 | 1.5% |
| French | 2 | 0.8% |
| German | 104 | 40.3% |
| Indonesian | 11 | 4.3% |
| Irish | 38 | 14.7% |
| Italian | 4 | 1.5% |
| Luxembourger | 1 | 0.4% |
| Mexican | 4 | 1.5% |
| Norwegian | 8 | 3.1% |
| Scotch-Irish | 2 | 0.8% |
| Scottish | 2 | 0.8% |
| Swedish | 10 | 3.9% |
| Swiss | 3 | 1.2% | View All 19 Rows |
Immigrants in Roseland
The most numerous immigrant groups reported in Roseland came from Central America (3 | 1.2%), Latin America (3 | 1.2%), Mexico (3 | 1.2%), Asia (2 | 0.8%), and England (2 | 0.8%), together accounting for 5.0% of all Roseland residents.
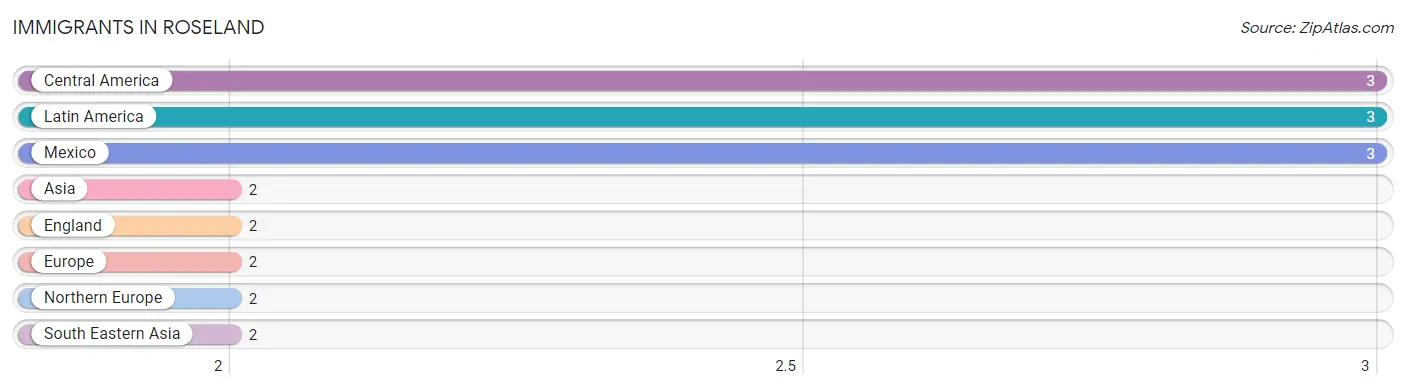
| Immigration Origin | # Population | % Population |
| Asia | 2 | 0.8% |
| Central America | 3 | 1.2% |
| England | 2 | 0.8% |
| Europe | 2 | 0.8% |
| Latin America | 3 | 1.2% |
| Mexico | 3 | 1.2% |
| Northern Europe | 2 | 0.8% |
| South Eastern Asia | 2 | 0.8% | View All 8 Rows |
Sex and Age in Roseland
Sex and Age in Roseland
The most populous age groups in Roseland are 10 to 14 Years (32 | 21.2%) for men and 40 to 44 Years (22 | 20.6%) for women.
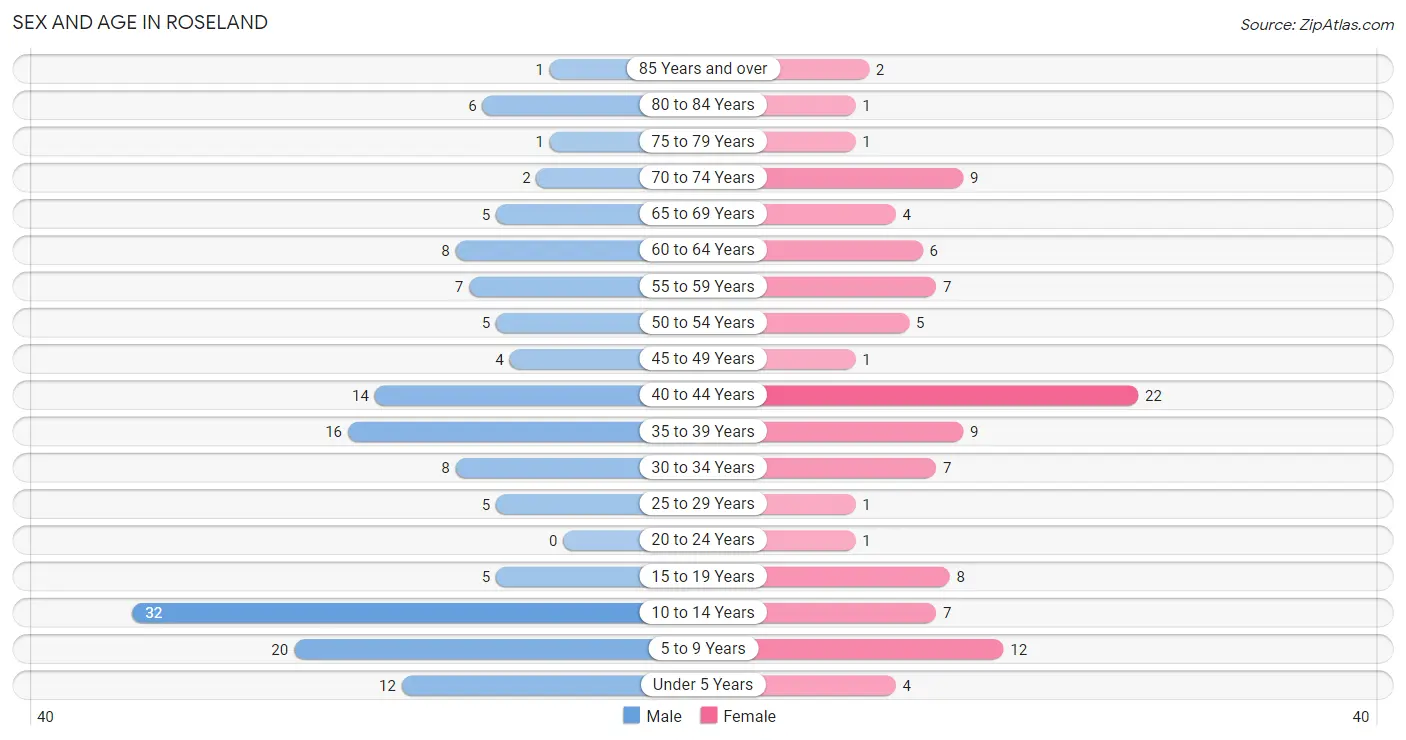
| Age Bracket | Male | Female |
| Under 5 Years | 12 (8.0%) | 4 (3.7%) |
| 5 to 9 Years | 20 (13.3%) | 12 (11.2%) |
| 10 to 14 Years | 32 (21.2%) | 7 (6.5%) |
| 15 to 19 Years | 5 (3.3%) | 8 (7.5%) |
| 20 to 24 Years | 0 (0.0%) | 1 (0.9%) |
| 25 to 29 Years | 5 (3.3%) | 1 (0.9%) |
| 30 to 34 Years | 8 (5.3%) | 7 (6.5%) |
| 35 to 39 Years | 16 (10.6%) | 9 (8.4%) |
| 40 to 44 Years | 14 (9.3%) | 22 (20.6%) |
| 45 to 49 Years | 4 (2.6%) | 1 (0.9%) |
| 50 to 54 Years | 5 (3.3%) | 5 (4.7%) |
| 55 to 59 Years | 7 (4.6%) | 7 (6.5%) |
| 60 to 64 Years | 8 (5.3%) | 6 (5.6%) |
| 65 to 69 Years | 5 (3.3%) | 4 (3.7%) |
| 70 to 74 Years | 2 (1.3%) | 9 (8.4%) |
| 75 to 79 Years | 1 (0.7%) | 1 (0.9%) |
| 80 to 84 Years | 6 (4.0%) | 1 (0.9%) |
| 85 Years and over | 1 (0.7%) | 2 (1.9%) |
| Total | 151 (100.0%) | 107 (100.0%) |
Families and Households in Roseland
Median Family Size in Roseland
The median family size in Roseland is 3.22 persons per family, with single male/father families (2 | 2.7%) accounting for the largest median family size of 3.5 persons per family. On the other hand, single female/mother families (5 | 6.9%) represent the smallest median family size with 2.60 persons per family.
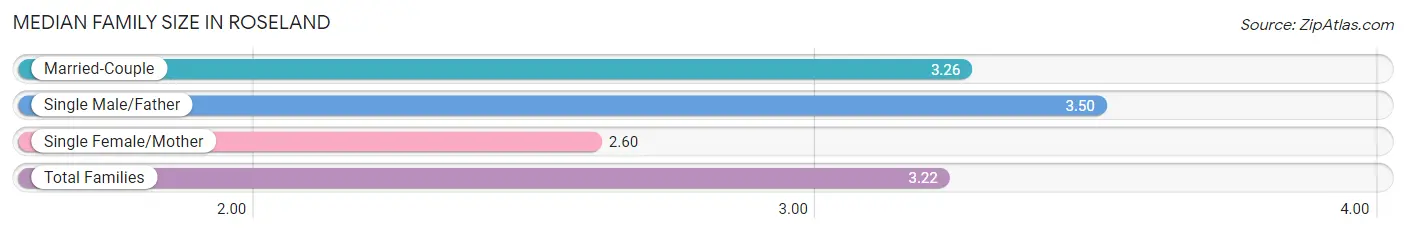
| Family Type | # Families | Family Size |
| Married-Couple | 66 (90.4%) | 3.26 |
| Single Male/Father | 2 (2.7%) | 3.50 |
| Single Female/Mother | 5 (6.9%) | 2.60 |
| Total Families | 73 (100.0%) | 3.22 |
Median Household Size in Roseland
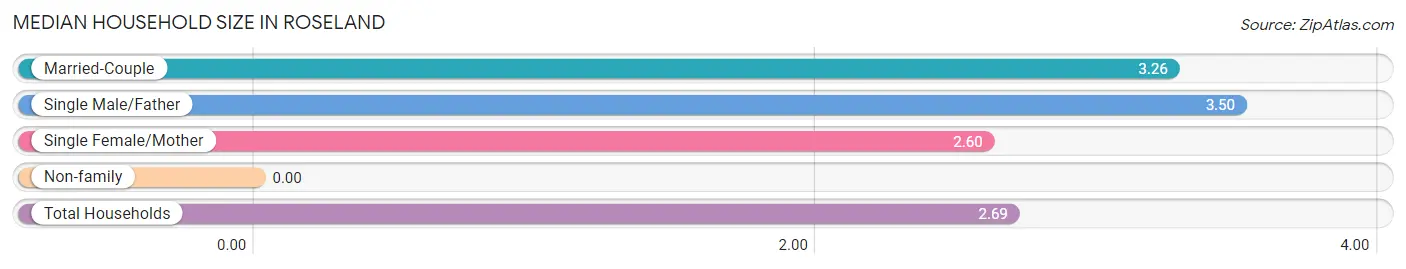
| Household Type | # Households | Household Size |
| Married-Couple | 66 (68.8%) | 3.26 |
| Single Male/Father | 2 (2.1%) | 3.50 |
| Single Female/Mother | 5 (5.2%) | 2.60 |
| Non-family | 23 (24.0%) | - |
| Total Households | 96 (100.0%) | 2.69 |
Household Size by Marriage Status in Roseland
Out of a total of 96 households in Roseland, 73 (76.0%) are family households, while 23 (24.0%) are nonfamily households. The most numerous type of family households are 2-person households, comprising 28, and the most common type of nonfamily households are 1-person households, comprising 23.
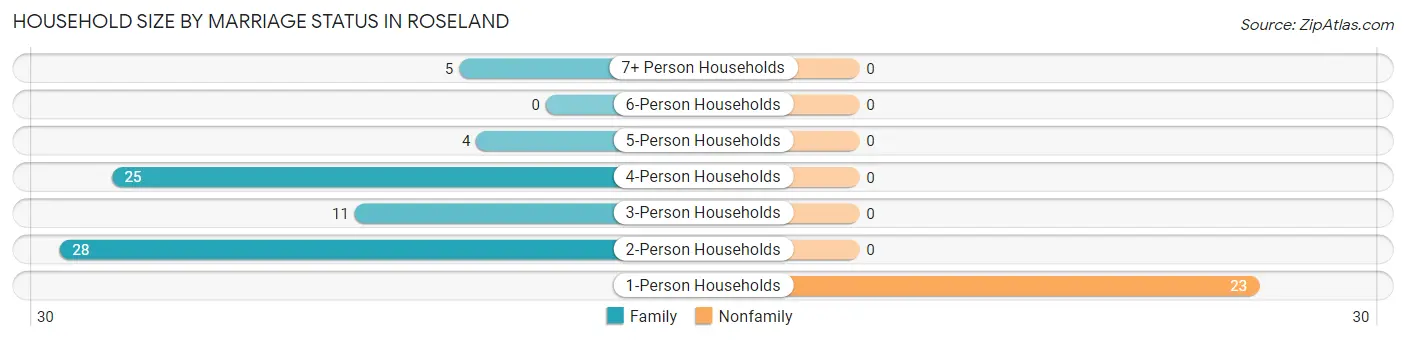
| Household Size | Family Households | Nonfamily Households |
| 1-Person Households | - | 23 (24.0%) |
| 2-Person Households | 28 (29.2%) | 0 (0.0%) |
| 3-Person Households | 11 (11.5%) | 0 (0.0%) |
| 4-Person Households | 25 (26.0%) | 0 (0.0%) |
| 5-Person Households | 4 (4.2%) | 0 (0.0%) |
| 6-Person Households | 0 (0.0%) | 0 (0.0%) |
| 7+ Person Households | 5 (5.2%) | 0 (0.0%) |
| Total | 73 (76.0%) | 23 (24.0%) |
Female Fertility in Roseland
Fertility by Age in Roseland
Average fertility rate in Roseland is 39.0 births per 1,000 women. Women in the age bracket of 20 to 34 years have the highest fertility rate with 111.0 births per 1,000 women. Women in the age bracket of 20 to 34 years acount for 50.0% of all women with births.
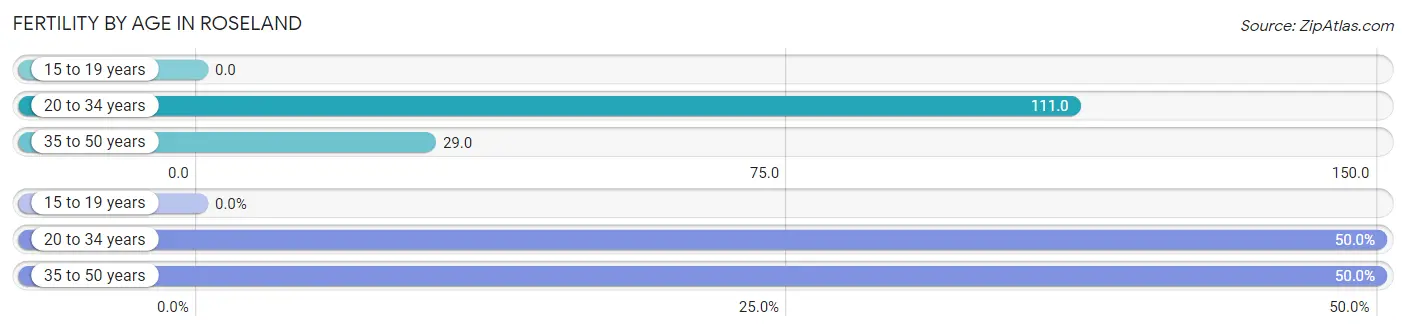
| Age Bracket | Women with Births | Births / 1,000 Women |
| 15 to 19 years | 0 (0.0%) | 0.0 |
| 20 to 34 years | 1 (50.0%) | 111.0 |
| 35 to 50 years | 1 (50.0%) | 29.0 |
| Total | 2 (100.0%) | 39.0 |
Fertility by Age by Marriage Status in Roseland
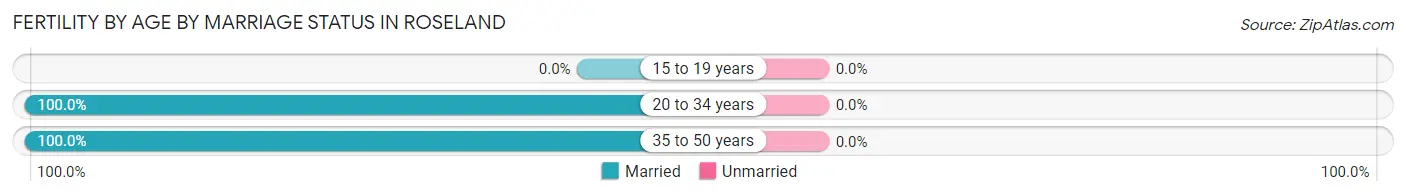
| Age Bracket | Married | Unmarried |
| 15 to 19 years | 0 (0.0%) | 0 (0.0%) |
| 20 to 34 years | 1 (100.0%) | 0 (0.0%) |
| 35 to 50 years | 1 (100.0%) | 0 (0.0%) |
| Total | 2 (100.0%) | 0 (0.0%) |
Fertility by Education in Roseland
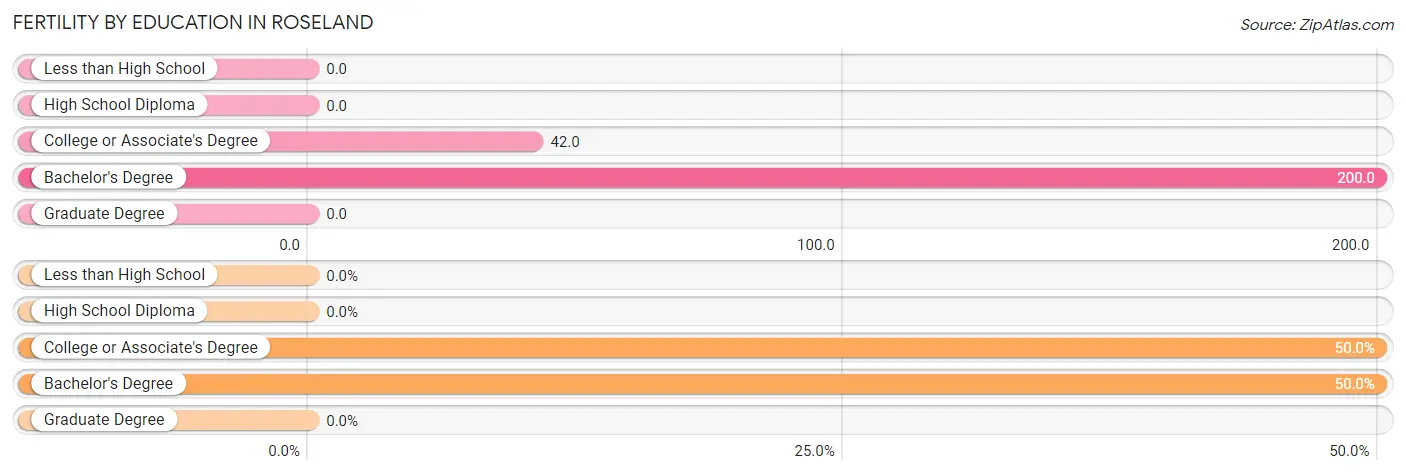
| Educational Attainment | Women with Births | Births / 1,000 Women |
| Less than High School | 0 (0.0%) | 0.0 |
| High School Diploma | 0 (0.0%) | 0.0 |
| College or Associate's Degree | 1 (50.0%) | 42.0 |
| Bachelor's Degree | 1 (50.0%) | 200.0 |
| Graduate Degree | 0 (0.0%) | 0.0 |
| Total | 2 (100.0%) | 39.0 |
Fertility by Education by Marriage Status in Roseland
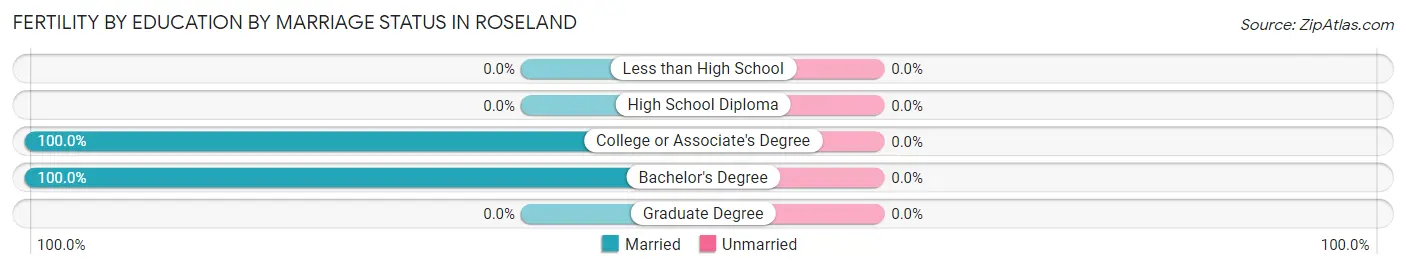
| Educational Attainment | Married | Unmarried |
| Less than High School | 0 (0.0%) | 0 (0.0%) |
| High School Diploma | 0 (0.0%) | 0 (0.0%) |
| College or Associate's Degree | 1 (100.0%) | 0 (0.0%) |
| Bachelor's Degree | 1 (100.0%) | 0 (0.0%) |
| Graduate Degree | 0 (0.0%) | 0 (0.0%) |
| Total | 2 (100.0%) | 0 (0.0%) |
Employment Characteristics in Roseland
Employment by Class of Employer in Roseland
Among the 118 employed individuals in Roseland, private company employees (65 | 55.1%), not-for-profit organizations (18 | 15.2%), and self-employed (not incorporated) (16 | 13.6%) make up the most common classes of employment.
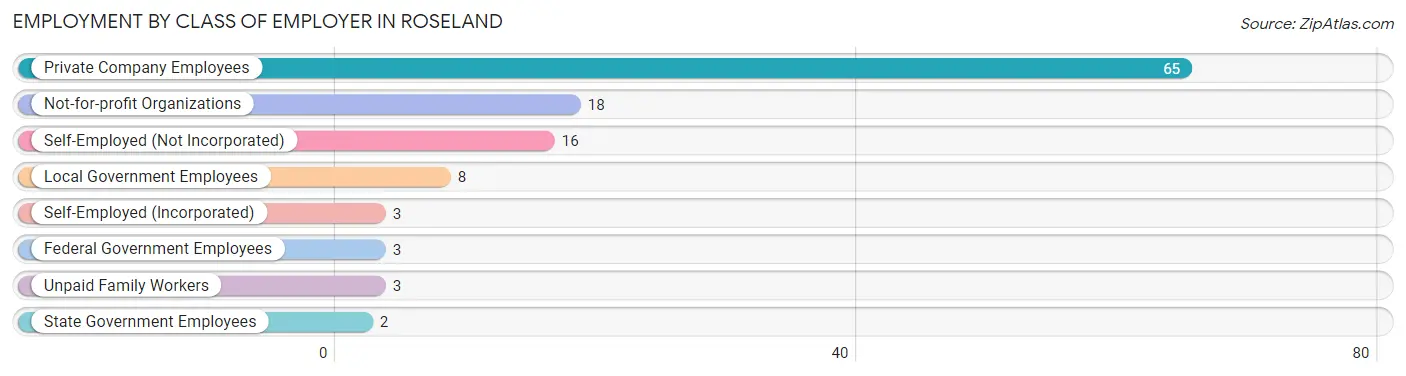
| Employer Class | # Employees | % Employees |
| Private Company Employees | 65 | 55.1% |
| Self-Employed (Incorporated) | 3 | 2.5% |
| Self-Employed (Not Incorporated) | 16 | 13.6% |
| Not-for-profit Organizations | 18 | 15.2% |
| Local Government Employees | 8 | 6.8% |
| State Government Employees | 2 | 1.7% |
| Federal Government Employees | 3 | 2.5% |
| Unpaid Family Workers | 3 | 2.5% |
| Total | 118 | 100.0% |
Employment Status by Age in Roseland
According to the labor force statistics for Roseland, out of the total population over 16 years of age (166), 72.3% or 120 individuals are in the labor force, with 0.8% or 1 of them unemployed. The age group with the highest labor force participation rate is 20 to 24 years, with 100.0% or 1 individuals in the labor force. Within the labor force, the 45 to 54 years age range has the highest percentage of unemployed individuals, with 7.1% or 1 of them being unemployed.
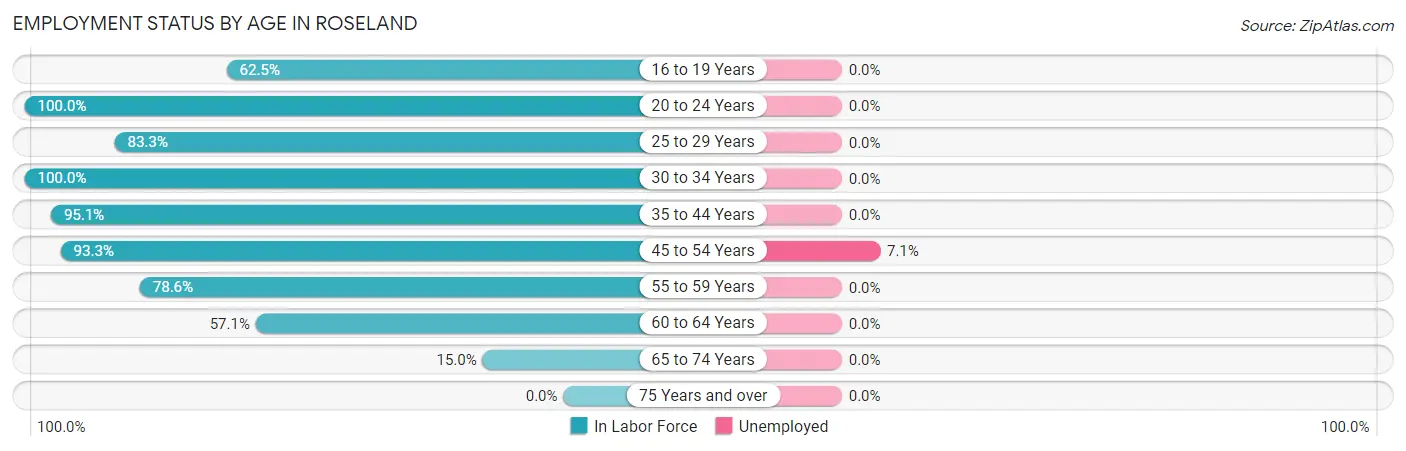
| Age Bracket | In Labor Force | Unemployed |
| 16 to 19 Years | 5 (62.5%) | 0 (0.0%) |
| 20 to 24 Years | 1 (100.0%) | 0 (0.0%) |
| 25 to 29 Years | 5 (83.3%) | 0 (0.0%) |
| 30 to 34 Years | 15 (100.0%) | 0 (0.0%) |
| 35 to 44 Years | 58 (95.1%) | 0 (0.0%) |
| 45 to 54 Years | 14 (93.3%) | 1 (7.1%) |
| 55 to 59 Years | 11 (78.6%) | 0 (0.0%) |
| 60 to 64 Years | 8 (57.1%) | 0 (0.0%) |
| 65 to 74 Years | 3 (15.0%) | 0 (0.0%) |
| 75 Years and over | 0 (0.0%) | 0 (0.0%) |
| Total | 120 (72.3%) | 1 (0.8%) |
Employment Status by Educational Attainment in Roseland
According to labor force statistics for Roseland, 88.8% of individuals (111) out of the total population between 25 and 64 years of age (125) are in the labor force, with 0.9% or 1 of them being unemployed. The group with the highest labor force participation rate are those with the educational attainment of less than high school, with 100.0% or 13 individuals in the labor force. Within the labor force, individuals with college / associate degree education have the highest percentage of unemployment, with 1.7% or 1 of them being unemployed.
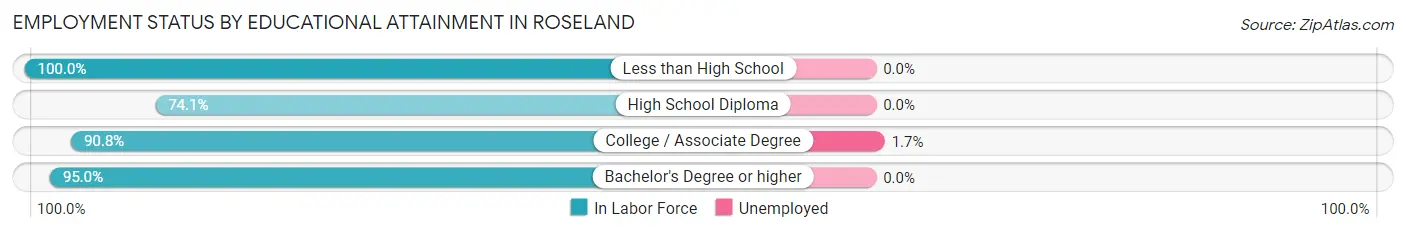
| Educational Attainment | In Labor Force | Unemployed |
| Less than High School | 13 (100.0%) | 0 (0.0%) |
| High School Diploma | 20 (74.1%) | 0 (0.0%) |
| College / Associate Degree | 59 (90.8%) | 1 (1.7%) |
| Bachelor's Degree or higher | 19 (95.0%) | 0 (0.0%) |
| Total | 111 (88.8%) | 1 (0.9%) |
Employment Occupations by Sex in Roseland
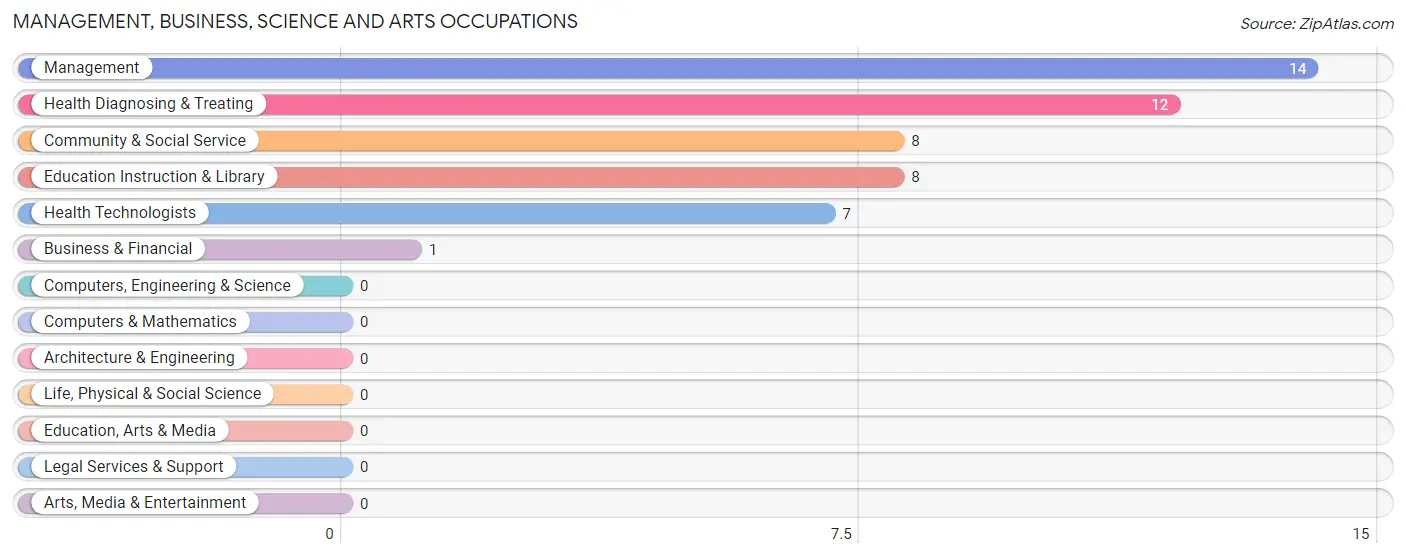
Management, Business, Science and Arts Occupations
The most common Management, Business, Science and Arts occupations in Roseland are Management (14 | 11.8%), Health Diagnosing & Treating (12 | 10.1%), Community & Social Service (8 | 6.7%), Education Instruction & Library (8 | 6.7%), and Health Technologists (7 | 5.9%).
Management, Business, Science and Arts Occupations by Sex
Within the Management, Business, Science and Arts occupations in Roseland, the most male-oriented occupations are Management (64.3%), Community & Social Service (25.0%), and Education Instruction & Library (25.0%), while the most female-oriented occupations are Business & Financial (100.0%), Health Diagnosing & Treating (100.0%), and Health Technologists (100.0%).
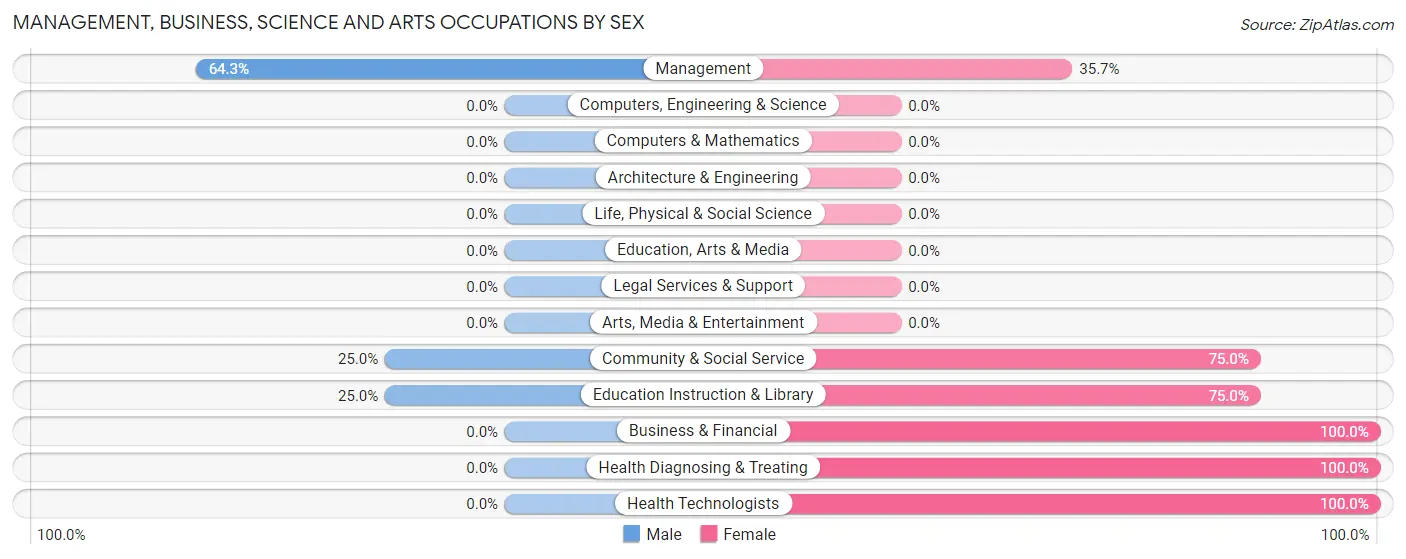
| Occupation | Male | Female |
| Management | 9 (64.3%) | 5 (35.7%) |
| Business & Financial | 0 (0.0%) | 1 (100.0%) |
| Computers, Engineering & Science | 0 (0.0%) | 0 (0.0%) |
| Computers & Mathematics | 0 (0.0%) | 0 (0.0%) |
| Architecture & Engineering | 0 (0.0%) | 0 (0.0%) |
| Life, Physical & Social Science | 0 (0.0%) | 0 (0.0%) |
| Community & Social Service | 2 (25.0%) | 6 (75.0%) |
| Education, Arts & Media | 0 (0.0%) | 0 (0.0%) |
| Legal Services & Support | 0 (0.0%) | 0 (0.0%) |
| Education Instruction & Library | 2 (25.0%) | 6 (75.0%) |
| Arts, Media & Entertainment | 0 (0.0%) | 0 (0.0%) |
| Health Diagnosing & Treating | 0 (0.0%) | 12 (100.0%) |
| Health Technologists | 0 (0.0%) | 7 (100.0%) |
| Total (Category) | 11 (31.4%) | 24 (68.6%) |
| Total (Overall) | 66 (55.5%) | 53 (44.5%) |
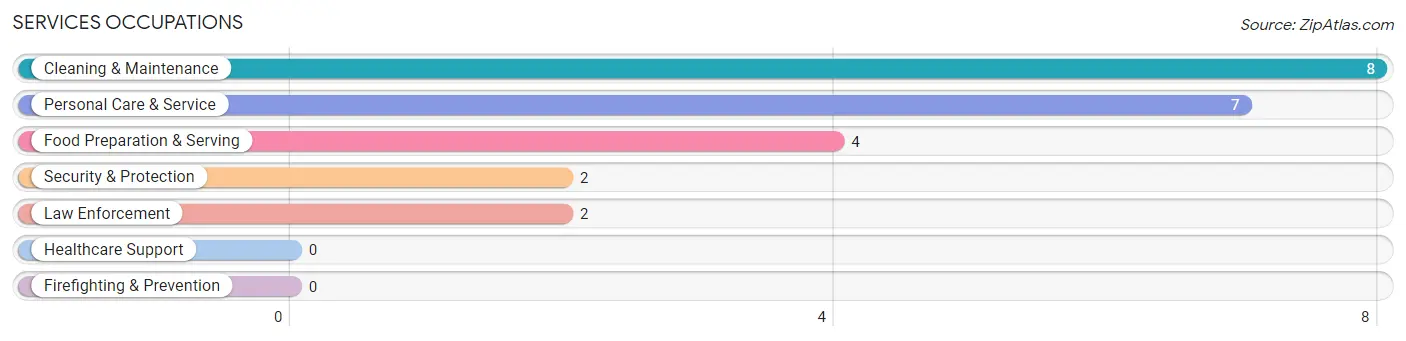
Services Occupations
The most common Services occupations in Roseland are Cleaning & Maintenance (8 | 6.7%), Personal Care & Service (7 | 5.9%), Food Preparation & Serving (4 | 3.4%), Security & Protection (2 | 1.7%), and Law Enforcement (2 | 1.7%).
Services Occupations by Sex
Within the Services occupations in Roseland, the most male-oriented occupations are Security & Protection (100.0%), Law Enforcement (100.0%), and Cleaning & Maintenance (100.0%), while the most female-oriented occupations are Personal Care & Service (71.4%), and Food Preparation & Serving (25.0%).
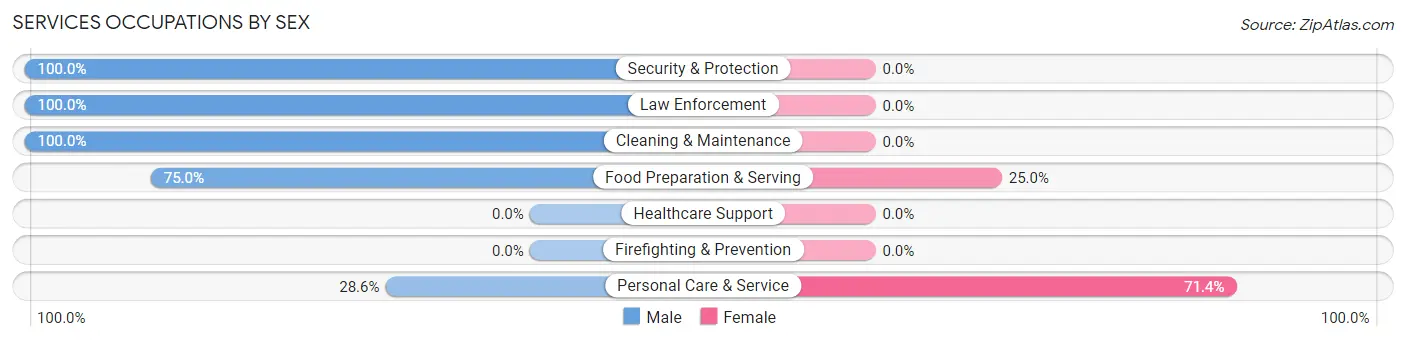
| Occupation | Male | Female |
| Healthcare Support | 0 (0.0%) | 0 (0.0%) |
| Security & Protection | 2 (100.0%) | 0 (0.0%) |
| Firefighting & Prevention | 0 (0.0%) | 0 (0.0%) |
| Law Enforcement | 2 (100.0%) | 0 (0.0%) |
| Food Preparation & Serving | 3 (75.0%) | 1 (25.0%) |
| Cleaning & Maintenance | 8 (100.0%) | 0 (0.0%) |
| Personal Care & Service | 2 (28.6%) | 5 (71.4%) |
| Total (Category) | 15 (71.4%) | 6 (28.6%) |
| Total (Overall) | 66 (55.5%) | 53 (44.5%) |
Sales and Office Occupations
The most common Sales and Office occupations in Roseland are Sales & Related (21 | 17.6%), and Office & Administration (12 | 10.1%).
Sales and Office Occupations by Sex
| Occupation | Male | Female |
| Sales & Related | 15 (71.4%) | 6 (28.6%) |
| Office & Administration | 0 (0.0%) | 12 (100.0%) |
| Total (Category) | 15 (45.5%) | 18 (54.5%) |
| Total (Overall) | 66 (55.5%) | 53 (44.5%) |
Natural Resources, Construction and Maintenance Occupations
The most common Natural Resources, Construction and Maintenance occupations in Roseland are Construction & Extraction (7 | 5.9%), and Installation, Maintenance & Repair (3 | 2.5%).
Natural Resources, Construction and Maintenance Occupations by Sex
| Occupation | Male | Female |
| Farming, Fishing & Forestry | 0 (0.0%) | 0 (0.0%) |
| Construction & Extraction | 7 (100.0%) | 0 (0.0%) |
| Installation, Maintenance & Repair | 3 (100.0%) | 0 (0.0%) |
| Total (Category) | 10 (100.0%) | 0 (0.0%) |
| Total (Overall) | 66 (55.5%) | 53 (44.5%) |
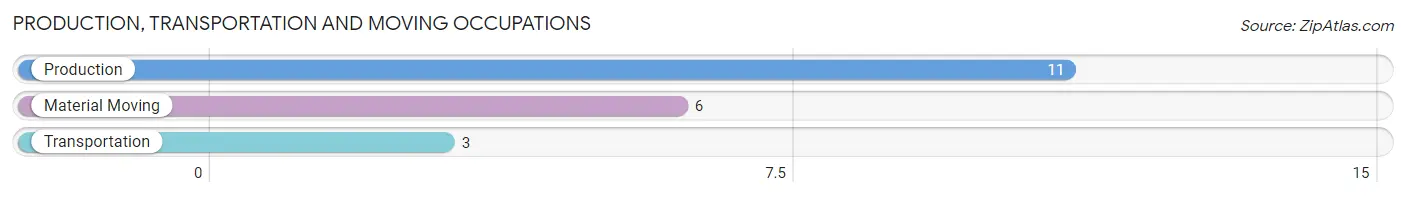
Production, Transportation and Moving Occupations
The most common Production, Transportation and Moving occupations in Roseland are Production (11 | 9.2%), Material Moving (6 | 5.0%), and Transportation (3 | 2.5%).
Production, Transportation and Moving Occupations by Sex
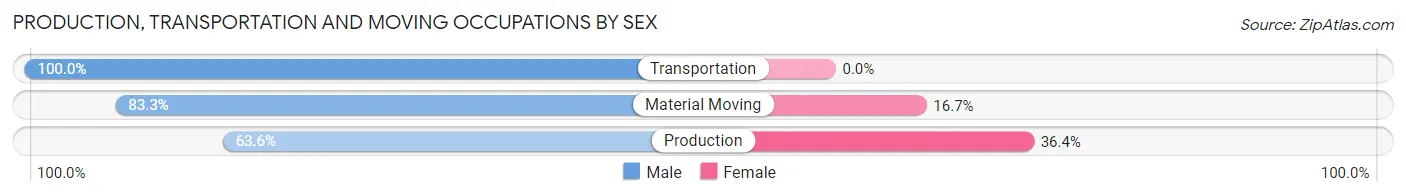
| Occupation | Male | Female |
| Production | 7 (63.6%) | 4 (36.4%) |
| Transportation | 3 (100.0%) | 0 (0.0%) |
| Material Moving | 5 (83.3%) | 1 (16.7%) |
| Total (Category) | 15 (75.0%) | 5 (25.0%) |
| Total (Overall) | 66 (55.5%) | 53 (44.5%) |
Employment Industries by Sex in Roseland
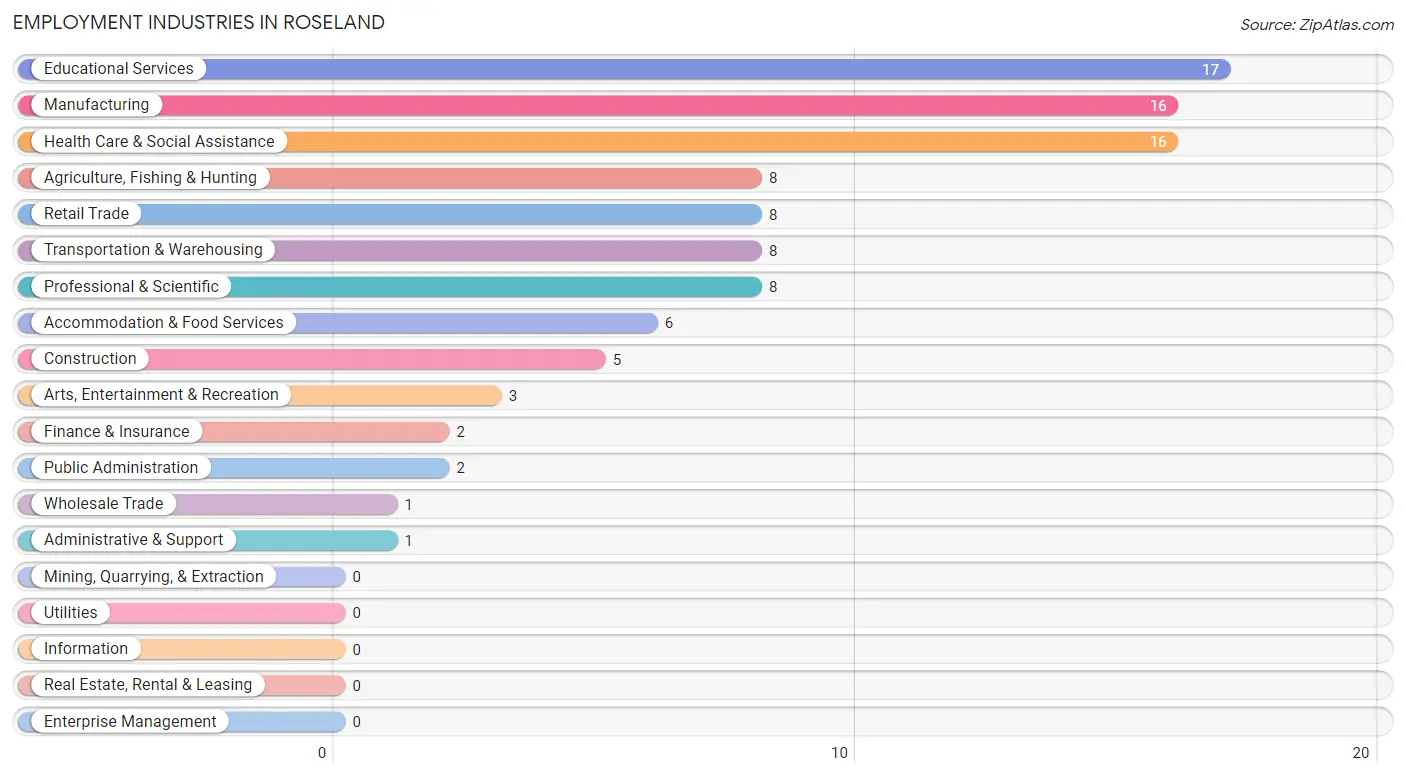
Employment Industries in Roseland
The major employment industries in Roseland include Educational Services (17 | 14.3%), Manufacturing (16 | 13.5%), Health Care & Social Assistance (16 | 13.5%), Agriculture, Fishing & Hunting (8 | 6.7%), and Retail Trade (8 | 6.7%).
Employment Industries by Sex in Roseland
The Roseland industries that see more men than women are Agriculture, Fishing & Hunting (100.0%), Construction (100.0%), and Wholesale Trade (100.0%), whereas the industries that tend to have a higher number of women are Finance & Insurance (100.0%), Administrative & Support (100.0%), and Health Care & Social Assistance (100.0%).
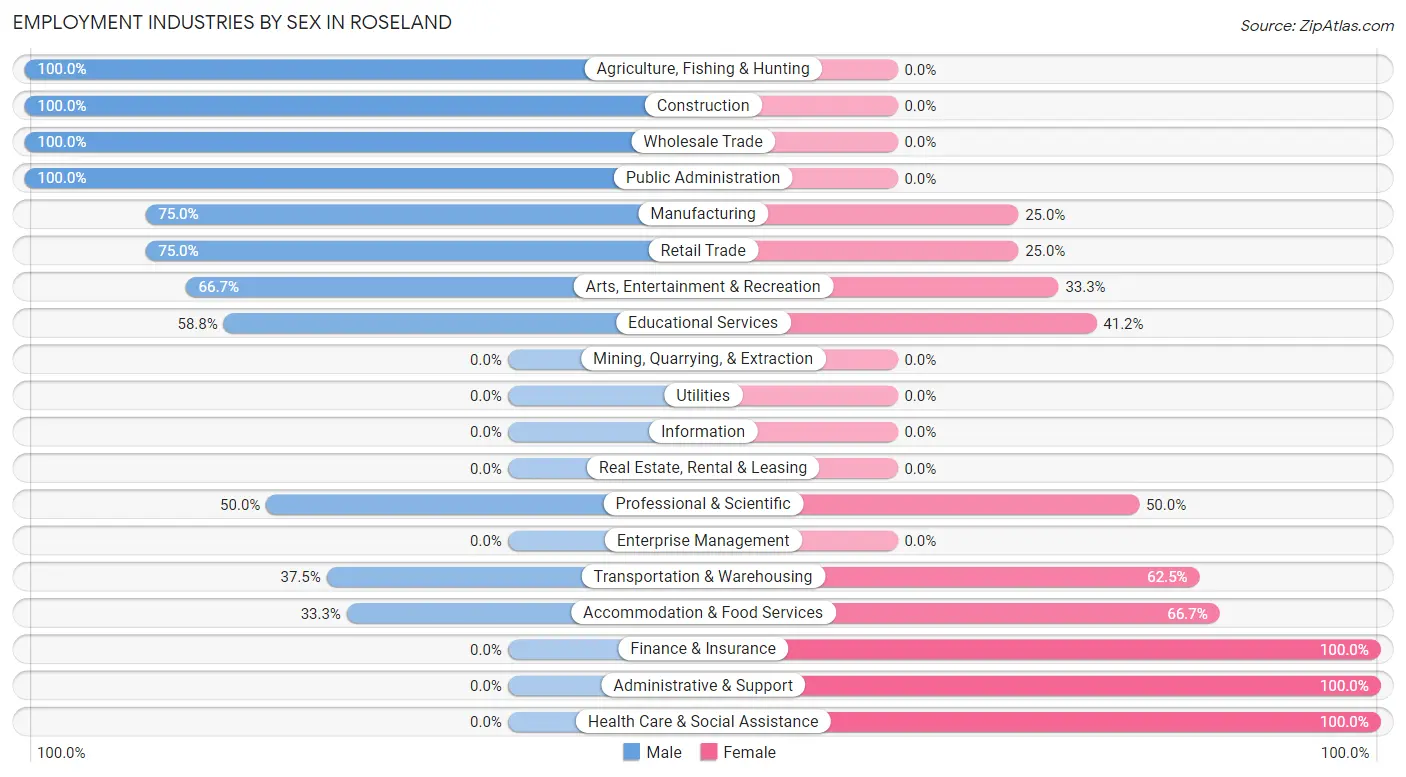
| Industry | Male | Female |
| Agriculture, Fishing & Hunting | 8 (100.0%) | 0 (0.0%) |
| Mining, Quarrying, & Extraction | 0 (0.0%) | 0 (0.0%) |
| Construction | 5 (100.0%) | 0 (0.0%) |
| Manufacturing | 12 (75.0%) | 4 (25.0%) |
| Wholesale Trade | 1 (100.0%) | 0 (0.0%) |
| Retail Trade | 6 (75.0%) | 2 (25.0%) |
| Transportation & Warehousing | 3 (37.5%) | 5 (62.5%) |
| Utilities | 0 (0.0%) | 0 (0.0%) |
| Information | 0 (0.0%) | 0 (0.0%) |
| Finance & Insurance | 0 (0.0%) | 2 (100.0%) |
| Real Estate, Rental & Leasing | 0 (0.0%) | 0 (0.0%) |
| Professional & Scientific | 4 (50.0%) | 4 (50.0%) |
| Enterprise Management | 0 (0.0%) | 0 (0.0%) |
| Administrative & Support | 0 (0.0%) | 1 (100.0%) |
| Educational Services | 10 (58.8%) | 7 (41.2%) |
| Health Care & Social Assistance | 0 (0.0%) | 16 (100.0%) |
| Arts, Entertainment & Recreation | 2 (66.7%) | 1 (33.3%) |
| Accommodation & Food Services | 2 (33.3%) | 4 (66.7%) |
| Public Administration | 2 (100.0%) | 0 (0.0%) |
| Total | 66 (55.5%) | 53 (44.5%) |
Education in Roseland
School Enrollment in Roseland
The most common levels of schooling among the 86 students in Roseland are middle school (34 | 39.5%), elementary school (32 | 37.2%), and high school (14 | 16.3%).
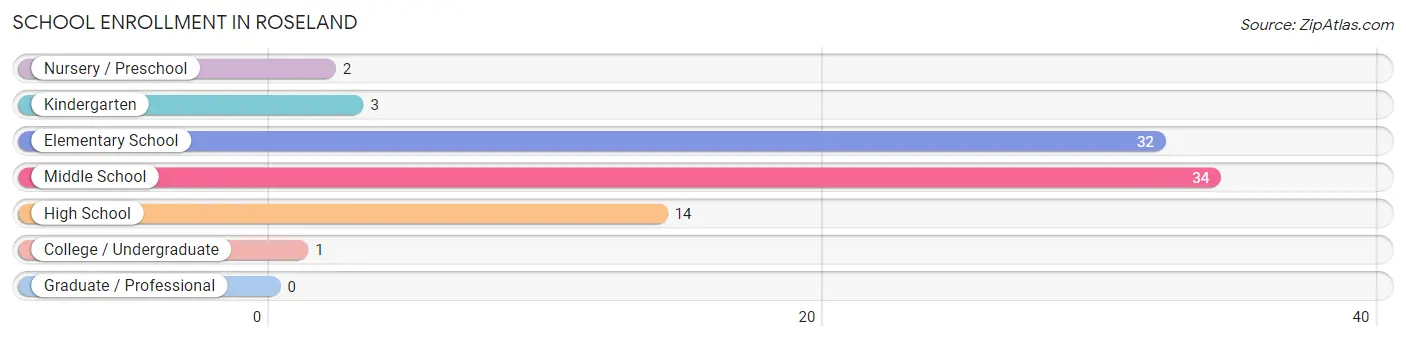
| School Level | # Students | % Students |
| Nursery / Preschool | 2 | 2.3% |
| Kindergarten | 3 | 3.5% |
| Elementary School | 32 | 37.2% |
| Middle School | 34 | 39.5% |
| High School | 14 | 16.3% |
| College / Undergraduate | 1 | 1.2% |
| Graduate / Professional | 0 | 0.0% |
| Total | 86 | 100.0% |
School Enrollment by Age by Funding Source in Roseland
Out of a total of 86 students who are enrolled in schools in Roseland, 9 (10.5%) attend a private institution, while the remaining 77 (89.5%) are enrolled in public schools. The age group of 3 to 4 year olds has the highest likelihood of being enrolled in private schools, with 1 (50.0% in the age bracket) enrolled. Conversely, the age group of 18 to 19 year olds has the lowest likelihood of being enrolled in a private school, with 3 (100.0% in the age bracket) attending a public institution.
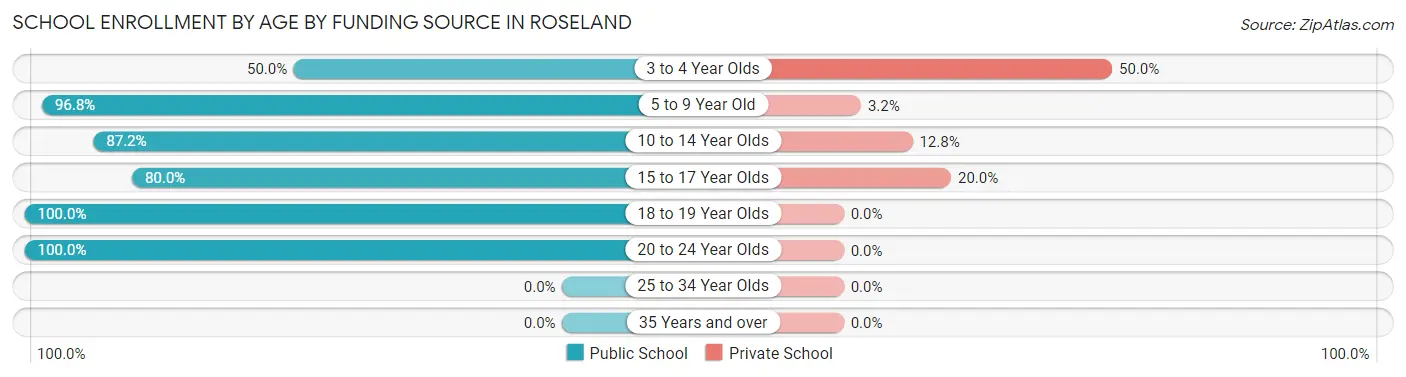
| Age Bracket | Public School | Private School |
| 3 to 4 Year Olds | 1 (50.0%) | 1 (50.0%) |
| 5 to 9 Year Old | 30 (96.8%) | 1 (3.2%) |
| 10 to 14 Year Olds | 34 (87.2%) | 5 (12.8%) |
| 15 to 17 Year Olds | 8 (80.0%) | 2 (20.0%) |
| 18 to 19 Year Olds | 3 (100.0%) | 0 (0.0%) |
| 20 to 24 Year Olds | 1 (100.0%) | 0 (0.0%) |
| 25 to 34 Year Olds | 0 (0.0%) | 0 (0.0%) |
| 35 Years and over | 0 (0.0%) | 0 (0.0%) |
| Total | 77 (89.5%) | 9 (10.5%) |
Educational Attainment by Field of Study in Roseland
Education (10 | 31.2%), science & technology (8 | 25.0%), business (5 | 15.6%), bio, nature & agricultural (4 | 12.5%), and physical & health sciences (3 | 9.4%) are the most common fields of study among 32 individuals in Roseland who have obtained a bachelor's degree or higher.
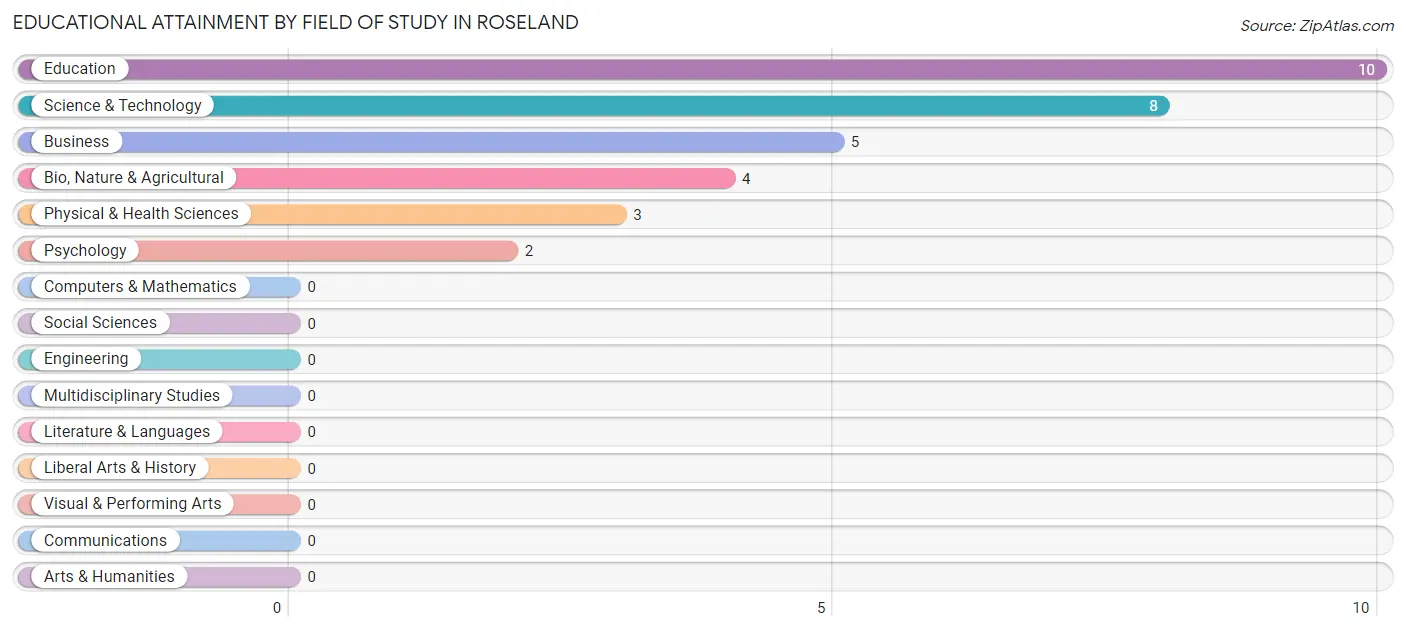
| Field of Study | # Graduates | % Graduates |
| Computers & Mathematics | 0 | 0.0% |
| Bio, Nature & Agricultural | 4 | 12.5% |
| Physical & Health Sciences | 3 | 9.4% |
| Psychology | 2 | 6.2% |
| Social Sciences | 0 | 0.0% |
| Engineering | 0 | 0.0% |
| Multidisciplinary Studies | 0 | 0.0% |
| Science & Technology | 8 | 25.0% |
| Business | 5 | 15.6% |
| Education | 10 | 31.2% |
| Literature & Languages | 0 | 0.0% |
| Liberal Arts & History | 0 | 0.0% |
| Visual & Performing Arts | 0 | 0.0% |
| Communications | 0 | 0.0% |
| Arts & Humanities | 0 | 0.0% |
| Total | 32 | 100.0% |
Transportation & Commute in Roseland
Vehicle Availability by Sex in Roseland
The most prevalent vehicle ownership categories in Roseland are males with 2 vehicles (25, accounting for 37.9%) and females with 2 vehicles (15, making up 48.1%).
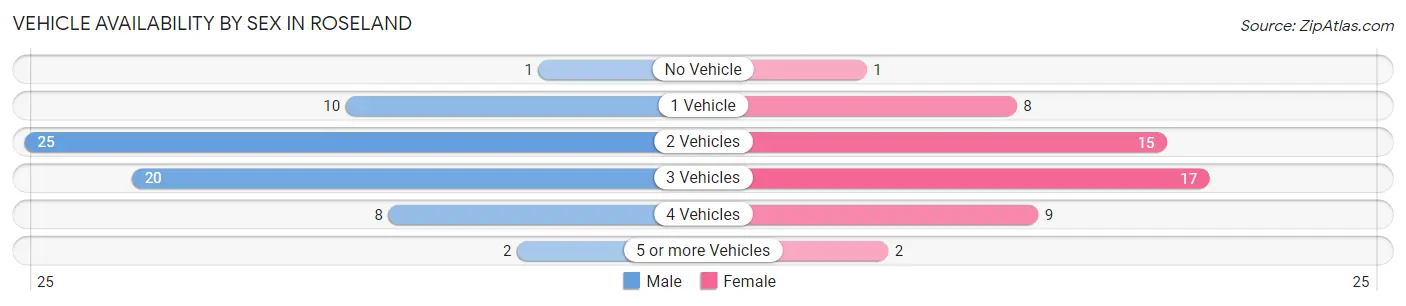
| Vehicles Available | Male | Female |
| No Vehicle | 1 (1.5%) | 1 (1.9%) |
| 1 Vehicle | 10 (15.1%) | 8 (15.4%) |
| 2 Vehicles | 25 (37.9%) | 15 (28.8%) |
| 3 Vehicles | 20 (30.3%) | 17 (32.7%) |
| 4 Vehicles | 8 (12.1%) | 9 (17.3%) |
| 5 or more Vehicles | 2 (3.0%) | 2 (3.8%) |
| Total | 66 (100.0%) | 52 (100.0%) |
Commute Time in Roseland
The most frequently occuring commute durations in Roseland are 20 to 24 minutes (31 commuters, 27.2%), 25 to 29 minutes (31 commuters, 27.2%), and 15 to 19 minutes (14 commuters, 12.3%).
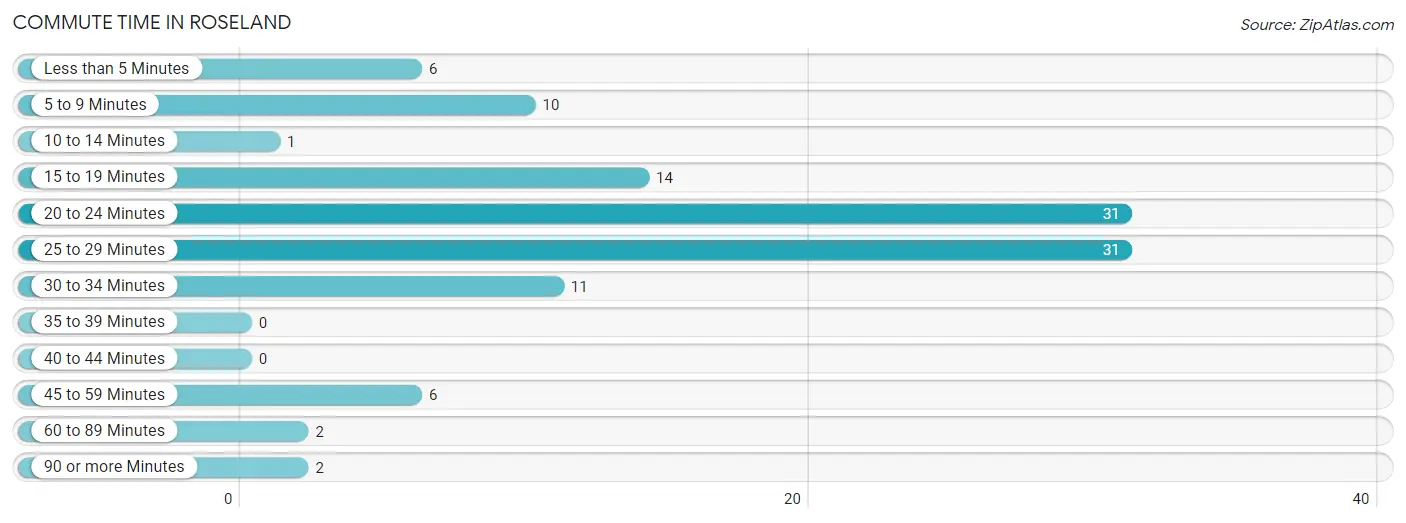
| Commute Time | # Commuters | % Commuters |
| Less than 5 Minutes | 6 | 5.3% |
| 5 to 9 Minutes | 10 | 8.8% |
| 10 to 14 Minutes | 1 | 0.9% |
| 15 to 19 Minutes | 14 | 12.3% |
| 20 to 24 Minutes | 31 | 27.2% |
| 25 to 29 Minutes | 31 | 27.2% |
| 30 to 34 Minutes | 11 | 9.7% |
| 35 to 39 Minutes | 0 | 0.0% |
| 40 to 44 Minutes | 0 | 0.0% |
| 45 to 59 Minutes | 6 | 5.3% |
| 60 to 89 Minutes | 2 | 1.8% |
| 90 or more Minutes | 2 | 1.8% |
Commute Time by Sex in Roseland
The most common commute times in Roseland are 20 to 24 minutes (14 commuters, 22.2%) for males and 20 to 24 minutes (17 commuters, 33.3%) for females.
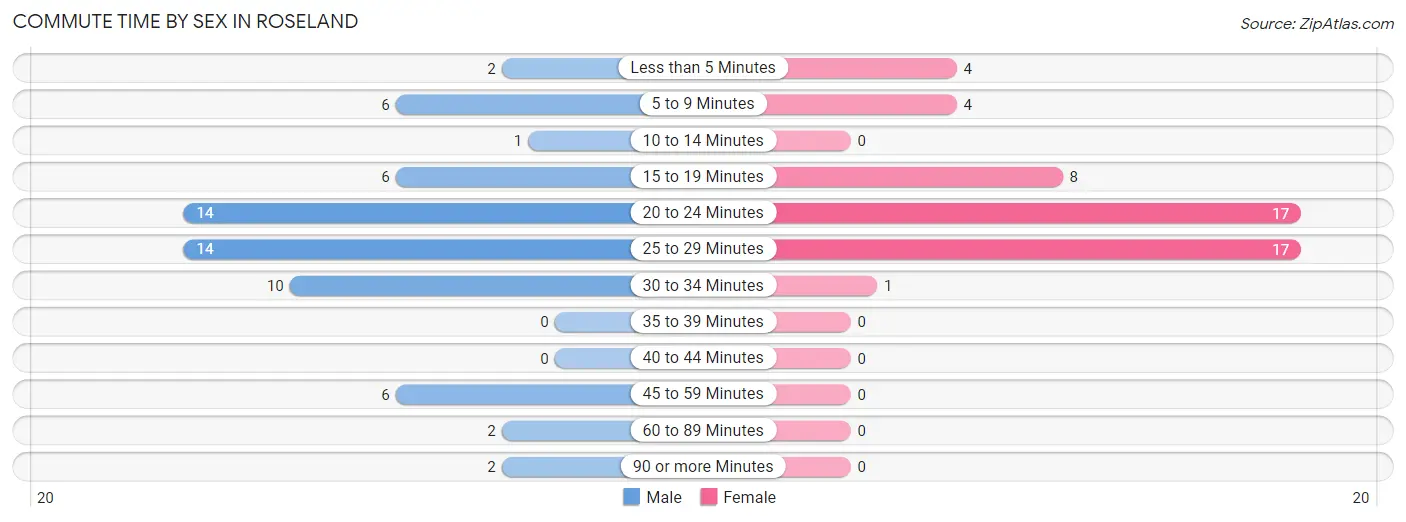
| Commute Time | Male | Female |
| Less than 5 Minutes | 2 (3.2%) | 4 (7.8%) |
| 5 to 9 Minutes | 6 (9.5%) | 4 (7.8%) |
| 10 to 14 Minutes | 1 (1.6%) | 0 (0.0%) |
| 15 to 19 Minutes | 6 (9.5%) | 8 (15.7%) |
| 20 to 24 Minutes | 14 (22.2%) | 17 (33.3%) |
| 25 to 29 Minutes | 14 (22.2%) | 17 (33.3%) |
| 30 to 34 Minutes | 10 (15.9%) | 1 (2.0%) |
| 35 to 39 Minutes | 0 (0.0%) | 0 (0.0%) |
| 40 to 44 Minutes | 0 (0.0%) | 0 (0.0%) |
| 45 to 59 Minutes | 6 (9.5%) | 0 (0.0%) |
| 60 to 89 Minutes | 2 (3.2%) | 0 (0.0%) |
| 90 or more Minutes | 2 (3.2%) | 0 (0.0%) |
Time of Departure to Work by Sex in Roseland
The most frequent times of departure to work in Roseland are 7:00 AM to 7:29 AM (12, 19.1%) for males and 7:30 AM to 7:59 AM (16, 31.4%) for females.
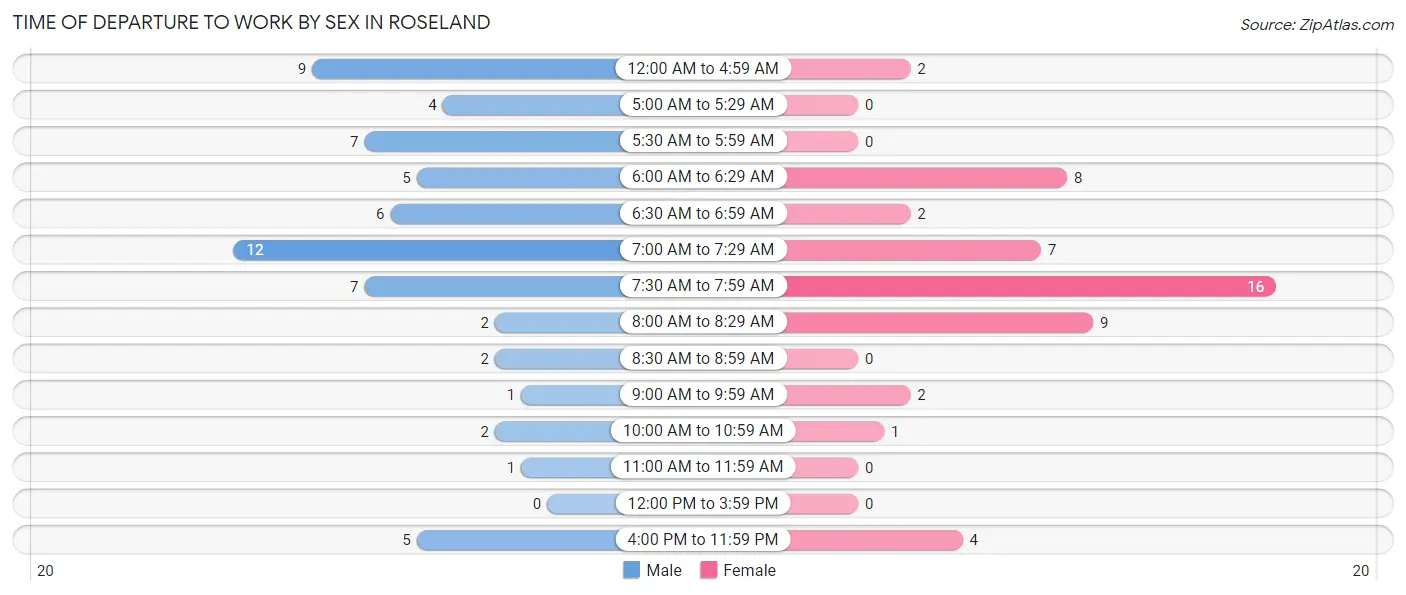
| Time of Departure | Male | Female |
| 12:00 AM to 4:59 AM | 9 (14.3%) | 2 (3.9%) |
| 5:00 AM to 5:29 AM | 4 (6.4%) | 0 (0.0%) |
| 5:30 AM to 5:59 AM | 7 (11.1%) | 0 (0.0%) |
| 6:00 AM to 6:29 AM | 5 (7.9%) | 8 (15.7%) |
| 6:30 AM to 6:59 AM | 6 (9.5%) | 2 (3.9%) |
| 7:00 AM to 7:29 AM | 12 (19.1%) | 7 (13.7%) |
| 7:30 AM to 7:59 AM | 7 (11.1%) | 16 (31.4%) |
| 8:00 AM to 8:29 AM | 2 (3.2%) | 9 (17.6%) |
| 8:30 AM to 8:59 AM | 2 (3.2%) | 0 (0.0%) |
| 9:00 AM to 9:59 AM | 1 (1.6%) | 2 (3.9%) |
| 10:00 AM to 10:59 AM | 2 (3.2%) | 1 (2.0%) |
| 11:00 AM to 11:59 AM | 1 (1.6%) | 0 (0.0%) |
| 12:00 PM to 3:59 PM | 0 (0.0%) | 0 (0.0%) |
| 4:00 PM to 11:59 PM | 5 (7.9%) | 4 (7.8%) |
| Total | 63 (100.0%) | 51 (100.0%) |
Housing Occupancy in Roseland
Occupancy by Ownership in Roseland
Of the total 96 dwellings in Roseland, owner-occupied units account for 85 (88.5%), while renter-occupied units make up 11 (11.5%).
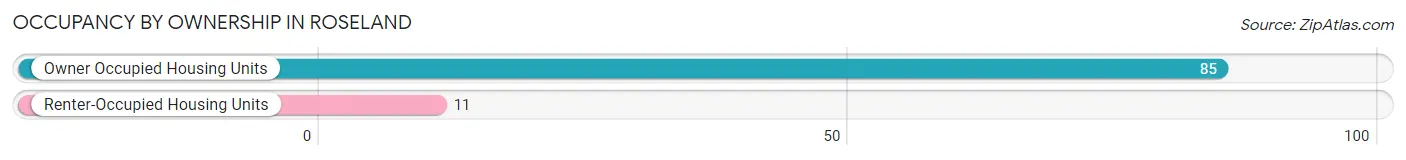
| Occupancy | # Housing Units | % Housing Units |
| Owner Occupied Housing Units | 85 | 88.5% |
| Renter-Occupied Housing Units | 11 | 11.5% |
| Total Occupied Housing Units | 96 | 100.0% |
Occupancy by Household Size in Roseland
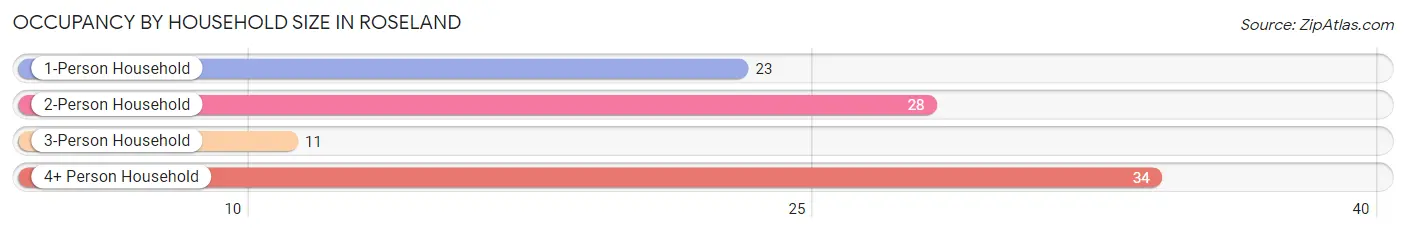
| Household Size | # Housing Units | % Housing Units |
| 1-Person Household | 23 | 24.0% |
| 2-Person Household | 28 | 29.2% |
| 3-Person Household | 11 | 11.5% |
| 4+ Person Household | 34 | 35.4% |
| Total Housing Units | 96 | 100.0% |
Occupancy by Ownership by Household Size in Roseland
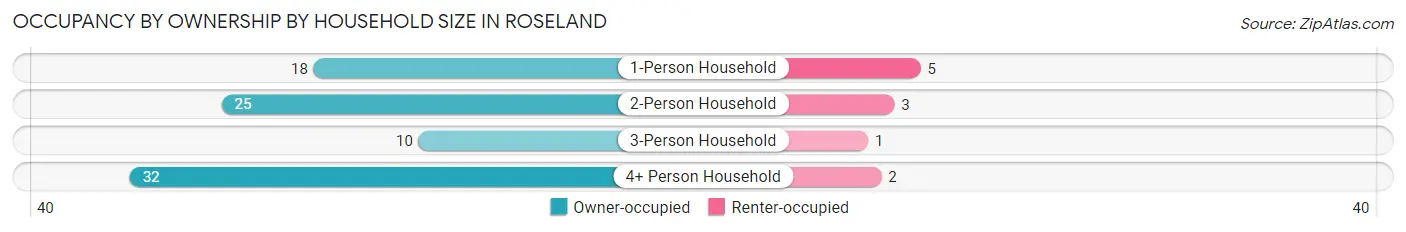
| Household Size | Owner-occupied | Renter-occupied |
| 1-Person Household | 18 (78.3%) | 5 (21.7%) |
| 2-Person Household | 25 (89.3%) | 3 (10.7%) |
| 3-Person Household | 10 (90.9%) | 1 (9.1%) |
| 4+ Person Household | 32 (94.1%) | 2 (5.9%) |
| Total Housing Units | 85 (88.5%) | 11 (11.5%) |
Occupancy by Educational Attainment in Roseland
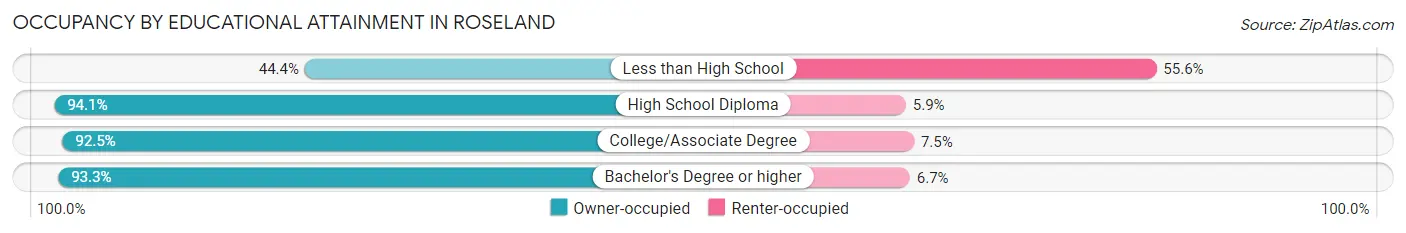
| Household Size | Owner-occupied | Renter-occupied |
| Less than High School | 4 (44.4%) | 5 (55.6%) |
| High School Diploma | 16 (94.1%) | 1 (5.9%) |
| College/Associate Degree | 37 (92.5%) | 3 (7.5%) |
| Bachelor's Degree or higher | 28 (93.3%) | 2 (6.7%) |
Occupancy by Age of Householder in Roseland
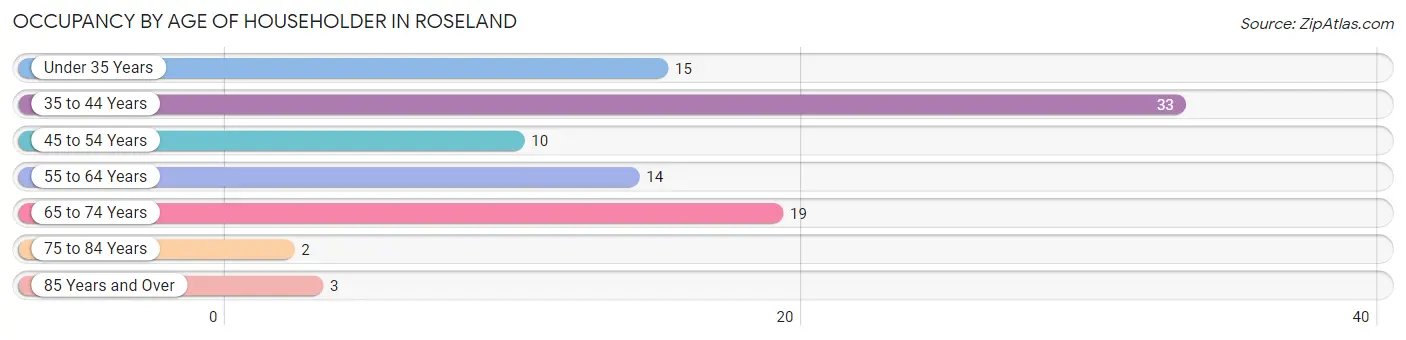
| Age Bracket | # Households | % Households |
| Under 35 Years | 15 | 15.6% |
| 35 to 44 Years | 33 | 34.4% |
| 45 to 54 Years | 10 | 10.4% |
| 55 to 64 Years | 14 | 14.6% |
| 65 to 74 Years | 19 | 19.8% |
| 75 to 84 Years | 2 | 2.1% |
| 85 Years and Over | 3 | 3.1% |
| Total | 96 | 100.0% |
Housing Finances in Roseland
Median Income by Occupancy in Roseland
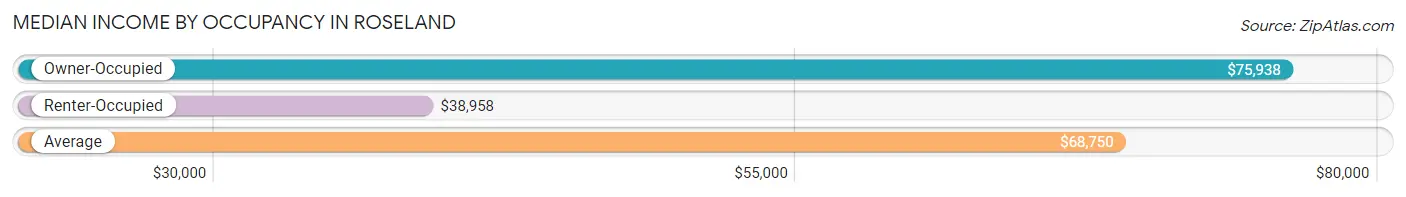
| Occupancy Type | # Households | Median Income |
| Owner-Occupied | 85 (88.5%) | $75,938 |
| Renter-Occupied | 11 (11.5%) | $38,958 |
| Average | 96 (100.0%) | $68,750 |
Occupancy by Householder Income Bracket in Roseland
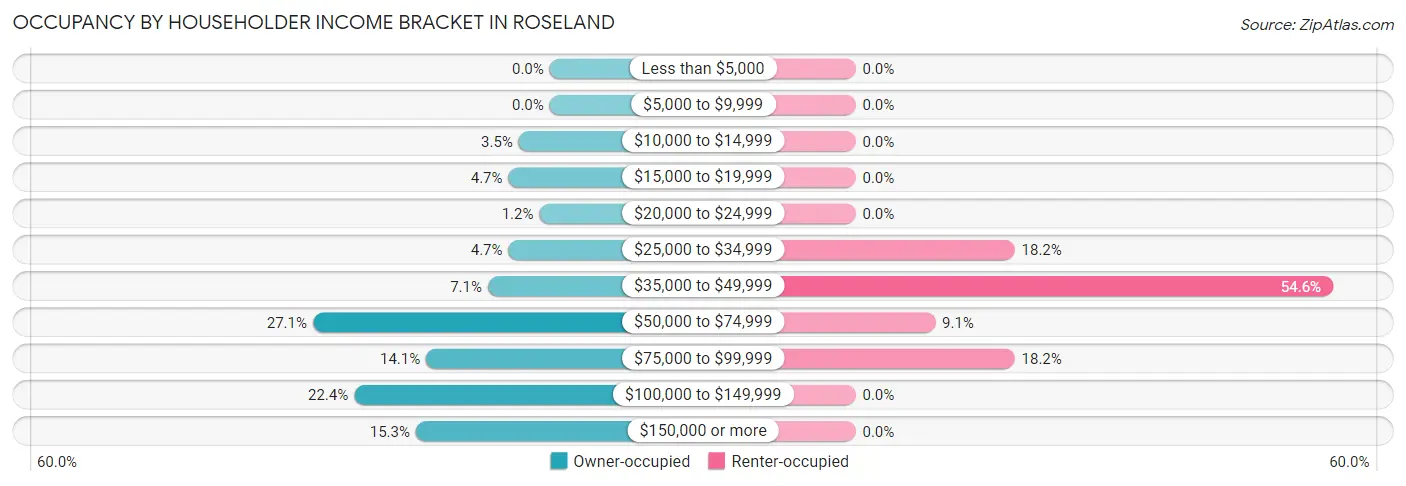
| Income Bracket | Owner-occupied | Renter-occupied |
| Less than $5,000 | 0 (0.0%) | 0 (0.0%) |
| $5,000 to $9,999 | 0 (0.0%) | 0 (0.0%) |
| $10,000 to $14,999 | 3 (3.5%) | 0 (0.0%) |
| $15,000 to $19,999 | 4 (4.7%) | 0 (0.0%) |
| $20,000 to $24,999 | 1 (1.2%) | 0 (0.0%) |
| $25,000 to $34,999 | 4 (4.7%) | 2 (18.2%) |
| $35,000 to $49,999 | 6 (7.1%) | 6 (54.5%) |
| $50,000 to $74,999 | 23 (27.1%) | 1 (9.1%) |
| $75,000 to $99,999 | 12 (14.1%) | 2 (18.2%) |
| $100,000 to $149,999 | 19 (22.4%) | 0 (0.0%) |
| $150,000 or more | 13 (15.3%) | 0 (0.0%) |
| Total | 85 (100.0%) | 11 (100.0%) |
Monthly Housing Cost Tiers in Roseland
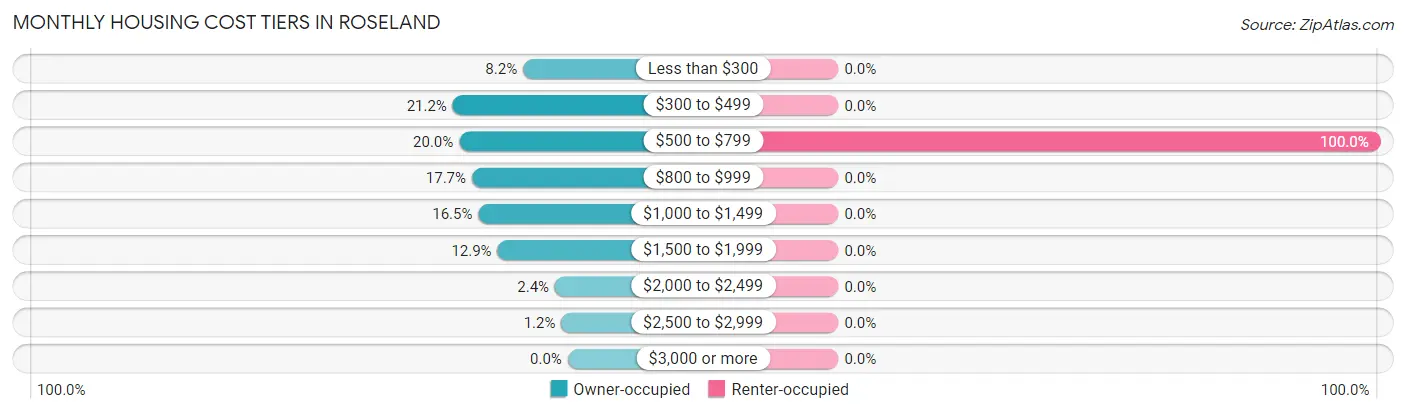
| Monthly Cost | Owner-occupied | Renter-occupied |
| Less than $300 | 7 (8.2%) | 0 (0.0%) |
| $300 to $499 | 18 (21.2%) | 0 (0.0%) |
| $500 to $799 | 17 (20.0%) | 11 (100.0%) |
| $800 to $999 | 15 (17.6%) | 0 (0.0%) |
| $1,000 to $1,499 | 14 (16.5%) | 0 (0.0%) |
| $1,500 to $1,999 | 11 (12.9%) | 0 (0.0%) |
| $2,000 to $2,499 | 2 (2.4%) | 0 (0.0%) |
| $2,500 to $2,999 | 1 (1.2%) | 0 (0.0%) |
| $3,000 or more | 0 (0.0%) | 0 (0.0%) |
| Total | 85 (100.0%) | 11 (100.0%) |
Physical Housing Characteristics in Roseland
Housing Structures in Roseland
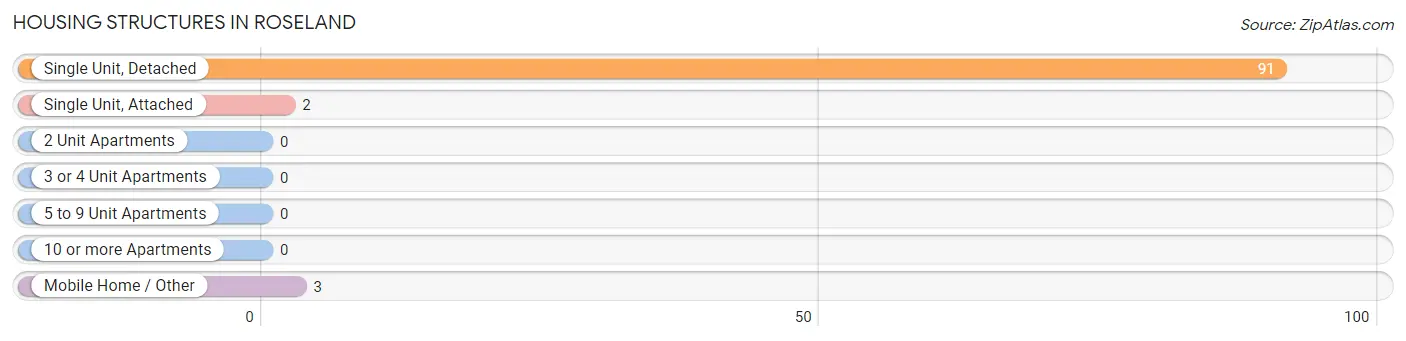
| Structure Type | # Housing Units | % Housing Units |
| Single Unit, Detached | 91 | 94.8% |
| Single Unit, Attached | 2 | 2.1% |
| 2 Unit Apartments | 0 | 0.0% |
| 3 or 4 Unit Apartments | 0 | 0.0% |
| 5 to 9 Unit Apartments | 0 | 0.0% |
| 10 or more Apartments | 0 | 0.0% |
| Mobile Home / Other | 3 | 3.1% |
| Total | 96 | 100.0% |
Housing Structures by Occupancy in Roseland
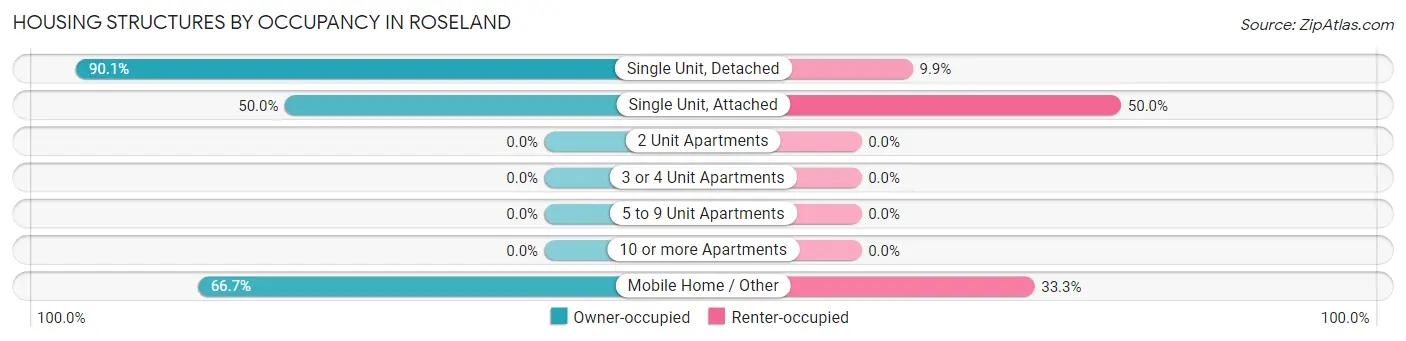
| Structure Type | Owner-occupied | Renter-occupied |
| Single Unit, Detached | 82 (90.1%) | 9 (9.9%) |
| Single Unit, Attached | 1 (50.0%) | 1 (50.0%) |
| 2 Unit Apartments | 0 (0.0%) | 0 (0.0%) |
| 3 or 4 Unit Apartments | 0 (0.0%) | 0 (0.0%) |
| 5 to 9 Unit Apartments | 0 (0.0%) | 0 (0.0%) |
| 10 or more Apartments | 0 (0.0%) | 0 (0.0%) |
| Mobile Home / Other | 2 (66.7%) | 1 (33.3%) |
| Total | 85 (88.5%) | 11 (11.5%) |
Housing Structures by Number of Rooms in Roseland
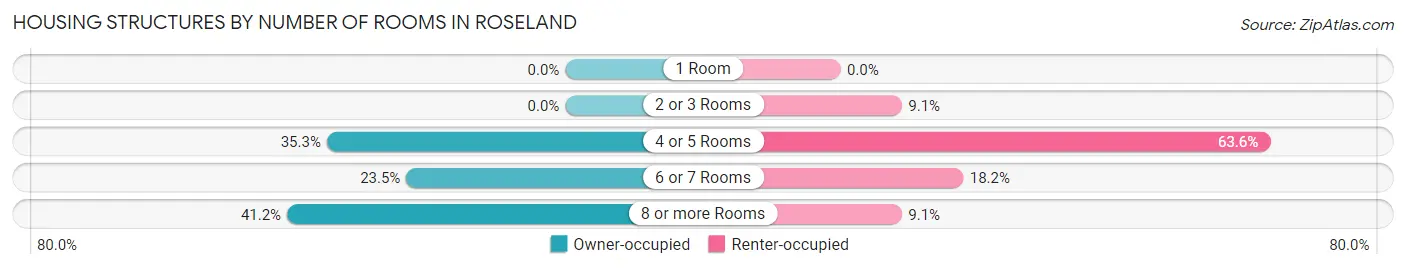
| Number of Rooms | Owner-occupied | Renter-occupied |
| 1 Room | 0 (0.0%) | 0 (0.0%) |
| 2 or 3 Rooms | 0 (0.0%) | 1 (9.1%) |
| 4 or 5 Rooms | 30 (35.3%) | 7 (63.6%) |
| 6 or 7 Rooms | 20 (23.5%) | 2 (18.2%) |
| 8 or more Rooms | 35 (41.2%) | 1 (9.1%) |
| Total | 85 (100.0%) | 11 (100.0%) |
Housing Structure by Heating Type in Roseland
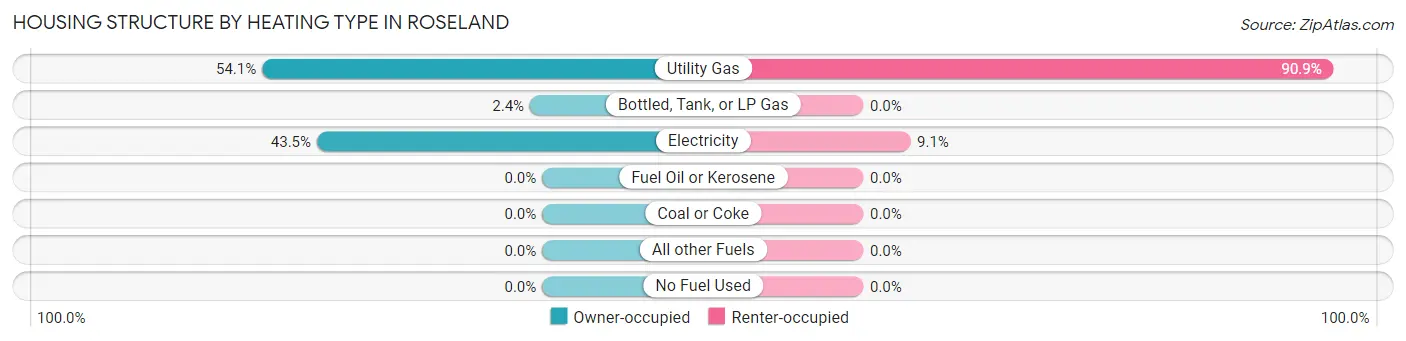
| Heating Type | Owner-occupied | Renter-occupied |
| Utility Gas | 46 (54.1%) | 10 (90.9%) |
| Bottled, Tank, or LP Gas | 2 (2.4%) | 0 (0.0%) |
| Electricity | 37 (43.5%) | 1 (9.1%) |
| Fuel Oil or Kerosene | 0 (0.0%) | 0 (0.0%) |
| Coal or Coke | 0 (0.0%) | 0 (0.0%) |
| All other Fuels | 0 (0.0%) | 0 (0.0%) |
| No Fuel Used | 0 (0.0%) | 0 (0.0%) |
| Total | 85 (100.0%) | 11 (100.0%) |
Household Vehicle Usage in Roseland
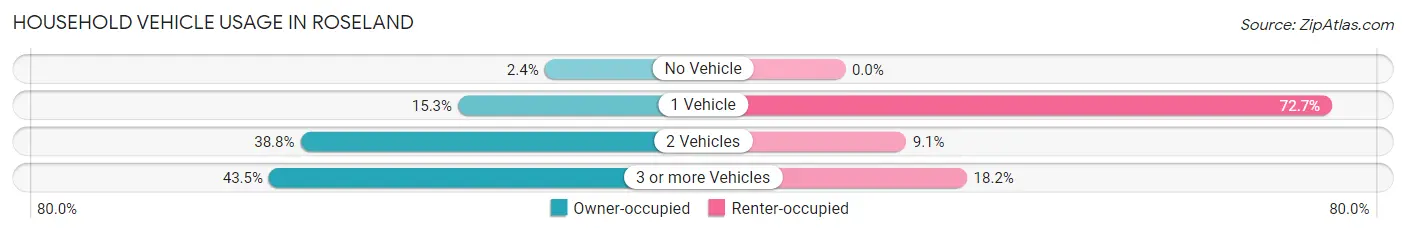
| Vehicles per Household | Owner-occupied | Renter-occupied |
| No Vehicle | 2 (2.4%) | 0 (0.0%) |
| 1 Vehicle | 13 (15.3%) | 8 (72.7%) |
| 2 Vehicles | 33 (38.8%) | 1 (9.1%) |
| 3 or more Vehicles | 37 (43.5%) | 2 (18.2%) |
| Total | 85 (100.0%) | 11 (100.0%) |
Real Estate & Mortgages in Roseland
Real Estate and Mortgage Overview in Roseland
| Characteristic | Without Mortgage | With Mortgage |
| Housing Units | 40 | 45 |
| Median Property Value | $120,800 | $143,800 |
| Median Household Income | $60,000 | $8 |
| Monthly Housing Costs | $400 | $0 |
| Real Estate Taxes | $1,571 | $7 |
Property Value by Mortgage Status in Roseland
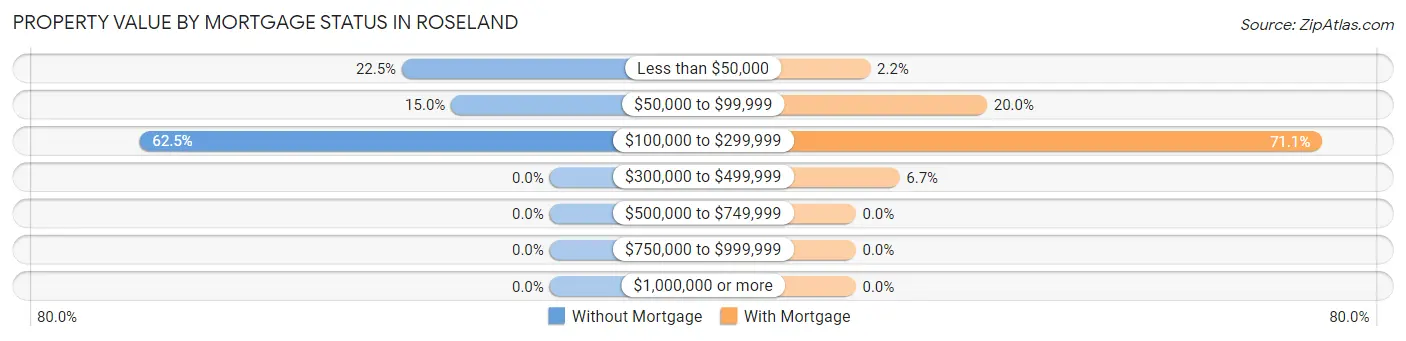
| Property Value | Without Mortgage | With Mortgage |
| Less than $50,000 | 9 (22.5%) | 1 (2.2%) |
| $50,000 to $99,999 | 6 (15.0%) | 9 (20.0%) |
| $100,000 to $299,999 | 25 (62.5%) | 32 (71.1%) |
| $300,000 to $499,999 | 0 (0.0%) | 3 (6.7%) |
| $500,000 to $749,999 | 0 (0.0%) | 0 (0.0%) |
| $750,000 to $999,999 | 0 (0.0%) | 0 (0.0%) |
| $1,000,000 or more | 0 (0.0%) | 0 (0.0%) |
| Total | 40 (100.0%) | 45 (100.0%) |
Household Income by Mortgage Status in Roseland
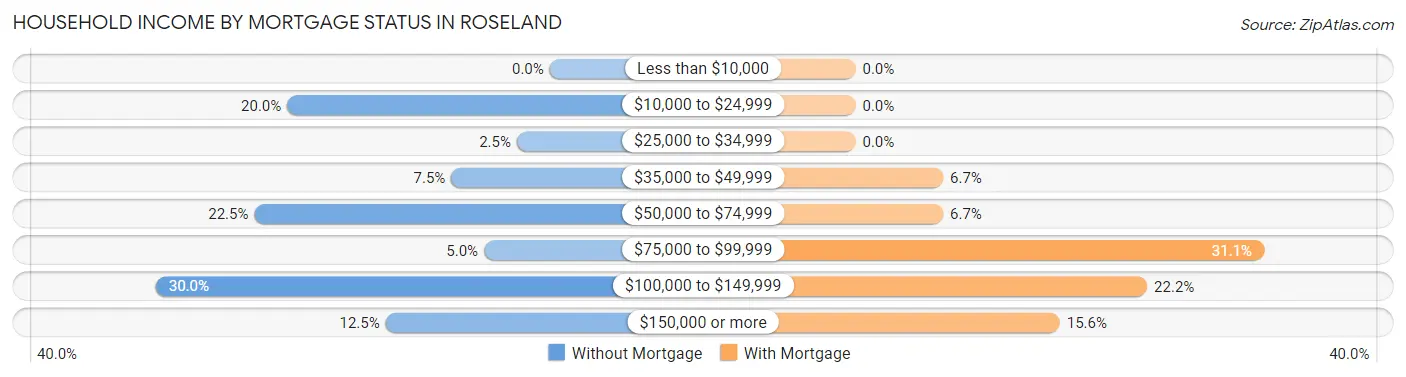
| Household Income | Without Mortgage | With Mortgage |
| Less than $10,000 | 0 (0.0%) | 0 (0.0%) |
| $10,000 to $24,999 | 8 (20.0%) | 0 (0.0%) |
| $25,000 to $34,999 | 1 (2.5%) | 0 (0.0%) |
| $35,000 to $49,999 | 3 (7.5%) | 3 (6.7%) |
| $50,000 to $74,999 | 9 (22.5%) | 3 (6.7%) |
| $75,000 to $99,999 | 2 (5.0%) | 14 (31.1%) |
| $100,000 to $149,999 | 12 (30.0%) | 10 (22.2%) |
| $150,000 or more | 5 (12.5%) | 7 (15.6%) |
| Total | 40 (100.0%) | 45 (100.0%) |
Property Value to Household Income Ratio in Roseland
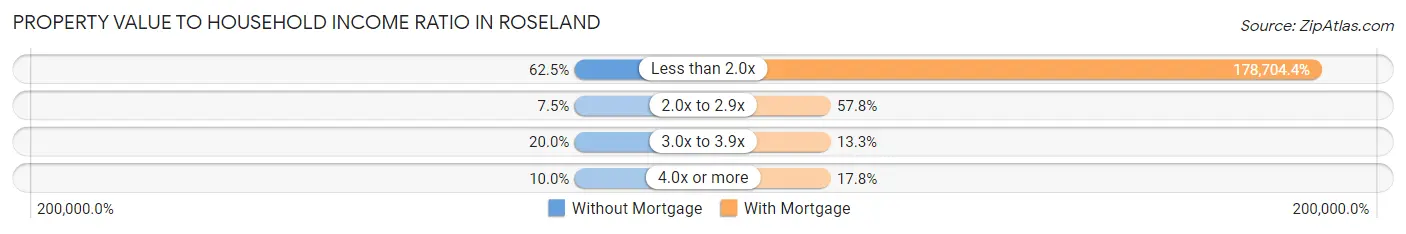
| Value-to-Income Ratio | Without Mortgage | With Mortgage |
| Less than 2.0x | 25 (62.5%) | 80,417 (178,704.4%) |
| 2.0x to 2.9x | 3 (7.5%) | 26 (57.8%) |
| 3.0x to 3.9x | 8 (20.0%) | 6 (13.3%) |
| 4.0x or more | 4 (10.0%) | 8 (17.8%) |
| Total | 40 (100.0%) | 45 (100.0%) |
Real Estate Taxes by Mortgage Status in Roseland
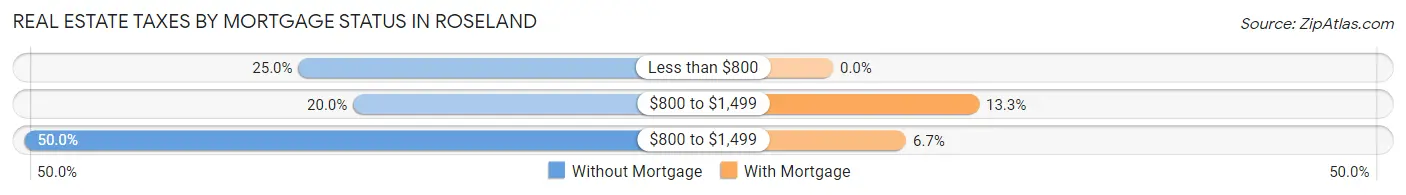
| Property Taxes | Without Mortgage | With Mortgage |
| Less than $800 | 10 (25.0%) | 0 (0.0%) |
| $800 to $1,499 | 8 (20.0%) | 6 (13.3%) |
| $800 to $1,499 | 20 (50.0%) | 3 (6.7%) |
| Total | 40 (100.0%) | 45 (100.0%) |
Health & Disability in Roseland
Health Insurance Coverage by Age in Roseland
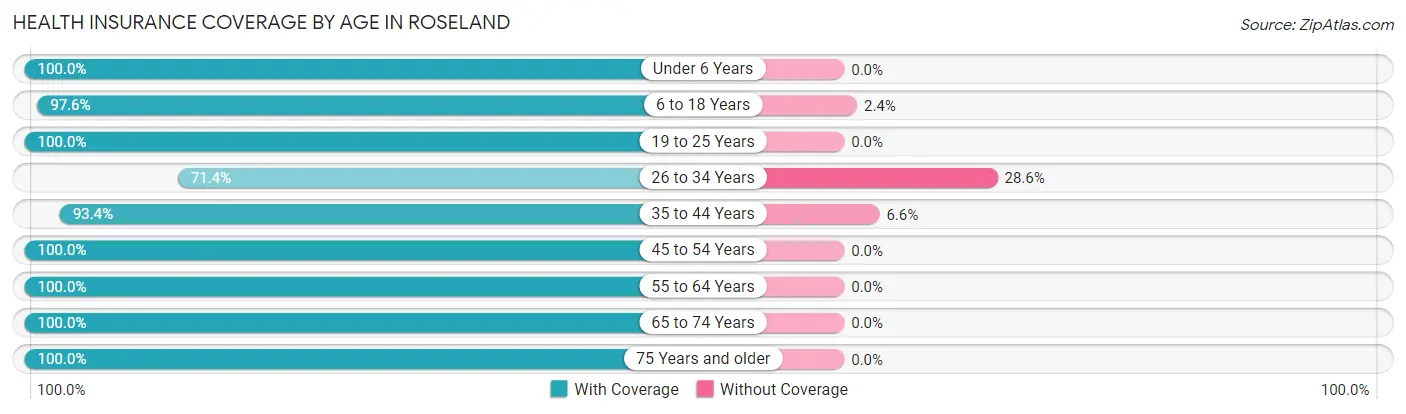
| Age Bracket | With Coverage | Without Coverage |
| Under 6 Years | 16 (100.0%) | 0 (0.0%) |
| 6 to 18 Years | 82 (97.6%) | 2 (2.4%) |
| 19 to 25 Years | 1 (100.0%) | 0 (0.0%) |
| 26 to 34 Years | 15 (71.4%) | 6 (28.6%) |
| 35 to 44 Years | 57 (93.4%) | 4 (6.6%) |
| 45 to 54 Years | 15 (100.0%) | 0 (0.0%) |
| 55 to 64 Years | 28 (100.0%) | 0 (0.0%) |
| 65 to 74 Years | 20 (100.0%) | 0 (0.0%) |
| 75 Years and older | 12 (100.0%) | 0 (0.0%) |
| Total | 246 (95.4%) | 12 (4.6%) |
Health Insurance Coverage by Citizenship Status in Roseland
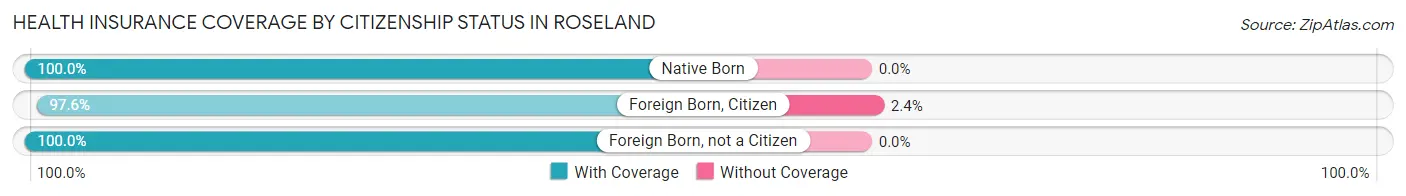
| Citizenship Status | With Coverage | Without Coverage |
| Native Born | 16 (100.0%) | 0 (0.0%) |
| Foreign Born, Citizen | 82 (97.6%) | 2 (2.4%) |
| Foreign Born, not a Citizen | 1 (100.0%) | 0 (0.0%) |
Health Insurance Coverage by Household Income in Roseland
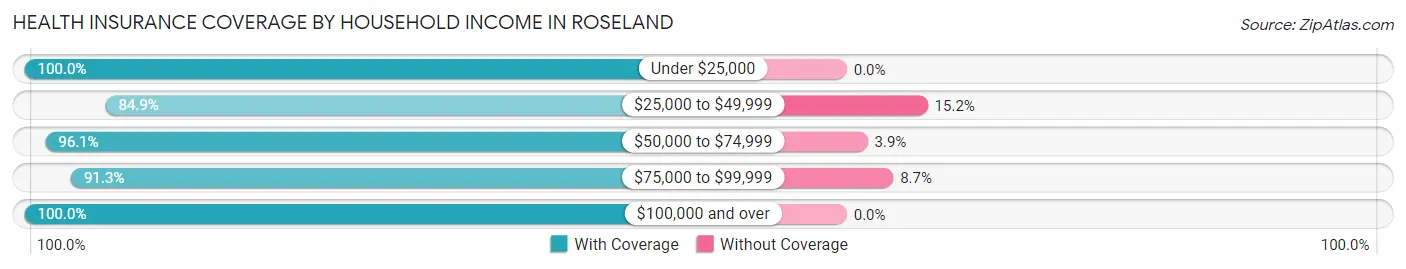
| Household Income | With Coverage | Without Coverage |
| Under $25,000 | 9 (100.0%) | 0 (0.0%) |
| $25,000 to $49,999 | 28 (84.9%) | 5 (15.1%) |
| $50,000 to $74,999 | 74 (96.1%) | 3 (3.9%) |
| $75,000 to $99,999 | 42 (91.3%) | 4 (8.7%) |
| $100,000 and over | 93 (100.0%) | 0 (0.0%) |
Public vs Private Health Insurance Coverage by Age in Roseland
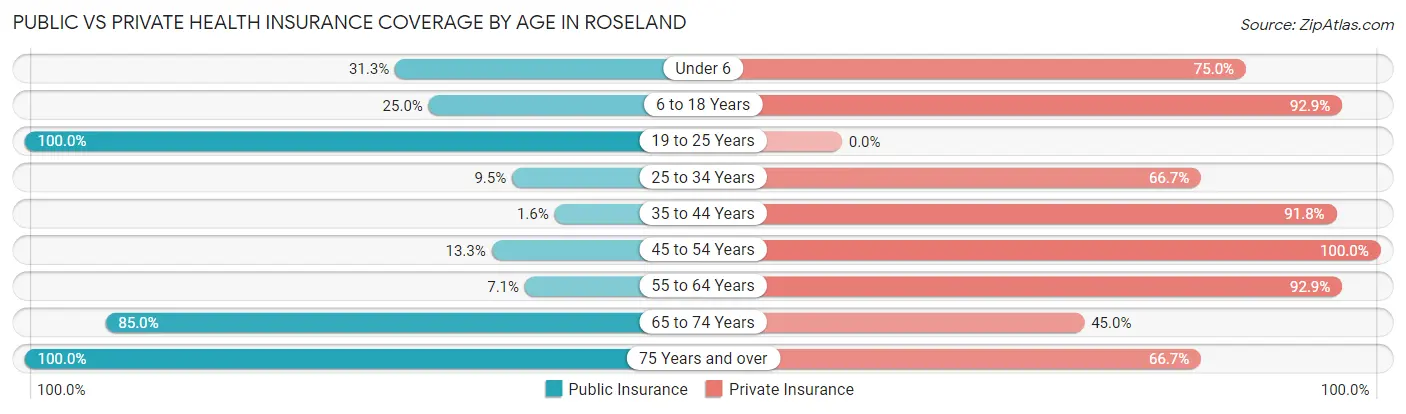
| Age Bracket | Public Insurance | Private Insurance |
| Under 6 | 5 (31.2%) | 12 (75.0%) |
| 6 to 18 Years | 21 (25.0%) | 78 (92.9%) |
| 19 to 25 Years | 1 (100.0%) | 0 (0.0%) |
| 25 to 34 Years | 2 (9.5%) | 14 (66.7%) |
| 35 to 44 Years | 1 (1.6%) | 56 (91.8%) |
| 45 to 54 Years | 2 (13.3%) | 15 (100.0%) |
| 55 to 64 Years | 2 (7.1%) | 26 (92.9%) |
| 65 to 74 Years | 17 (85.0%) | 9 (45.0%) |
| 75 Years and over | 12 (100.0%) | 8 (66.7%) |
| Total | 63 (24.4%) | 218 (84.5%) |
Disability Status by Sex by Age in Roseland
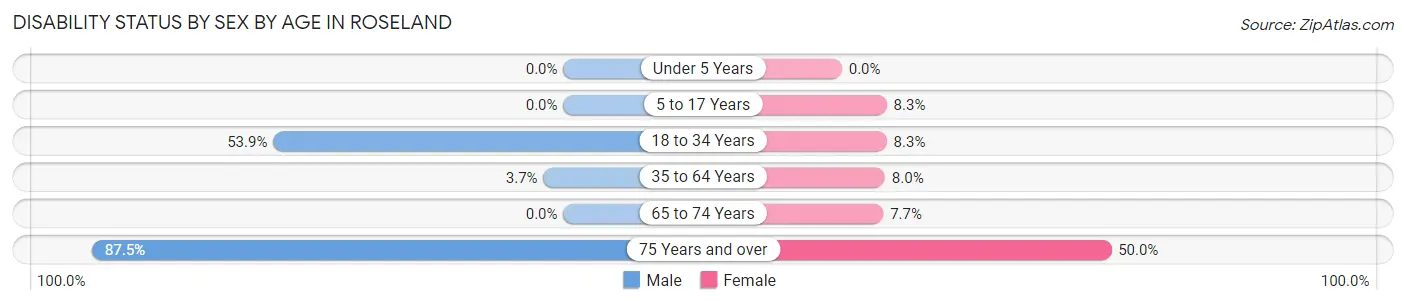
| Age Bracket | Male | Female |
| Under 5 Years | 0 (0.0%) | 0 (0.0%) |
| 5 to 17 Years | 0 (0.0%) | 2 (8.3%) |
| 18 to 34 Years | 7 (53.8%) | 1 (8.3%) |
| 35 to 64 Years | 2 (3.7%) | 4 (8.0%) |
| 65 to 74 Years | 0 (0.0%) | 1 (7.7%) |
| 75 Years and over | 7 (87.5%) | 2 (50.0%) |
Disability Class by Sex by Age in Roseland
Disability Class: Hearing Difficulty
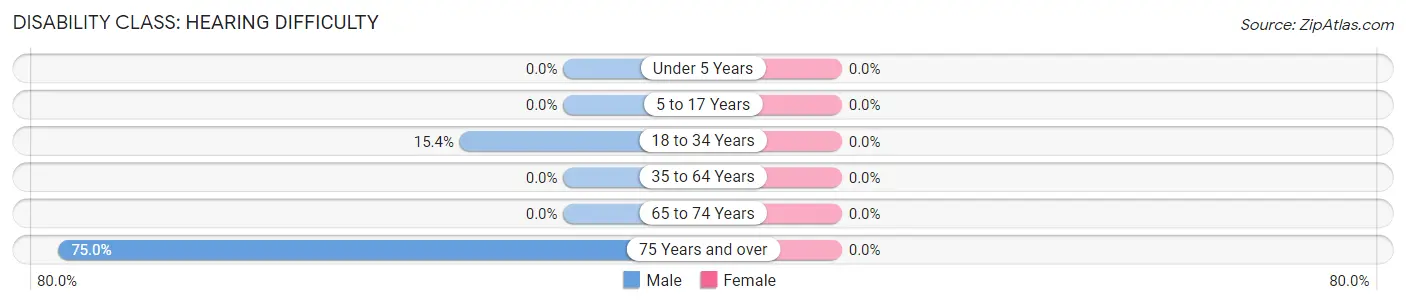
| Age Bracket | Male | Female |
| Under 5 Years | 0 (0.0%) | 0 (0.0%) |
| 5 to 17 Years | 0 (0.0%) | 0 (0.0%) |
| 18 to 34 Years | 2 (15.4%) | 0 (0.0%) |
| 35 to 64 Years | 0 (0.0%) | 0 (0.0%) |
| 65 to 74 Years | 0 (0.0%) | 0 (0.0%) |
| 75 Years and over | 6 (75.0%) | 0 (0.0%) |
Disability Class: Vision Difficulty
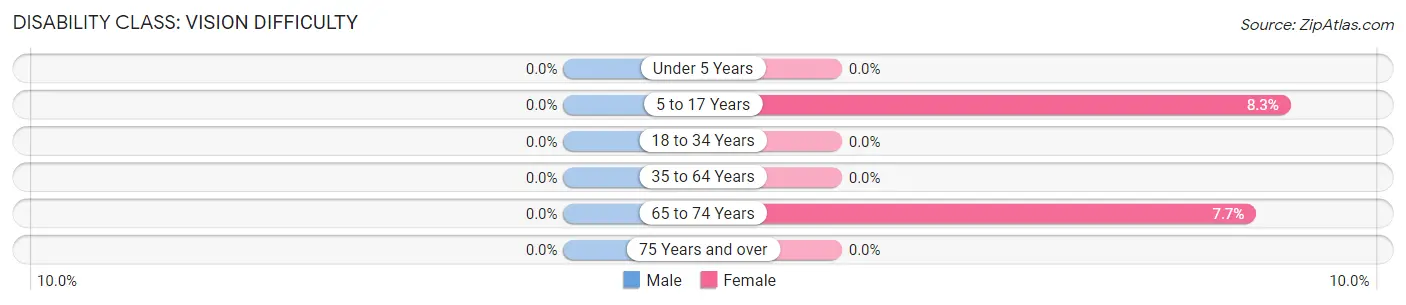
| Age Bracket | Male | Female |
| Under 5 Years | 0 (0.0%) | 0 (0.0%) |
| 5 to 17 Years | 0 (0.0%) | 2 (8.3%) |
| 18 to 34 Years | 0 (0.0%) | 0 (0.0%) |
| 35 to 64 Years | 0 (0.0%) | 0 (0.0%) |
| 65 to 74 Years | 0 (0.0%) | 1 (7.7%) |
| 75 Years and over | 0 (0.0%) | 0 (0.0%) |
Disability Class: Cognitive Difficulty
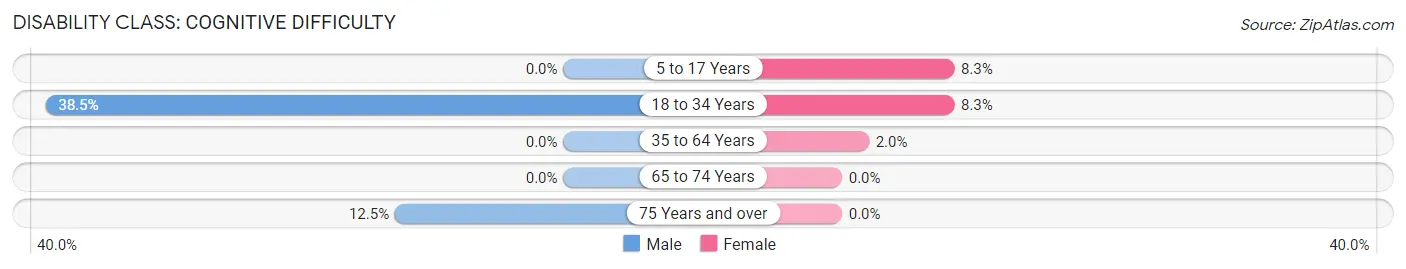
| Age Bracket | Male | Female |
| 5 to 17 Years | 0 (0.0%) | 2 (8.3%) |
| 18 to 34 Years | 5 (38.5%) | 1 (8.3%) |
| 35 to 64 Years | 0 (0.0%) | 1 (2.0%) |
| 65 to 74 Years | 0 (0.0%) | 0 (0.0%) |
| 75 Years and over | 1 (12.5%) | 0 (0.0%) |
Disability Class: Ambulatory Difficulty
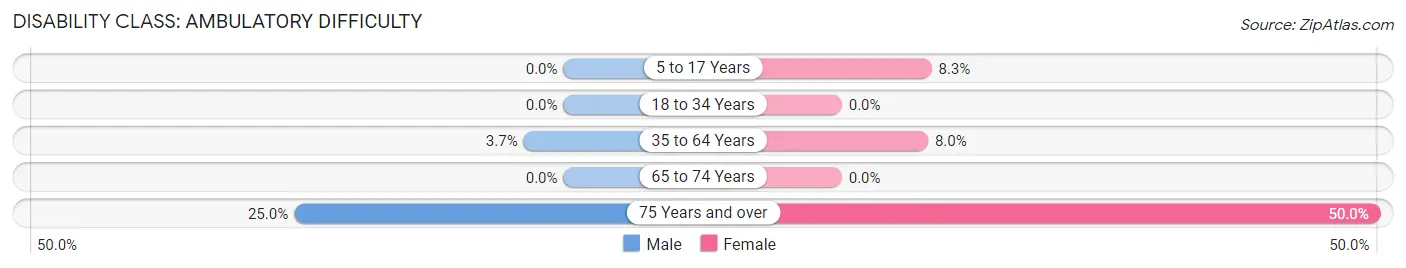
| Age Bracket | Male | Female |
| 5 to 17 Years | 0 (0.0%) | 2 (8.3%) |
| 18 to 34 Years | 0 (0.0%) | 0 (0.0%) |
| 35 to 64 Years | 2 (3.7%) | 4 (8.0%) |
| 65 to 74 Years | 0 (0.0%) | 0 (0.0%) |
| 75 Years and over | 2 (25.0%) | 2 (50.0%) |
Disability Class: Self-Care Difficulty
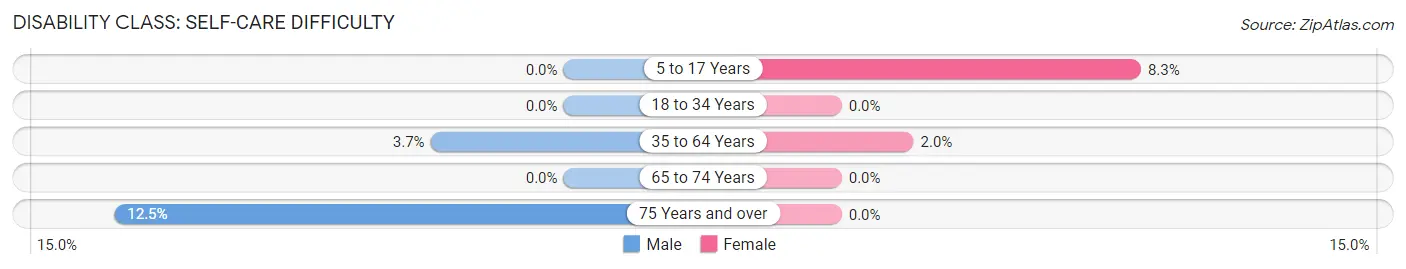
| Age Bracket | Male | Female |
| 5 to 17 Years | 0 (0.0%) | 2 (8.3%) |
| 18 to 34 Years | 0 (0.0%) | 0 (0.0%) |
| 35 to 64 Years | 2 (3.7%) | 1 (2.0%) |
| 65 to 74 Years | 0 (0.0%) | 0 (0.0%) |
| 75 Years and over | 1 (12.5%) | 0 (0.0%) |
Technology Access in Roseland
Computing Device Access in Roseland
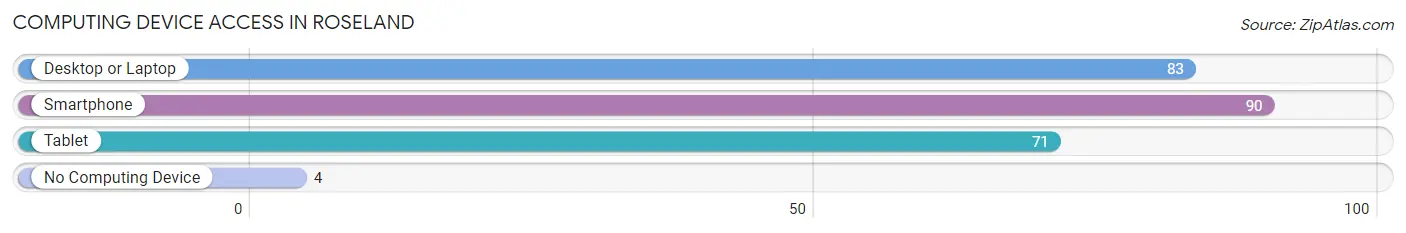
| Device Type | # Households | % Households |
| Desktop or Laptop | 83 | 86.5% |
| Smartphone | 90 | 93.8% |
| Tablet | 71 | 74.0% |
| No Computing Device | 4 | 4.2% |
| Total | 96 | 100.0% |
Internet Access in Roseland
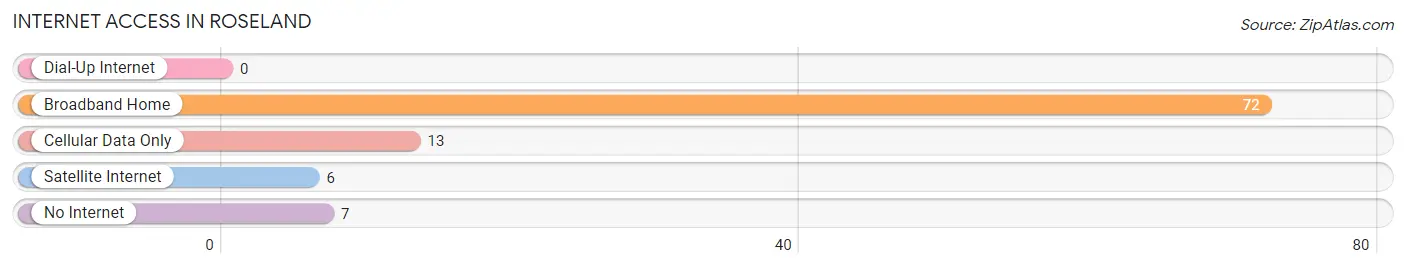
| Internet Type | # Households | % Households |
| Dial-Up Internet | 0 | 0.0% |
| Broadband Home | 72 | 75.0% |
| Cellular Data Only | 13 | 13.5% |
| Satellite Internet | 6 | 6.2% |
| No Internet | 7 | 7.3% |
| Total | 96 | 100.0% |
Roseland Summary
Roseland, Nebraska is a small village located in the southeastern corner of the state, in the county of Lancaster. It is situated on the banks of the Platte River, and is surrounded by rolling hills and farmland. The village has a population of just over 500 people, and is home to a variety of businesses, including a grocery store, a gas station, a post office, and a few restaurants.
History
Roseland was founded in 1871 by a group of settlers from the nearby town of Lincoln. The settlers were looking for a place to settle and farm, and chose the area due to its fertile soil and abundant water supply. The village was named after the wild roses that grew in abundance in the area.
The village grew slowly over the years, and by the early 1900s, it had become a thriving agricultural community. The village was home to a variety of businesses, including a general store, a blacksmith, a livery stable, and a hotel.
In the 1920s, the village began to experience a decline in population as many of the young people moved away to find work in larger cities. This trend continued until the 1950s, when the village began to experience a resurgence in population. This was due in part to the construction of a new bridge over the Platte River, which allowed for easier access to the village.
Geography
Roseland is located in the southeastern corner of Lancaster County, Nebraska. It is situated on the banks of the Platte River, and is surrounded by rolling hills and farmland. The village is located approximately 25 miles from the state capital of Lincoln.
The village is located at an elevation of 1,400 feet above sea level, and has an average annual temperature of 54 degrees Fahrenheit. The village receives an average of 28 inches of precipitation each year, with the majority of it falling in the form of snow.
Economy
The economy of Roseland is largely based on agriculture. The village is home to a variety of farms, which produce a variety of crops, including corn, soybeans, wheat, and hay. The village also has a few small businesses, including a grocery store, a gas station, a post office, and a few restaurants.
Demographics
As of the 2010 census, the population of Roseland was 514 people. The village is predominantly white, with 94.3% of the population identifying as such. The remaining 5.7% of the population is made up of African Americans, Native Americans, Asians, and other races.
The median household income in Roseland is $45,000, and the median age is 44 years old. The village has a high rate of homeownership, with 87.3% of the population owning their own homes.
Conclusion
Roseland, Nebraska is a small village located in the southeastern corner of the state, in the county of Lancaster. It is situated on the banks of the Platte River, and is surrounded by rolling hills and farmland. The village has a population of just over 500 people, and is home to a variety of businesses, including a grocery store, a gas station, a post office, and a few restaurants. The economy of Roseland is largely based on agriculture, and the village is predominantly white. The median household income in Roseland is $45,000, and the median age is 44 years old.
Common Questions
What is Per Capita Income in Roseland?
Per Capita income in Roseland is $30,306.
What is the Median Family Income in Roseland?
Median Family Income in Roseland is $88,750.
What is the Median Household income in Roseland?
Median Household Income in Roseland is $68,750.
What is Income or Wage Gap in Roseland?
Income or Wage Gap in Roseland is 48.0%.
Women in Roseland earn 52.0 cents for every dollar earned by a man.
What is Inequality or Gini Index in Roseland?
Inequality or Gini Index in Roseland is 0.32.
What is the Total Population of Roseland?
Total Population of Roseland is 258.
What is the Total Male Population of Roseland?
Total Male Population of Roseland is 151.
What is the Total Female Population of Roseland?
Total Female Population of Roseland is 107.
What is the Ratio of Males per 100 Females in Roseland?
There are 141.12 Males per 100 Females in Roseland.
What is the Ratio of Females per 100 Males in Roseland?
There are 70.86 Females per 100 Males in Roseland.
What is the Median Population Age in Roseland?
Median Population Age in Roseland is 37.3 Years.
What is the Average Family Size in Roseland
Average Family Size in Roseland is 3.2 People.
What is the Average Household Size in Roseland
Average Household Size in Roseland is 2.7 People.
How Large is the Labor Force in Roseland?
There are 120 People in the Labor Forcein in Roseland.
What is the Percentage of People in the Labor Force in Roseland?
72.3% of People are in the Labor Force in Roseland.
What is the Unemployment Rate in Roseland?
Unemployment Rate in Roseland is 0.8%.