West Harrison, IN Map & Demographics
West Harrison Map
West Harrison Overview
$22,791
PER CAPITA INCOME
$50,500
AVG FAMILY INCOME
$47,083
AVG HOUSEHOLD INCOME
4.4%
WAGE / INCOME GAP [ % ]
95.6¢/ $1
WAGE / INCOME GAP [ $ ]
0.30
INEQUALITY / GINI INDEX
322
TOTAL POPULATION
156
MALE POPULATION
166
FEMALE POPULATION
93.98
MALES / 100 FEMALES
106.41
FEMALES / 100 MALES
29.6
MEDIAN AGE
2.9
AVG FAMILY SIZE
2.2
AVG HOUSEHOLD SIZE
156
LABOR FORCE [ PEOPLE ]
63.9%
PERCENT IN LABOR FORCE
5.8%
UNEMPLOYMENT RATE
West Harrison Zip Codes
West Harrison Area Codes
Income in West Harrison
Income Overview in West Harrison
Per Capita Income in West Harrison is $22,791, while median incomes of families and households are $50,500 and $47,083 respectively.
| Characteristic | Number | Measure |
| Per Capita Income | 322 | $22,791 |
| Median Family Income | 68 | $50,500 |
| Mean Family Income | 68 | $59,766 |
| Median Household Income | 145 | $47,083 |
| Mean Household Income | 145 | $50,578 |
| Income Deficit | 68 | $0 |
| Wage / Income Gap (%) | 322 | 4.36% |
| Wage / Income Gap ($) | 322 | 95.64¢ per $1 |
| Gini / Inequality Index | 322 | 0.30 |
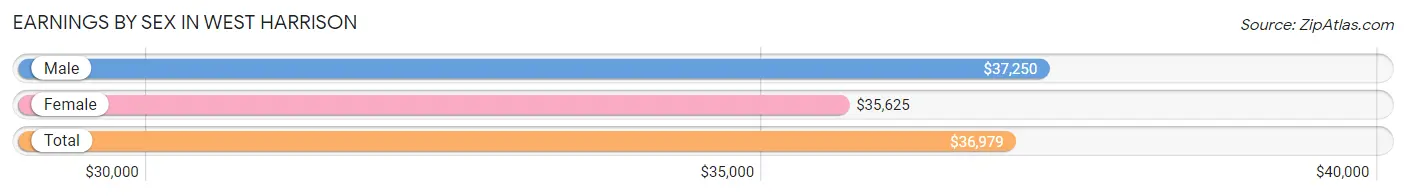
Earnings by Sex in West Harrison
Average Earnings in West Harrison are $36,979, $37,250 for men and $35,625 for women, a difference of 4.4%.
| Sex | Number | Average Earnings |
| Male | 94 (55.6%) | $37,250 |
| Female | 75 (44.4%) | $35,625 |
| Total | 169 (100.0%) | $36,979 |
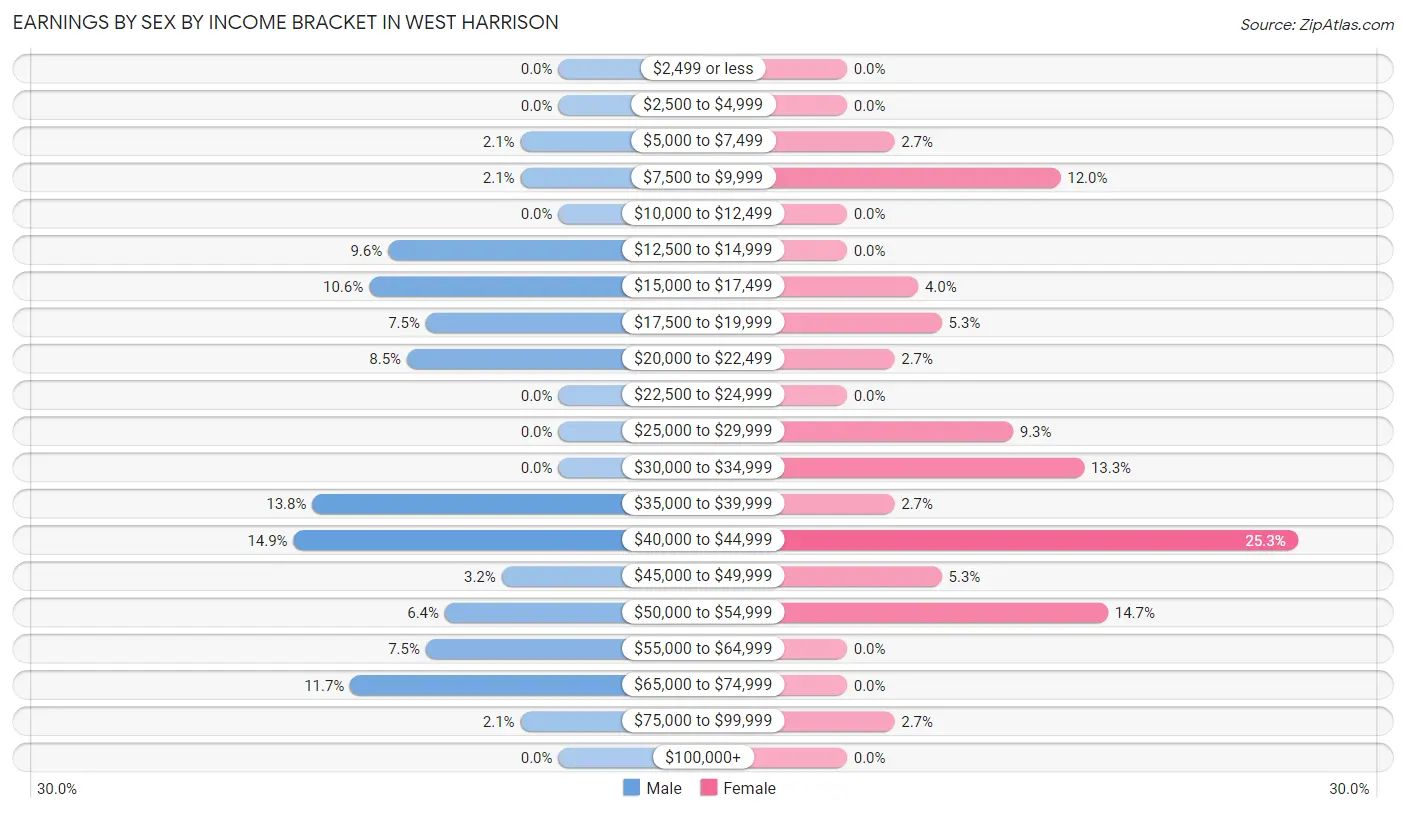
Earnings by Sex by Income Bracket in West Harrison
The most common earnings brackets in West Harrison are $40,000 to $44,999 for men (14 | 14.9%) and $40,000 to $44,999 for women (19 | 25.3%).
| Income | Male | Female |
| $2,499 or less | 0 (0.0%) | 0 (0.0%) |
| $2,500 to $4,999 | 0 (0.0%) | 0 (0.0%) |
| $5,000 to $7,499 | 2 (2.1%) | 2 (2.7%) |
| $7,500 to $9,999 | 2 (2.1%) | 9 (12.0%) |
| $10,000 to $12,499 | 0 (0.0%) | 0 (0.0%) |
| $12,500 to $14,999 | 9 (9.6%) | 0 (0.0%) |
| $15,000 to $17,499 | 10 (10.6%) | 3 (4.0%) |
| $17,500 to $19,999 | 7 (7.4%) | 4 (5.3%) |
| $20,000 to $22,499 | 8 (8.5%) | 2 (2.7%) |
| $22,500 to $24,999 | 0 (0.0%) | 0 (0.0%) |
| $25,000 to $29,999 | 0 (0.0%) | 7 (9.3%) |
| $30,000 to $34,999 | 0 (0.0%) | 10 (13.3%) |
| $35,000 to $39,999 | 13 (13.8%) | 2 (2.7%) |
| $40,000 to $44,999 | 14 (14.9%) | 19 (25.3%) |
| $45,000 to $49,999 | 3 (3.2%) | 4 (5.3%) |
| $50,000 to $54,999 | 6 (6.4%) | 11 (14.7%) |
| $55,000 to $64,999 | 7 (7.4%) | 0 (0.0%) |
| $65,000 to $74,999 | 11 (11.7%) | 0 (0.0%) |
| $75,000 to $99,999 | 2 (2.1%) | 2 (2.7%) |
| $100,000+ | 0 (0.0%) | 0 (0.0%) |
| Total | 94 (100.0%) | 75 (100.0%) |
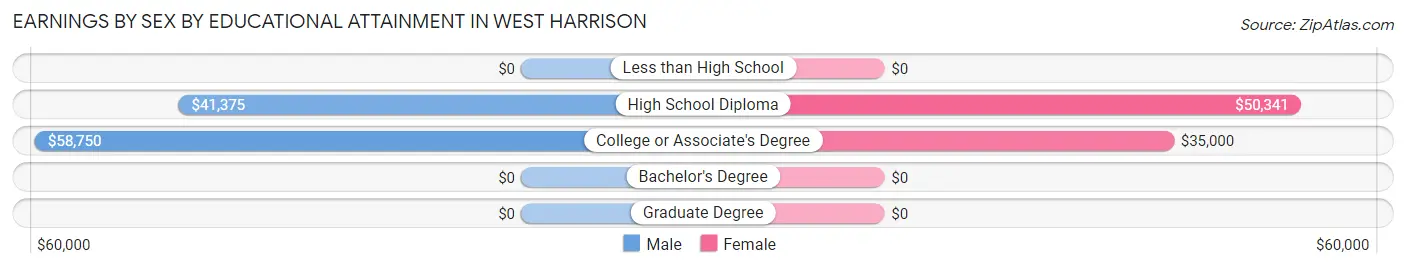
Earnings by Sex by Educational Attainment in West Harrison
Average earnings in West Harrison are $42,375 for men and $34,167 for women, a difference of 19.4%. Men with an educational attainment of college or associate's degree enjoy the highest average annual earnings of $58,750, while those with high school diploma education earn the least with $41,375. Women with an educational attainment of high school diploma earn the most with the average annual earnings of $50,341, while those with college or associate's degree education have the smallest earnings of $35,000.
| Educational Attainment | Male Income | Female Income |
| Less than High School | - | - |
| High School Diploma | $41,375 | $50,341 |
| College or Associate's Degree | $58,750 | $35,000 |
| Bachelor's Degree | - | - |
| Graduate Degree | - | - |
| Total | $42,375 | $34,167 |
Family Income in West Harrison
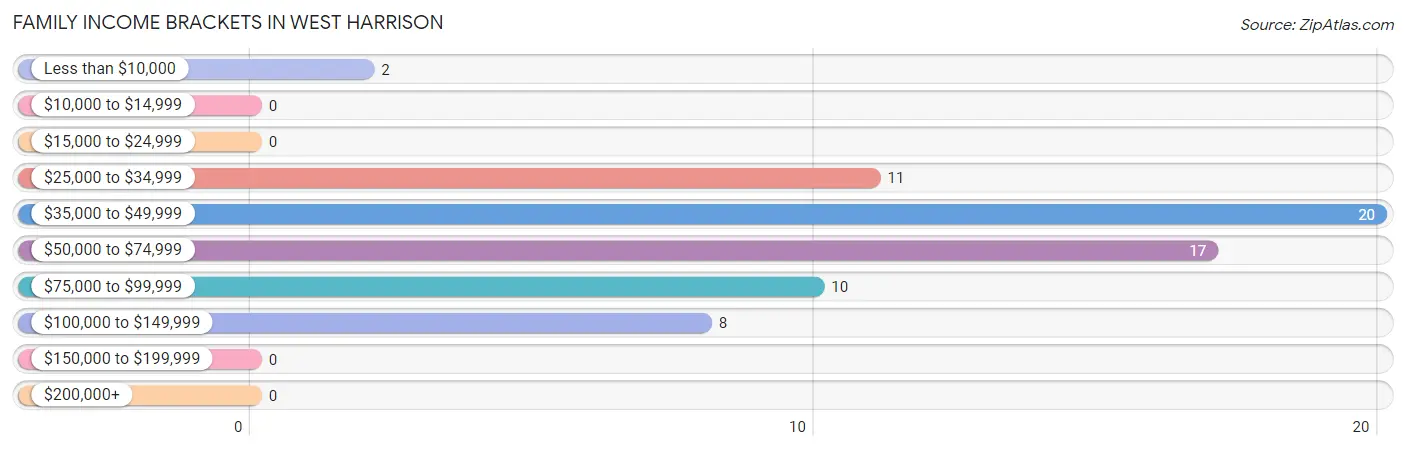
Family Income Brackets in West Harrison
According to the West Harrison family income data, there are 20 families falling into the $35,000 to $49,999 income range, which is the most common income bracket and makes up 29.4% of all families.
| Income Bracket | # Families | % Families |
| Less than $10,000 | 2 | 2.9% |
| $10,000 to $14,999 | 0 | 0.0% |
| $15,000 to $24,999 | 0 | 0.0% |
| $25,000 to $34,999 | 11 | 16.2% |
| $35,000 to $49,999 | 20 | 29.4% |
| $50,000 to $74,999 | 17 | 25.0% |
| $75,000 to $99,999 | 10 | 14.7% |
| $100,000 to $149,999 | 8 | 11.8% |
| $150,000 to $199,999 | 0 | 0.0% |
| $200,000+ | 0 | 0.0% |
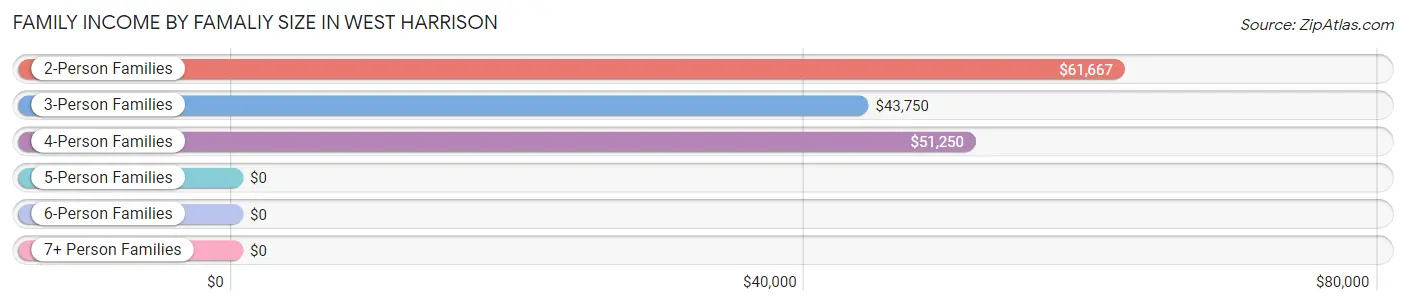
Family Income by Famaliy Size in West Harrison
2-person families (28 | 41.2%) account for the highest median family income in West Harrison with $61,667 per family, while 2-person families (28 | 41.2%) have the highest median income of $30,834 per family member.
| Income Bracket | # Families | Median Income |
| 2-Person Families | 28 (41.2%) | $61,667 |
| 3-Person Families | 29 (42.6%) | $43,750 |
| 4-Person Families | 9 (13.2%) | $51,250 |
| 5-Person Families | 2 (2.9%) | $0 |
| 6-Person Families | 0 (0.0%) | $0 |
| 7+ Person Families | 0 (0.0%) | $0 |
| Total | 68 (100.0%) | $50,500 |
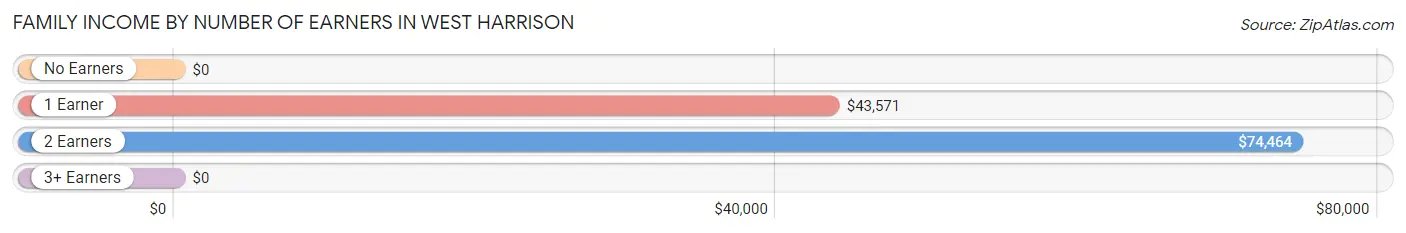
Family Income by Number of Earners in West Harrison
| Number of Earners | # Families | Median Income |
| No Earners | 5 (7.3%) | $0 |
| 1 Earner | 34 (50.0%) | $43,571 |
| 2 Earners | 29 (42.6%) | $74,464 |
| 3+ Earners | 0 (0.0%) | $0 |
| Total | 68 (100.0%) | $50,500 |
Household Income in West Harrison
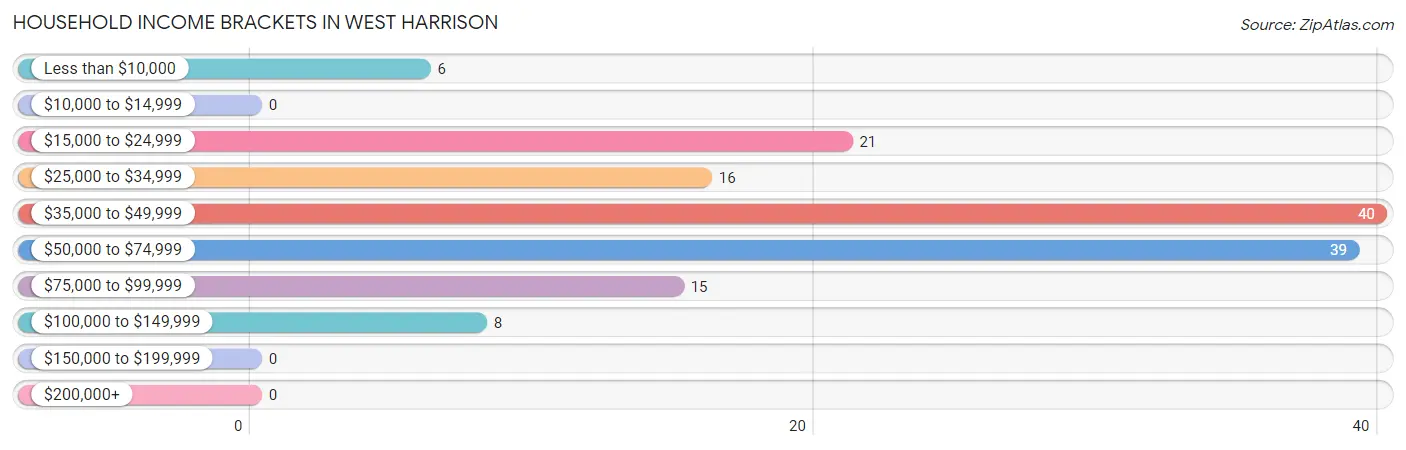
Household Income Brackets in West Harrison
With 40 households falling in the category, the $35,000 to $49,999 income range is the most frequent in West Harrison, accounting for 27.6% of all households.
| Income Bracket | # Households | % Households |
| Less than $10,000 | 6 | 4.1% |
| $10,000 to $14,999 | 0 | 0.0% |
| $15,000 to $24,999 | 21 | 14.5% |
| $25,000 to $34,999 | 16 | 11.0% |
| $35,000 to $49,999 | 40 | 27.6% |
| $50,000 to $74,999 | 39 | 26.9% |
| $75,000 to $99,999 | 15 | 10.3% |
| $100,000 to $149,999 | 8 | 5.5% |
| $150,000 to $199,999 | 0 | 0.0% |
| $200,000+ | 0 | 0.0% |
Household Income by Householder Age in West Harrison
The median household income in West Harrison is $47,083, with the highest median household income of $56,964 found in the 45 to 64 years age bracket for the primary householder. A total of 53 households (36.5%) fall into this category. Meanwhile, the 15 to 24 years age bracket for the primary householder has the lowest median household income of $0, with 13 households (9.0%) in this group.
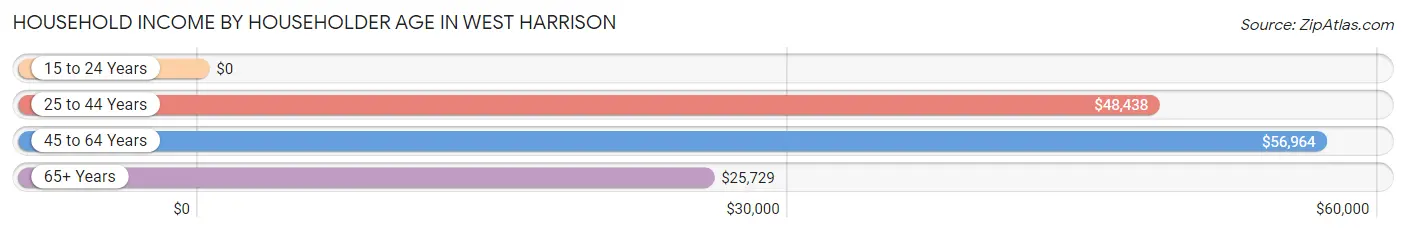
| Income Bracket | # Households | Median Income |
| 15 to 24 Years | 13 (9.0%) | $0 |
| 25 to 44 Years | 40 (27.6%) | $48,438 |
| 45 to 64 Years | 53 (36.5%) | $56,964 |
| 65+ Years | 39 (26.9%) | $25,729 |
| Total | 145 (100.0%) | $47,083 |
Poverty in West Harrison
Income Below Poverty by Sex and Age in West Harrison
With 4.3% poverty level for males and 3.1% for females among the residents of West Harrison, 35 to 44 year old males and under 5 year old females are the most vulnerable to poverty, with 2 males (18.2%) and 2 females (12.5%) in their respective age groups living below the poverty level.
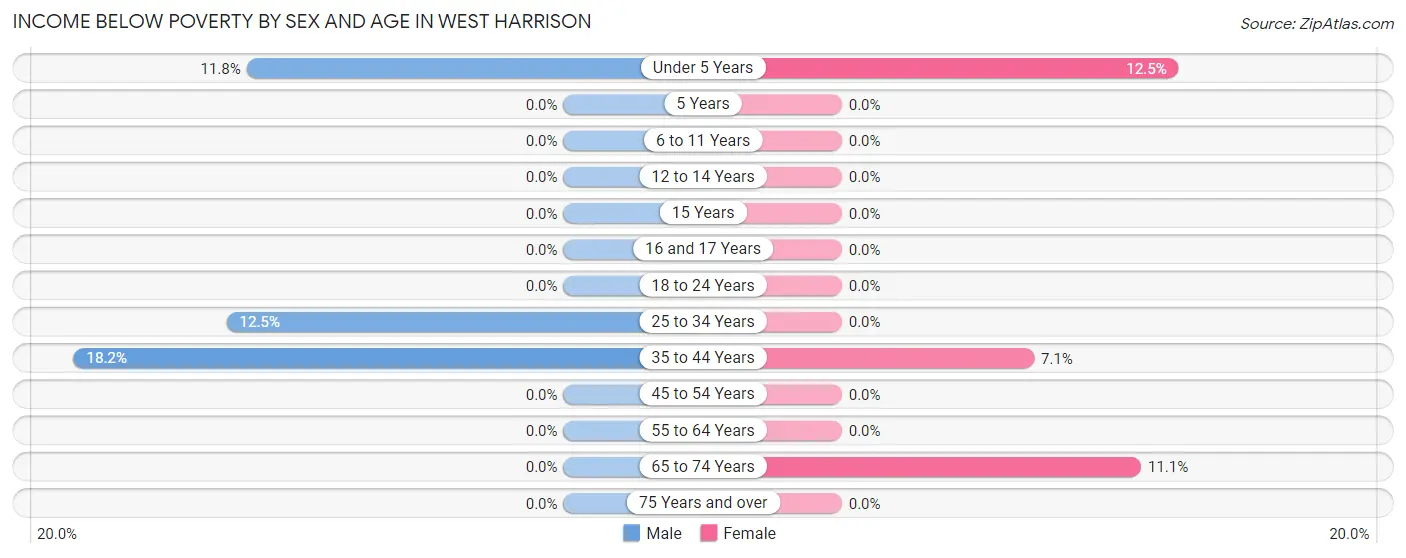
| Age Bracket | Male | Female |
| Under 5 Years | 2 (11.8%) | 2 (12.5%) |
| 5 Years | 0 (0.0%) | 0 (0.0%) |
| 6 to 11 Years | 0 (0.0%) | 0 (0.0%) |
| 12 to 14 Years | 0 (0.0%) | 0 (0.0%) |
| 15 Years | 0 (0.0%) | 0 (0.0%) |
| 16 and 17 Years | 0 (0.0%) | 0 (0.0%) |
| 18 to 24 Years | 0 (0.0%) | 0 (0.0%) |
| 25 to 34 Years | 2 (12.5%) | 0 (0.0%) |
| 35 to 44 Years | 2 (18.2%) | 1 (7.1%) |
| 45 to 54 Years | 0 (0.0%) | 0 (0.0%) |
| 55 to 64 Years | 0 (0.0%) | 0 (0.0%) |
| 65 to 74 Years | 0 (0.0%) | 2 (11.1%) |
| 75 Years and over | 0 (0.0%) | 0 (0.0%) |
| Total | 6 (4.3%) | 5 (3.1%) |
Income Above Poverty by Sex and Age in West Harrison
According to the poverty statistics in West Harrison, males aged 6 to 11 years and females aged 5 years are the age groups that are most secure financially, with 100.0% of males and 100.0% of females in these age groups living above the poverty line.
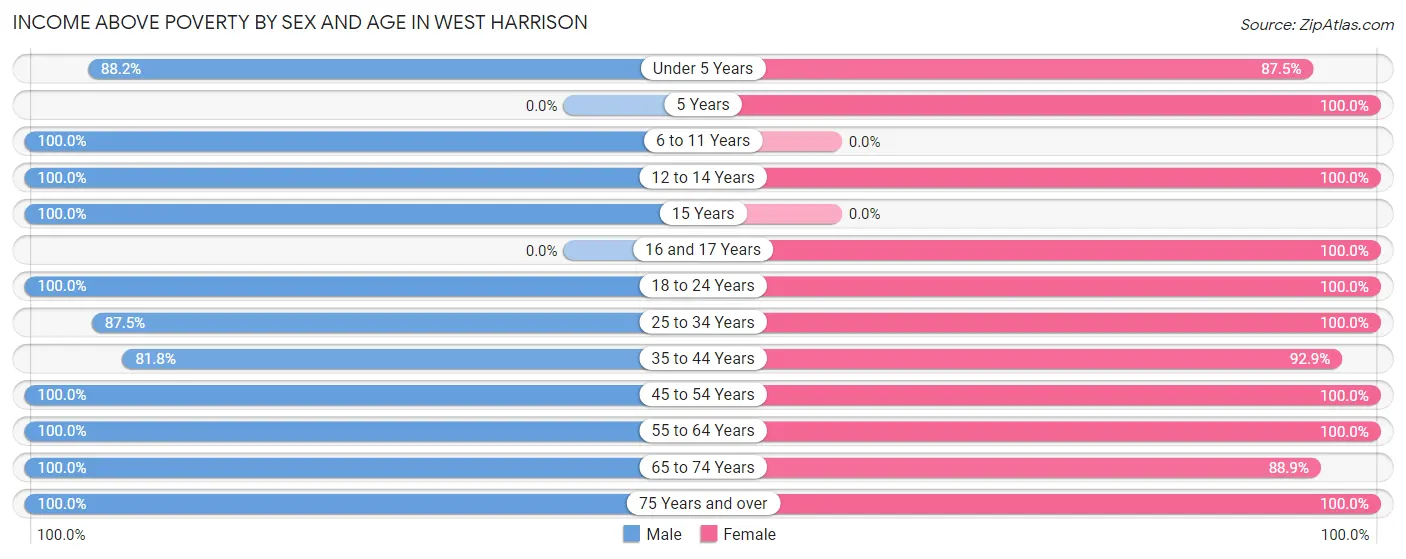
| Age Bracket | Male | Female |
| Under 5 Years | 15 (88.2%) | 14 (87.5%) |
| 5 Years | 0 (0.0%) | 3 (100.0%) |
| 6 to 11 Years | 3 (100.0%) | 0 (0.0%) |
| 12 to 14 Years | 1 (100.0%) | 11 (100.0%) |
| 15 Years | 5 (100.0%) | 0 (0.0%) |
| 16 and 17 Years | 0 (0.0%) | 13 (100.0%) |
| 18 to 24 Years | 32 (100.0%) | 16 (100.0%) |
| 25 to 34 Years | 14 (87.5%) | 25 (100.0%) |
| 35 to 44 Years | 9 (81.8%) | 13 (92.9%) |
| 45 to 54 Years | 16 (100.0%) | 11 (100.0%) |
| 55 to 64 Years | 20 (100.0%) | 22 (100.0%) |
| 65 to 74 Years | 13 (100.0%) | 16 (88.9%) |
| 75 Years and over | 7 (100.0%) | 10 (100.0%) |
| Total | 135 (95.7%) | 154 (96.9%) |
Income Below Poverty Among Married-Couple Families in West Harrison
The poverty statistics for married-couple families in West Harrison show that 4.8% or 2 of the total 42 families live below the poverty line. Families with 3 or 4 children have the highest poverty rate of 100.0%, comprising of 2 families. On the other hand, families with no children have the lowest poverty rate of 0.0%, which includes 0 families.
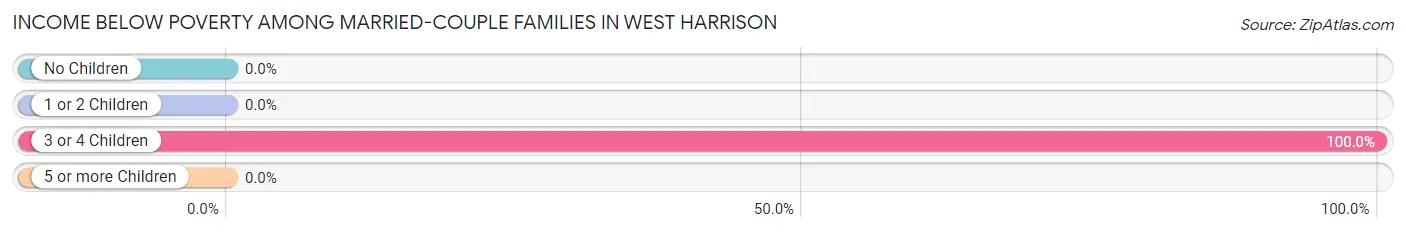
| Children | Above Poverty | Below Poverty |
| No Children | 18 (100.0%) | 0 (0.0%) |
| 1 or 2 Children | 22 (100.0%) | 0 (0.0%) |
| 3 or 4 Children | 0 (0.0%) | 2 (100.0%) |
| 5 or more Children | 0 (0.0%) | 0 (0.0%) |
| Total | 40 (95.2%) | 2 (4.8%) |
Income Below Poverty Among Single-Parent Households in West Harrison
| Children | Single Father | Single Mother |
| No Children | 0 (0.0%) | 0 (0.0%) |
| 1 or 2 Children | 0 (0.0%) | 0 (0.0%) |
| 3 or 4 Children | 0 (0.0%) | 0 (0.0%) |
| 5 or more Children | 0 (0.0%) | 0 (0.0%) |
| Total | 0 (0.0%) | 0 (0.0%) |
Income Below Poverty Among Married-Couple vs Single-Parent Households in West Harrison
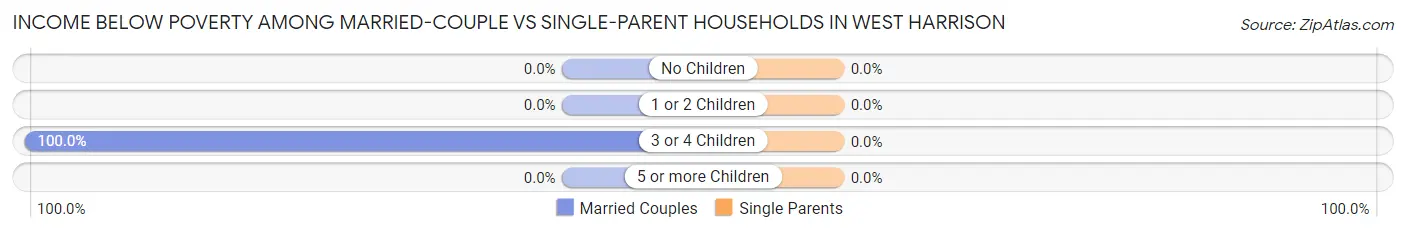
| Children | Married-Couple Families | Single-Parent Households |
| No Children | 0 (0.0%) | 0 (0.0%) |
| 1 or 2 Children | 0 (0.0%) | 0 (0.0%) |
| 3 or 4 Children | 2 (100.0%) | 0 (0.0%) |
| 5 or more Children | 0 (0.0%) | 0 (0.0%) |
| Total | 2 (4.8%) | 0 (0.0%) |
Race in West Harrison
The most populous races in West Harrison are White / Caucasian (291 | 90.4%), Two or more Races (24 | 7.4%), and Asian (7 | 2.2%).
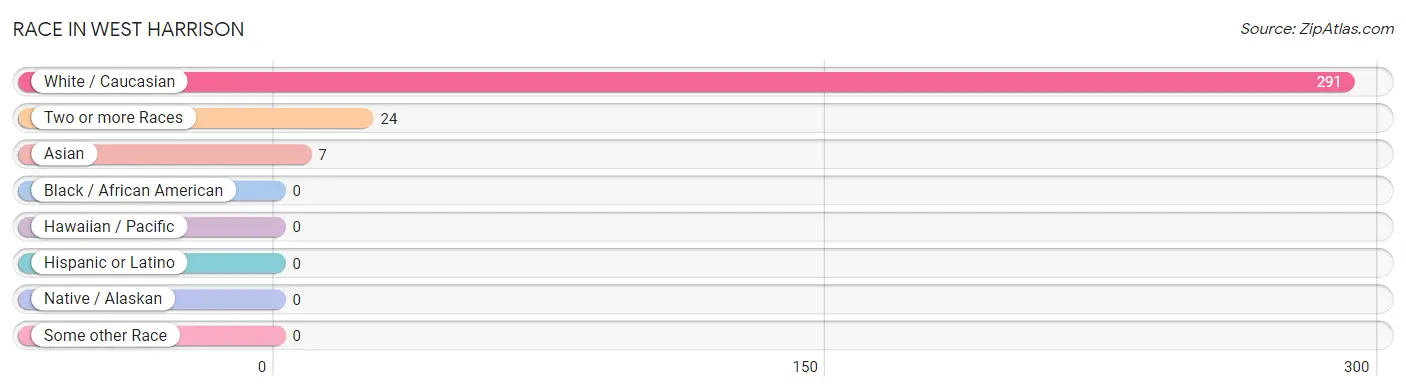
| Race | # Population | % Population |
| Asian | 7 | 2.2% |
| Black / African American | 0 | 0.0% |
| Hawaiian / Pacific | 0 | 0.0% |
| Hispanic or Latino | 0 | 0.0% |
| Native / Alaskan | 0 | 0.0% |
| White / Caucasian | 291 | 90.4% |
| Two or more Races | 24 | 7.4% |
| Some other Race | 0 | 0.0% |
| Total | 322 | 100.0% |
Ancestry in West Harrison
The most populous ancestries reported in West Harrison are American (69 | 21.4%), German (62 | 19.3%), Irish (36 | 11.2%), English (21 | 6.5%), and Indonesian (5 | 1.5%), together accounting for 59.9% of all West Harrison residents.
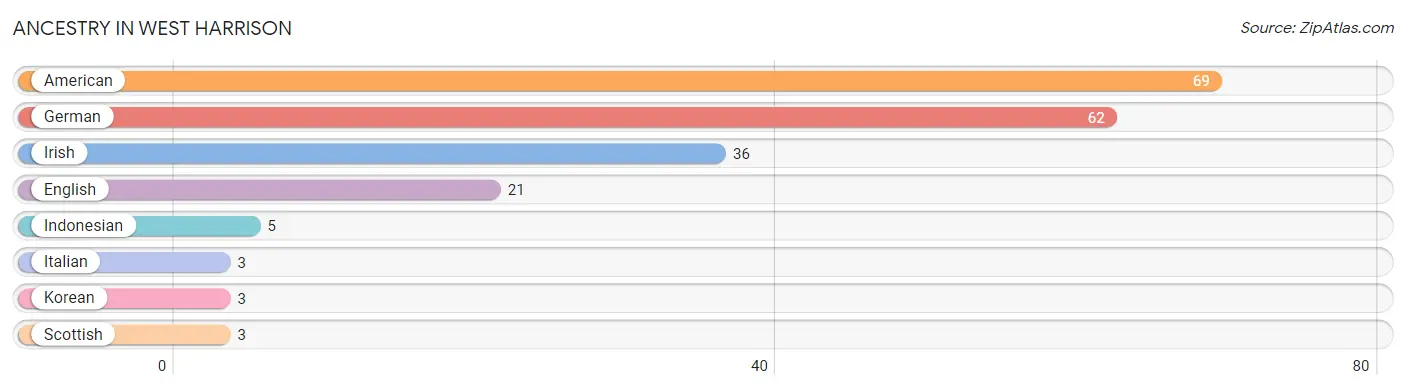
| Ancestry | # Population | % Population |
| American | 69 | 21.4% |
| English | 21 | 6.5% |
| German | 62 | 19.3% |
| Indonesian | 5 | 1.5% |
| Irish | 36 | 11.2% |
| Italian | 3 | 0.9% |
| Korean | 3 | 0.9% |
| Scottish | 3 | 0.9% | View All 8 Rows |
Immigrants in West Harrison
The most numerous immigrant groups reported in West Harrison came from Asia (7 | 2.2%), South Eastern Asia (7 | 2.2%), Thailand (3 | 0.9%), Denmark (2 | 0.6%), and Europe (2 | 0.6%), together accounting for 6.5% of all West Harrison residents.
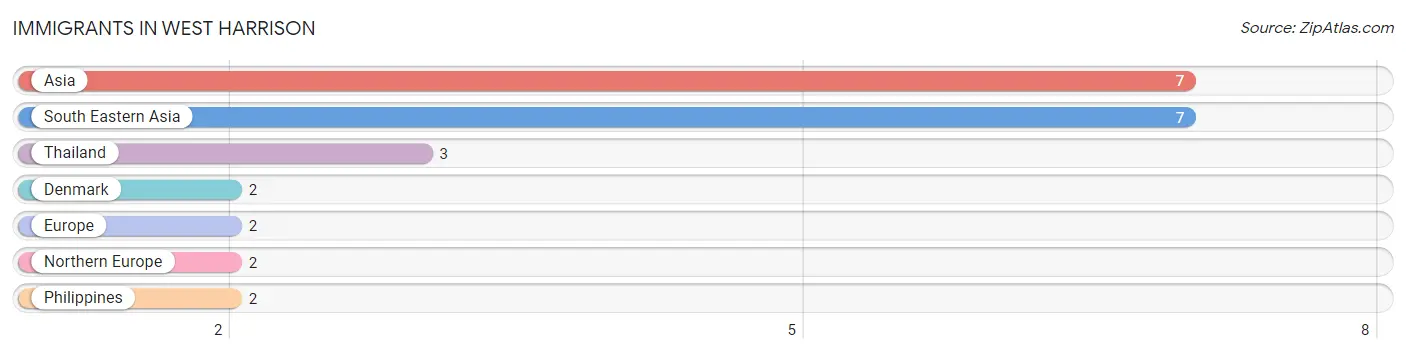
| Immigration Origin | # Population | % Population |
| Asia | 7 | 2.2% |
| Denmark | 2 | 0.6% |
| Europe | 2 | 0.6% |
| Northern Europe | 2 | 0.6% |
| Philippines | 2 | 0.6% |
| South Eastern Asia | 7 | 2.2% |
| Thailand | 3 | 0.9% | View All 7 Rows |
Sex and Age in West Harrison
Sex and Age in West Harrison
The most populous age groups in West Harrison are 15 to 19 Years (27 | 17.3%) for men and 15 to 19 Years (17 | 10.2%) for women.
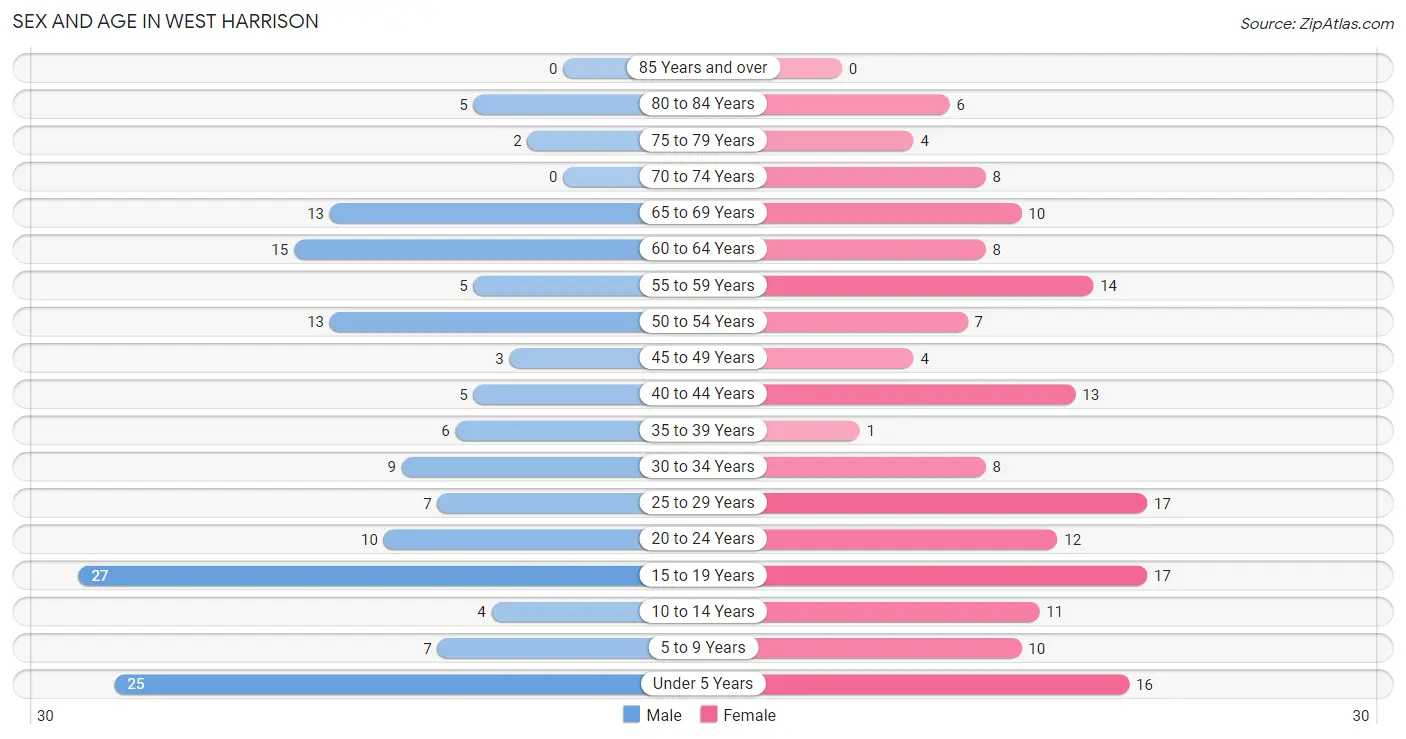
| Age Bracket | Male | Female |
| Under 5 Years | 25 (16.0%) | 16 (9.6%) |
| 5 to 9 Years | 7 (4.5%) | 10 (6.0%) |
| 10 to 14 Years | 4 (2.6%) | 11 (6.6%) |
| 15 to 19 Years | 27 (17.3%) | 17 (10.2%) |
| 20 to 24 Years | 10 (6.4%) | 12 (7.2%) |
| 25 to 29 Years | 7 (4.5%) | 17 (10.2%) |
| 30 to 34 Years | 9 (5.8%) | 8 (4.8%) |
| 35 to 39 Years | 6 (3.8%) | 1 (0.6%) |
| 40 to 44 Years | 5 (3.2%) | 13 (7.8%) |
| 45 to 49 Years | 3 (1.9%) | 4 (2.4%) |
| 50 to 54 Years | 13 (8.3%) | 7 (4.2%) |
| 55 to 59 Years | 5 (3.2%) | 14 (8.4%) |
| 60 to 64 Years | 15 (9.6%) | 8 (4.8%) |
| 65 to 69 Years | 13 (8.3%) | 10 (6.0%) |
| 70 to 74 Years | 0 (0.0%) | 8 (4.8%) |
| 75 to 79 Years | 2 (1.3%) | 4 (2.4%) |
| 80 to 84 Years | 5 (3.2%) | 6 (3.6%) |
| 85 Years and over | 0 (0.0%) | 0 (0.0%) |
| Total | 156 (100.0%) | 166 (100.0%) |
Families and Households in West Harrison
Median Family Size in West Harrison
The median family size in West Harrison is 2.91 persons per family, with single female/mother families (23 | 33.8%) accounting for the largest median family size of 3.43 persons per family. On the other hand, single male/father families (3 | 4.4%) represent the smallest median family size with 2.00 persons per family.
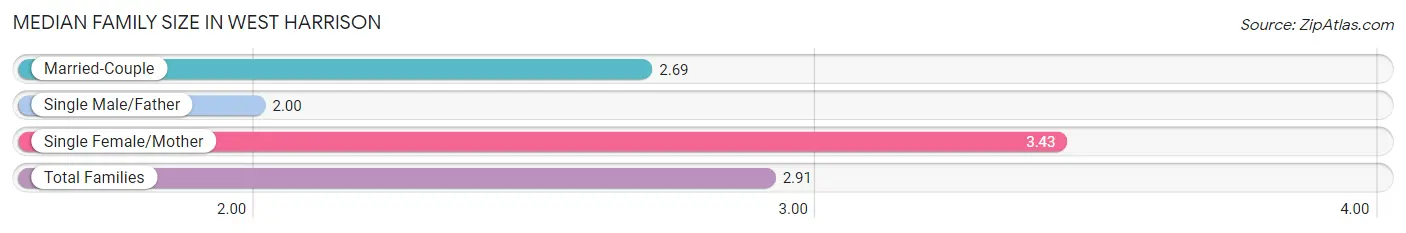
| Family Type | # Families | Family Size |
| Married-Couple | 42 (61.8%) | 2.69 |
| Single Male/Father | 3 (4.4%) | 2.00 |
| Single Female/Mother | 23 (33.8%) | 3.43 |
| Total Families | 68 (100.0%) | 2.91 |
Median Household Size in West Harrison
The median household size in West Harrison is 2.22 persons per household, with single female/mother households (23 | 15.9%) accounting for the largest median household size of 4.22 persons per household. non-family households (77 | 53.1%) represent the smallest median household size with 1.38 persons per household.
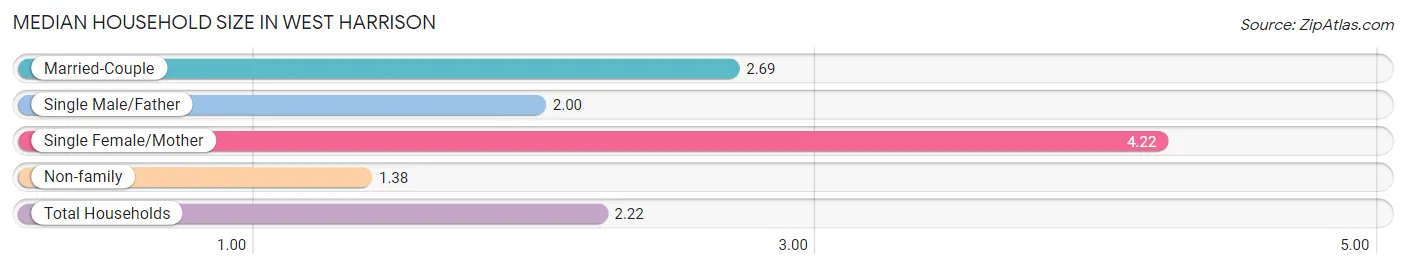
| Household Type | # Households | Household Size |
| Married-Couple | 42 (29.0%) | 2.69 |
| Single Male/Father | 3 (2.1%) | 2.00 |
| Single Female/Mother | 23 (15.9%) | 4.22 |
| Non-family | 77 (53.1%) | 1.38 |
| Total Households | 145 (100.0%) | 2.22 |
Household Size by Marriage Status in West Harrison
Out of a total of 145 households in West Harrison, 68 (46.9%) are family households, while 77 (53.1%) are nonfamily households. The most numerous type of family households are 2-person households, comprising 28, and the most common type of nonfamily households are 1-person households, comprising 70.
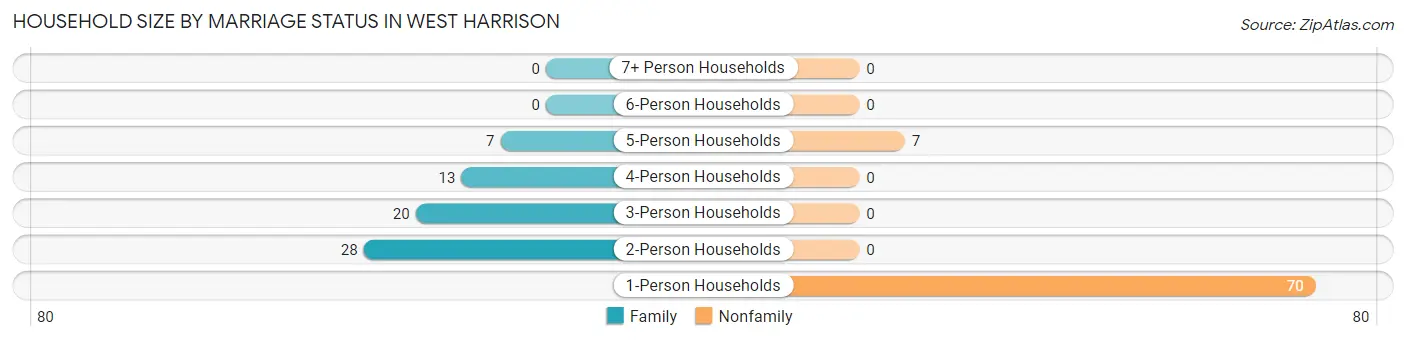
| Household Size | Family Households | Nonfamily Households |
| 1-Person Households | - | 70 (48.3%) |
| 2-Person Households | 28 (19.3%) | 0 (0.0%) |
| 3-Person Households | 20 (13.8%) | 0 (0.0%) |
| 4-Person Households | 13 (9.0%) | 0 (0.0%) |
| 5-Person Households | 7 (4.8%) | 7 (4.8%) |
| 6-Person Households | 0 (0.0%) | 0 (0.0%) |
| 7+ Person Households | 0 (0.0%) | 0 (0.0%) |
| Total | 68 (46.9%) | 77 (53.1%) |
Female Fertility in West Harrison
Fertility by Age in West Harrison
Average fertility rate in West Harrison is 42.0 births per 1,000 women. Women in the age bracket of 35 to 50 years have the highest fertility rate with 56.0 births per 1,000 women. Women in the age bracket of 20 to 34 years acount for 66.7% of all women with births.
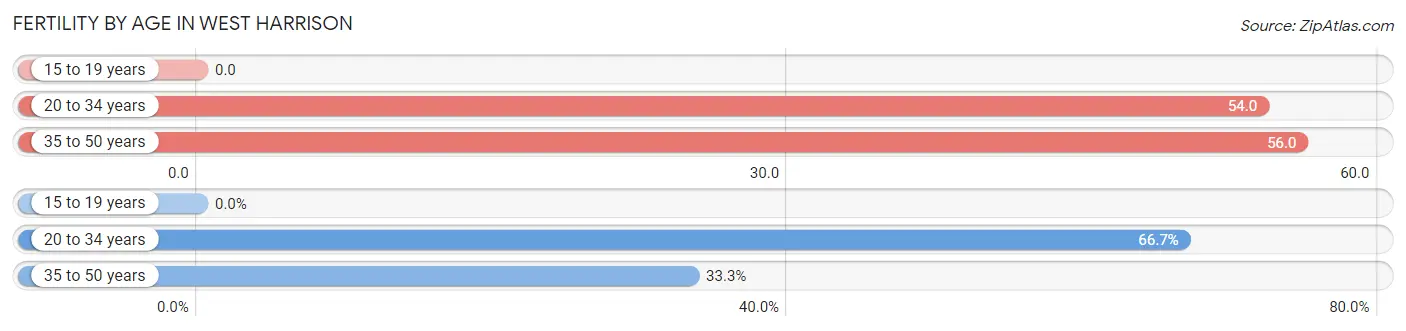
| Age Bracket | Women with Births | Births / 1,000 Women |
| 15 to 19 years | 0 (0.0%) | 0.0 |
| 20 to 34 years | 2 (66.7%) | 54.0 |
| 35 to 50 years | 1 (33.3%) | 56.0 |
| Total | 3 (100.0%) | 42.0 |
Fertility by Age by Marriage Status in West Harrison
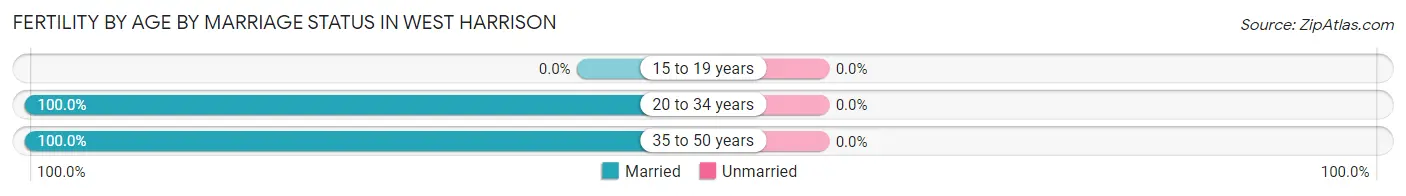
| Age Bracket | Married | Unmarried |
| 15 to 19 years | 0 (0.0%) | 0 (0.0%) |
| 20 to 34 years | 2 (100.0%) | 0 (0.0%) |
| 35 to 50 years | 1 (100.0%) | 0 (0.0%) |
| Total | 3 (100.0%) | 0 (0.0%) |
Fertility by Education in West Harrison
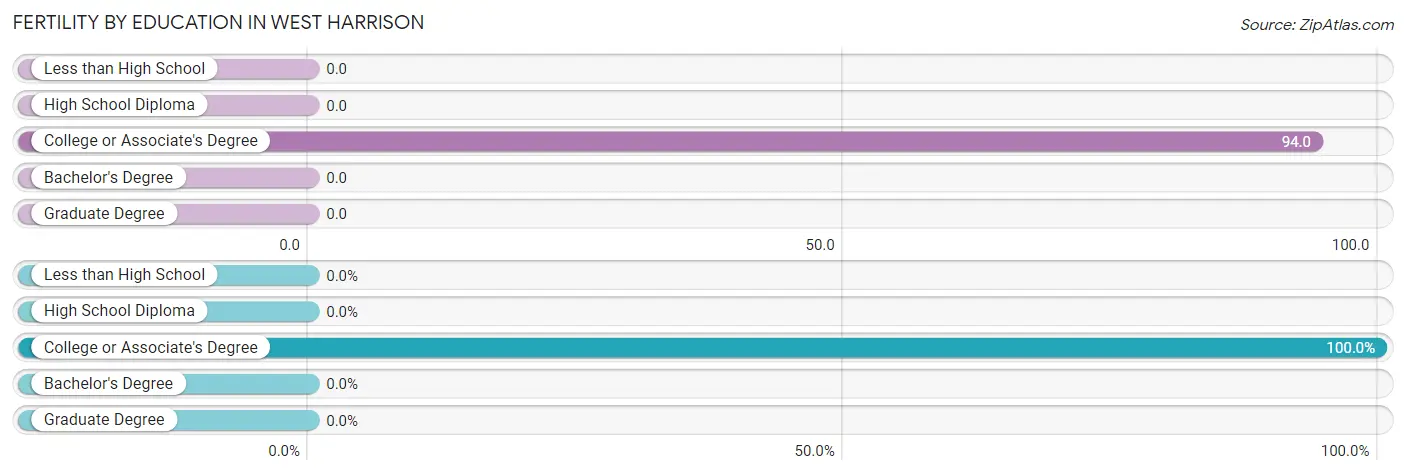
| Educational Attainment | Women with Births | Births / 1,000 Women |
| Less than High School | 0 (0.0%) | 0.0 |
| High School Diploma | 0 (0.0%) | 0.0 |
| College or Associate's Degree | 3 (100.0%) | 94.0 |
| Bachelor's Degree | 0 (0.0%) | 0.0 |
| Graduate Degree | 0 (0.0%) | 0.0 |
| Total | 3 (100.0%) | 42.0 |
Fertility by Education by Marriage Status in West Harrison
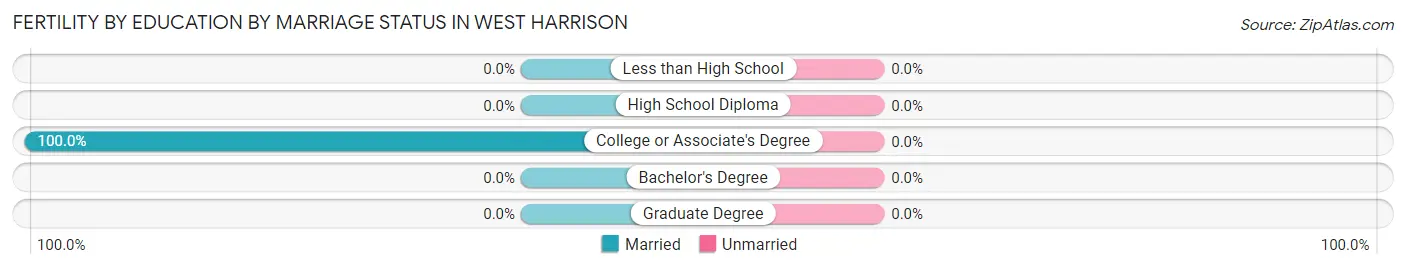
| Educational Attainment | Married | Unmarried |
| Less than High School | 0 (0.0%) | 0 (0.0%) |
| High School Diploma | 0 (0.0%) | 0 (0.0%) |
| College or Associate's Degree | 3 (100.0%) | 0 (0.0%) |
| Bachelor's Degree | 0 (0.0%) | 0 (0.0%) |
| Graduate Degree | 0 (0.0%) | 0 (0.0%) |
| Total | 3 (100.0%) | 0 (0.0%) |
Employment Characteristics in West Harrison
Employment by Class of Employer in West Harrison
Among the 142 employed individuals in West Harrison, private company employees (121 | 85.2%), local government employees (8 | 5.6%), and federal government employees (5 | 3.5%) make up the most common classes of employment.
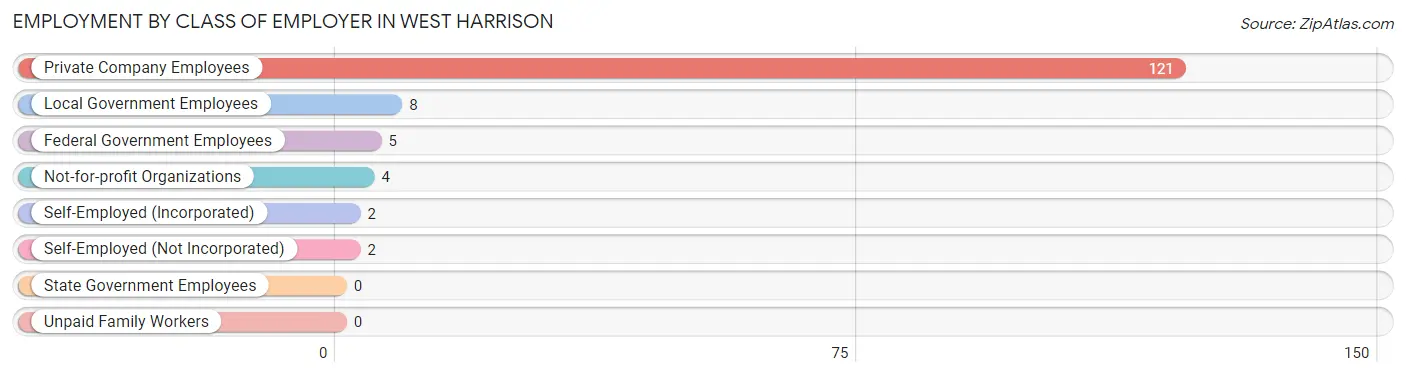
| Employer Class | # Employees | % Employees |
| Private Company Employees | 121 | 85.2% |
| Self-Employed (Incorporated) | 2 | 1.4% |
| Self-Employed (Not Incorporated) | 2 | 1.4% |
| Not-for-profit Organizations | 4 | 2.8% |
| Local Government Employees | 8 | 5.6% |
| State Government Employees | 0 | 0.0% |
| Federal Government Employees | 5 | 3.5% |
| Unpaid Family Workers | 0 | 0.0% |
| Total | 142 | 100.0% |
Employment Status by Age in West Harrison
According to the labor force statistics for West Harrison, out of the total population over 16 years of age (244), 63.9% or 156 individuals are in the labor force, with 5.8% or 9 of them unemployed. The age group with the highest labor force participation rate is 35 to 44 years, with 96.0% or 24 individuals in the labor force. Within the labor force, the 65 to 74 years age range has the highest percentage of unemployed individuals, with 50.0% or 3 of them being unemployed.
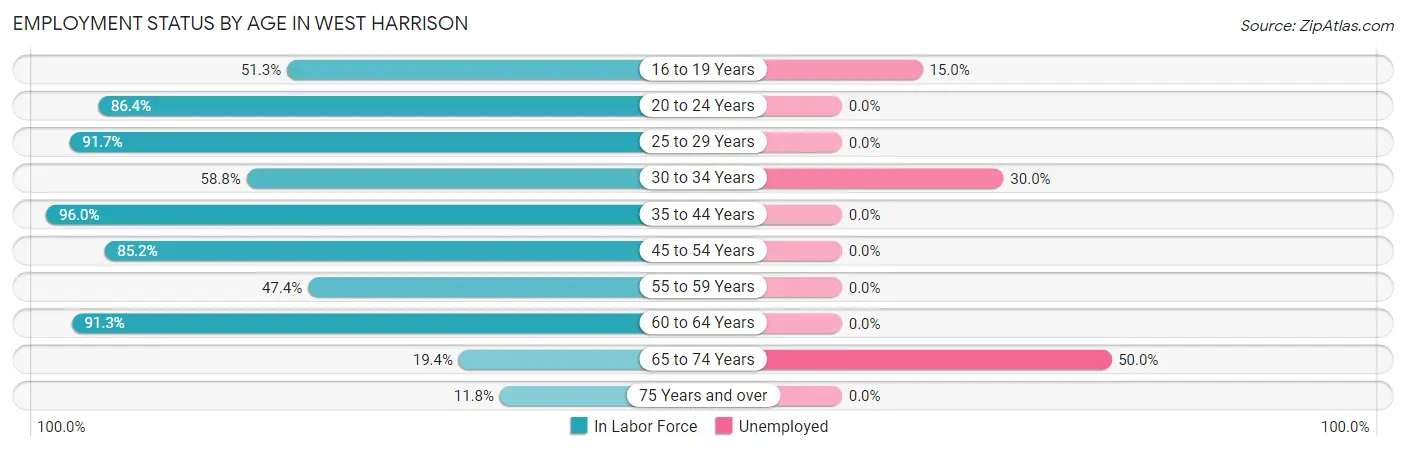
| Age Bracket | In Labor Force | Unemployed |
| 16 to 19 Years | 20 (51.3%) | 3 (15.0%) |
| 20 to 24 Years | 19 (86.4%) | 0 (0.0%) |
| 25 to 29 Years | 22 (91.7%) | 0 (0.0%) |
| 30 to 34 Years | 10 (58.8%) | 3 (30.0%) |
| 35 to 44 Years | 24 (96.0%) | 0 (0.0%) |
| 45 to 54 Years | 23 (85.2%) | 0 (0.0%) |
| 55 to 59 Years | 9 (47.4%) | 0 (0.0%) |
| 60 to 64 Years | 21 (91.3%) | 0 (0.0%) |
| 65 to 74 Years | 6 (19.4%) | 3 (50.0%) |
| 75 Years and over | 2 (11.8%) | 0 (0.0%) |
| Total | 156 (63.9%) | 9 (5.8%) |
Employment Status by Educational Attainment in West Harrison
According to labor force statistics for West Harrison, 80.7% of individuals (109) out of the total population between 25 and 64 years of age (135) are in the labor force, with 2.8% or 3 of them being unemployed. The group with the highest labor force participation rate are those with the educational attainment of bachelor's degree or higher, with 100.0% or 7 individuals in the labor force. Within the labor force, individuals with college / associate degree education have the highest percentage of unemployment, with 7.1% or 3 of them being unemployed.
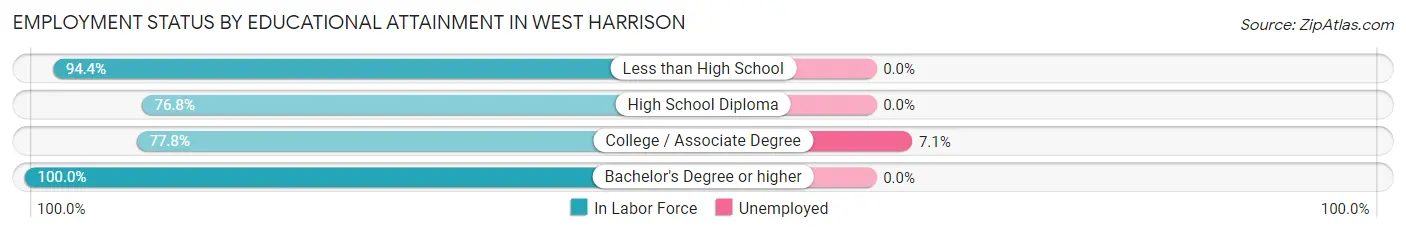
| Educational Attainment | In Labor Force | Unemployed |
| Less than High School | 17 (94.4%) | 0 (0.0%) |
| High School Diploma | 43 (76.8%) | 0 (0.0%) |
| College / Associate Degree | 42 (77.8%) | 4 (7.1%) |
| Bachelor's Degree or higher | 7 (100.0%) | 0 (0.0%) |
| Total | 109 (80.7%) | 4 (2.8%) |
Employment Occupations by Sex in West Harrison
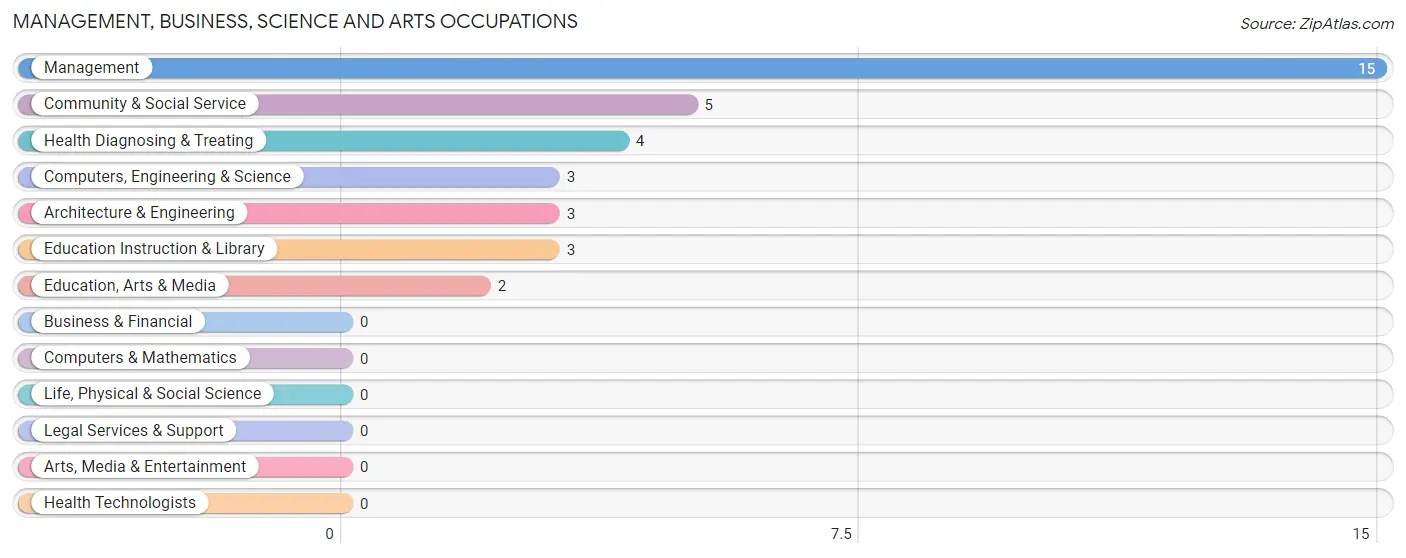
Management, Business, Science and Arts Occupations
The most common Management, Business, Science and Arts occupations in West Harrison are Management (15 | 10.2%), Community & Social Service (5 | 3.4%), Health Diagnosing & Treating (4 | 2.7%), Computers, Engineering & Science (3 | 2.0%), and Architecture & Engineering (3 | 2.0%).
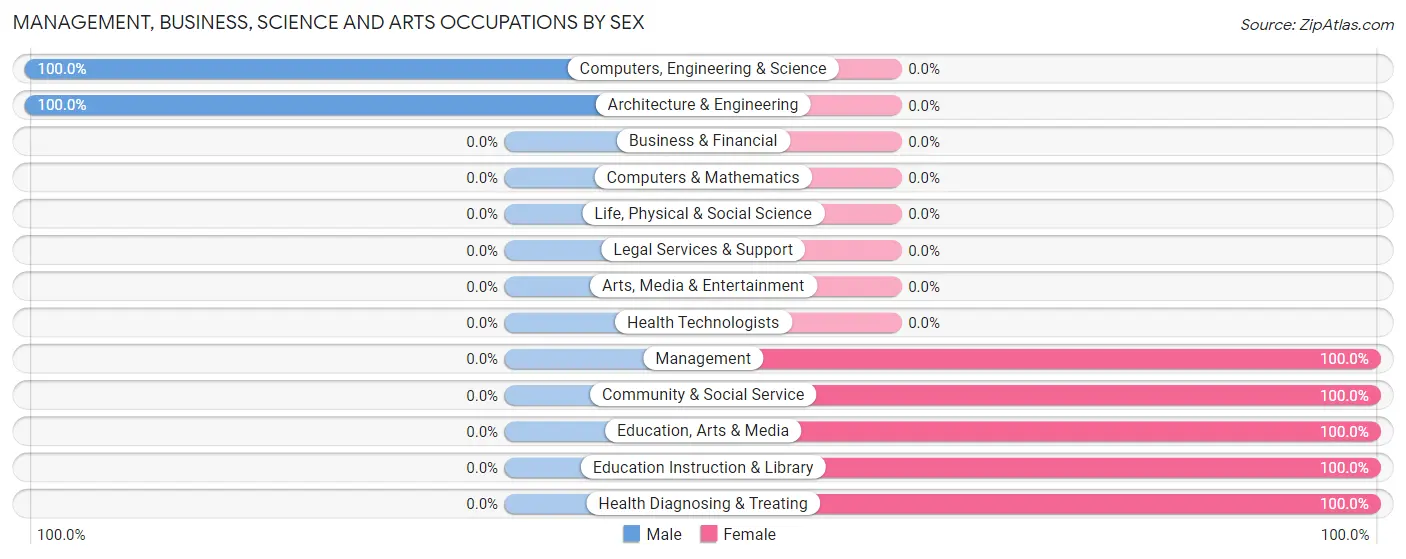
Management, Business, Science and Arts Occupations by Sex
Within the Management, Business, Science and Arts occupations in West Harrison, the most male-oriented occupations are Computers, Engineering & Science (100.0%), and Architecture & Engineering (100.0%), while the most female-oriented occupations are Management (100.0%), Community & Social Service (100.0%), and Education, Arts & Media (100.0%).
| Occupation | Male | Female |
| Management | 0 (0.0%) | 15 (100.0%) |
| Business & Financial | 0 (0.0%) | 0 (0.0%) |
| Computers, Engineering & Science | 3 (100.0%) | 0 (0.0%) |
| Computers & Mathematics | 0 (0.0%) | 0 (0.0%) |
| Architecture & Engineering | 3 (100.0%) | 0 (0.0%) |
| Life, Physical & Social Science | 0 (0.0%) | 0 (0.0%) |
| Community & Social Service | 0 (0.0%) | 5 (100.0%) |
| Education, Arts & Media | 0 (0.0%) | 2 (100.0%) |
| Legal Services & Support | 0 (0.0%) | 0 (0.0%) |
| Education Instruction & Library | 0 (0.0%) | 3 (100.0%) |
| Arts, Media & Entertainment | 0 (0.0%) | 0 (0.0%) |
| Health Diagnosing & Treating | 0 (0.0%) | 4 (100.0%) |
| Health Technologists | 0 (0.0%) | 0 (0.0%) |
| Total (Category) | 3 (11.1%) | 24 (88.9%) |
| Total (Overall) | 82 (55.8%) | 65 (44.2%) |
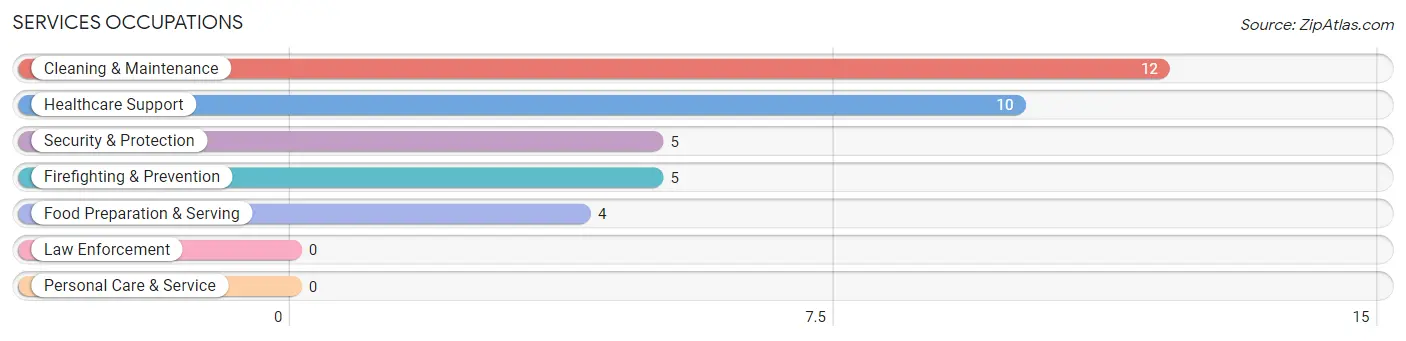
Services Occupations
The most common Services occupations in West Harrison are Cleaning & Maintenance (12 | 8.2%), Healthcare Support (10 | 6.8%), Security & Protection (5 | 3.4%), Firefighting & Prevention (5 | 3.4%), and Food Preparation & Serving (4 | 2.7%).
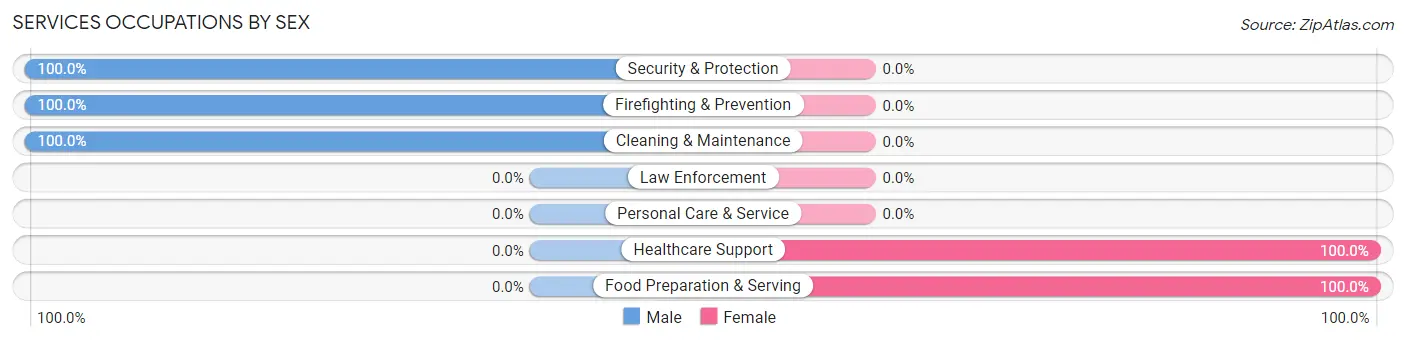
Services Occupations by Sex
Within the Services occupations in West Harrison, the most male-oriented occupations are Security & Protection (100.0%), Firefighting & Prevention (100.0%), and Cleaning & Maintenance (100.0%), while the most female-oriented occupations are Healthcare Support (100.0%), and Food Preparation & Serving (100.0%).
| Occupation | Male | Female |
| Healthcare Support | 0 (0.0%) | 10 (100.0%) |
| Security & Protection | 5 (100.0%) | 0 (0.0%) |
| Firefighting & Prevention | 5 (100.0%) | 0 (0.0%) |
| Law Enforcement | 0 (0.0%) | 0 (0.0%) |
| Food Preparation & Serving | 0 (0.0%) | 4 (100.0%) |
| Cleaning & Maintenance | 12 (100.0%) | 0 (0.0%) |
| Personal Care & Service | 0 (0.0%) | 0 (0.0%) |
| Total (Category) | 17 (54.8%) | 14 (45.2%) |
| Total (Overall) | 82 (55.8%) | 65 (44.2%) |
Sales and Office Occupations
The most common Sales and Office occupations in West Harrison are Sales & Related (10 | 6.8%), and Office & Administration (7 | 4.8%).
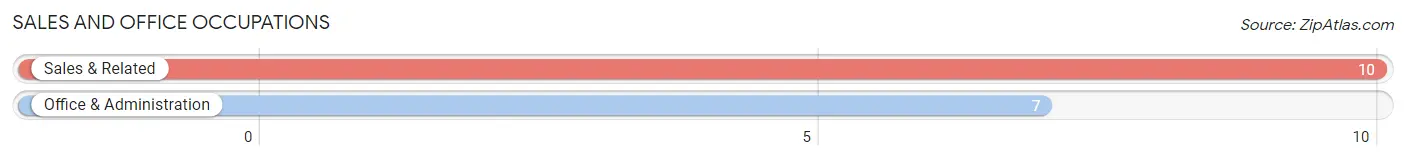
Sales and Office Occupations by Sex
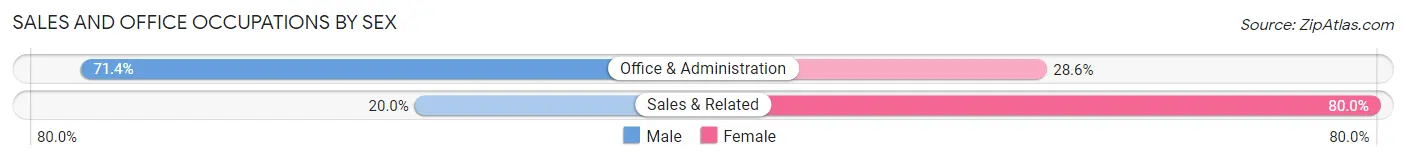
| Occupation | Male | Female |
| Sales & Related | 2 (20.0%) | 8 (80.0%) |
| Office & Administration | 5 (71.4%) | 2 (28.6%) |
| Total (Category) | 7 (41.2%) | 10 (58.8%) |
| Total (Overall) | 82 (55.8%) | 65 (44.2%) |
Natural Resources, Construction and Maintenance Occupations
The most common Natural Resources, Construction and Maintenance occupations in West Harrison are Construction & Extraction (8 | 5.4%), Farming, Fishing & Forestry (5 | 3.4%), and Installation, Maintenance & Repair (5 | 3.4%).
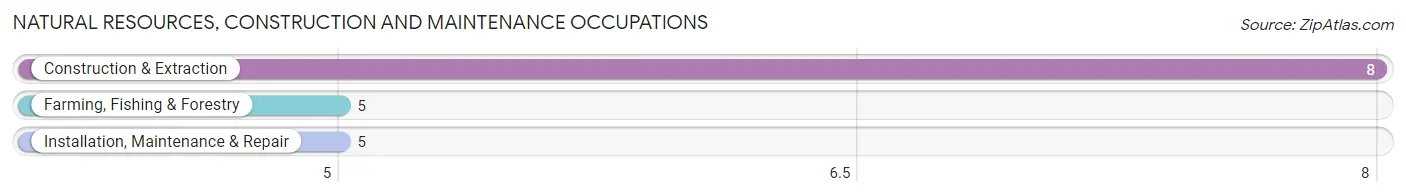
Natural Resources, Construction and Maintenance Occupations by Sex
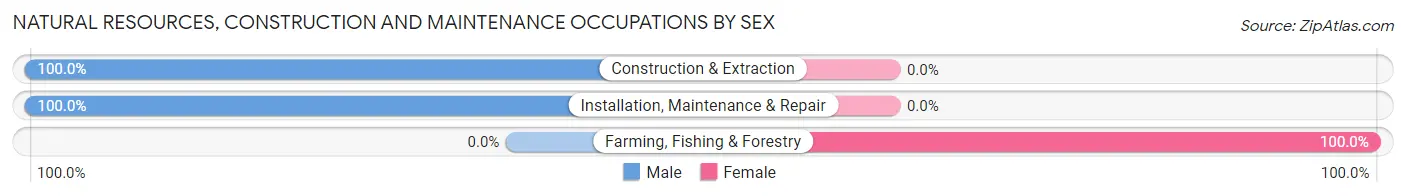
| Occupation | Male | Female |
| Farming, Fishing & Forestry | 0 (0.0%) | 5 (100.0%) |
| Construction & Extraction | 8 (100.0%) | 0 (0.0%) |
| Installation, Maintenance & Repair | 5 (100.0%) | 0 (0.0%) |
| Total (Category) | 13 (72.2%) | 5 (27.8%) |
| Total (Overall) | 82 (55.8%) | 65 (44.2%) |
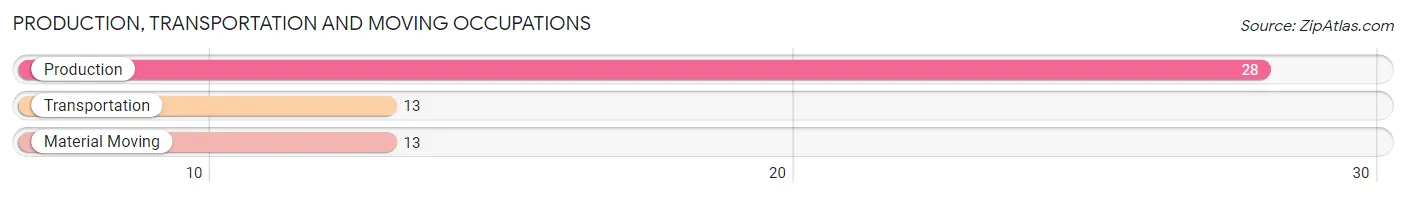
Production, Transportation and Moving Occupations
The most common Production, Transportation and Moving occupations in West Harrison are Production (28 | 19.1%), Transportation (13 | 8.8%), and Material Moving (13 | 8.8%).
Production, Transportation and Moving Occupations by Sex
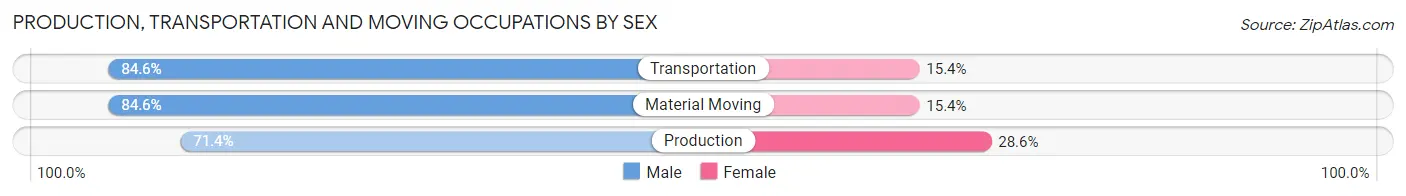
| Occupation | Male | Female |
| Production | 20 (71.4%) | 8 (28.6%) |
| Transportation | 11 (84.6%) | 2 (15.4%) |
| Material Moving | 11 (84.6%) | 2 (15.4%) |
| Total (Category) | 42 (77.8%) | 12 (22.2%) |
| Total (Overall) | 82 (55.8%) | 65 (44.2%) |
Employment Industries by Sex in West Harrison
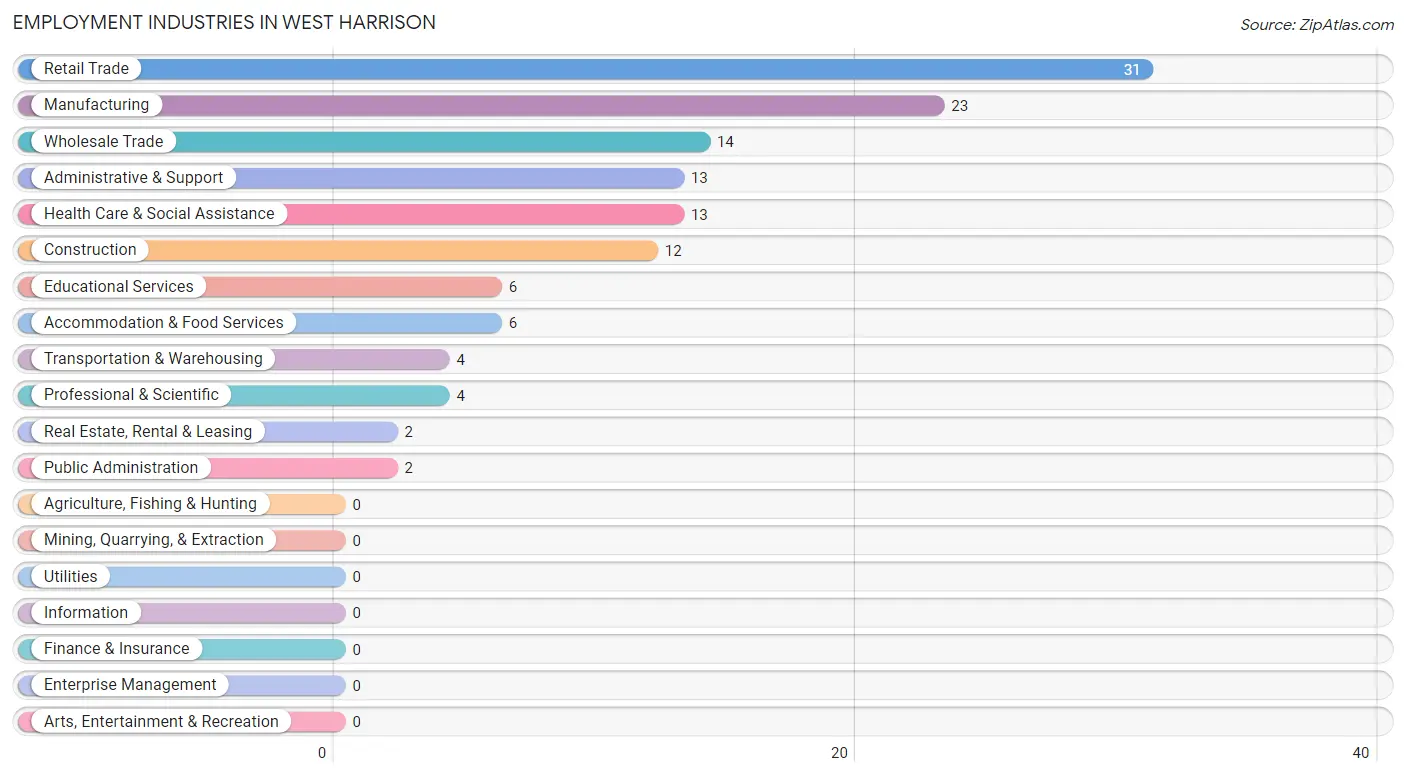
Employment Industries in West Harrison
The major employment industries in West Harrison include Retail Trade (31 | 21.1%), Manufacturing (23 | 15.7%), Wholesale Trade (14 | 9.5%), Administrative & Support (13 | 8.8%), and Health Care & Social Assistance (13 | 8.8%).
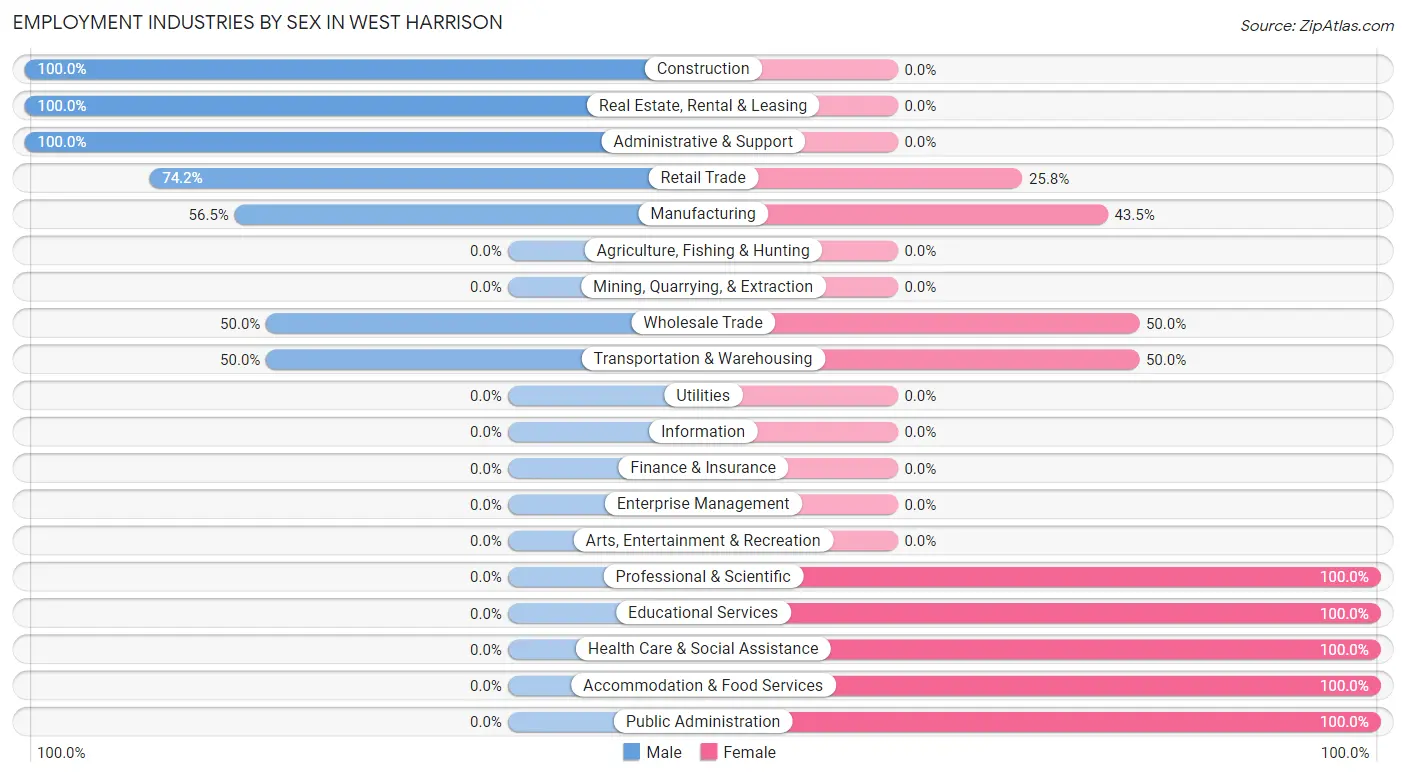
Employment Industries by Sex in West Harrison
The West Harrison industries that see more men than women are Construction (100.0%), Real Estate, Rental & Leasing (100.0%), and Administrative & Support (100.0%), whereas the industries that tend to have a higher number of women are Professional & Scientific (100.0%), Educational Services (100.0%), and Health Care & Social Assistance (100.0%).
| Industry | Male | Female |
| Agriculture, Fishing & Hunting | 0 (0.0%) | 0 (0.0%) |
| Mining, Quarrying, & Extraction | 0 (0.0%) | 0 (0.0%) |
| Construction | 12 (100.0%) | 0 (0.0%) |
| Manufacturing | 13 (56.5%) | 10 (43.5%) |
| Wholesale Trade | 7 (50.0%) | 7 (50.0%) |
| Retail Trade | 23 (74.2%) | 8 (25.8%) |
| Transportation & Warehousing | 2 (50.0%) | 2 (50.0%) |
| Utilities | 0 (0.0%) | 0 (0.0%) |
| Information | 0 (0.0%) | 0 (0.0%) |
| Finance & Insurance | 0 (0.0%) | 0 (0.0%) |
| Real Estate, Rental & Leasing | 2 (100.0%) | 0 (0.0%) |
| Professional & Scientific | 0 (0.0%) | 4 (100.0%) |
| Enterprise Management | 0 (0.0%) | 0 (0.0%) |
| Administrative & Support | 13 (100.0%) | 0 (0.0%) |
| Educational Services | 0 (0.0%) | 6 (100.0%) |
| Health Care & Social Assistance | 0 (0.0%) | 13 (100.0%) |
| Arts, Entertainment & Recreation | 0 (0.0%) | 0 (0.0%) |
| Accommodation & Food Services | 0 (0.0%) | 6 (100.0%) |
| Public Administration | 0 (0.0%) | 2 (100.0%) |
| Total | 82 (55.8%) | 65 (44.2%) |
Education in West Harrison
School Enrollment in West Harrison
The most common levels of schooling among the 66 students in West Harrison are high school (30 | 45.5%), elementary school (14 | 21.2%), and college / undergraduate (14 | 21.2%).
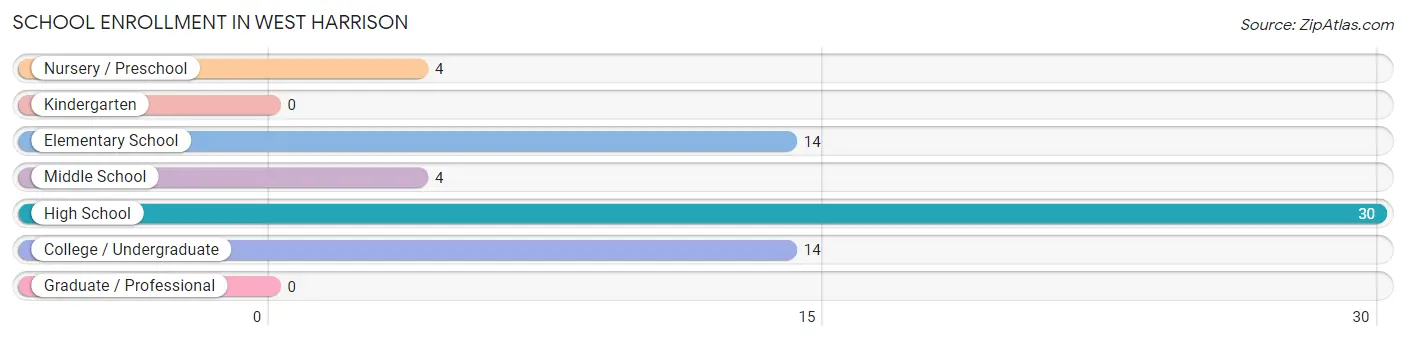
| School Level | # Students | % Students |
| Nursery / Preschool | 4 | 6.1% |
| Kindergarten | 0 | 0.0% |
| Elementary School | 14 | 21.2% |
| Middle School | 4 | 6.1% |
| High School | 30 | 45.5% |
| College / Undergraduate | 14 | 21.2% |
| Graduate / Professional | 0 | 0.0% |
| Total | 66 | 100.0% |
School Enrollment by Age by Funding Source in West Harrison
Out of a total of 66 students who are enrolled in schools in West Harrison, 1 (1.5%) attend a private institution, while the remaining 65 (98.5%) are enrolled in public schools. The age group of 3 to 4 year olds has the highest likelihood of being enrolled in private schools, with 1 (100.0% in the age bracket) enrolled. Conversely, the age group of 5 to 9 year old has the lowest likelihood of being enrolled in a private school, with 17 (100.0% in the age bracket) attending a public institution.
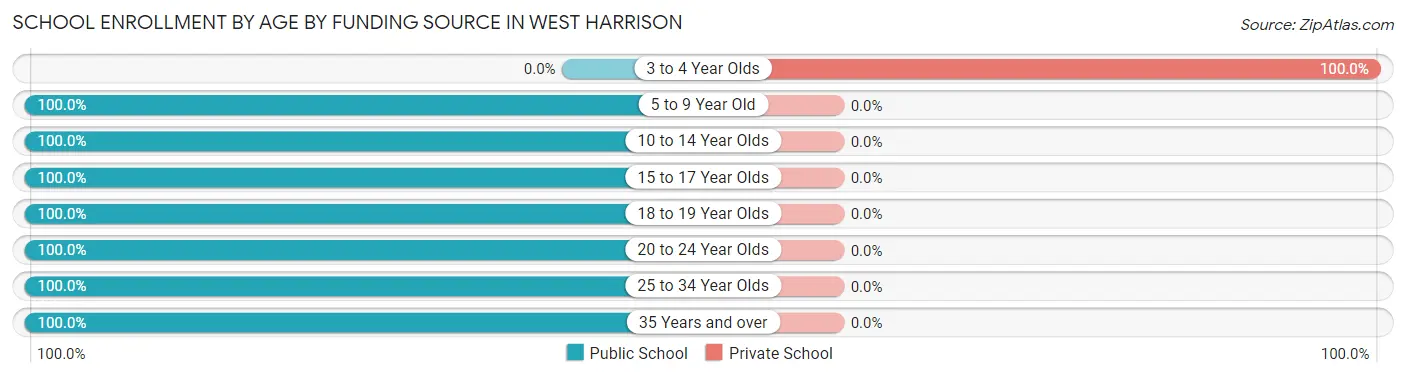
| Age Bracket | Public School | Private School |
| 3 to 4 Year Olds | 0 (0.0%) | 1 (100.0%) |
| 5 to 9 Year Old | 17 (100.0%) | 0 (0.0%) |
| 10 to 14 Year Olds | 15 (100.0%) | 0 (0.0%) |
| 15 to 17 Year Olds | 13 (100.0%) | 0 (0.0%) |
| 18 to 19 Year Olds | 6 (100.0%) | 0 (0.0%) |
| 20 to 24 Year Olds | 6 (100.0%) | 0 (0.0%) |
| 25 to 34 Year Olds | 6 (100.0%) | 0 (0.0%) |
| 35 Years and over | 2 (100.0%) | 0 (0.0%) |
| Total | 65 (98.5%) | 1 (1.5%) |
Educational Attainment by Field of Study in West Harrison
Science & technology (3 | 42.9%), liberal arts & history (2 | 28.6%), and arts & humanities (2 | 28.6%) are the most common fields of study among 7 individuals in West Harrison who have obtained a bachelor's degree or higher.
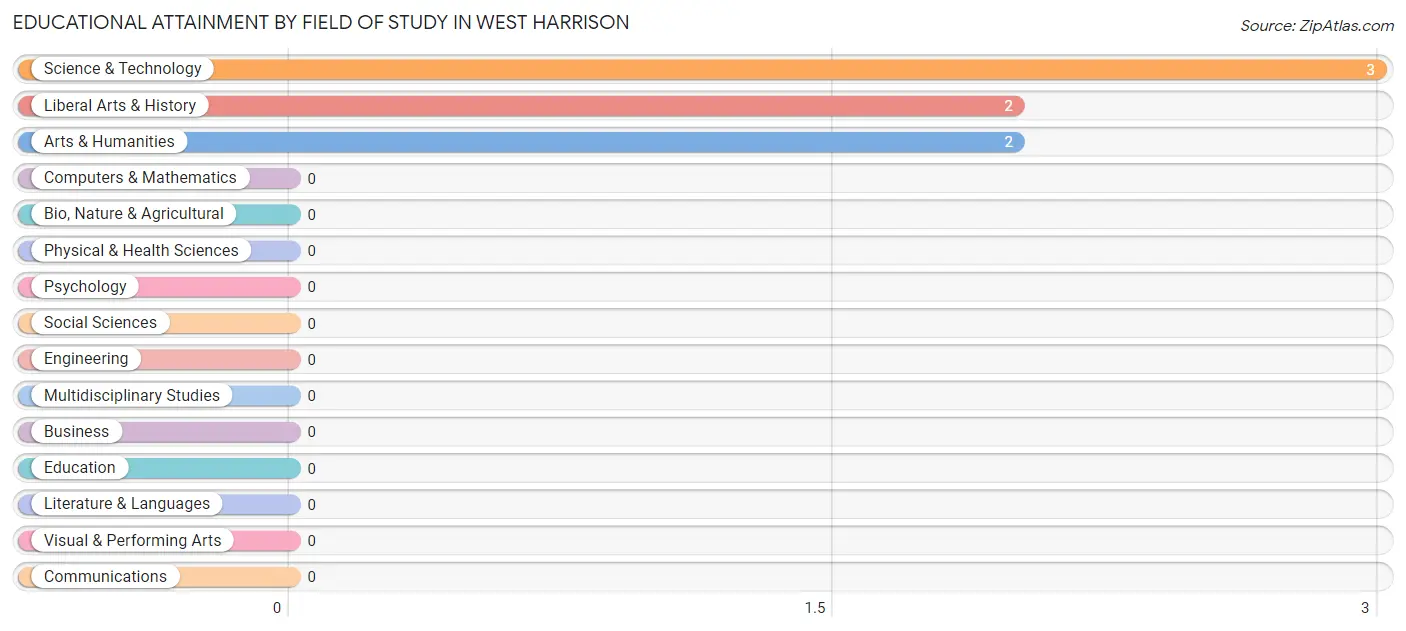
| Field of Study | # Graduates | % Graduates |
| Computers & Mathematics | 0 | 0.0% |
| Bio, Nature & Agricultural | 0 | 0.0% |
| Physical & Health Sciences | 0 | 0.0% |
| Psychology | 0 | 0.0% |
| Social Sciences | 0 | 0.0% |
| Engineering | 0 | 0.0% |
| Multidisciplinary Studies | 0 | 0.0% |
| Science & Technology | 3 | 42.9% |
| Business | 0 | 0.0% |
| Education | 0 | 0.0% |
| Literature & Languages | 0 | 0.0% |
| Liberal Arts & History | 2 | 28.6% |
| Visual & Performing Arts | 0 | 0.0% |
| Communications | 0 | 0.0% |
| Arts & Humanities | 2 | 28.6% |
| Total | 7 | 100.0% |
Transportation & Commute in West Harrison
Vehicle Availability by Sex in West Harrison
The most prevalent vehicle ownership categories in West Harrison are males with 2 vehicles (35, accounting for 45.5%) and females with 2 vehicles (30, making up 53.8%).
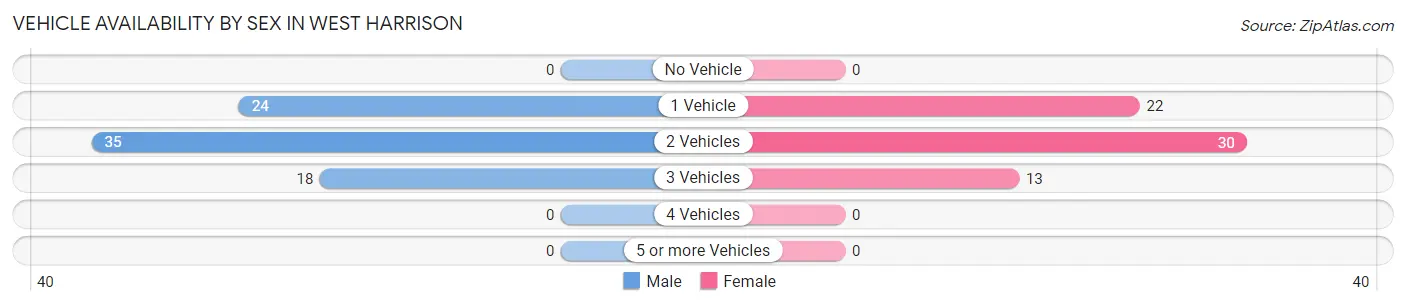
| Vehicles Available | Male | Female |
| No Vehicle | 0 (0.0%) | 0 (0.0%) |
| 1 Vehicle | 24 (31.2%) | 22 (33.9%) |
| 2 Vehicles | 35 (45.5%) | 30 (46.2%) |
| 3 Vehicles | 18 (23.4%) | 13 (20.0%) |
| 4 Vehicles | 0 (0.0%) | 0 (0.0%) |
| 5 or more Vehicles | 0 (0.0%) | 0 (0.0%) |
| Total | 77 (100.0%) | 65 (100.0%) |
Commute Time in West Harrison
The most frequently occuring commute durations in West Harrison are 5 to 9 minutes (28 commuters, 21.2%), 30 to 34 minutes (21 commuters, 15.9%), and 10 to 14 minutes (18 commuters, 13.6%).
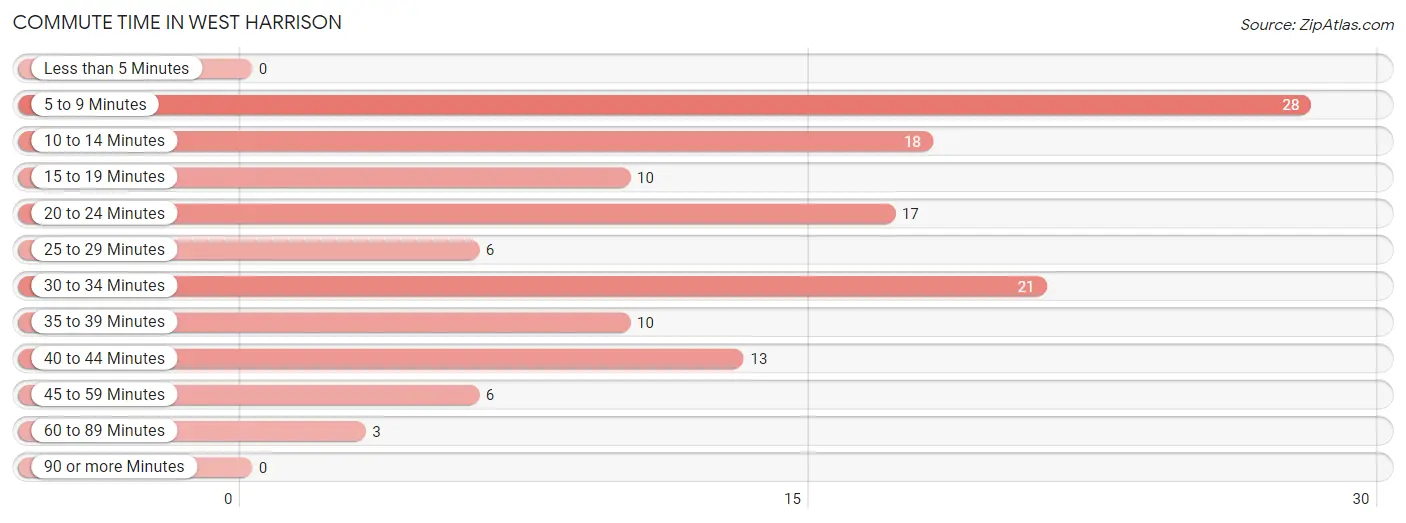
| Commute Time | # Commuters | % Commuters |
| Less than 5 Minutes | 0 | 0.0% |
| 5 to 9 Minutes | 28 | 21.2% |
| 10 to 14 Minutes | 18 | 13.6% |
| 15 to 19 Minutes | 10 | 7.6% |
| 20 to 24 Minutes | 17 | 12.9% |
| 25 to 29 Minutes | 6 | 4.5% |
| 30 to 34 Minutes | 21 | 15.9% |
| 35 to 39 Minutes | 10 | 7.6% |
| 40 to 44 Minutes | 13 | 9.9% |
| 45 to 59 Minutes | 6 | 4.5% |
| 60 to 89 Minutes | 3 | 2.3% |
| 90 or more Minutes | 0 | 0.0% |
Commute Time by Sex in West Harrison
The most common commute times in West Harrison are 40 to 44 minutes (13 commuters, 17.6%) for males and 5 to 9 minutes (19 commuters, 32.8%) for females.
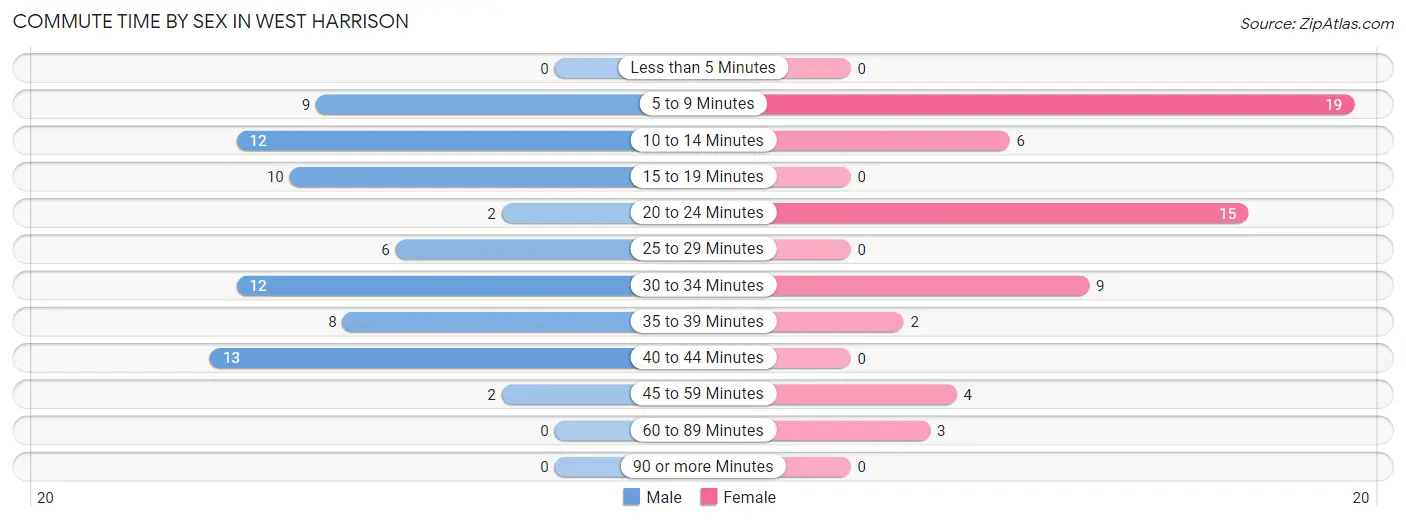
| Commute Time | Male | Female |
| Less than 5 Minutes | 0 (0.0%) | 0 (0.0%) |
| 5 to 9 Minutes | 9 (12.2%) | 19 (32.8%) |
| 10 to 14 Minutes | 12 (16.2%) | 6 (10.3%) |
| 15 to 19 Minutes | 10 (13.5%) | 0 (0.0%) |
| 20 to 24 Minutes | 2 (2.7%) | 15 (25.9%) |
| 25 to 29 Minutes | 6 (8.1%) | 0 (0.0%) |
| 30 to 34 Minutes | 12 (16.2%) | 9 (15.5%) |
| 35 to 39 Minutes | 8 (10.8%) | 2 (3.5%) |
| 40 to 44 Minutes | 13 (17.6%) | 0 (0.0%) |
| 45 to 59 Minutes | 2 (2.7%) | 4 (6.9%) |
| 60 to 89 Minutes | 0 (0.0%) | 3 (5.2%) |
| 90 or more Minutes | 0 (0.0%) | 0 (0.0%) |
Time of Departure to Work by Sex in West Harrison
The most frequent times of departure to work in West Harrison are 7:30 AM to 7:59 AM (18, 24.3%) for males and 6:00 AM to 6:29 AM (15, 25.9%) for females.
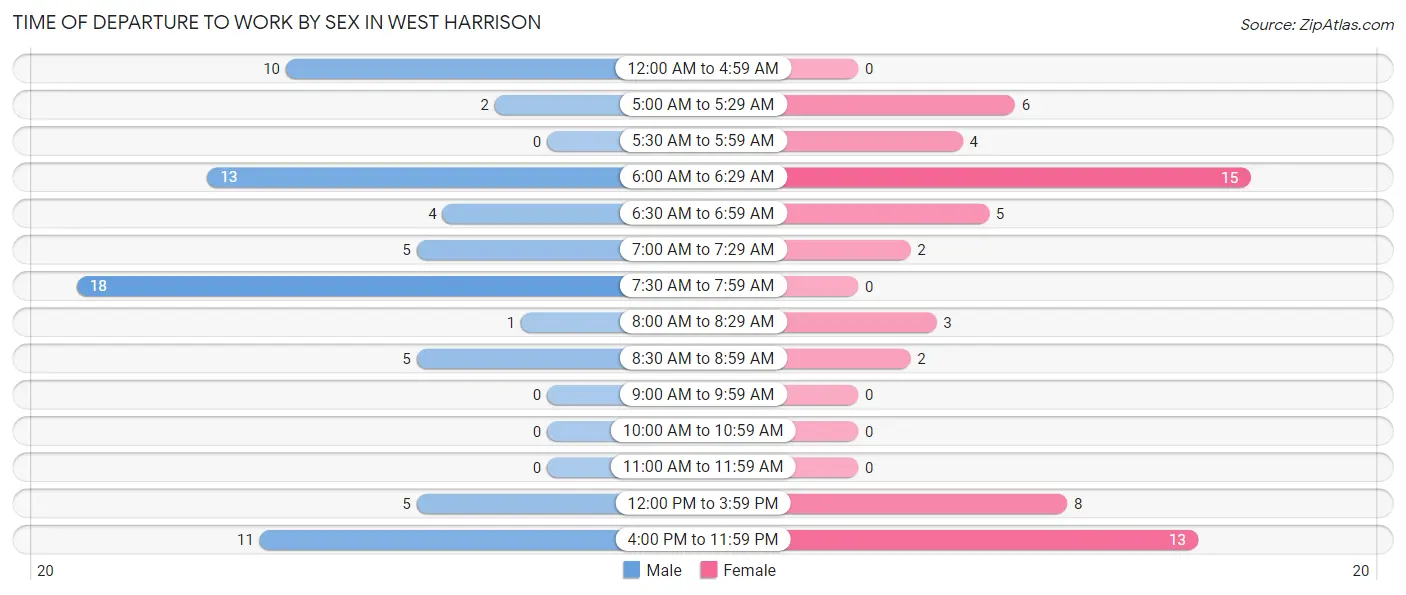
| Time of Departure | Male | Female |
| 12:00 AM to 4:59 AM | 10 (13.5%) | 0 (0.0%) |
| 5:00 AM to 5:29 AM | 2 (2.7%) | 6 (10.3%) |
| 5:30 AM to 5:59 AM | 0 (0.0%) | 4 (6.9%) |
| 6:00 AM to 6:29 AM | 13 (17.6%) | 15 (25.9%) |
| 6:30 AM to 6:59 AM | 4 (5.4%) | 5 (8.6%) |
| 7:00 AM to 7:29 AM | 5 (6.8%) | 2 (3.5%) |
| 7:30 AM to 7:59 AM | 18 (24.3%) | 0 (0.0%) |
| 8:00 AM to 8:29 AM | 1 (1.3%) | 3 (5.2%) |
| 8:30 AM to 8:59 AM | 5 (6.8%) | 2 (3.5%) |
| 9:00 AM to 9:59 AM | 0 (0.0%) | 0 (0.0%) |
| 10:00 AM to 10:59 AM | 0 (0.0%) | 0 (0.0%) |
| 11:00 AM to 11:59 AM | 0 (0.0%) | 0 (0.0%) |
| 12:00 PM to 3:59 PM | 5 (6.8%) | 8 (13.8%) |
| 4:00 PM to 11:59 PM | 11 (14.9%) | 13 (22.4%) |
| Total | 74 (100.0%) | 58 (100.0%) |
Housing Occupancy in West Harrison
Occupancy by Ownership in West Harrison
Of the total 145 dwellings in West Harrison, owner-occupied units account for 62 (42.8%), while renter-occupied units make up 83 (57.2%).
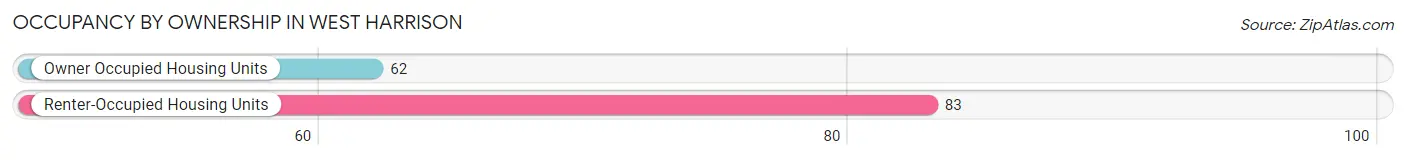
| Occupancy | # Housing Units | % Housing Units |
| Owner Occupied Housing Units | 62 | 42.8% |
| Renter-Occupied Housing Units | 83 | 57.2% |
| Total Occupied Housing Units | 145 | 100.0% |
Occupancy by Household Size in West Harrison
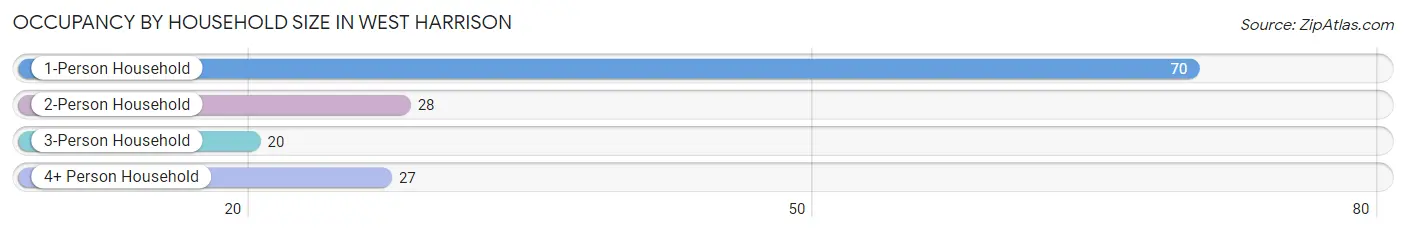
| Household Size | # Housing Units | % Housing Units |
| 1-Person Household | 70 | 48.3% |
| 2-Person Household | 28 | 19.3% |
| 3-Person Household | 20 | 13.8% |
| 4+ Person Household | 27 | 18.6% |
| Total Housing Units | 145 | 100.0% |
Occupancy by Ownership by Household Size in West Harrison
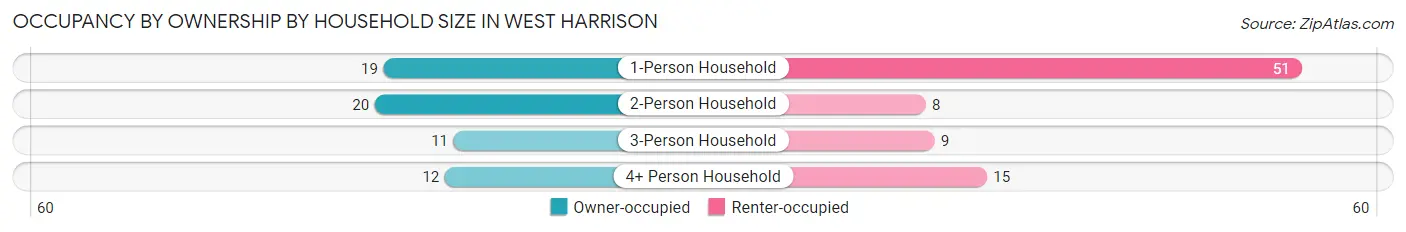
| Household Size | Owner-occupied | Renter-occupied |
| 1-Person Household | 19 (27.1%) | 51 (72.9%) |
| 2-Person Household | 20 (71.4%) | 8 (28.6%) |
| 3-Person Household | 11 (55.0%) | 9 (45.0%) |
| 4+ Person Household | 12 (44.4%) | 15 (55.6%) |
| Total Housing Units | 62 (42.8%) | 83 (57.2%) |
Occupancy by Educational Attainment in West Harrison
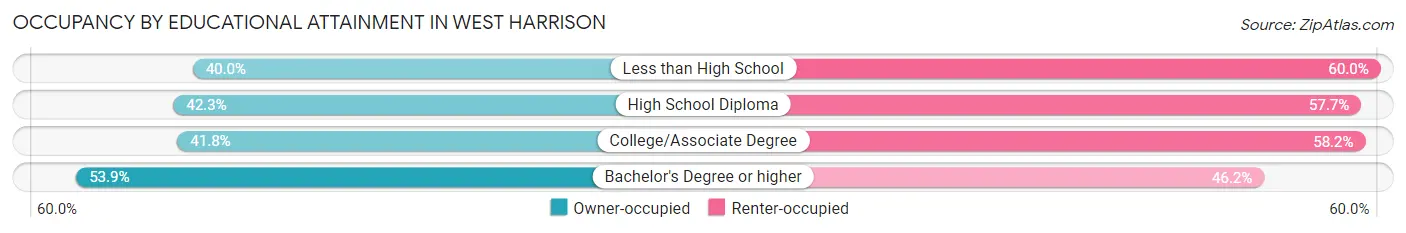
| Household Size | Owner-occupied | Renter-occupied |
| Less than High School | 10 (40.0%) | 15 (60.0%) |
| High School Diploma | 22 (42.3%) | 30 (57.7%) |
| College/Associate Degree | 23 (41.8%) | 32 (58.2%) |
| Bachelor's Degree or higher | 7 (53.8%) | 6 (46.2%) |
Occupancy by Age of Householder in West Harrison
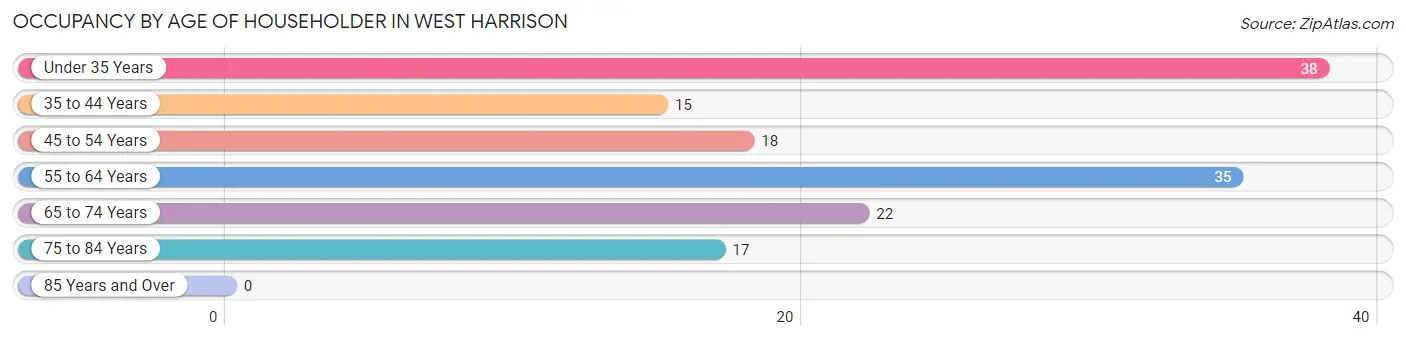
| Age Bracket | # Households | % Households |
| Under 35 Years | 38 | 26.2% |
| 35 to 44 Years | 15 | 10.3% |
| 45 to 54 Years | 18 | 12.4% |
| 55 to 64 Years | 35 | 24.1% |
| 65 to 74 Years | 22 | 15.2% |
| 75 to 84 Years | 17 | 11.7% |
| 85 Years and Over | 0 | 0.0% |
| Total | 145 | 100.0% |
Housing Finances in West Harrison
Median Income by Occupancy in West Harrison
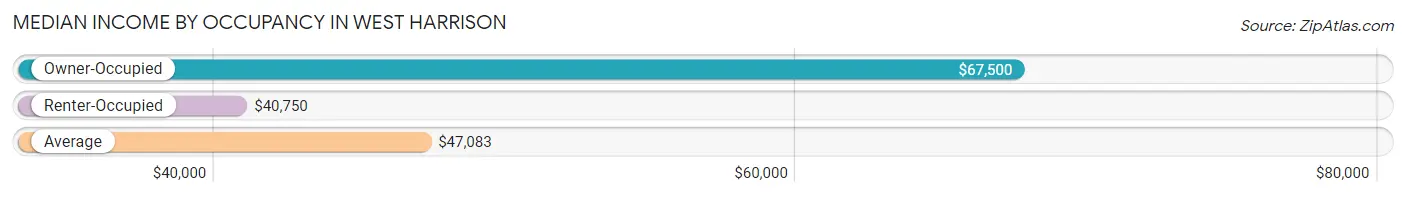
| Occupancy Type | # Households | Median Income |
| Owner-Occupied | 62 (42.8%) | $67,500 |
| Renter-Occupied | 83 (57.2%) | $40,750 |
| Average | 145 (100.0%) | $47,083 |
Occupancy by Householder Income Bracket in West Harrison
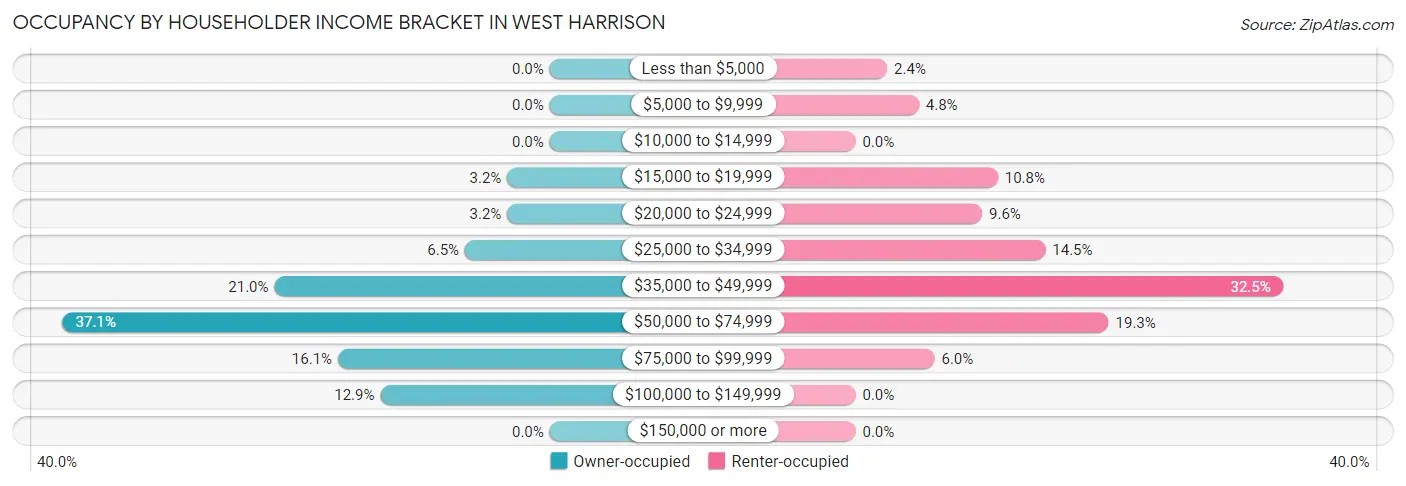
| Income Bracket | Owner-occupied | Renter-occupied |
| Less than $5,000 | 0 (0.0%) | 2 (2.4%) |
| $5,000 to $9,999 | 0 (0.0%) | 4 (4.8%) |
| $10,000 to $14,999 | 0 (0.0%) | 0 (0.0%) |
| $15,000 to $19,999 | 2 (3.2%) | 9 (10.8%) |
| $20,000 to $24,999 | 2 (3.2%) | 8 (9.6%) |
| $25,000 to $34,999 | 4 (6.5%) | 12 (14.5%) |
| $35,000 to $49,999 | 13 (21.0%) | 27 (32.5%) |
| $50,000 to $74,999 | 23 (37.1%) | 16 (19.3%) |
| $75,000 to $99,999 | 10 (16.1%) | 5 (6.0%) |
| $100,000 to $149,999 | 8 (12.9%) | 0 (0.0%) |
| $150,000 or more | 0 (0.0%) | 0 (0.0%) |
| Total | 62 (100.0%) | 83 (100.0%) |
Monthly Housing Cost Tiers in West Harrison
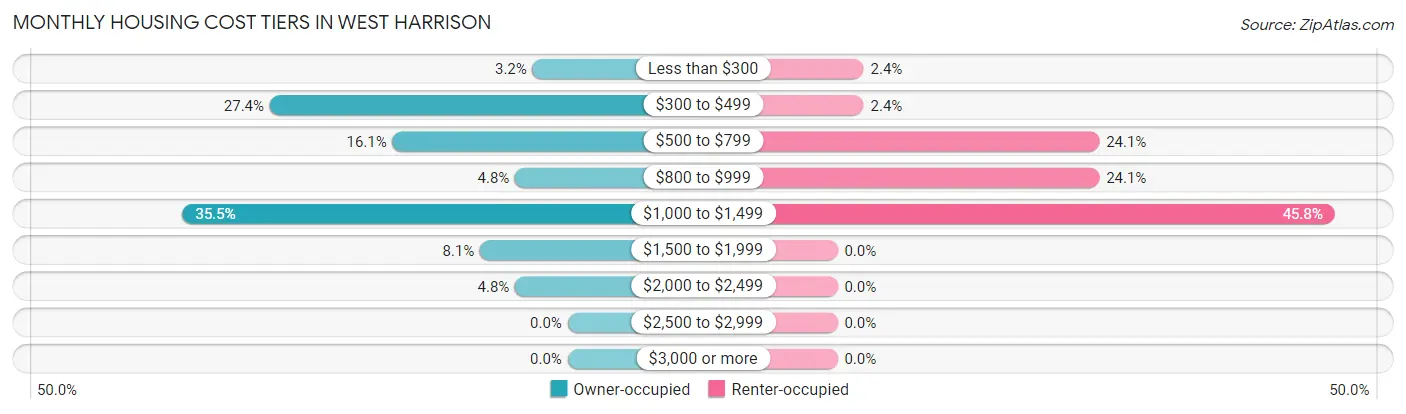
| Monthly Cost | Owner-occupied | Renter-occupied |
| Less than $300 | 2 (3.2%) | 2 (2.4%) |
| $300 to $499 | 17 (27.4%) | 2 (2.4%) |
| $500 to $799 | 10 (16.1%) | 20 (24.1%) |
| $800 to $999 | 3 (4.8%) | 20 (24.1%) |
| $1,000 to $1,499 | 22 (35.5%) | 38 (45.8%) |
| $1,500 to $1,999 | 5 (8.1%) | 0 (0.0%) |
| $2,000 to $2,499 | 3 (4.8%) | 0 (0.0%) |
| $2,500 to $2,999 | 0 (0.0%) | 0 (0.0%) |
| $3,000 or more | 0 (0.0%) | 0 (0.0%) |
| Total | 62 (100.0%) | 83 (100.0%) |
Physical Housing Characteristics in West Harrison
Housing Structures in West Harrison
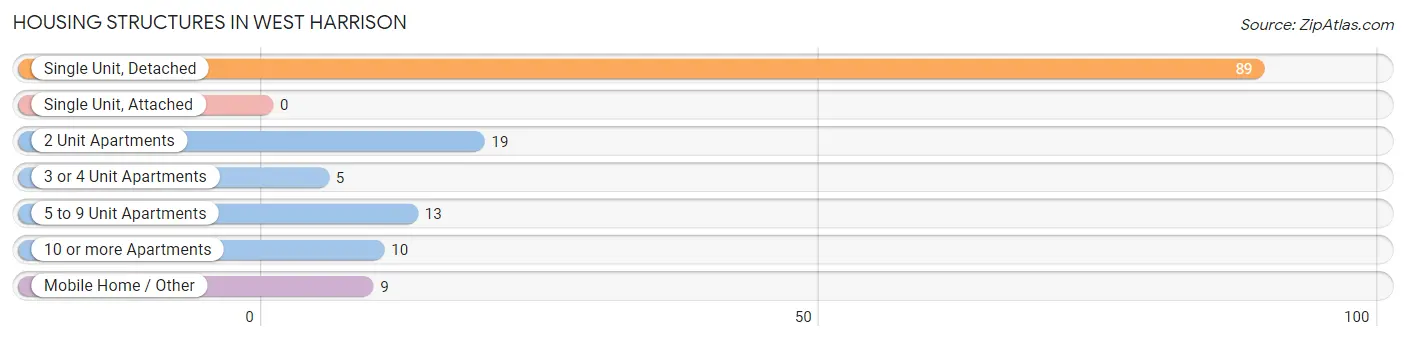
| Structure Type | # Housing Units | % Housing Units |
| Single Unit, Detached | 89 | 61.4% |
| Single Unit, Attached | 0 | 0.0% |
| 2 Unit Apartments | 19 | 13.1% |
| 3 or 4 Unit Apartments | 5 | 3.5% |
| 5 to 9 Unit Apartments | 13 | 9.0% |
| 10 or more Apartments | 10 | 6.9% |
| Mobile Home / Other | 9 | 6.2% |
| Total | 145 | 100.0% |
Housing Structures by Occupancy in West Harrison
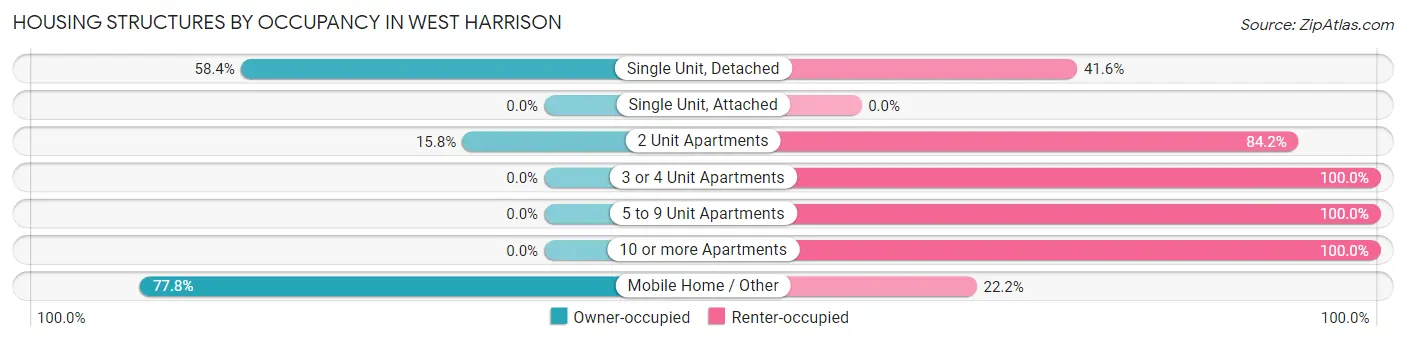
| Structure Type | Owner-occupied | Renter-occupied |
| Single Unit, Detached | 52 (58.4%) | 37 (41.6%) |
| Single Unit, Attached | 0 (0.0%) | 0 (0.0%) |
| 2 Unit Apartments | 3 (15.8%) | 16 (84.2%) |
| 3 or 4 Unit Apartments | 0 (0.0%) | 5 (100.0%) |
| 5 to 9 Unit Apartments | 0 (0.0%) | 13 (100.0%) |
| 10 or more Apartments | 0 (0.0%) | 10 (100.0%) |
| Mobile Home / Other | 7 (77.8%) | 2 (22.2%) |
| Total | 62 (42.8%) | 83 (57.2%) |
Housing Structures by Number of Rooms in West Harrison
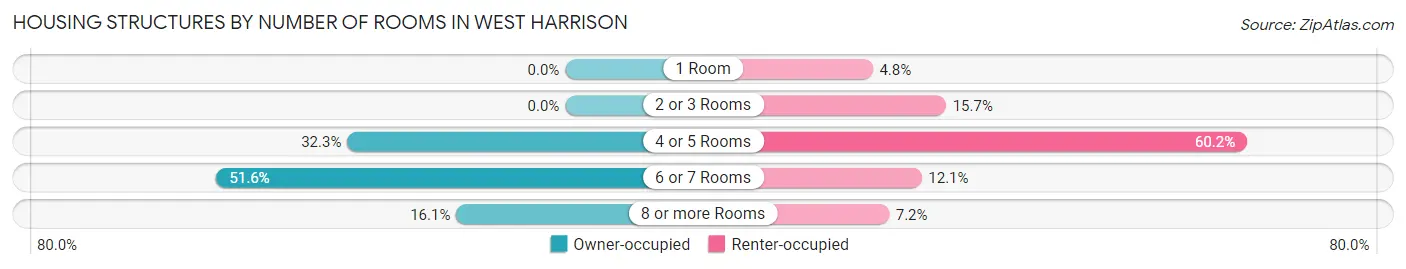
| Number of Rooms | Owner-occupied | Renter-occupied |
| 1 Room | 0 (0.0%) | 4 (4.8%) |
| 2 or 3 Rooms | 0 (0.0%) | 13 (15.7%) |
| 4 or 5 Rooms | 20 (32.3%) | 50 (60.2%) |
| 6 or 7 Rooms | 32 (51.6%) | 10 (12.0%) |
| 8 or more Rooms | 10 (16.1%) | 6 (7.2%) |
| Total | 62 (100.0%) | 83 (100.0%) |
Housing Structure by Heating Type in West Harrison
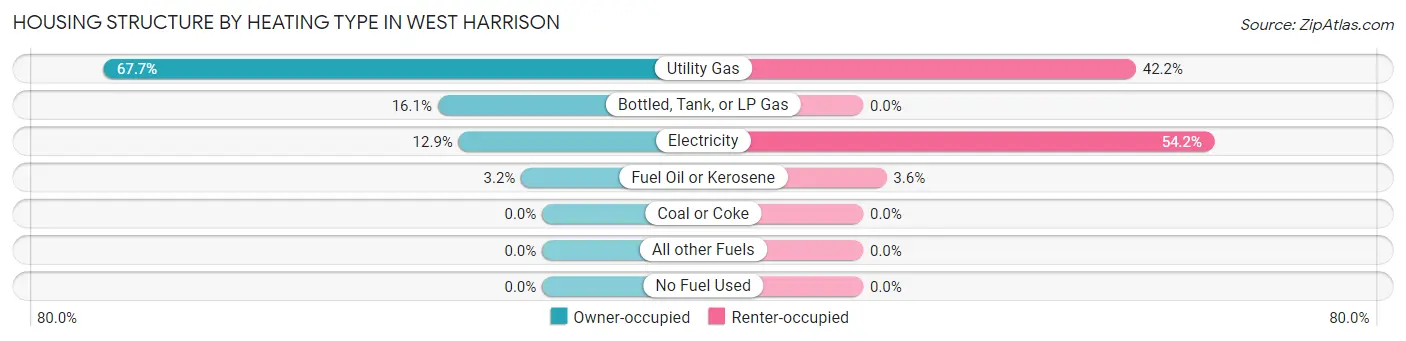
| Heating Type | Owner-occupied | Renter-occupied |
| Utility Gas | 42 (67.7%) | 35 (42.2%) |
| Bottled, Tank, or LP Gas | 10 (16.1%) | 0 (0.0%) |
| Electricity | 8 (12.9%) | 45 (54.2%) |
| Fuel Oil or Kerosene | 2 (3.2%) | 3 (3.6%) |
| Coal or Coke | 0 (0.0%) | 0 (0.0%) |
| All other Fuels | 0 (0.0%) | 0 (0.0%) |
| No Fuel Used | 0 (0.0%) | 0 (0.0%) |
| Total | 62 (100.0%) | 83 (100.0%) |
Household Vehicle Usage in West Harrison
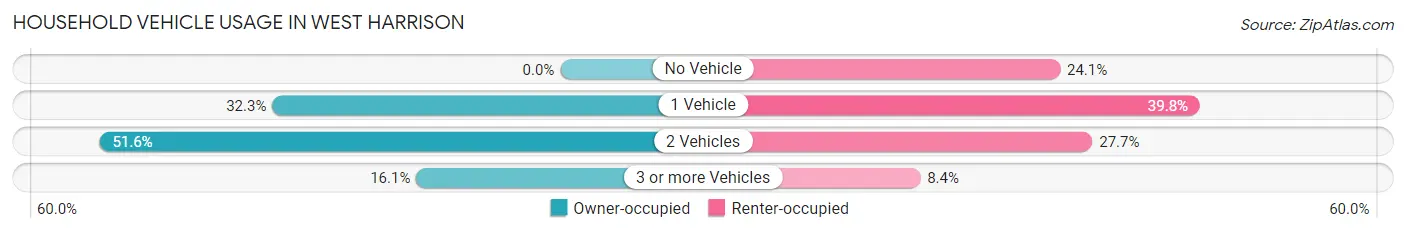
| Vehicles per Household | Owner-occupied | Renter-occupied |
| No Vehicle | 0 (0.0%) | 20 (24.1%) |
| 1 Vehicle | 20 (32.3%) | 33 (39.8%) |
| 2 Vehicles | 32 (51.6%) | 23 (27.7%) |
| 3 or more Vehicles | 10 (16.1%) | 7 (8.4%) |
| Total | 62 (100.0%) | 83 (100.0%) |
Real Estate & Mortgages in West Harrison
Real Estate and Mortgage Overview in West Harrison
| Characteristic | Without Mortgage | With Mortgage |
| Housing Units | 21 | 41 |
| Median Property Value | $109,400 | $146,300 |
| Median Household Income | $48,125 | $0 |
| Monthly Housing Costs | $358 | $0 |
| Real Estate Taxes | $614 | $0 |
Property Value by Mortgage Status in West Harrison
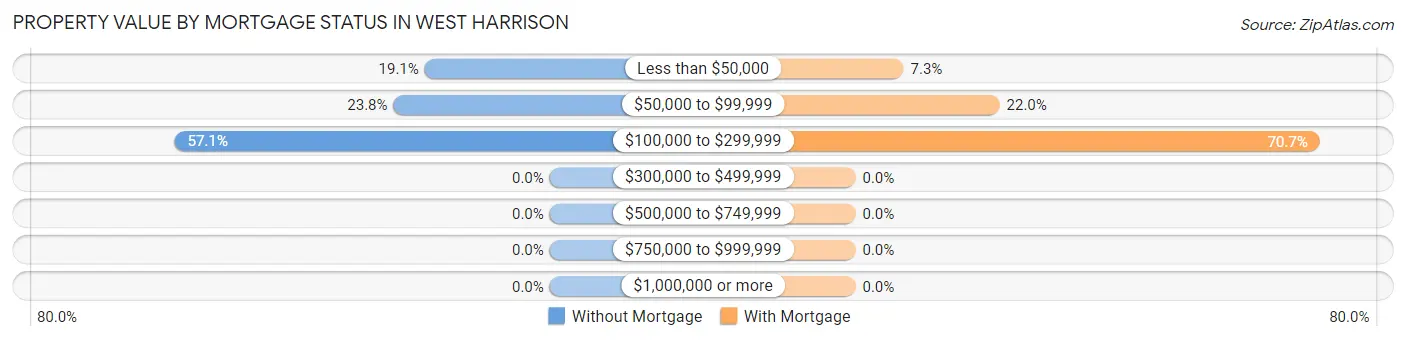
| Property Value | Without Mortgage | With Mortgage |
| Less than $50,000 | 4 (19.1%) | 3 (7.3%) |
| $50,000 to $99,999 | 5 (23.8%) | 9 (22.0%) |
| $100,000 to $299,999 | 12 (57.1%) | 29 (70.7%) |
| $300,000 to $499,999 | 0 (0.0%) | 0 (0.0%) |
| $500,000 to $749,999 | 0 (0.0%) | 0 (0.0%) |
| $750,000 to $999,999 | 0 (0.0%) | 0 (0.0%) |
| $1,000,000 or more | 0 (0.0%) | 0 (0.0%) |
| Total | 21 (100.0%) | 41 (100.0%) |
Household Income by Mortgage Status in West Harrison
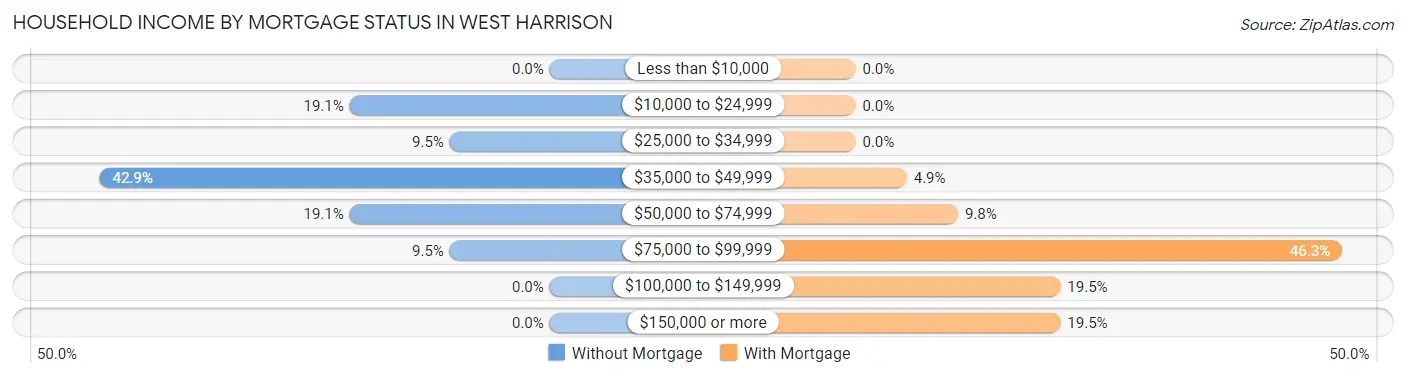
| Household Income | Without Mortgage | With Mortgage |
| Less than $10,000 | 0 (0.0%) | 0 (0.0%) |
| $10,000 to $24,999 | 4 (19.1%) | 0 (0.0%) |
| $25,000 to $34,999 | 2 (9.5%) | 0 (0.0%) |
| $35,000 to $49,999 | 9 (42.9%) | 2 (4.9%) |
| $50,000 to $74,999 | 4 (19.1%) | 4 (9.8%) |
| $75,000 to $99,999 | 2 (9.5%) | 19 (46.3%) |
| $100,000 to $149,999 | 0 (0.0%) | 8 (19.5%) |
| $150,000 or more | 0 (0.0%) | 8 (19.5%) |
| Total | 21 (100.0%) | 41 (100.0%) |
Property Value to Household Income Ratio in West Harrison
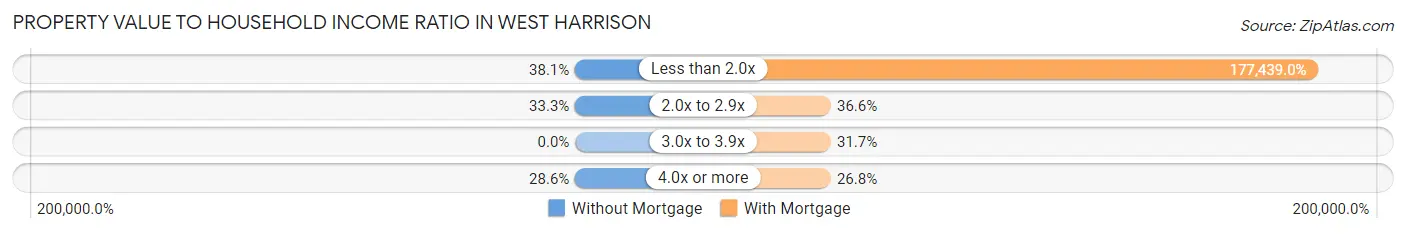
| Value-to-Income Ratio | Without Mortgage | With Mortgage |
| Less than 2.0x | 8 (38.1%) | 72,750 (177,439.0%) |
| 2.0x to 2.9x | 7 (33.3%) | 15 (36.6%) |
| 3.0x to 3.9x | 0 (0.0%) | 13 (31.7%) |
| 4.0x or more | 6 (28.6%) | 11 (26.8%) |
| Total | 21 (100.0%) | 41 (100.0%) |
Real Estate Taxes by Mortgage Status in West Harrison
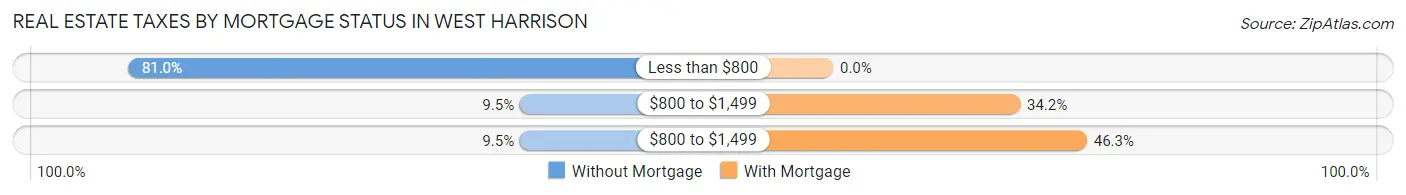
| Property Taxes | Without Mortgage | With Mortgage |
| Less than $800 | 17 (80.9%) | 0 (0.0%) |
| $800 to $1,499 | 2 (9.5%) | 14 (34.2%) |
| $800 to $1,499 | 2 (9.5%) | 19 (46.3%) |
| Total | 21 (100.0%) | 41 (100.0%) |
Health & Disability in West Harrison
Health Insurance Coverage by Age in West Harrison
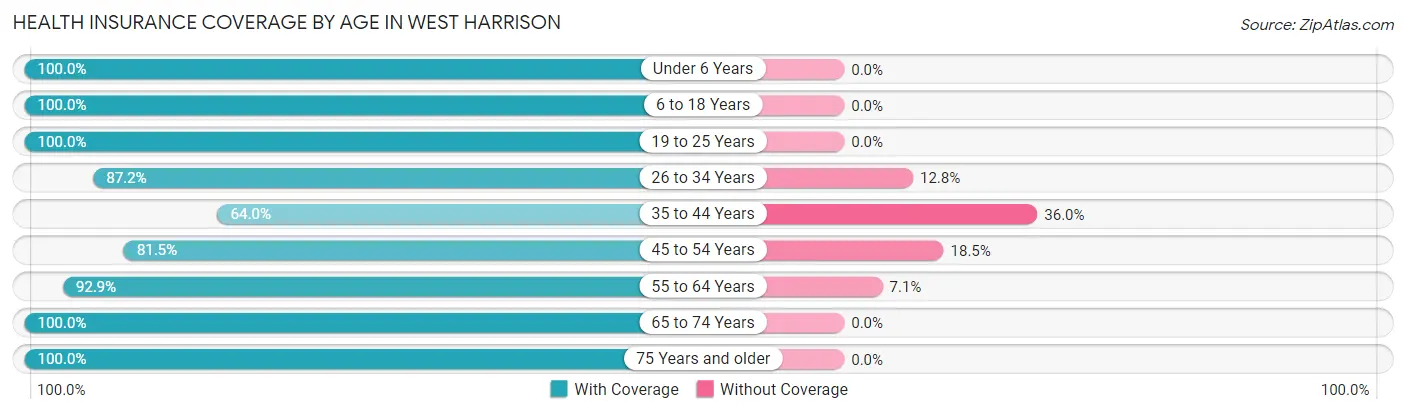
| Age Bracket | With Coverage | Without Coverage |
| Under 6 Years | 44 (100.0%) | 0 (0.0%) |
| 6 to 18 Years | 59 (100.0%) | 0 (0.0%) |
| 19 to 25 Years | 38 (100.0%) | 0 (0.0%) |
| 26 to 34 Years | 34 (87.2%) | 5 (12.8%) |
| 35 to 44 Years | 16 (64.0%) | 9 (36.0%) |
| 45 to 54 Years | 22 (81.5%) | 5 (18.5%) |
| 55 to 64 Years | 39 (92.9%) | 3 (7.1%) |
| 65 to 74 Years | 31 (100.0%) | 0 (0.0%) |
| 75 Years and older | 17 (100.0%) | 0 (0.0%) |
| Total | 300 (93.2%) | 22 (6.8%) |
Health Insurance Coverage by Citizenship Status in West Harrison
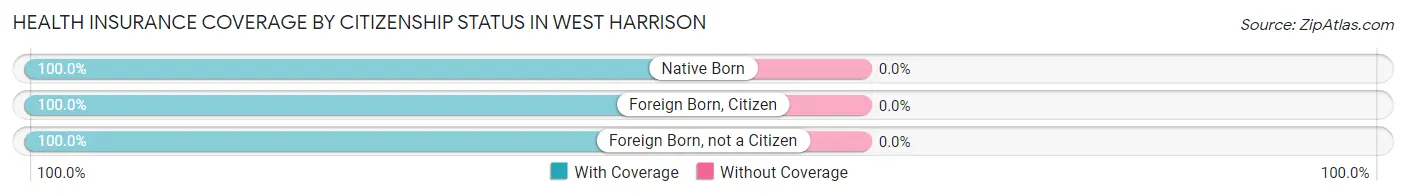
| Citizenship Status | With Coverage | Without Coverage |
| Native Born | 44 (100.0%) | 0 (0.0%) |
| Foreign Born, Citizen | 59 (100.0%) | 0 (0.0%) |
| Foreign Born, not a Citizen | 38 (100.0%) | 0 (0.0%) |
Health Insurance Coverage by Household Income in West Harrison
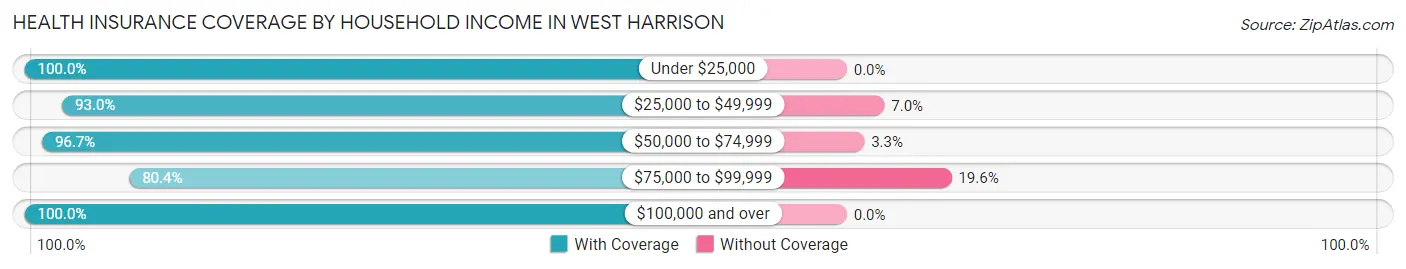
| Household Income | With Coverage | Without Coverage |
| Under $25,000 | 32 (100.0%) | 0 (0.0%) |
| $25,000 to $49,999 | 119 (93.0%) | 9 (7.0%) |
| $50,000 to $74,999 | 89 (96.7%) | 3 (3.3%) |
| $75,000 to $99,999 | 41 (80.4%) | 10 (19.6%) |
| $100,000 and over | 19 (100.0%) | 0 (0.0%) |
Public vs Private Health Insurance Coverage by Age in West Harrison
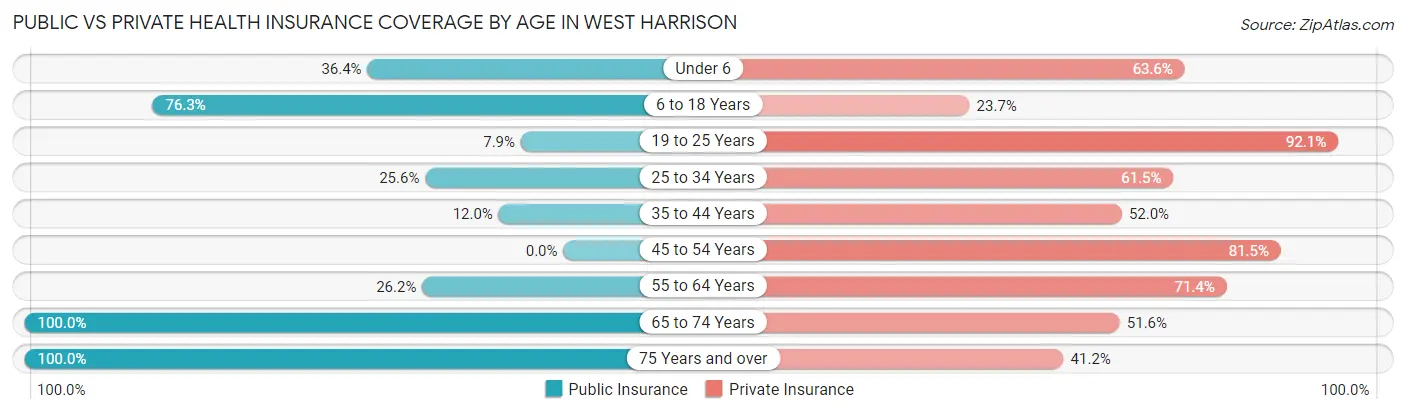
| Age Bracket | Public Insurance | Private Insurance |
| Under 6 | 16 (36.4%) | 28 (63.6%) |
| 6 to 18 Years | 45 (76.3%) | 14 (23.7%) |
| 19 to 25 Years | 3 (7.9%) | 35 (92.1%) |
| 25 to 34 Years | 10 (25.6%) | 24 (61.5%) |
| 35 to 44 Years | 3 (12.0%) | 13 (52.0%) |
| 45 to 54 Years | 0 (0.0%) | 22 (81.5%) |
| 55 to 64 Years | 11 (26.2%) | 30 (71.4%) |
| 65 to 74 Years | 31 (100.0%) | 16 (51.6%) |
| 75 Years and over | 17 (100.0%) | 7 (41.2%) |
| Total | 136 (42.2%) | 189 (58.7%) |
Disability Status by Sex by Age in West Harrison
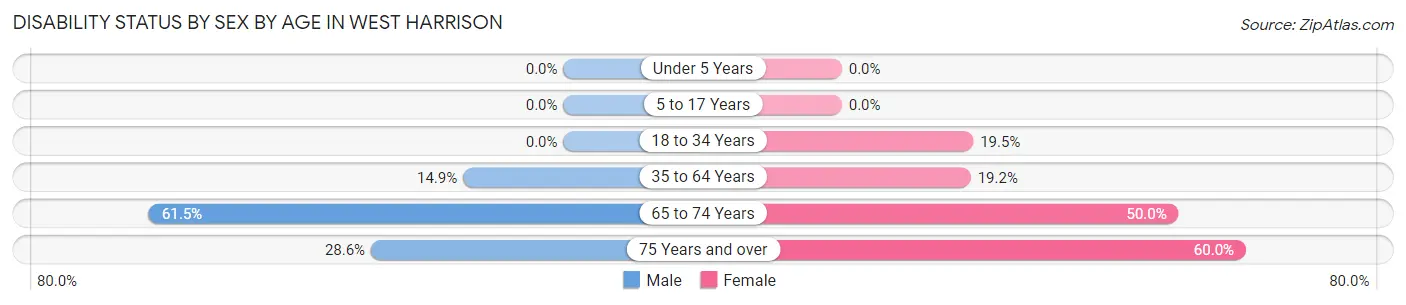
| Age Bracket | Male | Female |
| Under 5 Years | 0 (0.0%) | 0 (0.0%) |
| 5 to 17 Years | 0 (0.0%) | 0 (0.0%) |
| 18 to 34 Years | 0 (0.0%) | 8 (19.5%) |
| 35 to 64 Years | 7 (14.9%) | 9 (19.2%) |
| 65 to 74 Years | 8 (61.5%) | 9 (50.0%) |
| 75 Years and over | 2 (28.6%) | 6 (60.0%) |
Disability Class by Sex by Age in West Harrison
Disability Class: Hearing Difficulty
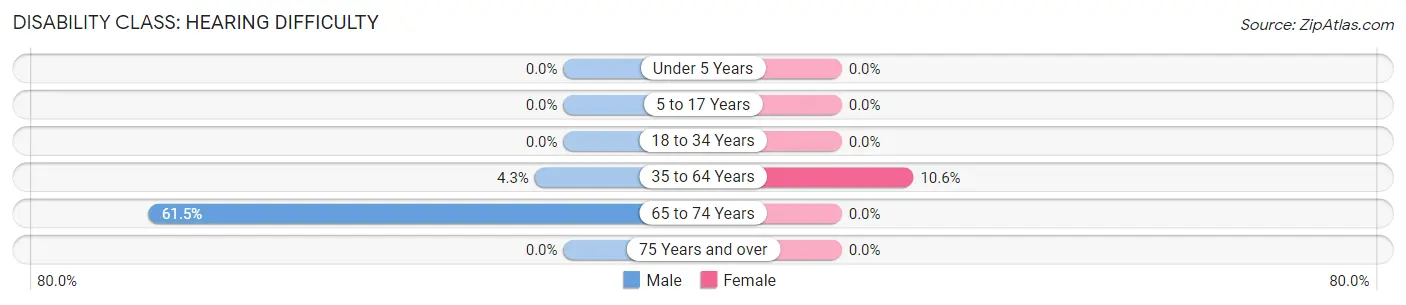
| Age Bracket | Male | Female |
| Under 5 Years | 0 (0.0%) | 0 (0.0%) |
| 5 to 17 Years | 0 (0.0%) | 0 (0.0%) |
| 18 to 34 Years | 0 (0.0%) | 0 (0.0%) |
| 35 to 64 Years | 2 (4.3%) | 5 (10.6%) |
| 65 to 74 Years | 8 (61.5%) | 0 (0.0%) |
| 75 Years and over | 0 (0.0%) | 0 (0.0%) |
Disability Class: Vision Difficulty
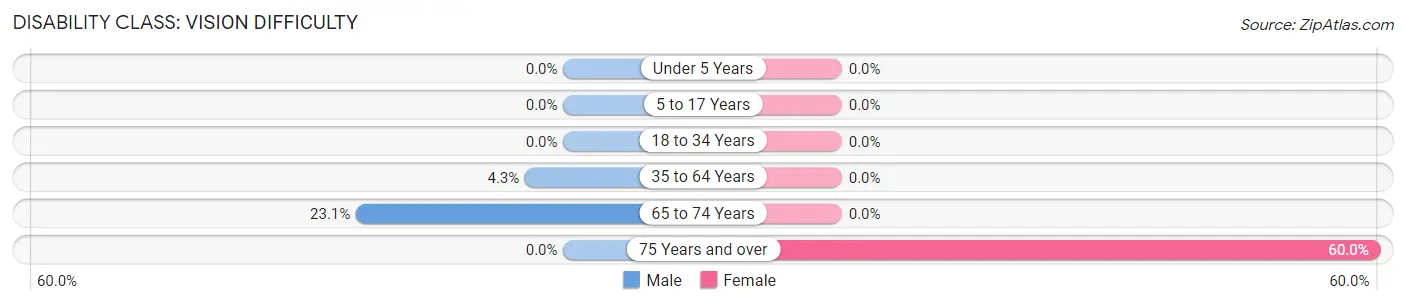
| Age Bracket | Male | Female |
| Under 5 Years | 0 (0.0%) | 0 (0.0%) |
| 5 to 17 Years | 0 (0.0%) | 0 (0.0%) |
| 18 to 34 Years | 0 (0.0%) | 0 (0.0%) |
| 35 to 64 Years | 2 (4.3%) | 0 (0.0%) |
| 65 to 74 Years | 3 (23.1%) | 0 (0.0%) |
| 75 Years and over | 0 (0.0%) | 6 (60.0%) |
Disability Class: Cognitive Difficulty
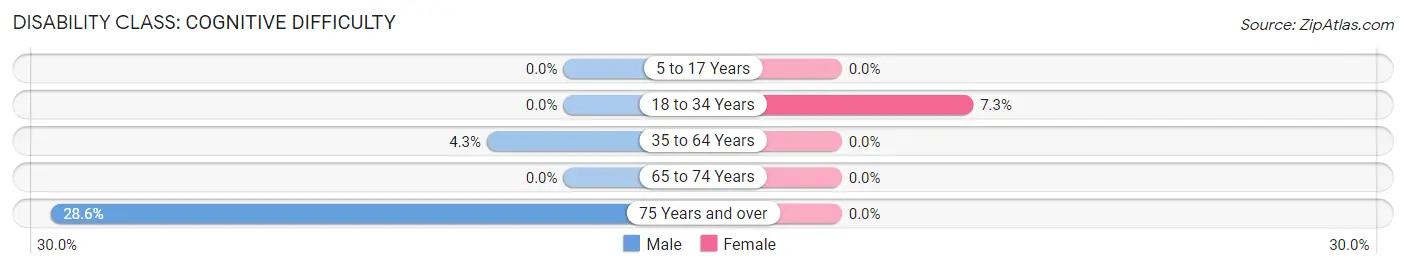
| Age Bracket | Male | Female |
| 5 to 17 Years | 0 (0.0%) | 0 (0.0%) |
| 18 to 34 Years | 0 (0.0%) | 3 (7.3%) |
| 35 to 64 Years | 2 (4.3%) | 0 (0.0%) |
| 65 to 74 Years | 0 (0.0%) | 0 (0.0%) |
| 75 Years and over | 2 (28.6%) | 0 (0.0%) |
Disability Class: Ambulatory Difficulty
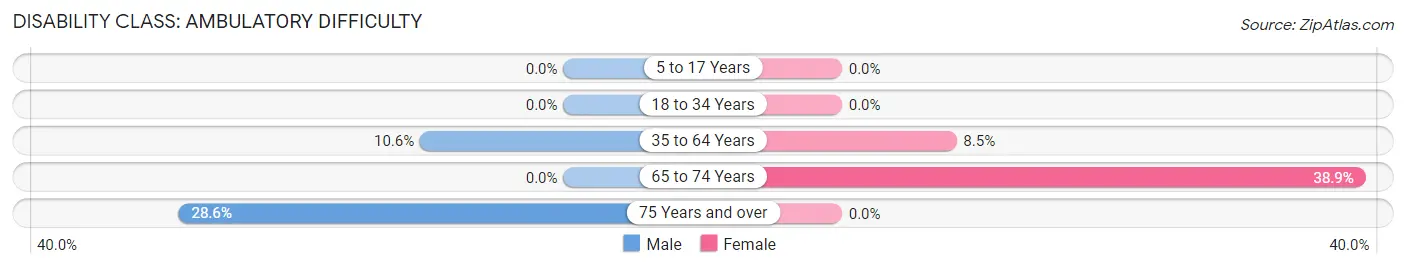
| Age Bracket | Male | Female |
| 5 to 17 Years | 0 (0.0%) | 0 (0.0%) |
| 18 to 34 Years | 0 (0.0%) | 0 (0.0%) |
| 35 to 64 Years | 5 (10.6%) | 4 (8.5%) |
| 65 to 74 Years | 0 (0.0%) | 7 (38.9%) |
| 75 Years and over | 2 (28.6%) | 0 (0.0%) |
Disability Class: Self-Care Difficulty
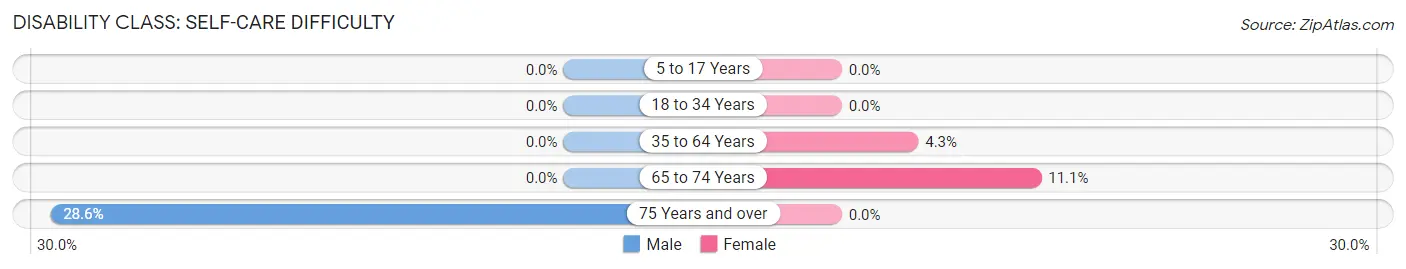
| Age Bracket | Male | Female |
| 5 to 17 Years | 0 (0.0%) | 0 (0.0%) |
| 18 to 34 Years | 0 (0.0%) | 0 (0.0%) |
| 35 to 64 Years | 0 (0.0%) | 2 (4.3%) |
| 65 to 74 Years | 0 (0.0%) | 2 (11.1%) |
| 75 Years and over | 2 (28.6%) | 0 (0.0%) |
Technology Access in West Harrison
Computing Device Access in West Harrison
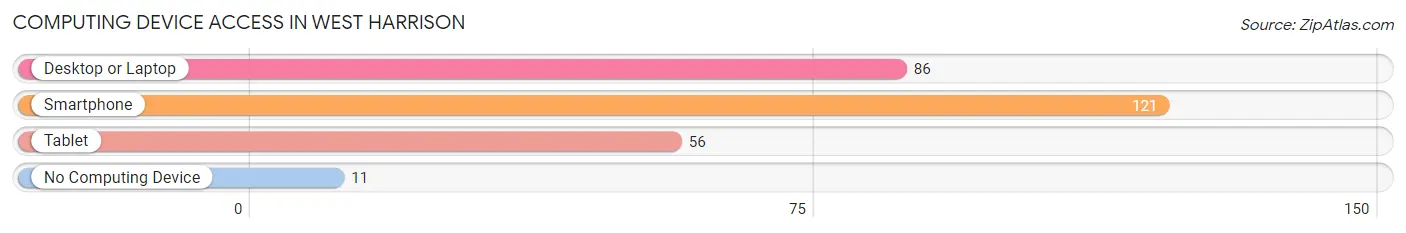
| Device Type | # Households | % Households |
| Desktop or Laptop | 86 | 59.3% |
| Smartphone | 121 | 83.5% |
| Tablet | 56 | 38.6% |
| No Computing Device | 11 | 7.6% |
| Total | 145 | 100.0% |
Internet Access in West Harrison
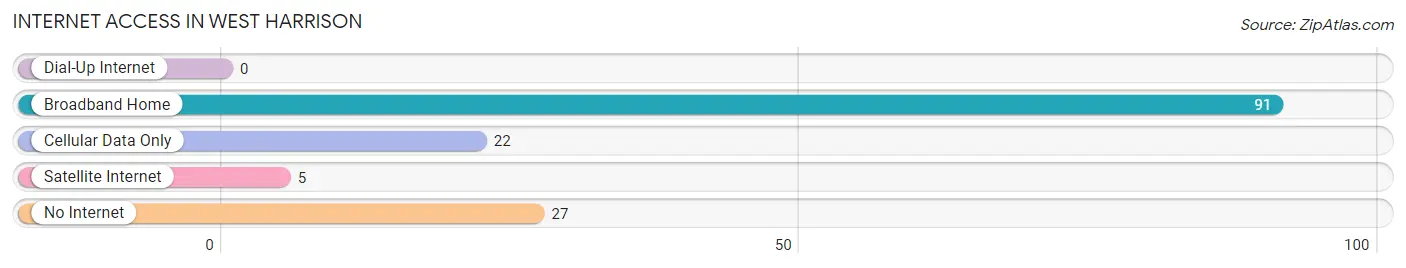
| Internet Type | # Households | % Households |
| Dial-Up Internet | 0 | 0.0% |
| Broadband Home | 91 | 62.8% |
| Cellular Data Only | 22 | 15.2% |
| Satellite Internet | 5 | 3.5% |
| No Internet | 27 | 18.6% |
| Total | 145 | 100.0% |
West Harrison Summary
Harrison County, Indiana is located in the southwestern corner of the state, and is bordered by the Ohio River to the west and the Kentucky state line to the south. The county seat is Corydon, and the largest city is New Albany. West Harrison is an unincorporated community located in the western part of the county, near the Ohio River.
History
Harrison County was formed in 1808 from parts of Knox and Clark counties. It was named for William Henry Harrison, the ninth president of the United States. The county was originally divided into two townships, Harrison and Jackson. West Harrison was part of the Harrison Township.
The first settlers in the area were mostly of German and Irish descent. The first permanent settlement was established in 1809 by John and Mary Ann Miller. The Millers built a log cabin near the Ohio River, and the area became known as Miller’s Landing.
In 1811, the first post office was established in the area, and the name was changed to West Harrison. The town was officially platted in 1817, and the first school was built in 1820.
Geography
West Harrison is located in the western part of Harrison County, near the Ohio River. The town is situated on a ridge overlooking the river. The terrain is mostly flat, with some rolling hills. The climate is humid continental, with hot summers and cold winters.
The town is located within the Bluegrass region of Kentucky, and is part of the Louisville metropolitan area. The nearest major cities are Louisville, Kentucky (25 miles to the south) and Cincinnati, Ohio (50 miles to the north).
Economy
West Harrison’s economy is largely based on agriculture and manufacturing. The town is home to several small businesses, including a feed mill, a sawmill, and a furniture factory. The town also has a few retail stores, including a grocery store and a hardware store.
The town is also home to several farms, which produce corn, soybeans, wheat, and hay. The town is also home to a few wineries, which produce wine from locally grown grapes.
Demographics
As of the 2010 census, West Harrison had a population of 1,845. The racial makeup of the town was 97.3% White, 0.7% African American, 0.3% Native American, 0.2% Asian, and 1.5% from other races. Hispanic or Latino of any race were 1.2% of the population.
The median household income in West Harrison was $45,938, and the median family income was $51,250. The per capita income was $20,945. About 8.3% of families and 10.2% of the population were below the poverty line, including 14.2% of those under age 18 and 8.2% of those age 65 or over.
Common Questions
What is Per Capita Income in West Harrison?
Per Capita income in West Harrison is $22,791.
What is the Median Family Income in West Harrison?
Median Family Income in West Harrison is $50,500.
What is the Median Household income in West Harrison?
Median Household Income in West Harrison is $47,083.
What is Income or Wage Gap in West Harrison?
Income or Wage Gap in West Harrison is 4.4%.
Women in West Harrison earn 95.6 cents for every dollar earned by a man.
What is Inequality or Gini Index in West Harrison?
Inequality or Gini Index in West Harrison is 0.30.
What is the Total Population of West Harrison?
Total Population of West Harrison is 322.
What is the Total Male Population of West Harrison?
Total Male Population of West Harrison is 156.
What is the Total Female Population of West Harrison?
Total Female Population of West Harrison is 166.
What is the Ratio of Males per 100 Females in West Harrison?
There are 93.98 Males per 100 Females in West Harrison.
What is the Ratio of Females per 100 Males in West Harrison?
There are 106.41 Females per 100 Males in West Harrison.
What is the Median Population Age in West Harrison?
Median Population Age in West Harrison is 29.6 Years.
What is the Average Family Size in West Harrison
Average Family Size in West Harrison is 2.9 People.
What is the Average Household Size in West Harrison
Average Household Size in West Harrison is 2.2 People.
How Large is the Labor Force in West Harrison?
There are 156 People in the Labor Forcein in West Harrison.
What is the Percentage of People in the Labor Force in West Harrison?
63.9% of People are in the Labor Force in West Harrison.
What is the Unemployment Rate in West Harrison?
Unemployment Rate in West Harrison is 5.8%.