Lyons, IN Map & Demographics
Lyons Map
Lyons Overview
$31,326
PER CAPITA INCOME
$63,309
AVG FAMILY INCOME
$49,176
AVG HOUSEHOLD INCOME
41.1%
WAGE / INCOME GAP [ % ]
58.9¢/ $1
WAGE / INCOME GAP [ $ ]
$8,563
FAMILY INCOME DEFICIT
0.52
INEQUALITY / GINI INDEX
802
TOTAL POPULATION
406
MALE POPULATION
396
FEMALE POPULATION
102.53
MALES / 100 FEMALES
97.54
FEMALES / 100 MALES
43.3
MEDIAN AGE
3.1
AVG FAMILY SIZE
2.5
AVG HOUSEHOLD SIZE
409
LABOR FORCE [ PEOPLE ]
60.9%
PERCENT IN LABOR FORCE
3.7%
UNEMPLOYMENT RATE
Lyons Zip Codes
Lyons Area Codes
Income in Lyons
Income Overview in Lyons
Per Capita Income in Lyons is $31,326, while median incomes of families and households are $63,309 and $49,176 respectively.
| Characteristic | Number | Measure |
| Per Capita Income | 802 | $31,326 |
| Median Family Income | 187 | $63,309 |
| Mean Family Income | 187 | $103,597 |
| Median Household Income | 295 | $49,176 |
| Mean Household Income | 295 | $79,674 |
| Income Deficit | 187 | $8,563 |
| Wage / Income Gap (%) | 802 | 41.07% |
| Wage / Income Gap ($) | 802 | 58.93¢ per $1 |
| Gini / Inequality Index | 802 | 0.52 |
Earnings by Sex in Lyons
Average Earnings in Lyons are $27,500, $36,058 for men and $21,250 for women, a difference of 41.1%.
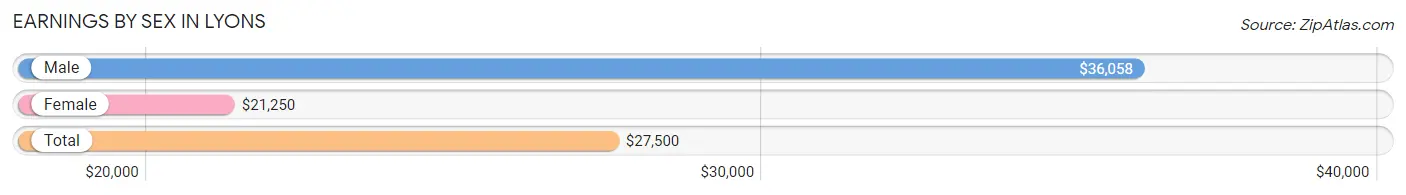
| Sex | Number | Average Earnings |
| Male | 225 (54.3%) | $36,058 |
| Female | 189 (45.7%) | $21,250 |
| Total | 414 (100.0%) | $27,500 |
Earnings by Sex by Income Bracket in Lyons
The most common earnings brackets in Lyons are $12,500 to $14,999 for men (38 | 16.9%) and $12,500 to $14,999 for women (34 | 18.0%).
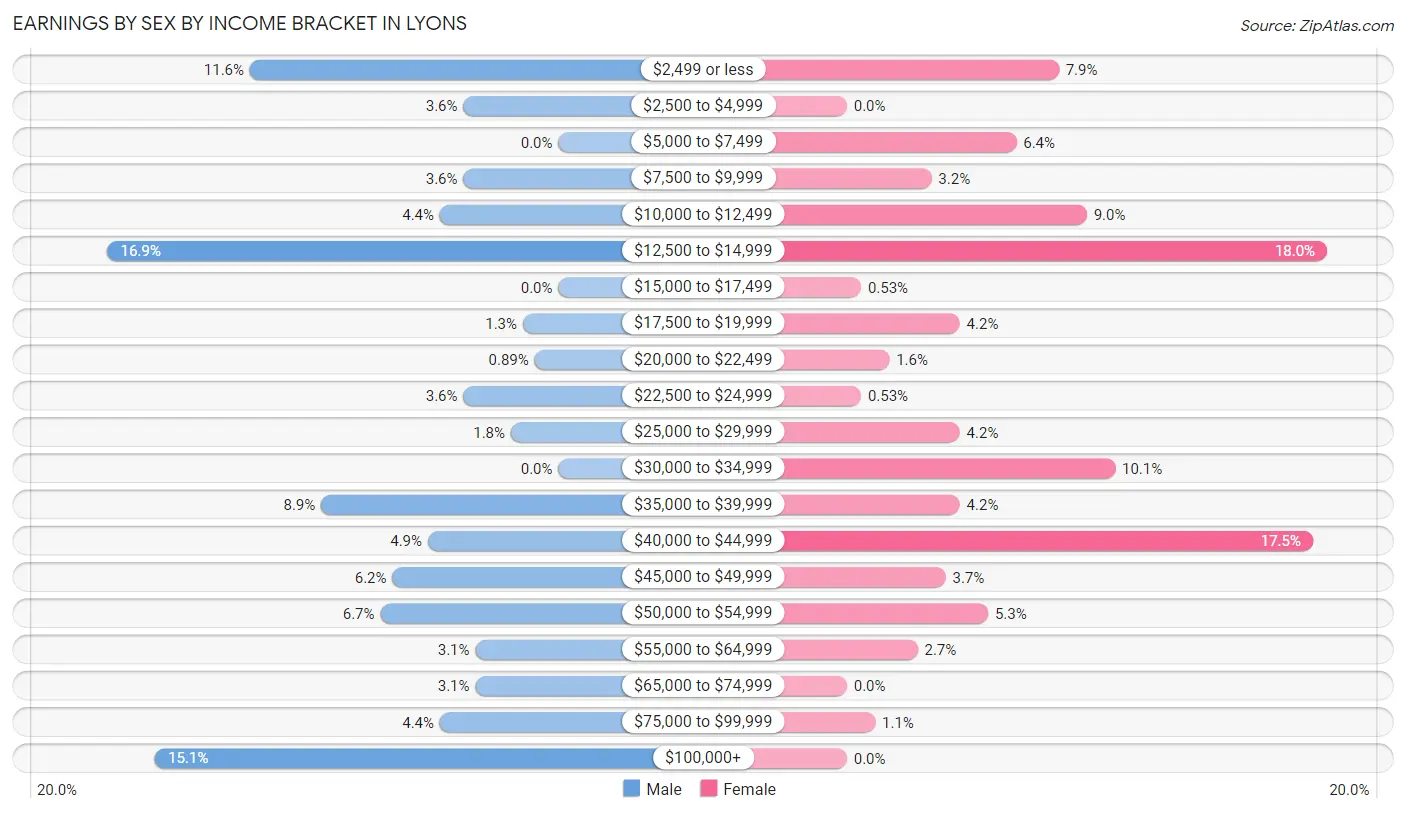
| Income | Male | Female |
| $2,499 or less | 26 (11.6%) | 15 (7.9%) |
| $2,500 to $4,999 | 8 (3.6%) | 0 (0.0%) |
| $5,000 to $7,499 | 0 (0.0%) | 12 (6.4%) |
| $7,500 to $9,999 | 8 (3.6%) | 6 (3.2%) |
| $10,000 to $12,499 | 10 (4.4%) | 17 (9.0%) |
| $12,500 to $14,999 | 38 (16.9%) | 34 (18.0%) |
| $15,000 to $17,499 | 0 (0.0%) | 1 (0.5%) |
| $17,500 to $19,999 | 3 (1.3%) | 8 (4.2%) |
| $20,000 to $22,499 | 2 (0.9%) | 3 (1.6%) |
| $22,500 to $24,999 | 8 (3.6%) | 1 (0.5%) |
| $25,000 to $29,999 | 4 (1.8%) | 8 (4.2%) |
| $30,000 to $34,999 | 0 (0.0%) | 19 (10.1%) |
| $35,000 to $39,999 | 20 (8.9%) | 8 (4.2%) |
| $40,000 to $44,999 | 11 (4.9%) | 33 (17.5%) |
| $45,000 to $49,999 | 14 (6.2%) | 7 (3.7%) |
| $50,000 to $54,999 | 15 (6.7%) | 10 (5.3%) |
| $55,000 to $64,999 | 7 (3.1%) | 5 (2.6%) |
| $65,000 to $74,999 | 7 (3.1%) | 0 (0.0%) |
| $75,000 to $99,999 | 10 (4.4%) | 2 (1.1%) |
| $100,000+ | 34 (15.1%) | 0 (0.0%) |
| Total | 225 (100.0%) | 189 (100.0%) |
Earnings by Sex by Educational Attainment in Lyons
Average earnings in Lyons are $36,923 for men and $26,964 for women, a difference of 27.0%. Men with an educational attainment of bachelor's degree enjoy the highest average annual earnings of $53,571, while those with high school diploma education earn the least with $36,346. Women with an educational attainment of high school diploma earn the most with the average annual earnings of $33,750, while those with less than high school education have the smallest earnings of $33,482.
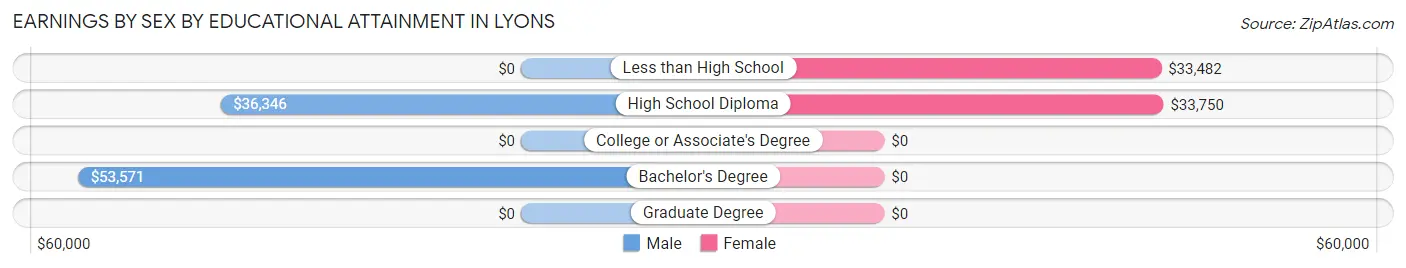
| Educational Attainment | Male Income | Female Income |
| Less than High School | - | - |
| High School Diploma | $36,346 | $33,750 |
| College or Associate's Degree | - | - |
| Bachelor's Degree | $53,571 | $0 |
| Graduate Degree | - | - |
| Total | $36,923 | $26,964 |
Family Income in Lyons
Family Income Brackets in Lyons
According to the Lyons family income data, there are 41 families falling into the $100,000 to $149,999 income range, which is the most common income bracket and makes up 21.9% of all families.
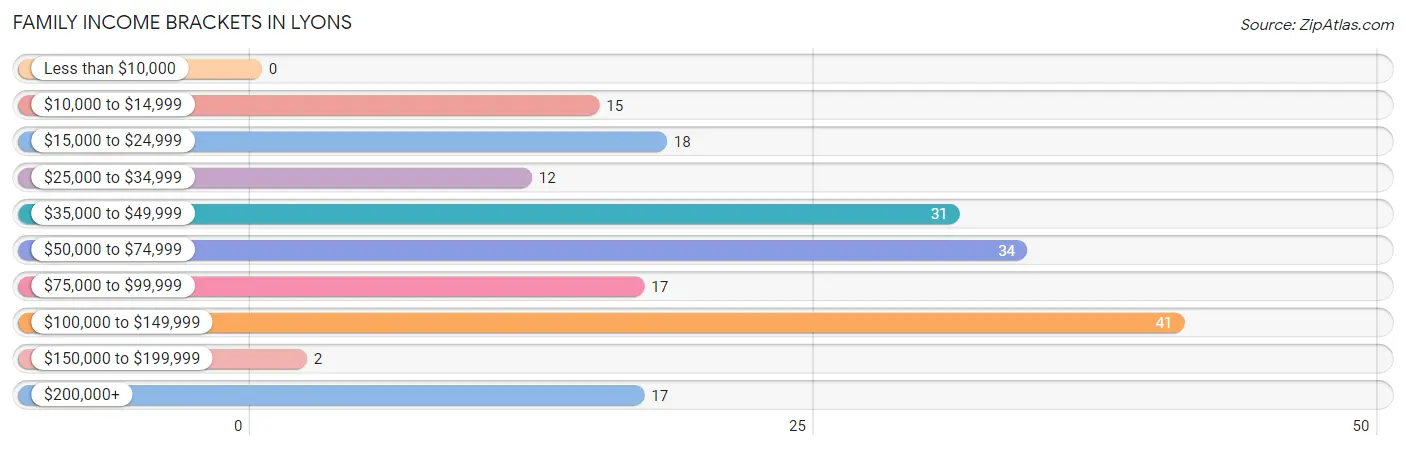
| Income Bracket | # Families | % Families |
| Less than $10,000 | 0 | 0.0% |
| $10,000 to $14,999 | 15 | 8.0% |
| $15,000 to $24,999 | 18 | 9.6% |
| $25,000 to $34,999 | 12 | 6.4% |
| $35,000 to $49,999 | 31 | 16.6% |
| $50,000 to $74,999 | 34 | 18.2% |
| $75,000 to $99,999 | 17 | 9.1% |
| $100,000 to $149,999 | 41 | 21.9% |
| $150,000 to $199,999 | 2 | 1.1% |
| $200,000+ | 17 | 9.1% |
Family Income by Famaliy Size in Lyons
4-person families (66 | 35.3%) account for the highest median family income in Lyons with $57,143 per family, while 2-person families (55 | 29.4%) have the highest median income of $24,062 per family member.
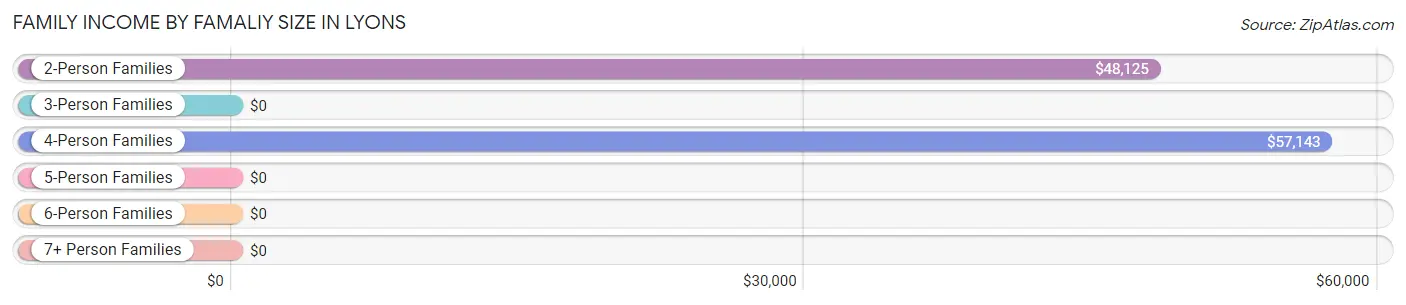
| Income Bracket | # Families | Median Income |
| 2-Person Families | 55 (29.4%) | $48,125 |
| 3-Person Families | 43 (23.0%) | $0 |
| 4-Person Families | 66 (35.3%) | $57,143 |
| 5-Person Families | 23 (12.3%) | $0 |
| 6-Person Families | 0 (0.0%) | $0 |
| 7+ Person Families | 0 (0.0%) | $0 |
| Total | 187 (100.0%) | $63,309 |
Family Income by Number of Earners in Lyons
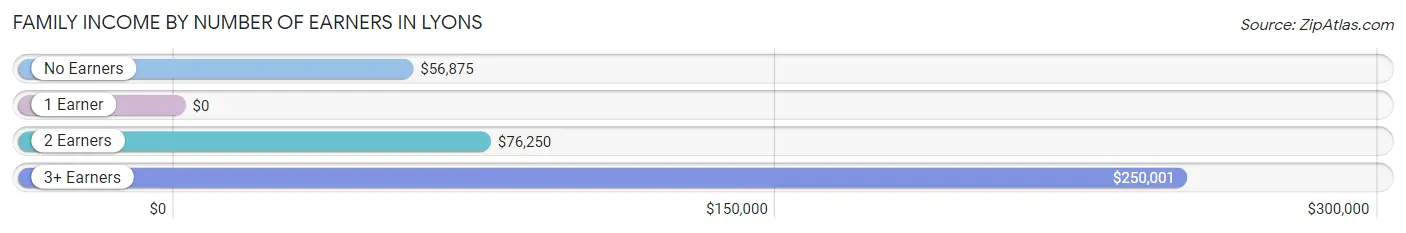
| Number of Earners | # Families | Median Income |
| No Earners | 37 (19.8%) | $56,875 |
| 1 Earner | 36 (19.3%) | $0 |
| 2 Earners | 82 (43.9%) | $76,250 |
| 3+ Earners | 32 (17.1%) | $250,001 |
| Total | 187 (100.0%) | $63,309 |
Household Income in Lyons
Household Income Brackets in Lyons
With 55 households falling in the category, the $35,000 to $49,999 income range is the most frequent in Lyons, accounting for 18.6% of all households. In contrast, only 6 households (2.0%) fall into the $150,000 to $199,999 income bracket, making it the least populous group.
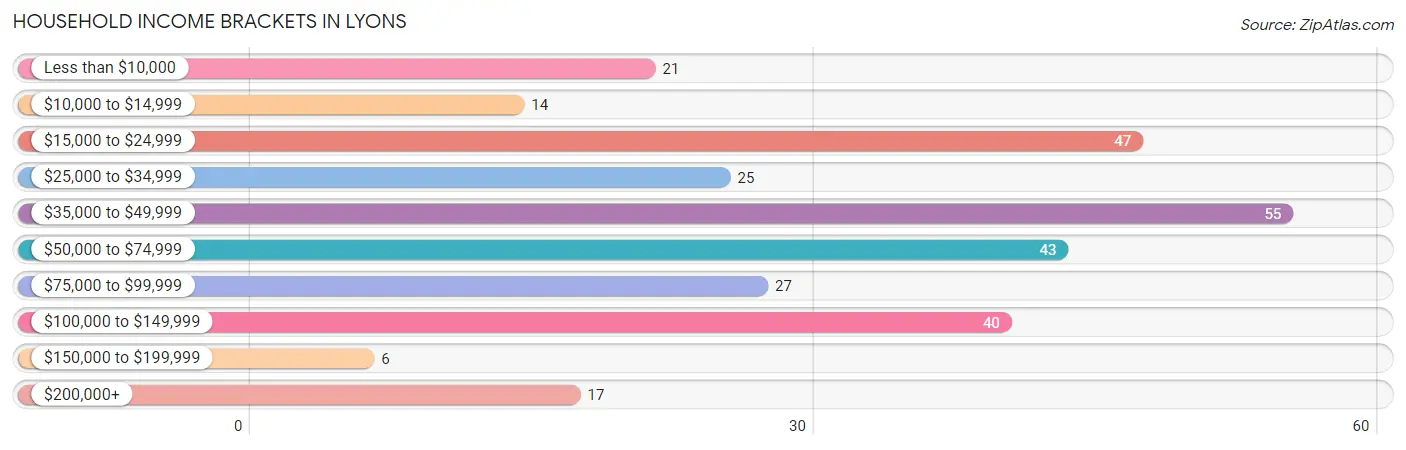
| Income Bracket | # Households | % Households |
| Less than $10,000 | 21 | 7.1% |
| $10,000 to $14,999 | 14 | 4.7% |
| $15,000 to $24,999 | 47 | 15.9% |
| $25,000 to $34,999 | 25 | 8.5% |
| $35,000 to $49,999 | 55 | 18.6% |
| $50,000 to $74,999 | 43 | 14.6% |
| $75,000 to $99,999 | 27 | 9.2% |
| $100,000 to $149,999 | 40 | 13.6% |
| $150,000 to $199,999 | 6 | 2.0% |
| $200,000+ | 17 | 5.8% |
Household Income by Householder Age in Lyons
The median household income in Lyons is $49,176, with the highest median household income of $63,167 found in the 45 to 64 years age bracket for the primary householder. A total of 132 households (44.8%) fall into this category.
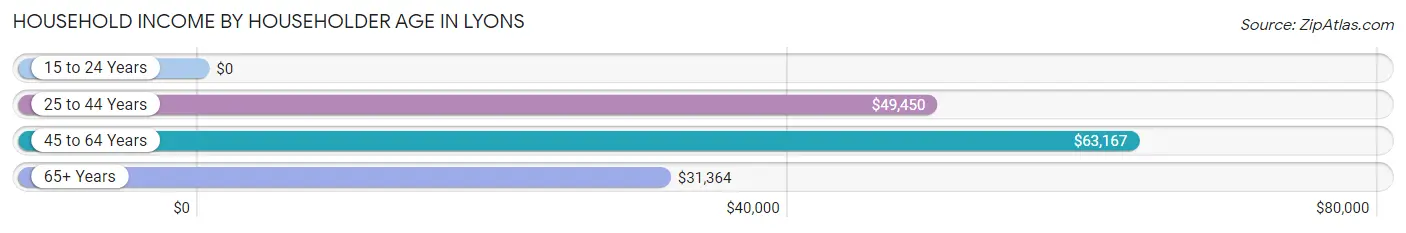
| Income Bracket | # Households | Median Income |
| 15 to 24 Years | 0 (0.0%) | $0 |
| 25 to 44 Years | 97 (32.9%) | $49,450 |
| 45 to 64 Years | 132 (44.8%) | $63,167 |
| 65+ Years | 66 (22.4%) | $31,364 |
| Total | 295 (100.0%) | $49,176 |
Poverty in Lyons
Income Below Poverty by Sex and Age in Lyons
With 18.3% poverty level for males and 20.5% for females among the residents of Lyons, 12 to 14 year old males and under 5 year old females are the most vulnerable to poverty, with 5 males (71.4%) and 6 females (50.0%) in their respective age groups living below the poverty level.
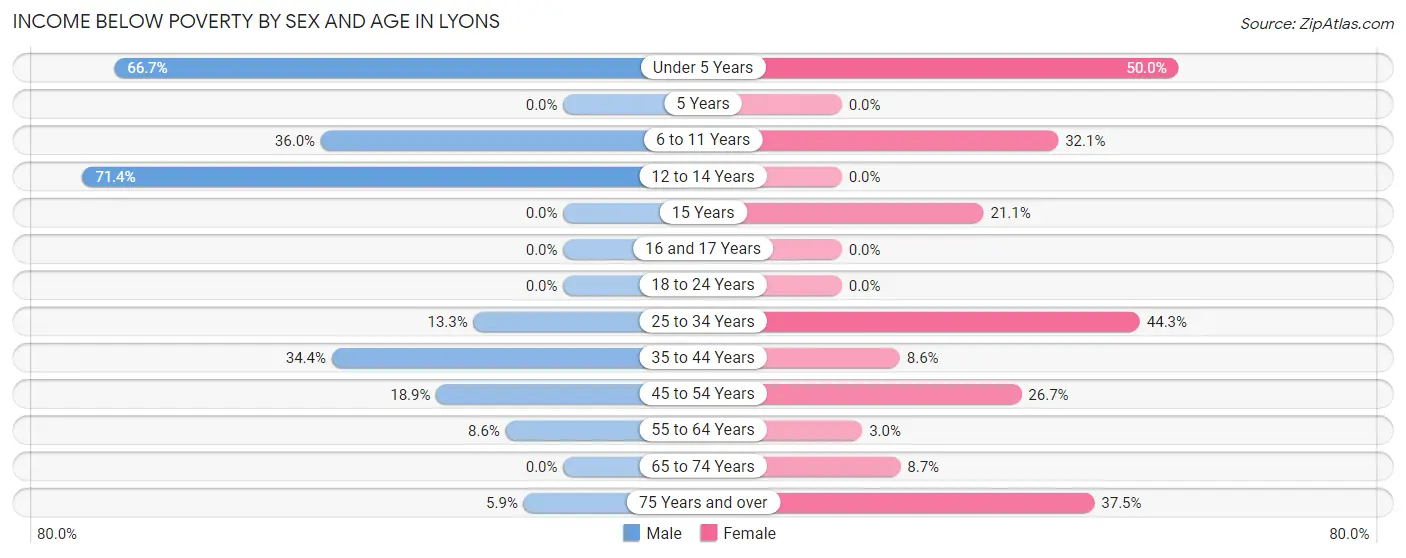
| Age Bracket | Male | Female |
| Under 5 Years | 12 (66.7%) | 6 (50.0%) |
| 5 Years | 0 (0.0%) | 0 (0.0%) |
| 6 to 11 Years | 9 (36.0%) | 9 (32.1%) |
| 12 to 14 Years | 5 (71.4%) | 0 (0.0%) |
| 15 Years | 0 (0.0%) | 4 (21.0%) |
| 16 and 17 Years | 0 (0.0%) | 0 (0.0%) |
| 18 to 24 Years | 0 (0.0%) | 0 (0.0%) |
| 25 to 34 Years | 10 (13.3%) | 27 (44.3%) |
| 35 to 44 Years | 11 (34.4%) | 5 (8.6%) |
| 45 to 54 Years | 10 (18.9%) | 8 (26.7%) |
| 55 to 64 Years | 6 (8.6%) | 2 (3.0%) |
| 65 to 74 Years | 0 (0.0%) | 2 (8.7%) |
| 75 Years and over | 1 (5.9%) | 15 (37.5%) |
| Total | 64 (18.3%) | 78 (20.5%) |
Income Above Poverty by Sex and Age in Lyons
According to the poverty statistics in Lyons, males aged 5 years and females aged 5 years are the age groups that are most secure financially, with 100.0% of males and 100.0% of females in these age groups living above the poverty line.
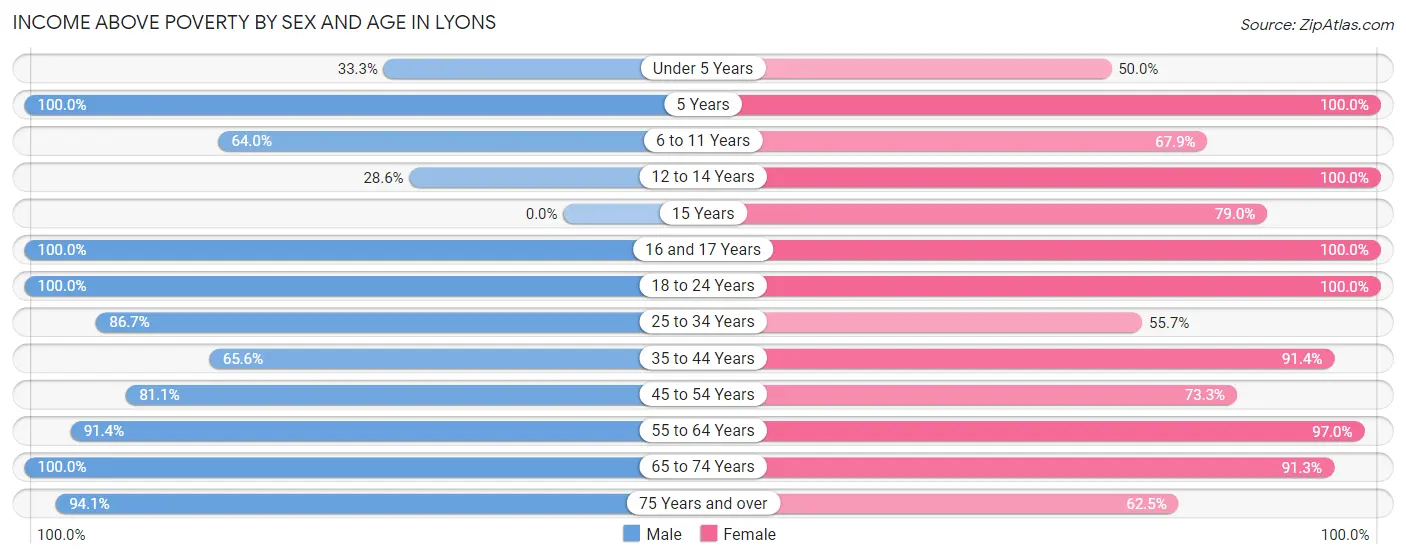
| Age Bracket | Male | Female |
| Under 5 Years | 6 (33.3%) | 6 (50.0%) |
| 5 Years | 3 (100.0%) | 5 (100.0%) |
| 6 to 11 Years | 16 (64.0%) | 19 (67.9%) |
| 12 to 14 Years | 2 (28.6%) | 13 (100.0%) |
| 15 Years | 0 (0.0%) | 15 (78.9%) |
| 16 and 17 Years | 12 (100.0%) | 11 (100.0%) |
| 18 to 24 Years | 18 (100.0%) | 14 (100.0%) |
| 25 to 34 Years | 65 (86.7%) | 34 (55.7%) |
| 35 to 44 Years | 21 (65.6%) | 53 (91.4%) |
| 45 to 54 Years | 43 (81.1%) | 22 (73.3%) |
| 55 to 64 Years | 64 (91.4%) | 64 (97.0%) |
| 65 to 74 Years | 20 (100.0%) | 21 (91.3%) |
| 75 Years and over | 16 (94.1%) | 25 (62.5%) |
| Total | 286 (81.7%) | 302 (79.5%) |
Income Below Poverty Among Married-Couple Families in Lyons
The poverty statistics for married-couple families in Lyons show that 10.2% or 16 of the total 157 families live below the poverty line. Families with 3 or 4 children have the highest poverty rate of 31.2%, comprising of 5 families. On the other hand, families with 1 or 2 children have the lowest poverty rate of 0.0%, which includes 0 families.
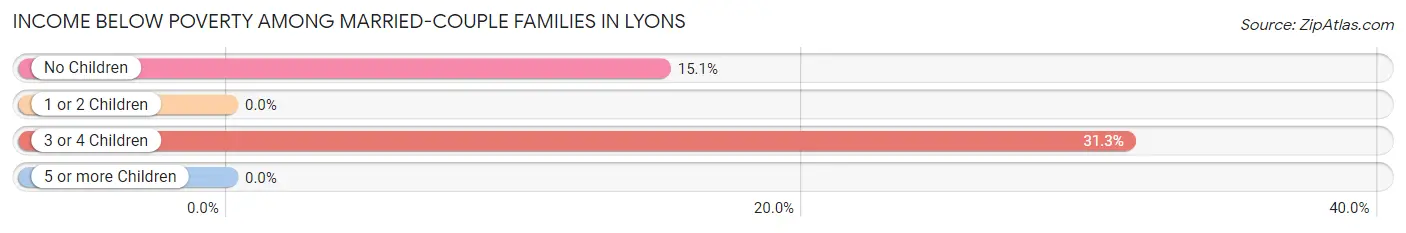
| Children | Above Poverty | Below Poverty |
| No Children | 62 (84.9%) | 11 (15.1%) |
| 1 or 2 Children | 68 (100.0%) | 0 (0.0%) |
| 3 or 4 Children | 11 (68.8%) | 5 (31.2%) |
| 5 or more Children | 0 (0.0%) | 0 (0.0%) |
| Total | 141 (89.8%) | 16 (10.2%) |
Income Below Poverty Among Single-Parent Households in Lyons
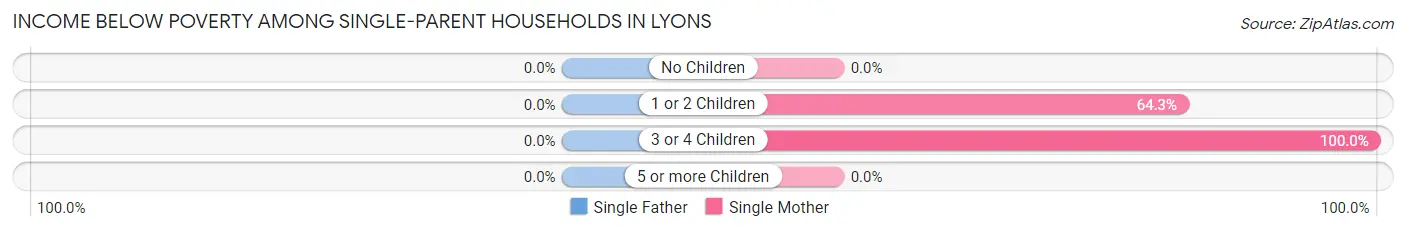
| Children | Single Father | Single Mother |
| No Children | 0 (0.0%) | 0 (0.0%) |
| 1 or 2 Children | 0 (0.0%) | 9 (64.3%) |
| 3 or 4 Children | 0 (0.0%) | 5 (100.0%) |
| 5 or more Children | 0 (0.0%) | 0 (0.0%) |
| Total | 0 (0.0%) | 14 (60.9%) |
Income Below Poverty Among Married-Couple vs Single-Parent Households in Lyons
The poverty data for Lyons shows that 16 of the married-couple family households (10.2%) and 14 of the single-parent households (46.7%) are living below the poverty level. Within the married-couple family households, those with 3 or 4 children have the highest poverty rate, with 5 households (31.2%) falling below the poverty line. Among the single-parent households, those with 3 or 4 children have the highest poverty rate, with 5 household (100.0%) living below poverty.
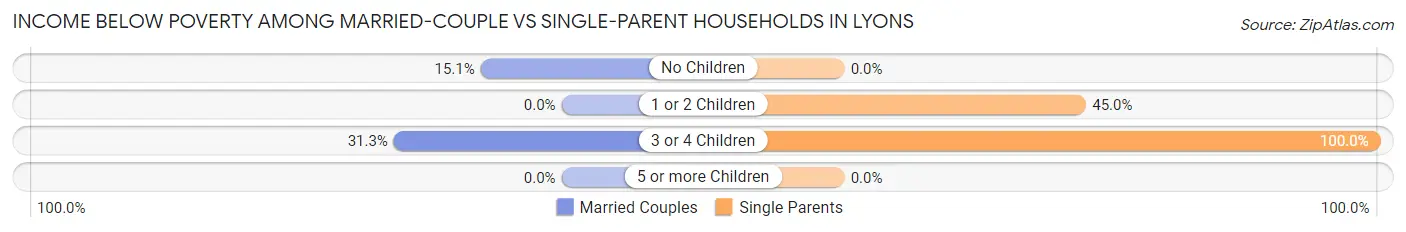
| Children | Married-Couple Families | Single-Parent Households |
| No Children | 11 (15.1%) | 0 (0.0%) |
| 1 or 2 Children | 0 (0.0%) | 9 (45.0%) |
| 3 or 4 Children | 5 (31.2%) | 5 (100.0%) |
| 5 or more Children | 0 (0.0%) | 0 (0.0%) |
| Total | 16 (10.2%) | 14 (46.7%) |
Race in Lyons
The most populous races in Lyons are White / Caucasian (715 | 89.1%), Hispanic or Latino (79 | 9.9%), and Some other Race (36 | 4.5%).
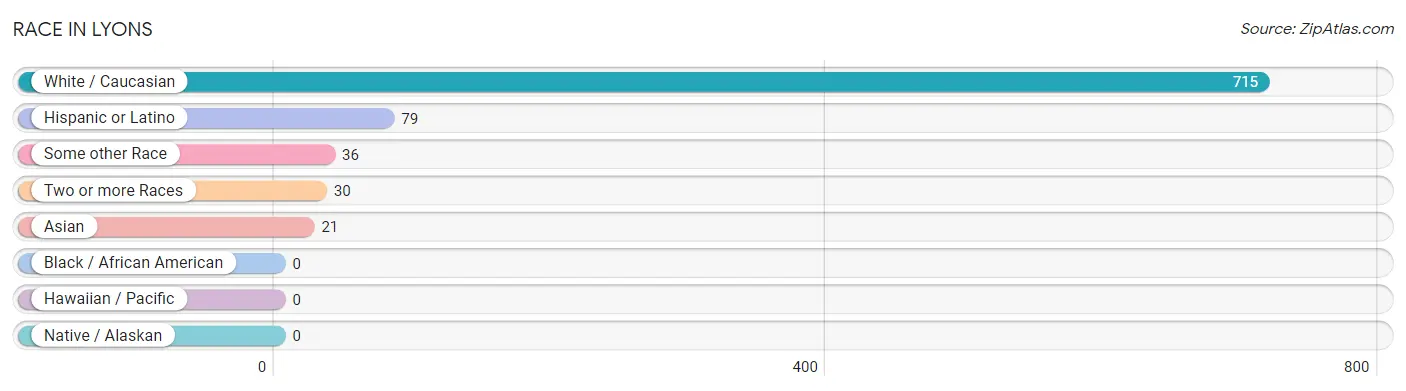
| Race | # Population | % Population |
| Asian | 21 | 2.6% |
| Black / African American | 0 | 0.0% |
| Hawaiian / Pacific | 0 | 0.0% |
| Hispanic or Latino | 79 | 9.9% |
| Native / Alaskan | 0 | 0.0% |
| White / Caucasian | 715 | 89.1% |
| Two or more Races | 30 | 3.7% |
| Some other Race | 36 | 4.5% |
| Total | 802 | 100.0% |
Ancestry in Lyons
The most populous ancestries reported in Lyons are German (199 | 24.8%), English (105 | 13.1%), Welsh (63 | 7.9%), Central American (62 | 7.7%), and Irish (57 | 7.1%), together accounting for 60.6% of all Lyons residents.
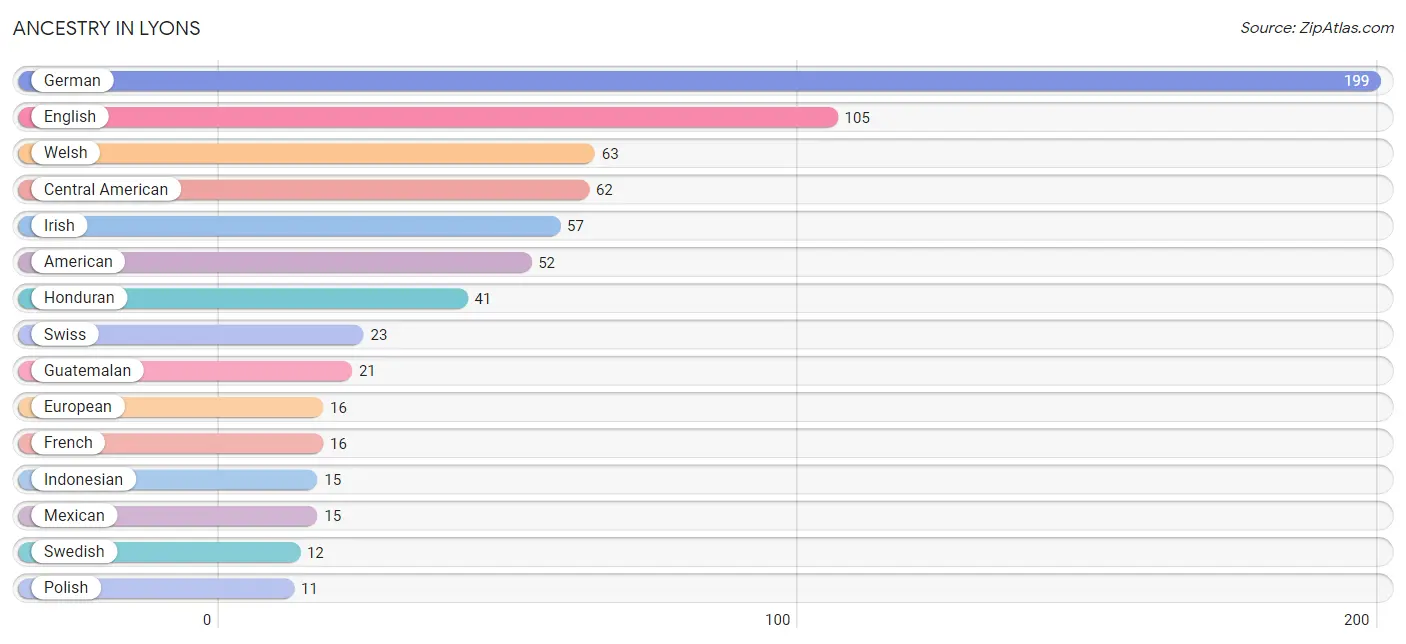
| Ancestry | # Population | % Population |
| American | 52 | 6.5% |
| Blackfeet | 5 | 0.6% |
| Central American | 62 | 7.7% |
| Cherokee | 8 | 1.0% |
| Croatian | 1 | 0.1% |
| Dutch | 2 | 0.3% |
| English | 105 | 13.1% |
| European | 16 | 2.0% |
| French | 16 | 2.0% |
| German | 199 | 24.8% |
| Guatemalan | 21 | 2.6% |
| Honduran | 41 | 5.1% |
| Indonesian | 15 | 1.9% |
| Iranian | 3 | 0.4% |
| Irish | 57 | 7.1% |
| Korean | 6 | 0.7% |
| Mexican | 15 | 1.9% |
| Polish | 11 | 1.4% |
| Scotch-Irish | 7 | 0.9% |
| Scottish | 6 | 0.7% |
| Spanish | 2 | 0.3% |
| Swedish | 12 | 1.5% |
| Swiss | 23 | 2.9% |
| Welsh | 63 | 7.9% | View All 24 Rows |
Immigrants in Lyons
The most numerous immigrant groups reported in Lyons came from Central America (48 | 6.0%), Latin America (48 | 6.0%), Honduras (25 | 3.1%), Asia (21 | 2.6%), and Guatemala (21 | 2.6%), together accounting for 20.3% of all Lyons residents.
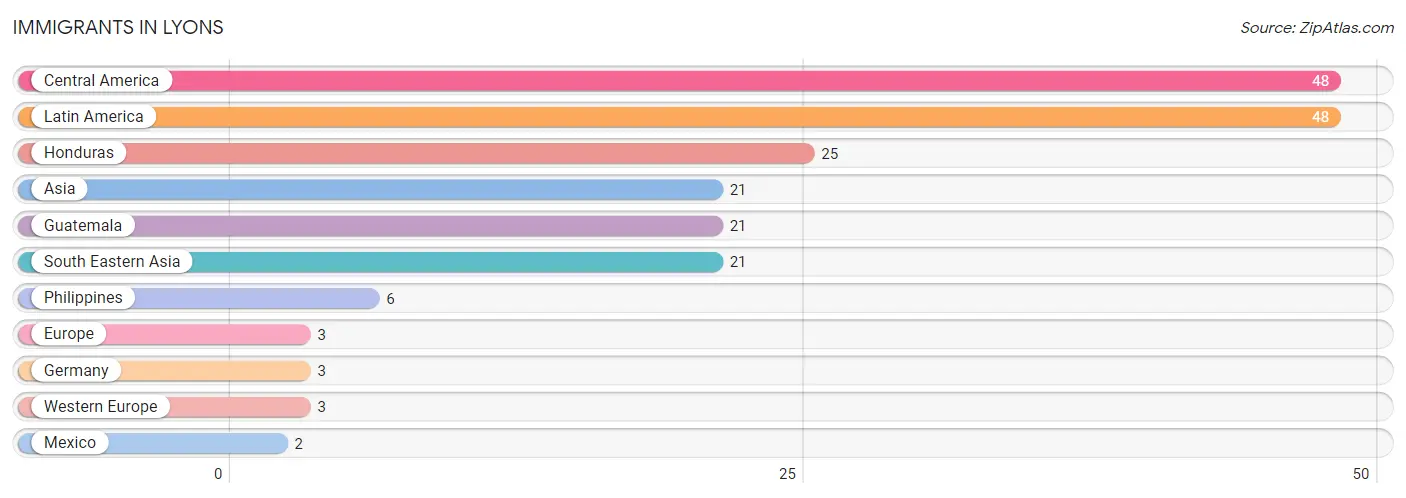
| Immigration Origin | # Population | % Population |
| Asia | 21 | 2.6% |
| Central America | 48 | 6.0% |
| Europe | 3 | 0.4% |
| Germany | 3 | 0.4% |
| Guatemala | 21 | 2.6% |
| Honduras | 25 | 3.1% |
| Latin America | 48 | 6.0% |
| Mexico | 2 | 0.3% |
| Philippines | 6 | 0.7% |
| South Eastern Asia | 21 | 2.6% |
| Western Europe | 3 | 0.4% | View All 11 Rows |
Sex and Age in Lyons
Sex and Age in Lyons
The most populous age groups in Lyons are 30 to 34 Years (59 | 14.5%) for men and 15 to 19 Years (41 | 10.3%) for women.
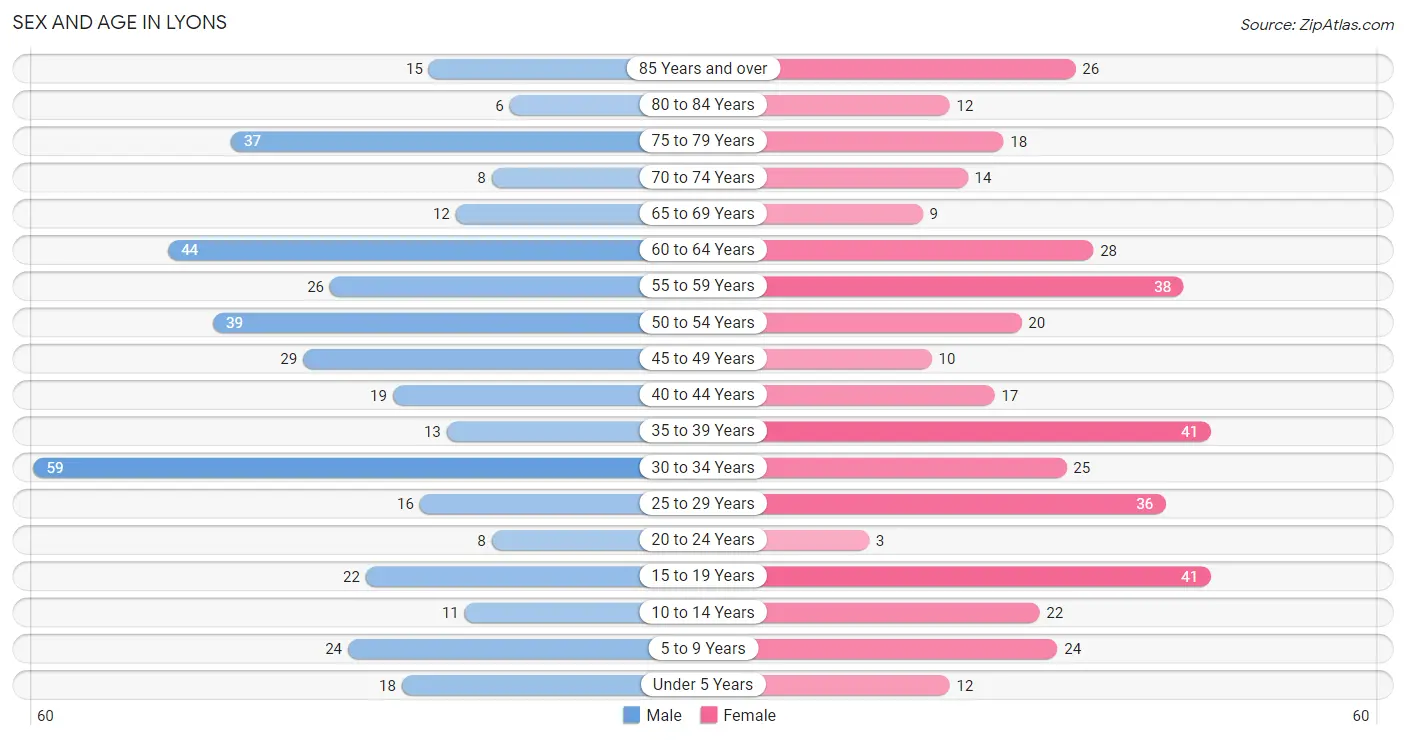
| Age Bracket | Male | Female |
| Under 5 Years | 18 (4.4%) | 12 (3.0%) |
| 5 to 9 Years | 24 (5.9%) | 24 (6.1%) |
| 10 to 14 Years | 11 (2.7%) | 22 (5.6%) |
| 15 to 19 Years | 22 (5.4%) | 41 (10.3%) |
| 20 to 24 Years | 8 (2.0%) | 3 (0.8%) |
| 25 to 29 Years | 16 (3.9%) | 36 (9.1%) |
| 30 to 34 Years | 59 (14.5%) | 25 (6.3%) |
| 35 to 39 Years | 13 (3.2%) | 41 (10.3%) |
| 40 to 44 Years | 19 (4.7%) | 17 (4.3%) |
| 45 to 49 Years | 29 (7.1%) | 10 (2.5%) |
| 50 to 54 Years | 39 (9.6%) | 20 (5.1%) |
| 55 to 59 Years | 26 (6.4%) | 38 (9.6%) |
| 60 to 64 Years | 44 (10.8%) | 28 (7.1%) |
| 65 to 69 Years | 12 (3.0%) | 9 (2.3%) |
| 70 to 74 Years | 8 (2.0%) | 14 (3.5%) |
| 75 to 79 Years | 37 (9.1%) | 18 (4.5%) |
| 80 to 84 Years | 6 (1.5%) | 12 (3.0%) |
| 85 Years and over | 15 (3.7%) | 26 (6.6%) |
| Total | 406 (100.0%) | 396 (100.0%) |
Families and Households in Lyons
Median Family Size in Lyons
The median family size in Lyons is 3.13 persons per family, with single female/mother families (23 | 12.3%) accounting for the largest median family size of 3.87 persons per family. On the other hand, single male/father families (7 | 3.7%) represent the smallest median family size with 2.57 persons per family.
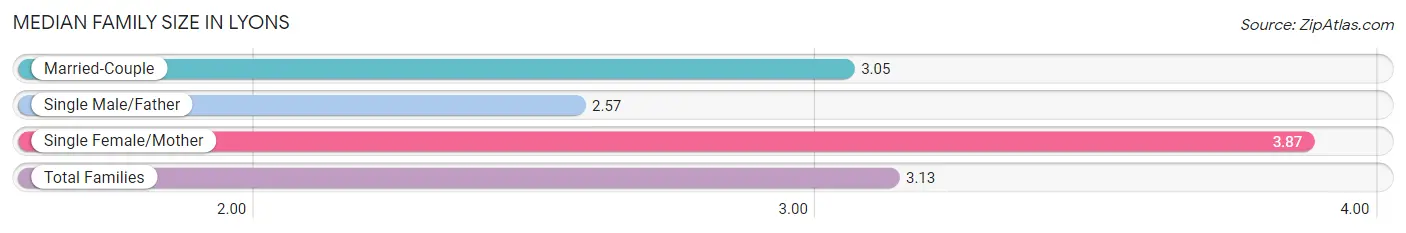
| Family Type | # Families | Family Size |
| Married-Couple | 157 (84.0%) | 3.05 |
| Single Male/Father | 7 (3.7%) | 2.57 |
| Single Female/Mother | 23 (12.3%) | 3.87 |
| Total Families | 187 (100.0%) | 3.13 |
Median Household Size in Lyons
The median household size in Lyons is 2.47 persons per household, with single female/mother households (23 | 7.8%) accounting for the largest median household size of 4.52 persons per household. non-family households (108 | 36.6%) represent the smallest median household size with 1.17 persons per household.
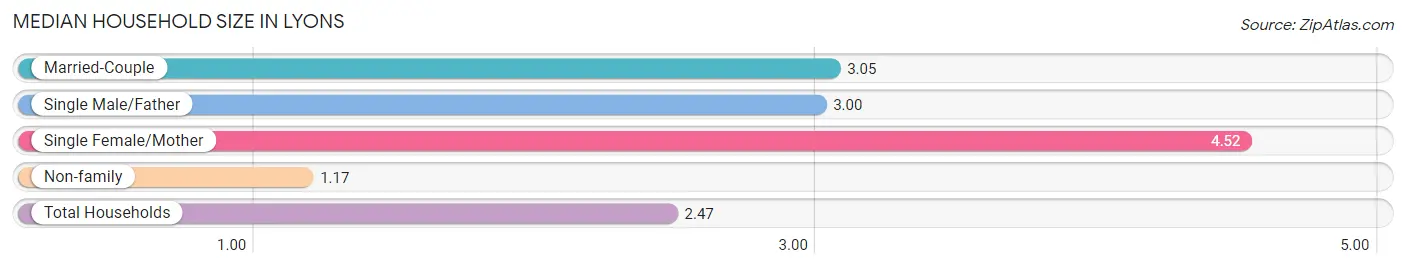
| Household Type | # Households | Household Size |
| Married-Couple | 157 (53.2%) | 3.05 |
| Single Male/Father | 7 (2.4%) | 3.00 |
| Single Female/Mother | 23 (7.8%) | 4.52 |
| Non-family | 108 (36.6%) | 1.17 |
| Total Households | 295 (100.0%) | 2.47 |
Household Size by Marriage Status in Lyons
Out of a total of 295 households in Lyons, 187 (63.4%) are family households, while 108 (36.6%) are nonfamily households. The most numerous type of family households are 4-person households, comprising 80, and the most common type of nonfamily households are 1-person households, comprising 94.
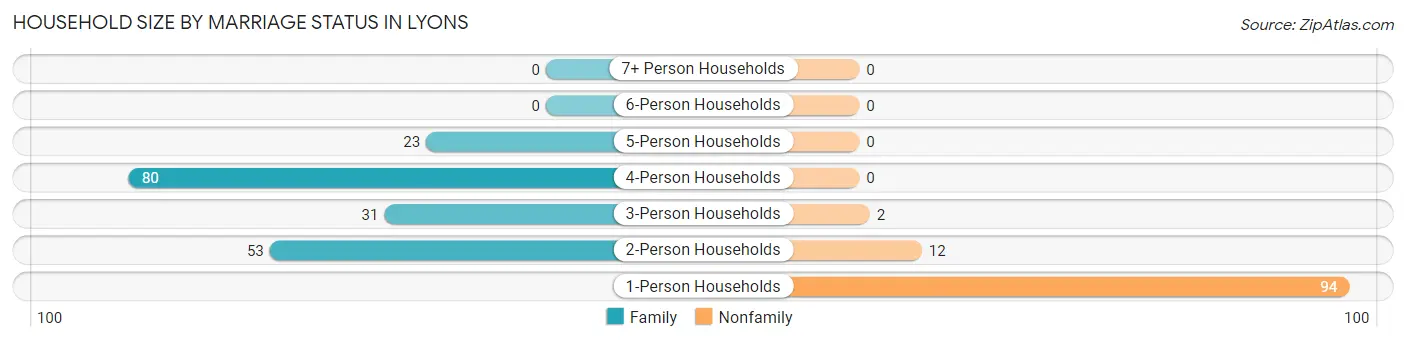
| Household Size | Family Households | Nonfamily Households |
| 1-Person Households | - | 94 (31.9%) |
| 2-Person Households | 53 (18.0%) | 12 (4.1%) |
| 3-Person Households | 31 (10.5%) | 2 (0.7%) |
| 4-Person Households | 80 (27.1%) | 0 (0.0%) |
| 5-Person Households | 23 (7.8%) | 0 (0.0%) |
| 6-Person Households | 0 (0.0%) | 0 (0.0%) |
| 7+ Person Households | 0 (0.0%) | 0 (0.0%) |
| Total | 187 (63.4%) | 108 (36.6%) |
Female Fertility in Lyons
Fertility by Age in Lyons
Average fertility rate in Lyons is 49.0 births per 1,000 women. Women in the age bracket of 20 to 34 years have the highest fertility rate with 141.0 births per 1,000 women. Women in the age bracket of 20 to 34 years acount for 100.0% of all women with births.
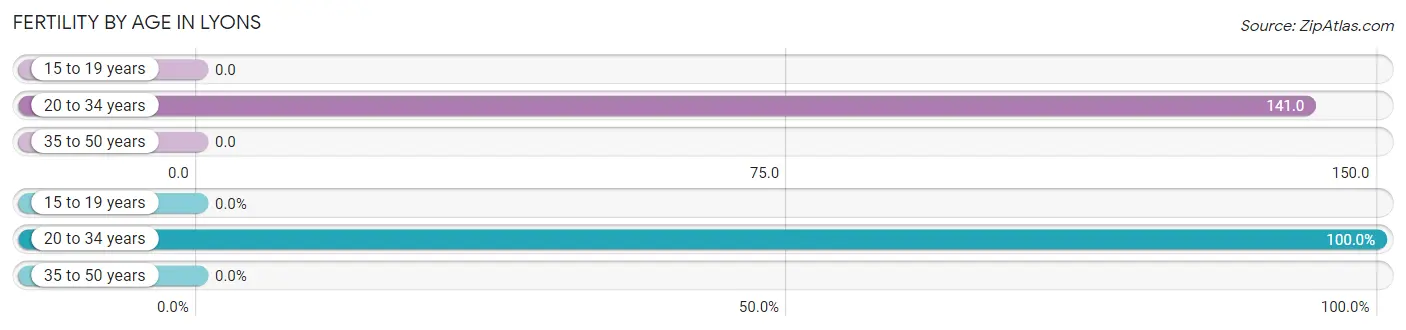
| Age Bracket | Women with Births | Births / 1,000 Women |
| 15 to 19 years | 0 (0.0%) | 0.0 |
| 20 to 34 years | 9 (100.0%) | 141.0 |
| 35 to 50 years | 0 (0.0%) | 0.0 |
| Total | 9 (100.0%) | 49.0 |
Fertility by Age by Marriage Status in Lyons
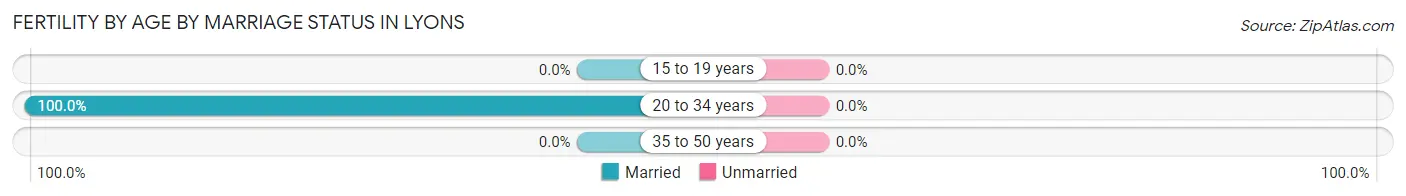
| Age Bracket | Married | Unmarried |
| 15 to 19 years | 0 (0.0%) | 0 (0.0%) |
| 20 to 34 years | 9 (100.0%) | 0 (0.0%) |
| 35 to 50 years | 0 (0.0%) | 0 (0.0%) |
| Total | 9 (100.0%) | 0 (0.0%) |
Fertility by Education in Lyons
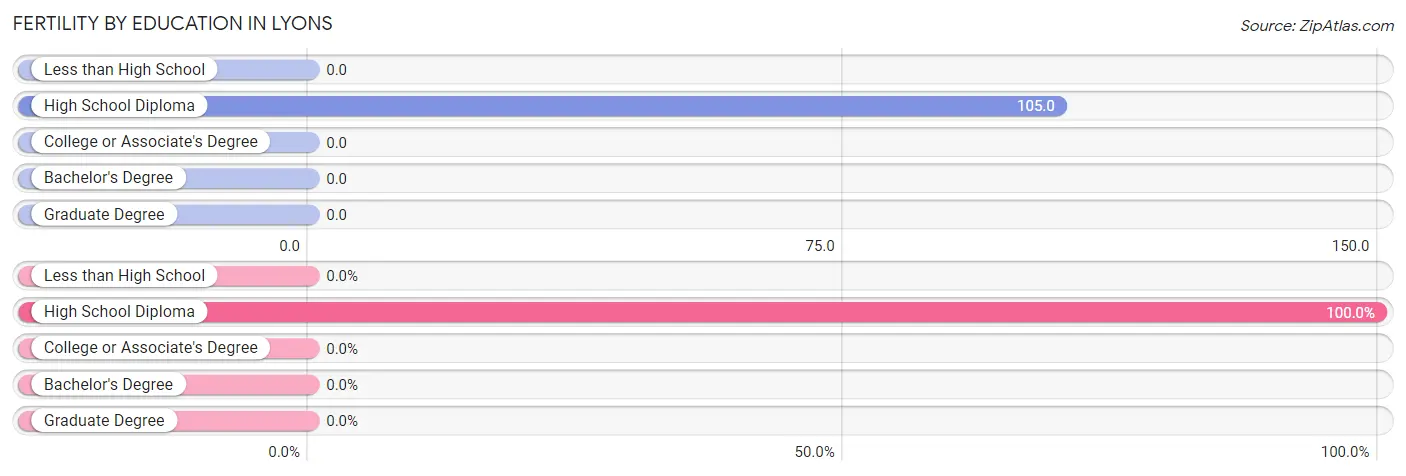
| Educational Attainment | Women with Births | Births / 1,000 Women |
| Less than High School | 0 (0.0%) | 0.0 |
| High School Diploma | 9 (100.0%) | 105.0 |
| College or Associate's Degree | 0 (0.0%) | 0.0 |
| Bachelor's Degree | 0 (0.0%) | 0.0 |
| Graduate Degree | 0 (0.0%) | 0.0 |
| Total | 9 (100.0%) | 49.0 |
Fertility by Education by Marriage Status in Lyons
| Educational Attainment | Married | Unmarried |
| Less than High School | 0 (0.0%) | 0 (0.0%) |
| High School Diploma | 9 (100.0%) | 0 (0.0%) |
| College or Associate's Degree | 0 (0.0%) | 0 (0.0%) |
| Bachelor's Degree | 0 (0.0%) | 0 (0.0%) |
| Graduate Degree | 0 (0.0%) | 0 (0.0%) |
| Total | 9 (100.0%) | 0 (0.0%) |
Employment Characteristics in Lyons
Employment by Class of Employer in Lyons
Among the 380 employed individuals in Lyons, private company employees (236 | 62.1%), not-for-profit organizations (54 | 14.2%), and self-employed (not incorporated) (20 | 5.3%) make up the most common classes of employment.
| Employer Class | # Employees | % Employees |
| Private Company Employees | 236 | 62.1% |
| Self-Employed (Incorporated) | 19 | 5.0% |
| Self-Employed (Not Incorporated) | 20 | 5.3% |
| Not-for-profit Organizations | 54 | 14.2% |
| Local Government Employees | 18 | 4.7% |
| State Government Employees | 16 | 4.2% |
| Federal Government Employees | 17 | 4.5% |
| Unpaid Family Workers | 0 | 0.0% |
| Total | 380 | 100.0% |
Employment Status by Age in Lyons
According to the labor force statistics for Lyons, out of the total population over 16 years of age (672), 60.9% or 409 individuals are in the labor force, with 3.7% or 15 of them unemployed. The age group with the highest labor force participation rate is 30 to 34 years, with 96.4% or 81 individuals in the labor force. Within the labor force, the 35 to 44 years age range has the highest percentage of unemployed individuals, with 8.1% or 7 of them being unemployed.
| Age Bracket | In Labor Force | Unemployed |
| 16 to 19 Years | 28 (63.6%) | 0 (0.0%) |
| 20 to 24 Years | 8 (72.7%) | 0 (0.0%) |
| 25 to 29 Years | 39 (75.0%) | 3 (7.7%) |
| 30 to 34 Years | 81 (96.4%) | 2 (2.5%) |
| 35 to 44 Years | 86 (95.6%) | 7 (8.1%) |
| 45 to 54 Years | 66 (67.3%) | 1 (1.5%) |
| 55 to 59 Years | 56 (87.5%) | 0 (0.0%) |
| 60 to 64 Years | 37 (51.4%) | 2 (5.4%) |
| 65 to 74 Years | 5 (11.6%) | 0 (0.0%) |
| 75 Years and over | 3 (2.6%) | 0 (0.0%) |
| Total | 409 (60.9%) | 15 (3.7%) |
Employment Status by Educational Attainment in Lyons
According to labor force statistics for Lyons, 79.3% of individuals (365) out of the total population between 25 and 64 years of age (460) are in the labor force, with 4.1% or 15 of them being unemployed. The group with the highest labor force participation rate are those with the educational attainment of bachelor's degree or higher, with 100.0% or 26 individuals in the labor force. Within the labor force, individuals with less than high school education have the highest percentage of unemployment, with 16.7% or 5 of them being unemployed.
| Educational Attainment | In Labor Force | Unemployed |
| Less than High School | 30 (55.6%) | 9 (16.7%) |
| High School Diploma | 150 (72.5%) | 8 (4.0%) |
| College / Associate Degree | 159 (91.9%) | 4 (2.5%) |
| Bachelor's Degree or higher | 26 (100.0%) | 0 (0.0%) |
| Total | 365 (79.3%) | 19 (4.1%) |
Employment Occupations by Sex in Lyons
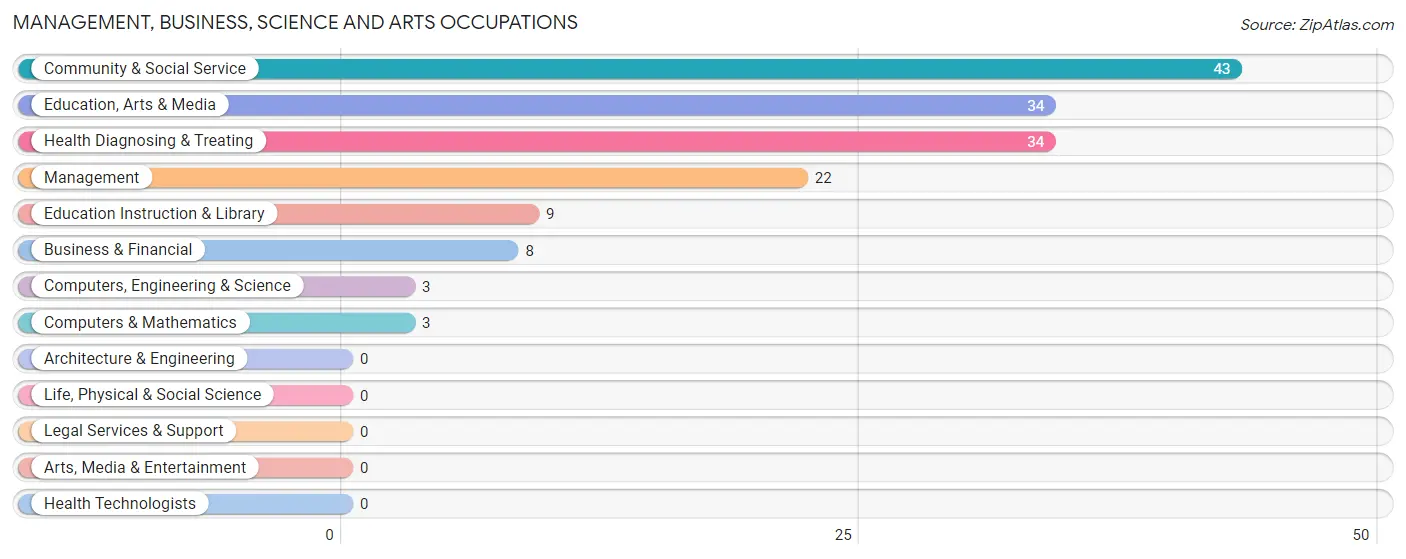
Management, Business, Science and Arts Occupations
The most common Management, Business, Science and Arts occupations in Lyons are Community & Social Service (43 | 10.9%), Education, Arts & Media (34 | 8.6%), Health Diagnosing & Treating (34 | 8.6%), Management (22 | 5.6%), and Education Instruction & Library (9 | 2.3%).
Management, Business, Science and Arts Occupations by Sex
Within the Management, Business, Science and Arts occupations in Lyons, the most male-oriented occupations are Management (90.9%), Health Diagnosing & Treating (50.0%), and Education, Arts & Media (23.5%), while the most female-oriented occupations are Business & Financial (100.0%), Computers, Engineering & Science (100.0%), and Computers & Mathematics (100.0%).
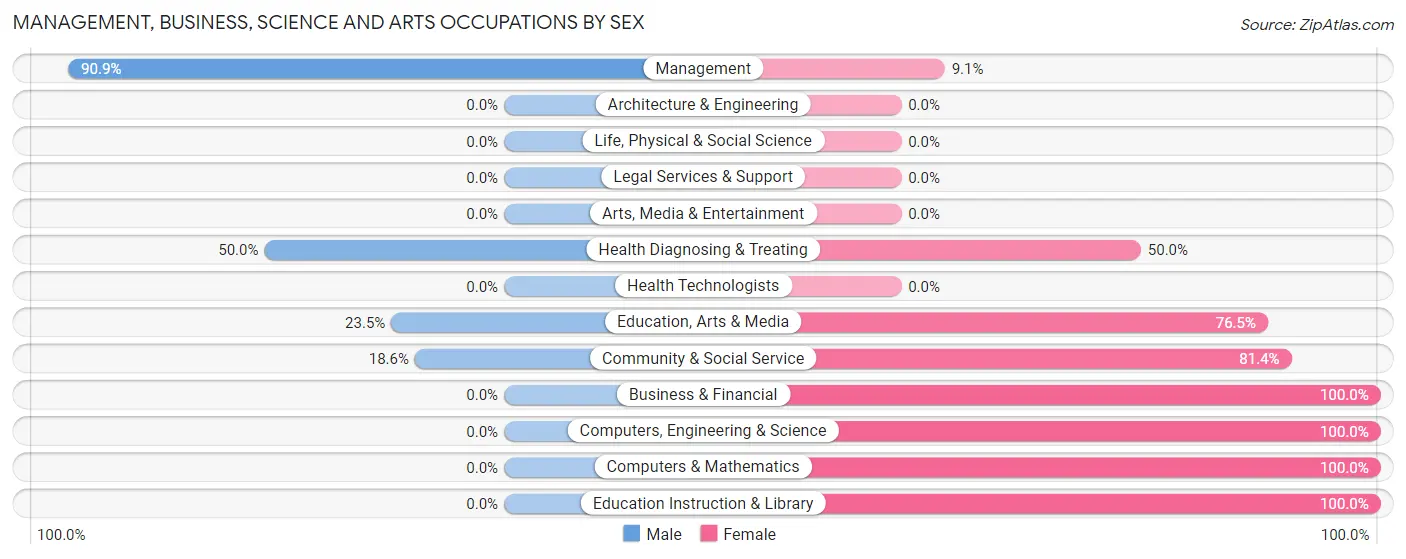
| Occupation | Male | Female |
| Management | 20 (90.9%) | 2 (9.1%) |
| Business & Financial | 0 (0.0%) | 8 (100.0%) |
| Computers, Engineering & Science | 0 (0.0%) | 3 (100.0%) |
| Computers & Mathematics | 0 (0.0%) | 3 (100.0%) |
| Architecture & Engineering | 0 (0.0%) | 0 (0.0%) |
| Life, Physical & Social Science | 0 (0.0%) | 0 (0.0%) |
| Community & Social Service | 8 (18.6%) | 35 (81.4%) |
| Education, Arts & Media | 8 (23.5%) | 26 (76.5%) |
| Legal Services & Support | 0 (0.0%) | 0 (0.0%) |
| Education Instruction & Library | 0 (0.0%) | 9 (100.0%) |
| Arts, Media & Entertainment | 0 (0.0%) | 0 (0.0%) |
| Health Diagnosing & Treating | 17 (50.0%) | 17 (50.0%) |
| Health Technologists | 0 (0.0%) | 0 (0.0%) |
| Total (Category) | 45 (40.9%) | 65 (59.1%) |
| Total (Overall) | 212 (53.8%) | 182 (46.2%) |
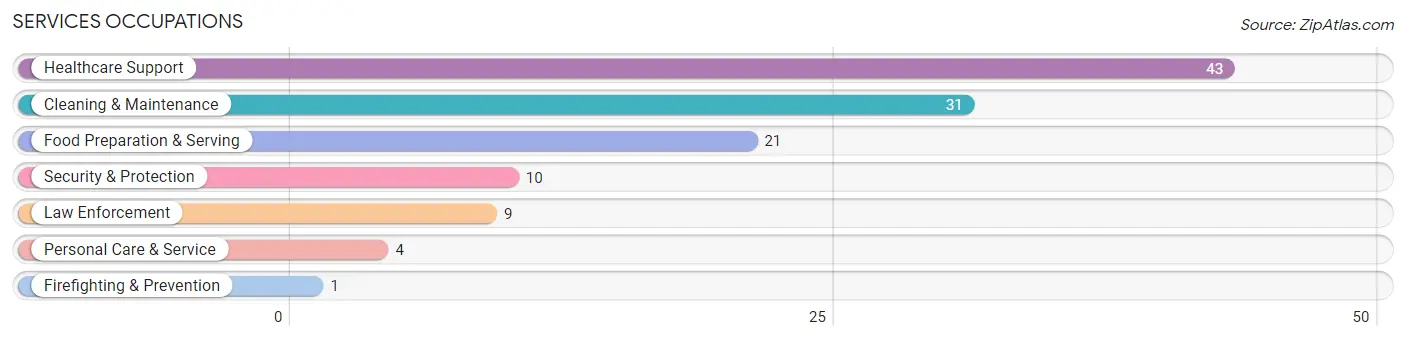
Services Occupations
The most common Services occupations in Lyons are Healthcare Support (43 | 10.9%), Cleaning & Maintenance (31 | 7.9%), Food Preparation & Serving (21 | 5.3%), Security & Protection (10 | 2.5%), and Law Enforcement (9 | 2.3%).
Services Occupations by Sex
Within the Services occupations in Lyons, the most male-oriented occupations are Firefighting & Prevention (100.0%), Healthcare Support (88.4%), and Cleaning & Maintenance (64.5%), while the most female-oriented occupations are Personal Care & Service (100.0%), Food Preparation & Serving (71.4%), and Law Enforcement (66.7%).
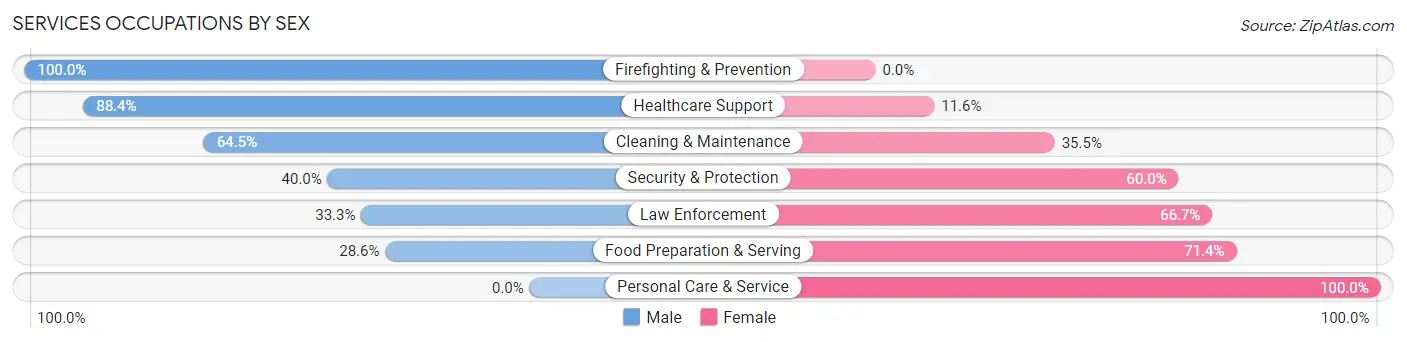
| Occupation | Male | Female |
| Healthcare Support | 38 (88.4%) | 5 (11.6%) |
| Security & Protection | 4 (40.0%) | 6 (60.0%) |
| Firefighting & Prevention | 1 (100.0%) | 0 (0.0%) |
| Law Enforcement | 3 (33.3%) | 6 (66.7%) |
| Food Preparation & Serving | 6 (28.6%) | 15 (71.4%) |
| Cleaning & Maintenance | 20 (64.5%) | 11 (35.5%) |
| Personal Care & Service | 0 (0.0%) | 4 (100.0%) |
| Total (Category) | 68 (62.4%) | 41 (37.6%) |
| Total (Overall) | 212 (53.8%) | 182 (46.2%) |
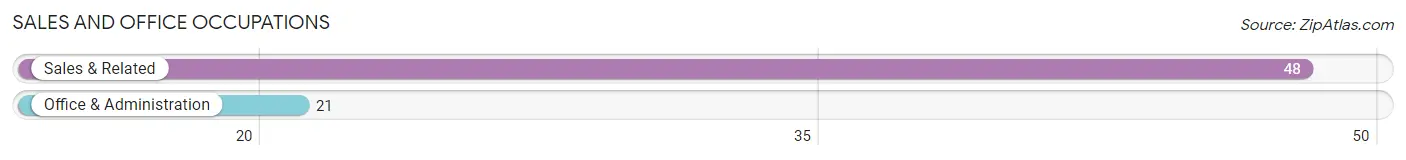
Sales and Office Occupations
The most common Sales and Office occupations in Lyons are Sales & Related (48 | 12.2%), and Office & Administration (21 | 5.3%).
Sales and Office Occupations by Sex
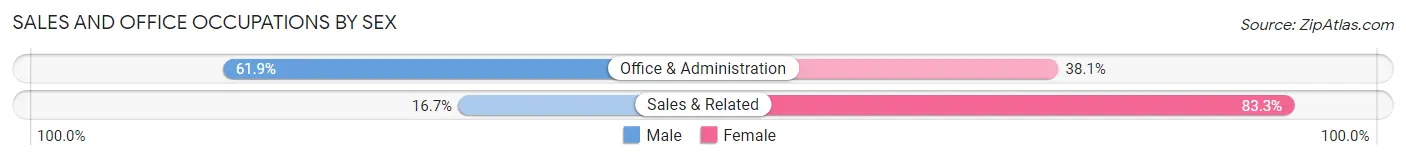
| Occupation | Male | Female |
| Sales & Related | 8 (16.7%) | 40 (83.3%) |
| Office & Administration | 13 (61.9%) | 8 (38.1%) |
| Total (Category) | 21 (30.4%) | 48 (69.6%) |
| Total (Overall) | 212 (53.8%) | 182 (46.2%) |
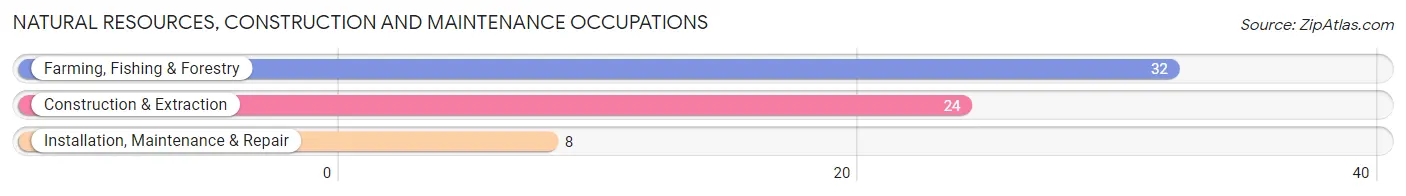
Natural Resources, Construction and Maintenance Occupations
The most common Natural Resources, Construction and Maintenance occupations in Lyons are Farming, Fishing & Forestry (32 | 8.1%), Construction & Extraction (24 | 6.1%), and Installation, Maintenance & Repair (8 | 2.0%).
Natural Resources, Construction and Maintenance Occupations by Sex
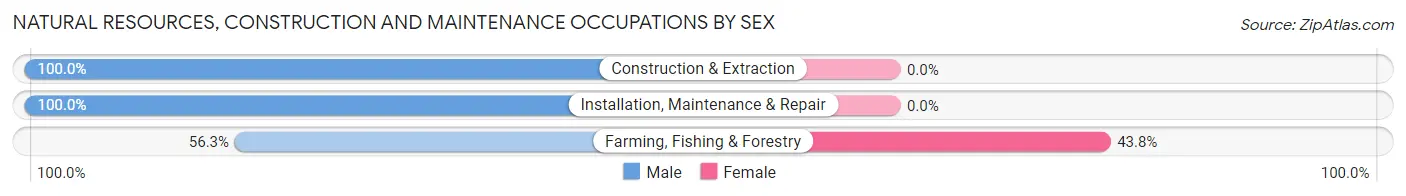
| Occupation | Male | Female |
| Farming, Fishing & Forestry | 18 (56.2%) | 14 (43.8%) |
| Construction & Extraction | 24 (100.0%) | 0 (0.0%) |
| Installation, Maintenance & Repair | 8 (100.0%) | 0 (0.0%) |
| Total (Category) | 50 (78.1%) | 14 (21.9%) |
| Total (Overall) | 212 (53.8%) | 182 (46.2%) |
Production, Transportation and Moving Occupations
The most common Production, Transportation and Moving occupations in Lyons are Production (17 | 4.3%), Transportation (14 | 3.5%), and Material Moving (11 | 2.8%).
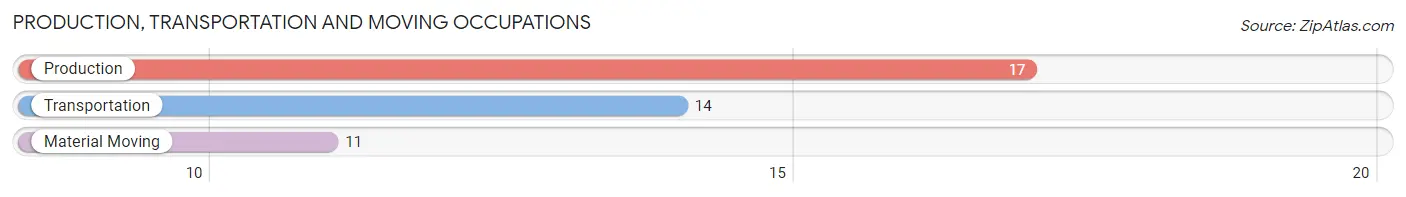
Production, Transportation and Moving Occupations by Sex
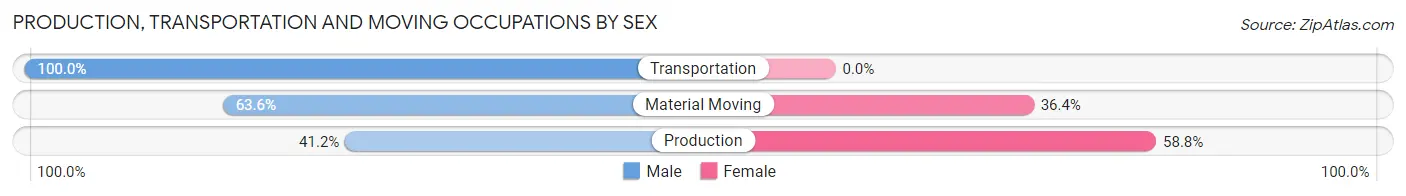
| Occupation | Male | Female |
| Production | 7 (41.2%) | 10 (58.8%) |
| Transportation | 14 (100.0%) | 0 (0.0%) |
| Material Moving | 7 (63.6%) | 4 (36.4%) |
| Total (Category) | 28 (66.7%) | 14 (33.3%) |
| Total (Overall) | 212 (53.8%) | 182 (46.2%) |
Employment Industries by Sex in Lyons
Employment Industries in Lyons
The major employment industries in Lyons include Health Care & Social Assistance (86 | 21.8%), Retail Trade (82 | 20.8%), Manufacturing (47 | 11.9%), Agriculture, Fishing & Hunting (40 | 10.2%), and Public Administration (30 | 7.6%).
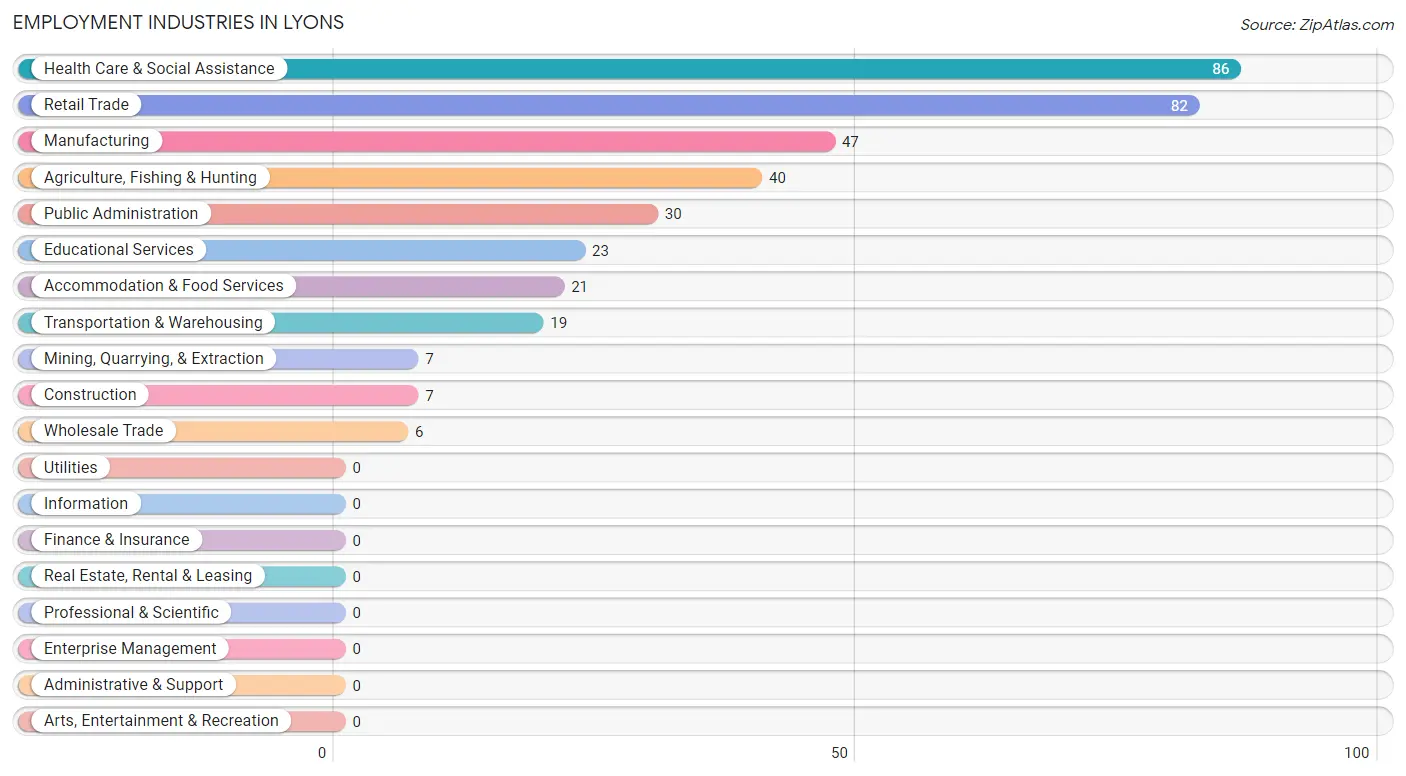
Employment Industries by Sex in Lyons
The Lyons industries that see more men than women are Mining, Quarrying, & Extraction (100.0%), Construction (100.0%), and Wholesale Trade (100.0%), whereas the industries that tend to have a higher number of women are Educational Services (91.3%), Retail Trade (74.4%), and Accommodation & Food Services (71.4%).
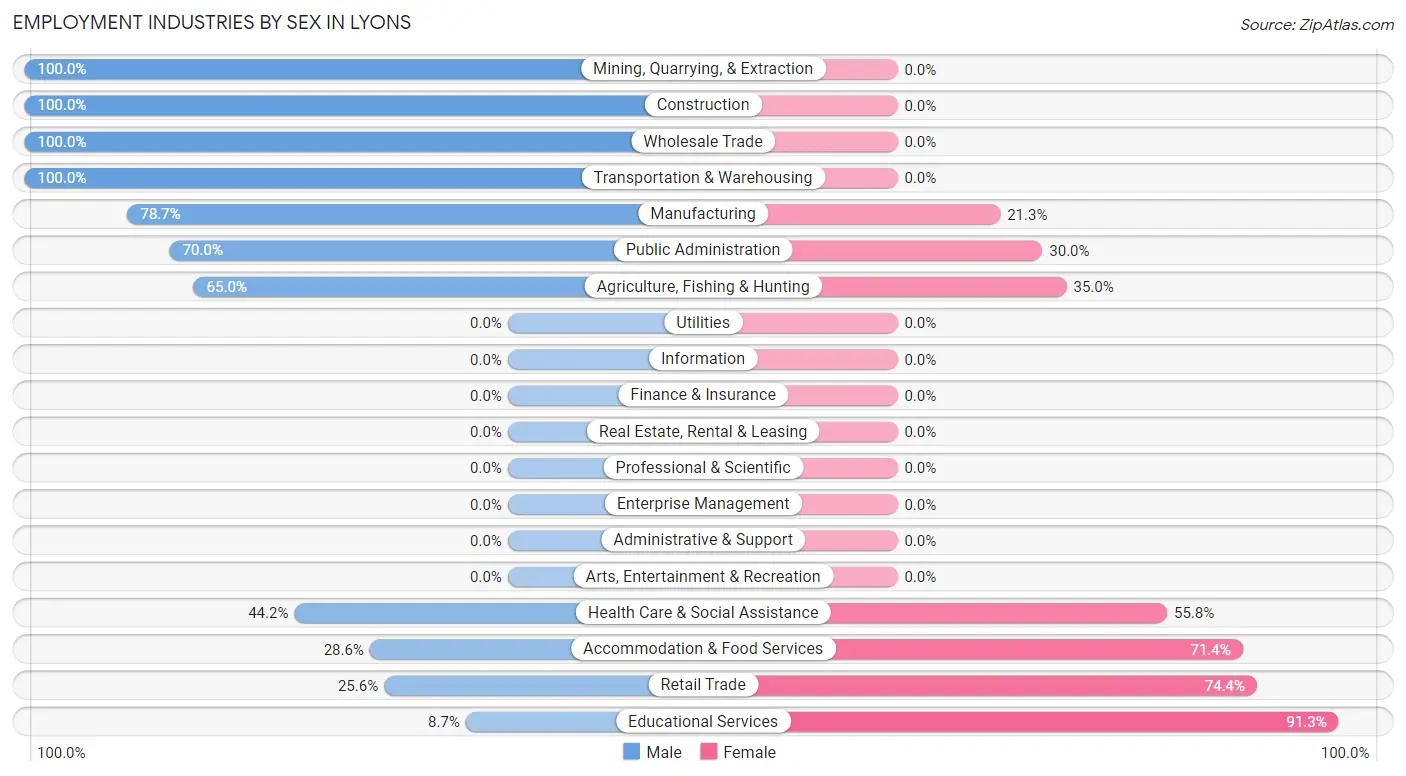
| Industry | Male | Female |
| Agriculture, Fishing & Hunting | 26 (65.0%) | 14 (35.0%) |
| Mining, Quarrying, & Extraction | 7 (100.0%) | 0 (0.0%) |
| Construction | 7 (100.0%) | 0 (0.0%) |
| Manufacturing | 37 (78.7%) | 10 (21.3%) |
| Wholesale Trade | 6 (100.0%) | 0 (0.0%) |
| Retail Trade | 21 (25.6%) | 61 (74.4%) |
| Transportation & Warehousing | 19 (100.0%) | 0 (0.0%) |
| Utilities | 0 (0.0%) | 0 (0.0%) |
| Information | 0 (0.0%) | 0 (0.0%) |
| Finance & Insurance | 0 (0.0%) | 0 (0.0%) |
| Real Estate, Rental & Leasing | 0 (0.0%) | 0 (0.0%) |
| Professional & Scientific | 0 (0.0%) | 0 (0.0%) |
| Enterprise Management | 0 (0.0%) | 0 (0.0%) |
| Administrative & Support | 0 (0.0%) | 0 (0.0%) |
| Educational Services | 2 (8.7%) | 21 (91.3%) |
| Health Care & Social Assistance | 38 (44.2%) | 48 (55.8%) |
| Arts, Entertainment & Recreation | 0 (0.0%) | 0 (0.0%) |
| Accommodation & Food Services | 6 (28.6%) | 15 (71.4%) |
| Public Administration | 21 (70.0%) | 9 (30.0%) |
| Total | 212 (53.8%) | 182 (46.2%) |
Education in Lyons
School Enrollment in Lyons
The most common levels of schooling among the 130 students in Lyons are high school (45 | 34.6%), elementary school (27 | 20.8%), and kindergarten (22 | 16.9%).
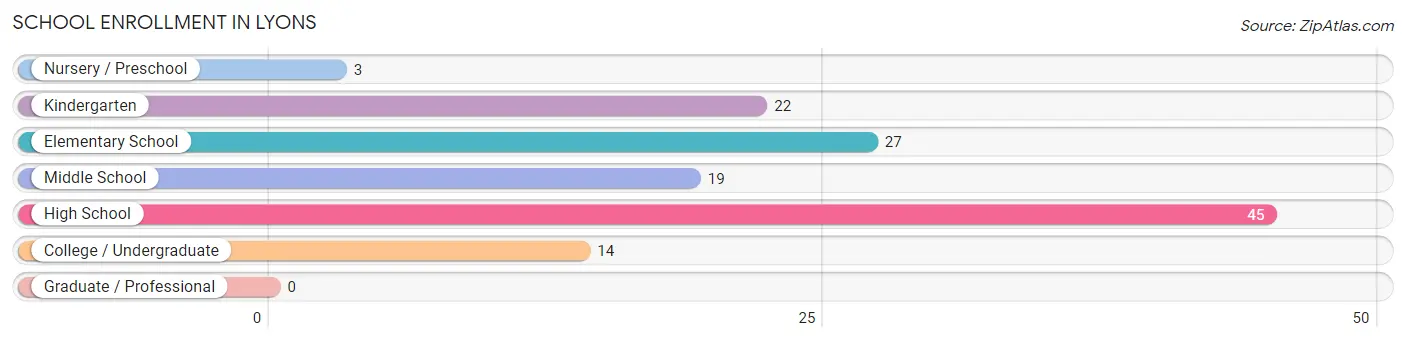
| School Level | # Students | % Students |
| Nursery / Preschool | 3 | 2.3% |
| Kindergarten | 22 | 16.9% |
| Elementary School | 27 | 20.8% |
| Middle School | 19 | 14.6% |
| High School | 45 | 34.6% |
| College / Undergraduate | 14 | 10.8% |
| Graduate / Professional | 0 | 0.0% |
| Total | 130 | 100.0% |
School Enrollment by Age by Funding Source in Lyons
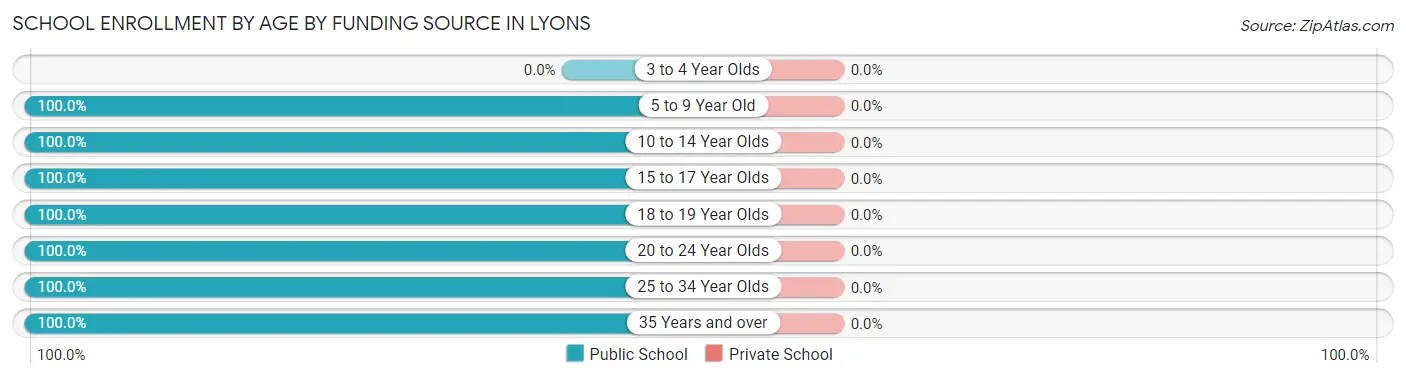
| Age Bracket | Public School | Private School |
| 3 to 4 Year Olds | 0 (0.0%) | 0 (0.0%) |
| 5 to 9 Year Old | 48 (100.0%) | 0 (0.0%) |
| 10 to 14 Year Olds | 33 (100.0%) | 0 (0.0%) |
| 15 to 17 Year Olds | 32 (100.0%) | 0 (0.0%) |
| 18 to 19 Year Olds | 10 (100.0%) | 0 (0.0%) |
| 20 to 24 Year Olds | 3 (100.0%) | 0 (0.0%) |
| 25 to 34 Year Olds | 2 (100.0%) | 0 (0.0%) |
| 35 Years and over | 2 (100.0%) | 0 (0.0%) |
| Total | 130 (100.0%) | 0 (0.0%) |
Educational Attainment by Field of Study in Lyons
Business (7 | 25.0%), liberal arts & history (7 | 25.0%), communications (6 | 21.4%), physical & health sciences (3 | 10.7%), and education (3 | 10.7%) are the most common fields of study among 28 individuals in Lyons who have obtained a bachelor's degree or higher.
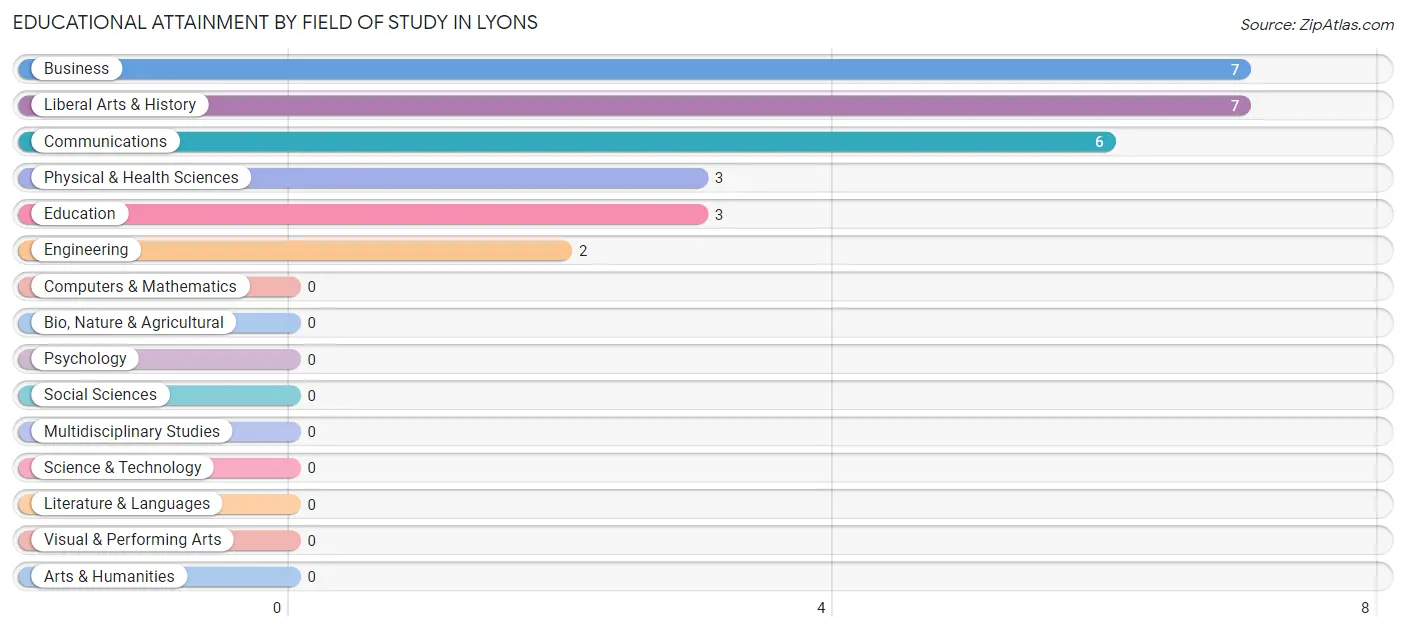
| Field of Study | # Graduates | % Graduates |
| Computers & Mathematics | 0 | 0.0% |
| Bio, Nature & Agricultural | 0 | 0.0% |
| Physical & Health Sciences | 3 | 10.7% |
| Psychology | 0 | 0.0% |
| Social Sciences | 0 | 0.0% |
| Engineering | 2 | 7.1% |
| Multidisciplinary Studies | 0 | 0.0% |
| Science & Technology | 0 | 0.0% |
| Business | 7 | 25.0% |
| Education | 3 | 10.7% |
| Literature & Languages | 0 | 0.0% |
| Liberal Arts & History | 7 | 25.0% |
| Visual & Performing Arts | 0 | 0.0% |
| Communications | 6 | 21.4% |
| Arts & Humanities | 0 | 0.0% |
| Total | 28 | 100.0% |
Transportation & Commute in Lyons
Vehicle Availability by Sex in Lyons
The most prevalent vehicle ownership categories in Lyons are males with 4 vehicles (75, accounting for 36.9%) and females with 4 vehicles (45, making up 42.4%).
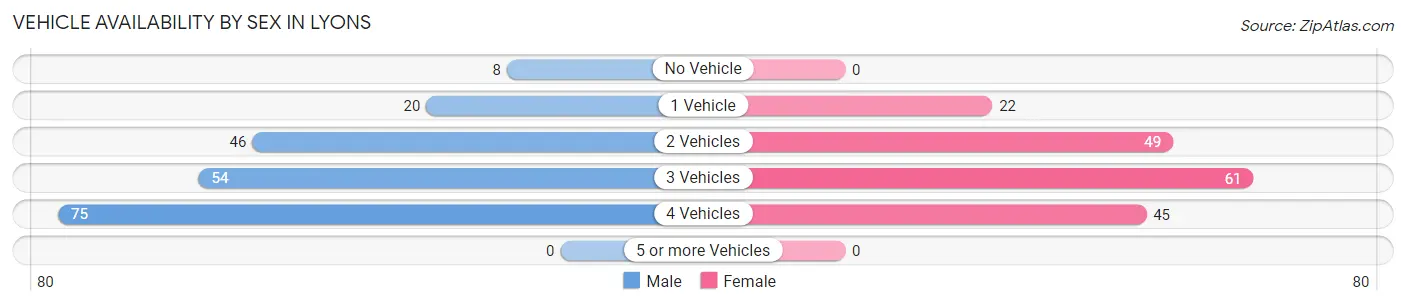
| Vehicles Available | Male | Female |
| No Vehicle | 8 (3.9%) | 0 (0.0%) |
| 1 Vehicle | 20 (9.9%) | 22 (12.4%) |
| 2 Vehicles | 46 (22.7%) | 49 (27.7%) |
| 3 Vehicles | 54 (26.6%) | 61 (34.5%) |
| 4 Vehicles | 75 (36.9%) | 45 (25.4%) |
| 5 or more Vehicles | 0 (0.0%) | 0 (0.0%) |
| Total | 203 (100.0%) | 177 (100.0%) |
Commute Time in Lyons
The most frequently occuring commute durations in Lyons are 45 to 59 minutes (60 commuters, 16.1%), less than 5 minutes (57 commuters, 15.3%), and 10 to 14 minutes (55 commuters, 14.7%).
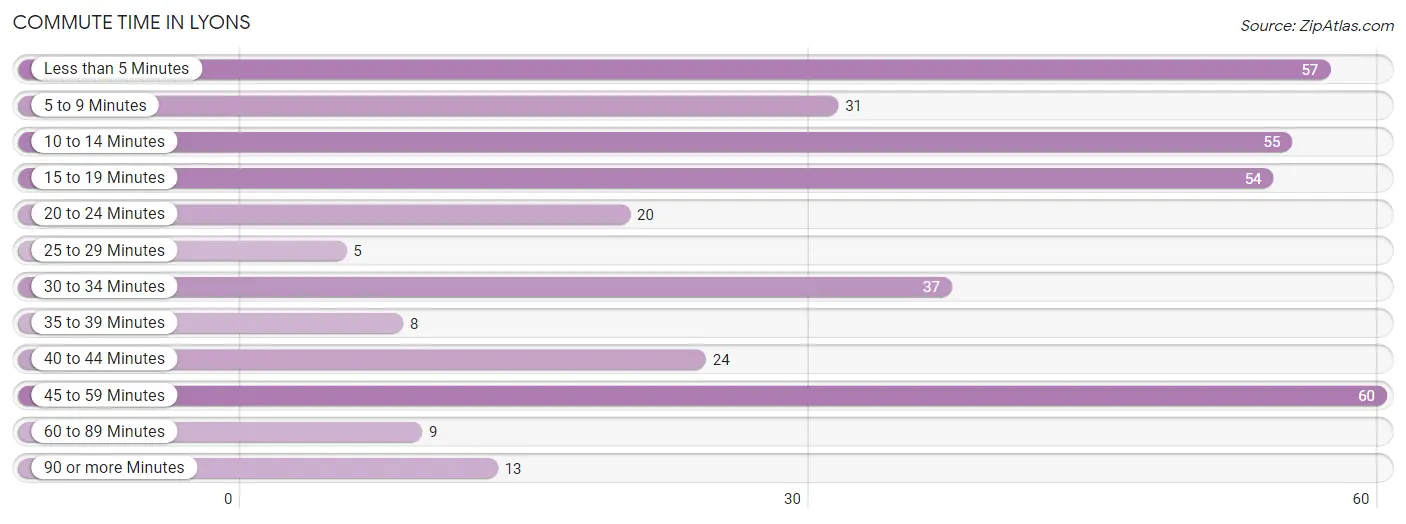
| Commute Time | # Commuters | % Commuters |
| Less than 5 Minutes | 57 | 15.3% |
| 5 to 9 Minutes | 31 | 8.3% |
| 10 to 14 Minutes | 55 | 14.7% |
| 15 to 19 Minutes | 54 | 14.5% |
| 20 to 24 Minutes | 20 | 5.4% |
| 25 to 29 Minutes | 5 | 1.3% |
| 30 to 34 Minutes | 37 | 9.9% |
| 35 to 39 Minutes | 8 | 2.1% |
| 40 to 44 Minutes | 24 | 6.4% |
| 45 to 59 Minutes | 60 | 16.1% |
| 60 to 89 Minutes | 9 | 2.4% |
| 90 or more Minutes | 13 | 3.5% |
Commute Time by Sex in Lyons
The most common commute times in Lyons are 45 to 59 minutes (54 commuters, 27.0%) for males and less than 5 minutes (38 commuters, 22.0%) for females.
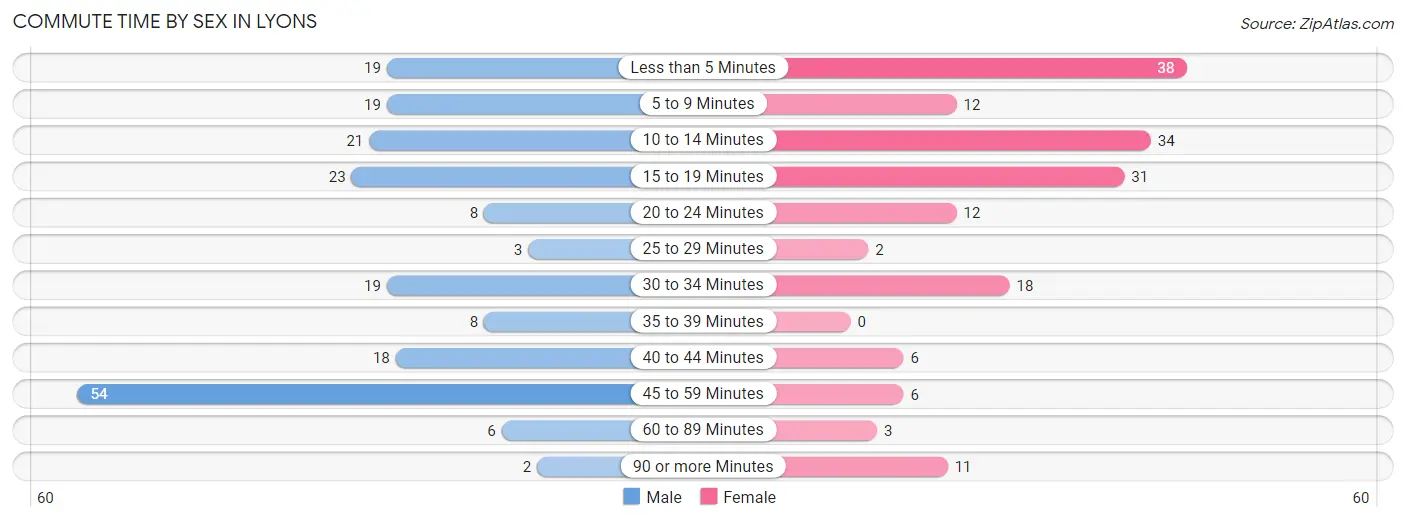
| Commute Time | Male | Female |
| Less than 5 Minutes | 19 (9.5%) | 38 (22.0%) |
| 5 to 9 Minutes | 19 (9.5%) | 12 (6.9%) |
| 10 to 14 Minutes | 21 (10.5%) | 34 (19.7%) |
| 15 to 19 Minutes | 23 (11.5%) | 31 (17.9%) |
| 20 to 24 Minutes | 8 (4.0%) | 12 (6.9%) |
| 25 to 29 Minutes | 3 (1.5%) | 2 (1.2%) |
| 30 to 34 Minutes | 19 (9.5%) | 18 (10.4%) |
| 35 to 39 Minutes | 8 (4.0%) | 0 (0.0%) |
| 40 to 44 Minutes | 18 (9.0%) | 6 (3.5%) |
| 45 to 59 Minutes | 54 (27.0%) | 6 (3.5%) |
| 60 to 89 Minutes | 6 (3.0%) | 3 (1.7%) |
| 90 or more Minutes | 2 (1.0%) | 11 (6.4%) |
Time of Departure to Work by Sex in Lyons
The most frequent times of departure to work in Lyons are 7:00 AM to 7:29 AM (38, 19.0%) for males and 8:00 AM to 8:29 AM (40, 23.1%) for females.
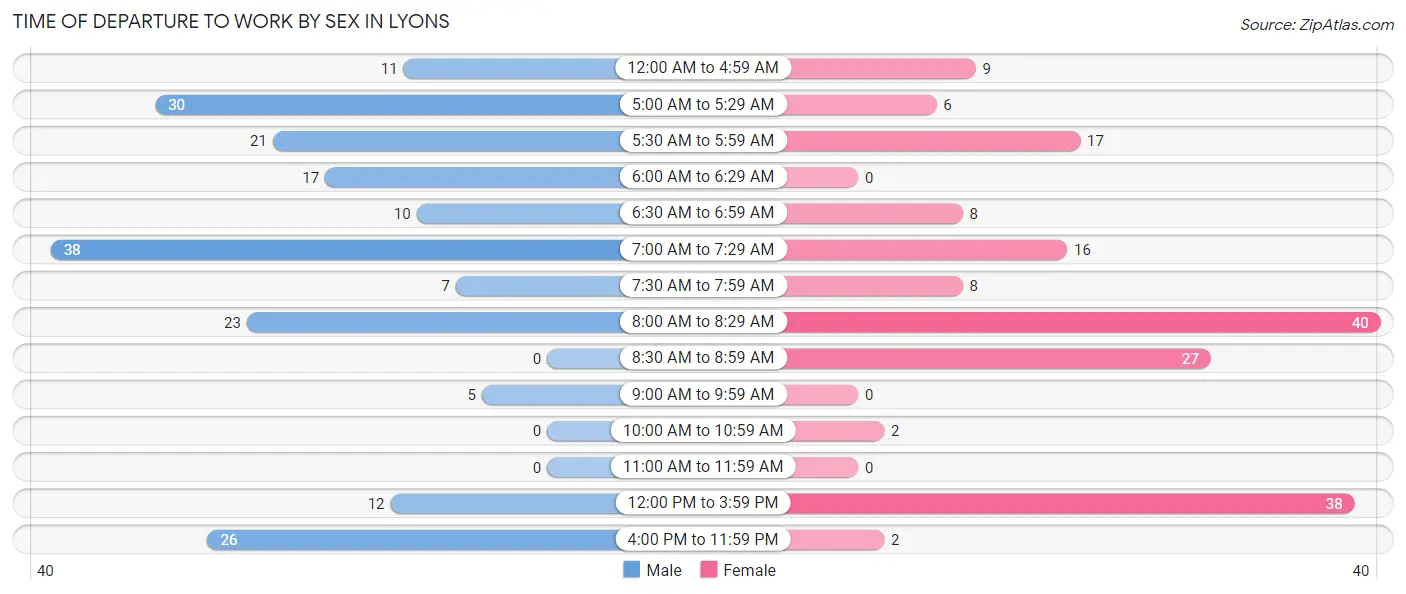
| Time of Departure | Male | Female |
| 12:00 AM to 4:59 AM | 11 (5.5%) | 9 (5.2%) |
| 5:00 AM to 5:29 AM | 30 (15.0%) | 6 (3.5%) |
| 5:30 AM to 5:59 AM | 21 (10.5%) | 17 (9.8%) |
| 6:00 AM to 6:29 AM | 17 (8.5%) | 0 (0.0%) |
| 6:30 AM to 6:59 AM | 10 (5.0%) | 8 (4.6%) |
| 7:00 AM to 7:29 AM | 38 (19.0%) | 16 (9.2%) |
| 7:30 AM to 7:59 AM | 7 (3.5%) | 8 (4.6%) |
| 8:00 AM to 8:29 AM | 23 (11.5%) | 40 (23.1%) |
| 8:30 AM to 8:59 AM | 0 (0.0%) | 27 (15.6%) |
| 9:00 AM to 9:59 AM | 5 (2.5%) | 0 (0.0%) |
| 10:00 AM to 10:59 AM | 0 (0.0%) | 2 (1.2%) |
| 11:00 AM to 11:59 AM | 0 (0.0%) | 0 (0.0%) |
| 12:00 PM to 3:59 PM | 12 (6.0%) | 38 (22.0%) |
| 4:00 PM to 11:59 PM | 26 (13.0%) | 2 (1.2%) |
| Total | 200 (100.0%) | 173 (100.0%) |
Housing Occupancy in Lyons
Occupancy by Ownership in Lyons
Of the total 295 dwellings in Lyons, owner-occupied units account for 207 (70.2%), while renter-occupied units make up 88 (29.8%).
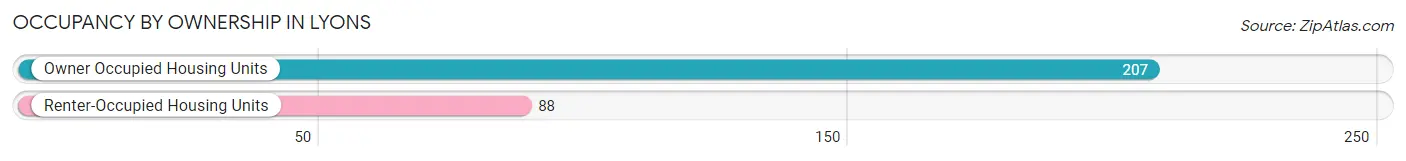
| Occupancy | # Housing Units | % Housing Units |
| Owner Occupied Housing Units | 207 | 70.2% |
| Renter-Occupied Housing Units | 88 | 29.8% |
| Total Occupied Housing Units | 295 | 100.0% |
Occupancy by Household Size in Lyons
| Household Size | # Housing Units | % Housing Units |
| 1-Person Household | 94 | 31.9% |
| 2-Person Household | 65 | 22.0% |
| 3-Person Household | 33 | 11.2% |
| 4+ Person Household | 103 | 34.9% |
| Total Housing Units | 295 | 100.0% |
Occupancy by Ownership by Household Size in Lyons
| Household Size | Owner-occupied | Renter-occupied |
| 1-Person Household | 69 (73.4%) | 25 (26.6%) |
| 2-Person Household | 53 (81.5%) | 12 (18.5%) |
| 3-Person Household | 26 (78.8%) | 7 (21.2%) |
| 4+ Person Household | 59 (57.3%) | 44 (42.7%) |
| Total Housing Units | 207 (70.2%) | 88 (29.8%) |
Occupancy by Educational Attainment in Lyons
| Household Size | Owner-occupied | Renter-occupied |
| Less than High School | 15 (51.7%) | 14 (48.3%) |
| High School Diploma | 54 (47.4%) | 60 (52.6%) |
| College/Associate Degree | 127 (94.8%) | 7 (5.2%) |
| Bachelor's Degree or higher | 11 (61.1%) | 7 (38.9%) |
Occupancy by Age of Householder in Lyons
| Age Bracket | # Households | % Households |
| Under 35 Years | 40 | 13.6% |
| 35 to 44 Years | 57 | 19.3% |
| 45 to 54 Years | 44 | 14.9% |
| 55 to 64 Years | 88 | 29.8% |
| 65 to 74 Years | 31 | 10.5% |
| 75 to 84 Years | 28 | 9.5% |
| 85 Years and Over | 7 | 2.4% |
| Total | 295 | 100.0% |
Housing Finances in Lyons
Median Income by Occupancy in Lyons
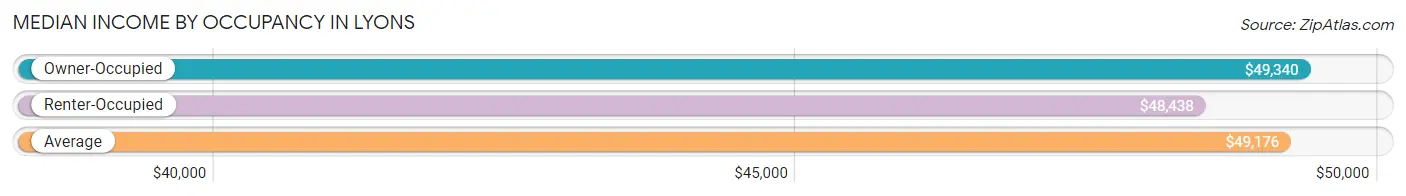
| Occupancy Type | # Households | Median Income |
| Owner-Occupied | 207 (70.2%) | $49,340 |
| Renter-Occupied | 88 (29.8%) | $48,438 |
| Average | 295 (100.0%) | $49,176 |
Occupancy by Householder Income Bracket in Lyons
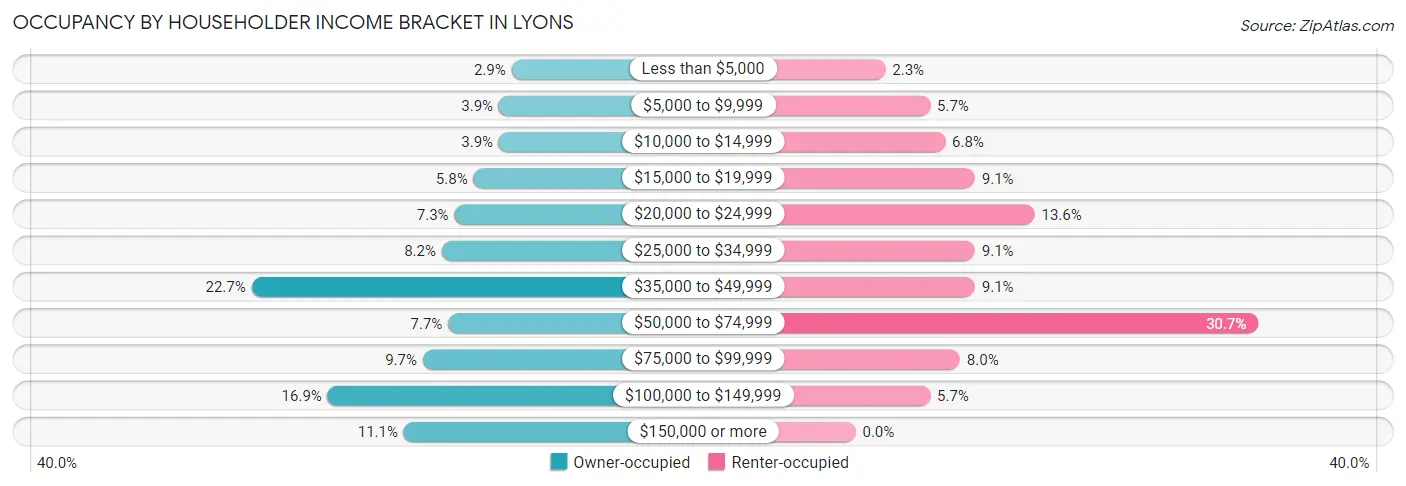
| Income Bracket | Owner-occupied | Renter-occupied |
| Less than $5,000 | 6 (2.9%) | 2 (2.3%) |
| $5,000 to $9,999 | 8 (3.9%) | 5 (5.7%) |
| $10,000 to $14,999 | 8 (3.9%) | 6 (6.8%) |
| $15,000 to $19,999 | 12 (5.8%) | 8 (9.1%) |
| $20,000 to $24,999 | 15 (7.2%) | 12 (13.6%) |
| $25,000 to $34,999 | 17 (8.2%) | 8 (9.1%) |
| $35,000 to $49,999 | 47 (22.7%) | 8 (9.1%) |
| $50,000 to $74,999 | 16 (7.7%) | 27 (30.7%) |
| $75,000 to $99,999 | 20 (9.7%) | 7 (8.0%) |
| $100,000 to $149,999 | 35 (16.9%) | 5 (5.7%) |
| $150,000 or more | 23 (11.1%) | 0 (0.0%) |
| Total | 207 (100.0%) | 88 (100.0%) |
Monthly Housing Cost Tiers in Lyons
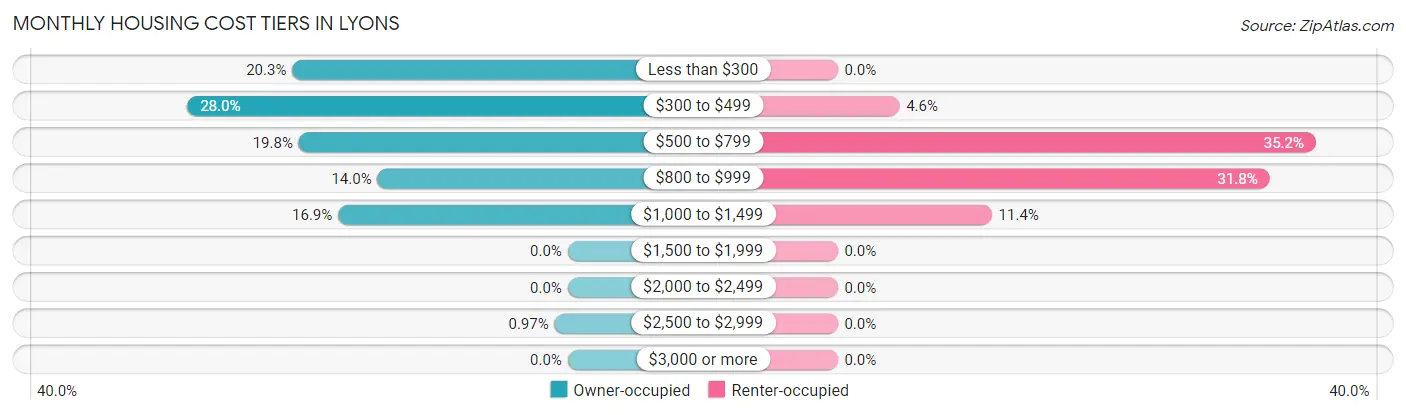
| Monthly Cost | Owner-occupied | Renter-occupied |
| Less than $300 | 42 (20.3%) | 0 (0.0%) |
| $300 to $499 | 58 (28.0%) | 4 (4.5%) |
| $500 to $799 | 41 (19.8%) | 31 (35.2%) |
| $800 to $999 | 29 (14.0%) | 28 (31.8%) |
| $1,000 to $1,499 | 35 (16.9%) | 10 (11.4%) |
| $1,500 to $1,999 | 0 (0.0%) | 0 (0.0%) |
| $2,000 to $2,499 | 0 (0.0%) | 0 (0.0%) |
| $2,500 to $2,999 | 2 (1.0%) | 0 (0.0%) |
| $3,000 or more | 0 (0.0%) | 0 (0.0%) |
| Total | 207 (100.0%) | 88 (100.0%) |
Physical Housing Characteristics in Lyons
Housing Structures in Lyons
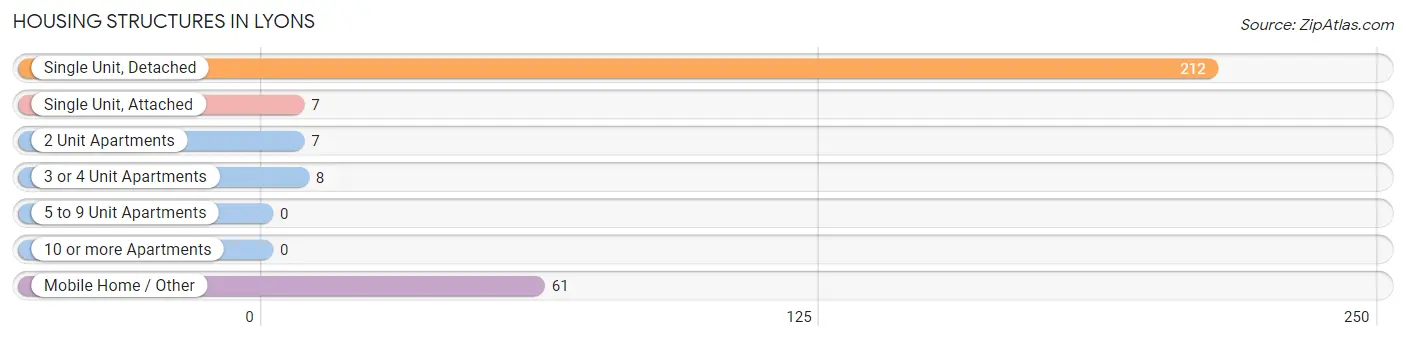
| Structure Type | # Housing Units | % Housing Units |
| Single Unit, Detached | 212 | 71.9% |
| Single Unit, Attached | 7 | 2.4% |
| 2 Unit Apartments | 7 | 2.4% |
| 3 or 4 Unit Apartments | 8 | 2.7% |
| 5 to 9 Unit Apartments | 0 | 0.0% |
| 10 or more Apartments | 0 | 0.0% |
| Mobile Home / Other | 61 | 20.7% |
| Total | 295 | 100.0% |
Housing Structures by Occupancy in Lyons
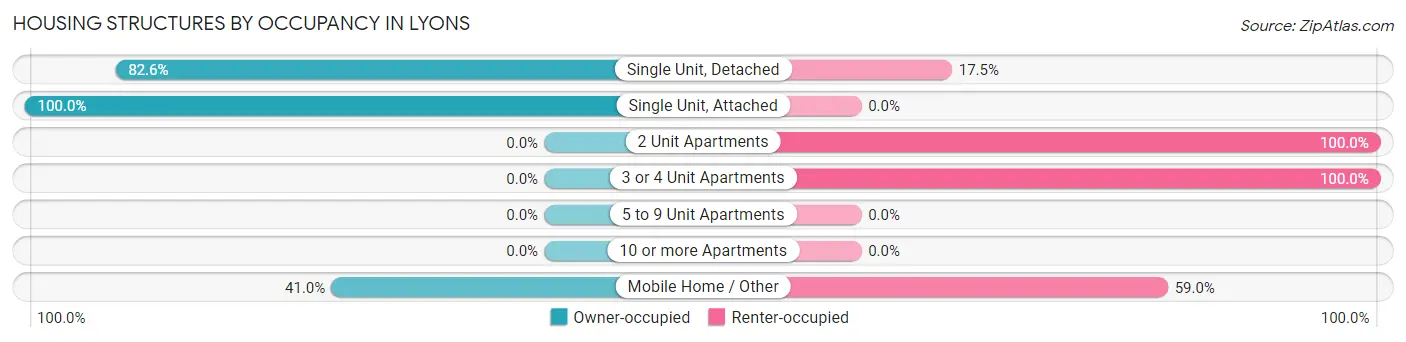
| Structure Type | Owner-occupied | Renter-occupied |
| Single Unit, Detached | 175 (82.6%) | 37 (17.4%) |
| Single Unit, Attached | 7 (100.0%) | 0 (0.0%) |
| 2 Unit Apartments | 0 (0.0%) | 7 (100.0%) |
| 3 or 4 Unit Apartments | 0 (0.0%) | 8 (100.0%) |
| 5 to 9 Unit Apartments | 0 (0.0%) | 0 (0.0%) |
| 10 or more Apartments | 0 (0.0%) | 0 (0.0%) |
| Mobile Home / Other | 25 (41.0%) | 36 (59.0%) |
| Total | 207 (70.2%) | 88 (29.8%) |
Housing Structures by Number of Rooms in Lyons
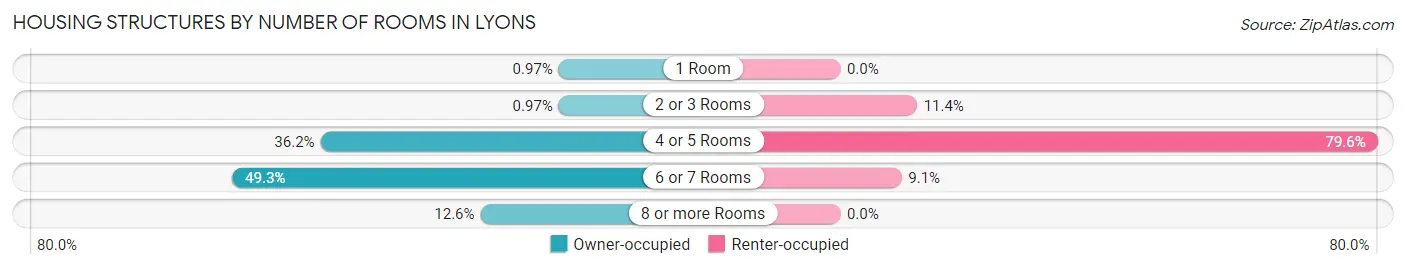
| Number of Rooms | Owner-occupied | Renter-occupied |
| 1 Room | 2 (1.0%) | 0 (0.0%) |
| 2 or 3 Rooms | 2 (1.0%) | 10 (11.4%) |
| 4 or 5 Rooms | 75 (36.2%) | 70 (79.5%) |
| 6 or 7 Rooms | 102 (49.3%) | 8 (9.1%) |
| 8 or more Rooms | 26 (12.6%) | 0 (0.0%) |
| Total | 207 (100.0%) | 88 (100.0%) |
Housing Structure by Heating Type in Lyons
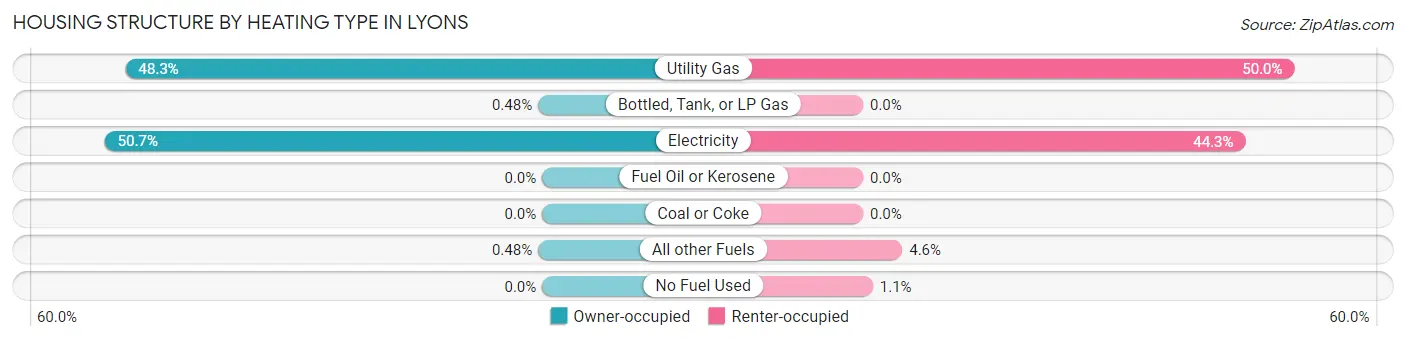
| Heating Type | Owner-occupied | Renter-occupied |
| Utility Gas | 100 (48.3%) | 44 (50.0%) |
| Bottled, Tank, or LP Gas | 1 (0.5%) | 0 (0.0%) |
| Electricity | 105 (50.7%) | 39 (44.3%) |
| Fuel Oil or Kerosene | 0 (0.0%) | 0 (0.0%) |
| Coal or Coke | 0 (0.0%) | 0 (0.0%) |
| All other Fuels | 1 (0.5%) | 4 (4.5%) |
| No Fuel Used | 0 (0.0%) | 1 (1.1%) |
| Total | 207 (100.0%) | 88 (100.0%) |
Household Vehicle Usage in Lyons
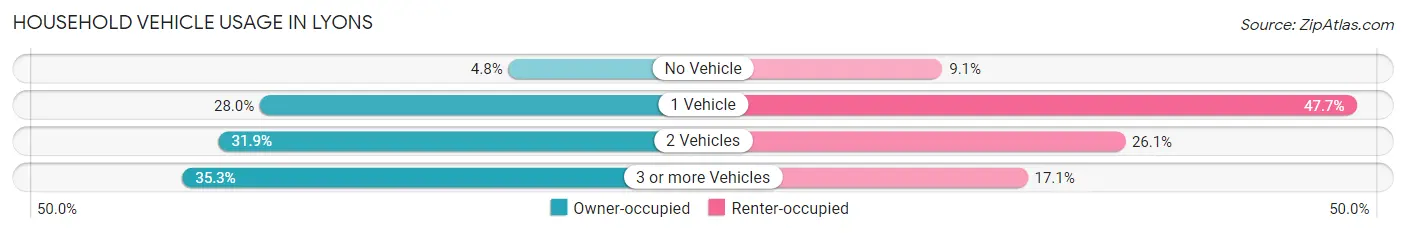
| Vehicles per Household | Owner-occupied | Renter-occupied |
| No Vehicle | 10 (4.8%) | 8 (9.1%) |
| 1 Vehicle | 58 (28.0%) | 42 (47.7%) |
| 2 Vehicles | 66 (31.9%) | 23 (26.1%) |
| 3 or more Vehicles | 73 (35.3%) | 15 (17.1%) |
| Total | 207 (100.0%) | 88 (100.0%) |
Real Estate & Mortgages in Lyons
Real Estate and Mortgage Overview in Lyons
| Characteristic | Without Mortgage | With Mortgage |
| Housing Units | 130 | 77 |
| Median Property Value | $64,100 | $76,300 |
| Median Household Income | $45,000 | $2 |
| Monthly Housing Costs | $411 | $0 |
| Real Estate Taxes | - | - |
Property Value by Mortgage Status in Lyons
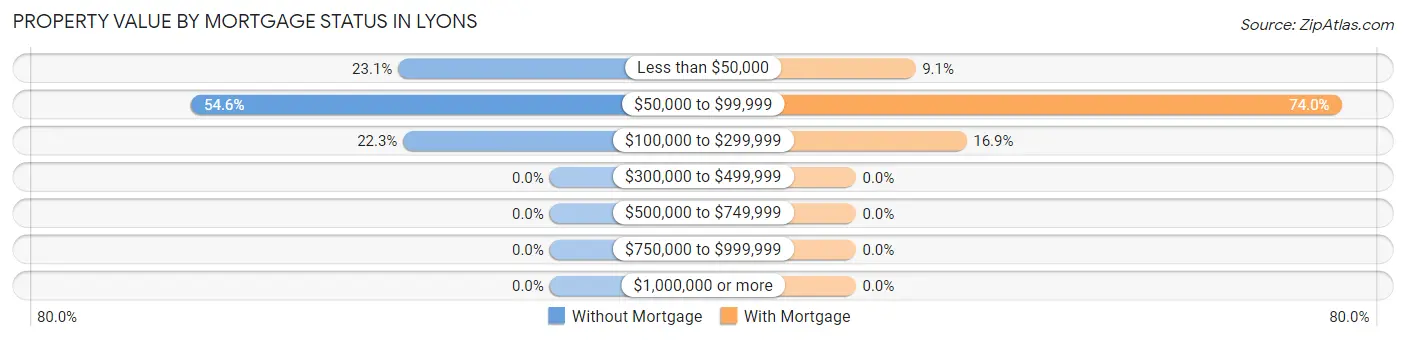
| Property Value | Without Mortgage | With Mortgage |
| Less than $50,000 | 30 (23.1%) | 7 (9.1%) |
| $50,000 to $99,999 | 71 (54.6%) | 57 (74.0%) |
| $100,000 to $299,999 | 29 (22.3%) | 13 (16.9%) |
| $300,000 to $499,999 | 0 (0.0%) | 0 (0.0%) |
| $500,000 to $749,999 | 0 (0.0%) | 0 (0.0%) |
| $750,000 to $999,999 | 0 (0.0%) | 0 (0.0%) |
| $1,000,000 or more | 0 (0.0%) | 0 (0.0%) |
| Total | 130 (100.0%) | 77 (100.0%) |
Household Income by Mortgage Status in Lyons
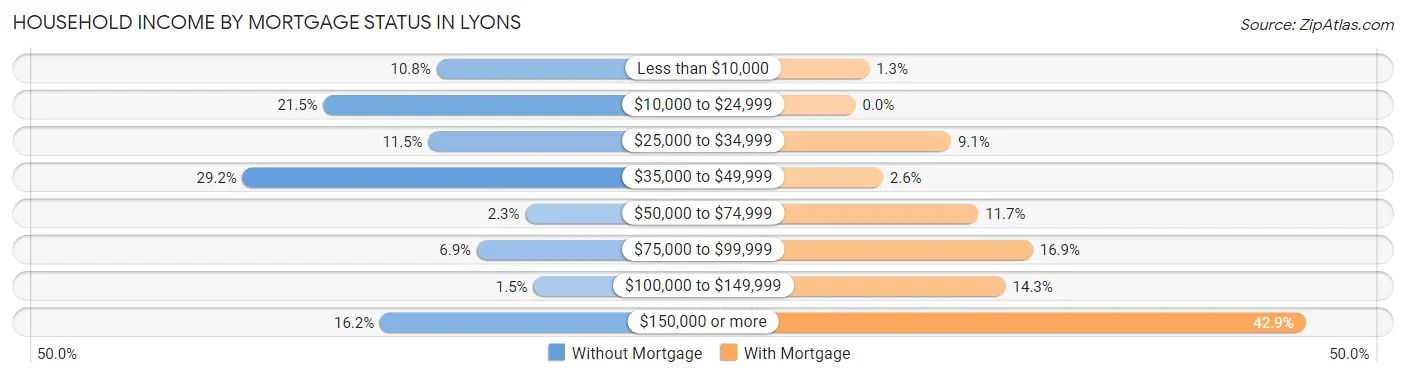
| Household Income | Without Mortgage | With Mortgage |
| Less than $10,000 | 14 (10.8%) | 1 (1.3%) |
| $10,000 to $24,999 | 28 (21.5%) | 0 (0.0%) |
| $25,000 to $34,999 | 15 (11.5%) | 7 (9.1%) |
| $35,000 to $49,999 | 38 (29.2%) | 2 (2.6%) |
| $50,000 to $74,999 | 3 (2.3%) | 9 (11.7%) |
| $75,000 to $99,999 | 9 (6.9%) | 13 (16.9%) |
| $100,000 to $149,999 | 2 (1.5%) | 11 (14.3%) |
| $150,000 or more | 21 (16.2%) | 33 (42.9%) |
| Total | 130 (100.0%) | 77 (100.0%) |
Property Value to Household Income Ratio in Lyons
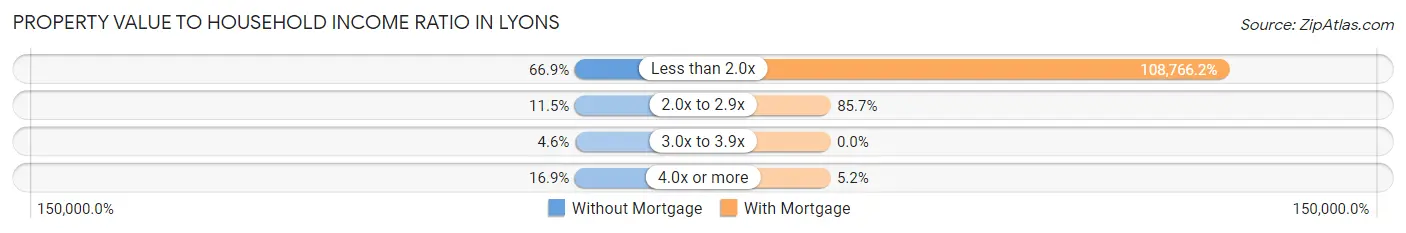
| Value-to-Income Ratio | Without Mortgage | With Mortgage |
| Less than 2.0x | 87 (66.9%) | 83,750 (108,766.2%) |
| 2.0x to 2.9x | 15 (11.5%) | 66 (85.7%) |
| 3.0x to 3.9x | 6 (4.6%) | 0 (0.0%) |
| 4.0x or more | 22 (16.9%) | 4 (5.2%) |
| Total | 130 (100.0%) | 77 (100.0%) |
Real Estate Taxes by Mortgage Status in Lyons
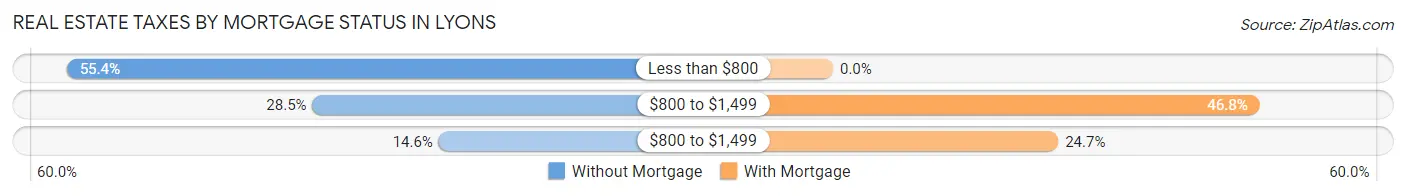
| Property Taxes | Without Mortgage | With Mortgage |
| Less than $800 | 72 (55.4%) | 0 (0.0%) |
| $800 to $1,499 | 37 (28.5%) | 36 (46.8%) |
| $800 to $1,499 | 19 (14.6%) | 19 (24.7%) |
| Total | 130 (100.0%) | 77 (100.0%) |
Health & Disability in Lyons
Health Insurance Coverage by Age in Lyons
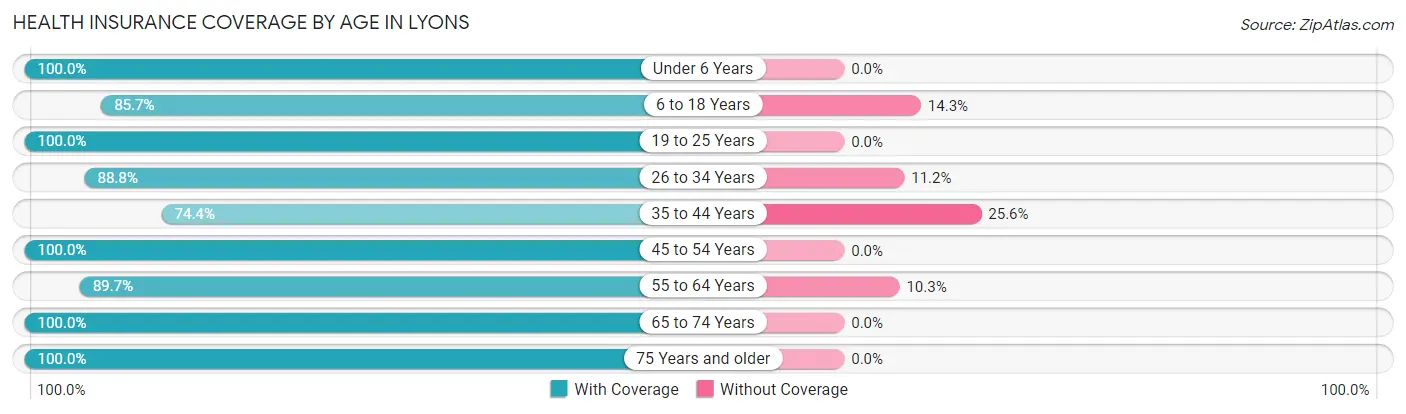
| Age Bracket | With Coverage | Without Coverage |
| Under 6 Years | 38 (100.0%) | 0 (0.0%) |
| 6 to 18 Years | 108 (85.7%) | 18 (14.3%) |
| 19 to 25 Years | 23 (100.0%) | 0 (0.0%) |
| 26 to 34 Years | 119 (88.8%) | 15 (11.2%) |
| 35 to 44 Years | 67 (74.4%) | 23 (25.6%) |
| 45 to 54 Years | 83 (100.0%) | 0 (0.0%) |
| 55 to 64 Years | 122 (89.7%) | 14 (10.3%) |
| 65 to 74 Years | 43 (100.0%) | 0 (0.0%) |
| 75 Years and older | 57 (100.0%) | 0 (0.0%) |
| Total | 660 (90.4%) | 70 (9.6%) |
Health Insurance Coverage by Citizenship Status in Lyons
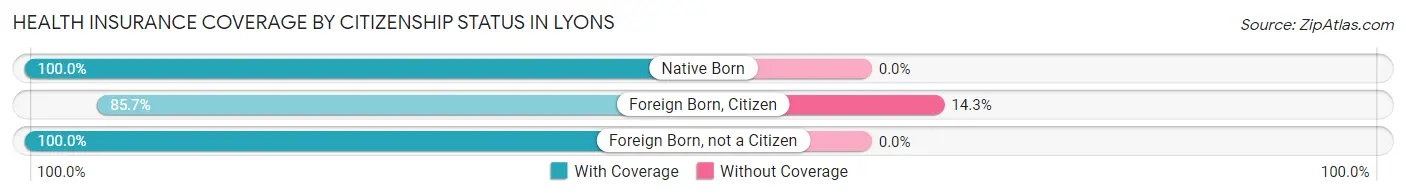
| Citizenship Status | With Coverage | Without Coverage |
| Native Born | 38 (100.0%) | 0 (0.0%) |
| Foreign Born, Citizen | 108 (85.7%) | 18 (14.3%) |
| Foreign Born, not a Citizen | 23 (100.0%) | 0 (0.0%) |
Health Insurance Coverage by Household Income in Lyons
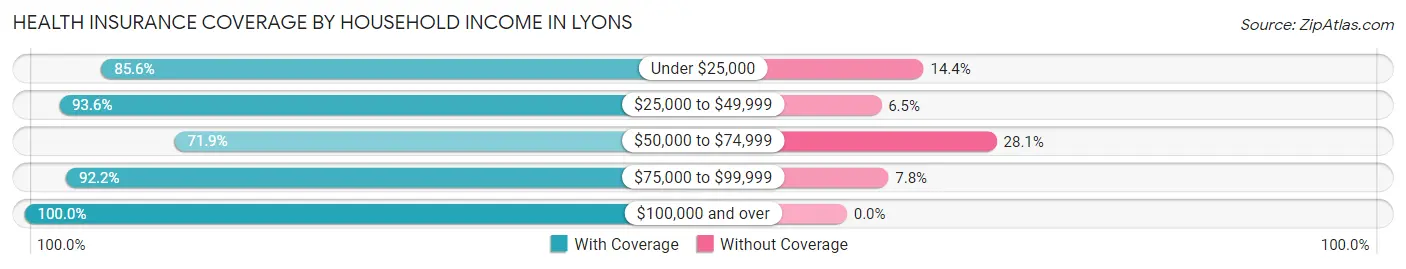
| Household Income | With Coverage | Without Coverage |
| Under $25,000 | 125 (85.6%) | 21 (14.4%) |
| $25,000 to $49,999 | 145 (93.5%) | 10 (6.5%) |
| $50,000 to $74,999 | 82 (71.9%) | 32 (28.1%) |
| $75,000 to $99,999 | 83 (92.2%) | 7 (7.8%) |
| $100,000 and over | 225 (100.0%) | 0 (0.0%) |
Public vs Private Health Insurance Coverage by Age in Lyons
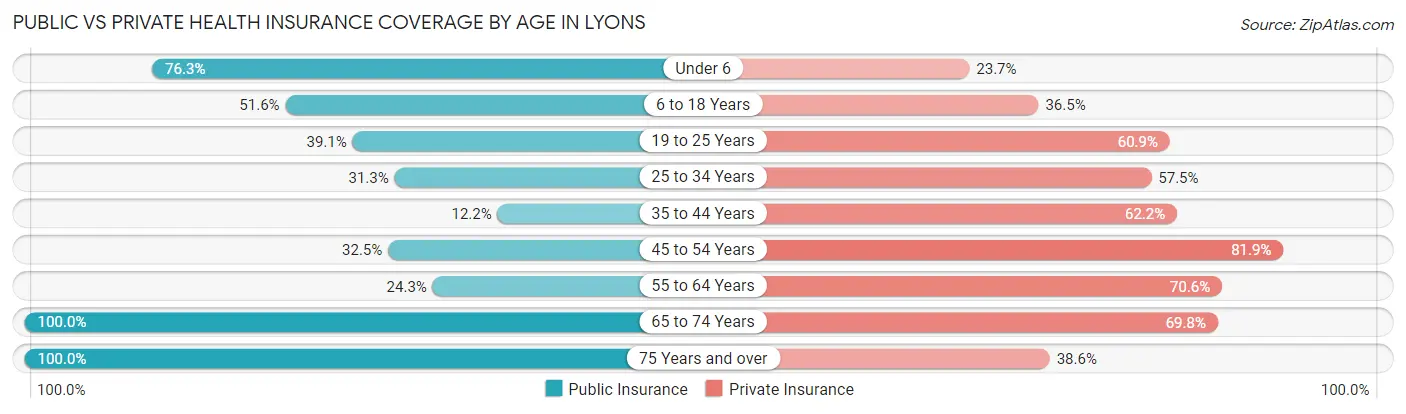
| Age Bracket | Public Insurance | Private Insurance |
| Under 6 | 29 (76.3%) | 9 (23.7%) |
| 6 to 18 Years | 65 (51.6%) | 46 (36.5%) |
| 19 to 25 Years | 9 (39.1%) | 14 (60.9%) |
| 25 to 34 Years | 42 (31.3%) | 77 (57.5%) |
| 35 to 44 Years | 11 (12.2%) | 56 (62.2%) |
| 45 to 54 Years | 27 (32.5%) | 68 (81.9%) |
| 55 to 64 Years | 33 (24.3%) | 96 (70.6%) |
| 65 to 74 Years | 43 (100.0%) | 30 (69.8%) |
| 75 Years and over | 57 (100.0%) | 22 (38.6%) |
| Total | 316 (43.3%) | 418 (57.3%) |
Disability Status by Sex by Age in Lyons
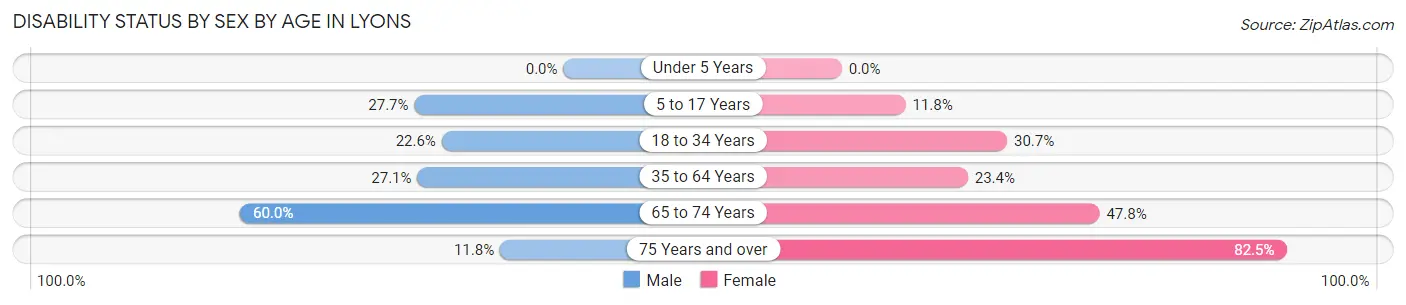
| Age Bracket | Male | Female |
| Under 5 Years | 0 (0.0%) | 0 (0.0%) |
| 5 to 17 Years | 13 (27.7%) | 9 (11.8%) |
| 18 to 34 Years | 21 (22.6%) | 23 (30.7%) |
| 35 to 64 Years | 42 (27.1%) | 36 (23.4%) |
| 65 to 74 Years | 12 (60.0%) | 11 (47.8%) |
| 75 Years and over | 2 (11.8%) | 33 (82.5%) |
Disability Class by Sex by Age in Lyons
Disability Class: Hearing Difficulty
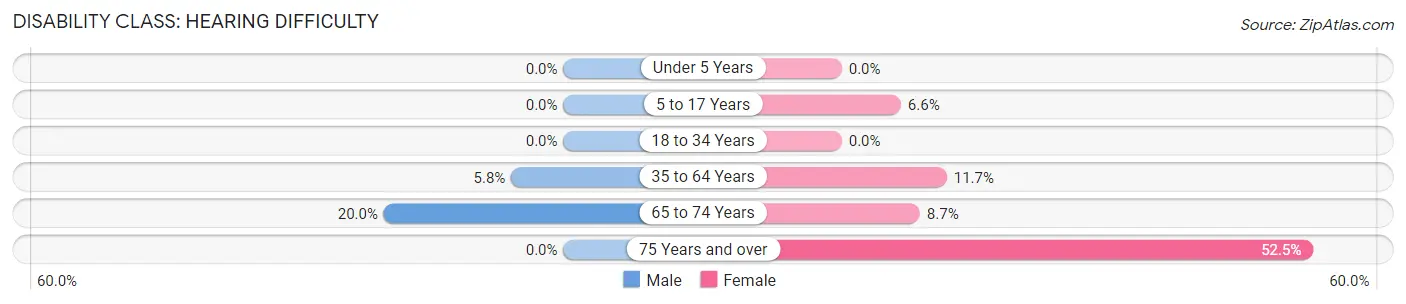
| Age Bracket | Male | Female |
| Under 5 Years | 0 (0.0%) | 0 (0.0%) |
| 5 to 17 Years | 0 (0.0%) | 5 (6.6%) |
| 18 to 34 Years | 0 (0.0%) | 0 (0.0%) |
| 35 to 64 Years | 9 (5.8%) | 18 (11.7%) |
| 65 to 74 Years | 4 (20.0%) | 2 (8.7%) |
| 75 Years and over | 0 (0.0%) | 21 (52.5%) |
Disability Class: Vision Difficulty
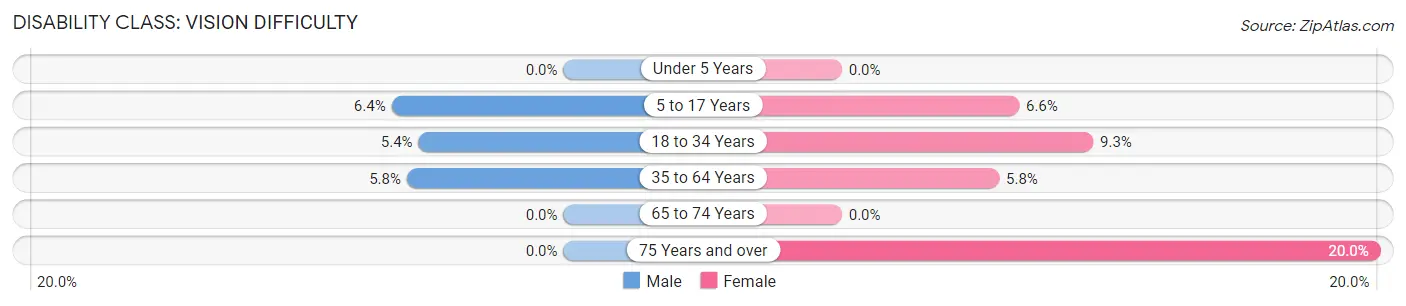
| Age Bracket | Male | Female |
| Under 5 Years | 0 (0.0%) | 0 (0.0%) |
| 5 to 17 Years | 3 (6.4%) | 5 (6.6%) |
| 18 to 34 Years | 5 (5.4%) | 7 (9.3%) |
| 35 to 64 Years | 9 (5.8%) | 9 (5.8%) |
| 65 to 74 Years | 0 (0.0%) | 0 (0.0%) |
| 75 Years and over | 0 (0.0%) | 8 (20.0%) |
Disability Class: Cognitive Difficulty
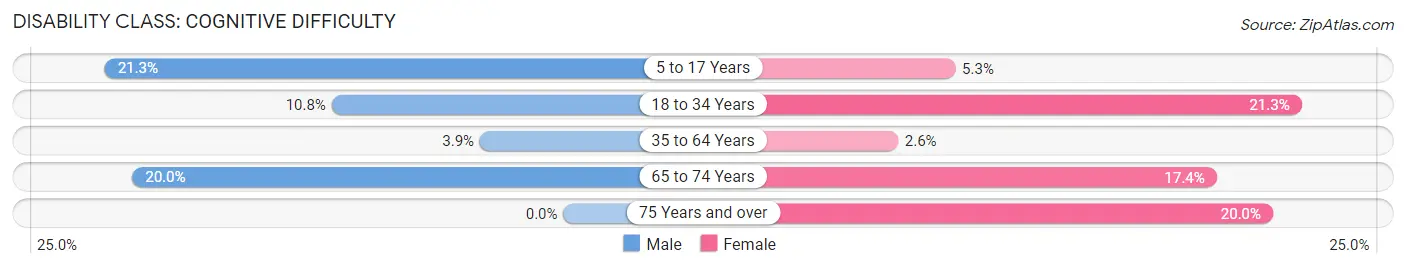
| Age Bracket | Male | Female |
| 5 to 17 Years | 10 (21.3%) | 4 (5.3%) |
| 18 to 34 Years | 10 (10.7%) | 16 (21.3%) |
| 35 to 64 Years | 6 (3.9%) | 4 (2.6%) |
| 65 to 74 Years | 4 (20.0%) | 4 (17.4%) |
| 75 Years and over | 0 (0.0%) | 8 (20.0%) |
Disability Class: Ambulatory Difficulty
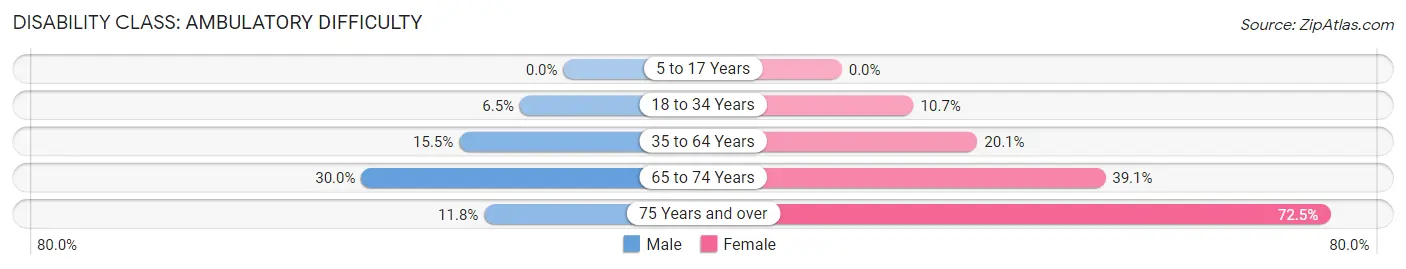
| Age Bracket | Male | Female |
| 5 to 17 Years | 0 (0.0%) | 0 (0.0%) |
| 18 to 34 Years | 6 (6.5%) | 8 (10.7%) |
| 35 to 64 Years | 24 (15.5%) | 31 (20.1%) |
| 65 to 74 Years | 6 (30.0%) | 9 (39.1%) |
| 75 Years and over | 2 (11.8%) | 29 (72.5%) |
Disability Class: Self-Care Difficulty
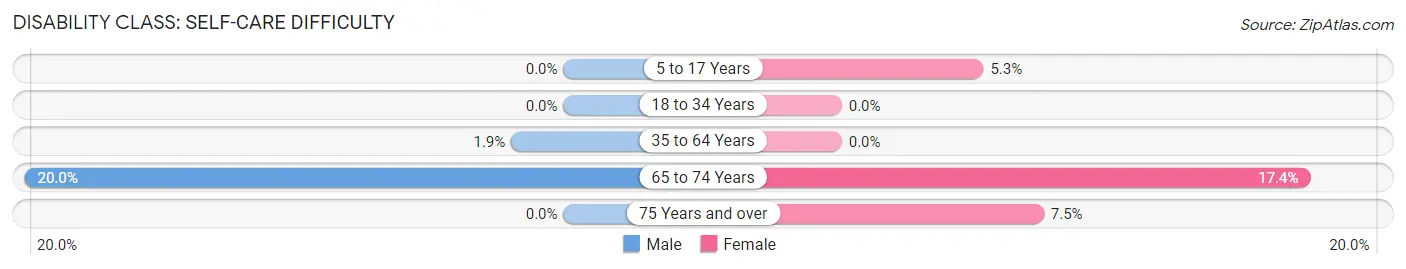
| Age Bracket | Male | Female |
| 5 to 17 Years | 0 (0.0%) | 4 (5.3%) |
| 18 to 34 Years | 0 (0.0%) | 0 (0.0%) |
| 35 to 64 Years | 3 (1.9%) | 0 (0.0%) |
| 65 to 74 Years | 4 (20.0%) | 4 (17.4%) |
| 75 Years and over | 0 (0.0%) | 3 (7.5%) |
Technology Access in Lyons
Computing Device Access in Lyons
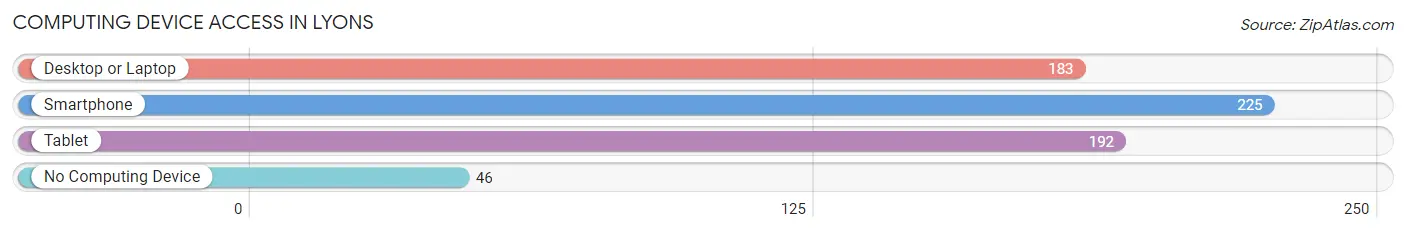
| Device Type | # Households | % Households |
| Desktop or Laptop | 183 | 62.0% |
| Smartphone | 225 | 76.3% |
| Tablet | 192 | 65.1% |
| No Computing Device | 46 | 15.6% |
| Total | 295 | 100.0% |
Internet Access in Lyons
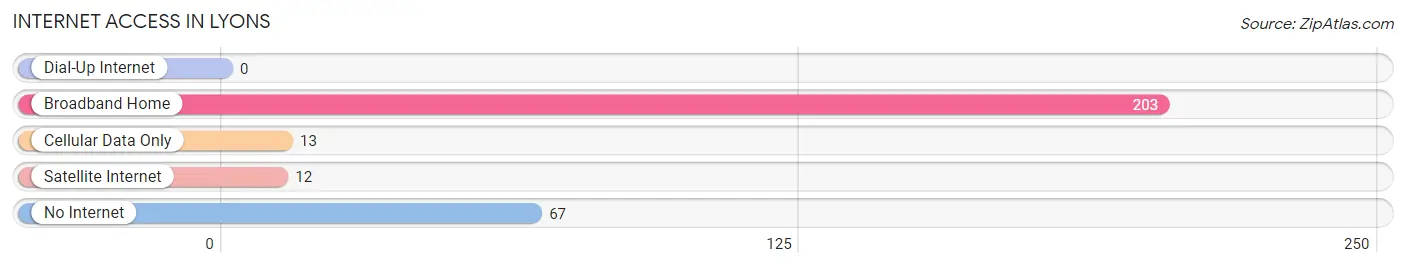
| Internet Type | # Households | % Households |
| Dial-Up Internet | 0 | 0.0% |
| Broadband Home | 203 | 68.8% |
| Cellular Data Only | 13 | 4.4% |
| Satellite Internet | 12 | 4.1% |
| No Internet | 67 | 22.7% |
| Total | 295 | 100.0% |
Lyons Summary
Lyons is a small town located in the northwest corner of Indiana, in White County. It is situated on the banks of the Tippecanoe River, and is surrounded by rolling hills and farmland. The town has a population of just over 1,000 people, and is known for its small-town charm and friendly atmosphere.
History
The area that is now Lyons was first settled in the early 1800s by a group of settlers from Ohio. The town was originally known as “Lyonsville”, and was named after the first settler, John Lyons. The town was officially incorporated in 1837, and the first post office was established in 1838.
In the late 1800s, the town began to grow and prosper. The railroad came to town in 1882, and the town was connected to the rest of the country. This allowed for the growth of industry and commerce in the area. The town also became a popular tourist destination, as it was located near several lakes and rivers.
Geography
Lyons is located in the northwest corner of Indiana, in White County. It is situated on the banks of the Tippecanoe River, and is surrounded by rolling hills and farmland. The town is located about 30 miles from the state capital of Indianapolis, and is about an hour’s drive from Chicago.
The town has a total area of 1.2 square miles, all of which is land. The town is located at an elevation of 830 feet above sea level. The climate in Lyons is generally mild, with hot summers and cold winters.
Economy
The economy of Lyons is largely based on agriculture and tourism. The town is home to several farms, which produce a variety of crops, including corn, soybeans, and wheat. The town is also home to several small businesses, including restaurants, shops, and other services.
Tourism is also an important part of the economy in Lyons. The town is home to several lakes and rivers, which attract visitors from all over the region. The town is also home to several parks and recreational areas, which are popular with visitors.
Demographics
As of the 2010 census, the population of Lyons was 1,037. The racial makeup of the town was 97.3% White, 0.7% African American, 0.3% Native American, 0.2% Asian, 0.1% Pacific Islander, 0.3% from other races, and 1.2% from two or more races. Hispanic or Latino of any race were 1.2% of the population.
The median income for a household in the town was $37,500, and the median income for a family was $45,000. The per capita income for the town was $18,000. About 10.3% of families and 13.2% of the population were below the poverty line, including 16.2% of those under age 18 and 8.3% of those age 65 or over.
Lyons is a small town with a rich history and a friendly atmosphere. The town is home to several farms and businesses, and is a popular tourist destination. The town has a diverse population, and is a great place to live and work.
Common Questions
What is Per Capita Income in Lyons?
Per Capita income in Lyons is $31,326.
What is the Median Family Income in Lyons?
Median Family Income in Lyons is $63,309.
What is the Median Household income in Lyons?
Median Household Income in Lyons is $49,176.
What is Income or Wage Gap in Lyons?
Income or Wage Gap in Lyons is 41.1%.
Women in Lyons earn 58.9 cents for every dollar earned by a man.
What is Family Income Deficit in Lyons?
Family Income Deficit in Lyons is $8,563.
Families that are below poverty line in Lyons earn $8,563 less on average than the poverty threshold level.
What is Inequality or Gini Index in Lyons?
Inequality or Gini Index in Lyons is 0.52.
What is the Total Population of Lyons?
Total Population of Lyons is 802.
What is the Total Male Population of Lyons?
Total Male Population of Lyons is 406.
What is the Total Female Population of Lyons?
Total Female Population of Lyons is 396.
What is the Ratio of Males per 100 Females in Lyons?
There are 102.53 Males per 100 Females in Lyons.
What is the Ratio of Females per 100 Males in Lyons?
There are 97.54 Females per 100 Males in Lyons.
What is the Median Population Age in Lyons?
Median Population Age in Lyons is 43.3 Years.
What is the Average Family Size in Lyons
Average Family Size in Lyons is 3.1 People.
What is the Average Household Size in Lyons
Average Household Size in Lyons is 2.5 People.
How Large is the Labor Force in Lyons?
There are 409 People in the Labor Forcein in Lyons.
What is the Percentage of People in the Labor Force in Lyons?
60.9% of People are in the Labor Force in Lyons.
What is the Unemployment Rate in Lyons?
Unemployment Rate in Lyons is 3.7%.