Conesville, IA Map & Demographics
Conesville Map
Conesville Overview
$30,590
PER CAPITA INCOME
$86,071
AVG FAMILY INCOME
$68,750
AVG HOUSEHOLD INCOME
35.7%
WAGE / INCOME GAP [ % ]
64.3¢/ $1
WAGE / INCOME GAP [ $ ]
0.35
INEQUALITY / GINI INDEX
467
TOTAL POPULATION
264
MALE POPULATION
203
FEMALE POPULATION
130.05
MALES / 100 FEMALES
76.89
FEMALES / 100 MALES
34.6
MEDIAN AGE
2.7
AVG FAMILY SIZE
2.3
AVG HOUSEHOLD SIZE
272
LABOR FORCE [ PEOPLE ]
76.2%
PERCENT IN LABOR FORCE
6.3%
UNEMPLOYMENT RATE
Conesville Zip Codes
Conesville Area Codes
Income in Conesville
Income Overview in Conesville
Per Capita Income in Conesville is $30,590, while median incomes of families and households are $86,071 and $68,750 respectively.
| Characteristic | Number | Measure |
| Per Capita Income | 467 | $30,590 |
| Median Family Income | 134 | $86,071 |
| Mean Family Income | 134 | $85,093 |
| Median Household Income | 198 | $68,750 |
| Mean Household Income | 198 | $74,368 |
| Income Deficit | 134 | $0 |
| Wage / Income Gap (%) | 467 | 35.66% |
| Wage / Income Gap ($) | 467 | 64.34¢ per $1 |
| Gini / Inequality Index | 467 | 0.35 |
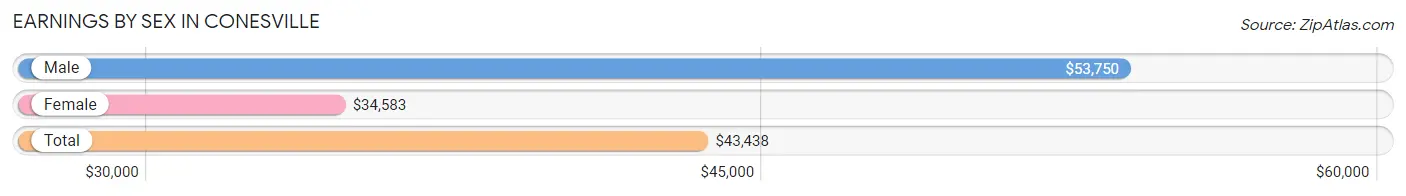
Earnings by Sex in Conesville
Average Earnings in Conesville are $43,438, $53,750 for men and $34,583 for women, a difference of 35.7%.
| Sex | Number | Average Earnings |
| Male | 172 (59.9%) | $53,750 |
| Female | 115 (40.1%) | $34,583 |
| Total | 287 (100.0%) | $43,438 |
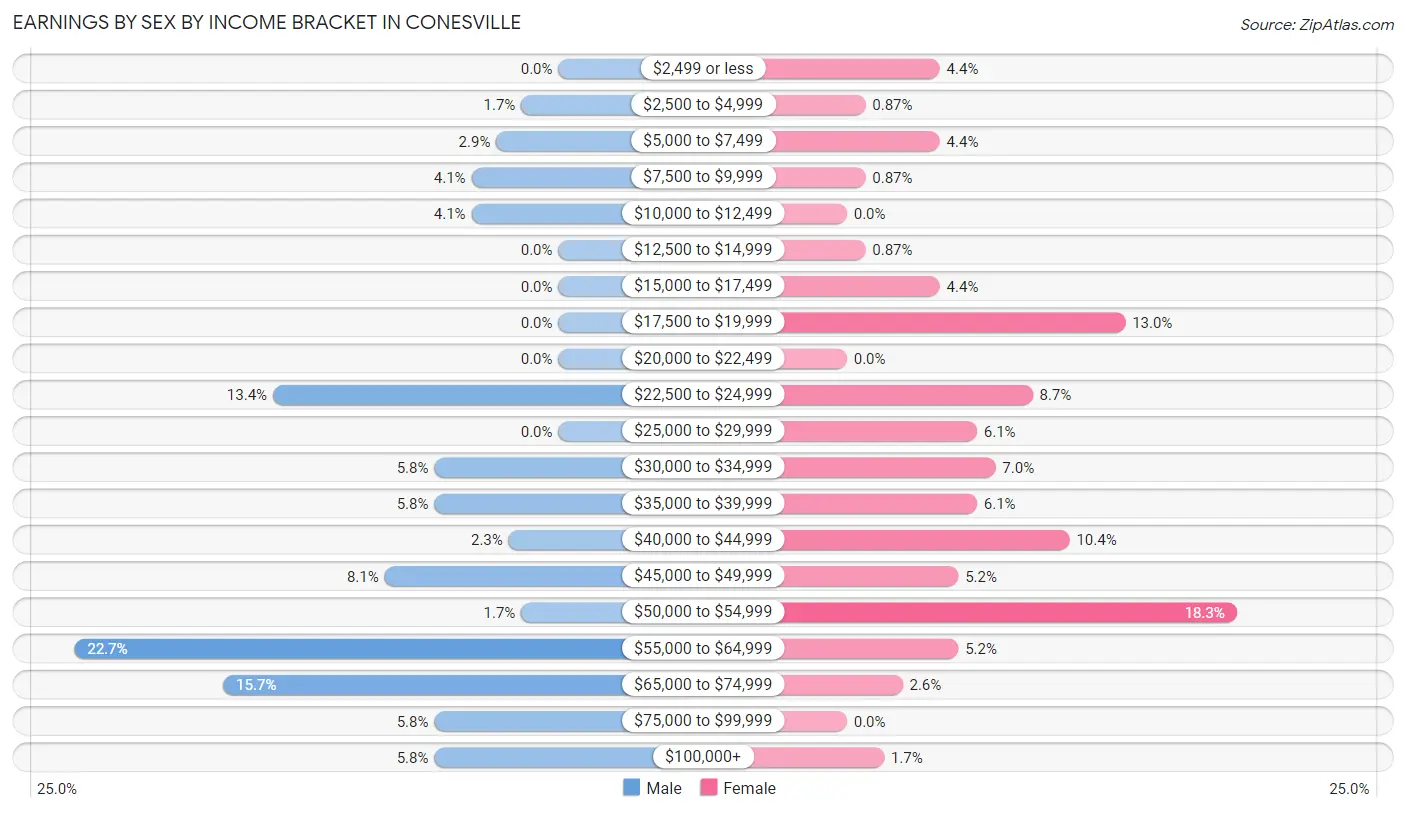
Earnings by Sex by Income Bracket in Conesville
The most common earnings brackets in Conesville are $55,000 to $64,999 for men (39 | 22.7%) and $50,000 to $54,999 for women (21 | 18.3%).
| Income | Male | Female |
| $2,499 or less | 0 (0.0%) | 5 (4.3%) |
| $2,500 to $4,999 | 3 (1.7%) | 1 (0.9%) |
| $5,000 to $7,499 | 5 (2.9%) | 5 (4.3%) |
| $7,500 to $9,999 | 7 (4.1%) | 1 (0.9%) |
| $10,000 to $12,499 | 7 (4.1%) | 0 (0.0%) |
| $12,500 to $14,999 | 0 (0.0%) | 1 (0.9%) |
| $15,000 to $17,499 | 0 (0.0%) | 5 (4.3%) |
| $17,500 to $19,999 | 0 (0.0%) | 15 (13.0%) |
| $20,000 to $22,499 | 0 (0.0%) | 0 (0.0%) |
| $22,500 to $24,999 | 23 (13.4%) | 10 (8.7%) |
| $25,000 to $29,999 | 0 (0.0%) | 7 (6.1%) |
| $30,000 to $34,999 | 10 (5.8%) | 8 (7.0%) |
| $35,000 to $39,999 | 10 (5.8%) | 7 (6.1%) |
| $40,000 to $44,999 | 4 (2.3%) | 12 (10.4%) |
| $45,000 to $49,999 | 14 (8.1%) | 6 (5.2%) |
| $50,000 to $54,999 | 3 (1.7%) | 21 (18.3%) |
| $55,000 to $64,999 | 39 (22.7%) | 6 (5.2%) |
| $65,000 to $74,999 | 27 (15.7%) | 3 (2.6%) |
| $75,000 to $99,999 | 10 (5.8%) | 0 (0.0%) |
| $100,000+ | 10 (5.8%) | 2 (1.7%) |
| Total | 172 (100.0%) | 115 (100.0%) |
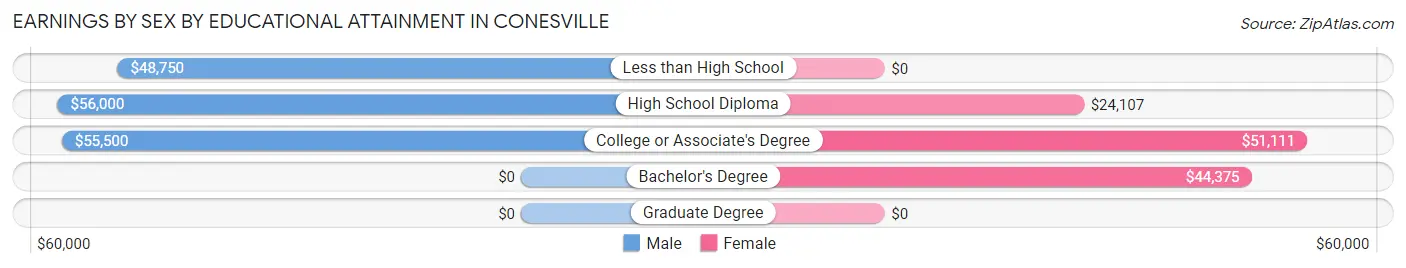
Earnings by Sex by Educational Attainment in Conesville
Average earnings in Conesville are $55,329 for men and $37,500 for women, a difference of 32.2%. Men with an educational attainment of high school diploma enjoy the highest average annual earnings of $56,000, while those with less than high school education earn the least with $48,750. Women with an educational attainment of college or associate's degree earn the most with the average annual earnings of $51,111, while those with high school diploma education have the smallest earnings of $24,107.
| Educational Attainment | Male Income | Female Income |
| Less than High School | $48,750 | $0 |
| High School Diploma | $56,000 | $24,107 |
| College or Associate's Degree | $55,500 | $51,111 |
| Bachelor's Degree | - | - |
| Graduate Degree | - | - |
| Total | $55,329 | $37,500 |
Family Income in Conesville
Family Income Brackets in Conesville
According to the Conesville family income data, there are 32 families falling into the $100,000 to $149,999 income range, which is the most common income bracket and makes up 23.9% of all families.
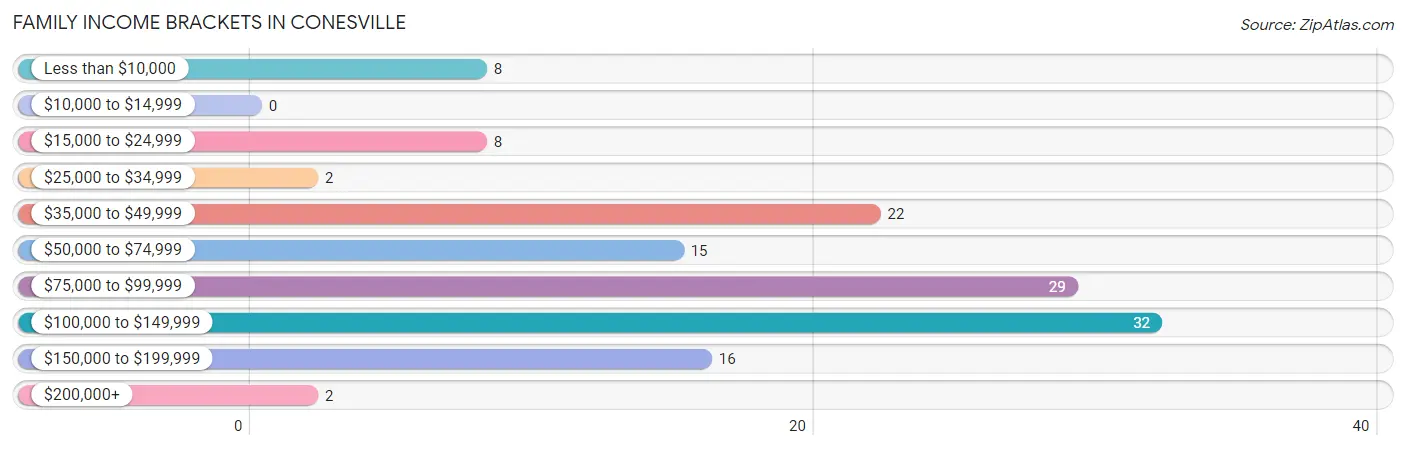
| Income Bracket | # Families | % Families |
| Less than $10,000 | 8 | 6.0% |
| $10,000 to $14,999 | 0 | 0.0% |
| $15,000 to $24,999 | 8 | 6.0% |
| $25,000 to $34,999 | 2 | 1.5% |
| $35,000 to $49,999 | 22 | 16.4% |
| $50,000 to $74,999 | 15 | 11.2% |
| $75,000 to $99,999 | 29 | 21.6% |
| $100,000 to $149,999 | 32 | 23.9% |
| $150,000 to $199,999 | 16 | 11.9% |
| $200,000+ | 2 | 1.5% |
Family Income by Famaliy Size in Conesville
2-person families (71 | 53.0%) account for the highest median family income in Conesville with $103,352 per family, while 2-person families (71 | 53.0%) have the highest median income of $51,676 per family member.
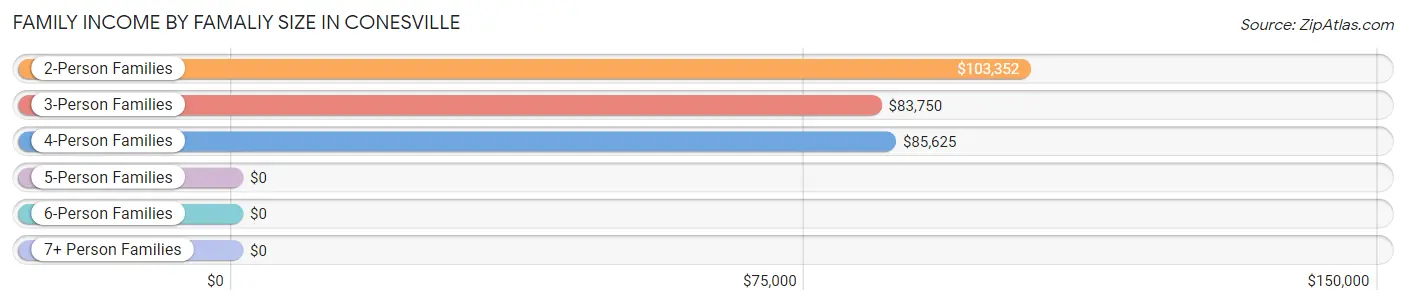
| Income Bracket | # Families | Median Income |
| 2-Person Families | 71 (53.0%) | $103,352 |
| 3-Person Families | 27 (20.2%) | $83,750 |
| 4-Person Families | 16 (11.9%) | $85,625 |
| 5-Person Families | 10 (7.5%) | $0 |
| 6-Person Families | 1 (0.7%) | $0 |
| 7+ Person Families | 9 (6.7%) | $0 |
| Total | 134 (100.0%) | $86,071 |
Family Income by Number of Earners in Conesville
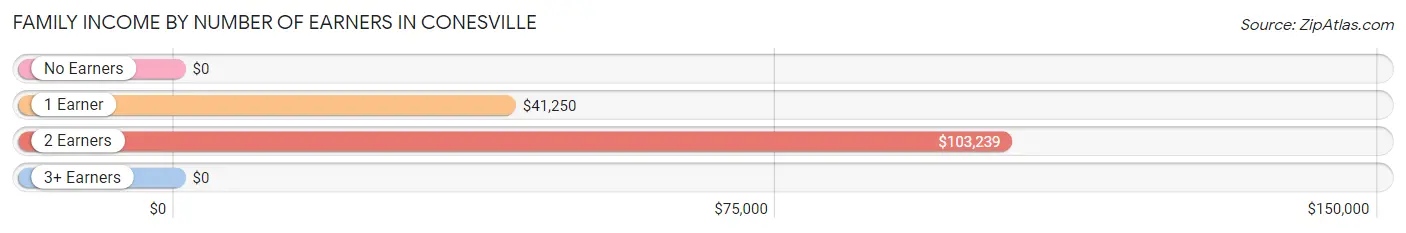
| Number of Earners | # Families | Median Income |
| No Earners | 6 (4.5%) | $0 |
| 1 Earner | 42 (31.3%) | $41,250 |
| 2 Earners | 75 (56.0%) | $103,239 |
| 3+ Earners | 11 (8.2%) | $0 |
| Total | 134 (100.0%) | $86,071 |
Household Income in Conesville
Household Income Brackets in Conesville
With 49 households falling in the category, the $35,000 to $49,999 income range is the most frequent in Conesville, accounting for 24.7% of all households. In contrast, only 2 households (1.0%) fall into the $10,000 to $14,999 income bracket, making it the least populous group.
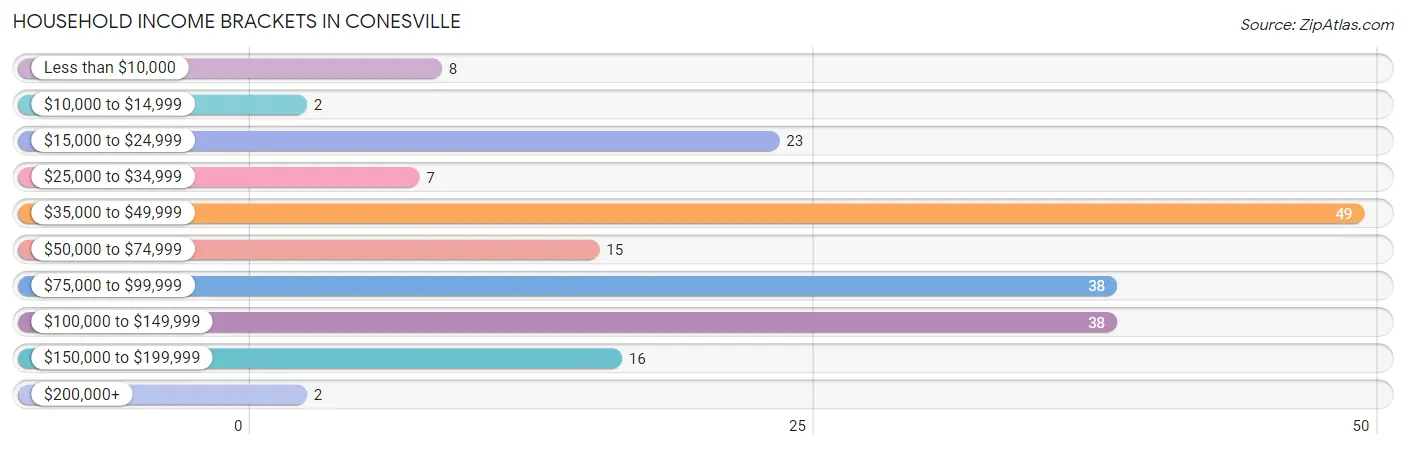
| Income Bracket | # Households | % Households |
| Less than $10,000 | 8 | 4.0% |
| $10,000 to $14,999 | 2 | 1.0% |
| $15,000 to $24,999 | 23 | 11.6% |
| $25,000 to $34,999 | 7 | 3.5% |
| $35,000 to $49,999 | 49 | 24.7% |
| $50,000 to $74,999 | 15 | 7.6% |
| $75,000 to $99,999 | 38 | 19.2% |
| $100,000 to $149,999 | 38 | 19.2% |
| $150,000 to $199,999 | 16 | 8.1% |
| $200,000+ | 2 | 1.0% |
Household Income by Householder Age in Conesville
The median household income in Conesville is $68,750, with the highest median household income of $86,667 found in the 45 to 64 years age bracket for the primary householder. A total of 90 households (45.5%) fall into this category. Meanwhile, the 15 to 24 years age bracket for the primary householder has the lowest median household income of $0, with 8 households (4.0%) in this group.
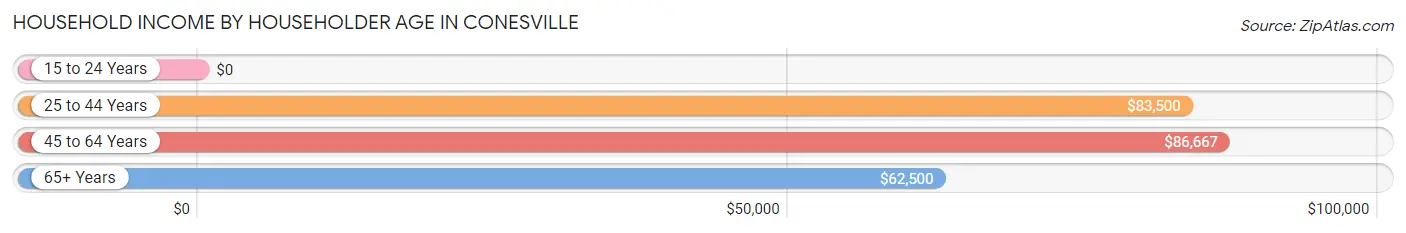
| Income Bracket | # Households | Median Income |
| 15 to 24 Years | 8 (4.0%) | $0 |
| 25 to 44 Years | 66 (33.3%) | $83,500 |
| 45 to 64 Years | 90 (45.5%) | $86,667 |
| 65+ Years | 34 (17.2%) | $62,500 |
| Total | 198 (100.0%) | $68,750 |
Poverty in Conesville
Income Below Poverty by Sex and Age in Conesville
With 13.6% poverty level for males and 14.0% for females among the residents of Conesville, 16 and 17 year old males and 12 to 14 year old females are the most vulnerable to poverty, with 2 males (100.0%) and 9 females (100.0%) in their respective age groups living below the poverty level.
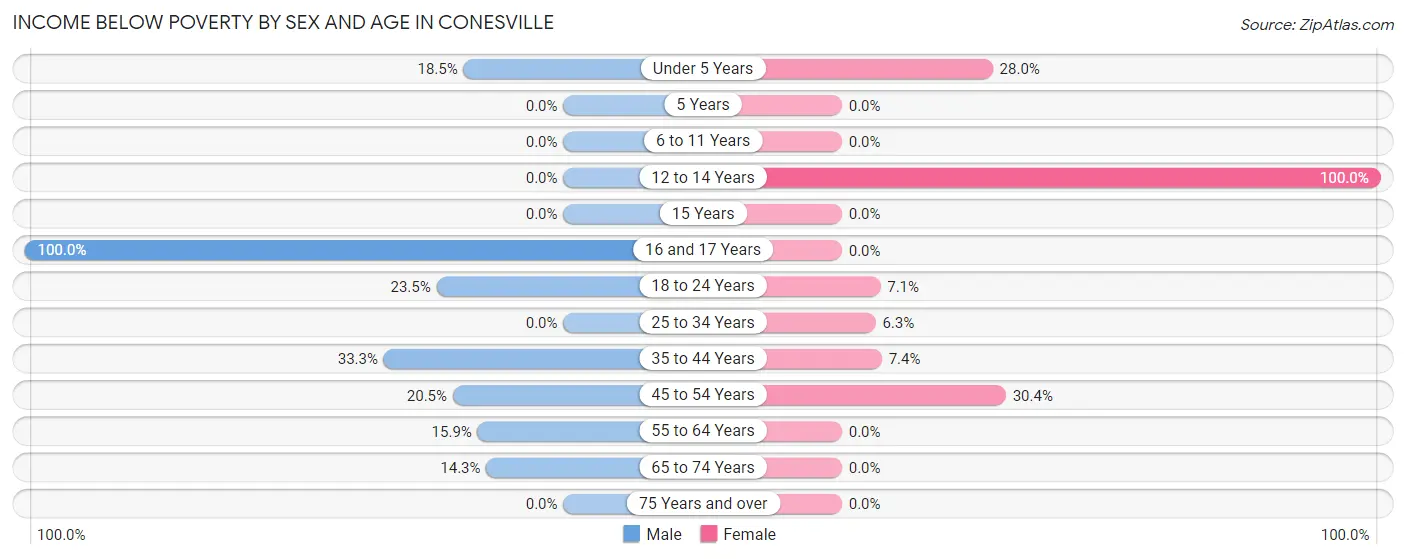
| Age Bracket | Male | Female |
| Under 5 Years | 5 (18.5%) | 7 (28.0%) |
| 5 Years | 0 (0.0%) | 0 (0.0%) |
| 6 to 11 Years | 0 (0.0%) | 0 (0.0%) |
| 12 to 14 Years | 0 (0.0%) | 9 (100.0%) |
| 15 Years | 0 (0.0%) | 0 (0.0%) |
| 16 and 17 Years | 2 (100.0%) | 0 (0.0%) |
| 18 to 24 Years | 4 (23.5%) | 1 (7.1%) |
| 25 to 34 Years | 0 (0.0%) | 2 (6.2%) |
| 35 to 44 Years | 9 (33.3%) | 2 (7.4%) |
| 45 to 54 Years | 8 (20.5%) | 7 (30.4%) |
| 55 to 64 Years | 7 (15.9%) | 0 (0.0%) |
| 65 to 74 Years | 1 (14.3%) | 0 (0.0%) |
| 75 Years and over | 0 (0.0%) | 0 (0.0%) |
| Total | 36 (13.6%) | 28 (14.0%) |
Income Above Poverty by Sex and Age in Conesville
According to the poverty statistics in Conesville, males aged 6 to 11 years and females aged 6 to 11 years are the age groups that are most secure financially, with 100.0% of males and 100.0% of females in these age groups living above the poverty line.
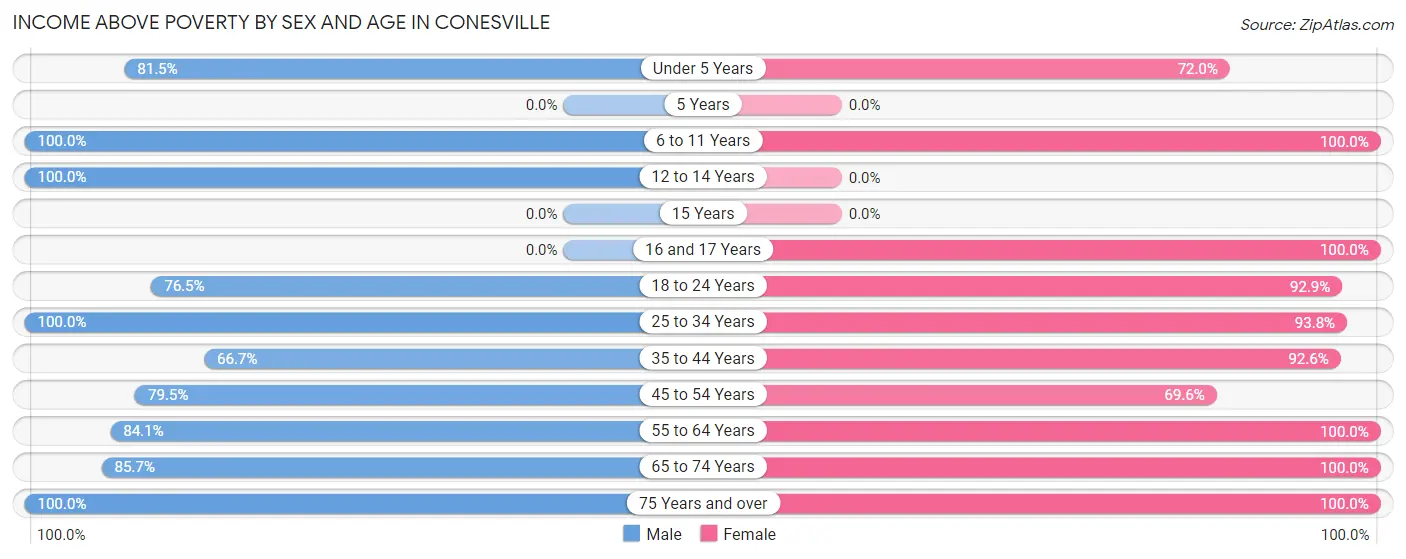
| Age Bracket | Male | Female |
| Under 5 Years | 22 (81.5%) | 18 (72.0%) |
| 5 Years | 0 (0.0%) | 0 (0.0%) |
| 6 to 11 Years | 28 (100.0%) | 15 (100.0%) |
| 12 to 14 Years | 3 (100.0%) | 0 (0.0%) |
| 15 Years | 0 (0.0%) | 0 (0.0%) |
| 16 and 17 Years | 0 (0.0%) | 2 (100.0%) |
| 18 to 24 Years | 13 (76.5%) | 13 (92.9%) |
| 25 to 34 Years | 58 (100.0%) | 30 (93.8%) |
| 35 to 44 Years | 18 (66.7%) | 25 (92.6%) |
| 45 to 54 Years | 31 (79.5%) | 16 (69.6%) |
| 55 to 64 Years | 37 (84.1%) | 24 (100.0%) |
| 65 to 74 Years | 6 (85.7%) | 12 (100.0%) |
| 75 Years and over | 12 (100.0%) | 17 (100.0%) |
| Total | 228 (86.4%) | 172 (86.0%) |
Income Below Poverty Among Married-Couple Families in Conesville
The poverty statistics for married-couple families in Conesville show that 15.1% or 11 of the total 73 families live below the poverty line. Families with 3 or 4 children have the highest poverty rate of 90.0%, comprising of 9 families. On the other hand, families with 1 or 2 children have the lowest poverty rate of 0.0%, which includes 0 families.
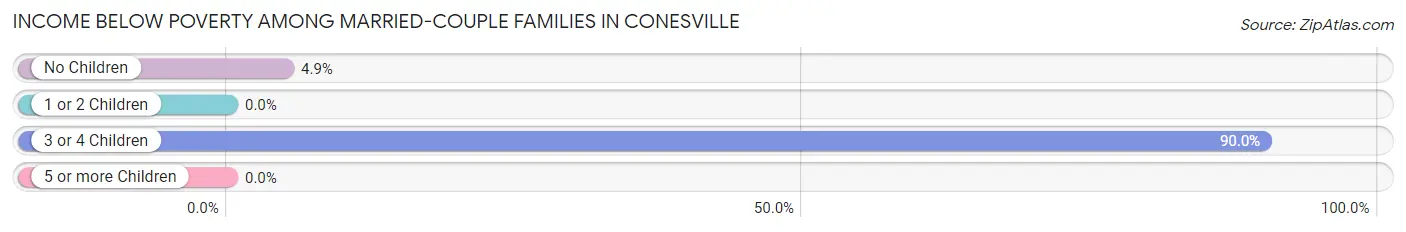
| Children | Above Poverty | Below Poverty |
| No Children | 39 (95.1%) | 2 (4.9%) |
| 1 or 2 Children | 13 (100.0%) | 0 (0.0%) |
| 3 or 4 Children | 1 (10.0%) | 9 (90.0%) |
| 5 or more Children | 9 (100.0%) | 0 (0.0%) |
| Total | 62 (84.9%) | 11 (15.1%) |
Income Below Poverty Among Single-Parent Households in Conesville
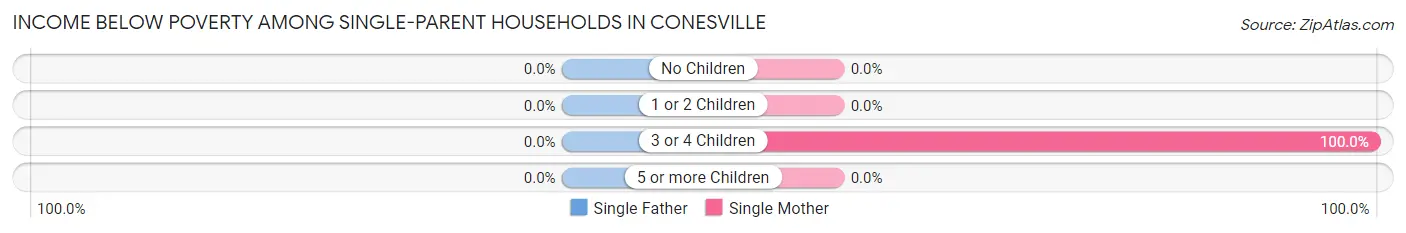
| Children | Single Father | Single Mother |
| No Children | 0 (0.0%) | 0 (0.0%) |
| 1 or 2 Children | 0 (0.0%) | 0 (0.0%) |
| 3 or 4 Children | 0 (0.0%) | 5 (100.0%) |
| 5 or more Children | 0 (0.0%) | 0 (0.0%) |
| Total | 0 (0.0%) | 5 (14.7%) |
Income Below Poverty Among Married-Couple vs Single-Parent Households in Conesville
The poverty data for Conesville shows that 11 of the married-couple family households (15.1%) and 5 of the single-parent households (8.2%) are living below the poverty level. Within the married-couple family households, those with 3 or 4 children have the highest poverty rate, with 9 households (90.0%) falling below the poverty line. Among the single-parent households, those with 3 or 4 children have the highest poverty rate, with 5 household (100.0%) living below poverty.
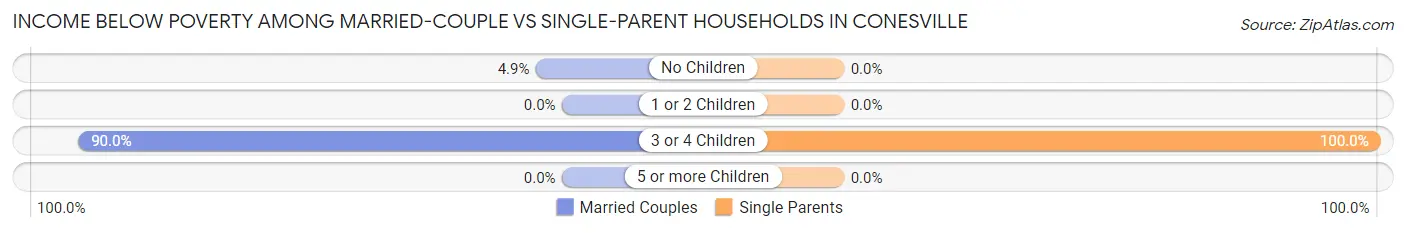
| Children | Married-Couple Families | Single-Parent Households |
| No Children | 2 (4.9%) | 0 (0.0%) |
| 1 or 2 Children | 0 (0.0%) | 0 (0.0%) |
| 3 or 4 Children | 9 (90.0%) | 5 (100.0%) |
| 5 or more Children | 0 (0.0%) | 0 (0.0%) |
| Total | 11 (15.1%) | 5 (8.2%) |
Race in Conesville
The most populous races in Conesville are Hispanic or Latino (272 | 58.2%), White / Caucasian (231 | 49.5%), and Some other Race (141 | 30.2%).
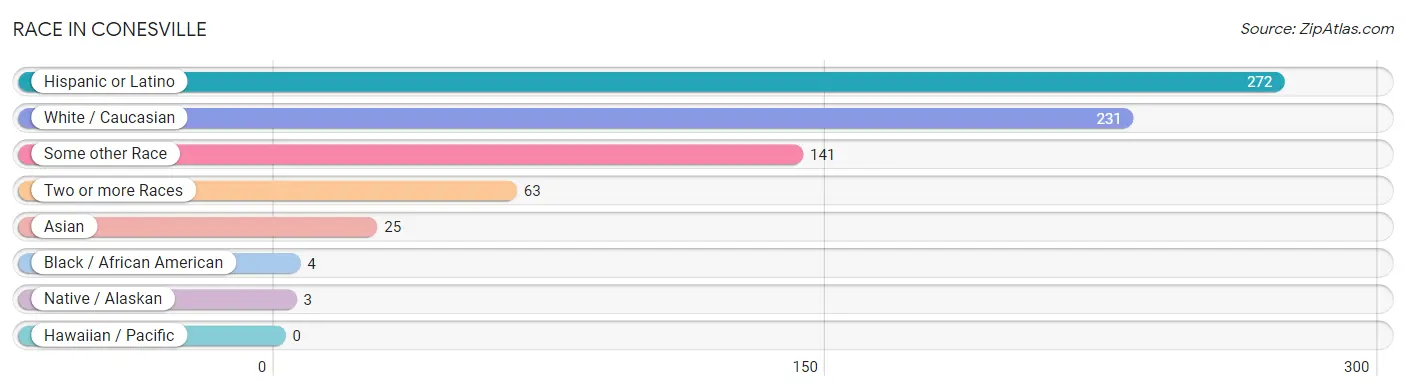
| Race | # Population | % Population |
| Asian | 25 | 5.3% |
| Black / African American | 4 | 0.9% |
| Hawaiian / Pacific | 0 | 0.0% |
| Hispanic or Latino | 272 | 58.2% |
| Native / Alaskan | 3 | 0.6% |
| White / Caucasian | 231 | 49.5% |
| Two or more Races | 63 | 13.5% |
| Some other Race | 141 | 30.2% |
| Total | 467 | 100.0% |
Ancestry in Conesville
The most populous ancestries reported in Conesville are Mexican (268 | 57.4%), German (47 | 10.1%), Norwegian (42 | 9.0%), English (29 | 6.2%), and Indonesian (25 | 5.3%), together accounting for 88.0% of all Conesville residents.
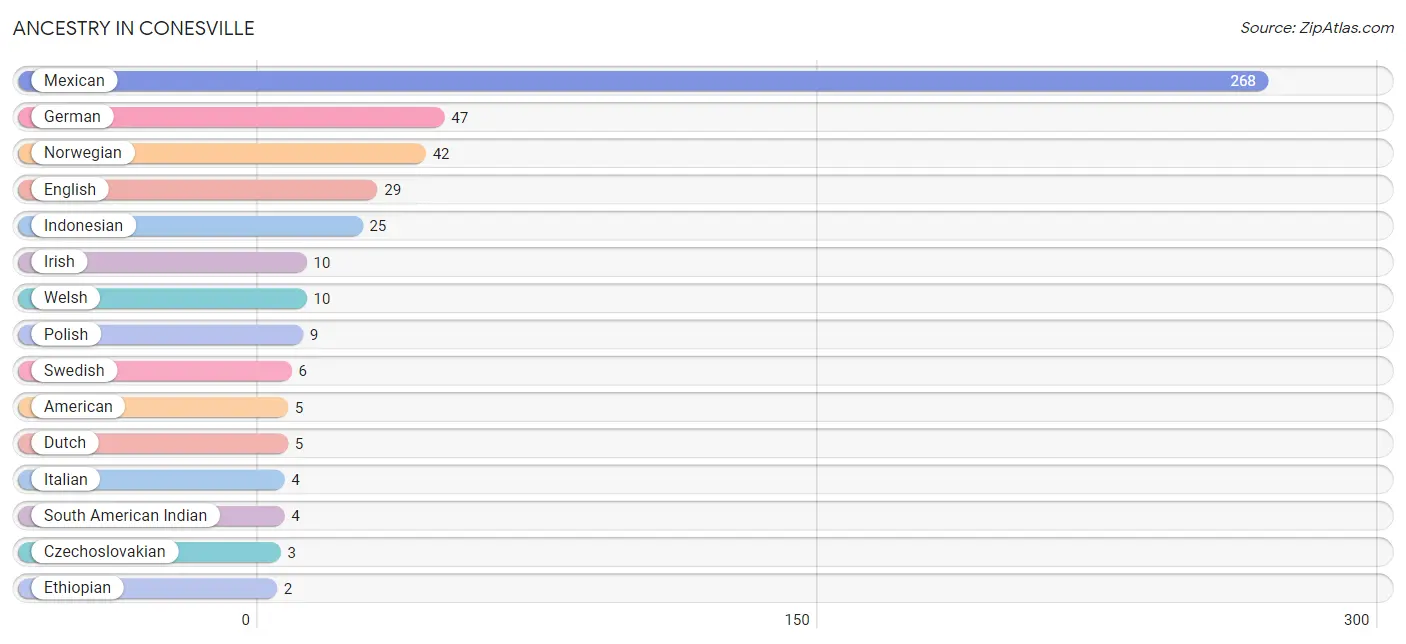
| Ancestry | # Population | % Population |
| American | 5 | 1.1% |
| Austrian | 1 | 0.2% |
| Czech | 1 | 0.2% |
| Czechoslovakian | 3 | 0.6% |
| Dutch | 5 | 1.1% |
| English | 29 | 6.2% |
| Ethiopian | 2 | 0.4% |
| German | 47 | 10.1% |
| Indonesian | 25 | 5.3% |
| Irish | 10 | 2.1% |
| Italian | 4 | 0.9% |
| Mexican | 268 | 57.4% |
| Norwegian | 42 | 9.0% |
| Pakistani | 2 | 0.4% |
| Pennsylvania German | 1 | 0.2% |
| Polish | 9 | 1.9% |
| Scandinavian | 2 | 0.4% |
| Scotch-Irish | 1 | 0.2% |
| Scottish | 2 | 0.4% |
| South American Indian | 4 | 0.9% |
| Subsaharan African | 2 | 0.4% |
| Swedish | 6 | 1.3% |
| Welsh | 10 | 2.1% | View All 23 Rows |
Immigrants in Conesville
The most numerous immigrant groups reported in Conesville came from Latin America (82 | 17.6%), Central America (78 | 16.7%), Mexico (78 | 16.7%), Asia (18 | 3.8%), and South Eastern Asia (18 | 3.8%), together accounting for 58.7% of all Conesville residents.
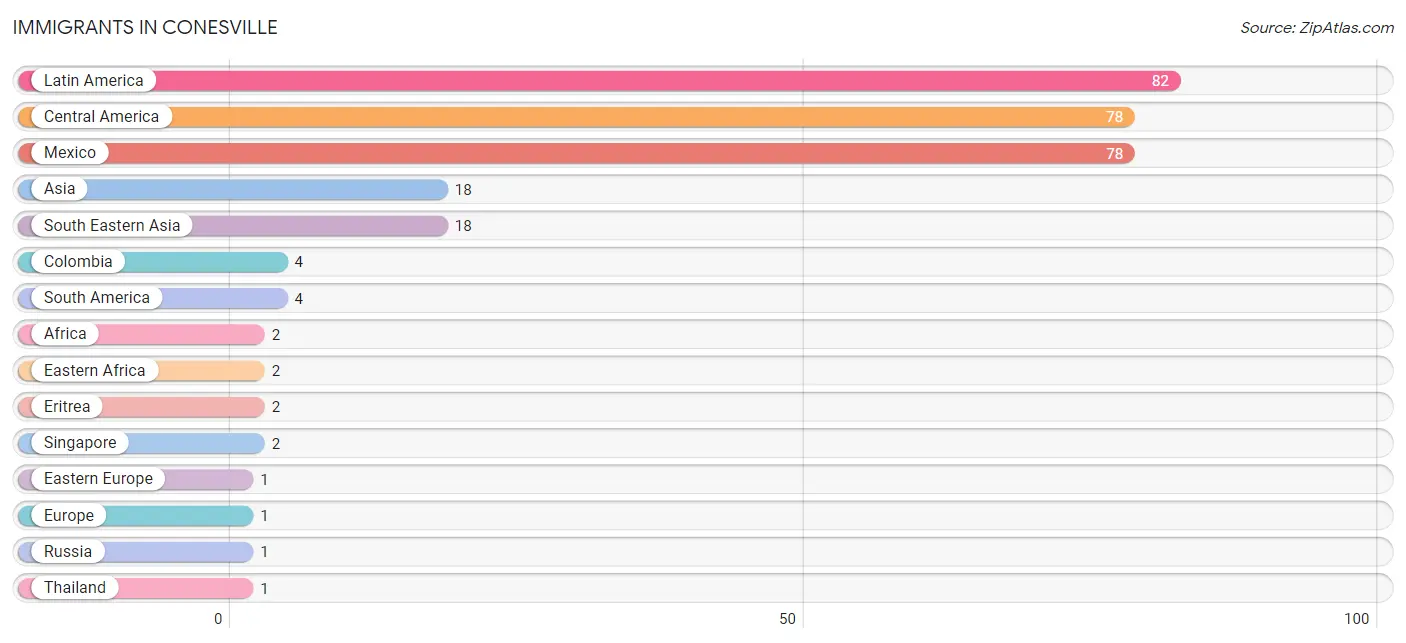
| Immigration Origin | # Population | % Population |
| Africa | 2 | 0.4% |
| Asia | 18 | 3.8% |
| Central America | 78 | 16.7% |
| Colombia | 4 | 0.9% |
| Eastern Africa | 2 | 0.4% |
| Eastern Europe | 1 | 0.2% |
| Eritrea | 2 | 0.4% |
| Europe | 1 | 0.2% |
| Latin America | 82 | 17.6% |
| Mexico | 78 | 16.7% |
| Russia | 1 | 0.2% |
| Singapore | 2 | 0.4% |
| South America | 4 | 0.9% |
| South Eastern Asia | 18 | 3.8% |
| Thailand | 1 | 0.2% | View All 15 Rows |
Sex and Age in Conesville
Sex and Age in Conesville
The most populous age groups in Conesville are 25 to 29 Years (38 | 14.4%) for men and Under 5 Years (28 | 13.8%) for women.
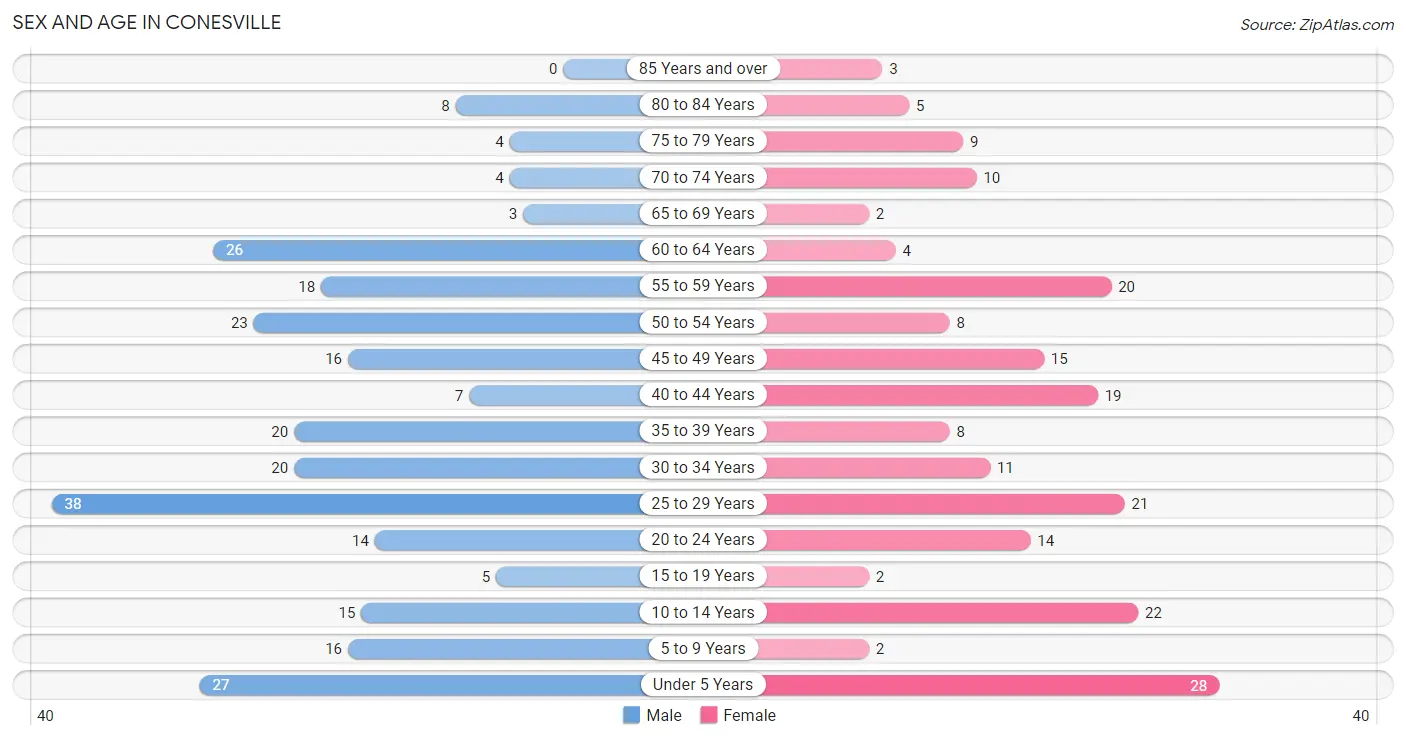
| Age Bracket | Male | Female |
| Under 5 Years | 27 (10.2%) | 28 (13.8%) |
| 5 to 9 Years | 16 (6.1%) | 2 (1.0%) |
| 10 to 14 Years | 15 (5.7%) | 22 (10.8%) |
| 15 to 19 Years | 5 (1.9%) | 2 (1.0%) |
| 20 to 24 Years | 14 (5.3%) | 14 (6.9%) |
| 25 to 29 Years | 38 (14.4%) | 21 (10.3%) |
| 30 to 34 Years | 20 (7.6%) | 11 (5.4%) |
| 35 to 39 Years | 20 (7.6%) | 8 (3.9%) |
| 40 to 44 Years | 7 (2.6%) | 19 (9.4%) |
| 45 to 49 Years | 16 (6.1%) | 15 (7.4%) |
| 50 to 54 Years | 23 (8.7%) | 8 (3.9%) |
| 55 to 59 Years | 18 (6.8%) | 20 (9.9%) |
| 60 to 64 Years | 26 (9.9%) | 4 (2.0%) |
| 65 to 69 Years | 3 (1.1%) | 2 (1.0%) |
| 70 to 74 Years | 4 (1.5%) | 10 (4.9%) |
| 75 to 79 Years | 4 (1.5%) | 9 (4.4%) |
| 80 to 84 Years | 8 (3.0%) | 5 (2.5%) |
| 85 Years and over | 0 (0.0%) | 3 (1.5%) |
| Total | 264 (100.0%) | 203 (100.0%) |
Families and Households in Conesville
Median Family Size in Conesville
The median family size in Conesville is 2.66 persons per family, with single female/mother families (34 | 25.4%) accounting for the largest median family size of 3.24 persons per family. On the other hand, single male/father families (27 | 20.2%) represent the smallest median family size with 1.30 persons per family.
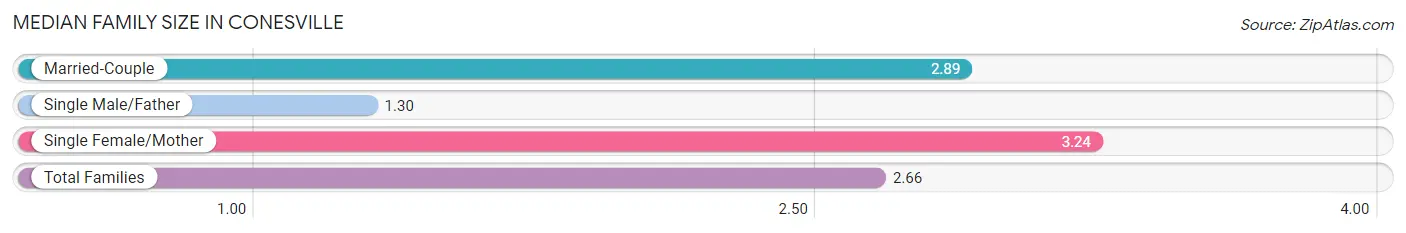
| Family Type | # Families | Family Size |
| Married-Couple | 73 (54.5%) | 2.89 |
| Single Male/Father | 27 (20.2%) | 1.30 |
| Single Female/Mother | 34 (25.4%) | 3.24 |
| Total Families | 134 (100.0%) | 2.66 |
Median Household Size in Conesville
The median household size in Conesville is 2.31 persons per household, with single female/mother households (34 | 17.2%) accounting for the largest median household size of 3.32 persons per household. single male/father households (27 | 13.6%) represent the smallest median household size with 1.30 persons per household.
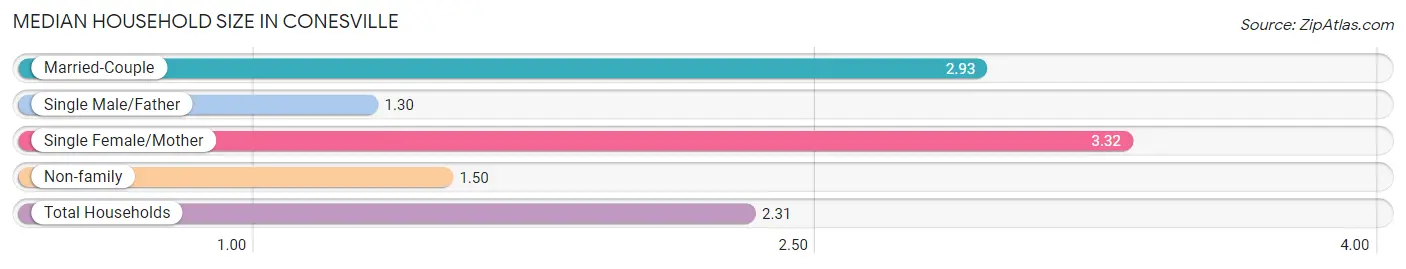
| Household Type | # Households | Household Size |
| Married-Couple | 73 (36.9%) | 2.93 |
| Single Male/Father | 27 (13.6%) | 1.30 |
| Single Female/Mother | 34 (17.2%) | 3.32 |
| Non-family | 64 (32.3%) | 1.50 |
| Total Households | 198 (100.0%) | 2.31 |
Household Size by Marriage Status in Conesville
Out of a total of 198 households in Conesville, 134 (67.7%) are family households, while 64 (32.3%) are nonfamily households. The most numerous type of family households are 2-person households, comprising 62, and the most common type of nonfamily households are 2-person households, comprising 37.
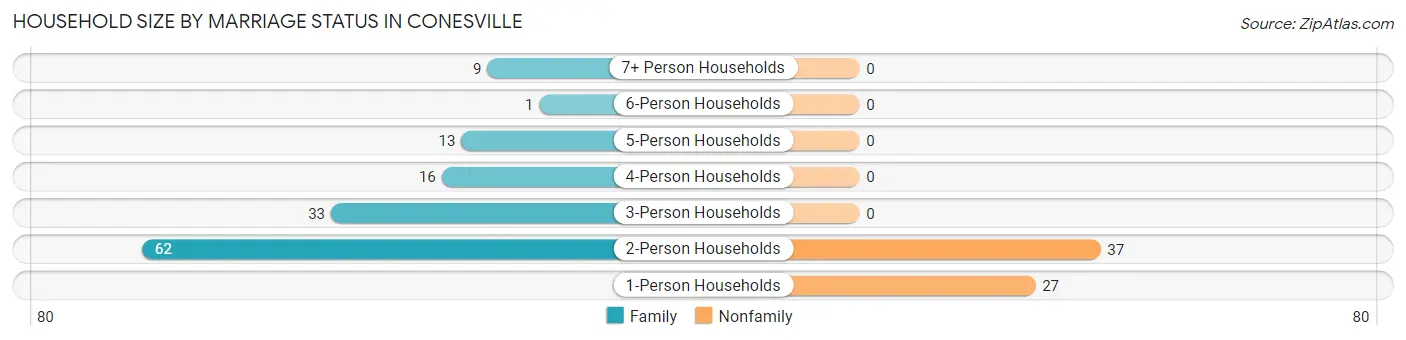
| Household Size | Family Households | Nonfamily Households |
| 1-Person Households | - | 27 (13.6%) |
| 2-Person Households | 62 (31.3%) | 37 (18.7%) |
| 3-Person Households | 33 (16.7%) | 0 (0.0%) |
| 4-Person Households | 16 (8.1%) | 0 (0.0%) |
| 5-Person Households | 13 (6.6%) | 0 (0.0%) |
| 6-Person Households | 1 (0.5%) | 0 (0.0%) |
| 7+ Person Households | 9 (4.5%) | 0 (0.0%) |
| Total | 134 (67.7%) | 64 (32.3%) |
Female Fertility in Conesville
Fertility by Age in Conesville
Average fertility rate in Conesville is 189.0 births per 1,000 women. Women in the age bracket of 20 to 34 years have the highest fertility rate with 370.0 births per 1,000 women. Women in the age bracket of 20 to 34 years acount for 100.0% of all women with births.
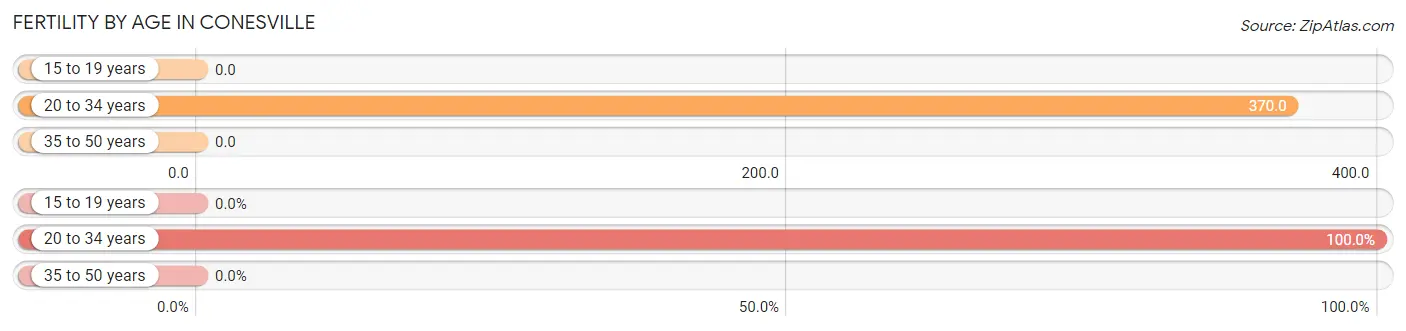
| Age Bracket | Women with Births | Births / 1,000 Women |
| 15 to 19 years | 0 (0.0%) | 0.0 |
| 20 to 34 years | 17 (100.0%) | 370.0 |
| 35 to 50 years | 0 (0.0%) | 0.0 |
| Total | 17 (100.0%) | 189.0 |
Fertility by Age by Marriage Status in Conesville
41.2% of women with births (17) in Conesville are married. The highest percentage of unmarried women with births falls into 20 to 34 years age bracket with 58.8% of them unmarried at the time of birth, while the lowest percentage of unmarried women with births belong to 20 to 34 years age bracket with 58.8% of them unmarried.
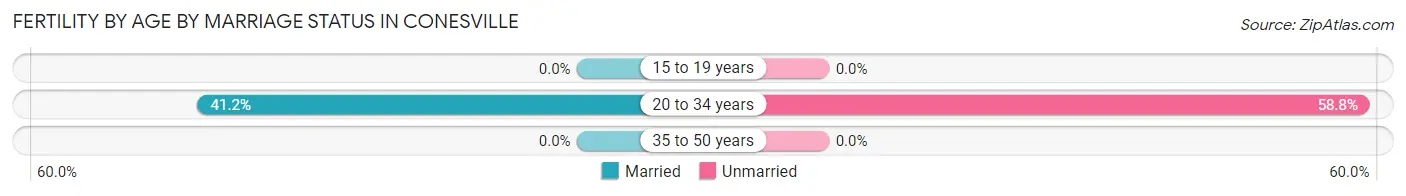
| Age Bracket | Married | Unmarried |
| 15 to 19 years | 0 (0.0%) | 0 (0.0%) |
| 20 to 34 years | 7 (41.2%) | 10 (58.8%) |
| 35 to 50 years | 0 (0.0%) | 0 (0.0%) |
| Total | 7 (41.2%) | 10 (58.8%) |
Fertility by Education in Conesville
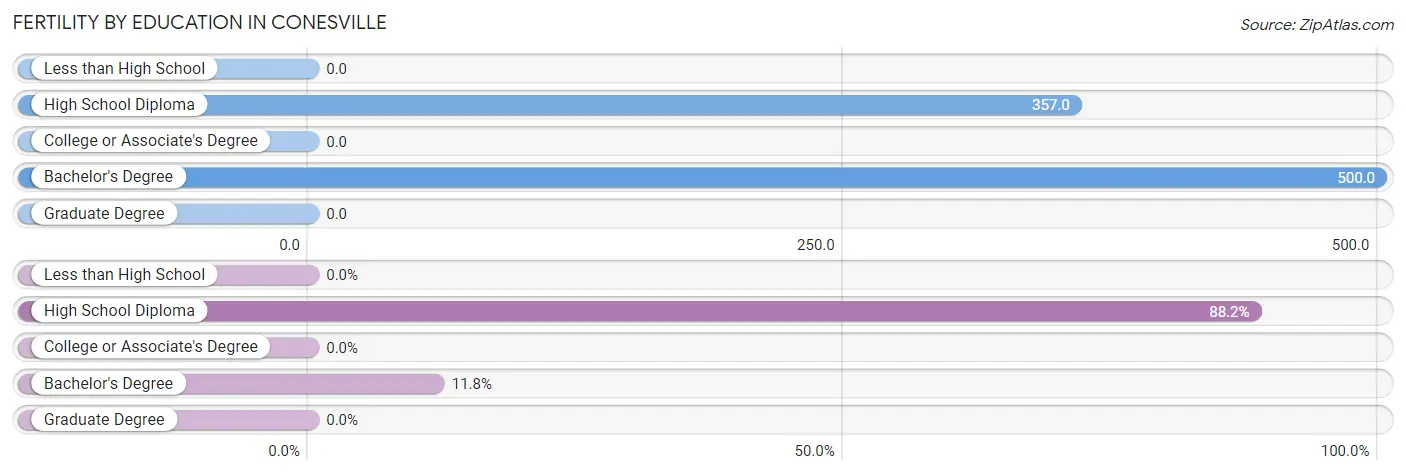
| Educational Attainment | Women with Births | Births / 1,000 Women |
| Less than High School | 0 (0.0%) | 0.0 |
| High School Diploma | 15 (88.2%) | 357.0 |
| College or Associate's Degree | 0 (0.0%) | 0.0 |
| Bachelor's Degree | 2 (11.8%) | 500.0 |
| Graduate Degree | 0 (0.0%) | 0.0 |
| Total | 17 (100.0%) | 189.0 |
Fertility by Education by Marriage Status in Conesville
58.8% of women with births in Conesville are unmarried. Women with the educational attainment of bachelor's degree are most likely to be married with 100.0% of them married at childbirth, while women with the educational attainment of high school diploma are least likely to be married with 66.7% of them unmarried at childbirth.
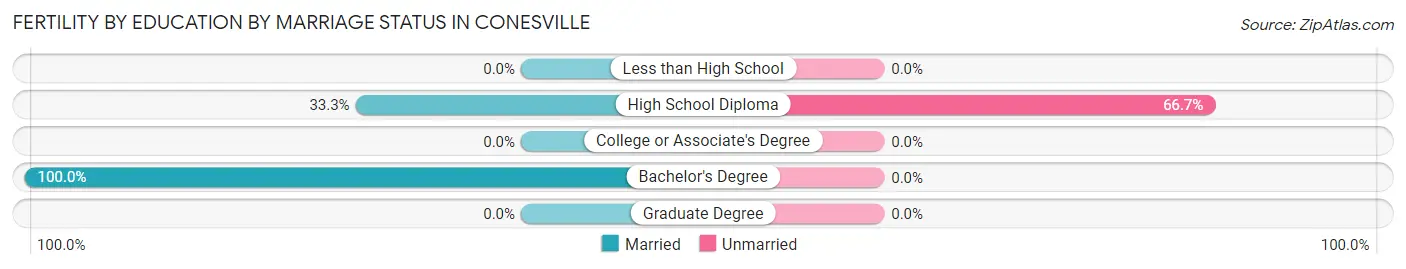
| Educational Attainment | Married | Unmarried |
| Less than High School | 0 (0.0%) | 0 (0.0%) |
| High School Diploma | 5 (33.3%) | 10 (66.7%) |
| College or Associate's Degree | 0 (0.0%) | 0 (0.0%) |
| Bachelor's Degree | 2 (100.0%) | 0 (0.0%) |
| Graduate Degree | 0 (0.0%) | 0 (0.0%) |
| Total | 7 (41.2%) | 10 (58.8%) |
Employment Characteristics in Conesville
Employment by Class of Employer in Conesville
Among the 255 employed individuals in Conesville, private company employees (218 | 85.5%), state government employees (16 | 6.3%), and not-for-profit organizations (14 | 5.5%) make up the most common classes of employment.
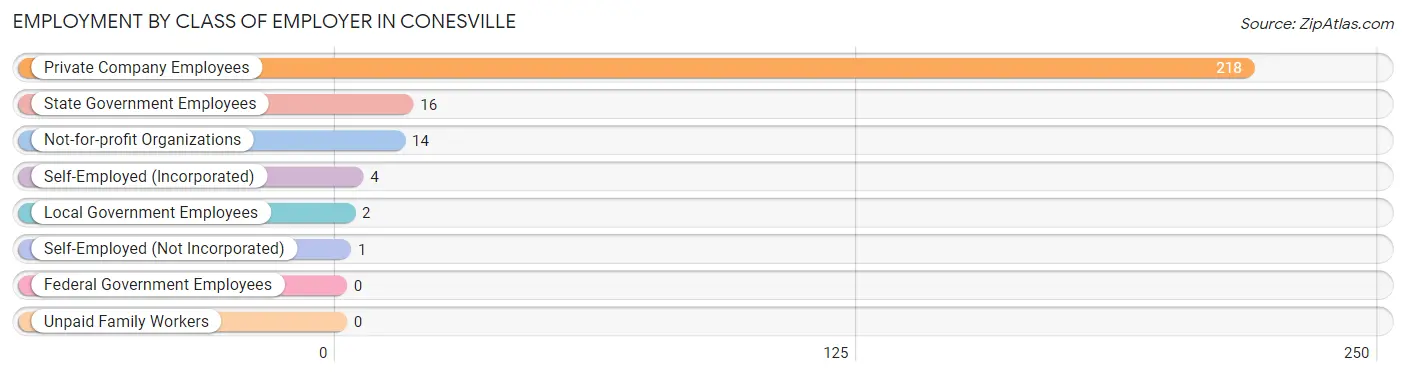
| Employer Class | # Employees | % Employees |
| Private Company Employees | 218 | 85.5% |
| Self-Employed (Incorporated) | 4 | 1.6% |
| Self-Employed (Not Incorporated) | 1 | 0.4% |
| Not-for-profit Organizations | 14 | 5.5% |
| Local Government Employees | 2 | 0.8% |
| State Government Employees | 16 | 6.3% |
| Federal Government Employees | 0 | 0.0% |
| Unpaid Family Workers | 0 | 0.0% |
| Total | 255 | 100.0% |
Employment Status by Age in Conesville
According to the labor force statistics for Conesville, out of the total population over 16 years of age (357), 76.2% or 272 individuals are in the labor force, with 6.3% or 17 of them unemployed. The age group with the highest labor force participation rate is 25 to 29 years, with 96.6% or 57 individuals in the labor force. Within the labor force, the 16 to 19 years age range has the highest percentage of unemployed individuals, with 60.0% or 3 of them being unemployed.
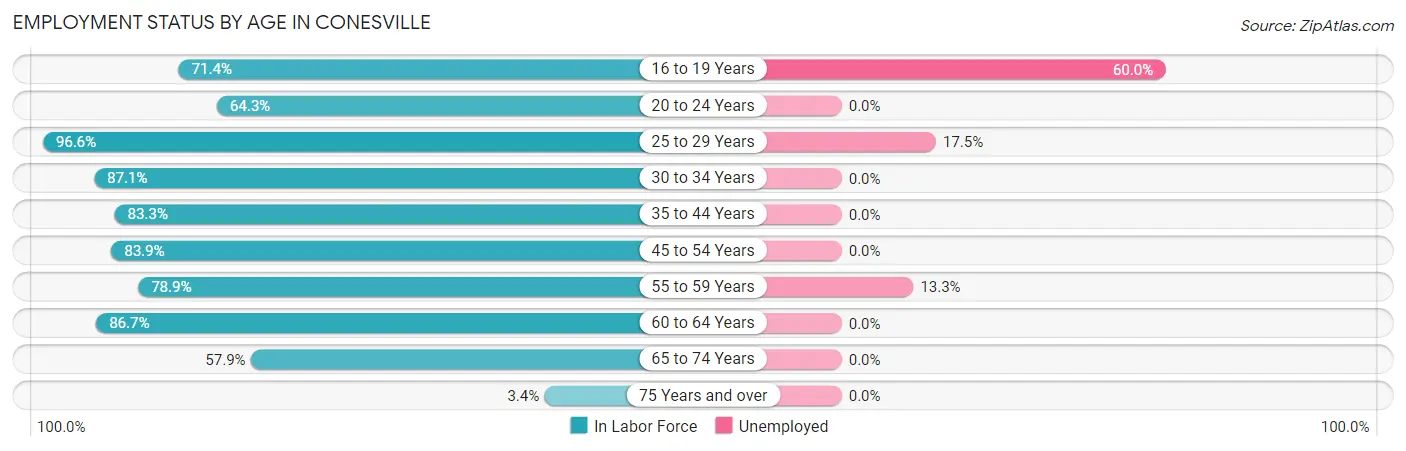
| Age Bracket | In Labor Force | Unemployed |
| 16 to 19 Years | 5 (71.4%) | 3 (60.0%) |
| 20 to 24 Years | 18 (64.3%) | 0 (0.0%) |
| 25 to 29 Years | 57 (96.6%) | 10 (17.5%) |
| 30 to 34 Years | 27 (87.1%) | 0 (0.0%) |
| 35 to 44 Years | 45 (83.3%) | 0 (0.0%) |
| 45 to 54 Years | 52 (83.9%) | 0 (0.0%) |
| 55 to 59 Years | 30 (78.9%) | 4 (13.3%) |
| 60 to 64 Years | 26 (86.7%) | 0 (0.0%) |
| 65 to 74 Years | 11 (57.9%) | 0 (0.0%) |
| 75 Years and over | 1 (3.4%) | 0 (0.0%) |
| Total | 272 (76.2%) | 17 (6.3%) |
Employment Status by Educational Attainment in Conesville
According to labor force statistics for Conesville, 86.5% of individuals (237) out of the total population between 25 and 64 years of age (274) are in the labor force, with 5.9% or 14 of them being unemployed. The group with the highest labor force participation rate are those with the educational attainment of college / associate degree, with 91.7% or 88 individuals in the labor force. Within the labor force, individuals with high school diploma education have the highest percentage of unemployment, with 9.1% or 10 of them being unemployed.
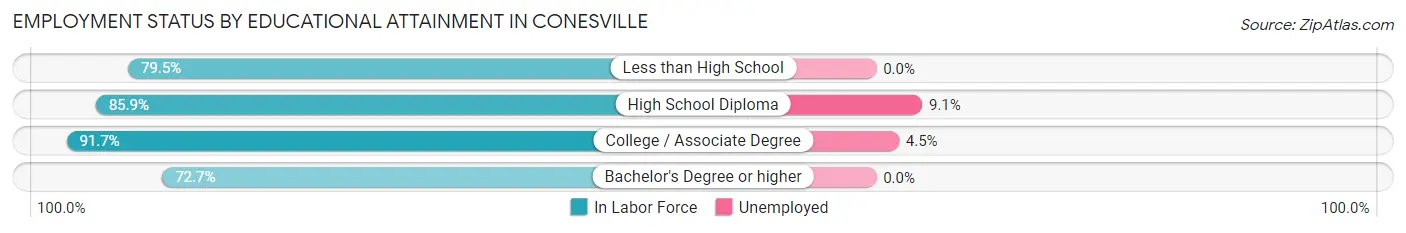
| Educational Attainment | In Labor Force | Unemployed |
| Less than High School | 31 (79.5%) | 0 (0.0%) |
| High School Diploma | 110 (85.9%) | 12 (9.1%) |
| College / Associate Degree | 88 (91.7%) | 4 (4.5%) |
| Bachelor's Degree or higher | 8 (72.7%) | 0 (0.0%) |
| Total | 237 (86.5%) | 16 (5.9%) |
Employment Occupations by Sex in Conesville
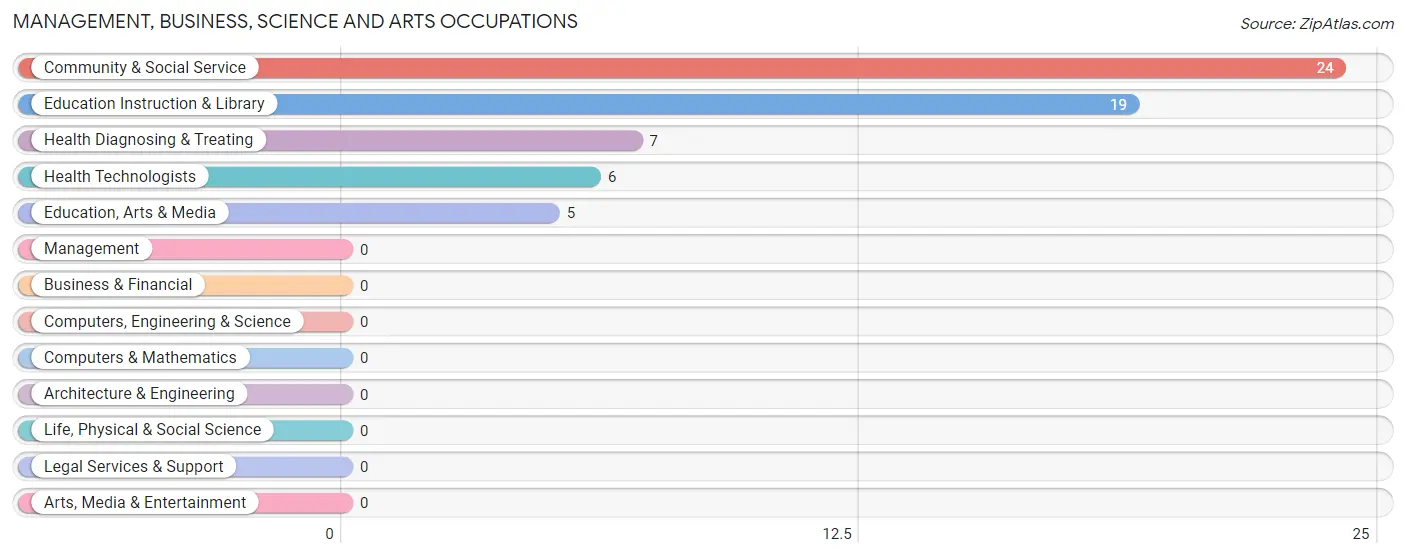
Management, Business, Science and Arts Occupations
The most common Management, Business, Science and Arts occupations in Conesville are Community & Social Service (24 | 9.4%), Education Instruction & Library (19 | 7.4%), Health Diagnosing & Treating (7 | 2.8%), Health Technologists (6 | 2.4%), and Education, Arts & Media (5 | 2.0%).
Management, Business, Science and Arts Occupations by Sex
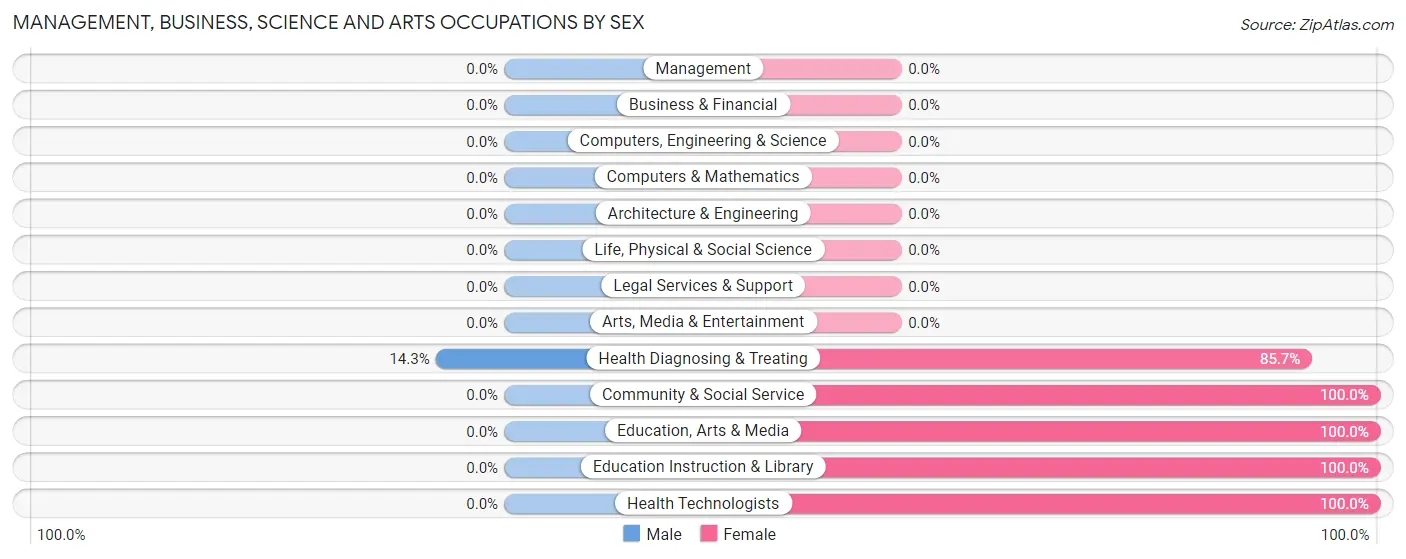
| Occupation | Male | Female |
| Management | 0 (0.0%) | 0 (0.0%) |
| Business & Financial | 0 (0.0%) | 0 (0.0%) |
| Computers, Engineering & Science | 0 (0.0%) | 0 (0.0%) |
| Computers & Mathematics | 0 (0.0%) | 0 (0.0%) |
| Architecture & Engineering | 0 (0.0%) | 0 (0.0%) |
| Life, Physical & Social Science | 0 (0.0%) | 0 (0.0%) |
| Community & Social Service | 0 (0.0%) | 24 (100.0%) |
| Education, Arts & Media | 0 (0.0%) | 5 (100.0%) |
| Legal Services & Support | 0 (0.0%) | 0 (0.0%) |
| Education Instruction & Library | 0 (0.0%) | 19 (100.0%) |
| Arts, Media & Entertainment | 0 (0.0%) | 0 (0.0%) |
| Health Diagnosing & Treating | 1 (14.3%) | 6 (85.7%) |
| Health Technologists | 0 (0.0%) | 6 (100.0%) |
| Total (Category) | 1 (3.2%) | 30 (96.8%) |
| Total (Overall) | 154 (60.4%) | 101 (39.6%) |
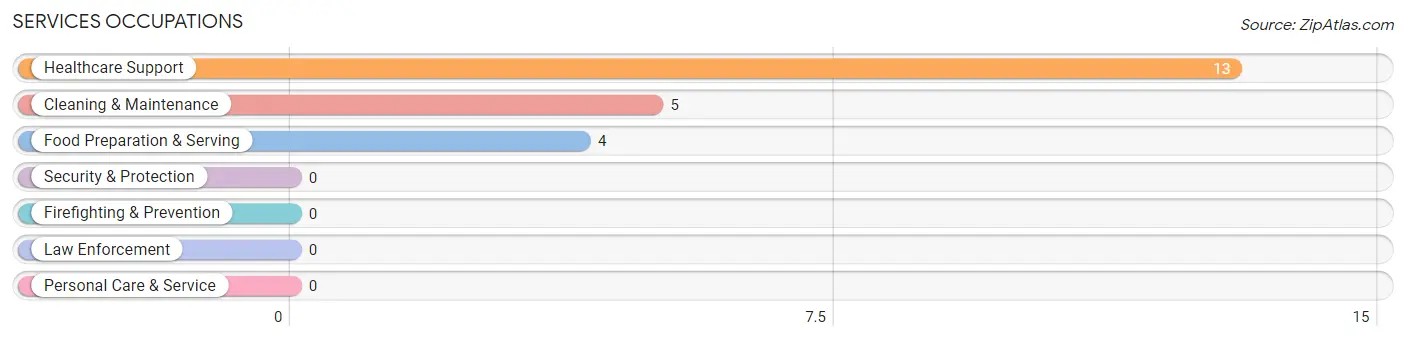
Services Occupations
The most common Services occupations in Conesville are Healthcare Support (13 | 5.1%), Cleaning & Maintenance (5 | 2.0%), and Food Preparation & Serving (4 | 1.6%).
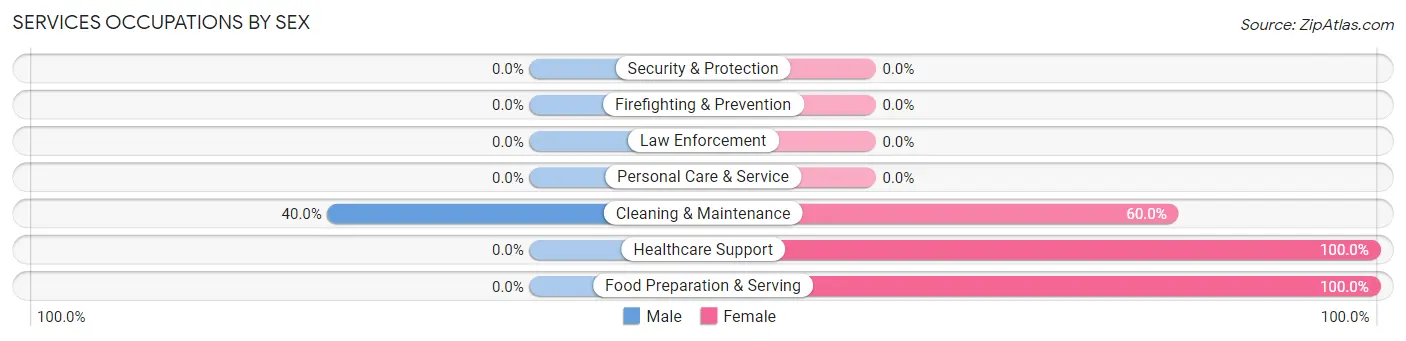
Services Occupations by Sex
| Occupation | Male | Female |
| Healthcare Support | 0 (0.0%) | 13 (100.0%) |
| Security & Protection | 0 (0.0%) | 0 (0.0%) |
| Firefighting & Prevention | 0 (0.0%) | 0 (0.0%) |
| Law Enforcement | 0 (0.0%) | 0 (0.0%) |
| Food Preparation & Serving | 0 (0.0%) | 4 (100.0%) |
| Cleaning & Maintenance | 2 (40.0%) | 3 (60.0%) |
| Personal Care & Service | 0 (0.0%) | 0 (0.0%) |
| Total (Category) | 2 (9.1%) | 20 (90.9%) |
| Total (Overall) | 154 (60.4%) | 101 (39.6%) |
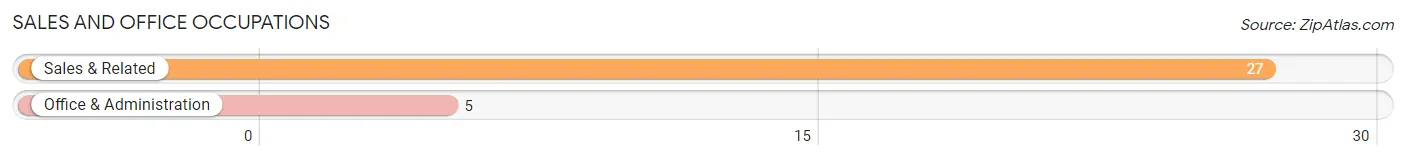
Sales and Office Occupations
The most common Sales and Office occupations in Conesville are Sales & Related (27 | 10.6%), and Office & Administration (5 | 2.0%).
Sales and Office Occupations by Sex
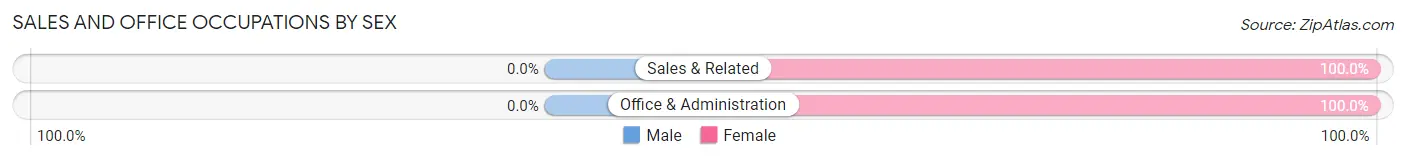
| Occupation | Male | Female |
| Sales & Related | 0 (0.0%) | 27 (100.0%) |
| Office & Administration | 0 (0.0%) | 5 (100.0%) |
| Total (Category) | 0 (0.0%) | 32 (100.0%) |
| Total (Overall) | 154 (60.4%) | 101 (39.6%) |
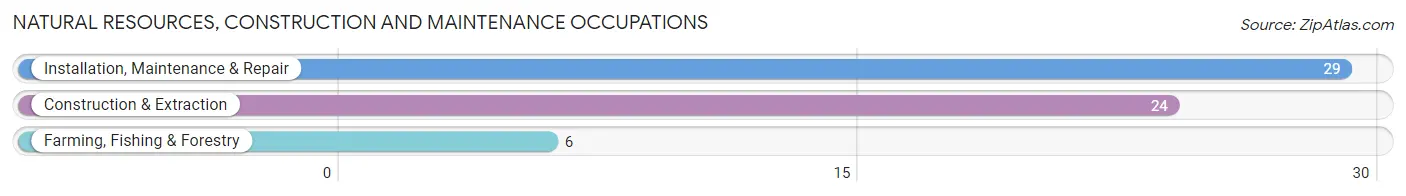
Natural Resources, Construction and Maintenance Occupations
The most common Natural Resources, Construction and Maintenance occupations in Conesville are Installation, Maintenance & Repair (29 | 11.4%), Construction & Extraction (24 | 9.4%), and Farming, Fishing & Forestry (6 | 2.4%).
Natural Resources, Construction and Maintenance Occupations by Sex
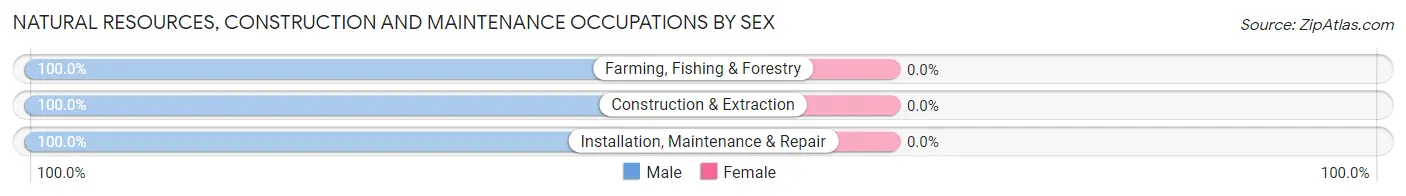
| Occupation | Male | Female |
| Farming, Fishing & Forestry | 6 (100.0%) | 0 (0.0%) |
| Construction & Extraction | 24 (100.0%) | 0 (0.0%) |
| Installation, Maintenance & Repair | 29 (100.0%) | 0 (0.0%) |
| Total (Category) | 59 (100.0%) | 0 (0.0%) |
| Total (Overall) | 154 (60.4%) | 101 (39.6%) |
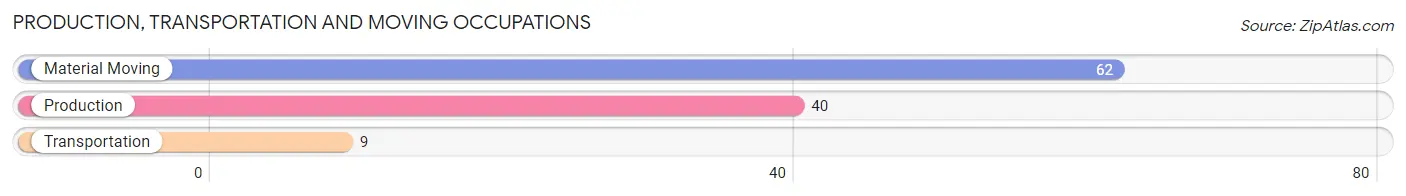
Production, Transportation and Moving Occupations
The most common Production, Transportation and Moving occupations in Conesville are Material Moving (62 | 24.3%), Production (40 | 15.7%), and Transportation (9 | 3.5%).
Production, Transportation and Moving Occupations by Sex
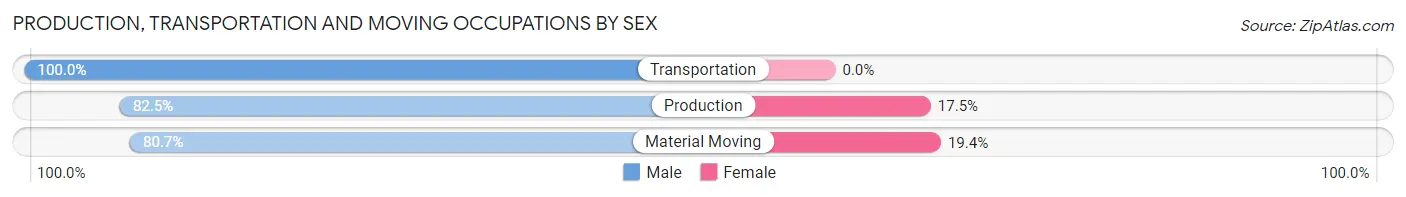
| Occupation | Male | Female |
| Production | 33 (82.5%) | 7 (17.5%) |
| Transportation | 9 (100.0%) | 0 (0.0%) |
| Material Moving | 50 (80.6%) | 12 (19.4%) |
| Total (Category) | 92 (82.9%) | 19 (17.1%) |
| Total (Overall) | 154 (60.4%) | 101 (39.6%) |
Employment Industries by Sex in Conesville
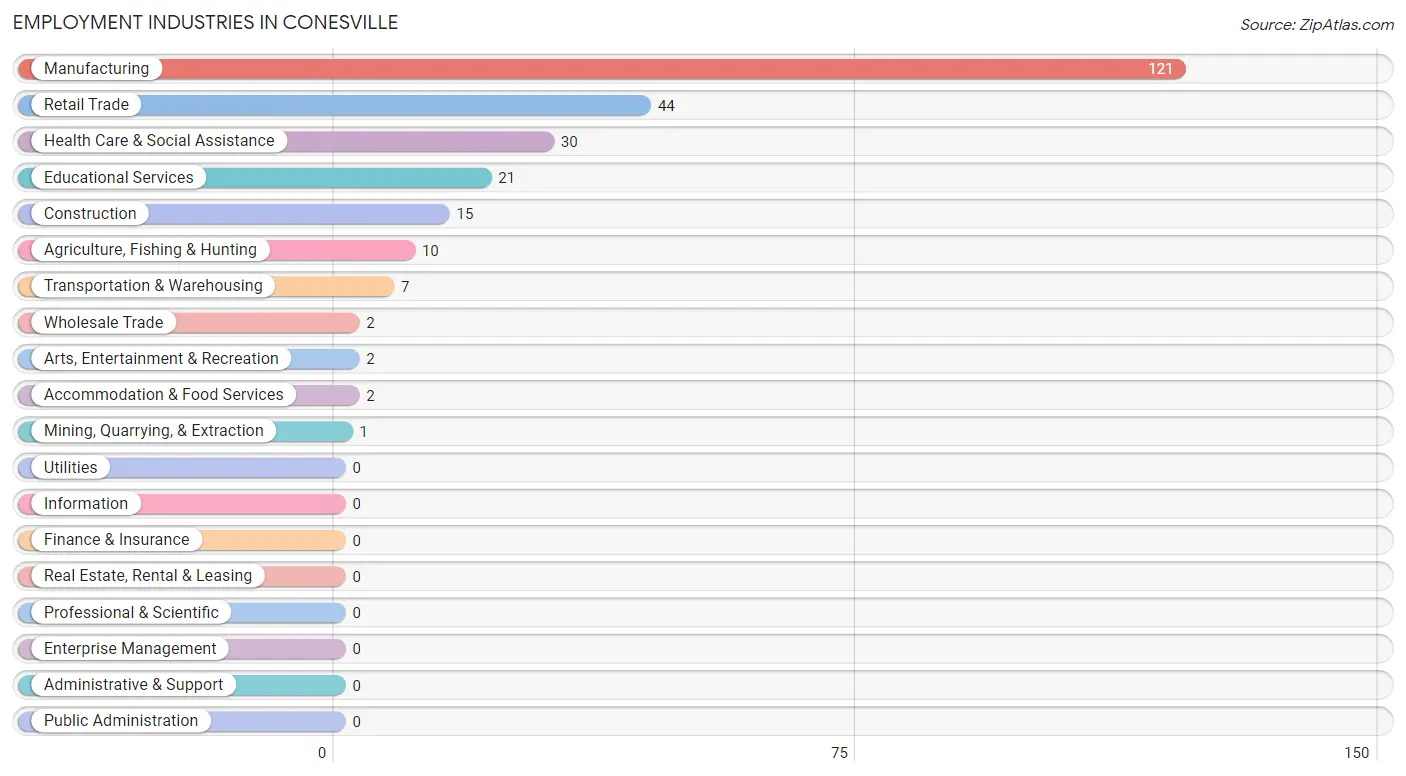
Employment Industries in Conesville
The major employment industries in Conesville include Manufacturing (121 | 47.4%), Retail Trade (44 | 17.2%), Health Care & Social Assistance (30 | 11.8%), Educational Services (21 | 8.2%), and Construction (15 | 5.9%).
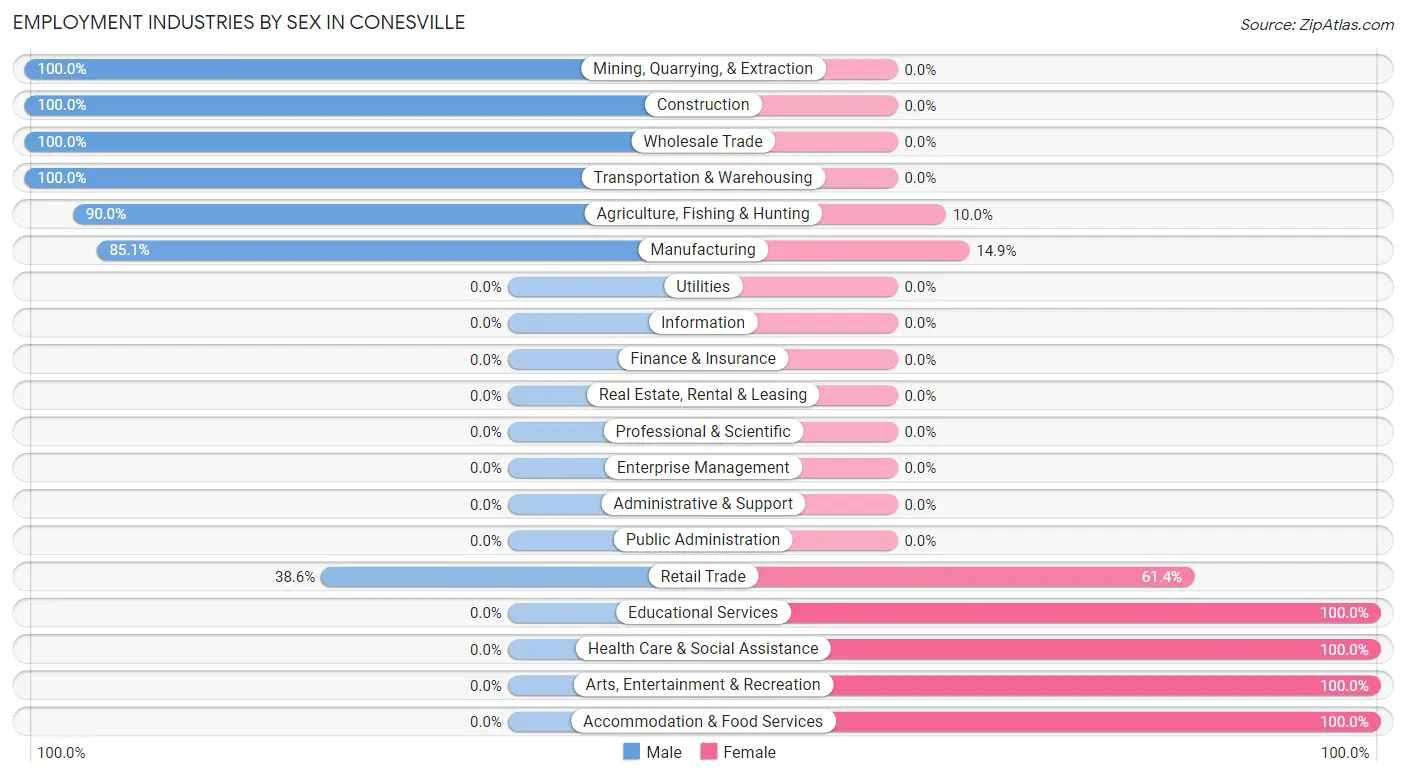
Employment Industries by Sex in Conesville
The Conesville industries that see more men than women are Mining, Quarrying, & Extraction (100.0%), Construction (100.0%), and Wholesale Trade (100.0%), whereas the industries that tend to have a higher number of women are Educational Services (100.0%), Health Care & Social Assistance (100.0%), and Arts, Entertainment & Recreation (100.0%).
| Industry | Male | Female |
| Agriculture, Fishing & Hunting | 9 (90.0%) | 1 (10.0%) |
| Mining, Quarrying, & Extraction | 1 (100.0%) | 0 (0.0%) |
| Construction | 15 (100.0%) | 0 (0.0%) |
| Manufacturing | 103 (85.1%) | 18 (14.9%) |
| Wholesale Trade | 2 (100.0%) | 0 (0.0%) |
| Retail Trade | 17 (38.6%) | 27 (61.4%) |
| Transportation & Warehousing | 7 (100.0%) | 0 (0.0%) |
| Utilities | 0 (0.0%) | 0 (0.0%) |
| Information | 0 (0.0%) | 0 (0.0%) |
| Finance & Insurance | 0 (0.0%) | 0 (0.0%) |
| Real Estate, Rental & Leasing | 0 (0.0%) | 0 (0.0%) |
| Professional & Scientific | 0 (0.0%) | 0 (0.0%) |
| Enterprise Management | 0 (0.0%) | 0 (0.0%) |
| Administrative & Support | 0 (0.0%) | 0 (0.0%) |
| Educational Services | 0 (0.0%) | 21 (100.0%) |
| Health Care & Social Assistance | 0 (0.0%) | 30 (100.0%) |
| Arts, Entertainment & Recreation | 0 (0.0%) | 2 (100.0%) |
| Accommodation & Food Services | 0 (0.0%) | 2 (100.0%) |
| Public Administration | 0 (0.0%) | 0 (0.0%) |
| Total | 154 (60.4%) | 101 (39.6%) |
Education in Conesville
School Enrollment in Conesville
The most common levels of schooling among the 74 students in Conesville are elementary school (30 | 40.5%), middle school (19 | 25.7%), and high school (8 | 10.8%).
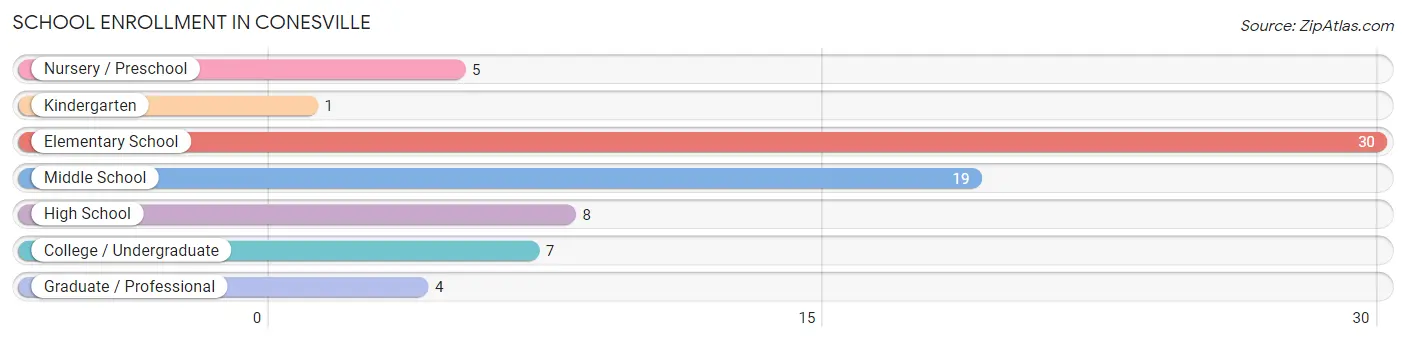
| School Level | # Students | % Students |
| Nursery / Preschool | 5 | 6.8% |
| Kindergarten | 1 | 1.3% |
| Elementary School | 30 | 40.5% |
| Middle School | 19 | 25.7% |
| High School | 8 | 10.8% |
| College / Undergraduate | 7 | 9.5% |
| Graduate / Professional | 4 | 5.4% |
| Total | 74 | 100.0% |
School Enrollment by Age by Funding Source in Conesville
Out of a total of 74 students who are enrolled in schools in Conesville, 8 (10.8%) attend a private institution, while the remaining 66 (89.2%) are enrolled in public schools. The age group of 20 to 24 year olds has the highest likelihood of being enrolled in private schools, with 5 (50.0% in the age bracket) enrolled. Conversely, the age group of 3 to 4 year olds has the lowest likelihood of being enrolled in a private school, with 5 (100.0% in the age bracket) attending a public institution.
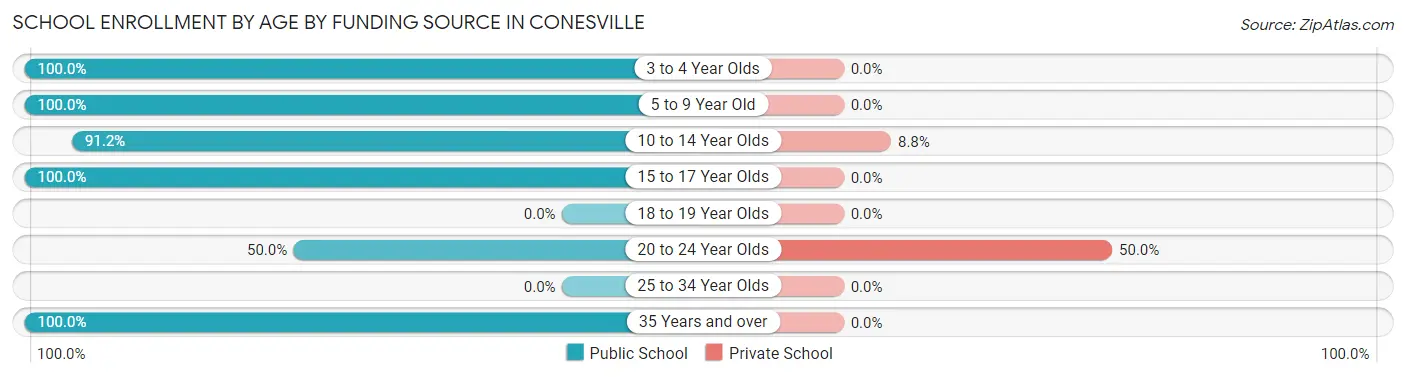
| Age Bracket | Public School | Private School |
| 3 to 4 Year Olds | 5 (100.0%) | 0 (0.0%) |
| 5 to 9 Year Old | 18 (100.0%) | 0 (0.0%) |
| 10 to 14 Year Olds | 31 (91.2%) | 3 (8.8%) |
| 15 to 17 Year Olds | 4 (100.0%) | 0 (0.0%) |
| 18 to 19 Year Olds | 0 (0.0%) | 0 (0.0%) |
| 20 to 24 Year Olds | 5 (50.0%) | 5 (50.0%) |
| 25 to 34 Year Olds | 0 (0.0%) | 0 (0.0%) |
| 35 Years and over | 3 (100.0%) | 0 (0.0%) |
| Total | 66 (89.2%) | 8 (10.8%) |
Educational Attainment by Field of Study in Conesville
Business (5 | 29.4%), education (5 | 29.4%), bio, nature & agricultural (3 | 17.6%), psychology (2 | 11.8%), and social sciences (2 | 11.8%) are the most common fields of study among 17 individuals in Conesville who have obtained a bachelor's degree or higher.
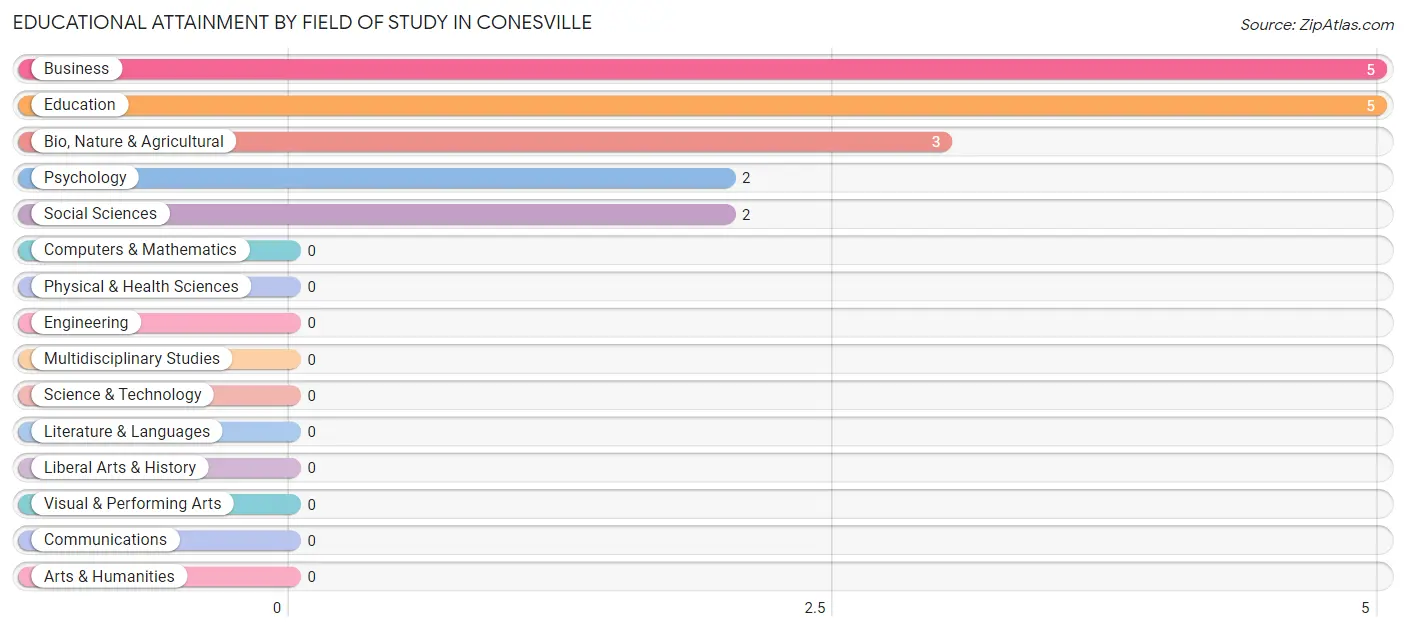
| Field of Study | # Graduates | % Graduates |
| Computers & Mathematics | 0 | 0.0% |
| Bio, Nature & Agricultural | 3 | 17.6% |
| Physical & Health Sciences | 0 | 0.0% |
| Psychology | 2 | 11.8% |
| Social Sciences | 2 | 11.8% |
| Engineering | 0 | 0.0% |
| Multidisciplinary Studies | 0 | 0.0% |
| Science & Technology | 0 | 0.0% |
| Business | 5 | 29.4% |
| Education | 5 | 29.4% |
| Literature & Languages | 0 | 0.0% |
| Liberal Arts & History | 0 | 0.0% |
| Visual & Performing Arts | 0 | 0.0% |
| Communications | 0 | 0.0% |
| Arts & Humanities | 0 | 0.0% |
| Total | 17 | 100.0% |
Transportation & Commute in Conesville
Vehicle Availability by Sex in Conesville
The most prevalent vehicle ownership categories in Conesville are males with 3 vehicles (72, accounting for 46.8%) and females with 3 vehicles (42, making up 72.7%).
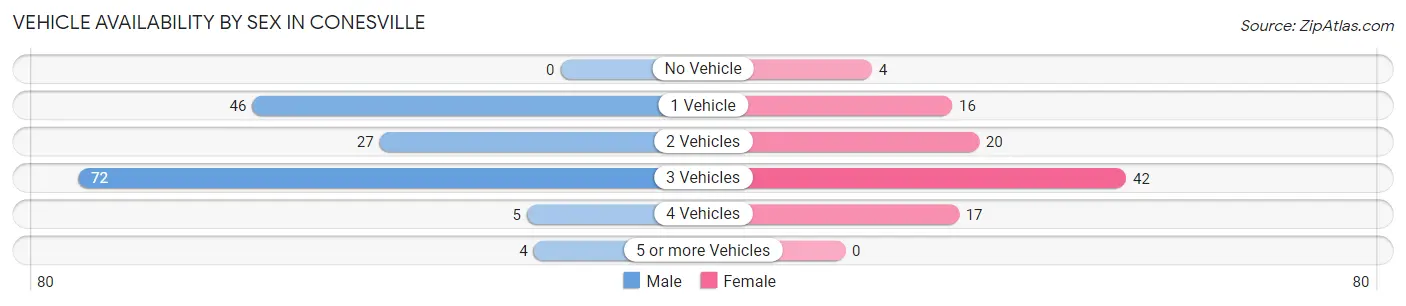
| Vehicles Available | Male | Female |
| No Vehicle | 0 (0.0%) | 4 (4.0%) |
| 1 Vehicle | 46 (29.9%) | 16 (16.2%) |
| 2 Vehicles | 27 (17.5%) | 20 (20.2%) |
| 3 Vehicles | 72 (46.8%) | 42 (42.4%) |
| 4 Vehicles | 5 (3.3%) | 17 (17.2%) |
| 5 or more Vehicles | 4 (2.6%) | 0 (0.0%) |
| Total | 154 (100.0%) | 99 (100.0%) |
Commute Time in Conesville
The most frequently occuring commute durations in Conesville are 25 to 29 minutes (68 commuters, 26.9%), 15 to 19 minutes (41 commuters, 16.2%), and 45 to 59 minutes (28 commuters, 11.1%).
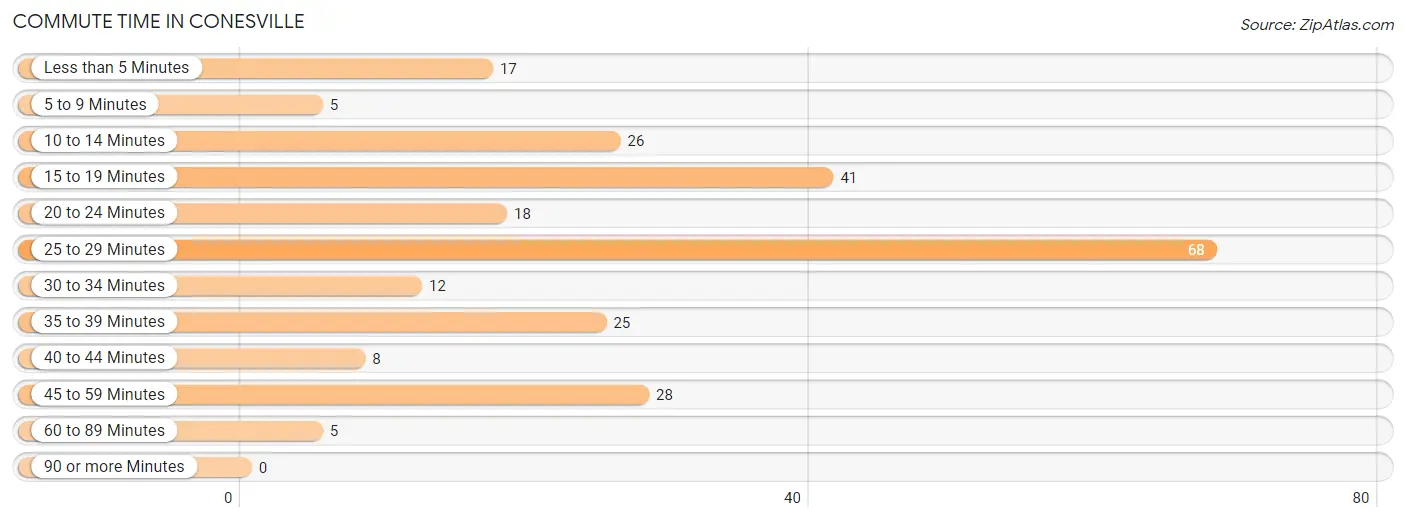
| Commute Time | # Commuters | % Commuters |
| Less than 5 Minutes | 17 | 6.7% |
| 5 to 9 Minutes | 5 | 2.0% |
| 10 to 14 Minutes | 26 | 10.3% |
| 15 to 19 Minutes | 41 | 16.2% |
| 20 to 24 Minutes | 18 | 7.1% |
| 25 to 29 Minutes | 68 | 26.9% |
| 30 to 34 Minutes | 12 | 4.7% |
| 35 to 39 Minutes | 25 | 9.9% |
| 40 to 44 Minutes | 8 | 3.2% |
| 45 to 59 Minutes | 28 | 11.1% |
| 60 to 89 Minutes | 5 | 2.0% |
| 90 or more Minutes | 0 | 0.0% |
Commute Time by Sex in Conesville
The most common commute times in Conesville are 25 to 29 minutes (61 commuters, 39.6%) for males and 15 to 19 minutes (27 commuters, 27.3%) for females.
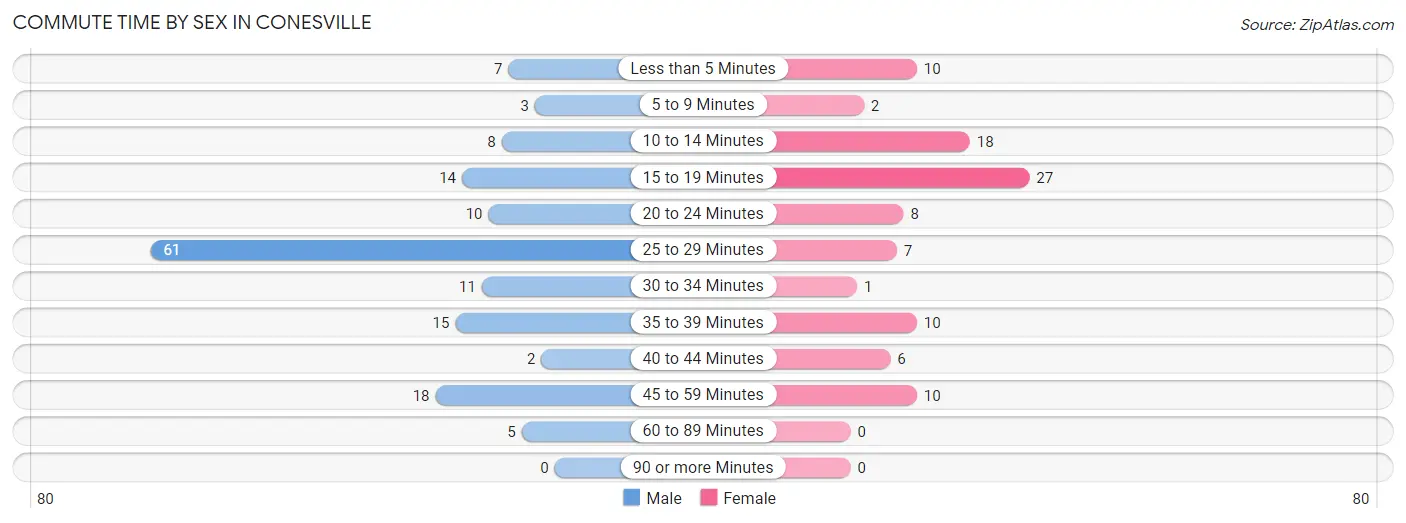
| Commute Time | Male | Female |
| Less than 5 Minutes | 7 (4.5%) | 10 (10.1%) |
| 5 to 9 Minutes | 3 (1.9%) | 2 (2.0%) |
| 10 to 14 Minutes | 8 (5.2%) | 18 (18.2%) |
| 15 to 19 Minutes | 14 (9.1%) | 27 (27.3%) |
| 20 to 24 Minutes | 10 (6.5%) | 8 (8.1%) |
| 25 to 29 Minutes | 61 (39.6%) | 7 (7.1%) |
| 30 to 34 Minutes | 11 (7.1%) | 1 (1.0%) |
| 35 to 39 Minutes | 15 (9.7%) | 10 (10.1%) |
| 40 to 44 Minutes | 2 (1.3%) | 6 (6.1%) |
| 45 to 59 Minutes | 18 (11.7%) | 10 (10.1%) |
| 60 to 89 Minutes | 5 (3.3%) | 0 (0.0%) |
| 90 or more Minutes | 0 (0.0%) | 0 (0.0%) |
Time of Departure to Work by Sex in Conesville
The most frequent times of departure to work in Conesville are 5:30 AM to 5:59 AM (54, 35.1%) for males and 7:00 AM to 7:29 AM (26, 26.3%) for females.
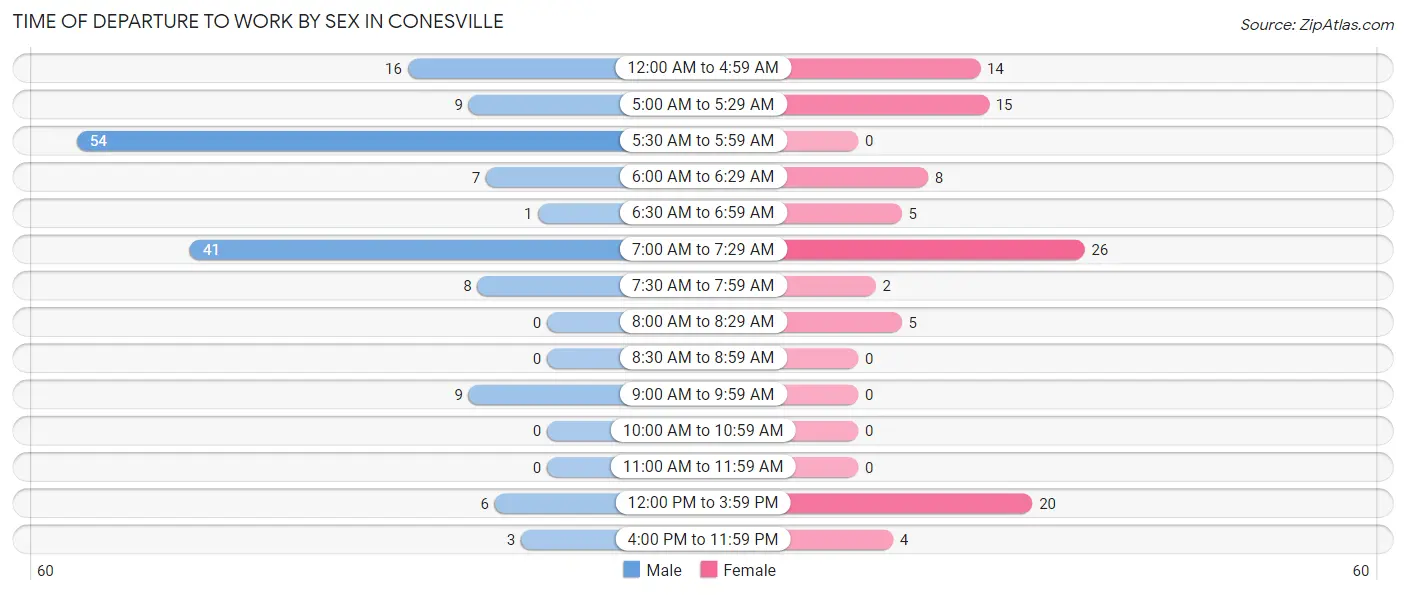
| Time of Departure | Male | Female |
| 12:00 AM to 4:59 AM | 16 (10.4%) | 14 (14.1%) |
| 5:00 AM to 5:29 AM | 9 (5.8%) | 15 (15.1%) |
| 5:30 AM to 5:59 AM | 54 (35.1%) | 0 (0.0%) |
| 6:00 AM to 6:29 AM | 7 (4.5%) | 8 (8.1%) |
| 6:30 AM to 6:59 AM | 1 (0.6%) | 5 (5.1%) |
| 7:00 AM to 7:29 AM | 41 (26.6%) | 26 (26.3%) |
| 7:30 AM to 7:59 AM | 8 (5.2%) | 2 (2.0%) |
| 8:00 AM to 8:29 AM | 0 (0.0%) | 5 (5.1%) |
| 8:30 AM to 8:59 AM | 0 (0.0%) | 0 (0.0%) |
| 9:00 AM to 9:59 AM | 9 (5.8%) | 0 (0.0%) |
| 10:00 AM to 10:59 AM | 0 (0.0%) | 0 (0.0%) |
| 11:00 AM to 11:59 AM | 0 (0.0%) | 0 (0.0%) |
| 12:00 PM to 3:59 PM | 6 (3.9%) | 20 (20.2%) |
| 4:00 PM to 11:59 PM | 3 (1.9%) | 4 (4.0%) |
| Total | 154 (100.0%) | 99 (100.0%) |
Housing Occupancy in Conesville
Occupancy by Ownership in Conesville
Of the total 198 dwellings in Conesville, owner-occupied units account for 142 (71.7%), while renter-occupied units make up 56 (28.3%).
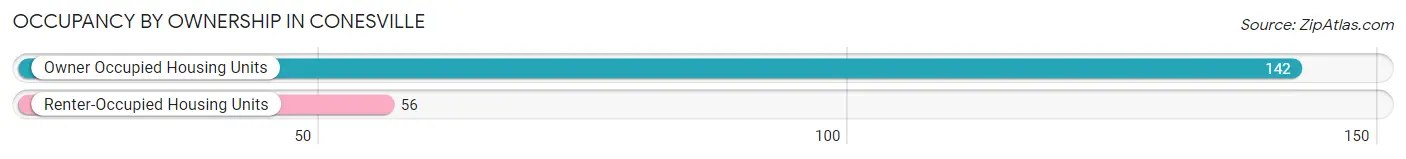
| Occupancy | # Housing Units | % Housing Units |
| Owner Occupied Housing Units | 142 | 71.7% |
| Renter-Occupied Housing Units | 56 | 28.3% |
| Total Occupied Housing Units | 198 | 100.0% |
Occupancy by Household Size in Conesville
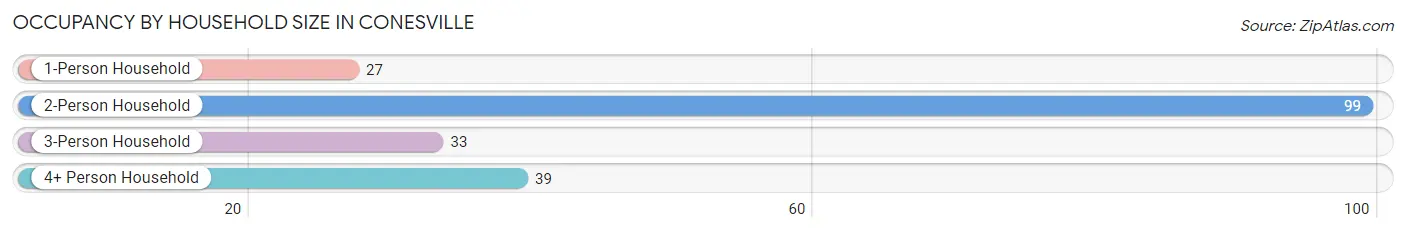
| Household Size | # Housing Units | % Housing Units |
| 1-Person Household | 27 | 13.6% |
| 2-Person Household | 99 | 50.0% |
| 3-Person Household | 33 | 16.7% |
| 4+ Person Household | 39 | 19.7% |
| Total Housing Units | 198 | 100.0% |
Occupancy by Ownership by Household Size in Conesville
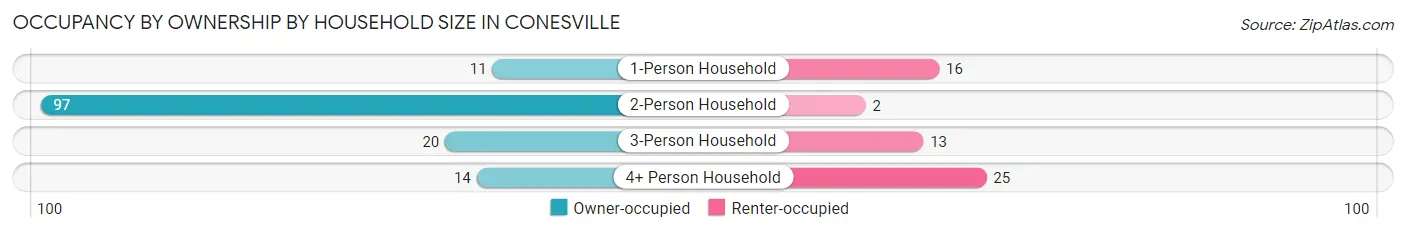
| Household Size | Owner-occupied | Renter-occupied |
| 1-Person Household | 11 (40.7%) | 16 (59.3%) |
| 2-Person Household | 97 (98.0%) | 2 (2.0%) |
| 3-Person Household | 20 (60.6%) | 13 (39.4%) |
| 4+ Person Household | 14 (35.9%) | 25 (64.1%) |
| Total Housing Units | 142 (71.7%) | 56 (28.3%) |
Occupancy by Educational Attainment in Conesville
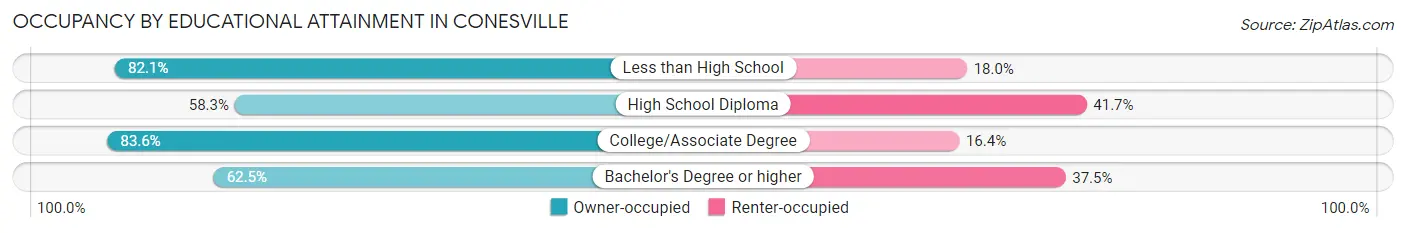
| Household Size | Owner-occupied | Renter-occupied |
| Less than High School | 32 (82.1%) | 7 (17.9%) |
| High School Diploma | 49 (58.3%) | 35 (41.7%) |
| College/Associate Degree | 56 (83.6%) | 11 (16.4%) |
| Bachelor's Degree or higher | 5 (62.5%) | 3 (37.5%) |
Occupancy by Age of Householder in Conesville
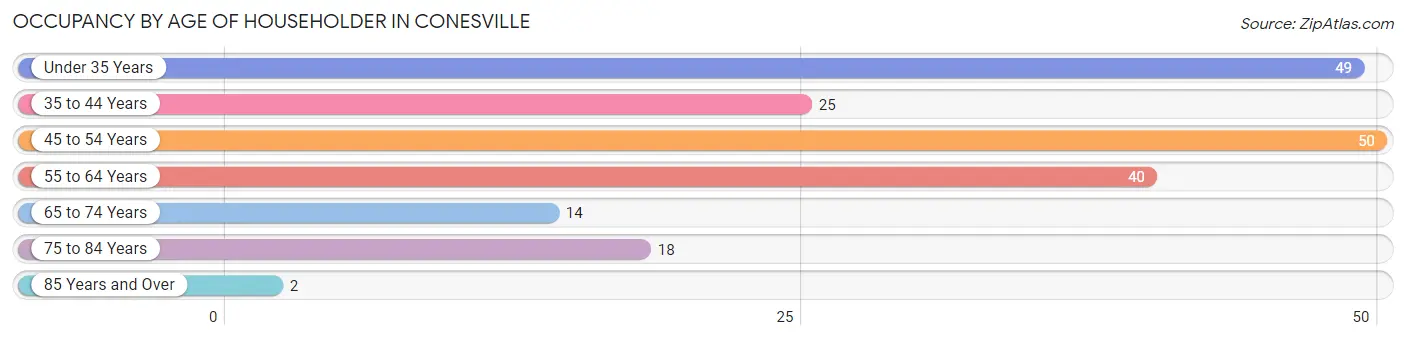
| Age Bracket | # Households | % Households |
| Under 35 Years | 49 | 24.7% |
| 35 to 44 Years | 25 | 12.6% |
| 45 to 54 Years | 50 | 25.3% |
| 55 to 64 Years | 40 | 20.2% |
| 65 to 74 Years | 14 | 7.1% |
| 75 to 84 Years | 18 | 9.1% |
| 85 Years and Over | 2 | 1.0% |
| Total | 198 | 100.0% |
Housing Finances in Conesville
Median Income by Occupancy in Conesville
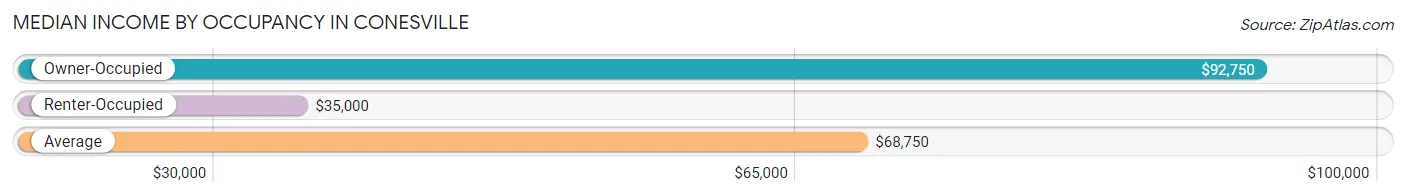
| Occupancy Type | # Households | Median Income |
| Owner-Occupied | 142 (71.7%) | $92,750 |
| Renter-Occupied | 56 (28.3%) | $35,000 |
| Average | 198 (100.0%) | $68,750 |
Occupancy by Householder Income Bracket in Conesville
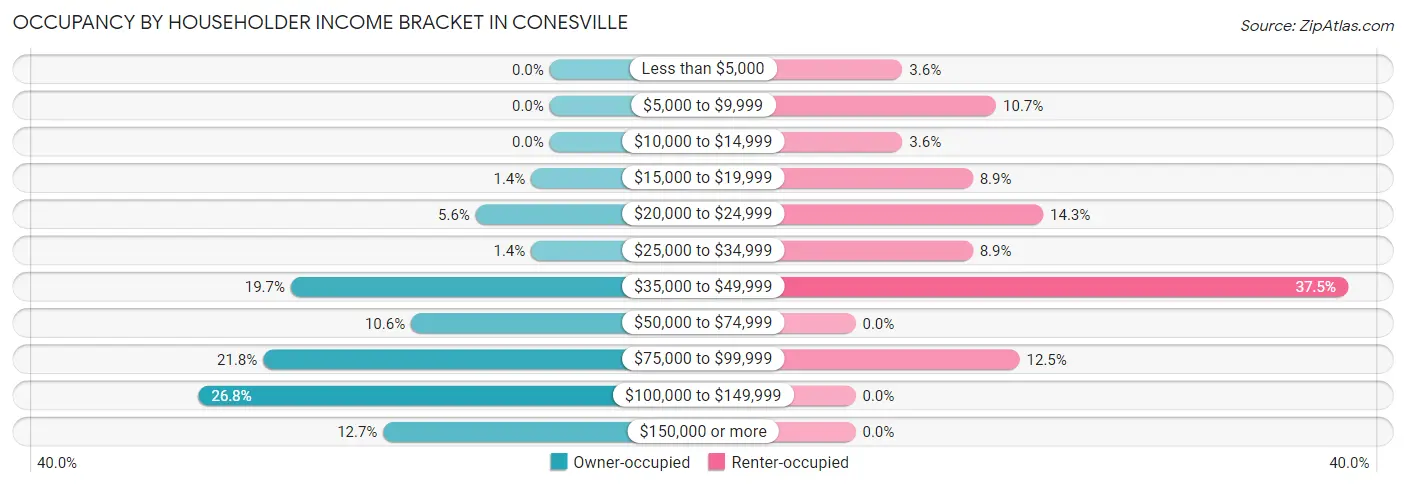
| Income Bracket | Owner-occupied | Renter-occupied |
| Less than $5,000 | 0 (0.0%) | 2 (3.6%) |
| $5,000 to $9,999 | 0 (0.0%) | 6 (10.7%) |
| $10,000 to $14,999 | 0 (0.0%) | 2 (3.6%) |
| $15,000 to $19,999 | 2 (1.4%) | 5 (8.9%) |
| $20,000 to $24,999 | 8 (5.6%) | 8 (14.3%) |
| $25,000 to $34,999 | 2 (1.4%) | 5 (8.9%) |
| $35,000 to $49,999 | 28 (19.7%) | 21 (37.5%) |
| $50,000 to $74,999 | 15 (10.6%) | 0 (0.0%) |
| $75,000 to $99,999 | 31 (21.8%) | 7 (12.5%) |
| $100,000 to $149,999 | 38 (26.8%) | 0 (0.0%) |
| $150,000 or more | 18 (12.7%) | 0 (0.0%) |
| Total | 142 (100.0%) | 56 (100.0%) |
Monthly Housing Cost Tiers in Conesville
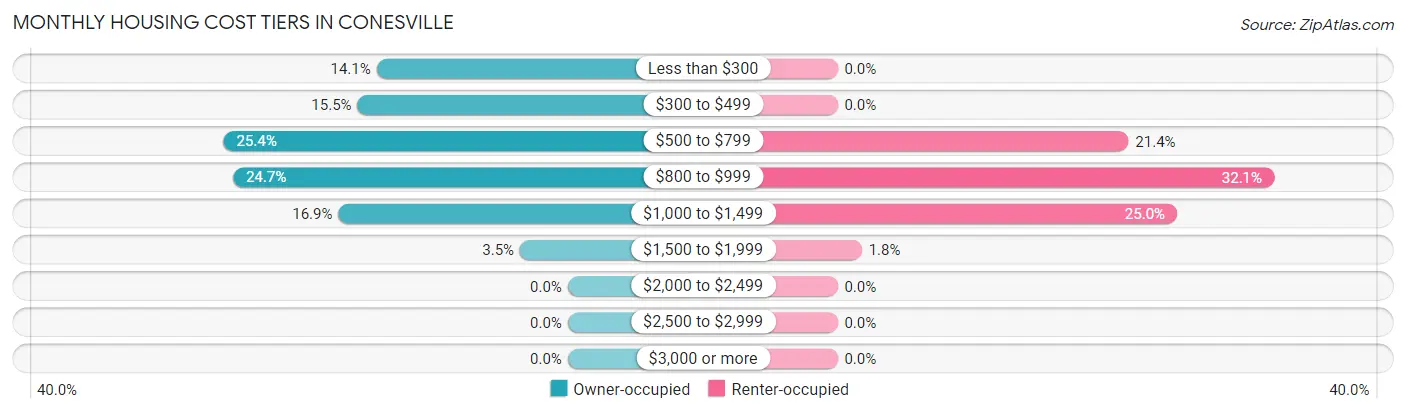
| Monthly Cost | Owner-occupied | Renter-occupied |
| Less than $300 | 20 (14.1%) | 0 (0.0%) |
| $300 to $499 | 22 (15.5%) | 0 (0.0%) |
| $500 to $799 | 36 (25.4%) | 12 (21.4%) |
| $800 to $999 | 35 (24.6%) | 18 (32.1%) |
| $1,000 to $1,499 | 24 (16.9%) | 14 (25.0%) |
| $1,500 to $1,999 | 5 (3.5%) | 1 (1.8%) |
| $2,000 to $2,499 | 0 (0.0%) | 0 (0.0%) |
| $2,500 to $2,999 | 0 (0.0%) | 0 (0.0%) |
| $3,000 or more | 0 (0.0%) | 0 (0.0%) |
| Total | 142 (100.0%) | 56 (100.0%) |
Physical Housing Characteristics in Conesville
Housing Structures in Conesville
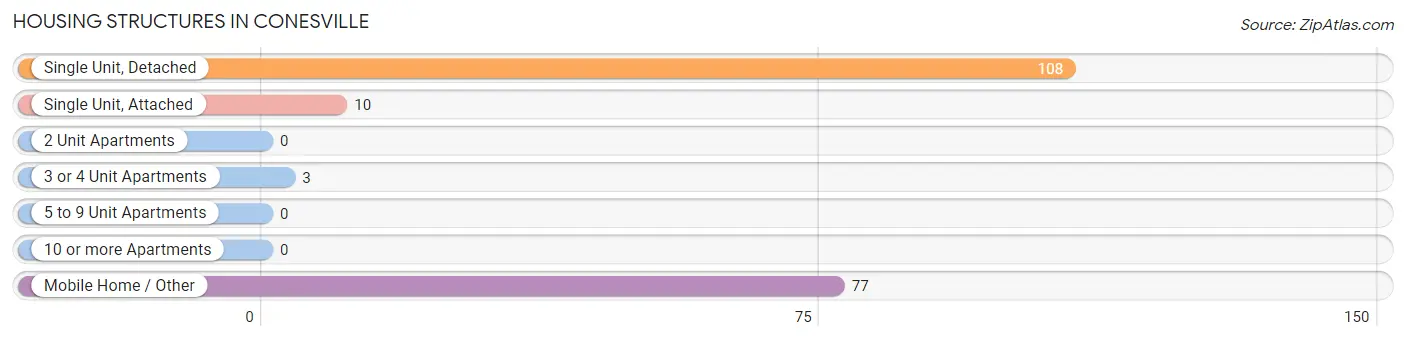
| Structure Type | # Housing Units | % Housing Units |
| Single Unit, Detached | 108 | 54.5% |
| Single Unit, Attached | 10 | 5.1% |
| 2 Unit Apartments | 0 | 0.0% |
| 3 or 4 Unit Apartments | 3 | 1.5% |
| 5 to 9 Unit Apartments | 0 | 0.0% |
| 10 or more Apartments | 0 | 0.0% |
| Mobile Home / Other | 77 | 38.9% |
| Total | 198 | 100.0% |
Housing Structures by Occupancy in Conesville
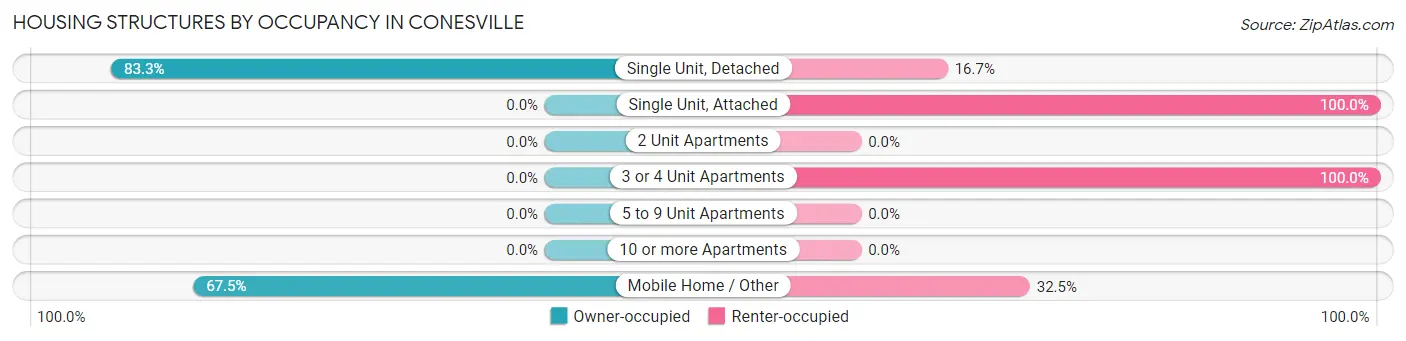
| Structure Type | Owner-occupied | Renter-occupied |
| Single Unit, Detached | 90 (83.3%) | 18 (16.7%) |
| Single Unit, Attached | 0 (0.0%) | 10 (100.0%) |
| 2 Unit Apartments | 0 (0.0%) | 0 (0.0%) |
| 3 or 4 Unit Apartments | 0 (0.0%) | 3 (100.0%) |
| 5 to 9 Unit Apartments | 0 (0.0%) | 0 (0.0%) |
| 10 or more Apartments | 0 (0.0%) | 0 (0.0%) |
| Mobile Home / Other | 52 (67.5%) | 25 (32.5%) |
| Total | 142 (71.7%) | 56 (28.3%) |
Housing Structures by Number of Rooms in Conesville
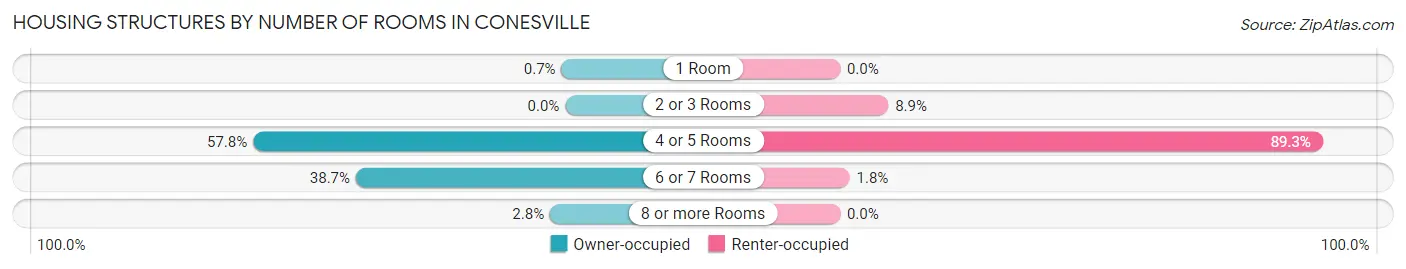
| Number of Rooms | Owner-occupied | Renter-occupied |
| 1 Room | 1 (0.7%) | 0 (0.0%) |
| 2 or 3 Rooms | 0 (0.0%) | 5 (8.9%) |
| 4 or 5 Rooms | 82 (57.8%) | 50 (89.3%) |
| 6 or 7 Rooms | 55 (38.7%) | 1 (1.8%) |
| 8 or more Rooms | 4 (2.8%) | 0 (0.0%) |
| Total | 142 (100.0%) | 56 (100.0%) |
Housing Structure by Heating Type in Conesville
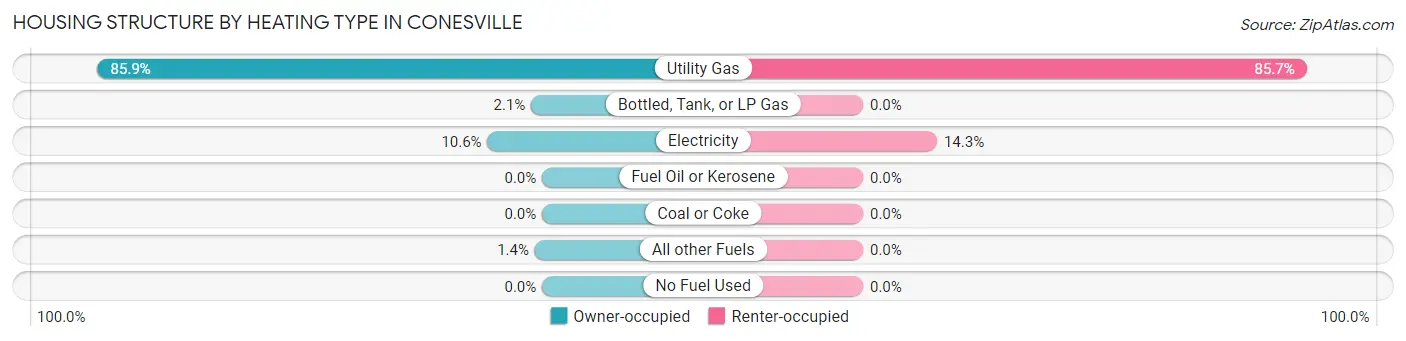
| Heating Type | Owner-occupied | Renter-occupied |
| Utility Gas | 122 (85.9%) | 48 (85.7%) |
| Bottled, Tank, or LP Gas | 3 (2.1%) | 0 (0.0%) |
| Electricity | 15 (10.6%) | 8 (14.3%) |
| Fuel Oil or Kerosene | 0 (0.0%) | 0 (0.0%) |
| Coal or Coke | 0 (0.0%) | 0 (0.0%) |
| All other Fuels | 2 (1.4%) | 0 (0.0%) |
| No Fuel Used | 0 (0.0%) | 0 (0.0%) |
| Total | 142 (100.0%) | 56 (100.0%) |
Household Vehicle Usage in Conesville
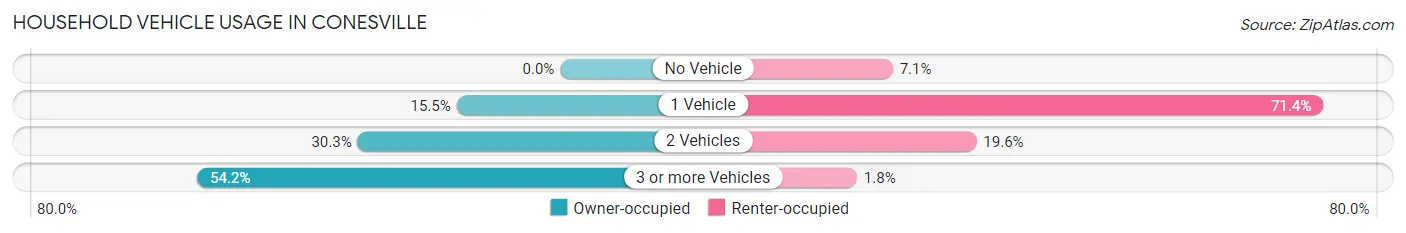
| Vehicles per Household | Owner-occupied | Renter-occupied |
| No Vehicle | 0 (0.0%) | 4 (7.1%) |
| 1 Vehicle | 22 (15.5%) | 40 (71.4%) |
| 2 Vehicles | 43 (30.3%) | 11 (19.6%) |
| 3 or more Vehicles | 77 (54.2%) | 1 (1.8%) |
| Total | 142 (100.0%) | 56 (100.0%) |
Real Estate & Mortgages in Conesville
Real Estate and Mortgage Overview in Conesville
| Characteristic | Without Mortgage | With Mortgage |
| Housing Units | 66 | 76 |
| Median Property Value | - | - |
| Median Household Income | $75,000 | $16 |
| Monthly Housing Costs | $365 | $0 |
| Real Estate Taxes | $686 | $2 |
Property Value by Mortgage Status in Conesville
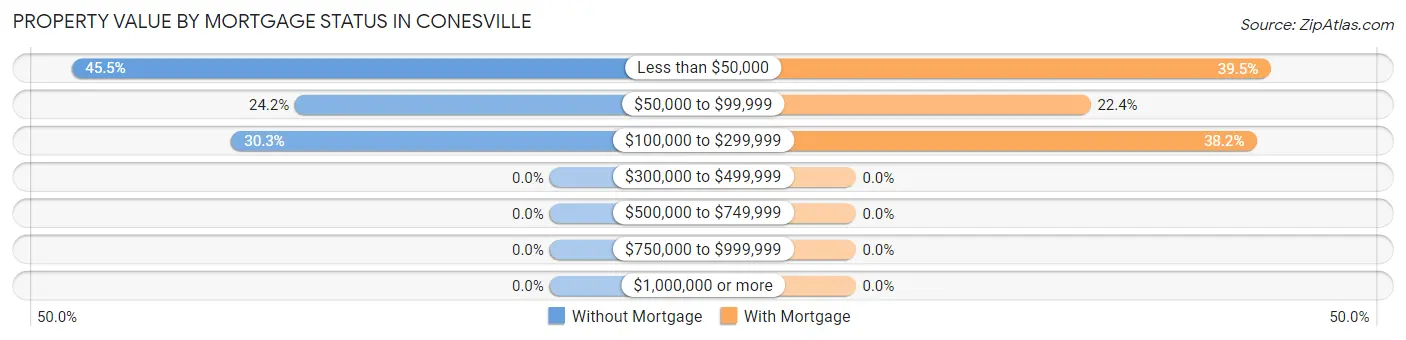
| Property Value | Without Mortgage | With Mortgage |
| Less than $50,000 | 30 (45.5%) | 30 (39.5%) |
| $50,000 to $99,999 | 16 (24.2%) | 17 (22.4%) |
| $100,000 to $299,999 | 20 (30.3%) | 29 (38.2%) |
| $300,000 to $499,999 | 0 (0.0%) | 0 (0.0%) |
| $500,000 to $749,999 | 0 (0.0%) | 0 (0.0%) |
| $750,000 to $999,999 | 0 (0.0%) | 0 (0.0%) |
| $1,000,000 or more | 0 (0.0%) | 0 (0.0%) |
| Total | 66 (100.0%) | 76 (100.0%) |
Household Income by Mortgage Status in Conesville
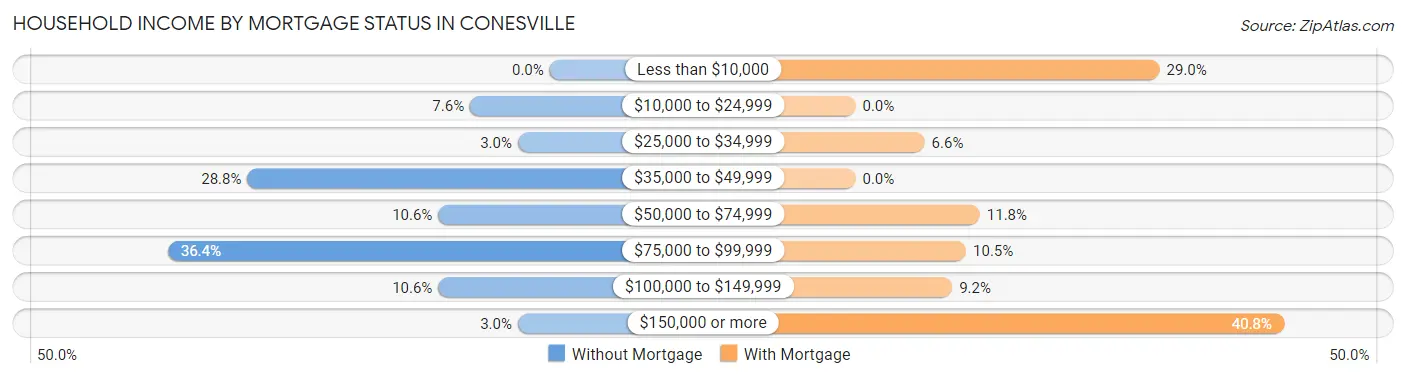
| Household Income | Without Mortgage | With Mortgage |
| Less than $10,000 | 0 (0.0%) | 22 (28.9%) |
| $10,000 to $24,999 | 5 (7.6%) | 0 (0.0%) |
| $25,000 to $34,999 | 2 (3.0%) | 5 (6.6%) |
| $35,000 to $49,999 | 19 (28.8%) | 0 (0.0%) |
| $50,000 to $74,999 | 7 (10.6%) | 9 (11.8%) |
| $75,000 to $99,999 | 24 (36.4%) | 8 (10.5%) |
| $100,000 to $149,999 | 7 (10.6%) | 7 (9.2%) |
| $150,000 or more | 2 (3.0%) | 31 (40.8%) |
| Total | 66 (100.0%) | 76 (100.0%) |
Property Value to Household Income Ratio in Conesville
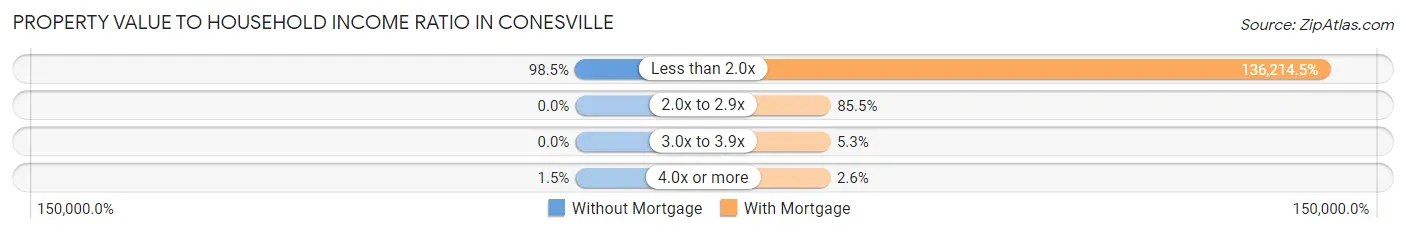
| Value-to-Income Ratio | Without Mortgage | With Mortgage |
| Less than 2.0x | 65 (98.5%) | 103,523 (136,214.5%) |
| 2.0x to 2.9x | 0 (0.0%) | 65 (85.5%) |
| 3.0x to 3.9x | 0 (0.0%) | 4 (5.3%) |
| 4.0x or more | 1 (1.5%) | 2 (2.6%) |
| Total | 66 (100.0%) | 76 (100.0%) |
Real Estate Taxes by Mortgage Status in Conesville
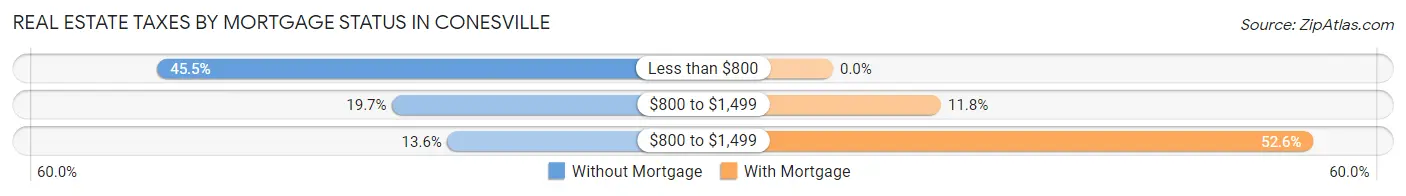
| Property Taxes | Without Mortgage | With Mortgage |
| Less than $800 | 30 (45.5%) | 0 (0.0%) |
| $800 to $1,499 | 13 (19.7%) | 9 (11.8%) |
| $800 to $1,499 | 9 (13.6%) | 40 (52.6%) |
| Total | 66 (100.0%) | 76 (100.0%) |
Health & Disability in Conesville
Health Insurance Coverage by Age in Conesville
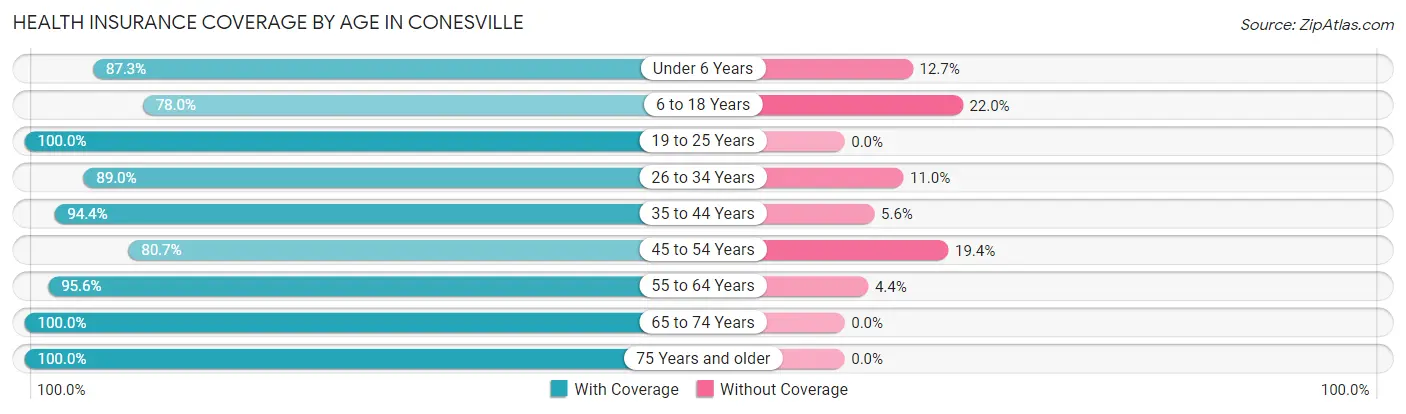
| Age Bracket | With Coverage | Without Coverage |
| Under 6 Years | 48 (87.3%) | 7 (12.7%) |
| 6 to 18 Years | 46 (78.0%) | 13 (22.0%) |
| 19 to 25 Years | 48 (100.0%) | 0 (0.0%) |
| 26 to 34 Years | 65 (89.0%) | 8 (11.0%) |
| 35 to 44 Years | 51 (94.4%) | 3 (5.6%) |
| 45 to 54 Years | 50 (80.6%) | 12 (19.4%) |
| 55 to 64 Years | 65 (95.6%) | 3 (4.4%) |
| 65 to 74 Years | 19 (100.0%) | 0 (0.0%) |
| 75 Years and older | 29 (100.0%) | 0 (0.0%) |
| Total | 421 (90.1%) | 46 (9.9%) |
Health Insurance Coverage by Citizenship Status in Conesville
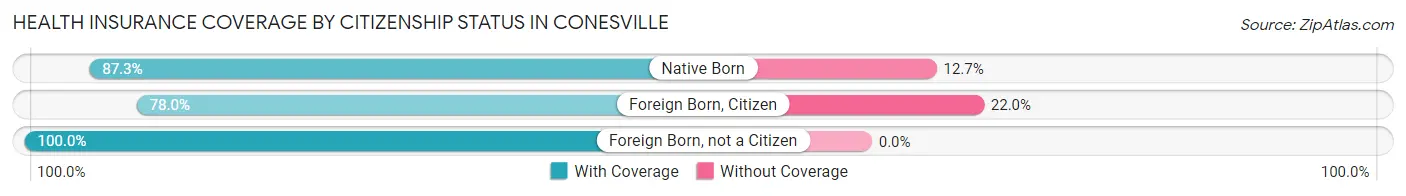
| Citizenship Status | With Coverage | Without Coverage |
| Native Born | 48 (87.3%) | 7 (12.7%) |
| Foreign Born, Citizen | 46 (78.0%) | 13 (22.0%) |
| Foreign Born, not a Citizen | 48 (100.0%) | 0 (0.0%) |
Health Insurance Coverage by Household Income in Conesville
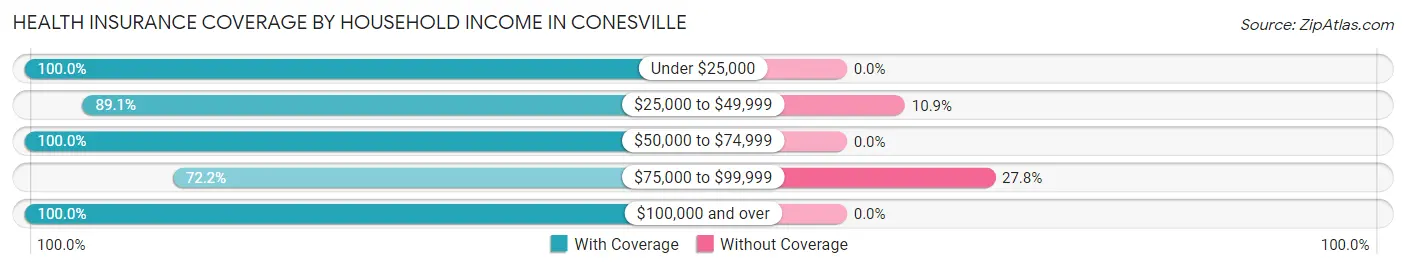
| Household Income | With Coverage | Without Coverage |
| Under $25,000 | 64 (100.0%) | 0 (0.0%) |
| $25,000 to $49,999 | 131 (89.1%) | 16 (10.9%) |
| $50,000 to $74,999 | 32 (100.0%) | 0 (0.0%) |
| $75,000 to $99,999 | 78 (72.2%) | 30 (27.8%) |
| $100,000 and over | 107 (100.0%) | 0 (0.0%) |
Public vs Private Health Insurance Coverage by Age in Conesville
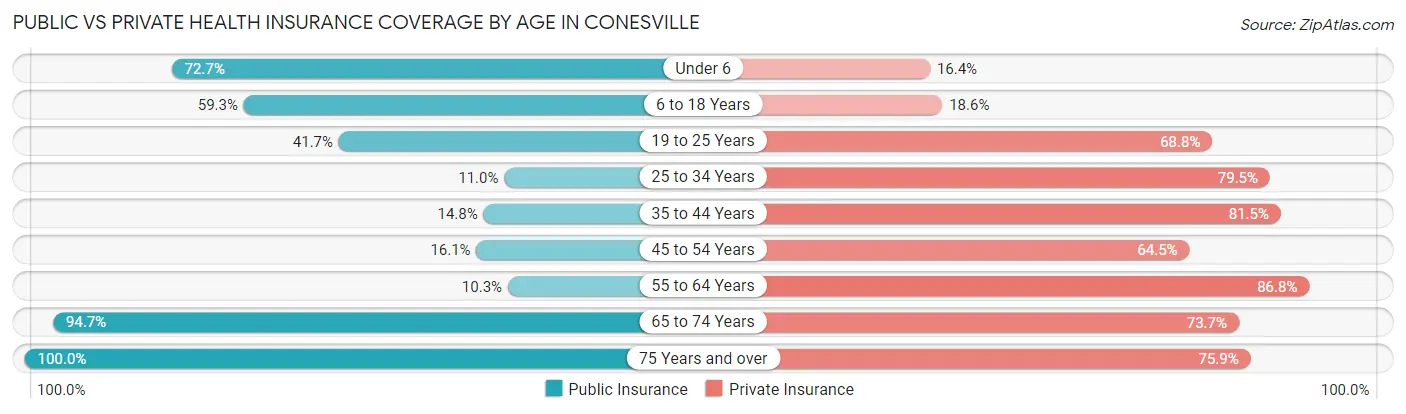
| Age Bracket | Public Insurance | Private Insurance |
| Under 6 | 40 (72.7%) | 9 (16.4%) |
| 6 to 18 Years | 35 (59.3%) | 11 (18.6%) |
| 19 to 25 Years | 20 (41.7%) | 33 (68.8%) |
| 25 to 34 Years | 8 (11.0%) | 58 (79.4%) |
| 35 to 44 Years | 8 (14.8%) | 44 (81.5%) |
| 45 to 54 Years | 10 (16.1%) | 40 (64.5%) |
| 55 to 64 Years | 7 (10.3%) | 59 (86.8%) |
| 65 to 74 Years | 18 (94.7%) | 14 (73.7%) |
| 75 Years and over | 29 (100.0%) | 22 (75.9%) |
| Total | 175 (37.5%) | 290 (62.1%) |
Disability Status by Sex by Age in Conesville
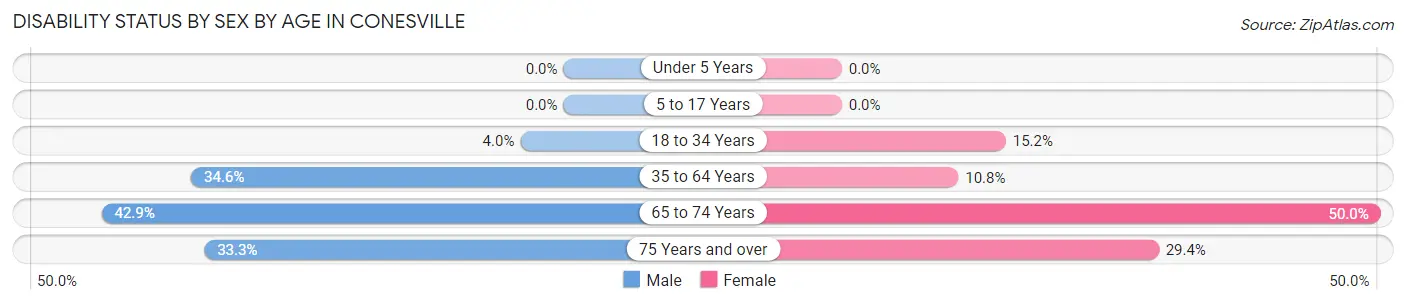
| Age Bracket | Male | Female |
| Under 5 Years | 0 (0.0%) | 0 (0.0%) |
| 5 to 17 Years | 0 (0.0%) | 0 (0.0%) |
| 18 to 34 Years | 3 (4.0%) | 7 (15.2%) |
| 35 to 64 Years | 38 (34.5%) | 8 (10.8%) |
| 65 to 74 Years | 3 (42.9%) | 6 (50.0%) |
| 75 Years and over | 4 (33.3%) | 5 (29.4%) |
Disability Class by Sex by Age in Conesville
Disability Class: Hearing Difficulty
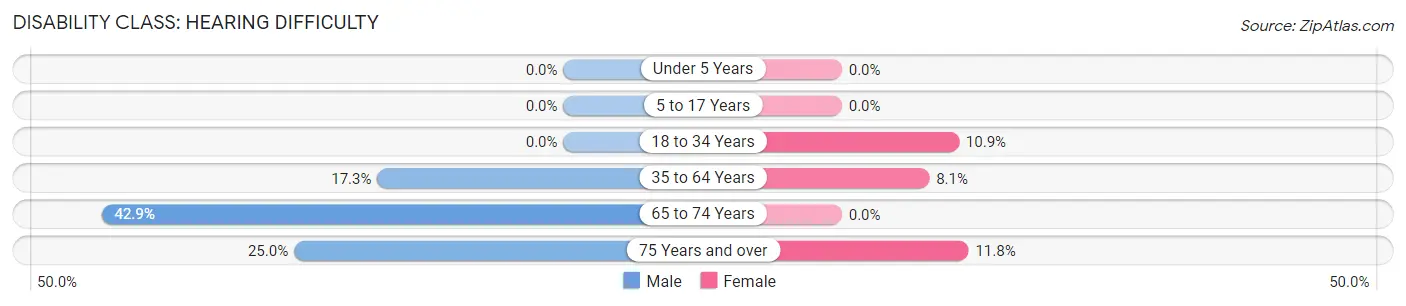
| Age Bracket | Male | Female |
| Under 5 Years | 0 (0.0%) | 0 (0.0%) |
| 5 to 17 Years | 0 (0.0%) | 0 (0.0%) |
| 18 to 34 Years | 0 (0.0%) | 5 (10.9%) |
| 35 to 64 Years | 19 (17.3%) | 6 (8.1%) |
| 65 to 74 Years | 3 (42.9%) | 0 (0.0%) |
| 75 Years and over | 3 (25.0%) | 2 (11.8%) |
Disability Class: Vision Difficulty
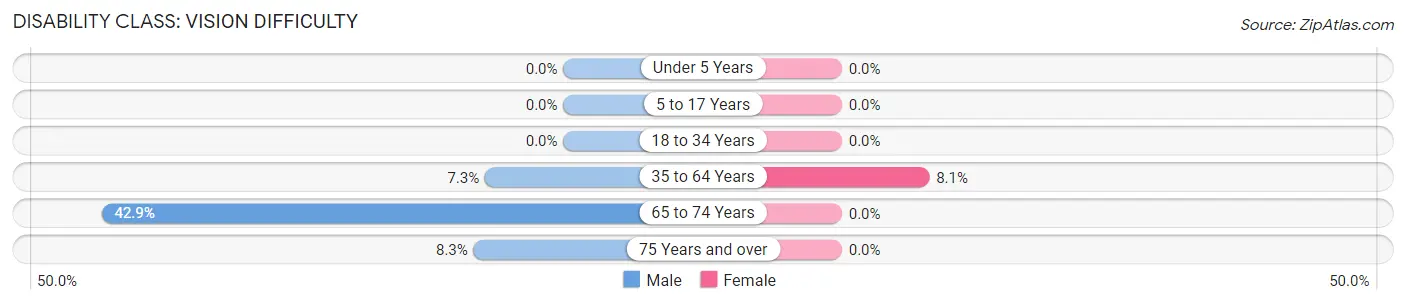
| Age Bracket | Male | Female |
| Under 5 Years | 0 (0.0%) | 0 (0.0%) |
| 5 to 17 Years | 0 (0.0%) | 0 (0.0%) |
| 18 to 34 Years | 0 (0.0%) | 0 (0.0%) |
| 35 to 64 Years | 8 (7.3%) | 6 (8.1%) |
| 65 to 74 Years | 3 (42.9%) | 0 (0.0%) |
| 75 Years and over | 1 (8.3%) | 0 (0.0%) |
Disability Class: Cognitive Difficulty
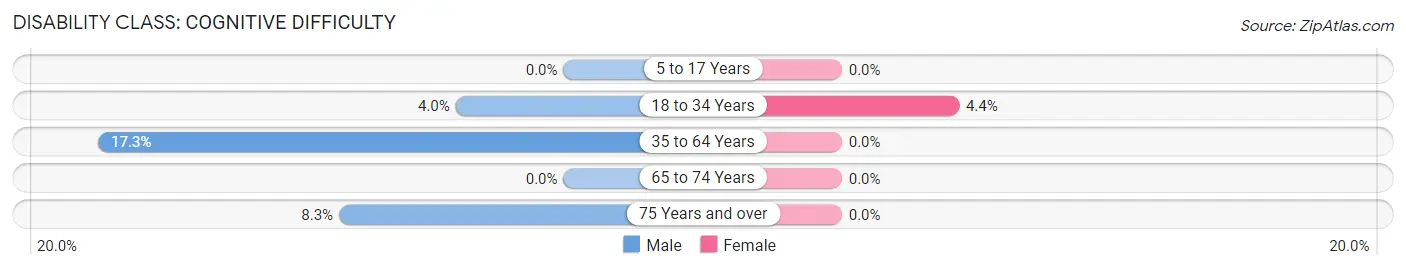
| Age Bracket | Male | Female |
| 5 to 17 Years | 0 (0.0%) | 0 (0.0%) |
| 18 to 34 Years | 3 (4.0%) | 2 (4.3%) |
| 35 to 64 Years | 19 (17.3%) | 0 (0.0%) |
| 65 to 74 Years | 0 (0.0%) | 0 (0.0%) |
| 75 Years and over | 1 (8.3%) | 0 (0.0%) |
Disability Class: Ambulatory Difficulty
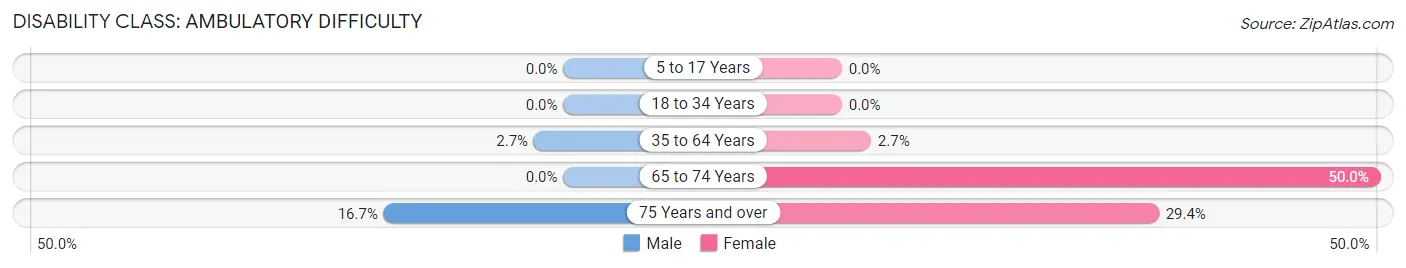
| Age Bracket | Male | Female |
| 5 to 17 Years | 0 (0.0%) | 0 (0.0%) |
| 18 to 34 Years | 0 (0.0%) | 0 (0.0%) |
| 35 to 64 Years | 3 (2.7%) | 2 (2.7%) |
| 65 to 74 Years | 0 (0.0%) | 6 (50.0%) |
| 75 Years and over | 2 (16.7%) | 5 (29.4%) |
Disability Class: Self-Care Difficulty
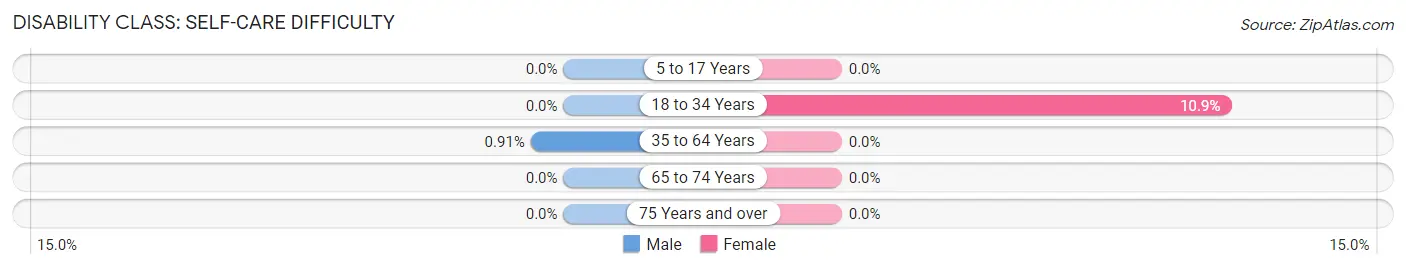
| Age Bracket | Male | Female |
| 5 to 17 Years | 0 (0.0%) | 0 (0.0%) |
| 18 to 34 Years | 0 (0.0%) | 5 (10.9%) |
| 35 to 64 Years | 1 (0.9%) | 0 (0.0%) |
| 65 to 74 Years | 0 (0.0%) | 0 (0.0%) |
| 75 Years and over | 0 (0.0%) | 0 (0.0%) |
Technology Access in Conesville
Computing Device Access in Conesville
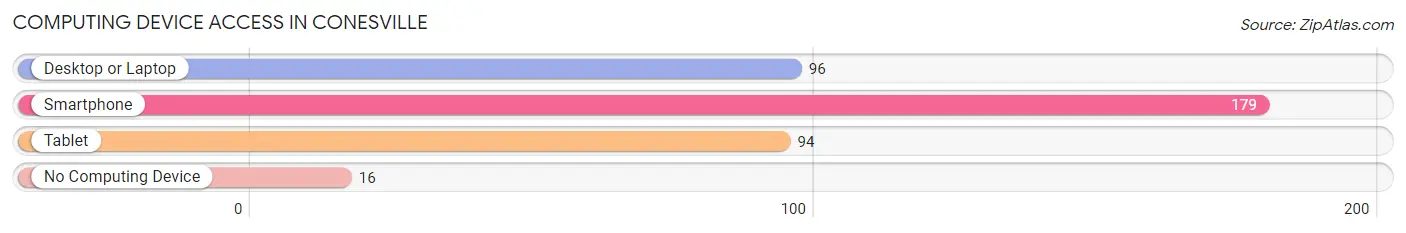
| Device Type | # Households | % Households |
| Desktop or Laptop | 96 | 48.5% |
| Smartphone | 179 | 90.4% |
| Tablet | 94 | 47.5% |
| No Computing Device | 16 | 8.1% |
| Total | 198 | 100.0% |
Internet Access in Conesville
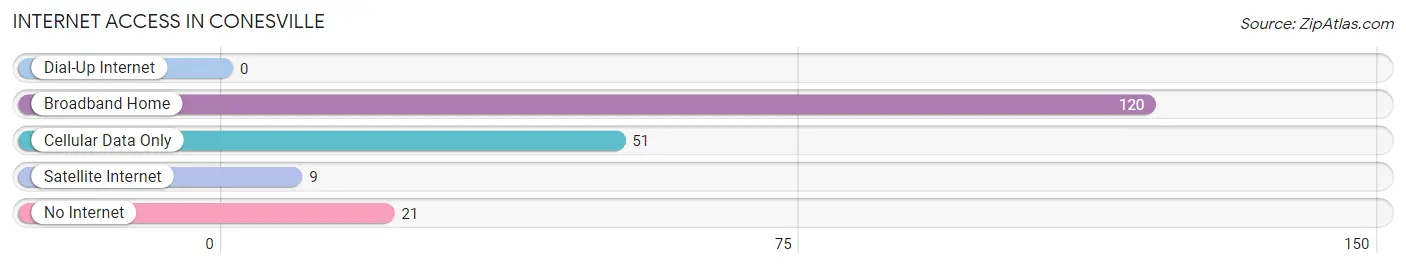
| Internet Type | # Households | % Households |
| Dial-Up Internet | 0 | 0.0% |
| Broadband Home | 120 | 60.6% |
| Cellular Data Only | 51 | 25.8% |
| Satellite Internet | 9 | 4.5% |
| No Internet | 21 | 10.6% |
| Total | 198 | 100.0% |
Conesville Summary
Conesville, Iowa is a small town located in the southeastern corner of the state, in the county of Muscatine. It is situated on the banks of the Mississippi River, and is home to a population of just over 1,000 people.
History
Conesville was founded in 1837 by a group of settlers from Ohio. The town was named after the Cones family, who were among the first settlers. The town was originally a farming community, and the main crops grown were corn, wheat, and oats. In the late 1800s, the town began to grow and develop, and by the early 1900s, it had become a thriving community.
The town was home to several businesses, including a general store, a blacksmith shop, a sawmill, and a grist mill. The town also had a post office, a bank, and a hotel. In the early 1900s, the town was also home to a number of churches, including the Methodist Episcopal Church, the Congregational Church, and the Baptist Church.
In the early 1900s, the town was also home to a number of schools, including the Conesville High School, which was established in 1910. The school was later renamed the Conesville Community High School, and it is still in operation today.
Geography
Conesville is located in the southeastern corner of Iowa, in the county of Muscatine. It is situated on the banks of the Mississippi River, and is bordered by the towns of Wilton, Durant, and Stockton. The town is located approximately 25 miles south of Davenport, and is about an hour and a half drive from Des Moines.
The town is situated on a flat plain, and is surrounded by rolling hills and farmland. The town is located in a temperate climate, with hot summers and cold winters. The average temperature in the summer is around 80 degrees Fahrenheit, and the average temperature in the winter is around 20 degrees Fahrenheit.
Economy
The economy of Conesville is largely based on agriculture. The town is home to several farms, which produce corn, soybeans, and other crops. The town is also home to a number of businesses, including a general store, a hardware store, a bank, and a hotel.
The town is also home to a number of manufacturing businesses, including a furniture factory, a printing company, and a plastics factory. The town is also home to a number of small businesses, including restaurants, bars, and shops.
Demographics
As of the 2010 census, the population of Conesville was 1,072. The town is predominantly white, with a population that is 97.3% white. The town is also home to a small Hispanic population, which makes up 1.2% of the population. The town is also home to a small African American population, which makes up 0.5% of the population.
The median household income in Conesville is $41,250, and the median home value is $117,000. The town has a poverty rate of 11.3%, which is slightly higher than the national average. The town also has a high rate of unemployment, with a rate of 8.2%.
Conclusion
Conesville, Iowa is a small town located in the southeastern corner of the state, in the county of Muscatine. It is situated on the banks of the Mississippi River, and is home to a population of just over 1,000 people. The town is largely based on agriculture, and is home to several businesses, including a general store, a hardware store, a bank, and a hotel. The town is predominantly white, with a population that is 97.3% white. The median household income in Conesville is $41,250, and the median home value is $117,000. The town has a poverty rate of 11.3%, which is slightly higher than the national average. The town also has a high rate of unemployment, with a rate of 8.2%.
Common Questions
What is Per Capita Income in Conesville?
Per Capita income in Conesville is $30,590.
What is the Median Family Income in Conesville?
Median Family Income in Conesville is $86,071.
What is the Median Household income in Conesville?
Median Household Income in Conesville is $68,750.
What is Income or Wage Gap in Conesville?
Income or Wage Gap in Conesville is 35.7%.
Women in Conesville earn 64.3 cents for every dollar earned by a man.
What is Inequality or Gini Index in Conesville?
Inequality or Gini Index in Conesville is 0.35.
What is the Total Population of Conesville?
Total Population of Conesville is 467.
What is the Total Male Population of Conesville?
Total Male Population of Conesville is 264.
What is the Total Female Population of Conesville?
Total Female Population of Conesville is 203.
What is the Ratio of Males per 100 Females in Conesville?
There are 130.05 Males per 100 Females in Conesville.
What is the Ratio of Females per 100 Males in Conesville?
There are 76.89 Females per 100 Males in Conesville.
What is the Median Population Age in Conesville?
Median Population Age in Conesville is 34.6 Years.
What is the Average Family Size in Conesville
Average Family Size in Conesville is 2.7 People.
What is the Average Household Size in Conesville
Average Household Size in Conesville is 2.3 People.
How Large is the Labor Force in Conesville?
There are 272 People in the Labor Forcein in Conesville.
What is the Percentage of People in the Labor Force in Conesville?
76.2% of People are in the Labor Force in Conesville.
What is the Unemployment Rate in Conesville?
Unemployment Rate in Conesville is 6.3%.