Dumas, TX Map & Demographics
Dumas Map
Dumas Overview
$25,943
PER CAPITA INCOME
$70,724
AVG FAMILY INCOME
$65,379
AVG HOUSEHOLD INCOME
32.6%
WAGE / INCOME GAP [ % ]
67.4¢/ $1
WAGE / INCOME GAP [ $ ]
$8,520
FAMILY INCOME DEFICIT
0.38
INEQUALITY / GINI INDEX
14,404
TOTAL POPULATION
7,547
MALE POPULATION
6,857
FEMALE POPULATION
110.06
MALES / 100 FEMALES
90.86
FEMALES / 100 MALES
29.2
MEDIAN AGE
3.7
AVG FAMILY SIZE
3.1
AVG HOUSEHOLD SIZE
6,750
LABOR FORCE [ PEOPLE ]
67.1%
PERCENT IN LABOR FORCE
2.3%
UNEMPLOYMENT RATE
Dumas Zip Codes
Dumas Area Codes
Income in Dumas
Income Overview in Dumas
Per Capita Income in Dumas is $25,943, while median incomes of families and households are $70,724 and $65,379 respectively.
| Characteristic | Number | Measure |
| Per Capita Income | 14,404 | $25,943 |
| Median Family Income | 3,410 | $70,724 |
| Mean Family Income | 3,410 | $84,597 |
| Median Household Income | 4,606 | $65,379 |
| Mean Household Income | 4,606 | $78,403 |
| Income Deficit | 3,410 | $8,520 |
| Wage / Income Gap (%) | 14,404 | 32.62% |
| Wage / Income Gap ($) | 14,404 | 67.38¢ per $1 |
| Gini / Inequality Index | 14,404 | 0.38 |
Earnings by Sex in Dumas
Average Earnings in Dumas are $39,445, $46,128 for men and $31,083 for women, a difference of 32.6%.
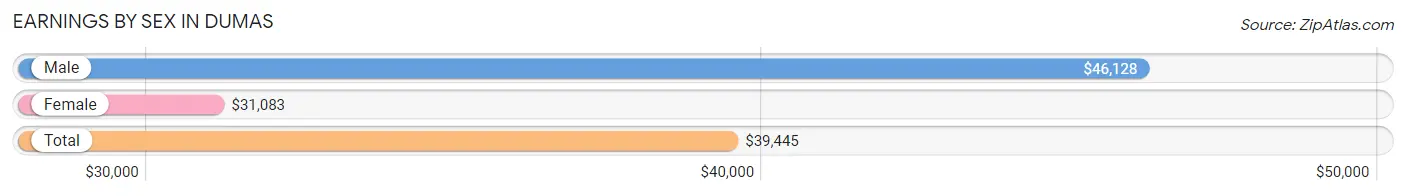
| Sex | Number | Average Earnings |
| Male | 4,063 (59.0%) | $46,128 |
| Female | 2,828 (41.0%) | $31,083 |
| Total | 6,891 (100.0%) | $39,445 |
Earnings by Sex by Income Bracket in Dumas
The most common earnings brackets in Dumas are $100,000+ for men (482 | 11.9%) and $25,000 to $29,999 for women (343 | 12.1%).
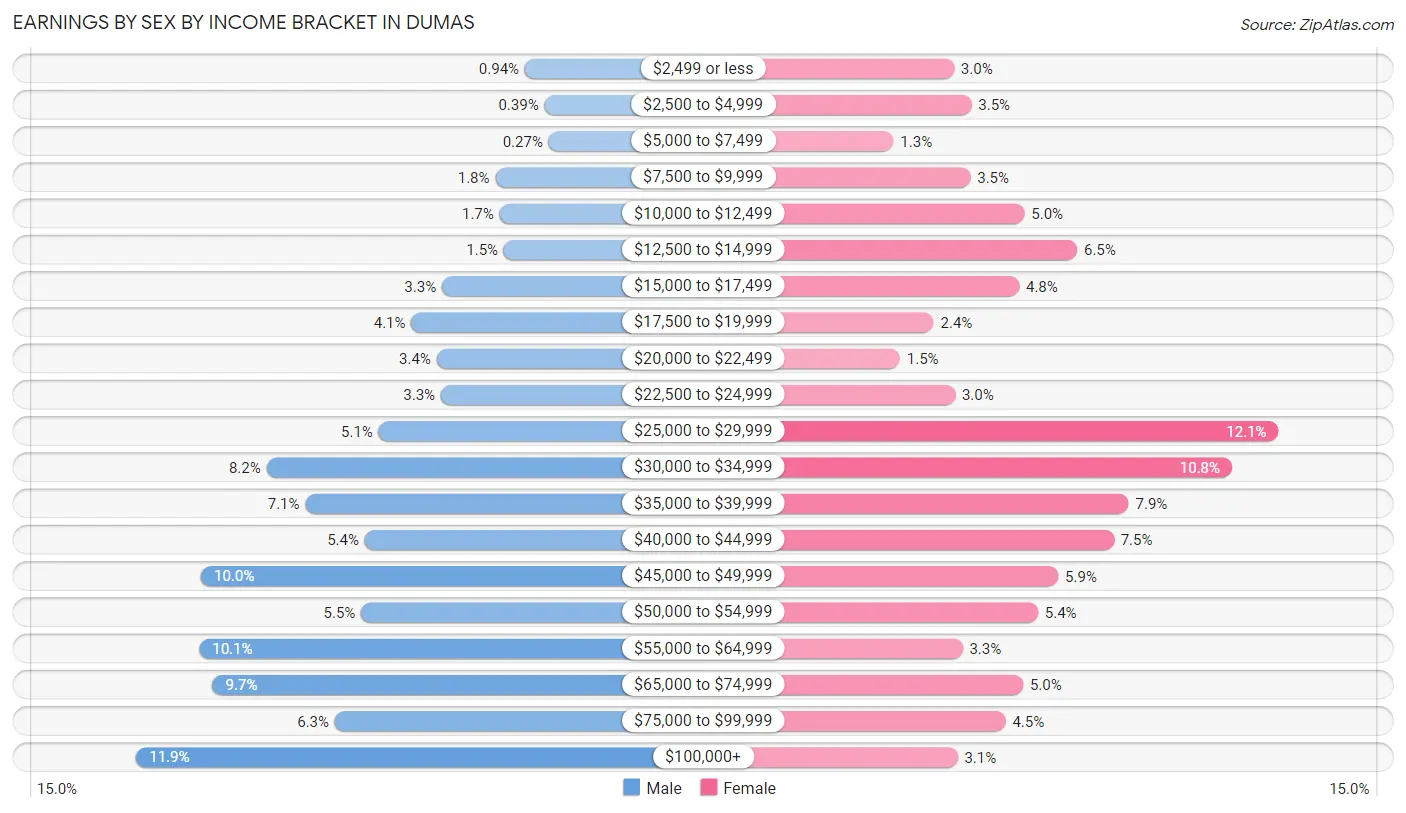
| Income | Male | Female |
| $2,499 or less | 38 (0.9%) | 85 (3.0%) |
| $2,500 to $4,999 | 16 (0.4%) | 99 (3.5%) |
| $5,000 to $7,499 | 11 (0.3%) | 37 (1.3%) |
| $7,500 to $9,999 | 72 (1.8%) | 98 (3.5%) |
| $10,000 to $12,499 | 67 (1.7%) | 141 (5.0%) |
| $12,500 to $14,999 | 62 (1.5%) | 183 (6.5%) |
| $15,000 to $17,499 | 133 (3.3%) | 137 (4.8%) |
| $17,500 to $19,999 | 168 (4.1%) | 69 (2.4%) |
| $20,000 to $22,499 | 139 (3.4%) | 42 (1.5%) |
| $22,500 to $24,999 | 134 (3.3%) | 86 (3.0%) |
| $25,000 to $29,999 | 205 (5.1%) | 343 (12.1%) |
| $30,000 to $34,999 | 333 (8.2%) | 306 (10.8%) |
| $35,000 to $39,999 | 289 (7.1%) | 224 (7.9%) |
| $40,000 to $44,999 | 221 (5.4%) | 212 (7.5%) |
| $45,000 to $49,999 | 408 (10.0%) | 168 (5.9%) |
| $50,000 to $54,999 | 225 (5.5%) | 152 (5.4%) |
| $55,000 to $64,999 | 410 (10.1%) | 92 (3.3%) |
| $65,000 to $74,999 | 395 (9.7%) | 140 (5.0%) |
| $75,000 to $99,999 | 255 (6.3%) | 126 (4.5%) |
| $100,000+ | 482 (11.9%) | 88 (3.1%) |
| Total | 4,063 (100.0%) | 2,828 (100.0%) |
Earnings by Sex by Educational Attainment in Dumas
Average earnings in Dumas are $49,250 for men and $32,086 for women, a difference of 34.8%. Men with an educational attainment of bachelor's degree enjoy the highest average annual earnings of $64,808, while those with less than high school education earn the least with $45,048. Women with an educational attainment of bachelor's degree earn the most with the average annual earnings of $74,464, while those with less than high school education have the smallest earnings of $25,399.
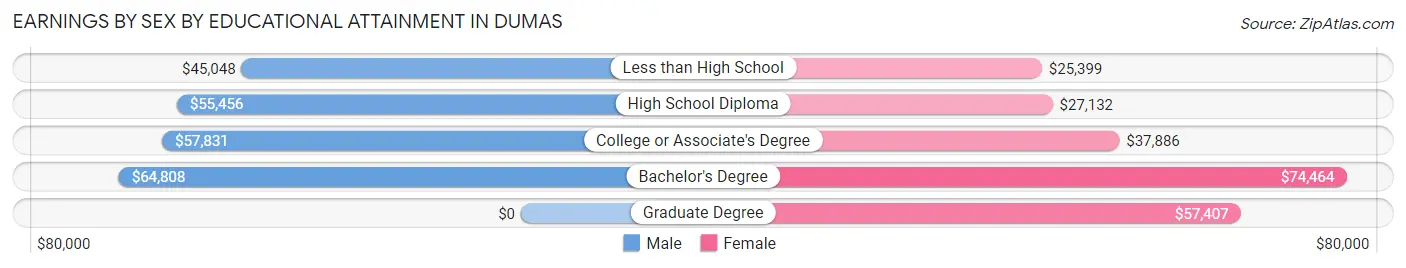
| Educational Attainment | Male Income | Female Income |
| Less than High School | $45,048 | $25,399 |
| High School Diploma | $55,456 | $27,132 |
| College or Associate's Degree | $57,831 | $37,886 |
| Bachelor's Degree | $64,808 | $74,464 |
| Graduate Degree | - | - |
| Total | $49,250 | $32,086 |
Family Income in Dumas
Family Income Brackets in Dumas
According to the Dumas family income data, there are 743 families falling into the $100,000 to $149,999 income range, which is the most common income bracket and makes up 21.8% of all families. Conversely, the less than $10,000 income bracket is the least frequent group with only 72 families (2.1%) belonging to this category.
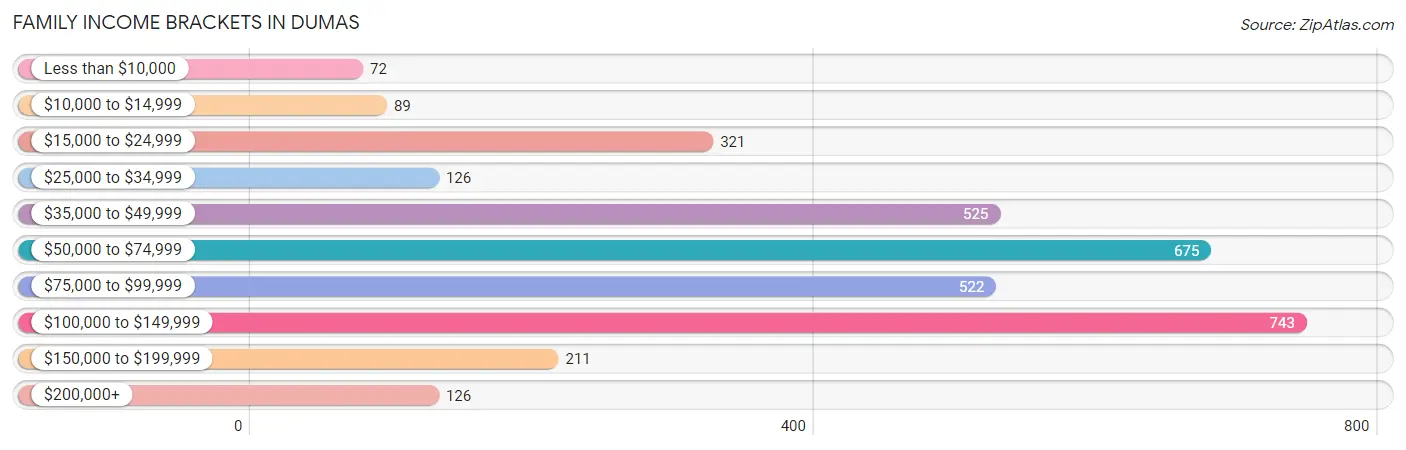
| Income Bracket | # Families | % Families |
| Less than $10,000 | 72 | 2.1% |
| $10,000 to $14,999 | 89 | 2.6% |
| $15,000 to $24,999 | 321 | 9.4% |
| $25,000 to $34,999 | 126 | 3.7% |
| $35,000 to $49,999 | 525 | 15.4% |
| $50,000 to $74,999 | 675 | 19.8% |
| $75,000 to $99,999 | 522 | 15.3% |
| $100,000 to $149,999 | 743 | 21.8% |
| $150,000 to $199,999 | 211 | 6.2% |
| $200,000+ | 126 | 3.7% |
Family Income by Famaliy Size in Dumas
5-person families (552 | 16.2%) account for the highest median family income in Dumas with $103,958 per family, while 2-person families (936 | 27.5%) have the highest median income of $46,250 per family member.
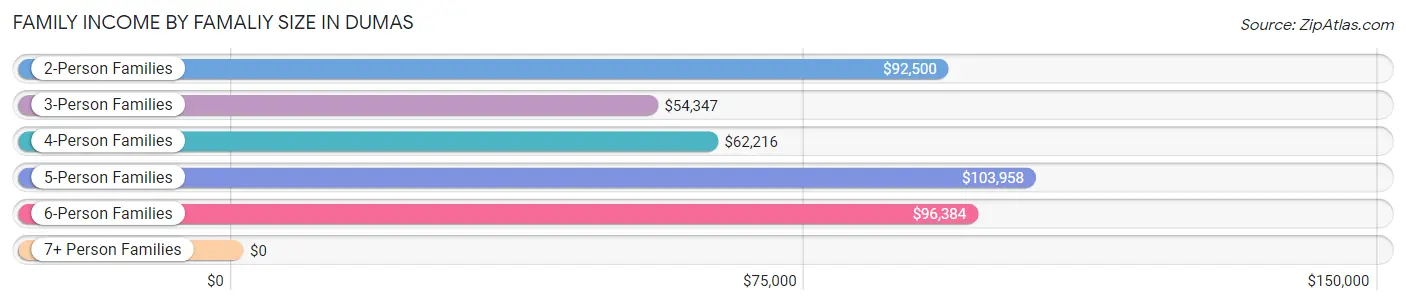
| Income Bracket | # Families | Median Income |
| 2-Person Families | 936 (27.5%) | $92,500 |
| 3-Person Families | 899 (26.4%) | $54,347 |
| 4-Person Families | 776 (22.8%) | $62,216 |
| 5-Person Families | 552 (16.2%) | $103,958 |
| 6-Person Families | 143 (4.2%) | $96,384 |
| 7+ Person Families | 104 (3.0%) | $0 |
| Total | 3,410 (100.0%) | $70,724 |
Family Income by Number of Earners in Dumas
The median family income in Dumas is $70,724, with families comprising 3+ earners (439) having the highest median family income of $123,495, while families with no earners (301) have the lowest median family income of $21,439, accounting for 12.9% and 8.8% of families, respectively.
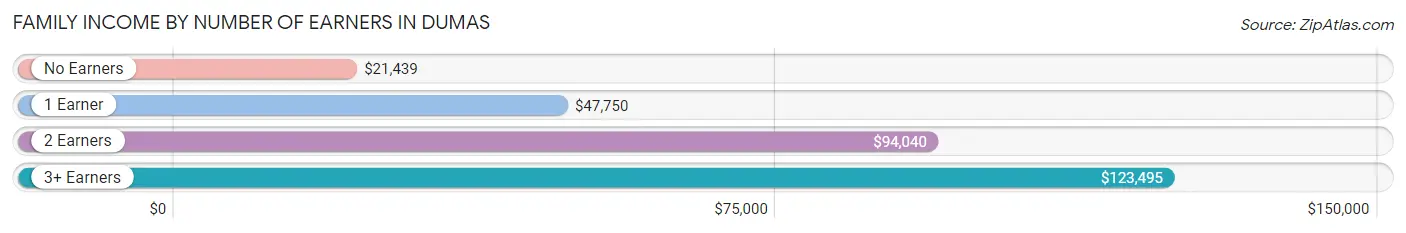
| Number of Earners | # Families | Median Income |
| No Earners | 301 (8.8%) | $21,439 |
| 1 Earner | 1,307 (38.3%) | $47,750 |
| 2 Earners | 1,363 (40.0%) | $94,040 |
| 3+ Earners | 439 (12.9%) | $123,495 |
| Total | 3,410 (100.0%) | $70,724 |
Household Income in Dumas
Household Income Brackets in Dumas
With 935 households falling in the category, the $50,000 to $74,999 income range is the most frequent in Dumas, accounting for 20.3% of all households. In contrast, only 60 households (1.3%) fall into the $10,000 to $14,999 income bracket, making it the least populous group.
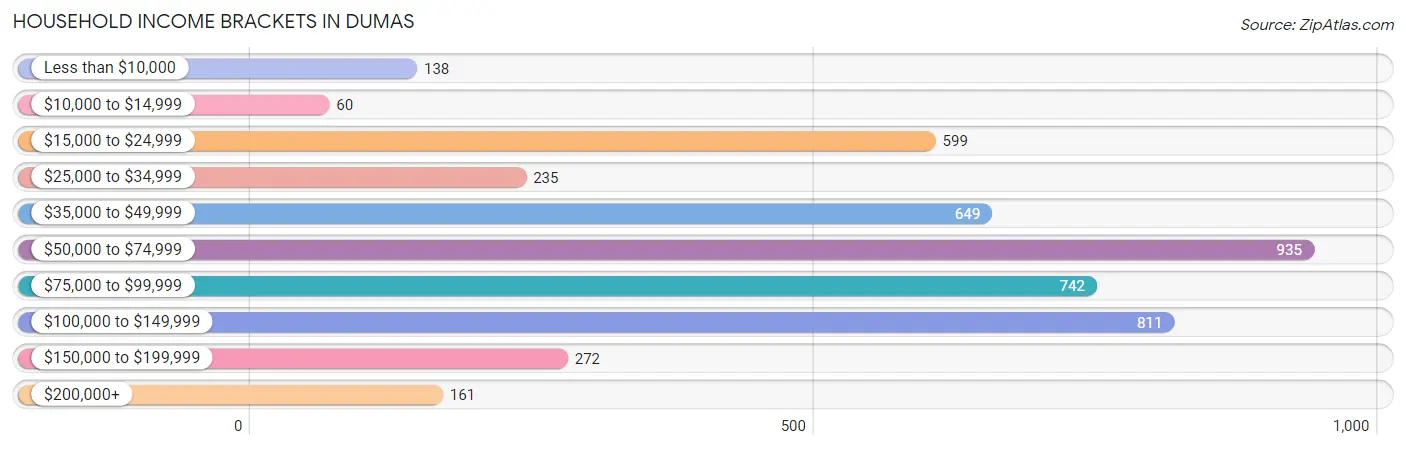
| Income Bracket | # Households | % Households |
| Less than $10,000 | 138 | 3.0% |
| $10,000 to $14,999 | 60 | 1.3% |
| $15,000 to $24,999 | 599 | 13.0% |
| $25,000 to $34,999 | 235 | 5.1% |
| $35,000 to $49,999 | 649 | 14.1% |
| $50,000 to $74,999 | 935 | 20.3% |
| $75,000 to $99,999 | 742 | 16.1% |
| $100,000 to $149,999 | 811 | 17.6% |
| $150,000 to $199,999 | 272 | 5.9% |
| $200,000+ | 161 | 3.5% |
Household Income by Householder Age in Dumas
The median household income in Dumas is $65,379, with the highest median household income of $81,711 found in the 45 to 64 years age bracket for the primary householder. A total of 1,460 households (31.7%) fall into this category. Meanwhile, the 65+ years age bracket for the primary householder has the lowest median household income of $47,653, with 1,023 households (22.2%) in this group.
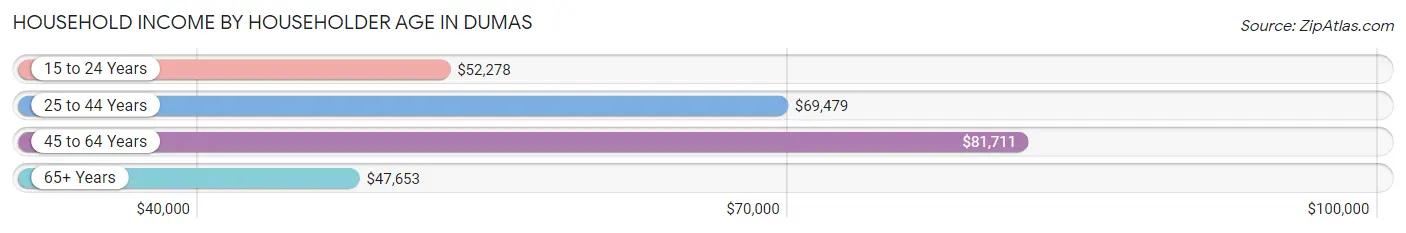
| Income Bracket | # Households | Median Income |
| 15 to 24 Years | 282 (6.1%) | $52,278 |
| 25 to 44 Years | 1,841 (40.0%) | $69,479 |
| 45 to 64 Years | 1,460 (31.7%) | $81,711 |
| 65+ Years | 1,023 (22.2%) | $47,653 |
| Total | 4,606 (100.0%) | $65,379 |
Poverty in Dumas
Income Below Poverty by Sex and Age in Dumas
With 13.2% poverty level for males and 15.2% for females among the residents of Dumas, 65 to 74 year old males and under 5 year old females are the most vulnerable to poverty, with 159 males (37.5%) and 261 females (43.7%) in their respective age groups living below the poverty level.
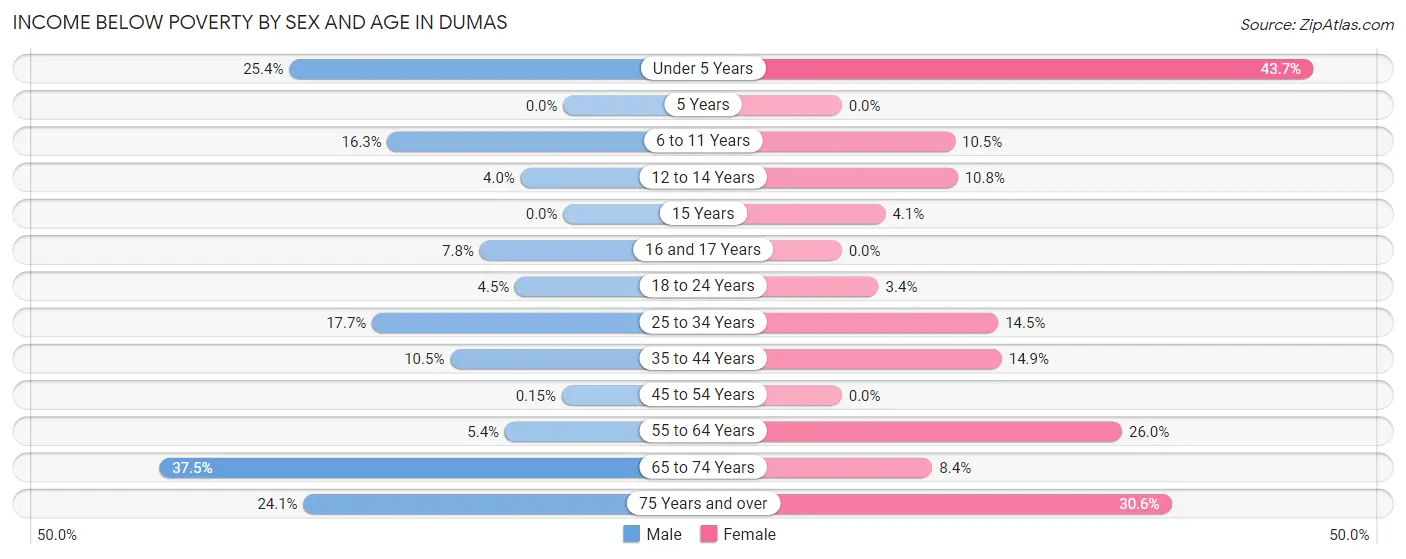
| Age Bracket | Male | Female |
| Under 5 Years | 160 (25.4%) | 261 (43.7%) |
| 5 Years | 0 (0.0%) | 0 (0.0%) |
| 6 to 11 Years | 188 (16.3%) | 94 (10.5%) |
| 12 to 14 Years | 18 (4.0%) | 24 (10.8%) |
| 15 Years | 0 (0.0%) | 7 (4.1%) |
| 16 and 17 Years | 19 (7.8%) | 0 (0.0%) |
| 18 to 24 Years | 32 (4.5%) | 25 (3.4%) |
| 25 to 34 Years | 188 (17.7%) | 140 (14.5%) |
| 35 to 44 Years | 107 (10.5%) | 125 (14.8%) |
| 45 to 54 Years | 1 (0.2%) | 0 (0.0%) |
| 55 to 64 Years | 37 (5.4%) | 193 (26.0%) |
| 65 to 74 Years | 159 (37.5%) | 43 (8.4%) |
| 75 Years and over | 75 (24.1%) | 111 (30.6%) |
| Total | 984 (13.2%) | 1,023 (15.2%) |
Income Above Poverty by Sex and Age in Dumas
According to the poverty statistics in Dumas, males aged 15 years and females aged 5 years are the age groups that are most secure financially, with 100.0% of males and 100.0% of females in these age groups living above the poverty line.
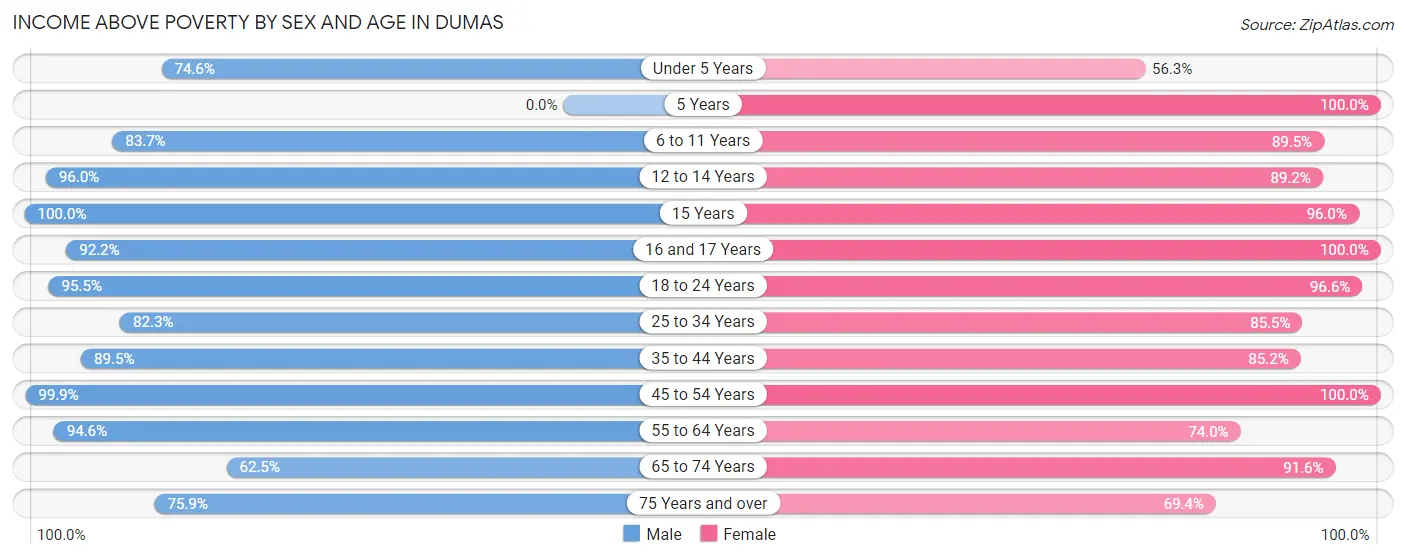
| Age Bracket | Male | Female |
| Under 5 Years | 469 (74.6%) | 336 (56.3%) |
| 5 Years | 0 (0.0%) | 80 (100.0%) |
| 6 to 11 Years | 965 (83.7%) | 800 (89.5%) |
| 12 to 14 Years | 436 (96.0%) | 199 (89.2%) |
| 15 Years | 85 (100.0%) | 166 (96.0%) |
| 16 and 17 Years | 226 (92.2%) | 144 (100.0%) |
| 18 to 24 Years | 684 (95.5%) | 705 (96.6%) |
| 25 to 34 Years | 872 (82.3%) | 824 (85.5%) |
| 35 to 44 Years | 912 (89.5%) | 717 (85.2%) |
| 45 to 54 Years | 675 (99.9%) | 483 (100.0%) |
| 55 to 64 Years | 646 (94.6%) | 549 (74.0%) |
| 65 to 74 Years | 265 (62.5%) | 468 (91.6%) |
| 75 Years and over | 236 (75.9%) | 252 (69.4%) |
| Total | 6,471 (86.8%) | 5,723 (84.8%) |
Income Below Poverty Among Married-Couple Families in Dumas
The poverty statistics for married-couple families in Dumas show that 11.9% or 288 of the total 2,429 families live below the poverty line. Families with 5 or more children have the highest poverty rate of 84.9%, comprising of 45 families. On the other hand, families with 1 or 2 children have the lowest poverty rate of 4.7%, which includes 44 families.
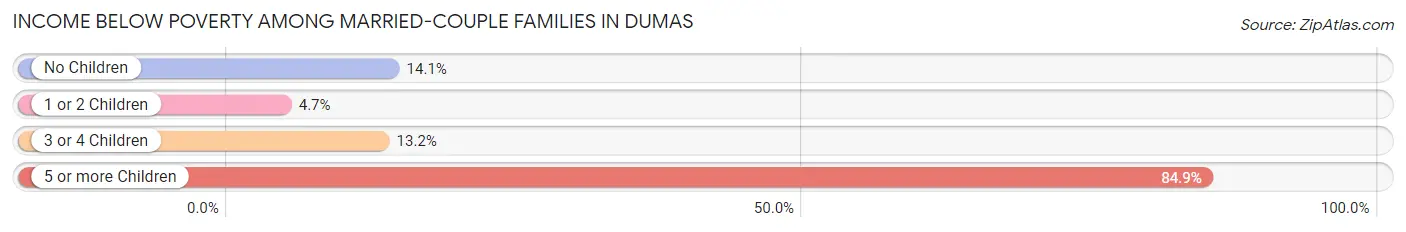
| Children | Above Poverty | Below Poverty |
| No Children | 928 (85.9%) | 152 (14.1%) |
| 1 or 2 Children | 896 (95.3%) | 44 (4.7%) |
| 3 or 4 Children | 309 (86.8%) | 47 (13.2%) |
| 5 or more Children | 8 (15.1%) | 45 (84.9%) |
| Total | 2,141 (88.1%) | 288 (11.9%) |
Income Below Poverty Among Single-Parent Households in Dumas
According to the poverty data in Dumas, 21.4% or 67 single-father households and 18.7% or 125 single-mother households are living below the poverty line. Among single-father households, those with 3 or 4 children have the highest poverty rate, with 18 households (62.1%) experiencing poverty. Likewise, among single-mother households, those with no children have the highest poverty rate, with 29 households (29.6%) falling below the poverty line.
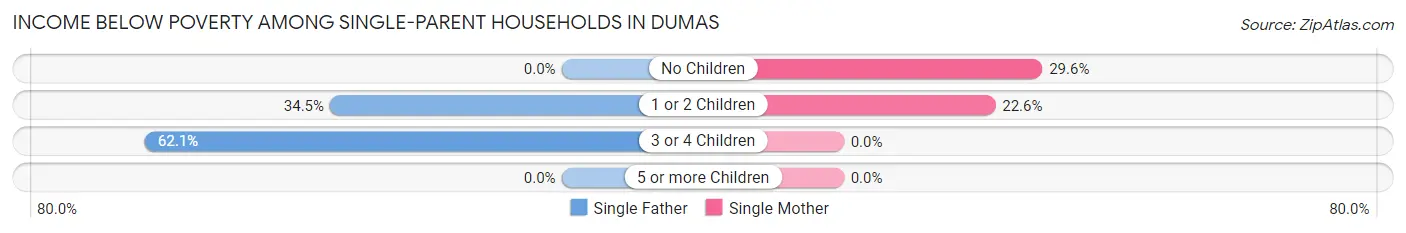
| Children | Single Father | Single Mother |
| No Children | 0 (0.0%) | 29 (29.6%) |
| 1 or 2 Children | 49 (34.5%) | 96 (22.6%) |
| 3 or 4 Children | 18 (62.1%) | 0 (0.0%) |
| 5 or more Children | 0 (0.0%) | 0 (0.0%) |
| Total | 67 (21.4%) | 125 (18.7%) |
Income Below Poverty Among Married-Couple vs Single-Parent Households in Dumas
The poverty data for Dumas shows that 288 of the married-couple family households (11.9%) and 192 of the single-parent households (19.6%) are living below the poverty level. Within the married-couple family households, those with 5 or more children have the highest poverty rate, with 45 households (84.9%) falling below the poverty line. Among the single-parent households, those with 1 or 2 children have the highest poverty rate, with 145 household (25.6%) living below poverty.
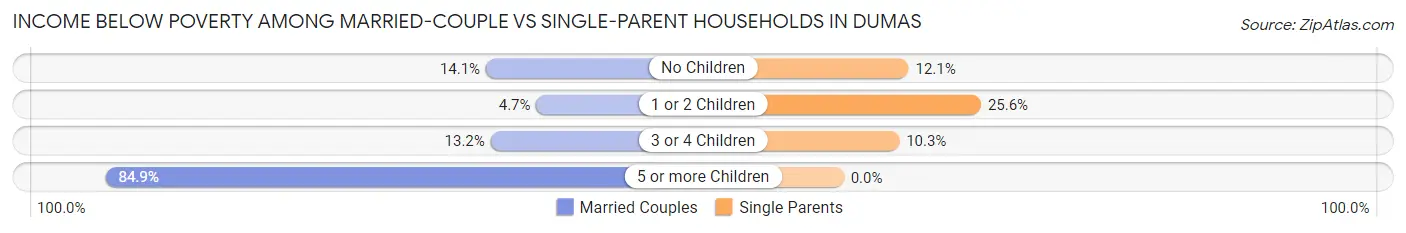
| Children | Married-Couple Families | Single-Parent Households |
| No Children | 152 (14.1%) | 29 (12.1%) |
| 1 or 2 Children | 44 (4.7%) | 145 (25.6%) |
| 3 or 4 Children | 47 (13.2%) | 18 (10.3%) |
| 5 or more Children | 45 (84.9%) | 0 (0.0%) |
| Total | 288 (11.9%) | 192 (19.6%) |
Race in Dumas
The most populous races in Dumas are White / Caucasian (9,165 | 63.6%), Hispanic or Latino (8,487 | 58.9%), and Two or more Races (2,526 | 17.5%).
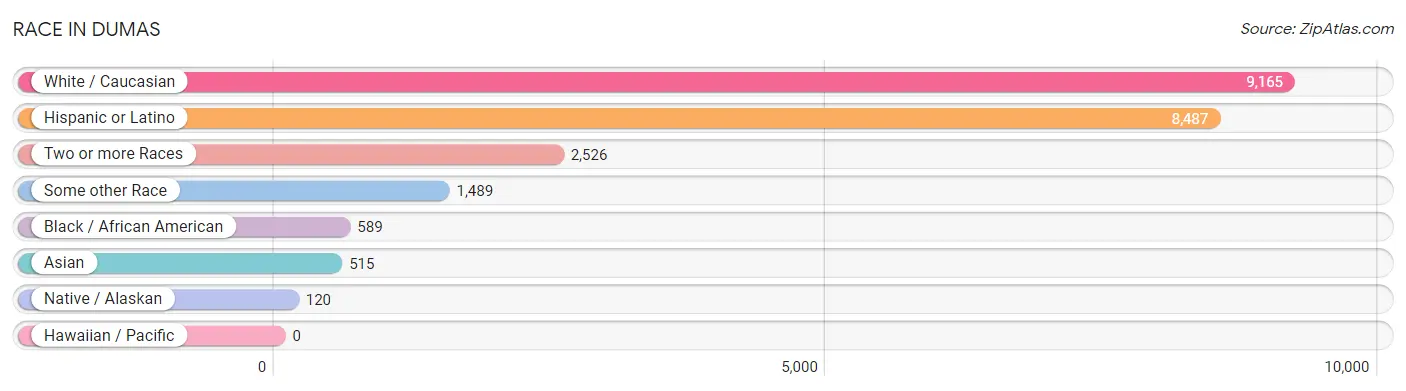
| Race | # Population | % Population |
| Asian | 515 | 3.6% |
| Black / African American | 589 | 4.1% |
| Hawaiian / Pacific | 0 | 0.0% |
| Hispanic or Latino | 8,487 | 58.9% |
| Native / Alaskan | 120 | 0.8% |
| White / Caucasian | 9,165 | 63.6% |
| Two or more Races | 2,526 | 17.5% |
| Some other Race | 1,489 | 10.3% |
| Total | 14,404 | 100.0% |
Ancestry in Dumas
The most populous ancestries reported in Dumas are Mexican (7,601 | 52.8%), German (806 | 5.6%), English (778 | 5.4%), Cuban (438 | 3.0%), and Malaysian (370 | 2.6%), together accounting for 69.4% of all Dumas residents.
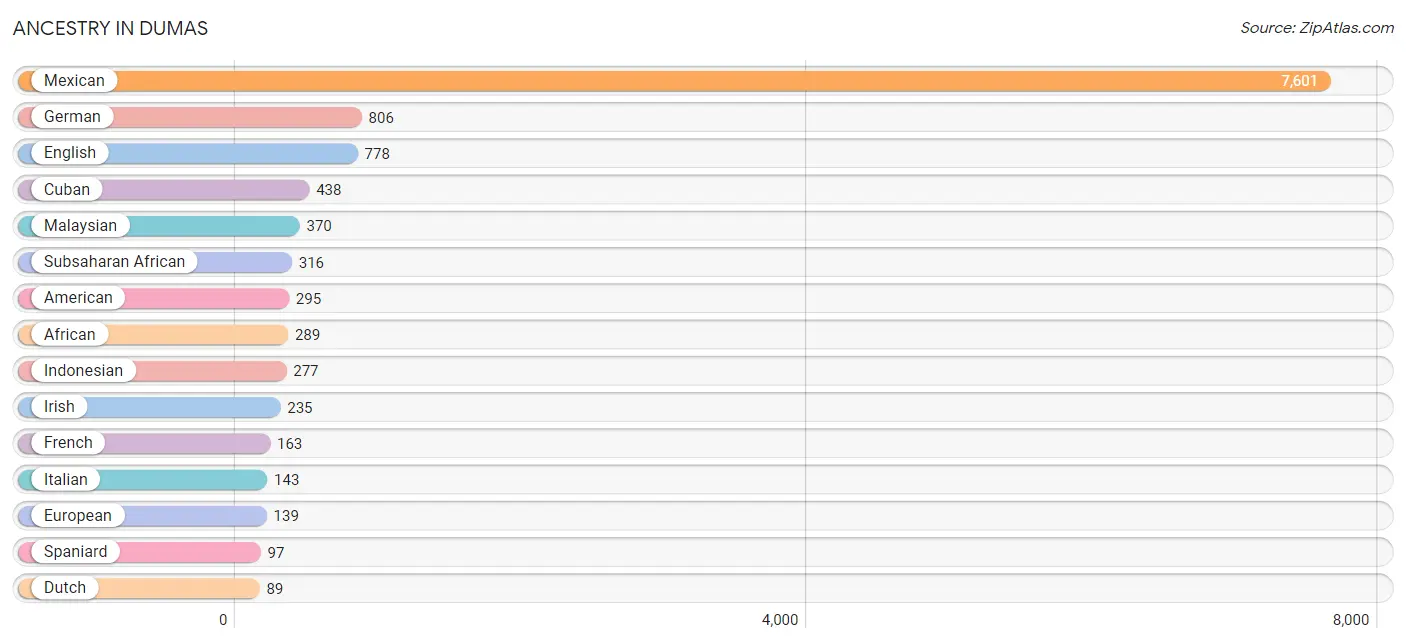
| Ancestry | # Population | % Population |
| African | 289 | 2.0% |
| American | 295 | 2.1% |
| Bhutanese | 3 | 0.0% |
| British | 70 | 0.5% |
| Burmese | 3 | 0.0% |
| Central American | 54 | 0.4% |
| Cherokee | 31 | 0.2% |
| Chilean | 40 | 0.3% |
| Chippewa | 9 | 0.1% |
| Choctaw | 16 | 0.1% |
| Colombian | 10 | 0.1% |
| Cuban | 438 | 3.0% |
| Czech | 47 | 0.3% |
| Danish | 11 | 0.1% |
| Dutch | 89 | 0.6% |
| Dutch West Indian | 11 | 0.1% |
| English | 778 | 5.4% |
| European | 139 | 1.0% |
| French | 163 | 1.1% |
| German | 806 | 5.6% |
| Guatemalan | 45 | 0.3% |
| Indonesian | 277 | 1.9% |
| Irish | 235 | 1.6% |
| Italian | 143 | 1.0% |
| Lithuanian | 13 | 0.1% |
| Malaysian | 370 | 2.6% |
| Mexican | 7,601 | 52.8% |
| Mexican American Indian | 57 | 0.4% |
| Nigerian | 27 | 0.2% |
| Norwegian | 19 | 0.1% |
| Pakistani | 49 | 0.3% |
| Portuguese | 14 | 0.1% |
| Salvadoran | 9 | 0.1% |
| Scotch-Irish | 54 | 0.4% |
| Scottish | 47 | 0.3% |
| South American | 50 | 0.4% |
| Spaniard | 97 | 0.7% |
| Subsaharan African | 316 | 2.2% |
| Swedish | 28 | 0.2% |
| Thai | 34 | 0.2% |
| Ukrainian | 10 | 0.1% |
| Welsh | 9 | 0.1% | View All 42 Rows |
Immigrants in Dumas
The most numerous immigrant groups reported in Dumas came from Latin America (2,440 | 16.9%), Central America (2,001 | 13.9%), Mexico (1,956 | 13.6%), Asia (368 | 2.5%), and South Eastern Asia (365 | 2.5%), together accounting for 49.5% of all Dumas residents.
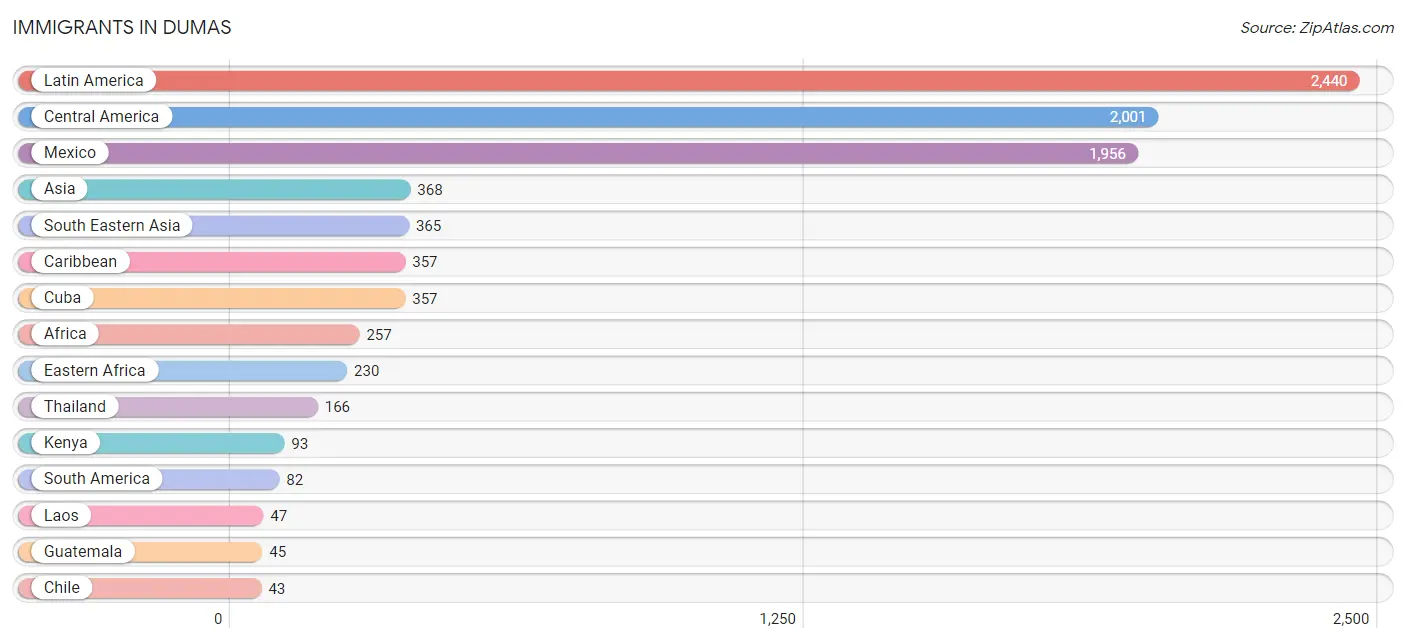
| Immigration Origin | # Population | % Population |
| Africa | 257 | 1.8% |
| Asia | 368 | 2.5% |
| Brazil | 23 | 0.2% |
| Caribbean | 357 | 2.5% |
| Central America | 2,001 | 13.9% |
| Chile | 43 | 0.3% |
| Colombia | 16 | 0.1% |
| Cuba | 357 | 2.5% |
| Eastern Africa | 230 | 1.6% |
| Eastern Asia | 3 | 0.0% |
| Eritrea | 11 | 0.1% |
| Europe | 30 | 0.2% |
| France | 30 | 0.2% |
| Guatemala | 45 | 0.3% |
| Kenya | 93 | 0.6% |
| Korea | 3 | 0.0% |
| Laos | 47 | 0.3% |
| Latin America | 2,440 | 16.9% |
| Malaysia | 34 | 0.2% |
| Mexico | 1,956 | 13.6% |
| Nigeria | 27 | 0.2% |
| South America | 82 | 0.6% |
| South Eastern Asia | 365 | 2.5% |
| Thailand | 166 | 1.1% |
| Western Africa | 27 | 0.2% |
| Western Europe | 30 | 0.2% | View All 26 Rows |
Sex and Age in Dumas
Sex and Age in Dumas
The most populous age groups in Dumas are 5 to 9 Years (814 | 10.8%) for men and 5 to 9 Years (730 | 10.6%) for women.
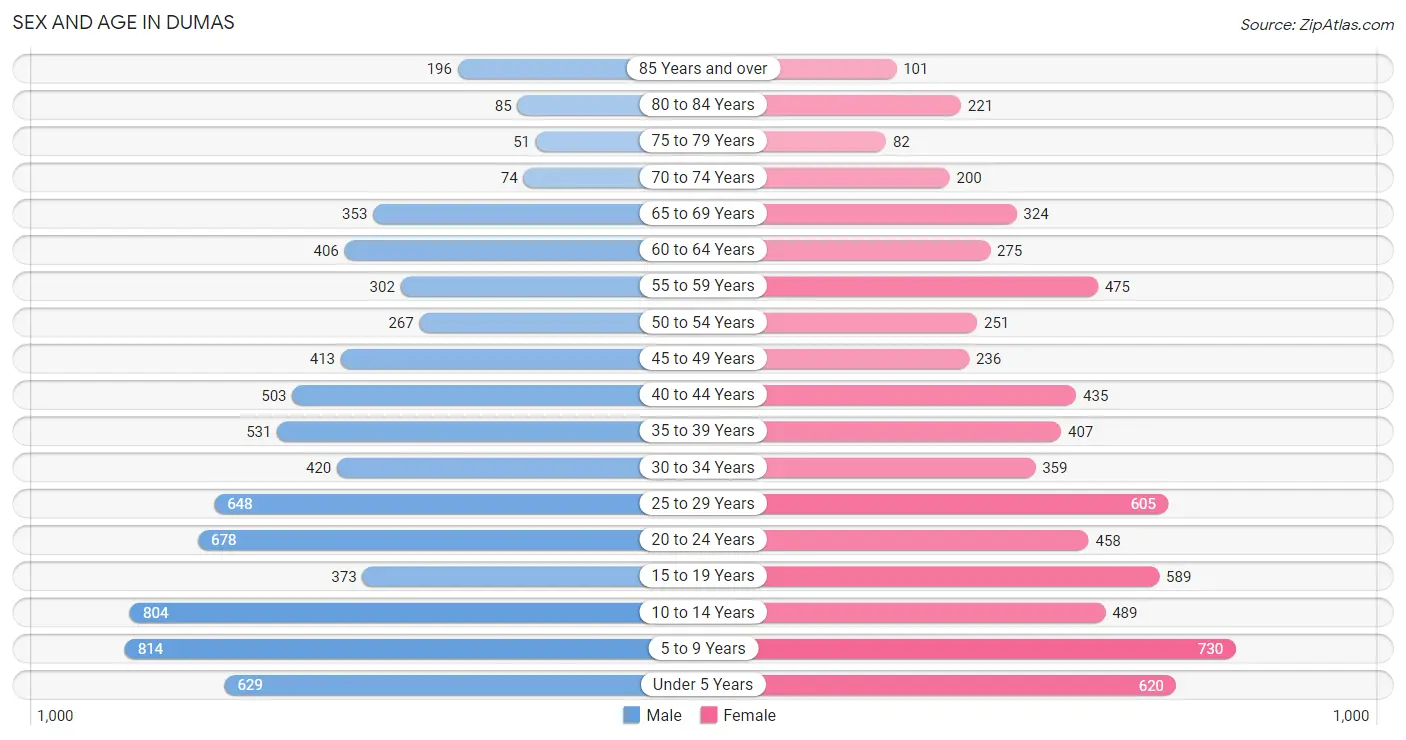
| Age Bracket | Male | Female |
| Under 5 Years | 629 (8.3%) | 620 (9.0%) |
| 5 to 9 Years | 814 (10.8%) | 730 (10.6%) |
| 10 to 14 Years | 804 (10.6%) | 489 (7.1%) |
| 15 to 19 Years | 373 (4.9%) | 589 (8.6%) |
| 20 to 24 Years | 678 (9.0%) | 458 (6.7%) |
| 25 to 29 Years | 648 (8.6%) | 605 (8.8%) |
| 30 to 34 Years | 420 (5.6%) | 359 (5.2%) |
| 35 to 39 Years | 531 (7.0%) | 407 (5.9%) |
| 40 to 44 Years | 503 (6.7%) | 435 (6.3%) |
| 45 to 49 Years | 413 (5.5%) | 236 (3.4%) |
| 50 to 54 Years | 267 (3.5%) | 251 (3.7%) |
| 55 to 59 Years | 302 (4.0%) | 475 (6.9%) |
| 60 to 64 Years | 406 (5.4%) | 275 (4.0%) |
| 65 to 69 Years | 353 (4.7%) | 324 (4.7%) |
| 70 to 74 Years | 74 (1.0%) | 200 (2.9%) |
| 75 to 79 Years | 51 (0.7%) | 82 (1.2%) |
| 80 to 84 Years | 85 (1.1%) | 221 (3.2%) |
| 85 Years and over | 196 (2.6%) | 101 (1.5%) |
| Total | 7,547 (100.0%) | 6,857 (100.0%) |
Families and Households in Dumas
Median Family Size in Dumas
The median family size in Dumas is 3.67 persons per family, with married-couple families (2,429 | 71.2%) accounting for the largest median family size of 3.8 persons per family. On the other hand, single male/father families (313 | 9.2%) represent the smallest median family size with 2.55 persons per family.
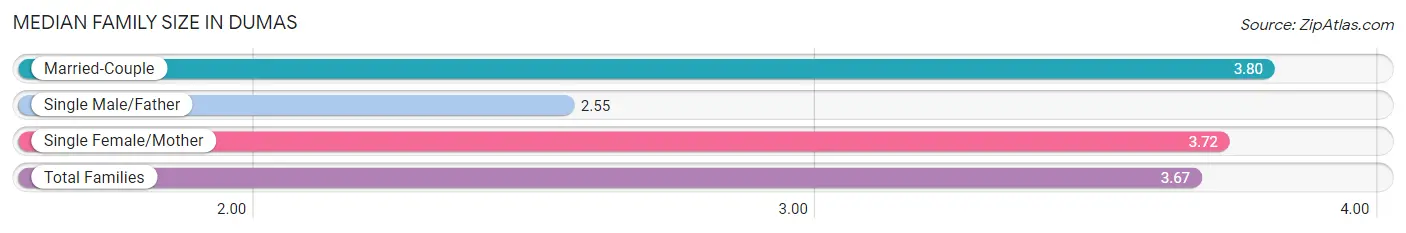
| Family Type | # Families | Family Size |
| Married-Couple | 2,429 (71.2%) | 3.80 |
| Single Male/Father | 313 (9.2%) | 2.55 |
| Single Female/Mother | 668 (19.6%) | 3.72 |
| Total Families | 3,410 (100.0%) | 3.67 |
Median Household Size in Dumas
The median household size in Dumas is 3.09 persons per household, with single female/mother households (668 | 14.5%) accounting for the largest median household size of 4.13 persons per household. non-family households (1,196 | 26.0%) represent the smallest median household size with 1.10 persons per household.
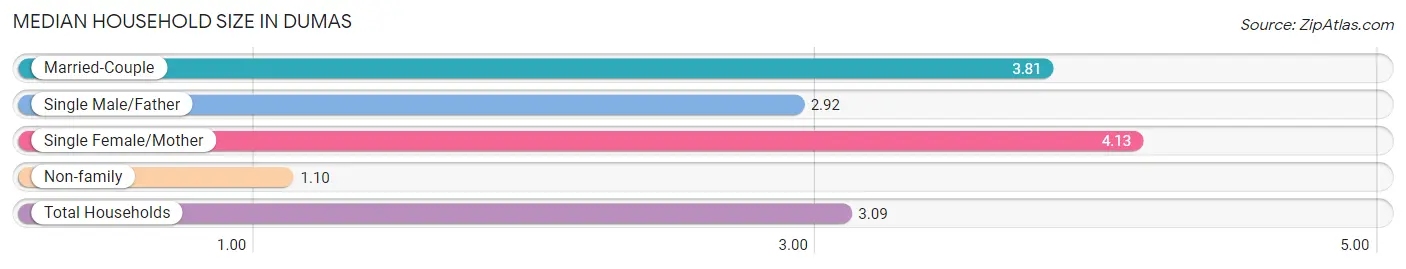
| Household Type | # Households | Household Size |
| Married-Couple | 2,429 (52.7%) | 3.81 |
| Single Male/Father | 313 (6.8%) | 2.92 |
| Single Female/Mother | 668 (14.5%) | 4.13 |
| Non-family | 1,196 (26.0%) | 1.10 |
| Total Households | 4,606 (100.0%) | 3.09 |
Household Size by Marriage Status in Dumas
Out of a total of 4,606 households in Dumas, 3,410 (74.0%) are family households, while 1,196 (26.0%) are nonfamily households. The most numerous type of family households are 2-person households, comprising 874, and the most common type of nonfamily households are 1-person households, comprising 1,129.
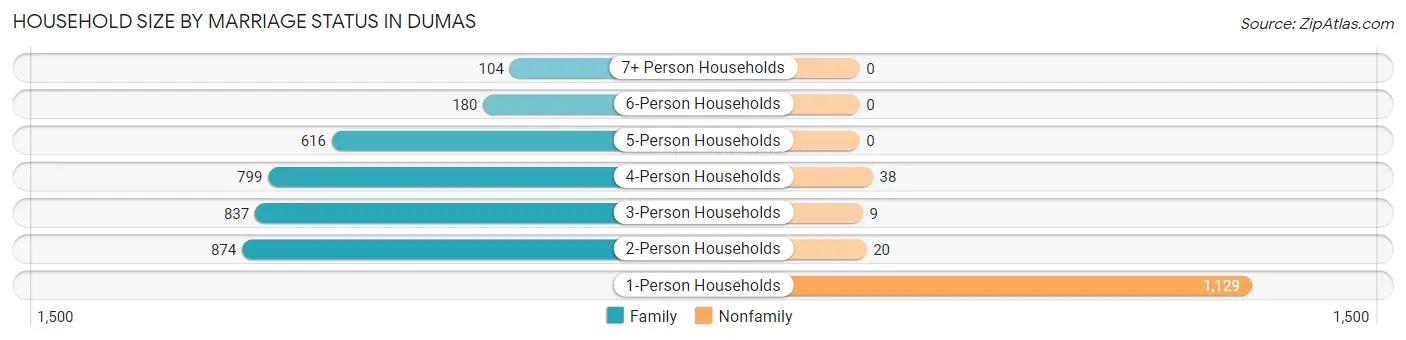
| Household Size | Family Households | Nonfamily Households |
| 1-Person Households | - | 1,129 (24.5%) |
| 2-Person Households | 874 (19.0%) | 20 (0.4%) |
| 3-Person Households | 837 (18.2%) | 9 (0.2%) |
| 4-Person Households | 799 (17.3%) | 38 (0.8%) |
| 5-Person Households | 616 (13.4%) | 0 (0.0%) |
| 6-Person Households | 180 (3.9%) | 0 (0.0%) |
| 7+ Person Households | 104 (2.3%) | 0 (0.0%) |
| Total | 3,410 (74.0%) | 1,196 (26.0%) |
Female Fertility in Dumas
Fertility by Age in Dumas
Average fertility rate in Dumas is 57.0 births per 1,000 women. Women in the age bracket of 20 to 34 years have the highest fertility rate with 118.0 births per 1,000 women. Women in the age bracket of 20 to 34 years acount for 91.8% of all women with births.
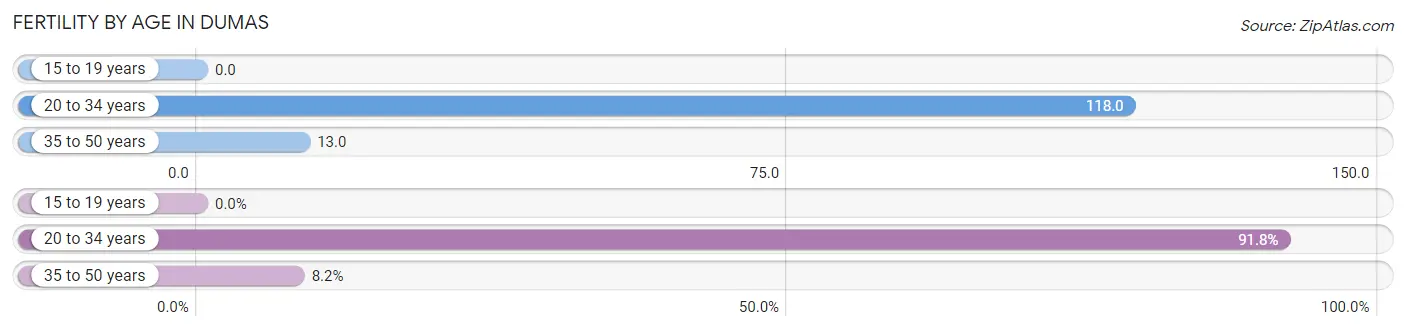
| Age Bracket | Women with Births | Births / 1,000 Women |
| 15 to 19 years | 0 (0.0%) | 0.0 |
| 20 to 34 years | 168 (91.8%) | 118.0 |
| 35 to 50 years | 15 (8.2%) | 13.0 |
| Total | 183 (100.0%) | 57.0 |
Fertility by Age by Marriage Status in Dumas
59.6% of women with births (183) in Dumas are married. The highest percentage of unmarried women with births falls into 35 to 50 years age bracket with 73.3% of them unmarried at the time of birth, while the lowest percentage of unmarried women with births belong to 20 to 34 years age bracket with 37.5% of them unmarried.
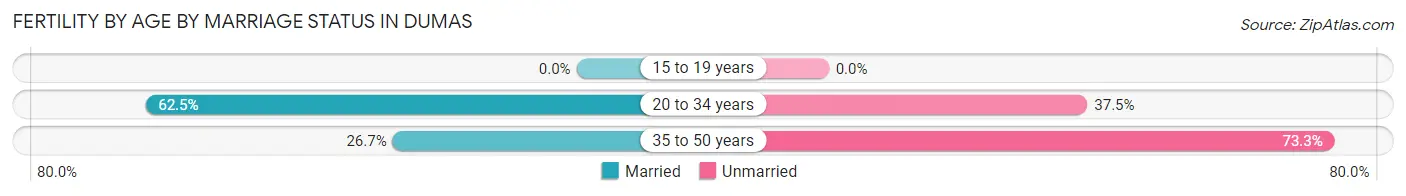
| Age Bracket | Married | Unmarried |
| 15 to 19 years | 0 (0.0%) | 0 (0.0%) |
| 20 to 34 years | 105 (62.5%) | 63 (37.5%) |
| 35 to 50 years | 4 (26.7%) | 11 (73.3%) |
| Total | 109 (59.6%) | 74 (40.4%) |
Fertility by Education in Dumas
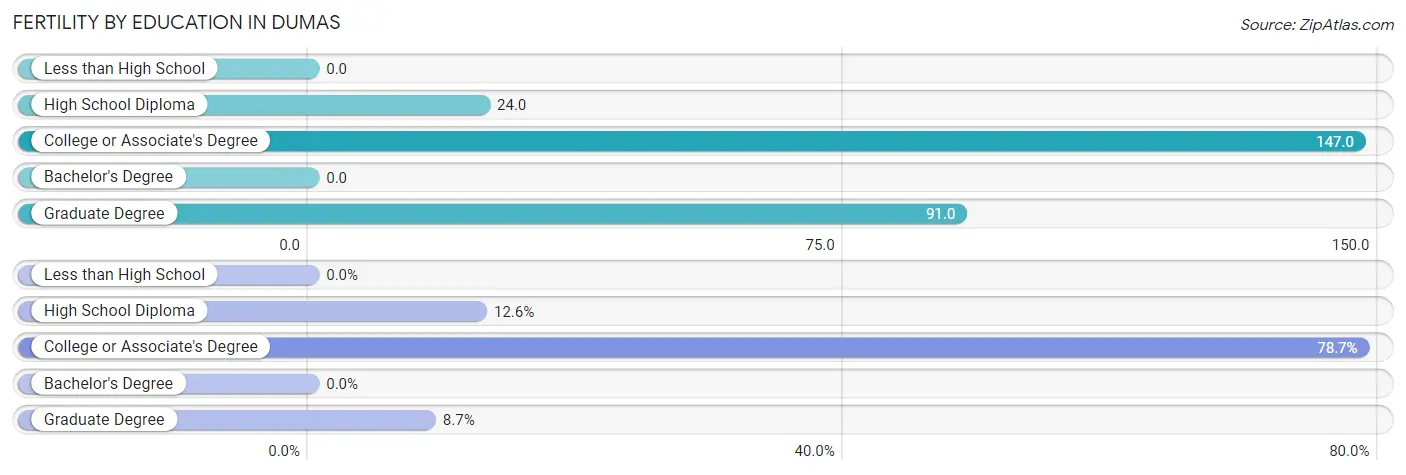
| Educational Attainment | Women with Births | Births / 1,000 Women |
| Less than High School | 0 (0.0%) | 0.0 |
| High School Diploma | 23 (12.6%) | 24.0 |
| College or Associate's Degree | 144 (78.7%) | 147.0 |
| Bachelor's Degree | 0 (0.0%) | 0.0 |
| Graduate Degree | 16 (8.7%) | 91.0 |
| Total | 183 (100.0%) | 57.0 |
Fertility by Education by Marriage Status in Dumas
40.4% of women with births in Dumas are unmarried. Women with the educational attainment of high school diploma are most likely to be married with 100.0% of them married at childbirth, while women with the educational attainment of college or associate's degree are least likely to be married with 51.4% of them unmarried at childbirth.
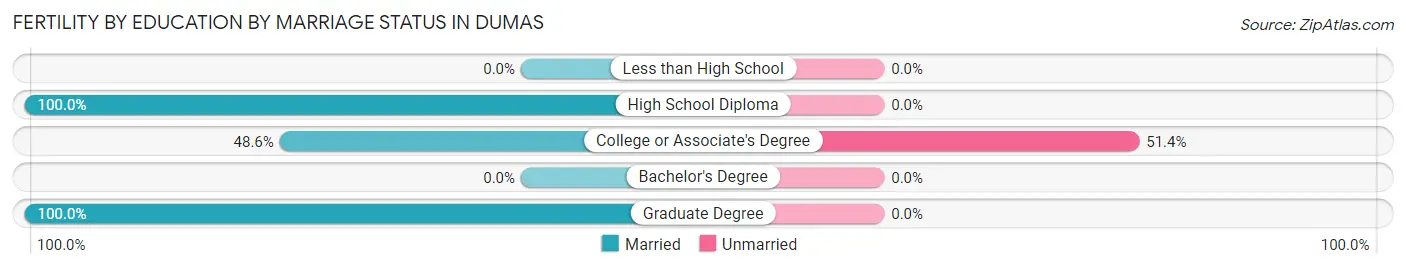
| Educational Attainment | Married | Unmarried |
| Less than High School | 0 (0.0%) | 0 (0.0%) |
| High School Diploma | 23 (100.0%) | 0 (0.0%) |
| College or Associate's Degree | 70 (48.6%) | 74 (51.4%) |
| Bachelor's Degree | 0 (0.0%) | 0 (0.0%) |
| Graduate Degree | 16 (100.0%) | 0 (0.0%) |
| Total | 109 (59.6%) | 74 (40.4%) |
Employment Characteristics in Dumas
Employment by Class of Employer in Dumas
Among the 6,564 employed individuals in Dumas, private company employees (4,983 | 75.9%), local government employees (577 | 8.8%), and state government employees (278 | 4.2%) make up the most common classes of employment.
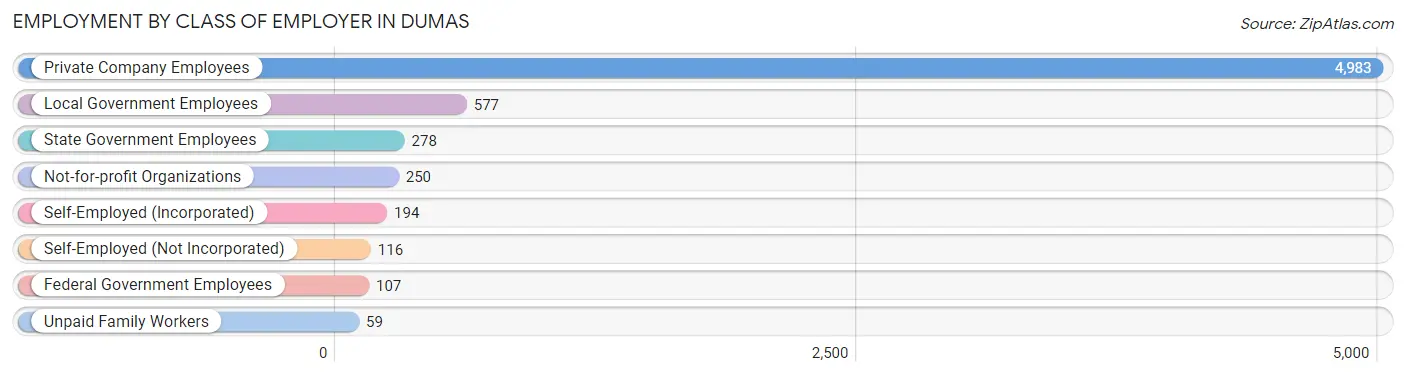
| Employer Class | # Employees | % Employees |
| Private Company Employees | 4,983 | 75.9% |
| Self-Employed (Incorporated) | 194 | 3.0% |
| Self-Employed (Not Incorporated) | 116 | 1.8% |
| Not-for-profit Organizations | 250 | 3.8% |
| Local Government Employees | 577 | 8.8% |
| State Government Employees | 278 | 4.2% |
| Federal Government Employees | 107 | 1.6% |
| Unpaid Family Workers | 59 | 0.9% |
| Total | 6,564 | 100.0% |
Employment Status by Age in Dumas
According to the labor force statistics for Dumas, out of the total population over 16 years of age (10,060), 67.1% or 6,750 individuals are in the labor force, with 2.3% or 155 of them unemployed. The age group with the highest labor force participation rate is 30 to 34 years, with 89.6% or 698 individuals in the labor force. Within the labor force, the 20 to 24 years age range has the highest percentage of unemployed individuals, with 5.8% or 48 of them being unemployed.
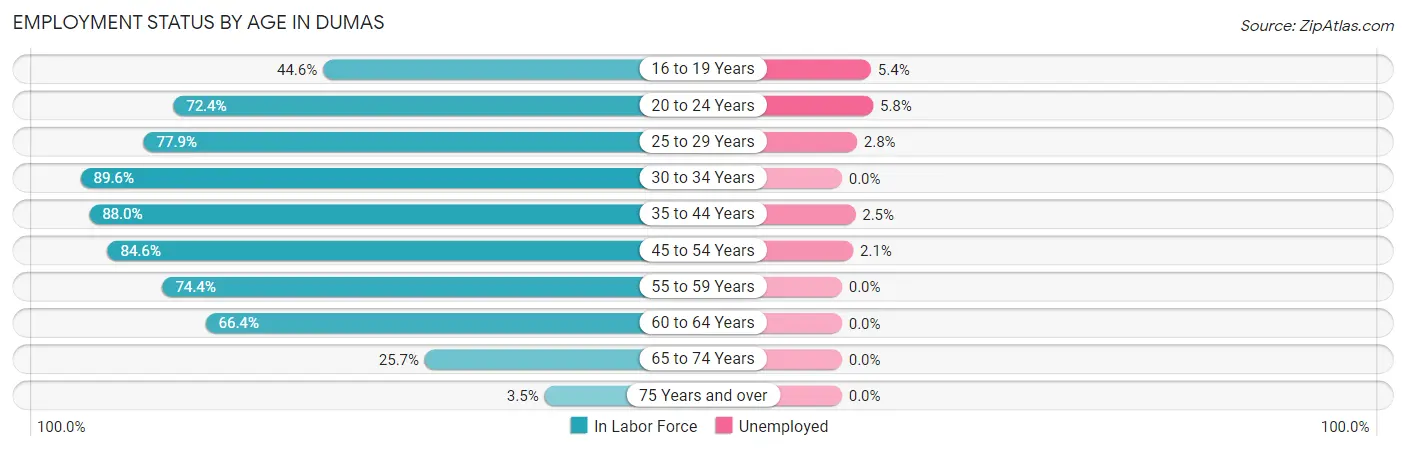
| Age Bracket | In Labor Force | Unemployed |
| 16 to 19 Years | 314 (44.6%) | 17 (5.4%) |
| 20 to 24 Years | 822 (72.4%) | 48 (5.8%) |
| 25 to 29 Years | 976 (77.9%) | 27 (2.8%) |
| 30 to 34 Years | 698 (89.6%) | 0 (0.0%) |
| 35 to 44 Years | 1,651 (88.0%) | 41 (2.5%) |
| 45 to 54 Years | 987 (84.6%) | 21 (2.1%) |
| 55 to 59 Years | 578 (74.4%) | 0 (0.0%) |
| 60 to 64 Years | 452 (66.4%) | 0 (0.0%) |
| 65 to 74 Years | 244 (25.7%) | 0 (0.0%) |
| 75 Years and over | 26 (3.5%) | 0 (0.0%) |
| Total | 6,750 (67.1%) | 155 (2.3%) |
Employment Status by Educational Attainment in Dumas
According to labor force statistics for Dumas, 81.8% of individuals (5,344) out of the total population between 25 and 64 years of age (6,533) are in the labor force, with 1.7% or 91 of them being unemployed. The group with the highest labor force participation rate are those with the educational attainment of bachelor's degree or higher, with 91.7% or 703 individuals in the labor force. Within the labor force, individuals with bachelor's degree or higher education have the highest percentage of unemployment, with 5.0% or 35 of them being unemployed.
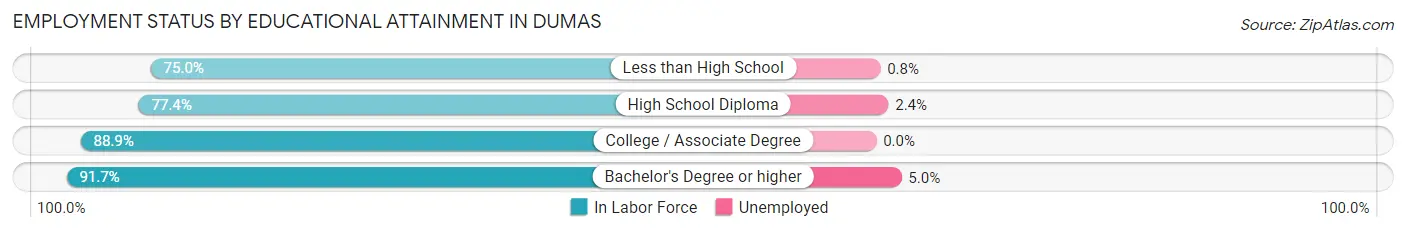
| Educational Attainment | In Labor Force | Unemployed |
| Less than High School | 1,183 (75.0%) | 13 (0.8%) |
| High School Diploma | 1,812 (77.4%) | 56 (2.4%) |
| College / Associate Degree | 1,643 (88.9%) | 0 (0.0%) |
| Bachelor's Degree or higher | 703 (91.7%) | 38 (5.0%) |
| Total | 5,344 (81.8%) | 111 (1.7%) |
Employment Occupations by Sex in Dumas
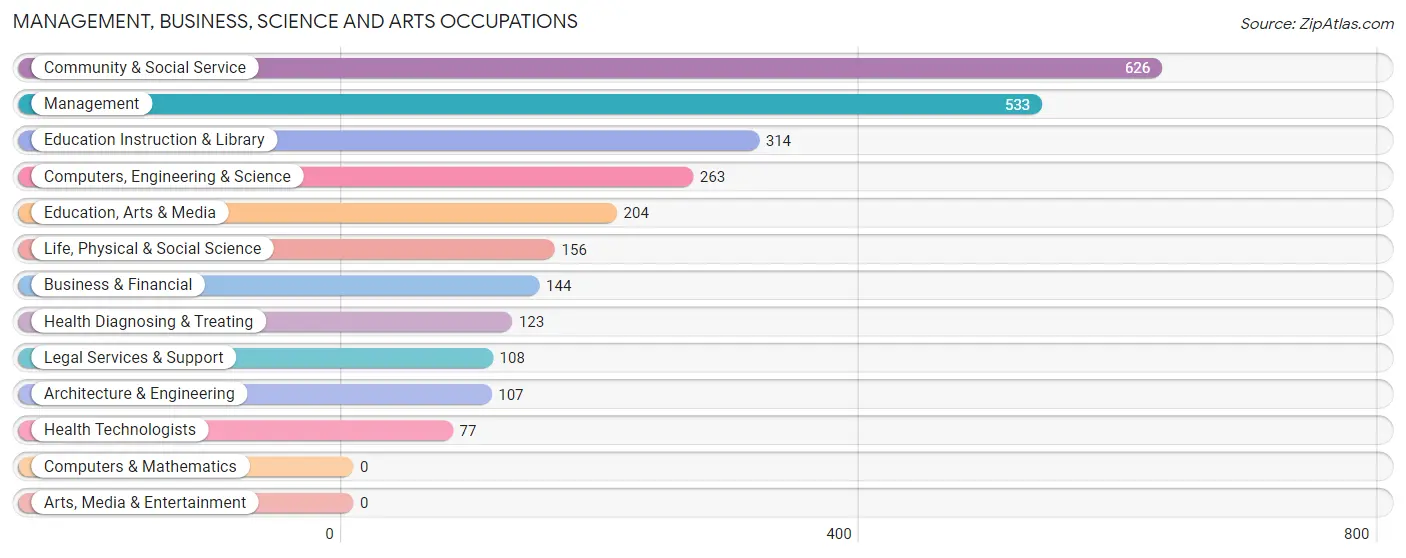
Management, Business, Science and Arts Occupations
The most common Management, Business, Science and Arts occupations in Dumas are Community & Social Service (626 | 9.5%), Management (533 | 8.1%), Education Instruction & Library (314 | 4.8%), Computers, Engineering & Science (263 | 4.0%), and Education, Arts & Media (204 | 3.1%).
Management, Business, Science and Arts Occupations by Sex
Within the Management, Business, Science and Arts occupations in Dumas, the most male-oriented occupations are Computers, Engineering & Science (100.0%), Architecture & Engineering (100.0%), and Life, Physical & Social Science (100.0%), while the most female-oriented occupations are Health Diagnosing & Treating (100.0%), Health Technologists (100.0%), and Legal Services & Support (78.7%).
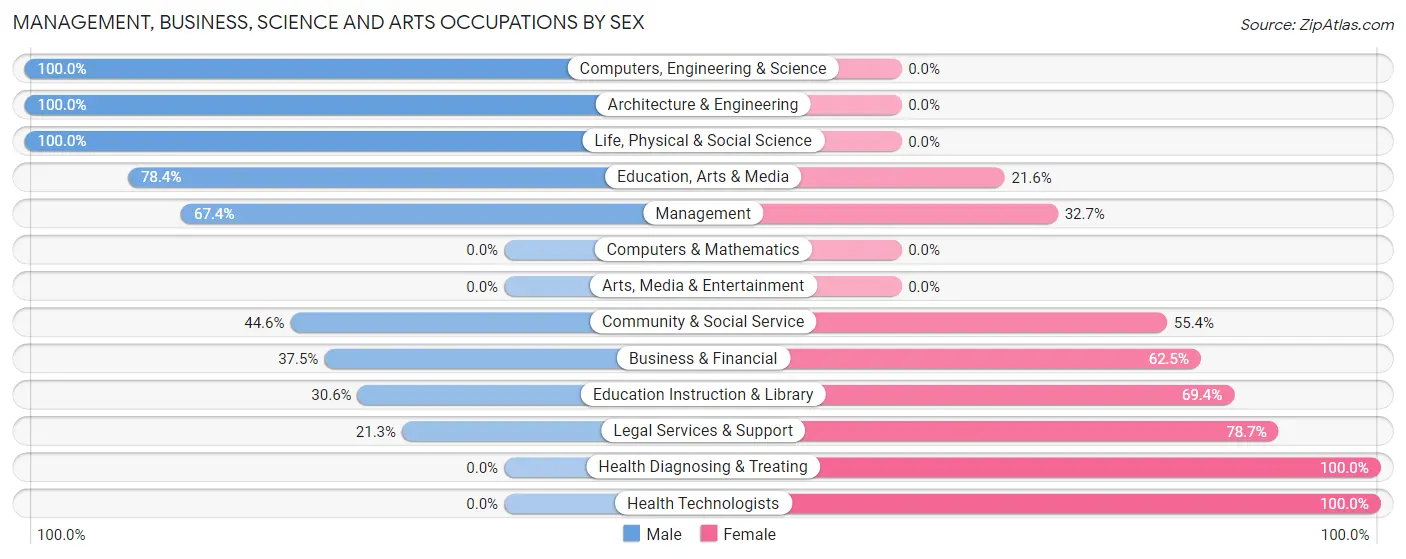
| Occupation | Male | Female |
| Management | 359 (67.3%) | 174 (32.7%) |
| Business & Financial | 54 (37.5%) | 90 (62.5%) |
| Computers, Engineering & Science | 263 (100.0%) | 0 (0.0%) |
| Computers & Mathematics | 0 (0.0%) | 0 (0.0%) |
| Architecture & Engineering | 107 (100.0%) | 0 (0.0%) |
| Life, Physical & Social Science | 156 (100.0%) | 0 (0.0%) |
| Community & Social Service | 279 (44.6%) | 347 (55.4%) |
| Education, Arts & Media | 160 (78.4%) | 44 (21.6%) |
| Legal Services & Support | 23 (21.3%) | 85 (78.7%) |
| Education Instruction & Library | 96 (30.6%) | 218 (69.4%) |
| Arts, Media & Entertainment | 0 (0.0%) | 0 (0.0%) |
| Health Diagnosing & Treating | 0 (0.0%) | 123 (100.0%) |
| Health Technologists | 0 (0.0%) | 77 (100.0%) |
| Total (Category) | 955 (56.5%) | 734 (43.5%) |
| Total (Overall) | 3,874 (58.8%) | 2,719 (41.2%) |
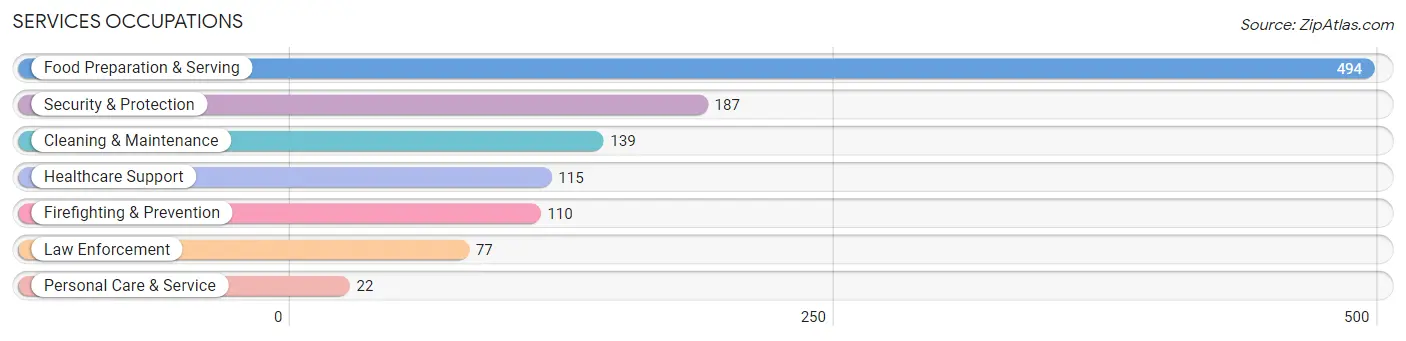
Services Occupations
The most common Services occupations in Dumas are Food Preparation & Serving (494 | 7.5%), Security & Protection (187 | 2.8%), Cleaning & Maintenance (139 | 2.1%), Healthcare Support (115 | 1.7%), and Firefighting & Prevention (110 | 1.7%).
Services Occupations by Sex
Within the Services occupations in Dumas, the most male-oriented occupations are Law Enforcement (100.0%), Security & Protection (79.1%), and Cleaning & Maintenance (67.6%), while the most female-oriented occupations are Personal Care & Service (90.9%), Food Preparation & Serving (67.4%), and Healthcare Support (57.4%).
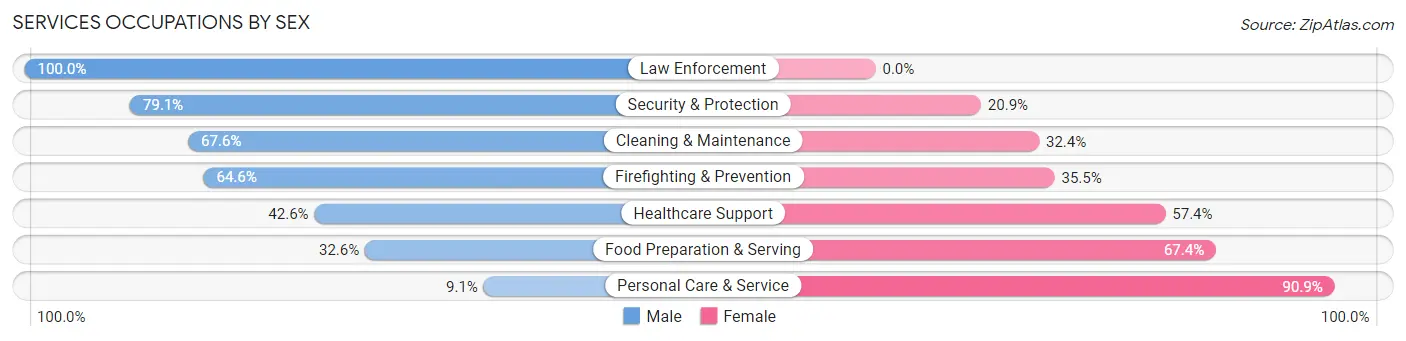
| Occupation | Male | Female |
| Healthcare Support | 49 (42.6%) | 66 (57.4%) |
| Security & Protection | 148 (79.1%) | 39 (20.9%) |
| Firefighting & Prevention | 71 (64.5%) | 39 (35.4%) |
| Law Enforcement | 77 (100.0%) | 0 (0.0%) |
| Food Preparation & Serving | 161 (32.6%) | 333 (67.4%) |
| Cleaning & Maintenance | 94 (67.6%) | 45 (32.4%) |
| Personal Care & Service | 2 (9.1%) | 20 (90.9%) |
| Total (Category) | 454 (47.4%) | 503 (52.6%) |
| Total (Overall) | 3,874 (58.8%) | 2,719 (41.2%) |
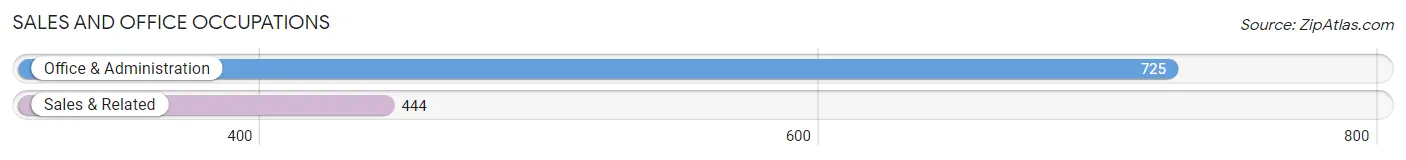
Sales and Office Occupations
The most common Sales and Office occupations in Dumas are Office & Administration (725 | 11.0%), and Sales & Related (444 | 6.7%).
Sales and Office Occupations by Sex
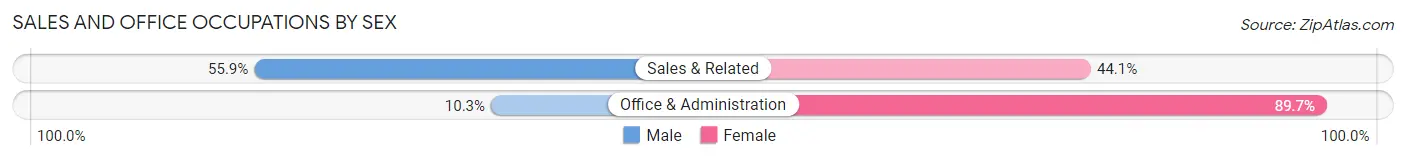
| Occupation | Male | Female |
| Sales & Related | 248 (55.9%) | 196 (44.1%) |
| Office & Administration | 75 (10.3%) | 650 (89.7%) |
| Total (Category) | 323 (27.6%) | 846 (72.4%) |
| Total (Overall) | 3,874 (58.8%) | 2,719 (41.2%) |
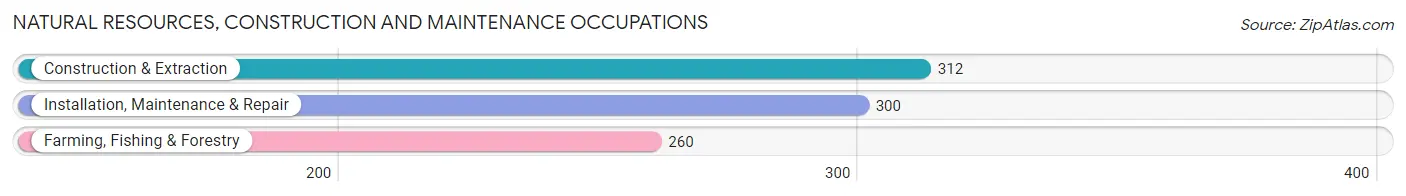
Natural Resources, Construction and Maintenance Occupations
The most common Natural Resources, Construction and Maintenance occupations in Dumas are Construction & Extraction (312 | 4.7%), Installation, Maintenance & Repair (300 | 4.5%), and Farming, Fishing & Forestry (260 | 3.9%).
Natural Resources, Construction and Maintenance Occupations by Sex
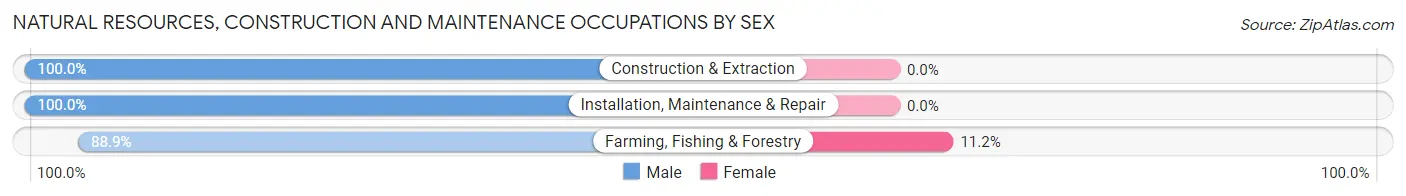
| Occupation | Male | Female |
| Farming, Fishing & Forestry | 231 (88.8%) | 29 (11.2%) |
| Construction & Extraction | 312 (100.0%) | 0 (0.0%) |
| Installation, Maintenance & Repair | 300 (100.0%) | 0 (0.0%) |
| Total (Category) | 843 (96.7%) | 29 (3.3%) |
| Total (Overall) | 3,874 (58.8%) | 2,719 (41.2%) |
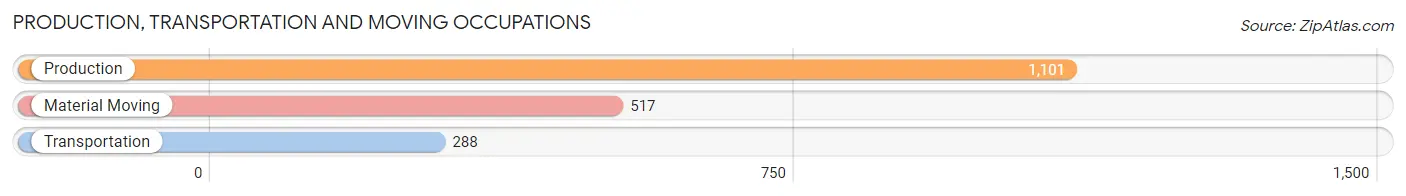
Production, Transportation and Moving Occupations
The most common Production, Transportation and Moving occupations in Dumas are Production (1,101 | 16.7%), Material Moving (517 | 7.8%), and Transportation (288 | 4.4%).
Production, Transportation and Moving Occupations by Sex
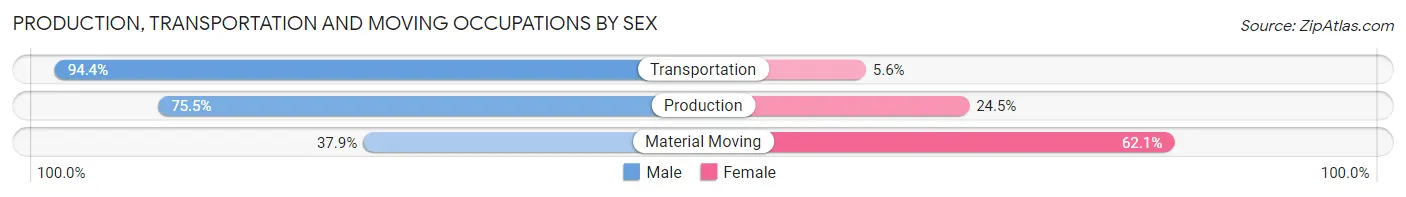
| Occupation | Male | Female |
| Production | 831 (75.5%) | 270 (24.5%) |
| Transportation | 272 (94.4%) | 16 (5.6%) |
| Material Moving | 196 (37.9%) | 321 (62.1%) |
| Total (Category) | 1,299 (68.1%) | 607 (31.9%) |
| Total (Overall) | 3,874 (58.8%) | 2,719 (41.2%) |
Employment Industries by Sex in Dumas
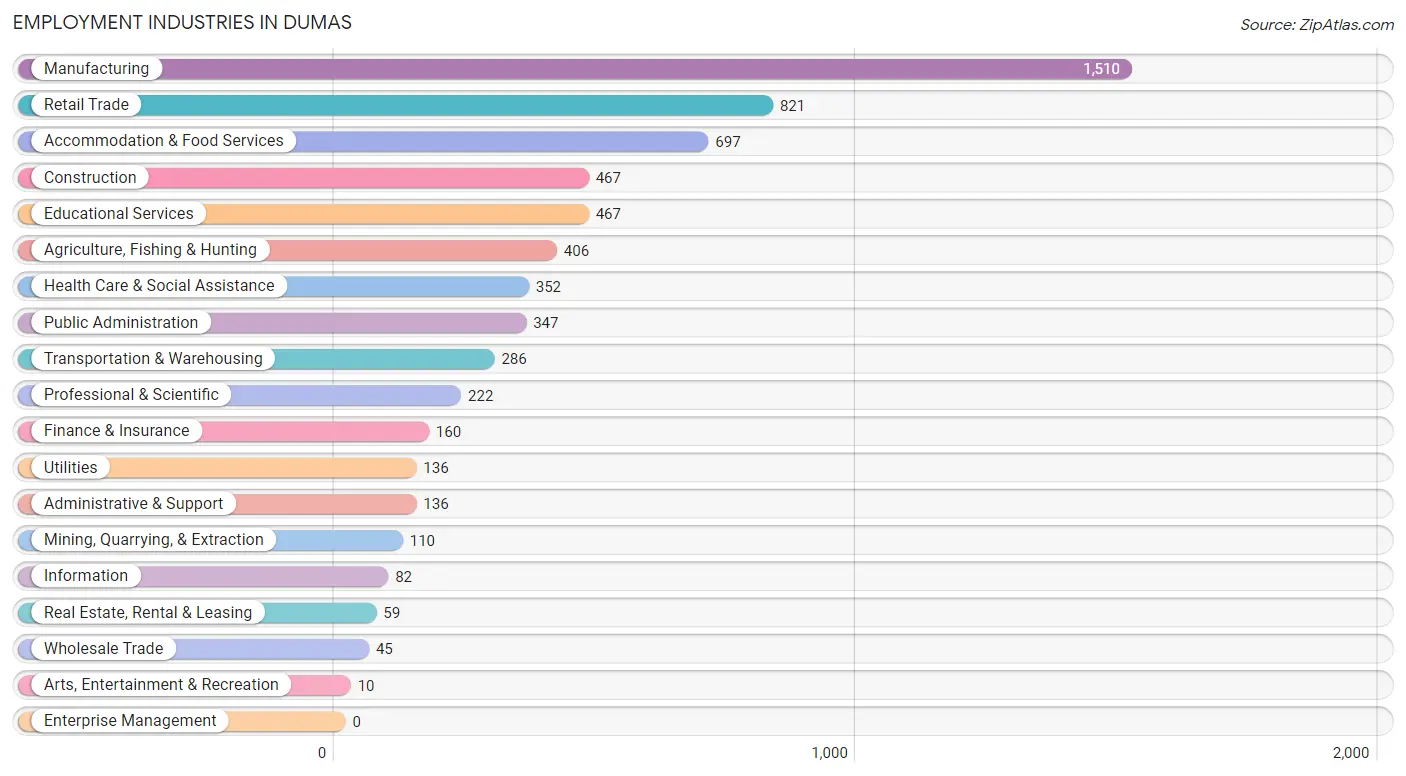
Employment Industries in Dumas
The major employment industries in Dumas include Manufacturing (1,510 | 22.9%), Retail Trade (821 | 12.4%), Accommodation & Food Services (697 | 10.6%), Construction (467 | 7.1%), and Educational Services (467 | 7.1%).
Employment Industries by Sex in Dumas
The Dumas industries that see more men than women are Wholesale Trade (100.0%), Utilities (100.0%), and Arts, Entertainment & Recreation (100.0%), whereas the industries that tend to have a higher number of women are Health Care & Social Assistance (86.1%), Real Estate, Rental & Leasing (78.0%), and Educational Services (77.3%).
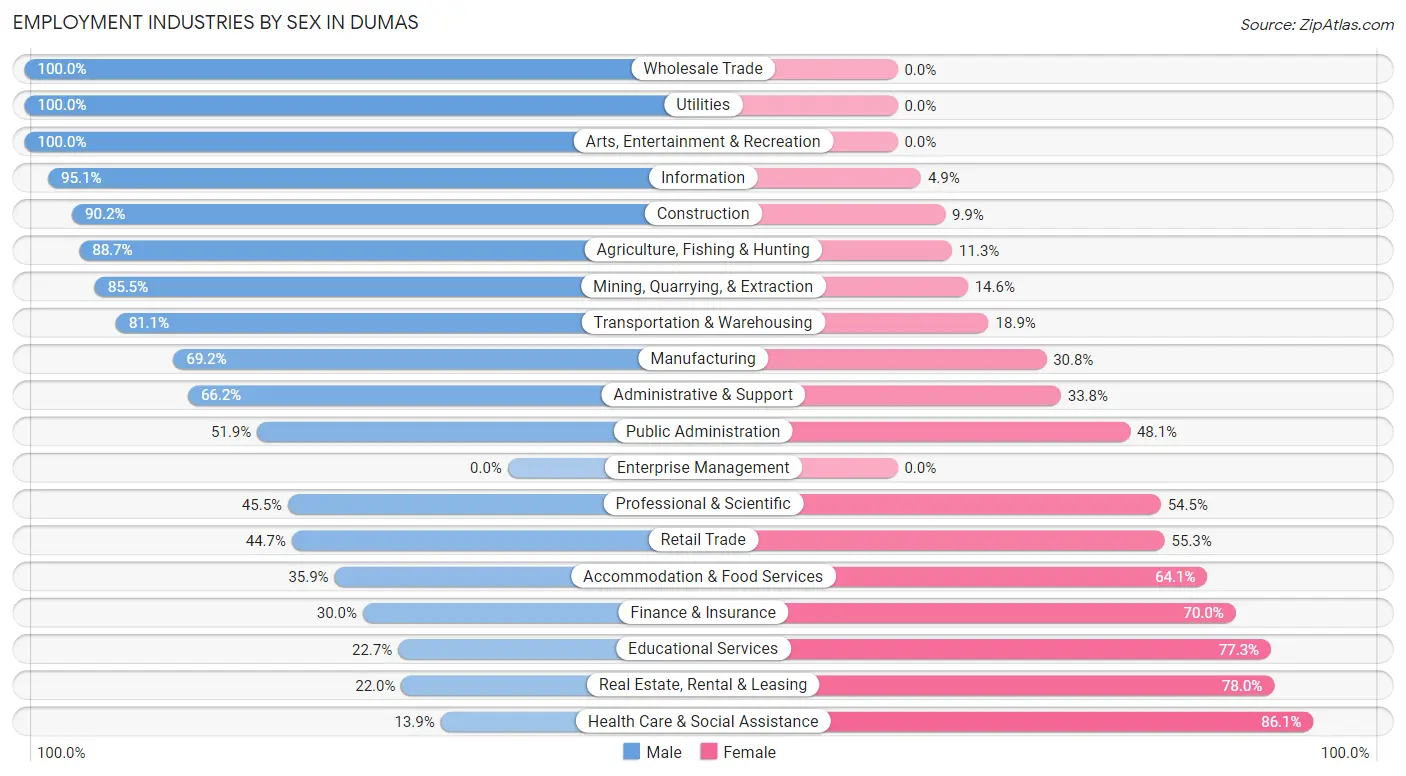
| Industry | Male | Female |
| Agriculture, Fishing & Hunting | 360 (88.7%) | 46 (11.3%) |
| Mining, Quarrying, & Extraction | 94 (85.5%) | 16 (14.5%) |
| Construction | 421 (90.1%) | 46 (9.9%) |
| Manufacturing | 1,045 (69.2%) | 465 (30.8%) |
| Wholesale Trade | 45 (100.0%) | 0 (0.0%) |
| Retail Trade | 367 (44.7%) | 454 (55.3%) |
| Transportation & Warehousing | 232 (81.1%) | 54 (18.9%) |
| Utilities | 136 (100.0%) | 0 (0.0%) |
| Information | 78 (95.1%) | 4 (4.9%) |
| Finance & Insurance | 48 (30.0%) | 112 (70.0%) |
| Real Estate, Rental & Leasing | 13 (22.0%) | 46 (78.0%) |
| Professional & Scientific | 101 (45.5%) | 121 (54.5%) |
| Enterprise Management | 0 (0.0%) | 0 (0.0%) |
| Administrative & Support | 90 (66.2%) | 46 (33.8%) |
| Educational Services | 106 (22.7%) | 361 (77.3%) |
| Health Care & Social Assistance | 49 (13.9%) | 303 (86.1%) |
| Arts, Entertainment & Recreation | 10 (100.0%) | 0 (0.0%) |
| Accommodation & Food Services | 250 (35.9%) | 447 (64.1%) |
| Public Administration | 180 (51.9%) | 167 (48.1%) |
| Total | 3,874 (58.8%) | 2,719 (41.2%) |
Education in Dumas
School Enrollment in Dumas
The most common levels of schooling among the 4,076 students in Dumas are elementary school (1,375 | 33.7%), middle school (1,034 | 25.4%), and high school (841 | 20.6%).
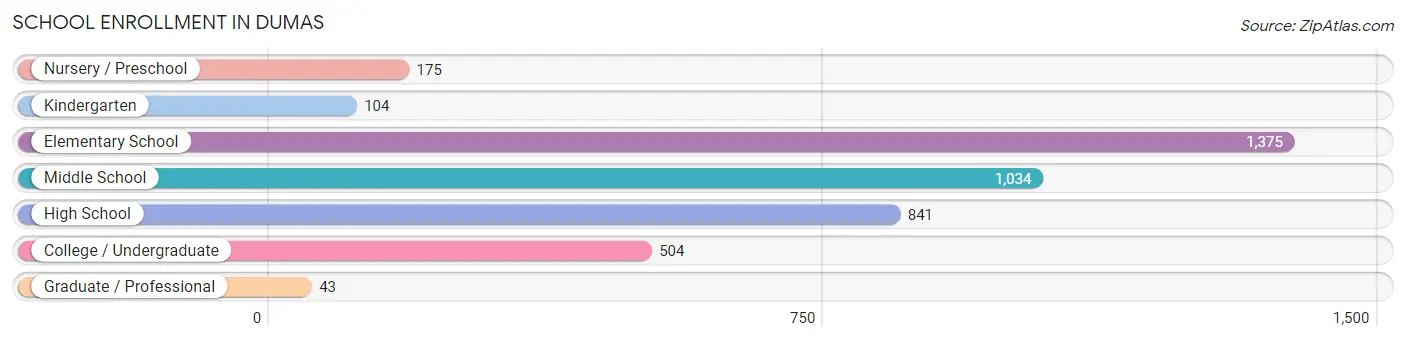
| School Level | # Students | % Students |
| Nursery / Preschool | 175 | 4.3% |
| Kindergarten | 104 | 2.5% |
| Elementary School | 1,375 | 33.7% |
| Middle School | 1,034 | 25.4% |
| High School | 841 | 20.6% |
| College / Undergraduate | 504 | 12.4% |
| Graduate / Professional | 43 | 1.1% |
| Total | 4,076 | 100.0% |
School Enrollment by Age by Funding Source in Dumas
Out of a total of 4,076 students who are enrolled in schools in Dumas, 82 (2.0%) attend a private institution, while the remaining 3,994 (98.0%) are enrolled in public schools. The age group of 25 to 34 year olds has the highest likelihood of being enrolled in private schools, with 40 (28.4% in the age bracket) enrolled. Conversely, the age group of 3 to 4 year olds has the lowest likelihood of being enrolled in a private school, with 133 (100.0% in the age bracket) attending a public institution.
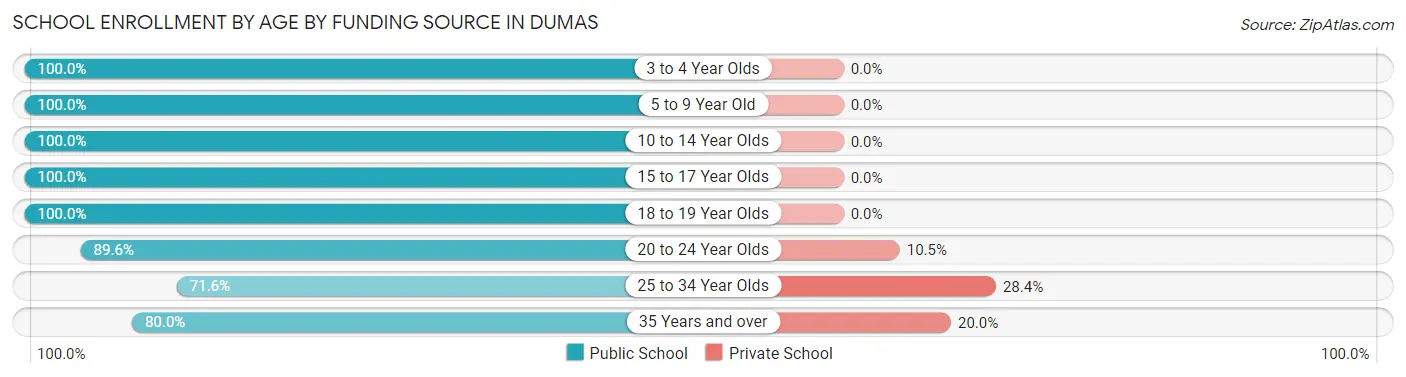
| Age Bracket | Public School | Private School |
| 3 to 4 Year Olds | 133 (100.0%) | 0 (0.0%) |
| 5 to 9 Year Old | 1,436 (100.0%) | 0 (0.0%) |
| 10 to 14 Year Olds | 1,293 (100.0%) | 0 (0.0%) |
| 15 to 17 Year Olds | 618 (100.0%) | 0 (0.0%) |
| 18 to 19 Year Olds | 176 (100.0%) | 0 (0.0%) |
| 20 to 24 Year Olds | 120 (89.5%) | 14 (10.4%) |
| 25 to 34 Year Olds | 101 (71.6%) | 40 (28.4%) |
| 35 Years and over | 116 (80.0%) | 29 (20.0%) |
| Total | 3,994 (98.0%) | 82 (2.0%) |
Educational Attainment by Field of Study in Dumas
Education (269 | 28.2%), bio, nature & agricultural (120 | 12.6%), business (111 | 11.7%), engineering (99 | 10.4%), and liberal arts & history (91 | 9.6%) are the most common fields of study among 953 individuals in Dumas who have obtained a bachelor's degree or higher.
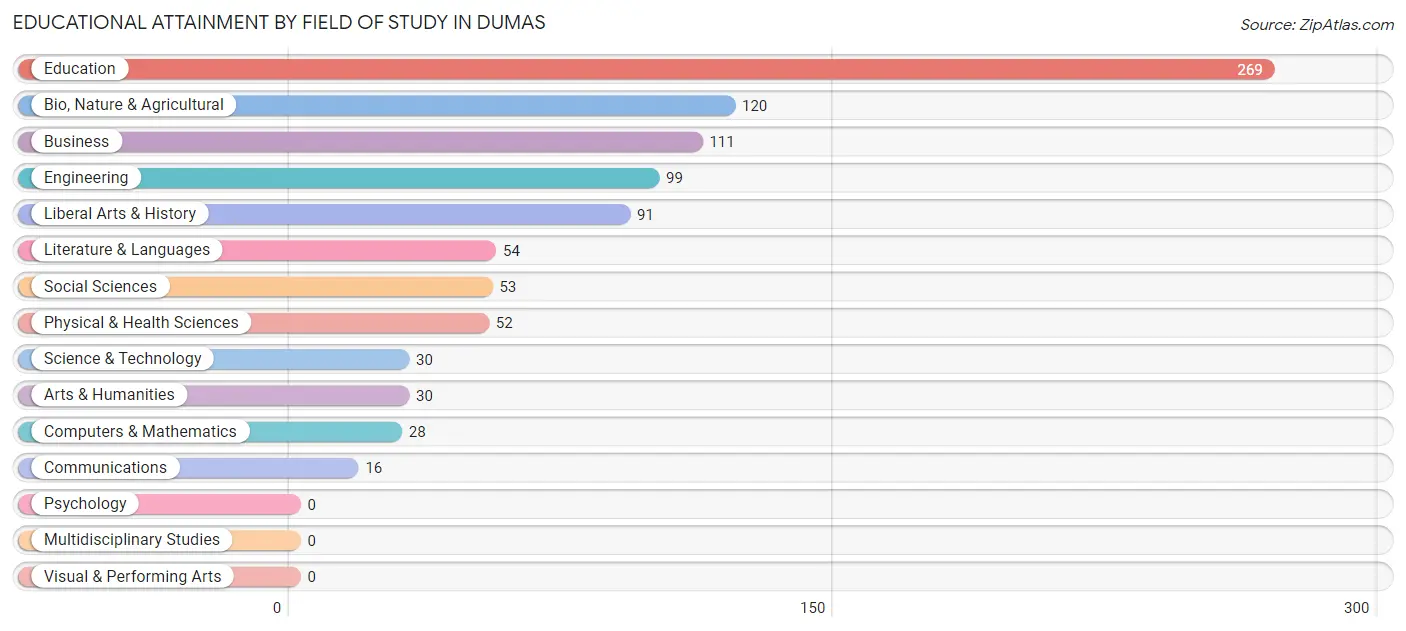
| Field of Study | # Graduates | % Graduates |
| Computers & Mathematics | 28 | 2.9% |
| Bio, Nature & Agricultural | 120 | 12.6% |
| Physical & Health Sciences | 52 | 5.5% |
| Psychology | 0 | 0.0% |
| Social Sciences | 53 | 5.6% |
| Engineering | 99 | 10.4% |
| Multidisciplinary Studies | 0 | 0.0% |
| Science & Technology | 30 | 3.2% |
| Business | 111 | 11.7% |
| Education | 269 | 28.2% |
| Literature & Languages | 54 | 5.7% |
| Liberal Arts & History | 91 | 9.6% |
| Visual & Performing Arts | 0 | 0.0% |
| Communications | 16 | 1.7% |
| Arts & Humanities | 30 | 3.2% |
| Total | 953 | 100.0% |
Transportation & Commute in Dumas
Vehicle Availability by Sex in Dumas
The most prevalent vehicle ownership categories in Dumas are males with 2 vehicles (1,333, accounting for 34.7%) and females with 2 vehicles (868, making up 49.0%).
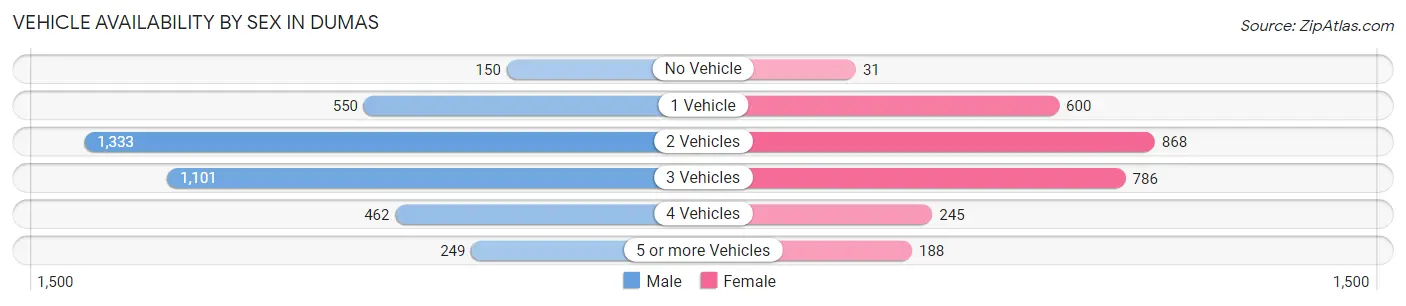
| Vehicles Available | Male | Female |
| No Vehicle | 150 (3.9%) | 31 (1.1%) |
| 1 Vehicle | 550 (14.3%) | 600 (22.1%) |
| 2 Vehicles | 1,333 (34.7%) | 868 (31.9%) |
| 3 Vehicles | 1,101 (28.6%) | 786 (28.9%) |
| 4 Vehicles | 462 (12.0%) | 245 (9.0%) |
| 5 or more Vehicles | 249 (6.5%) | 188 (6.9%) |
| Total | 3,845 (100.0%) | 2,718 (100.0%) |
Commute Time in Dumas
The most frequently occuring commute durations in Dumas are 5 to 9 minutes (1,762 commuters, 27.0%), 15 to 19 minutes (1,404 commuters, 21.5%), and 20 to 24 minutes (939 commuters, 14.4%).
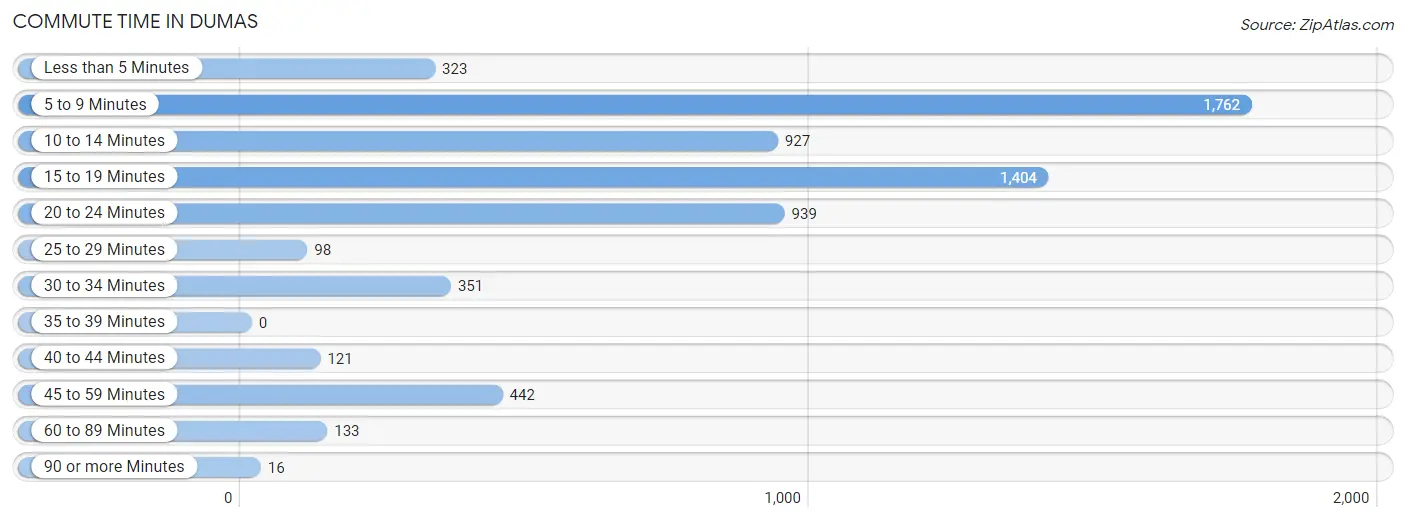
| Commute Time | # Commuters | % Commuters |
| Less than 5 Minutes | 323 | 5.0% |
| 5 to 9 Minutes | 1,762 | 27.0% |
| 10 to 14 Minutes | 927 | 14.2% |
| 15 to 19 Minutes | 1,404 | 21.5% |
| 20 to 24 Minutes | 939 | 14.4% |
| 25 to 29 Minutes | 98 | 1.5% |
| 30 to 34 Minutes | 351 | 5.4% |
| 35 to 39 Minutes | 0 | 0.0% |
| 40 to 44 Minutes | 121 | 1.9% |
| 45 to 59 Minutes | 442 | 6.8% |
| 60 to 89 Minutes | 133 | 2.0% |
| 90 or more Minutes | 16 | 0.3% |
Commute Time by Sex in Dumas
The most common commute times in Dumas are 5 to 9 minutes (1,002 commuters, 26.3%) for males and 5 to 9 minutes (760 commuters, 28.1%) for females.
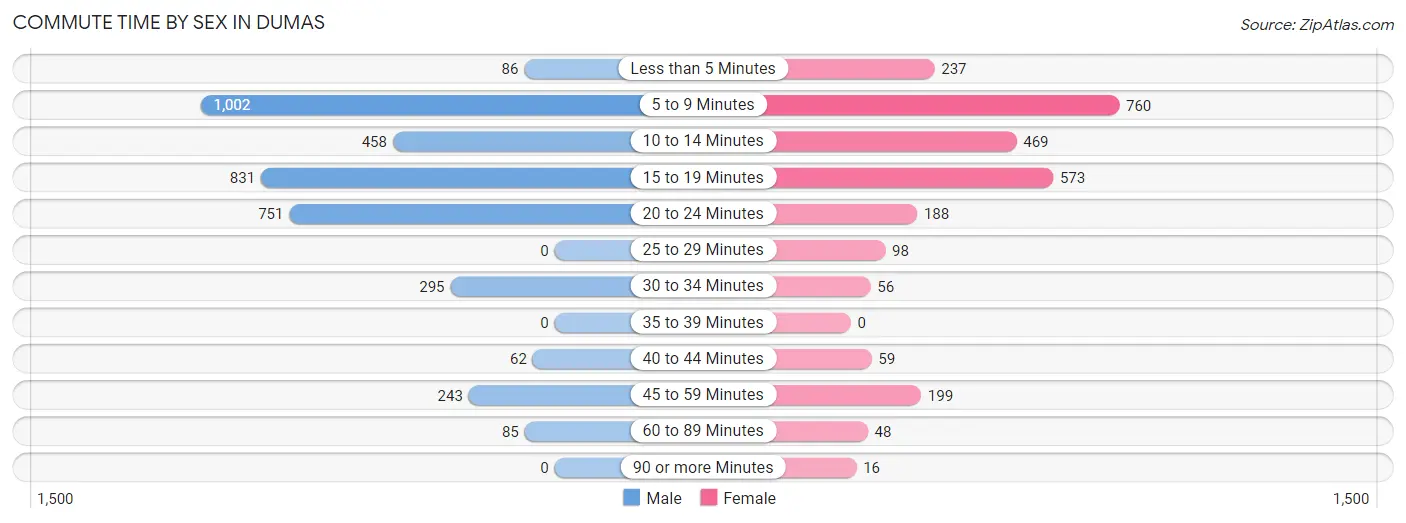
| Commute Time | Male | Female |
| Less than 5 Minutes | 86 (2.3%) | 237 (8.8%) |
| 5 to 9 Minutes | 1,002 (26.3%) | 760 (28.1%) |
| 10 to 14 Minutes | 458 (12.0%) | 469 (17.3%) |
| 15 to 19 Minutes | 831 (21.8%) | 573 (21.2%) |
| 20 to 24 Minutes | 751 (19.7%) | 188 (7.0%) |
| 25 to 29 Minutes | 0 (0.0%) | 98 (3.6%) |
| 30 to 34 Minutes | 295 (7.7%) | 56 (2.1%) |
| 35 to 39 Minutes | 0 (0.0%) | 0 (0.0%) |
| 40 to 44 Minutes | 62 (1.6%) | 59 (2.2%) |
| 45 to 59 Minutes | 243 (6.4%) | 199 (7.4%) |
| 60 to 89 Minutes | 85 (2.2%) | 48 (1.8%) |
| 90 or more Minutes | 0 (0.0%) | 16 (0.6%) |
Time of Departure to Work by Sex in Dumas
The most frequent times of departure to work in Dumas are 7:00 AM to 7:29 AM (622, 16.3%) for males and 7:00 AM to 7:29 AM (413, 15.3%) for females.
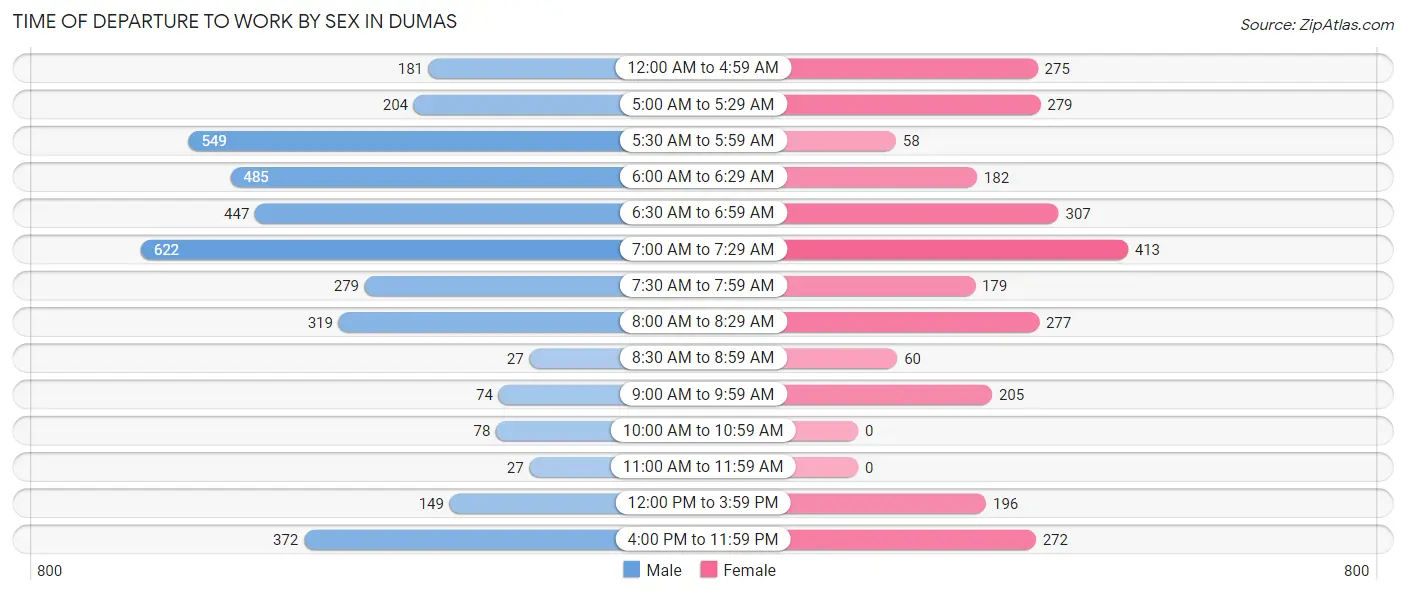
| Time of Departure | Male | Female |
| 12:00 AM to 4:59 AM | 181 (4.8%) | 275 (10.2%) |
| 5:00 AM to 5:29 AM | 204 (5.3%) | 279 (10.3%) |
| 5:30 AM to 5:59 AM | 549 (14.4%) | 58 (2.1%) |
| 6:00 AM to 6:29 AM | 485 (12.7%) | 182 (6.7%) |
| 6:30 AM to 6:59 AM | 447 (11.7%) | 307 (11.4%) |
| 7:00 AM to 7:29 AM | 622 (16.3%) | 413 (15.3%) |
| 7:30 AM to 7:59 AM | 279 (7.3%) | 179 (6.6%) |
| 8:00 AM to 8:29 AM | 319 (8.4%) | 277 (10.2%) |
| 8:30 AM to 8:59 AM | 27 (0.7%) | 60 (2.2%) |
| 9:00 AM to 9:59 AM | 74 (1.9%) | 205 (7.6%) |
| 10:00 AM to 10:59 AM | 78 (2.1%) | 0 (0.0%) |
| 11:00 AM to 11:59 AM | 27 (0.7%) | 0 (0.0%) |
| 12:00 PM to 3:59 PM | 149 (3.9%) | 196 (7.2%) |
| 4:00 PM to 11:59 PM | 372 (9.8%) | 272 (10.1%) |
| Total | 3,813 (100.0%) | 2,703 (100.0%) |
Housing Occupancy in Dumas
Occupancy by Ownership in Dumas
Of the total 4,606 dwellings in Dumas, owner-occupied units account for 3,093 (67.1%), while renter-occupied units make up 1,513 (32.9%).
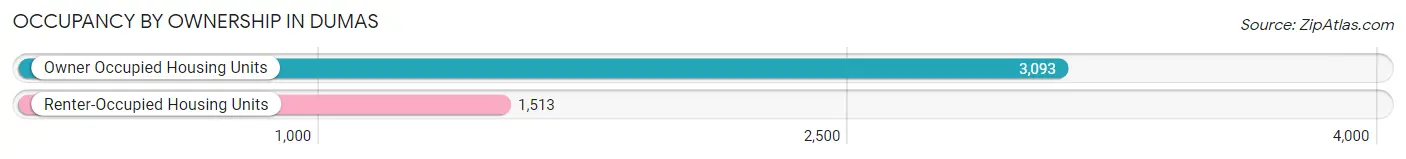
| Occupancy | # Housing Units | % Housing Units |
| Owner Occupied Housing Units | 3,093 | 67.1% |
| Renter-Occupied Housing Units | 1,513 | 32.9% |
| Total Occupied Housing Units | 4,606 | 100.0% |
Occupancy by Household Size in Dumas
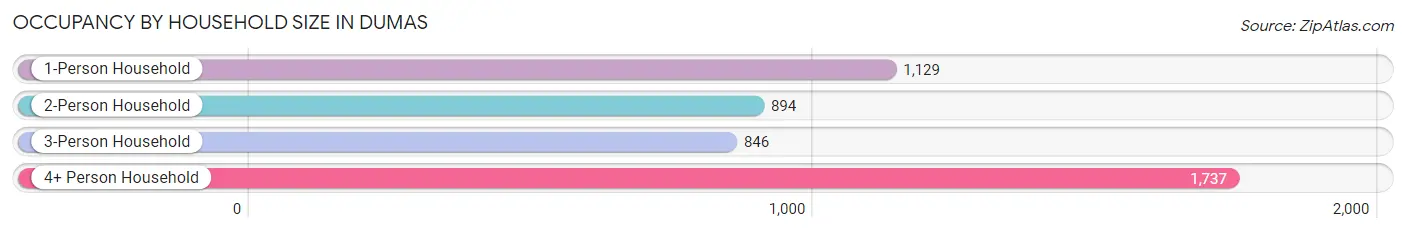
| Household Size | # Housing Units | % Housing Units |
| 1-Person Household | 1,129 | 24.5% |
| 2-Person Household | 894 | 19.4% |
| 3-Person Household | 846 | 18.4% |
| 4+ Person Household | 1,737 | 37.7% |
| Total Housing Units | 4,606 | 100.0% |
Occupancy by Ownership by Household Size in Dumas
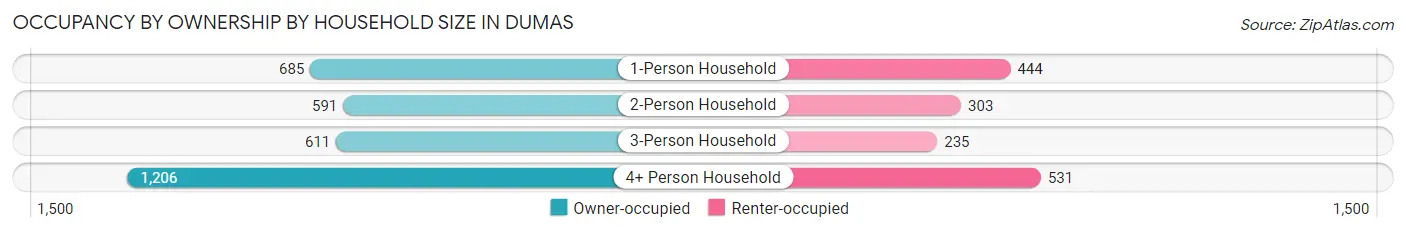
| Household Size | Owner-occupied | Renter-occupied |
| 1-Person Household | 685 (60.7%) | 444 (39.3%) |
| 2-Person Household | 591 (66.1%) | 303 (33.9%) |
| 3-Person Household | 611 (72.2%) | 235 (27.8%) |
| 4+ Person Household | 1,206 (69.4%) | 531 (30.6%) |
| Total Housing Units | 3,093 (67.1%) | 1,513 (32.9%) |
Occupancy by Educational Attainment in Dumas
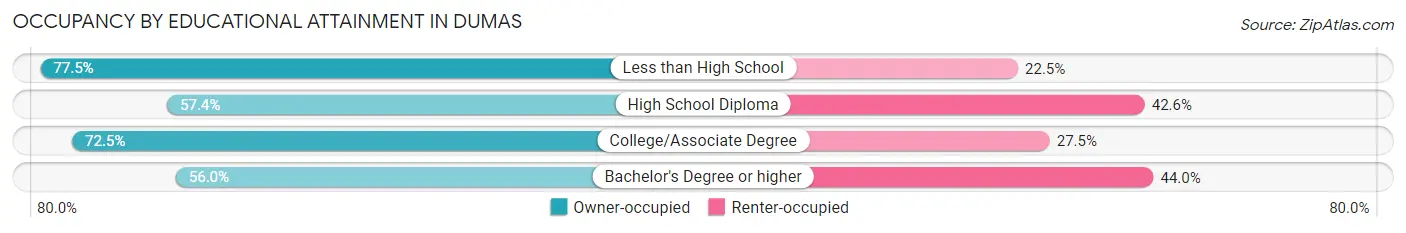
| Household Size | Owner-occupied | Renter-occupied |
| Less than High School | 878 (77.5%) | 255 (22.5%) |
| High School Diploma | 788 (57.4%) | 585 (42.6%) |
| College/Associate Degree | 1,105 (72.5%) | 420 (27.5%) |
| Bachelor's Degree or higher | 322 (56.0%) | 253 (44.0%) |
Occupancy by Age of Householder in Dumas
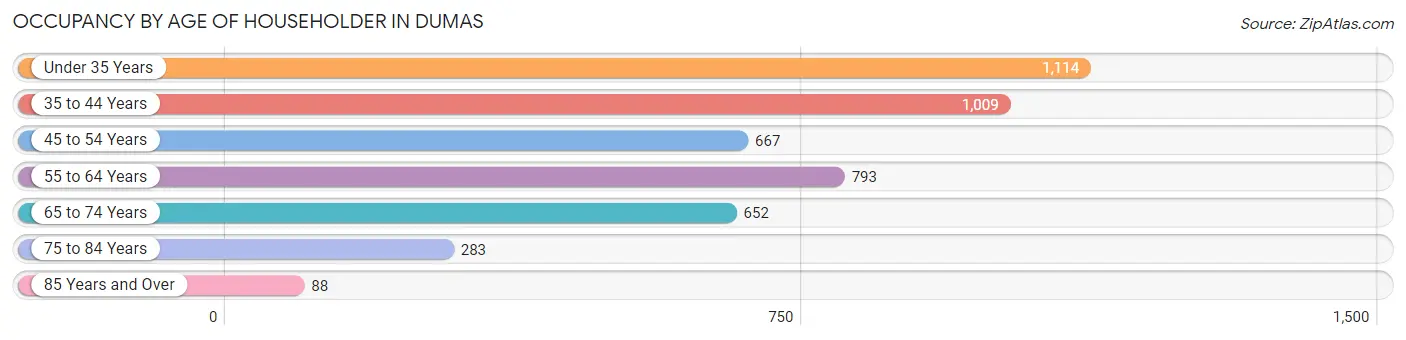
| Age Bracket | # Households | % Households |
| Under 35 Years | 1,114 | 24.2% |
| 35 to 44 Years | 1,009 | 21.9% |
| 45 to 54 Years | 667 | 14.5% |
| 55 to 64 Years | 793 | 17.2% |
| 65 to 74 Years | 652 | 14.2% |
| 75 to 84 Years | 283 | 6.1% |
| 85 Years and Over | 88 | 1.9% |
| Total | 4,606 | 100.0% |
Housing Finances in Dumas
Median Income by Occupancy in Dumas
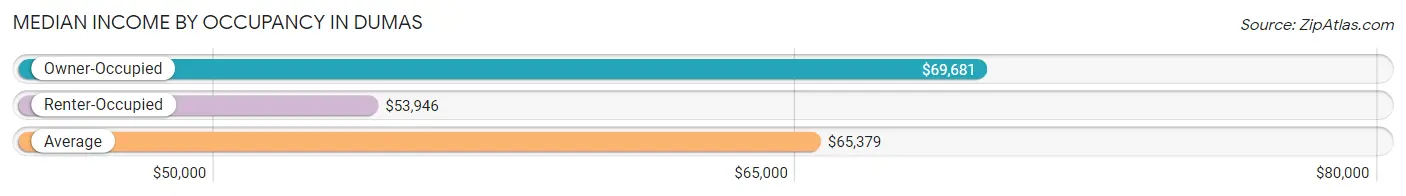
| Occupancy Type | # Households | Median Income |
| Owner-Occupied | 3,093 (67.1%) | $69,681 |
| Renter-Occupied | 1,513 (32.9%) | $53,946 |
| Average | 4,606 (100.0%) | $65,379 |
Occupancy by Householder Income Bracket in Dumas
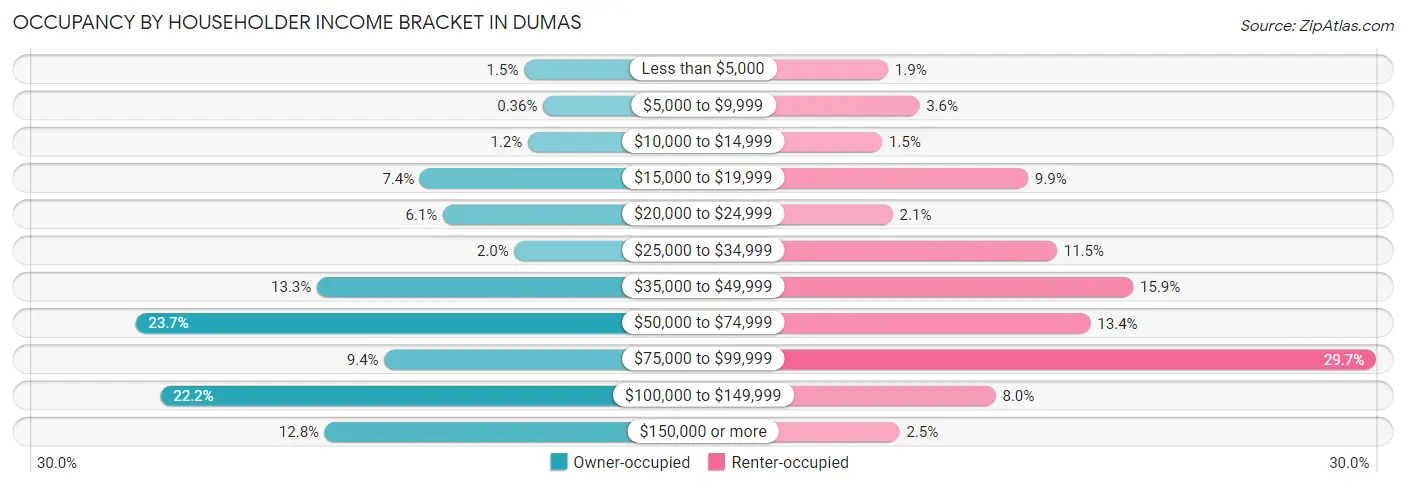
| Income Bracket | Owner-occupied | Renter-occupied |
| Less than $5,000 | 45 (1.5%) | 28 (1.8%) |
| $5,000 to $9,999 | 11 (0.4%) | 55 (3.6%) |
| $10,000 to $14,999 | 38 (1.2%) | 23 (1.5%) |
| $15,000 to $19,999 | 229 (7.4%) | 149 (9.9%) |
| $20,000 to $24,999 | 188 (6.1%) | 32 (2.1%) |
| $25,000 to $34,999 | 62 (2.0%) | 174 (11.5%) |
| $35,000 to $49,999 | 411 (13.3%) | 240 (15.9%) |
| $50,000 to $74,999 | 732 (23.7%) | 203 (13.4%) |
| $75,000 to $99,999 | 292 (9.4%) | 450 (29.7%) |
| $100,000 to $149,999 | 688 (22.2%) | 121 (8.0%) |
| $150,000 or more | 397 (12.8%) | 38 (2.5%) |
| Total | 3,093 (100.0%) | 1,513 (100.0%) |
Monthly Housing Cost Tiers in Dumas
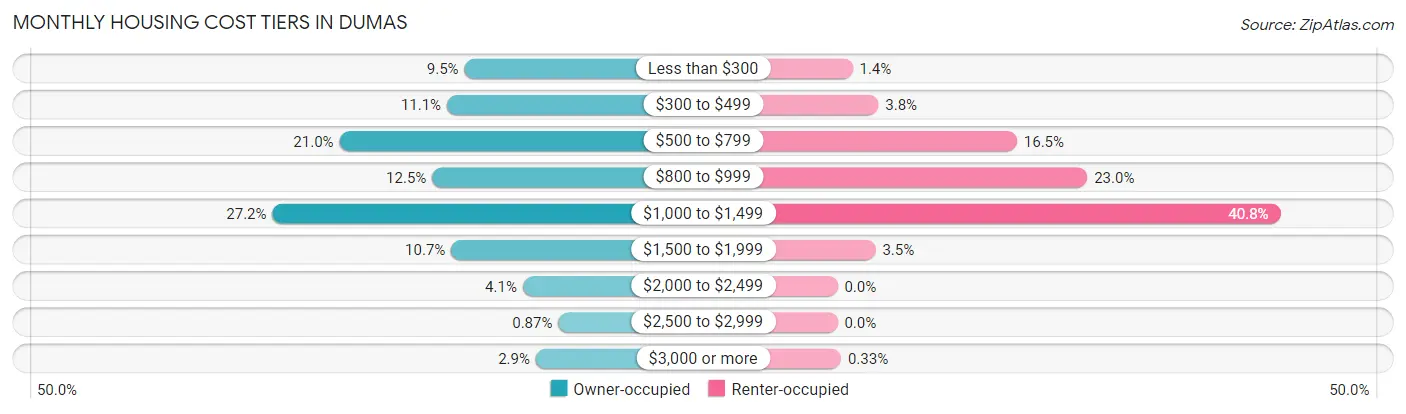
| Monthly Cost | Owner-occupied | Renter-occupied |
| Less than $300 | 294 (9.5%) | 21 (1.4%) |
| $300 to $499 | 344 (11.1%) | 57 (3.8%) |
| $500 to $799 | 650 (21.0%) | 250 (16.5%) |
| $800 to $999 | 386 (12.5%) | 348 (23.0%) |
| $1,000 to $1,499 | 841 (27.2%) | 617 (40.8%) |
| $1,500 to $1,999 | 332 (10.7%) | 53 (3.5%) |
| $2,000 to $2,499 | 128 (4.1%) | 0 (0.0%) |
| $2,500 to $2,999 | 27 (0.9%) | 0 (0.0%) |
| $3,000 or more | 91 (2.9%) | 5 (0.3%) |
| Total | 3,093 (100.0%) | 1,513 (100.0%) |
Physical Housing Characteristics in Dumas
Housing Structures in Dumas
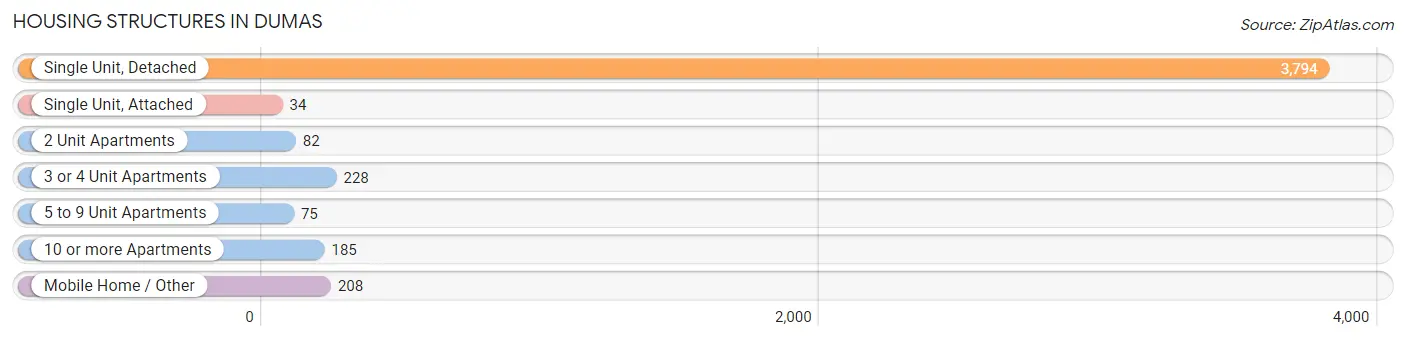
| Structure Type | # Housing Units | % Housing Units |
| Single Unit, Detached | 3,794 | 82.4% |
| Single Unit, Attached | 34 | 0.7% |
| 2 Unit Apartments | 82 | 1.8% |
| 3 or 4 Unit Apartments | 228 | 5.0% |
| 5 to 9 Unit Apartments | 75 | 1.6% |
| 10 or more Apartments | 185 | 4.0% |
| Mobile Home / Other | 208 | 4.5% |
| Total | 4,606 | 100.0% |
Housing Structures by Occupancy in Dumas
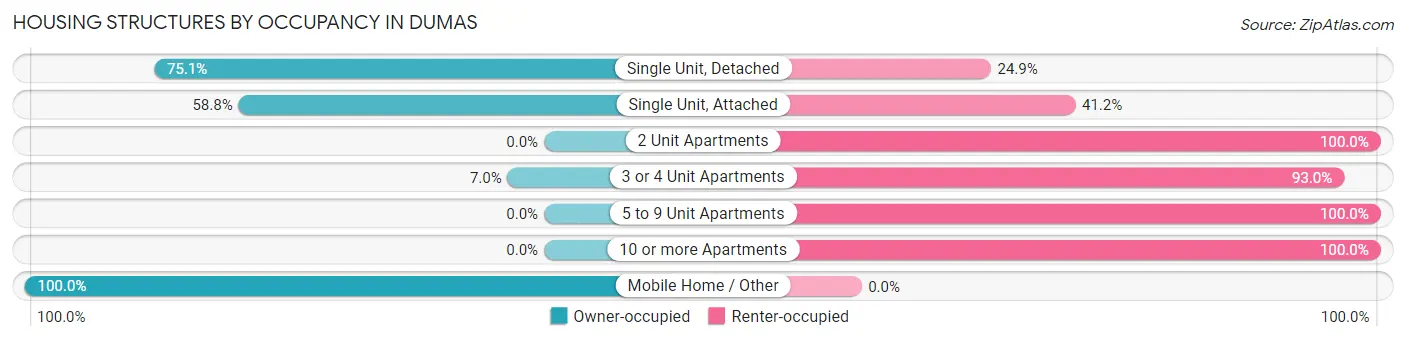
| Structure Type | Owner-occupied | Renter-occupied |
| Single Unit, Detached | 2,849 (75.1%) | 945 (24.9%) |
| Single Unit, Attached | 20 (58.8%) | 14 (41.2%) |
| 2 Unit Apartments | 0 (0.0%) | 82 (100.0%) |
| 3 or 4 Unit Apartments | 16 (7.0%) | 212 (93.0%) |
| 5 to 9 Unit Apartments | 0 (0.0%) | 75 (100.0%) |
| 10 or more Apartments | 0 (0.0%) | 185 (100.0%) |
| Mobile Home / Other | 208 (100.0%) | 0 (0.0%) |
| Total | 3,093 (67.1%) | 1,513 (32.9%) |
Housing Structures by Number of Rooms in Dumas
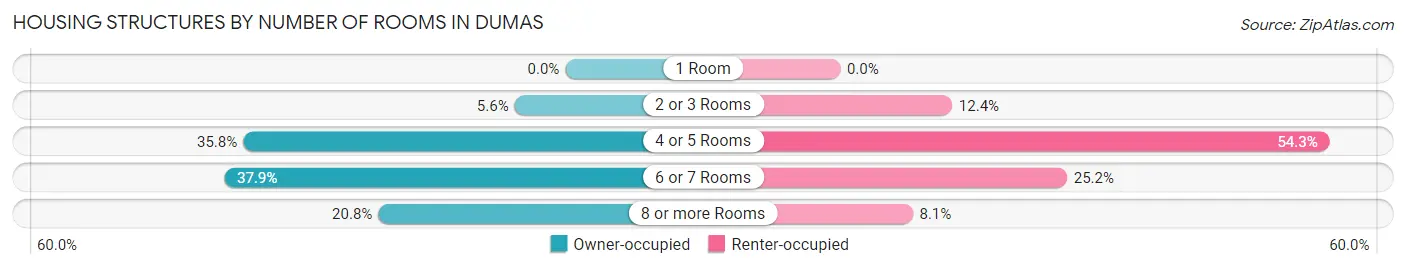
| Number of Rooms | Owner-occupied | Renter-occupied |
| 1 Room | 0 (0.0%) | 0 (0.0%) |
| 2 or 3 Rooms | 174 (5.6%) | 188 (12.4%) |
| 4 or 5 Rooms | 1,106 (35.8%) | 822 (54.3%) |
| 6 or 7 Rooms | 1,171 (37.9%) | 381 (25.2%) |
| 8 or more Rooms | 642 (20.8%) | 122 (8.1%) |
| Total | 3,093 (100.0%) | 1,513 (100.0%) |
Housing Structure by Heating Type in Dumas
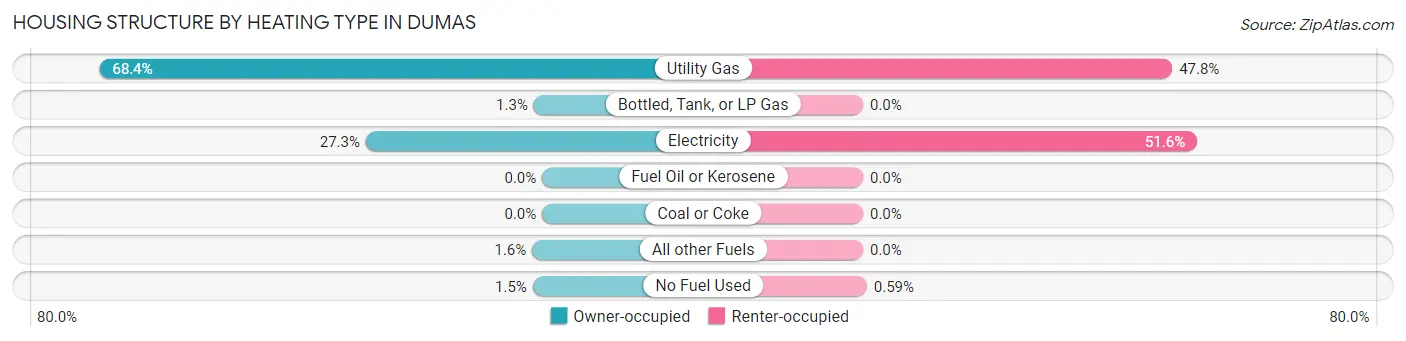
| Heating Type | Owner-occupied | Renter-occupied |
| Utility Gas | 2,117 (68.4%) | 723 (47.8%) |
| Bottled, Tank, or LP Gas | 40 (1.3%) | 0 (0.0%) |
| Electricity | 843 (27.3%) | 781 (51.6%) |
| Fuel Oil or Kerosene | 0 (0.0%) | 0 (0.0%) |
| Coal or Coke | 0 (0.0%) | 0 (0.0%) |
| All other Fuels | 48 (1.5%) | 0 (0.0%) |
| No Fuel Used | 45 (1.5%) | 9 (0.6%) |
| Total | 3,093 (100.0%) | 1,513 (100.0%) |
Household Vehicle Usage in Dumas
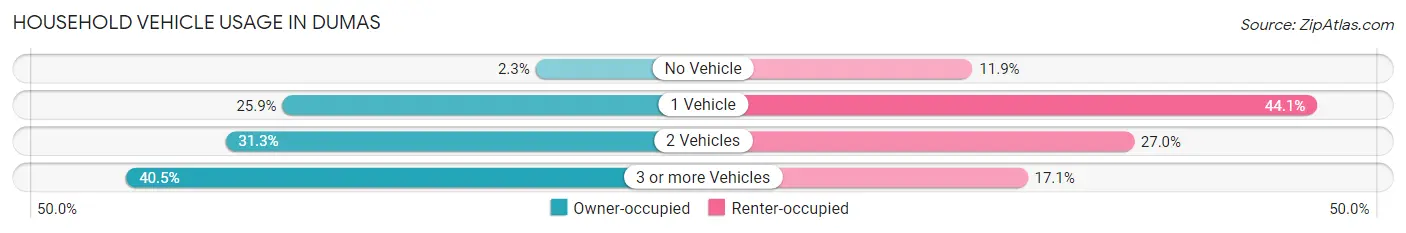
| Vehicles per Household | Owner-occupied | Renter-occupied |
| No Vehicle | 71 (2.3%) | 180 (11.9%) |
| 1 Vehicle | 802 (25.9%) | 667 (44.1%) |
| 2 Vehicles | 967 (31.3%) | 408 (27.0%) |
| 3 or more Vehicles | 1,253 (40.5%) | 258 (17.1%) |
| Total | 3,093 (100.0%) | 1,513 (100.0%) |
Real Estate & Mortgages in Dumas
Real Estate and Mortgage Overview in Dumas
| Characteristic | Without Mortgage | With Mortgage |
| Housing Units | 1,287 | 1,806 |
| Median Property Value | $106,100 | $154,700 |
| Median Household Income | $55,082 | $248 |
| Monthly Housing Costs | $514 | $79 |
| Real Estate Taxes | $1,257 | $22 |
Property Value by Mortgage Status in Dumas
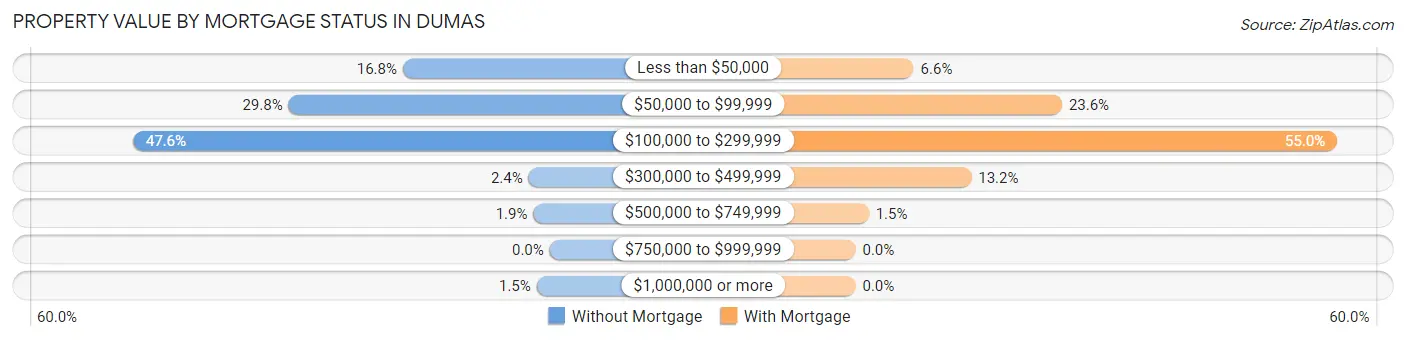
| Property Value | Without Mortgage | With Mortgage |
| Less than $50,000 | 216 (16.8%) | 120 (6.6%) |
| $50,000 to $99,999 | 384 (29.8%) | 426 (23.6%) |
| $100,000 to $299,999 | 613 (47.6%) | 994 (55.0%) |
| $300,000 to $499,999 | 31 (2.4%) | 239 (13.2%) |
| $500,000 to $749,999 | 24 (1.9%) | 27 (1.5%) |
| $750,000 to $999,999 | 0 (0.0%) | 0 (0.0%) |
| $1,000,000 or more | 19 (1.5%) | 0 (0.0%) |
| Total | 1,287 (100.0%) | 1,806 (100.0%) |
Household Income by Mortgage Status in Dumas
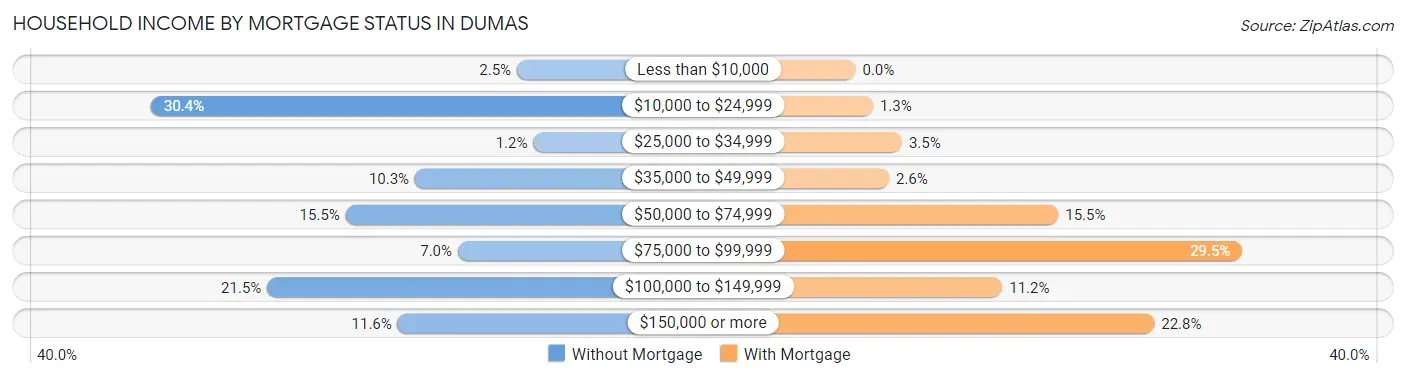
| Household Income | Without Mortgage | With Mortgage |
| Less than $10,000 | 32 (2.5%) | 0 (0.0%) |
| $10,000 to $24,999 | 391 (30.4%) | 24 (1.3%) |
| $25,000 to $34,999 | 16 (1.2%) | 64 (3.5%) |
| $35,000 to $49,999 | 132 (10.3%) | 46 (2.5%) |
| $50,000 to $74,999 | 200 (15.5%) | 279 (15.4%) |
| $75,000 to $99,999 | 90 (7.0%) | 532 (29.5%) |
| $100,000 to $149,999 | 277 (21.5%) | 202 (11.2%) |
| $150,000 or more | 149 (11.6%) | 411 (22.8%) |
| Total | 1,287 (100.0%) | 1,806 (100.0%) |
Property Value to Household Income Ratio in Dumas
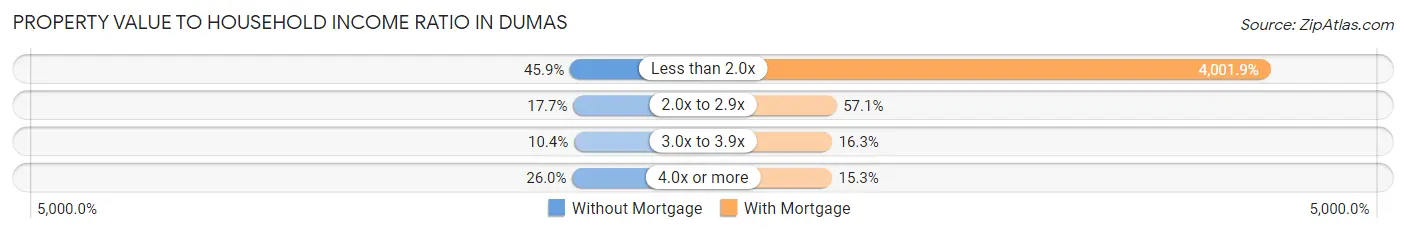
| Value-to-Income Ratio | Without Mortgage | With Mortgage |
| Less than 2.0x | 591 (45.9%) | 72,274 (4,001.9%) |
| 2.0x to 2.9x | 228 (17.7%) | 1,032 (57.1%) |
| 3.0x to 3.9x | 134 (10.4%) | 294 (16.3%) |
| 4.0x or more | 334 (26.0%) | 277 (15.3%) |
| Total | 1,287 (100.0%) | 1,806 (100.0%) |
Real Estate Taxes by Mortgage Status in Dumas
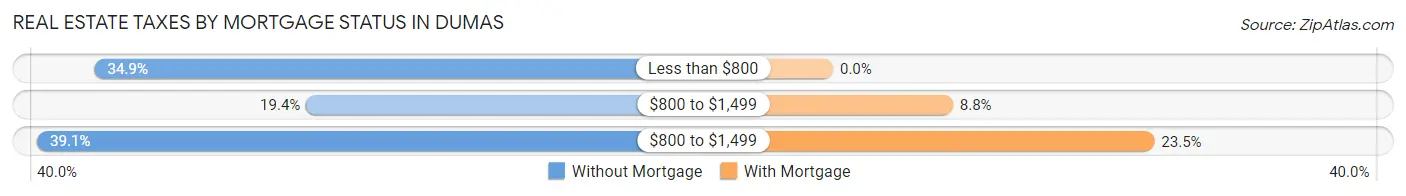
| Property Taxes | Without Mortgage | With Mortgage |
| Less than $800 | 449 (34.9%) | 0 (0.0%) |
| $800 to $1,499 | 250 (19.4%) | 158 (8.7%) |
| $800 to $1,499 | 503 (39.1%) | 424 (23.5%) |
| Total | 1,287 (100.0%) | 1,806 (100.0%) |
Health & Disability in Dumas
Health Insurance Coverage by Age in Dumas
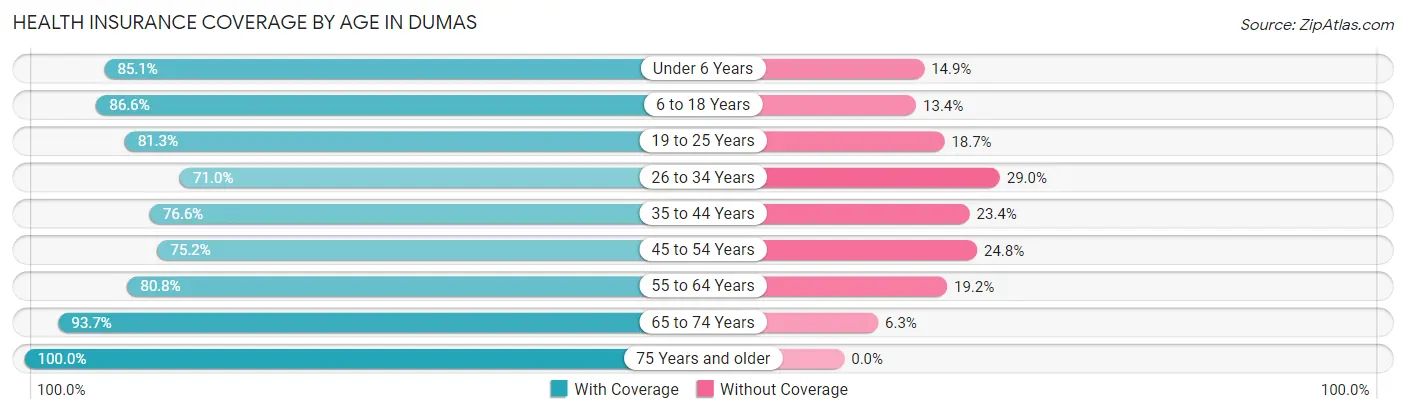
| Age Bracket | With Coverage | Without Coverage |
| Under 6 Years | 1,131 (85.1%) | 198 (14.9%) |
| 6 to 18 Years | 3,065 (86.6%) | 474 (13.4%) |
| 19 to 25 Years | 1,184 (81.3%) | 272 (18.7%) |
| 26 to 34 Years | 1,334 (71.0%) | 545 (29.0%) |
| 35 to 44 Years | 1,426 (76.6%) | 435 (23.4%) |
| 45 to 54 Years | 872 (75.2%) | 287 (24.8%) |
| 55 to 64 Years | 1,152 (80.8%) | 273 (19.2%) |
| 65 to 74 Years | 876 (93.7%) | 59 (6.3%) |
| 75 Years and older | 674 (100.0%) | 0 (0.0%) |
| Total | 11,714 (82.2%) | 2,543 (17.8%) |
Health Insurance Coverage by Citizenship Status in Dumas
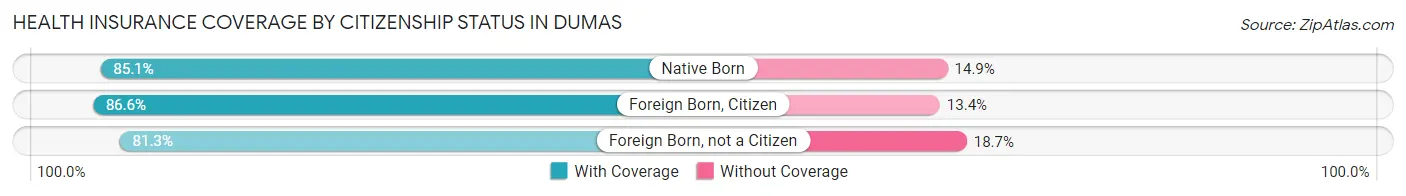
| Citizenship Status | With Coverage | Without Coverage |
| Native Born | 1,131 (85.1%) | 198 (14.9%) |
| Foreign Born, Citizen | 3,065 (86.6%) | 474 (13.4%) |
| Foreign Born, not a Citizen | 1,184 (81.3%) | 272 (18.7%) |
Health Insurance Coverage by Household Income in Dumas
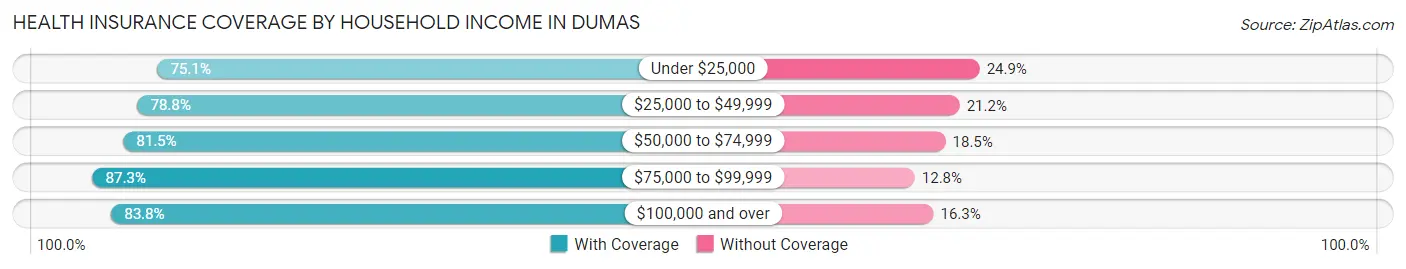
| Household Income | With Coverage | Without Coverage |
| Under $25,000 | 1,167 (75.1%) | 387 (24.9%) |
| $25,000 to $49,999 | 1,882 (78.8%) | 505 (21.2%) |
| $50,000 to $74,999 | 2,607 (81.5%) | 592 (18.5%) |
| $75,000 to $99,999 | 2,416 (87.3%) | 353 (12.8%) |
| $100,000 and over | 3,628 (83.8%) | 704 (16.3%) |
Public vs Private Health Insurance Coverage by Age in Dumas
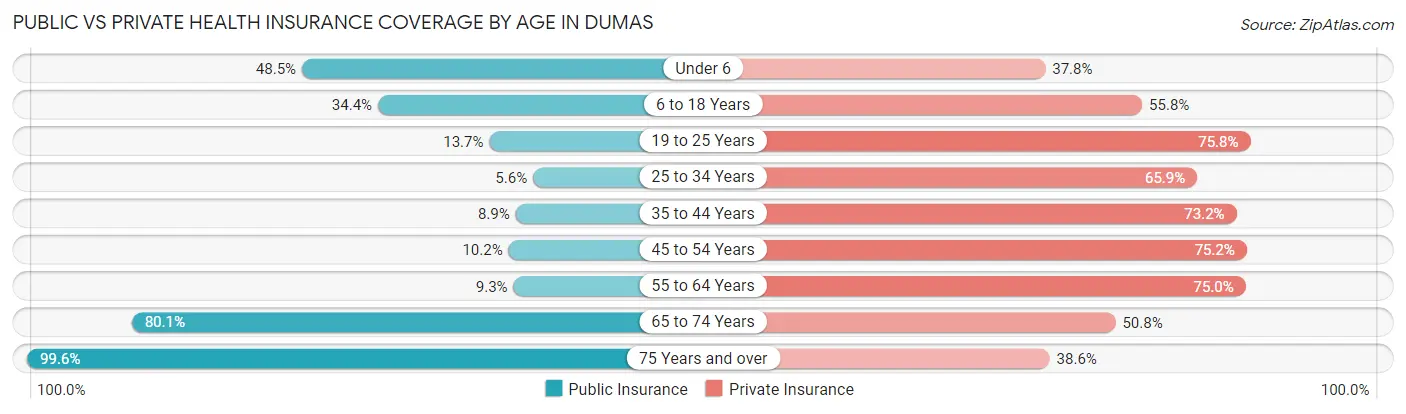
| Age Bracket | Public Insurance | Private Insurance |
| Under 6 | 645 (48.5%) | 502 (37.8%) |
| 6 to 18 Years | 1,218 (34.4%) | 1,973 (55.7%) |
| 19 to 25 Years | 200 (13.7%) | 1,104 (75.8%) |
| 25 to 34 Years | 106 (5.6%) | 1,239 (65.9%) |
| 35 to 44 Years | 165 (8.9%) | 1,363 (73.2%) |
| 45 to 54 Years | 118 (10.2%) | 871 (75.1%) |
| 55 to 64 Years | 132 (9.3%) | 1,068 (75.0%) |
| 65 to 74 Years | 749 (80.1%) | 475 (50.8%) |
| 75 Years and over | 671 (99.6%) | 260 (38.6%) |
| Total | 4,004 (28.1%) | 8,855 (62.1%) |
Disability Status by Sex by Age in Dumas
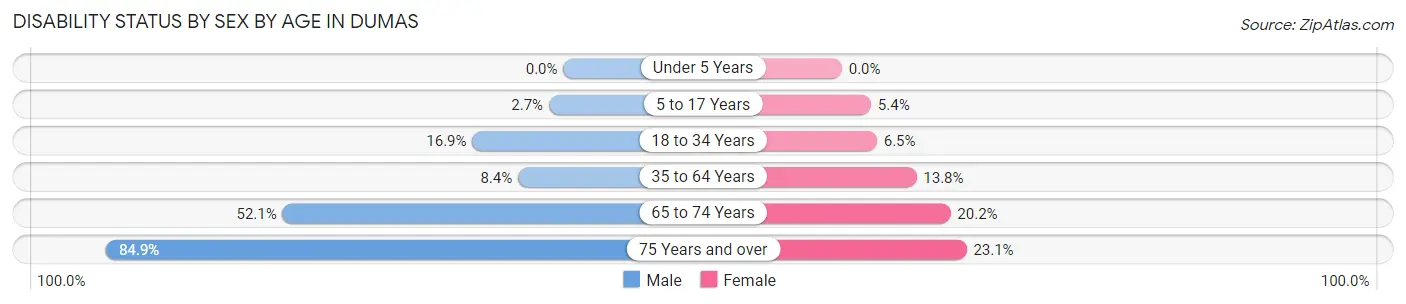
| Age Bracket | Male | Female |
| Under 5 Years | 0 (0.0%) | 0 (0.0%) |
| 5 to 17 Years | 52 (2.7%) | 83 (5.4%) |
| 18 to 34 Years | 300 (16.9%) | 110 (6.5%) |
| 35 to 64 Years | 200 (8.4%) | 286 (13.8%) |
| 65 to 74 Years | 221 (52.1%) | 103 (20.2%) |
| 75 Years and over | 264 (84.9%) | 84 (23.1%) |
Disability Class by Sex by Age in Dumas
Disability Class: Hearing Difficulty
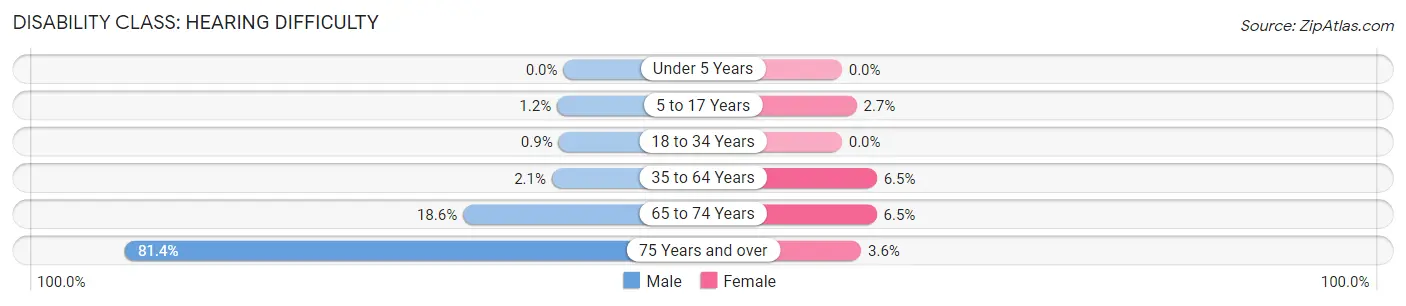
| Age Bracket | Male | Female |
| Under 5 Years | 0 (0.0%) | 0 (0.0%) |
| 5 to 17 Years | 23 (1.2%) | 42 (2.7%) |
| 18 to 34 Years | 16 (0.9%) | 0 (0.0%) |
| 35 to 64 Years | 51 (2.1%) | 134 (6.5%) |
| 65 to 74 Years | 79 (18.6%) | 33 (6.5%) |
| 75 Years and over | 253 (81.4%) | 13 (3.6%) |
Disability Class: Vision Difficulty
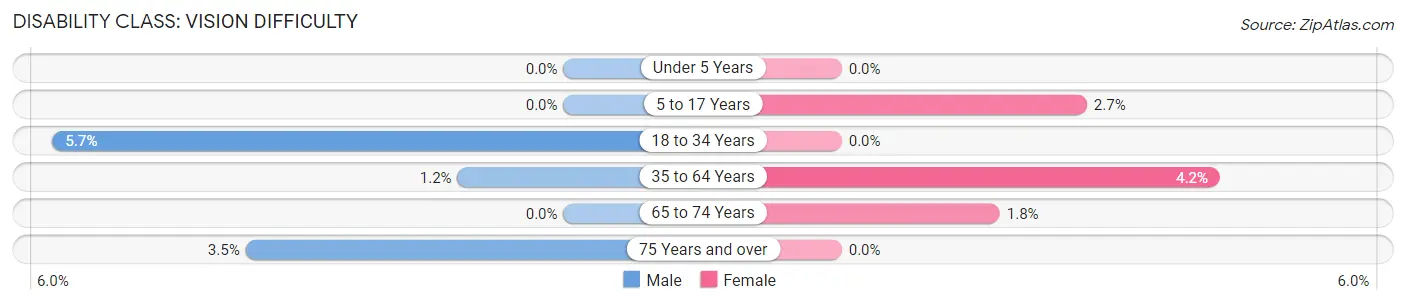
| Age Bracket | Male | Female |
| Under 5 Years | 0 (0.0%) | 0 (0.0%) |
| 5 to 17 Years | 0 (0.0%) | 42 (2.7%) |
| 18 to 34 Years | 101 (5.7%) | 0 (0.0%) |
| 35 to 64 Years | 28 (1.2%) | 87 (4.2%) |
| 65 to 74 Years | 0 (0.0%) | 9 (1.8%) |
| 75 Years and over | 11 (3.5%) | 0 (0.0%) |
Disability Class: Cognitive Difficulty
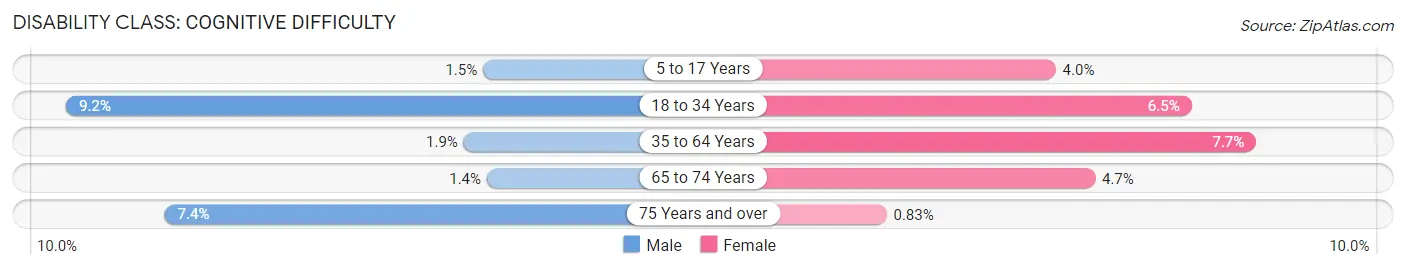
| Age Bracket | Male | Female |
| 5 to 17 Years | 29 (1.5%) | 61 (4.0%) |
| 18 to 34 Years | 164 (9.2%) | 110 (6.5%) |
| 35 to 64 Years | 44 (1.8%) | 159 (7.7%) |
| 65 to 74 Years | 6 (1.4%) | 24 (4.7%) |
| 75 Years and over | 23 (7.4%) | 3 (0.8%) |
Disability Class: Ambulatory Difficulty
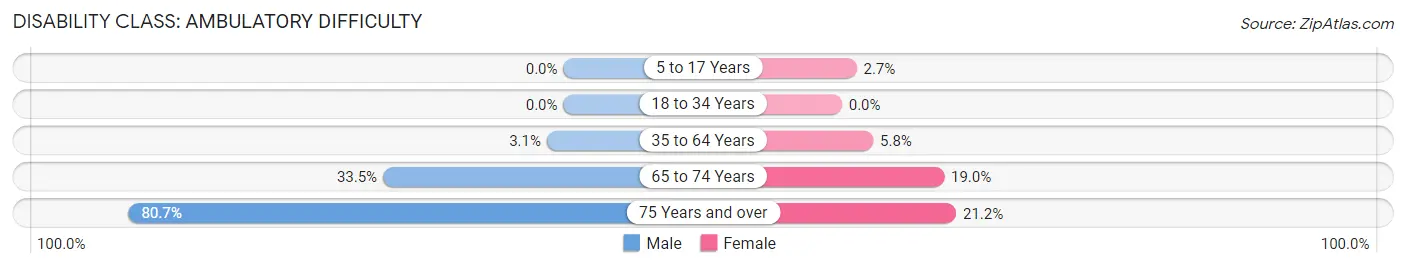
| Age Bracket | Male | Female |
| 5 to 17 Years | 0 (0.0%) | 42 (2.7%) |
| 18 to 34 Years | 0 (0.0%) | 0 (0.0%) |
| 35 to 64 Years | 73 (3.1%) | 120 (5.8%) |
| 65 to 74 Years | 142 (33.5%) | 97 (19.0%) |
| 75 Years and over | 251 (80.7%) | 77 (21.2%) |
Disability Class: Self-Care Difficulty
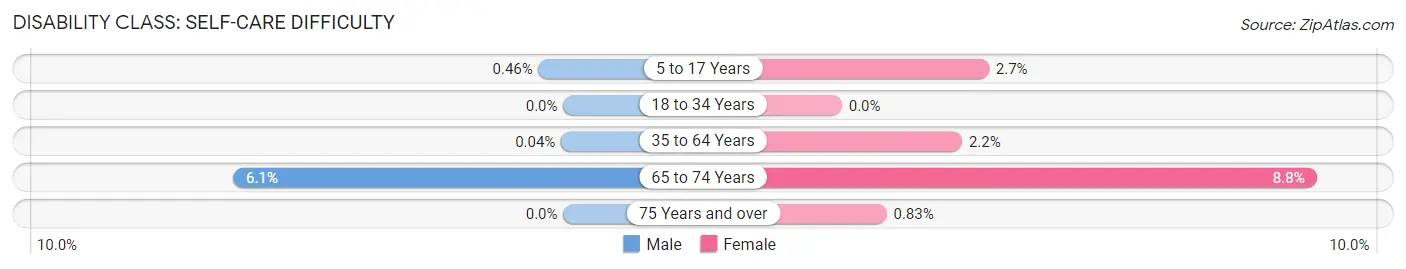
| Age Bracket | Male | Female |
| 5 to 17 Years | 9 (0.5%) | 42 (2.7%) |
| 18 to 34 Years | 0 (0.0%) | 0 (0.0%) |
| 35 to 64 Years | 1 (0.0%) | 46 (2.2%) |
| 65 to 74 Years | 26 (6.1%) | 45 (8.8%) |
| 75 Years and over | 0 (0.0%) | 3 (0.8%) |
Technology Access in Dumas
Computing Device Access in Dumas
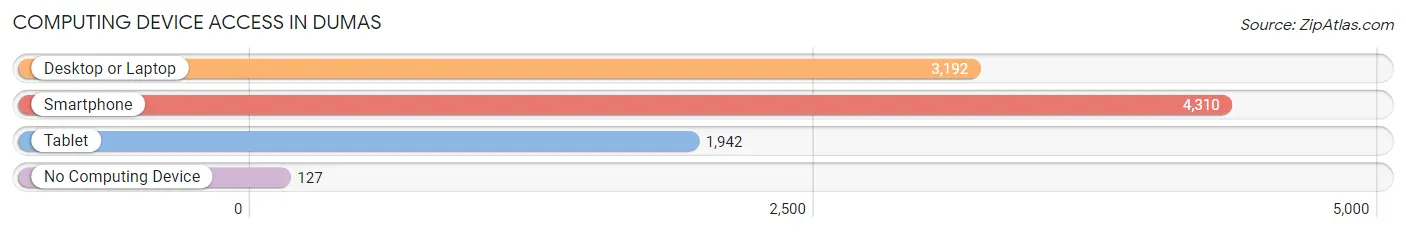
| Device Type | # Households | % Households |
| Desktop or Laptop | 3,192 | 69.3% |
| Smartphone | 4,310 | 93.6% |
| Tablet | 1,942 | 42.2% |
| No Computing Device | 127 | 2.8% |
| Total | 4,606 | 100.0% |
Internet Access in Dumas
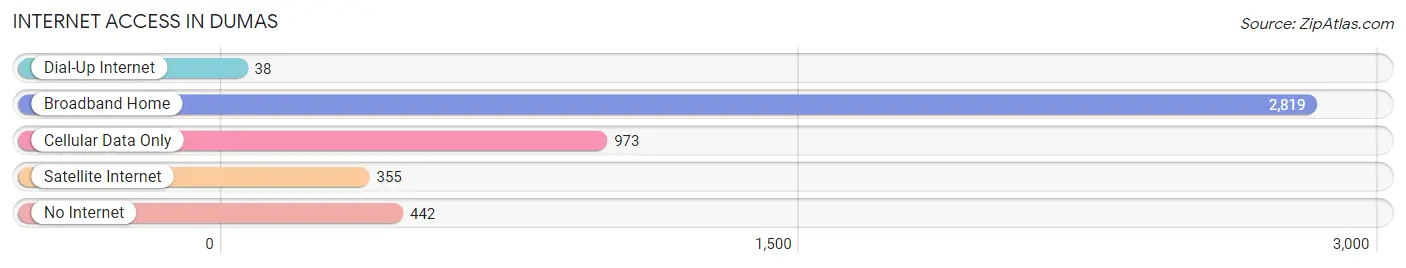
| Internet Type | # Households | % Households |
| Dial-Up Internet | 38 | 0.8% |
| Broadband Home | 2,819 | 61.2% |
| Cellular Data Only | 973 | 21.1% |
| Satellite Internet | 355 | 7.7% |
| No Internet | 442 | 9.6% |
| Total | 4,606 | 100.0% |
Dumas Summary
Dumas, Texas is a city located in Moore County, Texas, United States. It is the county seat of Moore County and is part of the Amarillo, Texas Metropolitan Statistical Area. The population was 14,691 at the 2010 census.
History
Dumas was founded in 1892 by Louis Dumas, a French immigrant who had come to the area in search of a better life. He purchased land from the XIT Ranch and established a small trading post. The town was officially incorporated in 1909 and soon became a major hub for the surrounding agricultural area.
In the early 20th century, Dumas was a major center for the cotton industry. The town was home to several cotton gins and warehouses, as well as a large cottonseed oil mill. The town also had a number of other businesses, including a hotel, a bank, a newspaper, and a movie theater.
Geography
Dumas is located in Moore County, Texas, at the intersection of U.S. Highway 287 and State Highway 152. It is approximately 25 miles north of Amarillo and 100 miles south of the Oklahoma border.
The city has a total area of 5.3 square miles, all of which is land. The elevation is 3,637 feet above sea level.
Economy
Dumas is a major center for agriculture in the Texas Panhandle. The city is home to several large farms and ranches, as well as a number of smaller family-owned operations. The city is also home to a number of businesses, including a number of manufacturing and service companies.
The city is also home to a number of oil and gas companies, as well as a number of wind energy companies. The city is also home to a number of retail stores, restaurants, and other businesses.
Demographics
As of the 2010 census, there were 14,691 people, 5,541 households, and 3,717 families residing in the city. The population density was 2,743.3 people per square mile. The racial makeup of the city was 75.2% White, 1.2% African American, 0.7% Native American, 0.5% Asian, 0.1% Pacific Islander, 19.7% from other races, and 2.7% from two or more races. Hispanic or Latino of any race were 37.2% of the population.
The median income for a household in the city was $35,945, and the median income for a family was $41,945. The per capita income for the city was $17,845. About 17.2% of families and 20.7% of the population were below the poverty line, including 28.2% of those under age 18 and 11.2% of those age 65 or over.
Common Questions
What is Per Capita Income in Dumas?
Per Capita income in Dumas is $25,943.
What is the Median Family Income in Dumas?
Median Family Income in Dumas is $70,724.
What is the Median Household income in Dumas?
Median Household Income in Dumas is $65,379.
What is Income or Wage Gap in Dumas?
Income or Wage Gap in Dumas is 32.6%.
Women in Dumas earn 67.4 cents for every dollar earned by a man.
What is Family Income Deficit in Dumas?
Family Income Deficit in Dumas is $8,520.
Families that are below poverty line in Dumas earn $8,520 less on average than the poverty threshold level.
What is Inequality or Gini Index in Dumas?
Inequality or Gini Index in Dumas is 0.38.
What is the Total Population of Dumas?
Total Population of Dumas is 14,404.
What is the Total Male Population of Dumas?
Total Male Population of Dumas is 7,547.
What is the Total Female Population of Dumas?
Total Female Population of Dumas is 6,857.
What is the Ratio of Males per 100 Females in Dumas?
There are 110.06 Males per 100 Females in Dumas.
What is the Ratio of Females per 100 Males in Dumas?
There are 90.86 Females per 100 Males in Dumas.
What is the Median Population Age in Dumas?
Median Population Age in Dumas is 29.2 Years.
What is the Average Family Size in Dumas
Average Family Size in Dumas is 3.7 People.
What is the Average Household Size in Dumas
Average Household Size in Dumas is 3.1 People.
How Large is the Labor Force in Dumas?
There are 6,750 People in the Labor Forcein in Dumas.
What is the Percentage of People in the Labor Force in Dumas?
67.1% of People are in the Labor Force in Dumas.
What is the Unemployment Rate in Dumas?
Unemployment Rate in Dumas is 2.3%.