Austin, MN Map & Demographics
Austin Map
Austin Overview
$29,992
PER CAPITA INCOME
$79,887
AVG FAMILY INCOME
$61,667
AVG HOUSEHOLD INCOME
27.7%
WAGE / INCOME GAP [ % ]
72.3¢/ $1
WAGE / INCOME GAP [ $ ]
$9,248
FAMILY INCOME DEFICIT
0.39
INEQUALITY / GINI INDEX
26,156
TOTAL POPULATION
13,325
MALE POPULATION
12,831
FEMALE POPULATION
103.85
MALES / 100 FEMALES
96.29
FEMALES / 100 MALES
37.0
MEDIAN AGE
3.1
AVG FAMILY SIZE
2.5
AVG HOUSEHOLD SIZE
12,756
LABOR FORCE [ PEOPLE ]
64.0%
PERCENT IN LABOR FORCE
3.5%
UNEMPLOYMENT RATE
Austin Zip Codes
Austin Area Codes
Income in Austin
Income Overview in Austin
Per Capita Income in Austin is $29,992, while median incomes of families and households are $79,887 and $61,667 respectively.
| Characteristic | Number | Measure |
| Per Capita Income | 26,156 | $29,992 |
| Median Family Income | 6,403 | $79,887 |
| Mean Family Income | 6,403 | $89,103 |
| Median Household Income | 10,172 | $61,667 |
| Mean Household Income | 10,172 | $75,298 |
| Income Deficit | 6,403 | $9,248 |
| Wage / Income Gap (%) | 26,156 | 27.73% |
| Wage / Income Gap ($) | 26,156 | 72.27¢ per $1 |
| Gini / Inequality Index | 26,156 | 0.39 |
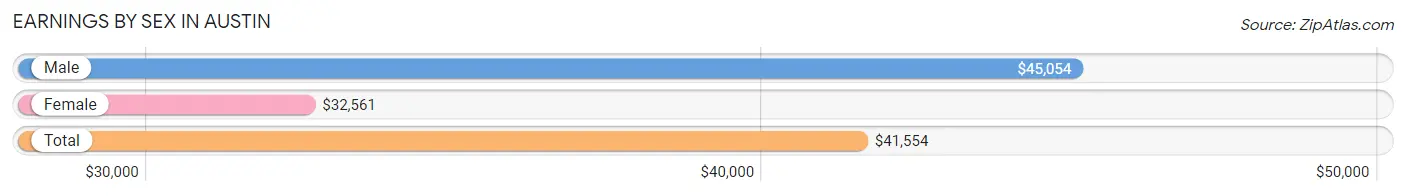
Earnings by Sex in Austin
Average Earnings in Austin are $41,554, $45,054 for men and $32,561 for women, a difference of 27.7%.
| Sex | Number | Average Earnings |
| Male | 7,672 (56.5%) | $45,054 |
| Female | 5,910 (43.5%) | $32,561 |
| Total | 13,582 (100.0%) | $41,554 |
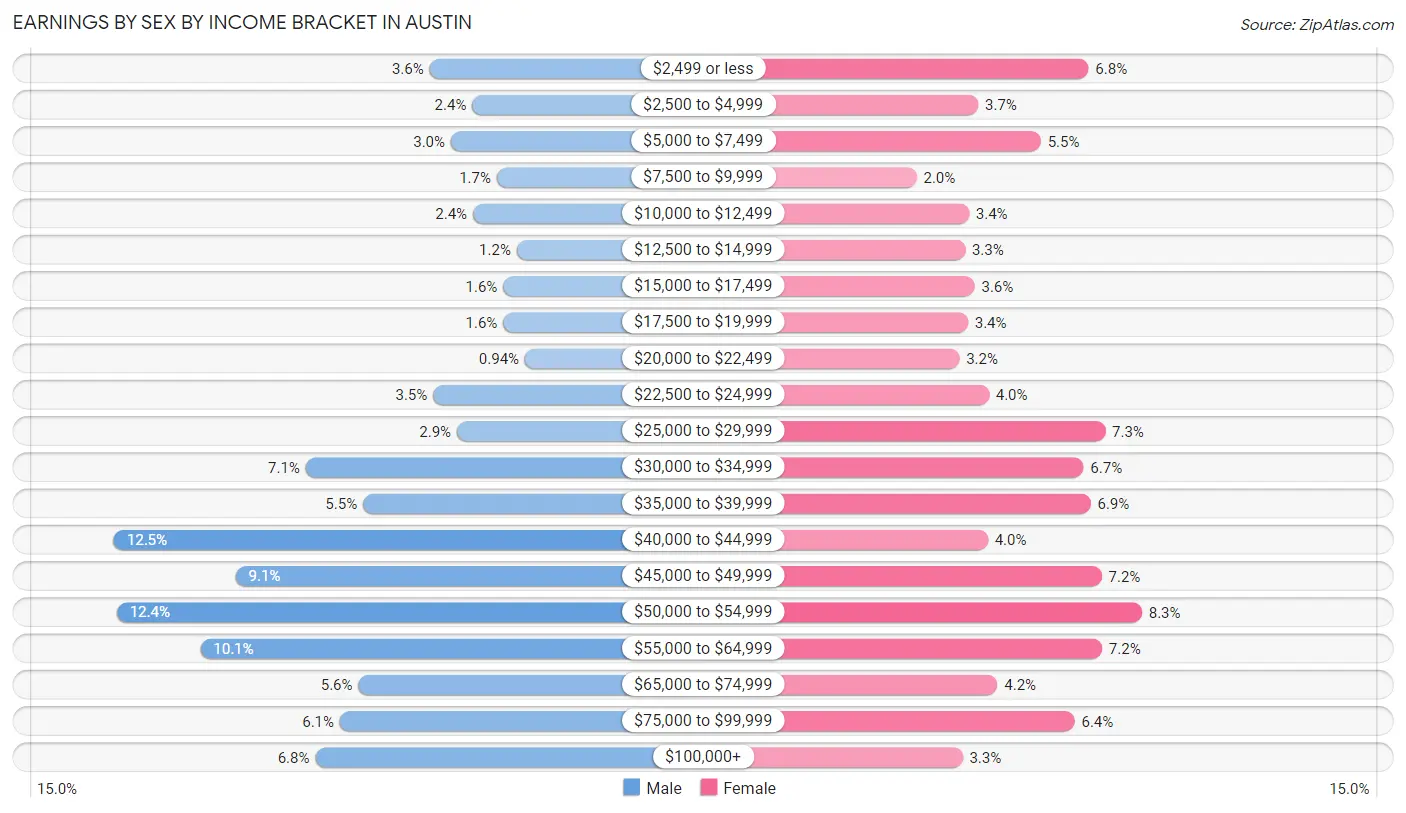
Earnings by Sex by Income Bracket in Austin
The most common earnings brackets in Austin are $40,000 to $44,999 for men (958 | 12.5%) and $50,000 to $54,999 for women (490 | 8.3%).
| Income | Male | Female |
| $2,499 or less | 278 (3.6%) | 401 (6.8%) |
| $2,500 to $4,999 | 186 (2.4%) | 218 (3.7%) |
| $5,000 to $7,499 | 232 (3.0%) | 322 (5.4%) |
| $7,500 to $9,999 | 133 (1.7%) | 116 (2.0%) |
| $10,000 to $12,499 | 184 (2.4%) | 203 (3.4%) |
| $12,500 to $14,999 | 90 (1.2%) | 196 (3.3%) |
| $15,000 to $17,499 | 119 (1.5%) | 212 (3.6%) |
| $17,500 to $19,999 | 119 (1.5%) | 201 (3.4%) |
| $20,000 to $22,499 | 72 (0.9%) | 187 (3.2%) |
| $22,500 to $24,999 | 270 (3.5%) | 236 (4.0%) |
| $25,000 to $29,999 | 219 (2.9%) | 429 (7.3%) |
| $30,000 to $34,999 | 545 (7.1%) | 393 (6.7%) |
| $35,000 to $39,999 | 421 (5.5%) | 405 (6.9%) |
| $40,000 to $44,999 | 958 (12.5%) | 234 (4.0%) |
| $45,000 to $49,999 | 696 (9.1%) | 423 (7.2%) |
| $50,000 to $54,999 | 952 (12.4%) | 490 (8.3%) |
| $55,000 to $64,999 | 772 (10.1%) | 424 (7.2%) |
| $65,000 to $74,999 | 431 (5.6%) | 250 (4.2%) |
| $75,000 to $99,999 | 471 (6.1%) | 378 (6.4%) |
| $100,000+ | 524 (6.8%) | 192 (3.3%) |
| Total | 7,672 (100.0%) | 5,910 (100.0%) |
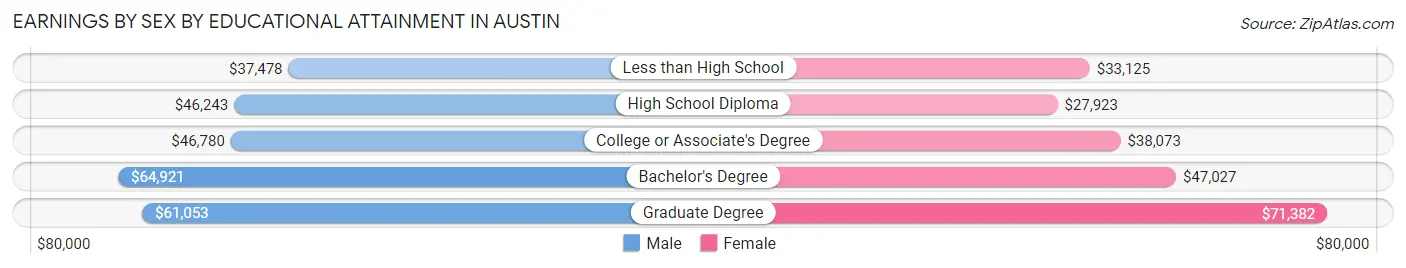
Earnings by Sex by Educational Attainment in Austin
Average earnings in Austin are $46,941 for men and $37,675 for women, a difference of 19.7%. Men with an educational attainment of bachelor's degree enjoy the highest average annual earnings of $64,921, while those with less than high school education earn the least with $37,478. Women with an educational attainment of graduate degree earn the most with the average annual earnings of $71,382, while those with high school diploma education have the smallest earnings of $27,923.
| Educational Attainment | Male Income | Female Income |
| Less than High School | $37,478 | $33,125 |
| High School Diploma | $46,243 | $27,923 |
| College or Associate's Degree | $46,780 | $38,073 |
| Bachelor's Degree | $64,921 | $47,027 |
| Graduate Degree | $61,053 | $71,382 |
| Total | $46,941 | $37,675 |
Family Income in Austin
Family Income Brackets in Austin
According to the Austin family income data, there are 1,396 families falling into the $75,000 to $99,999 income range, which is the most common income bracket and makes up 21.8% of all families. Conversely, the less than $10,000 income bracket is the least frequent group with only 160 families (2.5%) belonging to this category.
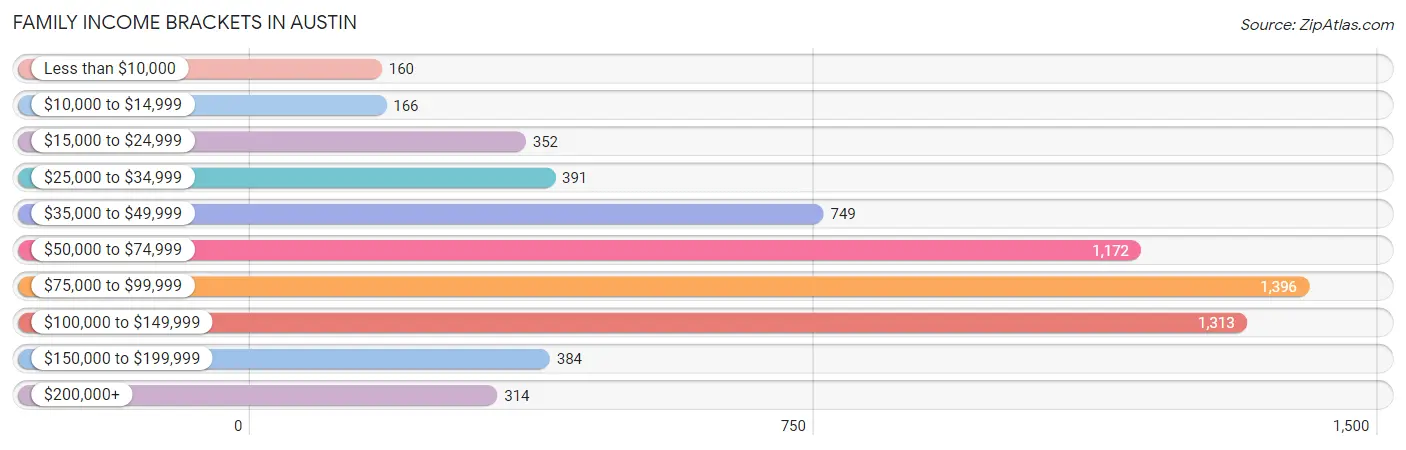
| Income Bracket | # Families | % Families |
| Less than $10,000 | 160 | 2.5% |
| $10,000 to $14,999 | 166 | 2.6% |
| $15,000 to $24,999 | 352 | 5.5% |
| $25,000 to $34,999 | 391 | 6.1% |
| $35,000 to $49,999 | 749 | 11.7% |
| $50,000 to $74,999 | 1,172 | 18.3% |
| $75,000 to $99,999 | 1,396 | 21.8% |
| $100,000 to $149,999 | 1,313 | 20.5% |
| $150,000 to $199,999 | 384 | 6.0% |
| $200,000+ | 314 | 4.9% |
Family Income by Famaliy Size in Austin
5-person families (656 | 10.2%) account for the highest median family income in Austin with $105,073 per family, while 2-person families (2,980 | 46.5%) have the highest median income of $35,204 per family member.
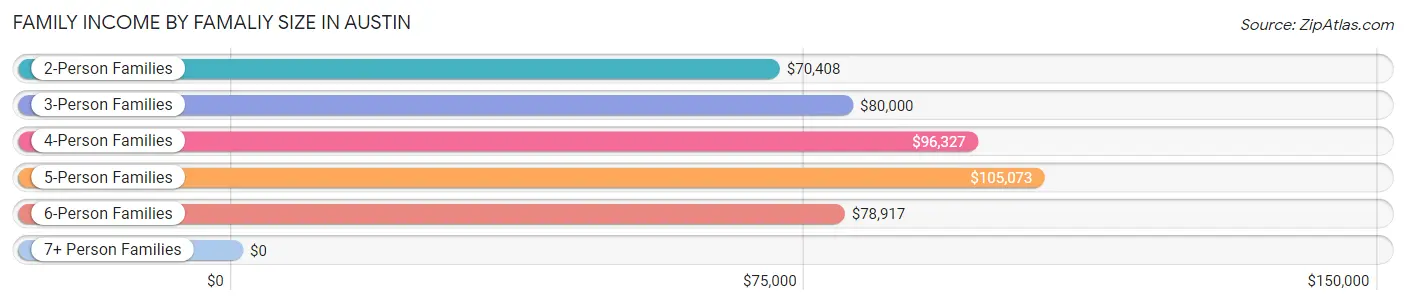
| Income Bracket | # Families | Median Income |
| 2-Person Families | 2,980 (46.5%) | $70,408 |
| 3-Person Families | 1,362 (21.3%) | $80,000 |
| 4-Person Families | 970 (15.1%) | $96,327 |
| 5-Person Families | 656 (10.2%) | $105,073 |
| 6-Person Families | 251 (3.9%) | $78,917 |
| 7+ Person Families | 184 (2.9%) | $0 |
| Total | 6,403 (100.0%) | $79,887 |
Family Income by Number of Earners in Austin
The median family income in Austin is $79,887, with families comprising 3+ earners (677) having the highest median family income of $106,865, while families with 1 earner (2,000) have the lowest median family income of $45,472, accounting for 10.6% and 31.2% of families, respectively.
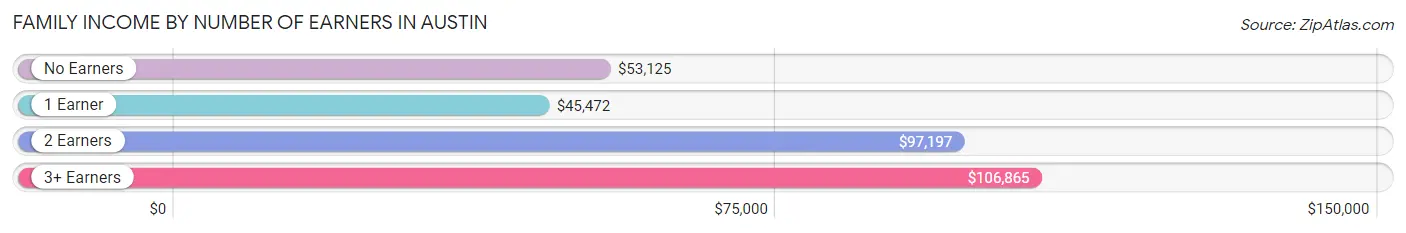
| Number of Earners | # Families | Median Income |
| No Earners | 1,010 (15.8%) | $53,125 |
| 1 Earner | 2,000 (31.2%) | $45,472 |
| 2 Earners | 2,716 (42.4%) | $97,197 |
| 3+ Earners | 677 (10.6%) | $106,865 |
| Total | 6,403 (100.0%) | $79,887 |
Household Income in Austin
Household Income Brackets in Austin
With 2,065 households falling in the category, the $50,000 to $74,999 income range is the most frequent in Austin, accounting for 20.3% of all households. In contrast, only 295 households (2.9%) fall into the less than $10,000 income bracket, making it the least populous group.
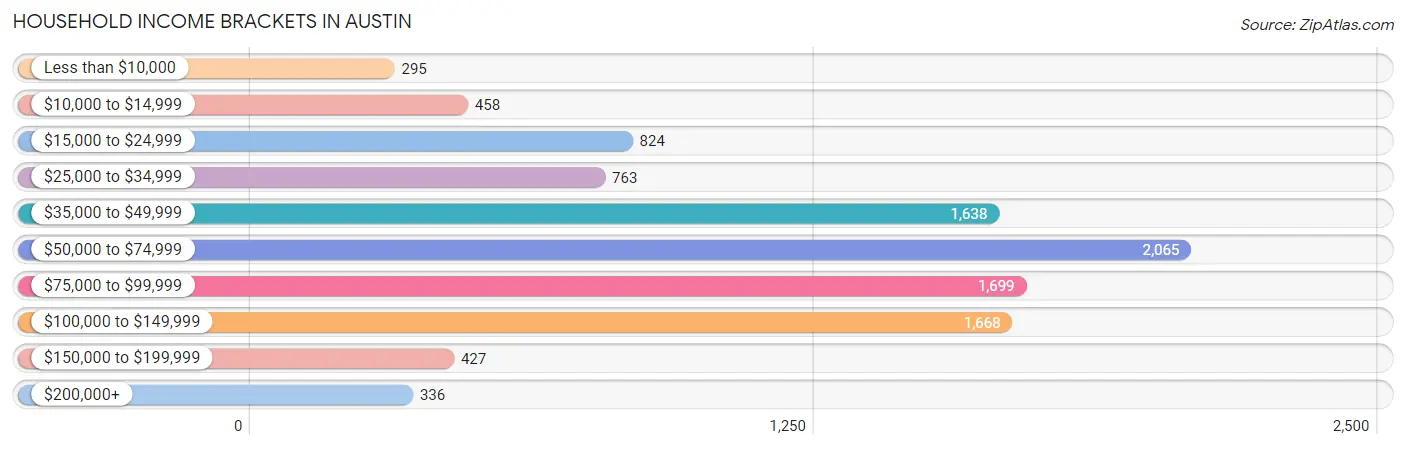
| Income Bracket | # Households | % Households |
| Less than $10,000 | 295 | 2.9% |
| $10,000 to $14,999 | 458 | 4.5% |
| $15,000 to $24,999 | 824 | 8.1% |
| $25,000 to $34,999 | 763 | 7.5% |
| $35,000 to $49,999 | 1,638 | 16.1% |
| $50,000 to $74,999 | 2,065 | 20.3% |
| $75,000 to $99,999 | 1,699 | 16.7% |
| $100,000 to $149,999 | 1,668 | 16.4% |
| $150,000 to $199,999 | 427 | 4.2% |
| $200,000+ | 336 | 3.3% |
Household Income by Householder Age in Austin
The median household income in Austin is $61,667, with the highest median household income of $70,250 found in the 25 to 44 years age bracket for the primary householder. A total of 3,665 households (36.0%) fall into this category. Meanwhile, the 15 to 24 years age bracket for the primary householder has the lowest median household income of $50,104, with 569 households (5.6%) in this group.
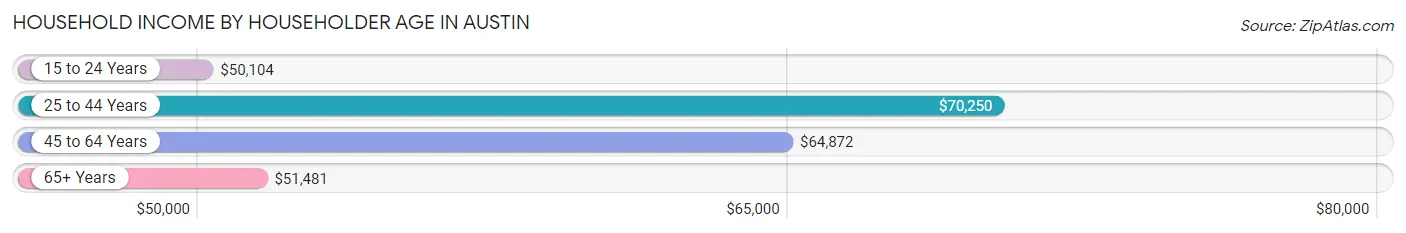
| Income Bracket | # Households | Median Income |
| 15 to 24 Years | 569 (5.6%) | $50,104 |
| 25 to 44 Years | 3,665 (36.0%) | $70,250 |
| 45 to 64 Years | 3,102 (30.5%) | $64,872 |
| 65+ Years | 2,836 (27.9%) | $51,481 |
| Total | 10,172 (100.0%) | $61,667 |
Poverty in Austin
Income Below Poverty by Sex and Age in Austin
With 12.2% poverty level for males and 16.6% for females among the residents of Austin, 5 year old males and 16 and 17 year old females are the most vulnerable to poverty, with 171 males (51.8%) and 136 females (42.5%) in their respective age groups living below the poverty level.
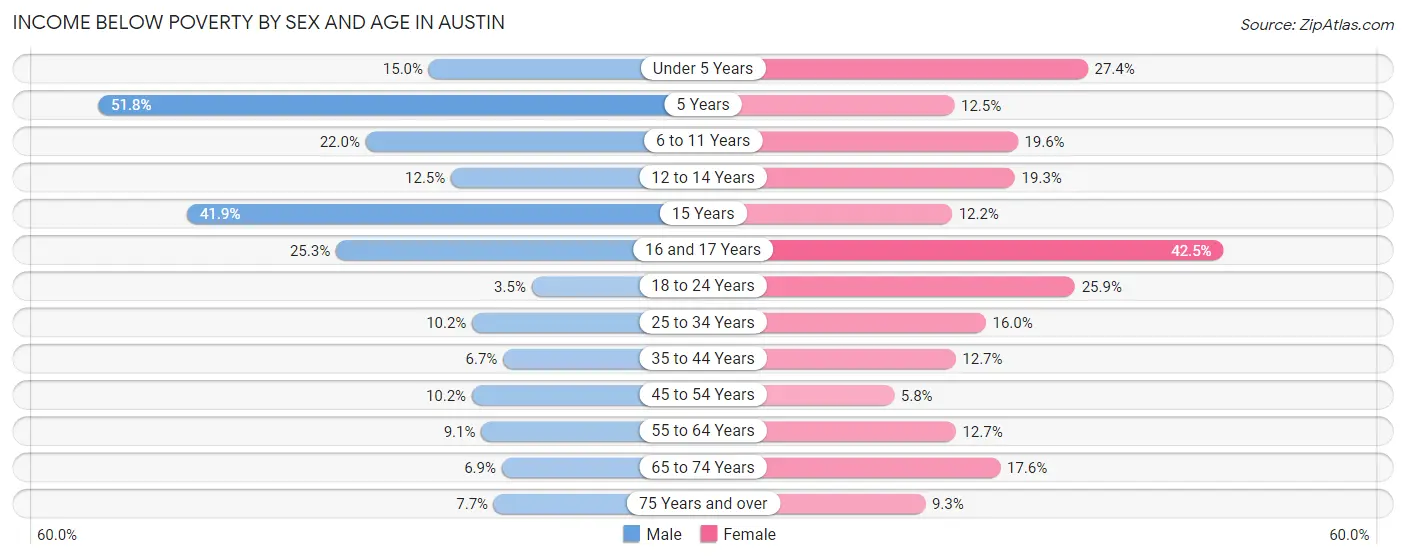
| Age Bracket | Male | Female |
| Under 5 Years | 142 (15.0%) | 283 (27.4%) |
| 5 Years | 171 (51.8%) | 14 (12.5%) |
| 6 to 11 Years | 259 (22.0%) | 222 (19.6%) |
| 12 to 14 Years | 35 (12.5%) | 123 (19.3%) |
| 15 Years | 127 (41.9%) | 12 (12.2%) |
| 16 and 17 Years | 100 (25.3%) | 136 (42.5%) |
| 18 to 24 Years | 39 (3.5%) | 263 (25.9%) |
| 25 to 34 Years | 179 (10.2%) | 251 (16.0%) |
| 35 to 44 Years | 130 (6.7%) | 206 (12.7%) |
| 45 to 54 Years | 134 (10.2%) | 70 (5.8%) |
| 55 to 64 Years | 138 (9.1%) | 177 (12.7%) |
| 65 to 74 Years | 77 (6.9%) | 204 (17.6%) |
| 75 Years and over | 64 (7.7%) | 112 (9.3%) |
| Total | 1,595 (12.2%) | 2,073 (16.6%) |
Income Above Poverty by Sex and Age in Austin
According to the poverty statistics in Austin, males aged 18 to 24 years and females aged 45 to 54 years are the age groups that are most secure financially, with 96.5% of males and 94.2% of females in these age groups living above the poverty line.
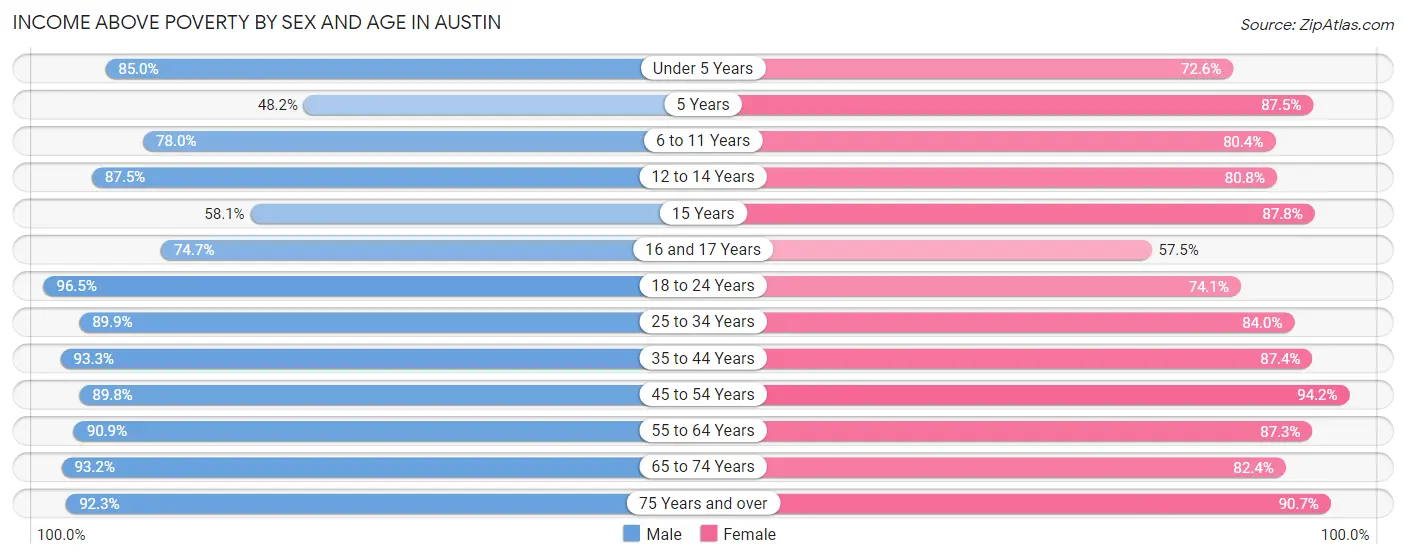
| Age Bracket | Male | Female |
| Under 5 Years | 806 (85.0%) | 751 (72.6%) |
| 5 Years | 159 (48.2%) | 98 (87.5%) |
| 6 to 11 Years | 918 (78.0%) | 913 (80.4%) |
| 12 to 14 Years | 245 (87.5%) | 516 (80.7%) |
| 15 Years | 176 (58.1%) | 86 (87.8%) |
| 16 and 17 Years | 295 (74.7%) | 184 (57.5%) |
| 18 to 24 Years | 1,069 (96.5%) | 751 (74.1%) |
| 25 to 34 Years | 1,584 (89.8%) | 1,317 (84.0%) |
| 35 to 44 Years | 1,810 (93.3%) | 1,423 (87.4%) |
| 45 to 54 Years | 1,182 (89.8%) | 1,136 (94.2%) |
| 55 to 64 Years | 1,372 (90.9%) | 1,221 (87.3%) |
| 65 to 74 Years | 1,047 (93.1%) | 954 (82.4%) |
| 75 Years and over | 764 (92.3%) | 1,098 (90.7%) |
| Total | 11,427 (87.7%) | 10,448 (83.4%) |
Income Below Poverty Among Married-Couple Families in Austin
The poverty statistics for married-couple families in Austin show that 4.5% or 213 of the total 4,724 families live below the poverty line. Families with 5 or more children have the highest poverty rate of 62.1%, comprising of 72 families. On the other hand, families with 1 or 2 children have the lowest poverty rate of 1.1%, which includes 15 families.
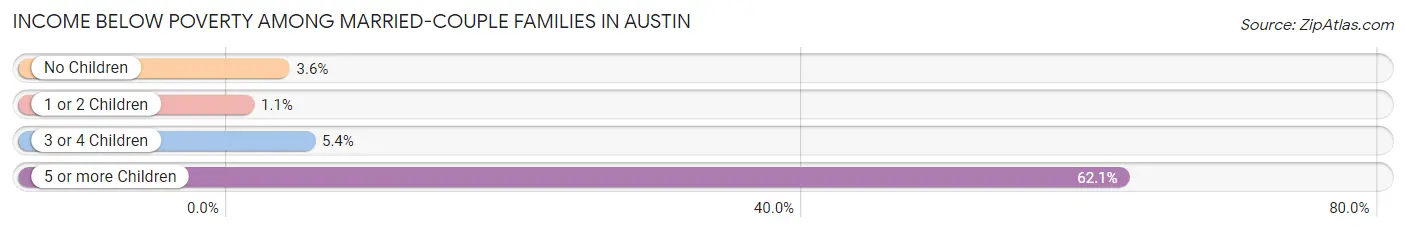
| Children | Above Poverty | Below Poverty |
| No Children | 2,685 (96.4%) | 100 (3.6%) |
| 1 or 2 Children | 1,323 (98.9%) | 15 (1.1%) |
| 3 or 4 Children | 459 (94.6%) | 26 (5.4%) |
| 5 or more Children | 44 (37.9%) | 72 (62.1%) |
| Total | 4,511 (95.5%) | 213 (4.5%) |
Income Below Poverty Among Single-Parent Households in Austin
According to the poverty data in Austin, 8.8% or 43 single-father households and 29.7% or 354 single-mother households are living below the poverty line. Among single-father households, those with 3 or 4 children have the highest poverty rate, with 6 households (15.8%) experiencing poverty. Likewise, among single-mother households, those with 1 or 2 children have the highest poverty rate, with 312 households (37.1%) falling below the poverty line.
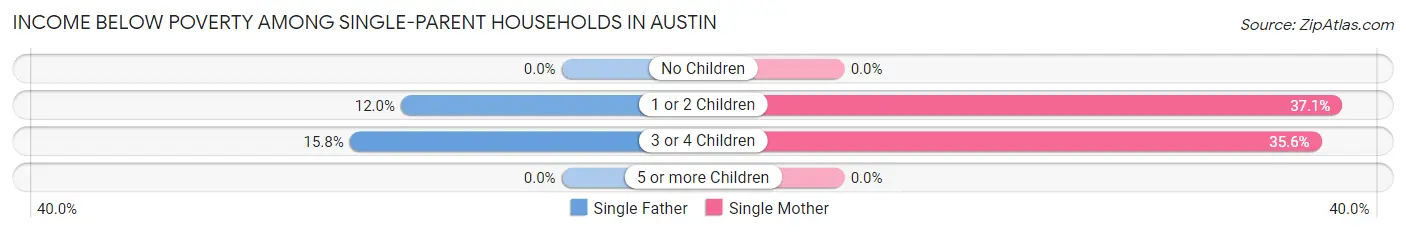
| Children | Single Father | Single Mother |
| No Children | 0 (0.0%) | 0 (0.0%) |
| 1 or 2 Children | 37 (12.0%) | 312 (37.1%) |
| 3 or 4 Children | 6 (15.8%) | 42 (35.6%) |
| 5 or more Children | 0 (0.0%) | 0 (0.0%) |
| Total | 43 (8.8%) | 354 (29.7%) |
Income Below Poverty Among Married-Couple vs Single-Parent Households in Austin
The poverty data for Austin shows that 213 of the married-couple family households (4.5%) and 397 of the single-parent households (23.6%) are living below the poverty level. Within the married-couple family households, those with 5 or more children have the highest poverty rate, with 72 households (62.1%) falling below the poverty line. Among the single-parent households, those with 3 or 4 children have the highest poverty rate, with 48 household (30.8%) living below poverty.
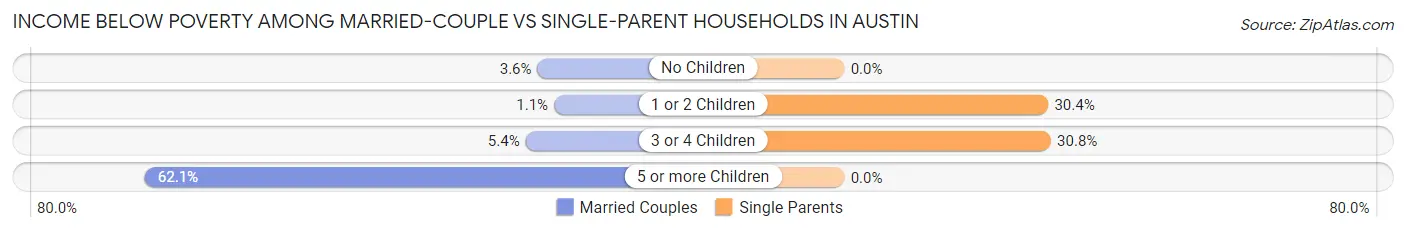
| Children | Married-Couple Families | Single-Parent Households |
| No Children | 100 (3.6%) | 0 (0.0%) |
| 1 or 2 Children | 15 (1.1%) | 349 (30.4%) |
| 3 or 4 Children | 26 (5.4%) | 48 (30.8%) |
| 5 or more Children | 72 (62.1%) | 0 (0.0%) |
| Total | 213 (4.5%) | 397 (23.6%) |
Race in Austin
The most populous races in Austin are White / Caucasian (19,262 | 73.6%), Hispanic or Latino (4,561 | 17.4%), and Asian (2,114 | 8.1%).
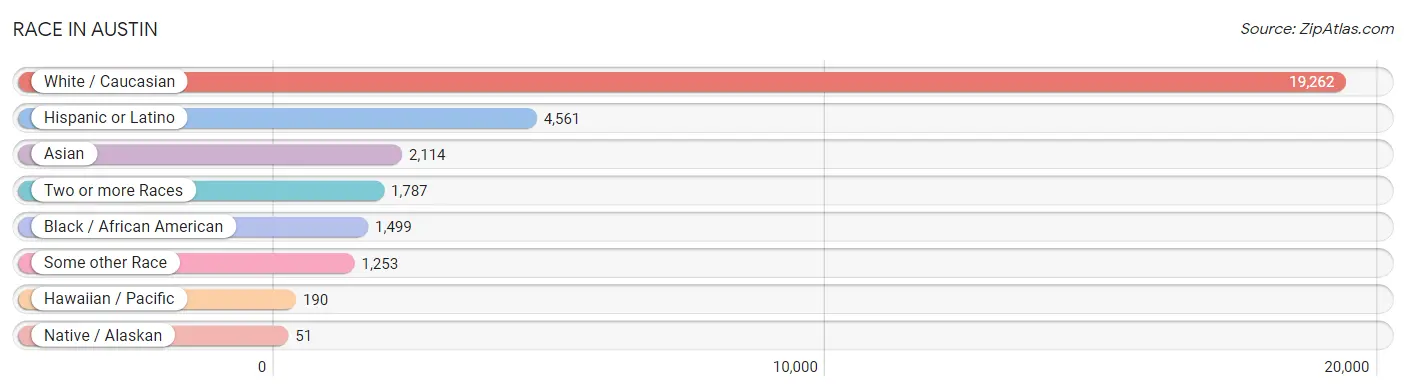
| Race | # Population | % Population |
| Asian | 2,114 | 8.1% |
| Black / African American | 1,499 | 5.7% |
| Hawaiian / Pacific | 190 | 0.7% |
| Hispanic or Latino | 4,561 | 17.4% |
| Native / Alaskan | 51 | 0.2% |
| White / Caucasian | 19,262 | 73.6% |
| Two or more Races | 1,787 | 6.8% |
| Some other Race | 1,253 | 4.8% |
| Total | 26,156 | 100.0% |
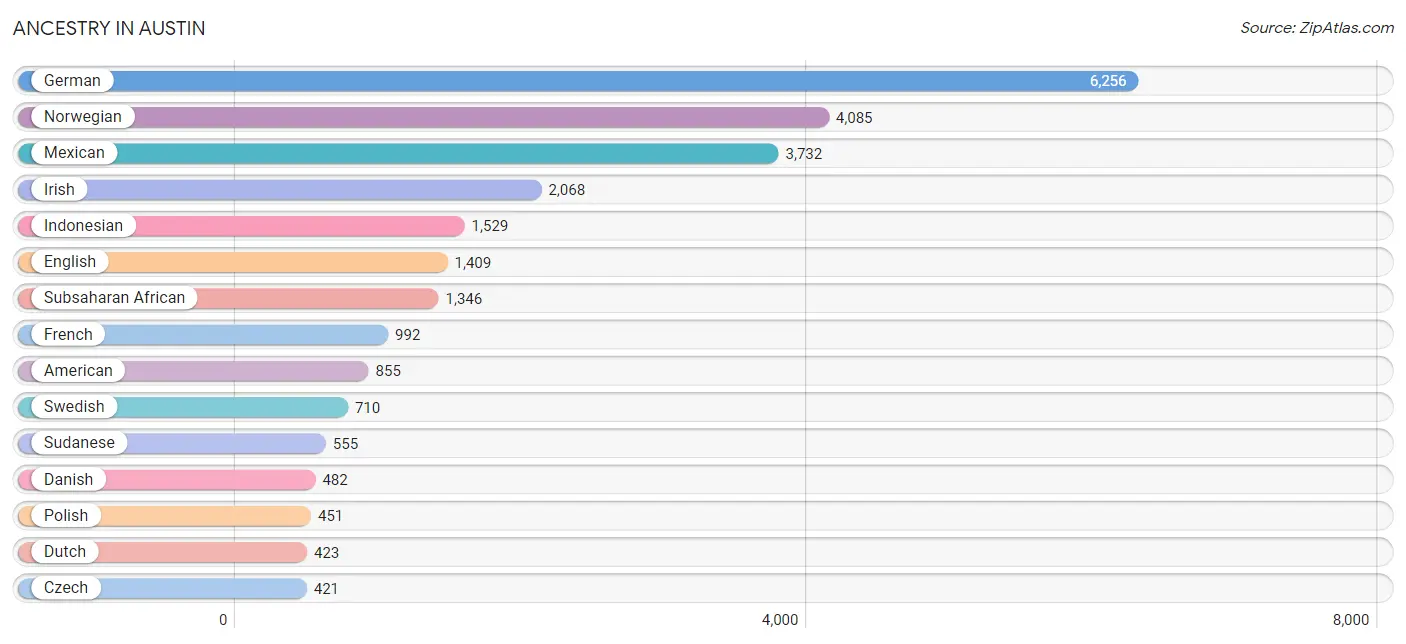
Ancestry in Austin
The most populous ancestries reported in Austin are German (6,256 | 23.9%), Norwegian (4,085 | 15.6%), Mexican (3,732 | 14.3%), Irish (2,068 | 7.9%), and Indonesian (1,529 | 5.9%), together accounting for 67.6% of all Austin residents.
| Ancestry | # Population | % Population |
| African | 200 | 0.8% |
| American | 855 | 3.3% |
| Arab | 13 | 0.1% |
| Austrian | 16 | 0.1% |
| Bangladeshi | 3 | 0.0% |
| Belgian | 132 | 0.5% |
| Bhutanese | 12 | 0.1% |
| British | 32 | 0.1% |
| Burmese | 8 | 0.0% |
| Celtic | 24 | 0.1% |
| Central American | 184 | 0.7% |
| Cherokee | 18 | 0.1% |
| Cheyenne | 4 | 0.0% |
| Chilean | 26 | 0.1% |
| Chippewa | 8 | 0.0% |
| Colombian | 35 | 0.1% |
| Cree | 7 | 0.0% |
| Cuban | 314 | 1.2% |
| Czech | 421 | 1.6% |
| Czechoslovakian | 83 | 0.3% |
| Danish | 482 | 1.8% |
| Dutch | 423 | 1.6% |
| Eastern European | 62 | 0.2% |
| Ecuadorian | 52 | 0.2% |
| English | 1,409 | 5.4% |
| Ethiopian | 286 | 1.1% |
| European | 264 | 1.0% |
| Finnish | 69 | 0.3% |
| French | 992 | 3.8% |
| French Canadian | 235 | 0.9% |
| German | 6,256 | 23.9% |
| Greek | 30 | 0.1% |
| Guatemalan | 107 | 0.4% |
| Guyanese | 10 | 0.0% |
| Honduran | 8 | 0.0% |
| Indian (Asian) | 148 | 0.6% |
| Indonesian | 1,529 | 5.9% |
| Iranian | 12 | 0.1% |
| Irish | 2,068 | 7.9% |
| Italian | 107 | 0.4% |
| Japanese | 123 | 0.5% |
| Korean | 45 | 0.2% |
| Liberian | 192 | 0.7% |
| Lithuanian | 7 | 0.0% |
| Luxembourger | 14 | 0.1% |
| Mexican | 3,732 | 14.3% |
| Mexican American Indian | 72 | 0.3% |
| Native Hawaiian | 5 | 0.0% |
| Northern European | 90 | 0.3% |
| Norwegian | 4,085 | 15.6% |
| Pakistani | 128 | 0.5% |
| Pennsylvania German | 29 | 0.1% |
| Polish | 451 | 1.7% |
| Puerto Rican | 41 | 0.2% |
| Russian | 81 | 0.3% |
| Salvadoran | 69 | 0.3% |
| Scandinavian | 236 | 0.9% |
| Scotch-Irish | 27 | 0.1% |
| Scottish | 342 | 1.3% |
| Sioux | 1 | 0.0% |
| Slovak | 13 | 0.1% |
| Slovene | 7 | 0.0% |
| South American | 113 | 0.4% |
| Spaniard | 3 | 0.0% |
| Sri Lankan | 46 | 0.2% |
| Subsaharan African | 1,346 | 5.1% |
| Sudanese | 555 | 2.1% |
| Swedish | 710 | 2.7% |
| Swiss | 49 | 0.2% |
| Thai | 135 | 0.5% |
| Ukrainian | 18 | 0.1% |
| Welsh | 278 | 1.1% | View All 72 Rows |
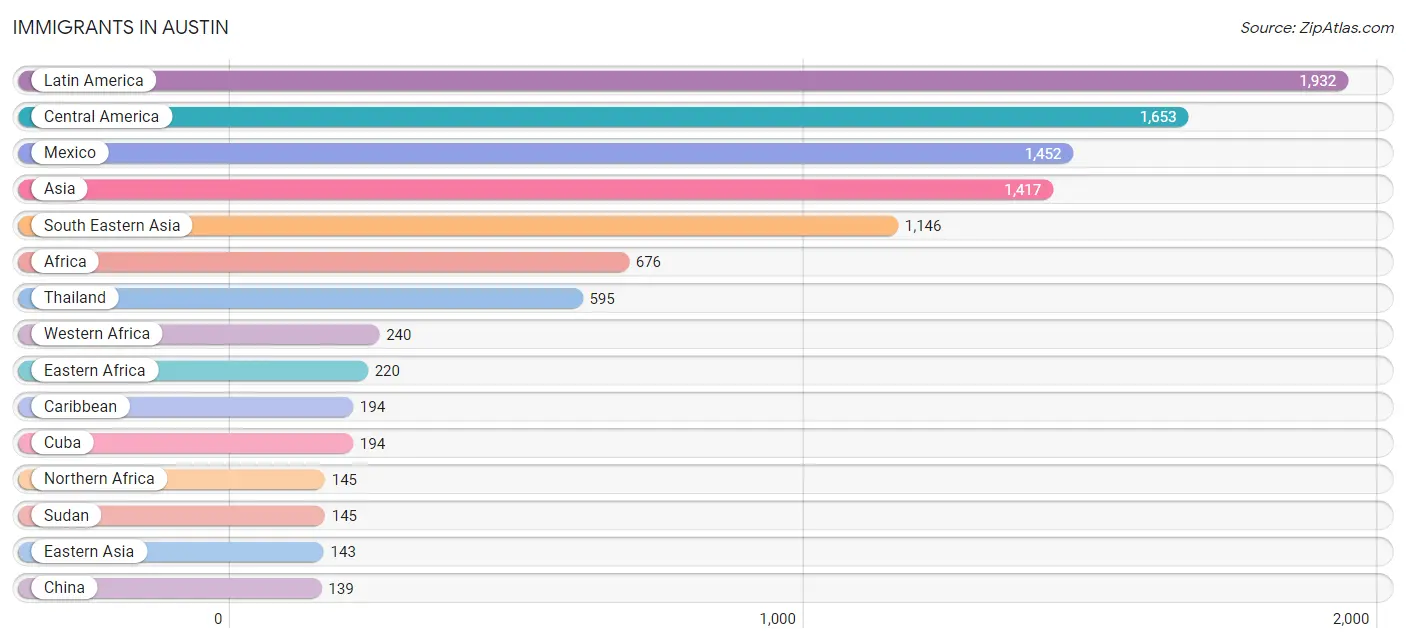
Immigrants in Austin
The most numerous immigrant groups reported in Austin came from Latin America (1,932 | 7.4%), Central America (1,653 | 6.3%), Mexico (1,452 | 5.6%), Asia (1,417 | 5.4%), and South Eastern Asia (1,146 | 4.4%), together accounting for 29.1% of all Austin residents.
| Immigration Origin | # Population | % Population |
| Africa | 676 | 2.6% |
| Asia | 1,417 | 5.4% |
| Cambodia | 30 | 0.1% |
| Caribbean | 194 | 0.7% |
| Central America | 1,653 | 6.3% |
| Chile | 26 | 0.1% |
| China | 139 | 0.5% |
| Colombia | 35 | 0.1% |
| Cuba | 194 | 0.7% |
| Czechoslovakia | 7 | 0.0% |
| Eastern Africa | 220 | 0.8% |
| Eastern Asia | 143 | 0.5% |
| Eastern Europe | 13 | 0.1% |
| Ecuador | 14 | 0.1% |
| El Salvador | 27 | 0.1% |
| England | 8 | 0.0% |
| Ethiopia | 110 | 0.4% |
| Europe | 126 | 0.5% |
| Germany | 85 | 0.3% |
| Guatemala | 107 | 0.4% |
| Guyana | 10 | 0.0% |
| Honduras | 67 | 0.3% |
| India | 75 | 0.3% |
| Italy | 10 | 0.0% |
| Japan | 4 | 0.0% |
| Kenya | 55 | 0.2% |
| Laos | 3 | 0.0% |
| Latin America | 1,932 | 7.4% |
| Latvia | 6 | 0.0% |
| Liberia | 79 | 0.3% |
| Mexico | 1,452 | 5.6% |
| Micronesia | 64 | 0.2% |
| Middle Africa | 10 | 0.0% |
| Northern Africa | 145 | 0.5% |
| Northern Europe | 8 | 0.0% |
| Oceania | 64 | 0.2% |
| Philippines | 55 | 0.2% |
| South Africa | 7 | 0.0% |
| South America | 85 | 0.3% |
| South Central Asia | 128 | 0.5% |
| South Eastern Asia | 1,146 | 4.4% |
| Southern Europe | 20 | 0.1% |
| Spain | 10 | 0.0% |
| Sri Lanka | 53 | 0.2% |
| Sudan | 145 | 0.5% |
| Thailand | 595 | 2.3% |
| Vietnam | 53 | 0.2% |
| Western Africa | 240 | 0.9% |
| Western Europe | 85 | 0.3% | View All 49 Rows |
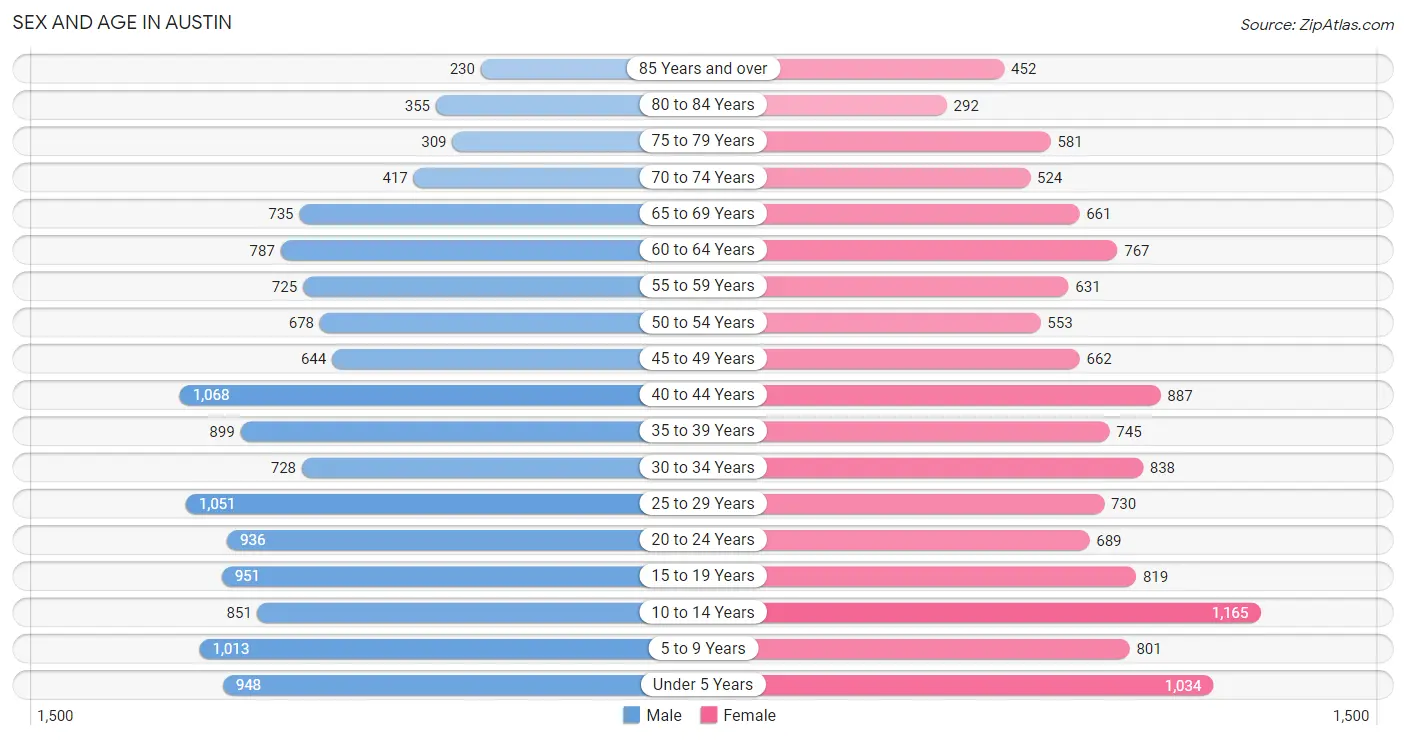
Sex and Age in Austin
Sex and Age in Austin
The most populous age groups in Austin are 40 to 44 Years (1,068 | 8.0%) for men and 10 to 14 Years (1,165 | 9.1%) for women.
| Age Bracket | Male | Female |
| Under 5 Years | 948 (7.1%) | 1,034 (8.1%) |
| 5 to 9 Years | 1,013 (7.6%) | 801 (6.2%) |
| 10 to 14 Years | 851 (6.4%) | 1,165 (9.1%) |
| 15 to 19 Years | 951 (7.1%) | 819 (6.4%) |
| 20 to 24 Years | 936 (7.0%) | 689 (5.4%) |
| 25 to 29 Years | 1,051 (7.9%) | 730 (5.7%) |
| 30 to 34 Years | 728 (5.5%) | 838 (6.5%) |
| 35 to 39 Years | 899 (6.8%) | 745 (5.8%) |
| 40 to 44 Years | 1,068 (8.0%) | 887 (6.9%) |
| 45 to 49 Years | 644 (4.8%) | 662 (5.2%) |
| 50 to 54 Years | 678 (5.1%) | 553 (4.3%) |
| 55 to 59 Years | 725 (5.4%) | 631 (4.9%) |
| 60 to 64 Years | 787 (5.9%) | 767 (6.0%) |
| 65 to 69 Years | 735 (5.5%) | 661 (5.1%) |
| 70 to 74 Years | 417 (3.1%) | 524 (4.1%) |
| 75 to 79 Years | 309 (2.3%) | 581 (4.5%) |
| 80 to 84 Years | 355 (2.7%) | 292 (2.3%) |
| 85 Years and over | 230 (1.7%) | 452 (3.5%) |
| Total | 13,325 (100.0%) | 12,831 (100.0%) |
Families and Households in Austin
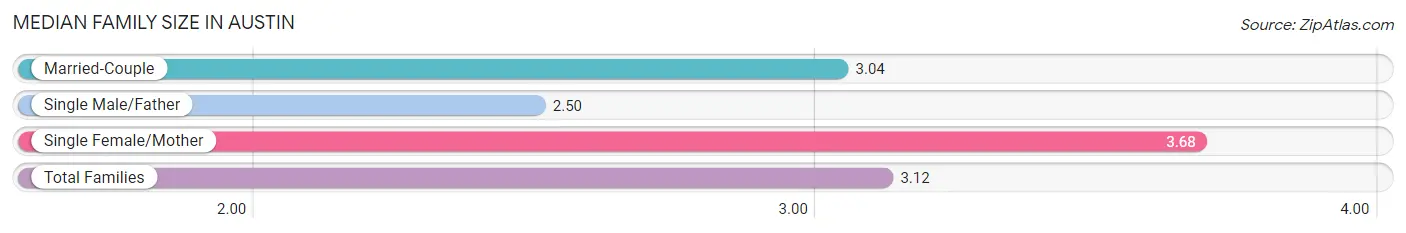
Median Family Size in Austin
The median family size in Austin is 3.12 persons per family, with single female/mother families (1,192 | 18.6%) accounting for the largest median family size of 3.68 persons per family. On the other hand, single male/father families (487 | 7.6%) represent the smallest median family size with 2.50 persons per family.
| Family Type | # Families | Family Size |
| Married-Couple | 4,724 (73.8%) | 3.04 |
| Single Male/Father | 487 (7.6%) | 2.50 |
| Single Female/Mother | 1,192 (18.6%) | 3.68 |
| Total Families | 6,403 (100.0%) | 3.12 |
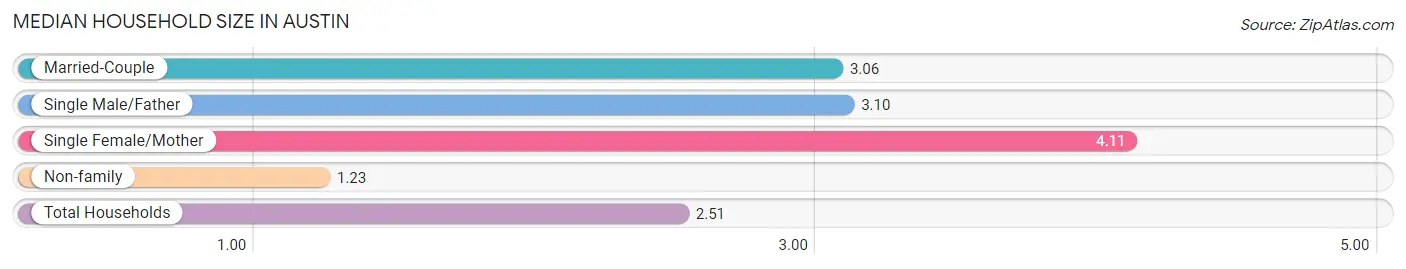
Median Household Size in Austin
The median household size in Austin is 2.51 persons per household, with single female/mother households (1,192 | 11.7%) accounting for the largest median household size of 4.11 persons per household. non-family households (3,769 | 37.0%) represent the smallest median household size with 1.23 persons per household.
| Household Type | # Households | Household Size |
| Married-Couple | 4,724 (46.4%) | 3.06 |
| Single Male/Father | 487 (4.8%) | 3.10 |
| Single Female/Mother | 1,192 (11.7%) | 4.11 |
| Non-family | 3,769 (37.0%) | 1.23 |
| Total Households | 10,172 (100.0%) | 2.51 |
Household Size by Marriage Status in Austin
Out of a total of 10,172 households in Austin, 6,403 (62.9%) are family households, while 3,769 (37.0%) are nonfamily households. The most numerous type of family households are 2-person households, comprising 2,742, and the most common type of nonfamily households are 1-person households, comprising 3,169.
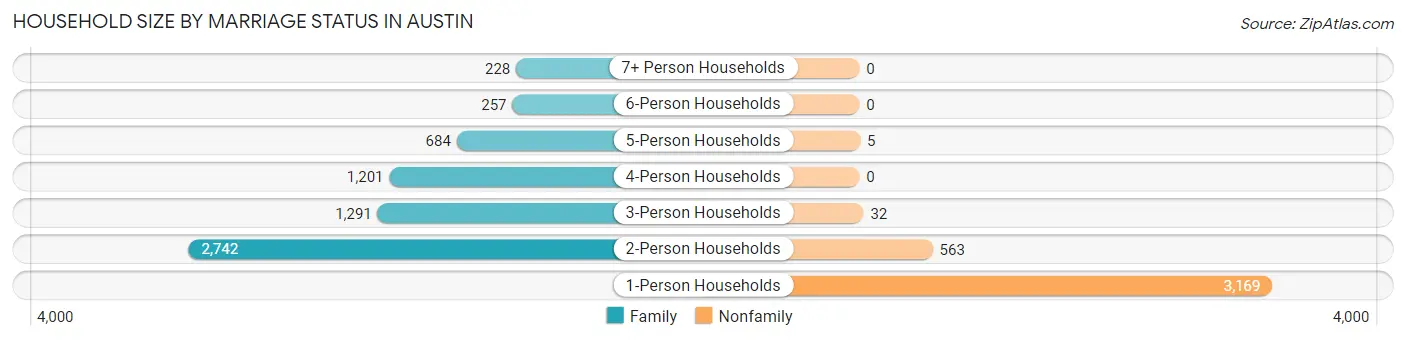
| Household Size | Family Households | Nonfamily Households |
| 1-Person Households | - | 3,169 (31.1%) |
| 2-Person Households | 2,742 (27.0%) | 563 (5.5%) |
| 3-Person Households | 1,291 (12.7%) | 32 (0.3%) |
| 4-Person Households | 1,201 (11.8%) | 0 (0.0%) |
| 5-Person Households | 684 (6.7%) | 5 (0.1%) |
| 6-Person Households | 257 (2.5%) | 0 (0.0%) |
| 7+ Person Households | 228 (2.2%) | 0 (0.0%) |
| Total | 6,403 (62.9%) | 3,769 (37.0%) |
Female Fertility in Austin
Fertility by Age in Austin
Average fertility rate in Austin is 109.0 births per 1,000 women. Women in the age bracket of 20 to 34 years have the highest fertility rate with 230.0 births per 1,000 women. Women in the age bracket of 20 to 34 years acount for 87.7% of all women with births.
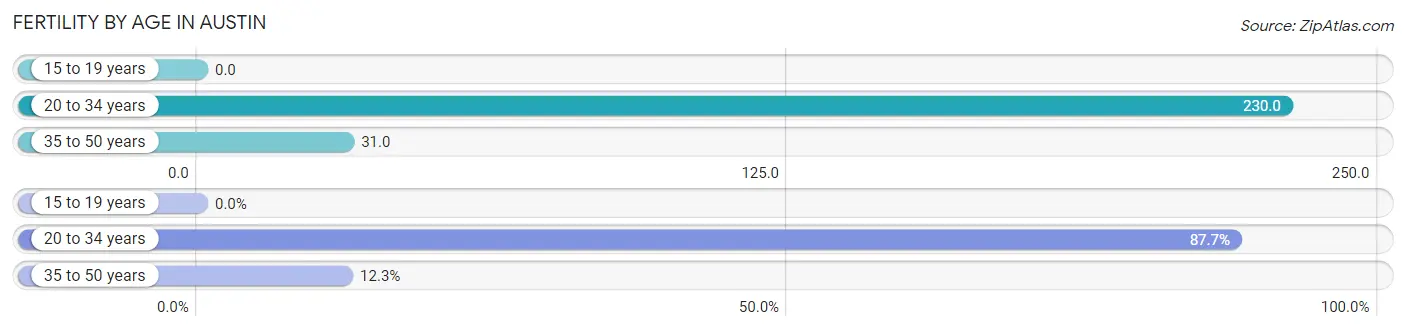
| Age Bracket | Women with Births | Births / 1,000 Women |
| 15 to 19 years | 0 (0.0%) | 0.0 |
| 20 to 34 years | 520 (87.7%) | 230.0 |
| 35 to 50 years | 73 (12.3%) | 31.0 |
| Total | 593 (100.0%) | 109.0 |
Fertility by Age by Marriage Status in Austin
57.2% of women with births (593) in Austin are married. The highest percentage of unmarried women with births falls into 35 to 50 years age bracket with 61.6% of them unmarried at the time of birth, while the lowest percentage of unmarried women with births belong to 20 to 34 years age bracket with 40.2% of them unmarried.
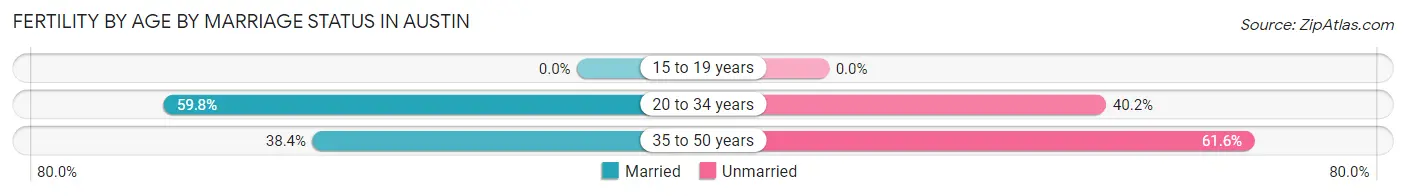
| Age Bracket | Married | Unmarried |
| 15 to 19 years | 0 (0.0%) | 0 (0.0%) |
| 20 to 34 years | 311 (59.8%) | 209 (40.2%) |
| 35 to 50 years | 28 (38.4%) | 45 (61.6%) |
| Total | 339 (57.2%) | 254 (42.8%) |
Fertility by Education in Austin
Average fertility rate in Austin is 109.0 births per 1,000 women. Women with the education attainment of graduate degree have the highest fertility rate of 228.0 births per 1,000 women, while women with the education attainment of college or associate's degree have the lowest fertility at 47.0 births per 1,000 women. Women with the education attainment of bachelor's degree represent 29.5% of all women with births.
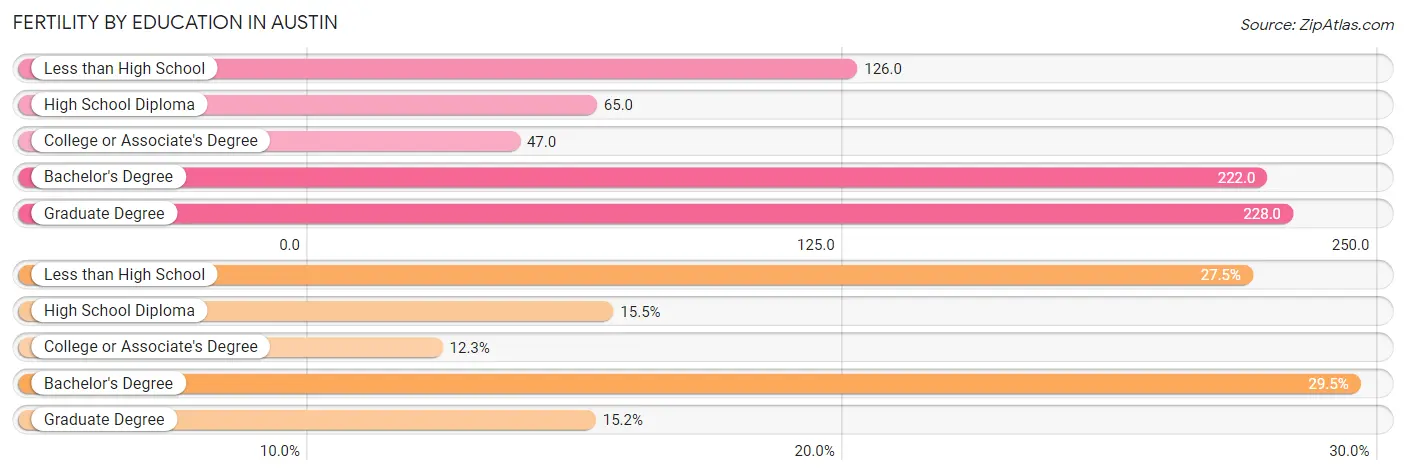
| Educational Attainment | Women with Births | Births / 1,000 Women |
| Less than High School | 163 (27.5%) | 126.0 |
| High School Diploma | 92 (15.5%) | 65.0 |
| College or Associate's Degree | 73 (12.3%) | 47.0 |
| Bachelor's Degree | 175 (29.5%) | 222.0 |
| Graduate Degree | 90 (15.2%) | 228.0 |
| Total | 593 (100.0%) | 109.0 |
Fertility by Education by Marriage Status in Austin
42.8% of women with births in Austin are unmarried. Women with the educational attainment of high school diploma are most likely to be married with 78.3% of them married at childbirth, while women with the educational attainment of less than high school are least likely to be married with 74.2% of them unmarried at childbirth.
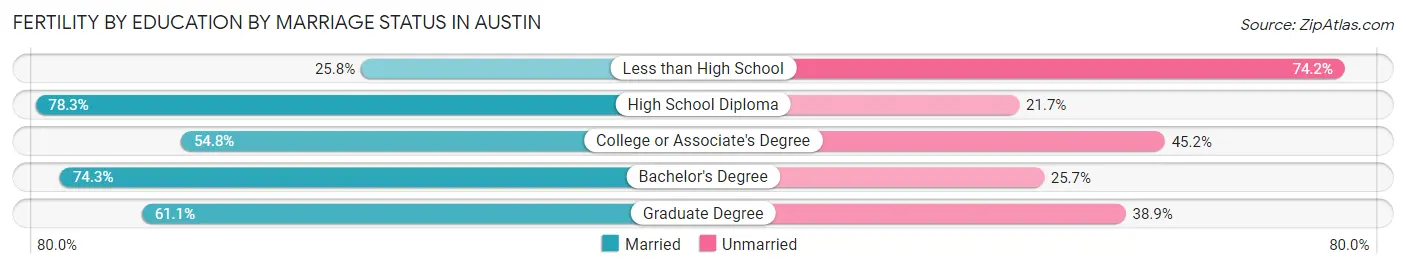
| Educational Attainment | Married | Unmarried |
| Less than High School | 42 (25.8%) | 121 (74.2%) |
| High School Diploma | 72 (78.3%) | 20 (21.7%) |
| College or Associate's Degree | 40 (54.8%) | 33 (45.2%) |
| Bachelor's Degree | 130 (74.3%) | 45 (25.7%) |
| Graduate Degree | 55 (61.1%) | 35 (38.9%) |
| Total | 339 (57.2%) | 254 (42.8%) |
Employment Characteristics in Austin
Employment by Class of Employer in Austin
Among the 12,159 employed individuals in Austin, private company employees (8,526 | 70.1%), not-for-profit organizations (1,503 | 12.4%), and local government employees (1,011 | 8.3%) make up the most common classes of employment.
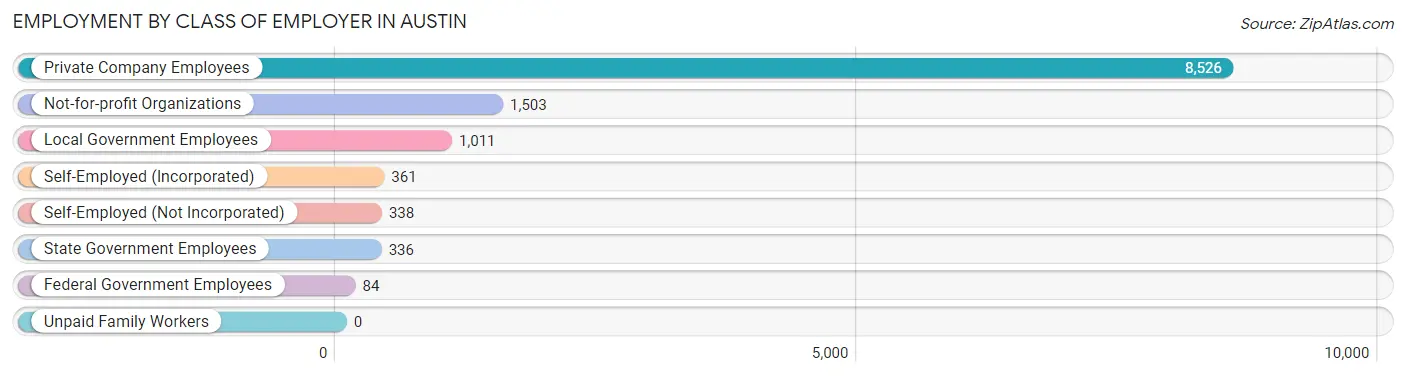
| Employer Class | # Employees | % Employees |
| Private Company Employees | 8,526 | 70.1% |
| Self-Employed (Incorporated) | 361 | 3.0% |
| Self-Employed (Not Incorporated) | 338 | 2.8% |
| Not-for-profit Organizations | 1,503 | 12.4% |
| Local Government Employees | 1,011 | 8.3% |
| State Government Employees | 336 | 2.8% |
| Federal Government Employees | 84 | 0.7% |
| Unpaid Family Workers | 0 | 0.0% |
| Total | 12,159 | 100.0% |
Employment Status by Age in Austin
According to the labor force statistics for Austin, out of the total population over 16 years of age (19,931), 64.0% or 12,756 individuals are in the labor force, with 3.5% or 446 of them unemployed. The age group with the highest labor force participation rate is 25 to 29 years, with 91.1% or 1,622 individuals in the labor force. Within the labor force, the 16 to 19 years age range has the highest percentage of unemployed individuals, with 21.4% or 132 of them being unemployed.
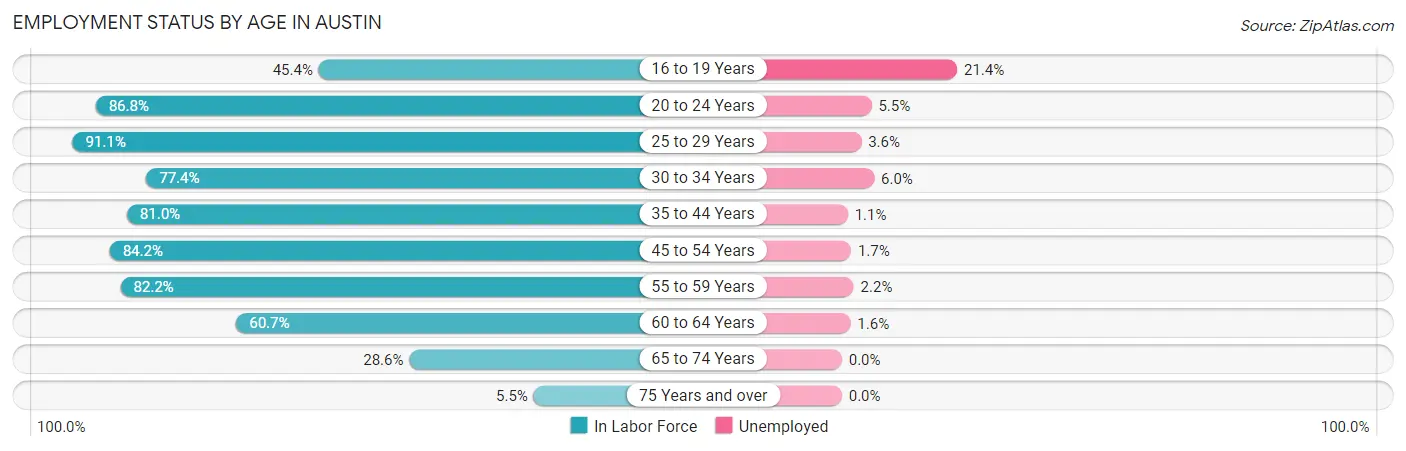
| Age Bracket | In Labor Force | Unemployed |
| 16 to 19 Years | 616 (45.4%) | 132 (21.4%) |
| 20 to 24 Years | 1,410 (86.8%) | 78 (5.5%) |
| 25 to 29 Years | 1,622 (91.1%) | 58 (3.6%) |
| 30 to 34 Years | 1,212 (77.4%) | 73 (6.0%) |
| 35 to 44 Years | 2,915 (81.0%) | 32 (1.1%) |
| 45 to 54 Years | 2,136 (84.2%) | 36 (1.7%) |
| 55 to 59 Years | 1,115 (82.2%) | 25 (2.2%) |
| 60 to 64 Years | 943 (60.7%) | 15 (1.6%) |
| 65 to 74 Years | 668 (28.6%) | 0 (0.0%) |
| 75 Years and over | 122 (5.5%) | 0 (0.0%) |
| Total | 12,756 (64.0%) | 446 (3.5%) |
Employment Status by Educational Attainment in Austin
According to labor force statistics for Austin, 80.2% of individuals (9,939) out of the total population between 25 and 64 years of age (12,393) are in the labor force, with 2.4% or 239 of them being unemployed. The group with the highest labor force participation rate are those with the educational attainment of college / associate degree, with 82.9% or 3,162 individuals in the labor force. Within the labor force, individuals with high school diploma education have the highest percentage of unemployment, with 4.1% or 133 of them being unemployed.
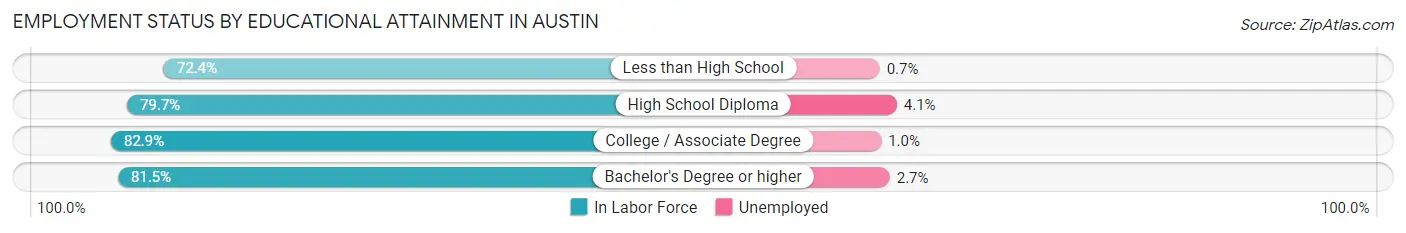
| Educational Attainment | In Labor Force | Unemployed |
| Less than High School | 1,114 (72.4%) | 11 (0.7%) |
| High School Diploma | 3,241 (79.7%) | 167 (4.1%) |
| College / Associate Degree | 3,162 (82.9%) | 38 (1.0%) |
| Bachelor's Degree or higher | 2,424 (81.5%) | 80 (2.7%) |
| Total | 9,939 (80.2%) | 297 (2.4%) |
Employment Occupations by Sex in Austin
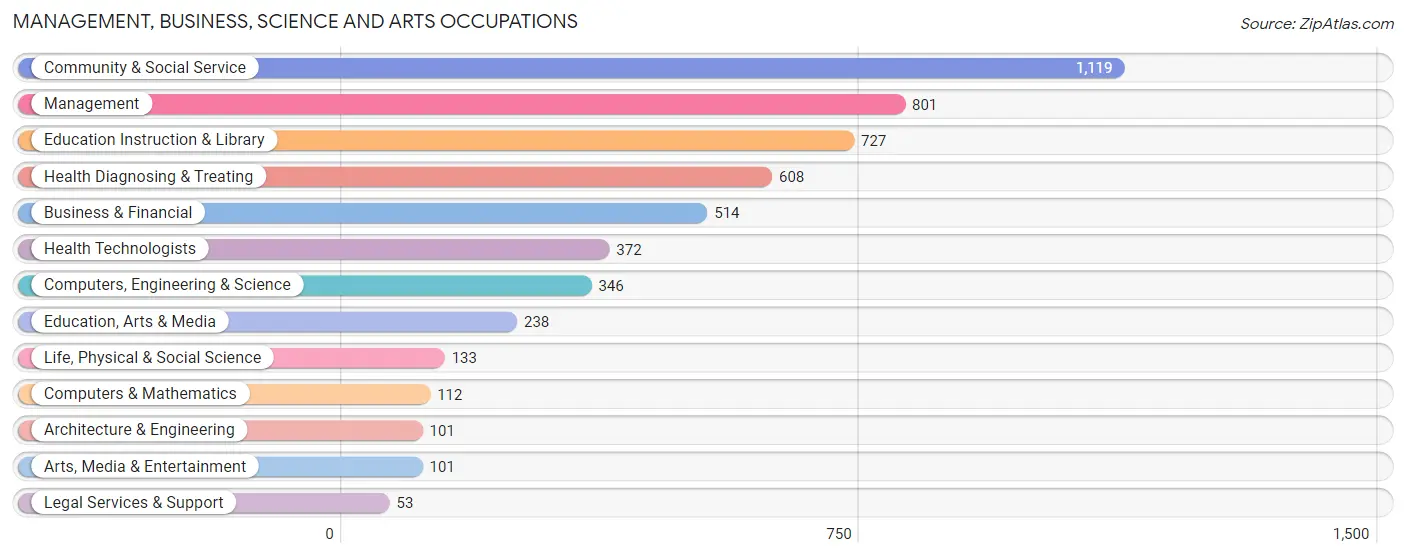
Management, Business, Science and Arts Occupations
The most common Management, Business, Science and Arts occupations in Austin are Community & Social Service (1,119 | 9.1%), Management (801 | 6.5%), Education Instruction & Library (727 | 5.9%), Health Diagnosing & Treating (608 | 4.9%), and Business & Financial (514 | 4.2%).
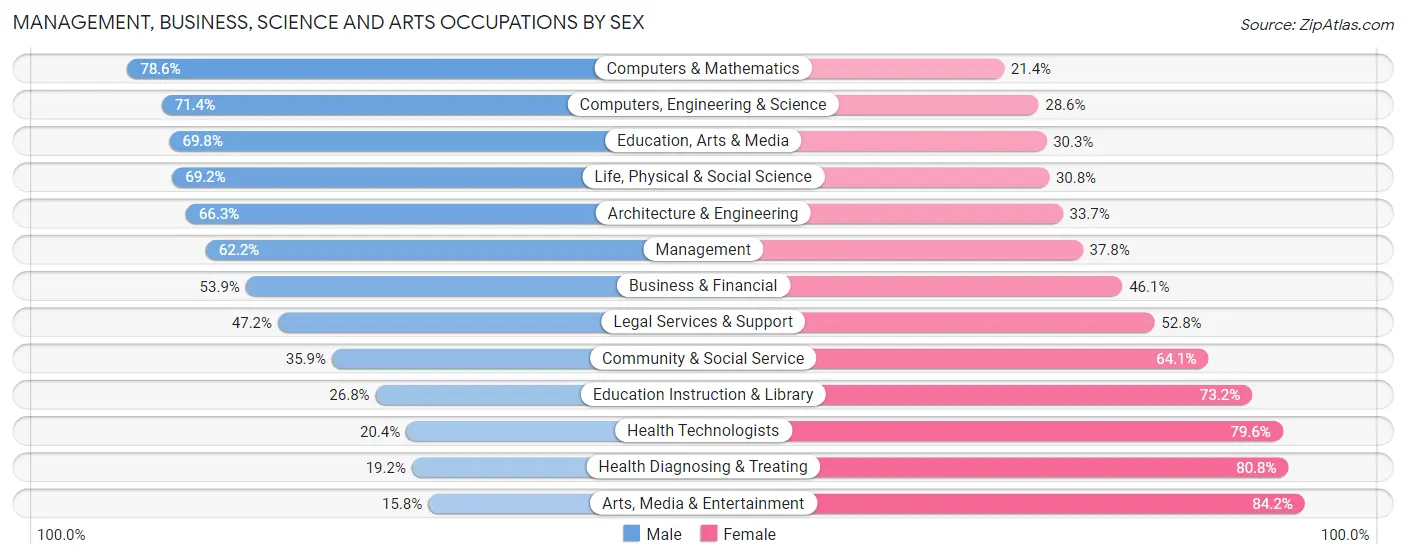
Management, Business, Science and Arts Occupations by Sex
Within the Management, Business, Science and Arts occupations in Austin, the most male-oriented occupations are Computers & Mathematics (78.6%), Computers, Engineering & Science (71.4%), and Education, Arts & Media (69.8%), while the most female-oriented occupations are Arts, Media & Entertainment (84.2%), Health Diagnosing & Treating (80.8%), and Health Technologists (79.6%).
| Occupation | Male | Female |
| Management | 498 (62.2%) | 303 (37.8%) |
| Business & Financial | 277 (53.9%) | 237 (46.1%) |
| Computers, Engineering & Science | 247 (71.4%) | 99 (28.6%) |
| Computers & Mathematics | 88 (78.6%) | 24 (21.4%) |
| Architecture & Engineering | 67 (66.3%) | 34 (33.7%) |
| Life, Physical & Social Science | 92 (69.2%) | 41 (30.8%) |
| Community & Social Service | 402 (35.9%) | 717 (64.1%) |
| Education, Arts & Media | 166 (69.8%) | 72 (30.2%) |
| Legal Services & Support | 25 (47.2%) | 28 (52.8%) |
| Education Instruction & Library | 195 (26.8%) | 532 (73.2%) |
| Arts, Media & Entertainment | 16 (15.8%) | 85 (84.2%) |
| Health Diagnosing & Treating | 117 (19.2%) | 491 (80.8%) |
| Health Technologists | 76 (20.4%) | 296 (79.6%) |
| Total (Category) | 1,541 (45.5%) | 1,847 (54.5%) |
| Total (Overall) | 6,943 (56.4%) | 5,365 (43.6%) |
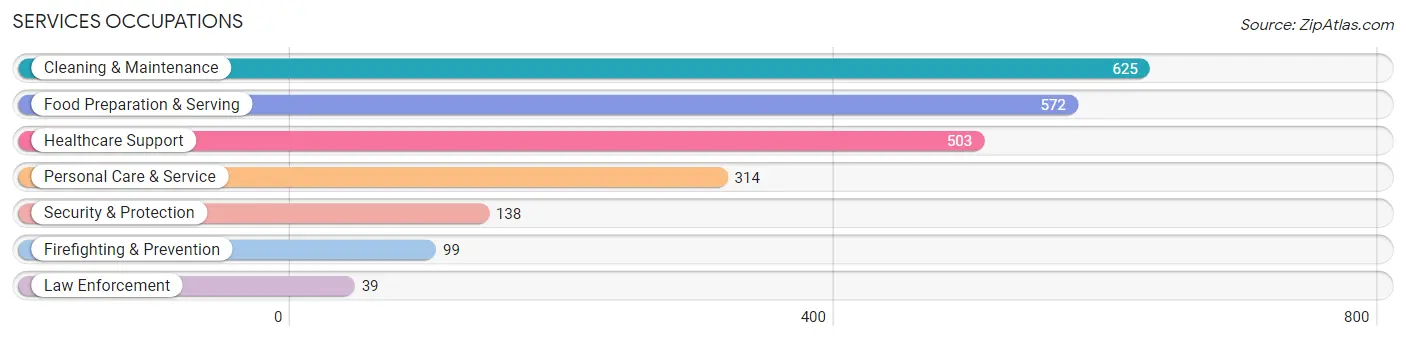
Services Occupations
The most common Services occupations in Austin are Cleaning & Maintenance (625 | 5.1%), Food Preparation & Serving (572 | 4.6%), Healthcare Support (503 | 4.1%), Personal Care & Service (314 | 2.5%), and Security & Protection (138 | 1.1%).
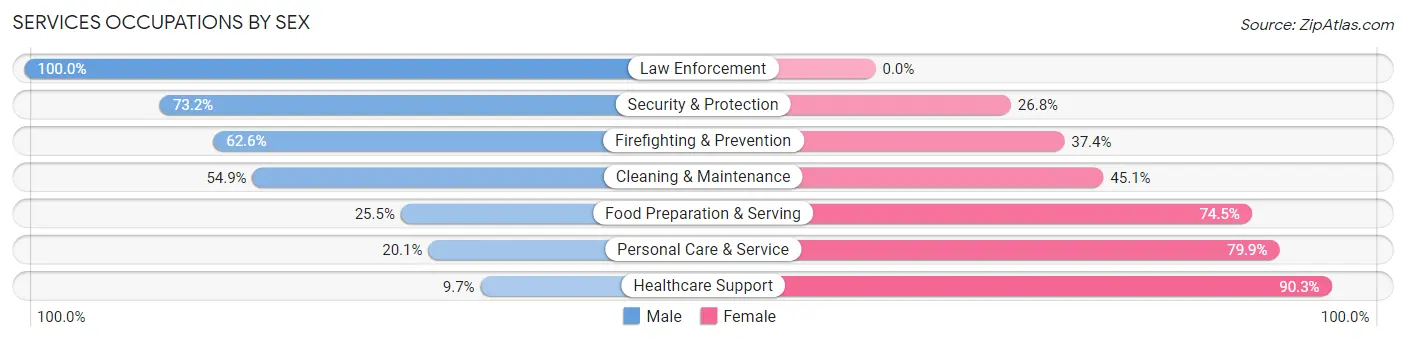
Services Occupations by Sex
Within the Services occupations in Austin, the most male-oriented occupations are Law Enforcement (100.0%), Security & Protection (73.2%), and Firefighting & Prevention (62.6%), while the most female-oriented occupations are Healthcare Support (90.3%), Personal Care & Service (79.9%), and Food Preparation & Serving (74.5%).
| Occupation | Male | Female |
| Healthcare Support | 49 (9.7%) | 454 (90.3%) |
| Security & Protection | 101 (73.2%) | 37 (26.8%) |
| Firefighting & Prevention | 62 (62.6%) | 37 (37.4%) |
| Law Enforcement | 39 (100.0%) | 0 (0.0%) |
| Food Preparation & Serving | 146 (25.5%) | 426 (74.5%) |
| Cleaning & Maintenance | 343 (54.9%) | 282 (45.1%) |
| Personal Care & Service | 63 (20.1%) | 251 (79.9%) |
| Total (Category) | 702 (32.6%) | 1,450 (67.4%) |
| Total (Overall) | 6,943 (56.4%) | 5,365 (43.6%) |
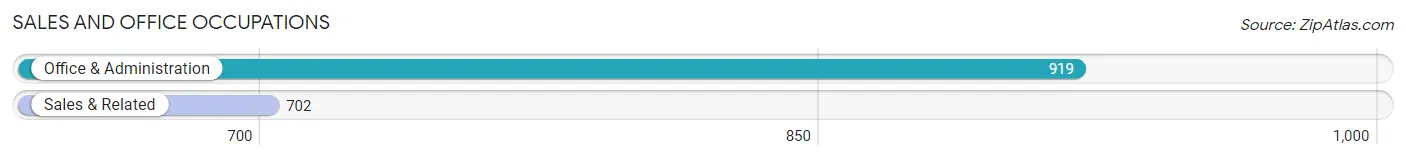
Sales and Office Occupations
The most common Sales and Office occupations in Austin are Office & Administration (919 | 7.5%), and Sales & Related (702 | 5.7%).
Sales and Office Occupations by Sex
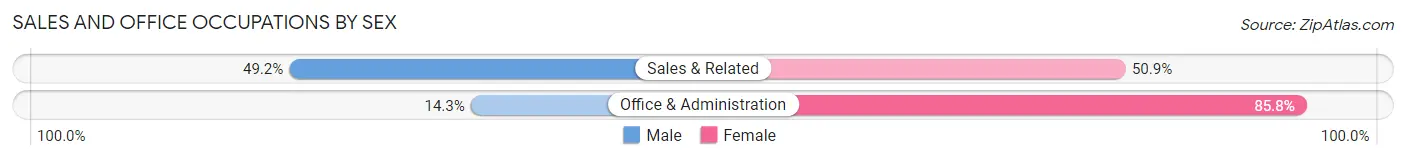
| Occupation | Male | Female |
| Sales & Related | 345 (49.1%) | 357 (50.8%) |
| Office & Administration | 131 (14.2%) | 788 (85.8%) |
| Total (Category) | 476 (29.4%) | 1,145 (70.6%) |
| Total (Overall) | 6,943 (56.4%) | 5,365 (43.6%) |
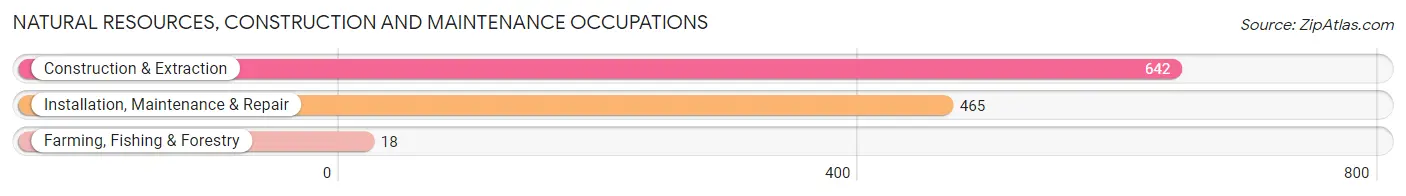
Natural Resources, Construction and Maintenance Occupations
The most common Natural Resources, Construction and Maintenance occupations in Austin are Construction & Extraction (642 | 5.2%), Installation, Maintenance & Repair (465 | 3.8%), and Farming, Fishing & Forestry (18 | 0.2%).
Natural Resources, Construction and Maintenance Occupations by Sex
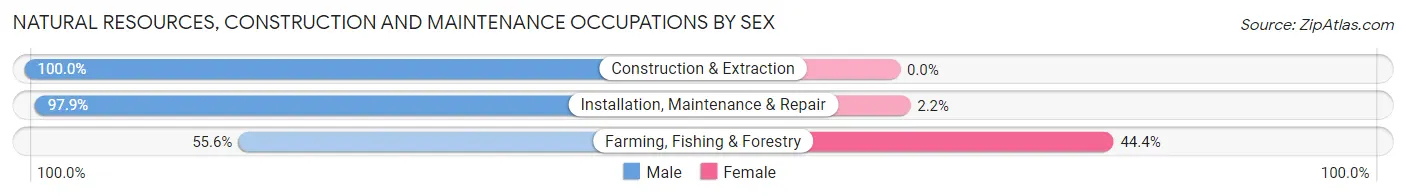
| Occupation | Male | Female |
| Farming, Fishing & Forestry | 10 (55.6%) | 8 (44.4%) |
| Construction & Extraction | 642 (100.0%) | 0 (0.0%) |
| Installation, Maintenance & Repair | 455 (97.9%) | 10 (2.1%) |
| Total (Category) | 1,107 (98.4%) | 18 (1.6%) |
| Total (Overall) | 6,943 (56.4%) | 5,365 (43.6%) |
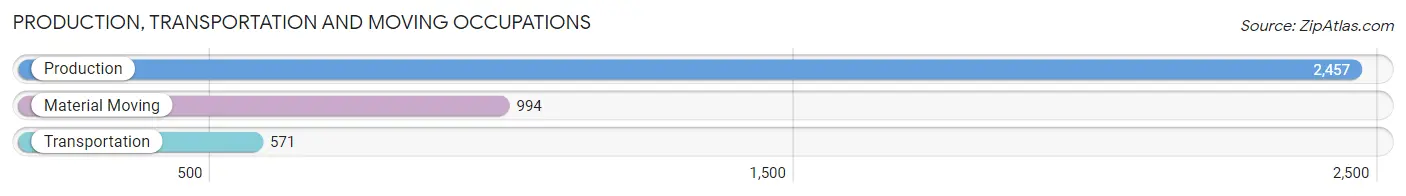
Production, Transportation and Moving Occupations
The most common Production, Transportation and Moving occupations in Austin are Production (2,457 | 20.0%), Material Moving (994 | 8.1%), and Transportation (571 | 4.6%).
Production, Transportation and Moving Occupations by Sex
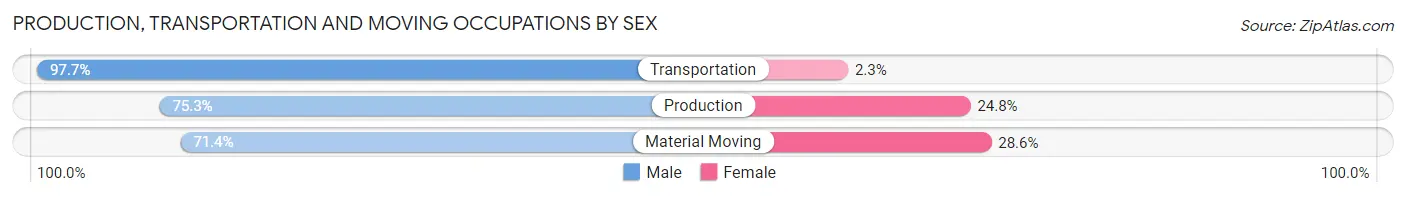
| Occupation | Male | Female |
| Production | 1,849 (75.2%) | 608 (24.7%) |
| Transportation | 558 (97.7%) | 13 (2.3%) |
| Material Moving | 710 (71.4%) | 284 (28.6%) |
| Total (Category) | 3,117 (77.5%) | 905 (22.5%) |
| Total (Overall) | 6,943 (56.4%) | 5,365 (43.6%) |
Employment Industries by Sex in Austin
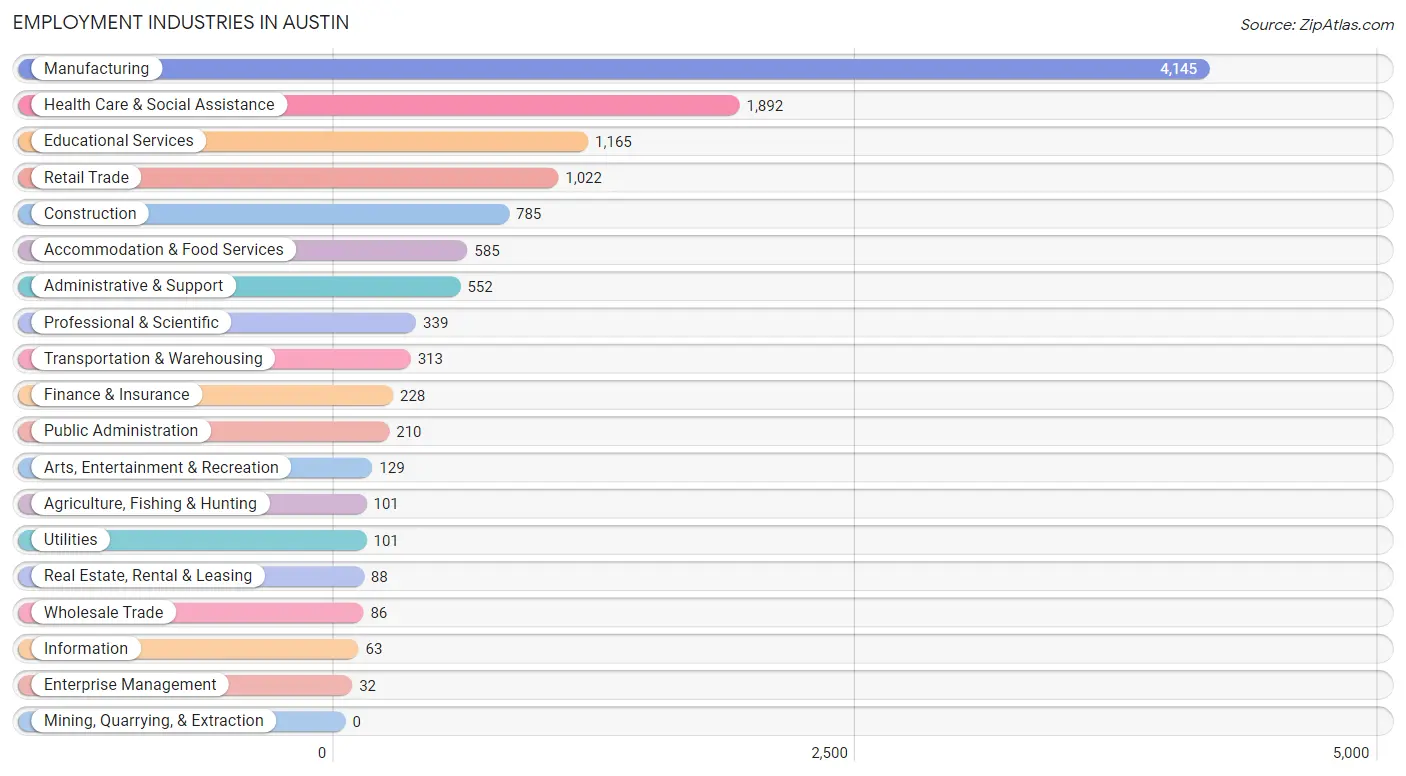
Employment Industries in Austin
The major employment industries in Austin include Manufacturing (4,145 | 33.7%), Health Care & Social Assistance (1,892 | 15.4%), Educational Services (1,165 | 9.5%), Retail Trade (1,022 | 8.3%), and Construction (785 | 6.4%).
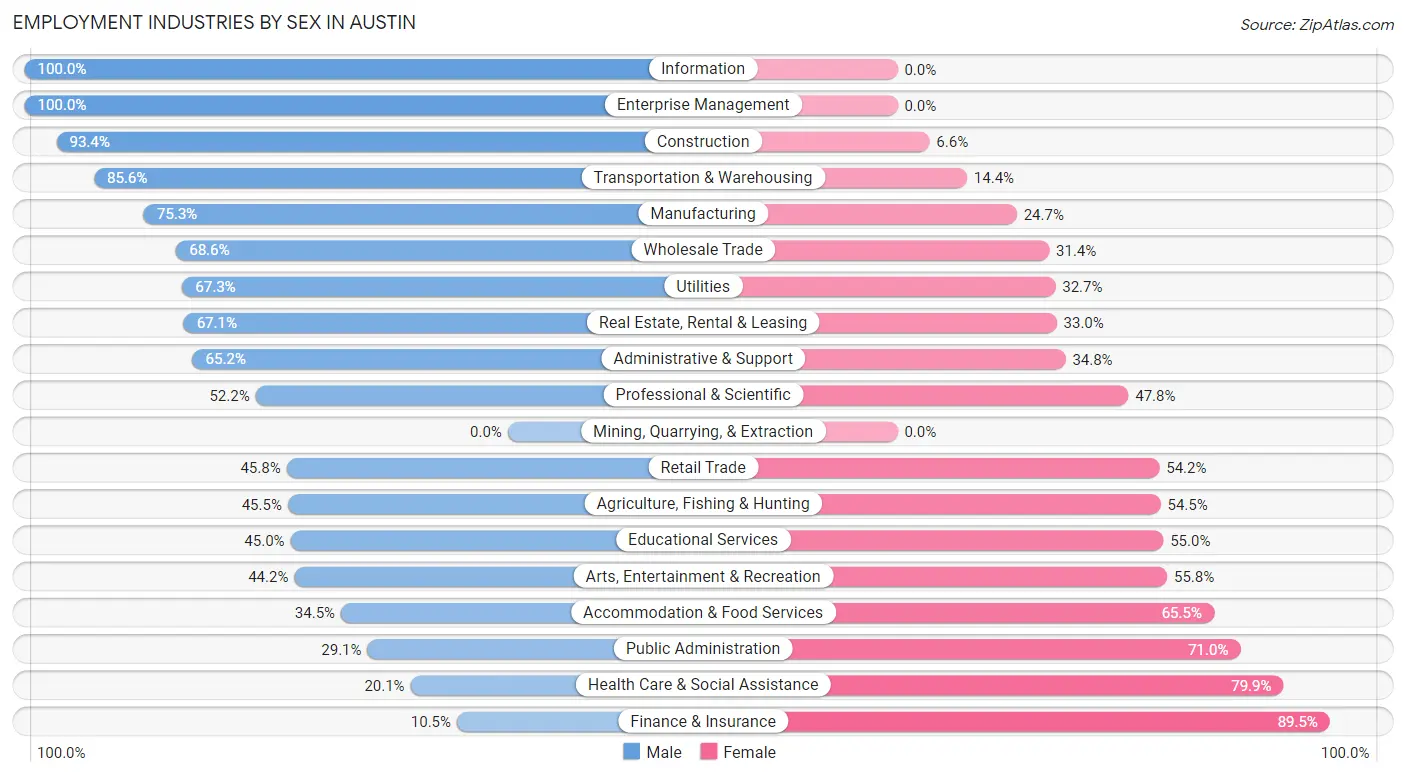
Employment Industries by Sex in Austin
The Austin industries that see more men than women are Information (100.0%), Enterprise Management (100.0%), and Construction (93.4%), whereas the industries that tend to have a higher number of women are Finance & Insurance (89.5%), Health Care & Social Assistance (79.9%), and Public Administration (71.0%).
| Industry | Male | Female |
| Agriculture, Fishing & Hunting | 46 (45.5%) | 55 (54.5%) |
| Mining, Quarrying, & Extraction | 0 (0.0%) | 0 (0.0%) |
| Construction | 733 (93.4%) | 52 (6.6%) |
| Manufacturing | 3,121 (75.3%) | 1,024 (24.7%) |
| Wholesale Trade | 59 (68.6%) | 27 (31.4%) |
| Retail Trade | 468 (45.8%) | 554 (54.2%) |
| Transportation & Warehousing | 268 (85.6%) | 45 (14.4%) |
| Utilities | 68 (67.3%) | 33 (32.7%) |
| Information | 63 (100.0%) | 0 (0.0%) |
| Finance & Insurance | 24 (10.5%) | 204 (89.5%) |
| Real Estate, Rental & Leasing | 59 (67.0%) | 29 (33.0%) |
| Professional & Scientific | 177 (52.2%) | 162 (47.8%) |
| Enterprise Management | 32 (100.0%) | 0 (0.0%) |
| Administrative & Support | 360 (65.2%) | 192 (34.8%) |
| Educational Services | 524 (45.0%) | 641 (55.0%) |
| Health Care & Social Assistance | 381 (20.1%) | 1,511 (79.9%) |
| Arts, Entertainment & Recreation | 57 (44.2%) | 72 (55.8%) |
| Accommodation & Food Services | 202 (34.5%) | 383 (65.5%) |
| Public Administration | 61 (29.0%) | 149 (71.0%) |
| Total | 6,943 (56.4%) | 5,365 (43.6%) |
Education in Austin
School Enrollment in Austin
The most common levels of schooling among the 6,390 students in Austin are middle school (1,639 | 25.7%), high school (1,445 | 22.6%), and elementary school (1,370 | 21.4%).
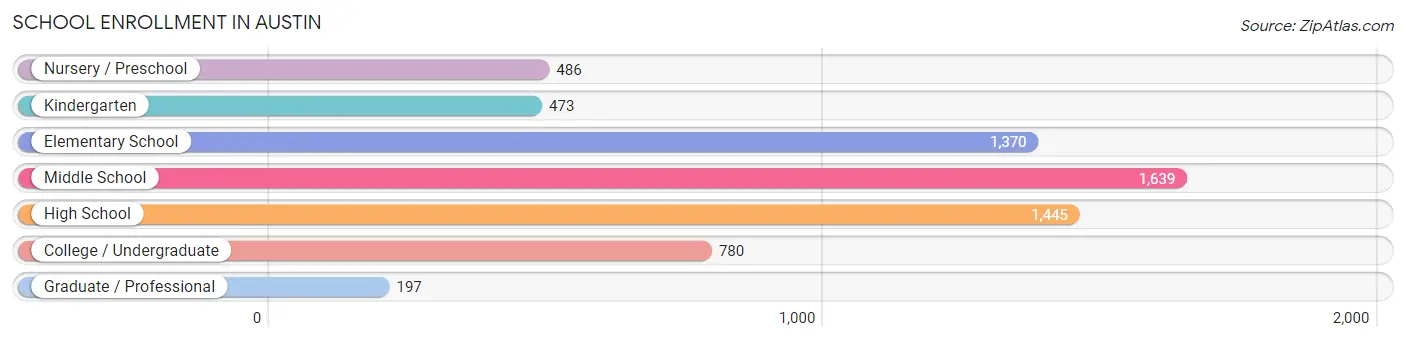
| School Level | # Students | % Students |
| Nursery / Preschool | 486 | 7.6% |
| Kindergarten | 473 | 7.4% |
| Elementary School | 1,370 | 21.4% |
| Middle School | 1,639 | 25.7% |
| High School | 1,445 | 22.6% |
| College / Undergraduate | 780 | 12.2% |
| Graduate / Professional | 197 | 3.1% |
| Total | 6,390 | 100.0% |
School Enrollment by Age by Funding Source in Austin
Out of a total of 6,390 students who are enrolled in schools in Austin, 607 (9.5%) attend a private institution, while the remaining 5,783 (90.5%) are enrolled in public schools. The age group of 3 to 4 year olds has the highest likelihood of being enrolled in private schools, with 156 (45.5% in the age bracket) enrolled. Conversely, the age group of 5 to 9 year old has the lowest likelihood of being enrolled in a private school, with 1,673 (95.4% in the age bracket) attending a public institution.
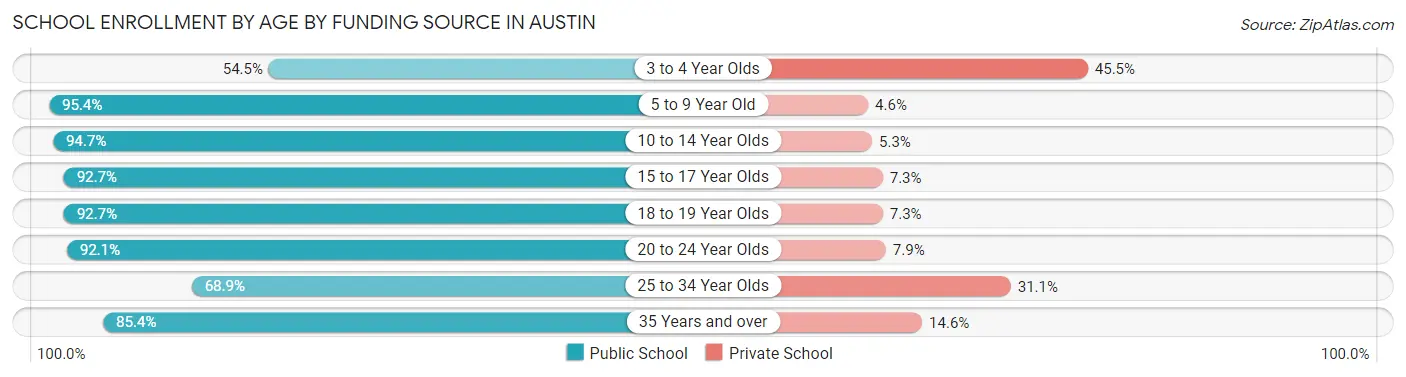
| Age Bracket | Public School | Private School |
| 3 to 4 Year Olds | 187 (54.5%) | 156 (45.5%) |
| 5 to 9 Year Old | 1,673 (95.4%) | 80 (4.6%) |
| 10 to 14 Year Olds | 1,825 (94.7%) | 102 (5.3%) |
| 15 to 17 Year Olds | 1,055 (92.7%) | 83 (7.3%) |
| 18 to 19 Year Olds | 330 (92.7%) | 26 (7.3%) |
| 20 to 24 Year Olds | 316 (92.1%) | 27 (7.9%) |
| 25 to 34 Year Olds | 219 (68.9%) | 99 (31.1%) |
| 35 Years and over | 181 (85.4%) | 31 (14.6%) |
| Total | 5,783 (90.5%) | 607 (9.5%) |
Educational Attainment by Field of Study in Austin
Education (1,052 | 23.1%), business (923 | 20.3%), bio, nature & agricultural (517 | 11.4%), science & technology (464 | 10.2%), and liberal arts & history (350 | 7.7%) are the most common fields of study among 4,555 individuals in Austin who have obtained a bachelor's degree or higher.
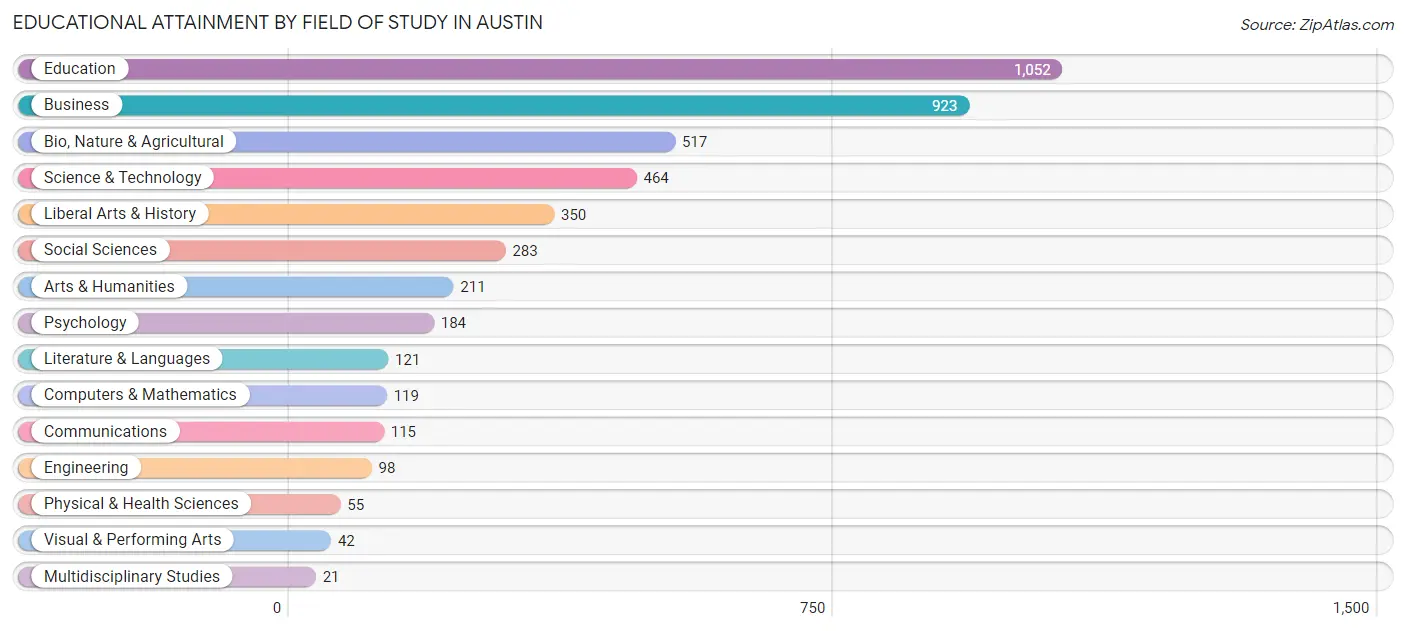
| Field of Study | # Graduates | % Graduates |
| Computers & Mathematics | 119 | 2.6% |
| Bio, Nature & Agricultural | 517 | 11.4% |
| Physical & Health Sciences | 55 | 1.2% |
| Psychology | 184 | 4.0% |
| Social Sciences | 283 | 6.2% |
| Engineering | 98 | 2.1% |
| Multidisciplinary Studies | 21 | 0.5% |
| Science & Technology | 464 | 10.2% |
| Business | 923 | 20.3% |
| Education | 1,052 | 23.1% |
| Literature & Languages | 121 | 2.7% |
| Liberal Arts & History | 350 | 7.7% |
| Visual & Performing Arts | 42 | 0.9% |
| Communications | 115 | 2.5% |
| Arts & Humanities | 211 | 4.6% |
| Total | 4,555 | 100.0% |
Transportation & Commute in Austin
Vehicle Availability by Sex in Austin
The most prevalent vehicle ownership categories in Austin are males with 2 vehicles (2,783, accounting for 41.0%) and females with 2 vehicles (2,243, making up 53.2%).
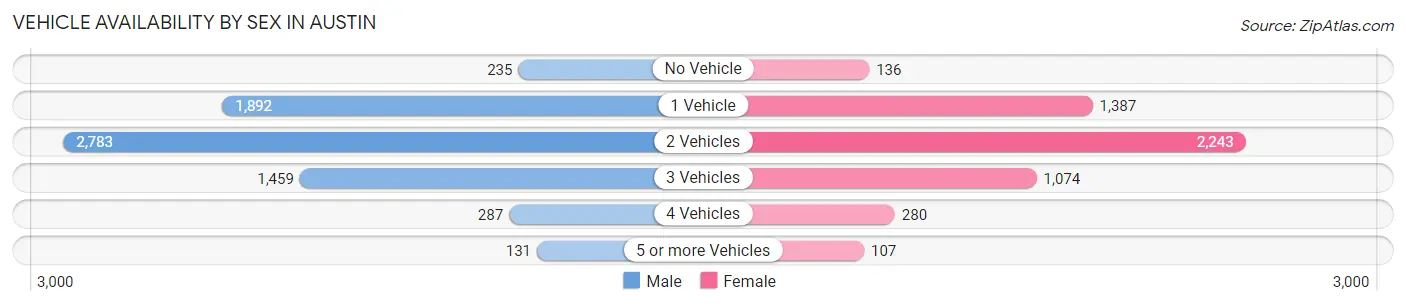
| Vehicles Available | Male | Female |
| No Vehicle | 235 (3.5%) | 136 (2.6%) |
| 1 Vehicle | 1,892 (27.9%) | 1,387 (26.5%) |
| 2 Vehicles | 2,783 (41.0%) | 2,243 (42.9%) |
| 3 Vehicles | 1,459 (21.5%) | 1,074 (20.5%) |
| 4 Vehicles | 287 (4.2%) | 280 (5.4%) |
| 5 or more Vehicles | 131 (1.9%) | 107 (2.1%) |
| Total | 6,787 (100.0%) | 5,227 (100.0%) |
Commute Time in Austin
The most frequently occuring commute durations in Austin are 5 to 9 minutes (4,342 commuters, 37.1%), 10 to 14 minutes (2,641 commuters, 22.6%), and less than 5 minutes (898 commuters, 7.7%).
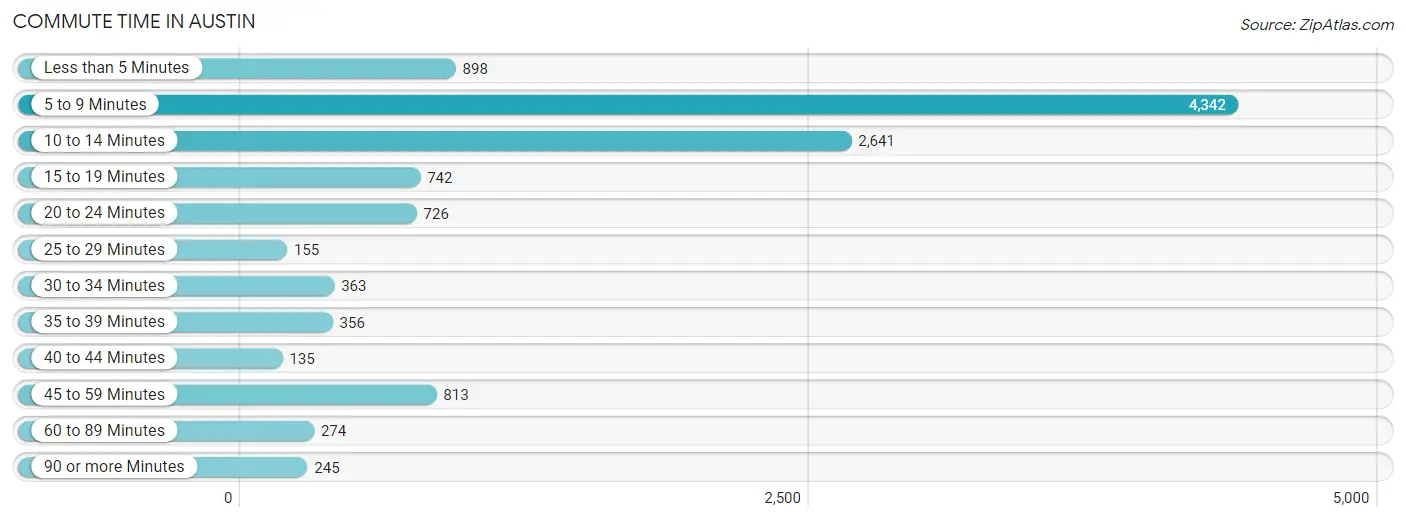
| Commute Time | # Commuters | % Commuters |
| Less than 5 Minutes | 898 | 7.7% |
| 5 to 9 Minutes | 4,342 | 37.1% |
| 10 to 14 Minutes | 2,641 | 22.6% |
| 15 to 19 Minutes | 742 | 6.4% |
| 20 to 24 Minutes | 726 | 6.2% |
| 25 to 29 Minutes | 155 | 1.3% |
| 30 to 34 Minutes | 363 | 3.1% |
| 35 to 39 Minutes | 356 | 3.0% |
| 40 to 44 Minutes | 135 | 1.1% |
| 45 to 59 Minutes | 813 | 7.0% |
| 60 to 89 Minutes | 274 | 2.3% |
| 90 or more Minutes | 245 | 2.1% |
Commute Time by Sex in Austin
The most common commute times in Austin are 5 to 9 minutes (2,346 commuters, 35.4%) for males and 5 to 9 minutes (1,996 commuters, 39.5%) for females.
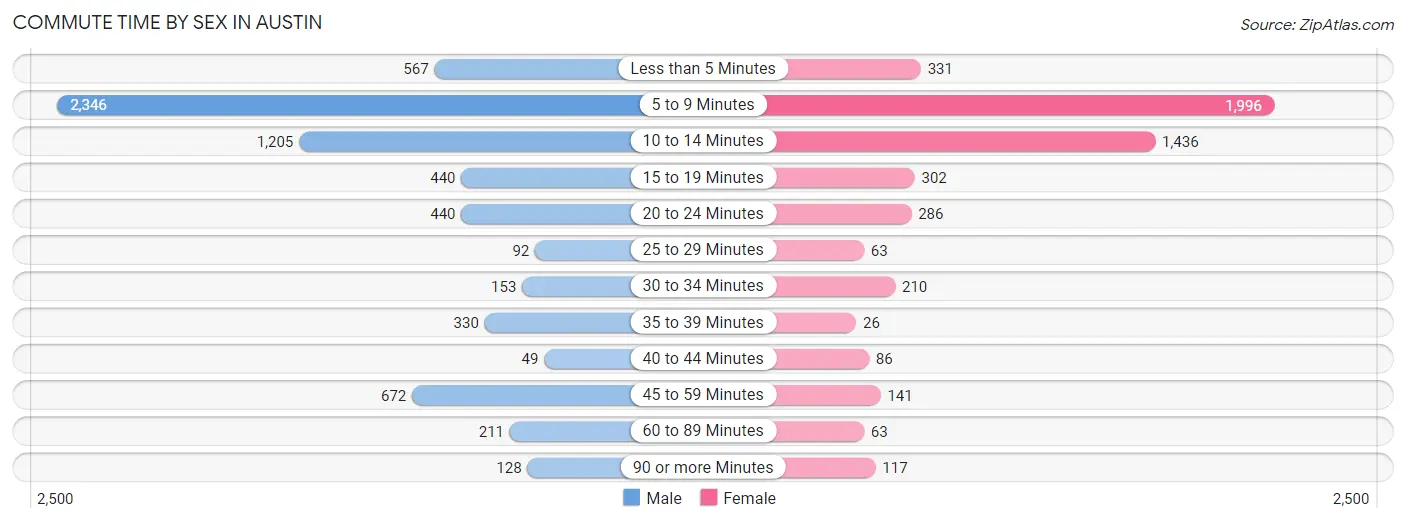
| Commute Time | Male | Female |
| Less than 5 Minutes | 567 (8.6%) | 331 (6.6%) |
| 5 to 9 Minutes | 2,346 (35.4%) | 1,996 (39.5%) |
| 10 to 14 Minutes | 1,205 (18.2%) | 1,436 (28.4%) |
| 15 to 19 Minutes | 440 (6.6%) | 302 (6.0%) |
| 20 to 24 Minutes | 440 (6.6%) | 286 (5.7%) |
| 25 to 29 Minutes | 92 (1.4%) | 63 (1.3%) |
| 30 to 34 Minutes | 153 (2.3%) | 210 (4.2%) |
| 35 to 39 Minutes | 330 (5.0%) | 26 (0.5%) |
| 40 to 44 Minutes | 49 (0.7%) | 86 (1.7%) |
| 45 to 59 Minutes | 672 (10.1%) | 141 (2.8%) |
| 60 to 89 Minutes | 211 (3.2%) | 63 (1.3%) |
| 90 or more Minutes | 128 (1.9%) | 117 (2.3%) |
Time of Departure to Work by Sex in Austin
The most frequent times of departure to work in Austin are 12:00 PM to 3:59 PM (1,186, 17.9%) for males and 7:00 AM to 7:29 AM (756, 14.9%) for females.
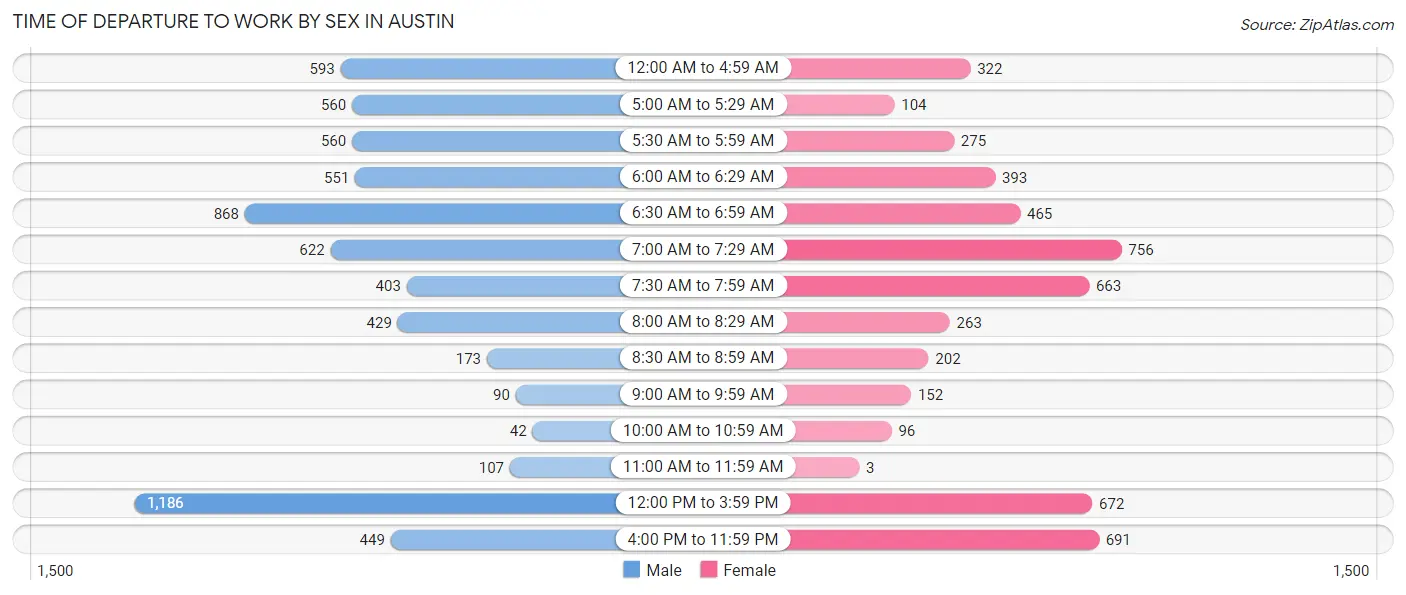
| Time of Departure | Male | Female |
| 12:00 AM to 4:59 AM | 593 (8.9%) | 322 (6.4%) |
| 5:00 AM to 5:29 AM | 560 (8.4%) | 104 (2.1%) |
| 5:30 AM to 5:59 AM | 560 (8.4%) | 275 (5.4%) |
| 6:00 AM to 6:29 AM | 551 (8.3%) | 393 (7.8%) |
| 6:30 AM to 6:59 AM | 868 (13.1%) | 465 (9.2%) |
| 7:00 AM to 7:29 AM | 622 (9.4%) | 756 (14.9%) |
| 7:30 AM to 7:59 AM | 403 (6.1%) | 663 (13.1%) |
| 8:00 AM to 8:29 AM | 429 (6.5%) | 263 (5.2%) |
| 8:30 AM to 8:59 AM | 173 (2.6%) | 202 (4.0%) |
| 9:00 AM to 9:59 AM | 90 (1.4%) | 152 (3.0%) |
| 10:00 AM to 10:59 AM | 42 (0.6%) | 96 (1.9%) |
| 11:00 AM to 11:59 AM | 107 (1.6%) | 3 (0.1%) |
| 12:00 PM to 3:59 PM | 1,186 (17.9%) | 672 (13.3%) |
| 4:00 PM to 11:59 PM | 449 (6.8%) | 691 (13.7%) |
| Total | 6,633 (100.0%) | 5,057 (100.0%) |
Housing Occupancy in Austin
Occupancy by Ownership in Austin
Of the total 10,172 dwellings in Austin, owner-occupied units account for 6,951 (68.3%), while renter-occupied units make up 3,221 (31.7%).
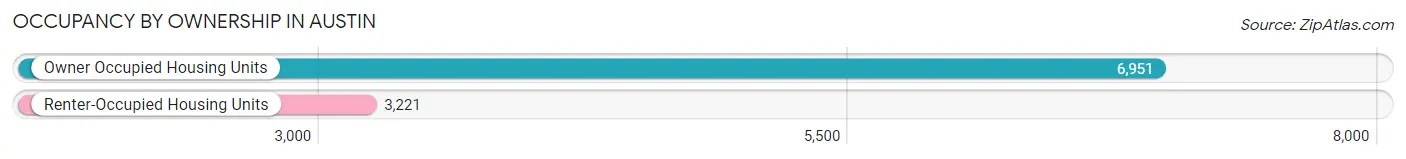
| Occupancy | # Housing Units | % Housing Units |
| Owner Occupied Housing Units | 6,951 | 68.3% |
| Renter-Occupied Housing Units | 3,221 | 31.7% |
| Total Occupied Housing Units | 10,172 | 100.0% |
Occupancy by Household Size in Austin
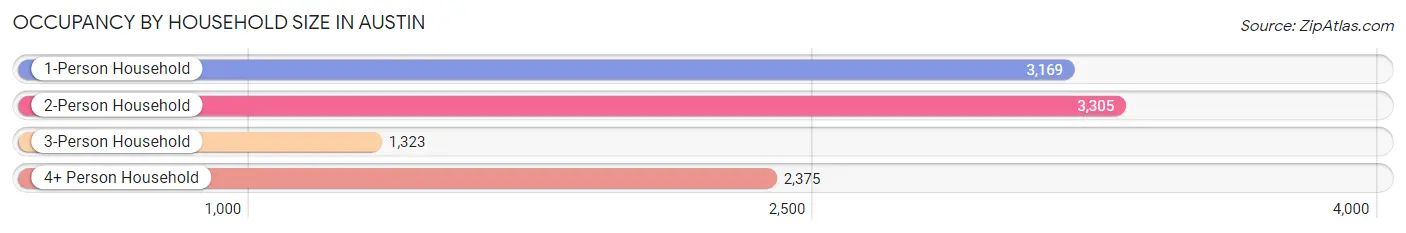
| Household Size | # Housing Units | % Housing Units |
| 1-Person Household | 3,169 | 31.1% |
| 2-Person Household | 3,305 | 32.5% |
| 3-Person Household | 1,323 | 13.0% |
| 4+ Person Household | 2,375 | 23.4% |
| Total Housing Units | 10,172 | 100.0% |
Occupancy by Ownership by Household Size in Austin
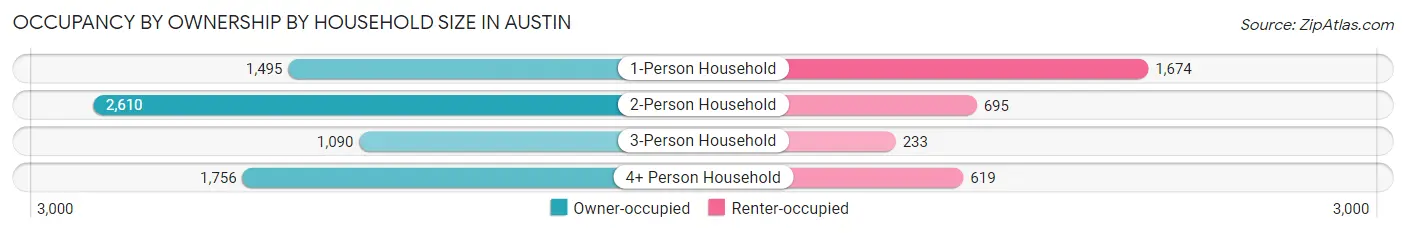
| Household Size | Owner-occupied | Renter-occupied |
| 1-Person Household | 1,495 (47.2%) | 1,674 (52.8%) |
| 2-Person Household | 2,610 (79.0%) | 695 (21.0%) |
| 3-Person Household | 1,090 (82.4%) | 233 (17.6%) |
| 4+ Person Household | 1,756 (73.9%) | 619 (26.1%) |
| Total Housing Units | 6,951 (68.3%) | 3,221 (31.7%) |
Occupancy by Educational Attainment in Austin
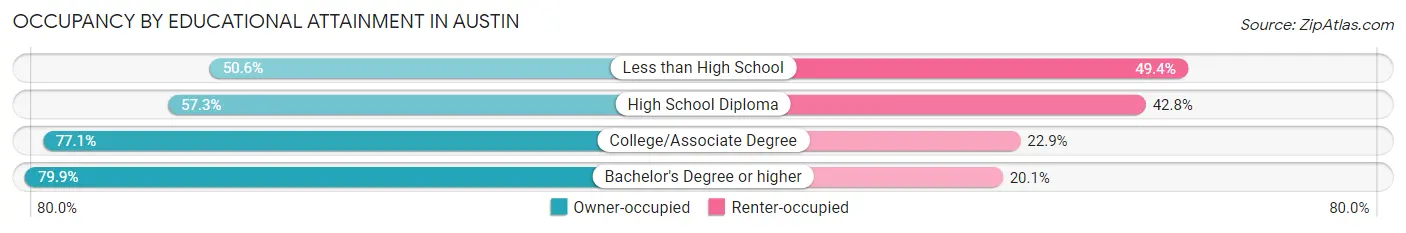
| Household Size | Owner-occupied | Renter-occupied |
| Less than High School | 565 (50.6%) | 551 (49.4%) |
| High School Diploma | 1,931 (57.3%) | 1,442 (42.7%) |
| College/Associate Degree | 2,400 (77.1%) | 712 (22.9%) |
| Bachelor's Degree or higher | 2,055 (79.9%) | 516 (20.1%) |
Occupancy by Age of Householder in Austin
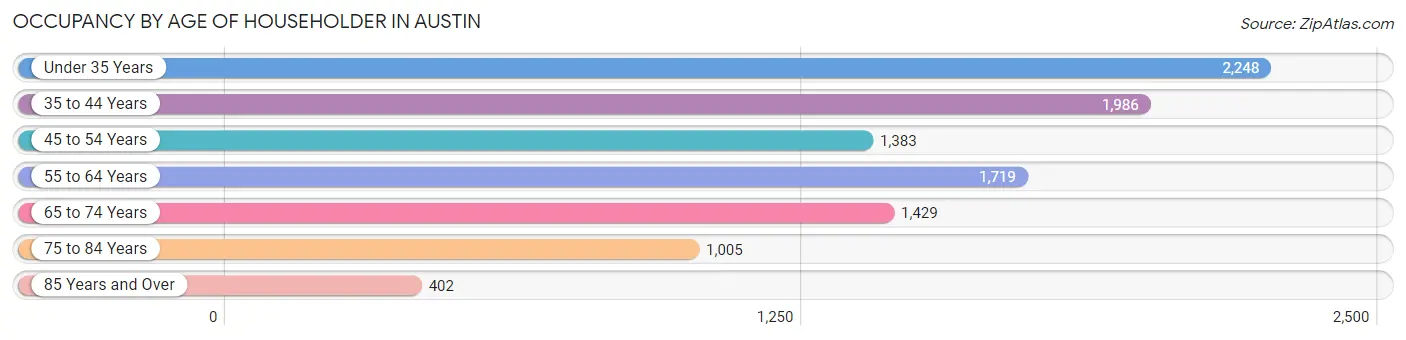
| Age Bracket | # Households | % Households |
| Under 35 Years | 2,248 | 22.1% |
| 35 to 44 Years | 1,986 | 19.5% |
| 45 to 54 Years | 1,383 | 13.6% |
| 55 to 64 Years | 1,719 | 16.9% |
| 65 to 74 Years | 1,429 | 14.1% |
| 75 to 84 Years | 1,005 | 9.9% |
| 85 Years and Over | 402 | 4.0% |
| Total | 10,172 | 100.0% |
Housing Finances in Austin
Median Income by Occupancy in Austin
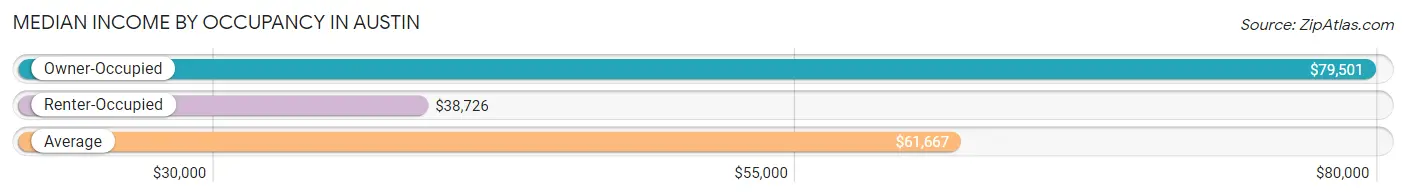
| Occupancy Type | # Households | Median Income |
| Owner-Occupied | 6,951 (68.3%) | $79,501 |
| Renter-Occupied | 3,221 (31.7%) | $38,726 |
| Average | 10,172 (100.0%) | $61,667 |
Occupancy by Householder Income Bracket in Austin
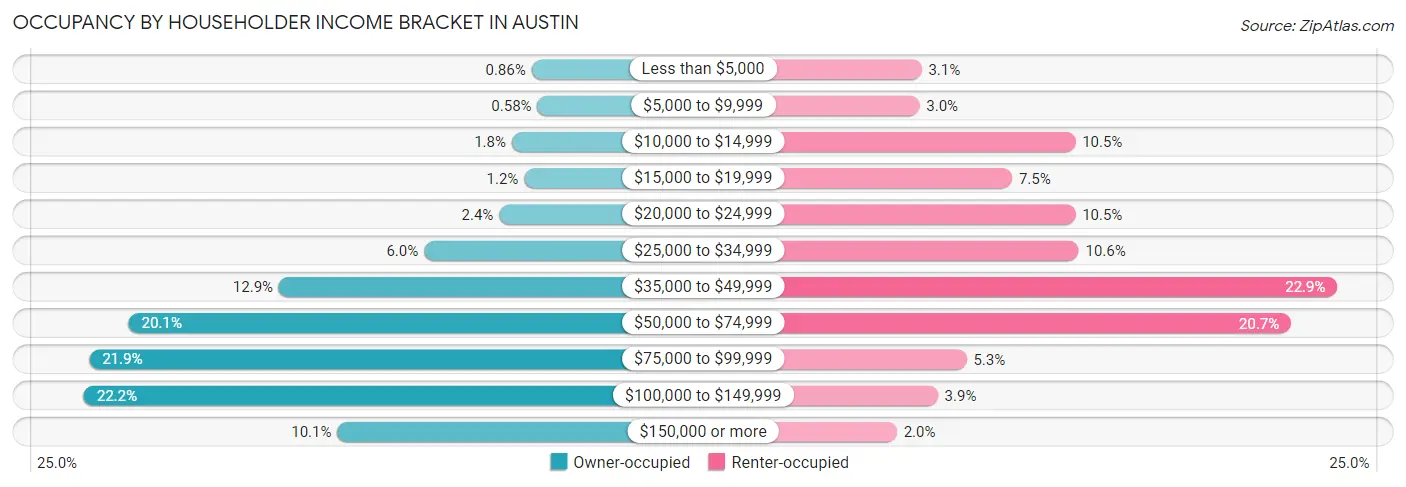
| Income Bracket | Owner-occupied | Renter-occupied |
| Less than $5,000 | 60 (0.9%) | 101 (3.1%) |
| $5,000 to $9,999 | 40 (0.6%) | 98 (3.0%) |
| $10,000 to $14,999 | 125 (1.8%) | 337 (10.5%) |
| $15,000 to $19,999 | 84 (1.2%) | 240 (7.4%) |
| $20,000 to $24,999 | 167 (2.4%) | 337 (10.5%) |
| $25,000 to $34,999 | 416 (6.0%) | 342 (10.6%) |
| $35,000 to $49,999 | 896 (12.9%) | 739 (22.9%) |
| $50,000 to $74,999 | 1,394 (20.1%) | 668 (20.7%) |
| $75,000 to $99,999 | 1,524 (21.9%) | 170 (5.3%) |
| $100,000 to $149,999 | 1,542 (22.2%) | 126 (3.9%) |
| $150,000 or more | 703 (10.1%) | 63 (2.0%) |
| Total | 6,951 (100.0%) | 3,221 (100.0%) |
Monthly Housing Cost Tiers in Austin
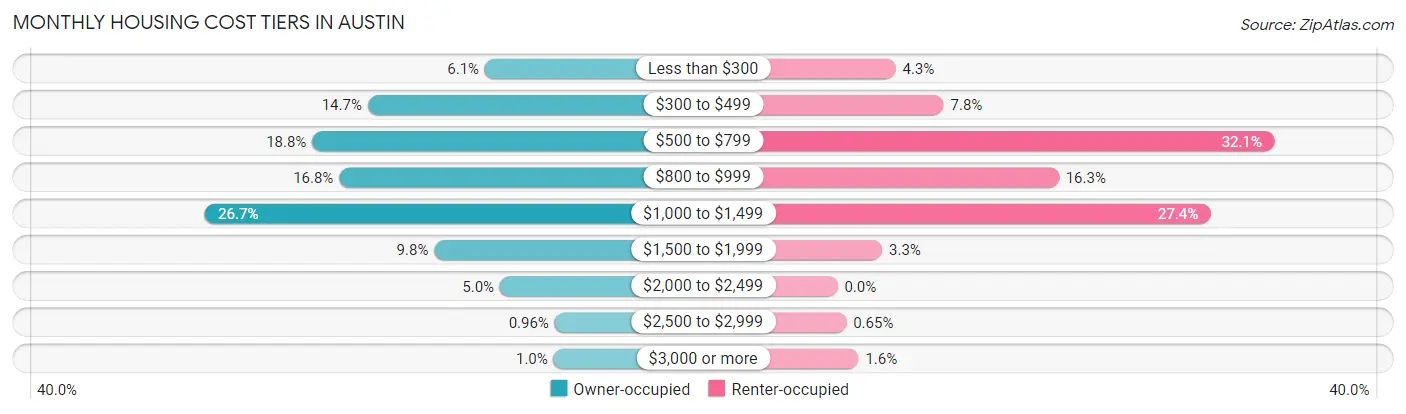
| Monthly Cost | Owner-occupied | Renter-occupied |
| Less than $300 | 424 (6.1%) | 138 (4.3%) |
| $300 to $499 | 1,024 (14.7%) | 252 (7.8%) |
| $500 to $799 | 1,308 (18.8%) | 1,035 (32.1%) |
| $800 to $999 | 1,170 (16.8%) | 525 (16.3%) |
| $1,000 to $1,499 | 1,856 (26.7%) | 884 (27.4%) |
| $1,500 to $1,999 | 683 (9.8%) | 106 (3.3%) |
| $2,000 to $2,499 | 347 (5.0%) | 0 (0.0%) |
| $2,500 to $2,999 | 67 (1.0%) | 21 (0.6%) |
| $3,000 or more | 72 (1.0%) | 50 (1.5%) |
| Total | 6,951 (100.0%) | 3,221 (100.0%) |
Physical Housing Characteristics in Austin
Housing Structures in Austin
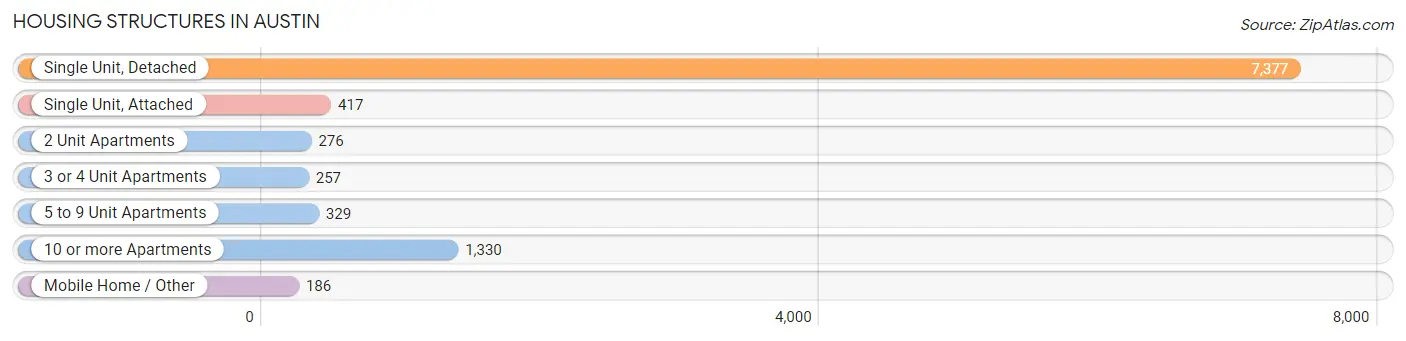
| Structure Type | # Housing Units | % Housing Units |
| Single Unit, Detached | 7,377 | 72.5% |
| Single Unit, Attached | 417 | 4.1% |
| 2 Unit Apartments | 276 | 2.7% |
| 3 or 4 Unit Apartments | 257 | 2.5% |
| 5 to 9 Unit Apartments | 329 | 3.2% |
| 10 or more Apartments | 1,330 | 13.1% |
| Mobile Home / Other | 186 | 1.8% |
| Total | 10,172 | 100.0% |
Housing Structures by Occupancy in Austin
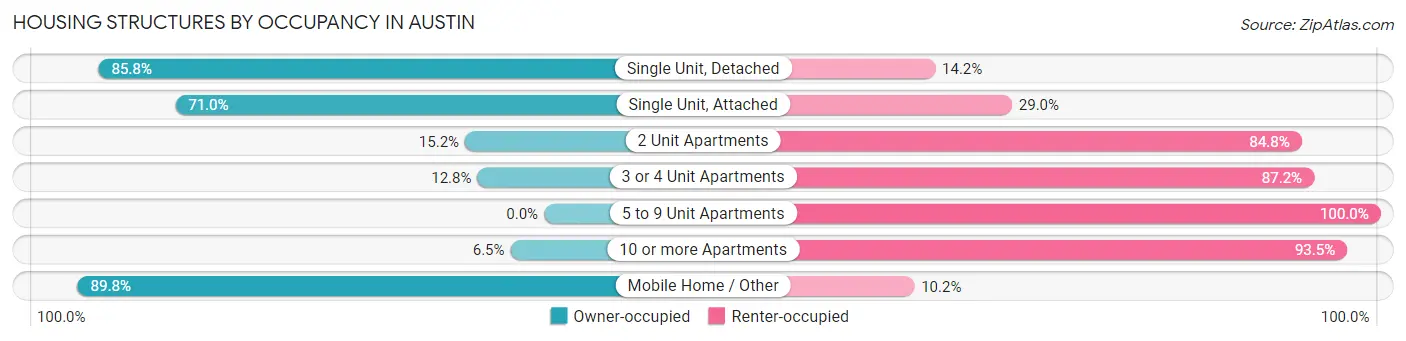
| Structure Type | Owner-occupied | Renter-occupied |
| Single Unit, Detached | 6,327 (85.8%) | 1,050 (14.2%) |
| Single Unit, Attached | 296 (71.0%) | 121 (29.0%) |
| 2 Unit Apartments | 42 (15.2%) | 234 (84.8%) |
| 3 or 4 Unit Apartments | 33 (12.8%) | 224 (87.2%) |
| 5 to 9 Unit Apartments | 0 (0.0%) | 329 (100.0%) |
| 10 or more Apartments | 86 (6.5%) | 1,244 (93.5%) |
| Mobile Home / Other | 167 (89.8%) | 19 (10.2%) |
| Total | 6,951 (68.3%) | 3,221 (31.7%) |
Housing Structures by Number of Rooms in Austin
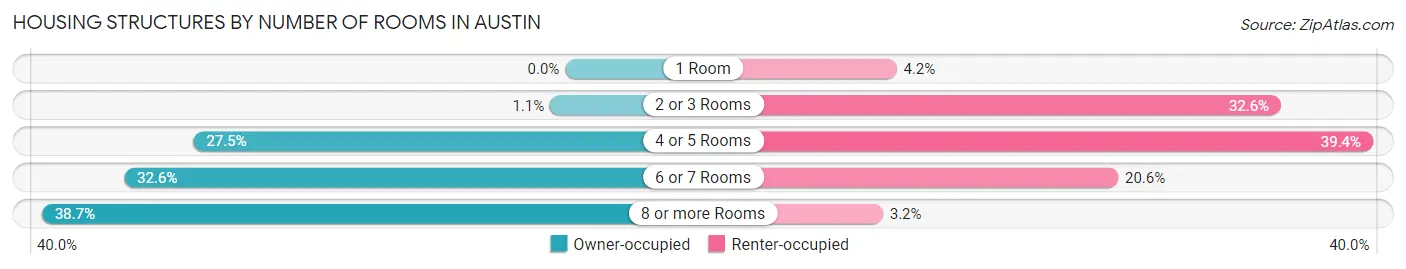
| Number of Rooms | Owner-occupied | Renter-occupied |
| 1 Room | 0 (0.0%) | 135 (4.2%) |
| 2 or 3 Rooms | 78 (1.1%) | 1,051 (32.6%) |
| 4 or 5 Rooms | 1,912 (27.5%) | 1,270 (39.4%) |
| 6 or 7 Rooms | 2,269 (32.6%) | 663 (20.6%) |
| 8 or more Rooms | 2,692 (38.7%) | 102 (3.2%) |
| Total | 6,951 (100.0%) | 3,221 (100.0%) |
Housing Structure by Heating Type in Austin
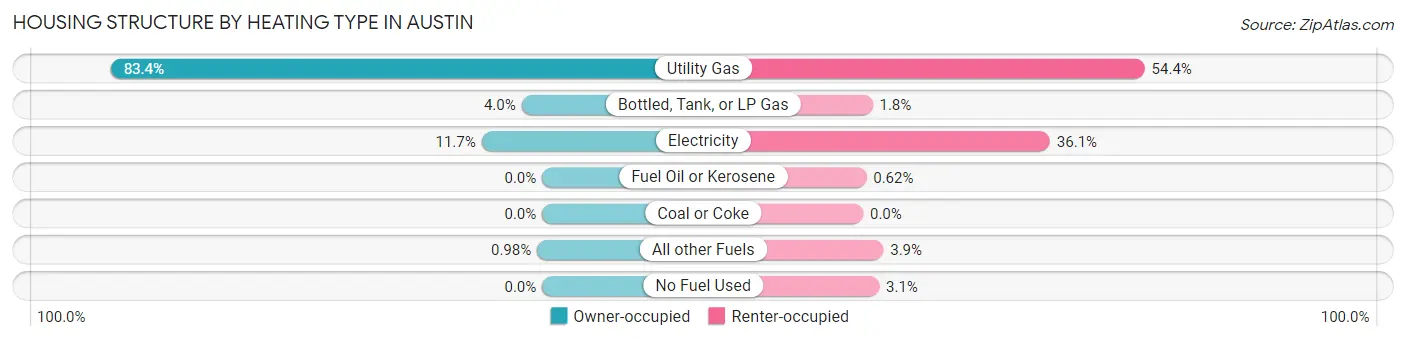
| Heating Type | Owner-occupied | Renter-occupied |
| Utility Gas | 5,794 (83.4%) | 1,753 (54.4%) |
| Bottled, Tank, or LP Gas | 276 (4.0%) | 59 (1.8%) |
| Electricity | 813 (11.7%) | 1,163 (36.1%) |
| Fuel Oil or Kerosene | 0 (0.0%) | 20 (0.6%) |
| Coal or Coke | 0 (0.0%) | 0 (0.0%) |
| All other Fuels | 68 (1.0%) | 126 (3.9%) |
| No Fuel Used | 0 (0.0%) | 100 (3.1%) |
| Total | 6,951 (100.0%) | 3,221 (100.0%) |
Household Vehicle Usage in Austin
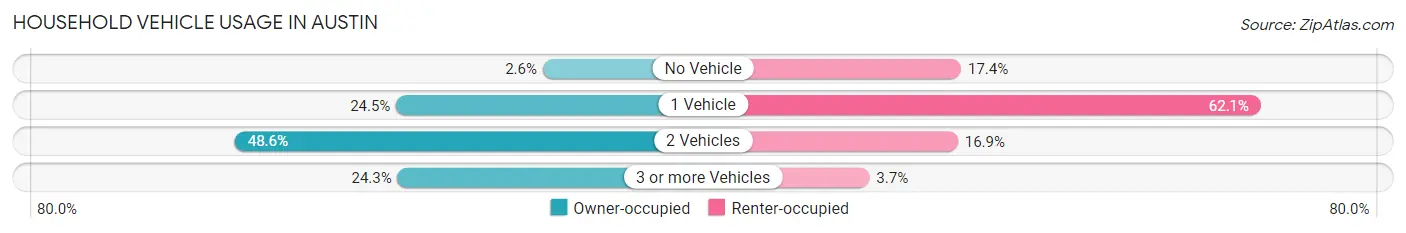
| Vehicles per Household | Owner-occupied | Renter-occupied |
| No Vehicle | 181 (2.6%) | 559 (17.3%) |
| 1 Vehicle | 1,703 (24.5%) | 2,001 (62.1%) |
| 2 Vehicles | 3,378 (48.6%) | 543 (16.9%) |
| 3 or more Vehicles | 1,689 (24.3%) | 118 (3.7%) |
| Total | 6,951 (100.0%) | 3,221 (100.0%) |
Real Estate & Mortgages in Austin
Real Estate and Mortgage Overview in Austin
| Characteristic | Without Mortgage | With Mortgage |
| Housing Units | 2,518 | 4,433 |
| Median Property Value | $131,000 | $145,200 |
| Median Household Income | $64,602 | $490 |
| Monthly Housing Costs | $466 | $67 |
| Real Estate Taxes | $1,531 | $84 |
Property Value by Mortgage Status in Austin
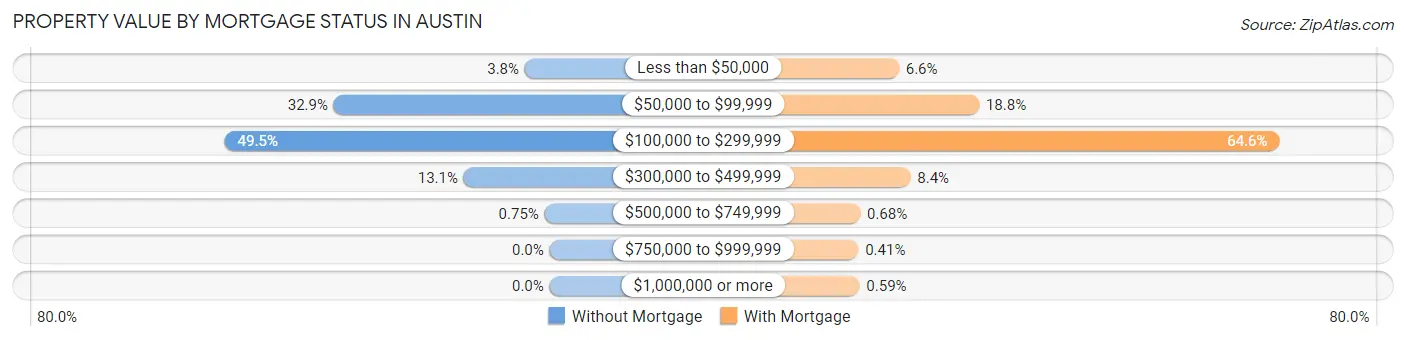
| Property Value | Without Mortgage | With Mortgage |
| Less than $50,000 | 95 (3.8%) | 292 (6.6%) |
| $50,000 to $99,999 | 828 (32.9%) | 834 (18.8%) |
| $100,000 to $299,999 | 1,247 (49.5%) | 2,863 (64.6%) |
| $300,000 to $499,999 | 329 (13.1%) | 370 (8.4%) |
| $500,000 to $749,999 | 19 (0.7%) | 30 (0.7%) |
| $750,000 to $999,999 | 0 (0.0%) | 18 (0.4%) |
| $1,000,000 or more | 0 (0.0%) | 26 (0.6%) |
| Total | 2,518 (100.0%) | 4,433 (100.0%) |
Household Income by Mortgage Status in Austin
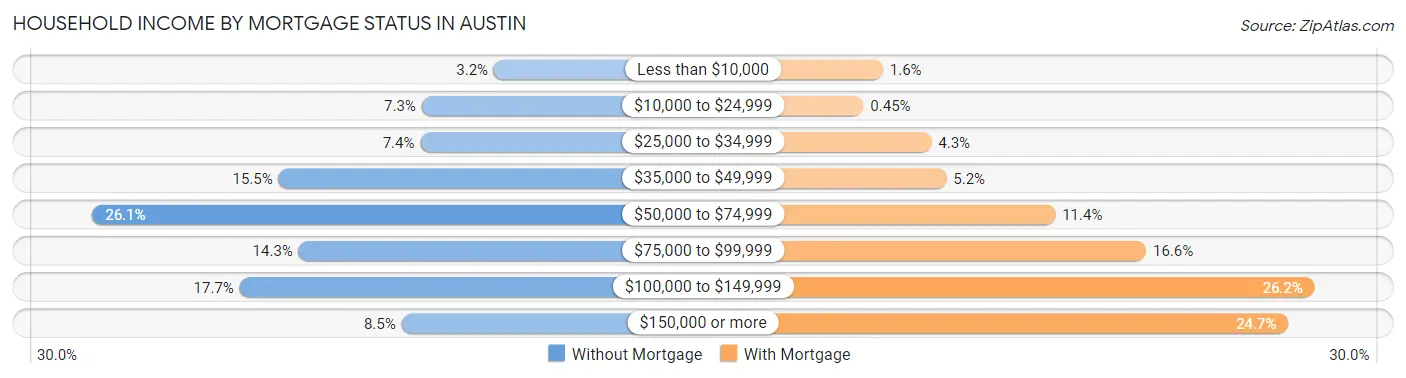
| Household Income | Without Mortgage | With Mortgage |
| Less than $10,000 | 80 (3.2%) | 69 (1.6%) |
| $10,000 to $24,999 | 184 (7.3%) | 20 (0.4%) |
| $25,000 to $34,999 | 186 (7.4%) | 192 (4.3%) |
| $35,000 to $49,999 | 390 (15.5%) | 230 (5.2%) |
| $50,000 to $74,999 | 658 (26.1%) | 506 (11.4%) |
| $75,000 to $99,999 | 361 (14.3%) | 736 (16.6%) |
| $100,000 to $149,999 | 446 (17.7%) | 1,163 (26.2%) |
| $150,000 or more | 213 (8.5%) | 1,096 (24.7%) |
| Total | 2,518 (100.0%) | 4,433 (100.0%) |
Property Value to Household Income Ratio in Austin
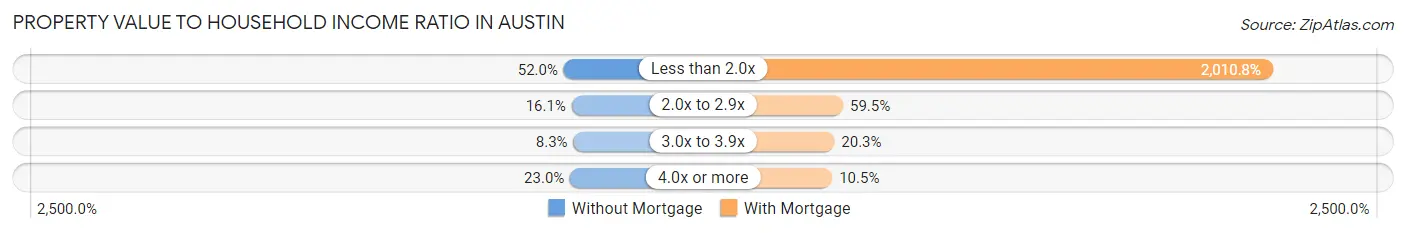
| Value-to-Income Ratio | Without Mortgage | With Mortgage |
| Less than 2.0x | 1,310 (52.0%) | 89,140 (2,010.8%) |
| 2.0x to 2.9x | 406 (16.1%) | 2,639 (59.5%) |
| 3.0x to 3.9x | 208 (8.3%) | 899 (20.3%) |
| 4.0x or more | 580 (23.0%) | 467 (10.5%) |
| Total | 2,518 (100.0%) | 4,433 (100.0%) |
Real Estate Taxes by Mortgage Status in Austin
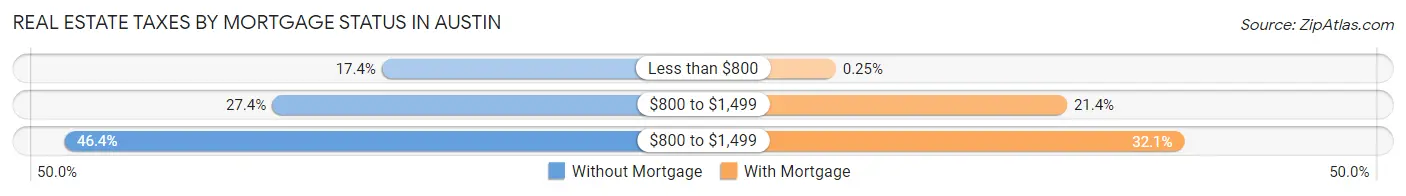
| Property Taxes | Without Mortgage | With Mortgage |
| Less than $800 | 438 (17.4%) | 11 (0.3%) |
| $800 to $1,499 | 690 (27.4%) | 947 (21.4%) |
| $800 to $1,499 | 1,168 (46.4%) | 1,422 (32.1%) |
| Total | 2,518 (100.0%) | 4,433 (100.0%) |
Health & Disability in Austin
Health Insurance Coverage by Age in Austin
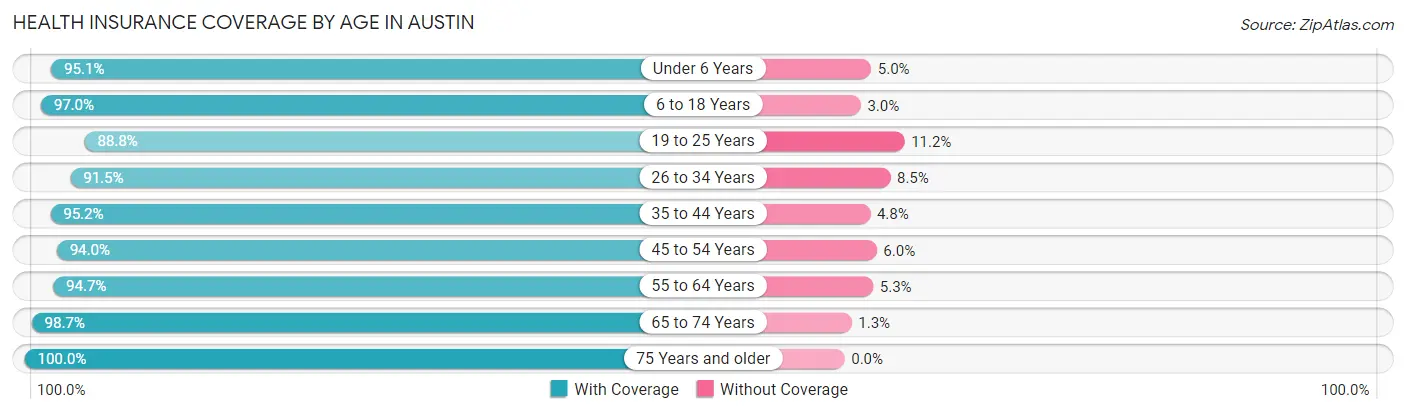
| Age Bracket | With Coverage | Without Coverage |
| Under 6 Years | 2,304 (95.1%) | 120 (5.0%) |
| 6 to 18 Years | 4,683 (97.0%) | 146 (3.0%) |
| 19 to 25 Years | 1,932 (88.8%) | 243 (11.2%) |
| 26 to 34 Years | 2,765 (91.5%) | 258 (8.5%) |
| 35 to 44 Years | 3,398 (95.2%) | 171 (4.8%) |
| 45 to 54 Years | 2,371 (94.0%) | 151 (6.0%) |
| 55 to 64 Years | 2,753 (94.7%) | 155 (5.3%) |
| 65 to 74 Years | 2,252 (98.7%) | 30 (1.3%) |
| 75 Years and older | 2,038 (100.0%) | 0 (0.0%) |
| Total | 24,496 (95.1%) | 1,274 (4.9%) |
Health Insurance Coverage by Citizenship Status in Austin
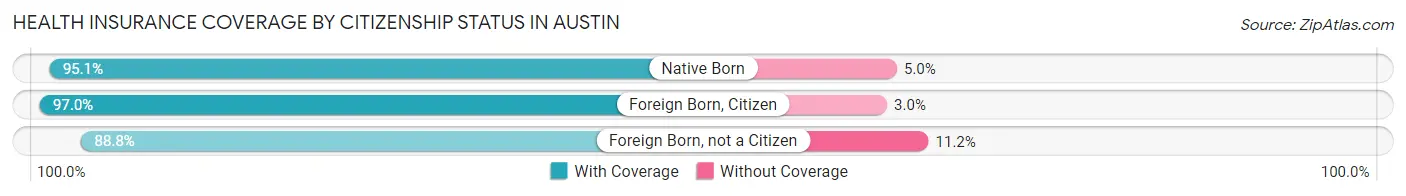
| Citizenship Status | With Coverage | Without Coverage |
| Native Born | 2,304 (95.1%) | 120 (5.0%) |
| Foreign Born, Citizen | 4,683 (97.0%) | 146 (3.0%) |
| Foreign Born, not a Citizen | 1,932 (88.8%) | 243 (11.2%) |
Health Insurance Coverage by Household Income in Austin
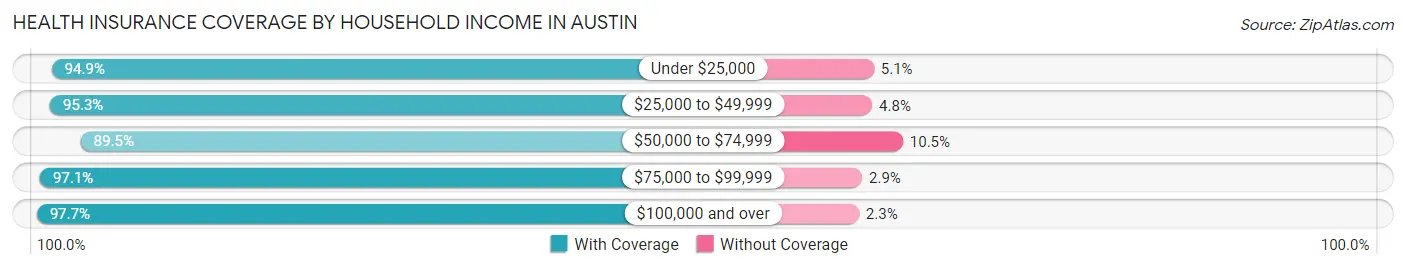
| Household Income | With Coverage | Without Coverage |
| Under $25,000 | 2,245 (94.9%) | 120 (5.1%) |
| $25,000 to $49,999 | 5,188 (95.3%) | 259 (4.8%) |
| $50,000 to $74,999 | 5,040 (89.5%) | 591 (10.5%) |
| $75,000 to $99,999 | 4,938 (97.1%) | 146 (2.9%) |
| $100,000 and over | 6,802 (97.7%) | 158 (2.3%) |
Public vs Private Health Insurance Coverage by Age in Austin
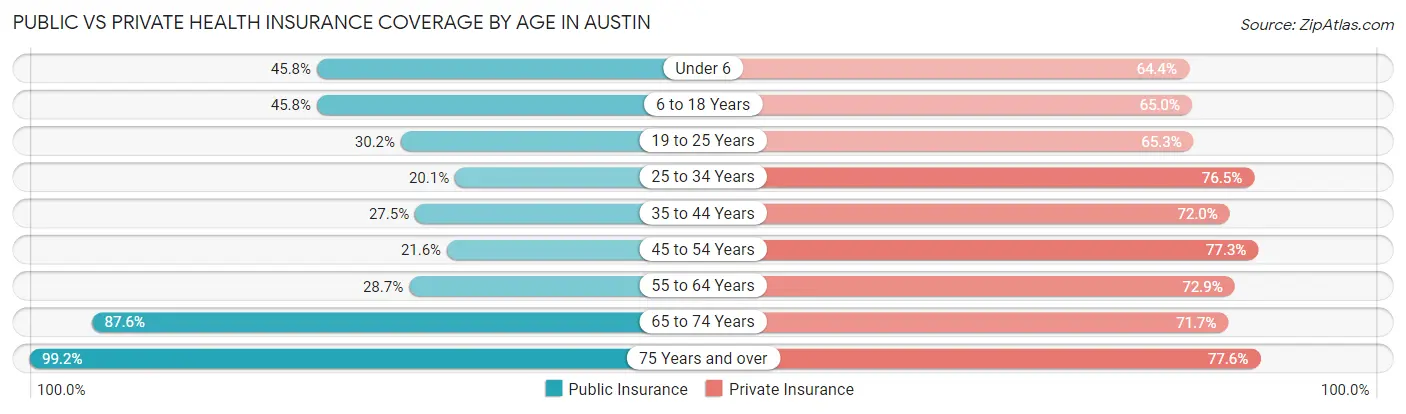
| Age Bracket | Public Insurance | Private Insurance |
| Under 6 | 1,109 (45.8%) | 1,561 (64.4%) |
| 6 to 18 Years | 2,210 (45.8%) | 3,137 (65.0%) |
| 19 to 25 Years | 656 (30.2%) | 1,420 (65.3%) |
| 25 to 34 Years | 608 (20.1%) | 2,313 (76.5%) |
| 35 to 44 Years | 983 (27.5%) | 2,569 (72.0%) |
| 45 to 54 Years | 545 (21.6%) | 1,949 (77.3%) |
| 55 to 64 Years | 833 (28.6%) | 2,120 (72.9%) |
| 65 to 74 Years | 1,998 (87.5%) | 1,637 (71.7%) |
| 75 Years and over | 2,021 (99.2%) | 1,582 (77.6%) |
| Total | 10,963 (42.5%) | 18,288 (71.0%) |
Disability Status by Sex by Age in Austin
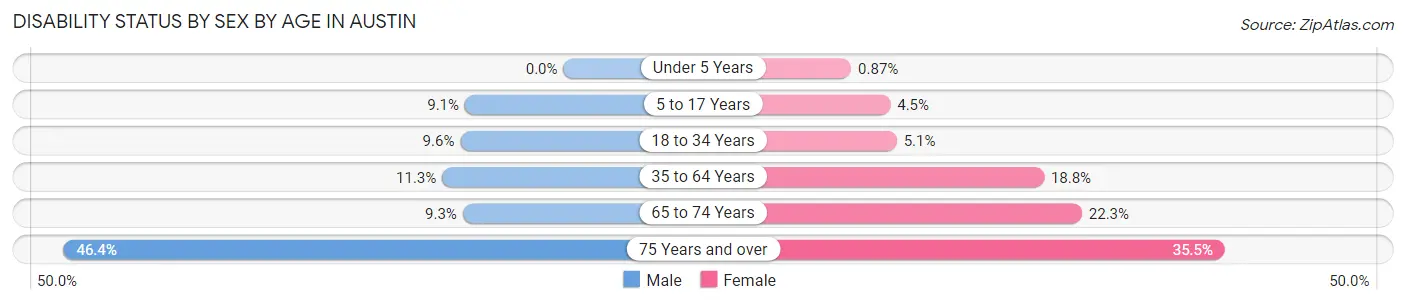
| Age Bracket | Male | Female |
| Under 5 Years | 0 (0.0%) | 9 (0.9%) |
| 5 to 17 Years | 233 (9.1%) | 107 (4.5%) |
| 18 to 34 Years | 277 (9.6%) | 135 (5.1%) |
| 35 to 64 Years | 536 (11.3%) | 794 (18.8%) |
| 65 to 74 Years | 105 (9.3%) | 258 (22.3%) |
| 75 Years and over | 384 (46.4%) | 430 (35.5%) |
Disability Class by Sex by Age in Austin
Disability Class: Hearing Difficulty
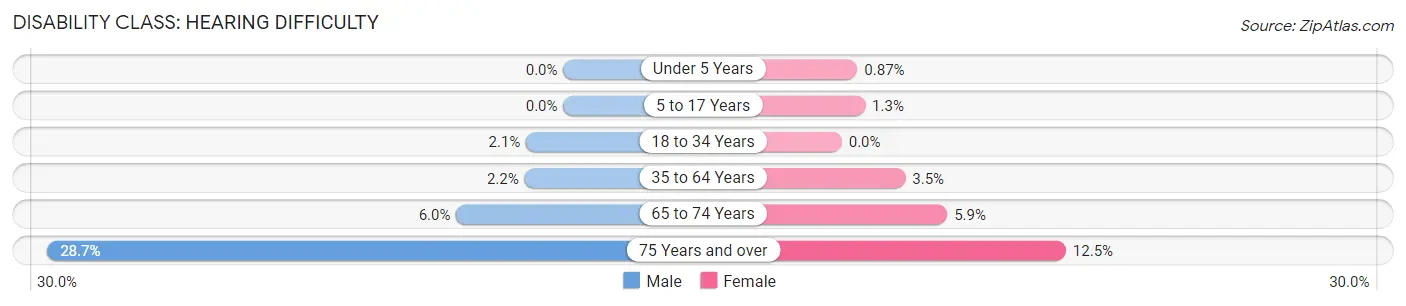
| Age Bracket | Male | Female |
| Under 5 Years | 0 (0.0%) | 9 (0.9%) |
| 5 to 17 Years | 0 (0.0%) | 31 (1.3%) |
| 18 to 34 Years | 60 (2.1%) | 0 (0.0%) |
| 35 to 64 Years | 103 (2.2%) | 150 (3.5%) |
| 65 to 74 Years | 67 (6.0%) | 68 (5.9%) |
| 75 Years and over | 238 (28.7%) | 151 (12.5%) |
Disability Class: Vision Difficulty
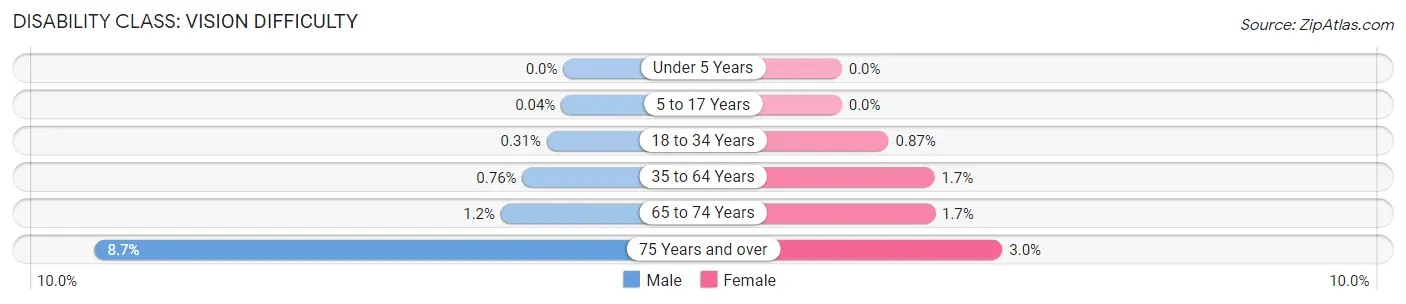
| Age Bracket | Male | Female |
| Under 5 Years | 0 (0.0%) | 0 (0.0%) |
| 5 to 17 Years | 1 (0.0%) | 0 (0.0%) |
| 18 to 34 Years | 9 (0.3%) | 23 (0.9%) |
| 35 to 64 Years | 36 (0.8%) | 73 (1.7%) |
| 65 to 74 Years | 13 (1.2%) | 20 (1.7%) |
| 75 Years and over | 72 (8.7%) | 36 (3.0%) |
Disability Class: Cognitive Difficulty
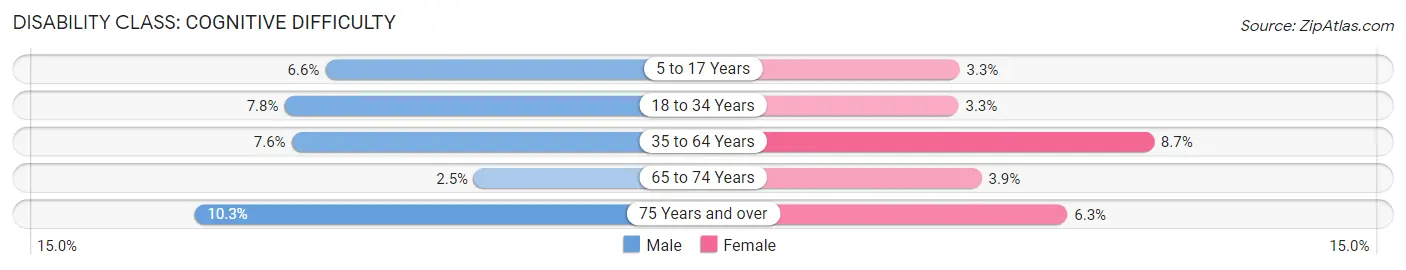
| Age Bracket | Male | Female |
| 5 to 17 Years | 169 (6.6%) | 78 (3.3%) |
| 18 to 34 Years | 225 (7.8%) | 86 (3.3%) |
| 35 to 64 Years | 361 (7.6%) | 368 (8.7%) |
| 65 to 74 Years | 28 (2.5%) | 45 (3.9%) |
| 75 Years and over | 85 (10.3%) | 76 (6.3%) |
Disability Class: Ambulatory Difficulty
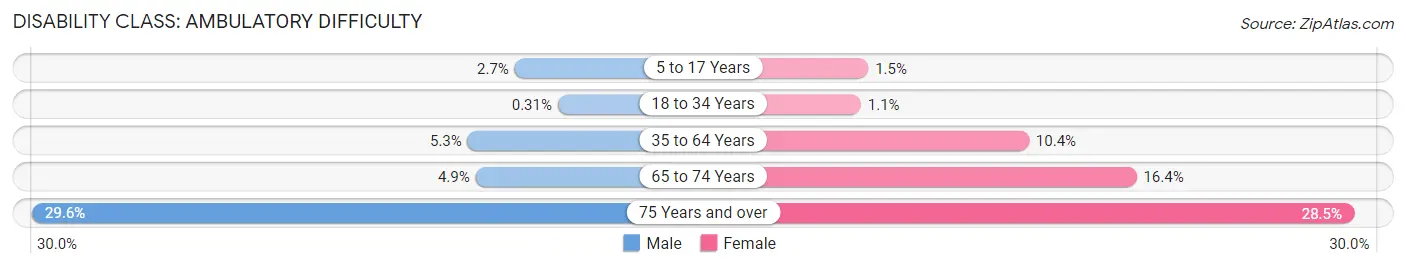
| Age Bracket | Male | Female |
| 5 to 17 Years | 69 (2.7%) | 35 (1.5%) |
| 18 to 34 Years | 9 (0.3%) | 28 (1.1%) |
| 35 to 64 Years | 254 (5.3%) | 441 (10.4%) |
| 65 to 74 Years | 55 (4.9%) | 190 (16.4%) |
| 75 Years and over | 245 (29.6%) | 345 (28.5%) |
Disability Class: Self-Care Difficulty
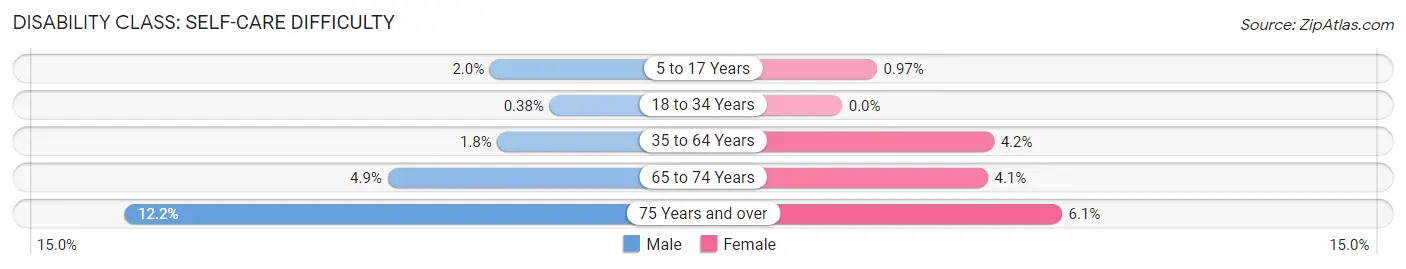
| Age Bracket | Male | Female |
| 5 to 17 Years | 52 (2.0%) | 23 (1.0%) |
| 18 to 34 Years | 11 (0.4%) | 0 (0.0%) |
| 35 to 64 Years | 87 (1.8%) | 179 (4.2%) |
| 65 to 74 Years | 55 (4.9%) | 47 (4.1%) |
| 75 Years and over | 101 (12.2%) | 74 (6.1%) |
Technology Access in Austin
Computing Device Access in Austin
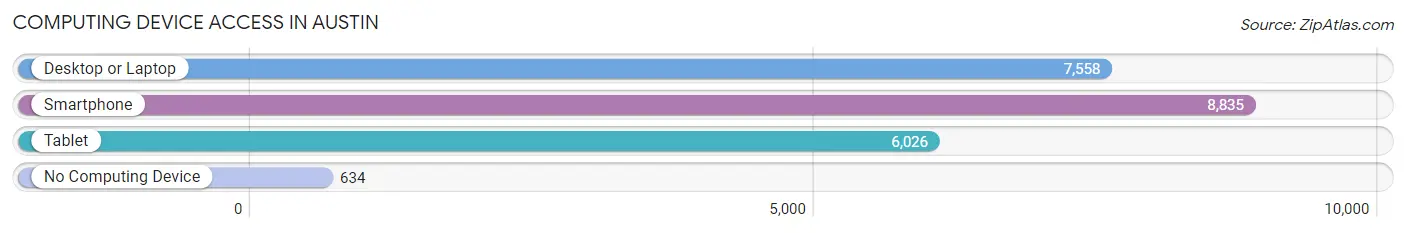
| Device Type | # Households | % Households |
| Desktop or Laptop | 7,558 | 74.3% |
| Smartphone | 8,835 | 86.9% |
| Tablet | 6,026 | 59.2% |
| No Computing Device | 634 | 6.2% |
| Total | 10,172 | 100.0% |
Internet Access in Austin
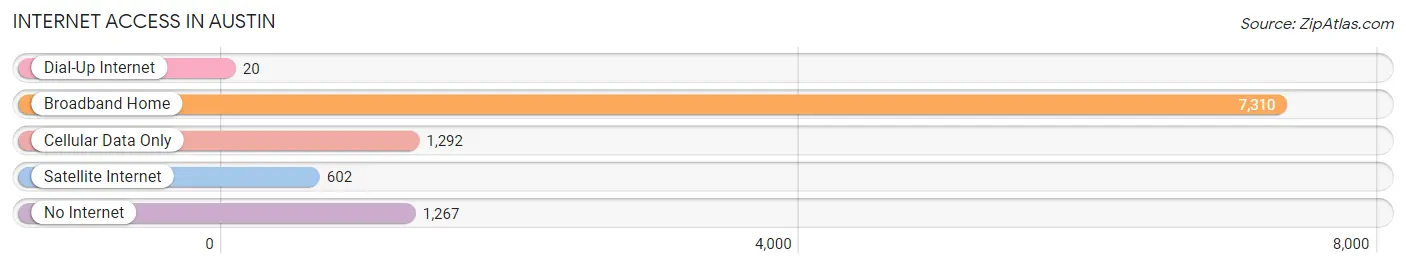
| Internet Type | # Households | % Households |
| Dial-Up Internet | 20 | 0.2% |
| Broadband Home | 7,310 | 71.9% |
| Cellular Data Only | 1,292 | 12.7% |
| Satellite Internet | 602 | 5.9% |
| No Internet | 1,267 | 12.5% |
| Total | 10,172 | 100.0% |
Austin Summary
Austin, Minnesota is a city located in Mower County, Minnesota, United States. The population was 24,718 at the 2010 census, making it the eleventh largest city in Minnesota. It is the county seat of Mower County. Austin is located along the Cedar River, 90 miles south of Minneapolis.
Geography
Austin is located at the intersection of Interstate 90 and U.S. Highway 218 in southeastern Minnesota. The city is situated on the Cedar River, which flows through the city from the northwest to the southeast. The city is located in the Driftless Area, a region of Minnesota that was not glaciated during the last ice age. The city is surrounded by rolling hills and bluffs, and is located in the Driftless Area of Minnesota.
The city has a total area of 11.2 square miles, of which 11.1 square miles is land and 0.1 square miles is water.
History
The area that is now Austin was first settled in 1853 by settlers from New York. The city was named after Austin R. Nichols, a railroad official. The city was incorporated in 1868.
In the late 19th century, Austin was a major center for the lumber industry. The city was also home to several large flour mills, which were powered by the Cedar River.
In the early 20th century, Austin was a major center for the meatpacking industry. The city was home to several large meatpacking plants, including the Austin Packing Company, which was founded in 1906.
Economy
Austin is a major center for the agricultural industry. The city is home to several large agricultural companies, including Hormel Foods, Quality Pork Processors, and Austin Packaging.
The city is also home to several large manufacturing companies, including Pace Industries, which produces aluminum die castings, and Austin Plastics, which produces plastic products.
The city is also home to several large retail stores including Walmart Target and Kohl s
Demographics
As of the 2010 census, there were 24,718 people, 9,945 households, and 6,072 families residing in the city. The population density was 2,223.3 people per square mile. The racial makeup of the city was 92.3% White, 1.2% African American, 0.4% Native American, 0.7% Asian, 0.1% Pacific Islander, 3.7% from other races, and 1.8% from two or more races. Hispanic or Latino of any race were 8.2% of the population.
The median income for a household in the city was $41,945, and the median income for a family was $51,945. The per capita income for the city was $20,945. About 8.2% of families and 11.2% of the population were below the poverty line, including 15.2% of those under age 18 and 8.2% of those age 65 or over.
Common Questions
What is Per Capita Income in Austin?
Per Capita income in Austin is $29,992.
What is the Median Family Income in Austin?
Median Family Income in Austin is $79,887.
What is the Median Household income in Austin?
Median Household Income in Austin is $61,667.
What is Income or Wage Gap in Austin?
Income or Wage Gap in Austin is 27.7%.
Women in Austin earn 72.3 cents for every dollar earned by a man.
What is Family Income Deficit in Austin?
Family Income Deficit in Austin is $9,248.
Families that are below poverty line in Austin earn $9,248 less on average than the poverty threshold level.
What is Inequality or Gini Index in Austin?
Inequality or Gini Index in Austin is 0.39.
What is the Total Population of Austin?
Total Population of Austin is 26,156.
What is the Total Male Population of Austin?
Total Male Population of Austin is 13,325.
What is the Total Female Population of Austin?
Total Female Population of Austin is 12,831.
What is the Ratio of Males per 100 Females in Austin?
There are 103.85 Males per 100 Females in Austin.
What is the Ratio of Females per 100 Males in Austin?
There are 96.29 Females per 100 Males in Austin.
What is the Median Population Age in Austin?
Median Population Age in Austin is 37.0 Years.
What is the Average Family Size in Austin
Average Family Size in Austin is 3.1 People.
What is the Average Household Size in Austin
Average Household Size in Austin is 2.5 People.
How Large is the Labor Force in Austin?
There are 12,756 People in the Labor Forcein in Austin.
What is the Percentage of People in the Labor Force in Austin?
64.0% of People are in the Labor Force in Austin.
What is the Unemployment Rate in Austin?
Unemployment Rate in Austin is 3.5%.