Irmo, SC Map & Demographics
Irmo Map
Irmo Overview
$34,177
PER CAPITA INCOME
$85,205
AVG FAMILY INCOME
$77,656
AVG HOUSEHOLD INCOME
17.7%
WAGE / INCOME GAP [ % ]
82.3¢/ $1
WAGE / INCOME GAP [ $ ]
$12,557
FAMILY INCOME DEFICIT
0.37
INEQUALITY / GINI INDEX
11,685
TOTAL POPULATION
5,680
MALE POPULATION
6,005
FEMALE POPULATION
94.59
MALES / 100 FEMALES
105.72
FEMALES / 100 MALES
39.2
MEDIAN AGE
2.9
AVG FAMILY SIZE
2.5
AVG HOUSEHOLD SIZE
6,469
LABOR FORCE [ PEOPLE ]
68.3%
PERCENT IN LABOR FORCE
4.6%
UNEMPLOYMENT RATE
Irmo Zip Codes
Income in Irmo
Income Overview in Irmo
Per Capita Income in Irmo is $34,177, while median incomes of families and households are $85,205 and $77,656 respectively.
| Characteristic | Number | Measure |
| Per Capita Income | 11,685 | $34,177 |
| Median Family Income | 3,358 | $85,205 |
| Mean Family Income | 3,358 | $93,630 |
| Median Household Income | 4,641 | $77,656 |
| Mean Household Income | 4,641 | $87,005 |
| Income Deficit | 3,358 | $12,557 |
| Wage / Income Gap (%) | 11,685 | 17.66% |
| Wage / Income Gap ($) | 11,685 | 82.34¢ per $1 |
| Gini / Inequality Index | 11,685 | 0.37 |
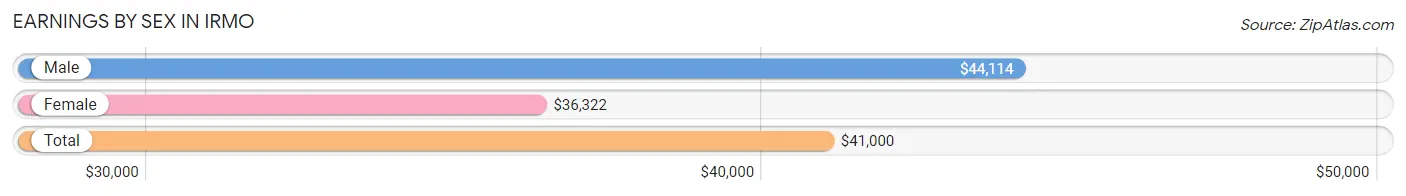
Earnings by Sex in Irmo
Average Earnings in Irmo are $41,000, $44,114 for men and $36,322 for women, a difference of 17.7%.
| Sex | Number | Average Earnings |
| Male | 3,393 (51.4%) | $44,114 |
| Female | 3,207 (48.6%) | $36,322 |
| Total | 6,600 (100.0%) | $41,000 |
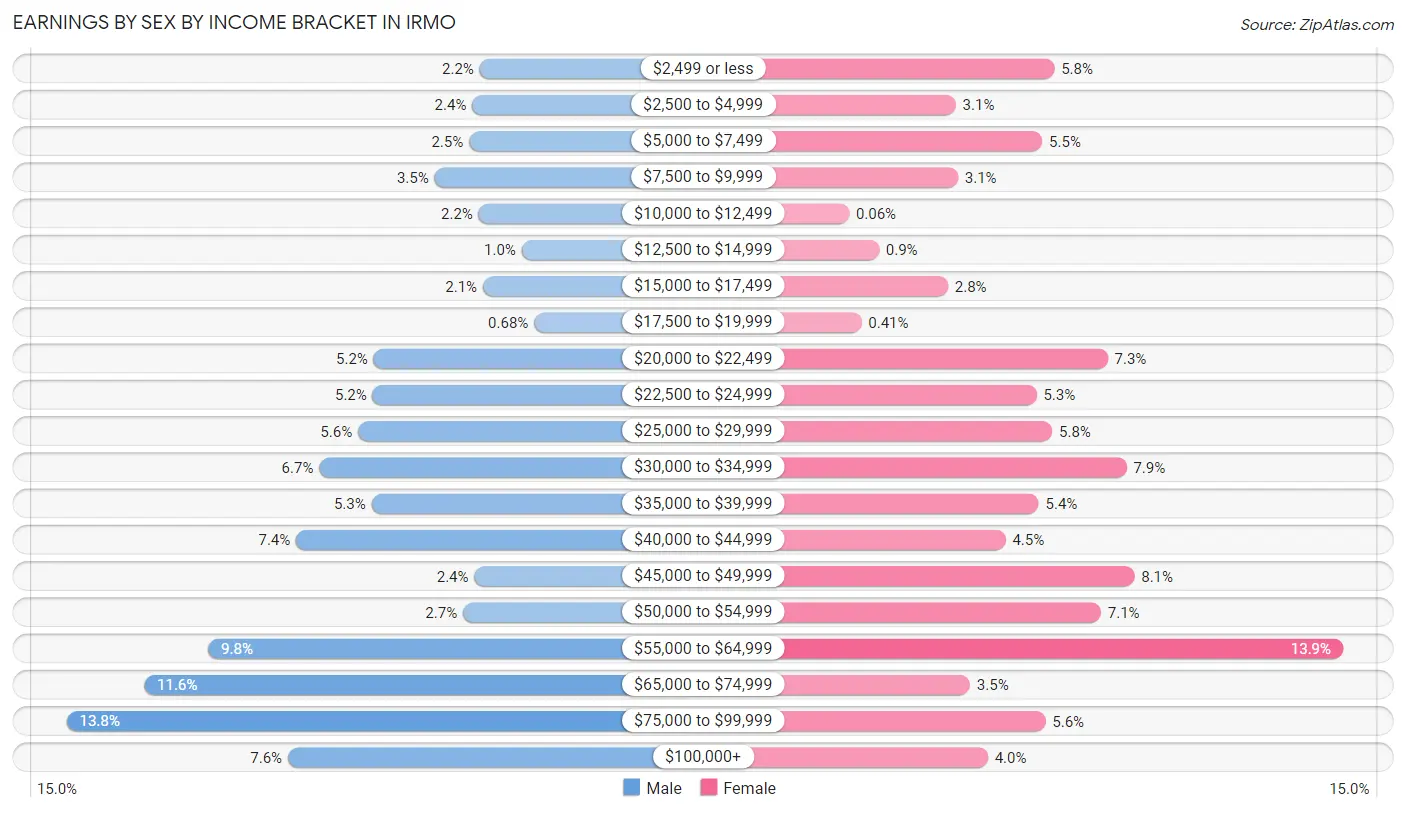
Earnings by Sex by Income Bracket in Irmo
The most common earnings brackets in Irmo are $75,000 to $99,999 for men (469 | 13.8%) and $55,000 to $64,999 for women (447 | 13.9%).
| Income | Male | Female |
| $2,499 or less | 75 (2.2%) | 187 (5.8%) |
| $2,500 to $4,999 | 82 (2.4%) | 98 (3.1%) |
| $5,000 to $7,499 | 85 (2.5%) | 176 (5.5%) |
| $7,500 to $9,999 | 118 (3.5%) | 100 (3.1%) |
| $10,000 to $12,499 | 76 (2.2%) | 2 (0.1%) |
| $12,500 to $14,999 | 35 (1.0%) | 29 (0.9%) |
| $15,000 to $17,499 | 72 (2.1%) | 91 (2.8%) |
| $17,500 to $19,999 | 23 (0.7%) | 13 (0.4%) |
| $20,000 to $22,499 | 176 (5.2%) | 235 (7.3%) |
| $22,500 to $24,999 | 177 (5.2%) | 171 (5.3%) |
| $25,000 to $29,999 | 191 (5.6%) | 185 (5.8%) |
| $30,000 to $34,999 | 228 (6.7%) | 252 (7.9%) |
| $35,000 to $39,999 | 178 (5.2%) | 173 (5.4%) |
| $40,000 to $44,999 | 250 (7.4%) | 143 (4.5%) |
| $45,000 to $49,999 | 80 (2.4%) | 259 (8.1%) |
| $50,000 to $54,999 | 91 (2.7%) | 229 (7.1%) |
| $55,000 to $64,999 | 334 (9.8%) | 447 (13.9%) |
| $65,000 to $74,999 | 395 (11.6%) | 111 (3.5%) |
| $75,000 to $99,999 | 469 (13.8%) | 179 (5.6%) |
| $100,000+ | 258 (7.6%) | 127 (4.0%) |
| Total | 3,393 (100.0%) | 3,207 (100.0%) |
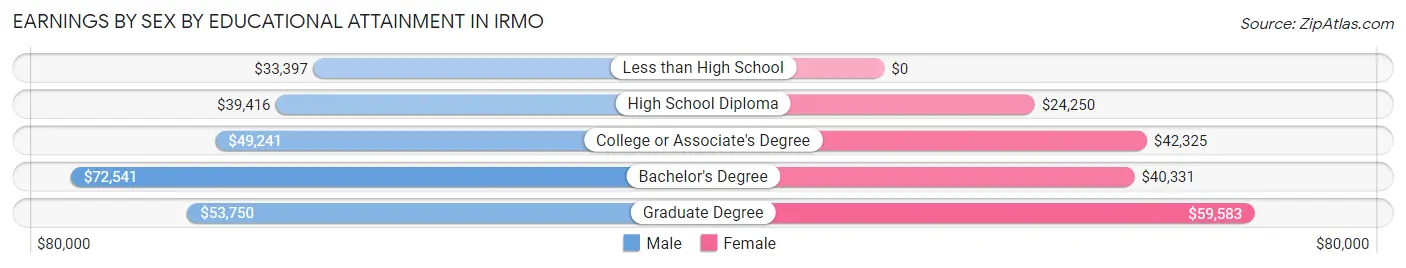
Earnings by Sex by Educational Attainment in Irmo
Average earnings in Irmo are $52,319 for men and $41,091 for women, a difference of 21.5%. Men with an educational attainment of bachelor's degree enjoy the highest average annual earnings of $72,541, while those with less than high school education earn the least with $33,397. Women with an educational attainment of graduate degree earn the most with the average annual earnings of $59,583, while those with high school diploma education have the smallest earnings of $24,250.
| Educational Attainment | Male Income | Female Income |
| Less than High School | $33,397 | $0 |
| High School Diploma | $39,416 | $24,250 |
| College or Associate's Degree | $49,241 | $42,325 |
| Bachelor's Degree | $72,541 | $40,331 |
| Graduate Degree | $53,750 | $59,583 |
| Total | $52,319 | $41,091 |
Family Income in Irmo
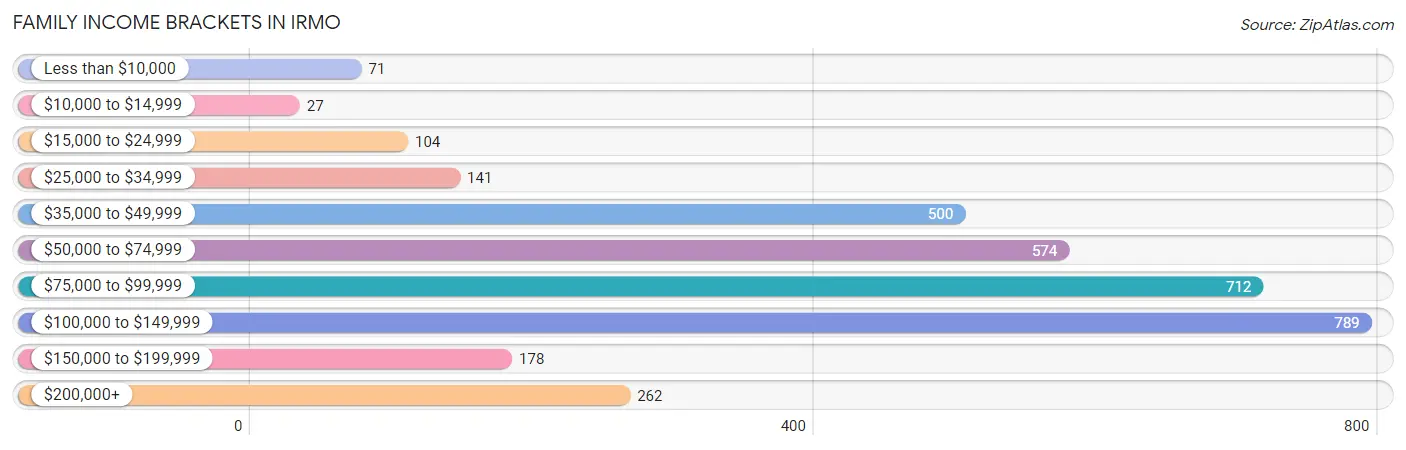
Family Income Brackets in Irmo
According to the Irmo family income data, there are 789 families falling into the $100,000 to $149,999 income range, which is the most common income bracket and makes up 23.5% of all families. Conversely, the $10,000 to $14,999 income bracket is the least frequent group with only 27 families (0.8%) belonging to this category.
| Income Bracket | # Families | % Families |
| Less than $10,000 | 71 | 2.1% |
| $10,000 to $14,999 | 27 | 0.8% |
| $15,000 to $24,999 | 104 | 3.1% |
| $25,000 to $34,999 | 141 | 4.2% |
| $35,000 to $49,999 | 500 | 14.9% |
| $50,000 to $74,999 | 574 | 17.1% |
| $75,000 to $99,999 | 712 | 21.2% |
| $100,000 to $149,999 | 789 | 23.5% |
| $150,000 to $199,999 | 178 | 5.3% |
| $200,000+ | 262 | 7.8% |
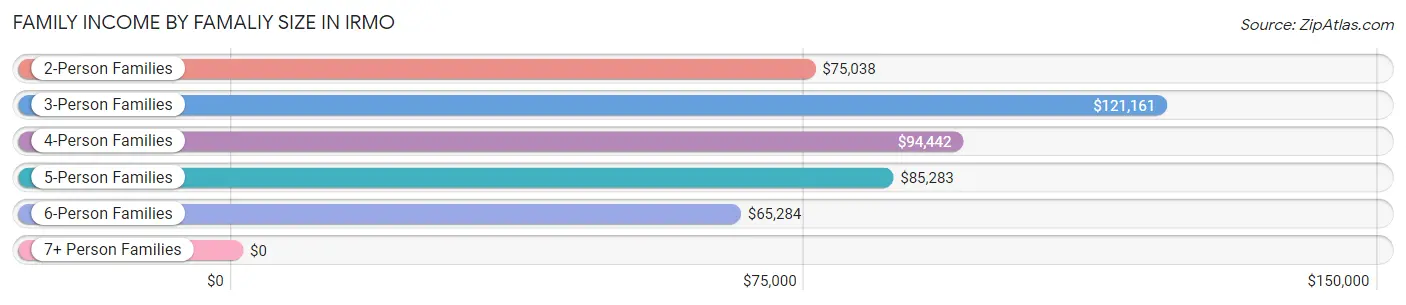
Family Income by Famaliy Size in Irmo
3-person families (761 | 22.7%) account for the highest median family income in Irmo with $121,161 per family, while 3-person families (761 | 22.7%) have the highest median income of $40,387 per family member.
| Income Bracket | # Families | Median Income |
| 2-Person Families | 1,787 (53.2%) | $75,038 |
| 3-Person Families | 761 (22.7%) | $121,161 |
| 4-Person Families | 473 (14.1%) | $94,442 |
| 5-Person Families | 244 (7.3%) | $85,283 |
| 6-Person Families | 73 (2.2%) | $65,284 |
| 7+ Person Families | 20 (0.6%) | $0 |
| Total | 3,358 (100.0%) | $85,205 |
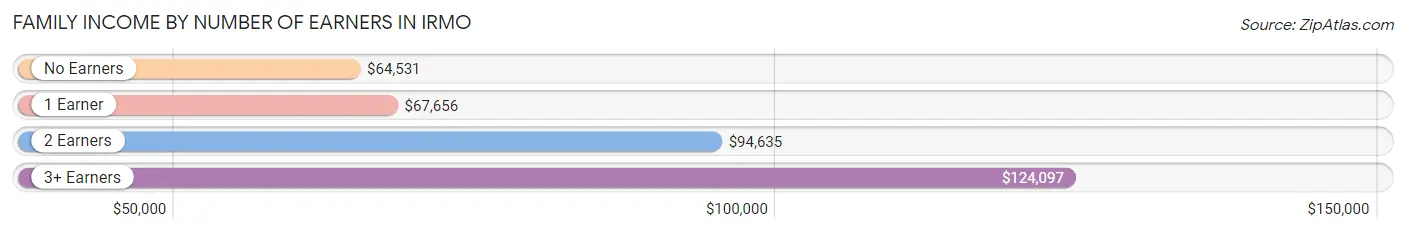
Family Income by Number of Earners in Irmo
The median family income in Irmo is $85,205, with families comprising 3+ earners (301) having the highest median family income of $124,097, while families with no earners (387) have the lowest median family income of $64,531, accounting for 9.0% and 11.5% of families, respectively.
| Number of Earners | # Families | Median Income |
| No Earners | 387 (11.5%) | $64,531 |
| 1 Earner | 1,269 (37.8%) | $67,656 |
| 2 Earners | 1,401 (41.7%) | $94,635 |
| 3+ Earners | 301 (9.0%) | $124,097 |
| Total | 3,358 (100.0%) | $85,205 |
Household Income in Irmo
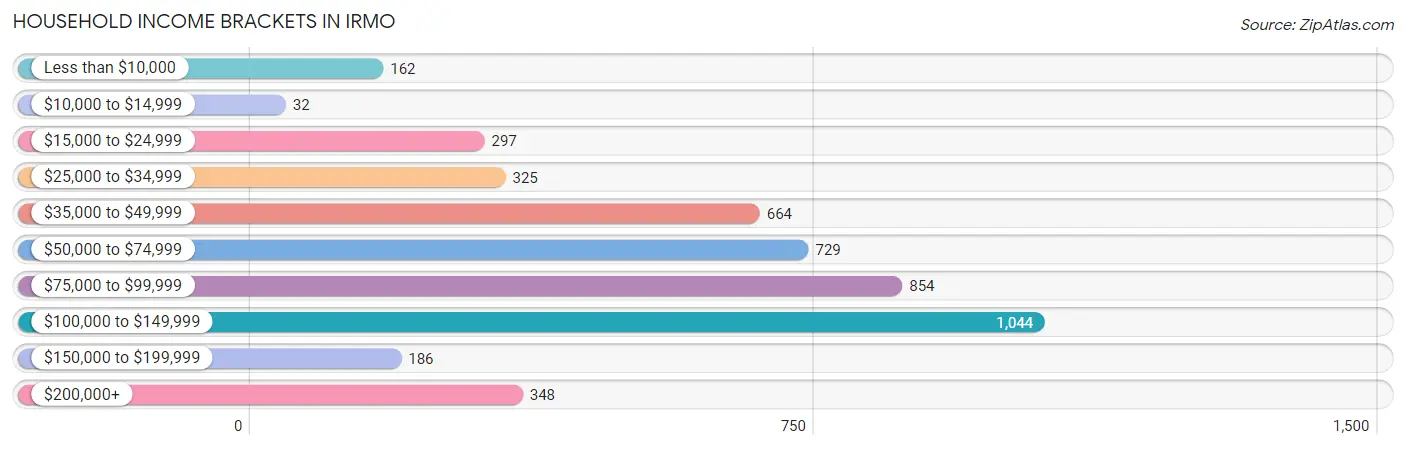
Household Income Brackets in Irmo
With 1,044 households falling in the category, the $100,000 to $149,999 income range is the most frequent in Irmo, accounting for 22.5% of all households. In contrast, only 32 households (0.7%) fall into the $10,000 to $14,999 income bracket, making it the least populous group.
| Income Bracket | # Households | % Households |
| Less than $10,000 | 162 | 3.5% |
| $10,000 to $14,999 | 32 | 0.7% |
| $15,000 to $24,999 | 297 | 6.4% |
| $25,000 to $34,999 | 325 | 7.0% |
| $35,000 to $49,999 | 664 | 14.3% |
| $50,000 to $74,999 | 729 | 15.7% |
| $75,000 to $99,999 | 854 | 18.4% |
| $100,000 to $149,999 | 1,044 | 22.5% |
| $150,000 to $199,999 | 186 | 4.0% |
| $200,000+ | 348 | 7.5% |
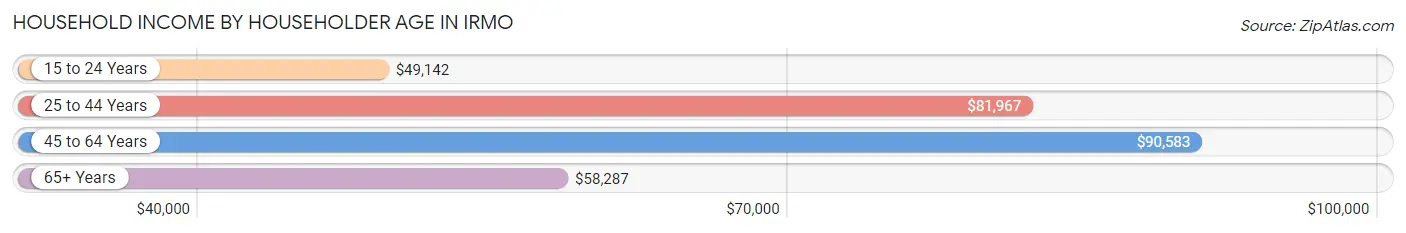
Household Income by Householder Age in Irmo
The median household income in Irmo is $77,656, with the highest median household income of $90,583 found in the 45 to 64 years age bracket for the primary householder. A total of 1,732 households (37.3%) fall into this category. Meanwhile, the 15 to 24 years age bracket for the primary householder has the lowest median household income of $49,142, with 131 households (2.8%) in this group.
| Income Bracket | # Households | Median Income |
| 15 to 24 Years | 131 (2.8%) | $49,142 |
| 25 to 44 Years | 1,525 (32.9%) | $81,967 |
| 45 to 64 Years | 1,732 (37.3%) | $90,583 |
| 65+ Years | 1,253 (27.0%) | $58,287 |
| Total | 4,641 (100.0%) | $77,656 |
Poverty in Irmo
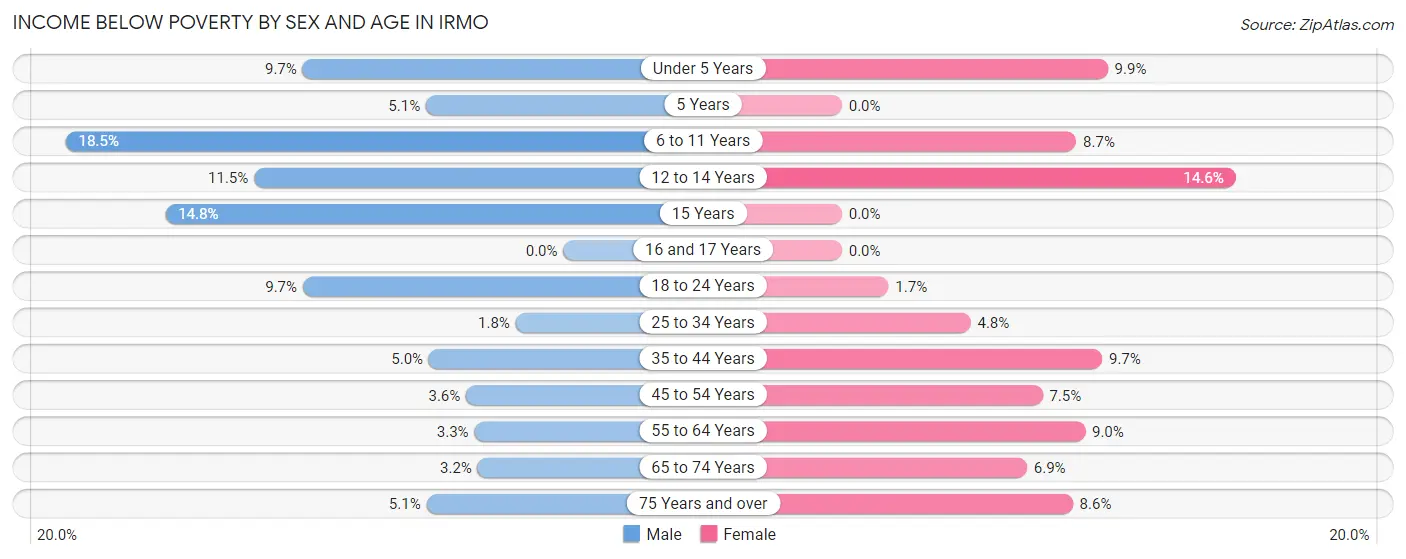
Income Below Poverty by Sex and Age in Irmo
With 6.0% poverty level for males and 7.1% for females among the residents of Irmo, 6 to 11 year old males and 12 to 14 year old females are the most vulnerable to poverty, with 78 males (18.5%) and 25 females (14.6%) in their respective age groups living below the poverty level.
| Age Bracket | Male | Female |
| Under 5 Years | 21 (9.7%) | 23 (9.9%) |
| 5 Years | 5 (5.1%) | 0 (0.0%) |
| 6 to 11 Years | 78 (18.5%) | 52 (8.7%) |
| 12 to 14 Years | 28 (11.5%) | 25 (14.6%) |
| 15 Years | 17 (14.8%) | 0 (0.0%) |
| 16 and 17 Years | 0 (0.0%) | 0 (0.0%) |
| 18 to 24 Years | 59 (9.7%) | 6 (1.7%) |
| 25 to 34 Years | 15 (1.8%) | 46 (4.8%) |
| 35 to 44 Years | 39 (5.0%) | 54 (9.7%) |
| 45 to 54 Years | 21 (3.6%) | 76 (7.4%) |
| 55 to 64 Years | 26 (3.3%) | 58 (9.0%) |
| 65 to 74 Years | 15 (3.2%) | 46 (6.9%) |
| 75 Years and over | 16 (5.1%) | 43 (8.6%) |
| Total | 340 (6.0%) | 429 (7.1%) |
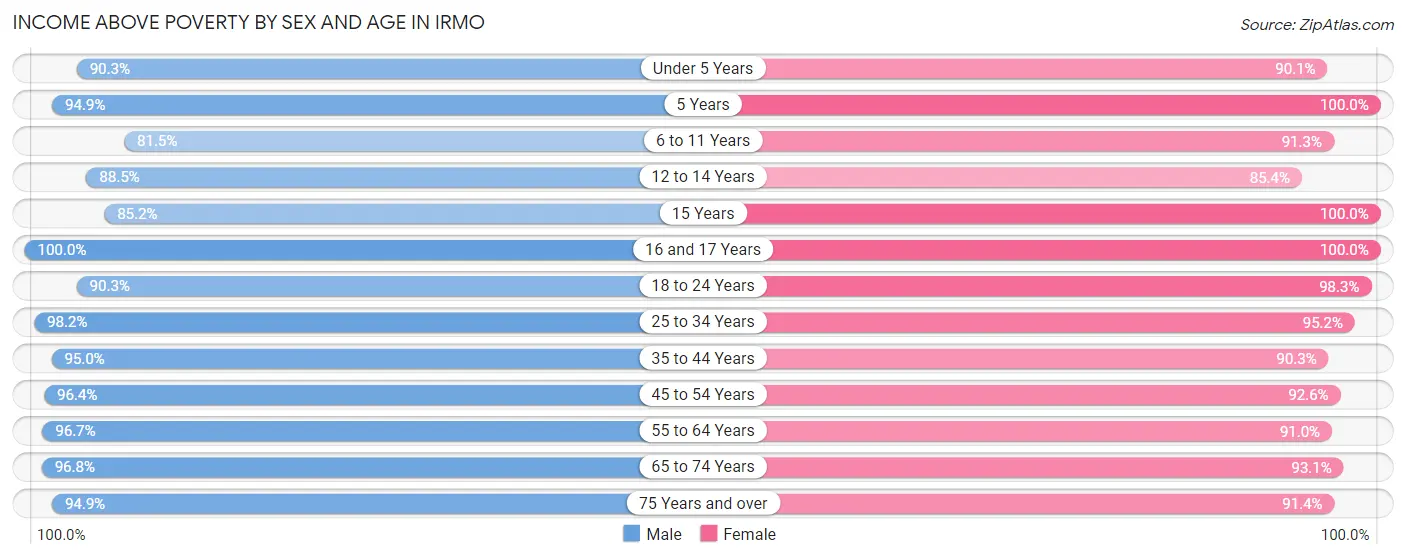
Income Above Poverty by Sex and Age in Irmo
According to the poverty statistics in Irmo, males aged 16 and 17 years and females aged 5 years are the age groups that are most secure financially, with 100.0% of males and 100.0% of females in these age groups living above the poverty line.
| Age Bracket | Male | Female |
| Under 5 Years | 196 (90.3%) | 210 (90.1%) |
| 5 Years | 93 (94.9%) | 34 (100.0%) |
| 6 to 11 Years | 344 (81.5%) | 546 (91.3%) |
| 12 to 14 Years | 216 (88.5%) | 146 (85.4%) |
| 15 Years | 98 (85.2%) | 82 (100.0%) |
| 16 and 17 Years | 187 (100.0%) | 183 (100.0%) |
| 18 to 24 Years | 551 (90.3%) | 340 (98.3%) |
| 25 to 34 Years | 831 (98.2%) | 917 (95.2%) |
| 35 to 44 Years | 743 (95.0%) | 505 (90.3%) |
| 45 to 54 Years | 561 (96.4%) | 944 (92.5%) |
| 55 to 64 Years | 762 (96.7%) | 584 (91.0%) |
| 65 to 74 Years | 456 (96.8%) | 624 (93.1%) |
| 75 Years and over | 299 (94.9%) | 459 (91.4%) |
| Total | 5,337 (94.0%) | 5,574 (92.8%) |
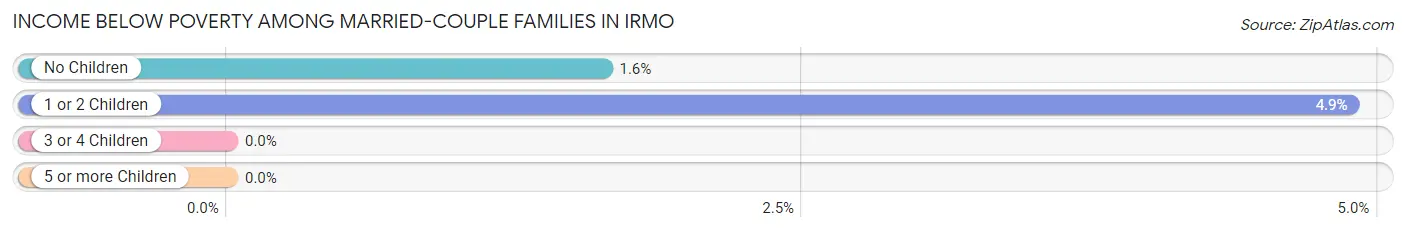
Income Below Poverty Among Married-Couple Families in Irmo
The poverty statistics for married-couple families in Irmo show that 2.6% or 65 of the total 2,481 families live below the poverty line. Families with 1 or 2 children have the highest poverty rate of 4.9%, comprising of 40 families. On the other hand, families with 3 or 4 children have the lowest poverty rate of 0.0%, which includes 0 families.
| Children | Above Poverty | Below Poverty |
| No Children | 1,508 (98.4%) | 25 (1.6%) |
| 1 or 2 Children | 780 (95.1%) | 40 (4.9%) |
| 3 or 4 Children | 128 (100.0%) | 0 (0.0%) |
| 5 or more Children | 0 (0.0%) | 0 (0.0%) |
| Total | 2,416 (97.4%) | 65 (2.6%) |
Income Below Poverty Among Single-Parent Households in Irmo
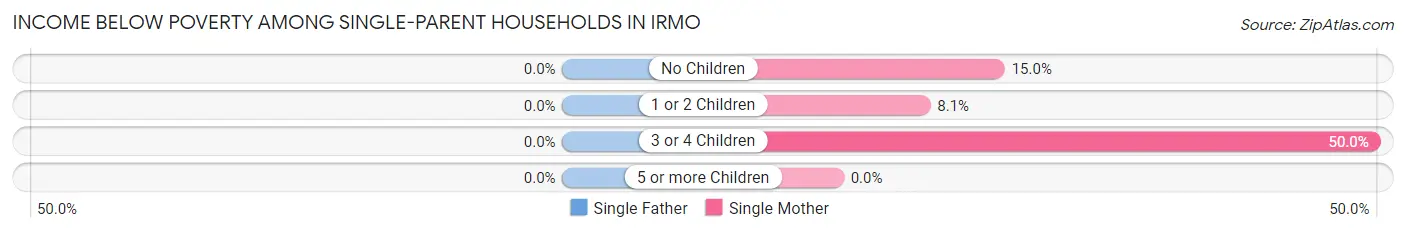
| Children | Single Father | Single Mother |
| No Children | 0 (0.0%) | 15 (15.0%) |
| 1 or 2 Children | 0 (0.0%) | 33 (8.1%) |
| 3 or 4 Children | 0 (0.0%) | 53 (50.0%) |
| 5 or more Children | 0 (0.0%) | 0 (0.0%) |
| Total | 0 (0.0%) | 101 (16.4%) |
Income Below Poverty Among Married-Couple vs Single-Parent Households in Irmo
The poverty data for Irmo shows that 65 of the married-couple family households (2.6%) and 101 of the single-parent households (11.5%) are living below the poverty level. Within the married-couple family households, those with 1 or 2 children have the highest poverty rate, with 40 households (4.9%) falling below the poverty line. Among the single-parent households, those with 3 or 4 children have the highest poverty rate, with 53 household (50.0%) living below poverty.
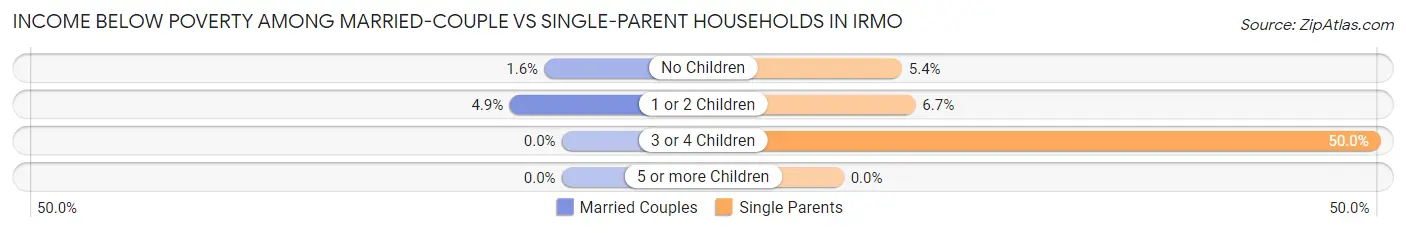
| Children | Married-Couple Families | Single-Parent Households |
| No Children | 25 (1.6%) | 15 (5.4%) |
| 1 or 2 Children | 40 (4.9%) | 33 (6.7%) |
| 3 or 4 Children | 0 (0.0%) | 53 (50.0%) |
| 5 or more Children | 0 (0.0%) | 0 (0.0%) |
| Total | 65 (2.6%) | 101 (11.5%) |
Race in Irmo
The most populous races in Irmo are White / Caucasian (7,327 | 62.7%), Black / African American (3,403 | 29.1%), and Asian (495 | 4.2%).
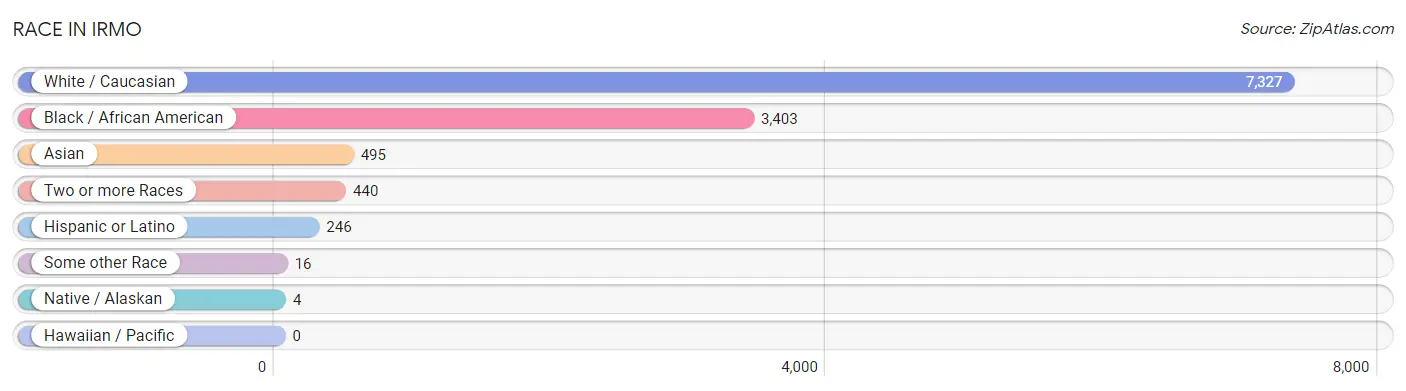
| Race | # Population | % Population |
| Asian | 495 | 4.2% |
| Black / African American | 3,403 | 29.1% |
| Hawaiian / Pacific | 0 | 0.0% |
| Hispanic or Latino | 246 | 2.1% |
| Native / Alaskan | 4 | 0.0% |
| White / Caucasian | 7,327 | 62.7% |
| Two or more Races | 440 | 3.8% |
| Some other Race | 16 | 0.1% |
| Total | 11,685 | 100.0% |
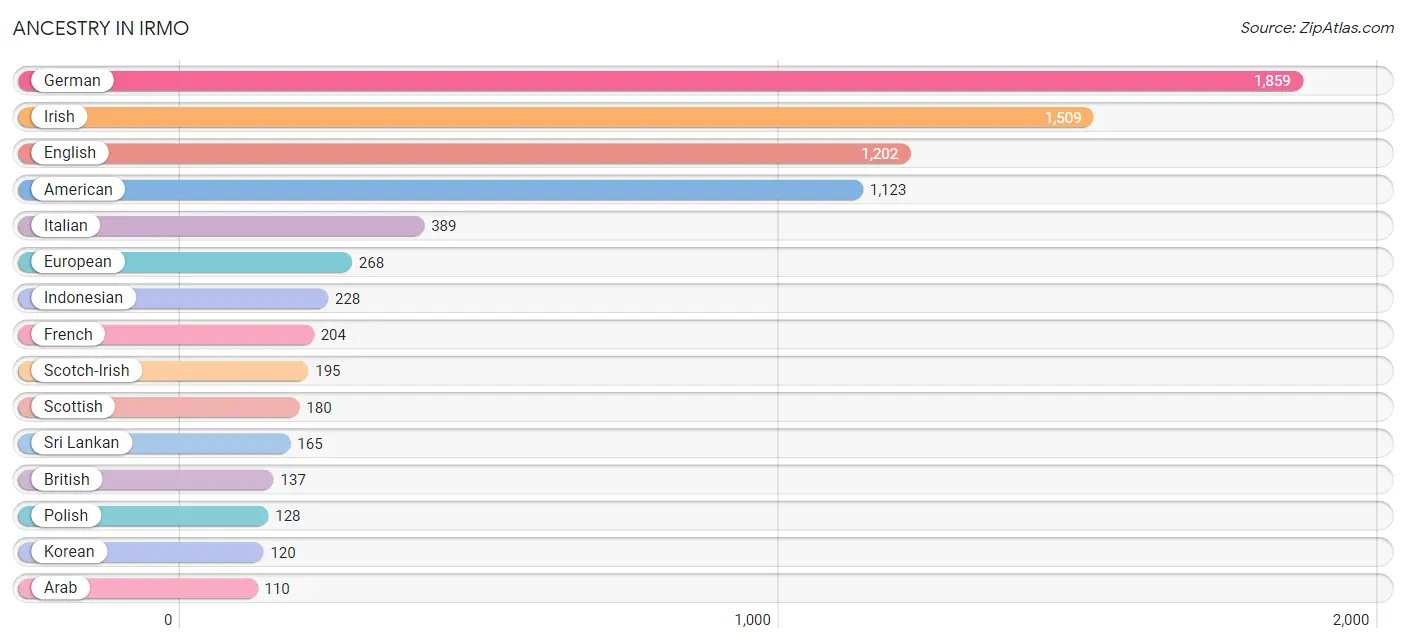
Ancestry in Irmo
The most populous ancestries reported in Irmo are German (1,859 | 15.9%), Irish (1,509 | 12.9%), English (1,202 | 10.3%), American (1,123 | 9.6%), and Italian (389 | 3.3%), together accounting for 52.1% of all Irmo residents.
| Ancestry | # Population | % Population |
| African | 61 | 0.5% |
| American | 1,123 | 9.6% |
| Arab | 110 | 0.9% |
| Austrian | 47 | 0.4% |
| Blackfeet | 5 | 0.0% |
| British | 137 | 1.2% |
| British West Indian | 9 | 0.1% |
| Burmese | 12 | 0.1% |
| Cherokee | 50 | 0.4% |
| Cuban | 11 | 0.1% |
| Czech | 13 | 0.1% |
| Danish | 14 | 0.1% |
| Dutch | 85 | 0.7% |
| Eastern European | 37 | 0.3% |
| English | 1,202 | 10.3% |
| European | 268 | 2.3% |
| French | 204 | 1.8% |
| French Canadian | 33 | 0.3% |
| German | 1,859 | 15.9% |
| Indonesian | 228 | 1.9% |
| Iraqi | 63 | 0.5% |
| Irish | 1,509 | 12.9% |
| Italian | 389 | 3.3% |
| Korean | 120 | 1.0% |
| Lebanese | 89 | 0.8% |
| Lumbee | 2 | 0.0% |
| Mexican | 40 | 0.3% |
| Norwegian | 2 | 0.0% |
| Polish | 128 | 1.1% |
| Puerto Rican | 46 | 0.4% |
| Russian | 84 | 0.7% |
| Scandinavian | 44 | 0.4% |
| Scotch-Irish | 195 | 1.7% |
| Scottish | 180 | 1.5% |
| Slavic | 14 | 0.1% |
| Slovene | 36 | 0.3% |
| South American | 60 | 0.5% |
| Spaniard | 81 | 0.7% |
| Spanish | 8 | 0.1% |
| Sri Lankan | 165 | 1.4% |
| Subsaharan African | 61 | 0.5% |
| Swedish | 29 | 0.3% |
| Swiss | 84 | 0.7% |
| Thai | 28 | 0.2% |
| Trinidadian and Tobagonian | 36 | 0.3% |
| Ukrainian | 64 | 0.5% |
| Venezuelan | 60 | 0.5% |
| Welsh | 5 | 0.0% |
| West Indian | 10 | 0.1% | View All 49 Rows |
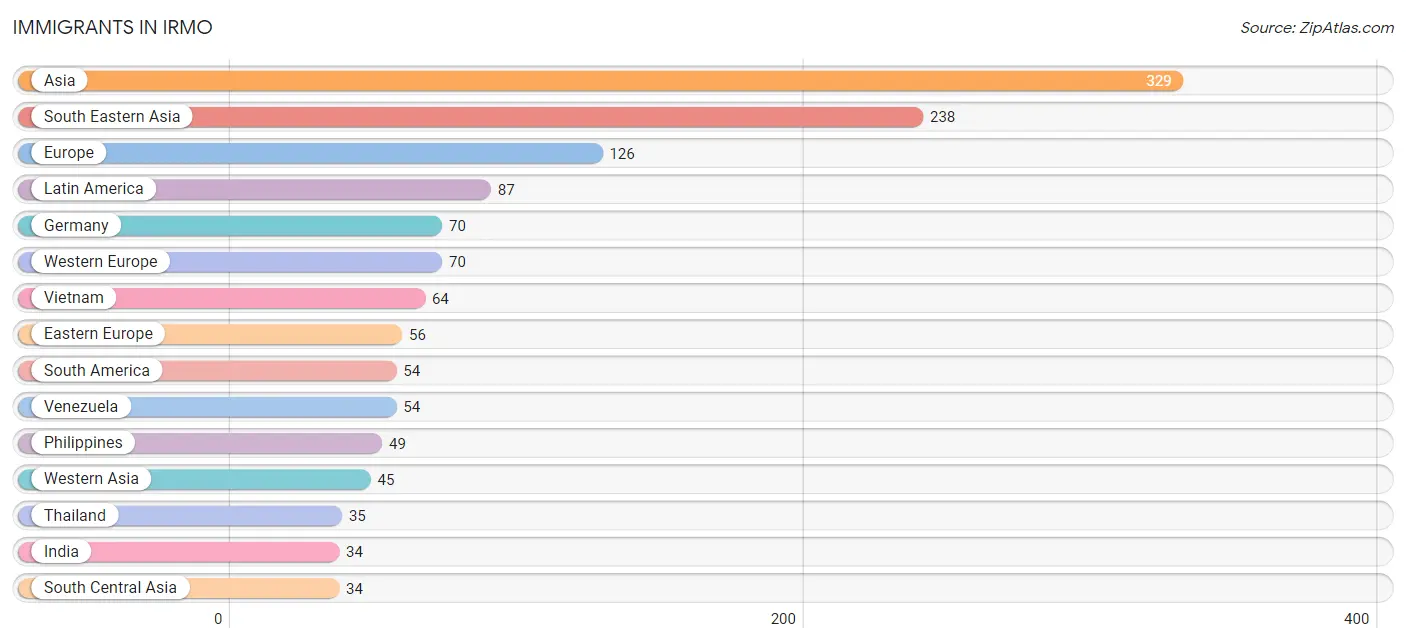
Immigrants in Irmo
The most numerous immigrant groups reported in Irmo came from Asia (329 | 2.8%), South Eastern Asia (238 | 2.0%), Europe (126 | 1.1%), Latin America (87 | 0.7%), and Germany (70 | 0.6%), together accounting for 7.3% of all Irmo residents.
| Immigration Origin | # Population | % Population |
| Africa | 23 | 0.2% |
| Asia | 329 | 2.8% |
| Belarus | 18 | 0.2% |
| Caribbean | 9 | 0.1% |
| Central America | 24 | 0.2% |
| Eastern Asia | 12 | 0.1% |
| Eastern Europe | 56 | 0.5% |
| Europe | 126 | 1.1% |
| Germany | 70 | 0.6% |
| India | 34 | 0.3% |
| Iraq | 21 | 0.2% |
| Korea | 12 | 0.1% |
| Latin America | 87 | 0.7% |
| Lebanon | 24 | 0.2% |
| Mexico | 24 | 0.2% |
| Philippines | 49 | 0.4% |
| Russia | 21 | 0.2% |
| South America | 54 | 0.5% |
| South Central Asia | 34 | 0.3% |
| South Eastern Asia | 238 | 2.0% |
| Thailand | 35 | 0.3% |
| Ukraine | 17 | 0.2% |
| Venezuela | 54 | 0.5% |
| Vietnam | 64 | 0.5% |
| Western Africa | 23 | 0.2% |
| Western Asia | 45 | 0.4% |
| Western Europe | 70 | 0.6% | View All 27 Rows |
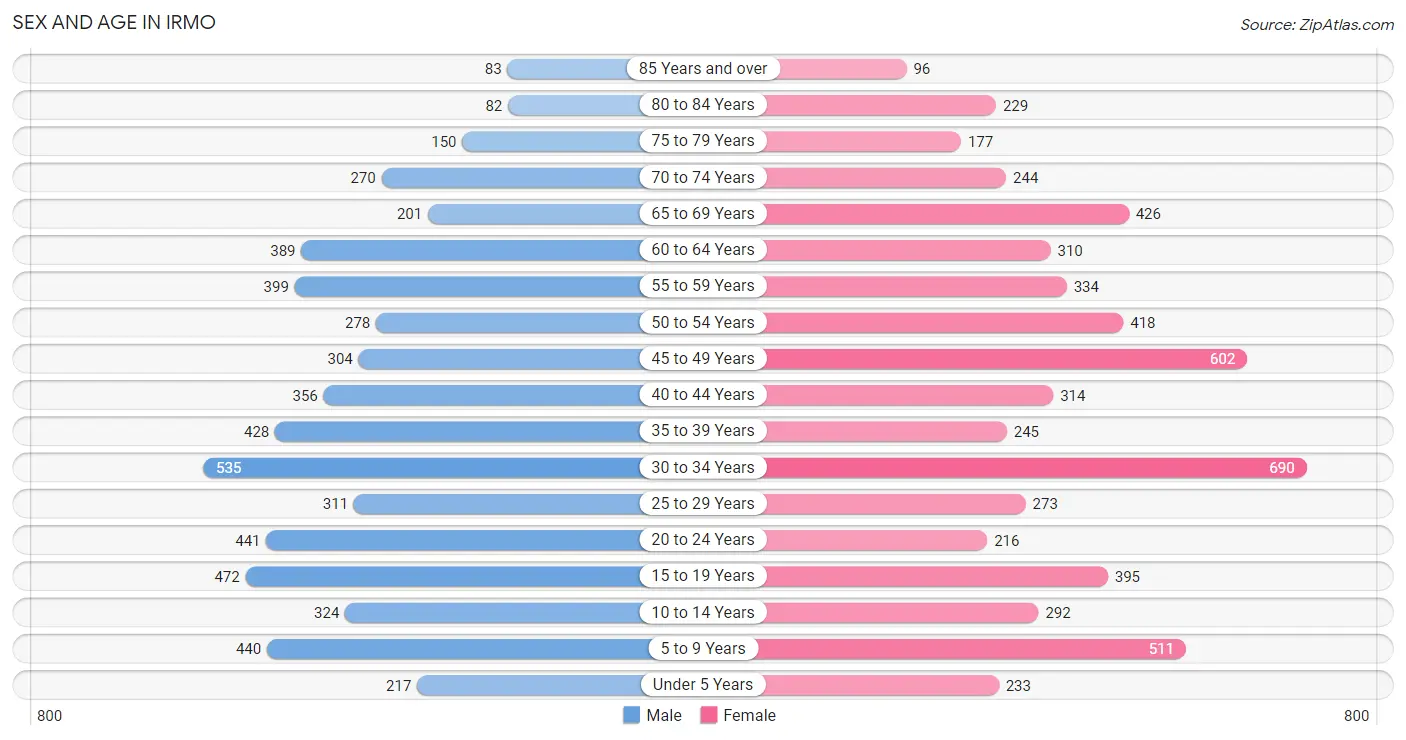
Sex and Age in Irmo
Sex and Age in Irmo
The most populous age groups in Irmo are 30 to 34 Years (535 | 9.4%) for men and 30 to 34 Years (690 | 11.5%) for women.
| Age Bracket | Male | Female |
| Under 5 Years | 217 (3.8%) | 233 (3.9%) |
| 5 to 9 Years | 440 (7.7%) | 511 (8.5%) |
| 10 to 14 Years | 324 (5.7%) | 292 (4.9%) |
| 15 to 19 Years | 472 (8.3%) | 395 (6.6%) |
| 20 to 24 Years | 441 (7.8%) | 216 (3.6%) |
| 25 to 29 Years | 311 (5.5%) | 273 (4.5%) |
| 30 to 34 Years | 535 (9.4%) | 690 (11.5%) |
| 35 to 39 Years | 428 (7.5%) | 245 (4.1%) |
| 40 to 44 Years | 356 (6.3%) | 314 (5.2%) |
| 45 to 49 Years | 304 (5.3%) | 602 (10.0%) |
| 50 to 54 Years | 278 (4.9%) | 418 (7.0%) |
| 55 to 59 Years | 399 (7.0%) | 334 (5.6%) |
| 60 to 64 Years | 389 (6.9%) | 310 (5.2%) |
| 65 to 69 Years | 201 (3.5%) | 426 (7.1%) |
| 70 to 74 Years | 270 (4.8%) | 244 (4.1%) |
| 75 to 79 Years | 150 (2.6%) | 177 (2.9%) |
| 80 to 84 Years | 82 (1.4%) | 229 (3.8%) |
| 85 Years and over | 83 (1.5%) | 96 (1.6%) |
| Total | 5,680 (100.0%) | 6,005 (100.0%) |
Families and Households in Irmo
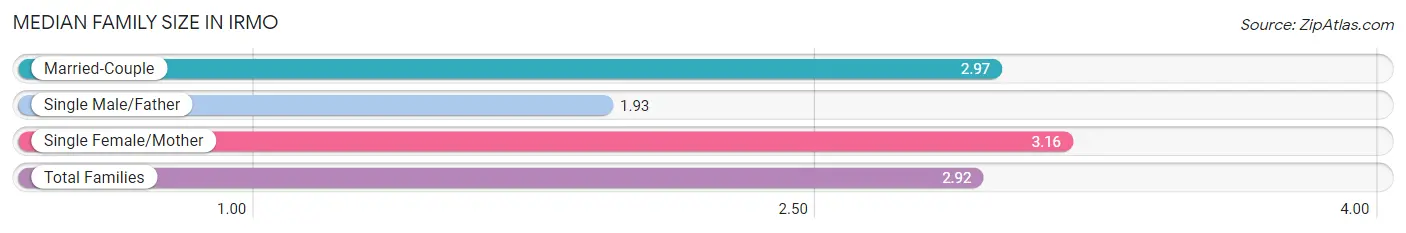
Median Family Size in Irmo
The median family size in Irmo is 2.92 persons per family, with single female/mother families (615 | 18.3%) accounting for the largest median family size of 3.16 persons per family. On the other hand, single male/father families (262 | 7.8%) represent the smallest median family size with 1.93 persons per family.
| Family Type | # Families | Family Size |
| Married-Couple | 2,481 (73.9%) | 2.97 |
| Single Male/Father | 262 (7.8%) | 1.93 |
| Single Female/Mother | 615 (18.3%) | 3.16 |
| Total Families | 3,358 (100.0%) | 2.92 |
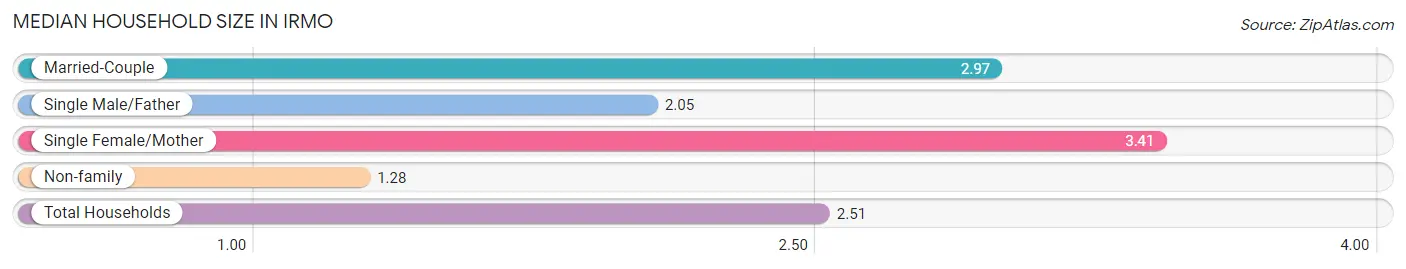
Median Household Size in Irmo
The median household size in Irmo is 2.51 persons per household, with single female/mother households (615 | 13.3%) accounting for the largest median household size of 3.41 persons per household. non-family households (1,283 | 27.6%) represent the smallest median household size with 1.28 persons per household.
| Household Type | # Households | Household Size |
| Married-Couple | 2,481 (53.5%) | 2.97 |
| Single Male/Father | 262 (5.7%) | 2.05 |
| Single Female/Mother | 615 (13.3%) | 3.41 |
| Non-family | 1,283 (27.6%) | 1.28 |
| Total Households | 4,641 (100.0%) | 2.51 |
Household Size by Marriage Status in Irmo
Out of a total of 4,641 households in Irmo, 3,358 (72.4%) are family households, while 1,283 (27.6%) are nonfamily households. The most numerous type of family households are 2-person households, comprising 1,741, and the most common type of nonfamily households are 1-person households, comprising 1,021.
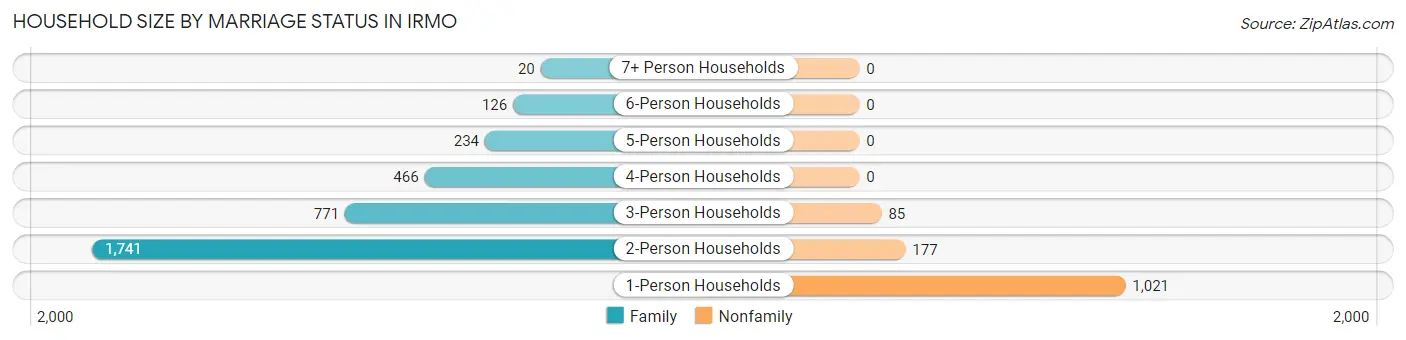
| Household Size | Family Households | Nonfamily Households |
| 1-Person Households | - | 1,021 (22.0%) |
| 2-Person Households | 1,741 (37.5%) | 177 (3.8%) |
| 3-Person Households | 771 (16.6%) | 85 (1.8%) |
| 4-Person Households | 466 (10.0%) | 0 (0.0%) |
| 5-Person Households | 234 (5.0%) | 0 (0.0%) |
| 6-Person Households | 126 (2.7%) | 0 (0.0%) |
| 7+ Person Households | 20 (0.4%) | 0 (0.0%) |
| Total | 3,358 (72.4%) | 1,283 (27.6%) |
Female Fertility in Irmo
Fertility by Age in Irmo
Average fertility rate in Irmo is 26.0 births per 1,000 women. Women in the age bracket of 20 to 34 years have the highest fertility rate with 62.0 births per 1,000 women. Women in the age bracket of 20 to 34 years acount for 100.0% of all women with births.
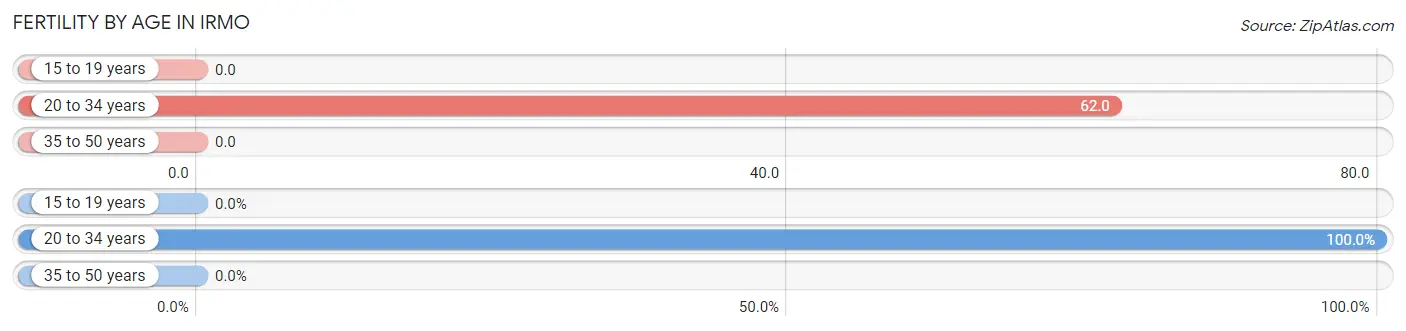
| Age Bracket | Women with Births | Births / 1,000 Women |
| 15 to 19 years | 0 (0.0%) | 0.0 |
| 20 to 34 years | 73 (100.0%) | 62.0 |
| 35 to 50 years | 0 (0.0%) | 0.0 |
| Total | 73 (100.0%) | 26.0 |
Fertility by Age by Marriage Status in Irmo
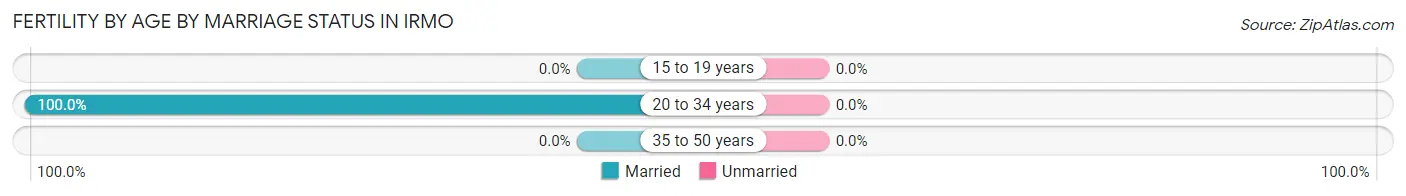
| Age Bracket | Married | Unmarried |
| 15 to 19 years | 0 (0.0%) | 0 (0.0%) |
| 20 to 34 years | 73 (100.0%) | 0 (0.0%) |
| 35 to 50 years | 0 (0.0%) | 0 (0.0%) |
| Total | 73 (100.0%) | 0 (0.0%) |
Fertility by Education in Irmo
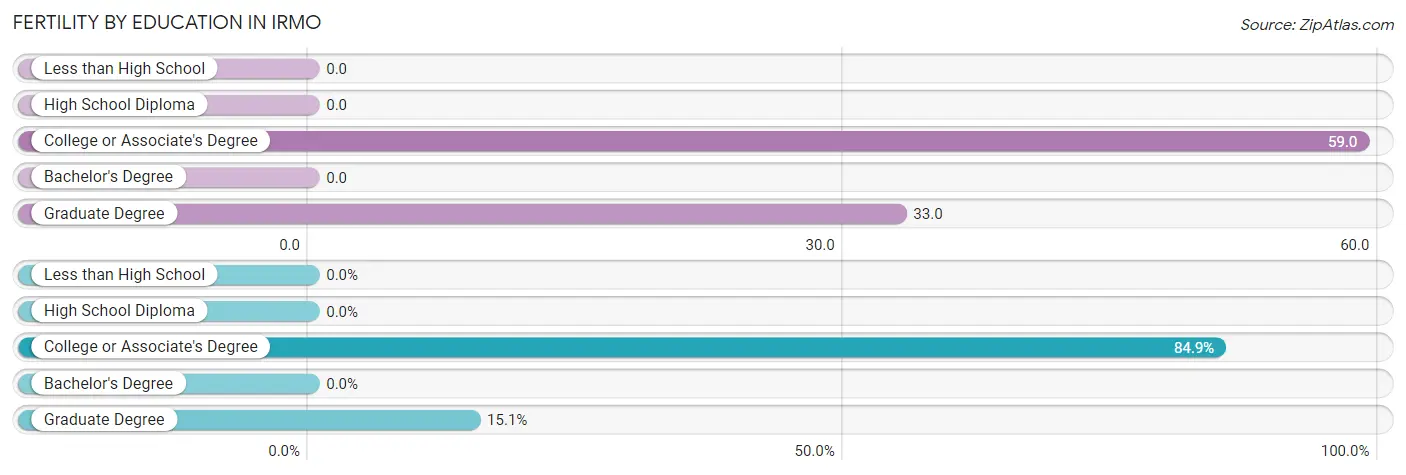
| Educational Attainment | Women with Births | Births / 1,000 Women |
| Less than High School | 0 (0.0%) | 0.0 |
| High School Diploma | 0 (0.0%) | 0.0 |
| College or Associate's Degree | 62 (84.9%) | 59.0 |
| Bachelor's Degree | 0 (0.0%) | 0.0 |
| Graduate Degree | 11 (15.1%) | 33.0 |
| Total | 73 (100.0%) | 26.0 |
Fertility by Education by Marriage Status in Irmo
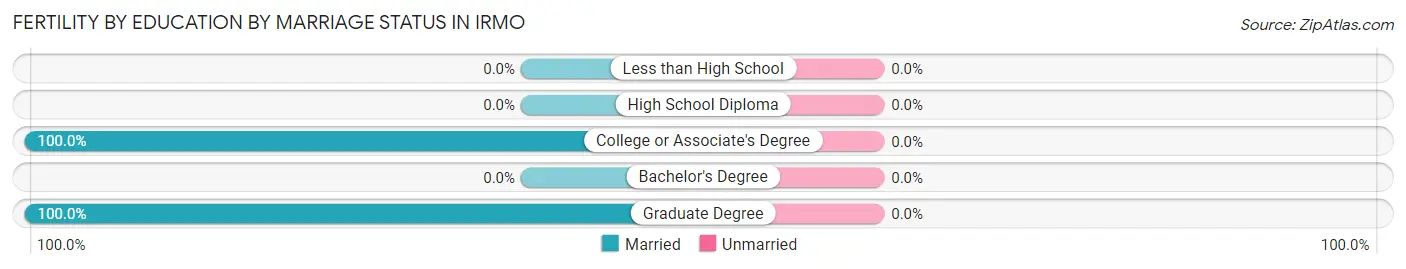
| Educational Attainment | Married | Unmarried |
| Less than High School | 0 (0.0%) | 0 (0.0%) |
| High School Diploma | 0 (0.0%) | 0 (0.0%) |
| College or Associate's Degree | 62 (100.0%) | 0 (0.0%) |
| Bachelor's Degree | 0 (0.0%) | 0 (0.0%) |
| Graduate Degree | 11 (100.0%) | 0 (0.0%) |
| Total | 73 (100.0%) | 0 (0.0%) |
Employment Characteristics in Irmo
Employment by Class of Employer in Irmo
Among the 6,157 employed individuals in Irmo, private company employees (3,988 | 64.8%), state government employees (592 | 9.6%), and self-employed (not incorporated) (483 | 7.8%) make up the most common classes of employment.
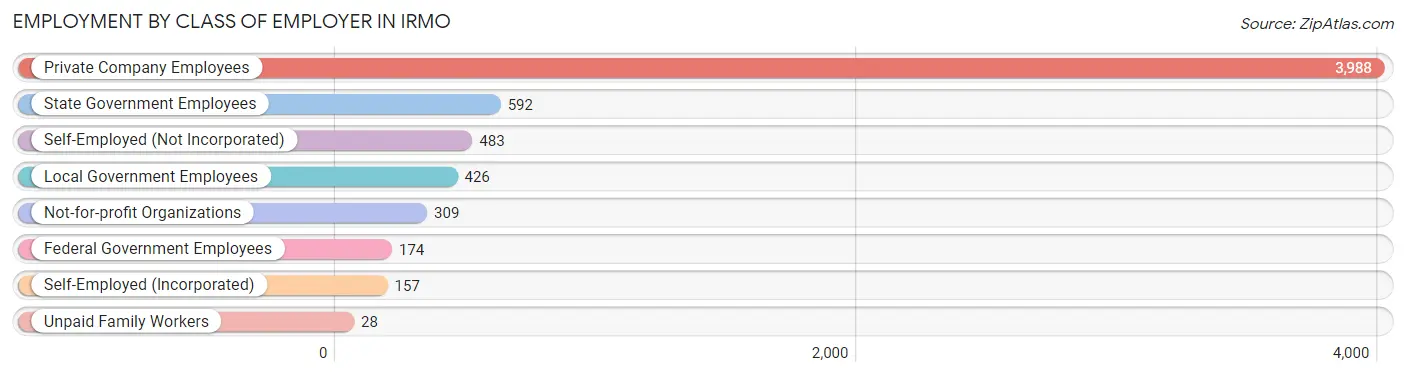
| Employer Class | # Employees | % Employees |
| Private Company Employees | 3,988 | 64.8% |
| Self-Employed (Incorporated) | 157 | 2.5% |
| Self-Employed (Not Incorporated) | 483 | 7.8% |
| Not-for-profit Organizations | 309 | 5.0% |
| Local Government Employees | 426 | 6.9% |
| State Government Employees | 592 | 9.6% |
| Federal Government Employees | 174 | 2.8% |
| Unpaid Family Workers | 28 | 0.4% |
| Total | 6,157 | 100.0% |
Employment Status by Age in Irmo
According to the labor force statistics for Irmo, out of the total population over 16 years of age (9,471), 68.3% or 6,469 individuals are in the labor force, with 4.6% or 298 of them unemployed. The age group with the highest labor force participation rate is 20 to 24 years, with 92.7% or 609 individuals in the labor force. Within the labor force, the 16 to 19 years age range has the highest percentage of unemployed individuals, with 25.2% or 84 of them being unemployed.
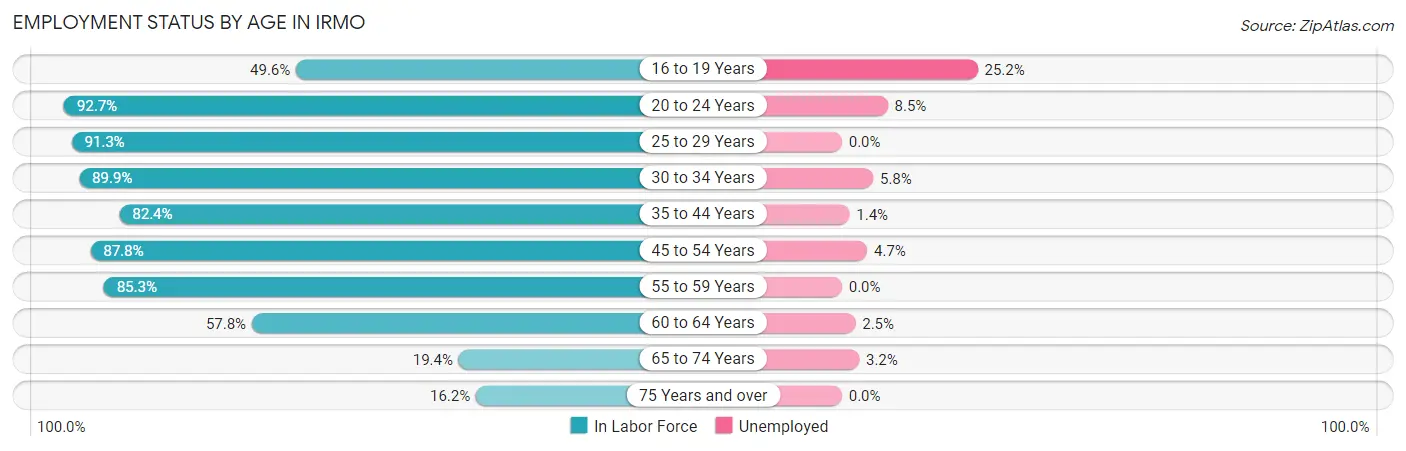
| Age Bracket | In Labor Force | Unemployed |
| 16 to 19 Years | 332 (49.6%) | 84 (25.2%) |
| 20 to 24 Years | 609 (92.7%) | 52 (8.5%) |
| 25 to 29 Years | 533 (91.3%) | 0 (0.0%) |
| 30 to 34 Years | 1,101 (89.9%) | 64 (5.8%) |
| 35 to 44 Years | 1,107 (82.4%) | 15 (1.4%) |
| 45 to 54 Years | 1,407 (87.8%) | 66 (4.7%) |
| 55 to 59 Years | 625 (85.3%) | 0 (0.0%) |
| 60 to 64 Years | 404 (57.8%) | 10 (2.5%) |
| 65 to 74 Years | 221 (19.4%) | 7 (3.2%) |
| 75 Years and over | 132 (16.2%) | 0 (0.0%) |
| Total | 6,469 (68.3%) | 298 (4.6%) |
Employment Status by Educational Attainment in Irmo
According to labor force statistics for Irmo, 83.7% of individuals (5,178) out of the total population between 25 and 64 years of age (6,186) are in the labor force, with 3.0% or 155 of them being unemployed. The group with the highest labor force participation rate are those with the educational attainment of bachelor's degree or higher, with 89.3% or 1,950 individuals in the labor force. Within the labor force, individuals with college / associate degree education have the highest percentage of unemployment, with 4.4% or 94 of them being unemployed.
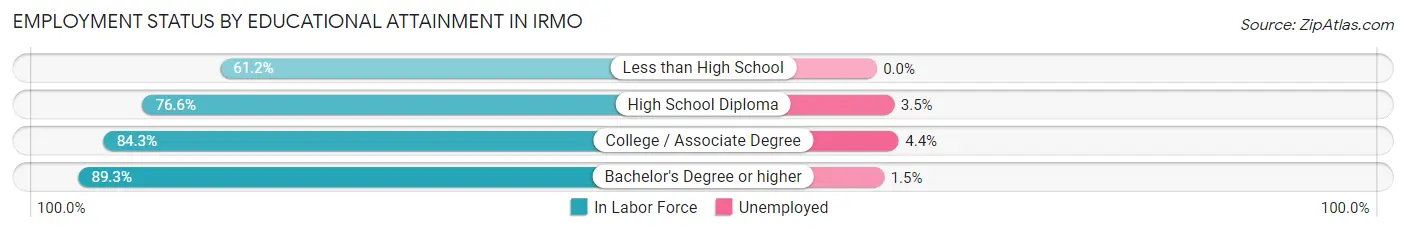
| Educational Attainment | In Labor Force | Unemployed |
| Less than High School | 139 (61.2%) | 0 (0.0%) |
| High School Diploma | 954 (76.6%) | 44 (3.5%) |
| College / Associate Degree | 2,133 (84.3%) | 111 (4.4%) |
| Bachelor's Degree or higher | 1,950 (89.3%) | 33 (1.5%) |
| Total | 5,178 (83.7%) | 186 (3.0%) |
Employment Occupations by Sex in Irmo
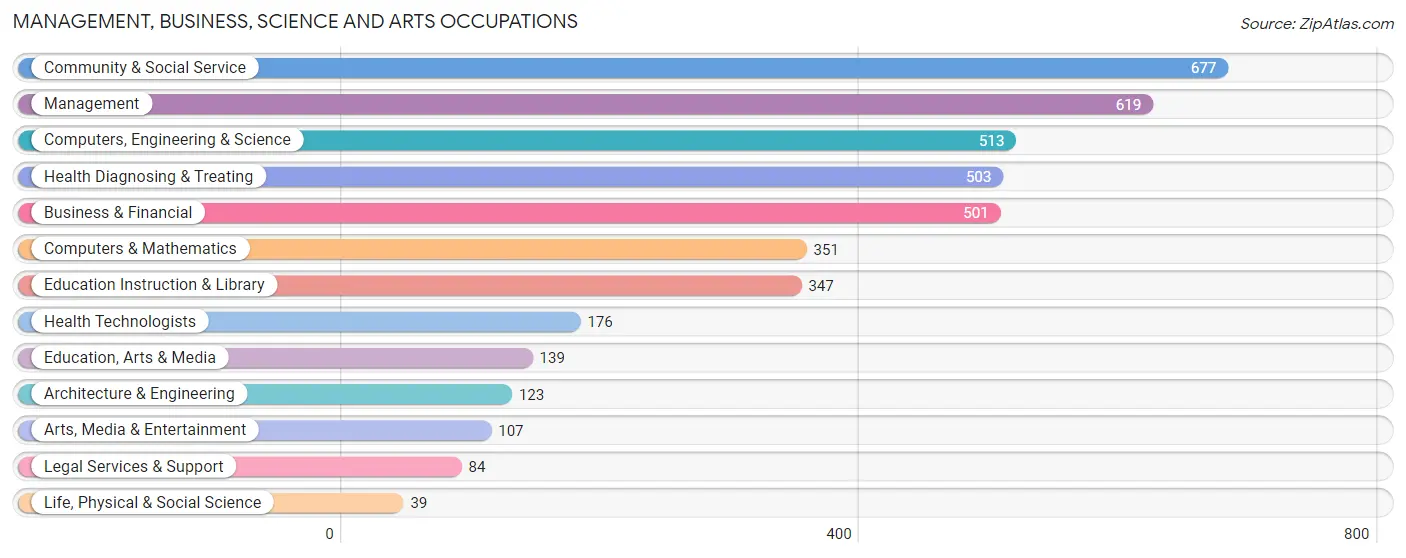
Management, Business, Science and Arts Occupations
The most common Management, Business, Science and Arts occupations in Irmo are Community & Social Service (677 | 11.1%), Management (619 | 10.1%), Computers, Engineering & Science (513 | 8.4%), Health Diagnosing & Treating (503 | 8.2%), and Business & Financial (501 | 8.2%).
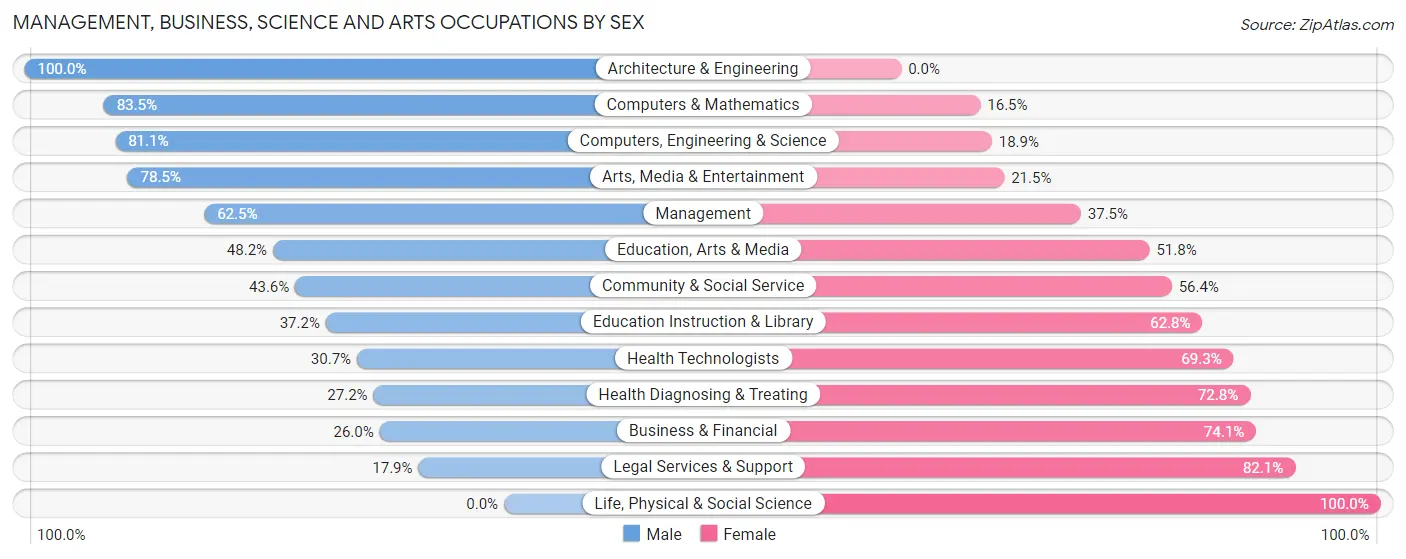
Management, Business, Science and Arts Occupations by Sex
Within the Management, Business, Science and Arts occupations in Irmo, the most male-oriented occupations are Architecture & Engineering (100.0%), Computers & Mathematics (83.5%), and Computers, Engineering & Science (81.1%), while the most female-oriented occupations are Life, Physical & Social Science (100.0%), Legal Services & Support (82.1%), and Business & Financial (74.1%).
| Occupation | Male | Female |
| Management | 387 (62.5%) | 232 (37.5%) |
| Business & Financial | 130 (26.0%) | 371 (74.1%) |
| Computers, Engineering & Science | 416 (81.1%) | 97 (18.9%) |
| Computers & Mathematics | 293 (83.5%) | 58 (16.5%) |
| Architecture & Engineering | 123 (100.0%) | 0 (0.0%) |
| Life, Physical & Social Science | 0 (0.0%) | 39 (100.0%) |
| Community & Social Service | 295 (43.6%) | 382 (56.4%) |
| Education, Arts & Media | 67 (48.2%) | 72 (51.8%) |
| Legal Services & Support | 15 (17.9%) | 69 (82.1%) |
| Education Instruction & Library | 129 (37.2%) | 218 (62.8%) |
| Arts, Media & Entertainment | 84 (78.5%) | 23 (21.5%) |
| Health Diagnosing & Treating | 137 (27.2%) | 366 (72.8%) |
| Health Technologists | 54 (30.7%) | 122 (69.3%) |
| Total (Category) | 1,365 (48.5%) | 1,448 (51.5%) |
| Total (Overall) | 3,101 (50.6%) | 3,023 (49.4%) |
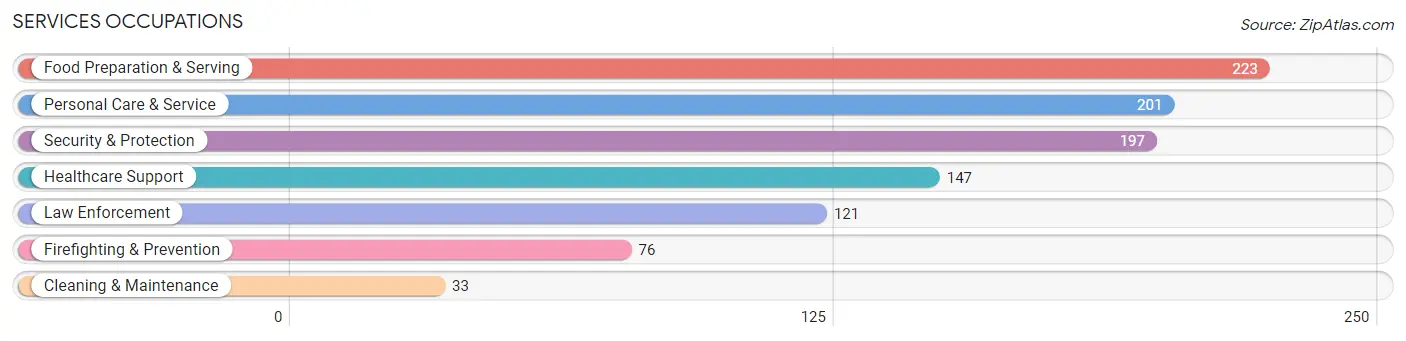
Services Occupations
The most common Services occupations in Irmo are Food Preparation & Serving (223 | 3.6%), Personal Care & Service (201 | 3.3%), Security & Protection (197 | 3.2%), Healthcare Support (147 | 2.4%), and Law Enforcement (121 | 2.0%).
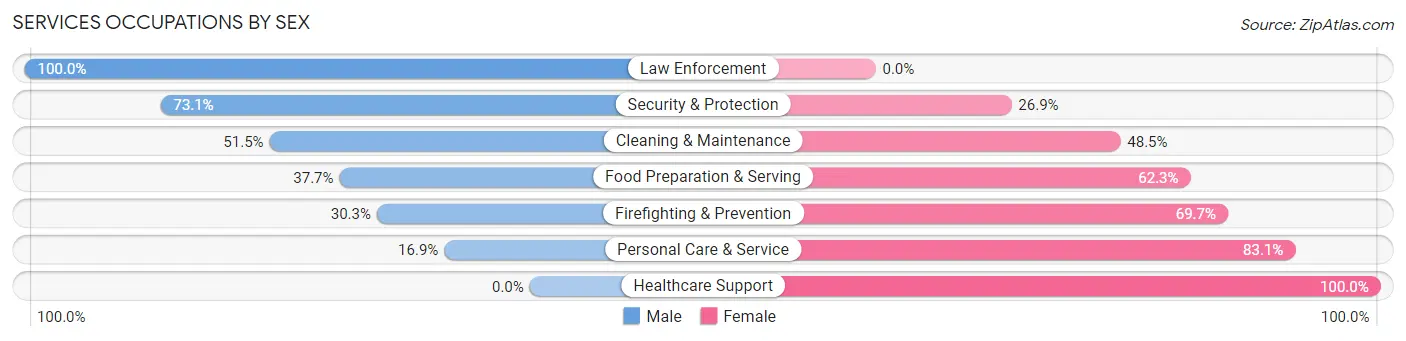
Services Occupations by Sex
Within the Services occupations in Irmo, the most male-oriented occupations are Law Enforcement (100.0%), Security & Protection (73.1%), and Cleaning & Maintenance (51.5%), while the most female-oriented occupations are Healthcare Support (100.0%), Personal Care & Service (83.1%), and Firefighting & Prevention (69.7%).
| Occupation | Male | Female |
| Healthcare Support | 0 (0.0%) | 147 (100.0%) |
| Security & Protection | 144 (73.1%) | 53 (26.9%) |
| Firefighting & Prevention | 23 (30.3%) | 53 (69.7%) |
| Law Enforcement | 121 (100.0%) | 0 (0.0%) |
| Food Preparation & Serving | 84 (37.7%) | 139 (62.3%) |
| Cleaning & Maintenance | 17 (51.5%) | 16 (48.5%) |
| Personal Care & Service | 34 (16.9%) | 167 (83.1%) |
| Total (Category) | 279 (34.8%) | 522 (65.2%) |
| Total (Overall) | 3,101 (50.6%) | 3,023 (49.4%) |
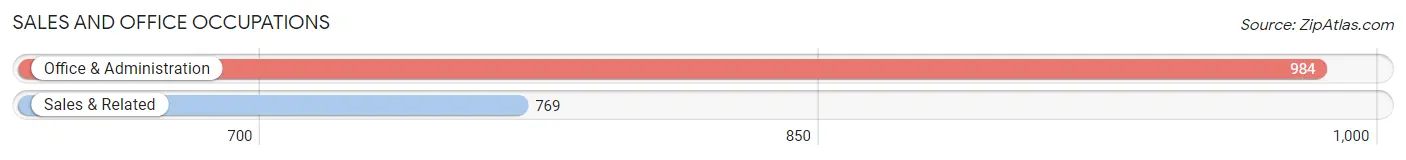
Sales and Office Occupations
The most common Sales and Office occupations in Irmo are Office & Administration (984 | 16.1%), and Sales & Related (769 | 12.6%).
Sales and Office Occupations by Sex
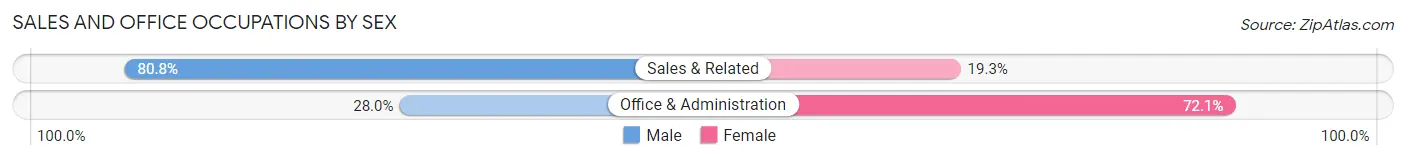
| Occupation | Male | Female |
| Sales & Related | 621 (80.7%) | 148 (19.3%) |
| Office & Administration | 275 (28.0%) | 709 (72.1%) |
| Total (Category) | 896 (51.1%) | 857 (48.9%) |
| Total (Overall) | 3,101 (50.6%) | 3,023 (49.4%) |
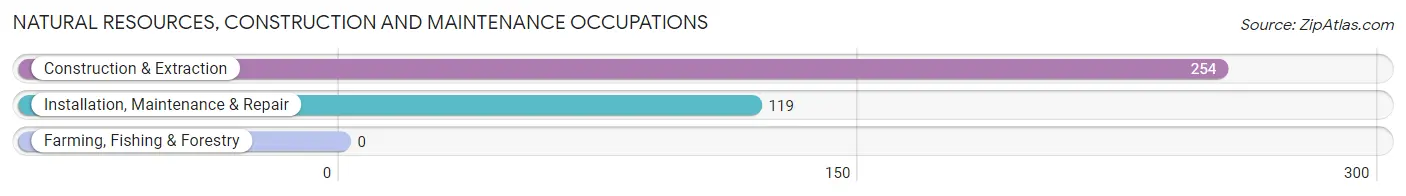
Natural Resources, Construction and Maintenance Occupations
The most common Natural Resources, Construction and Maintenance occupations in Irmo are Construction & Extraction (254 | 4.2%), and Installation, Maintenance & Repair (119 | 1.9%).
Natural Resources, Construction and Maintenance Occupations by Sex
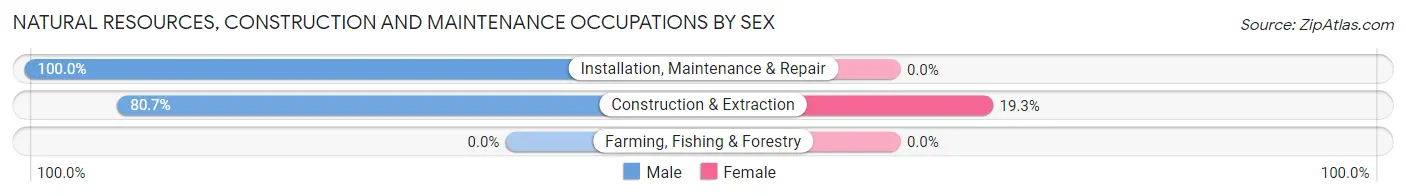
| Occupation | Male | Female |
| Farming, Fishing & Forestry | 0 (0.0%) | 0 (0.0%) |
| Construction & Extraction | 205 (80.7%) | 49 (19.3%) |
| Installation, Maintenance & Repair | 119 (100.0%) | 0 (0.0%) |
| Total (Category) | 324 (86.9%) | 49 (13.1%) |
| Total (Overall) | 3,101 (50.6%) | 3,023 (49.4%) |
Production, Transportation and Moving Occupations
The most common Production, Transportation and Moving occupations in Irmo are Transportation (156 | 2.5%), Production (131 | 2.1%), and Material Moving (97 | 1.6%).
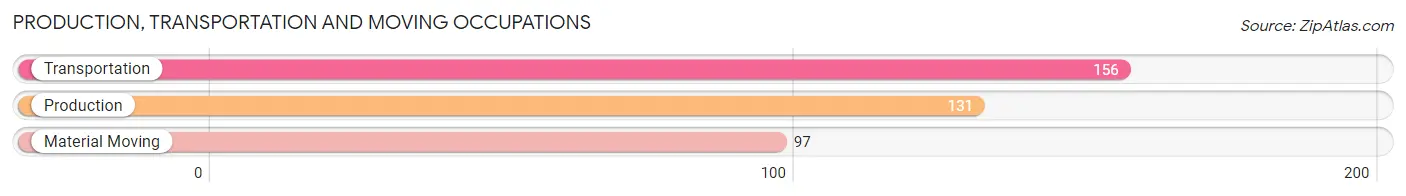
Production, Transportation and Moving Occupations by Sex
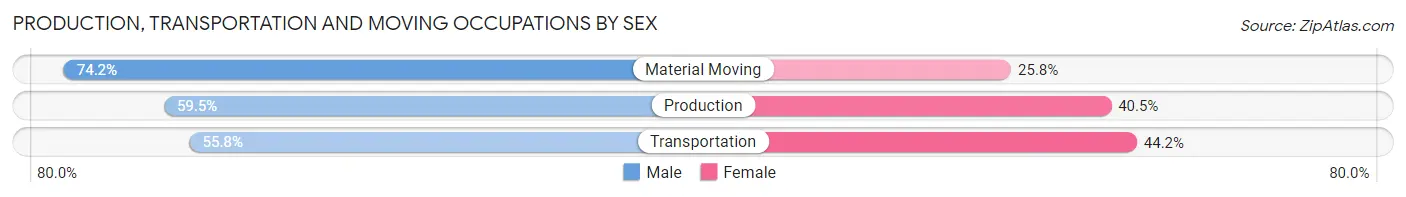
| Occupation | Male | Female |
| Production | 78 (59.5%) | 53 (40.5%) |
| Transportation | 87 (55.8%) | 69 (44.2%) |
| Material Moving | 72 (74.2%) | 25 (25.8%) |
| Total (Category) | 237 (61.7%) | 147 (38.3%) |
| Total (Overall) | 3,101 (50.6%) | 3,023 (49.4%) |
Employment Industries by Sex in Irmo
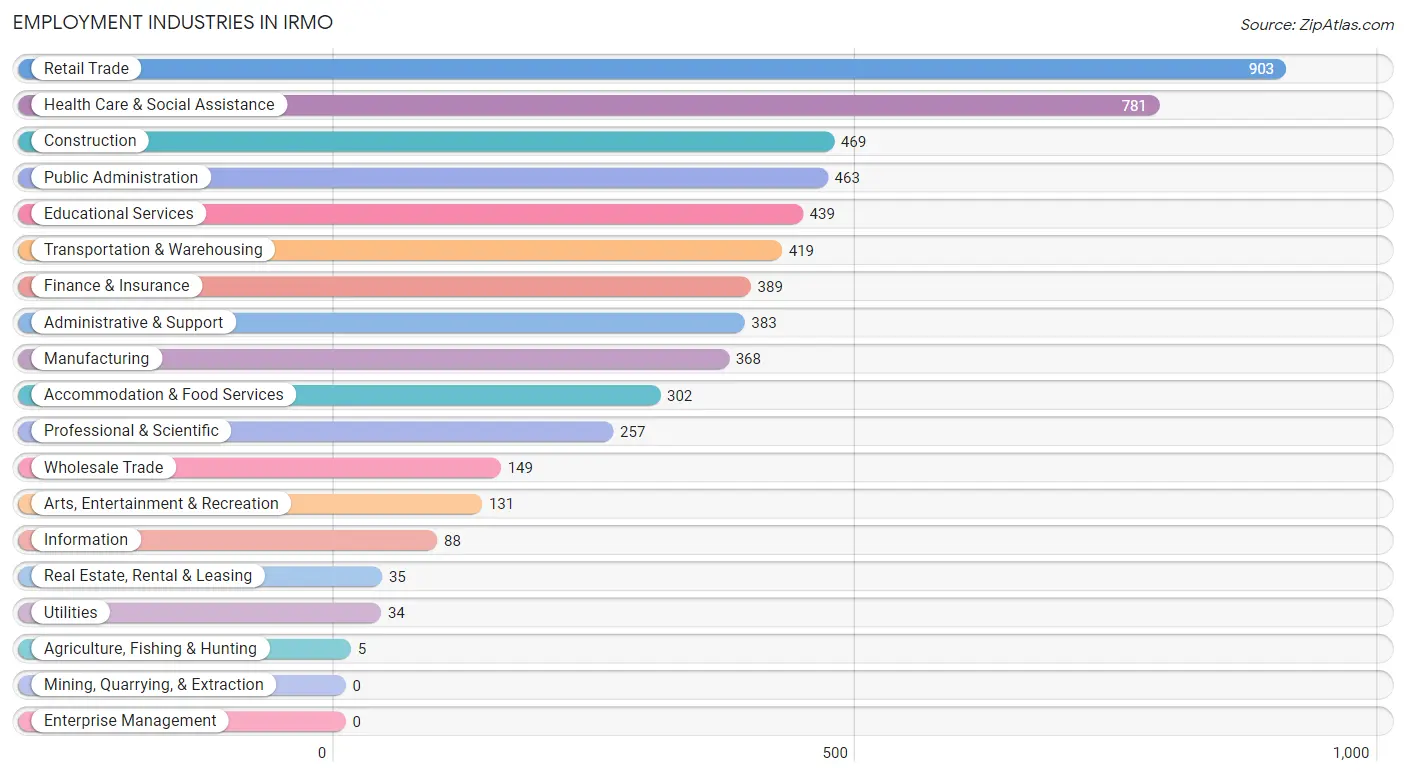
Employment Industries in Irmo
The major employment industries in Irmo include Retail Trade (903 | 14.7%), Health Care & Social Assistance (781 | 12.8%), Construction (469 | 7.7%), Public Administration (463 | 7.6%), and Educational Services (439 | 7.2%).
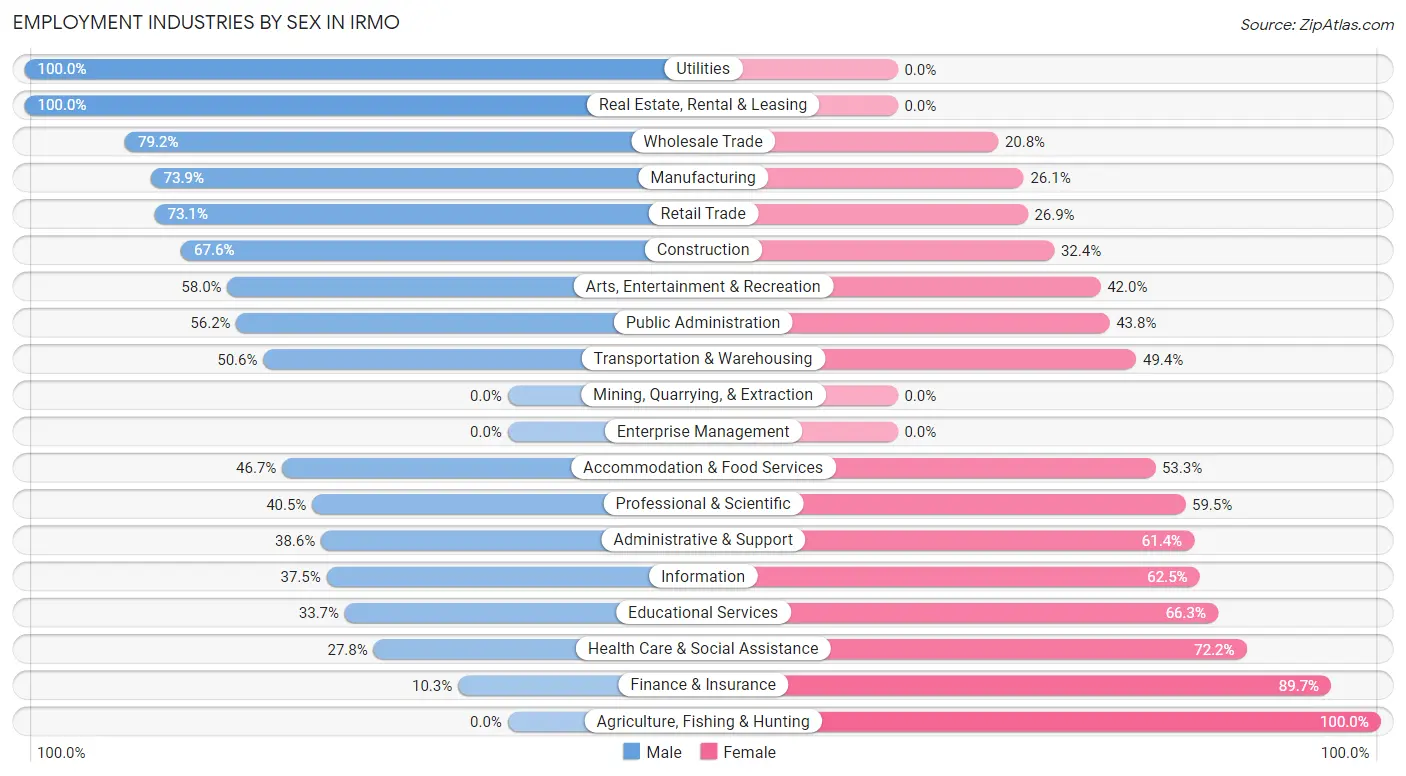
Employment Industries by Sex in Irmo
The Irmo industries that see more men than women are Utilities (100.0%), Real Estate, Rental & Leasing (100.0%), and Wholesale Trade (79.2%), whereas the industries that tend to have a higher number of women are Agriculture, Fishing & Hunting (100.0%), Finance & Insurance (89.7%), and Health Care & Social Assistance (72.2%).
| Industry | Male | Female |
| Agriculture, Fishing & Hunting | 0 (0.0%) | 5 (100.0%) |
| Mining, Quarrying, & Extraction | 0 (0.0%) | 0 (0.0%) |
| Construction | 317 (67.6%) | 152 (32.4%) |
| Manufacturing | 272 (73.9%) | 96 (26.1%) |
| Wholesale Trade | 118 (79.2%) | 31 (20.8%) |
| Retail Trade | 660 (73.1%) | 243 (26.9%) |
| Transportation & Warehousing | 212 (50.6%) | 207 (49.4%) |
| Utilities | 34 (100.0%) | 0 (0.0%) |
| Information | 33 (37.5%) | 55 (62.5%) |
| Finance & Insurance | 40 (10.3%) | 349 (89.7%) |
| Real Estate, Rental & Leasing | 35 (100.0%) | 0 (0.0%) |
| Professional & Scientific | 104 (40.5%) | 153 (59.5%) |
| Enterprise Management | 0 (0.0%) | 0 (0.0%) |
| Administrative & Support | 148 (38.6%) | 235 (61.4%) |
| Educational Services | 148 (33.7%) | 291 (66.3%) |
| Health Care & Social Assistance | 217 (27.8%) | 564 (72.2%) |
| Arts, Entertainment & Recreation | 76 (58.0%) | 55 (42.0%) |
| Accommodation & Food Services | 141 (46.7%) | 161 (53.3%) |
| Public Administration | 260 (56.2%) | 203 (43.8%) |
| Total | 3,101 (50.6%) | 3,023 (49.4%) |
Education in Irmo
School Enrollment in Irmo
The most common levels of schooling among the 2,793 students in Irmo are high school (800 | 28.6%), elementary school (682 | 24.4%), and middle school (523 | 18.7%).
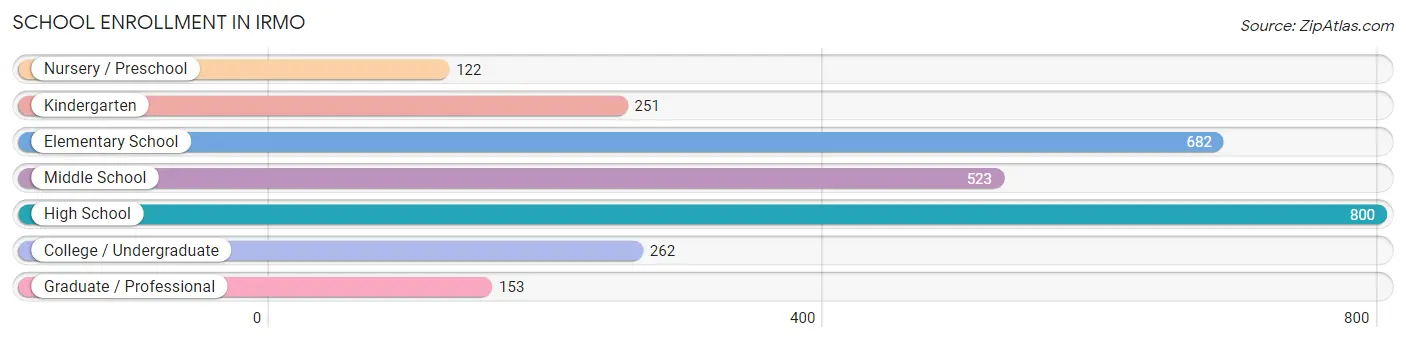
| School Level | # Students | % Students |
| Nursery / Preschool | 122 | 4.4% |
| Kindergarten | 251 | 9.0% |
| Elementary School | 682 | 24.4% |
| Middle School | 523 | 18.7% |
| High School | 800 | 28.6% |
| College / Undergraduate | 262 | 9.4% |
| Graduate / Professional | 153 | 5.5% |
| Total | 2,793 | 100.0% |
School Enrollment by Age by Funding Source in Irmo
Out of a total of 2,793 students who are enrolled in schools in Irmo, 265 (9.5%) attend a private institution, while the remaining 2,528 (90.5%) are enrolled in public schools. The age group of 3 to 4 year olds has the highest likelihood of being enrolled in private schools, with 95 (77.9% in the age bracket) enrolled. Conversely, the age group of 15 to 17 year olds has the lowest likelihood of being enrolled in a private school, with 567 (100.0% in the age bracket) attending a public institution.
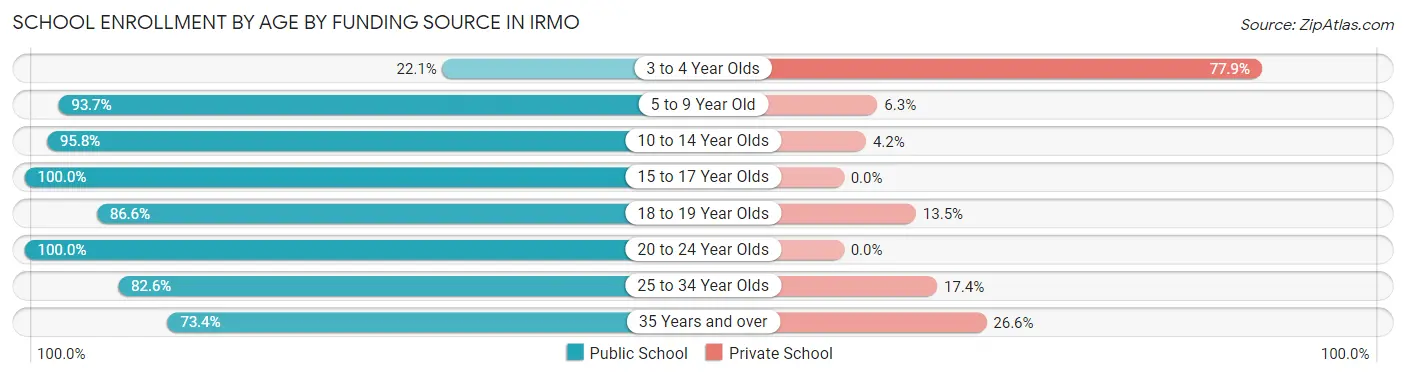
| Age Bracket | Public School | Private School |
| 3 to 4 Year Olds | 27 (22.1%) | 95 (77.9%) |
| 5 to 9 Year Old | 850 (93.7%) | 57 (6.3%) |
| 10 to 14 Year Olds | 576 (95.8%) | 25 (4.2%) |
| 15 to 17 Year Olds | 567 (100.0%) | 0 (0.0%) |
| 18 to 19 Year Olds | 148 (86.6%) | 23 (13.5%) |
| 20 to 24 Year Olds | 129 (100.0%) | 0 (0.0%) |
| 25 to 34 Year Olds | 114 (82.6%) | 24 (17.4%) |
| 35 Years and over | 116 (73.4%) | 42 (26.6%) |
| Total | 2,528 (90.5%) | 265 (9.5%) |
Educational Attainment by Field of Study in Irmo
Business (849 | 28.8%), arts & humanities (433 | 14.7%), science & technology (270 | 9.2%), education (233 | 7.9%), and social sciences (205 | 7.0%) are the most common fields of study among 2,948 individuals in Irmo who have obtained a bachelor's degree or higher.
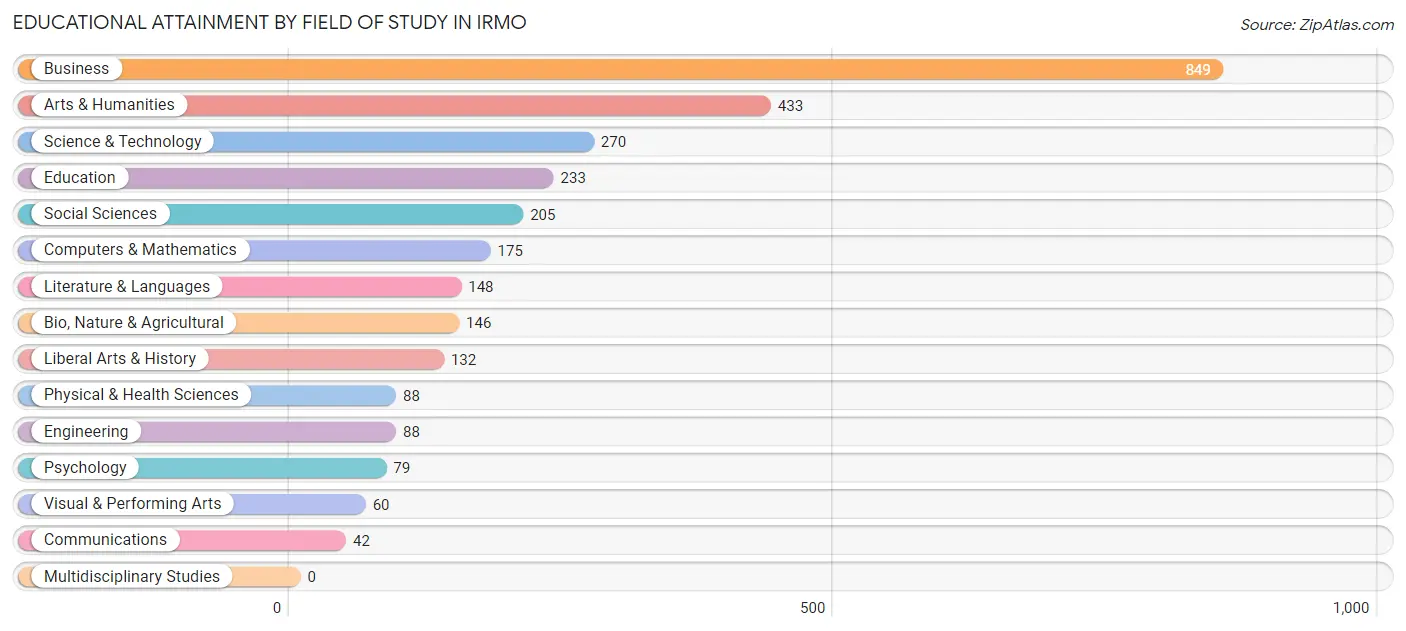
| Field of Study | # Graduates | % Graduates |
| Computers & Mathematics | 175 | 5.9% |
| Bio, Nature & Agricultural | 146 | 5.0% |
| Physical & Health Sciences | 88 | 3.0% |
| Psychology | 79 | 2.7% |
| Social Sciences | 205 | 7.0% |
| Engineering | 88 | 3.0% |
| Multidisciplinary Studies | 0 | 0.0% |
| Science & Technology | 270 | 9.2% |
| Business | 849 | 28.8% |
| Education | 233 | 7.9% |
| Literature & Languages | 148 | 5.0% |
| Liberal Arts & History | 132 | 4.5% |
| Visual & Performing Arts | 60 | 2.0% |
| Communications | 42 | 1.4% |
| Arts & Humanities | 433 | 14.7% |
| Total | 2,948 | 100.0% |
Transportation & Commute in Irmo
Vehicle Availability by Sex in Irmo
The most prevalent vehicle ownership categories in Irmo are males with 2 vehicles (1,486, accounting for 47.2%) and females with 2 vehicles (1,046, making up 49.5%).
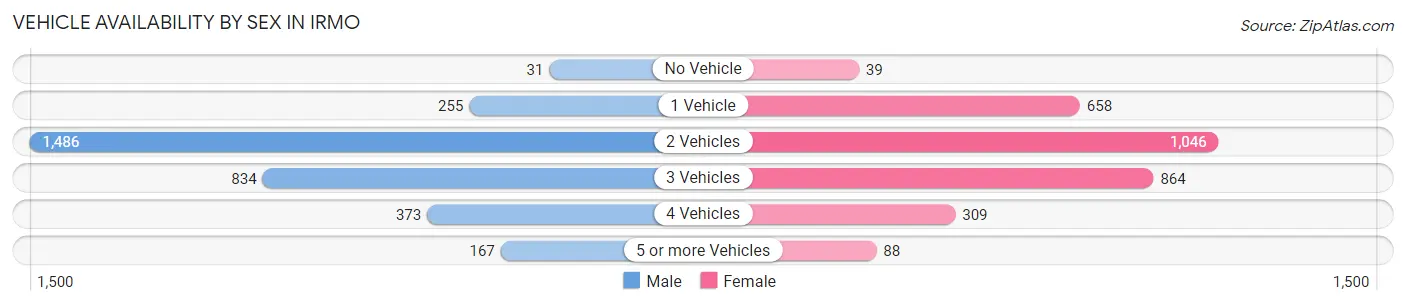
| Vehicles Available | Male | Female |
| No Vehicle | 31 (1.0%) | 39 (1.3%) |
| 1 Vehicle | 255 (8.1%) | 658 (21.9%) |
| 2 Vehicles | 1,486 (47.2%) | 1,046 (34.8%) |
| 3 Vehicles | 834 (26.5%) | 864 (28.8%) |
| 4 Vehicles | 373 (11.9%) | 309 (10.3%) |
| 5 or more Vehicles | 167 (5.3%) | 88 (2.9%) |
| Total | 3,146 (100.0%) | 3,004 (100.0%) |
Commute Time in Irmo
The most frequently occuring commute durations in Irmo are 20 to 24 minutes (1,083 commuters, 18.8%), 30 to 34 minutes (928 commuters, 16.1%), and 15 to 19 minutes (829 commuters, 14.4%).
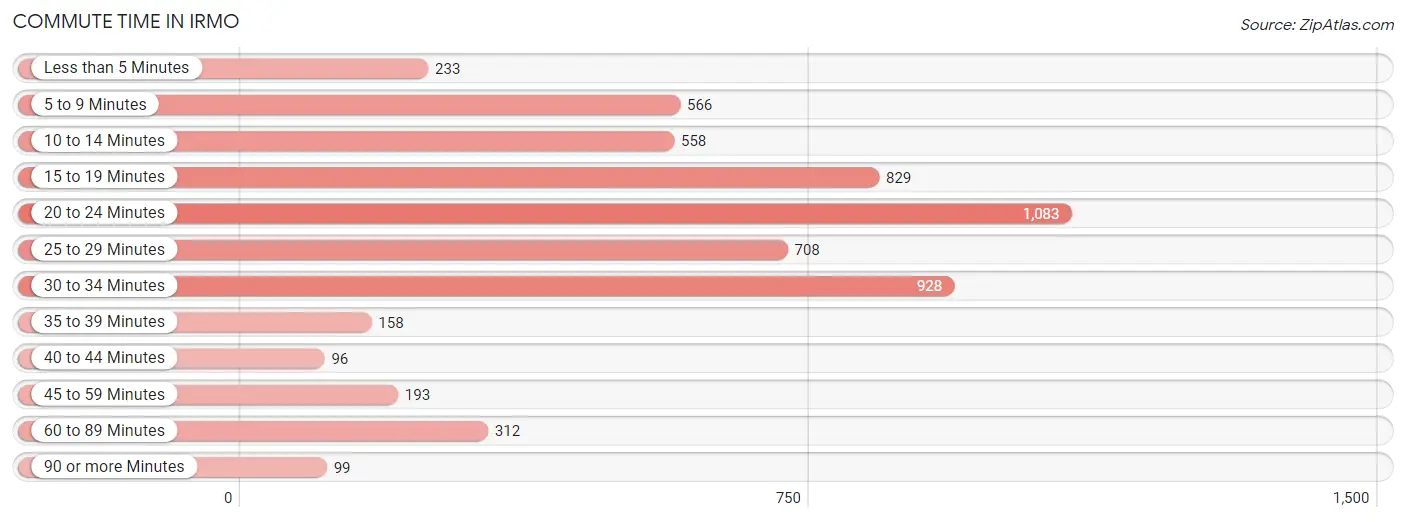
| Commute Time | # Commuters | % Commuters |
| Less than 5 Minutes | 233 | 4.0% |
| 5 to 9 Minutes | 566 | 9.8% |
| 10 to 14 Minutes | 558 | 9.7% |
| 15 to 19 Minutes | 829 | 14.4% |
| 20 to 24 Minutes | 1,083 | 18.8% |
| 25 to 29 Minutes | 708 | 12.3% |
| 30 to 34 Minutes | 928 | 16.1% |
| 35 to 39 Minutes | 158 | 2.7% |
| 40 to 44 Minutes | 96 | 1.7% |
| 45 to 59 Minutes | 193 | 3.4% |
| 60 to 89 Minutes | 312 | 5.4% |
| 90 or more Minutes | 99 | 1.7% |
Commute Time by Sex in Irmo
The most common commute times in Irmo are 20 to 24 minutes (669 commuters, 22.2%) for males and 30 to 34 minutes (523 commuters, 19.0%) for females.
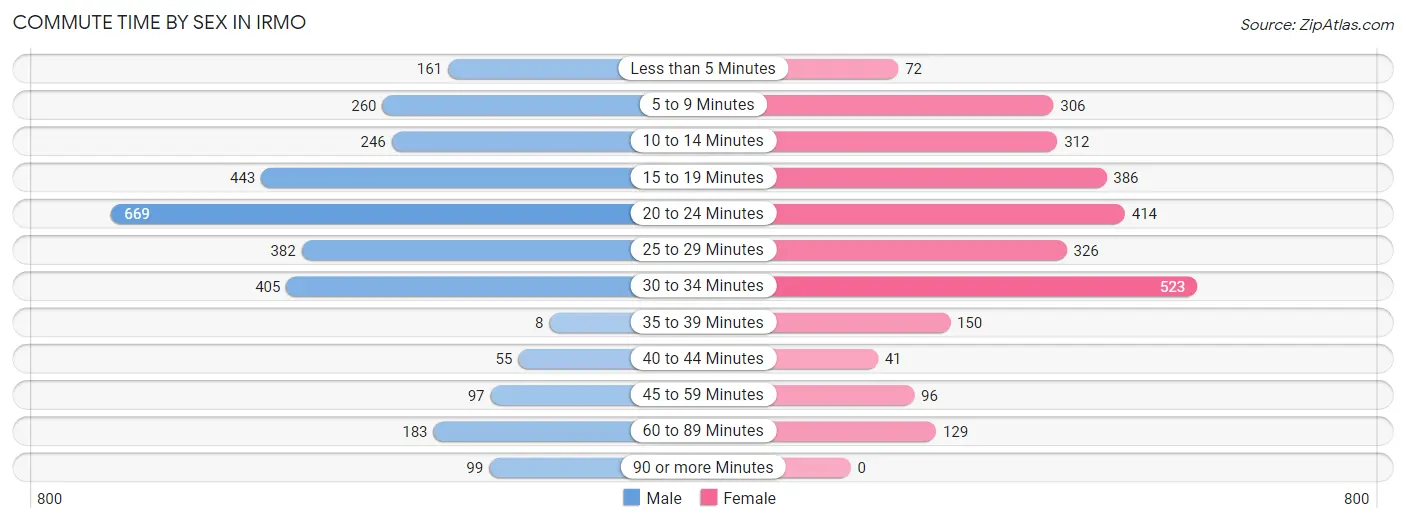
| Commute Time | Male | Female |
| Less than 5 Minutes | 161 (5.3%) | 72 (2.6%) |
| 5 to 9 Minutes | 260 (8.6%) | 306 (11.1%) |
| 10 to 14 Minutes | 246 (8.2%) | 312 (11.3%) |
| 15 to 19 Minutes | 443 (14.7%) | 386 (14.0%) |
| 20 to 24 Minutes | 669 (22.2%) | 414 (15.0%) |
| 25 to 29 Minutes | 382 (12.7%) | 326 (11.8%) |
| 30 to 34 Minutes | 405 (13.5%) | 523 (19.0%) |
| 35 to 39 Minutes | 8 (0.3%) | 150 (5.4%) |
| 40 to 44 Minutes | 55 (1.8%) | 41 (1.5%) |
| 45 to 59 Minutes | 97 (3.2%) | 96 (3.5%) |
| 60 to 89 Minutes | 183 (6.1%) | 129 (4.7%) |
| 90 or more Minutes | 99 (3.3%) | 0 (0.0%) |
Time of Departure to Work by Sex in Irmo
The most frequent times of departure to work in Irmo are 6:00 AM to 6:29 AM (432, 14.4%) for males and 7:00 AM to 7:29 AM (571, 20.7%) for females.
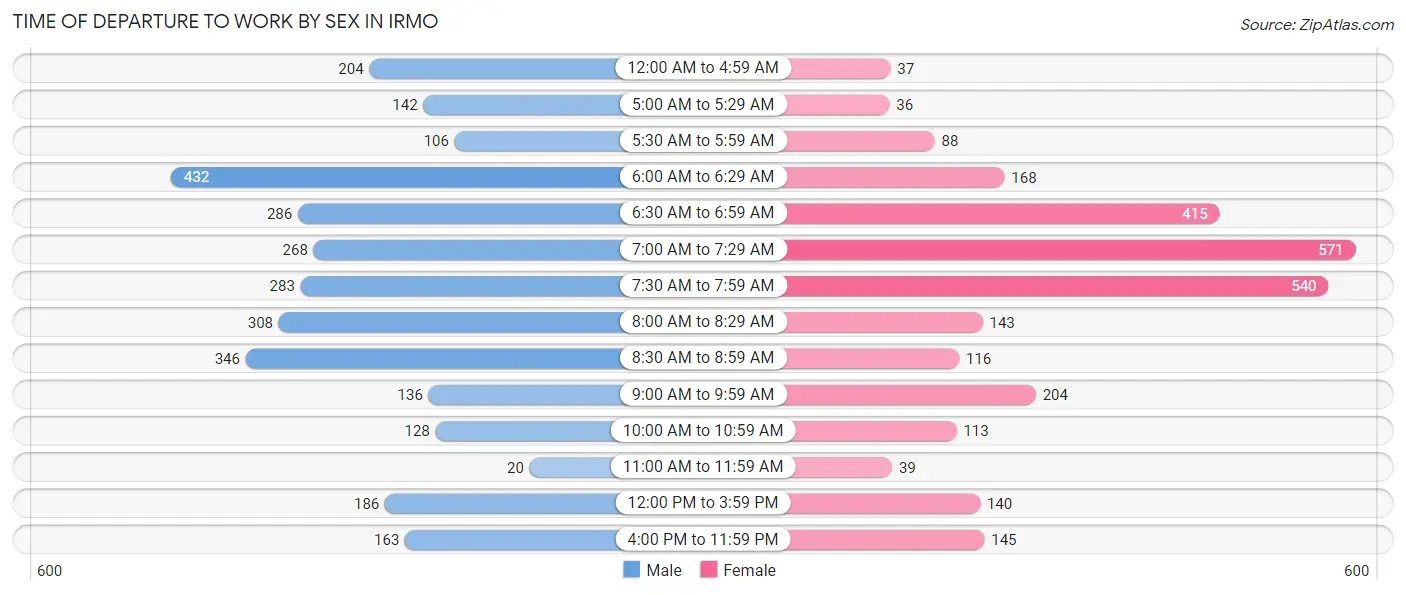
| Time of Departure | Male | Female |
| 12:00 AM to 4:59 AM | 204 (6.8%) | 37 (1.3%) |
| 5:00 AM to 5:29 AM | 142 (4.7%) | 36 (1.3%) |
| 5:30 AM to 5:59 AM | 106 (3.5%) | 88 (3.2%) |
| 6:00 AM to 6:29 AM | 432 (14.4%) | 168 (6.1%) |
| 6:30 AM to 6:59 AM | 286 (9.5%) | 415 (15.1%) |
| 7:00 AM to 7:29 AM | 268 (8.9%) | 571 (20.7%) |
| 7:30 AM to 7:59 AM | 283 (9.4%) | 540 (19.6%) |
| 8:00 AM to 8:29 AM | 308 (10.2%) | 143 (5.2%) |
| 8:30 AM to 8:59 AM | 346 (11.5%) | 116 (4.2%) |
| 9:00 AM to 9:59 AM | 136 (4.5%) | 204 (7.4%) |
| 10:00 AM to 10:59 AM | 128 (4.3%) | 113 (4.1%) |
| 11:00 AM to 11:59 AM | 20 (0.7%) | 39 (1.4%) |
| 12:00 PM to 3:59 PM | 186 (6.2%) | 140 (5.1%) |
| 4:00 PM to 11:59 PM | 163 (5.4%) | 145 (5.3%) |
| Total | 3,008 (100.0%) | 2,755 (100.0%) |
Housing Occupancy in Irmo
Occupancy by Ownership in Irmo
Of the total 4,641 dwellings in Irmo, owner-occupied units account for 3,690 (79.5%), while renter-occupied units make up 951 (20.5%).
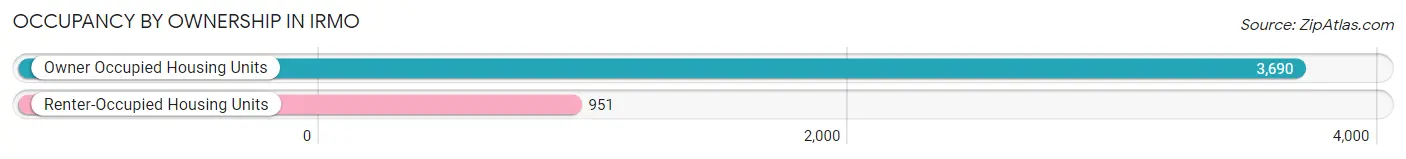
| Occupancy | # Housing Units | % Housing Units |
| Owner Occupied Housing Units | 3,690 | 79.5% |
| Renter-Occupied Housing Units | 951 | 20.5% |
| Total Occupied Housing Units | 4,641 | 100.0% |
Occupancy by Household Size in Irmo
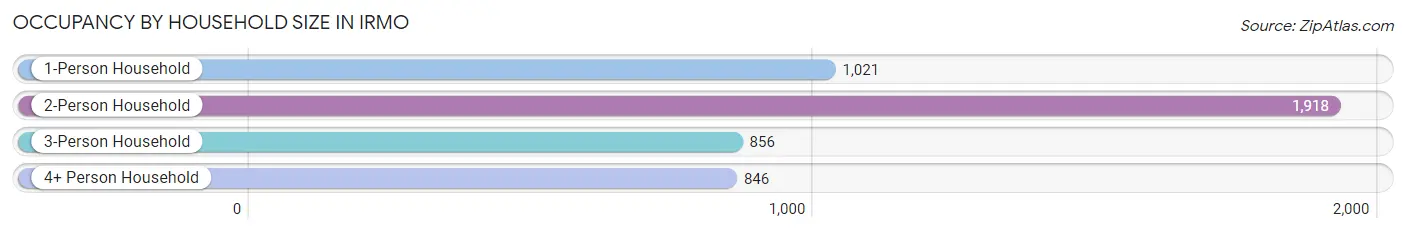
| Household Size | # Housing Units | % Housing Units |
| 1-Person Household | 1,021 | 22.0% |
| 2-Person Household | 1,918 | 41.3% |
| 3-Person Household | 856 | 18.4% |
| 4+ Person Household | 846 | 18.2% |
| Total Housing Units | 4,641 | 100.0% |
Occupancy by Ownership by Household Size in Irmo
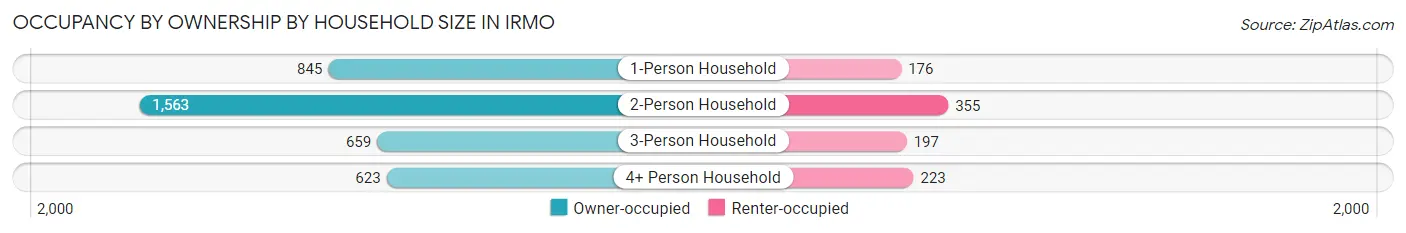
| Household Size | Owner-occupied | Renter-occupied |
| 1-Person Household | 845 (82.8%) | 176 (17.2%) |
| 2-Person Household | 1,563 (81.5%) | 355 (18.5%) |
| 3-Person Household | 659 (77.0%) | 197 (23.0%) |
| 4+ Person Household | 623 (73.6%) | 223 (26.4%) |
| Total Housing Units | 3,690 (79.5%) | 951 (20.5%) |
Occupancy by Educational Attainment in Irmo
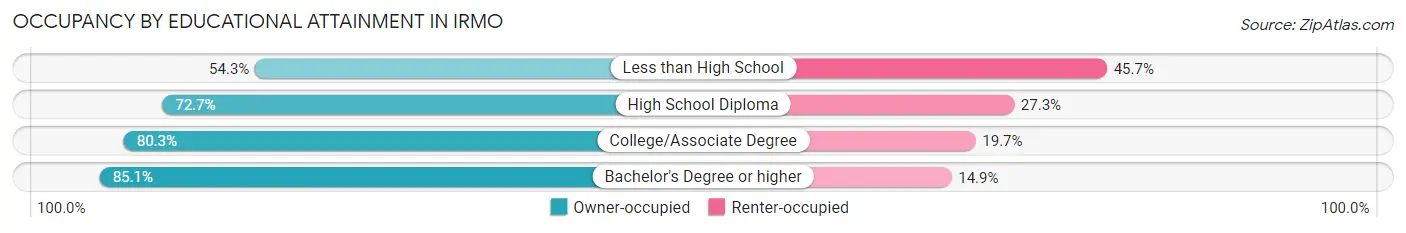
| Household Size | Owner-occupied | Renter-occupied |
| Less than High School | 133 (54.3%) | 112 (45.7%) |
| High School Diploma | 591 (72.7%) | 222 (27.3%) |
| College/Associate Degree | 1,401 (80.3%) | 343 (19.7%) |
| Bachelor's Degree or higher | 1,565 (85.1%) | 274 (14.9%) |
Occupancy by Age of Householder in Irmo
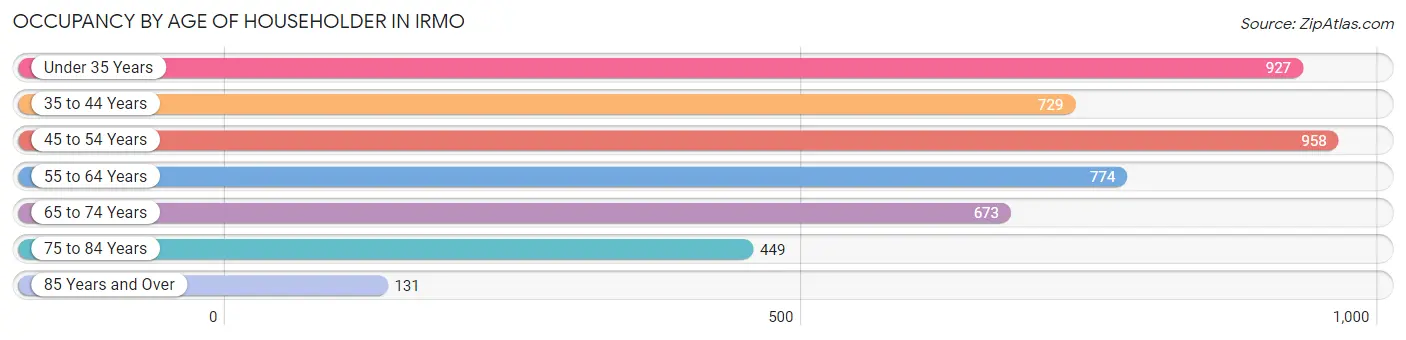
| Age Bracket | # Households | % Households |
| Under 35 Years | 927 | 20.0% |
| 35 to 44 Years | 729 | 15.7% |
| 45 to 54 Years | 958 | 20.6% |
| 55 to 64 Years | 774 | 16.7% |
| 65 to 74 Years | 673 | 14.5% |
| 75 to 84 Years | 449 | 9.7% |
| 85 Years and Over | 131 | 2.8% |
| Total | 4,641 | 100.0% |
Housing Finances in Irmo
Median Income by Occupancy in Irmo
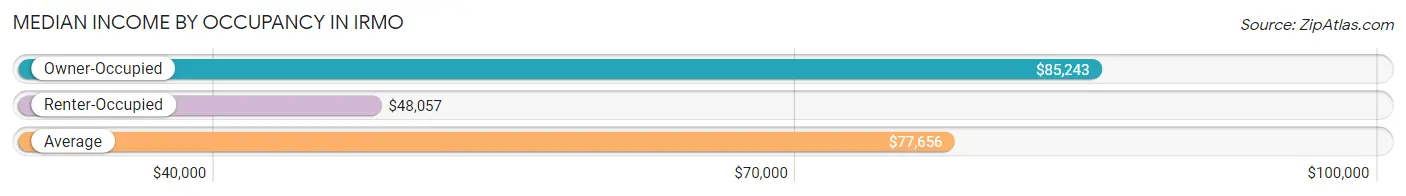
| Occupancy Type | # Households | Median Income |
| Owner-Occupied | 3,690 (79.5%) | $85,243 |
| Renter-Occupied | 951 (20.5%) | $48,057 |
| Average | 4,641 (100.0%) | $77,656 |
Occupancy by Householder Income Bracket in Irmo
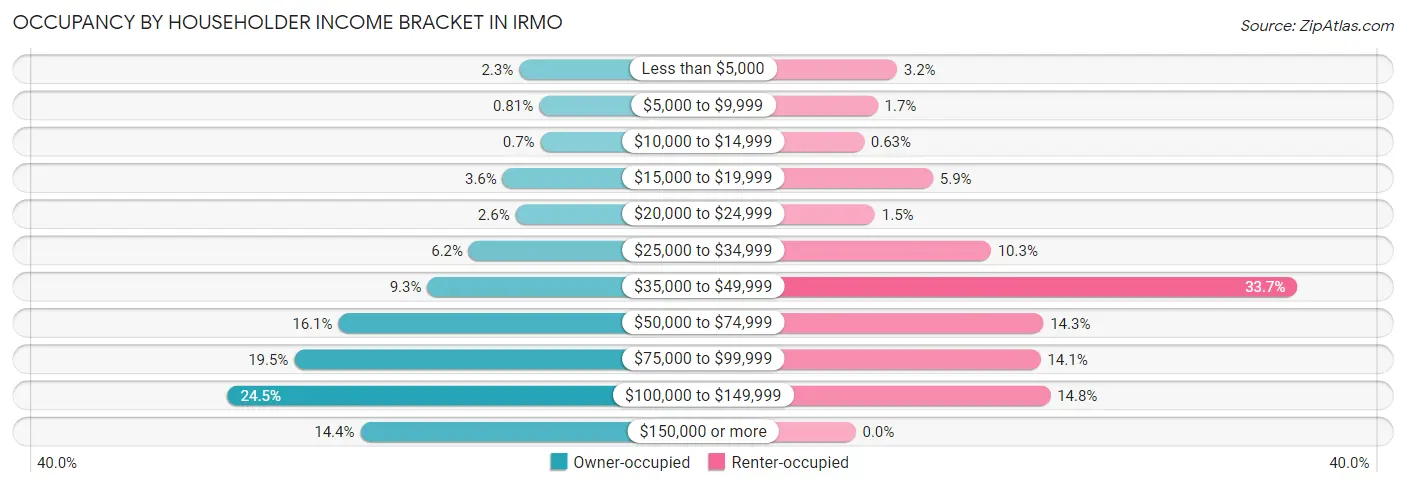
| Income Bracket | Owner-occupied | Renter-occupied |
| Less than $5,000 | 86 (2.3%) | 30 (3.2%) |
| $5,000 to $9,999 | 30 (0.8%) | 16 (1.7%) |
| $10,000 to $14,999 | 26 (0.7%) | 6 (0.6%) |
| $15,000 to $19,999 | 132 (3.6%) | 56 (5.9%) |
| $20,000 to $24,999 | 96 (2.6%) | 14 (1.5%) |
| $25,000 to $34,999 | 227 (6.1%) | 98 (10.3%) |
| $35,000 to $49,999 | 344 (9.3%) | 320 (33.7%) |
| $50,000 to $74,999 | 594 (16.1%) | 136 (14.3%) |
| $75,000 to $99,999 | 718 (19.5%) | 134 (14.1%) |
| $100,000 to $149,999 | 905 (24.5%) | 141 (14.8%) |
| $150,000 or more | 532 (14.4%) | 0 (0.0%) |
| Total | 3,690 (100.0%) | 951 (100.0%) |
Monthly Housing Cost Tiers in Irmo
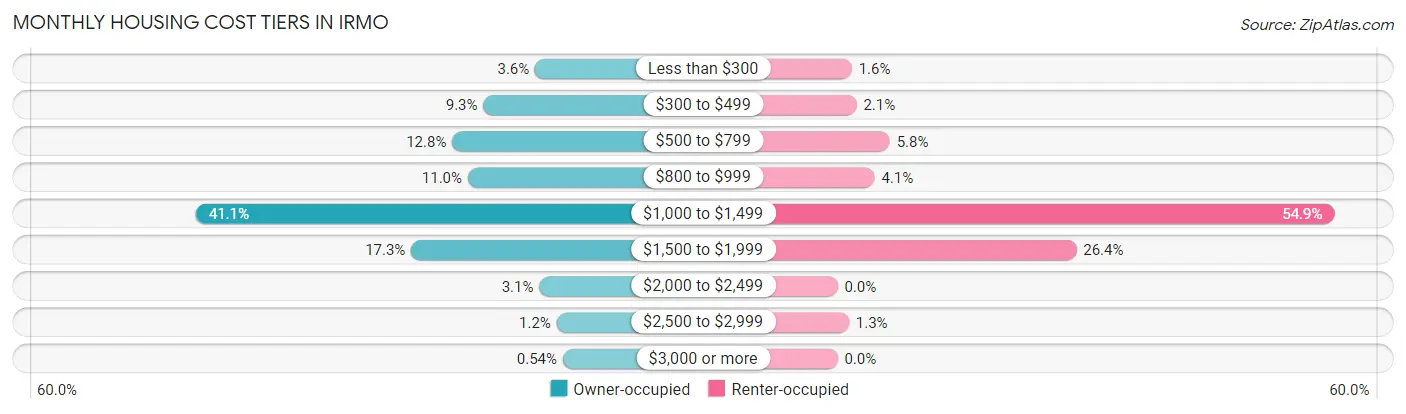
| Monthly Cost | Owner-occupied | Renter-occupied |
| Less than $300 | 133 (3.6%) | 15 (1.6%) |
| $300 to $499 | 344 (9.3%) | 20 (2.1%) |
| $500 to $799 | 471 (12.8%) | 55 (5.8%) |
| $800 to $999 | 407 (11.0%) | 39 (4.1%) |
| $1,000 to $1,499 | 1,516 (41.1%) | 522 (54.9%) |
| $1,500 to $1,999 | 638 (17.3%) | 251 (26.4%) |
| $2,000 to $2,499 | 116 (3.1%) | 0 (0.0%) |
| $2,500 to $2,999 | 45 (1.2%) | 12 (1.3%) |
| $3,000 or more | 20 (0.5%) | 0 (0.0%) |
| Total | 3,690 (100.0%) | 951 (100.0%) |
Physical Housing Characteristics in Irmo
Housing Structures in Irmo
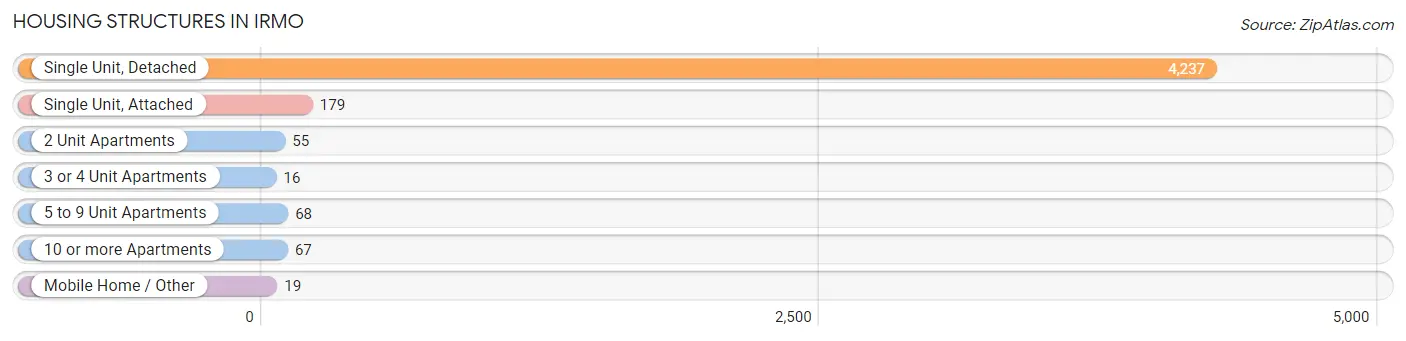
| Structure Type | # Housing Units | % Housing Units |
| Single Unit, Detached | 4,237 | 91.3% |
| Single Unit, Attached | 179 | 3.9% |
| 2 Unit Apartments | 55 | 1.2% |
| 3 or 4 Unit Apartments | 16 | 0.3% |
| 5 to 9 Unit Apartments | 68 | 1.5% |
| 10 or more Apartments | 67 | 1.4% |
| Mobile Home / Other | 19 | 0.4% |
| Total | 4,641 | 100.0% |
Housing Structures by Occupancy in Irmo
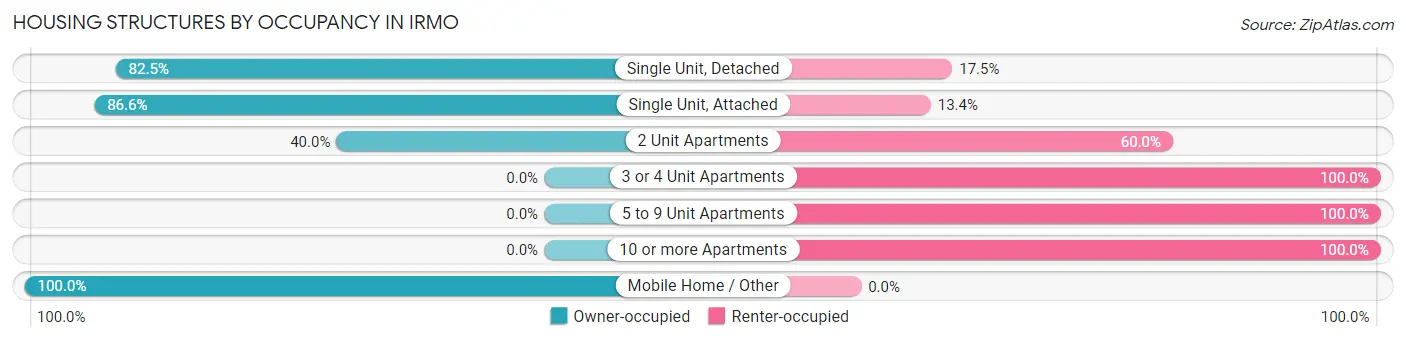
| Structure Type | Owner-occupied | Renter-occupied |
| Single Unit, Detached | 3,494 (82.5%) | 743 (17.5%) |
| Single Unit, Attached | 155 (86.6%) | 24 (13.4%) |
| 2 Unit Apartments | 22 (40.0%) | 33 (60.0%) |
| 3 or 4 Unit Apartments | 0 (0.0%) | 16 (100.0%) |
| 5 to 9 Unit Apartments | 0 (0.0%) | 68 (100.0%) |
| 10 or more Apartments | 0 (0.0%) | 67 (100.0%) |
| Mobile Home / Other | 19 (100.0%) | 0 (0.0%) |
| Total | 3,690 (79.5%) | 951 (20.5%) |
Housing Structures by Number of Rooms in Irmo
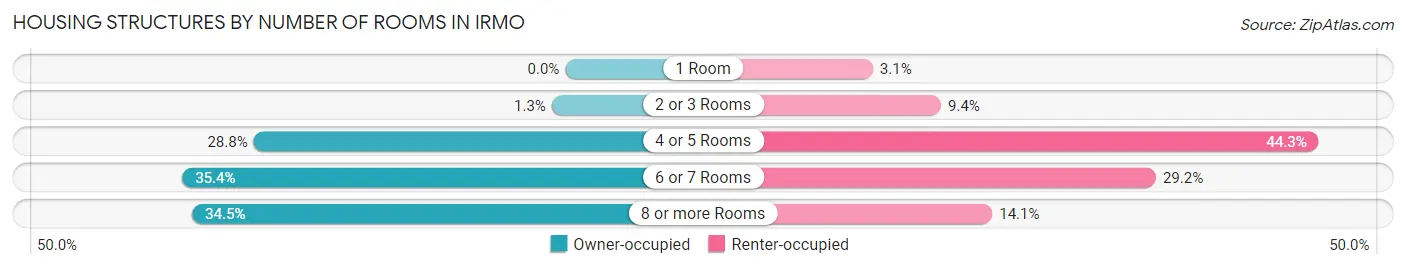
| Number of Rooms | Owner-occupied | Renter-occupied |
| 1 Room | 0 (0.0%) | 29 (3.0%) |
| 2 or 3 Rooms | 46 (1.3%) | 89 (9.4%) |
| 4 or 5 Rooms | 1,064 (28.8%) | 421 (44.3%) |
| 6 or 7 Rooms | 1,307 (35.4%) | 278 (29.2%) |
| 8 or more Rooms | 1,273 (34.5%) | 134 (14.1%) |
| Total | 3,690 (100.0%) | 951 (100.0%) |
Housing Structure by Heating Type in Irmo
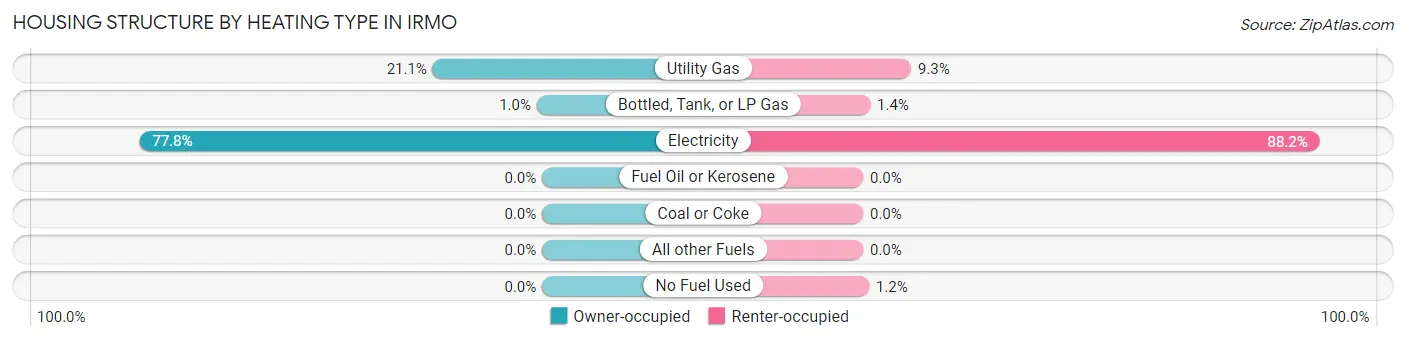
| Heating Type | Owner-occupied | Renter-occupied |
| Utility Gas | 780 (21.1%) | 88 (9.2%) |
| Bottled, Tank, or LP Gas | 38 (1.0%) | 13 (1.4%) |
| Electricity | 2,872 (77.8%) | 839 (88.2%) |
| Fuel Oil or Kerosene | 0 (0.0%) | 0 (0.0%) |
| Coal or Coke | 0 (0.0%) | 0 (0.0%) |
| All other Fuels | 0 (0.0%) | 0 (0.0%) |
| No Fuel Used | 0 (0.0%) | 11 (1.2%) |
| Total | 3,690 (100.0%) | 951 (100.0%) |
Household Vehicle Usage in Irmo
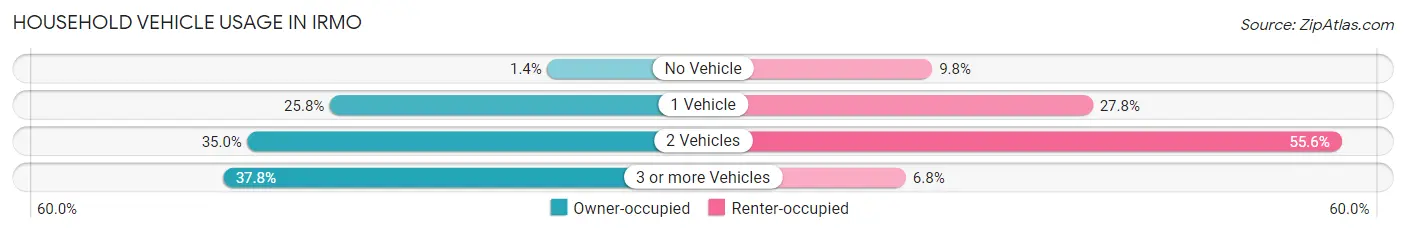
| Vehicles per Household | Owner-occupied | Renter-occupied |
| No Vehicle | 52 (1.4%) | 93 (9.8%) |
| 1 Vehicle | 951 (25.8%) | 264 (27.8%) |
| 2 Vehicles | 1,292 (35.0%) | 529 (55.6%) |
| 3 or more Vehicles | 1,395 (37.8%) | 65 (6.8%) |
| Total | 3,690 (100.0%) | 951 (100.0%) |
Real Estate & Mortgages in Irmo
Real Estate and Mortgage Overview in Irmo
| Characteristic | Without Mortgage | With Mortgage |
| Housing Units | 809 | 2,881 |
| Median Property Value | $169,400 | $168,000 |
| Median Household Income | $61,434 | $459 |
| Monthly Housing Costs | $458 | $20 |
| Real Estate Taxes | $936 | $23 |
Property Value by Mortgage Status in Irmo
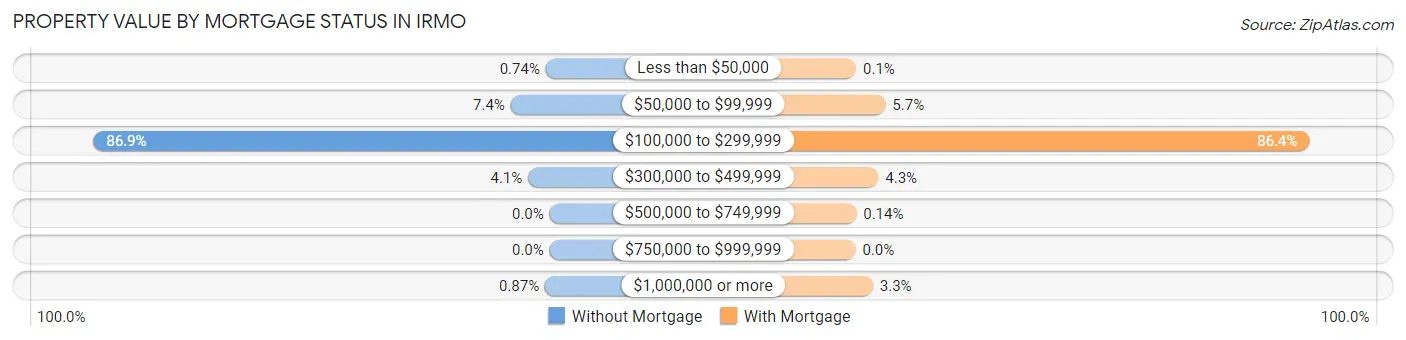
| Property Value | Without Mortgage | With Mortgage |
| Less than $50,000 | 6 (0.7%) | 3 (0.1%) |
| $50,000 to $99,999 | 60 (7.4%) | 164 (5.7%) |
| $100,000 to $299,999 | 703 (86.9%) | 2,490 (86.4%) |
| $300,000 to $499,999 | 33 (4.1%) | 125 (4.3%) |
| $500,000 to $749,999 | 0 (0.0%) | 4 (0.1%) |
| $750,000 to $999,999 | 0 (0.0%) | 0 (0.0%) |
| $1,000,000 or more | 7 (0.9%) | 95 (3.3%) |
| Total | 809 (100.0%) | 2,881 (100.0%) |
Household Income by Mortgage Status in Irmo
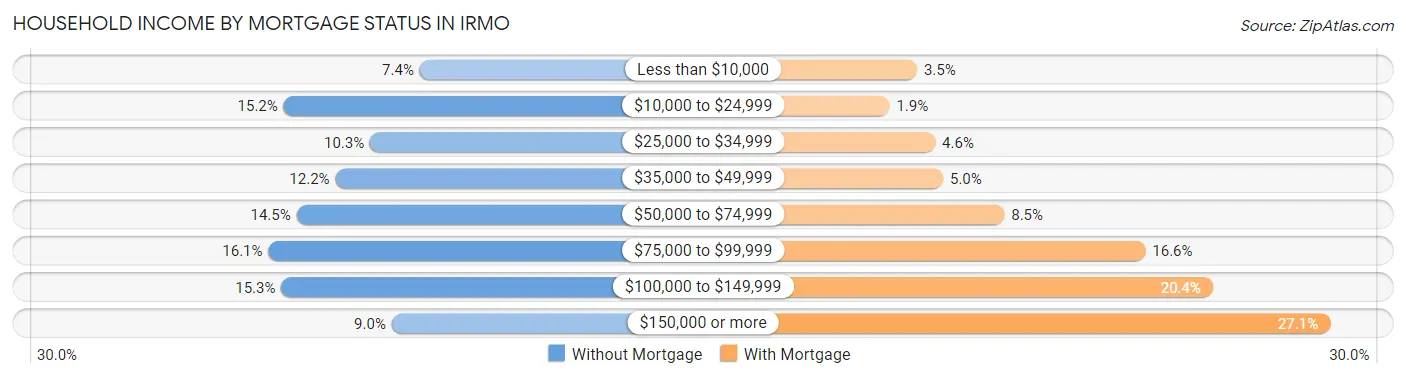
| Household Income | Without Mortgage | With Mortgage |
| Less than $10,000 | 60 (7.4%) | 101 (3.5%) |
| $10,000 to $24,999 | 123 (15.2%) | 56 (1.9%) |
| $25,000 to $34,999 | 83 (10.3%) | 131 (4.5%) |
| $35,000 to $49,999 | 99 (12.2%) | 144 (5.0%) |
| $50,000 to $74,999 | 117 (14.5%) | 245 (8.5%) |
| $75,000 to $99,999 | 130 (16.1%) | 477 (16.6%) |
| $100,000 to $149,999 | 124 (15.3%) | 588 (20.4%) |
| $150,000 or more | 73 (9.0%) | 781 (27.1%) |
| Total | 809 (100.0%) | 2,881 (100.0%) |
Property Value to Household Income Ratio in Irmo
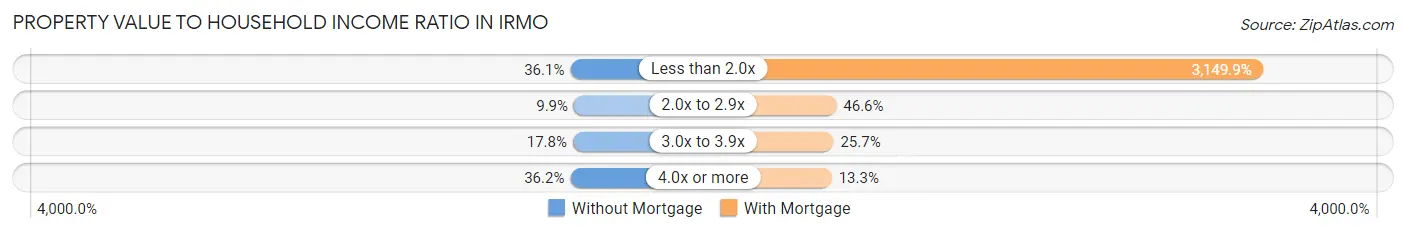
| Value-to-Income Ratio | Without Mortgage | With Mortgage |
| Less than 2.0x | 292 (36.1%) | 90,748 (3,149.9%) |
| 2.0x to 2.9x | 80 (9.9%) | 1,342 (46.6%) |
| 3.0x to 3.9x | 144 (17.8%) | 741 (25.7%) |
| 4.0x or more | 293 (36.2%) | 384 (13.3%) |
| Total | 809 (100.0%) | 2,881 (100.0%) |
Real Estate Taxes by Mortgage Status in Irmo
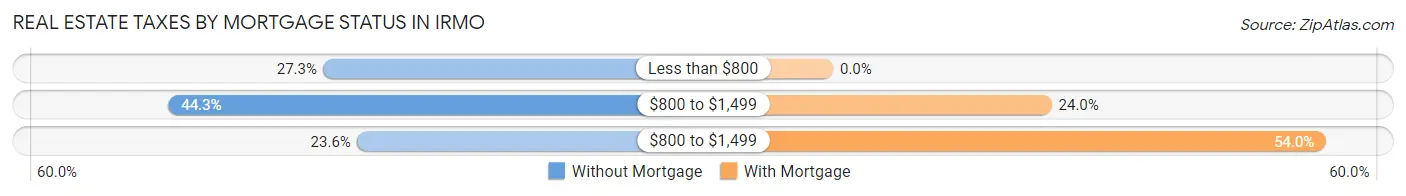
| Property Taxes | Without Mortgage | With Mortgage |
| Less than $800 | 221 (27.3%) | 0 (0.0%) |
| $800 to $1,499 | 358 (44.3%) | 690 (23.9%) |
| $800 to $1,499 | 191 (23.6%) | 1,557 (54.0%) |
| Total | 809 (100.0%) | 2,881 (100.0%) |
Health & Disability in Irmo
Health Insurance Coverage by Age in Irmo
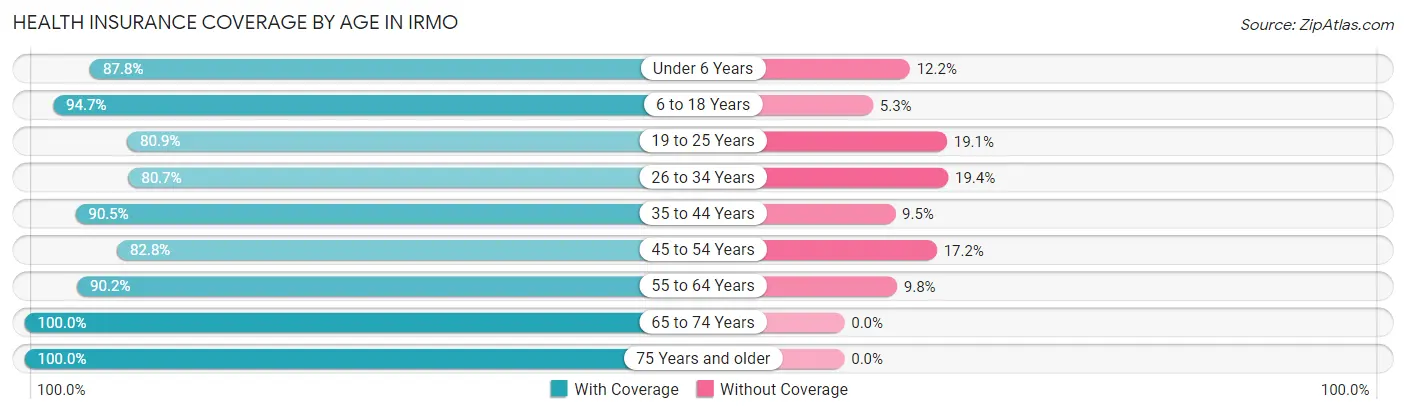
| Age Bracket | With Coverage | Without Coverage |
| Under 6 Years | 511 (87.8%) | 71 (12.2%) |
| 6 to 18 Years | 2,131 (94.7%) | 120 (5.3%) |
| 19 to 25 Years | 702 (80.9%) | 166 (19.1%) |
| 26 to 34 Years | 1,321 (80.6%) | 317 (19.4%) |
| 35 to 44 Years | 1,214 (90.5%) | 127 (9.5%) |
| 45 to 54 Years | 1,326 (82.8%) | 276 (17.2%) |
| 55 to 64 Years | 1,252 (90.2%) | 136 (9.8%) |
| 65 to 74 Years | 1,141 (100.0%) | 0 (0.0%) |
| 75 Years and older | 817 (100.0%) | 0 (0.0%) |
| Total | 10,415 (89.6%) | 1,213 (10.4%) |
Health Insurance Coverage by Citizenship Status in Irmo
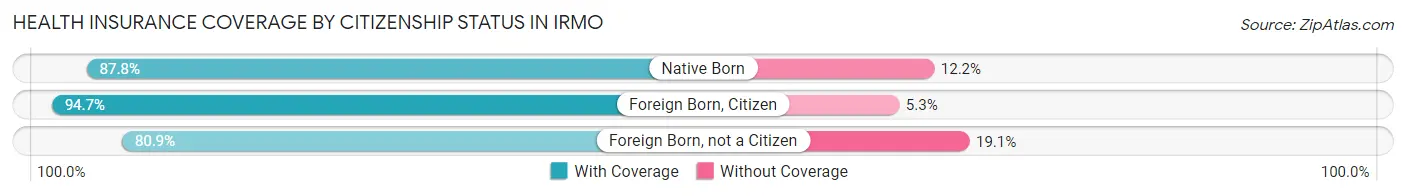
| Citizenship Status | With Coverage | Without Coverage |
| Native Born | 511 (87.8%) | 71 (12.2%) |
| Foreign Born, Citizen | 2,131 (94.7%) | 120 (5.3%) |
| Foreign Born, not a Citizen | 702 (80.9%) | 166 (19.1%) |
Health Insurance Coverage by Household Income in Irmo
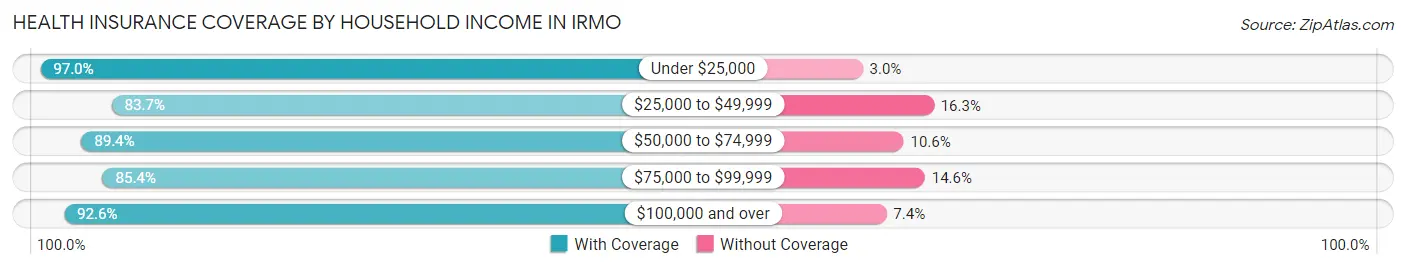
| Household Income | With Coverage | Without Coverage |
| Under $25,000 | 819 (97.0%) | 25 (3.0%) |
| $25,000 to $49,999 | 1,572 (83.7%) | 306 (16.3%) |
| $50,000 to $74,999 | 1,856 (89.4%) | 221 (10.6%) |
| $75,000 to $99,999 | 1,775 (85.4%) | 304 (14.6%) |
| $100,000 and over | 4,365 (92.6%) | 350 (7.4%) |
Public vs Private Health Insurance Coverage by Age in Irmo
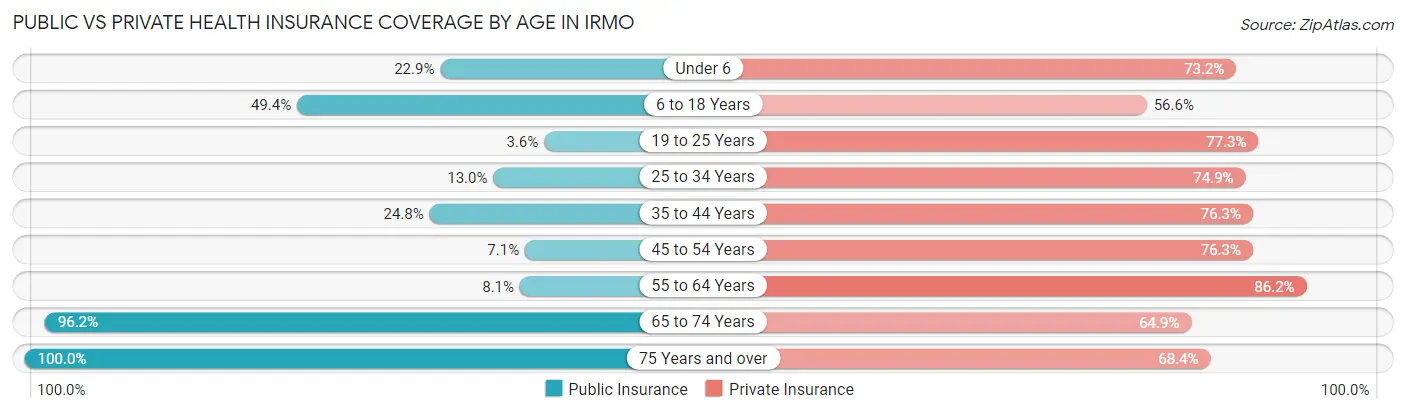
| Age Bracket | Public Insurance | Private Insurance |
| Under 6 | 133 (22.9%) | 426 (73.2%) |
| 6 to 18 Years | 1,113 (49.4%) | 1,274 (56.6%) |
| 19 to 25 Years | 31 (3.6%) | 671 (77.3%) |
| 25 to 34 Years | 213 (13.0%) | 1,227 (74.9%) |
| 35 to 44 Years | 333 (24.8%) | 1,023 (76.3%) |
| 45 to 54 Years | 114 (7.1%) | 1,222 (76.3%) |
| 55 to 64 Years | 112 (8.1%) | 1,197 (86.2%) |
| 65 to 74 Years | 1,098 (96.2%) | 740 (64.9%) |
| 75 Years and over | 817 (100.0%) | 559 (68.4%) |
| Total | 3,964 (34.1%) | 8,339 (71.7%) |
Disability Status by Sex by Age in Irmo
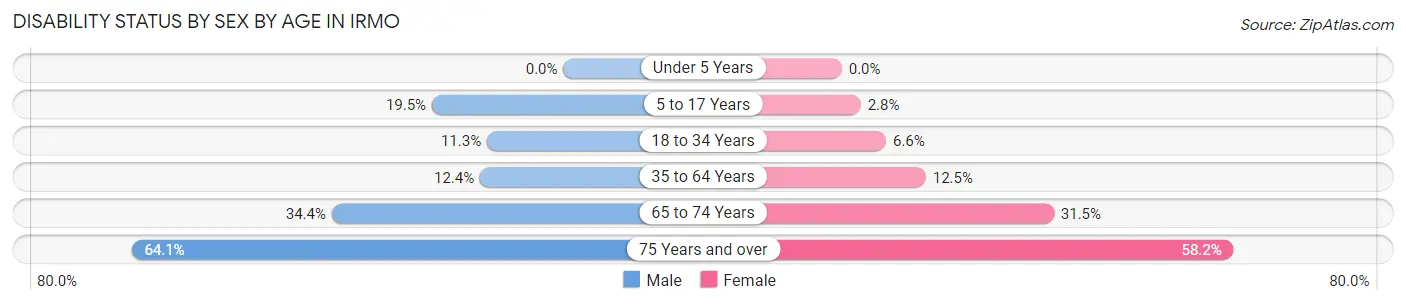
| Age Bracket | Male | Female |
| Under 5 Years | 0 (0.0%) | 0 (0.0%) |
| 5 to 17 Years | 208 (19.5%) | 30 (2.8%) |
| 18 to 34 Years | 164 (11.3%) | 86 (6.6%) |
| 35 to 64 Years | 261 (12.4%) | 277 (12.5%) |
| 65 to 74 Years | 162 (34.4%) | 211 (31.5%) |
| 75 Years and over | 202 (64.1%) | 292 (58.2%) |
Disability Class by Sex by Age in Irmo
Disability Class: Hearing Difficulty
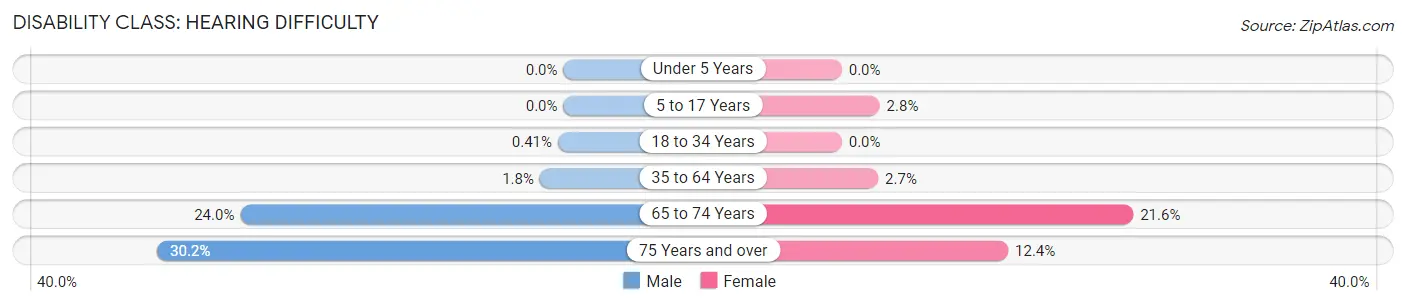
| Age Bracket | Male | Female |
| Under 5 Years | 0 (0.0%) | 0 (0.0%) |
| 5 to 17 Years | 0 (0.0%) | 30 (2.8%) |
| 18 to 34 Years | 6 (0.4%) | 0 (0.0%) |
| 35 to 64 Years | 37 (1.8%) | 60 (2.7%) |
| 65 to 74 Years | 113 (24.0%) | 145 (21.6%) |
| 75 Years and over | 95 (30.2%) | 62 (12.3%) |
Disability Class: Vision Difficulty
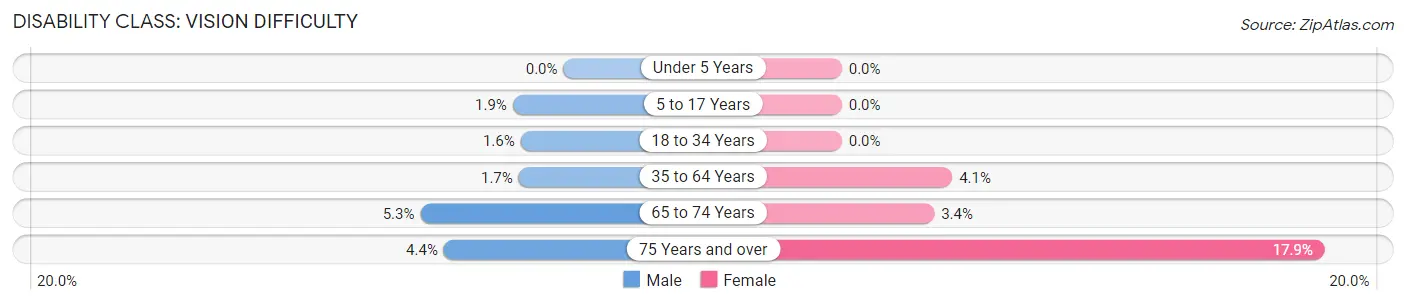
| Age Bracket | Male | Female |
| Under 5 Years | 0 (0.0%) | 0 (0.0%) |
| 5 to 17 Years | 20 (1.9%) | 0 (0.0%) |
| 18 to 34 Years | 23 (1.6%) | 0 (0.0%) |
| 35 to 64 Years | 35 (1.7%) | 91 (4.1%) |
| 65 to 74 Years | 25 (5.3%) | 23 (3.4%) |
| 75 Years and over | 14 (4.4%) | 90 (17.9%) |
Disability Class: Cognitive Difficulty
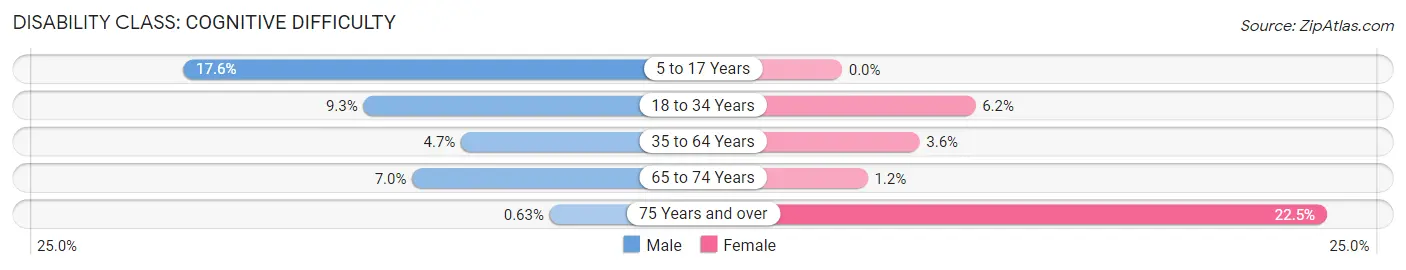
| Age Bracket | Male | Female |
| 5 to 17 Years | 188 (17.6%) | 0 (0.0%) |
| 18 to 34 Years | 134 (9.3%) | 81 (6.2%) |
| 35 to 64 Years | 100 (4.7%) | 80 (3.6%) |
| 65 to 74 Years | 33 (7.0%) | 8 (1.2%) |
| 75 Years and over | 2 (0.6%) | 113 (22.5%) |
Disability Class: Ambulatory Difficulty
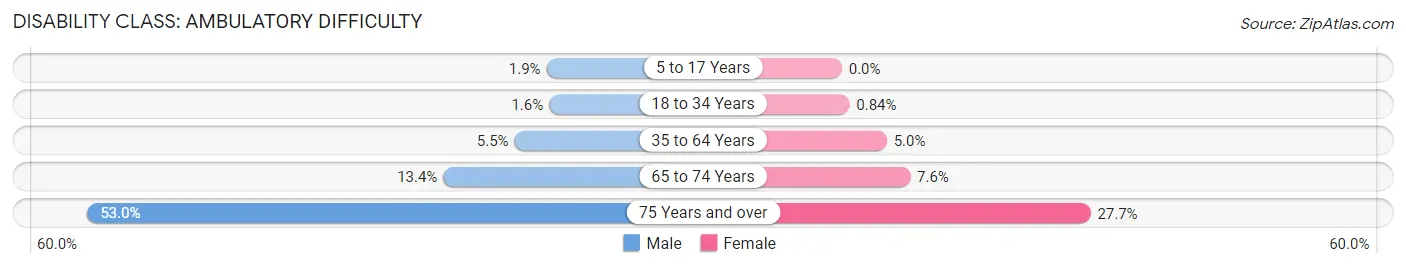
| Age Bracket | Male | Female |
| 5 to 17 Years | 20 (1.9%) | 0 (0.0%) |
| 18 to 34 Years | 23 (1.6%) | 11 (0.8%) |
| 35 to 64 Years | 115 (5.4%) | 111 (5.0%) |
| 65 to 74 Years | 63 (13.4%) | 51 (7.6%) |
| 75 Years and over | 167 (53.0%) | 139 (27.7%) |
Disability Class: Self-Care Difficulty
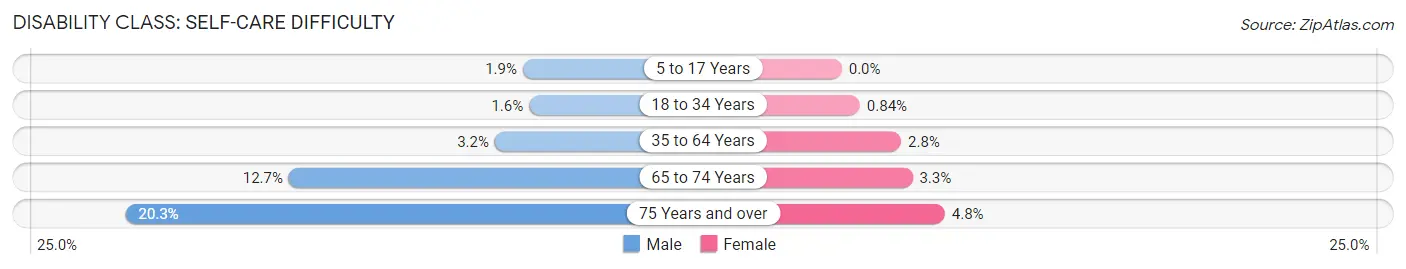
| Age Bracket | Male | Female |
| 5 to 17 Years | 20 (1.9%) | 0 (0.0%) |
| 18 to 34 Years | 23 (1.6%) | 11 (0.8%) |
| 35 to 64 Years | 67 (3.2%) | 61 (2.8%) |
| 65 to 74 Years | 60 (12.7%) | 22 (3.3%) |
| 75 Years and over | 64 (20.3%) | 24 (4.8%) |
Technology Access in Irmo
Computing Device Access in Irmo
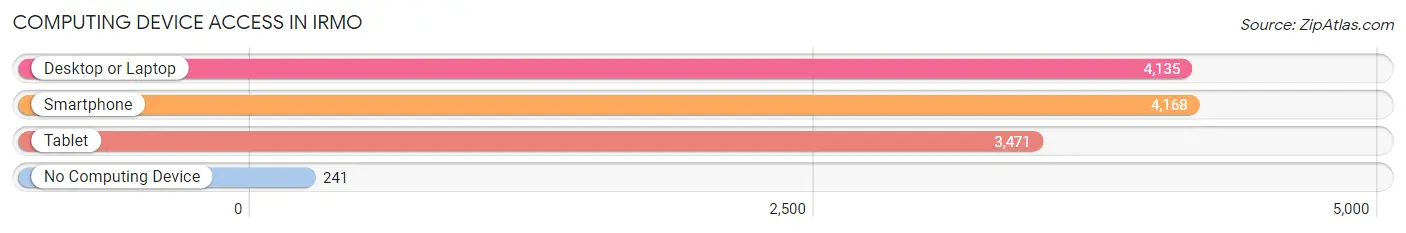
| Device Type | # Households | % Households |
| Desktop or Laptop | 4,135 | 89.1% |
| Smartphone | 4,168 | 89.8% |
| Tablet | 3,471 | 74.8% |
| No Computing Device | 241 | 5.2% |
| Total | 4,641 | 100.0% |
Internet Access in Irmo
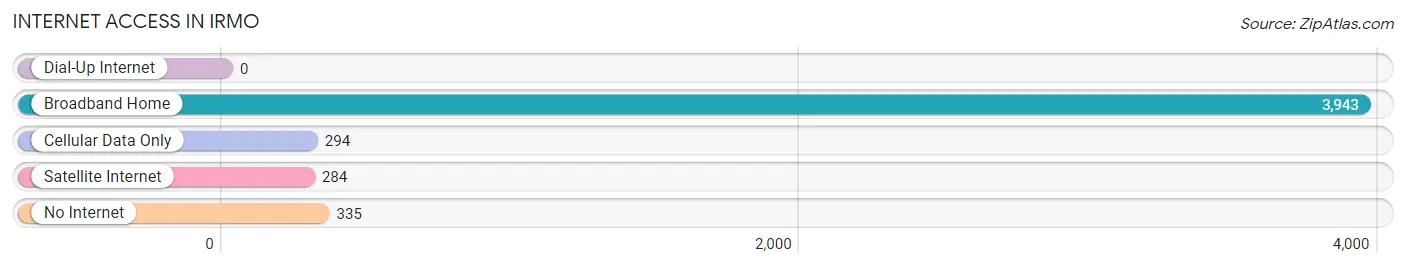
| Internet Type | # Households | % Households |
| Dial-Up Internet | 0 | 0.0% |
| Broadband Home | 3,943 | 85.0% |
| Cellular Data Only | 294 | 6.3% |
| Satellite Internet | 284 | 6.1% |
| No Internet | 335 | 7.2% |
| Total | 4,641 | 100.0% |
Irmo Summary
Irmo, South Carolina is a small town located in the Midlands region of the state, just outside of the capital city of Columbia. It is situated in the northwest corner of Lexington County, and is part of the Columbia Metropolitan Statistical Area. The town was founded in 1891 and has a population of approximately 11,000 people.
History
The town of Irmo was founded in 1891 by the Reverend William Irvin, who named the town after himself. The town was originally a farming community, and the first post office was established in 1892. In the early 1900s, the town began to grow and develop, and by the 1920s, it had become a popular summer resort destination. The town was incorporated in 1951, and in the 1960s, it began to experience rapid growth due to its proximity to Columbia.
Geography
Irmo is located in the Midlands region of South Carolina, just outside of the capital city of Columbia. It is situated in the northwest corner of Lexington County, and is part of the Columbia Metropolitan Statistical Area. The town is located on the banks of Lake Murray, a large reservoir created by the Saluda River. The town is bordered by the towns of Lexington, West Columbia, and Chapin.
Economy
The economy of Irmo is largely based on the service industry, with many businesses providing services to the surrounding area. The town is home to several large employers, including the Lexington Medical Center, the University of South Carolina, and the South Carolina Department of Transportation. Additionally, the town is home to several small businesses, including restaurants, retail stores, and professional services.
Demographics
As of the 2010 census, the population of Irmo was 11,039. The racial makeup of the town was 79.2% White, 15.3% African American, 0.4% Native American, 1.7% Asian, 0.1% Pacific Islander, 1.3% from other races, and 2.0% from two or more races. Hispanic or Latino of any race were 4.2% of the population. The median household income was $50,945, and the median family income was $60,945.
Conclusion
Irmo, South Carolina is a small town located in the Midlands region of the state, just outside of the capital city of Columbia. It is situated in the northwest corner of Lexington County, and is part of the Columbia Metropolitan Statistical Area. The town was founded in 1891 and has a population of approximately 11,000 people. The economy of Irmo is largely based on the service industry, with many businesses providing services to the surrounding area. As of the 2010 census, the population of Irmo was 11,039, with a median household income of $50,945. Irmo is a vibrant and growing community, and is a great place to live and work.
Common Questions
What is Per Capita Income in Irmo?
Per Capita income in Irmo is $34,177.
What is the Median Family Income in Irmo?
Median Family Income in Irmo is $85,205.
What is the Median Household income in Irmo?
Median Household Income in Irmo is $77,656.
What is Income or Wage Gap in Irmo?
Income or Wage Gap in Irmo is 17.7%.
Women in Irmo earn 82.3 cents for every dollar earned by a man.
What is Family Income Deficit in Irmo?
Family Income Deficit in Irmo is $12,557.
Families that are below poverty line in Irmo earn $12,557 less on average than the poverty threshold level.
What is Inequality or Gini Index in Irmo?
Inequality or Gini Index in Irmo is 0.37.
What is the Total Population of Irmo?
Total Population of Irmo is 11,685.
What is the Total Male Population of Irmo?
Total Male Population of Irmo is 5,680.
What is the Total Female Population of Irmo?
Total Female Population of Irmo is 6,005.
What is the Ratio of Males per 100 Females in Irmo?
There are 94.59 Males per 100 Females in Irmo.
What is the Ratio of Females per 100 Males in Irmo?
There are 105.72 Females per 100 Males in Irmo.
What is the Median Population Age in Irmo?
Median Population Age in Irmo is 39.2 Years.
What is the Average Family Size in Irmo
Average Family Size in Irmo is 2.9 People.
What is the Average Household Size in Irmo
Average Household Size in Irmo is 2.5 People.
How Large is the Labor Force in Irmo?
There are 6,469 People in the Labor Forcein in Irmo.
What is the Percentage of People in the Labor Force in Irmo?
68.3% of People are in the Labor Force in Irmo.
What is the Unemployment Rate in Irmo?
Unemployment Rate in Irmo is 4.6%.