Catonsville, MD Map & Demographics
Catonsville Map
Catonsville Overview
$48,766
PER CAPITA INCOME
$132,121
AVG FAMILY INCOME
$103,448
AVG HOUSEHOLD INCOME
25.1%
WAGE / INCOME GAP [ % ]
74.9¢/ $1
WAGE / INCOME GAP [ $ ]
$16,744
FAMILY INCOME DEFICIT
0.41
INEQUALITY / GINI INDEX
42,767
TOTAL POPULATION
20,130
MALE POPULATION
22,637
FEMALE POPULATION
88.93
MALES / 100 FEMALES
112.45
FEMALES / 100 MALES
40.0
MEDIAN AGE
3.1
AVG FAMILY SIZE
2.4
AVG HOUSEHOLD SIZE
21,941
LABOR FORCE [ PEOPLE ]
61.8%
PERCENT IN LABOR FORCE
3.7%
UNEMPLOYMENT RATE
Catonsville Zip Codes
Income in Catonsville
Income Overview in Catonsville
Per Capita Income in Catonsville is $48,766, while median incomes of families and households are $132,121 and $103,448 respectively.
| Characteristic | Number | Measure |
| Per Capita Income | 42,767 | $48,766 |
| Median Family Income | 9,386 | $132,121 |
| Mean Family Income | 9,386 | $156,104 |
| Median Household Income | 16,115 | $103,448 |
| Mean Household Income | 16,115 | $126,454 |
| Income Deficit | 9,386 | $16,744 |
| Wage / Income Gap (%) | 42,767 | 25.07% |
| Wage / Income Gap ($) | 42,767 | 74.93¢ per $1 |
| Gini / Inequality Index | 42,767 | 0.41 |
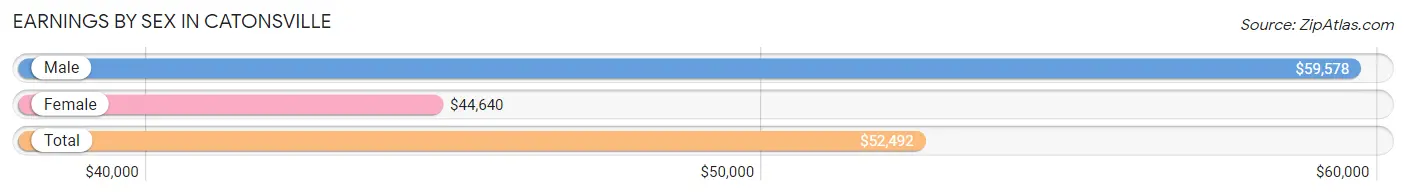
Earnings by Sex in Catonsville
Average Earnings in Catonsville are $52,492, $59,578 for men and $44,640 for women, a difference of 25.1%.
| Sex | Number | Average Earnings |
| Male | 12,151 (51.3%) | $59,578 |
| Female | 11,522 (48.7%) | $44,640 |
| Total | 23,673 (100.0%) | $52,492 |
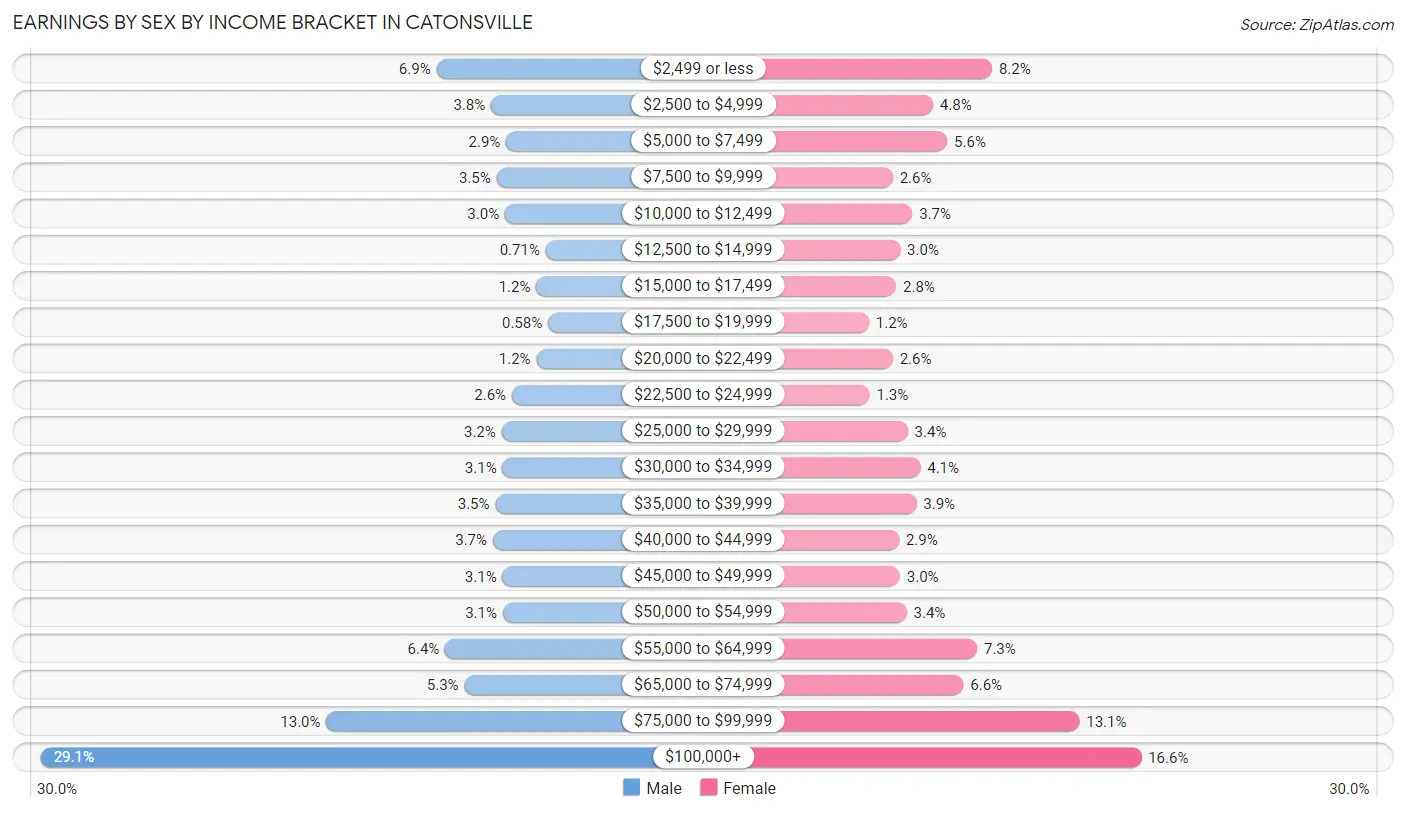
Earnings by Sex by Income Bracket in Catonsville
The most common earnings brackets in Catonsville are $100,000+ for men (3,535 | 29.1%) and $100,000+ for women (1,907 | 16.6%).
| Income | Male | Female |
| $2,499 or less | 832 (6.9%) | 940 (8.2%) |
| $2,500 to $4,999 | 459 (3.8%) | 558 (4.8%) |
| $5,000 to $7,499 | 356 (2.9%) | 650 (5.6%) |
| $7,500 to $9,999 | 422 (3.5%) | 297 (2.6%) |
| $10,000 to $12,499 | 364 (3.0%) | 424 (3.7%) |
| $12,500 to $14,999 | 86 (0.7%) | 346 (3.0%) |
| $15,000 to $17,499 | 151 (1.2%) | 319 (2.8%) |
| $17,500 to $19,999 | 71 (0.6%) | 143 (1.2%) |
| $20,000 to $22,499 | 150 (1.2%) | 297 (2.6%) |
| $22,500 to $24,999 | 317 (2.6%) | 148 (1.3%) |
| $25,000 to $29,999 | 388 (3.2%) | 394 (3.4%) |
| $30,000 to $34,999 | 382 (3.1%) | 476 (4.1%) |
| $35,000 to $39,999 | 430 (3.5%) | 451 (3.9%) |
| $40,000 to $44,999 | 447 (3.7%) | 338 (2.9%) |
| $45,000 to $49,999 | 382 (3.1%) | 343 (3.0%) |
| $50,000 to $54,999 | 379 (3.1%) | 387 (3.4%) |
| $55,000 to $64,999 | 773 (6.4%) | 843 (7.3%) |
| $65,000 to $74,999 | 642 (5.3%) | 755 (6.6%) |
| $75,000 to $99,999 | 1,585 (13.0%) | 1,506 (13.1%) |
| $100,000+ | 3,535 (29.1%) | 1,907 (16.6%) |
| Total | 12,151 (100.0%) | 11,522 (100.0%) |
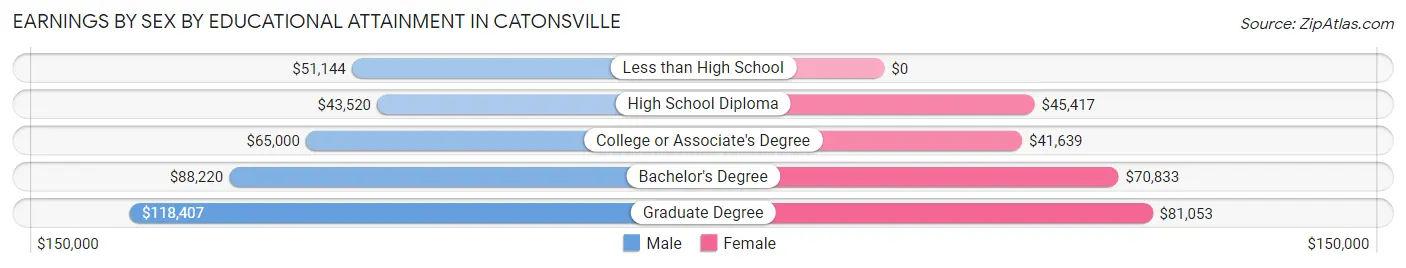
Earnings by Sex by Educational Attainment in Catonsville
Average earnings in Catonsville are $78,031 for men and $62,292 for women, a difference of 20.2%. Men with an educational attainment of graduate degree enjoy the highest average annual earnings of $118,407, while those with high school diploma education earn the least with $43,520. Women with an educational attainment of graduate degree earn the most with the average annual earnings of $81,053, while those with college or associate's degree education have the smallest earnings of $41,639.
| Educational Attainment | Male Income | Female Income |
| Less than High School | $51,144 | $0 |
| High School Diploma | $43,520 | $45,417 |
| College or Associate's Degree | $65,000 | $41,639 |
| Bachelor's Degree | $88,220 | $70,833 |
| Graduate Degree | $118,407 | $81,053 |
| Total | $78,031 | $62,292 |
Family Income in Catonsville
Family Income Brackets in Catonsville
According to the Catonsville family income data, there are 2,384 families falling into the $100,000 to $149,999 income range, which is the most common income bracket and makes up 25.4% of all families. Conversely, the $10,000 to $14,999 income bracket is the least frequent group with only 38 families (0.4%) belonging to this category.
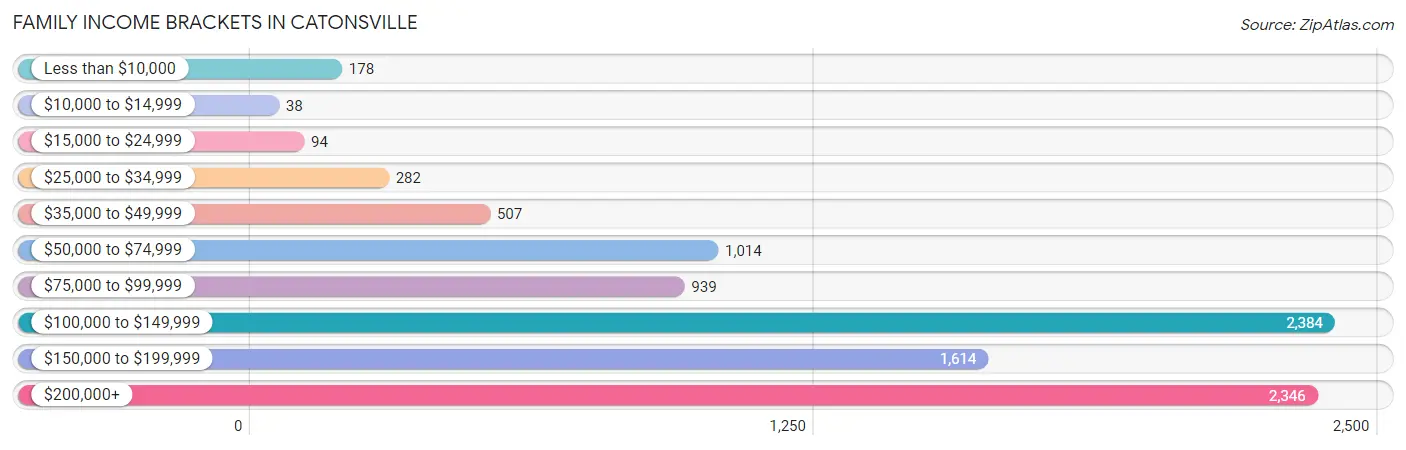
| Income Bracket | # Families | % Families |
| Less than $10,000 | 178 | 1.9% |
| $10,000 to $14,999 | 38 | 0.4% |
| $15,000 to $24,999 | 94 | 1.0% |
| $25,000 to $34,999 | 282 | 3.0% |
| $35,000 to $49,999 | 507 | 5.4% |
| $50,000 to $74,999 | 1,014 | 10.8% |
| $75,000 to $99,999 | 939 | 10.0% |
| $100,000 to $149,999 | 2,384 | 25.4% |
| $150,000 to $199,999 | 1,614 | 17.2% |
| $200,000+ | 2,346 | 25.0% |
Family Income by Famaliy Size in Catonsville
7+ person families (83 | 0.9%) account for the highest median family income in Catonsville with $197,639 per family, while 2-person families (4,471 | 47.6%) have the highest median income of $57,254 per family member.
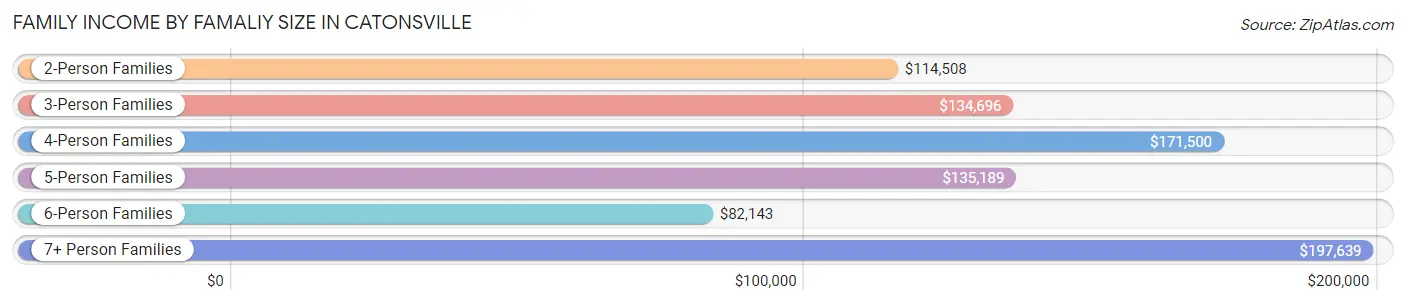
| Income Bracket | # Families | Median Income |
| 2-Person Families | 4,471 (47.6%) | $114,508 |
| 3-Person Families | 1,873 (20.0%) | $134,696 |
| 4-Person Families | 1,854 (19.8%) | $171,500 |
| 5-Person Families | 813 (8.7%) | $135,189 |
| 6-Person Families | 292 (3.1%) | $82,143 |
| 7+ Person Families | 83 (0.9%) | $197,639 |
| Total | 9,386 (100.0%) | $132,121 |
Family Income by Number of Earners in Catonsville
The median family income in Catonsville is $132,121, with families comprising 2 earners (4,265) having the highest median family income of $168,386, while families with no earners (1,083) have the lowest median family income of $90,144, accounting for 45.4% and 11.5% of families, respectively.
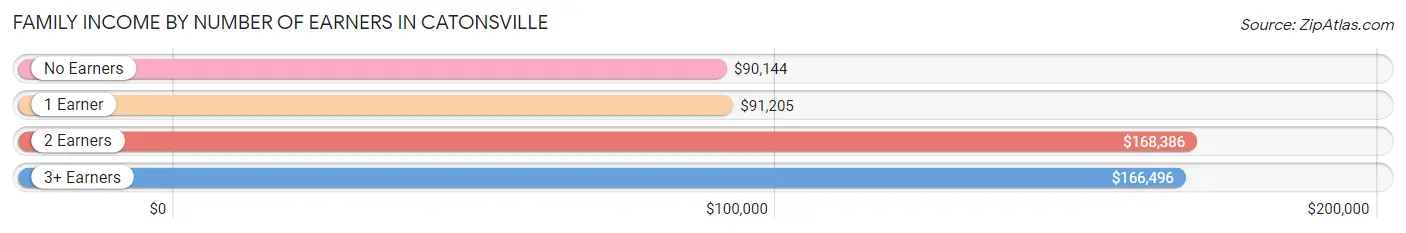
| Number of Earners | # Families | Median Income |
| No Earners | 1,083 (11.5%) | $90,144 |
| 1 Earner | 2,871 (30.6%) | $91,205 |
| 2 Earners | 4,265 (45.4%) | $168,386 |
| 3+ Earners | 1,167 (12.4%) | $166,496 |
| Total | 9,386 (100.0%) | $132,121 |
Household Income in Catonsville
Household Income Brackets in Catonsville
With 3,481 households falling in the category, the $100,000 to $149,999 income range is the most frequent in Catonsville, accounting for 21.6% of all households. In contrast, only 242 households (1.5%) fall into the $10,000 to $14,999 income bracket, making it the least populous group.
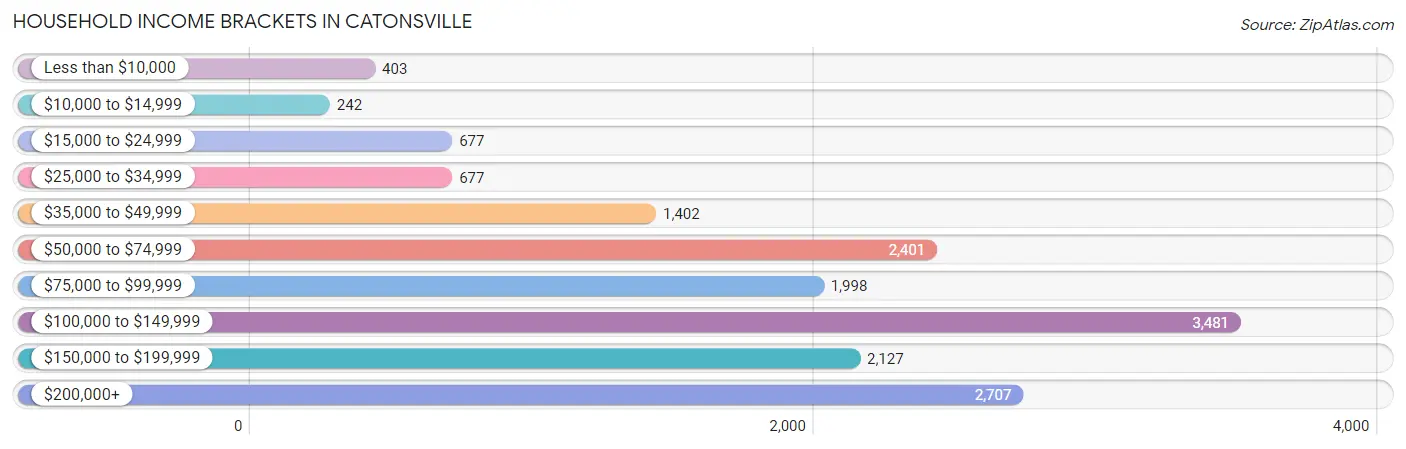
| Income Bracket | # Households | % Households |
| Less than $10,000 | 403 | 2.5% |
| $10,000 to $14,999 | 242 | 1.5% |
| $15,000 to $24,999 | 677 | 4.2% |
| $25,000 to $34,999 | 677 | 4.2% |
| $35,000 to $49,999 | 1,402 | 8.7% |
| $50,000 to $74,999 | 2,401 | 14.9% |
| $75,000 to $99,999 | 1,998 | 12.4% |
| $100,000 to $149,999 | 3,481 | 21.6% |
| $150,000 to $199,999 | 2,127 | 13.2% |
| $200,000+ | 2,707 | 16.8% |
Household Income by Householder Age in Catonsville
The median household income in Catonsville is $103,448, with the highest median household income of $125,667 found in the 45 to 64 years age bracket for the primary householder. A total of 5,549 households (34.4%) fall into this category. Meanwhile, the 65+ years age bracket for the primary householder has the lowest median household income of $71,864, with 5,822 households (36.1%) in this group.
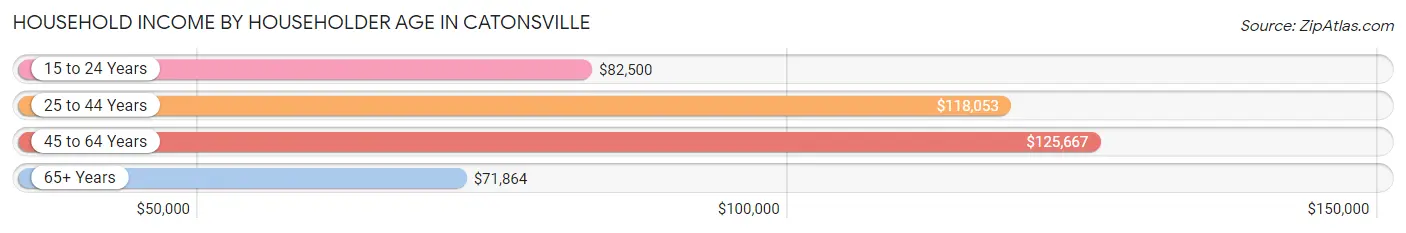
| Income Bracket | # Households | Median Income |
| 15 to 24 Years | 264 (1.6%) | $82,500 |
| 25 to 44 Years | 4,480 (27.8%) | $118,053 |
| 45 to 64 Years | 5,549 (34.4%) | $125,667 |
| 65+ Years | 5,822 (36.1%) | $71,864 |
| Total | 16,115 (100.0%) | $103,448 |
Poverty in Catonsville
Income Below Poverty by Sex and Age in Catonsville
With 4.5% poverty level for males and 7.2% for females among the residents of Catonsville, 18 to 24 year old males and 18 to 24 year old females are the most vulnerable to poverty, with 179 males (10.3%) and 188 females (17.5%) in their respective age groups living below the poverty level.
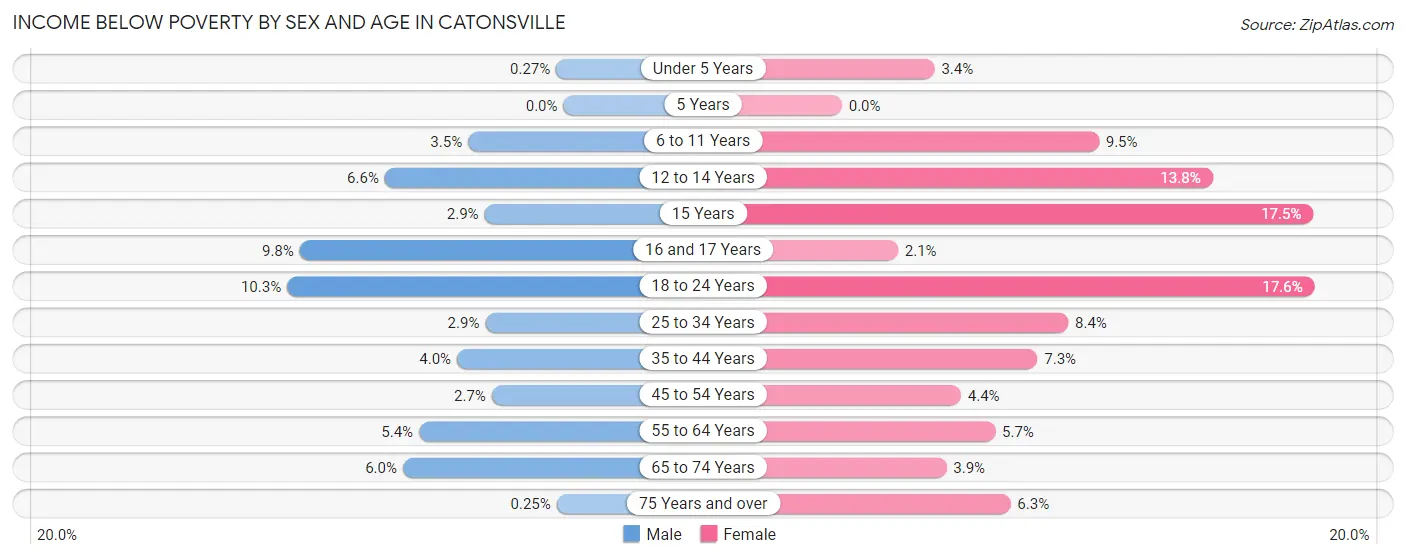
| Age Bracket | Male | Female |
| Under 5 Years | 3 (0.3%) | 22 (3.4%) |
| 5 Years | 0 (0.0%) | 0 (0.0%) |
| 6 to 11 Years | 43 (3.5%) | 144 (9.5%) |
| 12 to 14 Years | 52 (6.6%) | 142 (13.8%) |
| 15 Years | 11 (2.9%) | 49 (17.5%) |
| 16 and 17 Years | 57 (9.8%) | 12 (2.1%) |
| 18 to 24 Years | 179 (10.3%) | 188 (17.5%) |
| 25 to 34 Years | 58 (2.9%) | 175 (8.4%) |
| 35 to 44 Years | 100 (4.0%) | 196 (7.3%) |
| 45 to 54 Years | 54 (2.7%) | 91 (4.4%) |
| 55 to 64 Years | 136 (5.4%) | 158 (5.7%) |
| 65 to 74 Years | 119 (6.0%) | 79 (3.9%) |
| 75 Years and over | 3 (0.3%) | 203 (6.3%) |
| Total | 815 (4.5%) | 1,459 (7.2%) |
Income Above Poverty by Sex and Age in Catonsville
According to the poverty statistics in Catonsville, males aged 5 years and females aged 5 years are the age groups that are most secure financially, with 100.0% of males and 100.0% of females in these age groups living above the poverty line.
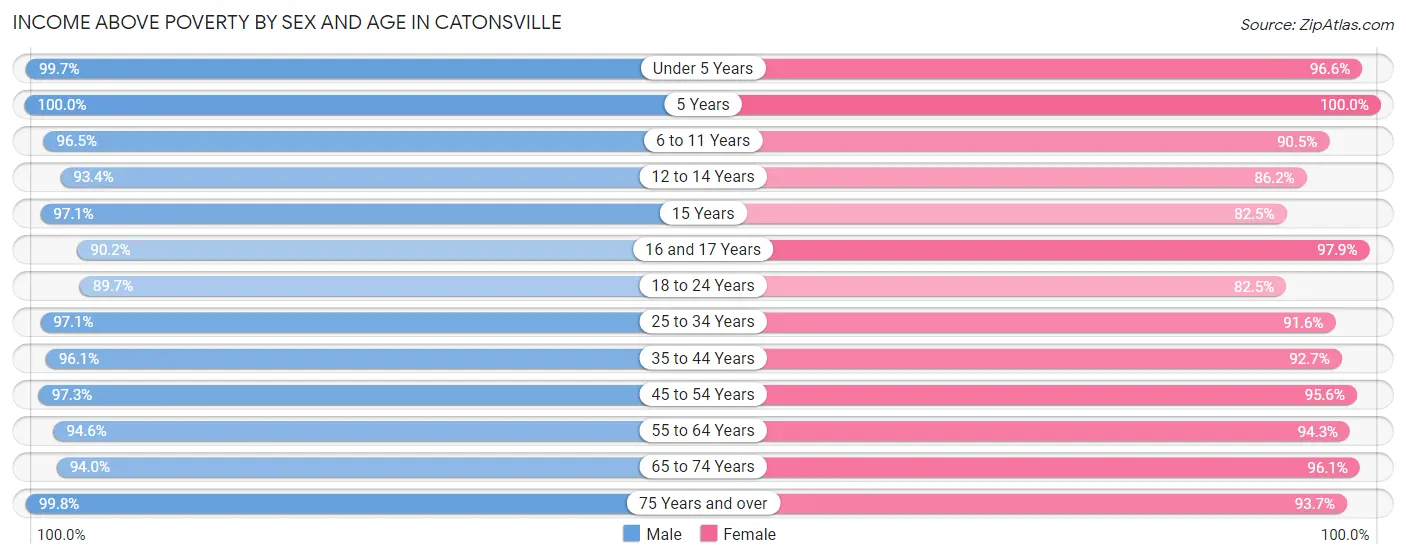
| Age Bracket | Male | Female |
| Under 5 Years | 1,088 (99.7%) | 618 (96.6%) |
| 5 Years | 155 (100.0%) | 144 (100.0%) |
| 6 to 11 Years | 1,170 (96.5%) | 1,365 (90.5%) |
| 12 to 14 Years | 732 (93.4%) | 890 (86.2%) |
| 15 Years | 365 (97.1%) | 231 (82.5%) |
| 16 and 17 Years | 525 (90.2%) | 566 (97.9%) |
| 18 to 24 Years | 1,566 (89.7%) | 883 (82.5%) |
| 25 to 34 Years | 1,939 (97.1%) | 1,909 (91.6%) |
| 35 to 44 Years | 2,432 (96.1%) | 2,504 (92.7%) |
| 45 to 54 Years | 1,978 (97.3%) | 1,970 (95.6%) |
| 55 to 64 Years | 2,399 (94.6%) | 2,618 (94.3%) |
| 65 to 74 Years | 1,878 (94.0%) | 1,956 (96.1%) |
| 75 Years and over | 1,191 (99.8%) | 3,040 (93.7%) |
| Total | 17,418 (95.5%) | 18,694 (92.8%) |
Income Below Poverty Among Married-Couple Families in Catonsville
The poverty statistics for married-couple families in Catonsville show that 1.6% or 116 of the total 7,264 families live below the poverty line. Families with 3 or 4 children have the highest poverty rate of 5.7%, comprising of 37 families. On the other hand, families with no children have the lowest poverty rate of 1.1%, which includes 43 families.
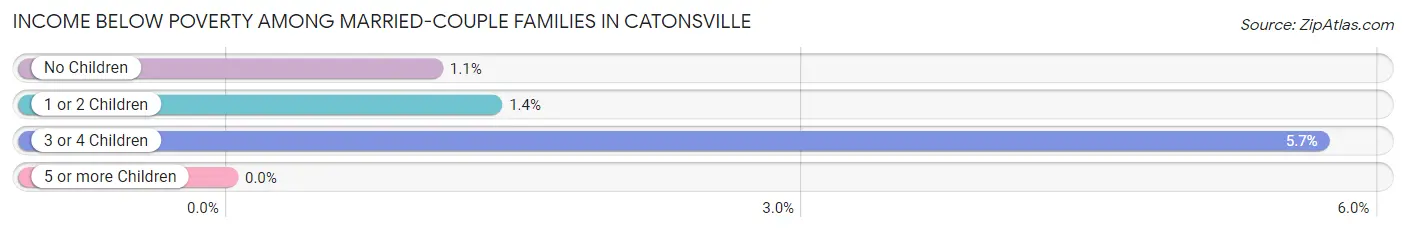
| Children | Above Poverty | Below Poverty |
| No Children | 3,966 (98.9%) | 43 (1.1%) |
| 1 or 2 Children | 2,570 (98.6%) | 36 (1.4%) |
| 3 or 4 Children | 612 (94.3%) | 37 (5.7%) |
| 5 or more Children | 0 (0.0%) | 0 (0.0%) |
| Total | 7,148 (98.4%) | 116 (1.6%) |
Income Below Poverty Among Single-Parent Households in Catonsville
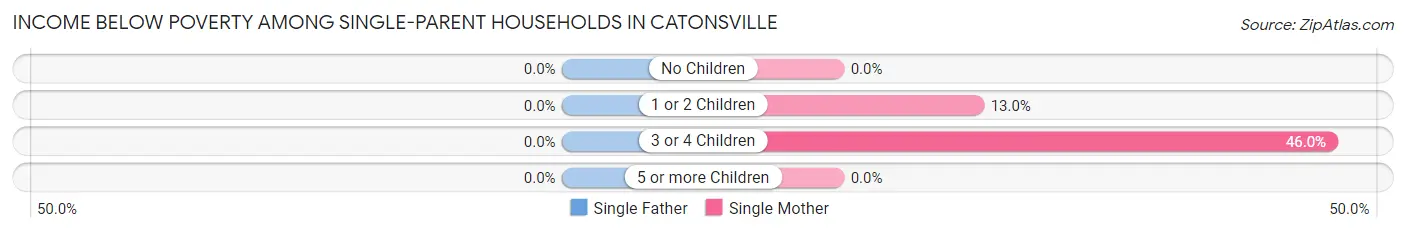
| Children | Single Father | Single Mother |
| No Children | 0 (0.0%) | 0 (0.0%) |
| 1 or 2 Children | 0 (0.0%) | 97 (13.0%) |
| 3 or 4 Children | 0 (0.0%) | 58 (46.0%) |
| 5 or more Children | 0 (0.0%) | 0 (0.0%) |
| Total | 0 (0.0%) | 155 (10.5%) |
Income Below Poverty Among Married-Couple vs Single-Parent Households in Catonsville
The poverty data for Catonsville shows that 116 of the married-couple family households (1.6%) and 155 of the single-parent households (7.3%) are living below the poverty level. Within the married-couple family households, those with 3 or 4 children have the highest poverty rate, with 37 households (5.7%) falling below the poverty line. Among the single-parent households, those with 3 or 4 children have the highest poverty rate, with 58 household (46.0%) living below poverty.
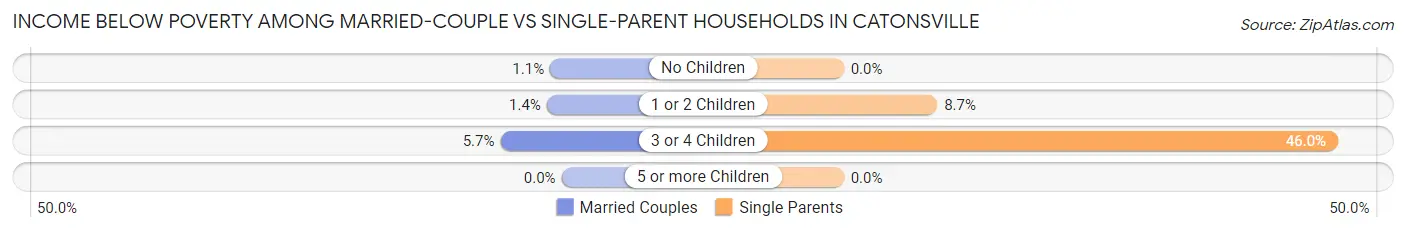
| Children | Married-Couple Families | Single-Parent Households |
| No Children | 43 (1.1%) | 0 (0.0%) |
| 1 or 2 Children | 36 (1.4%) | 97 (8.7%) |
| 3 or 4 Children | 37 (5.7%) | 58 (46.0%) |
| 5 or more Children | 0 (0.0%) | 0 (0.0%) |
| Total | 116 (1.6%) | 155 (7.3%) |
Race in Catonsville
The most populous races in Catonsville are White / Caucasian (27,550 | 64.4%), Black / African American (8,075 | 18.9%), and Asian (3,660 | 8.6%).
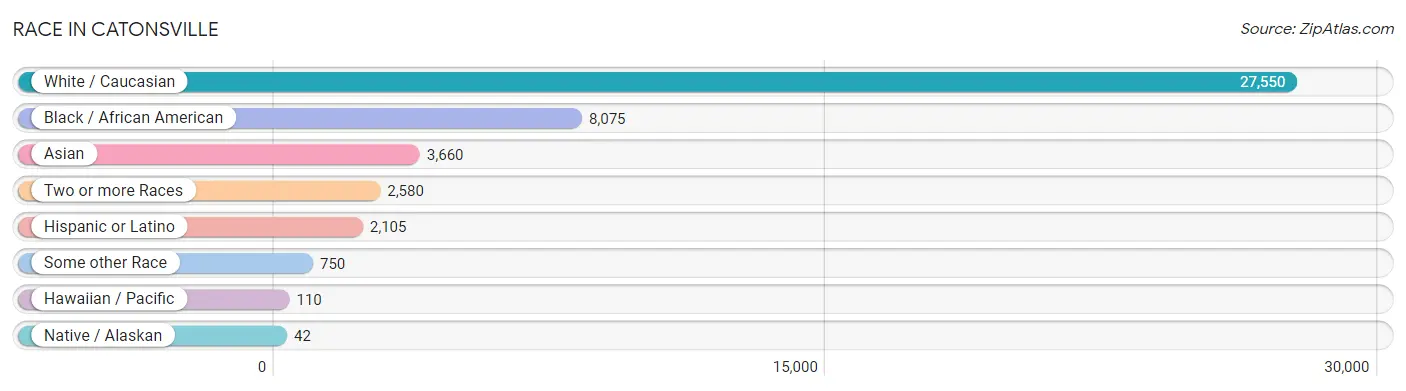
| Race | # Population | % Population |
| Asian | 3,660 | 8.6% |
| Black / African American | 8,075 | 18.9% |
| Hawaiian / Pacific | 110 | 0.3% |
| Hispanic or Latino | 2,105 | 4.9% |
| Native / Alaskan | 42 | 0.1% |
| White / Caucasian | 27,550 | 64.4% |
| Two or more Races | 2,580 | 6.0% |
| Some other Race | 750 | 1.8% |
| Total | 42,767 | 100.0% |
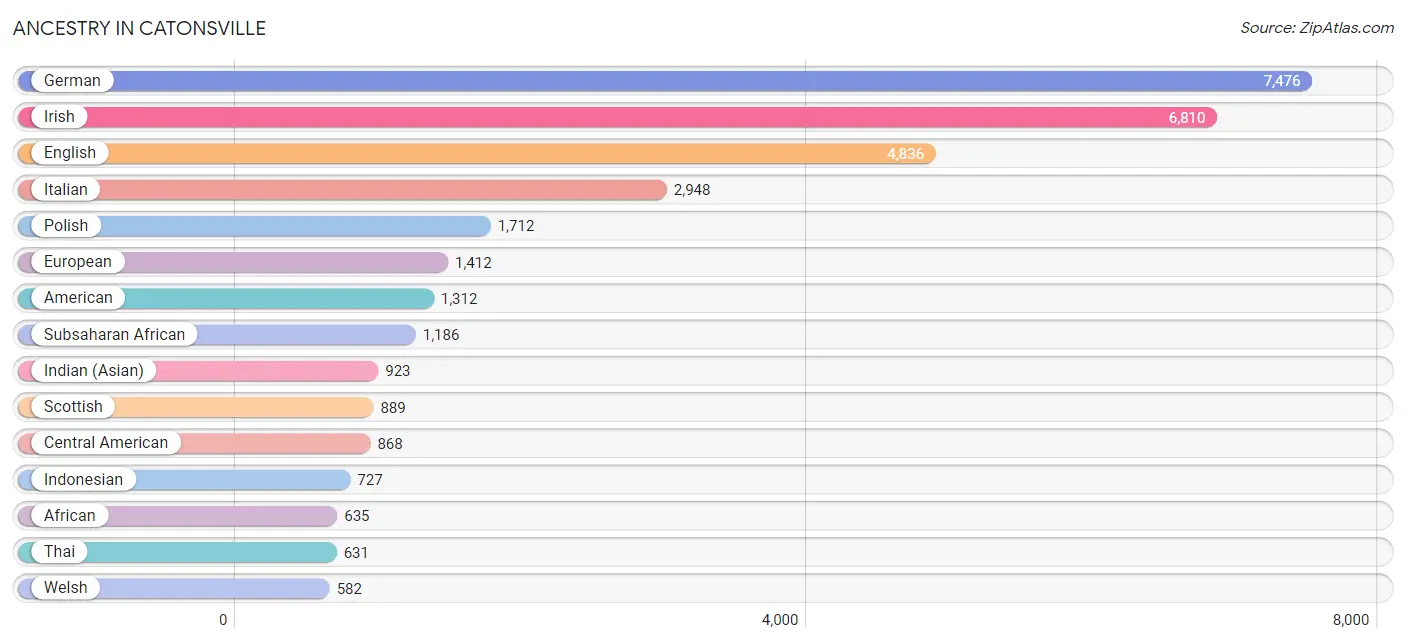
Ancestry in Catonsville
The most populous ancestries reported in Catonsville are German (7,476 | 17.5%), Irish (6,810 | 15.9%), English (4,836 | 11.3%), Italian (2,948 | 6.9%), and Polish (1,712 | 4.0%), together accounting for 55.6% of all Catonsville residents.
| Ancestry | # Population | % Population |
| Afghan | 278 | 0.6% |
| African | 635 | 1.5% |
| Albanian | 152 | 0.4% |
| American | 1,312 | 3.1% |
| Apache | 32 | 0.1% |
| Arab | 205 | 0.5% |
| Argentinean | 9 | 0.0% |
| Armenian | 42 | 0.1% |
| Austrian | 262 | 0.6% |
| Belgian | 30 | 0.1% |
| Bhutanese | 227 | 0.5% |
| Bolivian | 4 | 0.0% |
| Brazilian | 54 | 0.1% |
| British | 240 | 0.6% |
| British West Indian | 11 | 0.0% |
| Burmese | 282 | 0.7% |
| Cajun | 23 | 0.1% |
| Canadian | 72 | 0.2% |
| Carpatho Rusyn | 6 | 0.0% |
| Central American | 868 | 2.0% |
| Cherokee | 35 | 0.1% |
| Chinese | 13 | 0.0% |
| Colombian | 50 | 0.1% |
| Costa Rican | 32 | 0.1% |
| Croatian | 6 | 0.0% |
| Cuban | 36 | 0.1% |
| Czech | 191 | 0.4% |
| Czechoslovakian | 33 | 0.1% |
| Danish | 51 | 0.1% |
| Dominican | 85 | 0.2% |
| Dutch | 353 | 0.8% |
| Eastern European | 120 | 0.3% |
| Ecuadorian | 81 | 0.2% |
| Egyptian | 83 | 0.2% |
| English | 4,836 | 11.3% |
| Ethiopian | 192 | 0.4% |
| European | 1,412 | 3.3% |
| Filipino | 12 | 0.0% |
| Finnish | 66 | 0.2% |
| French | 503 | 1.2% |
| French American Indian | 5 | 0.0% |
| French Canadian | 114 | 0.3% |
| German | 7,476 | 17.5% |
| Ghanaian | 70 | 0.2% |
| Greek | 189 | 0.4% |
| Guamanian / Chamorro | 77 | 0.2% |
| Guatemalan | 57 | 0.1% |
| Haitian | 44 | 0.1% |
| Honduran | 124 | 0.3% |
| Hungarian | 36 | 0.1% |
| Icelander | 13 | 0.0% |
| Indian (Asian) | 923 | 2.2% |
| Indonesian | 727 | 1.7% |
| Iranian | 20 | 0.1% |
| Iraqi | 11 | 0.0% |
| Irish | 6,810 | 15.9% |
| Italian | 2,948 | 6.9% |
| Jamaican | 72 | 0.2% |
| Japanese | 70 | 0.2% |
| Jordanian | 16 | 0.0% |
| Korean | 410 | 1.0% |
| Latvian | 12 | 0.0% |
| Lithuanian | 454 | 1.1% |
| Mexican | 321 | 0.7% |
| Mexican American Indian | 17 | 0.0% |
| Moroccan | 32 | 0.1% |
| Native Hawaiian | 63 | 0.2% |
| Navajo | 32 | 0.1% |
| Nicaraguan | 3 | 0.0% |
| Nigerian | 197 | 0.5% |
| Northern European | 36 | 0.1% |
| Norwegian | 330 | 0.8% |
| Pakistani | 43 | 0.1% |
| Panamanian | 78 | 0.2% |
| Paraguayan | 8 | 0.0% |
| Peruvian | 108 | 0.3% |
| Polish | 1,712 | 4.0% |
| Portuguese | 15 | 0.0% |
| Puerto Rican | 206 | 0.5% |
| Romanian | 25 | 0.1% |
| Russian | 543 | 1.3% |
| Salvadoran | 574 | 1.3% |
| Samoan | 7 | 0.0% |
| Scandinavian | 166 | 0.4% |
| Scotch-Irish | 311 | 0.7% |
| Scottish | 889 | 2.1% |
| Serbian | 15 | 0.0% |
| Sierra Leonean | 40 | 0.1% |
| Sioux | 29 | 0.1% |
| Slovak | 78 | 0.2% |
| South American | 400 | 0.9% |
| Spaniard | 30 | 0.1% |
| Spanish | 75 | 0.2% |
| Sri Lankan | 265 | 0.6% |
| Subsaharan African | 1,186 | 2.8% |
| Swedish | 355 | 0.8% |
| Swiss | 193 | 0.4% |
| Syrian | 19 | 0.0% |
| Thai | 631 | 1.5% |
| Trinidadian and Tobagonian | 50 | 0.1% |
| Ugandan | 1 | 0.0% |
| Ukrainian | 342 | 0.8% |
| Venezuelan | 140 | 0.3% |
| Vietnamese | 118 | 0.3% |
| Welsh | 582 | 1.4% |
| West Indian | 70 | 0.2% |
| Yugoslavian | 6 | 0.0% | View All 107 Rows |
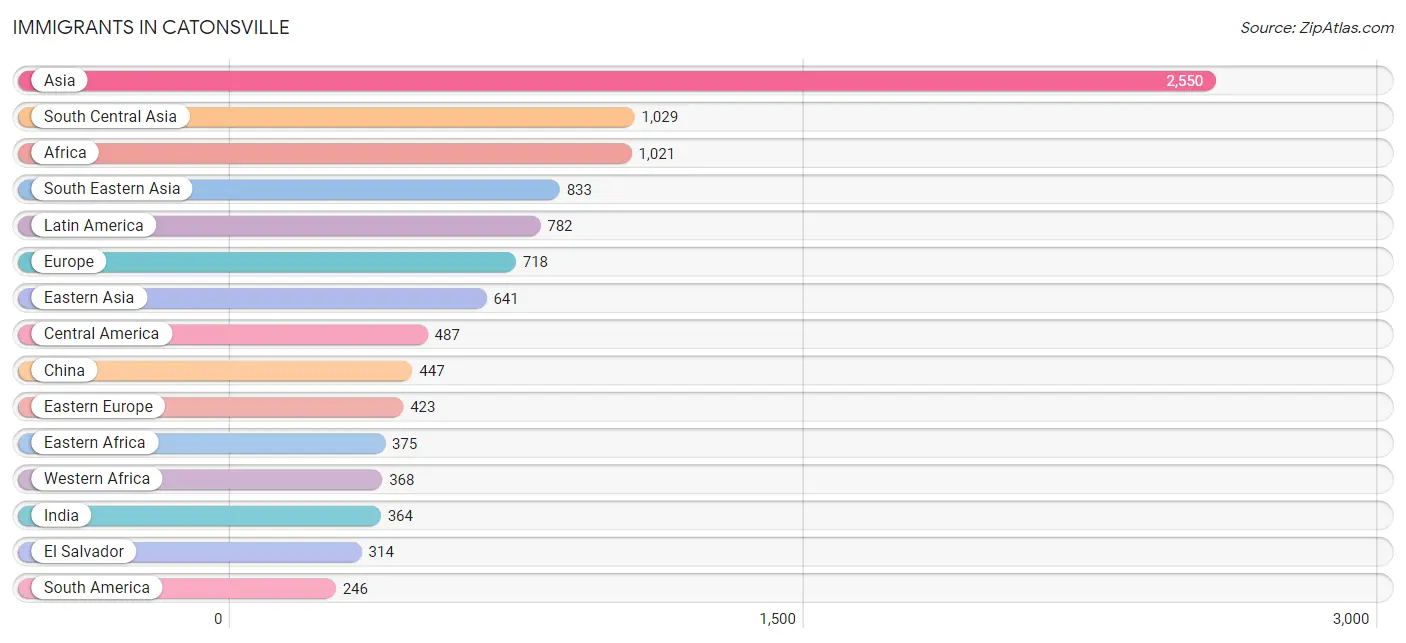
Immigrants in Catonsville
The most numerous immigrant groups reported in Catonsville came from Asia (2,550 | 6.0%), South Central Asia (1,029 | 2.4%), Africa (1,021 | 2.4%), South Eastern Asia (833 | 1.9%), and Latin America (782 | 1.8%), together accounting for 14.5% of all Catonsville residents.
| Immigration Origin | # Population | % Population |
| Afghanistan | 100 | 0.2% |
| Africa | 1,021 | 2.4% |
| Argentina | 6 | 0.0% |
| Asia | 2,550 | 6.0% |
| Bangladesh | 210 | 0.5% |
| Brazil | 34 | 0.1% |
| Cambodia | 35 | 0.1% |
| Cameroon | 80 | 0.2% |
| Canada | 16 | 0.0% |
| Caribbean | 49 | 0.1% |
| Central America | 487 | 1.1% |
| China | 447 | 1.1% |
| Colombia | 26 | 0.1% |
| Costa Rica | 32 | 0.1% |
| Croatia | 6 | 0.0% |
| Cuba | 12 | 0.0% |
| Czechoslovakia | 8 | 0.0% |
| Denmark | 14 | 0.0% |
| Dominica | 5 | 0.0% |
| Eastern Africa | 375 | 0.9% |
| Eastern Asia | 641 | 1.5% |
| Eastern Europe | 423 | 1.0% |
| Ecuador | 21 | 0.1% |
| Egypt | 12 | 0.0% |
| El Salvador | 314 | 0.7% |
| England | 44 | 0.1% |
| Eritrea | 110 | 0.3% |
| Ethiopia | 203 | 0.5% |
| Europe | 718 | 1.7% |
| France | 23 | 0.1% |
| Germany | 84 | 0.2% |
| Ghana | 56 | 0.1% |
| Greece | 36 | 0.1% |
| Guatemala | 57 | 0.1% |
| Honduras | 58 | 0.1% |
| Hong Kong | 6 | 0.0% |
| India | 364 | 0.9% |
| Iran | 10 | 0.0% |
| Ireland | 13 | 0.0% |
| Italy | 22 | 0.1% |
| Jamaica | 26 | 0.1% |
| Japan | 43 | 0.1% |
| Kenya | 7 | 0.0% |
| Korea | 151 | 0.4% |
| Latin America | 782 | 1.8% |
| Lithuania | 9 | 0.0% |
| Malaysia | 31 | 0.1% |
| Mexico | 17 | 0.0% |
| Middle Africa | 193 | 0.4% |
| Morocco | 15 | 0.0% |
| Nepal | 108 | 0.3% |
| Nicaragua | 3 | 0.0% |
| Nigeria | 215 | 0.5% |
| Northern Africa | 40 | 0.1% |
| Northern Europe | 105 | 0.3% |
| Oceania | 5 | 0.0% |
| Pakistan | 224 | 0.5% |
| Panama | 6 | 0.0% |
| Philippines | 72 | 0.2% |
| Poland | 73 | 0.2% |
| Romania | 20 | 0.1% |
| Russia | 125 | 0.3% |
| Saudi Arabia | 12 | 0.0% |
| Sierra Leone | 67 | 0.2% |
| South Africa | 19 | 0.0% |
| South America | 246 | 0.6% |
| South Central Asia | 1,029 | 2.4% |
| South Eastern Asia | 833 | 1.9% |
| Southern Europe | 58 | 0.1% |
| Switzerland | 25 | 0.1% |
| Taiwan | 70 | 0.2% |
| Thailand | 24 | 0.1% |
| Trinidad and Tobago | 6 | 0.0% |
| Uganda | 33 | 0.1% |
| Ukraine | 30 | 0.1% |
| Venezuela | 140 | 0.3% |
| Vietnam | 122 | 0.3% |
| Western Africa | 368 | 0.9% |
| Western Asia | 47 | 0.1% |
| Western Europe | 132 | 0.3% |
| Zaire | 113 | 0.3% | View All 81 Rows |
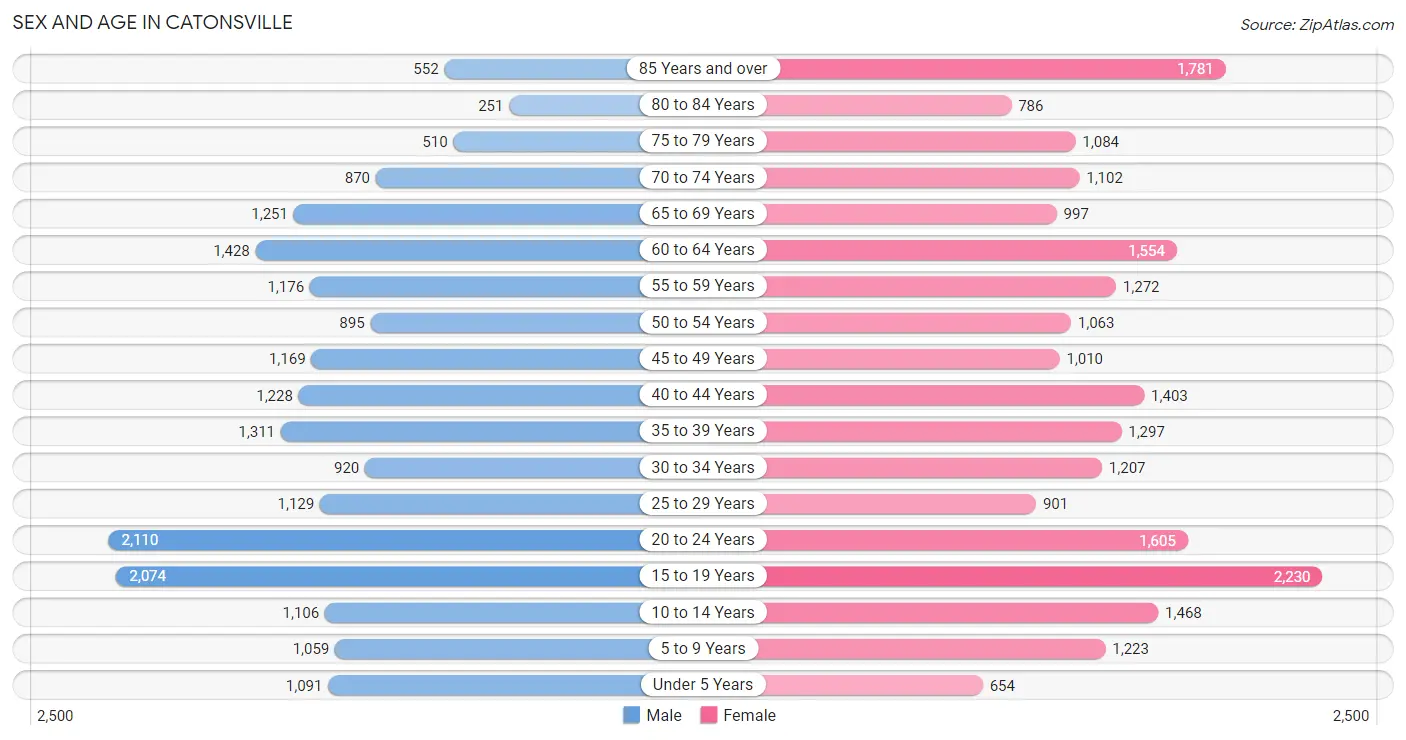
Sex and Age in Catonsville
Sex and Age in Catonsville
The most populous age groups in Catonsville are 20 to 24 Years (2,110 | 10.5%) for men and 15 to 19 Years (2,230 | 9.9%) for women.
| Age Bracket | Male | Female |
| Under 5 Years | 1,091 (5.4%) | 654 (2.9%) |
| 5 to 9 Years | 1,059 (5.3%) | 1,223 (5.4%) |
| 10 to 14 Years | 1,106 (5.5%) | 1,468 (6.5%) |
| 15 to 19 Years | 2,074 (10.3%) | 2,230 (9.9%) |
| 20 to 24 Years | 2,110 (10.5%) | 1,605 (7.1%) |
| 25 to 29 Years | 1,129 (5.6%) | 901 (4.0%) |
| 30 to 34 Years | 920 (4.6%) | 1,207 (5.3%) |
| 35 to 39 Years | 1,311 (6.5%) | 1,297 (5.7%) |
| 40 to 44 Years | 1,228 (6.1%) | 1,403 (6.2%) |
| 45 to 49 Years | 1,169 (5.8%) | 1,010 (4.5%) |
| 50 to 54 Years | 895 (4.4%) | 1,063 (4.7%) |
| 55 to 59 Years | 1,176 (5.8%) | 1,272 (5.6%) |
| 60 to 64 Years | 1,428 (7.1%) | 1,554 (6.9%) |
| 65 to 69 Years | 1,251 (6.2%) | 997 (4.4%) |
| 70 to 74 Years | 870 (4.3%) | 1,102 (4.9%) |
| 75 to 79 Years | 510 (2.5%) | 1,084 (4.8%) |
| 80 to 84 Years | 251 (1.3%) | 786 (3.5%) |
| 85 Years and over | 552 (2.7%) | 1,781 (7.9%) |
| Total | 20,130 (100.0%) | 22,637 (100.0%) |
Families and Households in Catonsville
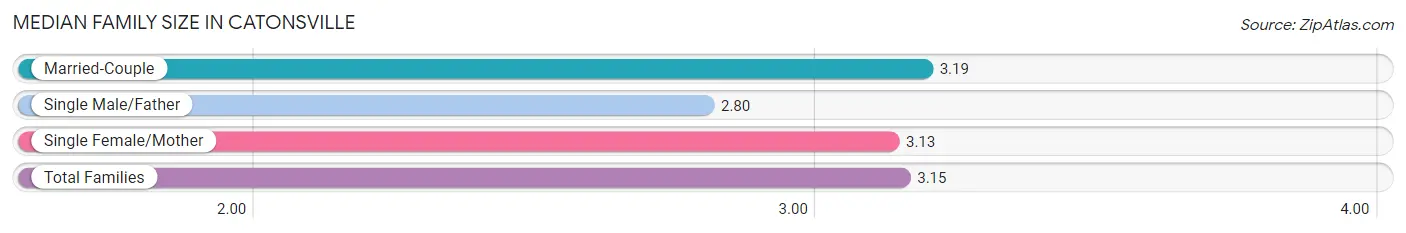
Median Family Size in Catonsville
The median family size in Catonsville is 3.15 persons per family, with married-couple families (7,264 | 77.4%) accounting for the largest median family size of 3.19 persons per family. On the other hand, single male/father families (652 | 7.0%) represent the smallest median family size with 2.80 persons per family.
| Family Type | # Families | Family Size |
| Married-Couple | 7,264 (77.4%) | 3.19 |
| Single Male/Father | 652 (7.0%) | 2.80 |
| Single Female/Mother | 1,470 (15.7%) | 3.13 |
| Total Families | 9,386 (100.0%) | 3.15 |
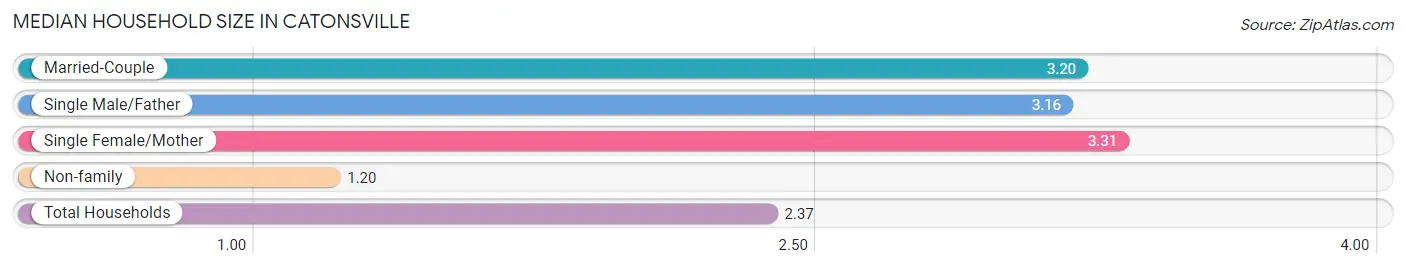
Median Household Size in Catonsville
The median household size in Catonsville is 2.37 persons per household, with single female/mother households (1,470 | 9.1%) accounting for the largest median household size of 3.31 persons per household. non-family households (6,729 | 41.8%) represent the smallest median household size with 1.20 persons per household.
| Household Type | # Households | Household Size |
| Married-Couple | 7,264 (45.1%) | 3.20 |
| Single Male/Father | 652 (4.1%) | 3.16 |
| Single Female/Mother | 1,470 (9.1%) | 3.31 |
| Non-family | 6,729 (41.8%) | 1.20 |
| Total Households | 16,115 (100.0%) | 2.37 |
Household Size by Marriage Status in Catonsville
Out of a total of 16,115 households in Catonsville, 9,386 (58.2%) are family households, while 6,729 (41.8%) are nonfamily households. The most numerous type of family households are 2-person households, comprising 4,255, and the most common type of nonfamily households are 1-person households, comprising 5,785.
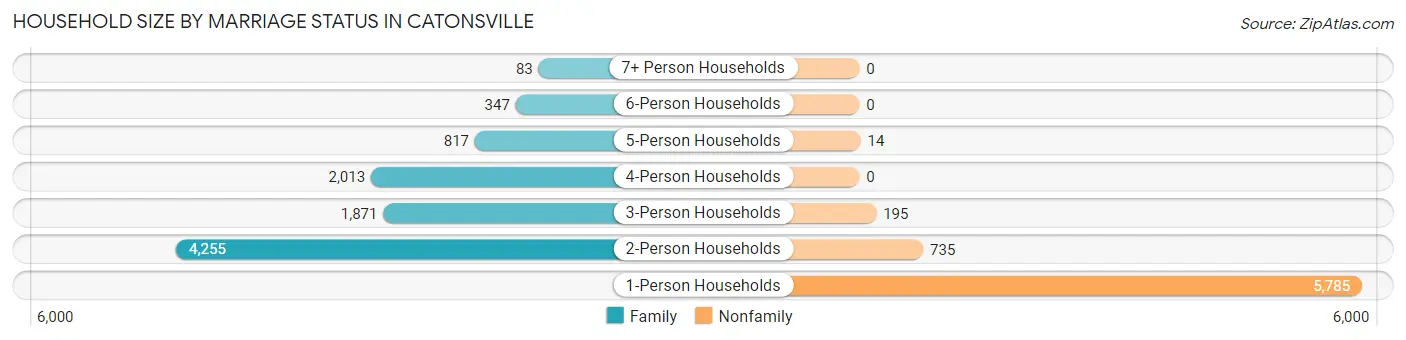
| Household Size | Family Households | Nonfamily Households |
| 1-Person Households | - | 5,785 (35.9%) |
| 2-Person Households | 4,255 (26.4%) | 735 (4.6%) |
| 3-Person Households | 1,871 (11.6%) | 195 (1.2%) |
| 4-Person Households | 2,013 (12.5%) | 0 (0.0%) |
| 5-Person Households | 817 (5.1%) | 14 (0.1%) |
| 6-Person Households | 347 (2.1%) | 0 (0.0%) |
| 7+ Person Households | 83 (0.5%) | 0 (0.0%) |
| Total | 9,386 (58.2%) | 6,729 (41.8%) |
Female Fertility in Catonsville
Fertility by Age in Catonsville
Average fertility rate in Catonsville is 50.0 births per 1,000 women. Women in the age bracket of 20 to 34 years have the highest fertility rate with 71.0 births per 1,000 women. Women in the age bracket of 20 to 34 years acount for 53.5% of all women with births.
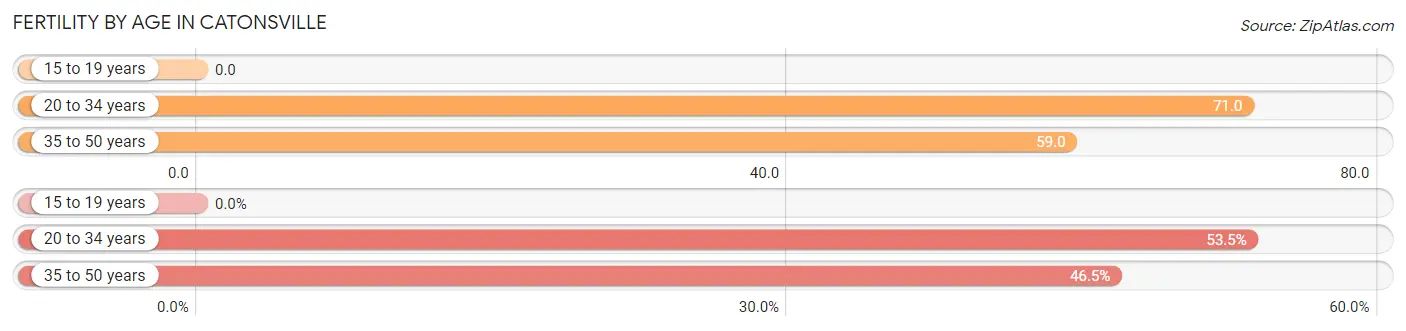
| Age Bracket | Women with Births | Births / 1,000 Women |
| 15 to 19 years | 0 (0.0%) | 0.0 |
| 20 to 34 years | 262 (53.5%) | 71.0 |
| 35 to 50 years | 228 (46.5%) | 59.0 |
| Total | 490 (100.0%) | 50.0 |
Fertility by Age by Marriage Status in Catonsville
65.9% of women with births (490) in Catonsville are married. The highest percentage of unmarried women with births falls into 20 to 34 years age bracket with 38.6% of them unmarried at the time of birth, while the lowest percentage of unmarried women with births belong to 35 to 50 years age bracket with 28.9% of them unmarried.
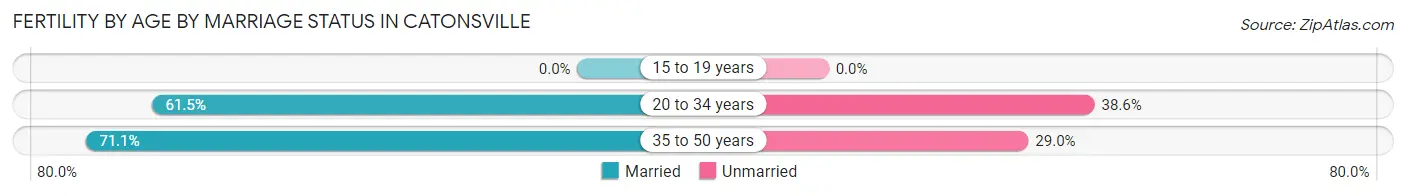
| Age Bracket | Married | Unmarried |
| 15 to 19 years | 0 (0.0%) | 0 (0.0%) |
| 20 to 34 years | 161 (61.5%) | 101 (38.6%) |
| 35 to 50 years | 162 (71.1%) | 66 (28.9%) |
| Total | 323 (65.9%) | 167 (34.1%) |
Fertility by Education in Catonsville
Average fertility rate in Catonsville is 50.0 births per 1,000 women. Women with the education attainment of graduate degree have the highest fertility rate of 87.0 births per 1,000 women, while women with the education attainment of college or associate's degree have the lowest fertility at 15.0 births per 1,000 women. Women with the education attainment of bachelor's degree represent 32.7% of all women with births.
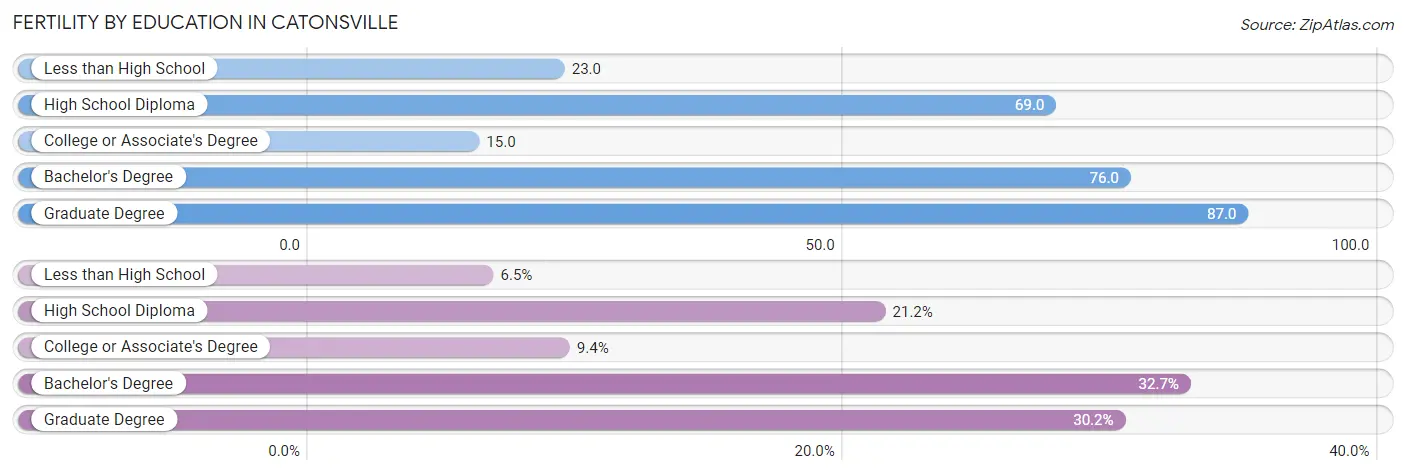
| Educational Attainment | Women with Births | Births / 1,000 Women |
| Less than High School | 32 (6.5%) | 23.0 |
| High School Diploma | 104 (21.2%) | 69.0 |
| College or Associate's Degree | 46 (9.4%) | 15.0 |
| Bachelor's Degree | 160 (32.7%) | 76.0 |
| Graduate Degree | 148 (30.2%) | 87.0 |
| Total | 490 (100.0%) | 50.0 |
Fertility by Education by Marriage Status in Catonsville
34.1% of women with births in Catonsville are unmarried. Women with the educational attainment of graduate degree are most likely to be married with 100.0% of them married at childbirth, while women with the educational attainment of high school diploma are least likely to be married with 80.8% of them unmarried at childbirth.
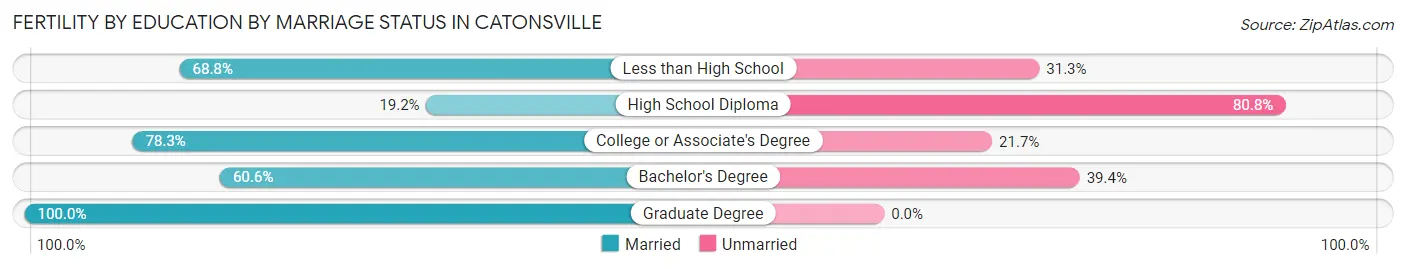
| Educational Attainment | Married | Unmarried |
| Less than High School | 22 (68.8%) | 10 (31.2%) |
| High School Diploma | 20 (19.2%) | 84 (80.8%) |
| College or Associate's Degree | 36 (78.3%) | 10 (21.7%) |
| Bachelor's Degree | 97 (60.6%) | 63 (39.4%) |
| Graduate Degree | 148 (100.0%) | 0 (0.0%) |
| Total | 323 (65.9%) | 167 (34.1%) |
Employment Characteristics in Catonsville
Employment by Class of Employer in Catonsville
Among the 20,719 employed individuals in Catonsville, private company employees (11,526 | 55.6%), not-for-profit organizations (2,789 | 13.5%), and state government employees (1,808 | 8.7%) make up the most common classes of employment.
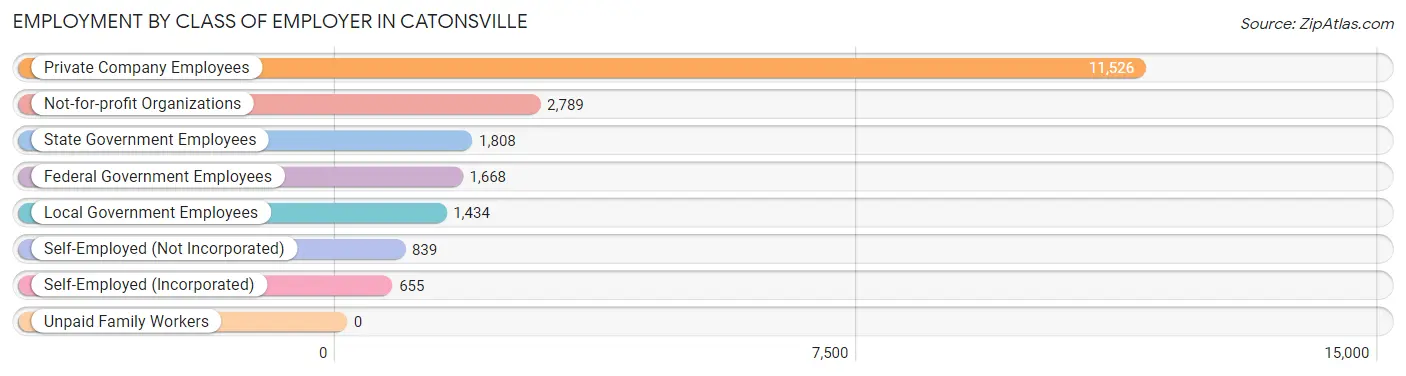
| Employer Class | # Employees | % Employees |
| Private Company Employees | 11,526 | 55.6% |
| Self-Employed (Incorporated) | 655 | 3.2% |
| Self-Employed (Not Incorporated) | 839 | 4.1% |
| Not-for-profit Organizations | 2,789 | 13.5% |
| Local Government Employees | 1,434 | 6.9% |
| State Government Employees | 1,808 | 8.7% |
| Federal Government Employees | 1,668 | 8.1% |
| Unpaid Family Workers | 0 | 0.0% |
| Total | 20,719 | 100.0% |
Employment Status by Age in Catonsville
According to the labor force statistics for Catonsville, out of the total population over 16 years of age (35,503), 61.8% or 21,941 individuals are in the labor force, with 3.7% or 812 of them unemployed. The age group with the highest labor force participation rate is 45 to 54 years, with 90.6% or 3,748 individuals in the labor force. Within the labor force, the 16 to 19 years age range has the highest percentage of unemployed individuals, with 8.5% or 115 of them being unemployed.
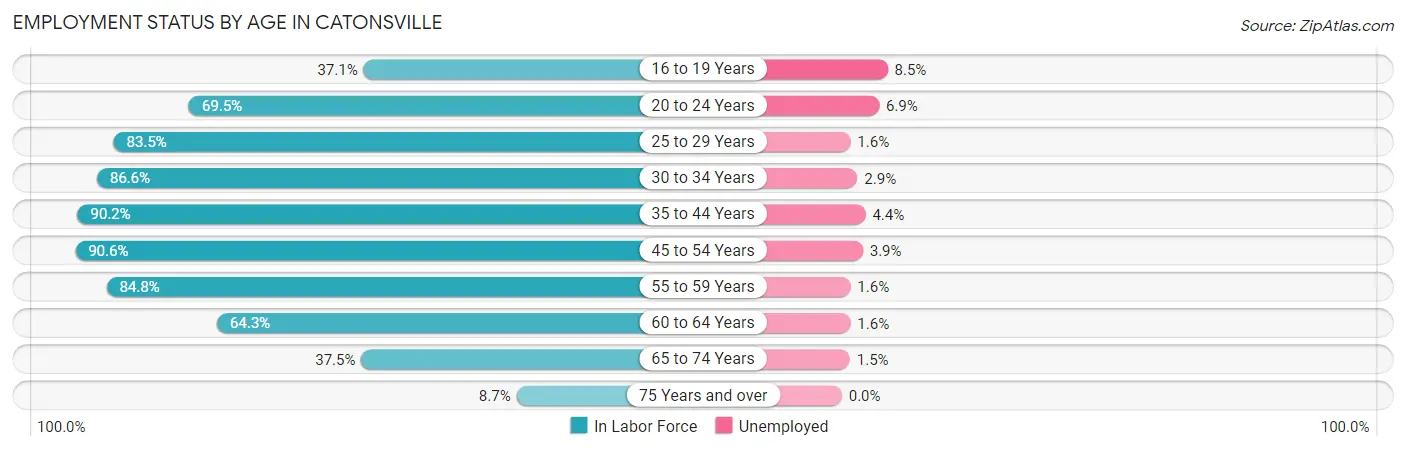
| Age Bracket | In Labor Force | Unemployed |
| 16 to 19 Years | 1,351 (37.1%) | 115 (8.5%) |
| 20 to 24 Years | 2,582 (69.5%) | 178 (6.9%) |
| 25 to 29 Years | 1,695 (83.5%) | 27 (1.6%) |
| 30 to 34 Years | 1,842 (86.6%) | 53 (2.9%) |
| 35 to 44 Years | 4,726 (90.2%) | 208 (4.4%) |
| 45 to 54 Years | 3,748 (90.6%) | 146 (3.9%) |
| 55 to 59 Years | 2,076 (84.8%) | 33 (1.6%) |
| 60 to 64 Years | 1,917 (64.3%) | 31 (1.6%) |
| 65 to 74 Years | 1,582 (37.5%) | 24 (1.5%) |
| 75 Years and over | 432 (8.7%) | 0 (0.0%) |
| Total | 21,941 (61.8%) | 812 (3.7%) |
Employment Status by Educational Attainment in Catonsville
According to labor force statistics for Catonsville, 84.4% of individuals (16,005) out of the total population between 25 and 64 years of age (18,963) are in the labor force, with 3.1% or 496 of them being unemployed. The group with the highest labor force participation rate are those with the educational attainment of bachelor's degree or higher, with 91.2% or 9,695 individuals in the labor force. Within the labor force, individuals with high school diploma education have the highest percentage of unemployment, with 4.9% or 100 of them being unemployed.
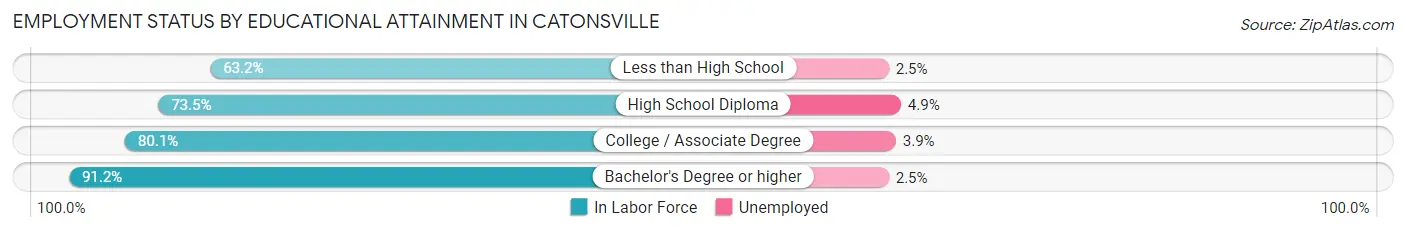
| Educational Attainment | In Labor Force | Unemployed |
| Less than High School | 688 (63.2%) | 27 (2.5%) |
| High School Diploma | 2,044 (73.5%) | 136 (4.9%) |
| College / Associate Degree | 3,575 (80.1%) | 174 (3.9%) |
| Bachelor's Degree or higher | 9,695 (91.2%) | 266 (2.5%) |
| Total | 16,005 (84.4%) | 588 (3.1%) |
Employment Occupations by Sex in Catonsville
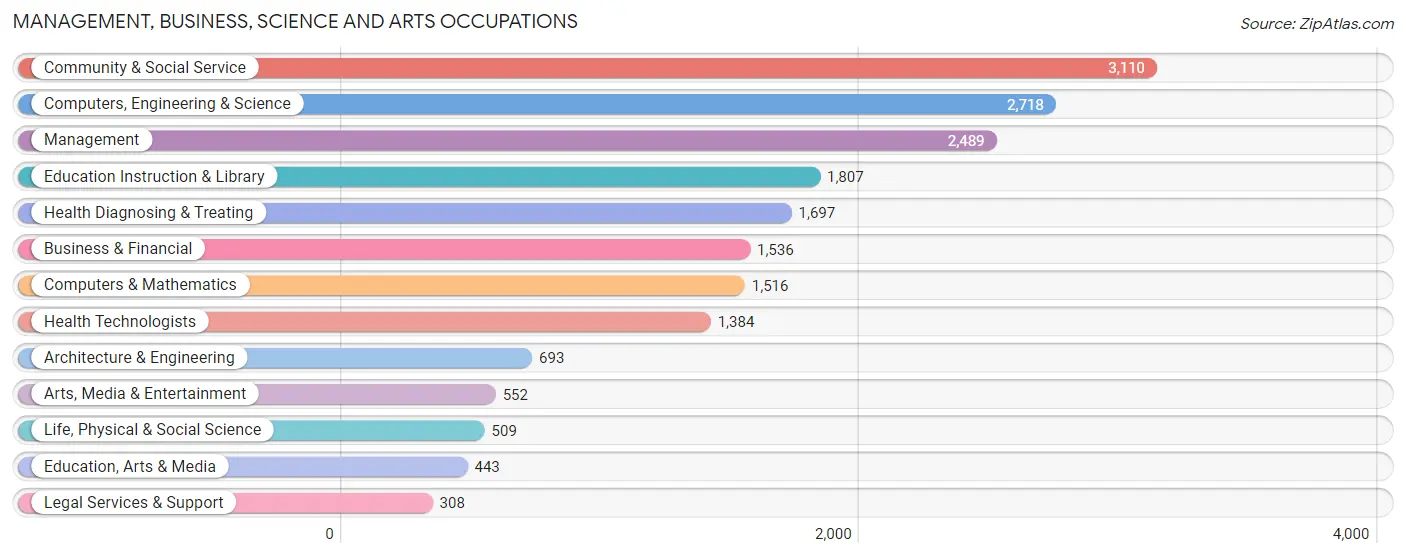
Management, Business, Science and Arts Occupations
The most common Management, Business, Science and Arts occupations in Catonsville are Community & Social Service (3,110 | 14.8%), Computers, Engineering & Science (2,718 | 12.9%), Management (2,489 | 11.8%), Education Instruction & Library (1,807 | 8.6%), and Health Diagnosing & Treating (1,697 | 8.1%).
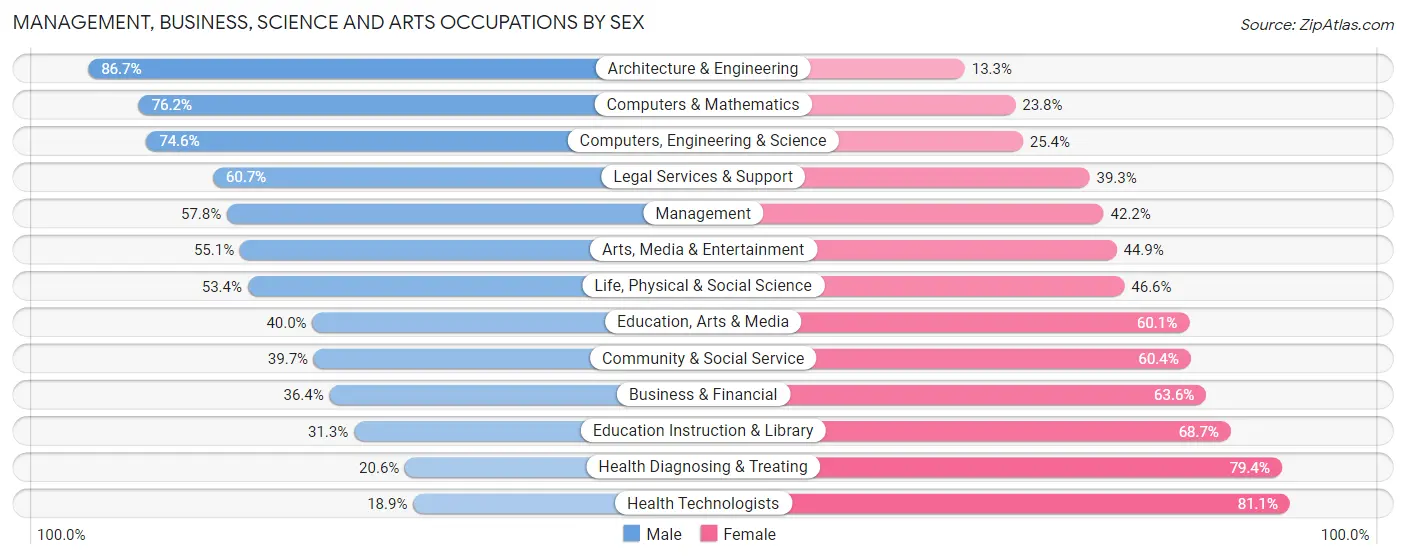
Management, Business, Science and Arts Occupations by Sex
Within the Management, Business, Science and Arts occupations in Catonsville, the most male-oriented occupations are Architecture & Engineering (86.7%), Computers & Mathematics (76.2%), and Computers, Engineering & Science (74.6%), while the most female-oriented occupations are Health Technologists (81.1%), Health Diagnosing & Treating (79.4%), and Education Instruction & Library (68.7%).
| Occupation | Male | Female |
| Management | 1,438 (57.8%) | 1,051 (42.2%) |
| Business & Financial | 559 (36.4%) | 977 (63.6%) |
| Computers, Engineering & Science | 2,028 (74.6%) | 690 (25.4%) |
| Computers & Mathematics | 1,155 (76.2%) | 361 (23.8%) |
| Architecture & Engineering | 601 (86.7%) | 92 (13.3%) |
| Life, Physical & Social Science | 272 (53.4%) | 237 (46.6%) |
| Community & Social Service | 1,233 (39.7%) | 1,877 (60.4%) |
| Education, Arts & Media | 177 (40.0%) | 266 (60.1%) |
| Legal Services & Support | 187 (60.7%) | 121 (39.3%) |
| Education Instruction & Library | 565 (31.3%) | 1,242 (68.7%) |
| Arts, Media & Entertainment | 304 (55.1%) | 248 (44.9%) |
| Health Diagnosing & Treating | 350 (20.6%) | 1,347 (79.4%) |
| Health Technologists | 262 (18.9%) | 1,122 (81.1%) |
| Total (Category) | 5,608 (48.5%) | 5,942 (51.4%) |
| Total (Overall) | 10,702 (50.9%) | 10,341 (49.1%) |
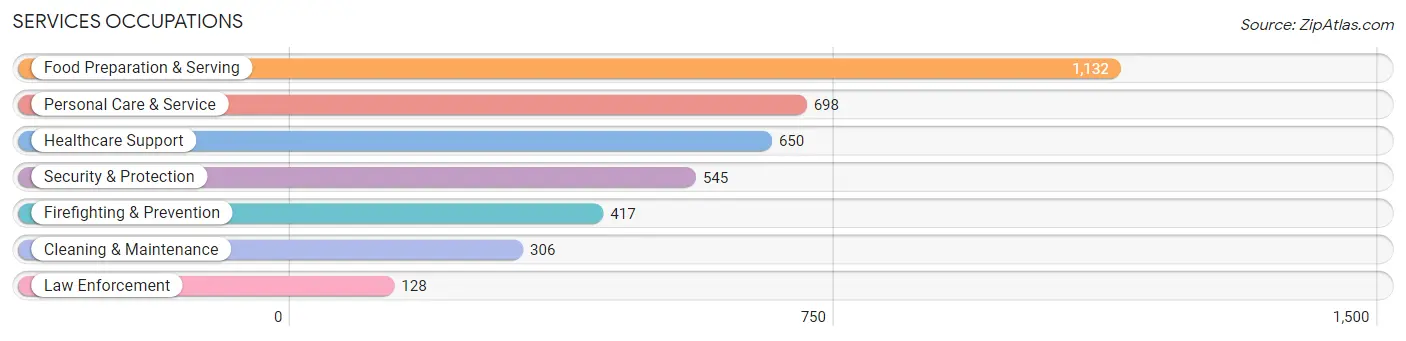
Services Occupations
The most common Services occupations in Catonsville are Food Preparation & Serving (1,132 | 5.4%), Personal Care & Service (698 | 3.3%), Healthcare Support (650 | 3.1%), Security & Protection (545 | 2.6%), and Firefighting & Prevention (417 | 2.0%).
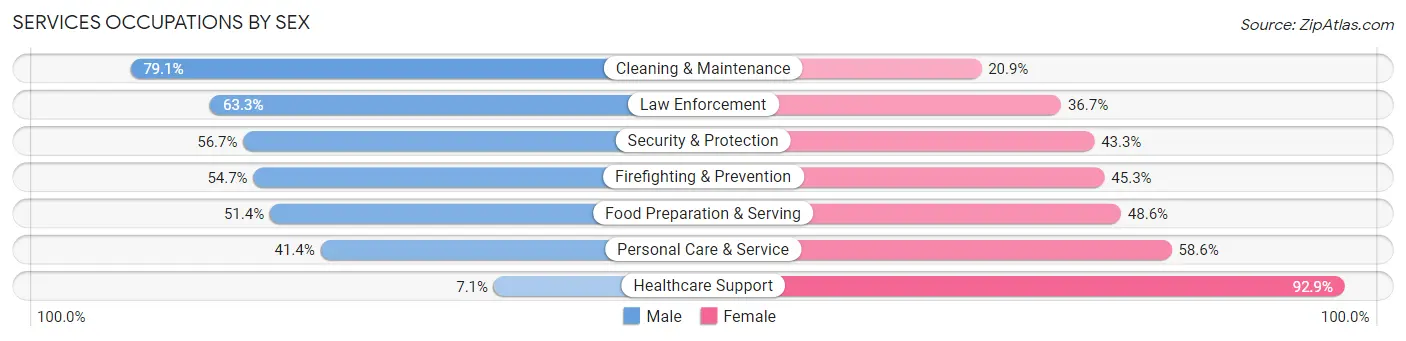
Services Occupations by Sex
Within the Services occupations in Catonsville, the most male-oriented occupations are Cleaning & Maintenance (79.1%), Law Enforcement (63.3%), and Security & Protection (56.7%), while the most female-oriented occupations are Healthcare Support (92.9%), Personal Care & Service (58.6%), and Food Preparation & Serving (48.6%).
| Occupation | Male | Female |
| Healthcare Support | 46 (7.1%) | 604 (92.9%) |
| Security & Protection | 309 (56.7%) | 236 (43.3%) |
| Firefighting & Prevention | 228 (54.7%) | 189 (45.3%) |
| Law Enforcement | 81 (63.3%) | 47 (36.7%) |
| Food Preparation & Serving | 582 (51.4%) | 550 (48.6%) |
| Cleaning & Maintenance | 242 (79.1%) | 64 (20.9%) |
| Personal Care & Service | 289 (41.4%) | 409 (58.6%) |
| Total (Category) | 1,468 (44.1%) | 1,863 (55.9%) |
| Total (Overall) | 10,702 (50.9%) | 10,341 (49.1%) |
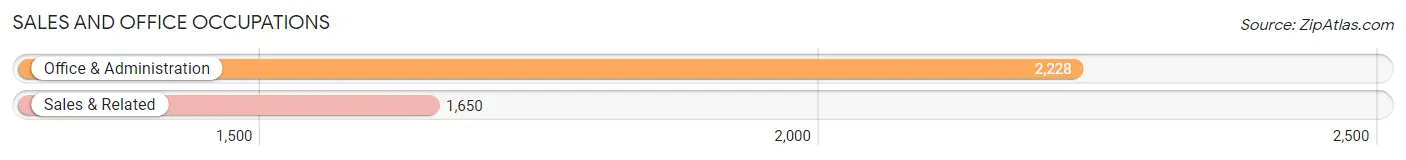
Sales and Office Occupations
The most common Sales and Office occupations in Catonsville are Office & Administration (2,228 | 10.6%), and Sales & Related (1,650 | 7.8%).
Sales and Office Occupations by Sex
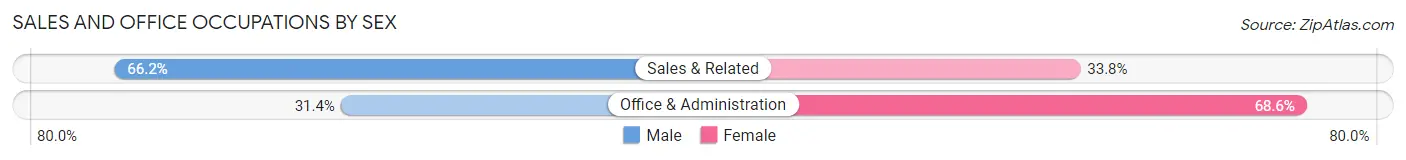
| Occupation | Male | Female |
| Sales & Related | 1,092 (66.2%) | 558 (33.8%) |
| Office & Administration | 699 (31.4%) | 1,529 (68.6%) |
| Total (Category) | 1,791 (46.2%) | 2,087 (53.8%) |
| Total (Overall) | 10,702 (50.9%) | 10,341 (49.1%) |
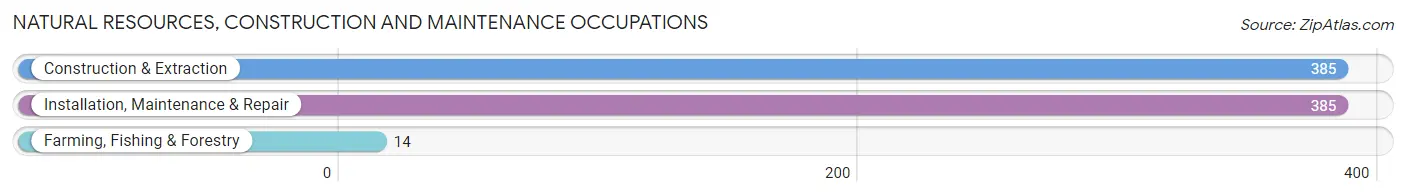
Natural Resources, Construction and Maintenance Occupations
The most common Natural Resources, Construction and Maintenance occupations in Catonsville are Construction & Extraction (385 | 1.8%), Installation, Maintenance & Repair (385 | 1.8%), and Farming, Fishing & Forestry (14 | 0.1%).
Natural Resources, Construction and Maintenance Occupations by Sex
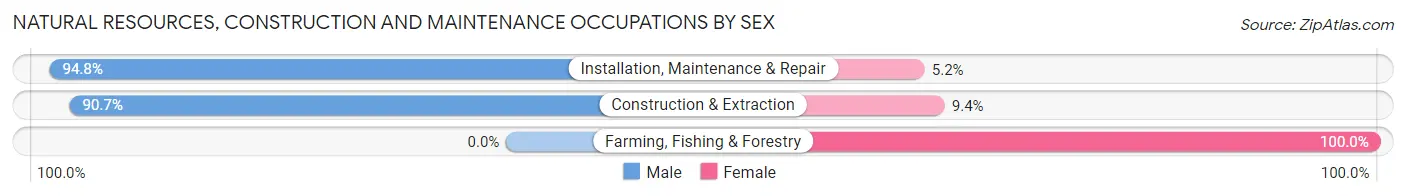
| Occupation | Male | Female |
| Farming, Fishing & Forestry | 0 (0.0%) | 14 (100.0%) |
| Construction & Extraction | 349 (90.6%) | 36 (9.3%) |
| Installation, Maintenance & Repair | 365 (94.8%) | 20 (5.2%) |
| Total (Category) | 714 (91.1%) | 70 (8.9%) |
| Total (Overall) | 10,702 (50.9%) | 10,341 (49.1%) |
Production, Transportation and Moving Occupations
The most common Production, Transportation and Moving occupations in Catonsville are Transportation (603 | 2.9%), Material Moving (469 | 2.2%), and Production (428 | 2.0%).
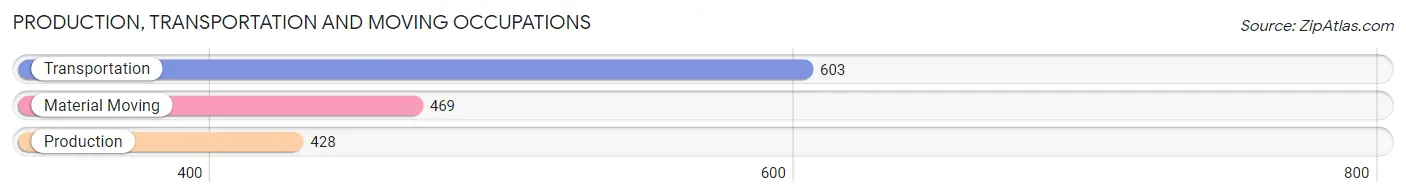
Production, Transportation and Moving Occupations by Sex
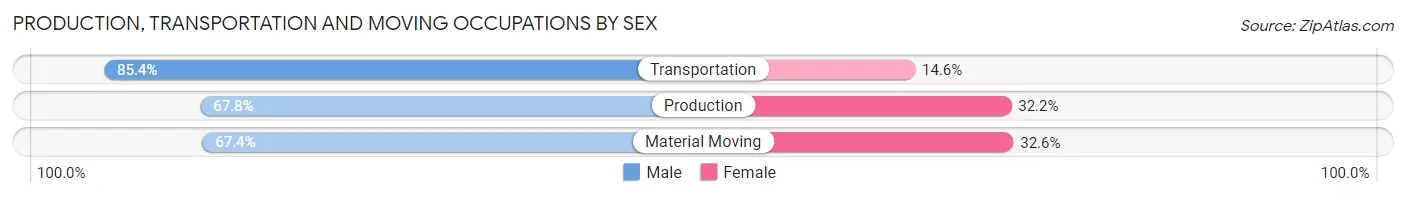
| Occupation | Male | Female |
| Production | 290 (67.8%) | 138 (32.2%) |
| Transportation | 515 (85.4%) | 88 (14.6%) |
| Material Moving | 316 (67.4%) | 153 (32.6%) |
| Total (Category) | 1,121 (74.7%) | 379 (25.3%) |
| Total (Overall) | 10,702 (50.9%) | 10,341 (49.1%) |
Employment Industries by Sex in Catonsville
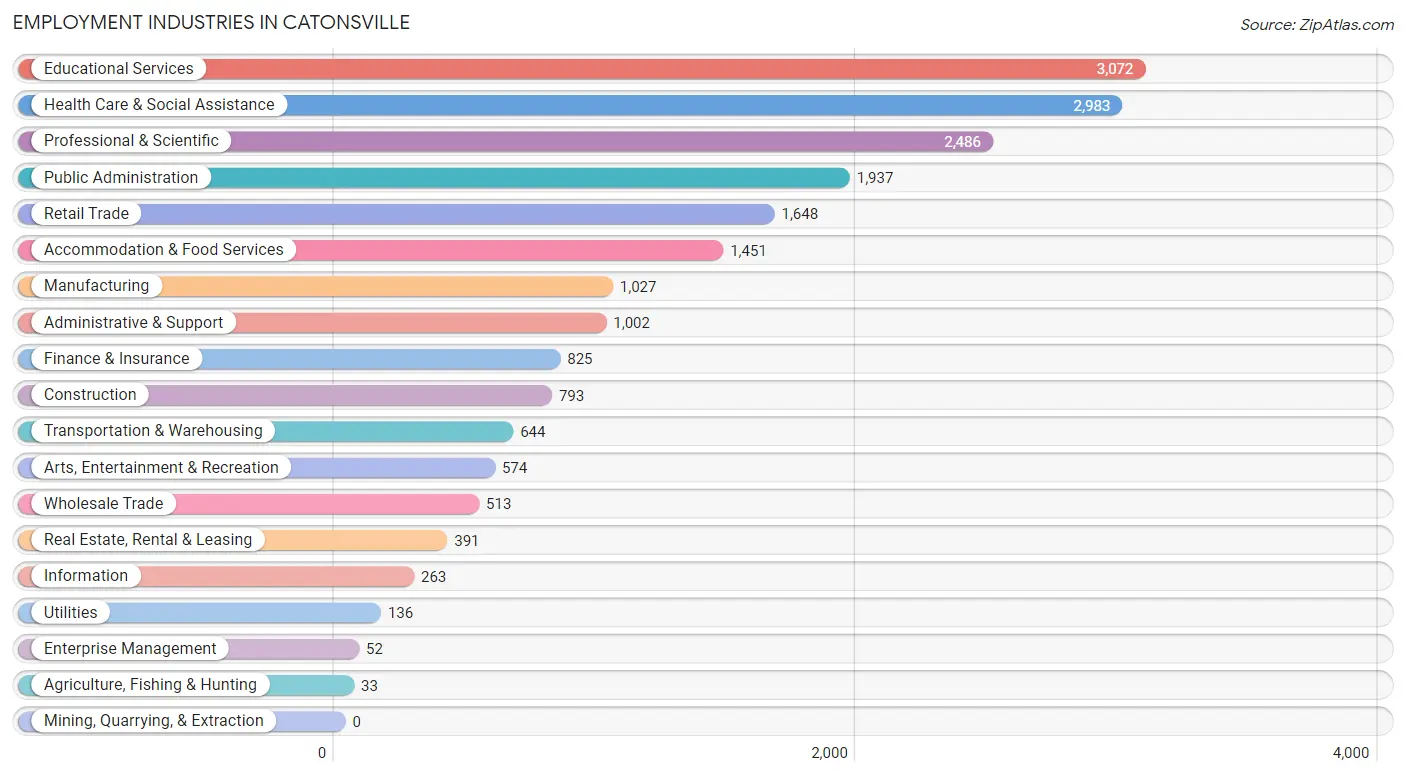
Employment Industries in Catonsville
The major employment industries in Catonsville include Educational Services (3,072 | 14.6%), Health Care & Social Assistance (2,983 | 14.2%), Professional & Scientific (2,486 | 11.8%), Public Administration (1,937 | 9.2%), and Retail Trade (1,648 | 7.8%).
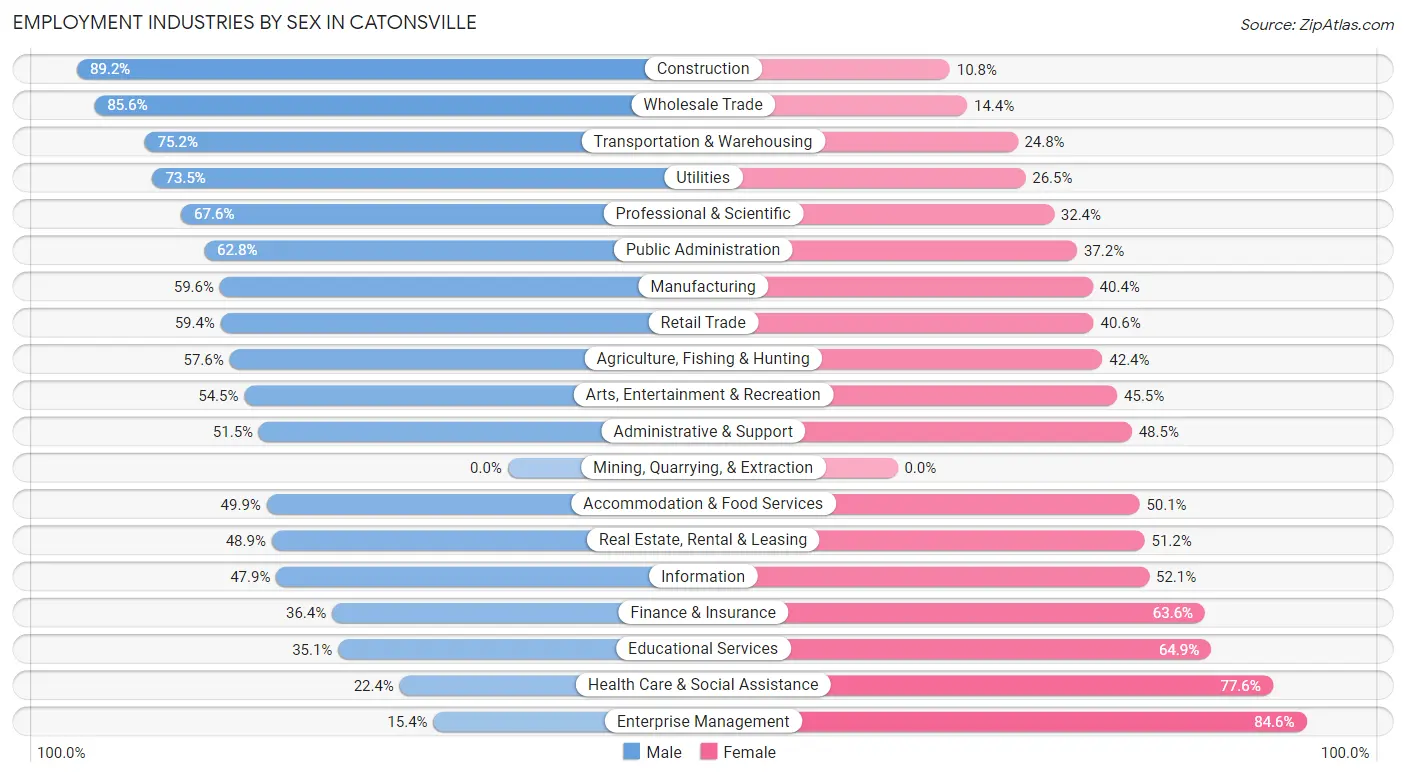
Employment Industries by Sex in Catonsville
The Catonsville industries that see more men than women are Construction (89.2%), Wholesale Trade (85.6%), and Transportation & Warehousing (75.2%), whereas the industries that tend to have a higher number of women are Enterprise Management (84.6%), Health Care & Social Assistance (77.6%), and Educational Services (64.9%).
| Industry | Male | Female |
| Agriculture, Fishing & Hunting | 19 (57.6%) | 14 (42.4%) |
| Mining, Quarrying, & Extraction | 0 (0.0%) | 0 (0.0%) |
| Construction | 707 (89.2%) | 86 (10.8%) |
| Manufacturing | 612 (59.6%) | 415 (40.4%) |
| Wholesale Trade | 439 (85.6%) | 74 (14.4%) |
| Retail Trade | 979 (59.4%) | 669 (40.6%) |
| Transportation & Warehousing | 484 (75.2%) | 160 (24.8%) |
| Utilities | 100 (73.5%) | 36 (26.5%) |
| Information | 126 (47.9%) | 137 (52.1%) |
| Finance & Insurance | 300 (36.4%) | 525 (63.6%) |
| Real Estate, Rental & Leasing | 191 (48.8%) | 200 (51.1%) |
| Professional & Scientific | 1,681 (67.6%) | 805 (32.4%) |
| Enterprise Management | 8 (15.4%) | 44 (84.6%) |
| Administrative & Support | 516 (51.5%) | 486 (48.5%) |
| Educational Services | 1,078 (35.1%) | 1,994 (64.9%) |
| Health Care & Social Assistance | 667 (22.4%) | 2,316 (77.6%) |
| Arts, Entertainment & Recreation | 313 (54.5%) | 261 (45.5%) |
| Accommodation & Food Services | 724 (49.9%) | 727 (50.1%) |
| Public Administration | 1,217 (62.8%) | 720 (37.2%) |
| Total | 10,702 (50.9%) | 10,341 (49.1%) |
Education in Catonsville
School Enrollment in Catonsville
The most common levels of schooling among the 13,295 students in Catonsville are college / undergraduate (5,220 | 39.3%), high school (2,384 | 17.9%), and middle school (2,054 | 15.4%).
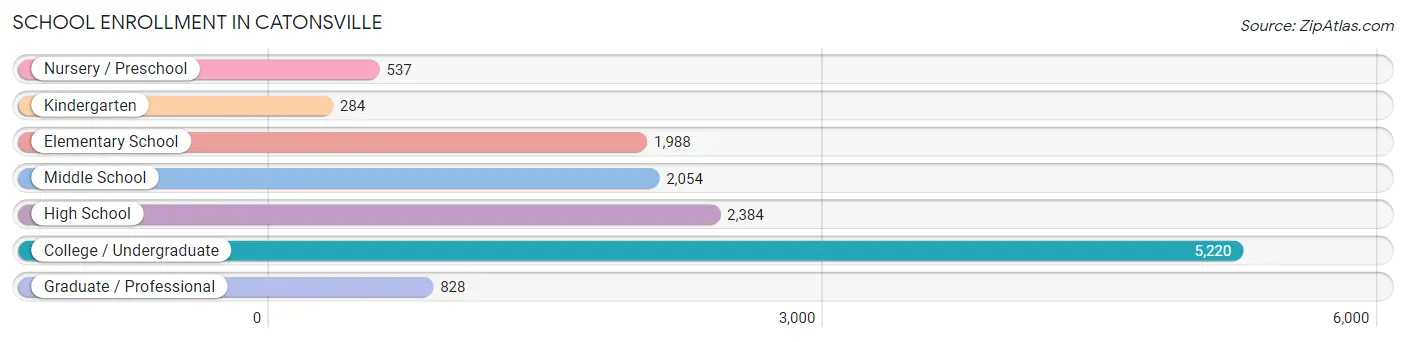
| School Level | # Students | % Students |
| Nursery / Preschool | 537 | 4.0% |
| Kindergarten | 284 | 2.1% |
| Elementary School | 1,988 | 14.9% |
| Middle School | 2,054 | 15.4% |
| High School | 2,384 | 17.9% |
| College / Undergraduate | 5,220 | 39.3% |
| Graduate / Professional | 828 | 6.2% |
| Total | 13,295 | 100.0% |
School Enrollment by Age by Funding Source in Catonsville
Out of a total of 13,295 students who are enrolled in schools in Catonsville, 2,619 (19.7%) attend a private institution, while the remaining 10,676 (80.3%) are enrolled in public schools. The age group of 3 to 4 year olds has the highest likelihood of being enrolled in private schools, with 257 (79.1% in the age bracket) enrolled. Conversely, the age group of 10 to 14 year olds has the lowest likelihood of being enrolled in a private school, with 2,251 (87.5% in the age bracket) attending a public institution.
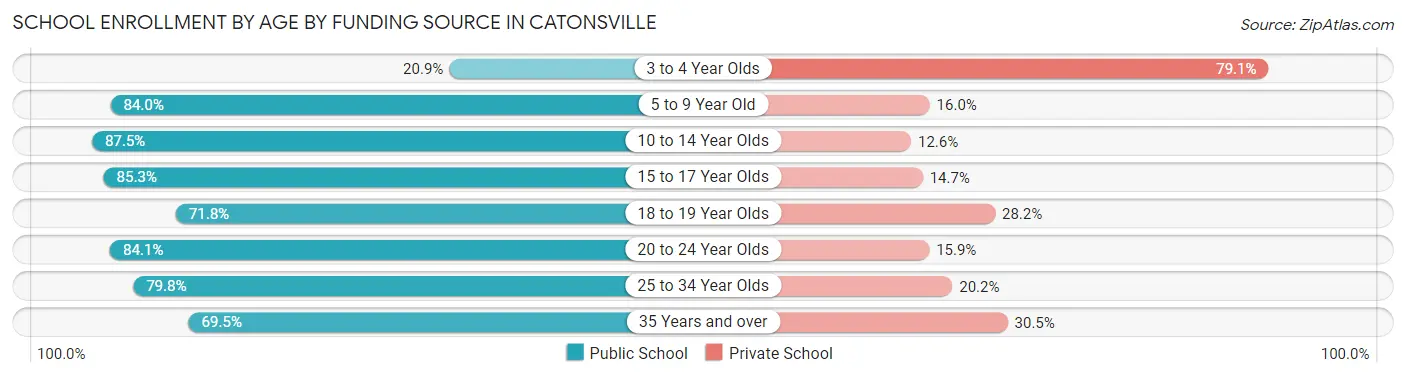
| Age Bracket | Public School | Private School |
| 3 to 4 Year Olds | 68 (20.9%) | 257 (79.1%) |
| 5 to 9 Year Old | 1,903 (84.0%) | 363 (16.0%) |
| 10 to 14 Year Olds | 2,251 (87.5%) | 323 (12.6%) |
| 15 to 17 Year Olds | 1,500 (85.3%) | 259 (14.7%) |
| 18 to 19 Year Olds | 1,600 (71.8%) | 628 (28.2%) |
| 20 to 24 Year Olds | 2,344 (84.1%) | 444 (15.9%) |
| 25 to 34 Year Olds | 540 (79.8%) | 137 (20.2%) |
| 35 Years and over | 471 (69.5%) | 207 (30.5%) |
| Total | 10,676 (80.3%) | 2,619 (19.7%) |
Educational Attainment by Field of Study in Catonsville
Business (2,107 | 13.4%), social sciences (1,787 | 11.4%), education (1,585 | 10.1%), science & technology (1,553 | 9.9%), and engineering (1,136 | 7.2%) are the most common fields of study among 15,699 individuals in Catonsville who have obtained a bachelor's degree or higher.
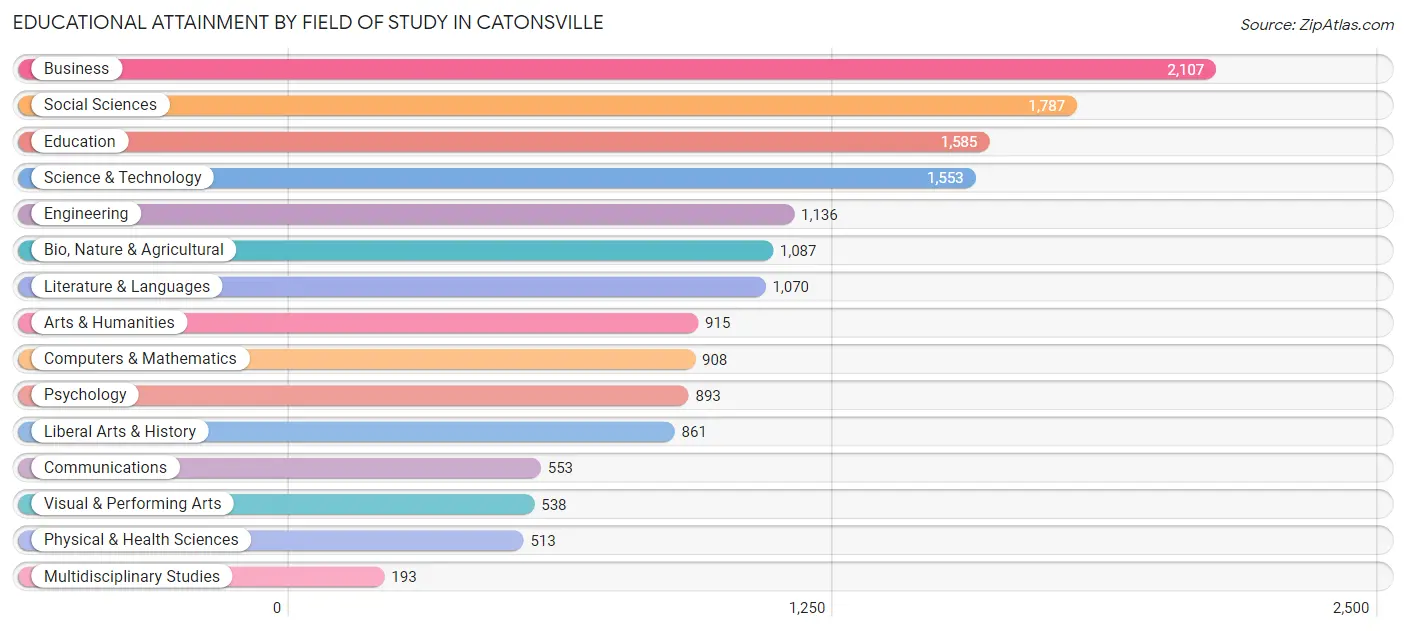
| Field of Study | # Graduates | % Graduates |
| Computers & Mathematics | 908 | 5.8% |
| Bio, Nature & Agricultural | 1,087 | 6.9% |
| Physical & Health Sciences | 513 | 3.3% |
| Psychology | 893 | 5.7% |
| Social Sciences | 1,787 | 11.4% |
| Engineering | 1,136 | 7.2% |
| Multidisciplinary Studies | 193 | 1.2% |
| Science & Technology | 1,553 | 9.9% |
| Business | 2,107 | 13.4% |
| Education | 1,585 | 10.1% |
| Literature & Languages | 1,070 | 6.8% |
| Liberal Arts & History | 861 | 5.5% |
| Visual & Performing Arts | 538 | 3.4% |
| Communications | 553 | 3.5% |
| Arts & Humanities | 915 | 5.8% |
| Total | 15,699 | 100.0% |
Transportation & Commute in Catonsville
Vehicle Availability by Sex in Catonsville
The most prevalent vehicle ownership categories in Catonsville are males with 2 vehicles (4,664, accounting for 45.5%) and females with 2 vehicles (4,244, making up 52.1%).
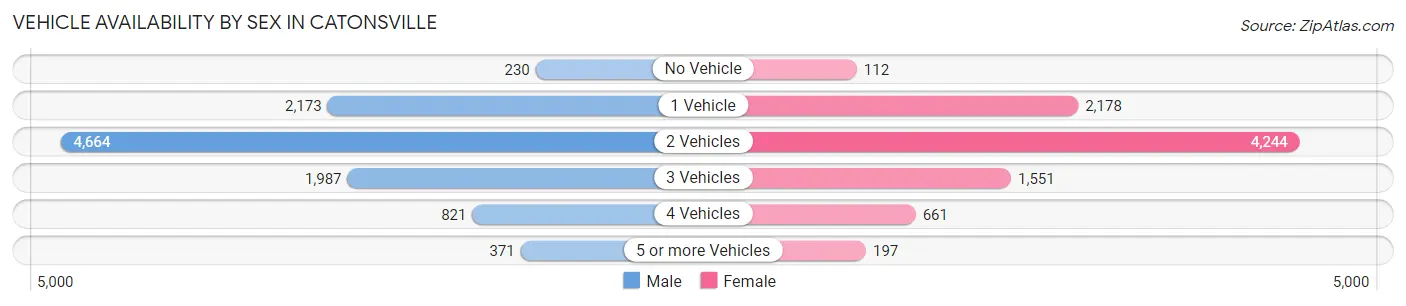
| Vehicles Available | Male | Female |
| No Vehicle | 230 (2.2%) | 112 (1.3%) |
| 1 Vehicle | 2,173 (21.2%) | 2,178 (24.3%) |
| 2 Vehicles | 4,664 (45.5%) | 4,244 (47.5%) |
| 3 Vehicles | 1,987 (19.4%) | 1,551 (17.3%) |
| 4 Vehicles | 821 (8.0%) | 661 (7.4%) |
| 5 or more Vehicles | 371 (3.6%) | 197 (2.2%) |
| Total | 10,246 (100.0%) | 8,943 (100.0%) |
Commute Time in Catonsville
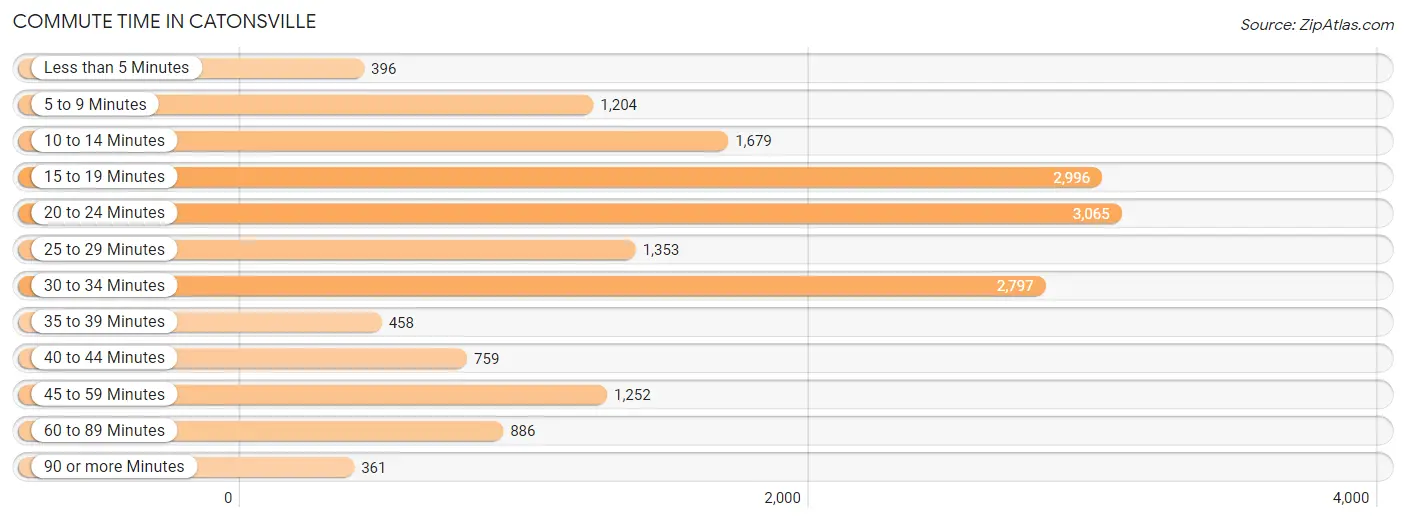
The most frequently occuring commute durations in Catonsville are 20 to 24 minutes (3,065 commuters, 17.8%), 15 to 19 minutes (2,996 commuters, 17.4%), and 30 to 34 minutes (2,797 commuters, 16.3%).
| Commute Time | # Commuters | % Commuters |
| Less than 5 Minutes | 396 | 2.3% |
| 5 to 9 Minutes | 1,204 | 7.0% |
| 10 to 14 Minutes | 1,679 | 9.8% |
| 15 to 19 Minutes | 2,996 | 17.4% |
| 20 to 24 Minutes | 3,065 | 17.8% |
| 25 to 29 Minutes | 1,353 | 7.9% |
| 30 to 34 Minutes | 2,797 | 16.3% |
| 35 to 39 Minutes | 458 | 2.7% |
| 40 to 44 Minutes | 759 | 4.4% |
| 45 to 59 Minutes | 1,252 | 7.3% |
| 60 to 89 Minutes | 886 | 5.1% |
| 90 or more Minutes | 361 | 2.1% |
Commute Time by Sex in Catonsville
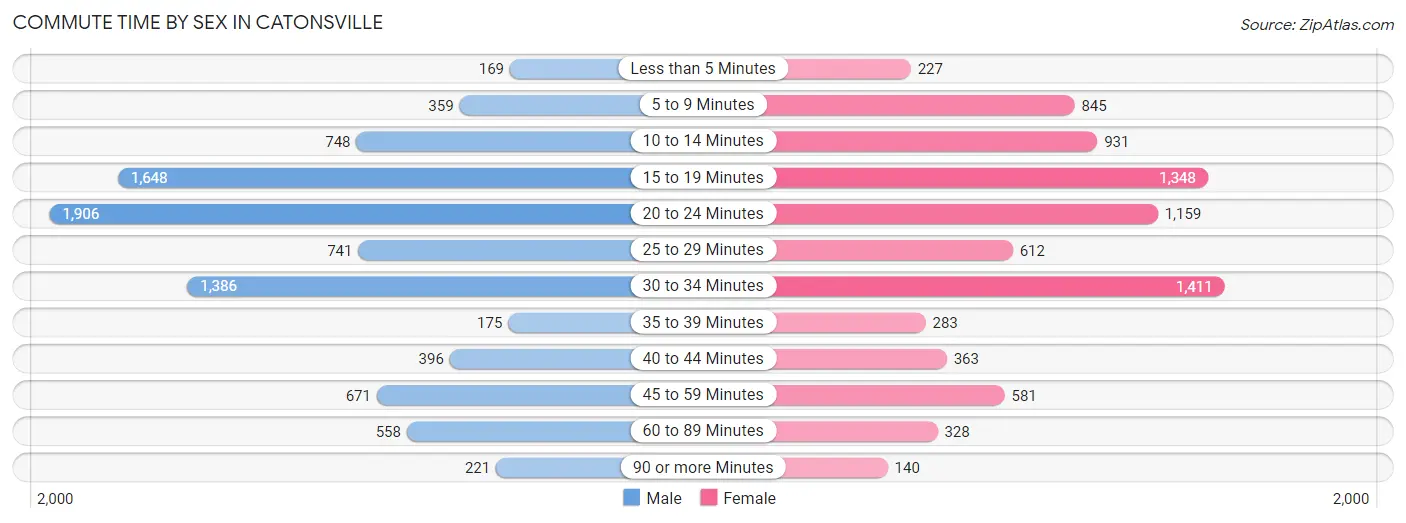
The most common commute times in Catonsville are 20 to 24 minutes (1,906 commuters, 21.2%) for males and 30 to 34 minutes (1,411 commuters, 17.2%) for females.
| Commute Time | Male | Female |
| Less than 5 Minutes | 169 (1.9%) | 227 (2.8%) |
| 5 to 9 Minutes | 359 (4.0%) | 845 (10.3%) |
| 10 to 14 Minutes | 748 (8.3%) | 931 (11.3%) |
| 15 to 19 Minutes | 1,648 (18.4%) | 1,348 (16.4%) |
| 20 to 24 Minutes | 1,906 (21.2%) | 1,159 (14.1%) |
| 25 to 29 Minutes | 741 (8.3%) | 612 (7.4%) |
| 30 to 34 Minutes | 1,386 (15.4%) | 1,411 (17.2%) |
| 35 to 39 Minutes | 175 (1.9%) | 283 (3.4%) |
| 40 to 44 Minutes | 396 (4.4%) | 363 (4.4%) |
| 45 to 59 Minutes | 671 (7.5%) | 581 (7.1%) |
| 60 to 89 Minutes | 558 (6.2%) | 328 (4.0%) |
| 90 or more Minutes | 221 (2.5%) | 140 (1.7%) |
Time of Departure to Work by Sex in Catonsville
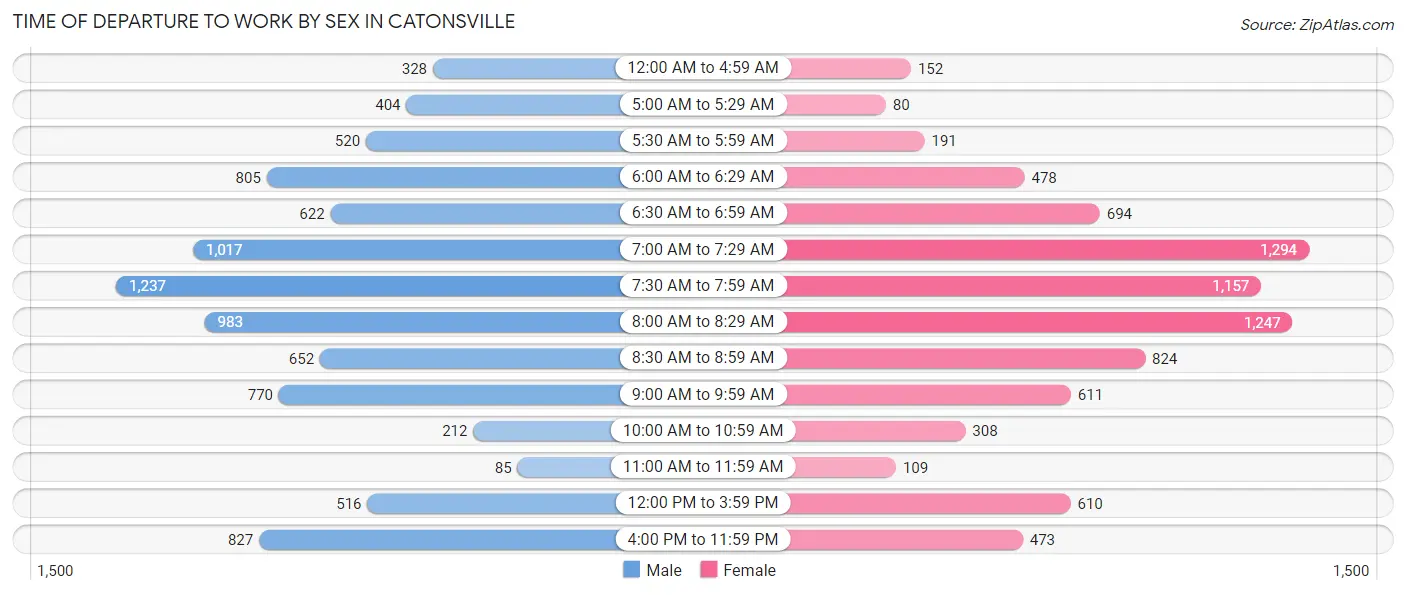
The most frequent times of departure to work in Catonsville are 7:30 AM to 7:59 AM (1,237, 13.8%) for males and 7:00 AM to 7:29 AM (1,294, 15.7%) for females.
| Time of Departure | Male | Female |
| 12:00 AM to 4:59 AM | 328 (3.6%) | 152 (1.8%) |
| 5:00 AM to 5:29 AM | 404 (4.5%) | 80 (1.0%) |
| 5:30 AM to 5:59 AM | 520 (5.8%) | 191 (2.3%) |
| 6:00 AM to 6:29 AM | 805 (9.0%) | 478 (5.8%) |
| 6:30 AM to 6:59 AM | 622 (6.9%) | 694 (8.4%) |
| 7:00 AM to 7:29 AM | 1,017 (11.3%) | 1,294 (15.7%) |
| 7:30 AM to 7:59 AM | 1,237 (13.8%) | 1,157 (14.1%) |
| 8:00 AM to 8:29 AM | 983 (11.0%) | 1,247 (15.2%) |
| 8:30 AM to 8:59 AM | 652 (7.3%) | 824 (10.0%) |
| 9:00 AM to 9:59 AM | 770 (8.6%) | 611 (7.4%) |
| 10:00 AM to 10:59 AM | 212 (2.4%) | 308 (3.7%) |
| 11:00 AM to 11:59 AM | 85 (0.9%) | 109 (1.3%) |
| 12:00 PM to 3:59 PM | 516 (5.8%) | 610 (7.4%) |
| 4:00 PM to 11:59 PM | 827 (9.2%) | 473 (5.8%) |
| Total | 8,978 (100.0%) | 8,228 (100.0%) |
Housing Occupancy in Catonsville
Occupancy by Ownership in Catonsville
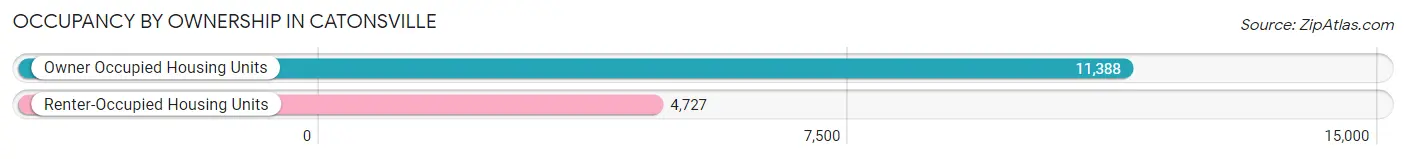
Of the total 16,115 dwellings in Catonsville, owner-occupied units account for 11,388 (70.7%), while renter-occupied units make up 4,727 (29.3%).
| Occupancy | # Housing Units | % Housing Units |
| Owner Occupied Housing Units | 11,388 | 70.7% |
| Renter-Occupied Housing Units | 4,727 | 29.3% |
| Total Occupied Housing Units | 16,115 | 100.0% |
Occupancy by Household Size in Catonsville
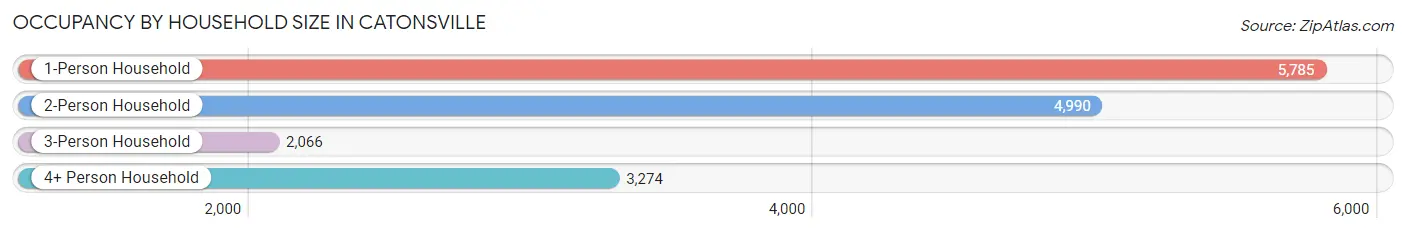
| Household Size | # Housing Units | % Housing Units |
| 1-Person Household | 5,785 | 35.9% |
| 2-Person Household | 4,990 | 31.0% |
| 3-Person Household | 2,066 | 12.8% |
| 4+ Person Household | 3,274 | 20.3% |
| Total Housing Units | 16,115 | 100.0% |
Occupancy by Ownership by Household Size in Catonsville
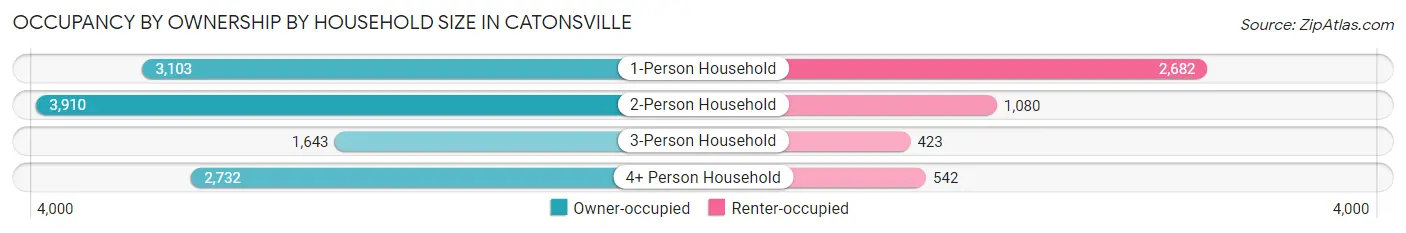
| Household Size | Owner-occupied | Renter-occupied |
| 1-Person Household | 3,103 (53.6%) | 2,682 (46.4%) |
| 2-Person Household | 3,910 (78.4%) | 1,080 (21.6%) |
| 3-Person Household | 1,643 (79.5%) | 423 (20.5%) |
| 4+ Person Household | 2,732 (83.5%) | 542 (16.6%) |
| Total Housing Units | 11,388 (70.7%) | 4,727 (29.3%) |
Occupancy by Educational Attainment in Catonsville
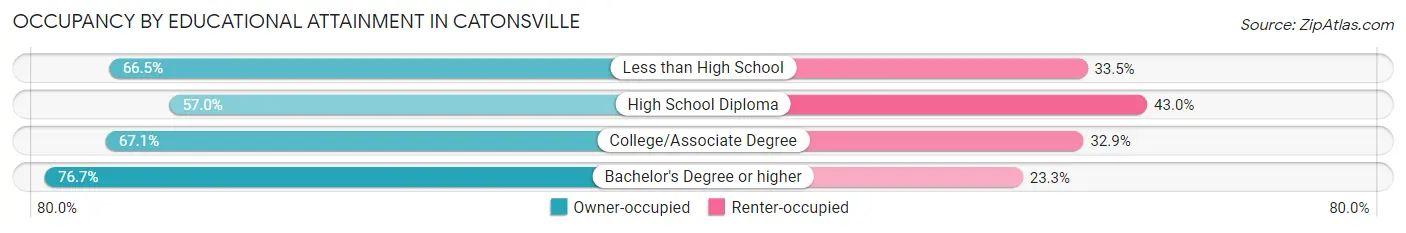
| Household Size | Owner-occupied | Renter-occupied |
| Less than High School | 514 (66.5%) | 259 (33.5%) |
| High School Diploma | 1,479 (57.0%) | 1,115 (43.0%) |
| College/Associate Degree | 2,705 (67.1%) | 1,325 (32.9%) |
| Bachelor's Degree or higher | 6,690 (76.7%) | 2,028 (23.3%) |
Occupancy by Age of Householder in Catonsville
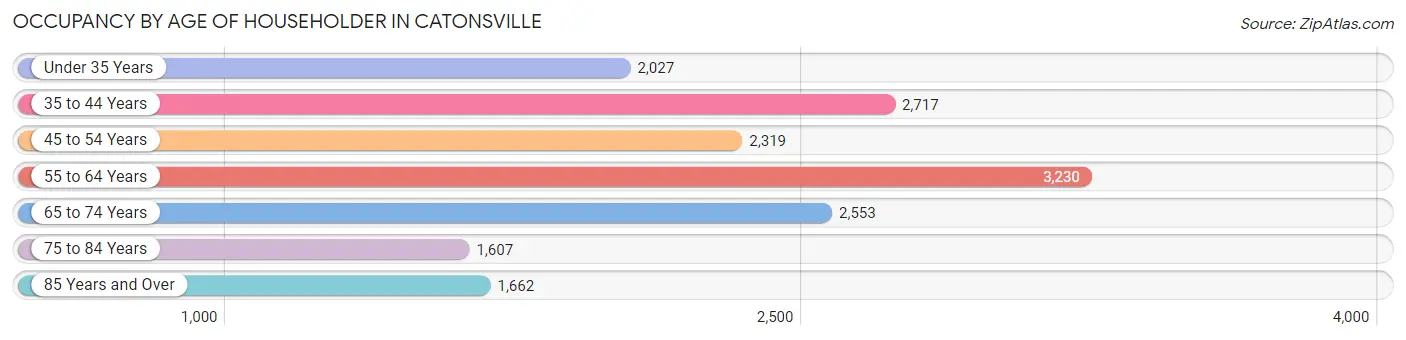
| Age Bracket | # Households | % Households |
| Under 35 Years | 2,027 | 12.6% |
| 35 to 44 Years | 2,717 | 16.9% |
| 45 to 54 Years | 2,319 | 14.4% |
| 55 to 64 Years | 3,230 | 20.0% |
| 65 to 74 Years | 2,553 | 15.8% |
| 75 to 84 Years | 1,607 | 10.0% |
| 85 Years and Over | 1,662 | 10.3% |
| Total | 16,115 | 100.0% |
Housing Finances in Catonsville
Median Income by Occupancy in Catonsville
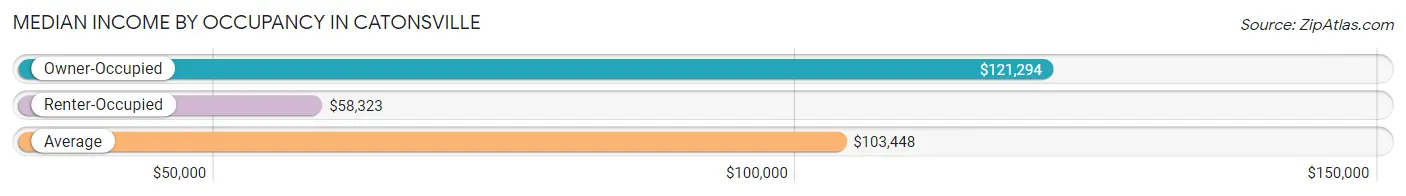
| Occupancy Type | # Households | Median Income |
| Owner-Occupied | 11,388 (70.7%) | $121,294 |
| Renter-Occupied | 4,727 (29.3%) | $58,323 |
| Average | 16,115 (100.0%) | $103,448 |
Occupancy by Householder Income Bracket in Catonsville
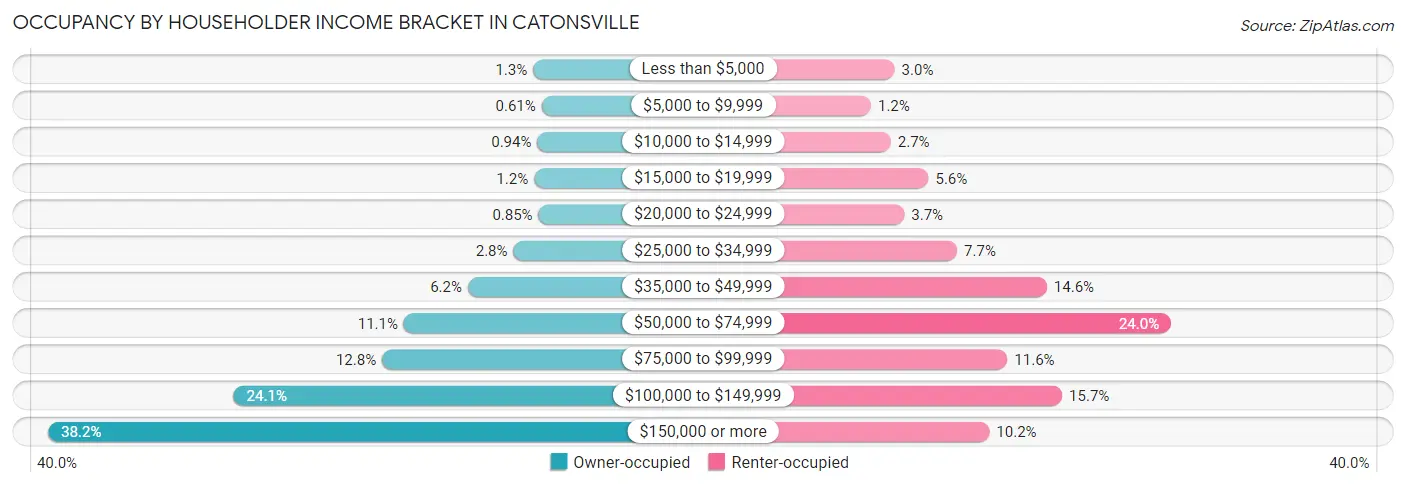
| Income Bracket | Owner-occupied | Renter-occupied |
| Less than $5,000 | 144 (1.3%) | 141 (3.0%) |
| $5,000 to $9,999 | 69 (0.6%) | 56 (1.2%) |
| $10,000 to $14,999 | 107 (0.9%) | 127 (2.7%) |
| $15,000 to $19,999 | 136 (1.2%) | 263 (5.6%) |
| $20,000 to $24,999 | 97 (0.9%) | 176 (3.7%) |
| $25,000 to $34,999 | 314 (2.8%) | 366 (7.7%) |
| $35,000 to $49,999 | 710 (6.2%) | 689 (14.6%) |
| $50,000 to $74,999 | 1,265 (11.1%) | 1,136 (24.0%) |
| $75,000 to $99,999 | 1,454 (12.8%) | 547 (11.6%) |
| $100,000 to $149,999 | 2,741 (24.1%) | 744 (15.7%) |
| $150,000 or more | 4,351 (38.2%) | 482 (10.2%) |
| Total | 11,388 (100.0%) | 4,727 (100.0%) |
Monthly Housing Cost Tiers in Catonsville
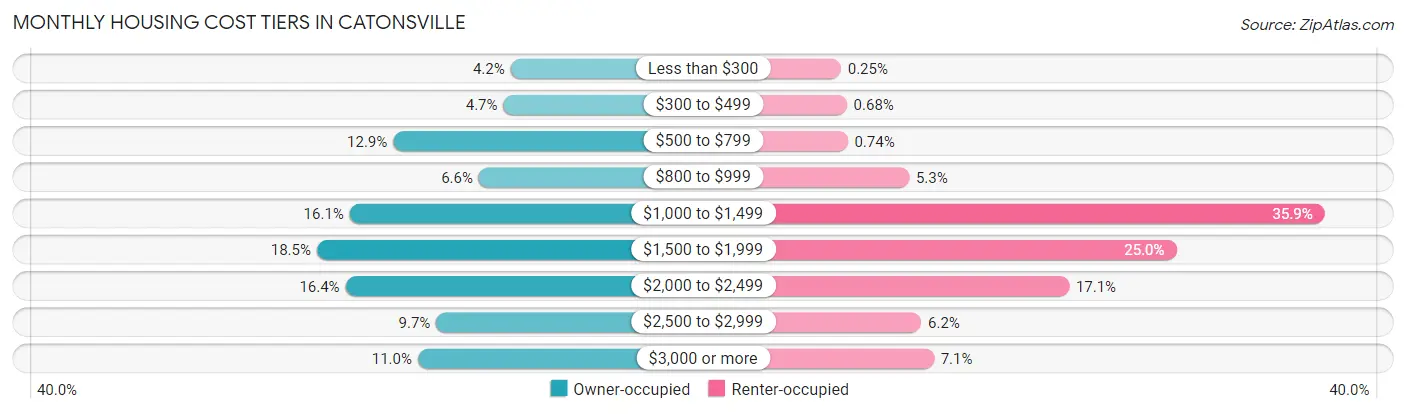
| Monthly Cost | Owner-occupied | Renter-occupied |
| Less than $300 | 480 (4.2%) | 12 (0.3%) |
| $300 to $499 | 540 (4.7%) | 32 (0.7%) |
| $500 to $799 | 1,464 (12.9%) | 35 (0.7%) |
| $800 to $999 | 746 (6.6%) | 249 (5.3%) |
| $1,000 to $1,499 | 1,829 (16.1%) | 1,696 (35.9%) |
| $1,500 to $1,999 | 2,105 (18.5%) | 1,180 (25.0%) |
| $2,000 to $2,499 | 1,864 (16.4%) | 806 (17.1%) |
| $2,500 to $2,999 | 1,103 (9.7%) | 291 (6.2%) |
| $3,000 or more | 1,257 (11.0%) | 335 (7.1%) |
| Total | 11,388 (100.0%) | 4,727 (100.0%) |
Physical Housing Characteristics in Catonsville
Housing Structures in Catonsville
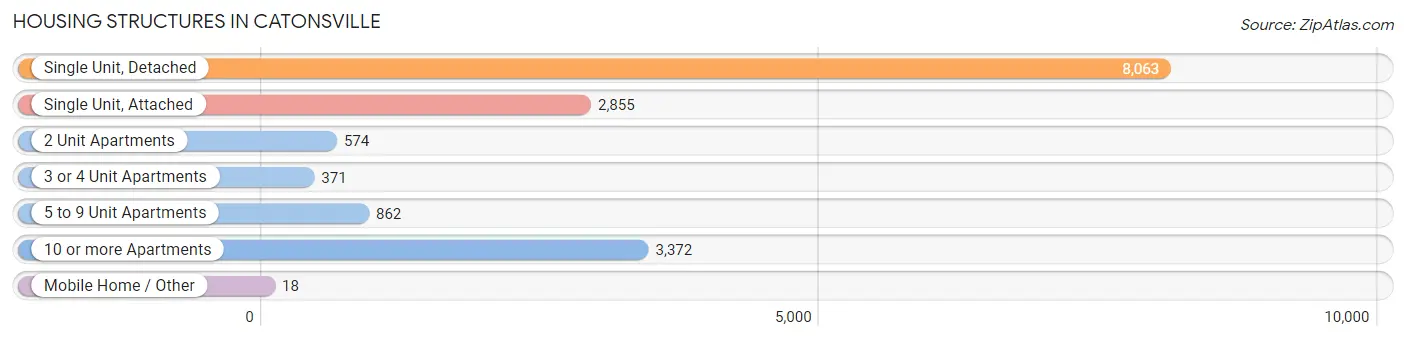
| Structure Type | # Housing Units | % Housing Units |
| Single Unit, Detached | 8,063 | 50.0% |
| Single Unit, Attached | 2,855 | 17.7% |
| 2 Unit Apartments | 574 | 3.6% |
| 3 or 4 Unit Apartments | 371 | 2.3% |
| 5 to 9 Unit Apartments | 862 | 5.3% |
| 10 or more Apartments | 3,372 | 20.9% |
| Mobile Home / Other | 18 | 0.1% |
| Total | 16,115 | 100.0% |
Housing Structures by Occupancy in Catonsville
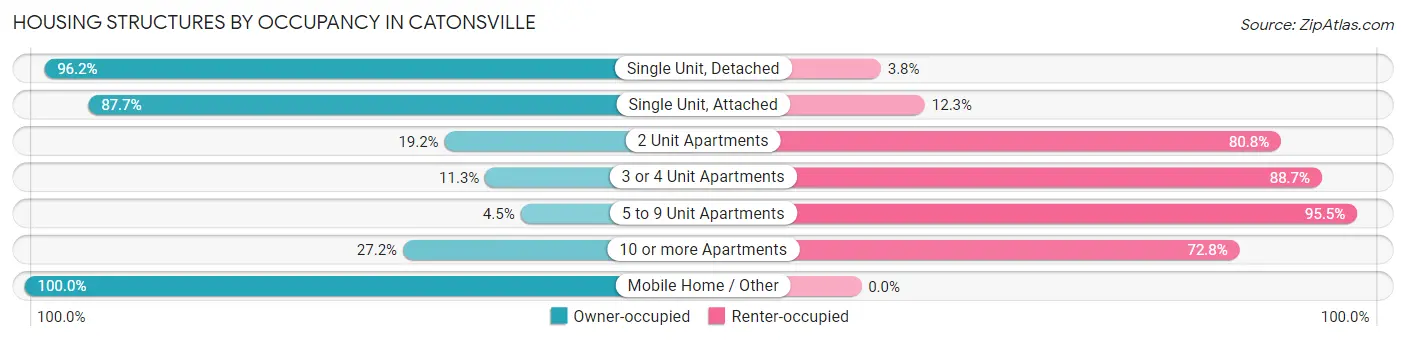
| Structure Type | Owner-occupied | Renter-occupied |
| Single Unit, Detached | 7,758 (96.2%) | 305 (3.8%) |
| Single Unit, Attached | 2,505 (87.7%) | 350 (12.3%) |
| 2 Unit Apartments | 110 (19.2%) | 464 (80.8%) |
| 3 or 4 Unit Apartments | 42 (11.3%) | 329 (88.7%) |
| 5 to 9 Unit Apartments | 39 (4.5%) | 823 (95.5%) |
| 10 or more Apartments | 916 (27.2%) | 2,456 (72.8%) |
| Mobile Home / Other | 18 (100.0%) | 0 (0.0%) |
| Total | 11,388 (70.7%) | 4,727 (29.3%) |
Housing Structures by Number of Rooms in Catonsville
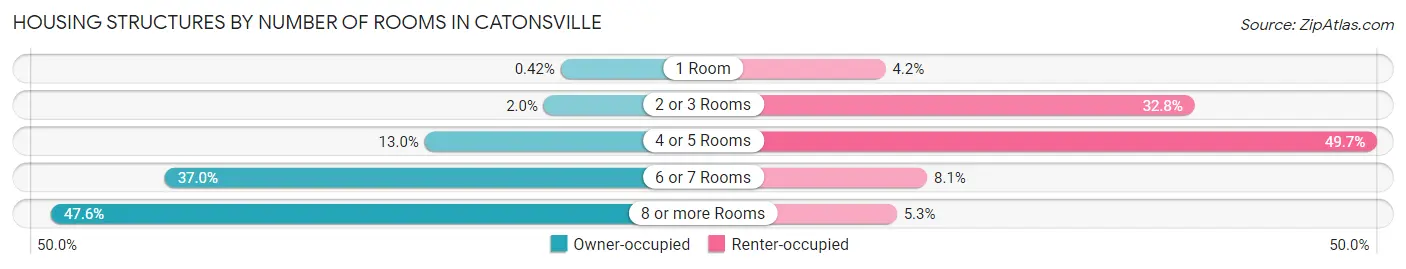
| Number of Rooms | Owner-occupied | Renter-occupied |
| 1 Room | 48 (0.4%) | 199 (4.2%) |
| 2 or 3 Rooms | 226 (2.0%) | 1,551 (32.8%) |
| 4 or 5 Rooms | 1,480 (13.0%) | 2,348 (49.7%) |
| 6 or 7 Rooms | 4,218 (37.0%) | 381 (8.1%) |
| 8 or more Rooms | 5,416 (47.6%) | 248 (5.2%) |
| Total | 11,388 (100.0%) | 4,727 (100.0%) |
Housing Structure by Heating Type in Catonsville
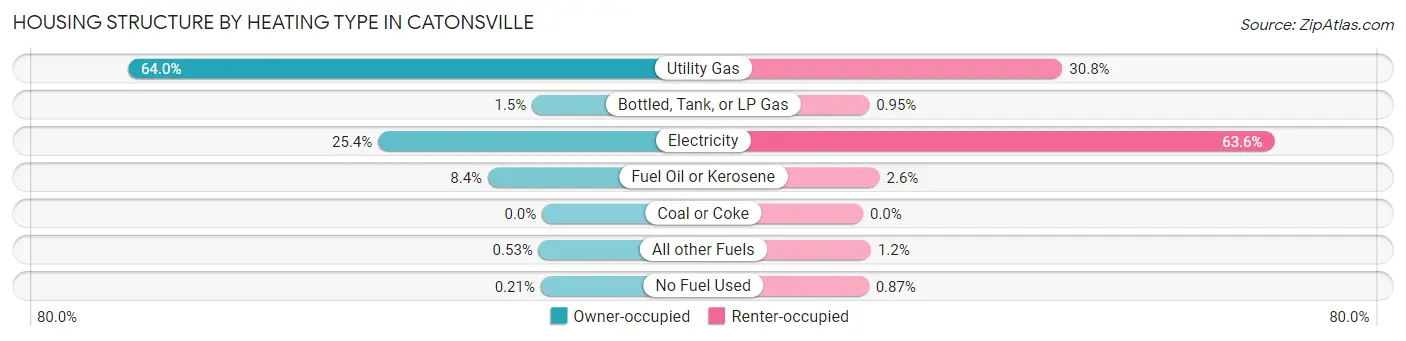
| Heating Type | Owner-occupied | Renter-occupied |
| Utility Gas | 7,289 (64.0%) | 1,457 (30.8%) |
| Bottled, Tank, or LP Gas | 175 (1.5%) | 45 (0.9%) |
| Electricity | 2,887 (25.4%) | 3,005 (63.6%) |
| Fuel Oil or Kerosene | 953 (8.4%) | 121 (2.6%) |
| Coal or Coke | 0 (0.0%) | 0 (0.0%) |
| All other Fuels | 60 (0.5%) | 58 (1.2%) |
| No Fuel Used | 24 (0.2%) | 41 (0.9%) |
| Total | 11,388 (100.0%) | 4,727 (100.0%) |
Household Vehicle Usage in Catonsville
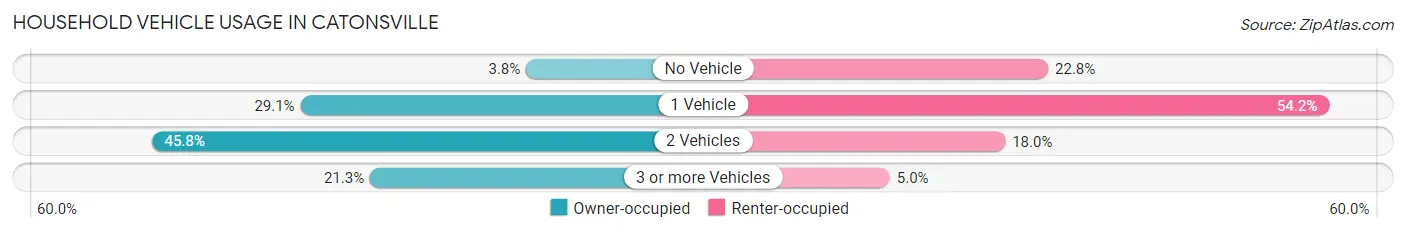
| Vehicles per Household | Owner-occupied | Renter-occupied |
| No Vehicle | 435 (3.8%) | 1,076 (22.8%) |
| 1 Vehicle | 3,314 (29.1%) | 2,564 (54.2%) |
| 2 Vehicles | 5,213 (45.8%) | 849 (18.0%) |
| 3 or more Vehicles | 2,426 (21.3%) | 238 (5.0%) |
| Total | 11,388 (100.0%) | 4,727 (100.0%) |
Real Estate & Mortgages in Catonsville
Real Estate and Mortgage Overview in Catonsville
| Characteristic | Without Mortgage | With Mortgage |
| Housing Units | 3,587 | 7,801 |
| Median Property Value | $383,900 | $379,800 |
| Median Household Income | $84,443 | $3,505 |
| Monthly Housing Costs | $706 | $1,197 |
| Real Estate Taxes | $4,355 | $115 |
Property Value by Mortgage Status in Catonsville
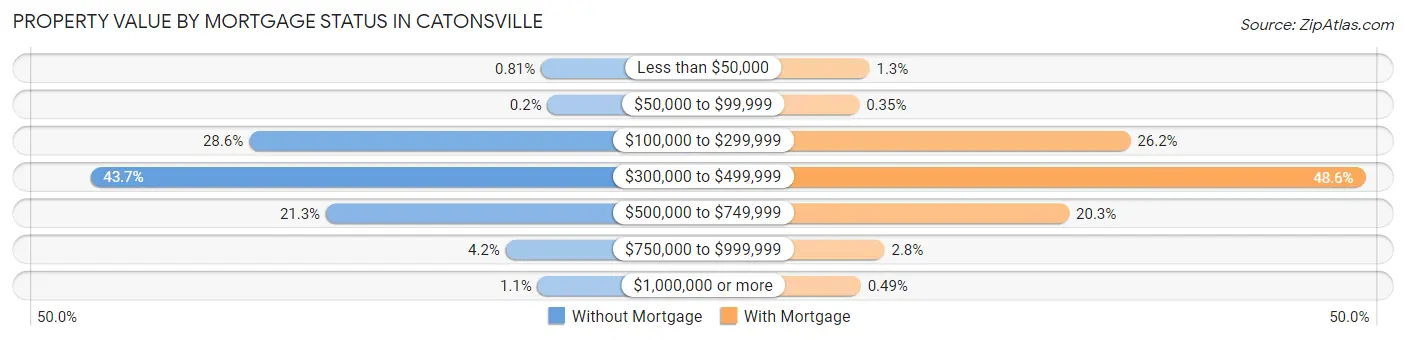
| Property Value | Without Mortgage | With Mortgage |
| Less than $50,000 | 29 (0.8%) | 104 (1.3%) |
| $50,000 to $99,999 | 7 (0.2%) | 27 (0.4%) |
| $100,000 to $299,999 | 1,027 (28.6%) | 2,042 (26.2%) |
| $300,000 to $499,999 | 1,569 (43.7%) | 3,788 (48.6%) |
| $500,000 to $749,999 | 764 (21.3%) | 1,587 (20.3%) |
| $750,000 to $999,999 | 150 (4.2%) | 215 (2.8%) |
| $1,000,000 or more | 41 (1.1%) | 38 (0.5%) |
| Total | 3,587 (100.0%) | 7,801 (100.0%) |
Household Income by Mortgage Status in Catonsville
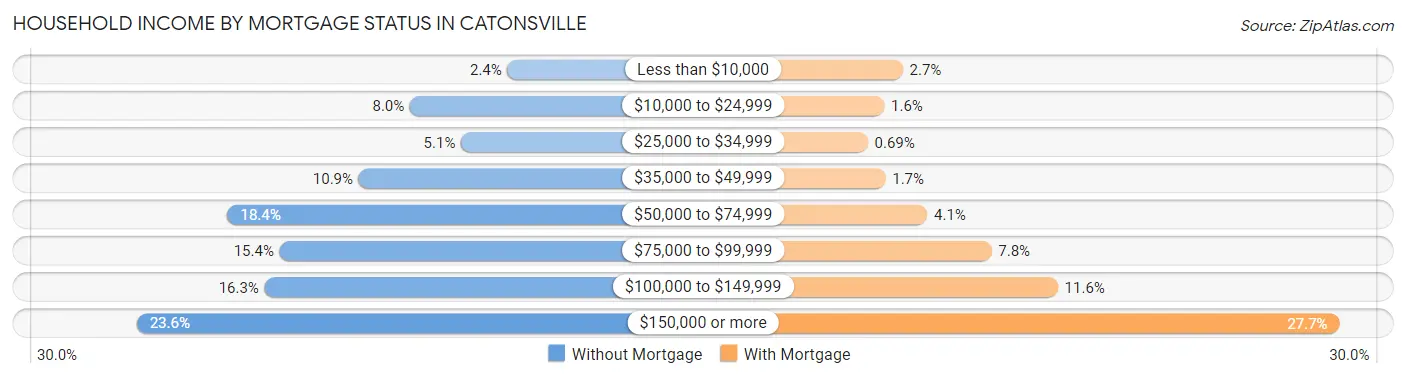
| Household Income | Without Mortgage | With Mortgage |
| Less than $10,000 | 86 (2.4%) | 210 (2.7%) |
| $10,000 to $24,999 | 286 (8.0%) | 127 (1.6%) |
| $25,000 to $34,999 | 181 (5.1%) | 54 (0.7%) |
| $35,000 to $49,999 | 391 (10.9%) | 133 (1.7%) |
| $50,000 to $74,999 | 660 (18.4%) | 319 (4.1%) |
| $75,000 to $99,999 | 553 (15.4%) | 605 (7.8%) |
| $100,000 to $149,999 | 584 (16.3%) | 901 (11.6%) |
| $150,000 or more | 846 (23.6%) | 2,157 (27.7%) |
| Total | 3,587 (100.0%) | 7,801 (100.0%) |
Property Value to Household Income Ratio in Catonsville
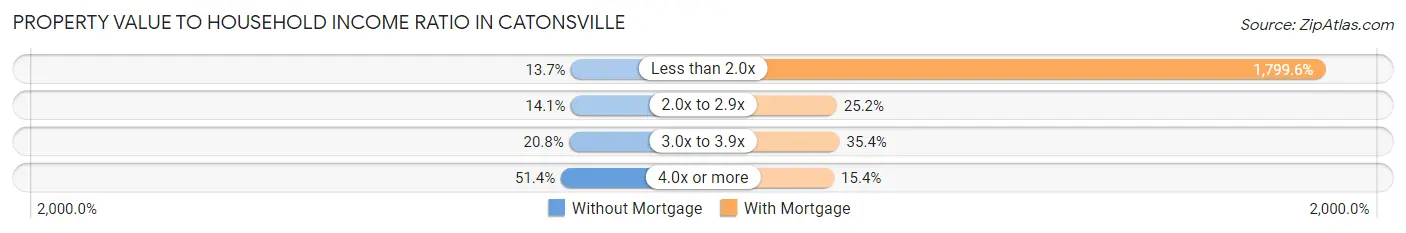
| Value-to-Income Ratio | Without Mortgage | With Mortgage |
| Less than 2.0x | 493 (13.7%) | 140,388 (1,799.6%) |
| 2.0x to 2.9x | 504 (14.1%) | 1,962 (25.2%) |
| 3.0x to 3.9x | 745 (20.8%) | 2,765 (35.4%) |
| 4.0x or more | 1,845 (51.4%) | 1,198 (15.4%) |
| Total | 3,587 (100.0%) | 7,801 (100.0%) |
Real Estate Taxes by Mortgage Status in Catonsville
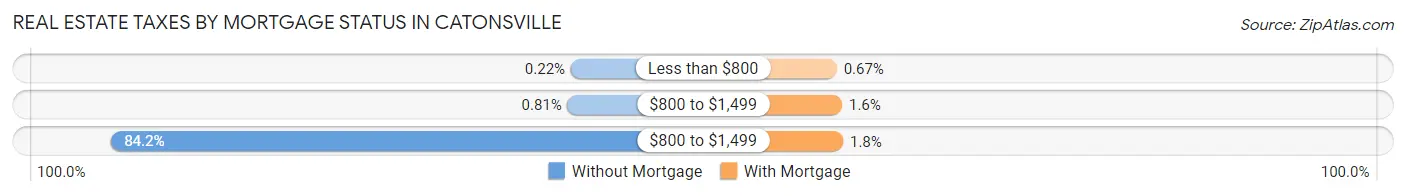
| Property Taxes | Without Mortgage | With Mortgage |
| Less than $800 | 8 (0.2%) | 52 (0.7%) |
| $800 to $1,499 | 29 (0.8%) | 128 (1.6%) |
| $800 to $1,499 | 3,019 (84.2%) | 143 (1.8%) |
| Total | 3,587 (100.0%) | 7,801 (100.0%) |
Health & Disability in Catonsville
Health Insurance Coverage by Age in Catonsville
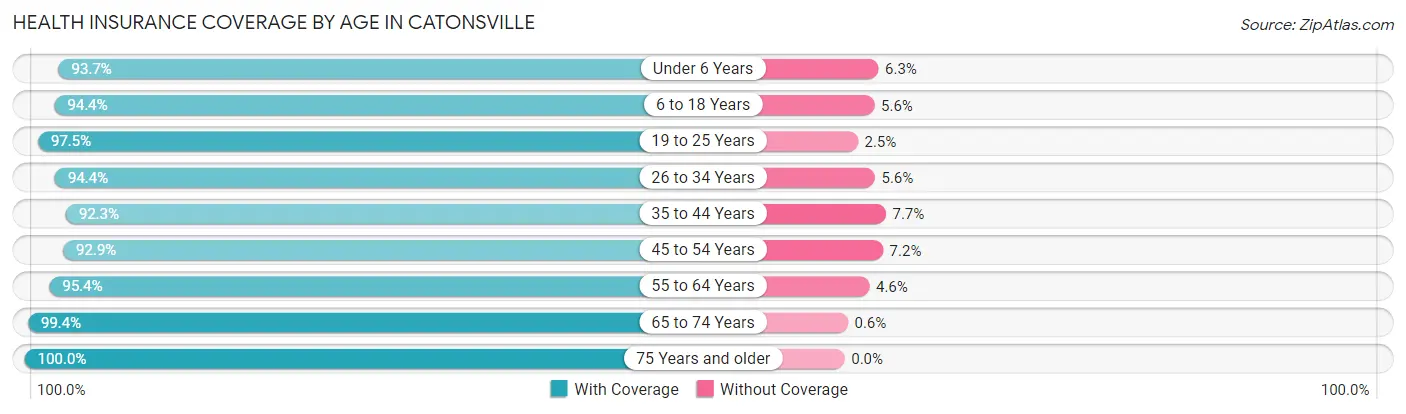
| Age Bracket | With Coverage | Without Coverage |
| Under 6 Years | 1,916 (93.7%) | 129 (6.3%) |
| 6 to 18 Years | 7,354 (94.4%) | 433 (5.6%) |
| 19 to 25 Years | 4,934 (97.5%) | 125 (2.5%) |
| 26 to 34 Years | 3,611 (94.4%) | 216 (5.6%) |
| 35 to 44 Years | 4,803 (92.3%) | 400 (7.7%) |
| 45 to 54 Years | 3,764 (92.8%) | 290 (7.1%) |
| 55 to 64 Years | 5,066 (95.4%) | 245 (4.6%) |
| 65 to 74 Years | 4,008 (99.4%) | 24 (0.6%) |
| 75 Years and older | 4,437 (100.0%) | 0 (0.0%) |
| Total | 39,893 (95.5%) | 1,862 (4.5%) |
Health Insurance Coverage by Citizenship Status in Catonsville
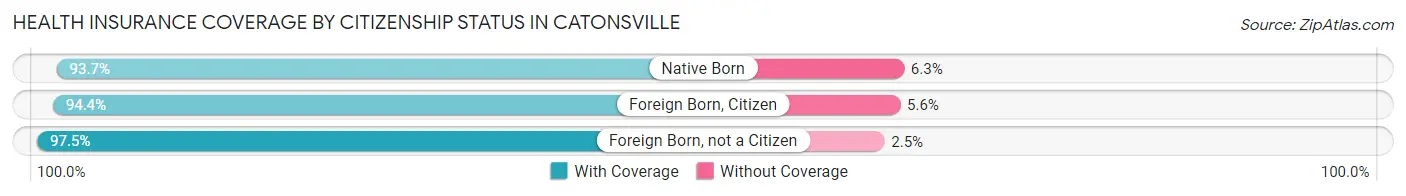
| Citizenship Status | With Coverage | Without Coverage |
| Native Born | 1,916 (93.7%) | 129 (6.3%) |
| Foreign Born, Citizen | 7,354 (94.4%) | 433 (5.6%) |
| Foreign Born, not a Citizen | 4,934 (97.5%) | 125 (2.5%) |
Health Insurance Coverage by Household Income in Catonsville
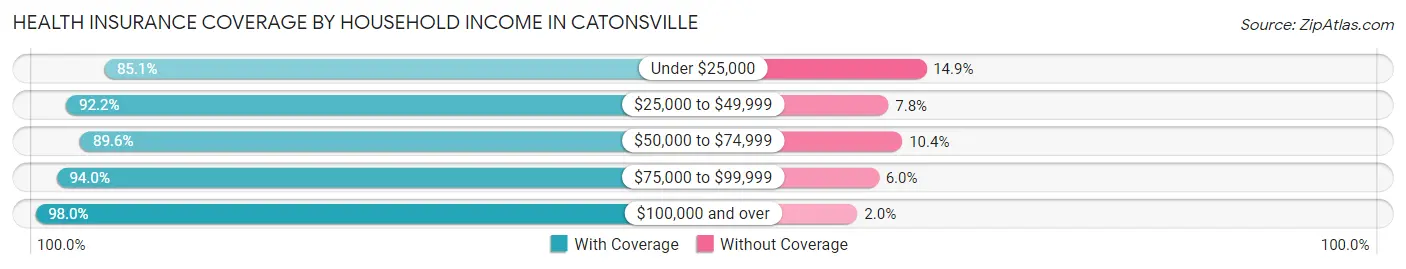
| Household Income | With Coverage | Without Coverage |
| Under $25,000 | 1,636 (85.1%) | 286 (14.9%) |
| $25,000 to $49,999 | 3,676 (92.2%) | 310 (7.8%) |
| $50,000 to $74,999 | 3,908 (89.6%) | 453 (10.4%) |
| $75,000 to $99,999 | 4,167 (94.0%) | 265 (6.0%) |
| $100,000 and over | 23,000 (98.0%) | 466 (2.0%) |
Public vs Private Health Insurance Coverage by Age in Catonsville
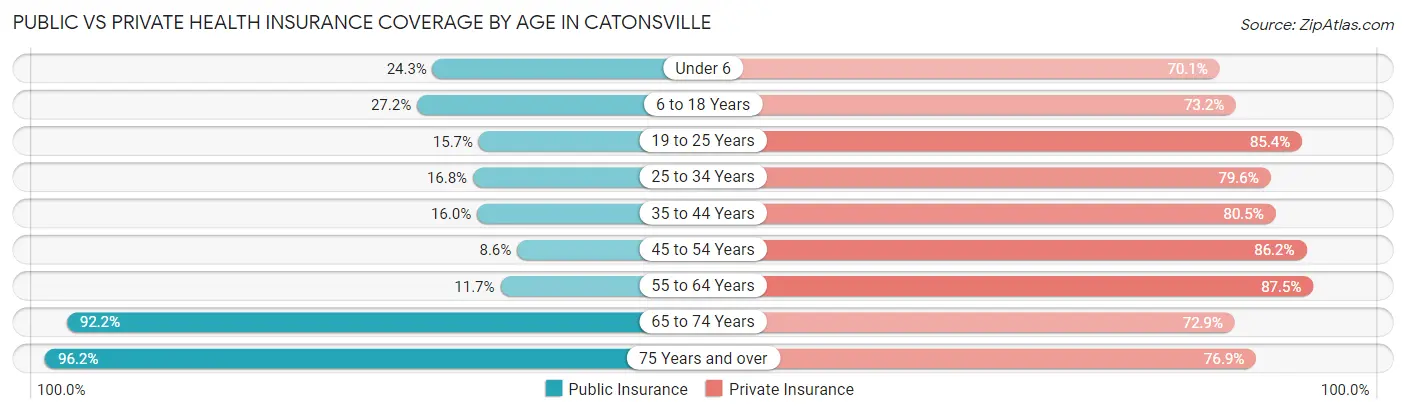
| Age Bracket | Public Insurance | Private Insurance |
| Under 6 | 496 (24.2%) | 1,434 (70.1%) |
| 6 to 18 Years | 2,116 (27.2%) | 5,700 (73.2%) |
| 19 to 25 Years | 793 (15.7%) | 4,322 (85.4%) |
| 25 to 34 Years | 642 (16.8%) | 3,045 (79.6%) |
| 35 to 44 Years | 834 (16.0%) | 4,189 (80.5%) |
| 45 to 54 Years | 348 (8.6%) | 3,495 (86.2%) |
| 55 to 64 Years | 621 (11.7%) | 4,647 (87.5%) |
| 65 to 74 Years | 3,716 (92.2%) | 2,941 (72.9%) |
| 75 Years and over | 4,268 (96.2%) | 3,412 (76.9%) |
| Total | 13,834 (33.1%) | 33,185 (79.5%) |
Disability Status by Sex by Age in Catonsville
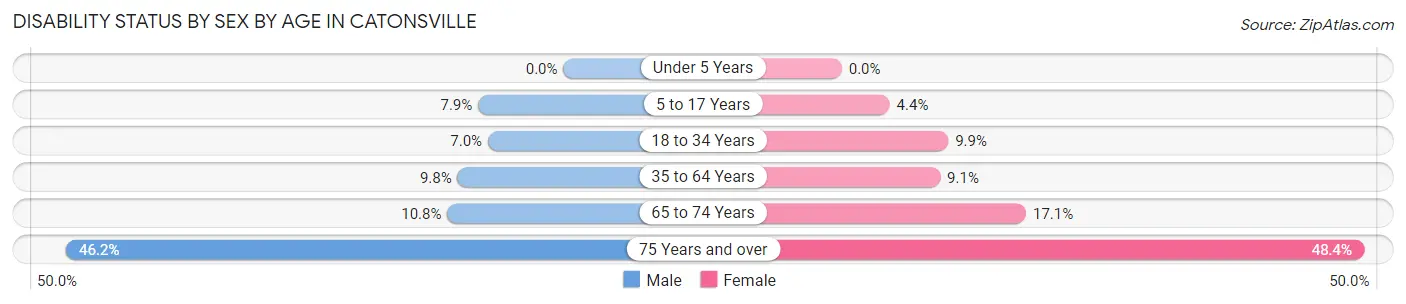
| Age Bracket | Male | Female |
| Under 5 Years | 0 (0.0%) | 0 (0.0%) |
| 5 to 17 Years | 247 (7.9%) | 158 (4.4%) |
| 18 to 34 Years | 366 (7.0%) | 501 (9.9%) |
| 35 to 64 Years | 691 (9.8%) | 688 (9.1%) |
| 65 to 74 Years | 215 (10.8%) | 348 (17.1%) |
| 75 Years and over | 551 (46.2%) | 1,571 (48.4%) |
Disability Class by Sex by Age in Catonsville
Disability Class: Hearing Difficulty
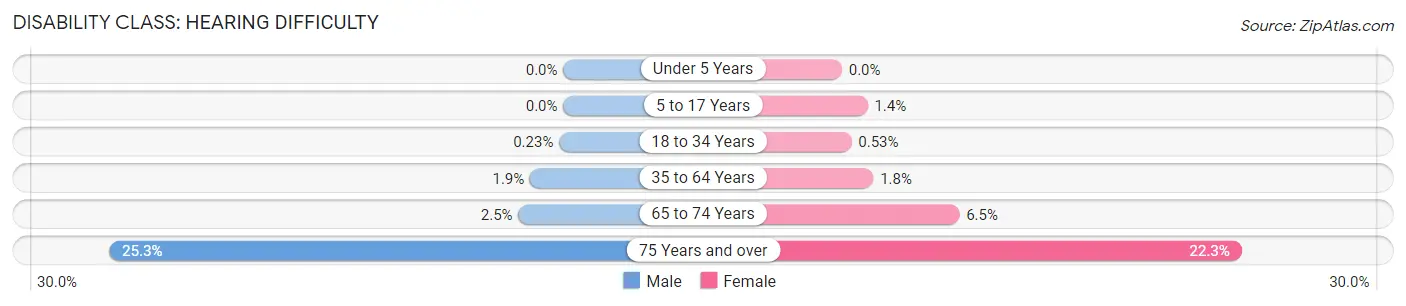
| Age Bracket | Male | Female |
| Under 5 Years | 0 (0.0%) | 0 (0.0%) |
| 5 to 17 Years | 0 (0.0%) | 51 (1.4%) |
| 18 to 34 Years | 12 (0.2%) | 27 (0.5%) |
| 35 to 64 Years | 130 (1.8%) | 132 (1.8%) |
| 65 to 74 Years | 50 (2.5%) | 133 (6.5%) |
| 75 Years and over | 302 (25.3%) | 722 (22.3%) |
Disability Class: Vision Difficulty
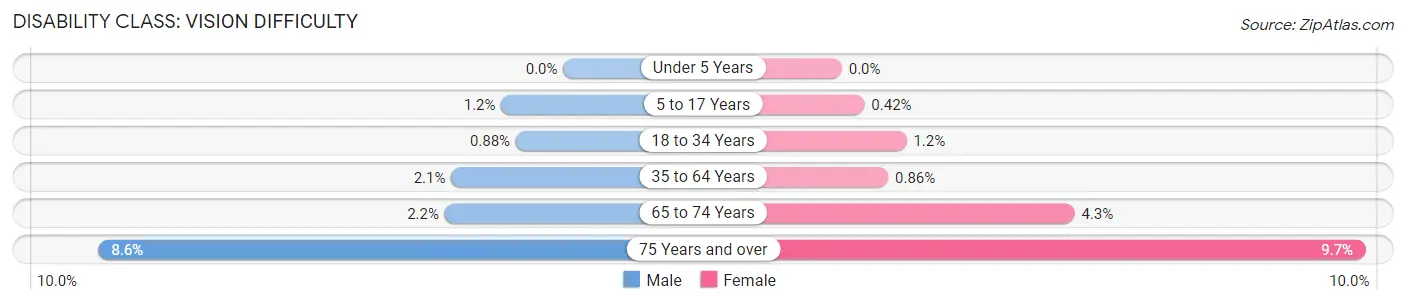
| Age Bracket | Male | Female |
| Under 5 Years | 0 (0.0%) | 0 (0.0%) |
| 5 to 17 Years | 36 (1.1%) | 15 (0.4%) |
| 18 to 34 Years | 46 (0.9%) | 61 (1.2%) |
| 35 to 64 Years | 146 (2.1%) | 65 (0.9%) |
| 65 to 74 Years | 44 (2.2%) | 88 (4.3%) |
| 75 Years and over | 103 (8.6%) | 315 (9.7%) |
Disability Class: Cognitive Difficulty
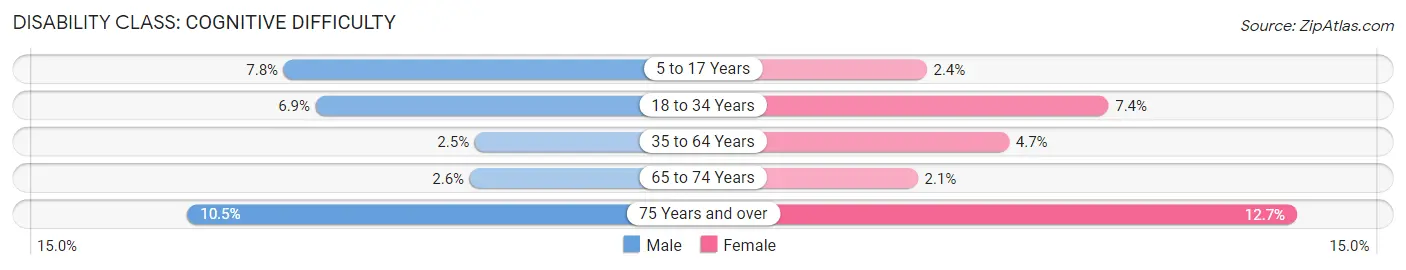
| Age Bracket | Male | Female |
| 5 to 17 Years | 243 (7.8%) | 84 (2.4%) |
| 18 to 34 Years | 360 (6.9%) | 376 (7.4%) |
| 35 to 64 Years | 173 (2.5%) | 350 (4.6%) |
| 65 to 74 Years | 52 (2.6%) | 43 (2.1%) |
| 75 Years and over | 125 (10.5%) | 411 (12.7%) |
Disability Class: Ambulatory Difficulty
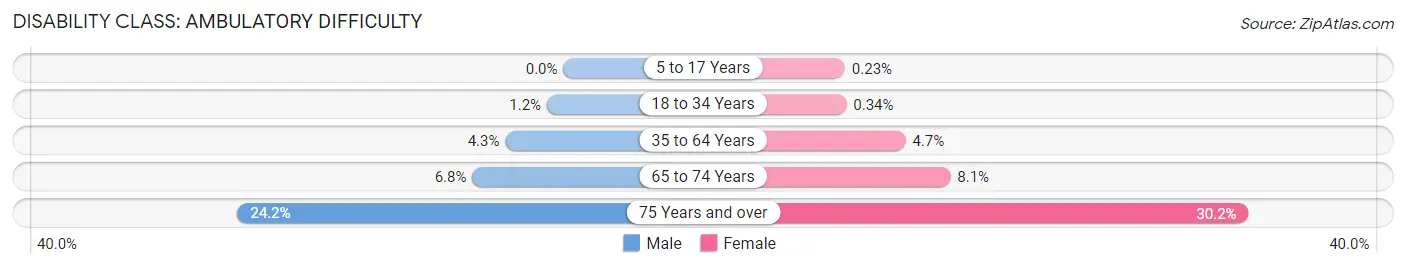
| Age Bracket | Male | Female |
| 5 to 17 Years | 0 (0.0%) | 8 (0.2%) |
| 18 to 34 Years | 64 (1.2%) | 17 (0.3%) |
| 35 to 64 Years | 303 (4.3%) | 356 (4.7%) |
| 65 to 74 Years | 135 (6.8%) | 164 (8.1%) |
| 75 Years and over | 289 (24.2%) | 979 (30.2%) |
Disability Class: Self-Care Difficulty
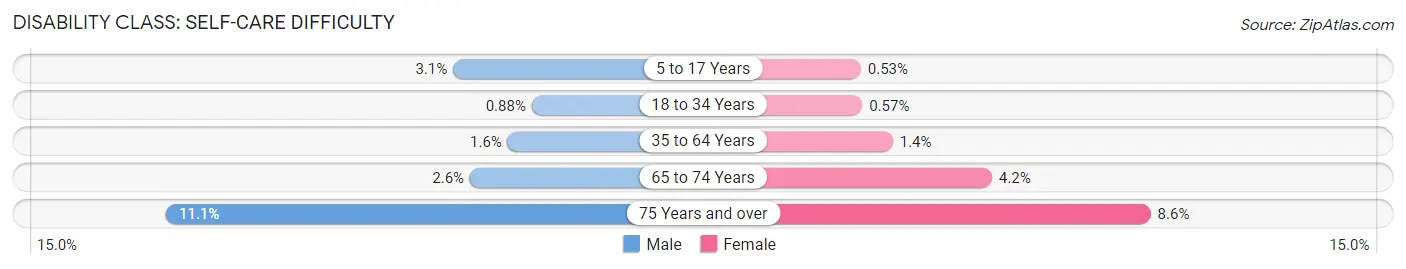
| Age Bracket | Male | Female |
| 5 to 17 Years | 96 (3.1%) | 19 (0.5%) |
| 18 to 34 Years | 46 (0.9%) | 29 (0.6%) |
| 35 to 64 Years | 109 (1.5%) | 107 (1.4%) |
| 65 to 74 Years | 52 (2.6%) | 85 (4.2%) |
| 75 Years and over | 132 (11.1%) | 279 (8.6%) |
Technology Access in Catonsville
Computing Device Access in Catonsville
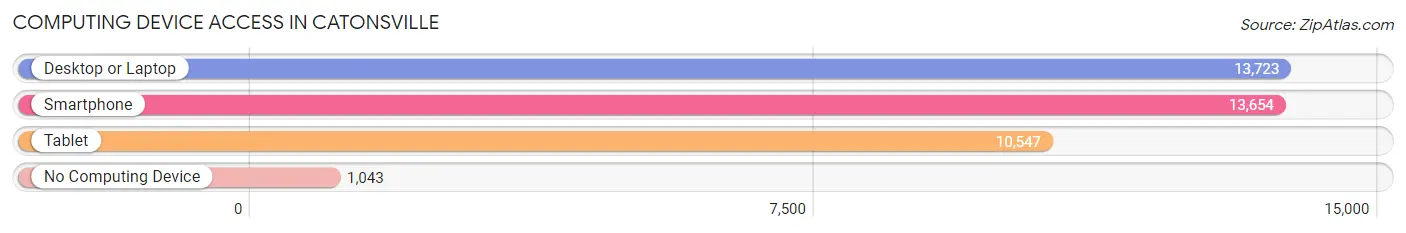
| Device Type | # Households | % Households |
| Desktop or Laptop | 13,723 | 85.2% |
| Smartphone | 13,654 | 84.7% |
| Tablet | 10,547 | 65.4% |
| No Computing Device | 1,043 | 6.5% |
| Total | 16,115 | 100.0% |
Internet Access in Catonsville
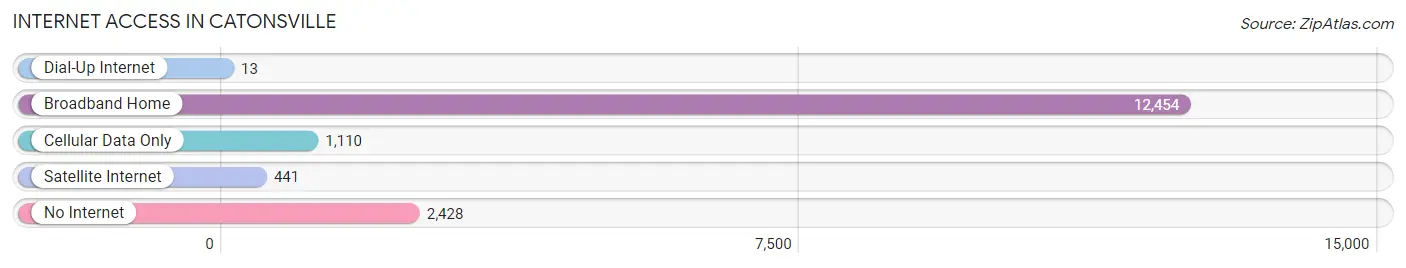
| Internet Type | # Households | % Households |
| Dial-Up Internet | 13 | 0.1% |
| Broadband Home | 12,454 | 77.3% |
| Cellular Data Only | 1,110 | 6.9% |
| Satellite Internet | 441 | 2.7% |
| No Internet | 2,428 | 15.1% |
| Total | 16,115 | 100.0% |
Catonsville Summary
Catonsville, Maryland is a small town located in Baltimore County, Maryland. It is situated just west of the city of Baltimore and is part of the Baltimore-Washington metropolitan area. The town has a population of approximately 41,000 people and is known for its small-town charm and close-knit community.
History
Catonsville was first settled in the late 1600s by the Caton family, who were among the first settlers in the area. The town was officially established in 1854 and was named after the Caton family. The town was originally a farming community, but it quickly grew into a bustling suburb of Baltimore.
In the late 1800s, Catonsville was home to a number of factories, including a paper mill, a brickyard, and a canning factory. The town also had a number of stores and shops, as well as a post office and a train station.
In the early 1900s, Catonsville was a popular destination for day-trippers from Baltimore. The town was home to a number of amusement parks, including the Catonsville Amusement Park, which opened in 1906 and closed in the 1950s.
Geography
Catonsville is located in the Piedmont region of Maryland, just west of the city of Baltimore. The town is situated on the Patapsco River, which flows through the area. The town is bordered by the towns of Arbutus, Ellicott City, and Woodlawn.
The town has a total area of 4.3 square miles, of which 4.2 square miles is land and 0.1 square miles is water. The town is located at an elevation of approximately 200 feet above sea level.
Economy
Catonsville is home to a number of businesses and industries, including retail stores, restaurants, and professional services. The town is also home to a number of corporate offices, including those of the University of Maryland Medical System, the Social Security Administration, and the Centers for Medicare and Medicaid Services.
The town is also home to a number of educational institutions, including the University of Maryland, Baltimore County, and the Community College of Baltimore County.
Demographics
As of the 2010 census, Catonsville had a population of 41,567 people. The racial makeup of the town was 79.3% White, 11.2% African American, 0.3% Native American, 4.2% Asian, 0.1% Pacific Islander, 2.2% from other races, and 2.9% from two or more races. Hispanic or Latino of any race were 5.2% of the population.
The median household income in Catonsville was $68,945, and the median family income was $81,917. The per capita income for the town was $31,945. About 6.2% of families and 8.7% of the population were below the poverty line, including 10.2% of those under age 18 and 6.2% of those age 65 or over.
Common Questions
What is Per Capita Income in Catonsville?
Per Capita income in Catonsville is $48,766.
What is the Median Family Income in Catonsville?
Median Family Income in Catonsville is $132,121.
What is the Median Household income in Catonsville?
Median Household Income in Catonsville is $103,448.
What is Income or Wage Gap in Catonsville?
Income or Wage Gap in Catonsville is 25.1%.
Women in Catonsville earn 74.9 cents for every dollar earned by a man.
What is Family Income Deficit in Catonsville?
Family Income Deficit in Catonsville is $16,744.
Families that are below poverty line in Catonsville earn $16,744 less on average than the poverty threshold level.
What is Inequality or Gini Index in Catonsville?
Inequality or Gini Index in Catonsville is 0.41.
What is the Total Population of Catonsville?
Total Population of Catonsville is 42,767.
What is the Total Male Population of Catonsville?
Total Male Population of Catonsville is 20,130.
What is the Total Female Population of Catonsville?
Total Female Population of Catonsville is 22,637.
What is the Ratio of Males per 100 Females in Catonsville?
There are 88.93 Males per 100 Females in Catonsville.
What is the Ratio of Females per 100 Males in Catonsville?
There are 112.45 Females per 100 Males in Catonsville.
What is the Median Population Age in Catonsville?
Median Population Age in Catonsville is 40.0 Years.
What is the Average Family Size in Catonsville
Average Family Size in Catonsville is 3.1 People.
What is the Average Household Size in Catonsville
Average Household Size in Catonsville is 2.4 People.
How Large is the Labor Force in Catonsville?
There are 21,941 People in the Labor Forcein in Catonsville.
What is the Percentage of People in the Labor Force in Catonsville?
61.8% of People are in the Labor Force in Catonsville.
What is the Unemployment Rate in Catonsville?
Unemployment Rate in Catonsville is 3.7%.