Glidden, IA Map & Demographics
Glidden Map
Glidden Overview
$30,179
PER CAPITA INCOME
$85,625
AVG FAMILY INCOME
$67,361
AVG HOUSEHOLD INCOME
31.8%
WAGE / INCOME GAP [ % ]
68.2¢/ $1
WAGE / INCOME GAP [ $ ]
0.37
INEQUALITY / GINI INDEX
964
TOTAL POPULATION
470
MALE POPULATION
494
FEMALE POPULATION
95.14
MALES / 100 FEMALES
105.11
FEMALES / 100 MALES
45.5
MEDIAN AGE
2.9
AVG FAMILY SIZE
2.4
AVG HOUSEHOLD SIZE
553
LABOR FORCE [ PEOPLE ]
70.8%
PERCENT IN LABOR FORCE
0.9%
UNEMPLOYMENT RATE
Glidden Zip Codes
Glidden Area Codes
Income in Glidden
Income Overview in Glidden
Per Capita Income in Glidden is $30,179, while median incomes of families and households are $85,625 and $67,361 respectively.
| Characteristic | Number | Measure |
| Per Capita Income | 964 | $30,179 |
| Median Family Income | 267 | $85,625 |
| Mean Family Income | 267 | $83,084 |
| Median Household Income | 395 | $67,361 |
| Mean Household Income | 395 | $71,845 |
| Income Deficit | 267 | $0 |
| Wage / Income Gap (%) | 964 | 31.79% |
| Wage / Income Gap ($) | 964 | 68.21¢ per $1 |
| Gini / Inequality Index | 964 | 0.37 |
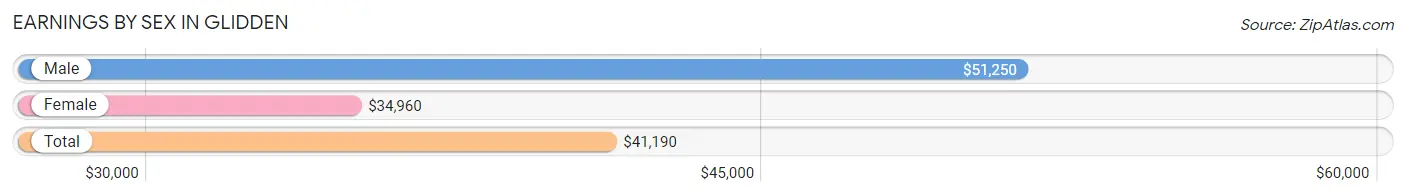
Earnings by Sex in Glidden
Average Earnings in Glidden are $41,190, $51,250 for men and $34,960 for women, a difference of 31.8%.
| Sex | Number | Average Earnings |
| Male | 305 (53.5%) | $51,250 |
| Female | 265 (46.5%) | $34,960 |
| Total | 570 (100.0%) | $41,190 |
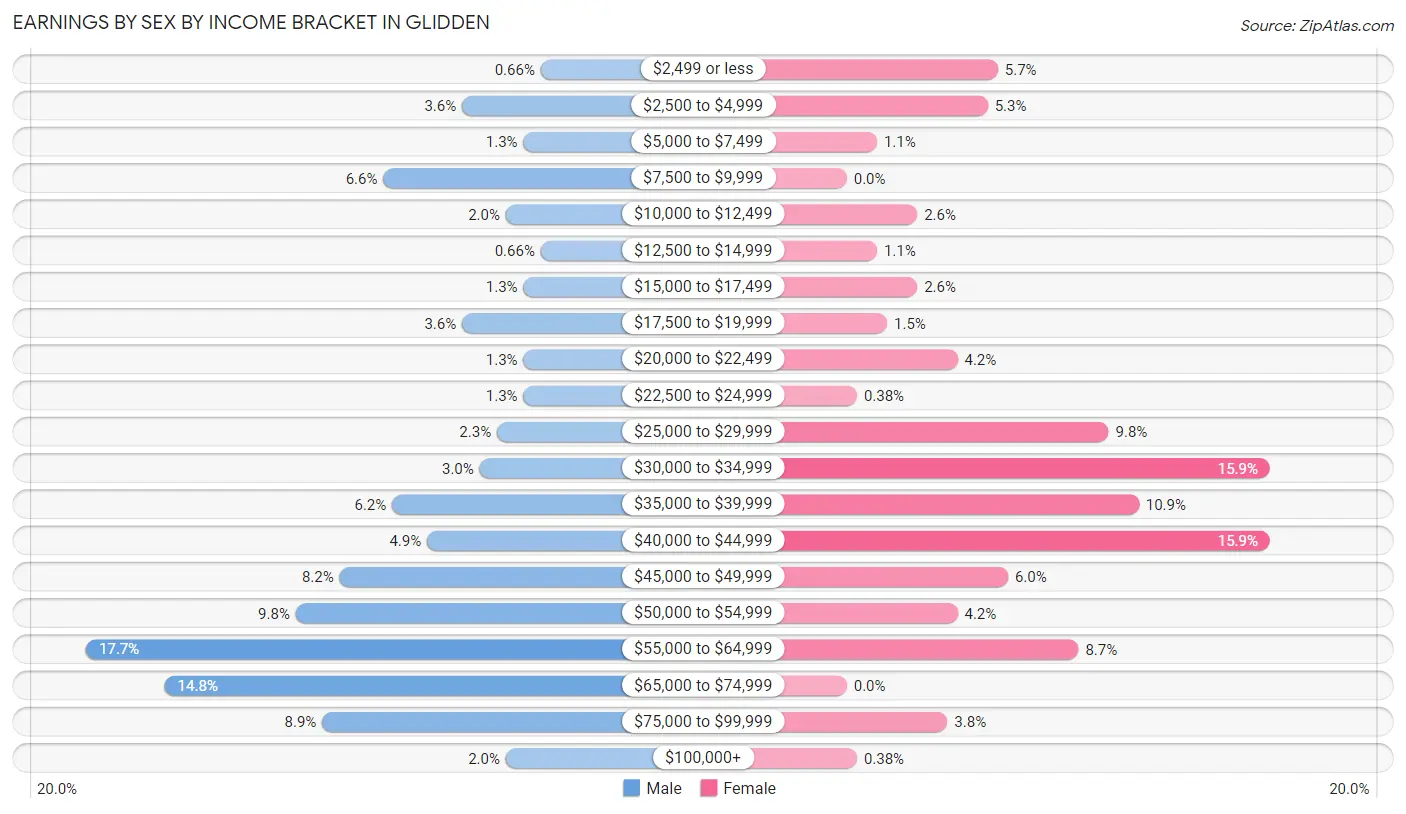
Earnings by Sex by Income Bracket in Glidden
The most common earnings brackets in Glidden are $55,000 to $64,999 for men (54 | 17.7%) and $30,000 to $34,999 for women (42 | 15.9%).
| Income | Male | Female |
| $2,499 or less | 2 (0.7%) | 15 (5.7%) |
| $2,500 to $4,999 | 11 (3.6%) | 14 (5.3%) |
| $5,000 to $7,499 | 4 (1.3%) | 3 (1.1%) |
| $7,500 to $9,999 | 20 (6.6%) | 0 (0.0%) |
| $10,000 to $12,499 | 6 (2.0%) | 7 (2.6%) |
| $12,500 to $14,999 | 2 (0.7%) | 3 (1.1%) |
| $15,000 to $17,499 | 4 (1.3%) | 7 (2.6%) |
| $17,500 to $19,999 | 11 (3.6%) | 4 (1.5%) |
| $20,000 to $22,499 | 4 (1.3%) | 11 (4.2%) |
| $22,500 to $24,999 | 4 (1.3%) | 1 (0.4%) |
| $25,000 to $29,999 | 7 (2.3%) | 26 (9.8%) |
| $30,000 to $34,999 | 9 (2.9%) | 42 (15.9%) |
| $35,000 to $39,999 | 19 (6.2%) | 29 (10.9%) |
| $40,000 to $44,999 | 15 (4.9%) | 42 (15.9%) |
| $45,000 to $49,999 | 25 (8.2%) | 16 (6.0%) |
| $50,000 to $54,999 | 30 (9.8%) | 11 (4.2%) |
| $55,000 to $64,999 | 54 (17.7%) | 23 (8.7%) |
| $65,000 to $74,999 | 45 (14.7%) | 0 (0.0%) |
| $75,000 to $99,999 | 27 (8.8%) | 10 (3.8%) |
| $100,000+ | 6 (2.0%) | 1 (0.4%) |
| Total | 305 (100.0%) | 265 (100.0%) |
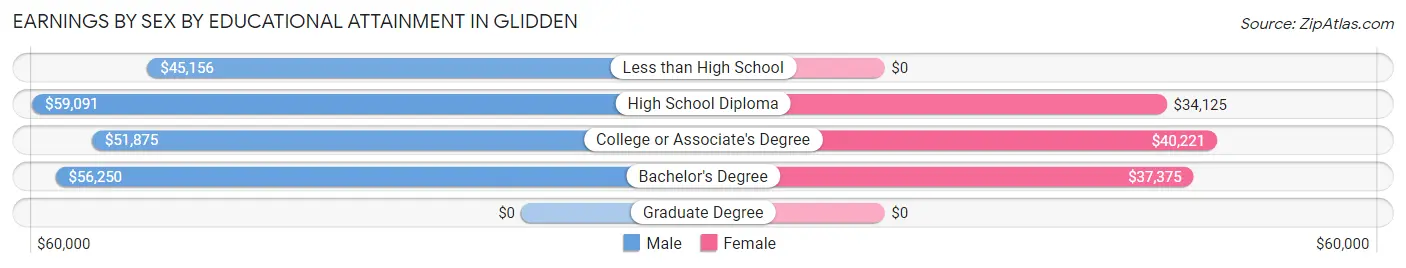
Earnings by Sex by Educational Attainment in Glidden
Average earnings in Glidden are $54,545 for men and $37,500 for women, a difference of 31.2%. Men with an educational attainment of high school diploma enjoy the highest average annual earnings of $59,091, while those with less than high school education earn the least with $45,156. Women with an educational attainment of college or associate's degree earn the most with the average annual earnings of $40,221, while those with high school diploma education have the smallest earnings of $34,125.
| Educational Attainment | Male Income | Female Income |
| Less than High School | $45,156 | $0 |
| High School Diploma | $59,091 | $34,125 |
| College or Associate's Degree | $51,875 | $40,221 |
| Bachelor's Degree | $56,250 | $37,375 |
| Graduate Degree | - | - |
| Total | $54,545 | $37,500 |
Family Income in Glidden
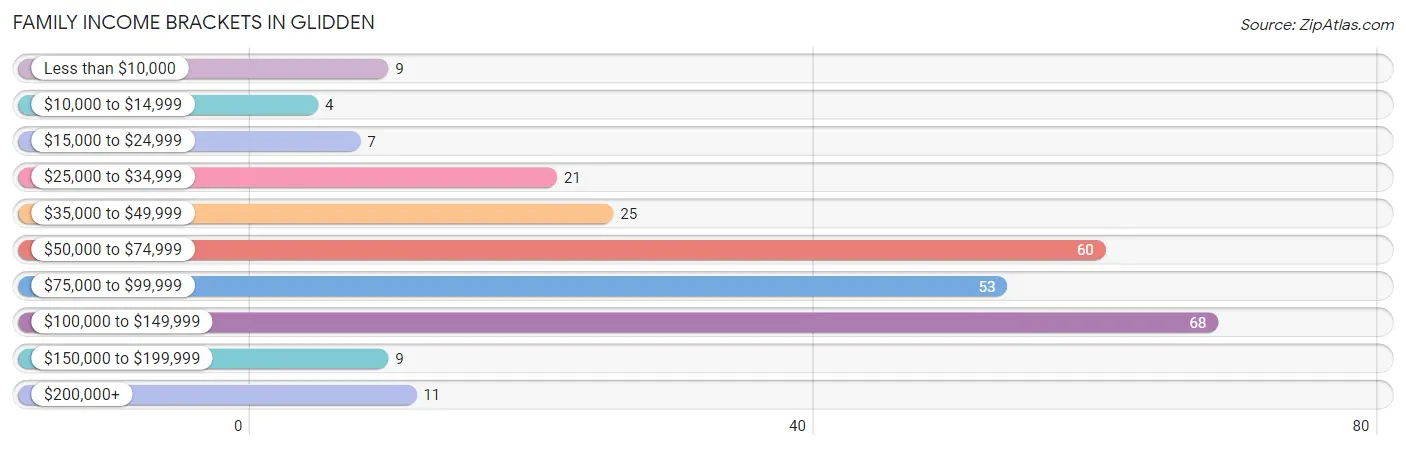
Family Income Brackets in Glidden
According to the Glidden family income data, there are 68 families falling into the $100,000 to $149,999 income range, which is the most common income bracket and makes up 25.5% of all families. Conversely, the $10,000 to $14,999 income bracket is the least frequent group with only 4 families (1.5%) belonging to this category.
| Income Bracket | # Families | % Families |
| Less than $10,000 | 9 | 3.4% |
| $10,000 to $14,999 | 4 | 1.5% |
| $15,000 to $24,999 | 7 | 2.6% |
| $25,000 to $34,999 | 21 | 7.9% |
| $35,000 to $49,999 | 25 | 9.4% |
| $50,000 to $74,999 | 60 | 22.5% |
| $75,000 to $99,999 | 53 | 19.9% |
| $100,000 to $149,999 | 68 | 25.5% |
| $150,000 to $199,999 | 9 | 3.4% |
| $200,000+ | 11 | 4.1% |
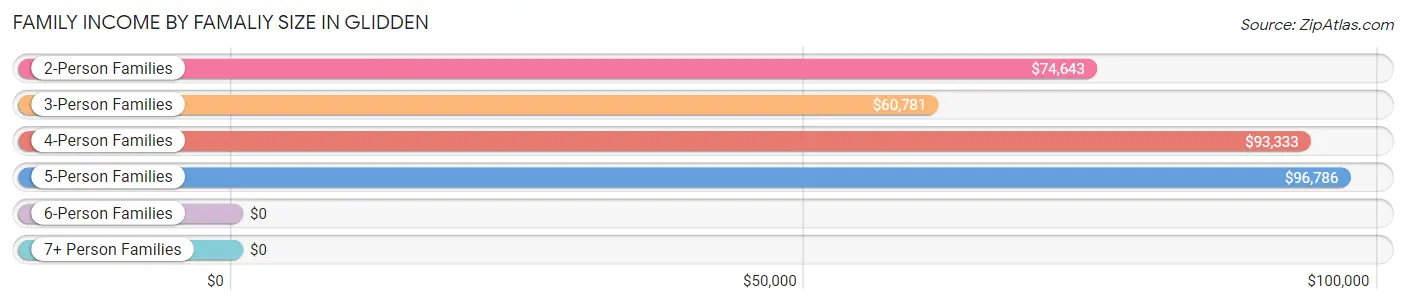
Family Income by Famaliy Size in Glidden
5-person families (26 | 9.7%) account for the highest median family income in Glidden with $96,786 per family, while 2-person families (162 | 60.7%) have the highest median income of $37,322 per family member.
| Income Bracket | # Families | Median Income |
| 2-Person Families | 162 (60.7%) | $74,643 |
| 3-Person Families | 37 (13.9%) | $60,781 |
| 4-Person Families | 42 (15.7%) | $93,333 |
| 5-Person Families | 26 (9.7%) | $96,786 |
| 6-Person Families | 0 (0.0%) | $0 |
| 7+ Person Families | 0 (0.0%) | $0 |
| Total | 267 (100.0%) | $85,625 |
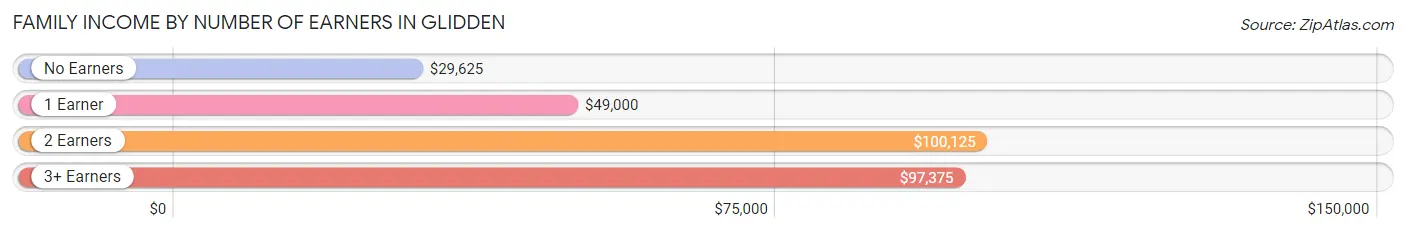
Family Income by Number of Earners in Glidden
The median family income in Glidden is $85,625, with families comprising 2 earners (143) having the highest median family income of $100,125, while families with no earners (51) have the lowest median family income of $29,625, accounting for 53.6% and 19.1% of families, respectively.
| Number of Earners | # Families | Median Income |
| No Earners | 51 (19.1%) | $29,625 |
| 1 Earner | 44 (16.5%) | $49,000 |
| 2 Earners | 143 (53.6%) | $100,125 |
| 3+ Earners | 29 (10.9%) | $97,375 |
| Total | 267 (100.0%) | $85,625 |
Household Income in Glidden
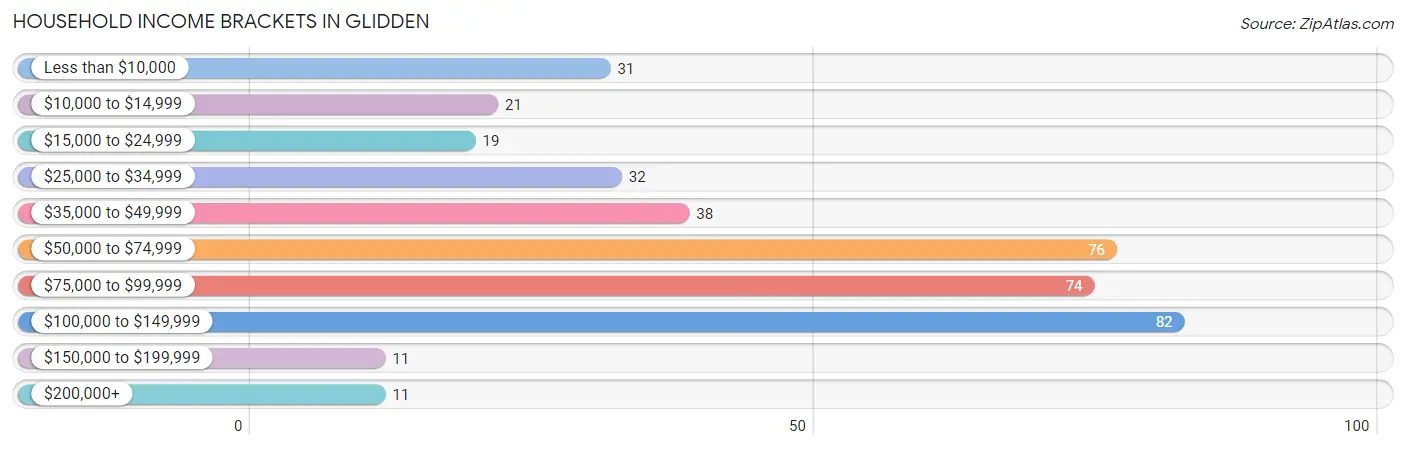
Household Income Brackets in Glidden
With 82 households falling in the category, the $100,000 to $149,999 income range is the most frequent in Glidden, accounting for 20.8% of all households. In contrast, only 11 households (2.8%) fall into the $150,000 to $199,999 income bracket, making it the least populous group.
| Income Bracket | # Households | % Households |
| Less than $10,000 | 31 | 7.8% |
| $10,000 to $14,999 | 21 | 5.3% |
| $15,000 to $24,999 | 19 | 4.8% |
| $25,000 to $34,999 | 32 | 8.1% |
| $35,000 to $49,999 | 38 | 9.6% |
| $50,000 to $74,999 | 76 | 19.2% |
| $75,000 to $99,999 | 74 | 18.7% |
| $100,000 to $149,999 | 82 | 20.8% |
| $150,000 to $199,999 | 11 | 2.8% |
| $200,000+ | 11 | 2.8% |
Household Income by Householder Age in Glidden
The median household income in Glidden is $67,361, with the highest median household income of $93,750 found in the 45 to 64 years age bracket for the primary householder. A total of 177 households (44.8%) fall into this category. Meanwhile, the 15 to 24 years age bracket for the primary householder has the lowest median household income of $0, with 17 households (4.3%) in this group.
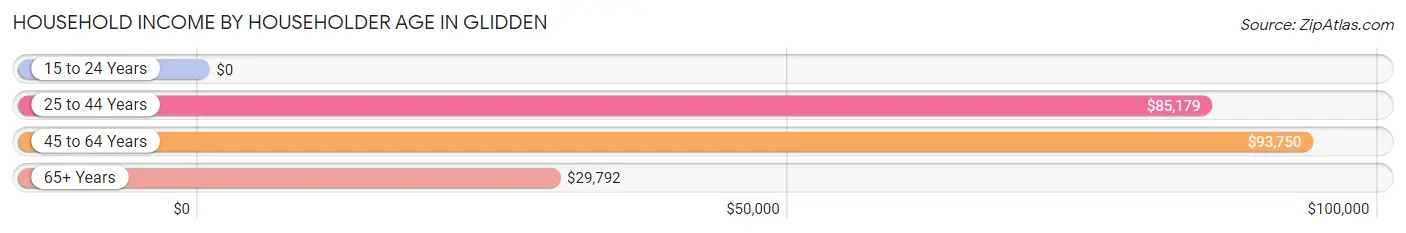
| Income Bracket | # Households | Median Income |
| 15 to 24 Years | 17 (4.3%) | $0 |
| 25 to 44 Years | 93 (23.5%) | $85,179 |
| 45 to 64 Years | 177 (44.8%) | $93,750 |
| 65+ Years | 108 (27.3%) | $29,792 |
| Total | 395 (100.0%) | $67,361 |
Poverty in Glidden
Income Below Poverty by Sex and Age in Glidden
With 13.0% poverty level for males and 11.2% for females among the residents of Glidden, 75 year old and over males and 65 to 74 year old females are the most vulnerable to poverty, with 16 males (57.1%) and 20 females (29.0%) in their respective age groups living below the poverty level.
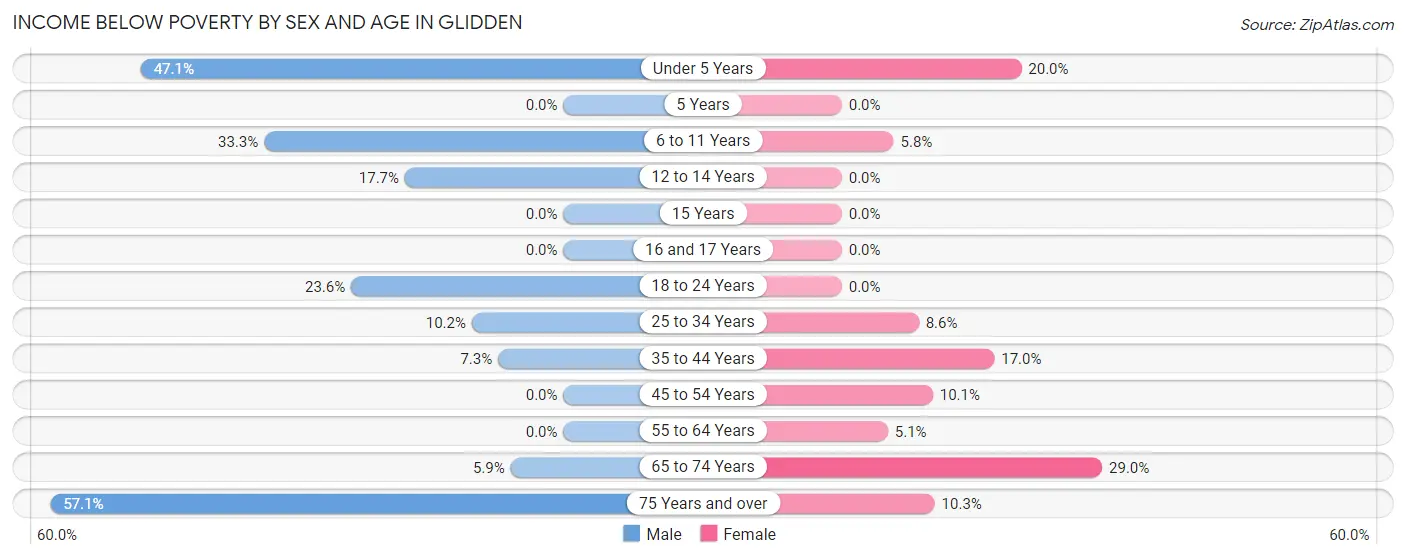
| Age Bracket | Male | Female |
| Under 5 Years | 8 (47.1%) | 5 (20.0%) |
| 5 Years | 0 (0.0%) | 0 (0.0%) |
| 6 to 11 Years | 9 (33.3%) | 3 (5.8%) |
| 12 to 14 Years | 3 (17.6%) | 0 (0.0%) |
| 15 Years | 0 (0.0%) | 0 (0.0%) |
| 16 and 17 Years | 0 (0.0%) | 0 (0.0%) |
| 18 to 24 Years | 13 (23.6%) | 0 (0.0%) |
| 25 to 34 Years | 5 (10.2%) | 3 (8.6%) |
| 35 to 44 Years | 4 (7.3%) | 9 (17.0%) |
| 45 to 54 Years | 0 (0.0%) | 8 (10.1%) |
| 55 to 64 Years | 0 (0.0%) | 4 (5.1%) |
| 65 to 74 Years | 3 (5.9%) | 20 (29.0%) |
| 75 Years and over | 16 (57.1%) | 3 (10.3%) |
| Total | 61 (13.0%) | 55 (11.2%) |
Income Above Poverty by Sex and Age in Glidden
According to the poverty statistics in Glidden, males aged 5 years and females aged 5 years are the age groups that are most secure financially, with 100.0% of males and 100.0% of females in these age groups living above the poverty line.
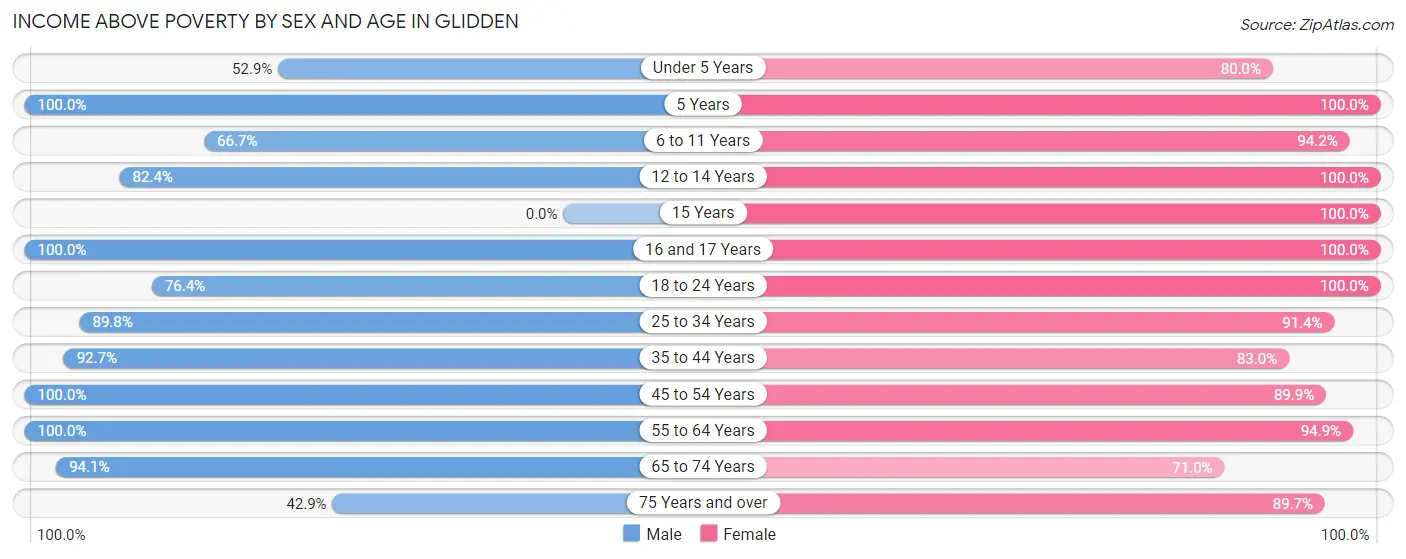
| Age Bracket | Male | Female |
| Under 5 Years | 9 (52.9%) | 20 (80.0%) |
| 5 Years | 3 (100.0%) | 4 (100.0%) |
| 6 to 11 Years | 18 (66.7%) | 49 (94.2%) |
| 12 to 14 Years | 14 (82.4%) | 24 (100.0%) |
| 15 Years | 0 (0.0%) | 11 (100.0%) |
| 16 and 17 Years | 15 (100.0%) | 17 (100.0%) |
| 18 to 24 Years | 42 (76.4%) | 15 (100.0%) |
| 25 to 34 Years | 44 (89.8%) | 32 (91.4%) |
| 35 to 44 Years | 51 (92.7%) | 44 (83.0%) |
| 45 to 54 Years | 81 (100.0%) | 71 (89.9%) |
| 55 to 64 Years | 72 (100.0%) | 74 (94.9%) |
| 65 to 74 Years | 48 (94.1%) | 49 (71.0%) |
| 75 Years and over | 12 (42.9%) | 26 (89.7%) |
| Total | 409 (87.0%) | 436 (88.8%) |
Income Below Poverty Among Married-Couple Families in Glidden
The poverty statistics for married-couple families in Glidden show that 3.1% or 7 of the total 224 families live below the poverty line. Families with no children have the highest poverty rate of 4.4%, comprising of 7 families. On the other hand, families with 1 or 2 children have the lowest poverty rate of 0.0%, which includes 0 families.
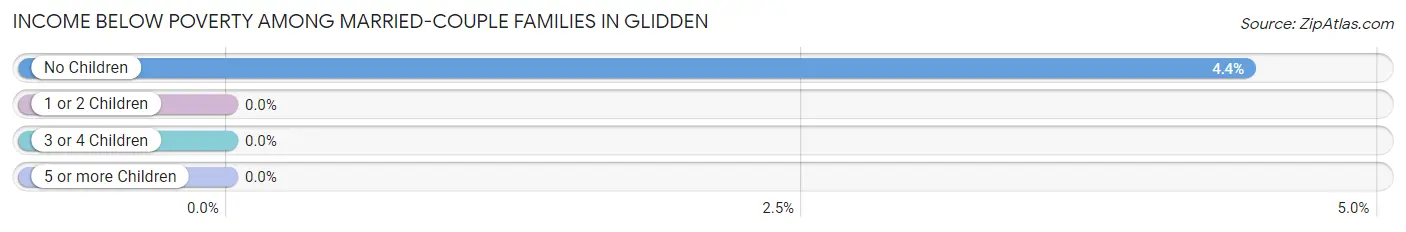
| Children | Above Poverty | Below Poverty |
| No Children | 151 (95.6%) | 7 (4.4%) |
| 1 or 2 Children | 57 (100.0%) | 0 (0.0%) |
| 3 or 4 Children | 9 (100.0%) | 0 (0.0%) |
| 5 or more Children | 0 (0.0%) | 0 (0.0%) |
| Total | 217 (96.9%) | 7 (3.1%) |
Income Below Poverty Among Single-Parent Households in Glidden
According to the poverty data in Glidden, 41.7% or 5 single-father households and 12.9% or 4 single-mother households are living below the poverty line. Among single-father households, those with 3 or 4 children have the highest poverty rate, with 5 households (100.0%) experiencing poverty. Likewise, among single-mother households, those with 3 or 4 children have the highest poverty rate, with 4 households (100.0%) falling below the poverty line.
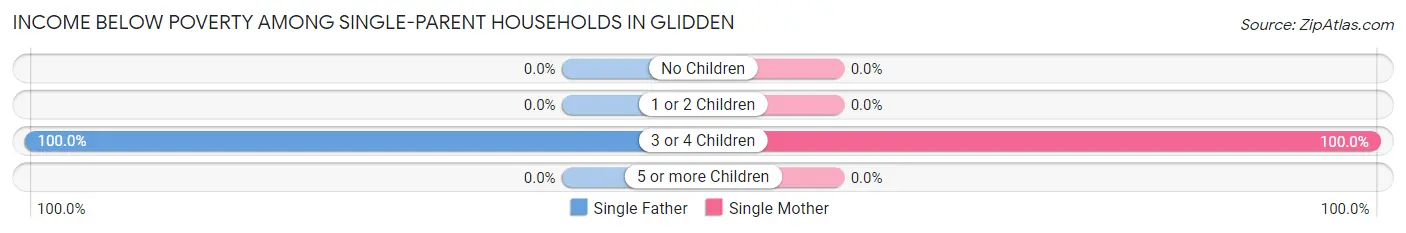
| Children | Single Father | Single Mother |
| No Children | 0 (0.0%) | 0 (0.0%) |
| 1 or 2 Children | 0 (0.0%) | 0 (0.0%) |
| 3 or 4 Children | 5 (100.0%) | 4 (100.0%) |
| 5 or more Children | 0 (0.0%) | 0 (0.0%) |
| Total | 5 (41.7%) | 4 (12.9%) |
Income Below Poverty Among Married-Couple vs Single-Parent Households in Glidden
The poverty data for Glidden shows that 7 of the married-couple family households (3.1%) and 9 of the single-parent households (20.9%) are living below the poverty level. Within the married-couple family households, those with no children have the highest poverty rate, with 7 households (4.4%) falling below the poverty line. Among the single-parent households, those with 3 or 4 children have the highest poverty rate, with 9 household (100.0%) living below poverty.
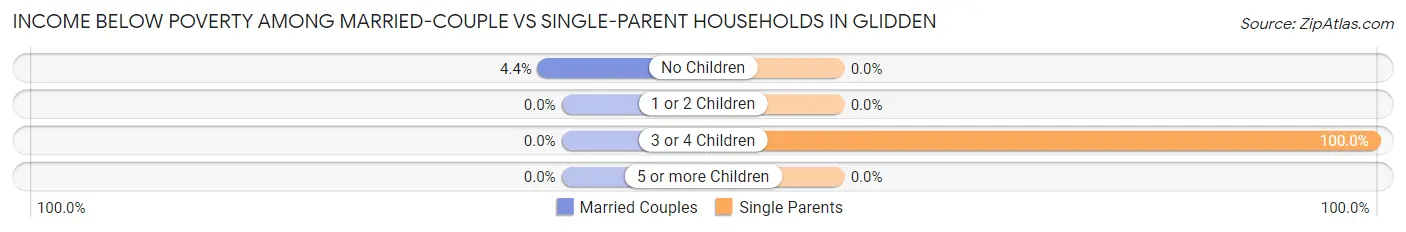
| Children | Married-Couple Families | Single-Parent Households |
| No Children | 7 (4.4%) | 0 (0.0%) |
| 1 or 2 Children | 0 (0.0%) | 0 (0.0%) |
| 3 or 4 Children | 0 (0.0%) | 9 (100.0%) |
| 5 or more Children | 0 (0.0%) | 0 (0.0%) |
| Total | 7 (3.1%) | 9 (20.9%) |
Race in Glidden
The most populous races in Glidden are White / Caucasian (921 | 95.5%), Hispanic or Latino (29 | 3.0%), and Asian (21 | 2.2%).
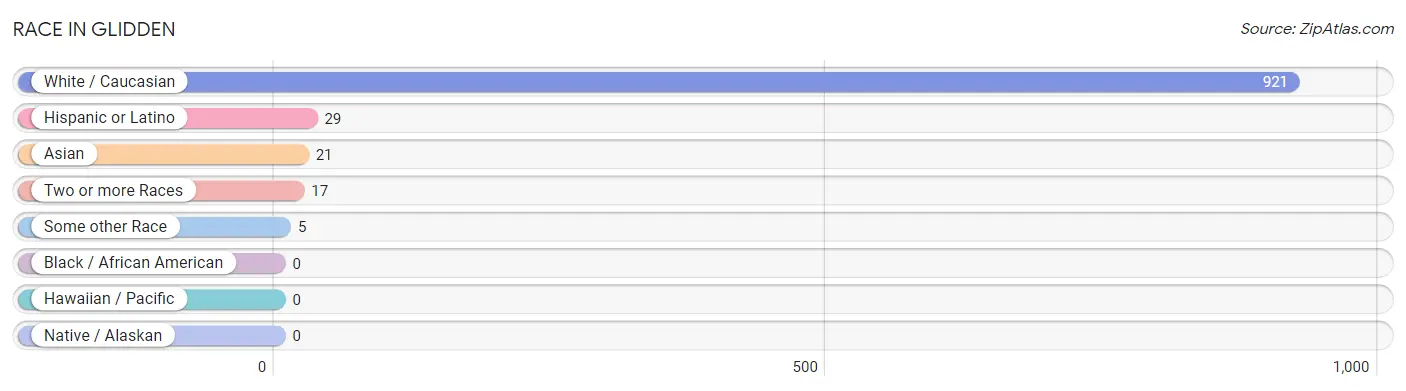
| Race | # Population | % Population |
| Asian | 21 | 2.2% |
| Black / African American | 0 | 0.0% |
| Hawaiian / Pacific | 0 | 0.0% |
| Hispanic or Latino | 29 | 3.0% |
| Native / Alaskan | 0 | 0.0% |
| White / Caucasian | 921 | 95.5% |
| Two or more Races | 17 | 1.8% |
| Some other Race | 5 | 0.5% |
| Total | 964 | 100.0% |
Ancestry in Glidden
The most populous ancestries reported in Glidden are German (446 | 46.3%), American (104 | 10.8%), Irish (73 | 7.6%), English (56 | 5.8%), and Danish (48 | 5.0%), together accounting for 75.4% of all Glidden residents.
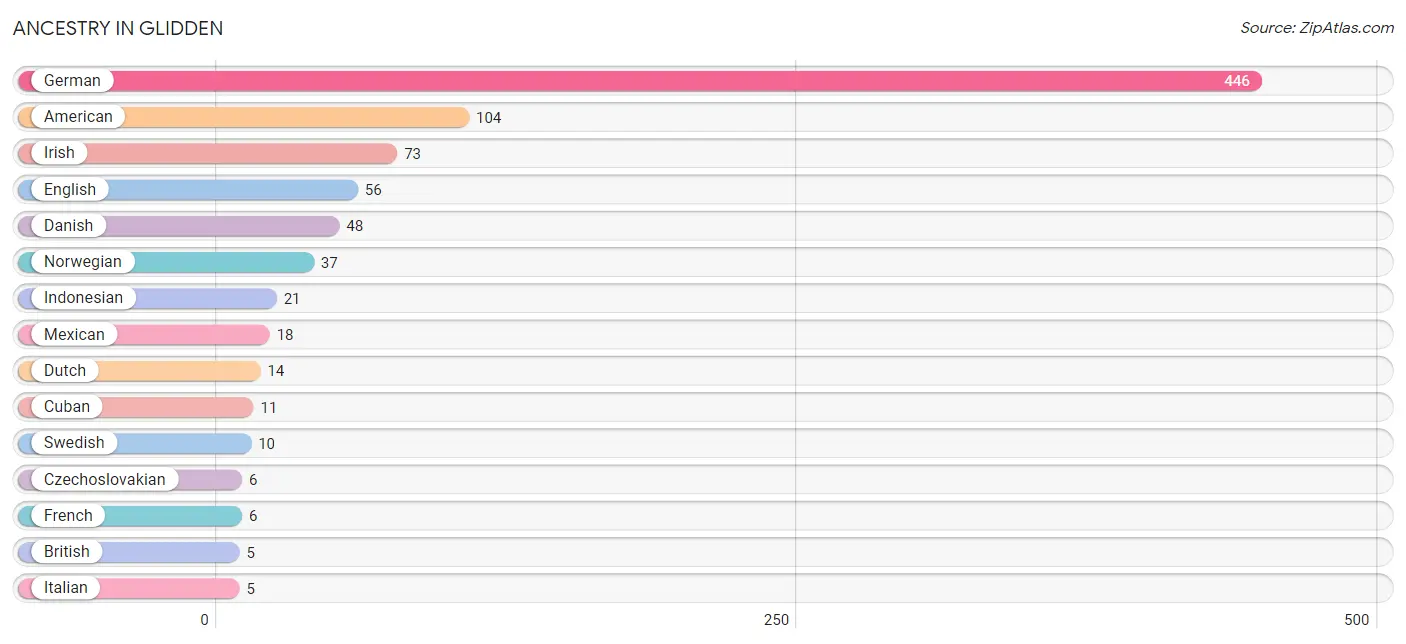
| Ancestry | # Population | % Population |
| American | 104 | 10.8% |
| Belgian | 2 | 0.2% |
| British | 5 | 0.5% |
| Bulgarian | 2 | 0.2% |
| Cuban | 11 | 1.1% |
| Czechoslovakian | 6 | 0.6% |
| Danish | 48 | 5.0% |
| Dutch | 14 | 1.5% |
| English | 56 | 5.8% |
| European | 3 | 0.3% |
| French | 6 | 0.6% |
| French Canadian | 4 | 0.4% |
| German | 446 | 46.3% |
| Indonesian | 21 | 2.2% |
| Irish | 73 | 7.6% |
| Italian | 5 | 0.5% |
| Mexican | 18 | 1.9% |
| Norwegian | 37 | 3.8% |
| Polish | 4 | 0.4% |
| Scotch-Irish | 4 | 0.4% |
| Scottish | 1 | 0.1% |
| Swedish | 10 | 1.0% |
| Swiss | 3 | 0.3% |
| Welsh | 3 | 0.3% | View All 24 Rows |
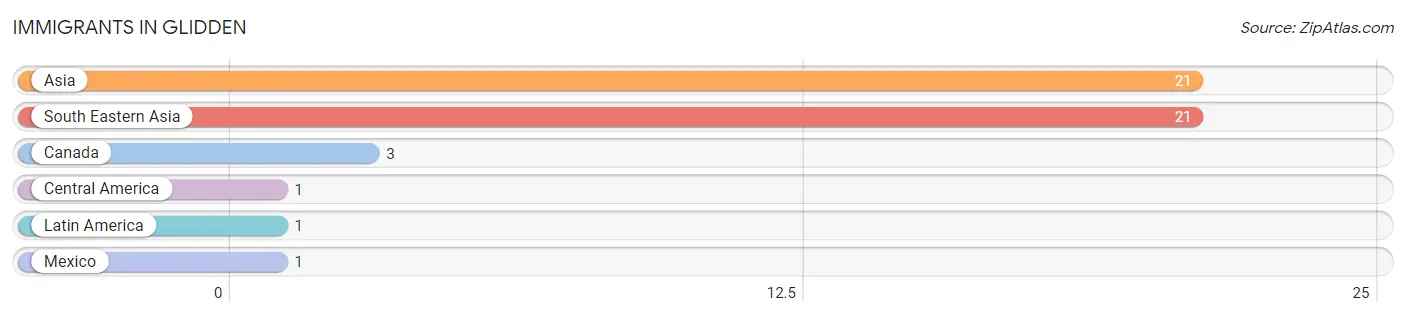
Immigrants in Glidden
The most numerous immigrant groups reported in Glidden came from Asia (21 | 2.2%), South Eastern Asia (21 | 2.2%), Canada (3 | 0.3%), Central America (1 | 0.1%), and Latin America (1 | 0.1%), together accounting for 4.9% of all Glidden residents.
| Immigration Origin | # Population | % Population |
| Asia | 21 | 2.2% |
| Canada | 3 | 0.3% |
| Central America | 1 | 0.1% |
| Latin America | 1 | 0.1% |
| Mexico | 1 | 0.1% |
| South Eastern Asia | 21 | 2.2% | View All 6 Rows |
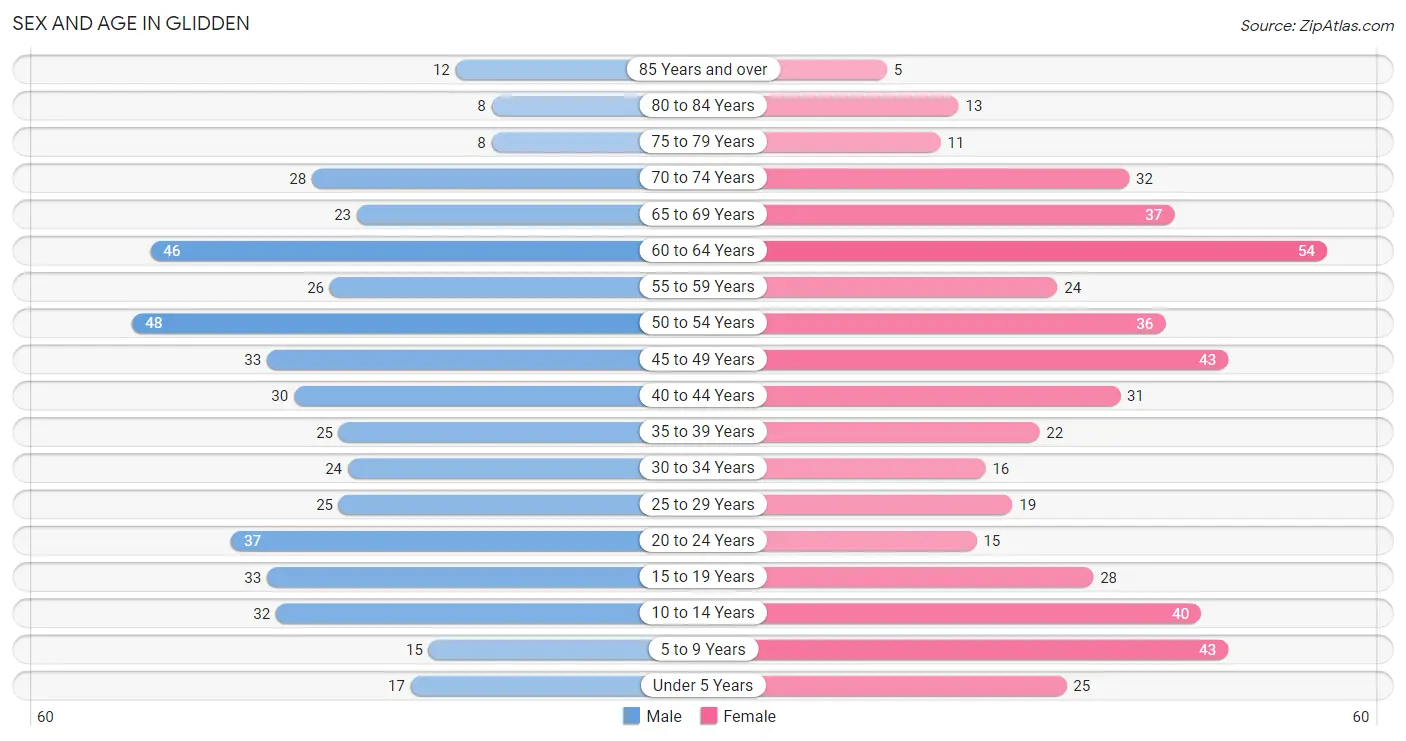
Sex and Age in Glidden
Sex and Age in Glidden
The most populous age groups in Glidden are 50 to 54 Years (48 | 10.2%) for men and 60 to 64 Years (54 | 10.9%) for women.
| Age Bracket | Male | Female |
| Under 5 Years | 17 (3.6%) | 25 (5.1%) |
| 5 to 9 Years | 15 (3.2%) | 43 (8.7%) |
| 10 to 14 Years | 32 (6.8%) | 40 (8.1%) |
| 15 to 19 Years | 33 (7.0%) | 28 (5.7%) |
| 20 to 24 Years | 37 (7.9%) | 15 (3.0%) |
| 25 to 29 Years | 25 (5.3%) | 19 (3.8%) |
| 30 to 34 Years | 24 (5.1%) | 16 (3.2%) |
| 35 to 39 Years | 25 (5.3%) | 22 (4.4%) |
| 40 to 44 Years | 30 (6.4%) | 31 (6.3%) |
| 45 to 49 Years | 33 (7.0%) | 43 (8.7%) |
| 50 to 54 Years | 48 (10.2%) | 36 (7.3%) |
| 55 to 59 Years | 26 (5.5%) | 24 (4.9%) |
| 60 to 64 Years | 46 (9.8%) | 54 (10.9%) |
| 65 to 69 Years | 23 (4.9%) | 37 (7.5%) |
| 70 to 74 Years | 28 (6.0%) | 32 (6.5%) |
| 75 to 79 Years | 8 (1.7%) | 11 (2.2%) |
| 80 to 84 Years | 8 (1.7%) | 13 (2.6%) |
| 85 Years and over | 12 (2.5%) | 5 (1.0%) |
| Total | 470 (100.0%) | 494 (100.0%) |
Families and Households in Glidden
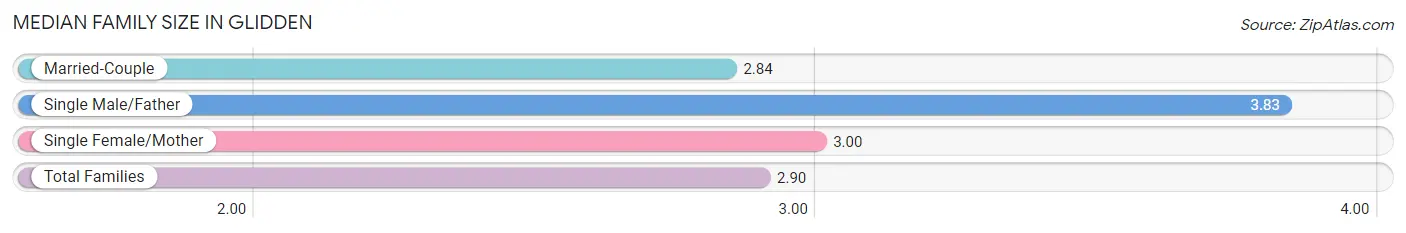
Median Family Size in Glidden
The median family size in Glidden is 2.90 persons per family, with single male/father families (12 | 4.5%) accounting for the largest median family size of 3.83 persons per family. On the other hand, married-couple families (224 | 83.9%) represent the smallest median family size with 2.84 persons per family.
| Family Type | # Families | Family Size |
| Married-Couple | 224 (83.9%) | 2.84 |
| Single Male/Father | 12 (4.5%) | 3.83 |
| Single Female/Mother | 31 (11.6%) | 3.00 |
| Total Families | 267 (100.0%) | 2.90 |
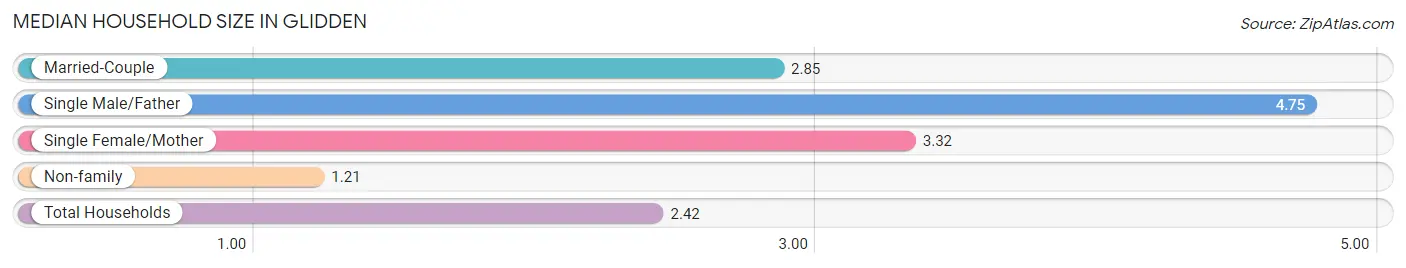
Median Household Size in Glidden
The median household size in Glidden is 2.42 persons per household, with single male/father households (12 | 3.0%) accounting for the largest median household size of 4.75 persons per household. non-family households (128 | 32.4%) represent the smallest median household size with 1.21 persons per household.
| Household Type | # Households | Household Size |
| Married-Couple | 224 (56.7%) | 2.85 |
| Single Male/Father | 12 (3.0%) | 4.75 |
| Single Female/Mother | 31 (7.9%) | 3.32 |
| Non-family | 128 (32.4%) | 1.21 |
| Total Households | 395 (100.0%) | 2.42 |
Household Size by Marriage Status in Glidden
Out of a total of 395 households in Glidden, 267 (67.6%) are family households, while 128 (32.4%) are nonfamily households. The most numerous type of family households are 2-person households, comprising 162, and the most common type of nonfamily households are 1-person households, comprising 110.
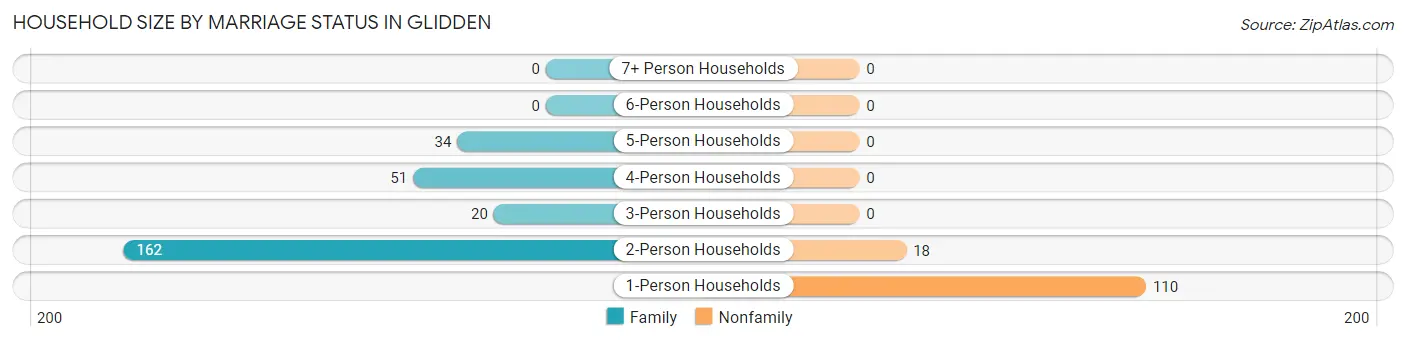
| Household Size | Family Households | Nonfamily Households |
| 1-Person Households | - | 110 (27.9%) |
| 2-Person Households | 162 (41.0%) | 18 (4.6%) |
| 3-Person Households | 20 (5.1%) | 0 (0.0%) |
| 4-Person Households | 51 (12.9%) | 0 (0.0%) |
| 5-Person Households | 34 (8.6%) | 0 (0.0%) |
| 6-Person Households | 0 (0.0%) | 0 (0.0%) |
| 7+ Person Households | 0 (0.0%) | 0 (0.0%) |
| Total | 267 (67.6%) | 128 (32.4%) |
Female Fertility in Glidden
Fertility by Age in Glidden
Average fertility rate in Glidden is 34.0 births per 1,000 women. Women in the age bracket of 20 to 34 years have the highest fertility rate with 60.0 births per 1,000 women. Women in the age bracket of 20 to 34 years acount for 50.0% of all women with births.
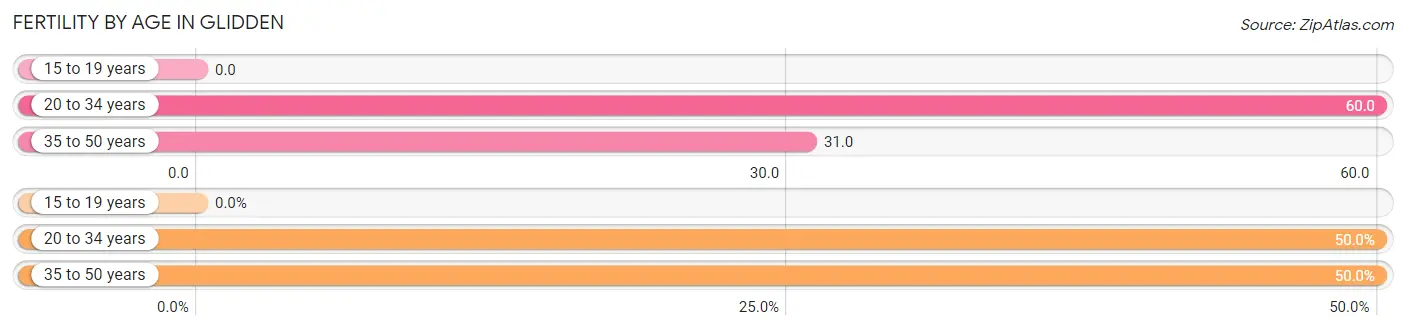
| Age Bracket | Women with Births | Births / 1,000 Women |
| 15 to 19 years | 0 (0.0%) | 0.0 |
| 20 to 34 years | 3 (50.0%) | 60.0 |
| 35 to 50 years | 3 (50.0%) | 31.0 |
| Total | 6 (100.0%) | 34.0 |
Fertility by Age by Marriage Status in Glidden
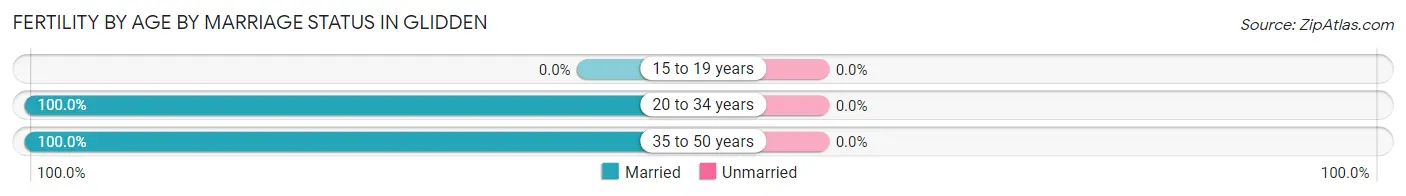
| Age Bracket | Married | Unmarried |
| 15 to 19 years | 0 (0.0%) | 0 (0.0%) |
| 20 to 34 years | 3 (100.0%) | 0 (0.0%) |
| 35 to 50 years | 3 (100.0%) | 0 (0.0%) |
| Total | 6 (100.0%) | 0 (0.0%) |
Fertility by Education in Glidden
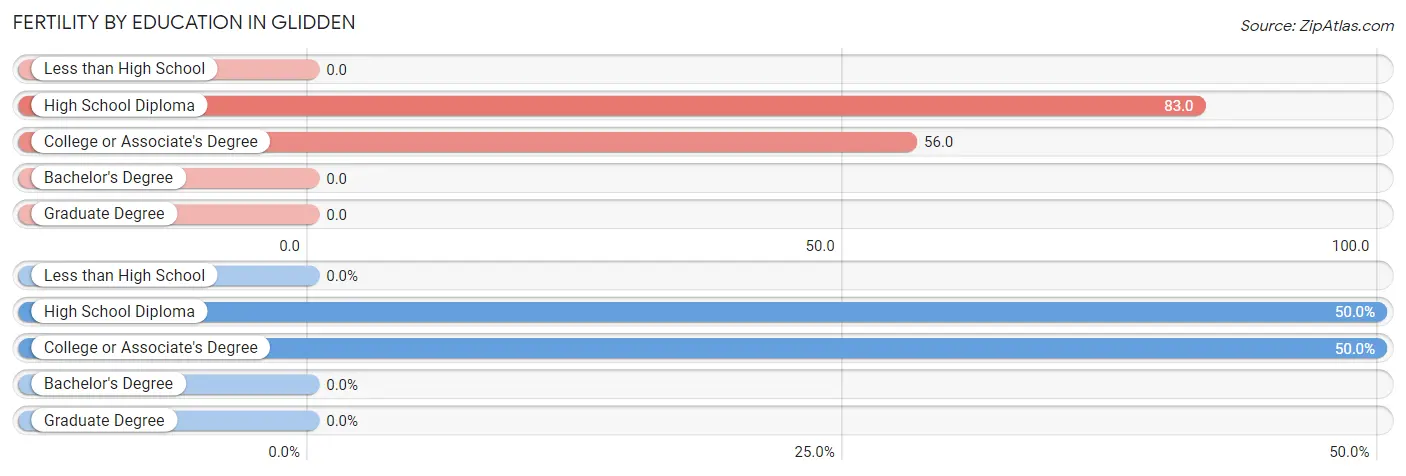
| Educational Attainment | Women with Births | Births / 1,000 Women |
| Less than High School | 0 (0.0%) | 0.0 |
| High School Diploma | 3 (50.0%) | 83.0 |
| College or Associate's Degree | 3 (50.0%) | 56.0 |
| Bachelor's Degree | 0 (0.0%) | 0.0 |
| Graduate Degree | 0 (0.0%) | 0.0 |
| Total | 6 (100.0%) | 34.0 |
Fertility by Education by Marriage Status in Glidden
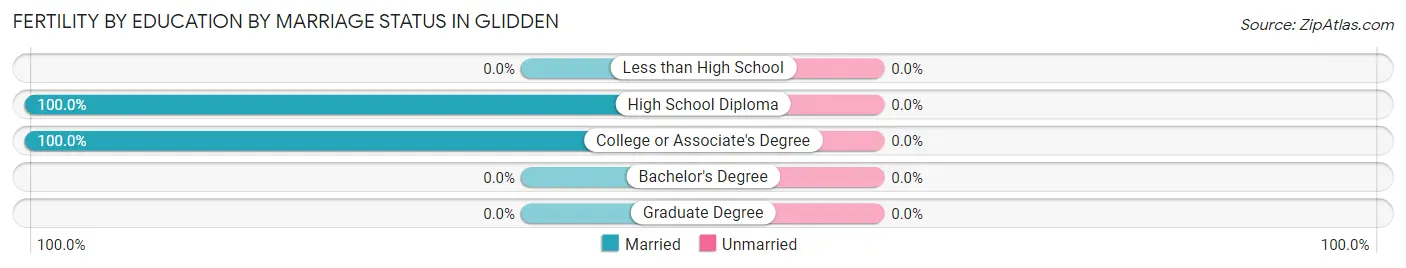
| Educational Attainment | Married | Unmarried |
| Less than High School | 0 (0.0%) | 0 (0.0%) |
| High School Diploma | 3 (100.0%) | 0 (0.0%) |
| College or Associate's Degree | 3 (100.0%) | 0 (0.0%) |
| Bachelor's Degree | 0 (0.0%) | 0 (0.0%) |
| Graduate Degree | 0 (0.0%) | 0 (0.0%) |
| Total | 6 (100.0%) | 0 (0.0%) |
Employment Characteristics in Glidden
Employment by Class of Employer in Glidden
Among the 537 employed individuals in Glidden, private company employees (380 | 70.8%), local government employees (64 | 11.9%), and self-employed (not incorporated) (37 | 6.9%) make up the most common classes of employment.
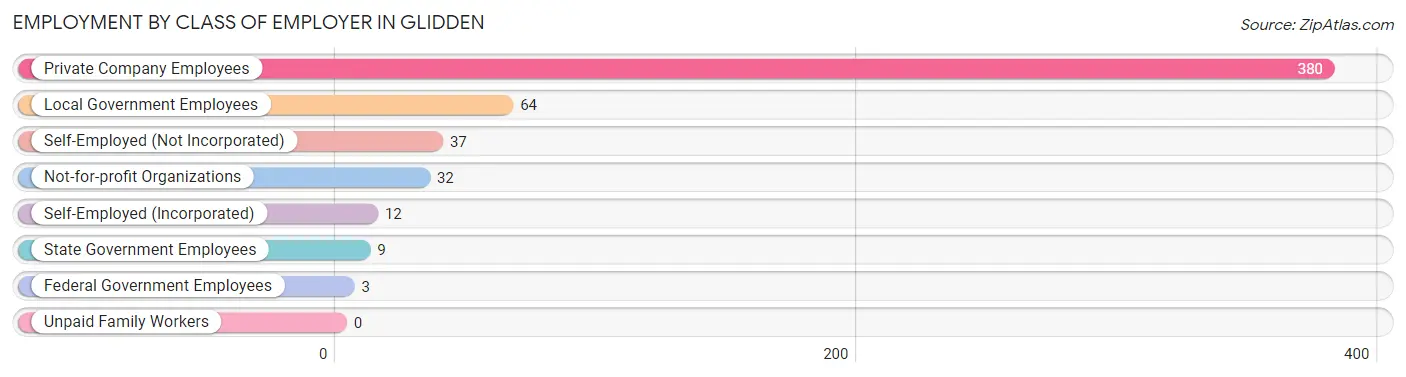
| Employer Class | # Employees | % Employees |
| Private Company Employees | 380 | 70.8% |
| Self-Employed (Incorporated) | 12 | 2.2% |
| Self-Employed (Not Incorporated) | 37 | 6.9% |
| Not-for-profit Organizations | 32 | 6.0% |
| Local Government Employees | 64 | 11.9% |
| State Government Employees | 9 | 1.7% |
| Federal Government Employees | 3 | 0.6% |
| Unpaid Family Workers | 0 | 0.0% |
| Total | 537 | 100.0% |
Employment Status by Age in Glidden
According to the labor force statistics for Glidden, out of the total population over 16 years of age (781), 70.8% or 553 individuals are in the labor force, with 0.9% or 5 of them unemployed. The age group with the highest labor force participation rate is 25 to 29 years, with 100.0% or 44 individuals in the labor force. Within the labor force, the 45 to 54 years age range has the highest percentage of unemployed individuals, with 3.4% or 5 of them being unemployed.
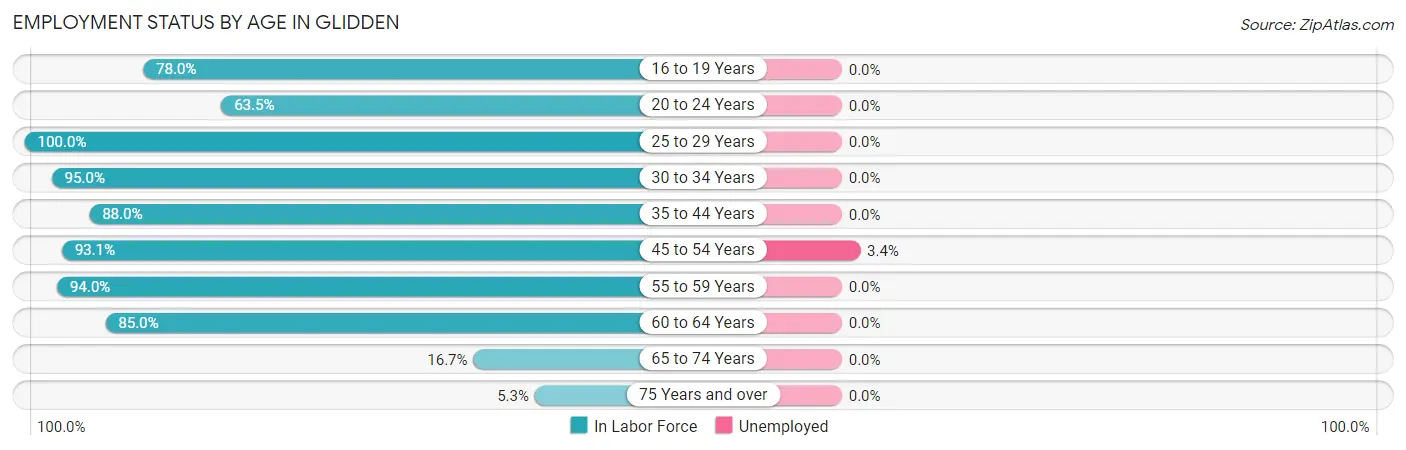
| Age Bracket | In Labor Force | Unemployed |
| 16 to 19 Years | 39 (78.0%) | 0 (0.0%) |
| 20 to 24 Years | 33 (63.5%) | 0 (0.0%) |
| 25 to 29 Years | 44 (100.0%) | 0 (0.0%) |
| 30 to 34 Years | 38 (95.0%) | 0 (0.0%) |
| 35 to 44 Years | 95 (88.0%) | 0 (0.0%) |
| 45 to 54 Years | 149 (93.1%) | 5 (3.4%) |
| 55 to 59 Years | 47 (94.0%) | 0 (0.0%) |
| 60 to 64 Years | 85 (85.0%) | 0 (0.0%) |
| 65 to 74 Years | 20 (16.7%) | 0 (0.0%) |
| 75 Years and over | 3 (5.3%) | 0 (0.0%) |
| Total | 553 (70.8%) | 5 (0.9%) |
Employment Status by Educational Attainment in Glidden
According to labor force statistics for Glidden, 91.2% of individuals (458) out of the total population between 25 and 64 years of age (502) are in the labor force, with 1.1% or 5 of them being unemployed. The group with the highest labor force participation rate are those with the educational attainment of college / associate degree, with 95.5% or 192 individuals in the labor force. Within the labor force, individuals with less than high school education have the highest percentage of unemployment, with 25.0% or 5 of them being unemployed.
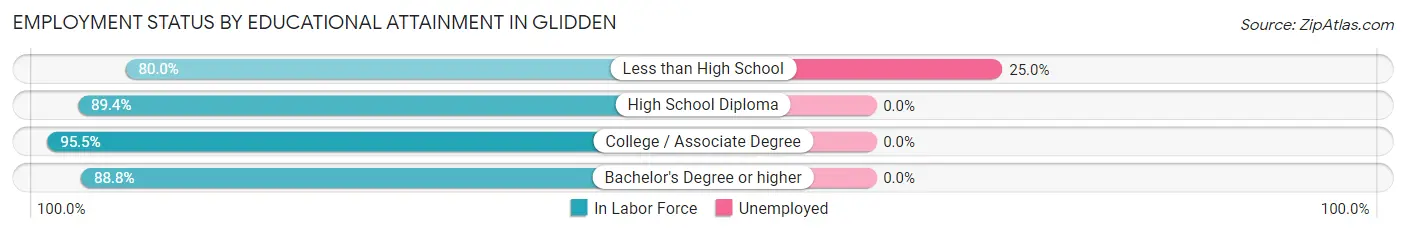
| Educational Attainment | In Labor Force | Unemployed |
| Less than High School | 20 (80.0%) | 6 (25.0%) |
| High School Diploma | 143 (89.4%) | 0 (0.0%) |
| College / Associate Degree | 192 (95.5%) | 0 (0.0%) |
| Bachelor's Degree or higher | 103 (88.8%) | 0 (0.0%) |
| Total | 458 (91.2%) | 6 (1.1%) |
Employment Occupations by Sex in Glidden
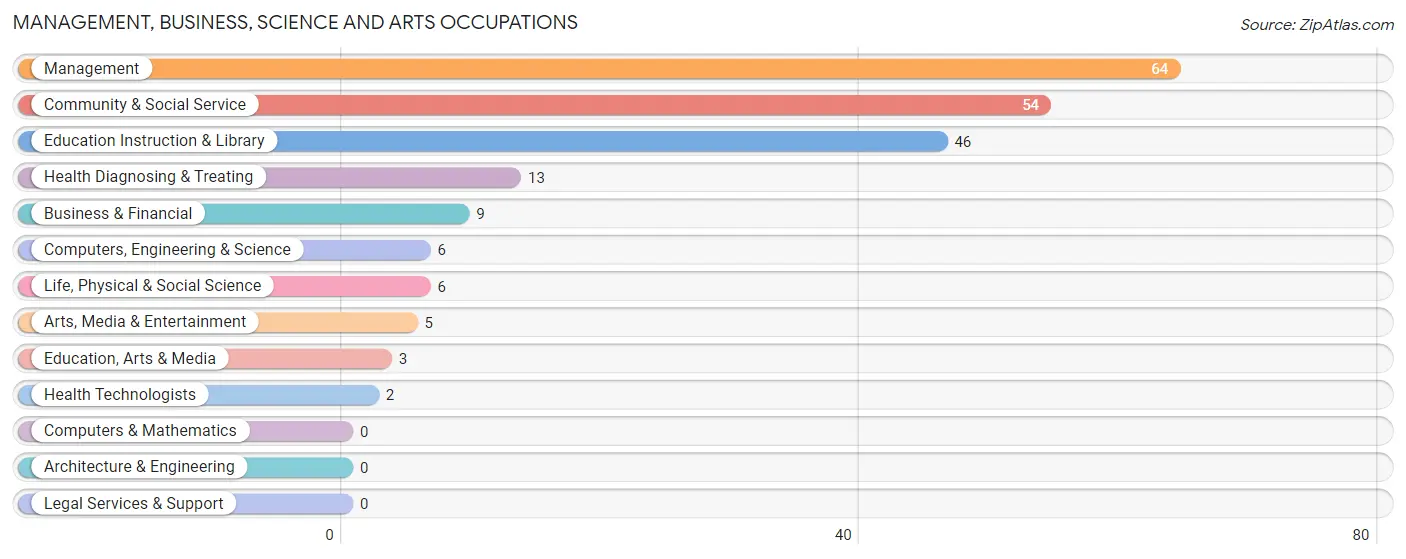
Management, Business, Science and Arts Occupations
The most common Management, Business, Science and Arts occupations in Glidden are Management (64 | 11.7%), Community & Social Service (54 | 9.9%), Education Instruction & Library (46 | 8.4%), Health Diagnosing & Treating (13 | 2.4%), and Business & Financial (9 | 1.6%).
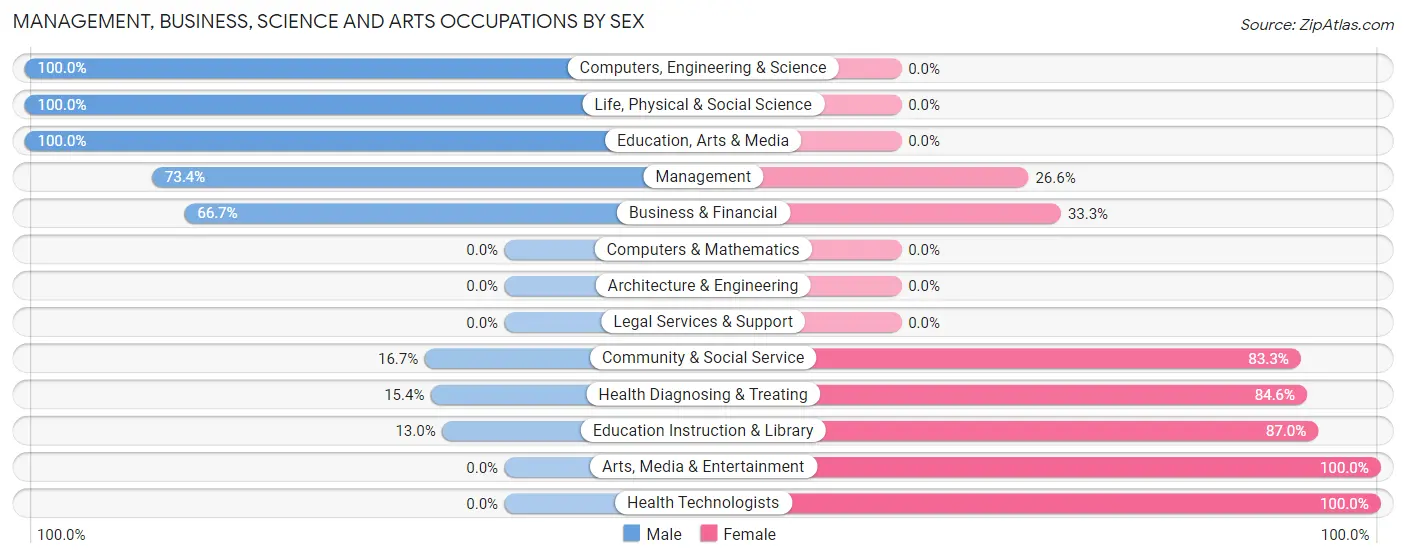
Management, Business, Science and Arts Occupations by Sex
Within the Management, Business, Science and Arts occupations in Glidden, the most male-oriented occupations are Computers, Engineering & Science (100.0%), Life, Physical & Social Science (100.0%), and Education, Arts & Media (100.0%), while the most female-oriented occupations are Arts, Media & Entertainment (100.0%), Health Technologists (100.0%), and Education Instruction & Library (87.0%).
| Occupation | Male | Female |
| Management | 47 (73.4%) | 17 (26.6%) |
| Business & Financial | 6 (66.7%) | 3 (33.3%) |
| Computers, Engineering & Science | 6 (100.0%) | 0 (0.0%) |
| Computers & Mathematics | 0 (0.0%) | 0 (0.0%) |
| Architecture & Engineering | 0 (0.0%) | 0 (0.0%) |
| Life, Physical & Social Science | 6 (100.0%) | 0 (0.0%) |
| Community & Social Service | 9 (16.7%) | 45 (83.3%) |
| Education, Arts & Media | 3 (100.0%) | 0 (0.0%) |
| Legal Services & Support | 0 (0.0%) | 0 (0.0%) |
| Education Instruction & Library | 6 (13.0%) | 40 (87.0%) |
| Arts, Media & Entertainment | 0 (0.0%) | 5 (100.0%) |
| Health Diagnosing & Treating | 2 (15.4%) | 11 (84.6%) |
| Health Technologists | 0 (0.0%) | 2 (100.0%) |
| Total (Category) | 70 (47.9%) | 76 (52.0%) |
| Total (Overall) | 300 (54.7%) | 248 (45.3%) |
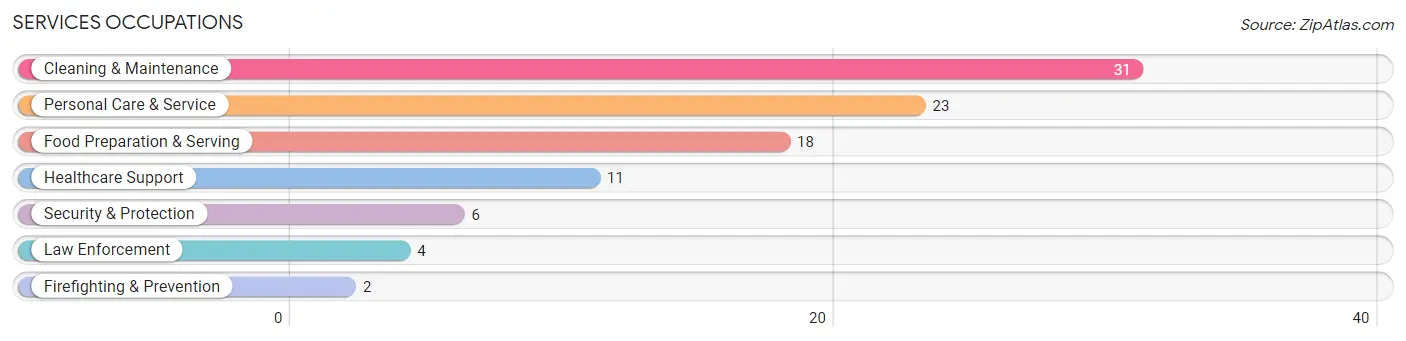
Services Occupations
The most common Services occupations in Glidden are Cleaning & Maintenance (31 | 5.7%), Personal Care & Service (23 | 4.2%), Food Preparation & Serving (18 | 3.3%), Healthcare Support (11 | 2.0%), and Security & Protection (6 | 1.1%).
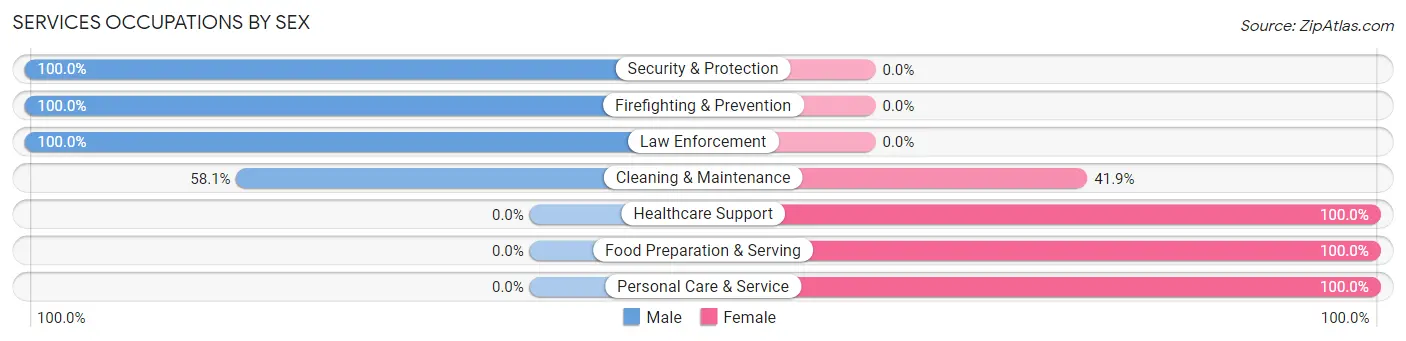
Services Occupations by Sex
Within the Services occupations in Glidden, the most male-oriented occupations are Security & Protection (100.0%), Firefighting & Prevention (100.0%), and Law Enforcement (100.0%), while the most female-oriented occupations are Healthcare Support (100.0%), Food Preparation & Serving (100.0%), and Personal Care & Service (100.0%).
| Occupation | Male | Female |
| Healthcare Support | 0 (0.0%) | 11 (100.0%) |
| Security & Protection | 6 (100.0%) | 0 (0.0%) |
| Firefighting & Prevention | 2 (100.0%) | 0 (0.0%) |
| Law Enforcement | 4 (100.0%) | 0 (0.0%) |
| Food Preparation & Serving | 0 (0.0%) | 18 (100.0%) |
| Cleaning & Maintenance | 18 (58.1%) | 13 (41.9%) |
| Personal Care & Service | 0 (0.0%) | 23 (100.0%) |
| Total (Category) | 24 (27.0%) | 65 (73.0%) |
| Total (Overall) | 300 (54.7%) | 248 (45.3%) |
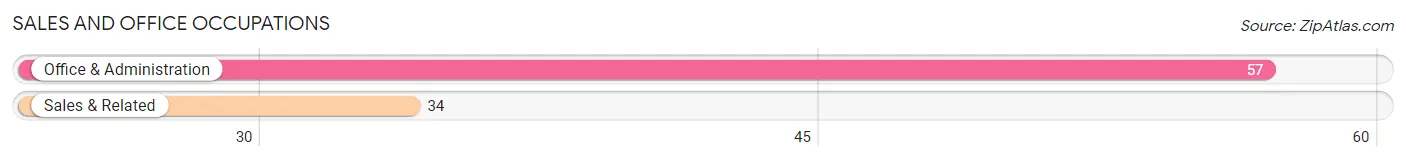
Sales and Office Occupations
The most common Sales and Office occupations in Glidden are Office & Administration (57 | 10.4%), and Sales & Related (34 | 6.2%).
Sales and Office Occupations by Sex
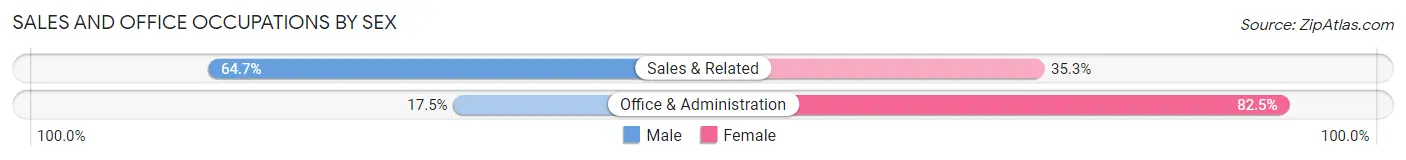
| Occupation | Male | Female |
| Sales & Related | 22 (64.7%) | 12 (35.3%) |
| Office & Administration | 10 (17.5%) | 47 (82.5%) |
| Total (Category) | 32 (35.2%) | 59 (64.8%) |
| Total (Overall) | 300 (54.7%) | 248 (45.3%) |
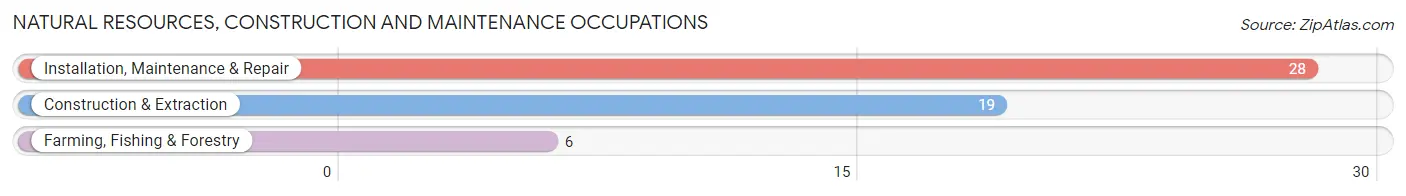
Natural Resources, Construction and Maintenance Occupations
The most common Natural Resources, Construction and Maintenance occupations in Glidden are Installation, Maintenance & Repair (28 | 5.1%), Construction & Extraction (19 | 3.5%), and Farming, Fishing & Forestry (6 | 1.1%).
Natural Resources, Construction and Maintenance Occupations by Sex
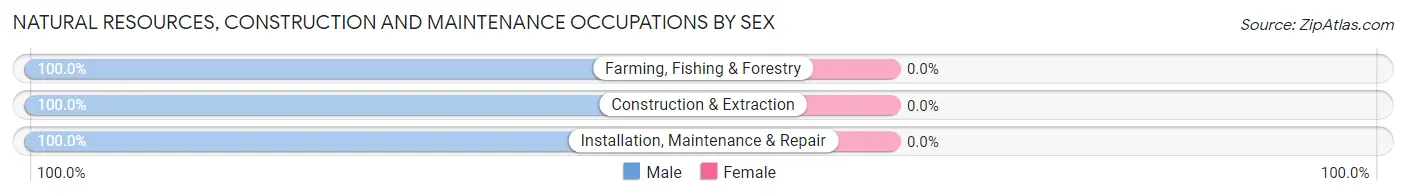
| Occupation | Male | Female |
| Farming, Fishing & Forestry | 6 (100.0%) | 0 (0.0%) |
| Construction & Extraction | 19 (100.0%) | 0 (0.0%) |
| Installation, Maintenance & Repair | 28 (100.0%) | 0 (0.0%) |
| Total (Category) | 53 (100.0%) | 0 (0.0%) |
| Total (Overall) | 300 (54.7%) | 248 (45.3%) |
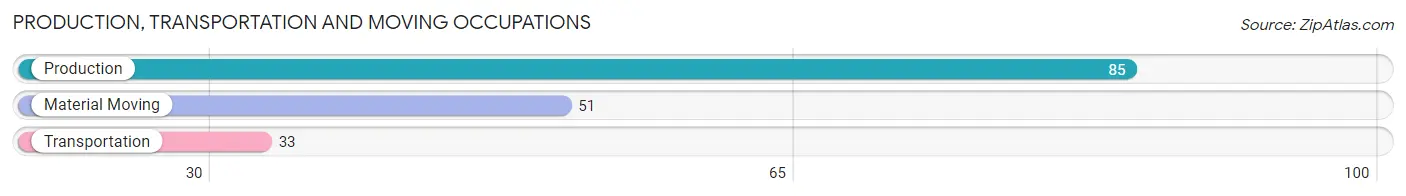
Production, Transportation and Moving Occupations
The most common Production, Transportation and Moving occupations in Glidden are Production (85 | 15.5%), Material Moving (51 | 9.3%), and Transportation (33 | 6.0%).
Production, Transportation and Moving Occupations by Sex
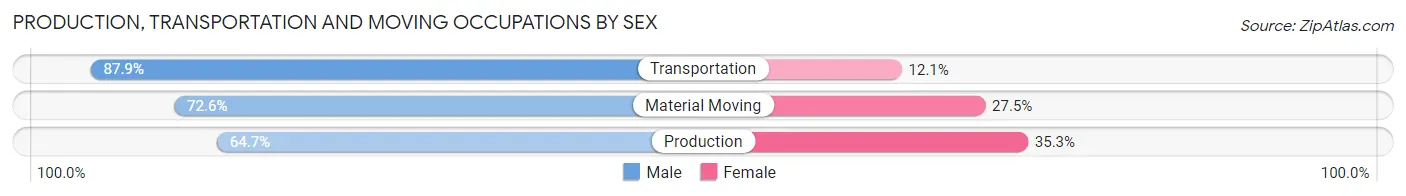
| Occupation | Male | Female |
| Production | 55 (64.7%) | 30 (35.3%) |
| Transportation | 29 (87.9%) | 4 (12.1%) |
| Material Moving | 37 (72.6%) | 14 (27.5%) |
| Total (Category) | 121 (71.6%) | 48 (28.4%) |
| Total (Overall) | 300 (54.7%) | 248 (45.3%) |
Employment Industries by Sex in Glidden
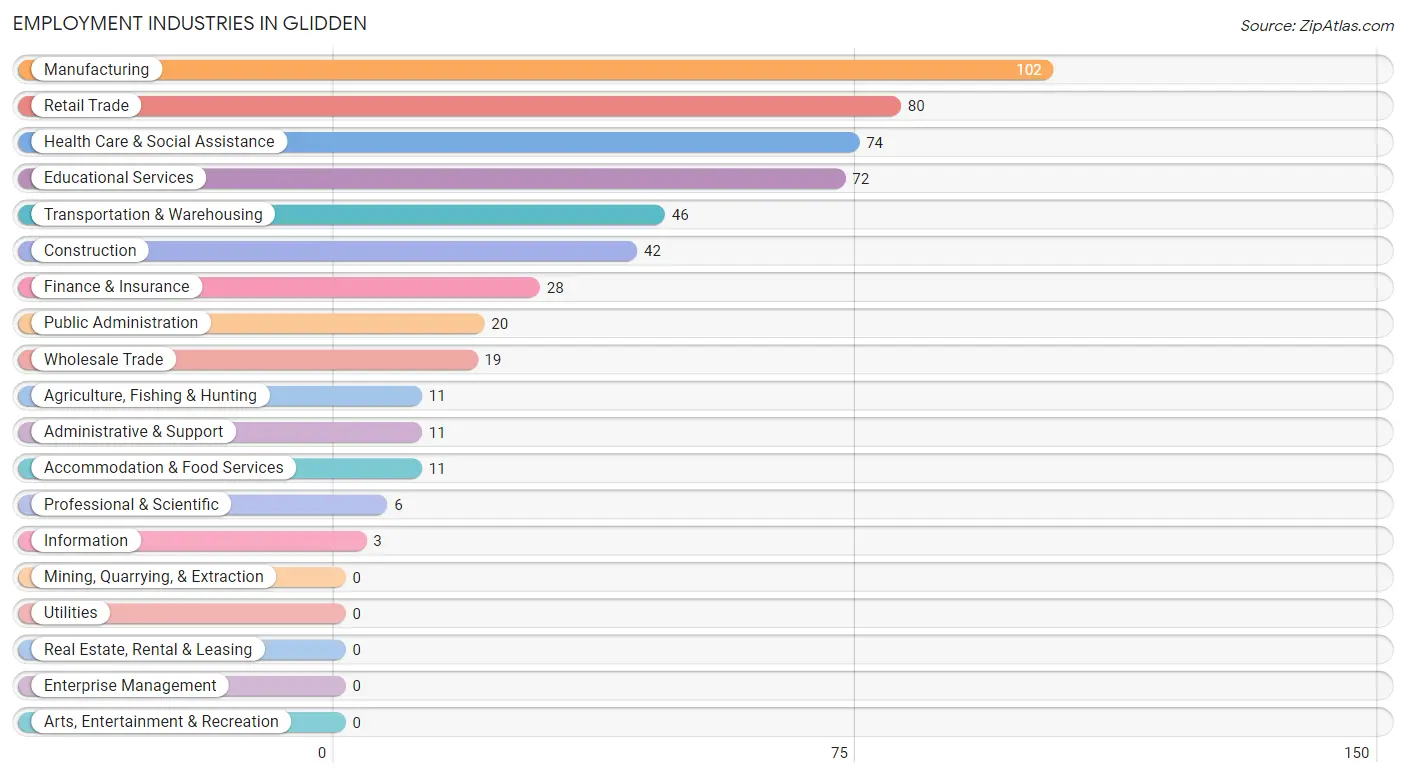
Employment Industries in Glidden
The major employment industries in Glidden include Manufacturing (102 | 18.6%), Retail Trade (80 | 14.6%), Health Care & Social Assistance (74 | 13.5%), Educational Services (72 | 13.1%), and Transportation & Warehousing (46 | 8.4%).
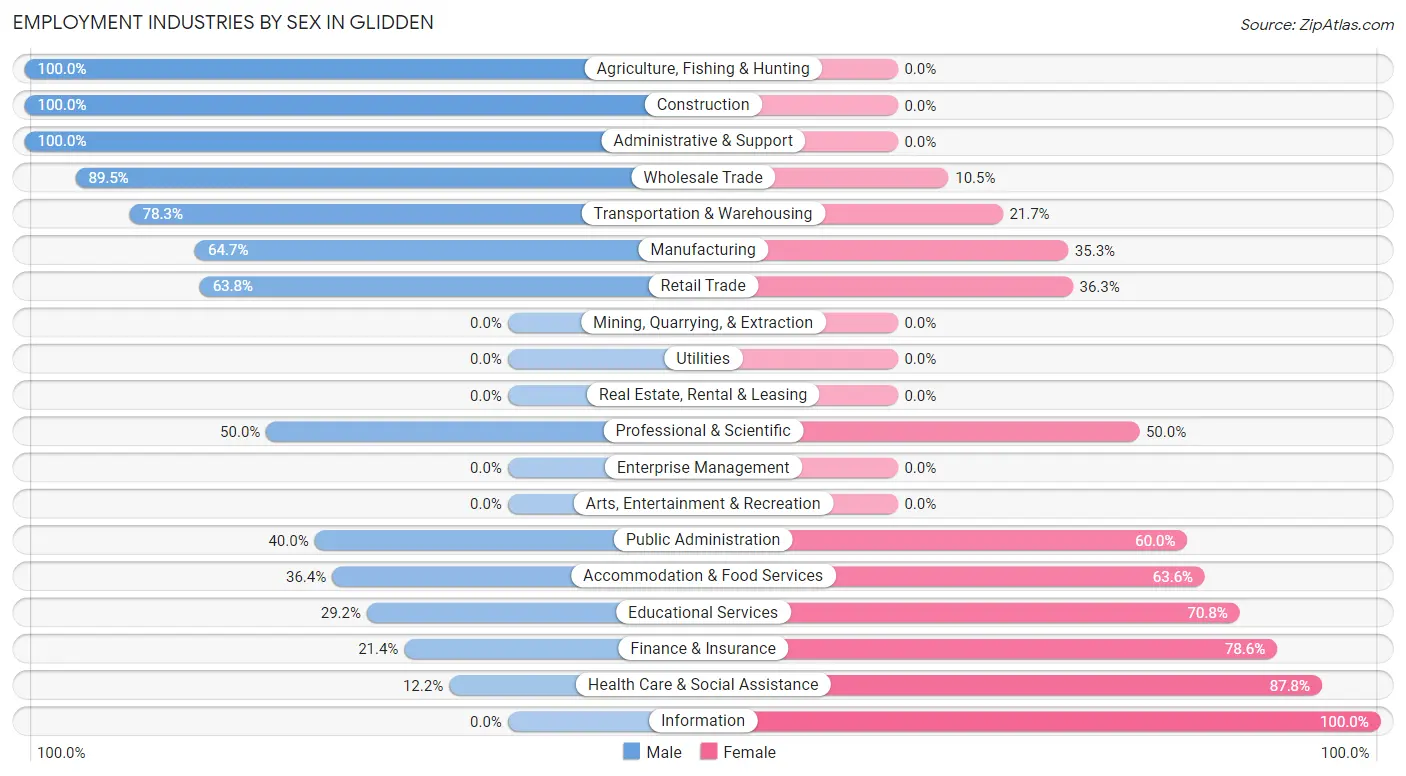
Employment Industries by Sex in Glidden
The Glidden industries that see more men than women are Agriculture, Fishing & Hunting (100.0%), Construction (100.0%), and Administrative & Support (100.0%), whereas the industries that tend to have a higher number of women are Information (100.0%), Health Care & Social Assistance (87.8%), and Finance & Insurance (78.6%).
| Industry | Male | Female |
| Agriculture, Fishing & Hunting | 11 (100.0%) | 0 (0.0%) |
| Mining, Quarrying, & Extraction | 0 (0.0%) | 0 (0.0%) |
| Construction | 42 (100.0%) | 0 (0.0%) |
| Manufacturing | 66 (64.7%) | 36 (35.3%) |
| Wholesale Trade | 17 (89.5%) | 2 (10.5%) |
| Retail Trade | 51 (63.7%) | 29 (36.2%) |
| Transportation & Warehousing | 36 (78.3%) | 10 (21.7%) |
| Utilities | 0 (0.0%) | 0 (0.0%) |
| Information | 0 (0.0%) | 3 (100.0%) |
| Finance & Insurance | 6 (21.4%) | 22 (78.6%) |
| Real Estate, Rental & Leasing | 0 (0.0%) | 0 (0.0%) |
| Professional & Scientific | 3 (50.0%) | 3 (50.0%) |
| Enterprise Management | 0 (0.0%) | 0 (0.0%) |
| Administrative & Support | 11 (100.0%) | 0 (0.0%) |
| Educational Services | 21 (29.2%) | 51 (70.8%) |
| Health Care & Social Assistance | 9 (12.2%) | 65 (87.8%) |
| Arts, Entertainment & Recreation | 0 (0.0%) | 0 (0.0%) |
| Accommodation & Food Services | 4 (36.4%) | 7 (63.6%) |
| Public Administration | 8 (40.0%) | 12 (60.0%) |
| Total | 300 (54.7%) | 248 (45.3%) |
Education in Glidden
School Enrollment in Glidden
The most common levels of schooling among the 206 students in Glidden are high school (65 | 31.6%), elementary school (53 | 25.7%), and middle school (50 | 24.3%).
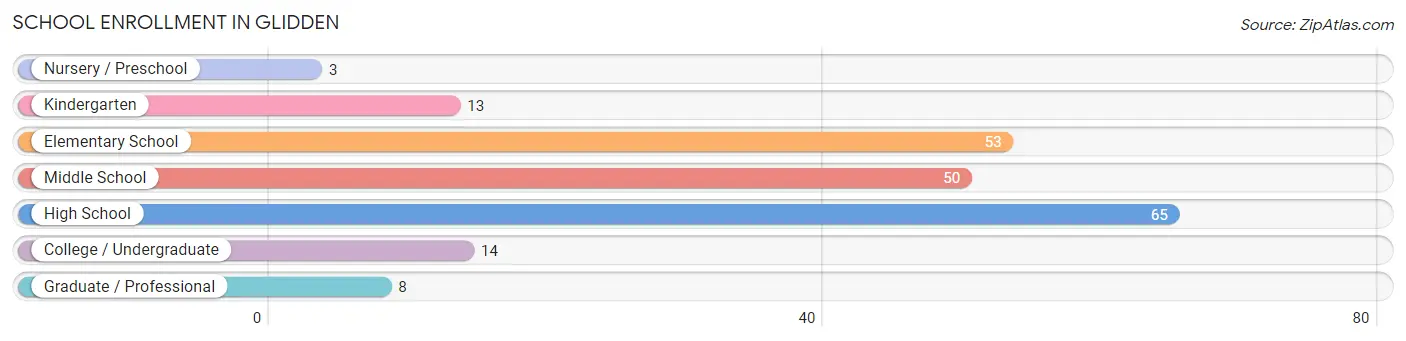
| School Level | # Students | % Students |
| Nursery / Preschool | 3 | 1.5% |
| Kindergarten | 13 | 6.3% |
| Elementary School | 53 | 25.7% |
| Middle School | 50 | 24.3% |
| High School | 65 | 31.6% |
| College / Undergraduate | 14 | 6.8% |
| Graduate / Professional | 8 | 3.9% |
| Total | 206 | 100.0% |
School Enrollment by Age by Funding Source in Glidden
Out of a total of 206 students who are enrolled in schools in Glidden, 7 (3.4%) attend a private institution, while the remaining 199 (96.6%) are enrolled in public schools. The age group of 35 years and over has the highest likelihood of being enrolled in private schools, with 3 (21.4% in the age bracket) enrolled. Conversely, the age group of 10 to 14 year olds has the lowest likelihood of being enrolled in a private school, with 69 (100.0% in the age bracket) attending a public institution.
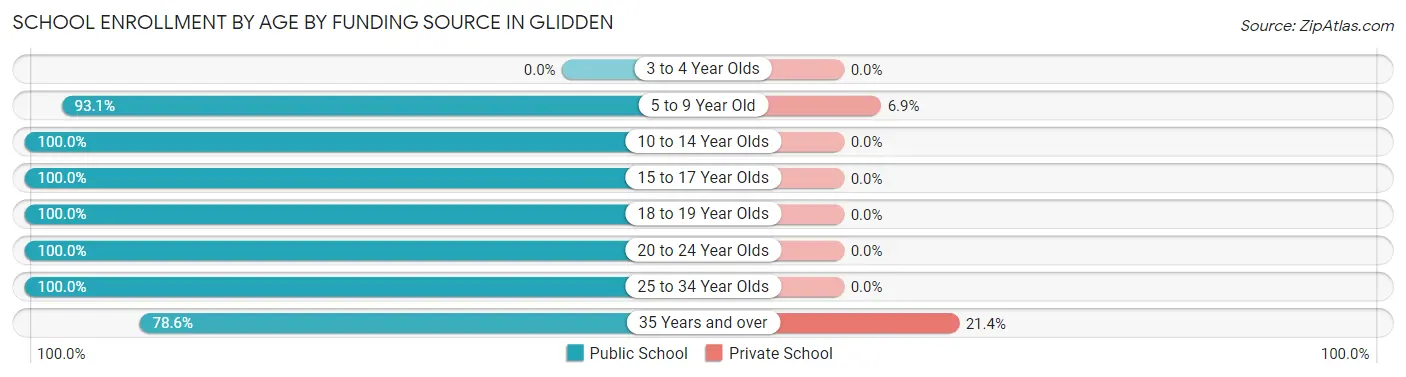
| Age Bracket | Public School | Private School |
| 3 to 4 Year Olds | 0 (0.0%) | 0 (0.0%) |
| 5 to 9 Year Old | 54 (93.1%) | 4 (6.9%) |
| 10 to 14 Year Olds | 69 (100.0%) | 0 (0.0%) |
| 15 to 17 Year Olds | 43 (100.0%) | 0 (0.0%) |
| 18 to 19 Year Olds | 14 (100.0%) | 0 (0.0%) |
| 20 to 24 Year Olds | 6 (100.0%) | 0 (0.0%) |
| 25 to 34 Year Olds | 2 (100.0%) | 0 (0.0%) |
| 35 Years and over | 11 (78.6%) | 3 (21.4%) |
| Total | 199 (96.6%) | 7 (3.4%) |
Educational Attainment by Field of Study in Glidden
Education (88 | 54.3%), business (30 | 18.5%), bio, nature & agricultural (12 | 7.4%), computers & mathematics (6 | 3.7%), and psychology (6 | 3.7%) are the most common fields of study among 162 individuals in Glidden who have obtained a bachelor's degree or higher.
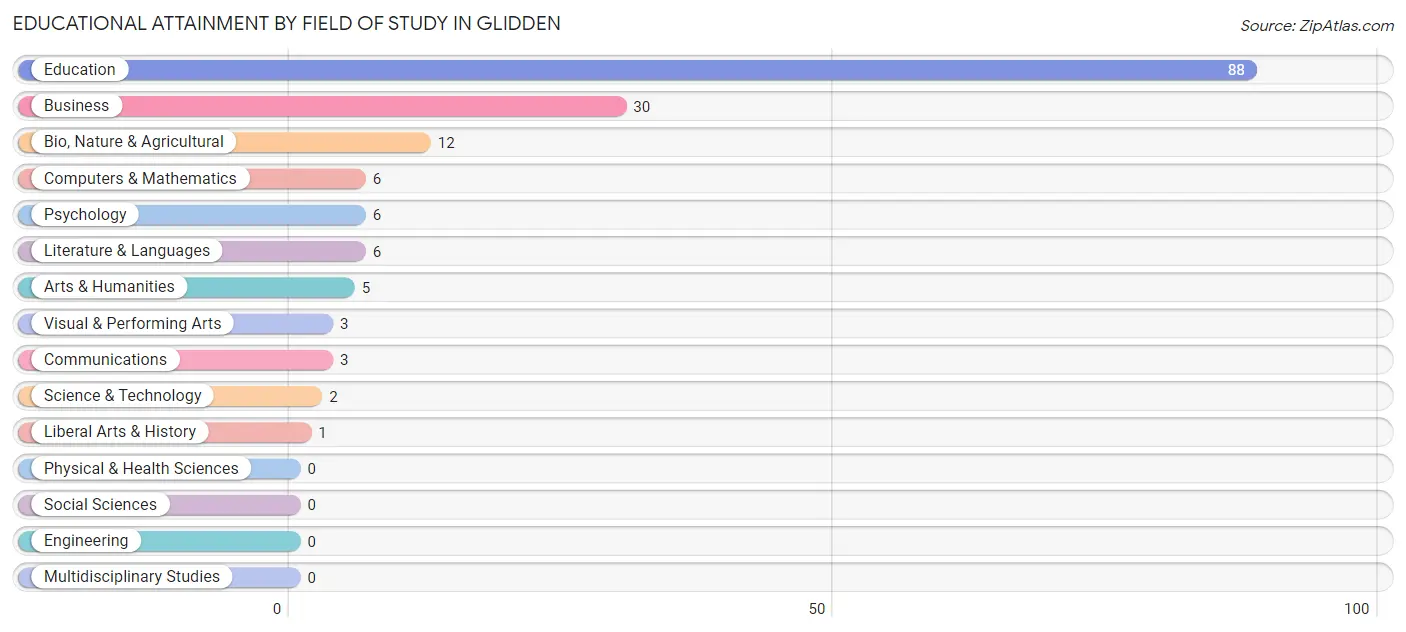
| Field of Study | # Graduates | % Graduates |
| Computers & Mathematics | 6 | 3.7% |
| Bio, Nature & Agricultural | 12 | 7.4% |
| Physical & Health Sciences | 0 | 0.0% |
| Psychology | 6 | 3.7% |
| Social Sciences | 0 | 0.0% |
| Engineering | 0 | 0.0% |
| Multidisciplinary Studies | 0 | 0.0% |
| Science & Technology | 2 | 1.2% |
| Business | 30 | 18.5% |
| Education | 88 | 54.3% |
| Literature & Languages | 6 | 3.7% |
| Liberal Arts & History | 1 | 0.6% |
| Visual & Performing Arts | 3 | 1.8% |
| Communications | 3 | 1.8% |
| Arts & Humanities | 5 | 3.1% |
| Total | 162 | 100.0% |
Transportation & Commute in Glidden
Vehicle Availability by Sex in Glidden
The most prevalent vehicle ownership categories in Glidden are males with 2 vehicles (118, accounting for 41.4%) and females with 2 vehicles (98, making up 47.6%).
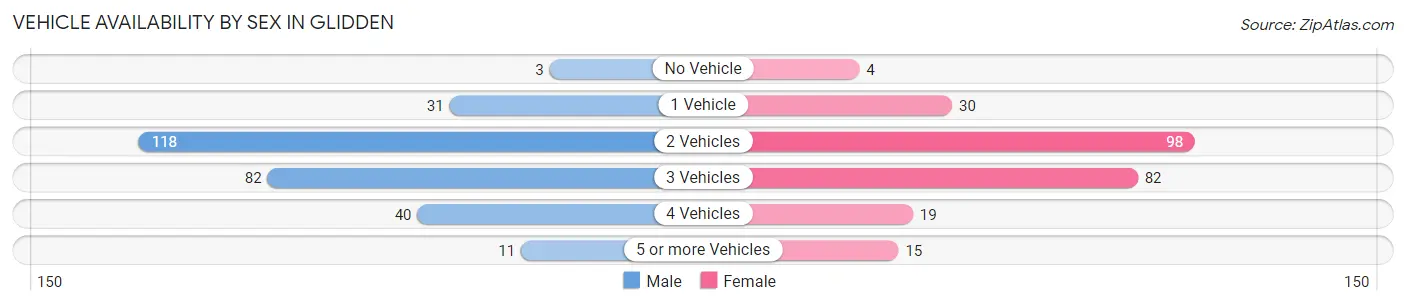
| Vehicles Available | Male | Female |
| No Vehicle | 3 (1.1%) | 4 (1.6%) |
| 1 Vehicle | 31 (10.9%) | 30 (12.1%) |
| 2 Vehicles | 118 (41.4%) | 98 (39.5%) |
| 3 Vehicles | 82 (28.8%) | 82 (33.1%) |
| 4 Vehicles | 40 (14.0%) | 19 (7.7%) |
| 5 or more Vehicles | 11 (3.9%) | 15 (6.0%) |
| Total | 285 (100.0%) | 248 (100.0%) |
Commute Time in Glidden
The most frequently occuring commute durations in Glidden are 10 to 14 minutes (184 commuters, 35.5%), 15 to 19 minutes (92 commuters, 17.8%), and less than 5 minutes (69 commuters, 13.3%).
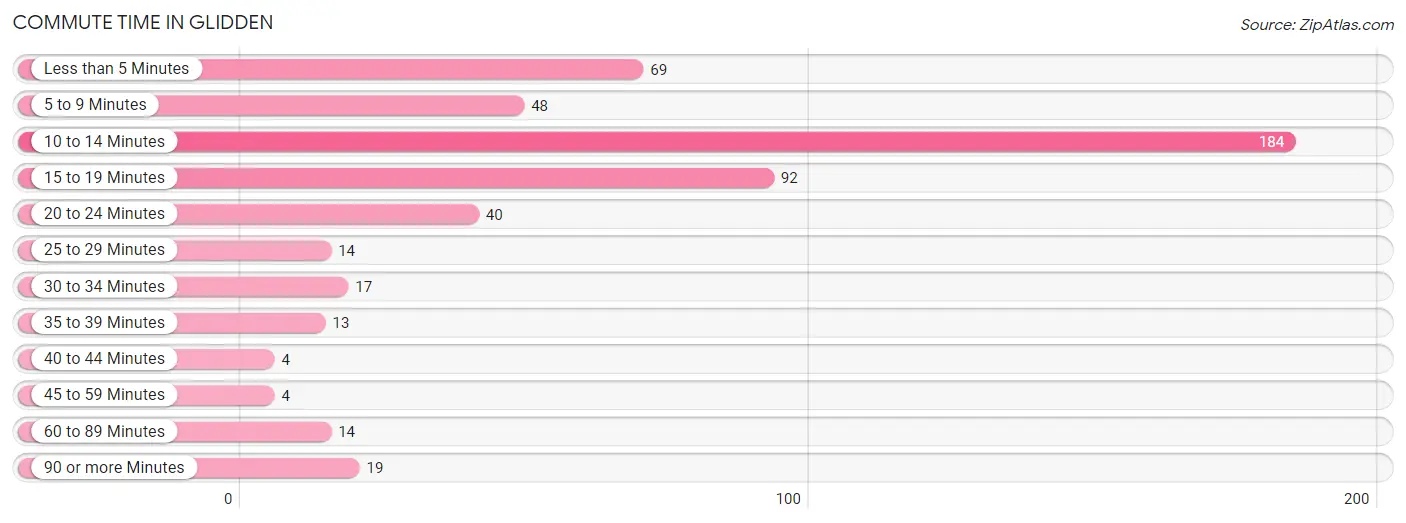
| Commute Time | # Commuters | % Commuters |
| Less than 5 Minutes | 69 | 13.3% |
| 5 to 9 Minutes | 48 | 9.3% |
| 10 to 14 Minutes | 184 | 35.5% |
| 15 to 19 Minutes | 92 | 17.8% |
| 20 to 24 Minutes | 40 | 7.7% |
| 25 to 29 Minutes | 14 | 2.7% |
| 30 to 34 Minutes | 17 | 3.3% |
| 35 to 39 Minutes | 13 | 2.5% |
| 40 to 44 Minutes | 4 | 0.8% |
| 45 to 59 Minutes | 4 | 0.8% |
| 60 to 89 Minutes | 14 | 2.7% |
| 90 or more Minutes | 19 | 3.7% |
Commute Time by Sex in Glidden
The most common commute times in Glidden are 10 to 14 minutes (96 commuters, 33.2%) for males and 10 to 14 minutes (88 commuters, 38.4%) for females.
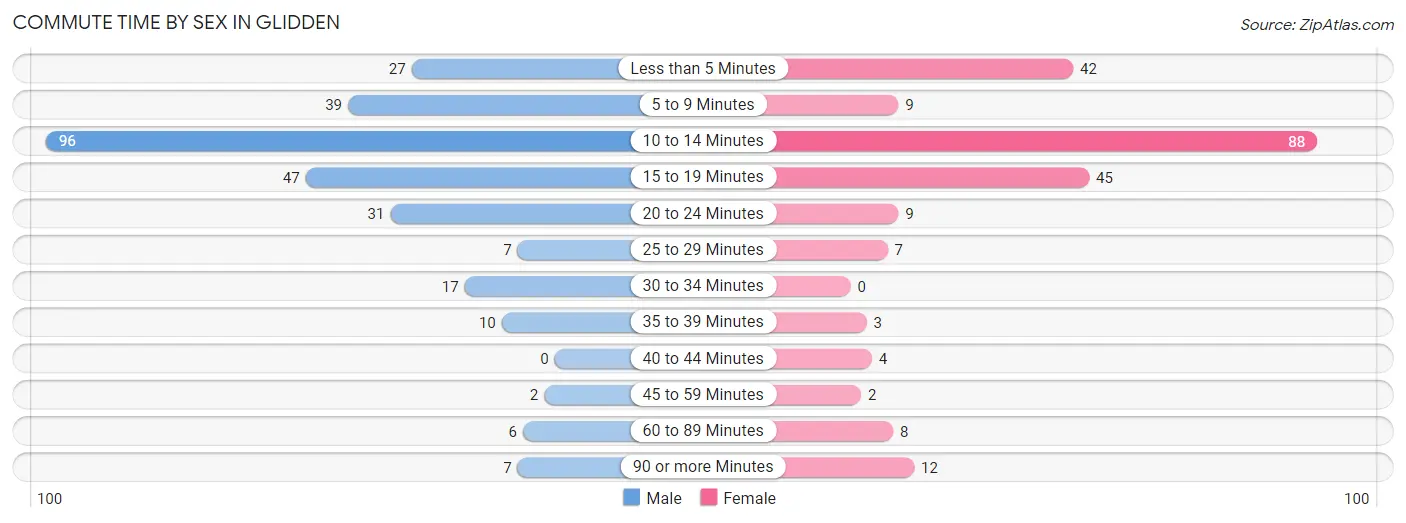
| Commute Time | Male | Female |
| Less than 5 Minutes | 27 (9.3%) | 42 (18.3%) |
| 5 to 9 Minutes | 39 (13.5%) | 9 (3.9%) |
| 10 to 14 Minutes | 96 (33.2%) | 88 (38.4%) |
| 15 to 19 Minutes | 47 (16.3%) | 45 (19.7%) |
| 20 to 24 Minutes | 31 (10.7%) | 9 (3.9%) |
| 25 to 29 Minutes | 7 (2.4%) | 7 (3.1%) |
| 30 to 34 Minutes | 17 (5.9%) | 0 (0.0%) |
| 35 to 39 Minutes | 10 (3.5%) | 3 (1.3%) |
| 40 to 44 Minutes | 0 (0.0%) | 4 (1.8%) |
| 45 to 59 Minutes | 2 (0.7%) | 2 (0.9%) |
| 60 to 89 Minutes | 6 (2.1%) | 8 (3.5%) |
| 90 or more Minutes | 7 (2.4%) | 12 (5.2%) |
Time of Departure to Work by Sex in Glidden
The most frequent times of departure to work in Glidden are 6:30 AM to 6:59 AM (54, 18.7%) for males and 7:00 AM to 7:29 AM (42, 18.3%) for females.
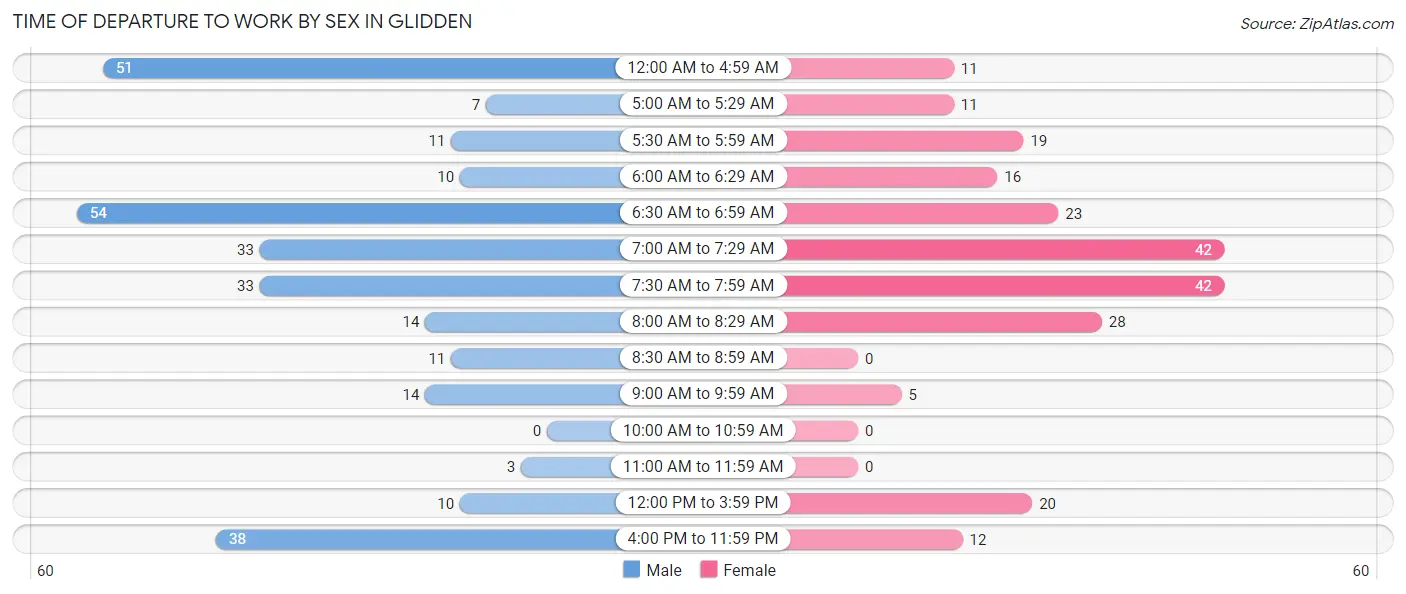
| Time of Departure | Male | Female |
| 12:00 AM to 4:59 AM | 51 (17.6%) | 11 (4.8%) |
| 5:00 AM to 5:29 AM | 7 (2.4%) | 11 (4.8%) |
| 5:30 AM to 5:59 AM | 11 (3.8%) | 19 (8.3%) |
| 6:00 AM to 6:29 AM | 10 (3.5%) | 16 (7.0%) |
| 6:30 AM to 6:59 AM | 54 (18.7%) | 23 (10.0%) |
| 7:00 AM to 7:29 AM | 33 (11.4%) | 42 (18.3%) |
| 7:30 AM to 7:59 AM | 33 (11.4%) | 42 (18.3%) |
| 8:00 AM to 8:29 AM | 14 (4.8%) | 28 (12.2%) |
| 8:30 AM to 8:59 AM | 11 (3.8%) | 0 (0.0%) |
| 9:00 AM to 9:59 AM | 14 (4.8%) | 5 (2.2%) |
| 10:00 AM to 10:59 AM | 0 (0.0%) | 0 (0.0%) |
| 11:00 AM to 11:59 AM | 3 (1.0%) | 0 (0.0%) |
| 12:00 PM to 3:59 PM | 10 (3.5%) | 20 (8.7%) |
| 4:00 PM to 11:59 PM | 38 (13.2%) | 12 (5.2%) |
| Total | 289 (100.0%) | 229 (100.0%) |
Housing Occupancy in Glidden
Occupancy by Ownership in Glidden
Of the total 395 dwellings in Glidden, owner-occupied units account for 324 (82.0%), while renter-occupied units make up 71 (18.0%).
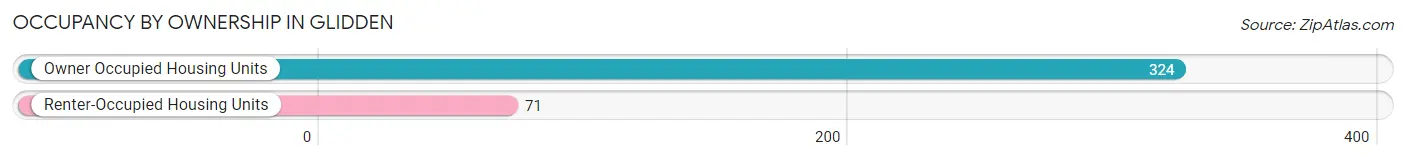
| Occupancy | # Housing Units | % Housing Units |
| Owner Occupied Housing Units | 324 | 82.0% |
| Renter-Occupied Housing Units | 71 | 18.0% |
| Total Occupied Housing Units | 395 | 100.0% |
Occupancy by Household Size in Glidden
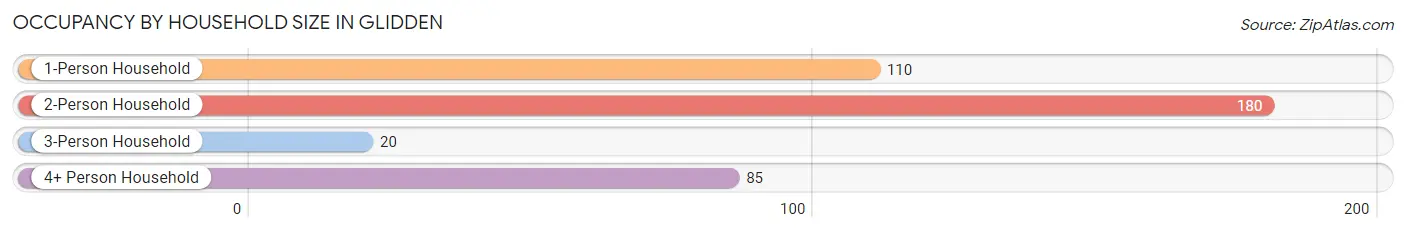
| Household Size | # Housing Units | % Housing Units |
| 1-Person Household | 110 | 27.9% |
| 2-Person Household | 180 | 45.6% |
| 3-Person Household | 20 | 5.1% |
| 4+ Person Household | 85 | 21.5% |
| Total Housing Units | 395 | 100.0% |
Occupancy by Ownership by Household Size in Glidden
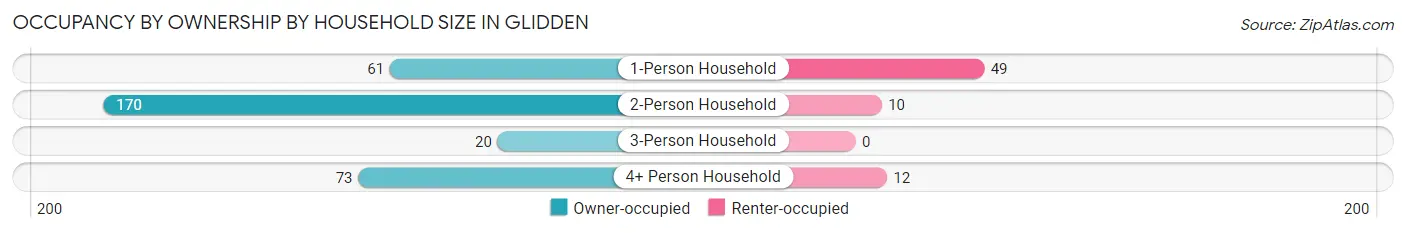
| Household Size | Owner-occupied | Renter-occupied |
| 1-Person Household | 61 (55.4%) | 49 (44.6%) |
| 2-Person Household | 170 (94.4%) | 10 (5.6%) |
| 3-Person Household | 20 (100.0%) | 0 (0.0%) |
| 4+ Person Household | 73 (85.9%) | 12 (14.1%) |
| Total Housing Units | 324 (82.0%) | 71 (18.0%) |
Occupancy by Educational Attainment in Glidden
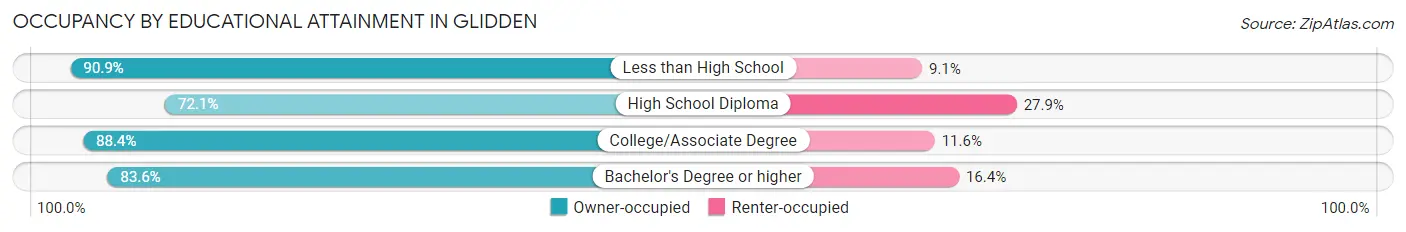
| Household Size | Owner-occupied | Renter-occupied |
| Less than High School | 30 (90.9%) | 3 (9.1%) |
| High School Diploma | 101 (72.1%) | 39 (27.9%) |
| College/Associate Degree | 137 (88.4%) | 18 (11.6%) |
| Bachelor's Degree or higher | 56 (83.6%) | 11 (16.4%) |
Occupancy by Age of Householder in Glidden
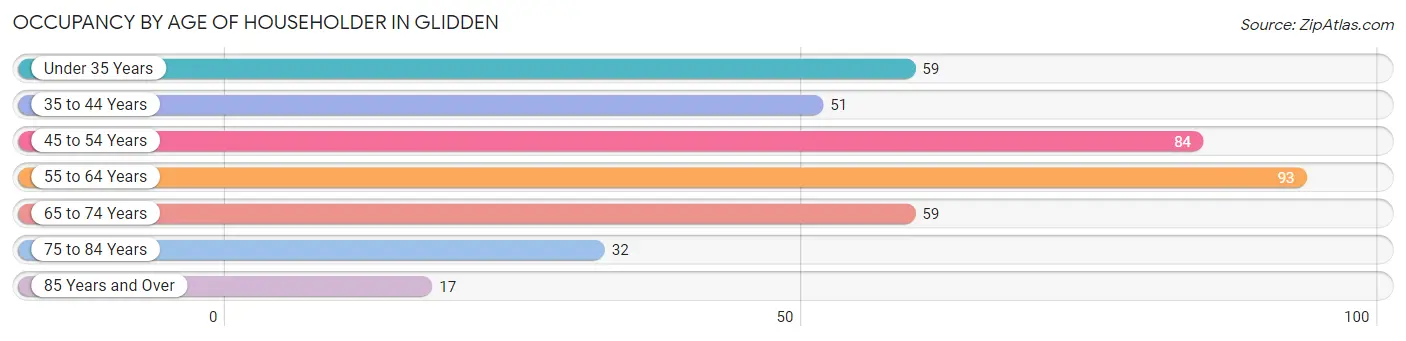
| Age Bracket | # Households | % Households |
| Under 35 Years | 59 | 14.9% |
| 35 to 44 Years | 51 | 12.9% |
| 45 to 54 Years | 84 | 21.3% |
| 55 to 64 Years | 93 | 23.5% |
| 65 to 74 Years | 59 | 14.9% |
| 75 to 84 Years | 32 | 8.1% |
| 85 Years and Over | 17 | 4.3% |
| Total | 395 | 100.0% |
Housing Finances in Glidden
Median Income by Occupancy in Glidden
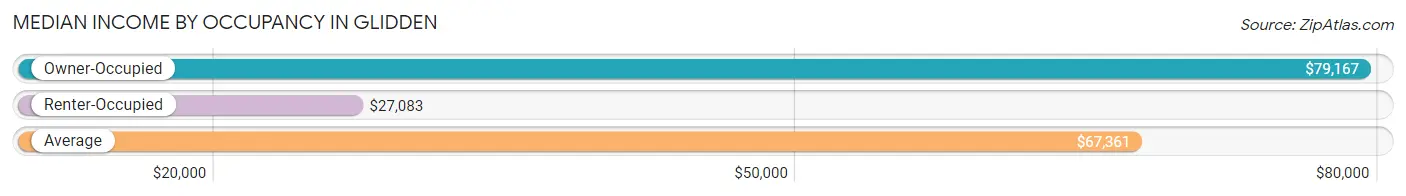
| Occupancy Type | # Households | Median Income |
| Owner-Occupied | 324 (82.0%) | $79,167 |
| Renter-Occupied | 71 (18.0%) | $27,083 |
| Average | 395 (100.0%) | $67,361 |
Occupancy by Householder Income Bracket in Glidden
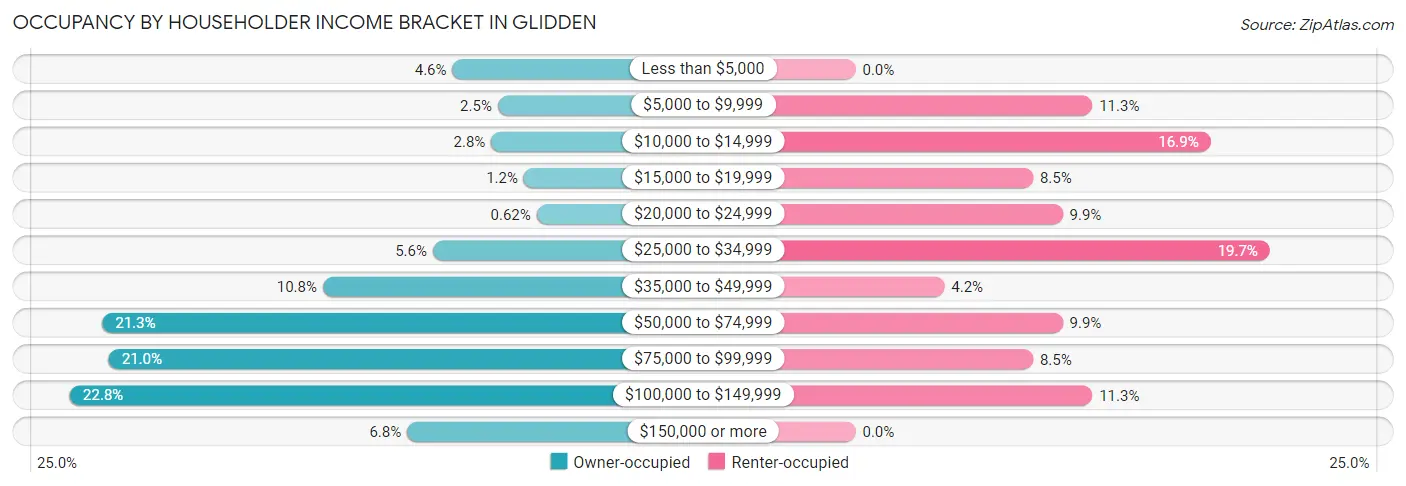
| Income Bracket | Owner-occupied | Renter-occupied |
| Less than $5,000 | 15 (4.6%) | 0 (0.0%) |
| $5,000 to $9,999 | 8 (2.5%) | 8 (11.3%) |
| $10,000 to $14,999 | 9 (2.8%) | 12 (16.9%) |
| $15,000 to $19,999 | 4 (1.2%) | 6 (8.5%) |
| $20,000 to $24,999 | 2 (0.6%) | 7 (9.9%) |
| $25,000 to $34,999 | 18 (5.6%) | 14 (19.7%) |
| $35,000 to $49,999 | 35 (10.8%) | 3 (4.2%) |
| $50,000 to $74,999 | 69 (21.3%) | 7 (9.9%) |
| $75,000 to $99,999 | 68 (21.0%) | 6 (8.5%) |
| $100,000 to $149,999 | 74 (22.8%) | 8 (11.3%) |
| $150,000 or more | 22 (6.8%) | 0 (0.0%) |
| Total | 324 (100.0%) | 71 (100.0%) |
Monthly Housing Cost Tiers in Glidden
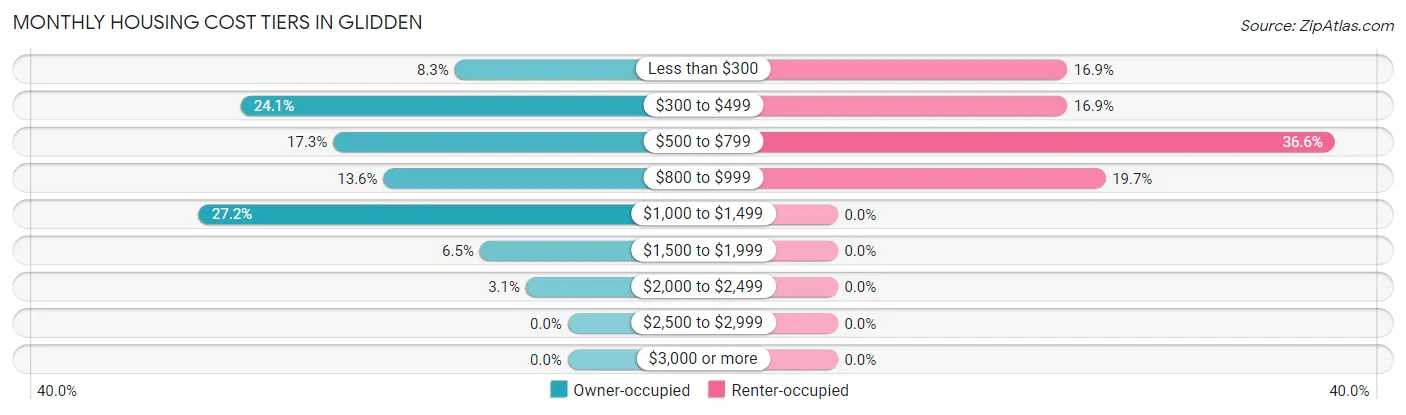
| Monthly Cost | Owner-occupied | Renter-occupied |
| Less than $300 | 27 (8.3%) | 12 (16.9%) |
| $300 to $499 | 78 (24.1%) | 12 (16.9%) |
| $500 to $799 | 56 (17.3%) | 26 (36.6%) |
| $800 to $999 | 44 (13.6%) | 14 (19.7%) |
| $1,000 to $1,499 | 88 (27.2%) | 0 (0.0%) |
| $1,500 to $1,999 | 21 (6.5%) | 0 (0.0%) |
| $2,000 to $2,499 | 10 (3.1%) | 0 (0.0%) |
| $2,500 to $2,999 | 0 (0.0%) | 0 (0.0%) |
| $3,000 or more | 0 (0.0%) | 0 (0.0%) |
| Total | 324 (100.0%) | 71 (100.0%) |
Physical Housing Characteristics in Glidden
Housing Structures in Glidden
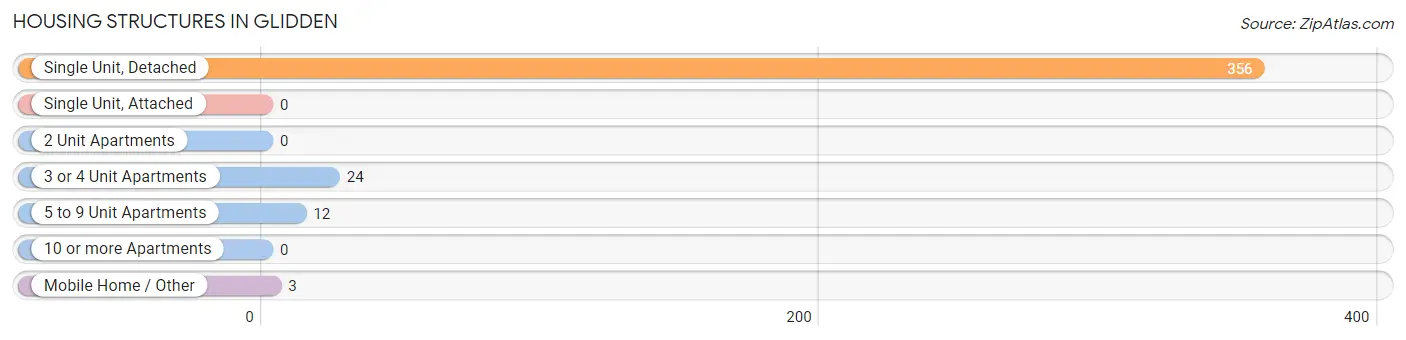
| Structure Type | # Housing Units | % Housing Units |
| Single Unit, Detached | 356 | 90.1% |
| Single Unit, Attached | 0 | 0.0% |
| 2 Unit Apartments | 0 | 0.0% |
| 3 or 4 Unit Apartments | 24 | 6.1% |
| 5 to 9 Unit Apartments | 12 | 3.0% |
| 10 or more Apartments | 0 | 0.0% |
| Mobile Home / Other | 3 | 0.8% |
| Total | 395 | 100.0% |
Housing Structures by Occupancy in Glidden
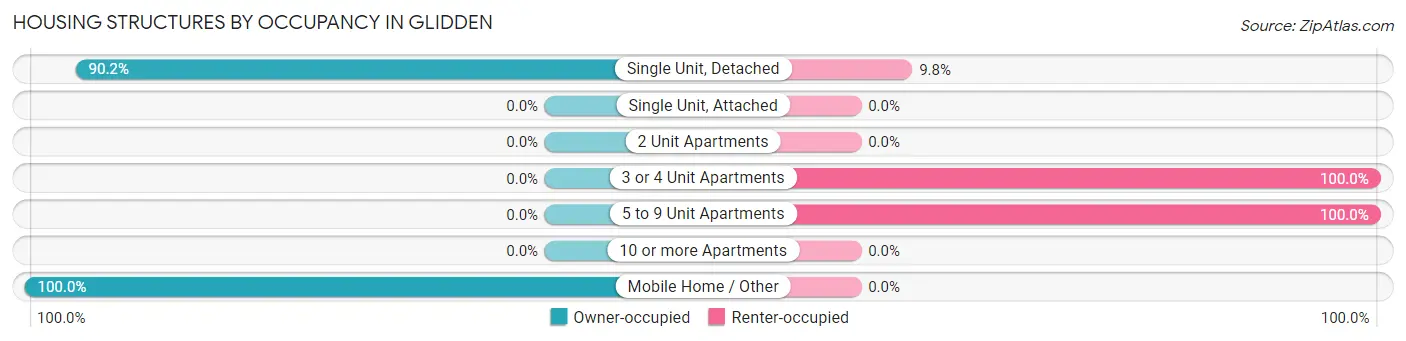
| Structure Type | Owner-occupied | Renter-occupied |
| Single Unit, Detached | 321 (90.2%) | 35 (9.8%) |
| Single Unit, Attached | 0 (0.0%) | 0 (0.0%) |
| 2 Unit Apartments | 0 (0.0%) | 0 (0.0%) |
| 3 or 4 Unit Apartments | 0 (0.0%) | 24 (100.0%) |
| 5 to 9 Unit Apartments | 0 (0.0%) | 12 (100.0%) |
| 10 or more Apartments | 0 (0.0%) | 0 (0.0%) |
| Mobile Home / Other | 3 (100.0%) | 0 (0.0%) |
| Total | 324 (82.0%) | 71 (18.0%) |
Housing Structures by Number of Rooms in Glidden
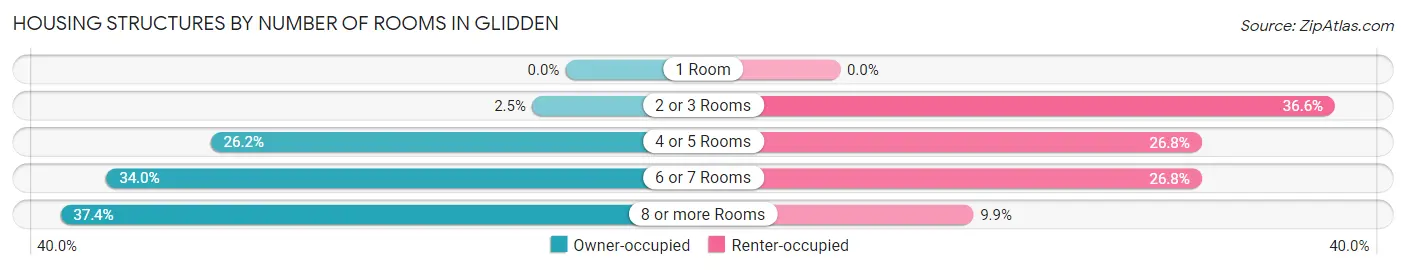
| Number of Rooms | Owner-occupied | Renter-occupied |
| 1 Room | 0 (0.0%) | 0 (0.0%) |
| 2 or 3 Rooms | 8 (2.5%) | 26 (36.6%) |
| 4 or 5 Rooms | 85 (26.2%) | 19 (26.8%) |
| 6 or 7 Rooms | 110 (34.0%) | 19 (26.8%) |
| 8 or more Rooms | 121 (37.3%) | 7 (9.9%) |
| Total | 324 (100.0%) | 71 (100.0%) |
Housing Structure by Heating Type in Glidden
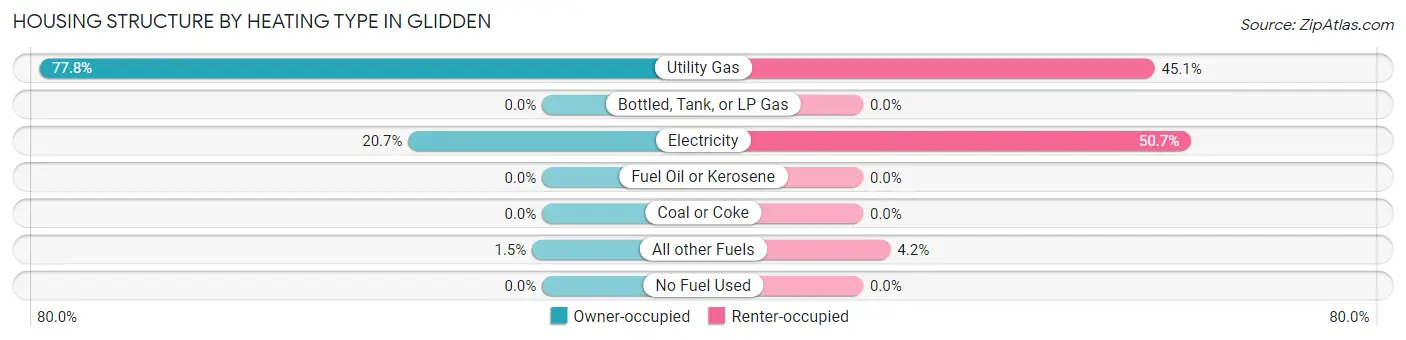
| Heating Type | Owner-occupied | Renter-occupied |
| Utility Gas | 252 (77.8%) | 32 (45.1%) |
| Bottled, Tank, or LP Gas | 0 (0.0%) | 0 (0.0%) |
| Electricity | 67 (20.7%) | 36 (50.7%) |
| Fuel Oil or Kerosene | 0 (0.0%) | 0 (0.0%) |
| Coal or Coke | 0 (0.0%) | 0 (0.0%) |
| All other Fuels | 5 (1.5%) | 3 (4.2%) |
| No Fuel Used | 0 (0.0%) | 0 (0.0%) |
| Total | 324 (100.0%) | 71 (100.0%) |
Household Vehicle Usage in Glidden
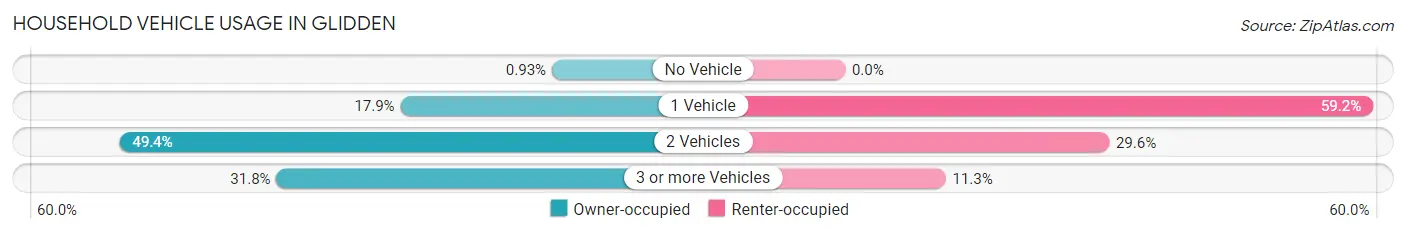
| Vehicles per Household | Owner-occupied | Renter-occupied |
| No Vehicle | 3 (0.9%) | 0 (0.0%) |
| 1 Vehicle | 58 (17.9%) | 42 (59.2%) |
| 2 Vehicles | 160 (49.4%) | 21 (29.6%) |
| 3 or more Vehicles | 103 (31.8%) | 8 (11.3%) |
| Total | 324 (100.0%) | 71 (100.0%) |
Real Estate & Mortgages in Glidden
Real Estate and Mortgage Overview in Glidden
| Characteristic | Without Mortgage | With Mortgage |
| Housing Units | 142 | 182 |
| Median Property Value | $87,800 | $164,000 |
| Median Household Income | $55,000 | $10 |
| Monthly Housing Costs | $414 | $0 |
| Real Estate Taxes | $1,150 | $14 |
Property Value by Mortgage Status in Glidden
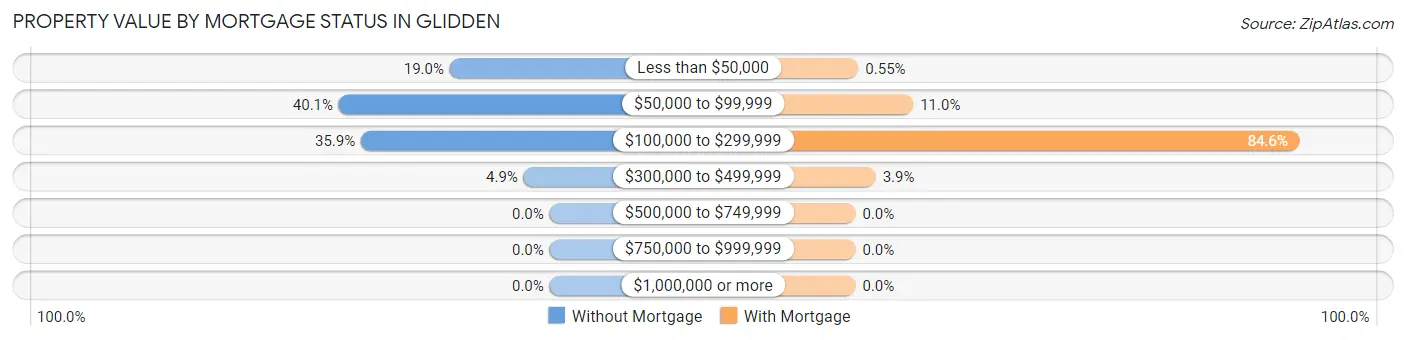
| Property Value | Without Mortgage | With Mortgage |
| Less than $50,000 | 27 (19.0%) | 1 (0.5%) |
| $50,000 to $99,999 | 57 (40.1%) | 20 (11.0%) |
| $100,000 to $299,999 | 51 (35.9%) | 154 (84.6%) |
| $300,000 to $499,999 | 7 (4.9%) | 7 (3.8%) |
| $500,000 to $749,999 | 0 (0.0%) | 0 (0.0%) |
| $750,000 to $999,999 | 0 (0.0%) | 0 (0.0%) |
| $1,000,000 or more | 0 (0.0%) | 0 (0.0%) |
| Total | 142 (100.0%) | 182 (100.0%) |
Household Income by Mortgage Status in Glidden
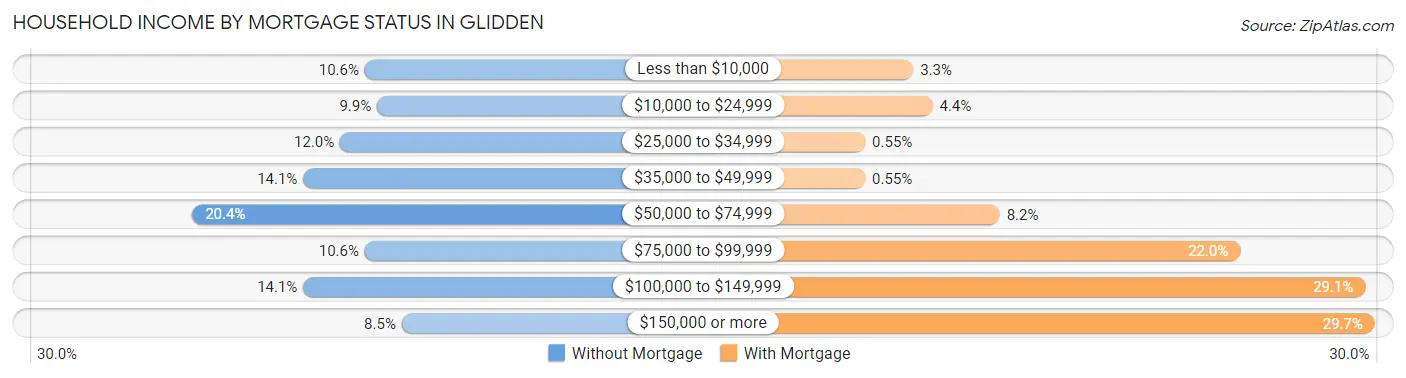
| Household Income | Without Mortgage | With Mortgage |
| Less than $10,000 | 15 (10.6%) | 6 (3.3%) |
| $10,000 to $24,999 | 14 (9.9%) | 8 (4.4%) |
| $25,000 to $34,999 | 17 (12.0%) | 1 (0.5%) |
| $35,000 to $49,999 | 20 (14.1%) | 1 (0.5%) |
| $50,000 to $74,999 | 29 (20.4%) | 15 (8.2%) |
| $75,000 to $99,999 | 15 (10.6%) | 40 (22.0%) |
| $100,000 to $149,999 | 20 (14.1%) | 53 (29.1%) |
| $150,000 or more | 12 (8.5%) | 54 (29.7%) |
| Total | 142 (100.0%) | 182 (100.0%) |
Property Value to Household Income Ratio in Glidden
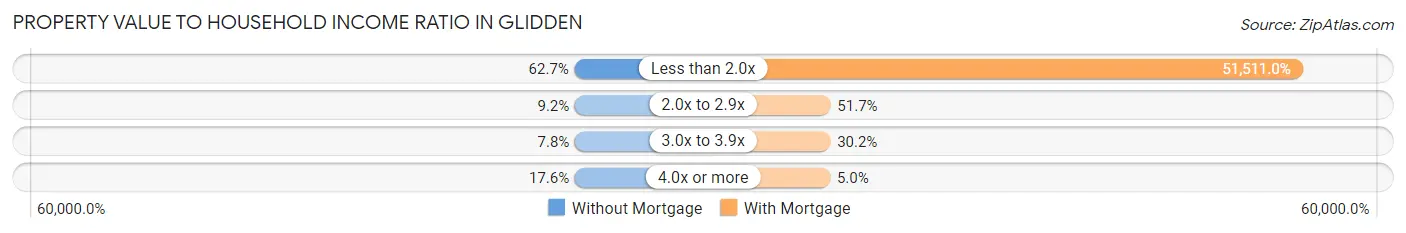
| Value-to-Income Ratio | Without Mortgage | With Mortgage |
| Less than 2.0x | 89 (62.7%) | 93,750 (51,511.0%) |
| 2.0x to 2.9x | 13 (9.1%) | 94 (51.6%) |
| 3.0x to 3.9x | 11 (7.7%) | 55 (30.2%) |
| 4.0x or more | 25 (17.6%) | 9 (5.0%) |
| Total | 142 (100.0%) | 182 (100.0%) |
Real Estate Taxes by Mortgage Status in Glidden
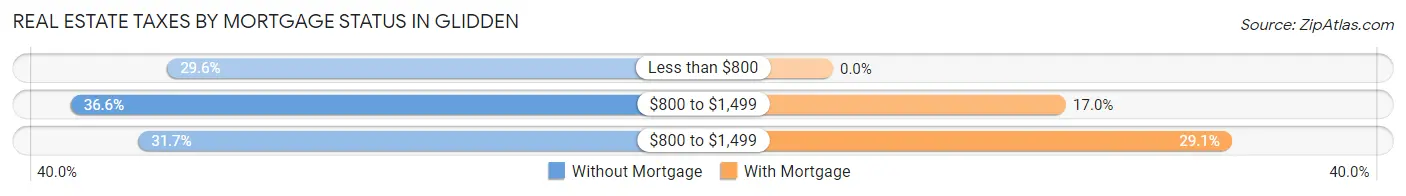
| Property Taxes | Without Mortgage | With Mortgage |
| Less than $800 | 42 (29.6%) | 0 (0.0%) |
| $800 to $1,499 | 52 (36.6%) | 31 (17.0%) |
| $800 to $1,499 | 45 (31.7%) | 53 (29.1%) |
| Total | 142 (100.0%) | 182 (100.0%) |
Health & Disability in Glidden
Health Insurance Coverage by Age in Glidden
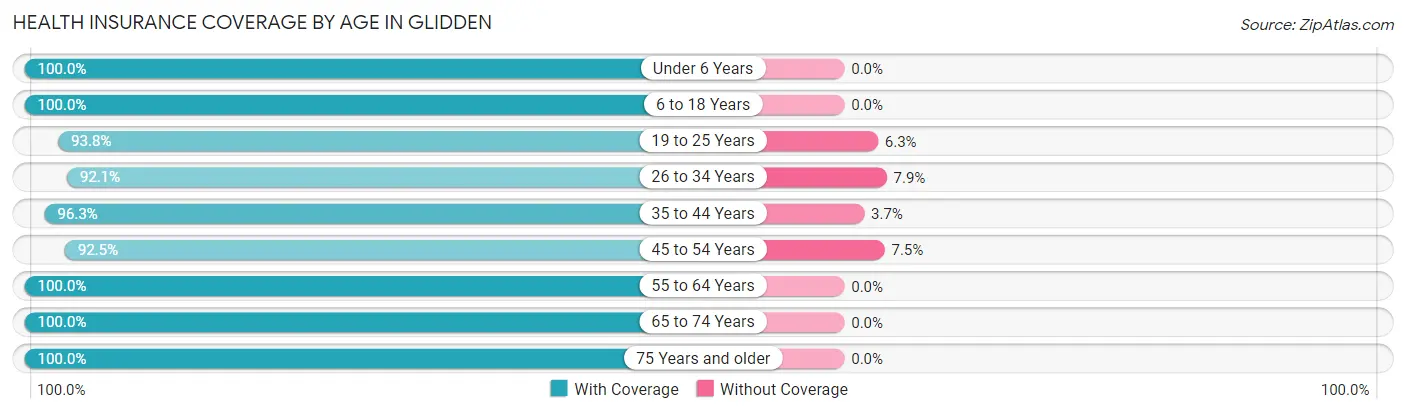
| Age Bracket | With Coverage | Without Coverage |
| Under 6 Years | 49 (100.0%) | 0 (0.0%) |
| 6 to 18 Years | 180 (100.0%) | 0 (0.0%) |
| 19 to 25 Years | 60 (93.8%) | 4 (6.2%) |
| 26 to 34 Years | 70 (92.1%) | 6 (7.9%) |
| 35 to 44 Years | 104 (96.3%) | 4 (3.7%) |
| 45 to 54 Years | 148 (92.5%) | 12 (7.5%) |
| 55 to 64 Years | 150 (100.0%) | 0 (0.0%) |
| 65 to 74 Years | 120 (100.0%) | 0 (0.0%) |
| 75 Years and older | 57 (100.0%) | 0 (0.0%) |
| Total | 938 (97.3%) | 26 (2.7%) |
Health Insurance Coverage by Citizenship Status in Glidden
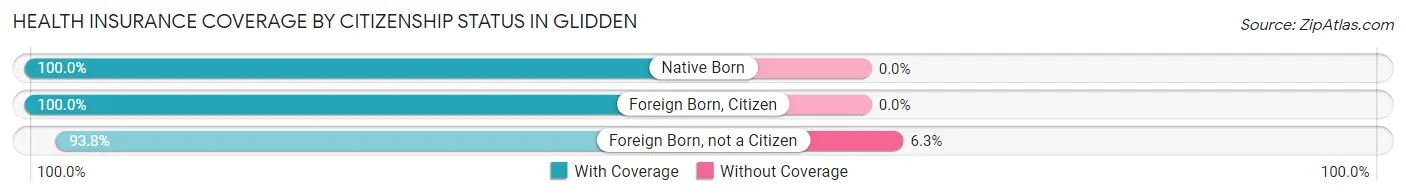
| Citizenship Status | With Coverage | Without Coverage |
| Native Born | 49 (100.0%) | 0 (0.0%) |
| Foreign Born, Citizen | 180 (100.0%) | 0 (0.0%) |
| Foreign Born, not a Citizen | 60 (93.8%) | 4 (6.2%) |
Health Insurance Coverage by Household Income in Glidden
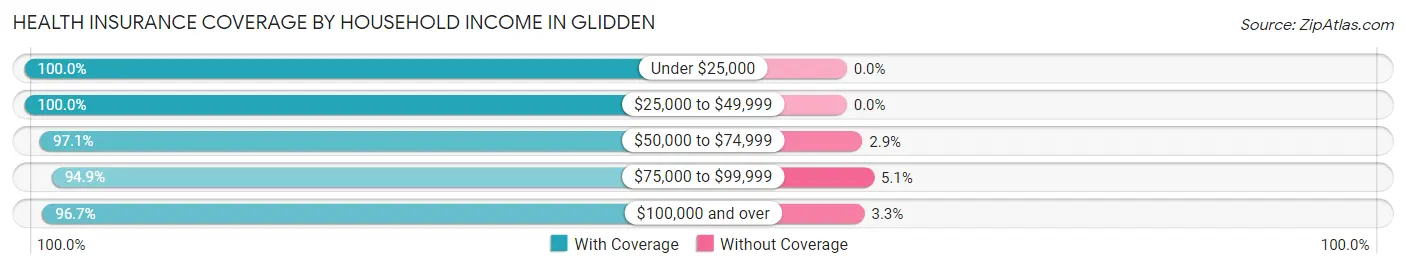
| Household Income | With Coverage | Without Coverage |
| Under $25,000 | 116 (100.0%) | 0 (0.0%) |
| $25,000 to $49,999 | 154 (100.0%) | 0 (0.0%) |
| $50,000 to $74,999 | 133 (97.1%) | 4 (2.9%) |
| $75,000 to $99,999 | 205 (94.9%) | 11 (5.1%) |
| $100,000 and over | 320 (96.7%) | 11 (3.3%) |
Public vs Private Health Insurance Coverage by Age in Glidden
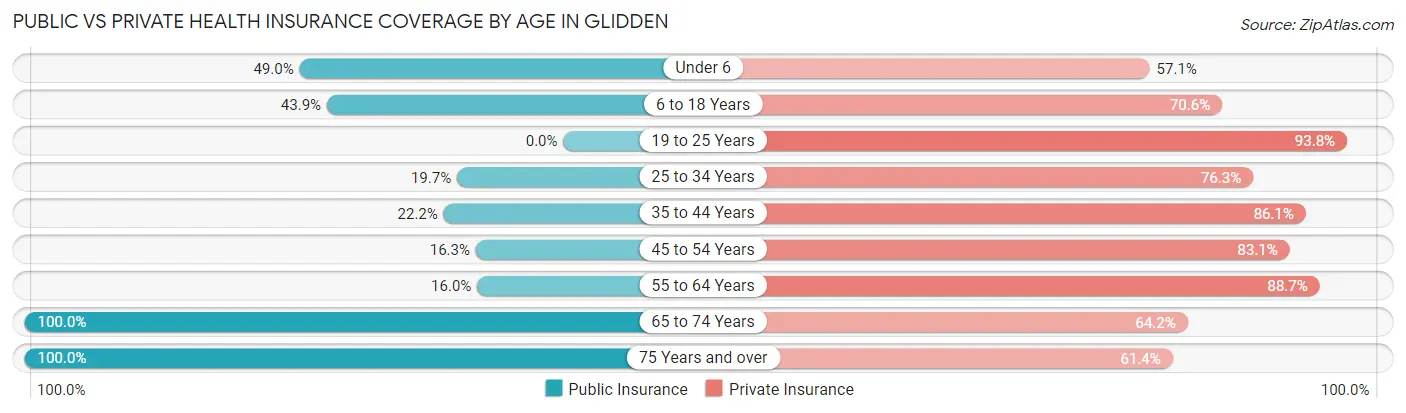
| Age Bracket | Public Insurance | Private Insurance |
| Under 6 | 24 (49.0%) | 28 (57.1%) |
| 6 to 18 Years | 79 (43.9%) | 127 (70.6%) |
| 19 to 25 Years | 0 (0.0%) | 60 (93.8%) |
| 25 to 34 Years | 15 (19.7%) | 58 (76.3%) |
| 35 to 44 Years | 24 (22.2%) | 93 (86.1%) |
| 45 to 54 Years | 26 (16.3%) | 133 (83.1%) |
| 55 to 64 Years | 24 (16.0%) | 133 (88.7%) |
| 65 to 74 Years | 120 (100.0%) | 77 (64.2%) |
| 75 Years and over | 57 (100.0%) | 35 (61.4%) |
| Total | 369 (38.3%) | 744 (77.2%) |
Disability Status by Sex by Age in Glidden
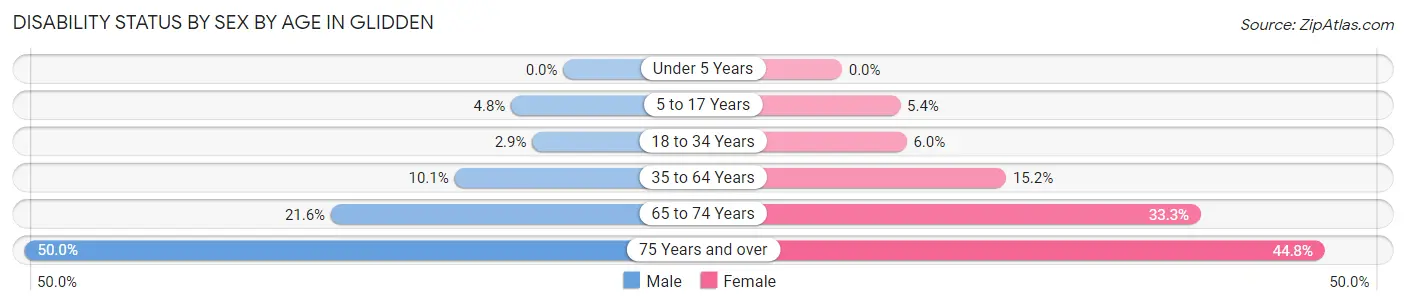
| Age Bracket | Male | Female |
| Under 5 Years | 0 (0.0%) | 0 (0.0%) |
| 5 to 17 Years | 3 (4.8%) | 6 (5.4%) |
| 18 to 34 Years | 3 (2.9%) | 3 (6.0%) |
| 35 to 64 Years | 21 (10.1%) | 32 (15.2%) |
| 65 to 74 Years | 11 (21.6%) | 23 (33.3%) |
| 75 Years and over | 14 (50.0%) | 13 (44.8%) |
Disability Class by Sex by Age in Glidden
Disability Class: Hearing Difficulty
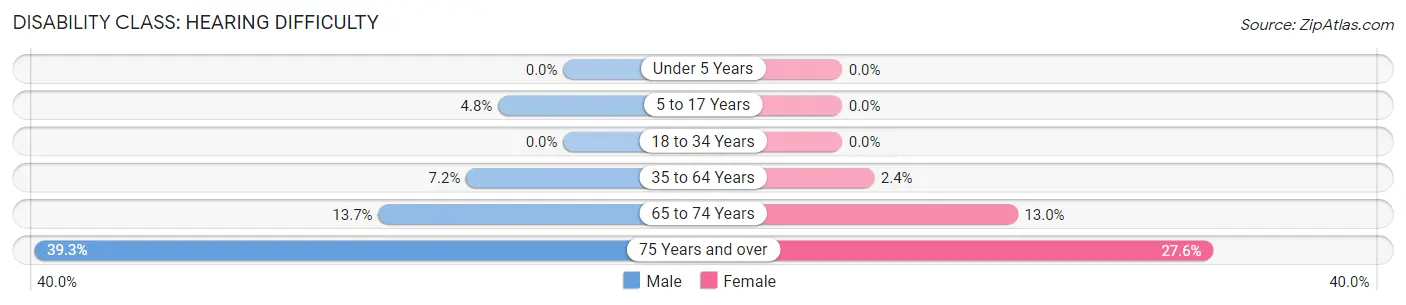
| Age Bracket | Male | Female |
| Under 5 Years | 0 (0.0%) | 0 (0.0%) |
| 5 to 17 Years | 3 (4.8%) | 0 (0.0%) |
| 18 to 34 Years | 0 (0.0%) | 0 (0.0%) |
| 35 to 64 Years | 15 (7.2%) | 5 (2.4%) |
| 65 to 74 Years | 7 (13.7%) | 9 (13.0%) |
| 75 Years and over | 11 (39.3%) | 8 (27.6%) |
Disability Class: Vision Difficulty
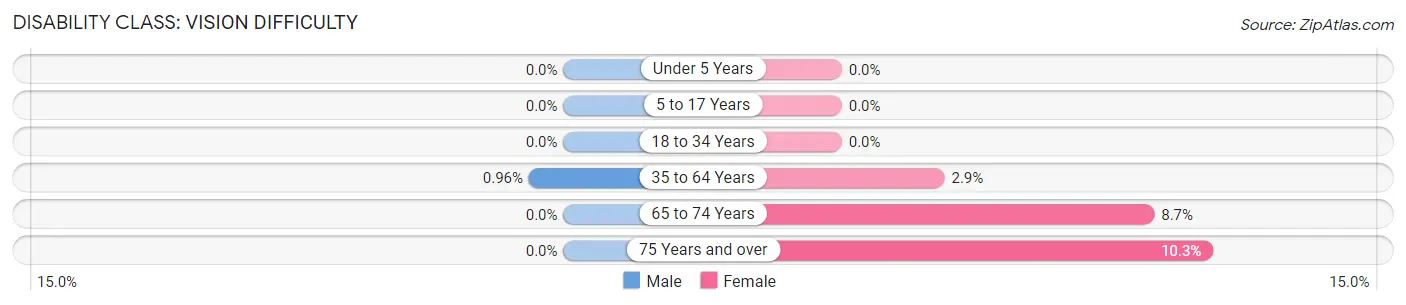
| Age Bracket | Male | Female |
| Under 5 Years | 0 (0.0%) | 0 (0.0%) |
| 5 to 17 Years | 0 (0.0%) | 0 (0.0%) |
| 18 to 34 Years | 0 (0.0%) | 0 (0.0%) |
| 35 to 64 Years | 2 (1.0%) | 6 (2.9%) |
| 65 to 74 Years | 0 (0.0%) | 6 (8.7%) |
| 75 Years and over | 0 (0.0%) | 3 (10.3%) |
Disability Class: Cognitive Difficulty
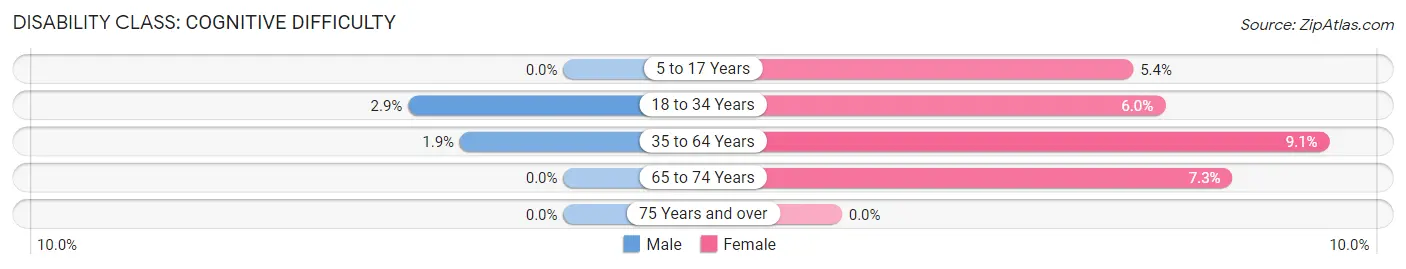
| Age Bracket | Male | Female |
| 5 to 17 Years | 0 (0.0%) | 6 (5.4%) |
| 18 to 34 Years | 3 (2.9%) | 3 (6.0%) |
| 35 to 64 Years | 4 (1.9%) | 19 (9.0%) |
| 65 to 74 Years | 0 (0.0%) | 5 (7.2%) |
| 75 Years and over | 0 (0.0%) | 0 (0.0%) |
Disability Class: Ambulatory Difficulty
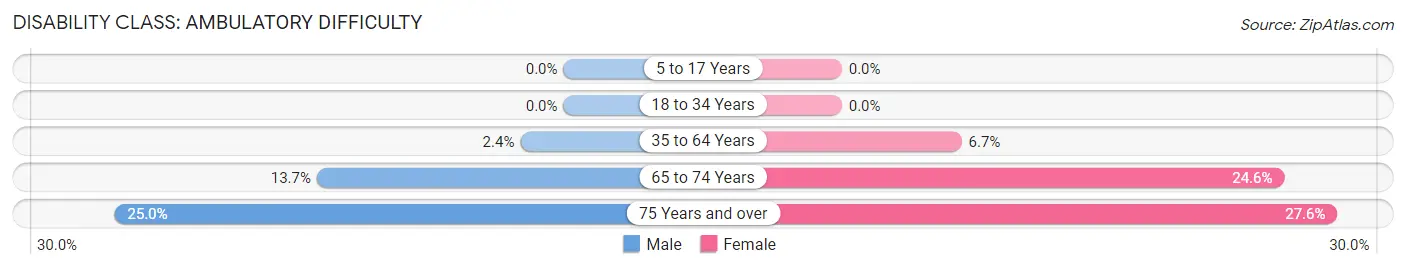
| Age Bracket | Male | Female |
| 5 to 17 Years | 0 (0.0%) | 0 (0.0%) |
| 18 to 34 Years | 0 (0.0%) | 0 (0.0%) |
| 35 to 64 Years | 5 (2.4%) | 14 (6.7%) |
| 65 to 74 Years | 7 (13.7%) | 17 (24.6%) |
| 75 Years and over | 7 (25.0%) | 8 (27.6%) |
Disability Class: Self-Care Difficulty
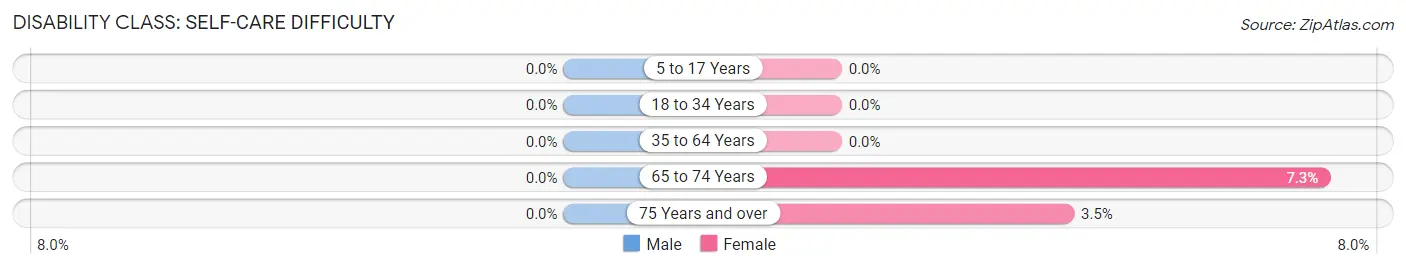
| Age Bracket | Male | Female |
| 5 to 17 Years | 0 (0.0%) | 0 (0.0%) |
| 18 to 34 Years | 0 (0.0%) | 0 (0.0%) |
| 35 to 64 Years | 0 (0.0%) | 0 (0.0%) |
| 65 to 74 Years | 0 (0.0%) | 5 (7.2%) |
| 75 Years and over | 0 (0.0%) | 1 (3.5%) |
Technology Access in Glidden
Computing Device Access in Glidden
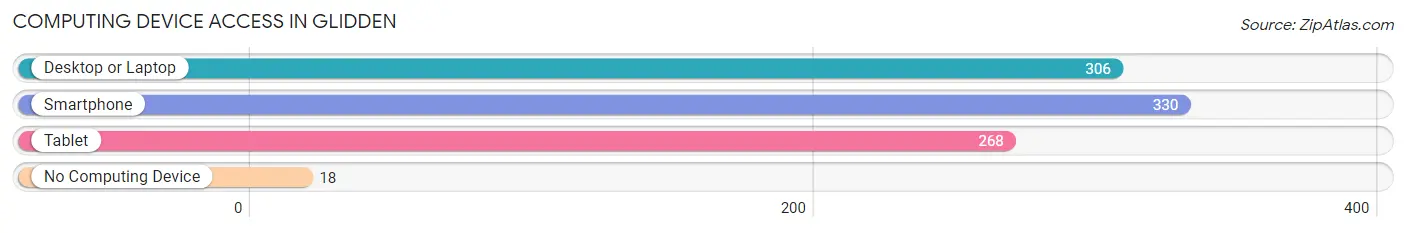
| Device Type | # Households | % Households |
| Desktop or Laptop | 306 | 77.5% |
| Smartphone | 330 | 83.5% |
| Tablet | 268 | 67.8% |
| No Computing Device | 18 | 4.6% |
| Total | 395 | 100.0% |
Internet Access in Glidden
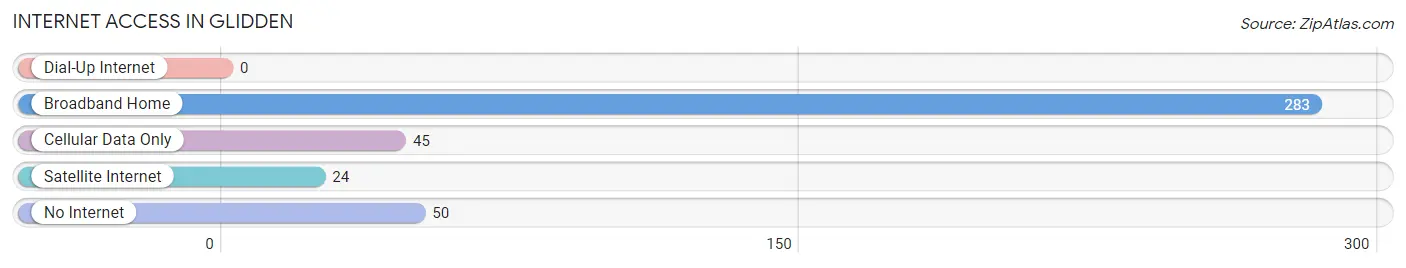
| Internet Type | # Households | % Households |
| Dial-Up Internet | 0 | 0.0% |
| Broadband Home | 283 | 71.7% |
| Cellular Data Only | 45 | 11.4% |
| Satellite Internet | 24 | 6.1% |
| No Internet | 50 | 12.7% |
| Total | 395 | 100.0% |
Glidden Summary
Glidden, Iowa is a small town located in Carroll County, Iowa. It is situated in the rolling hills of the Loess Hills region, and is home to a population of just over 1,000 people. The town was founded in 1881 by William Glidden, a local farmer, and was named after him.
Geography
Glidden is located in the Loess Hills region of Iowa, which is characterized by its rolling hills and deep ravines. The town is situated on the Middle Raccoon River, which flows through the town and provides a source of recreation for the locals. The town is located in the northwest corner of Carroll County, and is bordered by the towns of Coon Rapids, Lanesboro, and Dedham. The town is located approximately 30 miles east of Des Moines, the state capital.
Economy
The economy of Glidden is largely based on agriculture. The town is home to several farms, which produce a variety of crops, including corn, soybeans, and hay. The town also has a few small businesses, including a grocery store, a hardware store, and a few restaurants. The town is also home to a few manufacturing companies, which produce a variety of products, including furniture, clothing, and automotive parts.
Demographics
As of the 2010 census, Glidden had a population of 1,072 people. The racial makeup of the town was 97.3% White, 0.7% African American, 0.2% Native American, 0.2% Asian, 0.2% from other races, and 1.6% from two or more races. Hispanic or Latino of any race were 1.2% of the population.
The median income for a household in Glidden was $41,250, and the median income for a family was $50,000. The per capita income for the town was $20,845. About 8.2% of families and 10.2% of the population were below the poverty line, including 14.3% of those under age 18 and 8.3% of those age 65 or over.
Education
Glidden is served by the Glidden-Ralston Community School District, which consists of one elementary school, one middle school, and one high school. The district also operates a preschool and a daycare center. The town is also home to a branch of the Carroll County Library.
Conclusion
Glidden, Iowa is a small town located in Carroll County, Iowa. It is situated in the rolling hills of the Loess Hills region, and is home to a population of just over 1,000 people. The town is largely agricultural, with a few small businesses and manufacturing companies. The town is served by the Glidden-Ralston Community School District, and is home to a branch of the Carroll County Library. Glidden is a quiet, rural town with a strong sense of community and a rich history.
Common Questions
What is Per Capita Income in Glidden?
Per Capita income in Glidden is $30,179.
What is the Median Family Income in Glidden?
Median Family Income in Glidden is $85,625.
What is the Median Household income in Glidden?
Median Household Income in Glidden is $67,361.
What is Income or Wage Gap in Glidden?
Income or Wage Gap in Glidden is 31.8%.
Women in Glidden earn 68.2 cents for every dollar earned by a man.
What is Inequality or Gini Index in Glidden?
Inequality or Gini Index in Glidden is 0.37.
What is the Total Population of Glidden?
Total Population of Glidden is 964.
What is the Total Male Population of Glidden?
Total Male Population of Glidden is 470.
What is the Total Female Population of Glidden?
Total Female Population of Glidden is 494.
What is the Ratio of Males per 100 Females in Glidden?
There are 95.14 Males per 100 Females in Glidden.
What is the Ratio of Females per 100 Males in Glidden?
There are 105.11 Females per 100 Males in Glidden.
What is the Median Population Age in Glidden?
Median Population Age in Glidden is 45.5 Years.
What is the Average Family Size in Glidden
Average Family Size in Glidden is 2.9 People.
What is the Average Household Size in Glidden
Average Household Size in Glidden is 2.4 People.
How Large is the Labor Force in Glidden?
There are 553 People in the Labor Forcein in Glidden.
What is the Percentage of People in the Labor Force in Glidden?
70.8% of People are in the Labor Force in Glidden.
What is the Unemployment Rate in Glidden?
Unemployment Rate in Glidden is 0.9%.