Brewster, MN Map & Demographics
Brewster Map
Brewster Overview
$26,948
PER CAPITA INCOME
$74,167
AVG FAMILY INCOME
$55,481
AVG HOUSEHOLD INCOME
53.1%
WAGE / INCOME GAP [ % ]
46.9¢/ $1
WAGE / INCOME GAP [ $ ]
0.33
INEQUALITY / GINI INDEX
536
TOTAL POPULATION
305
MALE POPULATION
231
FEMALE POPULATION
132.03
MALES / 100 FEMALES
75.74
FEMALES / 100 MALES
41.1
MEDIAN AGE
4.6
AVG FAMILY SIZE
3.4
AVG HOUSEHOLD SIZE
301
LABOR FORCE [ PEOPLE ]
74.1%
PERCENT IN LABOR FORCE
5.0%
UNEMPLOYMENT RATE
Brewster Zip Codes
Brewster Area Codes
Income in Brewster
Income Overview in Brewster
Per Capita Income in Brewster is $26,948, while median incomes of families and households are $74,167 and $55,481 respectively.
| Characteristic | Number | Measure |
| Per Capita Income | 536 | $26,948 |
| Median Family Income | 98 | $74,167 |
| Mean Family Income | 98 | $77,008 |
| Median Household Income | 159 | $55,481 |
| Mean Household Income | 159 | $64,499 |
| Income Deficit | 98 | $0 |
| Wage / Income Gap (%) | 536 | 53.12% |
| Wage / Income Gap ($) | 536 | 46.88¢ per $1 |
| Gini / Inequality Index | 536 | 0.33 |
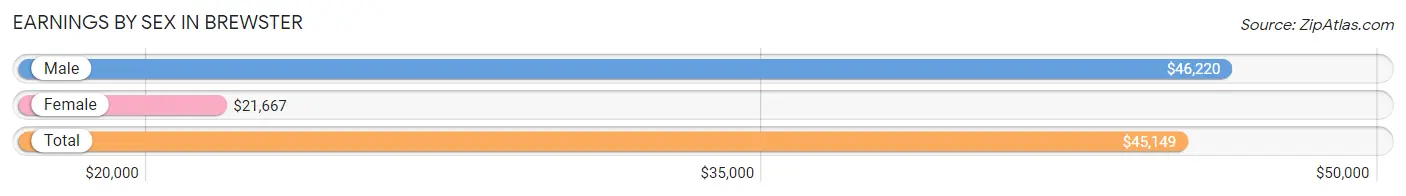
Earnings by Sex in Brewster
Average Earnings in Brewster are $45,149, $46,220 for men and $21,667 for women, a difference of 53.1%.
| Sex | Number | Average Earnings |
| Male | 200 (64.9%) | $46,220 |
| Female | 108 (35.1%) | $21,667 |
| Total | 308 (100.0%) | $45,149 |
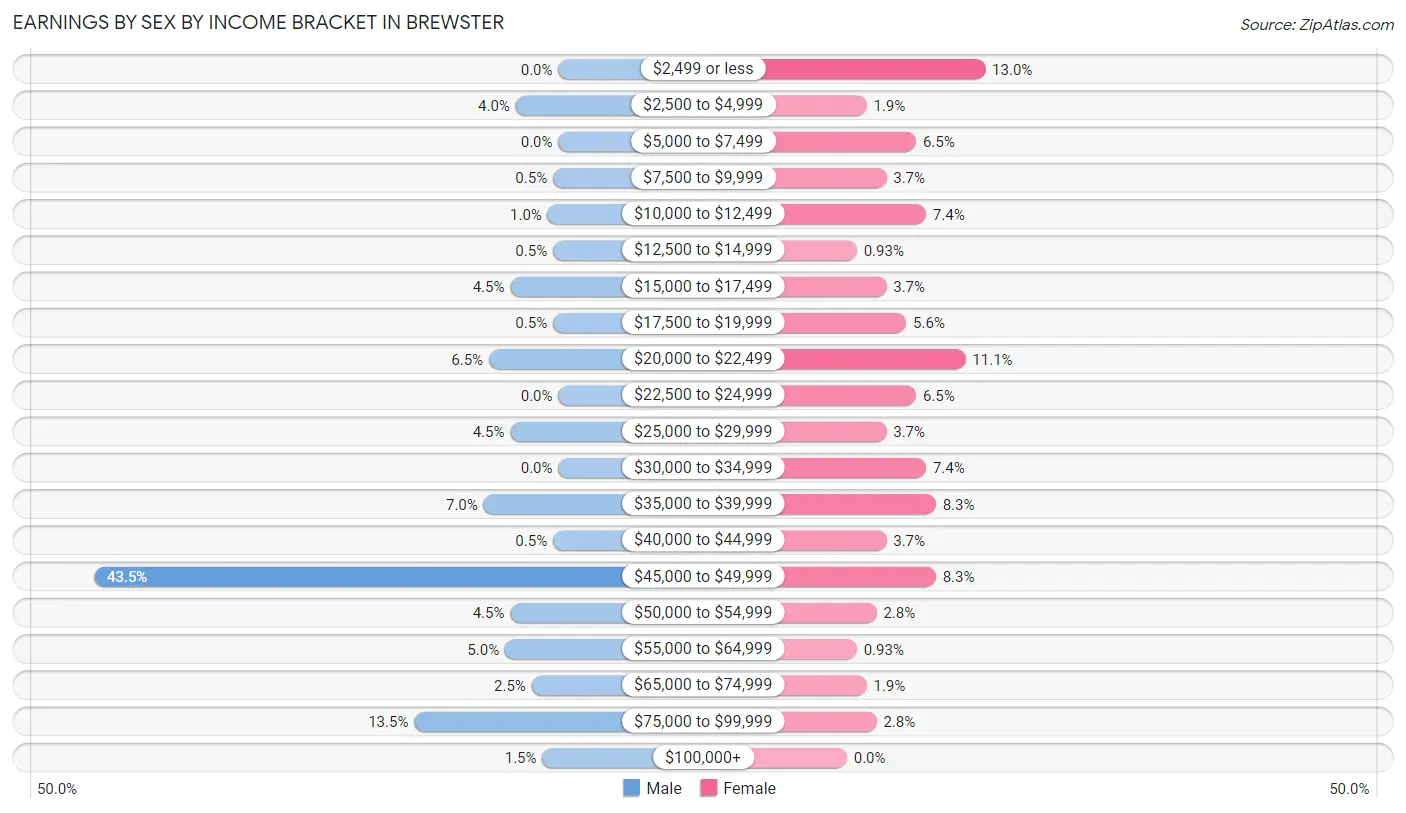
Earnings by Sex by Income Bracket in Brewster
The most common earnings brackets in Brewster are $45,000 to $49,999 for men (87 | 43.5%) and $2,499 or less for women (14 | 13.0%).
| Income | Male | Female |
| $2,499 or less | 0 (0.0%) | 14 (13.0%) |
| $2,500 to $4,999 | 8 (4.0%) | 2 (1.8%) |
| $5,000 to $7,499 | 0 (0.0%) | 7 (6.5%) |
| $7,500 to $9,999 | 1 (0.5%) | 4 (3.7%) |
| $10,000 to $12,499 | 2 (1.0%) | 8 (7.4%) |
| $12,500 to $14,999 | 1 (0.5%) | 1 (0.9%) |
| $15,000 to $17,499 | 9 (4.5%) | 4 (3.7%) |
| $17,500 to $19,999 | 1 (0.5%) | 6 (5.6%) |
| $20,000 to $22,499 | 13 (6.5%) | 12 (11.1%) |
| $22,500 to $24,999 | 0 (0.0%) | 7 (6.5%) |
| $25,000 to $29,999 | 9 (4.5%) | 4 (3.7%) |
| $30,000 to $34,999 | 0 (0.0%) | 8 (7.4%) |
| $35,000 to $39,999 | 14 (7.0%) | 9 (8.3%) |
| $40,000 to $44,999 | 1 (0.5%) | 4 (3.7%) |
| $45,000 to $49,999 | 87 (43.5%) | 9 (8.3%) |
| $50,000 to $54,999 | 9 (4.5%) | 3 (2.8%) |
| $55,000 to $64,999 | 10 (5.0%) | 1 (0.9%) |
| $65,000 to $74,999 | 5 (2.5%) | 2 (1.8%) |
| $75,000 to $99,999 | 27 (13.5%) | 3 (2.8%) |
| $100,000+ | 3 (1.5%) | 0 (0.0%) |
| Total | 200 (100.0%) | 108 (100.0%) |
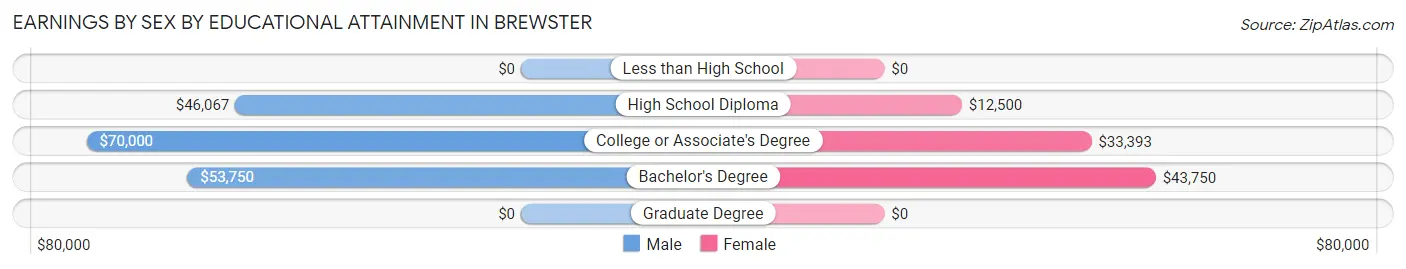
Earnings by Sex by Educational Attainment in Brewster
Average earnings in Brewster are $46,399 for men and $32,679 for women, a difference of 29.6%. Men with an educational attainment of college or associate's degree enjoy the highest average annual earnings of $70,000, while those with high school diploma education earn the least with $46,067. Women with an educational attainment of bachelor's degree earn the most with the average annual earnings of $43,750, while those with high school diploma education have the smallest earnings of $12,500.
| Educational Attainment | Male Income | Female Income |
| Less than High School | - | - |
| High School Diploma | $46,067 | $12,500 |
| College or Associate's Degree | $70,000 | $33,393 |
| Bachelor's Degree | $53,750 | $43,750 |
| Graduate Degree | - | - |
| Total | $46,399 | $32,679 |
Family Income in Brewster
Family Income Brackets in Brewster
According to the Brewster family income data, there are 29 families falling into the $50,000 to $74,999 income range, which is the most common income bracket and makes up 29.6% of all families.
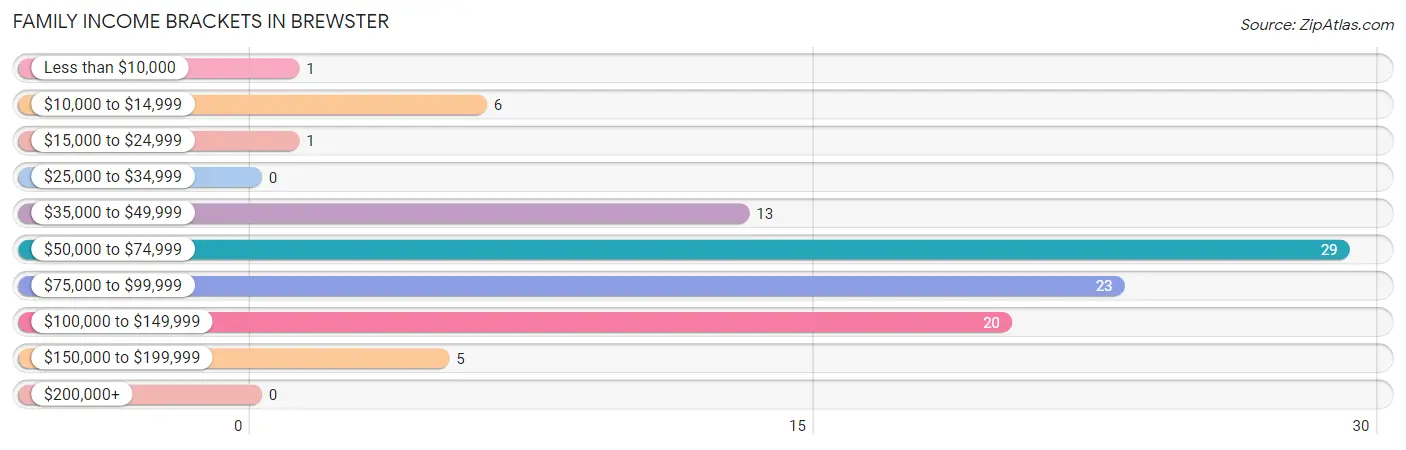
| Income Bracket | # Families | % Families |
| Less than $10,000 | 1 | 1.0% |
| $10,000 to $14,999 | 6 | 6.1% |
| $15,000 to $24,999 | 1 | 1.0% |
| $25,000 to $34,999 | 0 | 0.0% |
| $35,000 to $49,999 | 13 | 13.3% |
| $50,000 to $74,999 | 29 | 29.6% |
| $75,000 to $99,999 | 23 | 23.5% |
| $100,000 to $149,999 | 20 | 20.4% |
| $150,000 to $199,999 | 5 | 5.1% |
| $200,000+ | 0 | 0.0% |
Family Income by Famaliy Size in Brewster
2-person families (51 | 52.0%) account for the highest median family income in Brewster with $78,750 per family, while 2-person families (51 | 52.0%) have the highest median income of $39,375 per family member.
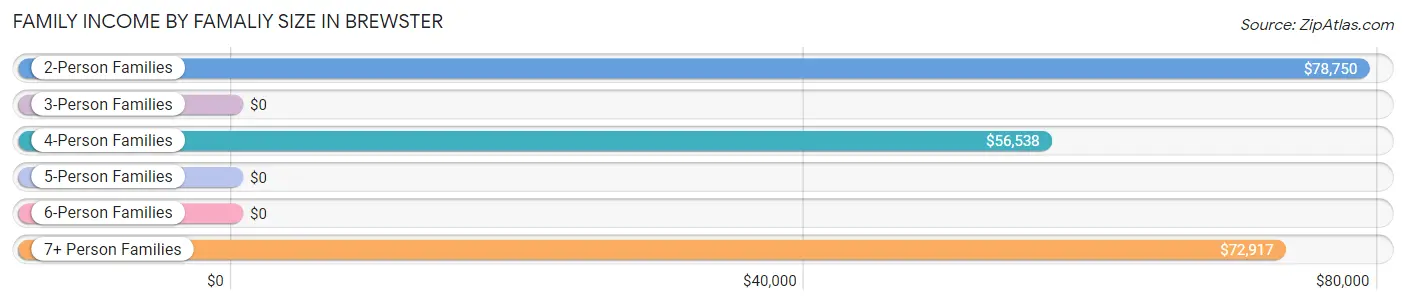
| Income Bracket | # Families | Median Income |
| 2-Person Families | 51 (52.0%) | $78,750 |
| 3-Person Families | 4 (4.1%) | $0 |
| 4-Person Families | 28 (28.6%) | $56,538 |
| 5-Person Families | 1 (1.0%) | $0 |
| 6-Person Families | 1 (1.0%) | $0 |
| 7+ Person Families | 13 (13.3%) | $72,917 |
| Total | 98 (100.0%) | $74,167 |
Family Income by Number of Earners in Brewster
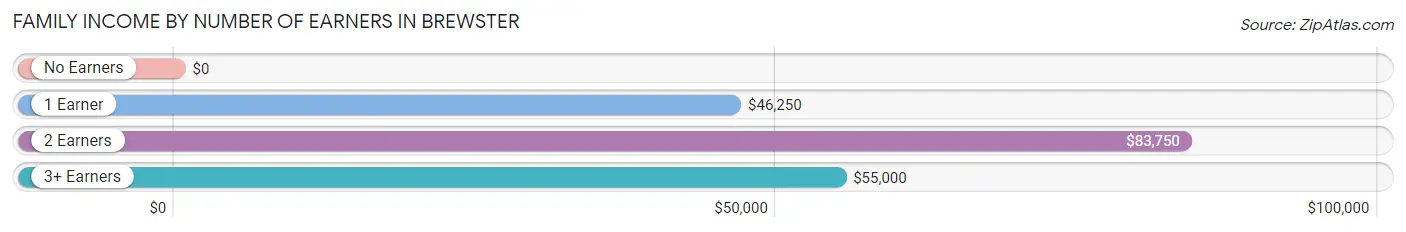
| Number of Earners | # Families | Median Income |
| No Earners | 6 (6.1%) | $0 |
| 1 Earner | 24 (24.5%) | $46,250 |
| 2 Earners | 56 (57.1%) | $83,750 |
| 3+ Earners | 12 (12.2%) | $55,000 |
| Total | 98 (100.0%) | $74,167 |
Household Income in Brewster
Household Income Brackets in Brewster
With 40 households falling in the category, the $50,000 to $74,999 income range is the most frequent in Brewster, accounting for 25.2% of all households.
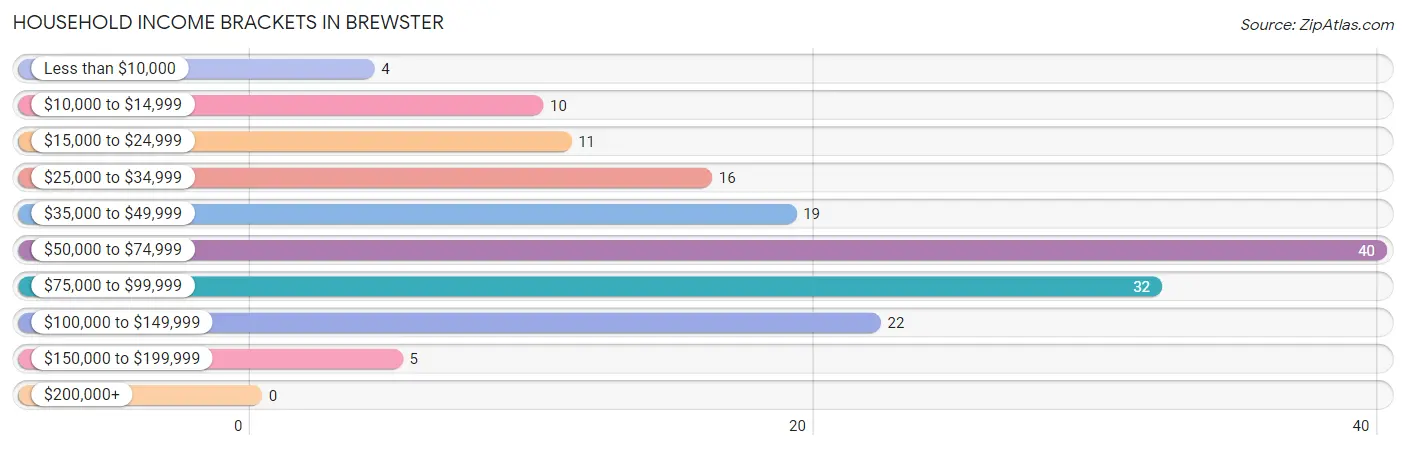
| Income Bracket | # Households | % Households |
| Less than $10,000 | 4 | 2.5% |
| $10,000 to $14,999 | 10 | 6.3% |
| $15,000 to $24,999 | 11 | 6.9% |
| $25,000 to $34,999 | 16 | 10.1% |
| $35,000 to $49,999 | 19 | 11.9% |
| $50,000 to $74,999 | 40 | 25.2% |
| $75,000 to $99,999 | 32 | 20.1% |
| $100,000 to $149,999 | 22 | 13.8% |
| $150,000 to $199,999 | 5 | 3.1% |
| $200,000+ | 0 | 0.0% |
Household Income by Householder Age in Brewster
The median household income in Brewster is $55,481, with the highest median household income of $78,281 found in the 25 to 44 years age bracket for the primary householder. A total of 39 households (24.5%) fall into this category. Meanwhile, the 65+ years age bracket for the primary householder has the lowest median household income of $34,107, with 51 households (32.1%) in this group.
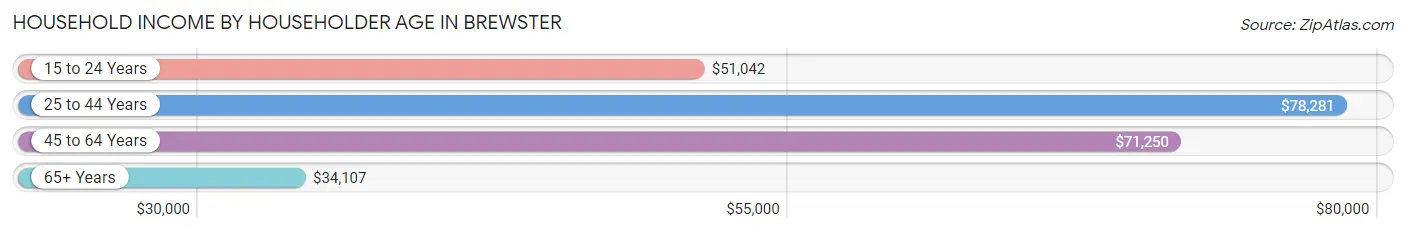
| Income Bracket | # Households | Median Income |
| 15 to 24 Years | 15 (9.4%) | $51,042 |
| 25 to 44 Years | 39 (24.5%) | $78,281 |
| 45 to 64 Years | 54 (34.0%) | $71,250 |
| 65+ Years | 51 (32.1%) | $34,107 |
| Total | 159 (100.0%) | $55,481 |
Poverty in Brewster
Income Below Poverty by Sex and Age in Brewster
With 5.6% poverty level for males and 12.1% for females among the residents of Brewster, 16 and 17 year old males and 6 to 11 year old females are the most vulnerable to poverty, with 6 males (100.0%) and 11 females (34.4%) in their respective age groups living below the poverty level.
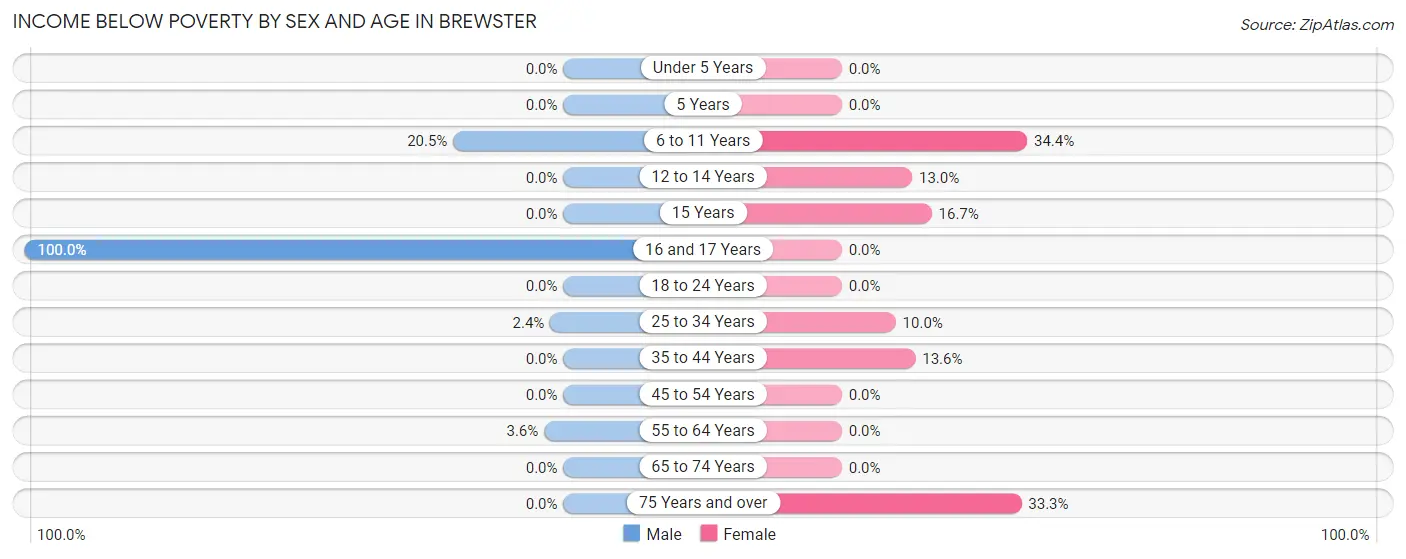
| Age Bracket | Male | Female |
| Under 5 Years | 0 (0.0%) | 0 (0.0%) |
| 5 Years | 0 (0.0%) | 0 (0.0%) |
| 6 to 11 Years | 9 (20.4%) | 11 (34.4%) |
| 12 to 14 Years | 0 (0.0%) | 3 (13.0%) |
| 15 Years | 0 (0.0%) | 1 (16.7%) |
| 16 and 17 Years | 6 (100.0%) | 0 (0.0%) |
| 18 to 24 Years | 0 (0.0%) | 0 (0.0%) |
| 25 to 34 Years | 1 (2.4%) | 1 (10.0%) |
| 35 to 44 Years | 0 (0.0%) | 6 (13.6%) |
| 45 to 54 Years | 0 (0.0%) | 0 (0.0%) |
| 55 to 64 Years | 1 (3.6%) | 0 (0.0%) |
| 65 to 74 Years | 0 (0.0%) | 0 (0.0%) |
| 75 Years and over | 0 (0.0%) | 6 (33.3%) |
| Total | 17 (5.6%) | 28 (12.1%) |
Income Above Poverty by Sex and Age in Brewster
According to the poverty statistics in Brewster, males aged under 5 years and females aged under 5 years are the age groups that are most secure financially, with 100.0% of males and 100.0% of females in these age groups living above the poverty line.
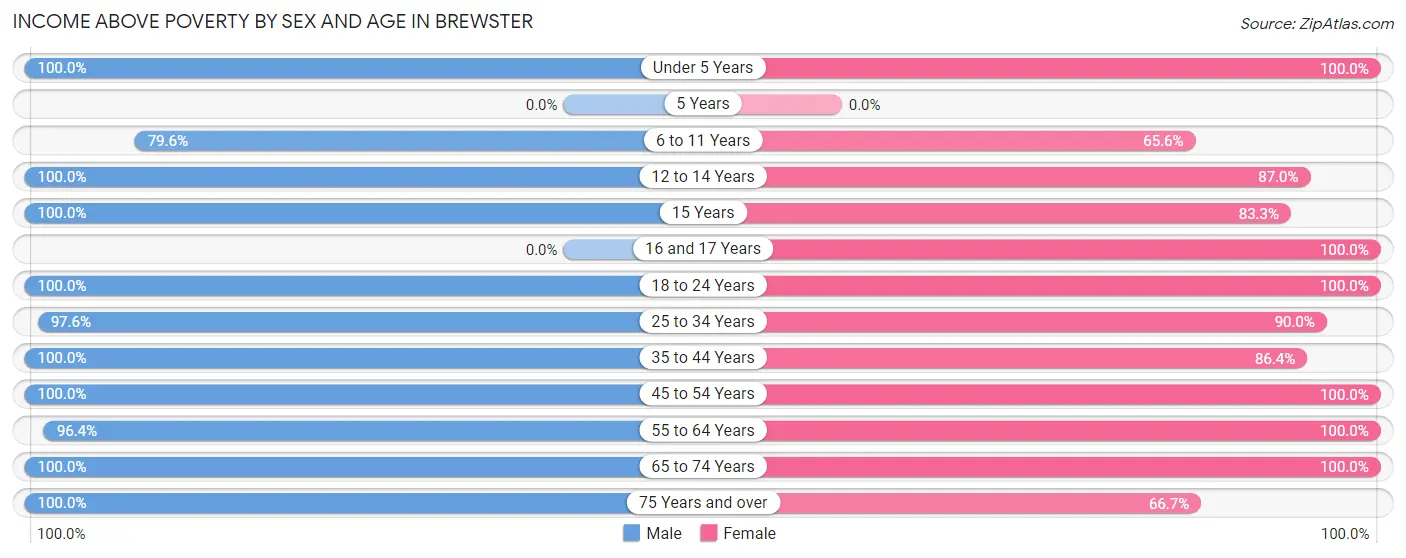
| Age Bracket | Male | Female |
| Under 5 Years | 13 (100.0%) | 4 (100.0%) |
| 5 Years | 0 (0.0%) | 0 (0.0%) |
| 6 to 11 Years | 35 (79.5%) | 21 (65.6%) |
| 12 to 14 Years | 6 (100.0%) | 20 (87.0%) |
| 15 Years | 2 (100.0%) | 5 (83.3%) |
| 16 and 17 Years | 0 (0.0%) | 8 (100.0%) |
| 18 to 24 Years | 21 (100.0%) | 30 (100.0%) |
| 25 to 34 Years | 40 (97.6%) | 9 (90.0%) |
| 35 to 44 Years | 91 (100.0%) | 38 (86.4%) |
| 45 to 54 Years | 13 (100.0%) | 9 (100.0%) |
| 55 to 64 Years | 27 (96.4%) | 28 (100.0%) |
| 65 to 74 Years | 18 (100.0%) | 19 (100.0%) |
| 75 Years and over | 22 (100.0%) | 12 (66.7%) |
| Total | 288 (94.4%) | 203 (87.9%) |
Income Below Poverty Among Married-Couple Families in Brewster
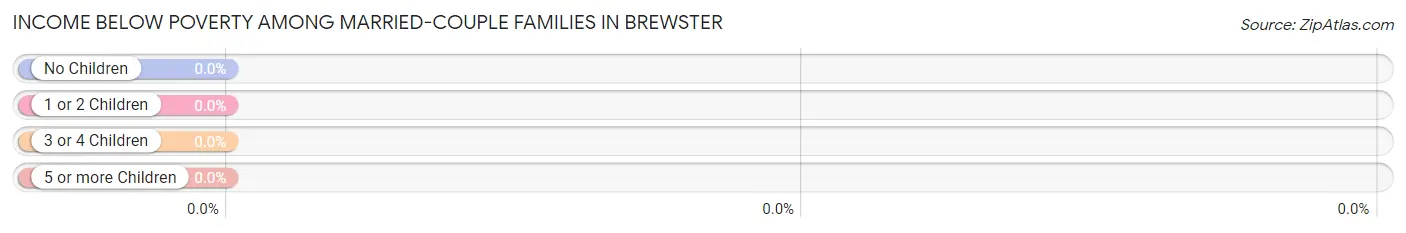
| Children | Above Poverty | Below Poverty |
| No Children | 37 (100.0%) | 0 (0.0%) |
| 1 or 2 Children | 5 (100.0%) | 0 (0.0%) |
| 3 or 4 Children | 3 (100.0%) | 0 (0.0%) |
| 5 or more Children | 4 (100.0%) | 0 (0.0%) |
| Total | 49 (100.0%) | 0 (0.0%) |
Income Below Poverty Among Single-Parent Households in Brewster
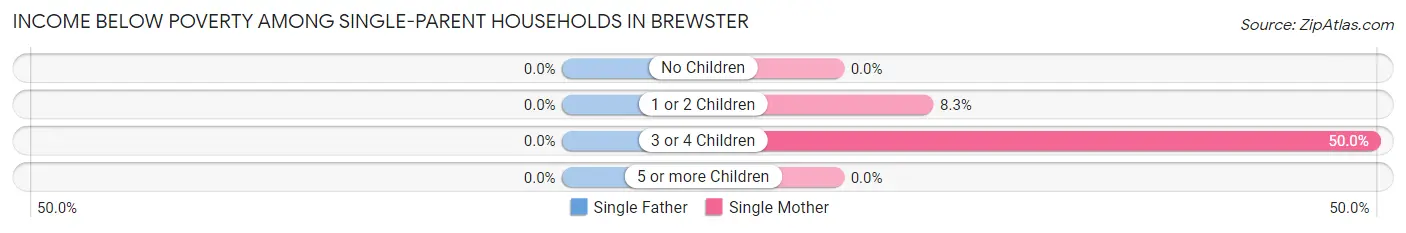
| Children | Single Father | Single Mother |
| No Children | 0 (0.0%) | 0 (0.0%) |
| 1 or 2 Children | 0 (0.0%) | 1 (8.3%) |
| 3 or 4 Children | 0 (0.0%) | 6 (50.0%) |
| 5 or more Children | 0 (0.0%) | 0 (0.0%) |
| Total | 0 (0.0%) | 7 (29.2%) |
Income Below Poverty Among Married-Couple vs Single-Parent Households in Brewster
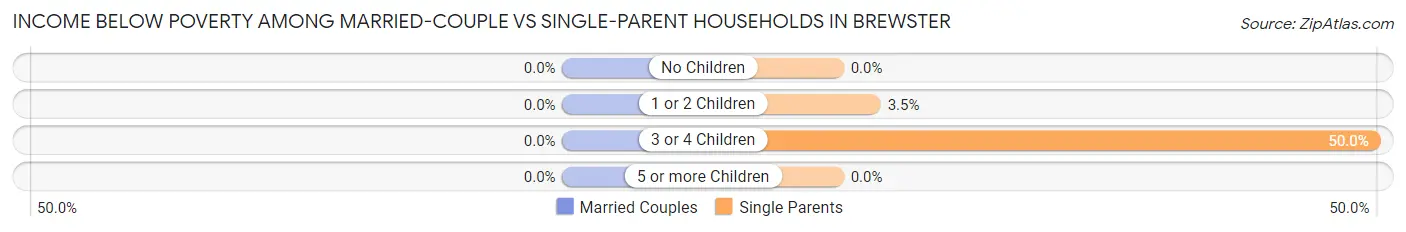
| Children | Married-Couple Families | Single-Parent Households |
| No Children | 0 (0.0%) | 0 (0.0%) |
| 1 or 2 Children | 0 (0.0%) | 1 (3.5%) |
| 3 or 4 Children | 0 (0.0%) | 6 (50.0%) |
| 5 or more Children | 0 (0.0%) | 0 (0.0%) |
| Total | 0 (0.0%) | 7 (14.3%) |
Race in Brewster
The most populous races in Brewster are White / Caucasian (275 | 51.3%), Hispanic or Latino (226 | 42.2%), and Two or more Races (184 | 34.3%).
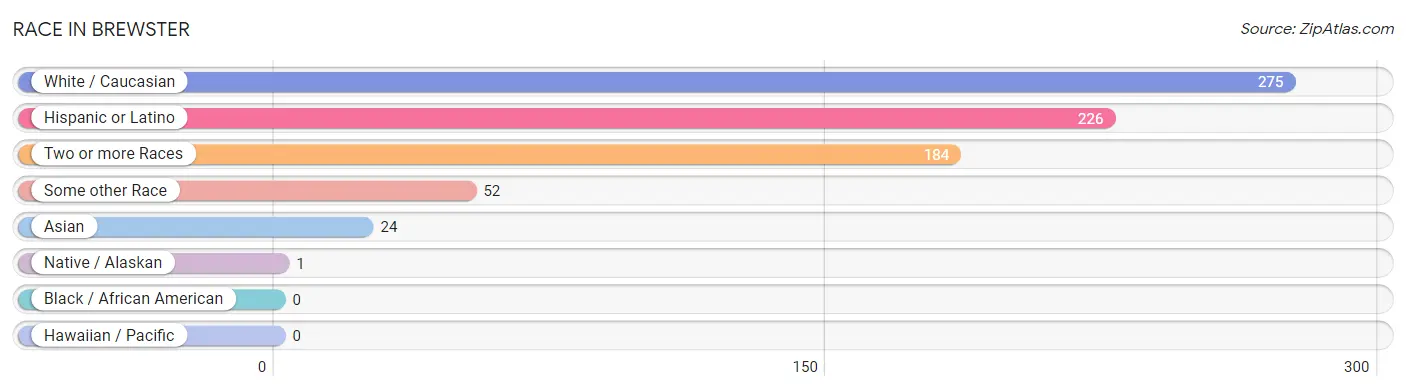
| Race | # Population | % Population |
| Asian | 24 | 4.5% |
| Black / African American | 0 | 0.0% |
| Hawaiian / Pacific | 0 | 0.0% |
| Hispanic or Latino | 226 | 42.2% |
| Native / Alaskan | 1 | 0.2% |
| White / Caucasian | 275 | 51.3% |
| Two or more Races | 184 | 34.3% |
| Some other Race | 52 | 9.7% |
| Total | 536 | 100.0% |
Ancestry in Brewster
The most populous ancestries reported in Brewster are Mexican (202 | 37.7%), German (100 | 18.7%), Irish (28 | 5.2%), Indonesian (24 | 4.5%), and Central American (21 | 3.9%), together accounting for 70.0% of all Brewster residents.
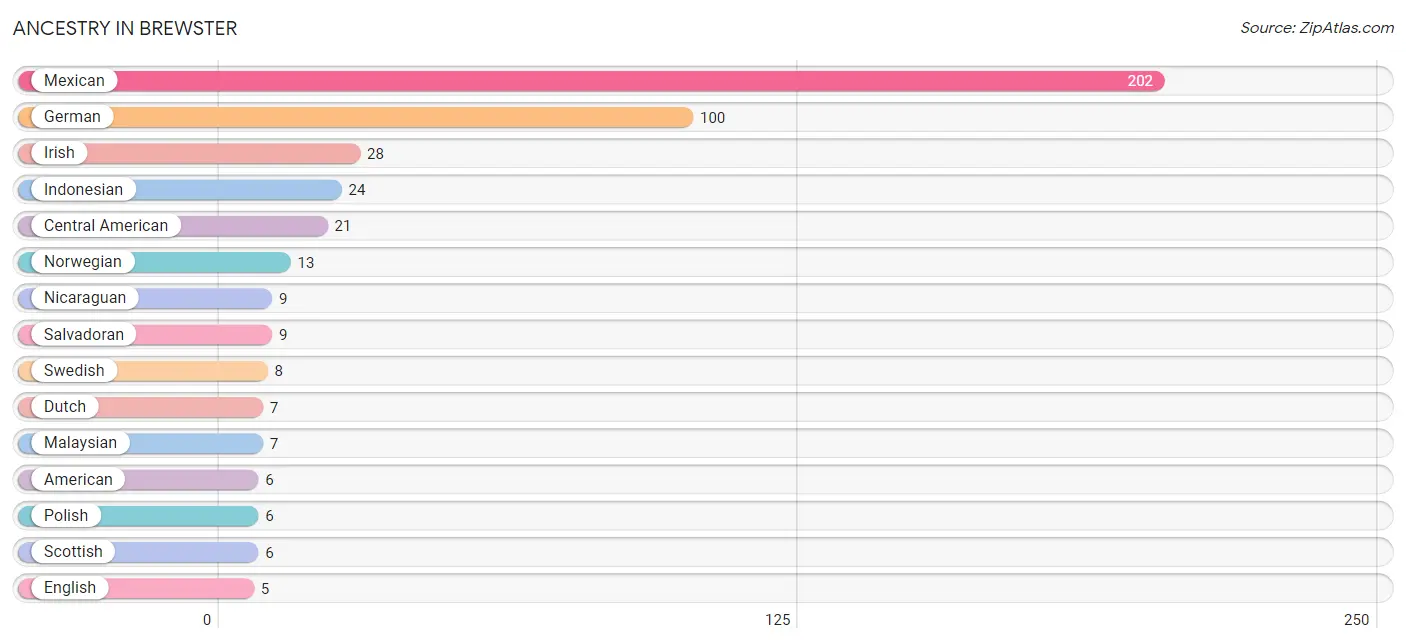
| Ancestry | # Population | % Population |
| American | 6 | 1.1% |
| Apache | 1 | 0.2% |
| Central American | 21 | 3.9% |
| Colombian | 2 | 0.4% |
| Czechoslovakian | 1 | 0.2% |
| Danish | 4 | 0.7% |
| Dutch | 7 | 1.3% |
| English | 5 | 0.9% |
| European | 2 | 0.4% |
| Finnish | 2 | 0.4% |
| French | 2 | 0.4% |
| German | 100 | 18.7% |
| Honduran | 3 | 0.6% |
| Indonesian | 24 | 4.5% |
| Irish | 28 | 5.2% |
| Malaysian | 7 | 1.3% |
| Mexican | 202 | 37.7% |
| Nicaraguan | 9 | 1.7% |
| Norwegian | 13 | 2.4% |
| Polish | 6 | 1.1% |
| Puerto Rican | 1 | 0.2% |
| Salvadoran | 9 | 1.7% |
| Scottish | 6 | 1.1% |
| South American | 2 | 0.4% |
| Swedish | 8 | 1.5% | View All 25 Rows |
Immigrants in Brewster
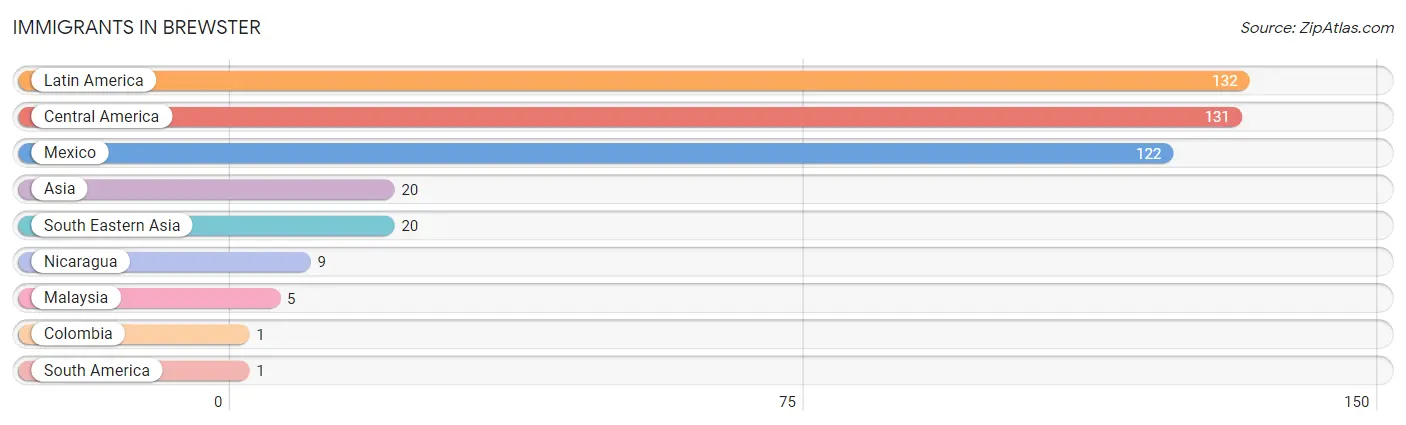
The most numerous immigrant groups reported in Brewster came from Latin America (132 | 24.6%), Central America (131 | 24.4%), Mexico (122 | 22.8%), Asia (20 | 3.7%), and South Eastern Asia (20 | 3.7%), together accounting for 79.3% of all Brewster residents.
| Immigration Origin | # Population | % Population |
| Asia | 20 | 3.7% |
| Central America | 131 | 24.4% |
| Colombia | 1 | 0.2% |
| Latin America | 132 | 24.6% |
| Malaysia | 5 | 0.9% |
| Mexico | 122 | 22.8% |
| Nicaragua | 9 | 1.7% |
| South America | 1 | 0.2% |
| South Eastern Asia | 20 | 3.7% | View All 9 Rows |
Sex and Age in Brewster
Sex and Age in Brewster
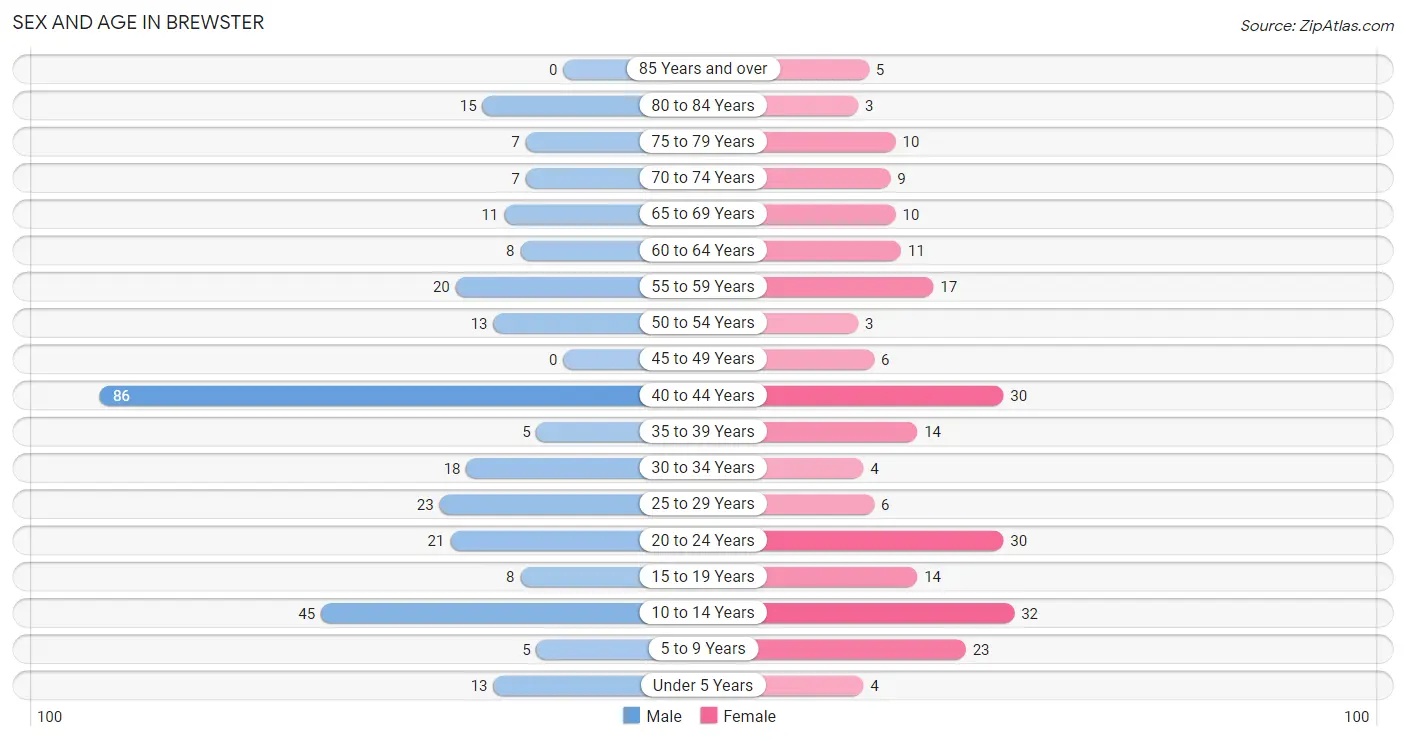
The most populous age groups in Brewster are 40 to 44 Years (86 | 28.2%) for men and 10 to 14 Years (32 | 13.9%) for women.
| Age Bracket | Male | Female |
| Under 5 Years | 13 (4.3%) | 4 (1.7%) |
| 5 to 9 Years | 5 (1.6%) | 23 (10.0%) |
| 10 to 14 Years | 45 (14.7%) | 32 (13.9%) |
| 15 to 19 Years | 8 (2.6%) | 14 (6.1%) |
| 20 to 24 Years | 21 (6.9%) | 30 (13.0%) |
| 25 to 29 Years | 23 (7.5%) | 6 (2.6%) |
| 30 to 34 Years | 18 (5.9%) | 4 (1.7%) |
| 35 to 39 Years | 5 (1.6%) | 14 (6.1%) |
| 40 to 44 Years | 86 (28.2%) | 30 (13.0%) |
| 45 to 49 Years | 0 (0.0%) | 6 (2.6%) |
| 50 to 54 Years | 13 (4.3%) | 3 (1.3%) |
| 55 to 59 Years | 20 (6.6%) | 17 (7.4%) |
| 60 to 64 Years | 8 (2.6%) | 11 (4.8%) |
| 65 to 69 Years | 11 (3.6%) | 10 (4.3%) |
| 70 to 74 Years | 7 (2.3%) | 9 (3.9%) |
| 75 to 79 Years | 7 (2.3%) | 10 (4.3%) |
| 80 to 84 Years | 15 (4.9%) | 3 (1.3%) |
| 85 Years and over | 0 (0.0%) | 5 (2.2%) |
| Total | 305 (100.0%) | 231 (100.0%) |
Families and Households in Brewster
Median Family Size in Brewster
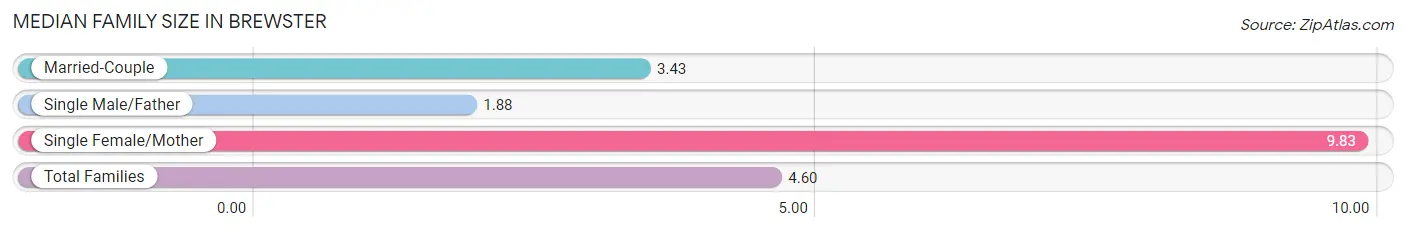
The median family size in Brewster is 4.60 persons per family, with single female/mother families (24 | 24.5%) accounting for the largest median family size of 9.83 persons per family. On the other hand, single male/father families (25 | 25.5%) represent the smallest median family size with 1.88 persons per family.
| Family Type | # Families | Family Size |
| Married-Couple | 49 (50.0%) | 3.43 |
| Single Male/Father | 25 (25.5%) | 1.88 |
| Single Female/Mother | 24 (24.5%) | 9.83 |
| Total Families | 98 (100.0%) | 4.60 |
Median Household Size in Brewster
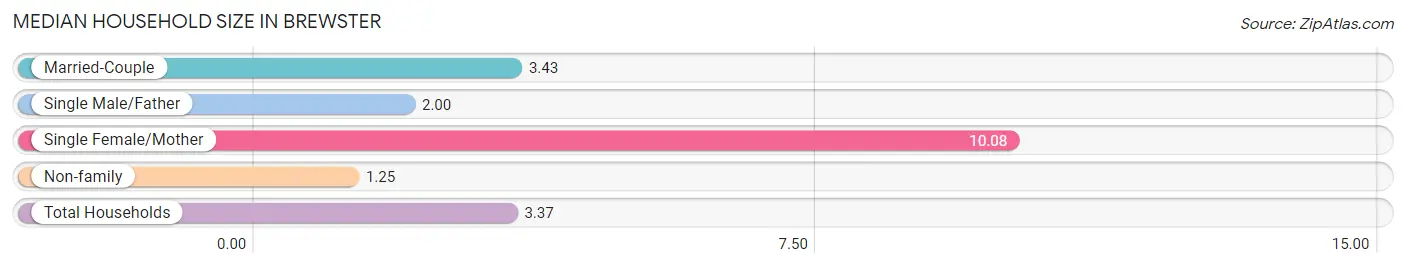
The median household size in Brewster is 3.37 persons per household, with single female/mother households (24 | 15.1%) accounting for the largest median household size of 10.08 persons per household. non-family households (61 | 38.4%) represent the smallest median household size with 1.25 persons per household.
| Household Type | # Households | Household Size |
| Married-Couple | 49 (30.8%) | 3.43 |
| Single Male/Father | 25 (15.7%) | 2.00 |
| Single Female/Mother | 24 (15.1%) | 10.08 |
| Non-family | 61 (38.4%) | 1.25 |
| Total Households | 159 (100.0%) | 3.37 |
Household Size by Marriage Status in Brewster
Out of a total of 159 households in Brewster, 98 (61.6%) are family households, while 61 (38.4%) are nonfamily households. The most numerous type of family households are 2-person households, comprising 49, and the most common type of nonfamily households are 1-person households, comprising 51.
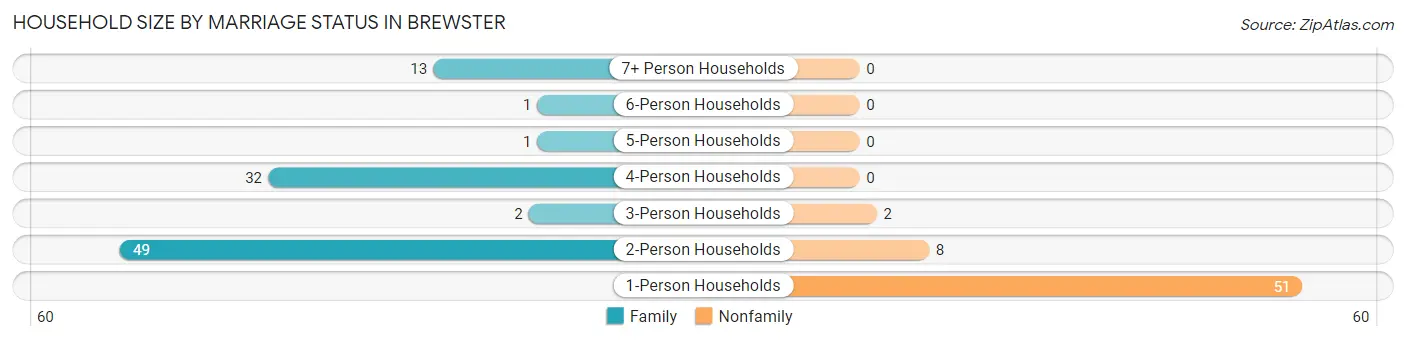
| Household Size | Family Households | Nonfamily Households |
| 1-Person Households | - | 51 (32.1%) |
| 2-Person Households | 49 (30.8%) | 8 (5.0%) |
| 3-Person Households | 2 (1.3%) | 2 (1.3%) |
| 4-Person Households | 32 (20.1%) | 0 (0.0%) |
| 5-Person Households | 1 (0.6%) | 0 (0.0%) |
| 6-Person Households | 1 (0.6%) | 0 (0.0%) |
| 7+ Person Households | 13 (8.2%) | 0 (0.0%) |
| Total | 98 (61.6%) | 61 (38.4%) |
Female Fertility in Brewster
Fertility by Age in Brewster
Average fertility rate in Brewster is 96.0 births per 1,000 women. Women in the age bracket of 20 to 34 years have the highest fertility rate with 250.0 births per 1,000 women. Women in the age bracket of 20 to 34 years acount for 100.0% of all women with births.
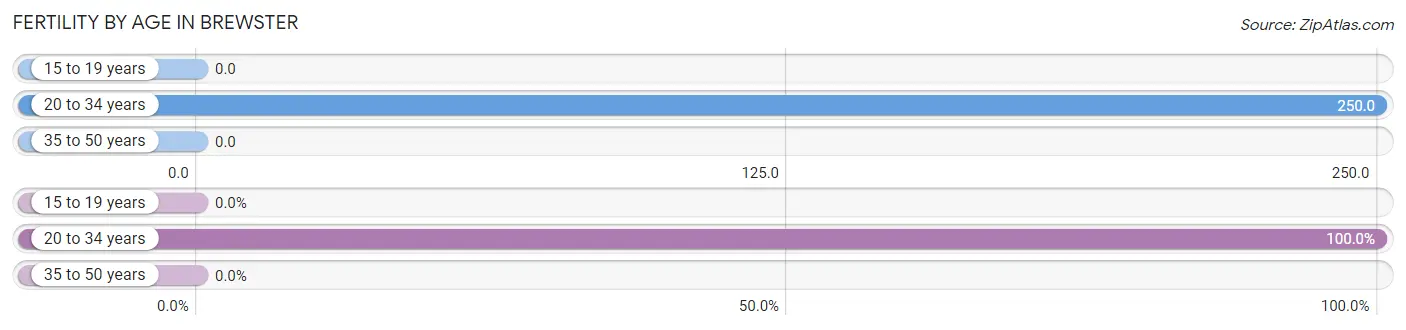
| Age Bracket | Women with Births | Births / 1,000 Women |
| 15 to 19 years | 0 (0.0%) | 0.0 |
| 20 to 34 years | 10 (100.0%) | 250.0 |
| 35 to 50 years | 0 (0.0%) | 0.0 |
| Total | 10 (100.0%) | 96.0 |
Fertility by Age by Marriage Status in Brewster
80.0% of women with births (10) in Brewster are married. The highest percentage of unmarried women with births falls into 20 to 34 years age bracket with 20.0% of them unmarried at the time of birth, while the lowest percentage of unmarried women with births belong to 20 to 34 years age bracket with 20.0% of them unmarried.
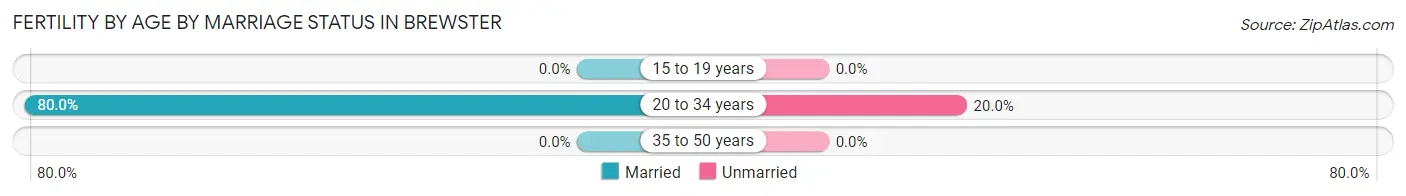
| Age Bracket | Married | Unmarried |
| 15 to 19 years | 0 (0.0%) | 0 (0.0%) |
| 20 to 34 years | 8 (80.0%) | 2 (20.0%) |
| 35 to 50 years | 0 (0.0%) | 0 (0.0%) |
| Total | 8 (80.0%) | 2 (20.0%) |
Fertility by Education in Brewster
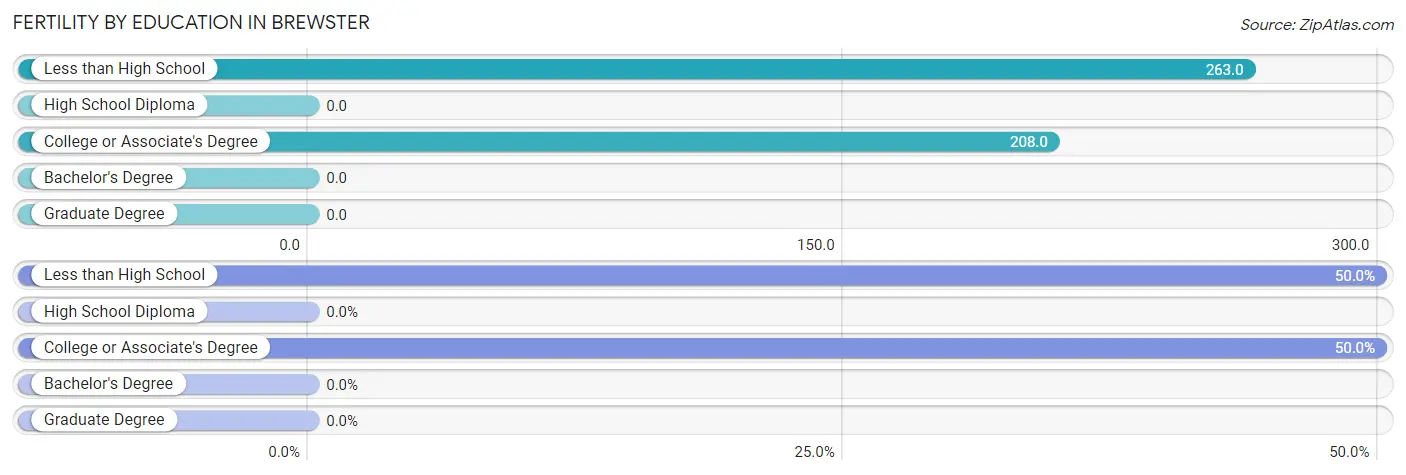
| Educational Attainment | Women with Births | Births / 1,000 Women |
| Less than High School | 5 (50.0%) | 263.0 |
| High School Diploma | 0 (0.0%) | 0.0 |
| College or Associate's Degree | 5 (50.0%) | 208.0 |
| Bachelor's Degree | 0 (0.0%) | 0.0 |
| Graduate Degree | 0 (0.0%) | 0.0 |
| Total | 10 (100.0%) | 96.0 |
Fertility by Education by Marriage Status in Brewster
20.0% of women with births in Brewster are unmarried. Women with the educational attainment of less than high school are most likely to be married with 100.0% of them married at childbirth, while women with the educational attainment of college or associate's degree are least likely to be married with 40.0% of them unmarried at childbirth.
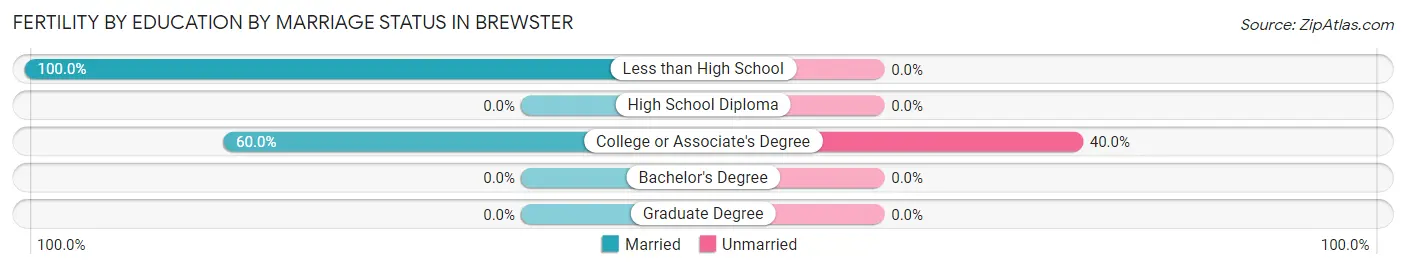
| Educational Attainment | Married | Unmarried |
| Less than High School | 5 (100.0%) | 0 (0.0%) |
| High School Diploma | 0 (0.0%) | 0 (0.0%) |
| College or Associate's Degree | 3 (60.0%) | 2 (40.0%) |
| Bachelor's Degree | 0 (0.0%) | 0 (0.0%) |
| Graduate Degree | 0 (0.0%) | 0 (0.0%) |
| Total | 8 (80.0%) | 2 (20.0%) |
Employment Characteristics in Brewster
Employment by Class of Employer in Brewster
Among the 273 employed individuals in Brewster, private company employees (133 | 48.7%), federal government employees (82 | 30.0%), and not-for-profit organizations (21 | 7.7%) make up the most common classes of employment.
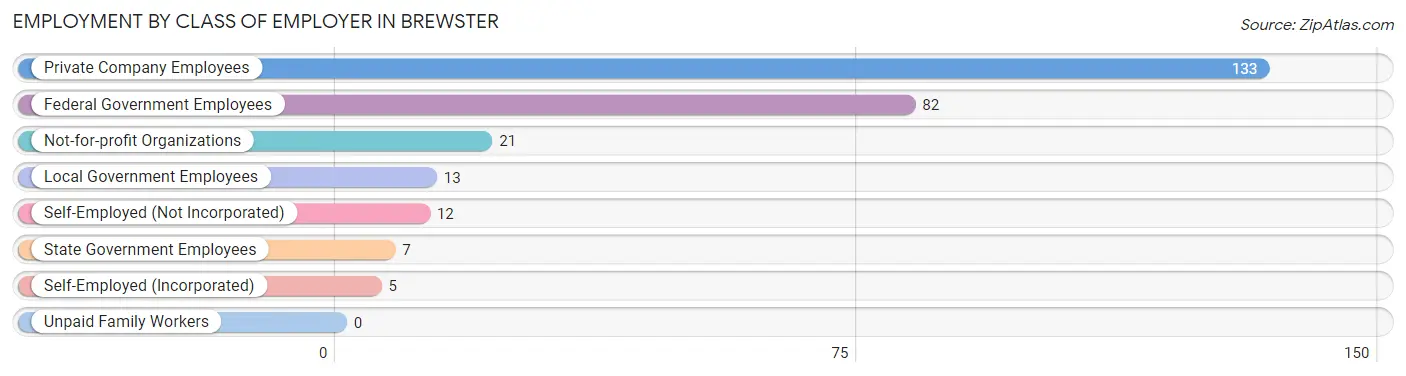
| Employer Class | # Employees | % Employees |
| Private Company Employees | 133 | 48.7% |
| Self-Employed (Incorporated) | 5 | 1.8% |
| Self-Employed (Not Incorporated) | 12 | 4.4% |
| Not-for-profit Organizations | 21 | 7.7% |
| Local Government Employees | 13 | 4.8% |
| State Government Employees | 7 | 2.6% |
| Federal Government Employees | 82 | 30.0% |
| Unpaid Family Workers | 0 | 0.0% |
| Total | 273 | 100.0% |
Employment Status by Age in Brewster
According to the labor force statistics for Brewster, out of the total population over 16 years of age (406), 74.1% or 301 individuals are in the labor force, with 5.0% or 15 of them unemployed. The age group with the highest labor force participation rate is 20 to 24 years, with 100.0% or 51 individuals in the labor force. Within the labor force, the 20 to 24 years age range has the highest percentage of unemployed individuals, with 27.5% or 14 of them being unemployed.
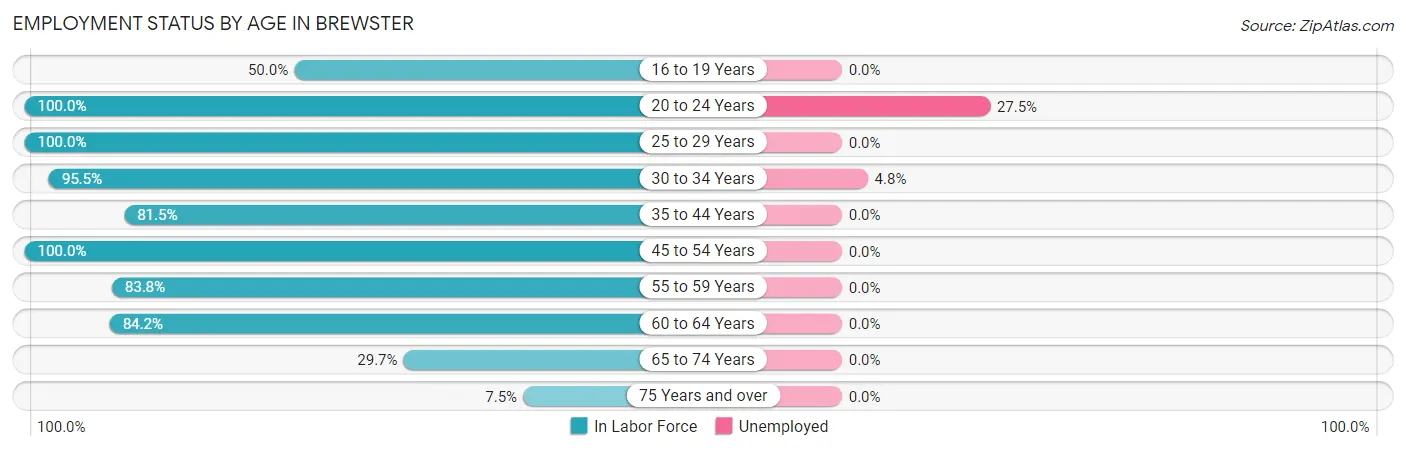
| Age Bracket | In Labor Force | Unemployed |
| 16 to 19 Years | 7 (50.0%) | 0 (0.0%) |
| 20 to 24 Years | 51 (100.0%) | 14 (27.5%) |
| 25 to 29 Years | 29 (100.0%) | 0 (0.0%) |
| 30 to 34 Years | 21 (95.5%) | 1 (4.8%) |
| 35 to 44 Years | 110 (81.5%) | 0 (0.0%) |
| 45 to 54 Years | 22 (100.0%) | 0 (0.0%) |
| 55 to 59 Years | 31 (83.8%) | 0 (0.0%) |
| 60 to 64 Years | 16 (84.2%) | 0 (0.0%) |
| 65 to 74 Years | 11 (29.7%) | 0 (0.0%) |
| 75 Years and over | 3 (7.5%) | 0 (0.0%) |
| Total | 301 (74.1%) | 15 (5.0%) |
Employment Status by Educational Attainment in Brewster
According to labor force statistics for Brewster, 86.7% of individuals (229) out of the total population between 25 and 64 years of age (264) are in the labor force, with 0.4% or 1 of them being unemployed. The group with the highest labor force participation rate are those with the educational attainment of less than high school, with 100.0% or 8 individuals in the labor force. Within the labor force, individuals with high school diploma education have the highest percentage of unemployment, with 0.8% or 1 of them being unemployed.
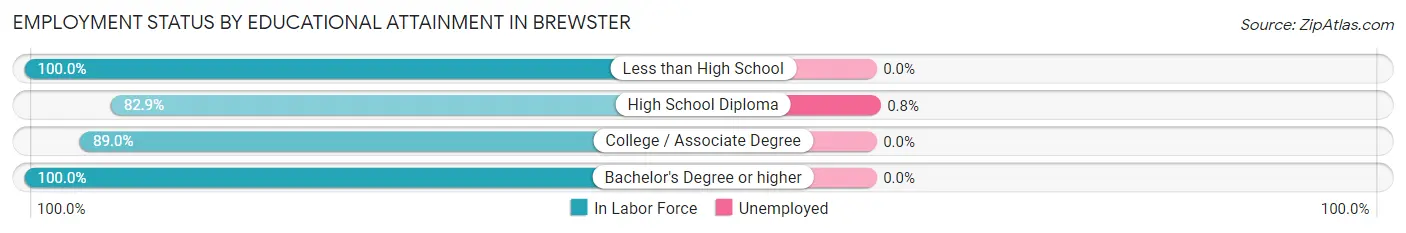
| Educational Attainment | In Labor Force | Unemployed |
| Less than High School | 8 (100.0%) | 0 (0.0%) |
| High School Diploma | 126 (82.9%) | 1 (0.8%) |
| College / Associate Degree | 73 (89.0%) | 0 (0.0%) |
| Bachelor's Degree or higher | 22 (100.0%) | 0 (0.0%) |
| Total | 229 (86.7%) | 1 (0.4%) |
Employment Occupations by Sex in Brewster
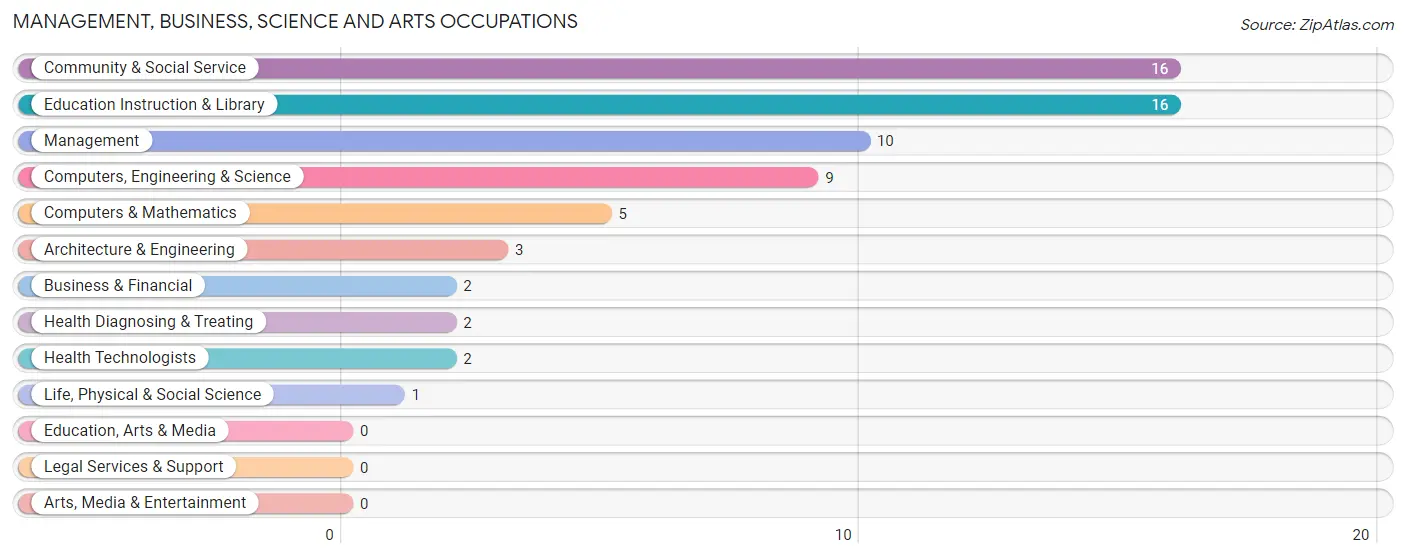
Management, Business, Science and Arts Occupations
The most common Management, Business, Science and Arts occupations in Brewster are Community & Social Service (16 | 5.6%), Education Instruction & Library (16 | 5.6%), Management (10 | 3.5%), Computers, Engineering & Science (9 | 3.2%), and Computers & Mathematics (5 | 1.8%).
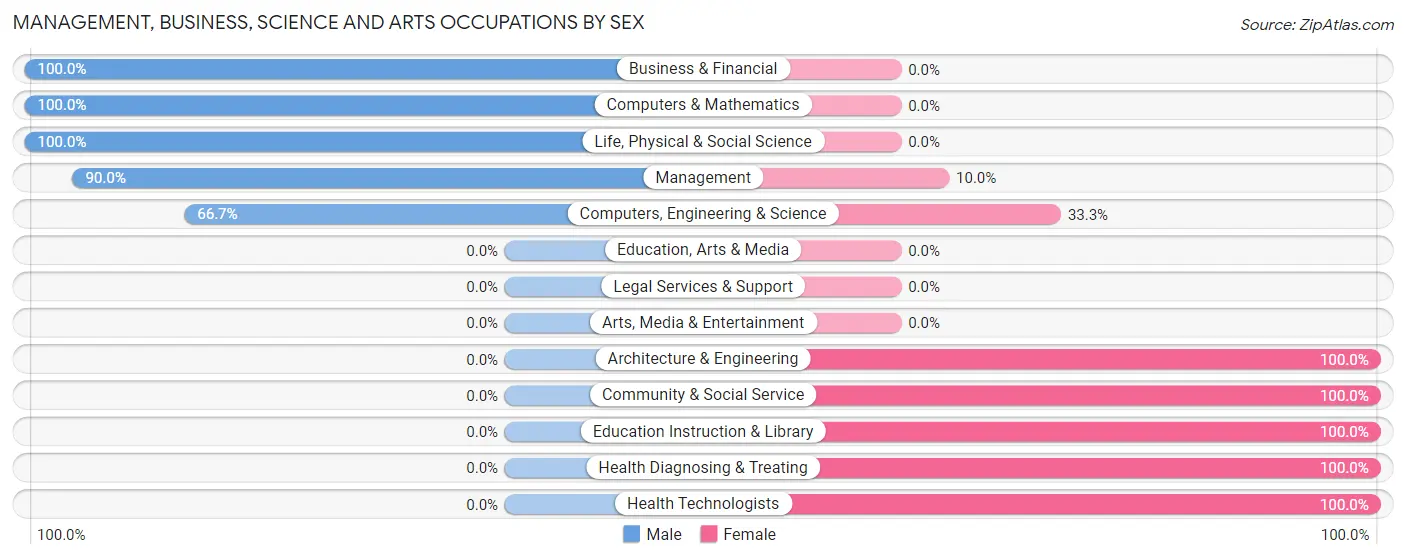
Management, Business, Science and Arts Occupations by Sex
Within the Management, Business, Science and Arts occupations in Brewster, the most male-oriented occupations are Business & Financial (100.0%), Computers & Mathematics (100.0%), and Life, Physical & Social Science (100.0%), while the most female-oriented occupations are Architecture & Engineering (100.0%), Community & Social Service (100.0%), and Education Instruction & Library (100.0%).
| Occupation | Male | Female |
| Management | 9 (90.0%) | 1 (10.0%) |
| Business & Financial | 2 (100.0%) | 0 (0.0%) |
| Computers, Engineering & Science | 6 (66.7%) | 3 (33.3%) |
| Computers & Mathematics | 5 (100.0%) | 0 (0.0%) |
| Architecture & Engineering | 0 (0.0%) | 3 (100.0%) |
| Life, Physical & Social Science | 1 (100.0%) | 0 (0.0%) |
| Community & Social Service | 0 (0.0%) | 16 (100.0%) |
| Education, Arts & Media | 0 (0.0%) | 0 (0.0%) |
| Legal Services & Support | 0 (0.0%) | 0 (0.0%) |
| Education Instruction & Library | 0 (0.0%) | 16 (100.0%) |
| Arts, Media & Entertainment | 0 (0.0%) | 0 (0.0%) |
| Health Diagnosing & Treating | 0 (0.0%) | 2 (100.0%) |
| Health Technologists | 0 (0.0%) | 2 (100.0%) |
| Total (Category) | 17 (43.6%) | 22 (56.4%) |
| Total (Overall) | 195 (68.2%) | 91 (31.8%) |
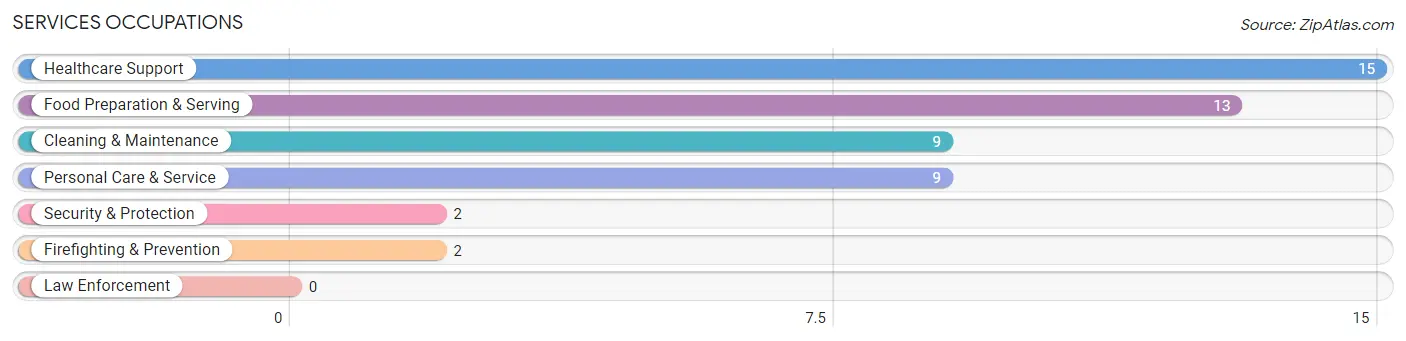
Services Occupations
The most common Services occupations in Brewster are Healthcare Support (15 | 5.2%), Food Preparation & Serving (13 | 4.5%), Cleaning & Maintenance (9 | 3.2%), Personal Care & Service (9 | 3.2%), and Security & Protection (2 | 0.7%).
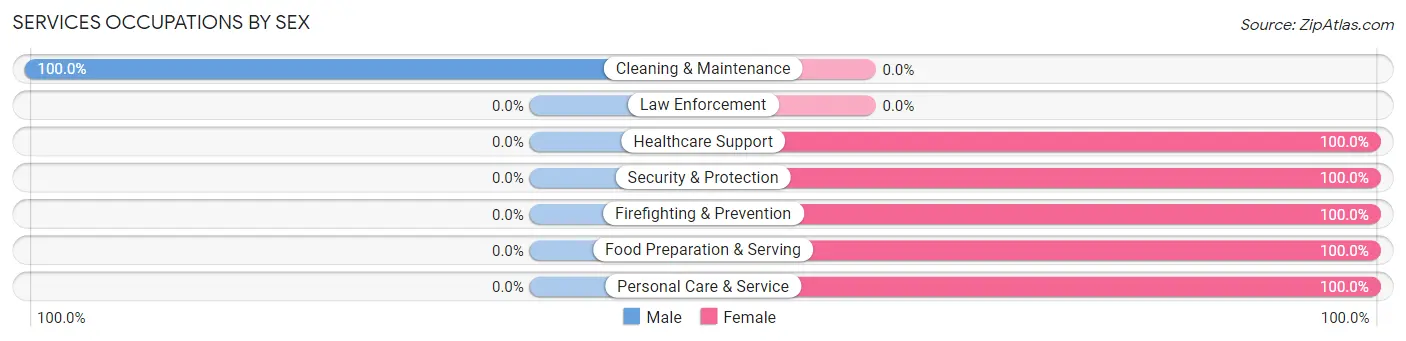
Services Occupations by Sex
| Occupation | Male | Female |
| Healthcare Support | 0 (0.0%) | 15 (100.0%) |
| Security & Protection | 0 (0.0%) | 2 (100.0%) |
| Firefighting & Prevention | 0 (0.0%) | 2 (100.0%) |
| Law Enforcement | 0 (0.0%) | 0 (0.0%) |
| Food Preparation & Serving | 0 (0.0%) | 13 (100.0%) |
| Cleaning & Maintenance | 9 (100.0%) | 0 (0.0%) |
| Personal Care & Service | 0 (0.0%) | 9 (100.0%) |
| Total (Category) | 9 (18.8%) | 39 (81.2%) |
| Total (Overall) | 195 (68.2%) | 91 (31.8%) |
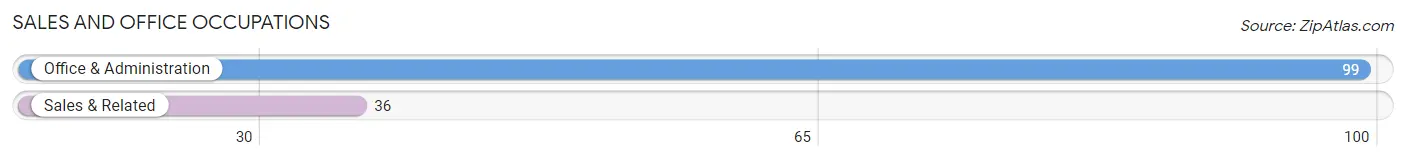
Sales and Office Occupations
The most common Sales and Office occupations in Brewster are Office & Administration (99 | 34.6%), and Sales & Related (36 | 12.6%).
Sales and Office Occupations by Sex
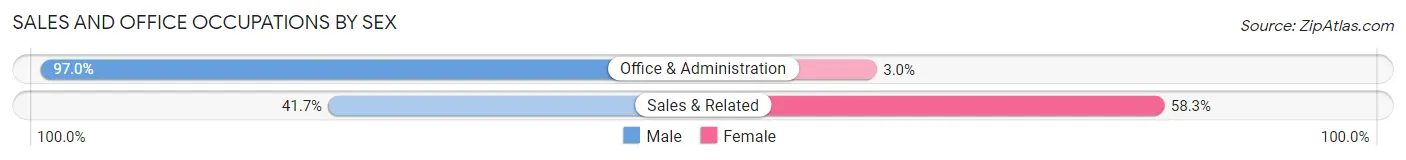
| Occupation | Male | Female |
| Sales & Related | 15 (41.7%) | 21 (58.3%) |
| Office & Administration | 96 (97.0%) | 3 (3.0%) |
| Total (Category) | 111 (82.2%) | 24 (17.8%) |
| Total (Overall) | 195 (68.2%) | 91 (31.8%) |
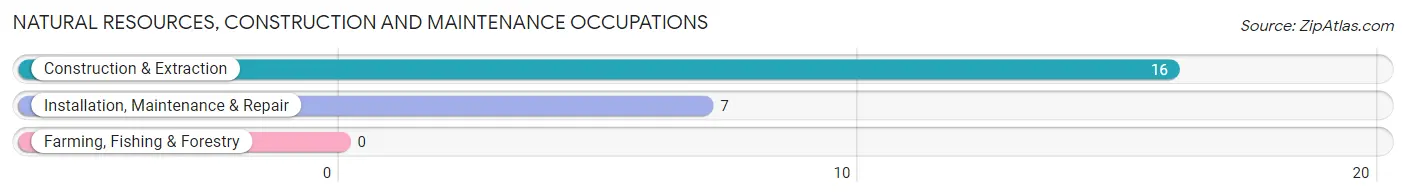
Natural Resources, Construction and Maintenance Occupations
The most common Natural Resources, Construction and Maintenance occupations in Brewster are Construction & Extraction (16 | 5.6%), and Installation, Maintenance & Repair (7 | 2.5%).
Natural Resources, Construction and Maintenance Occupations by Sex
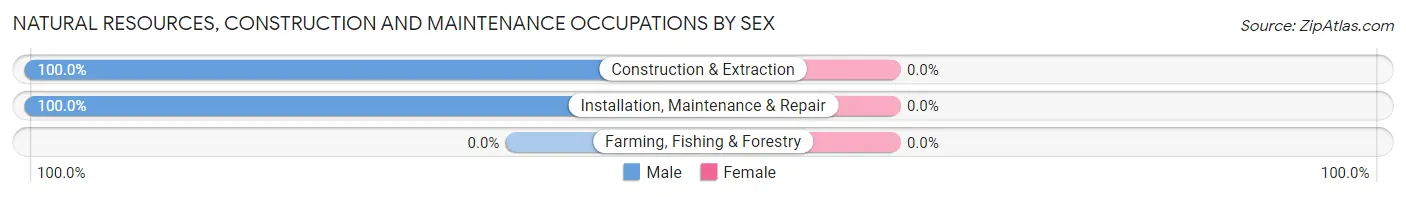
| Occupation | Male | Female |
| Farming, Fishing & Forestry | 0 (0.0%) | 0 (0.0%) |
| Construction & Extraction | 16 (100.0%) | 0 (0.0%) |
| Installation, Maintenance & Repair | 7 (100.0%) | 0 (0.0%) |
| Total (Category) | 23 (100.0%) | 0 (0.0%) |
| Total (Overall) | 195 (68.2%) | 91 (31.8%) |
Production, Transportation and Moving Occupations
The most common Production, Transportation and Moving occupations in Brewster are Production (27 | 9.4%), Transportation (7 | 2.5%), and Material Moving (7 | 2.5%).
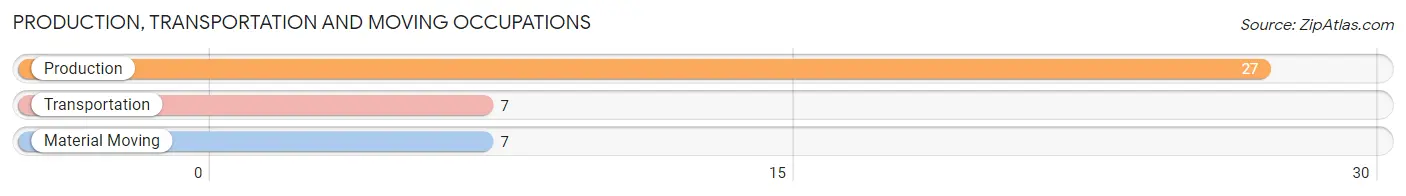
Production, Transportation and Moving Occupations by Sex
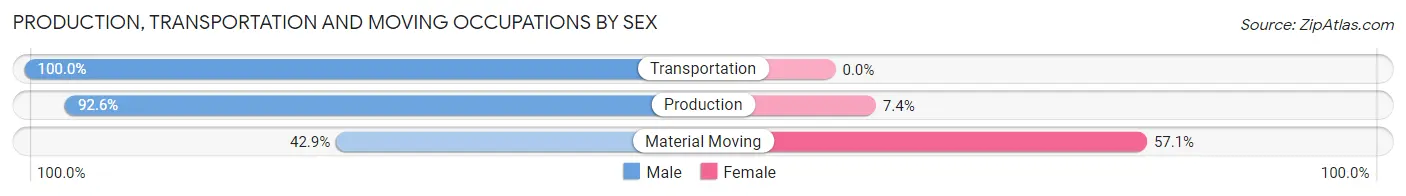
| Occupation | Male | Female |
| Production | 25 (92.6%) | 2 (7.4%) |
| Transportation | 7 (100.0%) | 0 (0.0%) |
| Material Moving | 3 (42.9%) | 4 (57.1%) |
| Total (Category) | 35 (85.4%) | 6 (14.6%) |
| Total (Overall) | 195 (68.2%) | 91 (31.8%) |
Employment Industries by Sex in Brewster
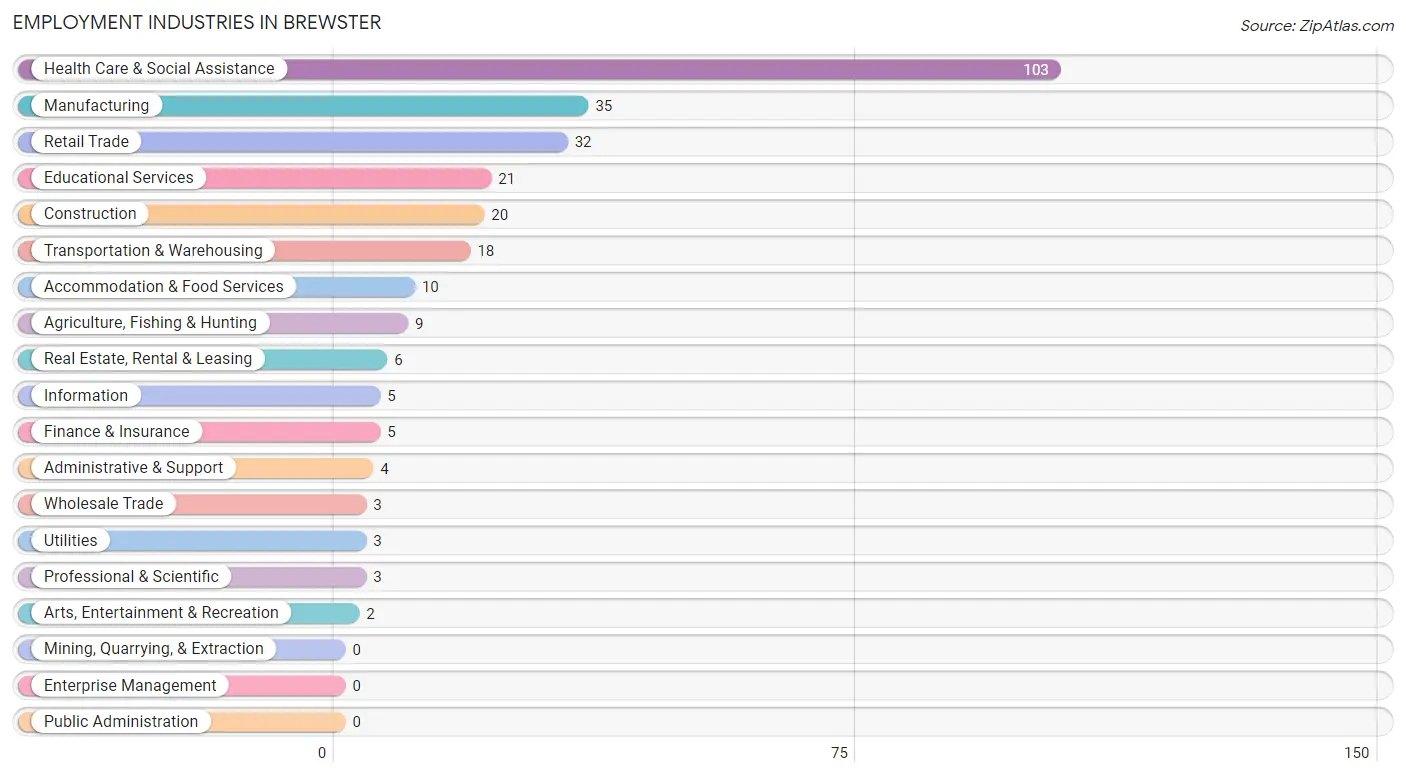
Employment Industries in Brewster
The major employment industries in Brewster include Health Care & Social Assistance (103 | 36.0%), Manufacturing (35 | 12.2%), Retail Trade (32 | 11.2%), Educational Services (21 | 7.3%), and Construction (20 | 7.0%).
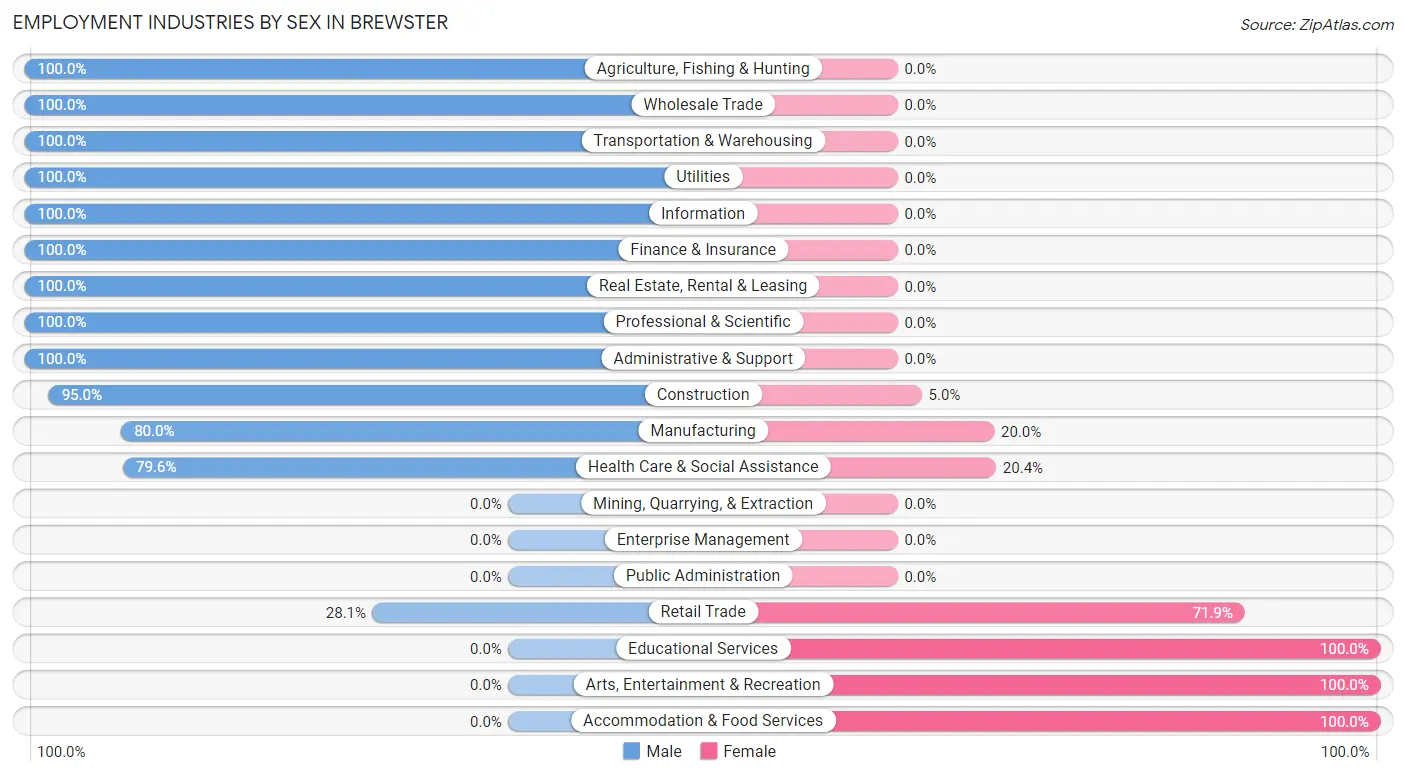
Employment Industries by Sex in Brewster
The Brewster industries that see more men than women are Agriculture, Fishing & Hunting (100.0%), Wholesale Trade (100.0%), and Transportation & Warehousing (100.0%), whereas the industries that tend to have a higher number of women are Educational Services (100.0%), Arts, Entertainment & Recreation (100.0%), and Accommodation & Food Services (100.0%).
| Industry | Male | Female |
| Agriculture, Fishing & Hunting | 9 (100.0%) | 0 (0.0%) |
| Mining, Quarrying, & Extraction | 0 (0.0%) | 0 (0.0%) |
| Construction | 19 (95.0%) | 1 (5.0%) |
| Manufacturing | 28 (80.0%) | 7 (20.0%) |
| Wholesale Trade | 3 (100.0%) | 0 (0.0%) |
| Retail Trade | 9 (28.1%) | 23 (71.9%) |
| Transportation & Warehousing | 18 (100.0%) | 0 (0.0%) |
| Utilities | 3 (100.0%) | 0 (0.0%) |
| Information | 5 (100.0%) | 0 (0.0%) |
| Finance & Insurance | 5 (100.0%) | 0 (0.0%) |
| Real Estate, Rental & Leasing | 6 (100.0%) | 0 (0.0%) |
| Professional & Scientific | 3 (100.0%) | 0 (0.0%) |
| Enterprise Management | 0 (0.0%) | 0 (0.0%) |
| Administrative & Support | 4 (100.0%) | 0 (0.0%) |
| Educational Services | 0 (0.0%) | 21 (100.0%) |
| Health Care & Social Assistance | 82 (79.6%) | 21 (20.4%) |
| Arts, Entertainment & Recreation | 0 (0.0%) | 2 (100.0%) |
| Accommodation & Food Services | 0 (0.0%) | 10 (100.0%) |
| Public Administration | 0 (0.0%) | 0 (0.0%) |
| Total | 195 (68.2%) | 91 (31.8%) |
Education in Brewster
School Enrollment in Brewster
The most common levels of schooling among the 138 students in Brewster are middle school (61 | 44.2%), high school (35 | 25.4%), and elementary school (26 | 18.8%).
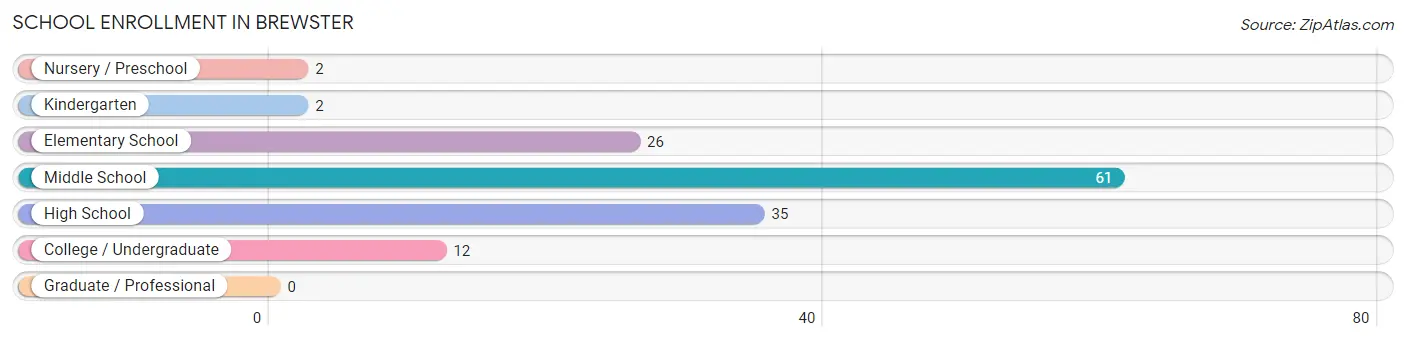
| School Level | # Students | % Students |
| Nursery / Preschool | 2 | 1.5% |
| Kindergarten | 2 | 1.5% |
| Elementary School | 26 | 18.8% |
| Middle School | 61 | 44.2% |
| High School | 35 | 25.4% |
| College / Undergraduate | 12 | 8.7% |
| Graduate / Professional | 0 | 0.0% |
| Total | 138 | 100.0% |
School Enrollment by Age by Funding Source in Brewster
Out of a total of 138 students who are enrolled in schools in Brewster, 9 (6.5%) attend a private institution, while the remaining 129 (93.5%) are enrolled in public schools. The age group of 20 to 24 year olds has the highest likelihood of being enrolled in private schools, with 6 (100.0% in the age bracket) enrolled. Conversely, the age group of 3 to 4 year olds has the lowest likelihood of being enrolled in a private school, with 2 (100.0% in the age bracket) attending a public institution.
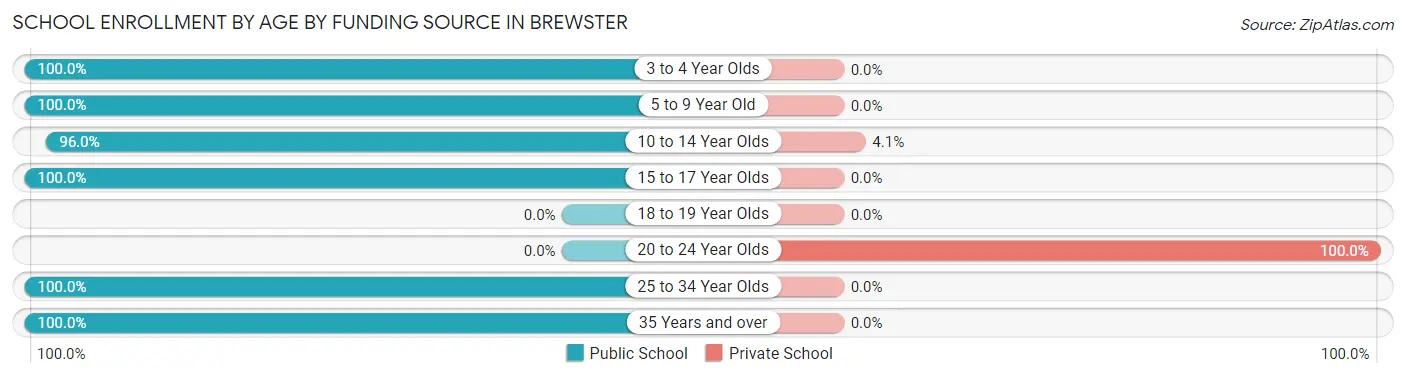
| Age Bracket | Public School | Private School |
| 3 to 4 Year Olds | 2 (100.0%) | 0 (0.0%) |
| 5 to 9 Year Old | 28 (100.0%) | 0 (0.0%) |
| 10 to 14 Year Olds | 71 (96.0%) | 3 (4.1%) |
| 15 to 17 Year Olds | 22 (100.0%) | 0 (0.0%) |
| 18 to 19 Year Olds | 0 (0.0%) | 0 (0.0%) |
| 20 to 24 Year Olds | 0 (0.0%) | 6 (100.0%) |
| 25 to 34 Year Olds | 5 (100.0%) | 0 (0.0%) |
| 35 Years and over | 1 (100.0%) | 0 (0.0%) |
| Total | 129 (93.5%) | 9 (6.5%) |
Educational Attainment by Field of Study in Brewster
Business (12 | 44.4%), education (6 | 22.2%), bio, nature & agricultural (5 | 18.5%), computers & mathematics (2 | 7.4%), and arts & humanities (2 | 7.4%) are the most common fields of study among 27 individuals in Brewster who have obtained a bachelor's degree or higher.
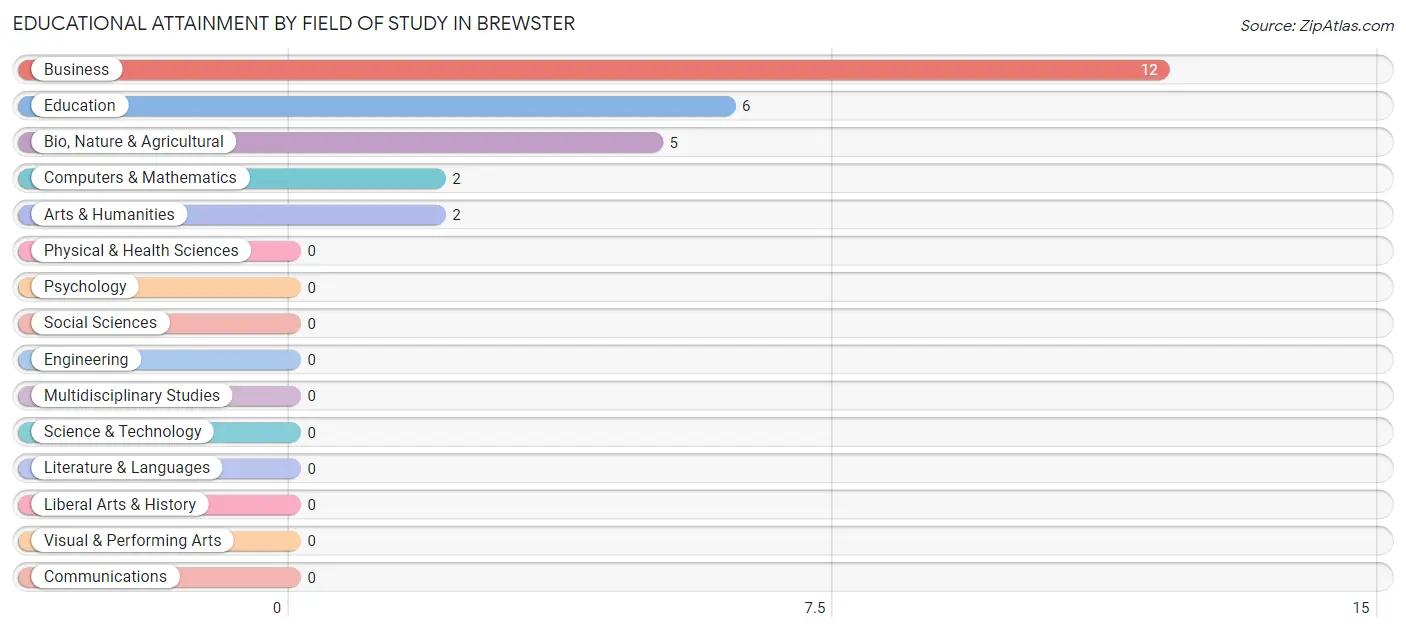
| Field of Study | # Graduates | % Graduates |
| Computers & Mathematics | 2 | 7.4% |
| Bio, Nature & Agricultural | 5 | 18.5% |
| Physical & Health Sciences | 0 | 0.0% |
| Psychology | 0 | 0.0% |
| Social Sciences | 0 | 0.0% |
| Engineering | 0 | 0.0% |
| Multidisciplinary Studies | 0 | 0.0% |
| Science & Technology | 0 | 0.0% |
| Business | 12 | 44.4% |
| Education | 6 | 22.2% |
| Literature & Languages | 0 | 0.0% |
| Liberal Arts & History | 0 | 0.0% |
| Visual & Performing Arts | 0 | 0.0% |
| Communications | 0 | 0.0% |
| Arts & Humanities | 2 | 7.4% |
| Total | 27 | 100.0% |
Transportation & Commute in Brewster
Vehicle Availability by Sex in Brewster
The most prevalent vehicle ownership categories in Brewster are males with 3 vehicles (100, accounting for 52.6%) and females with 3 vehicles (26, making up 120.5%).
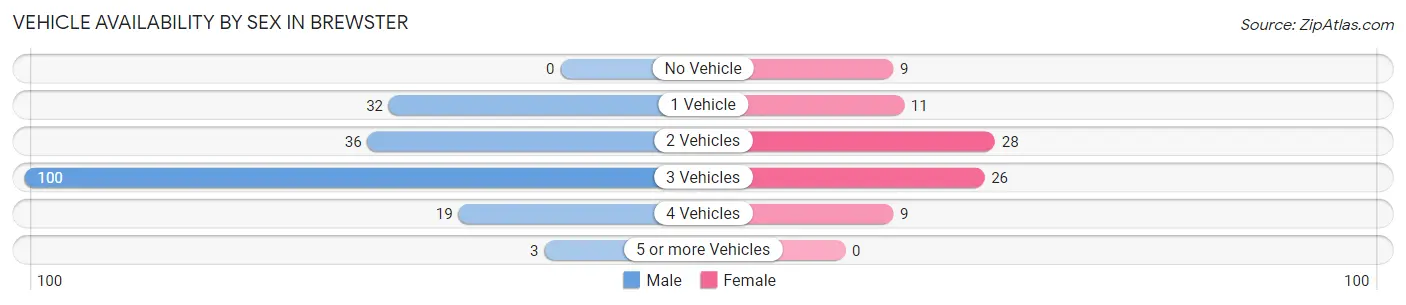
| Vehicles Available | Male | Female |
| No Vehicle | 0 (0.0%) | 9 (10.8%) |
| 1 Vehicle | 32 (16.8%) | 11 (13.3%) |
| 2 Vehicles | 36 (19.0%) | 28 (33.7%) |
| 3 Vehicles | 100 (52.6%) | 26 (31.3%) |
| 4 Vehicles | 19 (10.0%) | 9 (10.8%) |
| 5 or more Vehicles | 3 (1.6%) | 0 (0.0%) |
| Total | 190 (100.0%) | 83 (100.0%) |
Commute Time in Brewster
The most frequently occuring commute durations in Brewster are 15 to 19 minutes (122 commuters, 48.6%), 10 to 14 minutes (54 commuters, 21.5%), and less than 5 minutes (24 commuters, 9.6%).
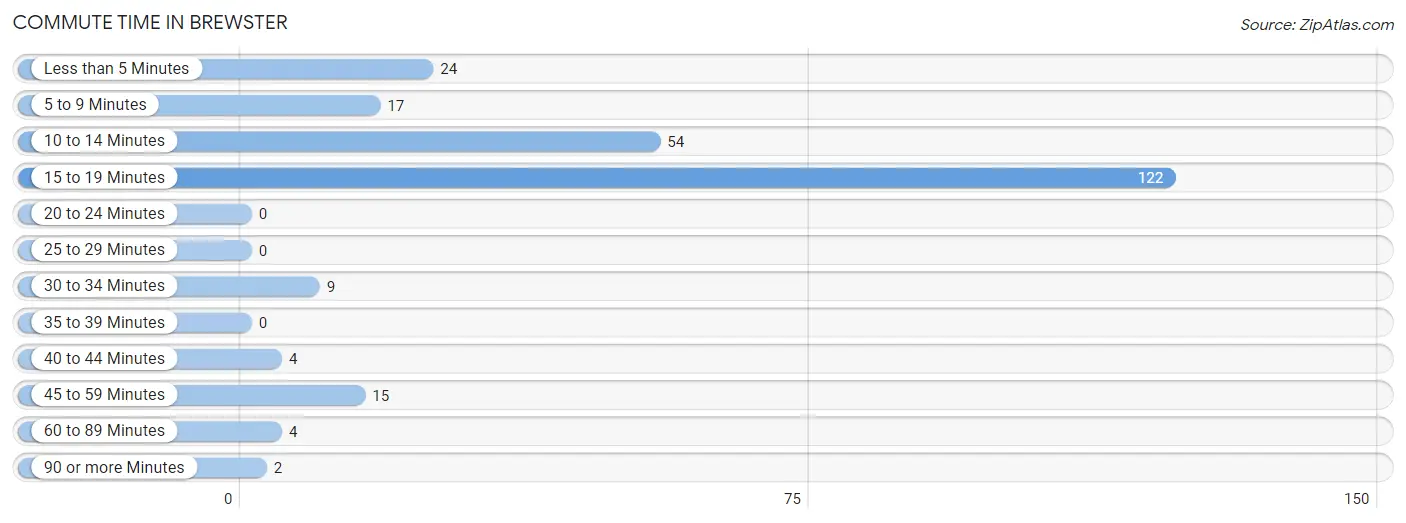
| Commute Time | # Commuters | % Commuters |
| Less than 5 Minutes | 24 | 9.6% |
| 5 to 9 Minutes | 17 | 6.8% |
| 10 to 14 Minutes | 54 | 21.5% |
| 15 to 19 Minutes | 122 | 48.6% |
| 20 to 24 Minutes | 0 | 0.0% |
| 25 to 29 Minutes | 0 | 0.0% |
| 30 to 34 Minutes | 9 | 3.6% |
| 35 to 39 Minutes | 0 | 0.0% |
| 40 to 44 Minutes | 4 | 1.6% |
| 45 to 59 Minutes | 15 | 6.0% |
| 60 to 89 Minutes | 4 | 1.6% |
| 90 or more Minutes | 2 | 0.8% |
Commute Time by Sex in Brewster
The most common commute times in Brewster are 15 to 19 minutes (109 commuters, 61.9%) for males and 10 to 14 minutes (36 commuters, 48.0%) for females.
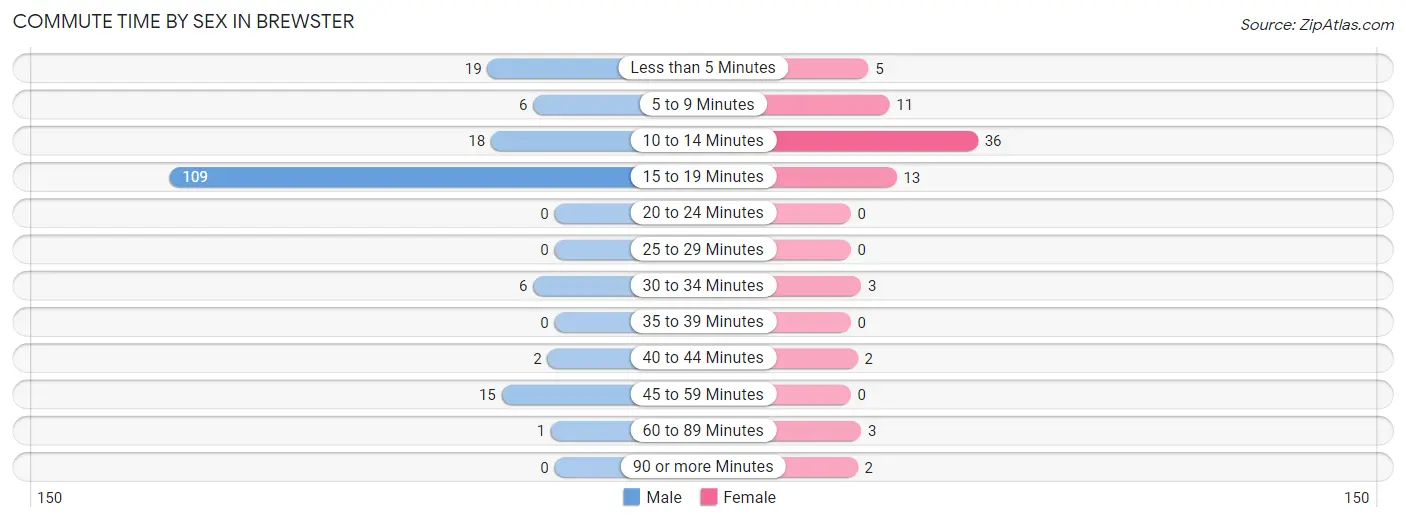
| Commute Time | Male | Female |
| Less than 5 Minutes | 19 (10.8%) | 5 (6.7%) |
| 5 to 9 Minutes | 6 (3.4%) | 11 (14.7%) |
| 10 to 14 Minutes | 18 (10.2%) | 36 (48.0%) |
| 15 to 19 Minutes | 109 (61.9%) | 13 (17.3%) |
| 20 to 24 Minutes | 0 (0.0%) | 0 (0.0%) |
| 25 to 29 Minutes | 0 (0.0%) | 0 (0.0%) |
| 30 to 34 Minutes | 6 (3.4%) | 3 (4.0%) |
| 35 to 39 Minutes | 0 (0.0%) | 0 (0.0%) |
| 40 to 44 Minutes | 2 (1.1%) | 2 (2.7%) |
| 45 to 59 Minutes | 15 (8.5%) | 0 (0.0%) |
| 60 to 89 Minutes | 1 (0.6%) | 3 (4.0%) |
| 90 or more Minutes | 0 (0.0%) | 2 (2.7%) |
Time of Departure to Work by Sex in Brewster
The most frequent times of departure to work in Brewster are 7:30 AM to 7:59 AM (102, 58.0%) for males and 12:00 PM to 3:59 PM (18, 24.0%) for females.
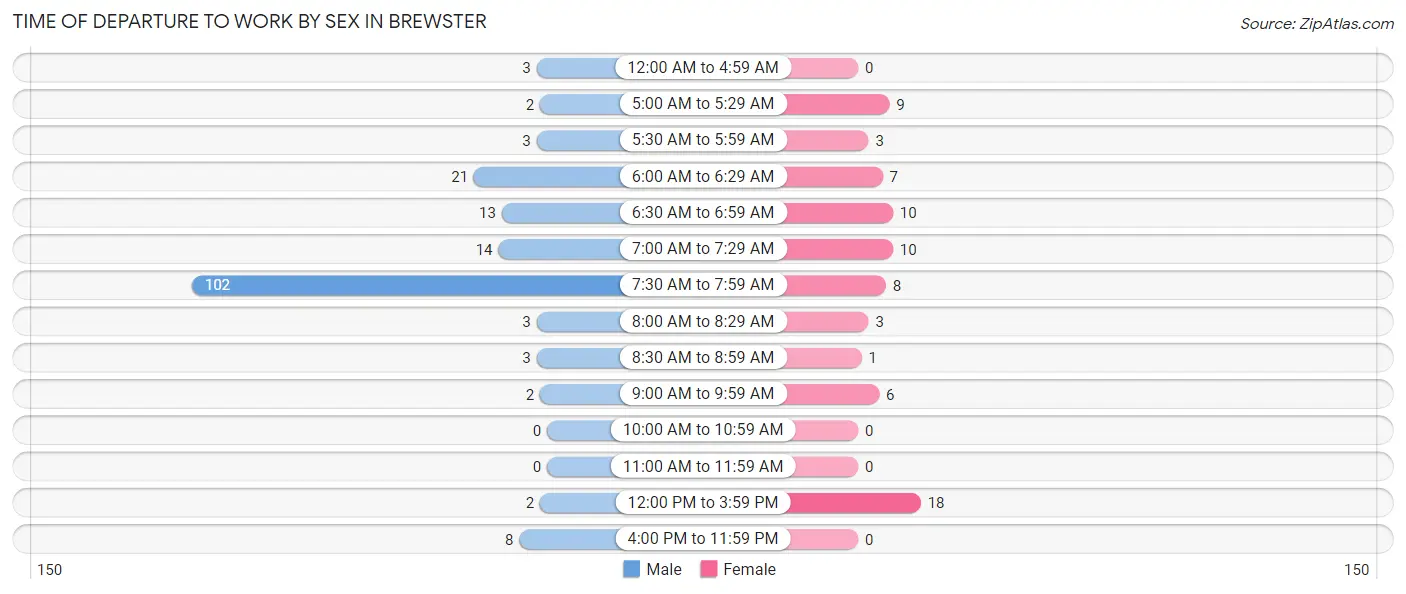
| Time of Departure | Male | Female |
| 12:00 AM to 4:59 AM | 3 (1.7%) | 0 (0.0%) |
| 5:00 AM to 5:29 AM | 2 (1.1%) | 9 (12.0%) |
| 5:30 AM to 5:59 AM | 3 (1.7%) | 3 (4.0%) |
| 6:00 AM to 6:29 AM | 21 (11.9%) | 7 (9.3%) |
| 6:30 AM to 6:59 AM | 13 (7.4%) | 10 (13.3%) |
| 7:00 AM to 7:29 AM | 14 (8.0%) | 10 (13.3%) |
| 7:30 AM to 7:59 AM | 102 (58.0%) | 8 (10.7%) |
| 8:00 AM to 8:29 AM | 3 (1.7%) | 3 (4.0%) |
| 8:30 AM to 8:59 AM | 3 (1.7%) | 1 (1.3%) |
| 9:00 AM to 9:59 AM | 2 (1.1%) | 6 (8.0%) |
| 10:00 AM to 10:59 AM | 0 (0.0%) | 0 (0.0%) |
| 11:00 AM to 11:59 AM | 0 (0.0%) | 0 (0.0%) |
| 12:00 PM to 3:59 PM | 2 (1.1%) | 18 (24.0%) |
| 4:00 PM to 11:59 PM | 8 (4.5%) | 0 (0.0%) |
| Total | 176 (100.0%) | 75 (100.0%) |
Housing Occupancy in Brewster
Occupancy by Ownership in Brewster
Of the total 159 dwellings in Brewster, owner-occupied units account for 125 (78.6%), while renter-occupied units make up 34 (21.4%).
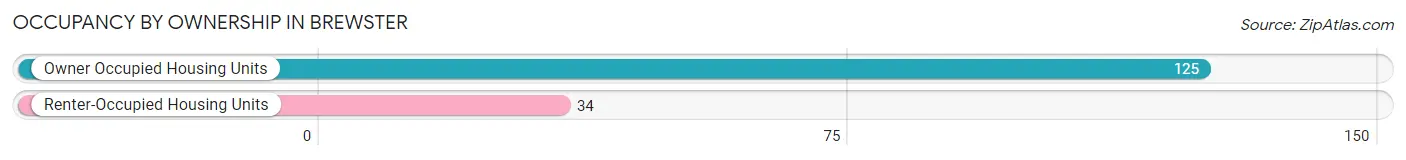
| Occupancy | # Housing Units | % Housing Units |
| Owner Occupied Housing Units | 125 | 78.6% |
| Renter-Occupied Housing Units | 34 | 21.4% |
| Total Occupied Housing Units | 159 | 100.0% |
Occupancy by Household Size in Brewster
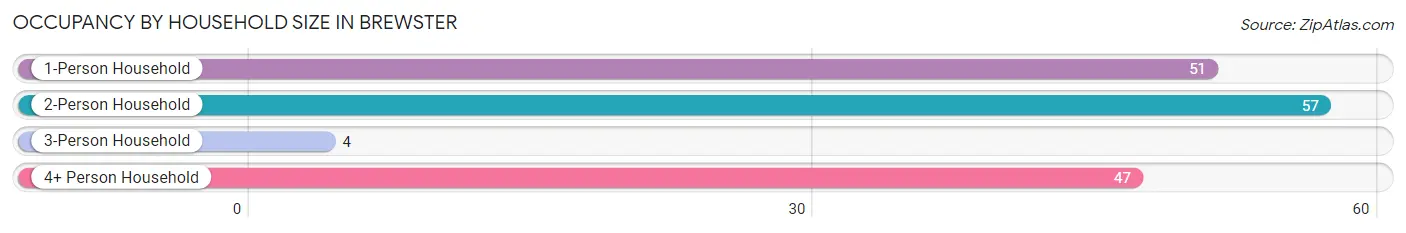
| Household Size | # Housing Units | % Housing Units |
| 1-Person Household | 51 | 32.1% |
| 2-Person Household | 57 | 35.8% |
| 3-Person Household | 4 | 2.5% |
| 4+ Person Household | 47 | 29.6% |
| Total Housing Units | 159 | 100.0% |
Occupancy by Ownership by Household Size in Brewster
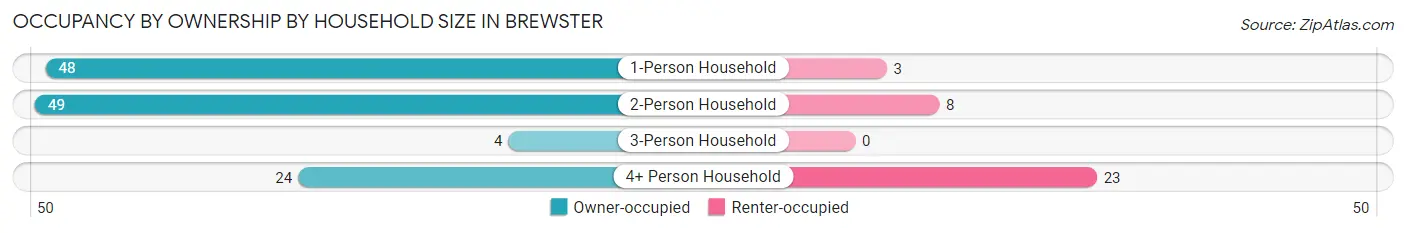
| Household Size | Owner-occupied | Renter-occupied |
| 1-Person Household | 48 (94.1%) | 3 (5.9%) |
| 2-Person Household | 49 (86.0%) | 8 (14.0%) |
| 3-Person Household | 4 (100.0%) | 0 (0.0%) |
| 4+ Person Household | 24 (51.1%) | 23 (48.9%) |
| Total Housing Units | 125 (78.6%) | 34 (21.4%) |
Occupancy by Educational Attainment in Brewster
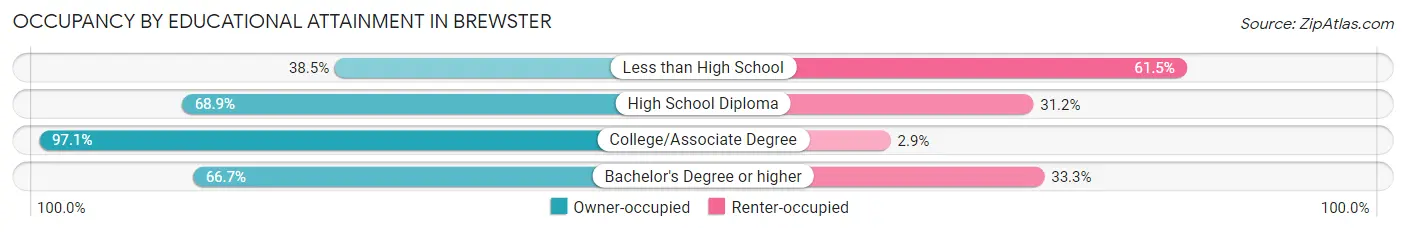
| Household Size | Owner-occupied | Renter-occupied |
| Less than High School | 5 (38.5%) | 8 (61.5%) |
| High School Diploma | 42 (68.9%) | 19 (31.1%) |
| College/Associate Degree | 68 (97.1%) | 2 (2.9%) |
| Bachelor's Degree or higher | 10 (66.7%) | 5 (33.3%) |
Occupancy by Age of Householder in Brewster
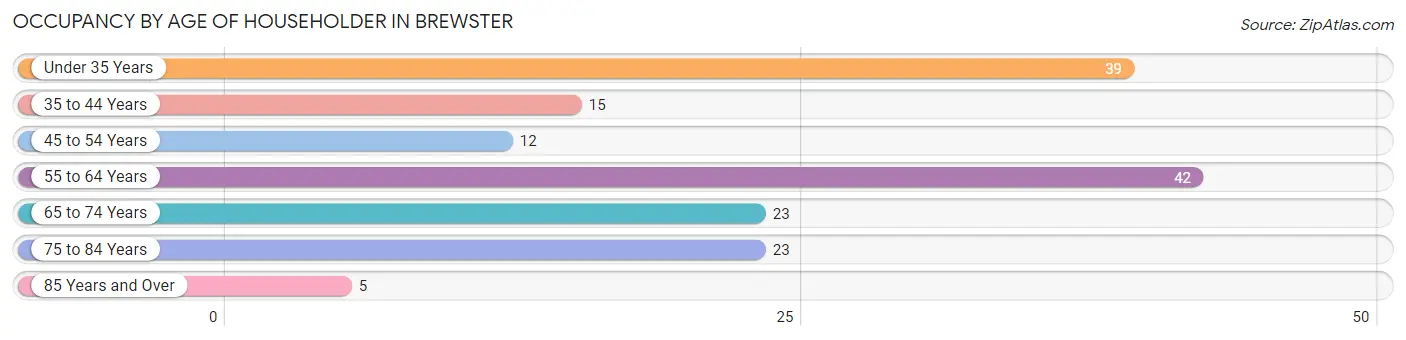
| Age Bracket | # Households | % Households |
| Under 35 Years | 39 | 24.5% |
| 35 to 44 Years | 15 | 9.4% |
| 45 to 54 Years | 12 | 7.5% |
| 55 to 64 Years | 42 | 26.4% |
| 65 to 74 Years | 23 | 14.5% |
| 75 to 84 Years | 23 | 14.5% |
| 85 Years and Over | 5 | 3.1% |
| Total | 159 | 100.0% |
Housing Finances in Brewster
Median Income by Occupancy in Brewster
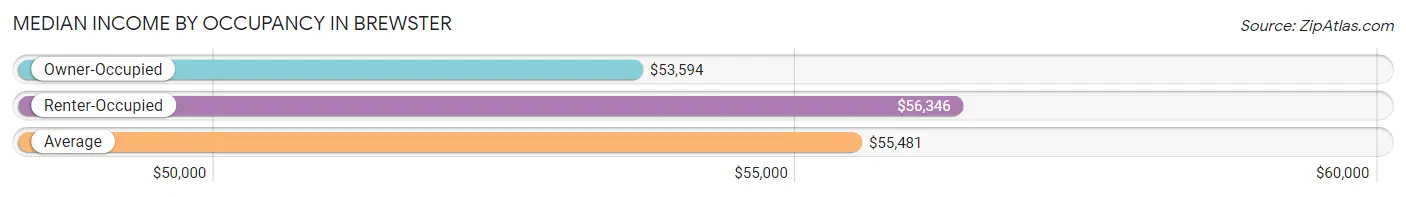
| Occupancy Type | # Households | Median Income |
| Owner-Occupied | 125 (78.6%) | $53,594 |
| Renter-Occupied | 34 (21.4%) | $56,346 |
| Average | 159 (100.0%) | $55,481 |
Occupancy by Householder Income Bracket in Brewster
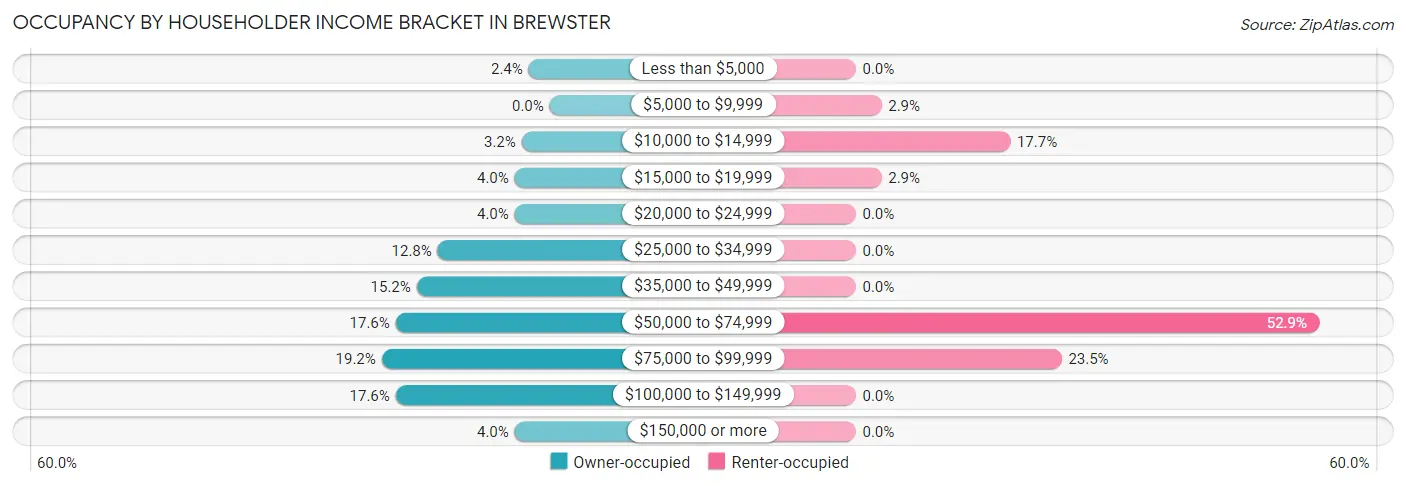
| Income Bracket | Owner-occupied | Renter-occupied |
| Less than $5,000 | 3 (2.4%) | 0 (0.0%) |
| $5,000 to $9,999 | 0 (0.0%) | 1 (2.9%) |
| $10,000 to $14,999 | 4 (3.2%) | 6 (17.6%) |
| $15,000 to $19,999 | 5 (4.0%) | 1 (2.9%) |
| $20,000 to $24,999 | 5 (4.0%) | 0 (0.0%) |
| $25,000 to $34,999 | 16 (12.8%) | 0 (0.0%) |
| $35,000 to $49,999 | 19 (15.2%) | 0 (0.0%) |
| $50,000 to $74,999 | 22 (17.6%) | 18 (52.9%) |
| $75,000 to $99,999 | 24 (19.2%) | 8 (23.5%) |
| $100,000 to $149,999 | 22 (17.6%) | 0 (0.0%) |
| $150,000 or more | 5 (4.0%) | 0 (0.0%) |
| Total | 125 (100.0%) | 34 (100.0%) |
Monthly Housing Cost Tiers in Brewster
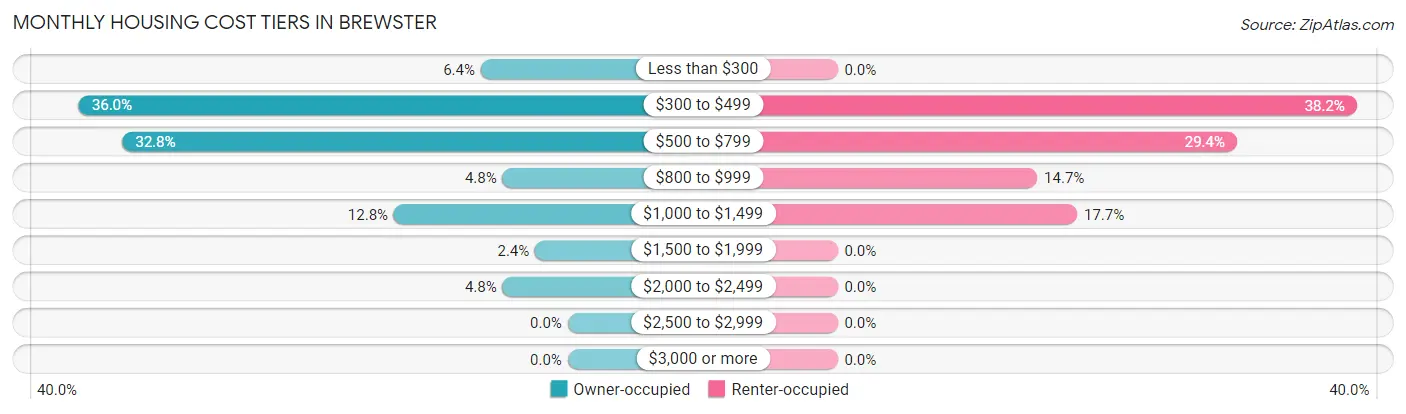
| Monthly Cost | Owner-occupied | Renter-occupied |
| Less than $300 | 8 (6.4%) | 0 (0.0%) |
| $300 to $499 | 45 (36.0%) | 13 (38.2%) |
| $500 to $799 | 41 (32.8%) | 10 (29.4%) |
| $800 to $999 | 6 (4.8%) | 5 (14.7%) |
| $1,000 to $1,499 | 16 (12.8%) | 6 (17.6%) |
| $1,500 to $1,999 | 3 (2.4%) | 0 (0.0%) |
| $2,000 to $2,499 | 6 (4.8%) | 0 (0.0%) |
| $2,500 to $2,999 | 0 (0.0%) | 0 (0.0%) |
| $3,000 or more | 0 (0.0%) | 0 (0.0%) |
| Total | 125 (100.0%) | 34 (100.0%) |
Physical Housing Characteristics in Brewster
Housing Structures in Brewster
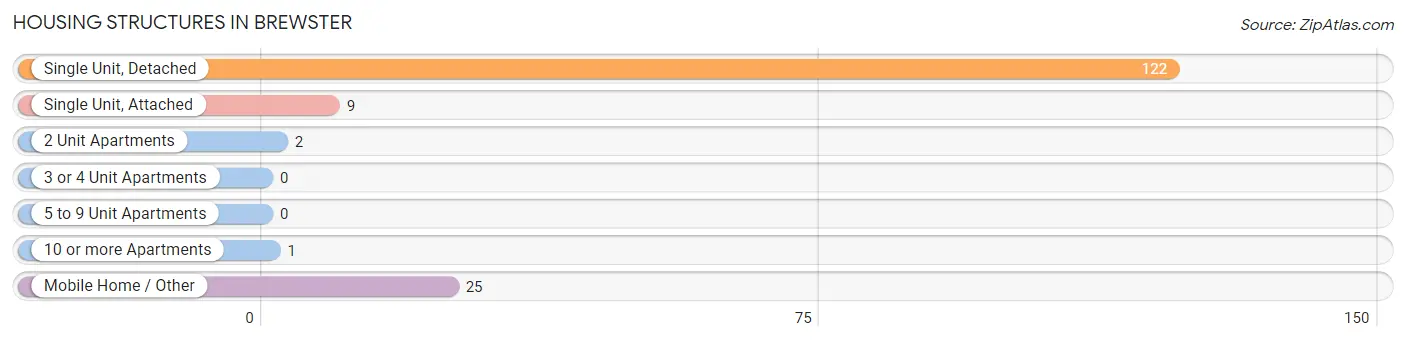
| Structure Type | # Housing Units | % Housing Units |
| Single Unit, Detached | 122 | 76.7% |
| Single Unit, Attached | 9 | 5.7% |
| 2 Unit Apartments | 2 | 1.3% |
| 3 or 4 Unit Apartments | 0 | 0.0% |
| 5 to 9 Unit Apartments | 0 | 0.0% |
| 10 or more Apartments | 1 | 0.6% |
| Mobile Home / Other | 25 | 15.7% |
| Total | 159 | 100.0% |
Housing Structures by Occupancy in Brewster
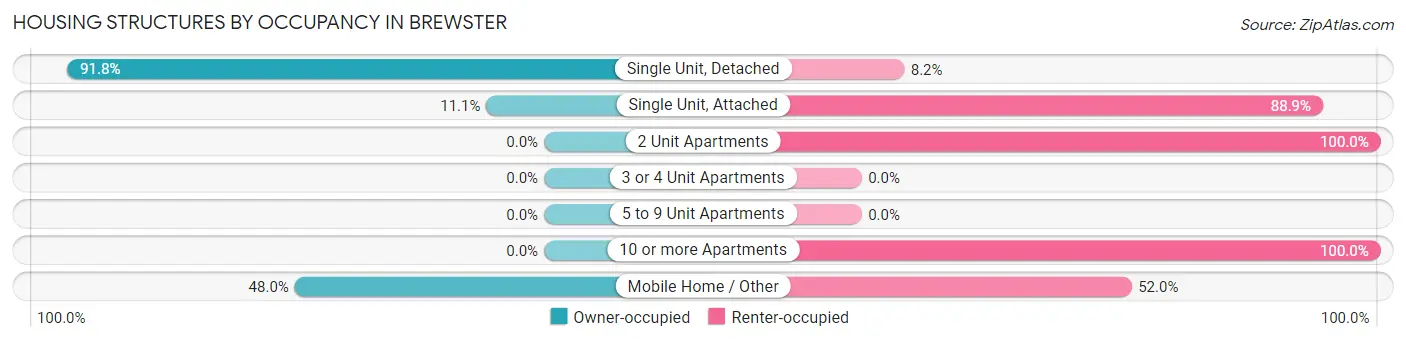
| Structure Type | Owner-occupied | Renter-occupied |
| Single Unit, Detached | 112 (91.8%) | 10 (8.2%) |
| Single Unit, Attached | 1 (11.1%) | 8 (88.9%) |
| 2 Unit Apartments | 0 (0.0%) | 2 (100.0%) |
| 3 or 4 Unit Apartments | 0 (0.0%) | 0 (0.0%) |
| 5 to 9 Unit Apartments | 0 (0.0%) | 0 (0.0%) |
| 10 or more Apartments | 0 (0.0%) | 1 (100.0%) |
| Mobile Home / Other | 12 (48.0%) | 13 (52.0%) |
| Total | 125 (78.6%) | 34 (21.4%) |
Housing Structures by Number of Rooms in Brewster
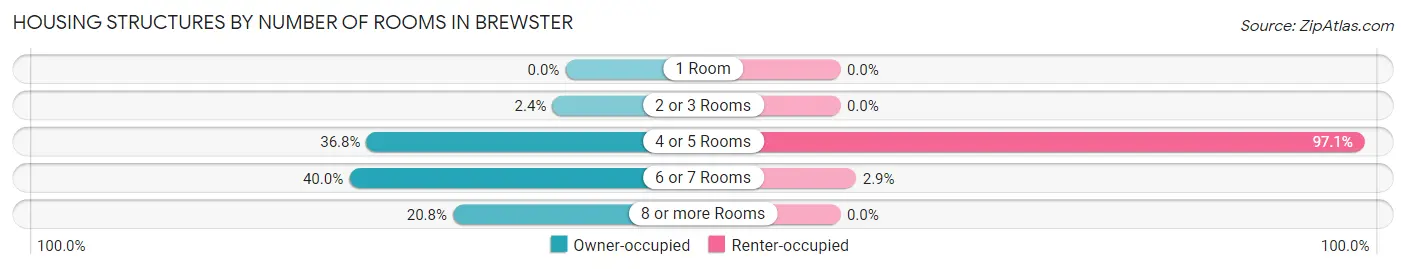
| Number of Rooms | Owner-occupied | Renter-occupied |
| 1 Room | 0 (0.0%) | 0 (0.0%) |
| 2 or 3 Rooms | 3 (2.4%) | 0 (0.0%) |
| 4 or 5 Rooms | 46 (36.8%) | 33 (97.1%) |
| 6 or 7 Rooms | 50 (40.0%) | 1 (2.9%) |
| 8 or more Rooms | 26 (20.8%) | 0 (0.0%) |
| Total | 125 (100.0%) | 34 (100.0%) |
Housing Structure by Heating Type in Brewster
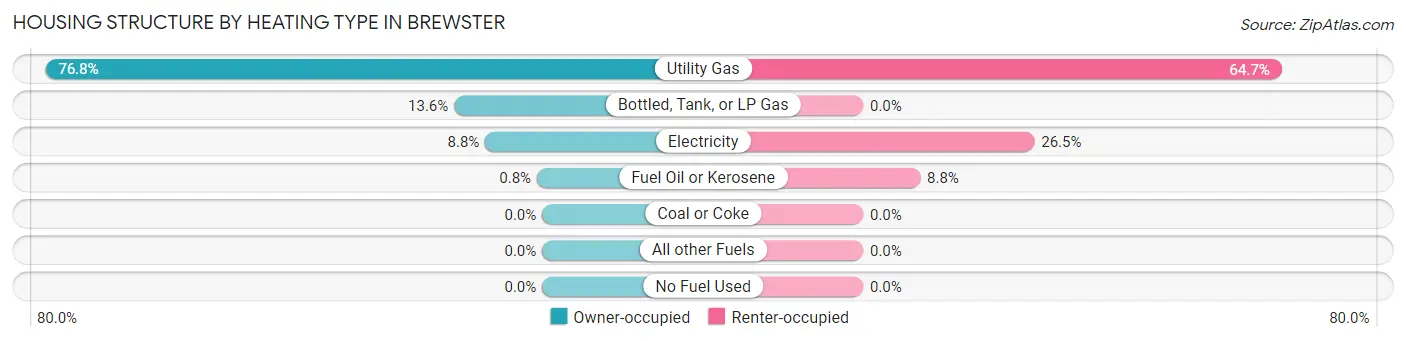
| Heating Type | Owner-occupied | Renter-occupied |
| Utility Gas | 96 (76.8%) | 22 (64.7%) |
| Bottled, Tank, or LP Gas | 17 (13.6%) | 0 (0.0%) |
| Electricity | 11 (8.8%) | 9 (26.5%) |
| Fuel Oil or Kerosene | 1 (0.8%) | 3 (8.8%) |
| Coal or Coke | 0 (0.0%) | 0 (0.0%) |
| All other Fuels | 0 (0.0%) | 0 (0.0%) |
| No Fuel Used | 0 (0.0%) | 0 (0.0%) |
| Total | 125 (100.0%) | 34 (100.0%) |
Household Vehicle Usage in Brewster
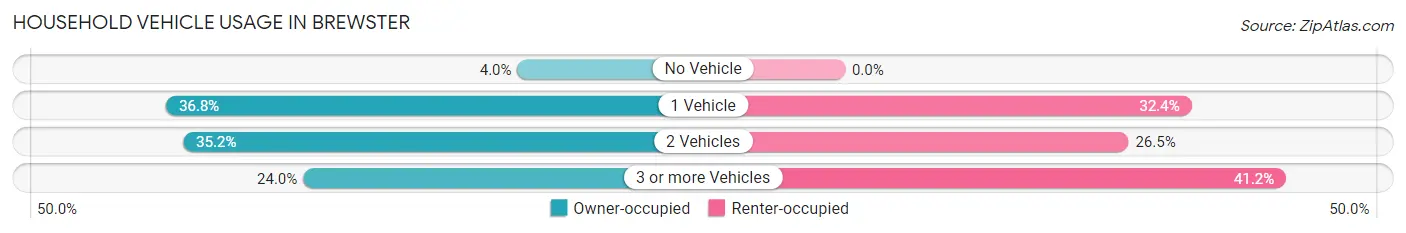
| Vehicles per Household | Owner-occupied | Renter-occupied |
| No Vehicle | 5 (4.0%) | 0 (0.0%) |
| 1 Vehicle | 46 (36.8%) | 11 (32.4%) |
| 2 Vehicles | 44 (35.2%) | 9 (26.5%) |
| 3 or more Vehicles | 30 (24.0%) | 14 (41.2%) |
| Total | 125 (100.0%) | 34 (100.0%) |
Real Estate & Mortgages in Brewster
Real Estate and Mortgage Overview in Brewster
| Characteristic | Without Mortgage | With Mortgage |
| Housing Units | 68 | 57 |
| Median Property Value | $128,100 | $123,600 |
| Median Household Income | $50,714 | $4 |
| Monthly Housing Costs | $392 | $0 |
| Real Estate Taxes | $1,120 | $0 |
Property Value by Mortgage Status in Brewster
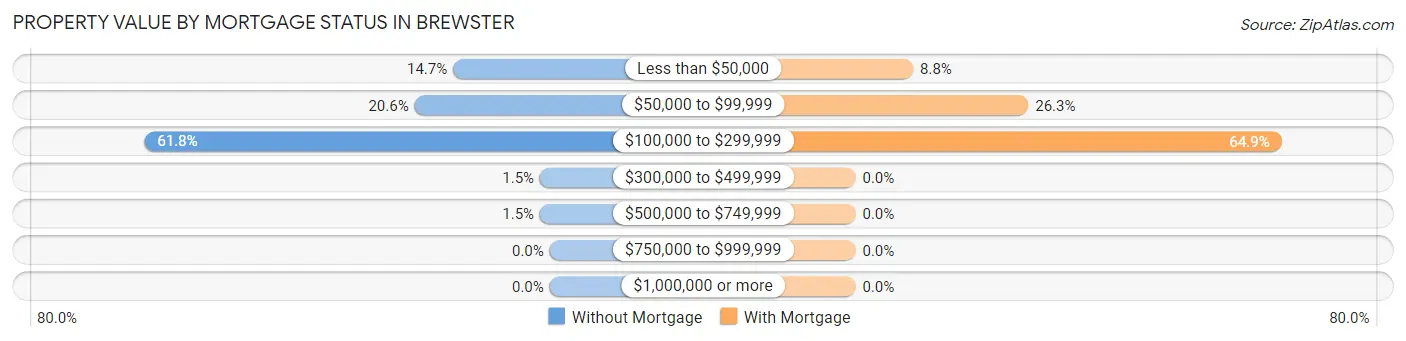
| Property Value | Without Mortgage | With Mortgage |
| Less than $50,000 | 10 (14.7%) | 5 (8.8%) |
| $50,000 to $99,999 | 14 (20.6%) | 15 (26.3%) |
| $100,000 to $299,999 | 42 (61.8%) | 37 (64.9%) |
| $300,000 to $499,999 | 1 (1.5%) | 0 (0.0%) |
| $500,000 to $749,999 | 1 (1.5%) | 0 (0.0%) |
| $750,000 to $999,999 | 0 (0.0%) | 0 (0.0%) |
| $1,000,000 or more | 0 (0.0%) | 0 (0.0%) |
| Total | 68 (100.0%) | 57 (100.0%) |
Household Income by Mortgage Status in Brewster
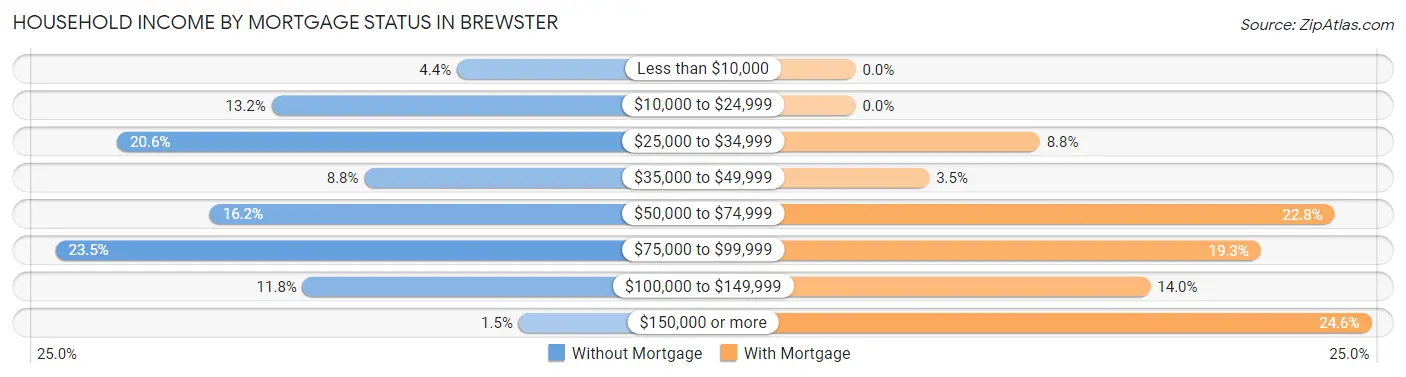
| Household Income | Without Mortgage | With Mortgage |
| Less than $10,000 | 3 (4.4%) | 0 (0.0%) |
| $10,000 to $24,999 | 9 (13.2%) | 0 (0.0%) |
| $25,000 to $34,999 | 14 (20.6%) | 5 (8.8%) |
| $35,000 to $49,999 | 6 (8.8%) | 2 (3.5%) |
| $50,000 to $74,999 | 11 (16.2%) | 13 (22.8%) |
| $75,000 to $99,999 | 16 (23.5%) | 11 (19.3%) |
| $100,000 to $149,999 | 8 (11.8%) | 8 (14.0%) |
| $150,000 or more | 1 (1.5%) | 14 (24.6%) |
| Total | 68 (100.0%) | 57 (100.0%) |
Property Value to Household Income Ratio in Brewster
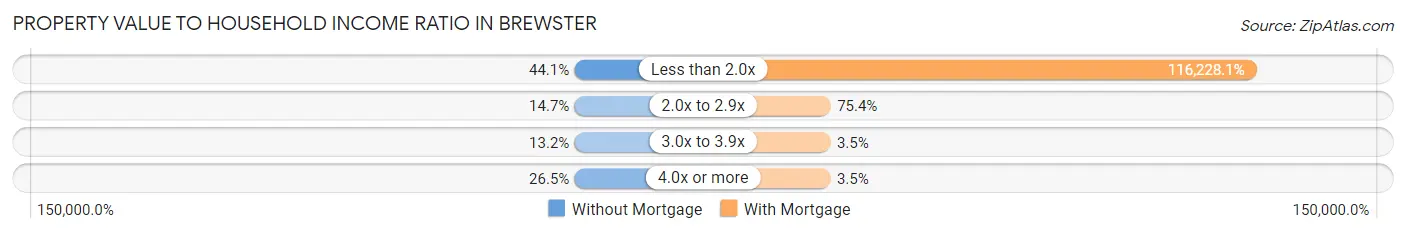
| Value-to-Income Ratio | Without Mortgage | With Mortgage |
| Less than 2.0x | 30 (44.1%) | 66,250 (116,228.1%) |
| 2.0x to 2.9x | 10 (14.7%) | 43 (75.4%) |
| 3.0x to 3.9x | 9 (13.2%) | 2 (3.5%) |
| 4.0x or more | 18 (26.5%) | 2 (3.5%) |
| Total | 68 (100.0%) | 57 (100.0%) |
Real Estate Taxes by Mortgage Status in Brewster
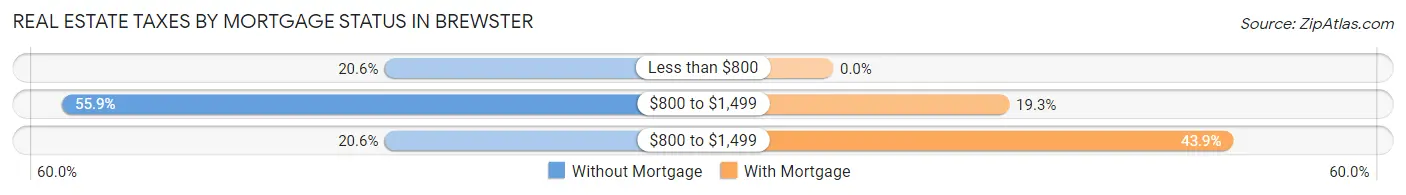
| Property Taxes | Without Mortgage | With Mortgage |
| Less than $800 | 14 (20.6%) | 0 (0.0%) |
| $800 to $1,499 | 38 (55.9%) | 11 (19.3%) |
| $800 to $1,499 | 14 (20.6%) | 25 (43.9%) |
| Total | 68 (100.0%) | 57 (100.0%) |
Health & Disability in Brewster
Health Insurance Coverage by Age in Brewster
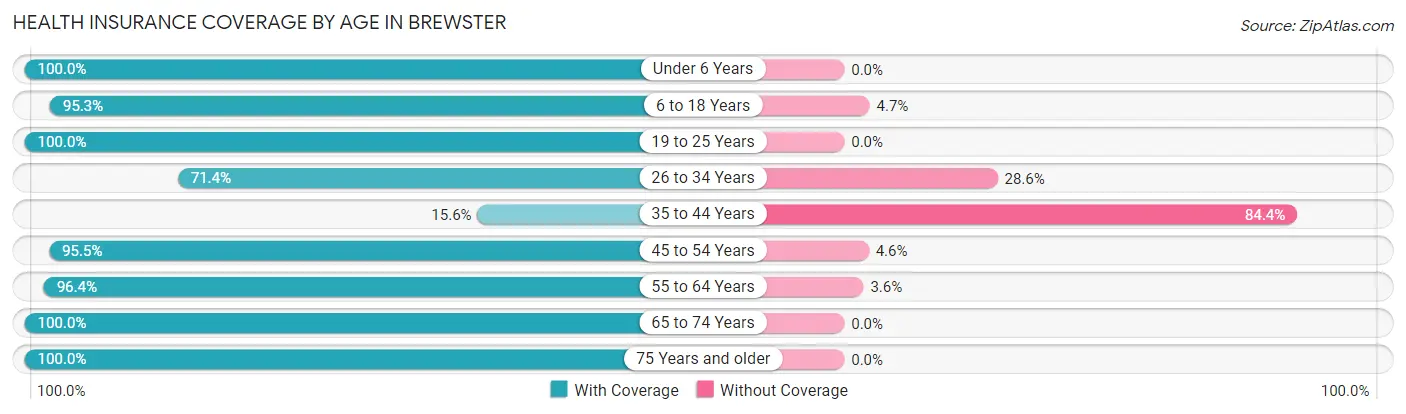
| Age Bracket | With Coverage | Without Coverage |
| Under 6 Years | 17 (100.0%) | 0 (0.0%) |
| 6 to 18 Years | 121 (95.3%) | 6 (4.7%) |
| 19 to 25 Years | 53 (100.0%) | 0 (0.0%) |
| 26 to 34 Years | 35 (71.4%) | 14 (28.6%) |
| 35 to 44 Years | 21 (15.6%) | 114 (84.4%) |
| 45 to 54 Years | 21 (95.5%) | 1 (4.5%) |
| 55 to 64 Years | 54 (96.4%) | 2 (3.6%) |
| 65 to 74 Years | 37 (100.0%) | 0 (0.0%) |
| 75 Years and older | 40 (100.0%) | 0 (0.0%) |
| Total | 399 (74.4%) | 137 (25.6%) |
Health Insurance Coverage by Citizenship Status in Brewster
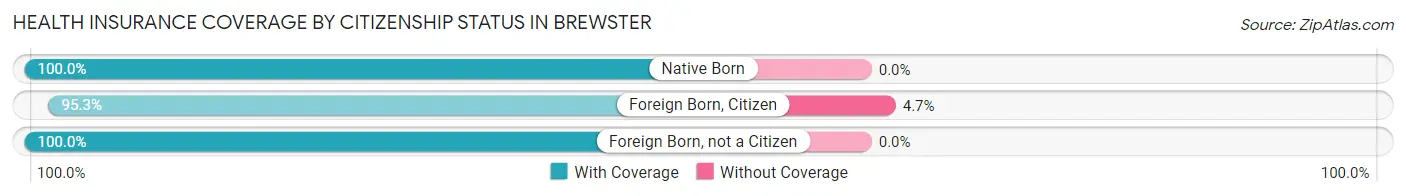
| Citizenship Status | With Coverage | Without Coverage |
| Native Born | 17 (100.0%) | 0 (0.0%) |
| Foreign Born, Citizen | 121 (95.3%) | 6 (4.7%) |
| Foreign Born, not a Citizen | 53 (100.0%) | 0 (0.0%) |
Health Insurance Coverage by Household Income in Brewster
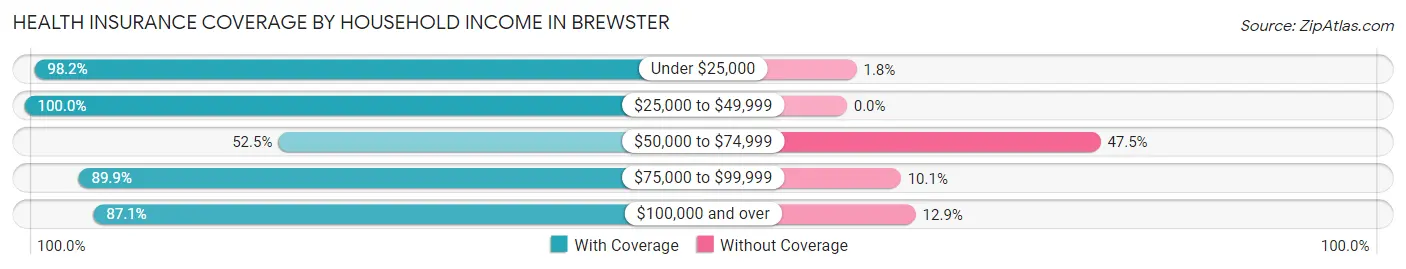
| Household Income | With Coverage | Without Coverage |
| Under $25,000 | 54 (98.2%) | 1 (1.8%) |
| $25,000 to $49,999 | 57 (100.0%) | 0 (0.0%) |
| $50,000 to $74,999 | 127 (52.5%) | 115 (47.5%) |
| $75,000 to $99,999 | 80 (89.9%) | 9 (10.1%) |
| $100,000 and over | 81 (87.1%) | 12 (12.9%) |
Public vs Private Health Insurance Coverage by Age in Brewster
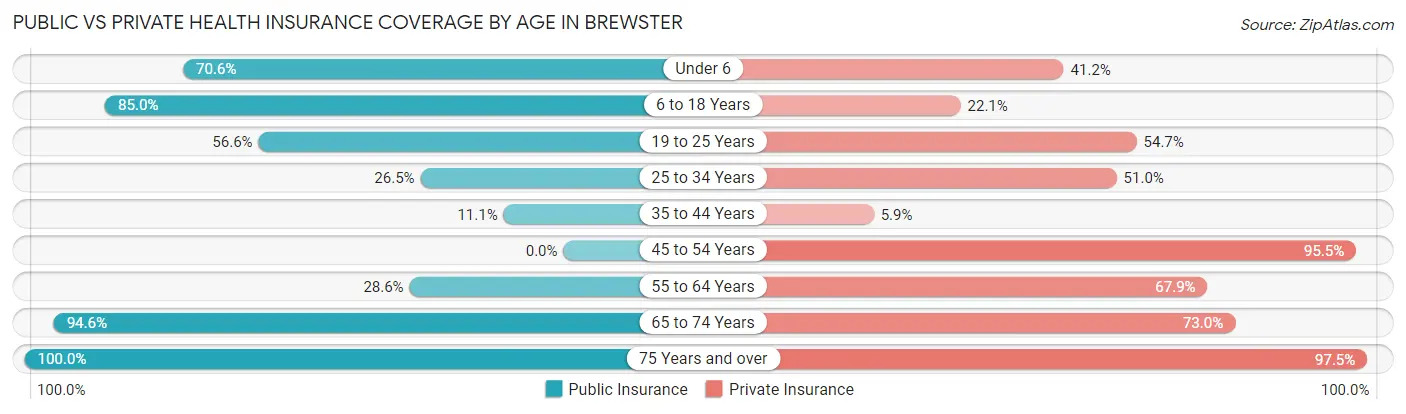
| Age Bracket | Public Insurance | Private Insurance |
| Under 6 | 12 (70.6%) | 7 (41.2%) |
| 6 to 18 Years | 108 (85.0%) | 28 (22.1%) |
| 19 to 25 Years | 30 (56.6%) | 29 (54.7%) |
| 25 to 34 Years | 13 (26.5%) | 25 (51.0%) |
| 35 to 44 Years | 15 (11.1%) | 8 (5.9%) |
| 45 to 54 Years | 0 (0.0%) | 21 (95.5%) |
| 55 to 64 Years | 16 (28.6%) | 38 (67.9%) |
| 65 to 74 Years | 35 (94.6%) | 27 (73.0%) |
| 75 Years and over | 40 (100.0%) | 39 (97.5%) |
| Total | 269 (50.2%) | 222 (41.4%) |
Disability Status by Sex by Age in Brewster
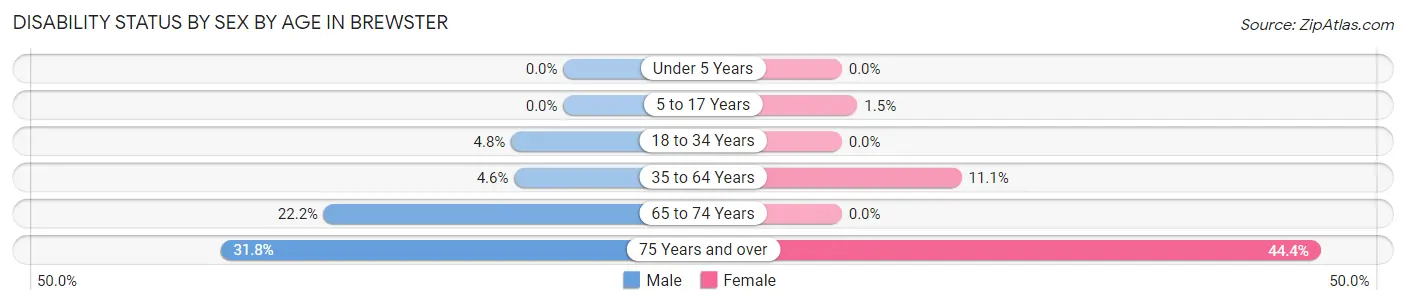
| Age Bracket | Male | Female |
| Under 5 Years | 0 (0.0%) | 0 (0.0%) |
| 5 to 17 Years | 0 (0.0%) | 1 (1.5%) |
| 18 to 34 Years | 3 (4.8%) | 0 (0.0%) |
| 35 to 64 Years | 6 (4.5%) | 9 (11.1%) |
| 65 to 74 Years | 4 (22.2%) | 0 (0.0%) |
| 75 Years and over | 7 (31.8%) | 8 (44.4%) |
Disability Class by Sex by Age in Brewster
Disability Class: Hearing Difficulty
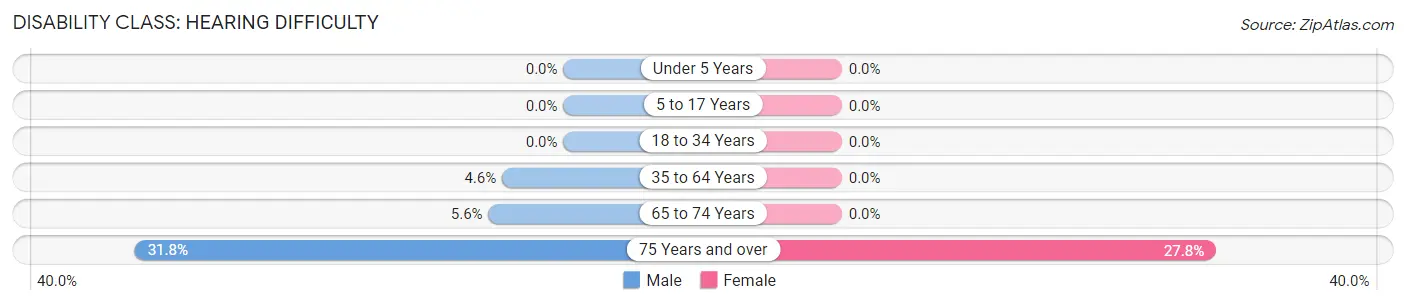
| Age Bracket | Male | Female |
| Under 5 Years | 0 (0.0%) | 0 (0.0%) |
| 5 to 17 Years | 0 (0.0%) | 0 (0.0%) |
| 18 to 34 Years | 0 (0.0%) | 0 (0.0%) |
| 35 to 64 Years | 6 (4.5%) | 0 (0.0%) |
| 65 to 74 Years | 1 (5.6%) | 0 (0.0%) |
| 75 Years and over | 7 (31.8%) | 5 (27.8%) |
Disability Class: Vision Difficulty
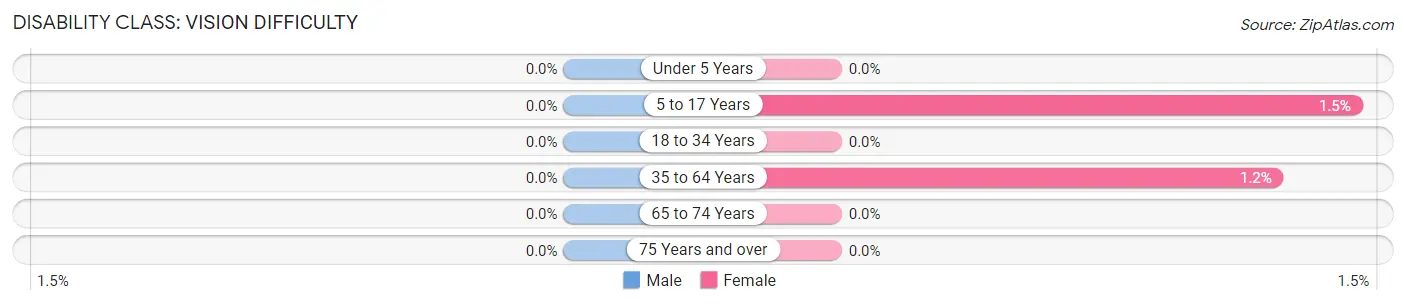
| Age Bracket | Male | Female |
| Under 5 Years | 0 (0.0%) | 0 (0.0%) |
| 5 to 17 Years | 0 (0.0%) | 1 (1.5%) |
| 18 to 34 Years | 0 (0.0%) | 0 (0.0%) |
| 35 to 64 Years | 0 (0.0%) | 1 (1.2%) |
| 65 to 74 Years | 0 (0.0%) | 0 (0.0%) |
| 75 Years and over | 0 (0.0%) | 0 (0.0%) |
Disability Class: Cognitive Difficulty
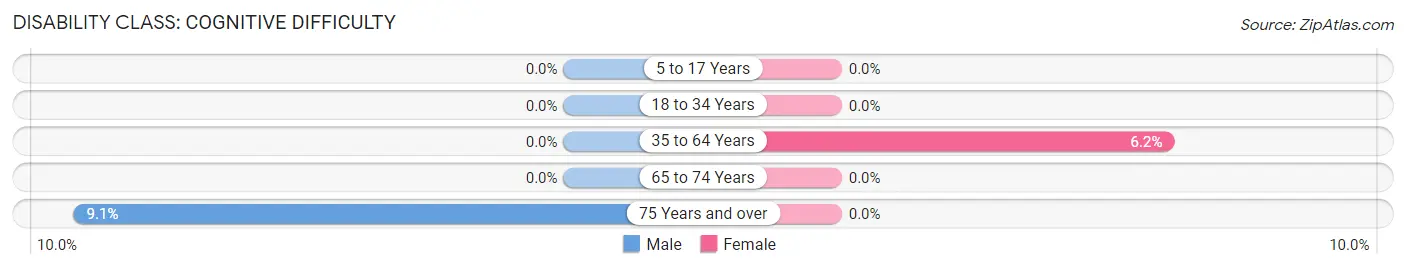
| Age Bracket | Male | Female |
| 5 to 17 Years | 0 (0.0%) | 0 (0.0%) |
| 18 to 34 Years | 0 (0.0%) | 0 (0.0%) |
| 35 to 64 Years | 0 (0.0%) | 5 (6.2%) |
| 65 to 74 Years | 0 (0.0%) | 0 (0.0%) |
| 75 Years and over | 2 (9.1%) | 0 (0.0%) |
Disability Class: Ambulatory Difficulty
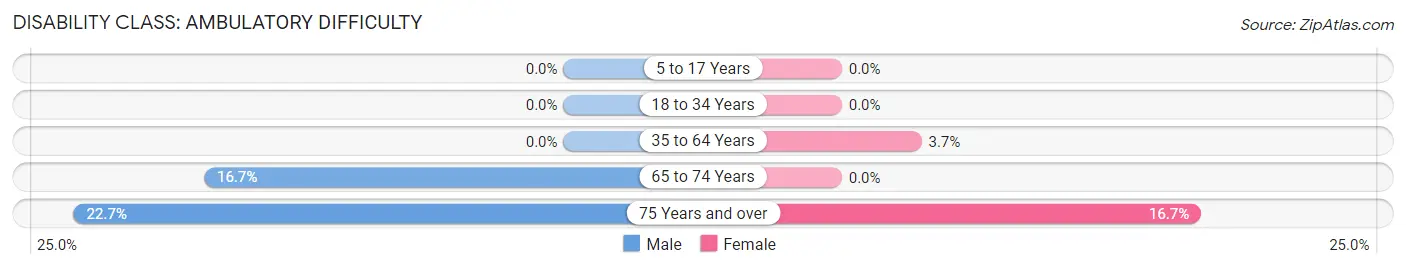
| Age Bracket | Male | Female |
| 5 to 17 Years | 0 (0.0%) | 0 (0.0%) |
| 18 to 34 Years | 0 (0.0%) | 0 (0.0%) |
| 35 to 64 Years | 0 (0.0%) | 3 (3.7%) |
| 65 to 74 Years | 3 (16.7%) | 0 (0.0%) |
| 75 Years and over | 5 (22.7%) | 3 (16.7%) |
Disability Class: Self-Care Difficulty
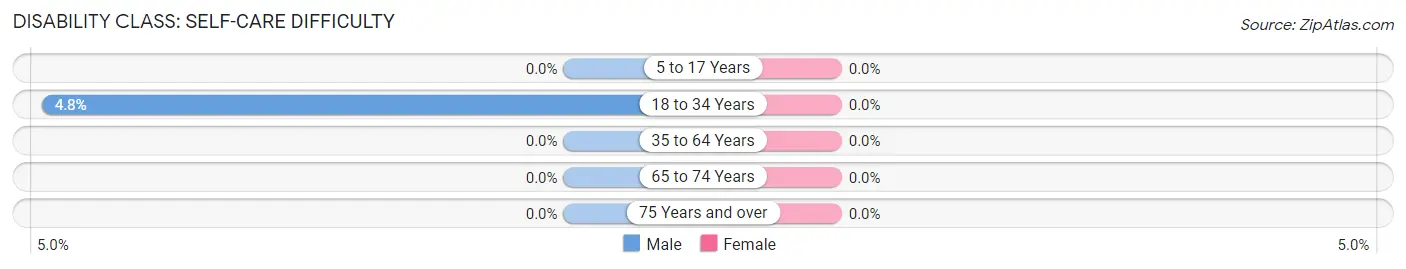
| Age Bracket | Male | Female |
| 5 to 17 Years | 0 (0.0%) | 0 (0.0%) |
| 18 to 34 Years | 3 (4.8%) | 0 (0.0%) |
| 35 to 64 Years | 0 (0.0%) | 0 (0.0%) |
| 65 to 74 Years | 0 (0.0%) | 0 (0.0%) |
| 75 Years and over | 0 (0.0%) | 0 (0.0%) |
Technology Access in Brewster
Computing Device Access in Brewster
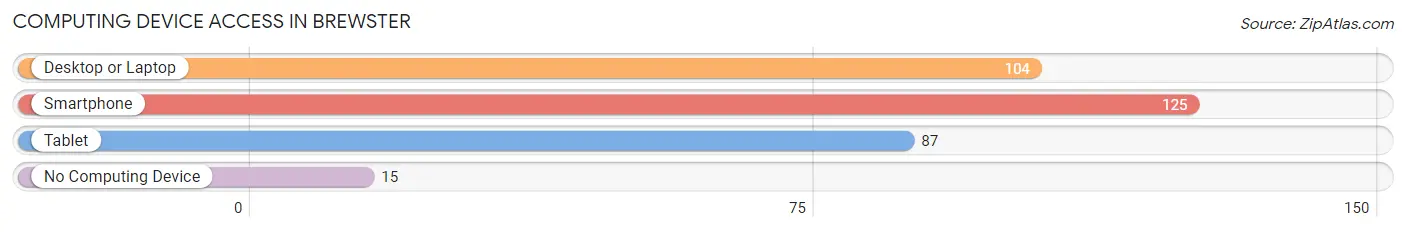
| Device Type | # Households | % Households |
| Desktop or Laptop | 104 | 65.4% |
| Smartphone | 125 | 78.6% |
| Tablet | 87 | 54.7% |
| No Computing Device | 15 | 9.4% |
| Total | 159 | 100.0% |
Internet Access in Brewster
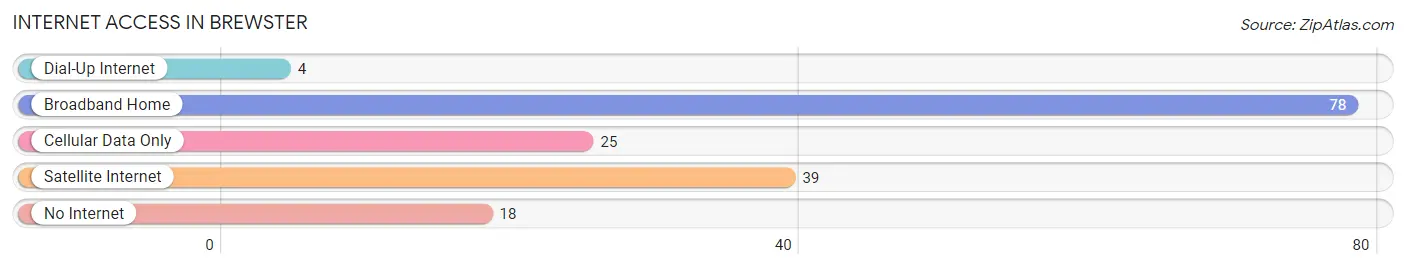
| Internet Type | # Households | % Households |
| Dial-Up Internet | 4 | 2.5% |
| Broadband Home | 78 | 49.1% |
| Cellular Data Only | 25 | 15.7% |
| Satellite Internet | 39 | 24.5% |
| No Internet | 18 | 11.3% |
| Total | 159 | 100.0% |
Brewster Summary
Brewster, Minnesota is a small city located in the southwestern corner of the state, near the border of South Dakota. It is part of the Big Stone County and is situated on the banks of the Big Stone Lake. The city has a population of just over 1,000 people and is known for its rural charm and friendly atmosphere.
History
Brewster was founded in 1881 by a group of settlers from Wisconsin. The city was named after the first settler, William Brewster, who had come to the area in search of a better life. The city was incorporated in 1883 and quickly grew to become a thriving community. The city was home to a variety of businesses, including a flour mill, a sawmill, a blacksmith shop, and a general store.
In the early 1900s, Brewster was a popular destination for tourists, who came to enjoy the lake and the surrounding countryside. The city was also home to a number of resorts, which attracted visitors from all over the Midwest.
Geography
Brewster is located in the southwestern corner of Minnesota, near the border of South Dakota. The city is situated on the banks of the Big Stone Lake, which is part of the Minnesota River system. The city is surrounded by rolling hills and farmland, and is home to a variety of wildlife, including deer, foxes, and bald eagles.
The climate in Brewster is typical of the Midwest, with cold winters and hot summers. The average temperature in the winter is around 20 degrees Fahrenheit, while the average temperature in the summer is around 70 degrees Fahrenheit.
Economy
Brewster’s economy is largely based on agriculture and tourism. The city is home to a number of farms, which produce a variety of crops, including corn, soybeans, and wheat. The city is also home to a number of resorts, which attract visitors from all over the Midwest.
In addition to agriculture and tourism, Brewster is home to a number of small businesses, including restaurants, retail stores, and service providers. The city is also home to a number of manufacturing companies, which produce a variety of products, including furniture, clothing, and electronics.
Demographics
As of the 2010 census, the population of Brewster was 1,072. The racial makeup of the city was 97.3% White, 0.3% African American, 0.2% Native American, 0.2% Asian, 0.1% Pacific Islander, 0.7% from other races, and 1.2% from two or more races. Hispanic or Latino of any race were 1.7% of the population.
The median income for a household in Brewster was $41,250, and the median income for a family was $48,750. The per capita income for the city was $19,945. About 8.3% of families and 10.2% of the population were below the poverty line, including 13.2% of those under age 18 and 8.3% of those age 65 or over.
Brewster is a small city with a rich history and a friendly atmosphere. The city is home to a variety of businesses, including farms, resorts, and manufacturing companies. The city is also home to a diverse population, with a variety of racial and ethnic backgrounds. Brewster is a great place to live and work, and is a great place to visit.
Common Questions
What is Per Capita Income in Brewster?
Per Capita income in Brewster is $26,948.
What is the Median Family Income in Brewster?
Median Family Income in Brewster is $74,167.
What is the Median Household income in Brewster?
Median Household Income in Brewster is $55,481.
What is Income or Wage Gap in Brewster?
Income or Wage Gap in Brewster is 53.1%.
Women in Brewster earn 46.9 cents for every dollar earned by a man.
What is Inequality or Gini Index in Brewster?
Inequality or Gini Index in Brewster is 0.33.
What is the Total Population of Brewster?
Total Population of Brewster is 536.
What is the Total Male Population of Brewster?
Total Male Population of Brewster is 305.
What is the Total Female Population of Brewster?
Total Female Population of Brewster is 231.
What is the Ratio of Males per 100 Females in Brewster?
There are 132.03 Males per 100 Females in Brewster.
What is the Ratio of Females per 100 Males in Brewster?
There are 75.74 Females per 100 Males in Brewster.
What is the Median Population Age in Brewster?
Median Population Age in Brewster is 41.1 Years.
What is the Average Family Size in Brewster
Average Family Size in Brewster is 4.6 People.
What is the Average Household Size in Brewster
Average Household Size in Brewster is 3.4 People.
How Large is the Labor Force in Brewster?
There are 301 People in the Labor Forcein in Brewster.
What is the Percentage of People in the Labor Force in Brewster?
74.1% of People are in the Labor Force in Brewster.
What is the Unemployment Rate in Brewster?
Unemployment Rate in Brewster is 5.0%.