Zip Codes with the Highest Percentage of Population Employed in Food Preparation & Serving in Edmond, OK
RELATED REPORTS & OPTIONS
Food Preparation & Serving
Edmond
Compare Zip Codes
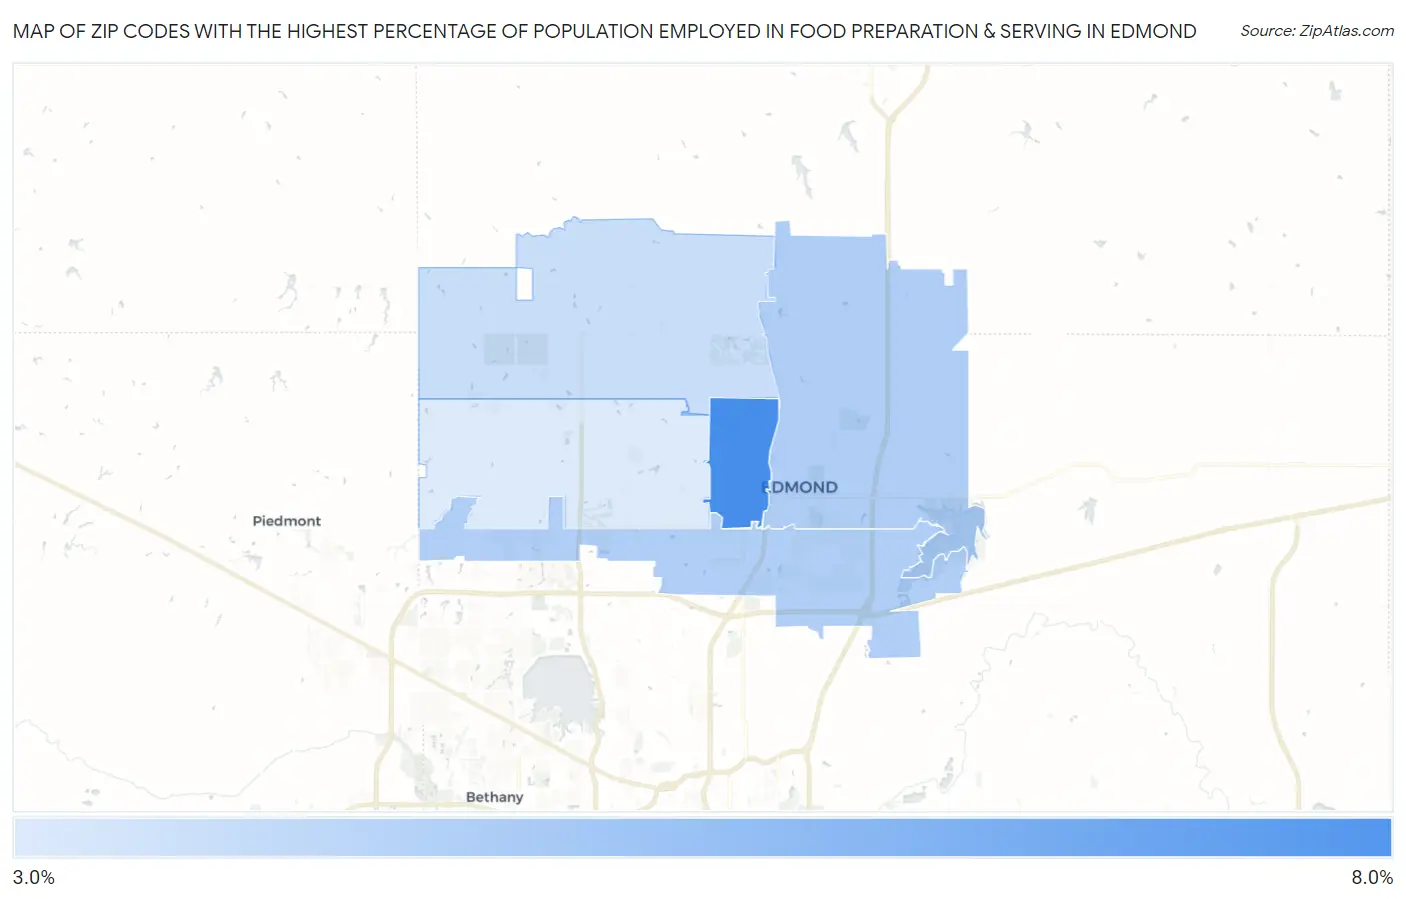
Map of Zip Codes with the Highest Percentage of Population Employed in Food Preparation & Serving in Edmond
3.4%
6.1%
Zip Codes with the Highest Percentage of Population Employed in Food Preparation & Serving in Edmond, OK
| Zip Code | % Employed | vs State | vs National | |
| 1. | 73003 | 6.1% | 5.6%(+0.544)#197 | 5.3%(+0.853)#8,900 |
| 2. | 73034 | 4.2% | 5.6%(-1.38)#339 | 5.3%(-1.07)#16,250 |
| 3. | 73013 | 4.2% | 5.6%(-1.40)#343 | 5.3%(-1.09)#16,349 |
| 4. | 73025 | 3.7% | 5.6%(-1.85)#378 | 5.3%(-1.54)#18,135 |
| 5. | 73012 | 3.4% | 5.6%(-2.21)#410 | 5.3%(-1.91)#19,689 |
1
Common Questions
What are the Top 3 Zip Codes with the Highest Percentage of Population Employed in Food Preparation & Serving in Edmond, OK?
Top 3 Zip Codes with the Highest Percentage of Population Employed in Food Preparation & Serving in Edmond, OK are:
What zip code has the Highest Percentage of Population Employed in Food Preparation & Serving in Edmond, OK?
73003 has the Highest Percentage of Population Employed in Food Preparation & Serving in Edmond, OK with 6.1%.
What is the Percentage of Population Employed in Food Preparation & Serving in Edmond, OK?
Percentage of Population Employed in Food Preparation & Serving in Edmond is 4.4%.
What is the Percentage of Population Employed in Food Preparation & Serving in Oklahoma?
Percentage of Population Employed in Food Preparation & Serving in Oklahoma is 5.6%.
What is the Percentage of Population Employed in Food Preparation & Serving in the United States?
Percentage of Population Employed in Food Preparation & Serving in the United States is 5.3%.