Zip Codes with the Highest Percentage of Population Employed in Food Preparation & Serving in Oklahoma City, OK
RELATED REPORTS & OPTIONS
Food Preparation & Serving
Oklahoma City
Compare Zip Codes
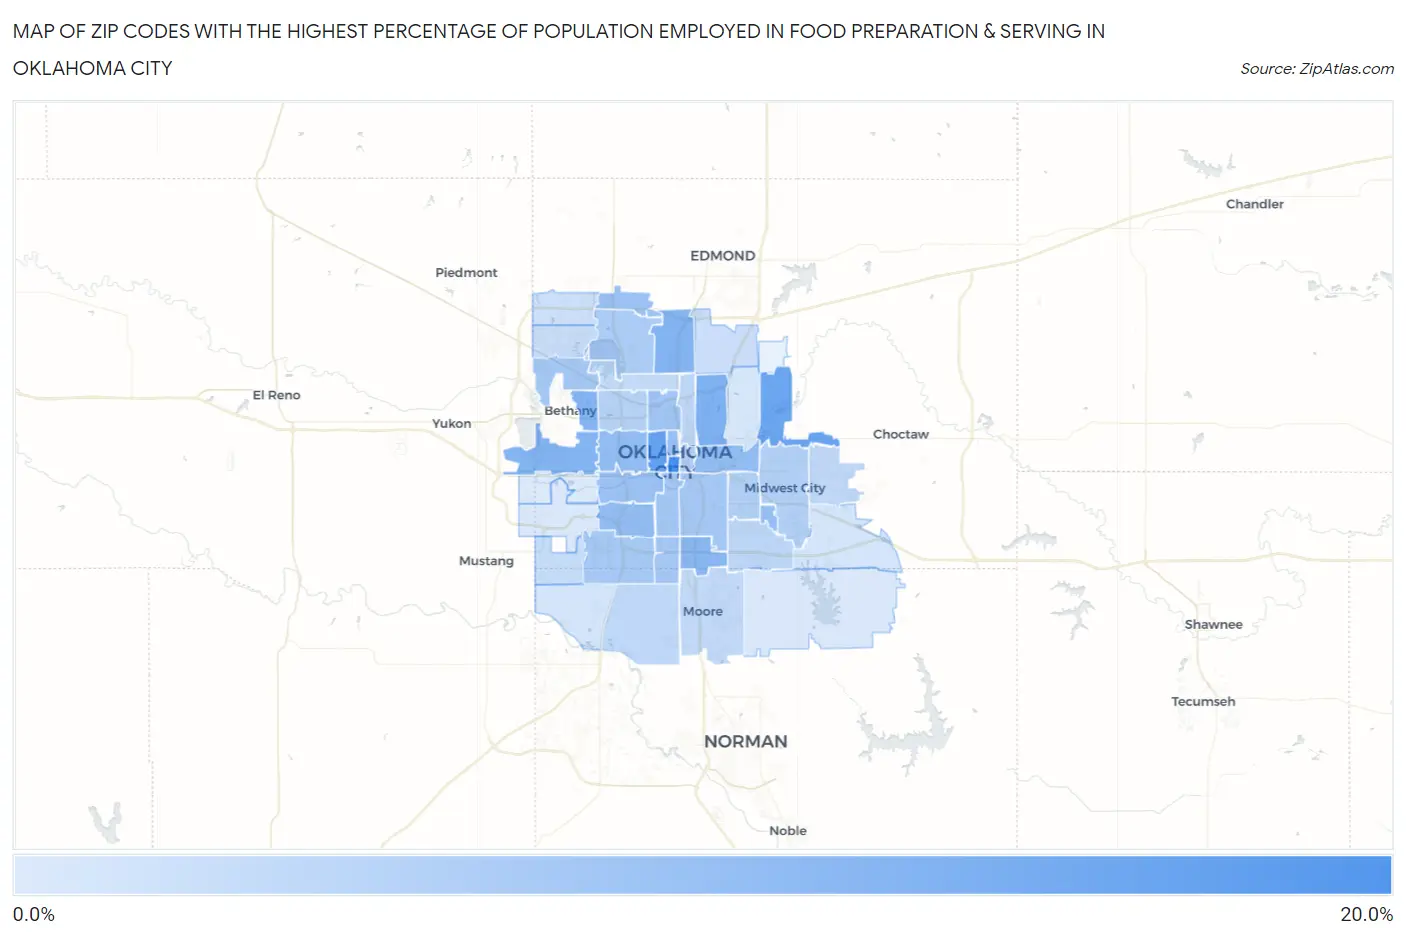
Map of Zip Codes with the Highest Percentage of Population Employed in Food Preparation & Serving in Oklahoma City
1.1%
18.3%
Zip Codes with the Highest Percentage of Population Employed in Food Preparation & Serving in Oklahoma City, OK
| Zip Code | % Employed | vs State | vs National | |
| 1. | 73102 | 18.3% | 5.6%(+12.7)#7 | 5.3%(+13.0)#622 |
| 2. | 73106 | 14.6% | 5.6%(+9.00)#12 | 5.3%(+9.31)#1,041 |
| 3. | 73141 | 13.9% | 5.6%(+8.35)#16 | 5.3%(+8.66)#1,173 |
| 4. | 73111 | 11.7% | 5.6%(+6.10)#27 | 5.3%(+6.41)#1,778 |
| 5. | 73114 | 11.2% | 5.6%(+5.62)#31 | 5.3%(+5.93)#1,949 |
| 6. | 73127 | 11.2% | 5.6%(+5.57)#32 | 5.3%(+5.87)#1,980 |
| 7. | 73122 | 10.9% | 5.6%(+5.29)#35 | 5.3%(+5.60)#2,111 |
| 8. | 73149 | 10.3% | 5.6%(+4.66)#45 | 5.3%(+4.97)#2,448 |
| 9. | 73117 | 9.3% | 5.6%(+3.75)#62 | 5.3%(+4.06)#3,189 |
| 10. | 73107 | 9.3% | 5.6%(+3.71)#65 | 5.3%(+4.02)#3,231 |
| 11. | 73119 | 9.1% | 5.6%(+3.52)#71 | 5.3%(+3.83)#3,403 |
| 12. | 73145 | 9.0% | 5.6%(+3.45)#73 | 5.3%(+3.76)#3,477 |
| 13. | 73103 | 8.8% | 5.6%(+3.23)#86 | 5.3%(+3.54)#3,707 |
| 14. | 73134 | 8.4% | 5.6%(+2.83)#92 | 5.3%(+3.14)#4,137 |
| 15. | 73108 | 8.3% | 5.6%(+2.66)#95 | 5.3%(+2.97)#4,364 |
| 16. | 73118 | 7.7% | 5.6%(+2.07)#115 | 5.3%(+2.38)#5,273 |
| 17. | 73109 | 7.4% | 5.6%(+1.78)#121 | 5.3%(+2.09)#5,790 |
| 18. | 73139 | 7.1% | 5.6%(+1.54)#134 | 5.3%(+1.85)#6,263 |
| 19. | 73132 | 7.0% | 5.6%(+1.44)#144 | 5.3%(+1.75)#6,473 |
| 20. | 73129 | 7.0% | 5.6%(+1.44)#145 | 5.3%(+1.75)#6,478 |
| 21. | 73159 | 7.0% | 5.6%(+1.40)#149 | 5.3%(+1.71)#6,576 |
| 22. | 73120 | 6.4% | 5.6%(+0.829)#176 | 5.3%(+1.14)#8,081 |
| 23. | 73104 | 5.8% | 5.6%(+0.158)#221 | 5.3%(+0.468)#10,172 |
| 24. | 73110 | 5.7% | 5.6%(+0.093)#226 | 5.3%(+0.402)#10,394 |
| 25. | 73115 | 5.5% | 5.6%(-0.062)#238 | 5.3%(+0.247)#10,955 |
| 26. | 73112 | 5.5% | 5.6%(-0.130)#244 | 5.3%(+0.179)#11,164 |
| 27. | 73135 | 4.6% | 5.6%(-0.963)#302 | 5.3%(-0.654)#14,443 |
| 28. | 73105 | 4.6% | 5.6%(-1.03)#312 | 5.3%(-0.720)#14,760 |
| 29. | 73170 | 4.2% | 5.6%(-1.38)#340 | 5.3%(-1.07)#16,258 |
| 30. | 73160 | 4.2% | 5.6%(-1.40)#344 | 5.3%(-1.09)#16,350 |
| 31. | 73130 | 4.0% | 5.6%(-1.64)#363 | 5.3%(-1.33)#17,291 |
| 32. | 73116 | 3.8% | 5.6%(-1.83)#375 | 5.3%(-1.52)#18,059 |
| 33. | 73169 | 3.6% | 5.6%(-1.96)#388 | 5.3%(-1.65)#18,606 |
| 34. | 73162 | 3.3% | 5.6%(-2.26)#414 | 5.3%(-1.95)#19,902 |
| 35. | 73131 | 3.2% | 5.6%(-2.41)#426 | 5.3%(-2.10)#20,527 |
| 36. | 73142 | 2.9% | 5.6%(-2.71)#455 | 5.3%(-2.40)#21,721 |
| 37. | 73173 | 2.0% | 5.6%(-3.55)#512 | 5.3%(-3.24)#24,566 |
| 38. | 73150 | 2.0% | 5.6%(-3.63)#519 | 5.3%(-3.32)#24,807 |
| 39. | 73121 | 1.9% | 5.6%(-3.74)#524 | 5.3%(-3.43)#25,133 |
| 40. | 73165 | 1.5% | 5.6%(-4.14)#544 | 5.3%(-3.83)#26,090 |
| 41. | 73179 | 1.5% | 5.6%(-4.14)#545 | 5.3%(-3.83)#26,093 |
| 42. | 73128 | 1.1% | 5.6%(-4.50)#559 | 5.3%(-4.19)#26,804 |
1
Common Questions
What are the Top 10 Zip Codes with the Highest Percentage of Population Employed in Food Preparation & Serving in Oklahoma City, OK?
Top 10 Zip Codes with the Highest Percentage of Population Employed in Food Preparation & Serving in Oklahoma City, OK are:
What zip code has the Highest Percentage of Population Employed in Food Preparation & Serving in Oklahoma City, OK?
73102 has the Highest Percentage of Population Employed in Food Preparation & Serving in Oklahoma City, OK with 18.3%.
What is the Percentage of Population Employed in Food Preparation & Serving in Oklahoma City, OK?
Percentage of Population Employed in Food Preparation & Serving in Oklahoma City is 6.1%.
What is the Percentage of Population Employed in Food Preparation & Serving in Oklahoma?
Percentage of Population Employed in Food Preparation & Serving in Oklahoma is 5.6%.
What is the Percentage of Population Employed in Food Preparation & Serving in the United States?
Percentage of Population Employed in Food Preparation & Serving in the United States is 5.3%.