Peavine, OK Map & Demographics
Peavine Map
Peavine Overview
$21,354
PER CAPITA INCOME
$62,692
AVG FAMILY INCOME
$52,917
AVG HOUSEHOLD INCOME
11.1%
WAGE / INCOME GAP [ % ]
88.9¢/ $1
WAGE / INCOME GAP [ $ ]
0.34
INEQUALITY / GINI INDEX
318
TOTAL POPULATION
189
MALE POPULATION
129
FEMALE POPULATION
146.51
MALES / 100 FEMALES
68.25
FEMALES / 100 MALES
43.3
MEDIAN AGE
3.7
AVG FAMILY SIZE
2.9
AVG HOUSEHOLD SIZE
140
LABOR FORCE [ PEOPLE ]
54.3%
PERCENT IN LABOR FORCE
2.1%
UNEMPLOYMENT RATE
Income in Peavine
Income Overview in Peavine
Per Capita Income in Peavine is $21,354, while median incomes of families and households are $62,692 and $52,917 respectively.
| Characteristic | Number | Measure |
| Per Capita Income | 318 | $21,354 |
| Median Family Income | 74 | $62,692 |
| Mean Family Income | 74 | $57,259 |
| Median Household Income | 111 | $52,917 |
| Mean Household Income | 111 | $56,903 |
| Income Deficit | 74 | $0 |
| Wage / Income Gap (%) | 318 | 11.08% |
| Wage / Income Gap ($) | 318 | 88.92¢ per $1 |
| Gini / Inequality Index | 318 | 0.34 |
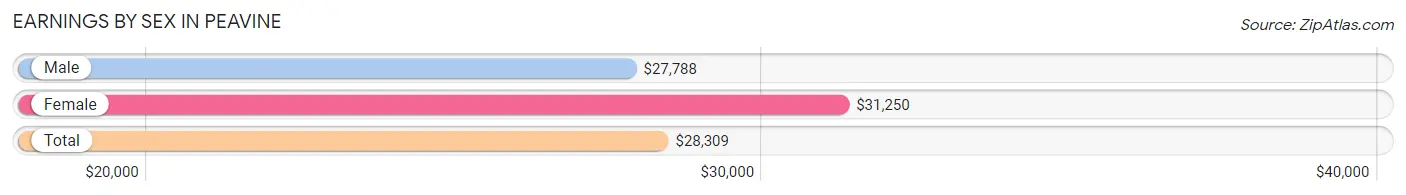
Earnings by Sex in Peavine
Average Earnings in Peavine are $28,309, $27,788 for men and $31,250 for women, a difference of 11.1%.
| Sex | Number | Average Earnings |
| Male | 109 (72.2%) | $27,788 |
| Female | 42 (27.8%) | $31,250 |
| Total | 151 (100.0%) | $28,309 |
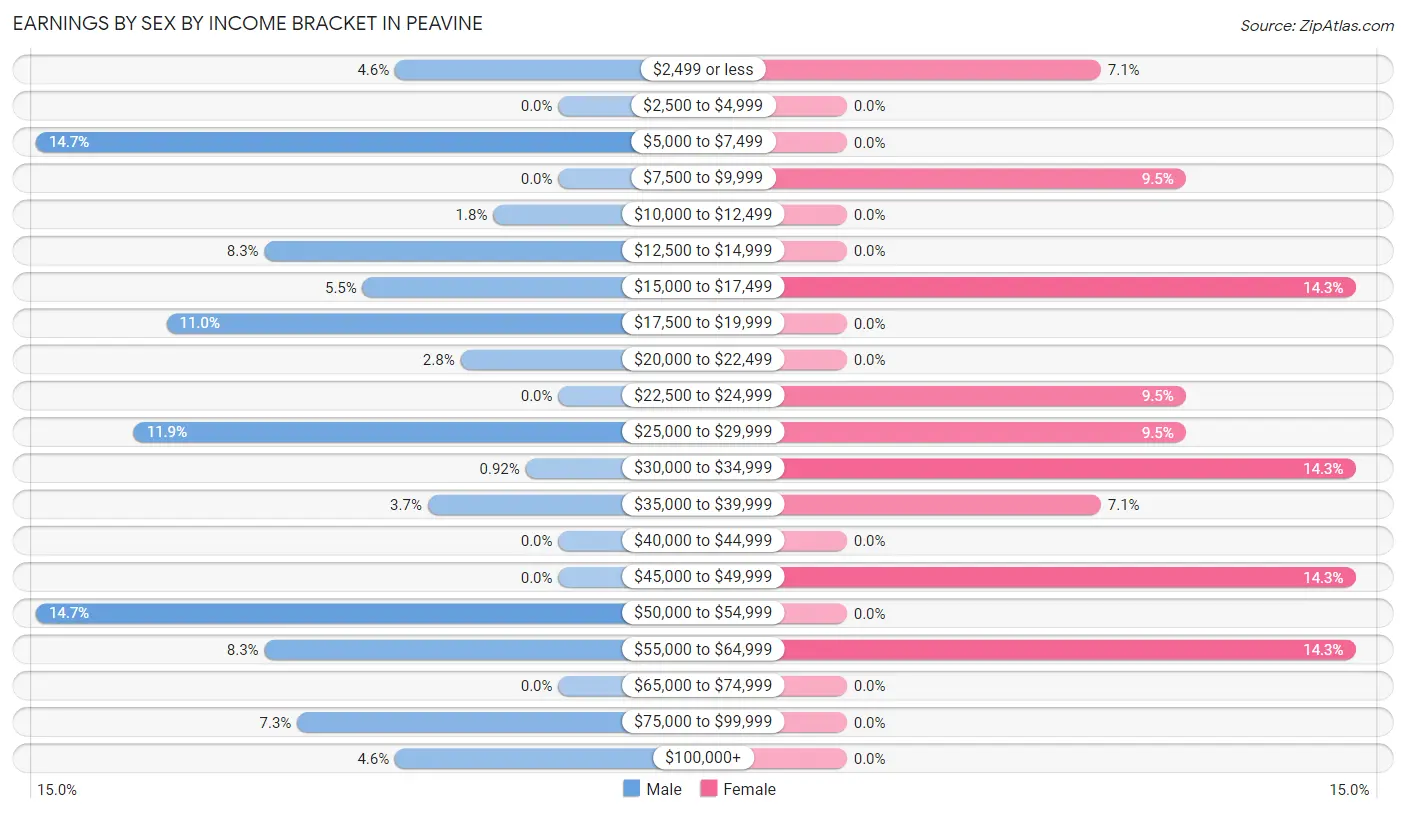
Earnings by Sex by Income Bracket in Peavine
The most common earnings brackets in Peavine are $5,000 to $7,499 for men (16 | 14.7%) and $15,000 to $17,499 for women (6 | 14.3%).
| Income | Male | Female |
| $2,499 or less | 5 (4.6%) | 3 (7.1%) |
| $2,500 to $4,999 | 0 (0.0%) | 0 (0.0%) |
| $5,000 to $7,499 | 16 (14.7%) | 0 (0.0%) |
| $7,500 to $9,999 | 0 (0.0%) | 4 (9.5%) |
| $10,000 to $12,499 | 2 (1.8%) | 0 (0.0%) |
| $12,500 to $14,999 | 9 (8.3%) | 0 (0.0%) |
| $15,000 to $17,499 | 6 (5.5%) | 6 (14.3%) |
| $17,500 to $19,999 | 12 (11.0%) | 0 (0.0%) |
| $20,000 to $22,499 | 3 (2.8%) | 0 (0.0%) |
| $22,500 to $24,999 | 0 (0.0%) | 4 (9.5%) |
| $25,000 to $29,999 | 13 (11.9%) | 4 (9.5%) |
| $30,000 to $34,999 | 1 (0.9%) | 6 (14.3%) |
| $35,000 to $39,999 | 4 (3.7%) | 3 (7.1%) |
| $40,000 to $44,999 | 0 (0.0%) | 0 (0.0%) |
| $45,000 to $49,999 | 0 (0.0%) | 6 (14.3%) |
| $50,000 to $54,999 | 16 (14.7%) | 0 (0.0%) |
| $55,000 to $64,999 | 9 (8.3%) | 6 (14.3%) |
| $65,000 to $74,999 | 0 (0.0%) | 0 (0.0%) |
| $75,000 to $99,999 | 8 (7.3%) | 0 (0.0%) |
| $100,000+ | 5 (4.6%) | 0 (0.0%) |
| Total | 109 (100.0%) | 42 (100.0%) |
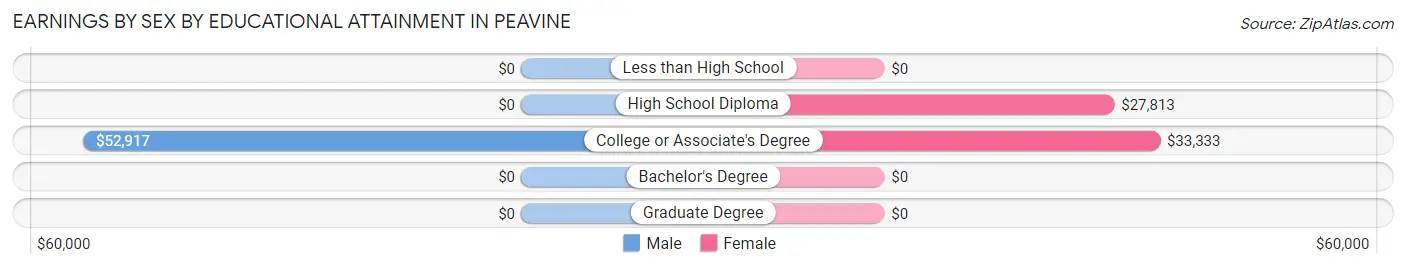
Earnings by Sex by Educational Attainment in Peavine
Average earnings in Peavine are $39,688 for men and $33,125 for women, a difference of 16.5%. Men with an educational attainment of college or associate's degree enjoy the highest average annual earnings of $52,917, while those with college or associate's degree education earn the least with $52,917. Women with an educational attainment of college or associate's degree earn the most with the average annual earnings of $33,333, while those with high school diploma education have the smallest earnings of $27,813.
| Educational Attainment | Male Income | Female Income |
| Less than High School | - | - |
| High School Diploma | - | - |
| College or Associate's Degree | $52,917 | $33,333 |
| Bachelor's Degree | - | - |
| Graduate Degree | - | - |
| Total | $39,688 | $33,125 |
Family Income in Peavine
Family Income Brackets in Peavine
According to the Peavine family income data, there are 24 families falling into the $50,000 to $74,999 income range, which is the most common income bracket and makes up 32.4% of all families.
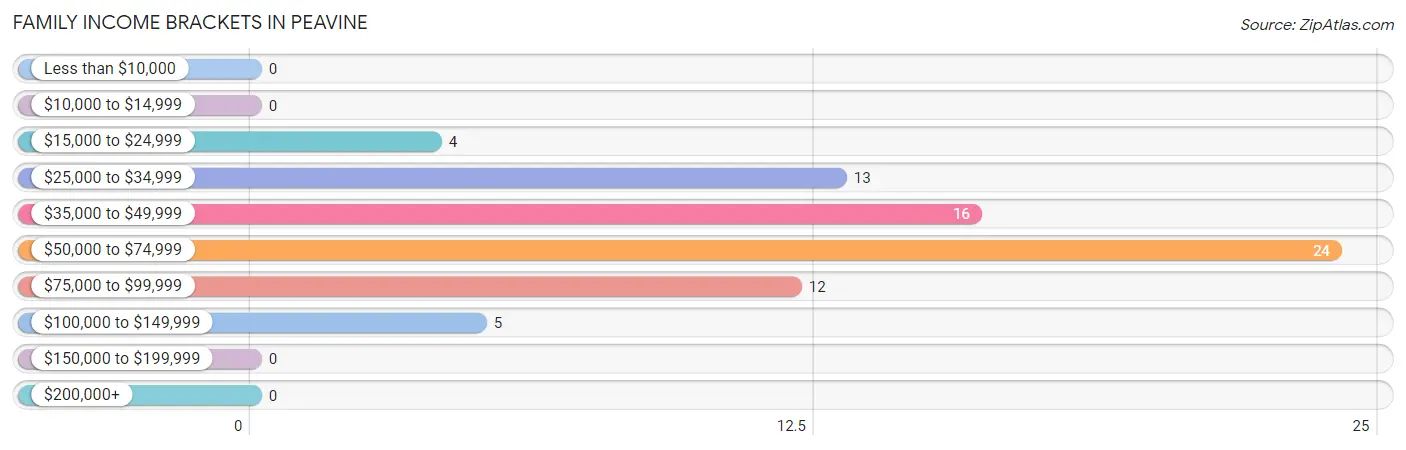
| Income Bracket | # Families | % Families |
| Less than $10,000 | 0 | 0.0% |
| $10,000 to $14,999 | 0 | 0.0% |
| $15,000 to $24,999 | 4 | 5.4% |
| $25,000 to $34,999 | 13 | 17.6% |
| $35,000 to $49,999 | 16 | 21.6% |
| $50,000 to $74,999 | 24 | 32.4% |
| $75,000 to $99,999 | 12 | 16.2% |
| $100,000 to $149,999 | 5 | 6.8% |
| $150,000 to $199,999 | 0 | 0.0% |
| $200,000+ | 0 | 0.0% |
Family Income by Famaliy Size in Peavine
3-person families (12 | 16.2%) account for the highest median family income in Peavine with $69,375 per family, while 2-person families (28 | 37.8%) have the highest median income of $28,125 per family member.
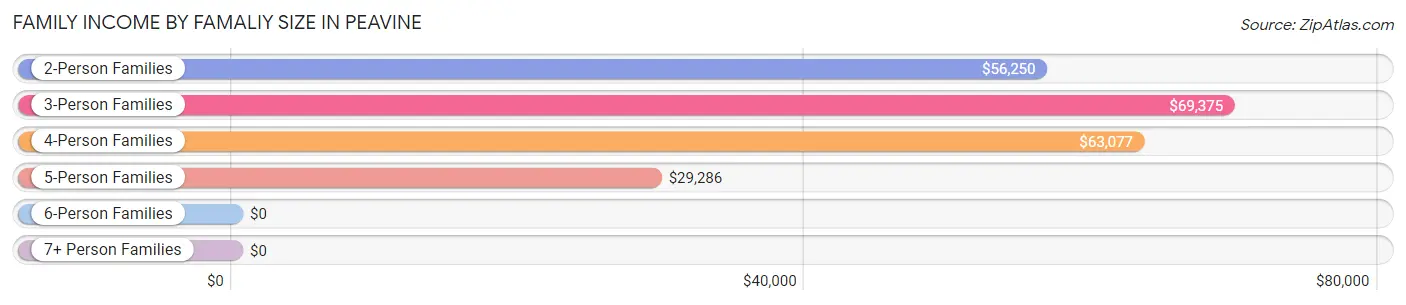
| Income Bracket | # Families | Median Income |
| 2-Person Families | 28 (37.8%) | $56,250 |
| 3-Person Families | 12 (16.2%) | $69,375 |
| 4-Person Families | 24 (32.4%) | $63,077 |
| 5-Person Families | 10 (13.5%) | $29,286 |
| 6-Person Families | 0 (0.0%) | $0 |
| 7+ Person Families | 0 (0.0%) | $0 |
| Total | 74 (100.0%) | $62,692 |
Family Income by Number of Earners in Peavine
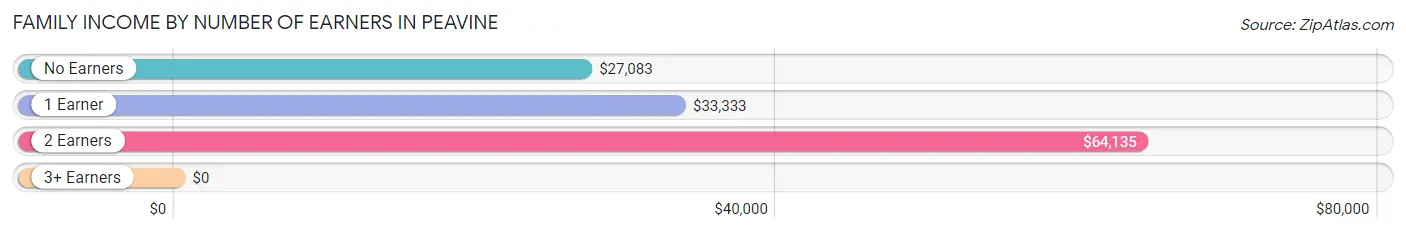
| Number of Earners | # Families | Median Income |
| No Earners | 13 (17.6%) | $27,083 |
| 1 Earner | 16 (21.6%) | $33,333 |
| 2 Earners | 41 (55.4%) | $64,135 |
| 3+ Earners | 4 (5.4%) | $0 |
| Total | 74 (100.0%) | $62,692 |
Household Income in Peavine
Household Income Brackets in Peavine
With 30 households falling in the category, the $50,000 to $74,999 income range is the most frequent in Peavine, accounting for 27.0% of all households.
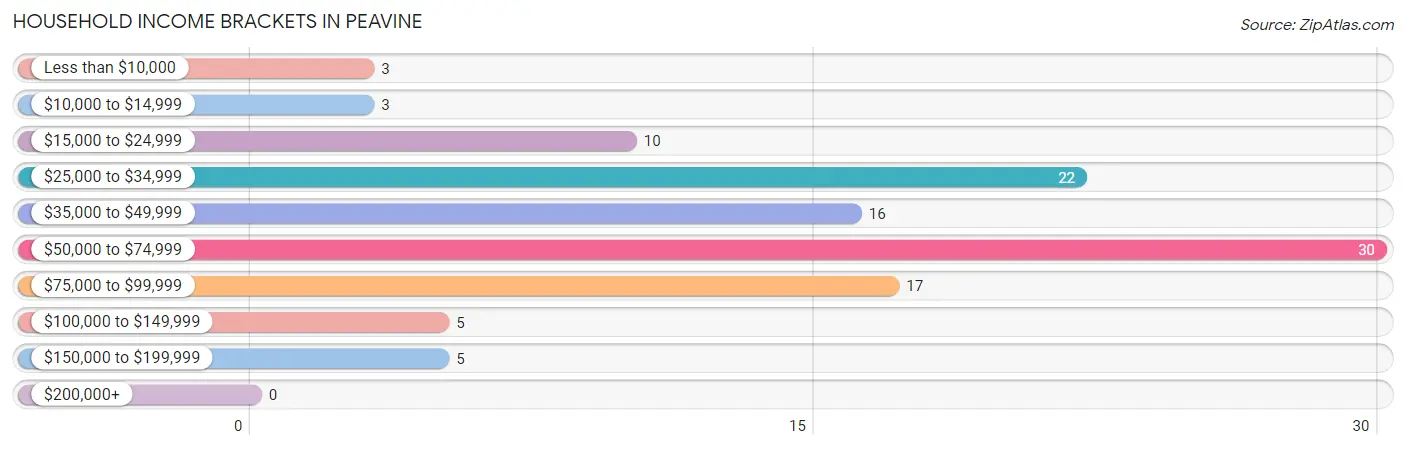
| Income Bracket | # Households | % Households |
| Less than $10,000 | 3 | 2.7% |
| $10,000 to $14,999 | 3 | 2.7% |
| $15,000 to $24,999 | 10 | 9.0% |
| $25,000 to $34,999 | 22 | 19.8% |
| $35,000 to $49,999 | 16 | 14.4% |
| $50,000 to $74,999 | 30 | 27.0% |
| $75,000 to $99,999 | 17 | 15.3% |
| $100,000 to $149,999 | 5 | 4.5% |
| $150,000 to $199,999 | 5 | 4.5% |
| $200,000+ | 0 | 0.0% |
Household Income by Householder Age in Peavine
The median household income in Peavine is $52,917, with the highest median household income of $56,000 found in the 45 to 64 years age bracket for the primary householder. A total of 62 households (55.9%) fall into this category.
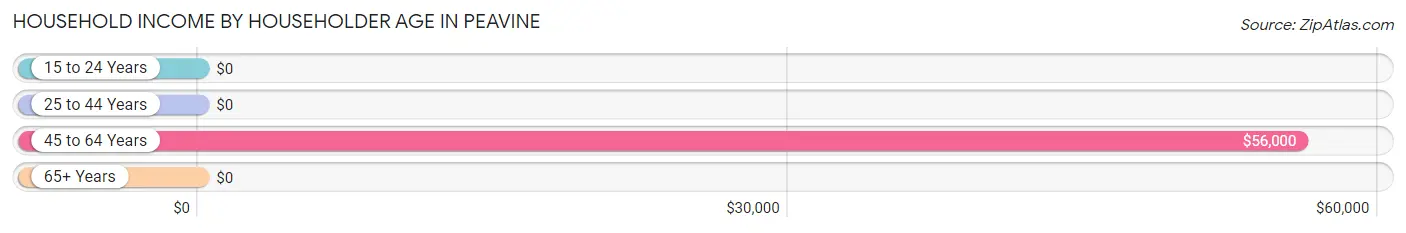
| Income Bracket | # Households | Median Income |
| 15 to 24 Years | 0 (0.0%) | $0 |
| 25 to 44 Years | 14 (12.6%) | $0 |
| 45 to 64 Years | 62 (55.9%) | $56,000 |
| 65+ Years | 35 (31.5%) | $0 |
| Total | 111 (100.0%) | $52,917 |
Poverty in Peavine
Income Below Poverty by Sex and Age in Peavine
With 7.4% poverty level for males and 27.9% for females among the residents of Peavine, 6 to 11 year old males and under 5 year old females are the most vulnerable to poverty, with 7 males (63.6%) and 7 females (100.0%) in their respective age groups living below the poverty level.
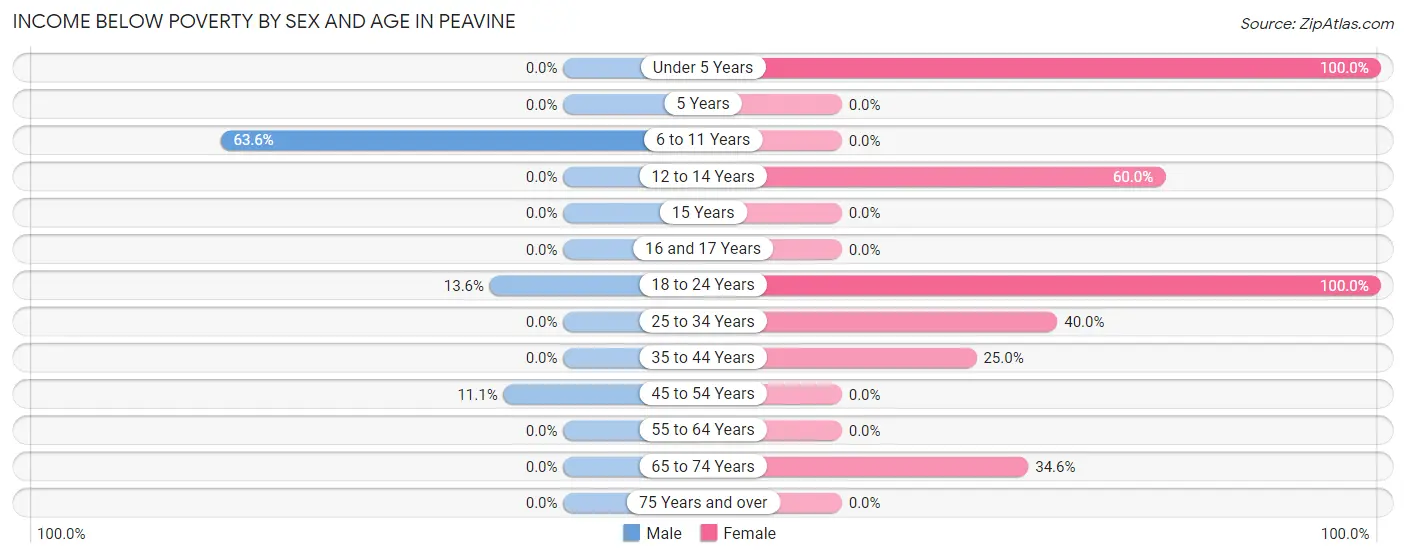
| Age Bracket | Male | Female |
| Under 5 Years | 0 (0.0%) | 7 (100.0%) |
| 5 Years | 0 (0.0%) | 0 (0.0%) |
| 6 to 11 Years | 7 (63.6%) | 0 (0.0%) |
| 12 to 14 Years | 0 (0.0%) | 6 (60.0%) |
| 15 Years | 0 (0.0%) | 0 (0.0%) |
| 16 and 17 Years | 0 (0.0%) | 0 (0.0%) |
| 18 to 24 Years | 3 (13.6%) | 3 (100.0%) |
| 25 to 34 Years | 0 (0.0%) | 6 (40.0%) |
| 35 to 44 Years | 0 (0.0%) | 5 (25.0%) |
| 45 to 54 Years | 4 (11.1%) | 0 (0.0%) |
| 55 to 64 Years | 0 (0.0%) | 0 (0.0%) |
| 65 to 74 Years | 0 (0.0%) | 9 (34.6%) |
| 75 Years and over | 0 (0.0%) | 0 (0.0%) |
| Total | 14 (7.4%) | 36 (27.9%) |
Income Above Poverty by Sex and Age in Peavine
According to the poverty statistics in Peavine, males aged under 5 years and females aged 15 years are the age groups that are most secure financially, with 100.0% of males and 100.0% of females in these age groups living above the poverty line.
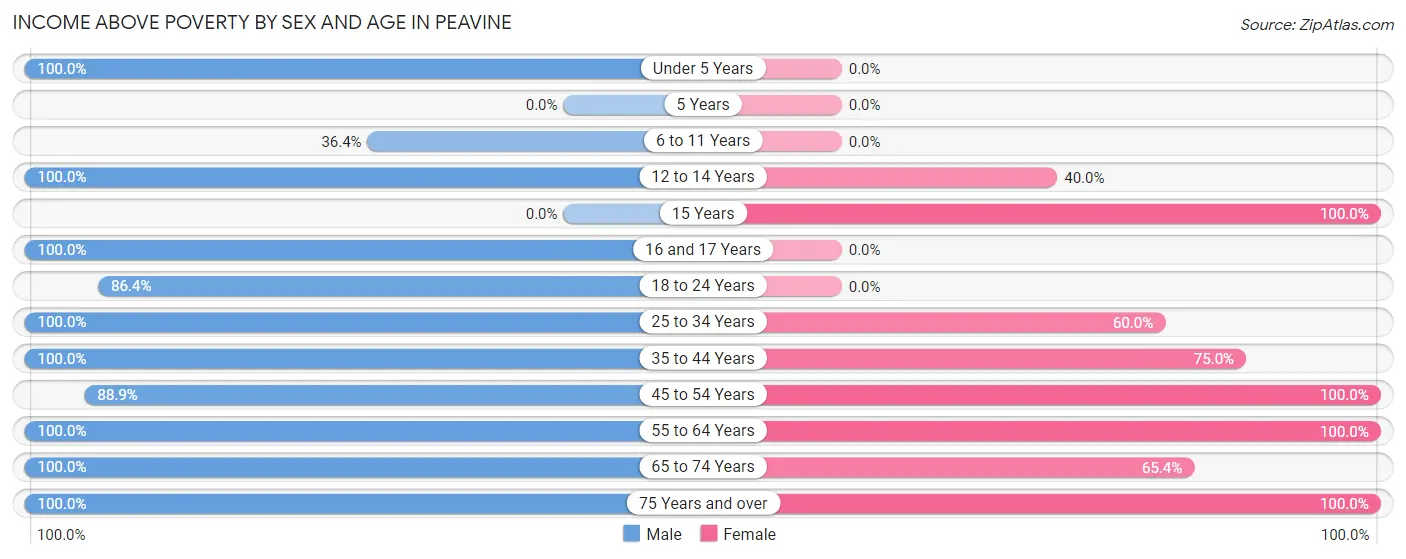
| Age Bracket | Male | Female |
| Under 5 Years | 3 (100.0%) | 0 (0.0%) |
| 5 Years | 0 (0.0%) | 0 (0.0%) |
| 6 to 11 Years | 4 (36.4%) | 0 (0.0%) |
| 12 to 14 Years | 25 (100.0%) | 4 (40.0%) |
| 15 Years | 0 (0.0%) | 4 (100.0%) |
| 16 and 17 Years | 13 (100.0%) | 0 (0.0%) |
| 18 to 24 Years | 19 (86.4%) | 0 (0.0%) |
| 25 to 34 Years | 23 (100.0%) | 9 (60.0%) |
| 35 to 44 Years | 11 (100.0%) | 15 (75.0%) |
| 45 to 54 Years | 32 (88.9%) | 25 (100.0%) |
| 55 to 64 Years | 18 (100.0%) | 11 (100.0%) |
| 65 to 74 Years | 22 (100.0%) | 17 (65.4%) |
| 75 Years and over | 5 (100.0%) | 8 (100.0%) |
| Total | 175 (92.6%) | 93 (72.1%) |
Income Below Poverty Among Married-Couple Families in Peavine
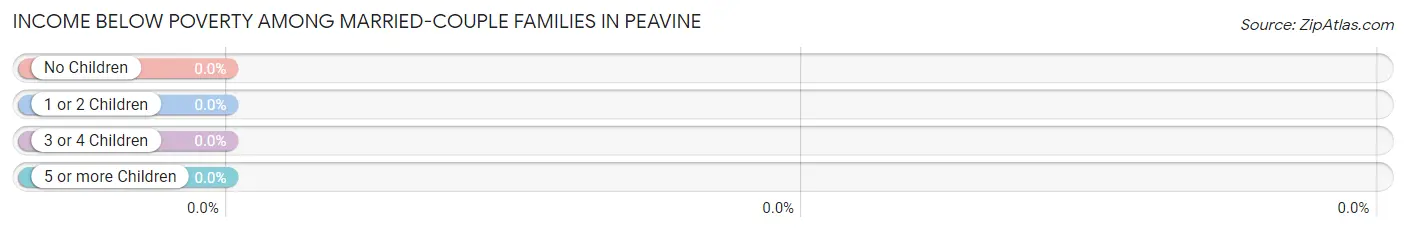
| Children | Above Poverty | Below Poverty |
| No Children | 34 (100.0%) | 0 (0.0%) |
| 1 or 2 Children | 22 (100.0%) | 0 (0.0%) |
| 3 or 4 Children | 0 (0.0%) | 0 (0.0%) |
| 5 or more Children | 0 (0.0%) | 0 (0.0%) |
| Total | 56 (100.0%) | 0 (0.0%) |
Income Below Poverty Among Single-Parent Households in Peavine
According to the poverty data in Peavine, 30.8% or 4 single-father households and 60.0% or 3 single-mother households are living below the poverty line. Among single-father households, those with 1 or 2 children have the highest poverty rate, with 4 households (100.0%) experiencing poverty. Likewise, among single-mother households, those with 1 or 2 children have the highest poverty rate, with 3 households (100.0%) falling below the poverty line.
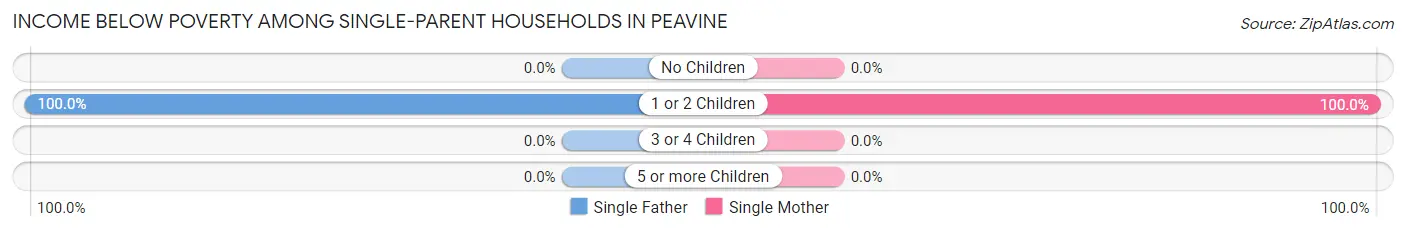
| Children | Single Father | Single Mother |
| No Children | 0 (0.0%) | 0 (0.0%) |
| 1 or 2 Children | 4 (100.0%) | 3 (100.0%) |
| 3 or 4 Children | 0 (0.0%) | 0 (0.0%) |
| 5 or more Children | 0 (0.0%) | 0 (0.0%) |
| Total | 4 (30.8%) | 3 (60.0%) |
Income Below Poverty Among Married-Couple vs Single-Parent Households in Peavine
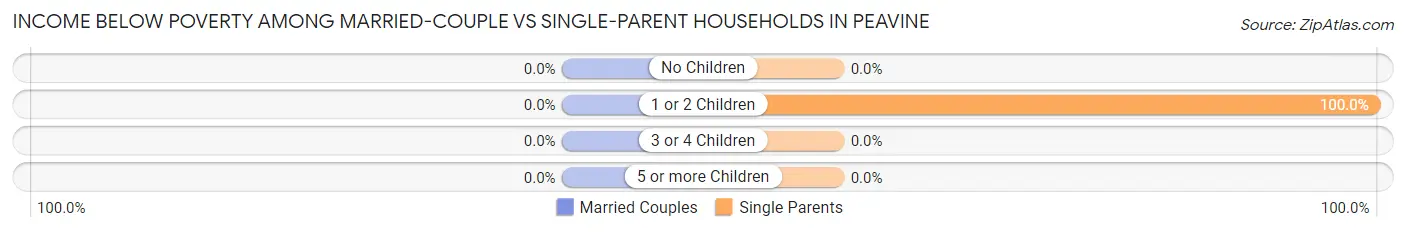
| Children | Married-Couple Families | Single-Parent Households |
| No Children | 0 (0.0%) | 0 (0.0%) |
| 1 or 2 Children | 0 (0.0%) | 7 (100.0%) |
| 3 or 4 Children | 0 (0.0%) | 0 (0.0%) |
| 5 or more Children | 0 (0.0%) | 0 (0.0%) |
| Total | 0 (0.0%) | 7 (38.9%) |
Race in Peavine
The most populous races in Peavine are White / Caucasian (151 | 47.5%), Native / Alaskan (130 | 40.9%), and Two or more Races (37 | 11.6%).
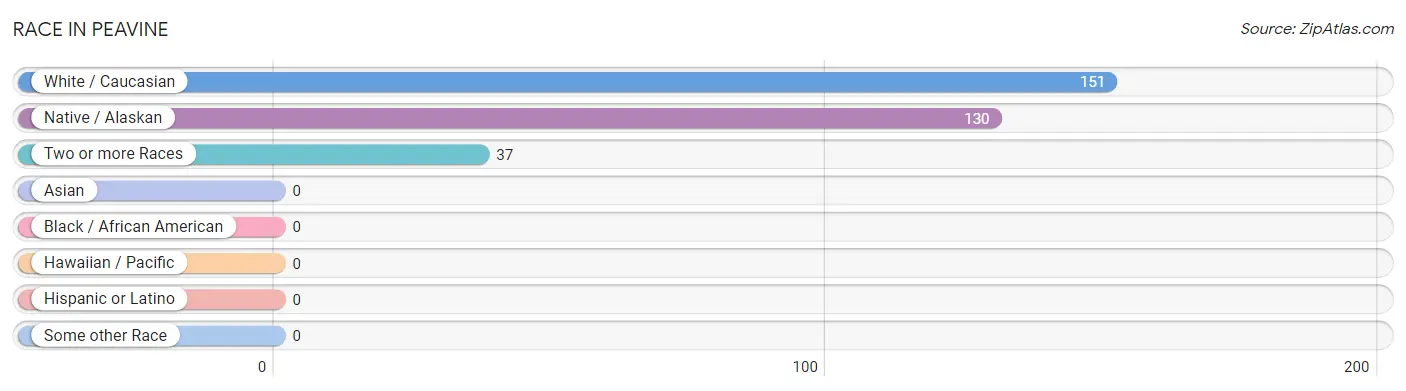
| Race | # Population | % Population |
| Asian | 0 | 0.0% |
| Black / African American | 0 | 0.0% |
| Hawaiian / Pacific | 0 | 0.0% |
| Hispanic or Latino | 0 | 0.0% |
| Native / Alaskan | 130 | 40.9% |
| White / Caucasian | 151 | 47.5% |
| Two or more Races | 37 | 11.6% |
| Some other Race | 0 | 0.0% |
| Total | 318 | 100.0% |
Ancestry in Peavine
The most populous ancestries reported in Peavine are Cherokee (165 | 51.9%), Irish (53 | 16.7%), Scotch-Irish (42 | 13.2%), German (18 | 5.7%), and Scottish (17 | 5.3%), together accounting for 92.8% of all Peavine residents.
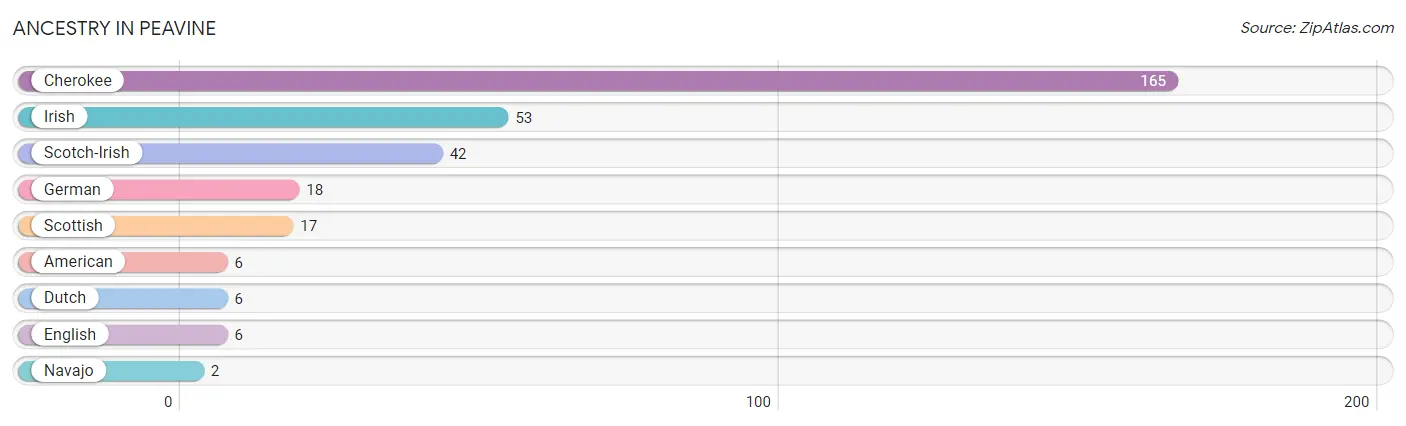
| Ancestry | # Population | % Population |
| American | 6 | 1.9% |
| Cherokee | 165 | 51.9% |
| Dutch | 6 | 1.9% |
| English | 6 | 1.9% |
| German | 18 | 5.7% |
| Irish | 53 | 16.7% |
| Navajo | 2 | 0.6% |
| Scotch-Irish | 42 | 13.2% |
| Scottish | 17 | 5.3% | View All 9 Rows |
Immigrants in Peavine

| Immigration Origin | # Population | % Population | View All 0 Rows |
Sex and Age in Peavine
Sex and Age in Peavine
The most populous age groups in Peavine are 10 to 14 Years (36 | 19.1%) for men and 65 to 69 Years (23 | 17.8%) for women.
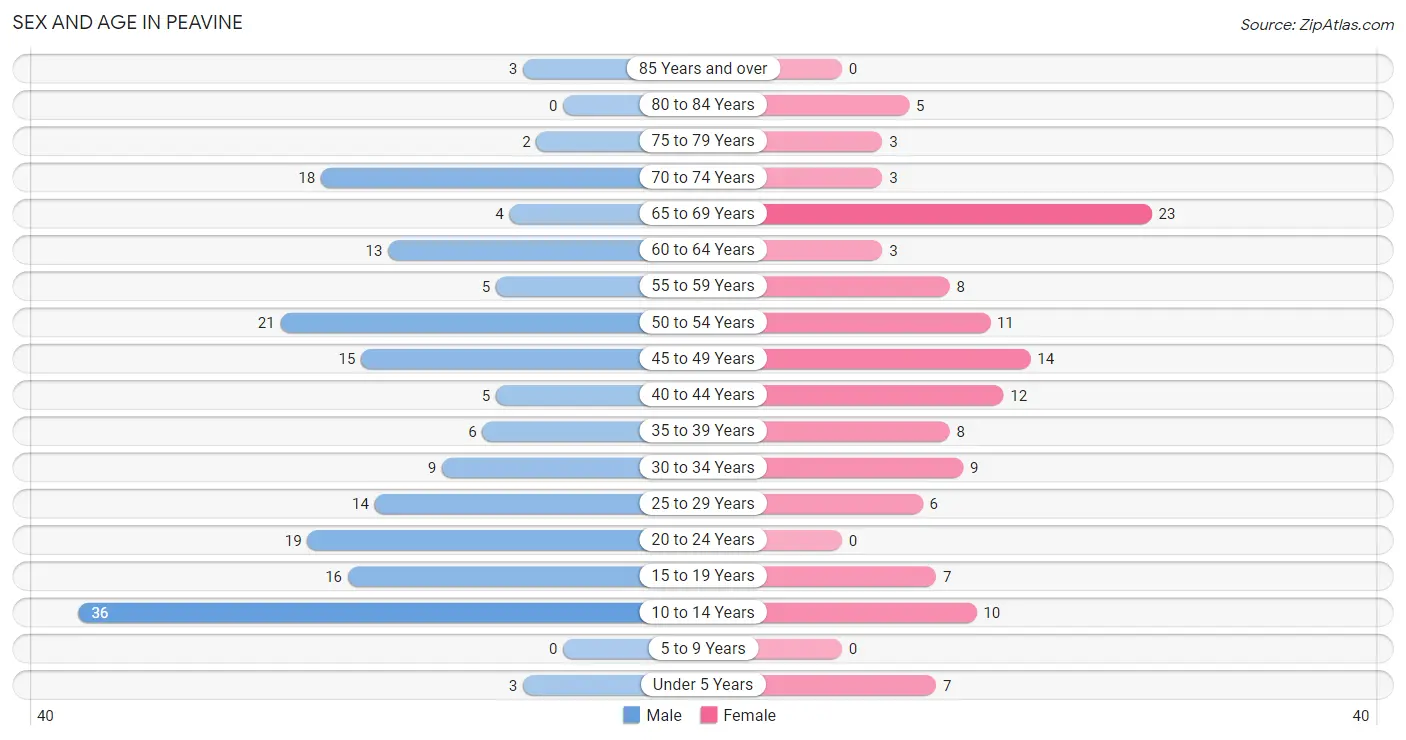
| Age Bracket | Male | Female |
| Under 5 Years | 3 (1.6%) | 7 (5.4%) |
| 5 to 9 Years | 0 (0.0%) | 0 (0.0%) |
| 10 to 14 Years | 36 (19.1%) | 10 (7.7%) |
| 15 to 19 Years | 16 (8.5%) | 7 (5.4%) |
| 20 to 24 Years | 19 (10.1%) | 0 (0.0%) |
| 25 to 29 Years | 14 (7.4%) | 6 (4.6%) |
| 30 to 34 Years | 9 (4.8%) | 9 (7.0%) |
| 35 to 39 Years | 6 (3.2%) | 8 (6.2%) |
| 40 to 44 Years | 5 (2.6%) | 12 (9.3%) |
| 45 to 49 Years | 15 (7.9%) | 14 (10.8%) |
| 50 to 54 Years | 21 (11.1%) | 11 (8.5%) |
| 55 to 59 Years | 5 (2.6%) | 8 (6.2%) |
| 60 to 64 Years | 13 (6.9%) | 3 (2.3%) |
| 65 to 69 Years | 4 (2.1%) | 23 (17.8%) |
| 70 to 74 Years | 18 (9.5%) | 3 (2.3%) |
| 75 to 79 Years | 2 (1.1%) | 3 (2.3%) |
| 80 to 84 Years | 0 (0.0%) | 5 (3.9%) |
| 85 Years and over | 3 (1.6%) | 0 (0.0%) |
| Total | 189 (100.0%) | 129 (100.0%) |
Families and Households in Peavine
Median Family Size in Peavine
The median family size in Peavine is 3.72 persons per family, with single female/mother families (5 | 6.8%) accounting for the largest median family size of 6.8 persons per family. On the other hand, married-couple families (56 | 75.7%) represent the smallest median family size with 3.36 persons per family.
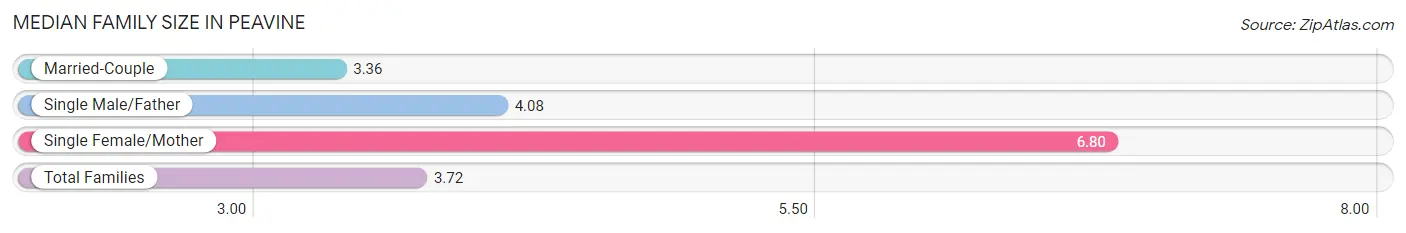
| Family Type | # Families | Family Size |
| Married-Couple | 56 (75.7%) | 3.36 |
| Single Male/Father | 13 (17.6%) | 4.08 |
| Single Female/Mother | 5 (6.8%) | 6.80 |
| Total Families | 74 (100.0%) | 3.72 |
Median Household Size in Peavine
The median household size in Peavine is 2.86 persons per household, with single female/mother households (5 | 4.5%) accounting for the largest median household size of 6.8 persons per household. non-family households (37 | 33.3%) represent the smallest median household size with 1.16 persons per household.
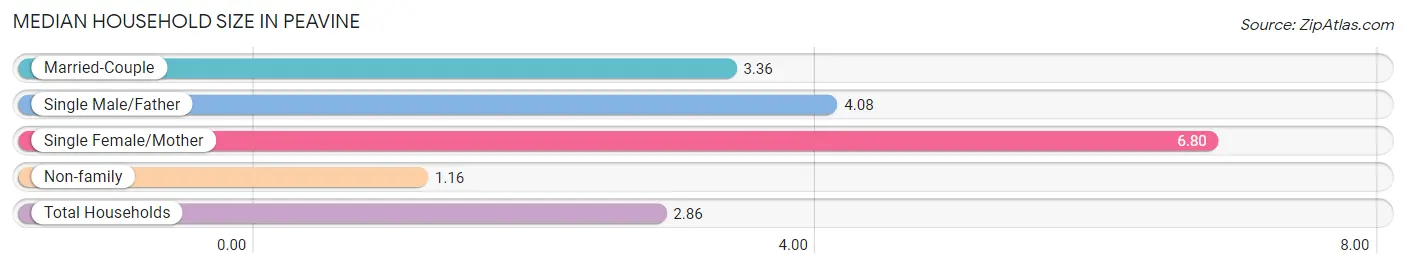
| Household Type | # Households | Household Size |
| Married-Couple | 56 (50.4%) | 3.36 |
| Single Male/Father | 13 (11.7%) | 4.08 |
| Single Female/Mother | 5 (4.5%) | 6.80 |
| Non-family | 37 (33.3%) | 1.16 |
| Total Households | 111 (100.0%) | 2.86 |
Household Size by Marriage Status in Peavine
Out of a total of 111 households in Peavine, 74 (66.7%) are family households, while 37 (33.3%) are nonfamily households. The most numerous type of family households are 2-person households, comprising 28, and the most common type of nonfamily households are 1-person households, comprising 31.
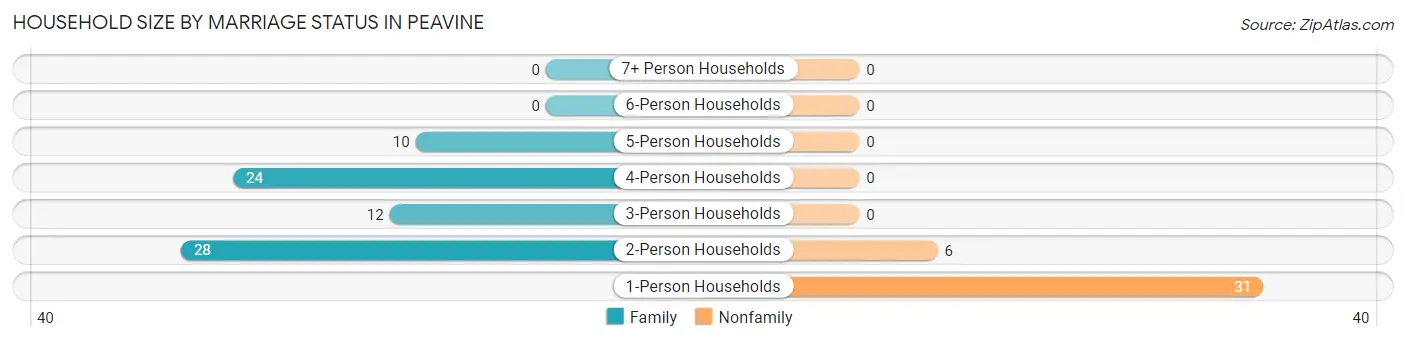
| Household Size | Family Households | Nonfamily Households |
| 1-Person Households | - | 31 (27.9%) |
| 2-Person Households | 28 (25.2%) | 6 (5.4%) |
| 3-Person Households | 12 (10.8%) | 0 (0.0%) |
| 4-Person Households | 24 (21.6%) | 0 (0.0%) |
| 5-Person Households | 10 (9.0%) | 0 (0.0%) |
| 6-Person Households | 0 (0.0%) | 0 (0.0%) |
| 7+ Person Households | 0 (0.0%) | 0 (0.0%) |
| Total | 74 (66.7%) | 37 (33.3%) |
Female Fertility in Peavine
Fertility by Age in Peavine
| Age Bracket | Women with Births | Births / 1,000 Women |
| 15 to 19 years | 0 (0.0%) | 0.0 |
| 20 to 34 years | 0 (0.0%) | 0.0 |
| 35 to 50 years | 0 (0.0%) | 0.0 |
| Total | 0 (0.0%) | 0.0 |
Fertility by Age by Marriage Status in Peavine
| Age Bracket | Married | Unmarried |
| 15 to 19 years | 0 (0.0%) | 0 (0.0%) |
| 20 to 34 years | 0 (0.0%) | 0 (0.0%) |
| 35 to 50 years | 0 (0.0%) | 0 (0.0%) |
| Total | 0 (0.0%) | 0 (0.0%) |
Fertility by Education in Peavine
| Educational Attainment | Women with Births | Births / 1,000 Women |
| Less than High School | 0 (0.0%) | 0.0 |
| High School Diploma | 0 (0.0%) | 0.0 |
| College or Associate's Degree | 0 (0.0%) | 0.0 |
| Bachelor's Degree | 0 (0.0%) | 0.0 |
| Graduate Degree | 0 (0.0%) | 0.0 |
| Total | 0 (0.0%) | 0.0 |
Fertility by Education by Marriage Status in Peavine
| Educational Attainment | Married | Unmarried |
| Less than High School | 0 (0.0%) | 0 (0.0%) |
| High School Diploma | 0 (0.0%) | 0 (0.0%) |
| College or Associate's Degree | 0 (0.0%) | 0 (0.0%) |
| Bachelor's Degree | 0 (0.0%) | 0 (0.0%) |
| Graduate Degree | 0 (0.0%) | 0 (0.0%) |
| Total | 0 (0.0%) | 0 (0.0%) |
Employment Characteristics in Peavine
Employment by Class of Employer in Peavine
Among the 137 employed individuals in Peavine, private company employees (84 | 61.3%), state government employees (19 | 13.9%), and federal government employees (18 | 13.1%) make up the most common classes of employment.
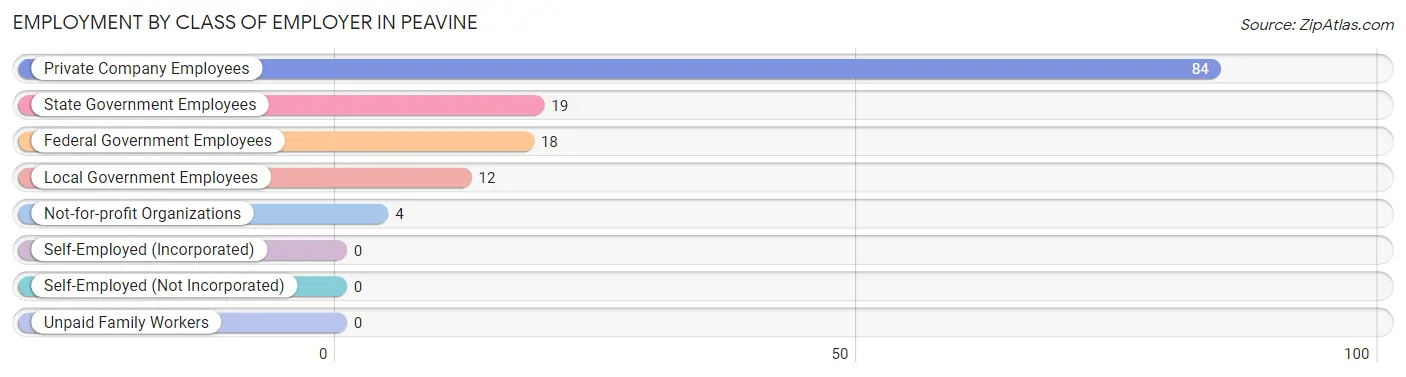
| Employer Class | # Employees | % Employees |
| Private Company Employees | 84 | 61.3% |
| Self-Employed (Incorporated) | 0 | 0.0% |
| Self-Employed (Not Incorporated) | 0 | 0.0% |
| Not-for-profit Organizations | 4 | 2.9% |
| Local Government Employees | 12 | 8.8% |
| State Government Employees | 19 | 13.9% |
| Federal Government Employees | 18 | 13.1% |
| Unpaid Family Workers | 0 | 0.0% |
| Total | 137 | 100.0% |
Employment Status by Age in Peavine
According to the labor force statistics for Peavine, out of the total population over 16 years of age (258), 54.3% or 140 individuals are in the labor force, with 2.1% or 3 of them unemployed. The age group with the highest labor force participation rate is 16 to 19 years, with 100.0% or 19 individuals in the labor force. Within the labor force, the 60 to 64 years age range has the highest percentage of unemployed individuals, with 23.1% or 3 of them being unemployed.
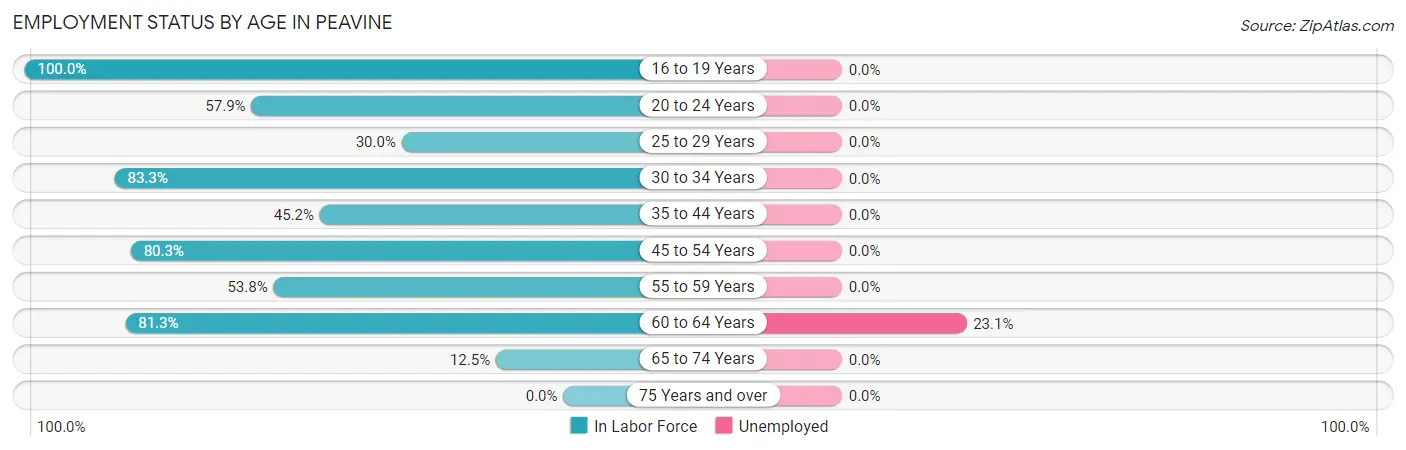
| Age Bracket | In Labor Force | Unemployed |
| 16 to 19 Years | 19 (100.0%) | 0 (0.0%) |
| 20 to 24 Years | 11 (57.9%) | 0 (0.0%) |
| 25 to 29 Years | 6 (30.0%) | 0 (0.0%) |
| 30 to 34 Years | 15 (83.3%) | 0 (0.0%) |
| 35 to 44 Years | 14 (45.2%) | 0 (0.0%) |
| 45 to 54 Years | 49 (80.3%) | 0 (0.0%) |
| 55 to 59 Years | 7 (53.8%) | 0 (0.0%) |
| 60 to 64 Years | 13 (81.3%) | 3 (23.1%) |
| 65 to 74 Years | 6 (12.5%) | 0 (0.0%) |
| 75 Years and over | 0 (0.0%) | 0 (0.0%) |
| Total | 140 (54.3%) | 3 (2.1%) |
Employment Status by Educational Attainment in Peavine
According to labor force statistics for Peavine, 65.4% of individuals (104) out of the total population between 25 and 64 years of age (159) are in the labor force, with 2.9% or 3 of them being unemployed. The group with the highest labor force participation rate are those with the educational attainment of bachelor's degree or higher, with 100.0% or 15 individuals in the labor force. Within the labor force, individuals with college / associate degree education have the highest percentage of unemployment, with 11.1% or 3 of them being unemployed.
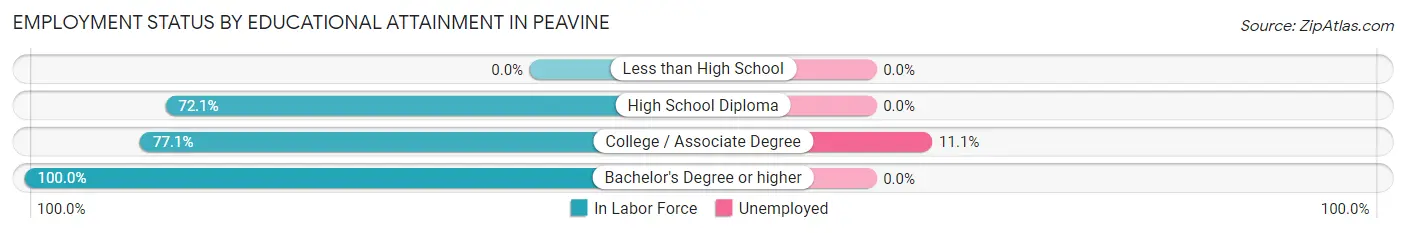
| Educational Attainment | In Labor Force | Unemployed |
| Less than High School | 0 (0.0%) | 0 (0.0%) |
| High School Diploma | 62 (72.1%) | 0 (0.0%) |
| College / Associate Degree | 27 (77.1%) | 4 (11.1%) |
| Bachelor's Degree or higher | 15 (100.0%) | 0 (0.0%) |
| Total | 104 (65.4%) | 5 (2.9%) |
Employment Occupations by Sex in Peavine
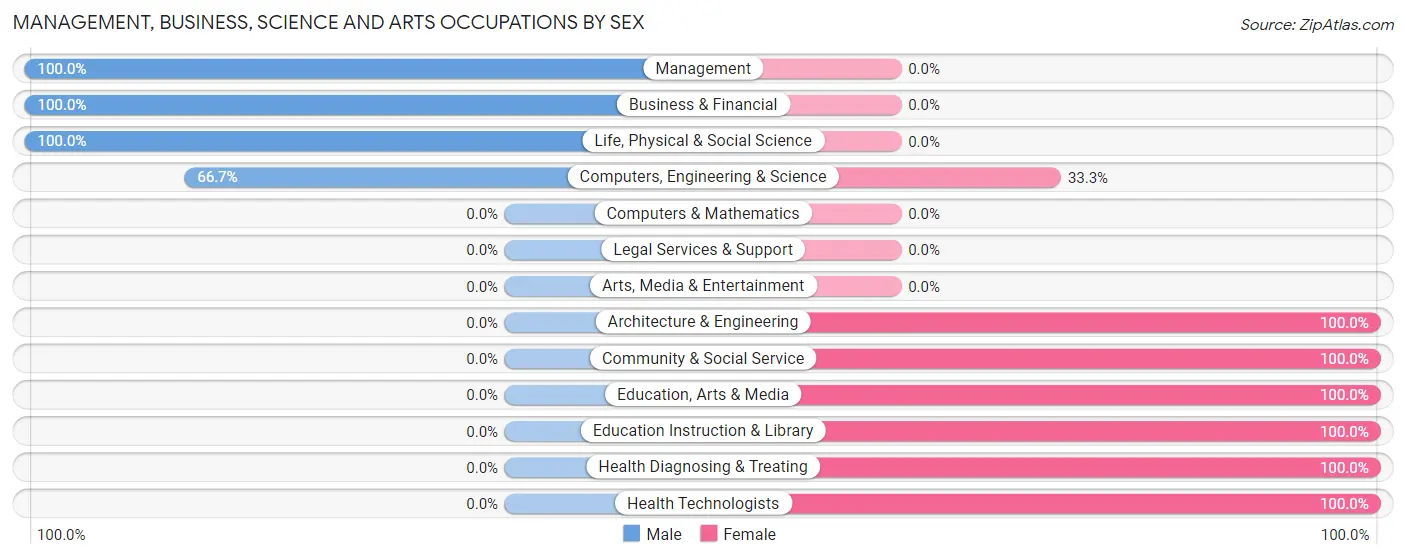
Management, Business, Science and Arts Occupations
The most common Management, Business, Science and Arts occupations in Peavine are Computers, Engineering & Science (9 | 6.6%), Health Diagnosing & Treating (9 | 6.6%), Management (8 | 5.8%), Life, Physical & Social Science (6 | 4.4%), and Community & Social Service (6 | 4.4%).
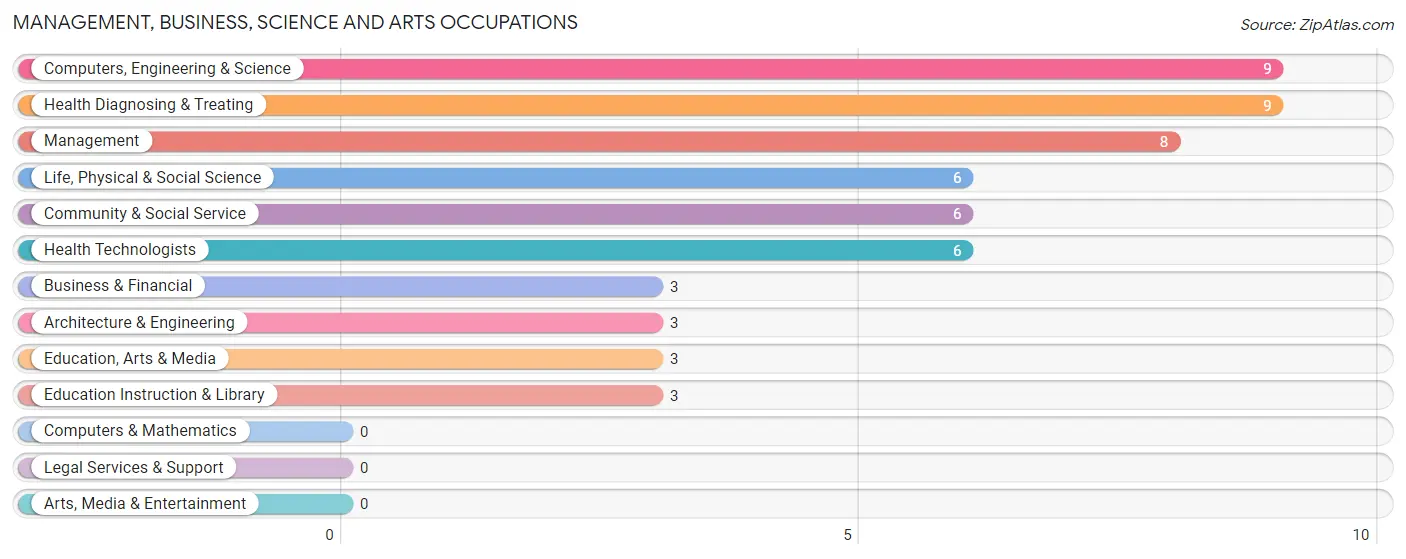
Management, Business, Science and Arts Occupations by Sex
Within the Management, Business, Science and Arts occupations in Peavine, the most male-oriented occupations are Management (100.0%), Business & Financial (100.0%), and Life, Physical & Social Science (100.0%), while the most female-oriented occupations are Architecture & Engineering (100.0%), Community & Social Service (100.0%), and Education, Arts & Media (100.0%).
| Occupation | Male | Female |
| Management | 8 (100.0%) | 0 (0.0%) |
| Business & Financial | 3 (100.0%) | 0 (0.0%) |
| Computers, Engineering & Science | 6 (66.7%) | 3 (33.3%) |
| Computers & Mathematics | 0 (0.0%) | 0 (0.0%) |
| Architecture & Engineering | 0 (0.0%) | 3 (100.0%) |
| Life, Physical & Social Science | 6 (100.0%) | 0 (0.0%) |
| Community & Social Service | 0 (0.0%) | 6 (100.0%) |
| Education, Arts & Media | 0 (0.0%) | 3 (100.0%) |
| Legal Services & Support | 0 (0.0%) | 0 (0.0%) |
| Education Instruction & Library | 0 (0.0%) | 3 (100.0%) |
| Arts, Media & Entertainment | 0 (0.0%) | 0 (0.0%) |
| Health Diagnosing & Treating | 0 (0.0%) | 9 (100.0%) |
| Health Technologists | 0 (0.0%) | 6 (100.0%) |
| Total (Category) | 17 (48.6%) | 18 (51.4%) |
| Total (Overall) | 99 (72.3%) | 38 (27.7%) |
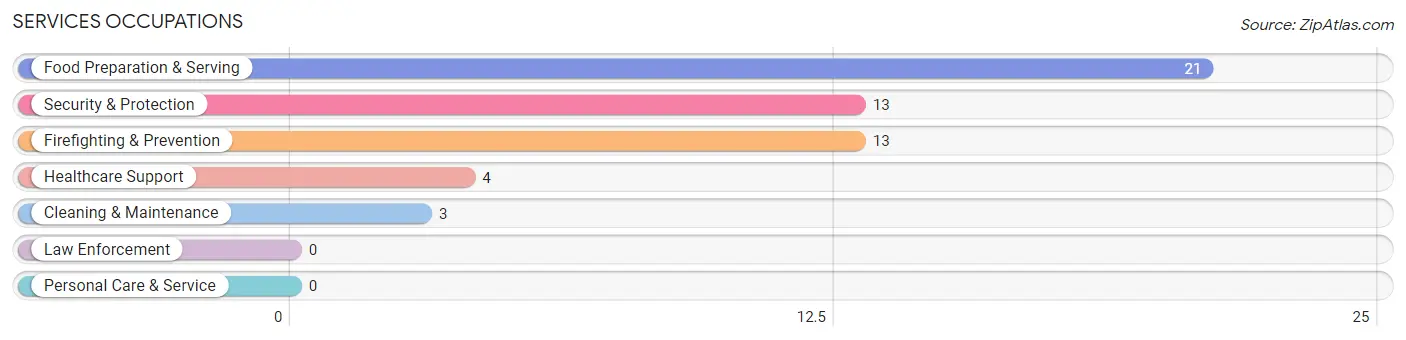
Services Occupations
The most common Services occupations in Peavine are Food Preparation & Serving (21 | 15.3%), Security & Protection (13 | 9.5%), Firefighting & Prevention (13 | 9.5%), Healthcare Support (4 | 2.9%), and Cleaning & Maintenance (3 | 2.2%).
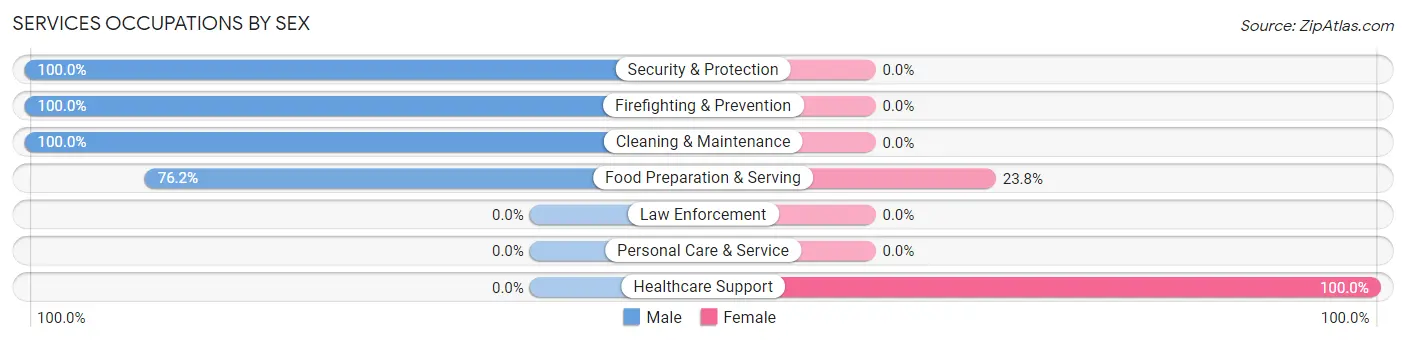
Services Occupations by Sex
Within the Services occupations in Peavine, the most male-oriented occupations are Security & Protection (100.0%), Firefighting & Prevention (100.0%), and Cleaning & Maintenance (100.0%), while the most female-oriented occupations are Healthcare Support (100.0%), and Food Preparation & Serving (23.8%).
| Occupation | Male | Female |
| Healthcare Support | 0 (0.0%) | 4 (100.0%) |
| Security & Protection | 13 (100.0%) | 0 (0.0%) |
| Firefighting & Prevention | 13 (100.0%) | 0 (0.0%) |
| Law Enforcement | 0 (0.0%) | 0 (0.0%) |
| Food Preparation & Serving | 16 (76.2%) | 5 (23.8%) |
| Cleaning & Maintenance | 3 (100.0%) | 0 (0.0%) |
| Personal Care & Service | 0 (0.0%) | 0 (0.0%) |
| Total (Category) | 32 (78.0%) | 9 (22.0%) |
| Total (Overall) | 99 (72.3%) | 38 (27.7%) |
Sales and Office Occupations
The most common Sales and Office occupations in Peavine are Office & Administration (17 | 12.4%), and Sales & Related (7 | 5.1%).
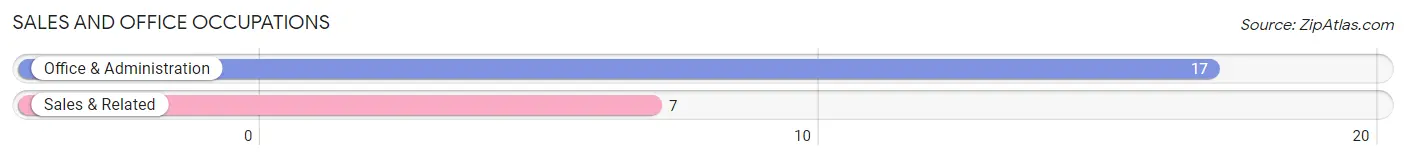
Sales and Office Occupations by Sex
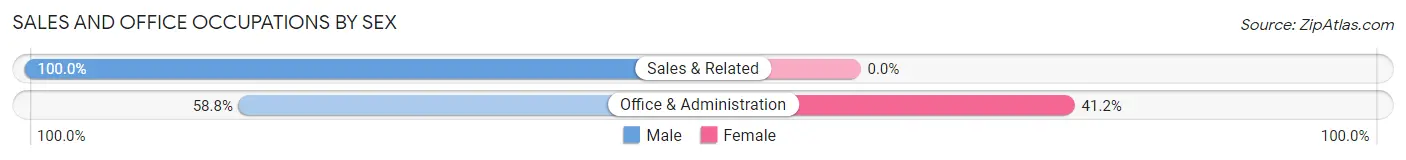
| Occupation | Male | Female |
| Sales & Related | 7 (100.0%) | 0 (0.0%) |
| Office & Administration | 10 (58.8%) | 7 (41.2%) |
| Total (Category) | 17 (70.8%) | 7 (29.2%) |
| Total (Overall) | 99 (72.3%) | 38 (27.7%) |
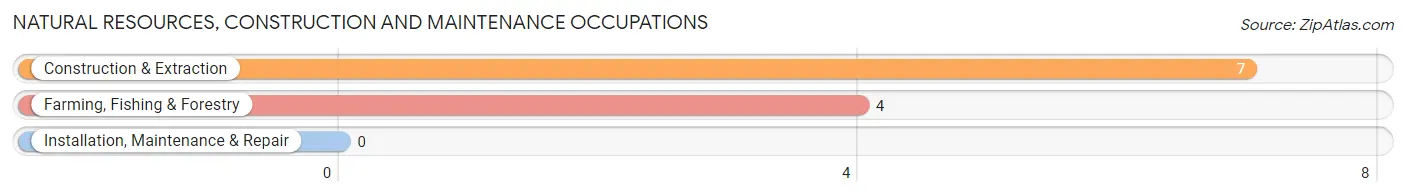
Natural Resources, Construction and Maintenance Occupations
The most common Natural Resources, Construction and Maintenance occupations in Peavine are Construction & Extraction (7 | 5.1%), and Farming, Fishing & Forestry (4 | 2.9%).
Natural Resources, Construction and Maintenance Occupations by Sex
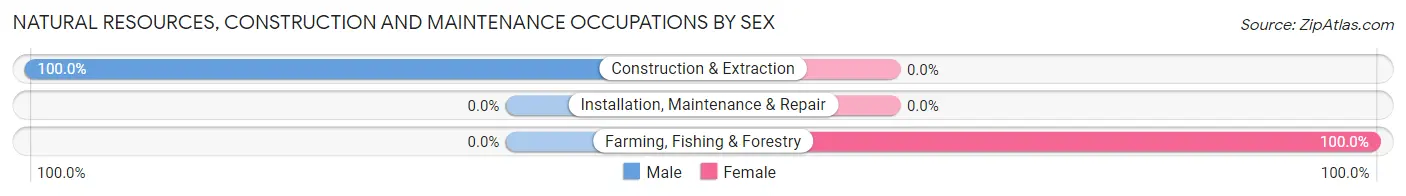
| Occupation | Male | Female |
| Farming, Fishing & Forestry | 0 (0.0%) | 4 (100.0%) |
| Construction & Extraction | 7 (100.0%) | 0 (0.0%) |
| Installation, Maintenance & Repair | 0 (0.0%) | 0 (0.0%) |
| Total (Category) | 7 (63.6%) | 4 (36.4%) |
| Total (Overall) | 99 (72.3%) | 38 (27.7%) |
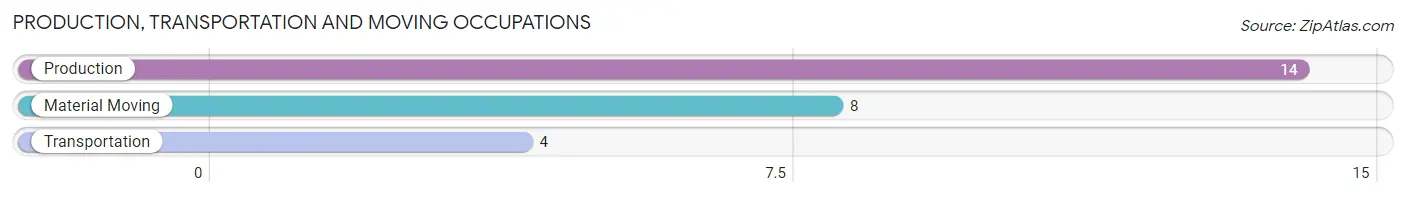
Production, Transportation and Moving Occupations
The most common Production, Transportation and Moving occupations in Peavine are Production (14 | 10.2%), Material Moving (8 | 5.8%), and Transportation (4 | 2.9%).
Production, Transportation and Moving Occupations by Sex
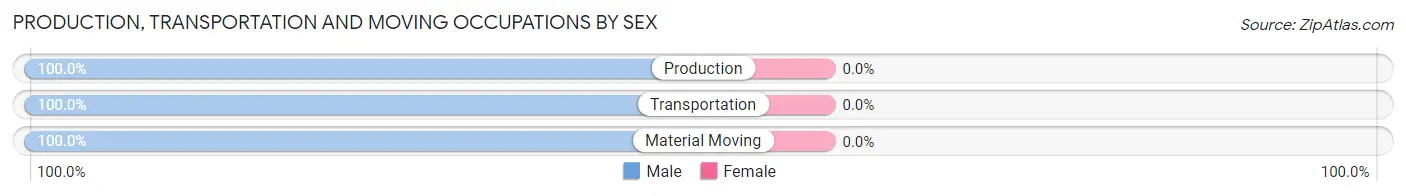
| Occupation | Male | Female |
| Production | 14 (100.0%) | 0 (0.0%) |
| Transportation | 4 (100.0%) | 0 (0.0%) |
| Material Moving | 8 (100.0%) | 0 (0.0%) |
| Total (Category) | 26 (100.0%) | 0 (0.0%) |
| Total (Overall) | 99 (72.3%) | 38 (27.7%) |
Employment Industries by Sex in Peavine
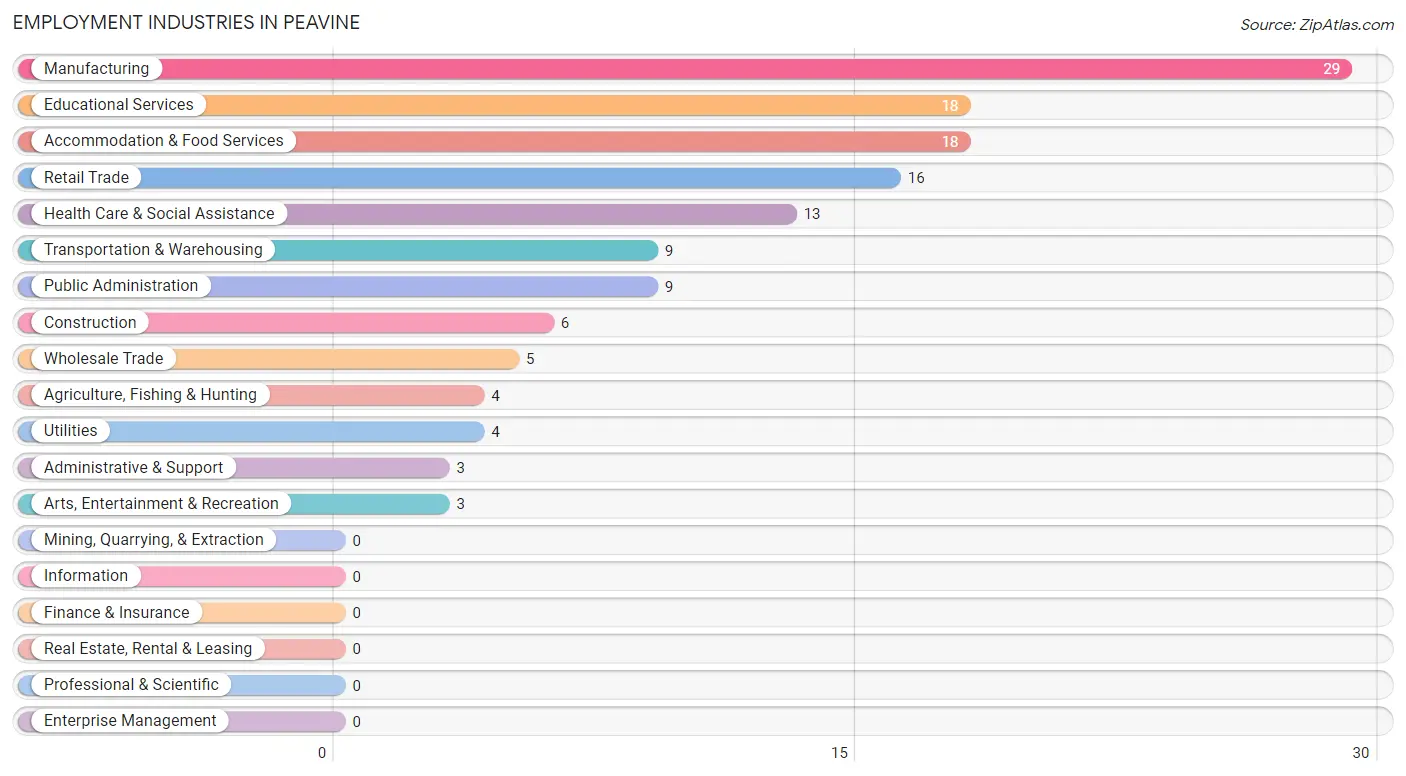
Employment Industries in Peavine
The major employment industries in Peavine include Manufacturing (29 | 21.2%), Educational Services (18 | 13.1%), Accommodation & Food Services (18 | 13.1%), Retail Trade (16 | 11.7%), and Health Care & Social Assistance (13 | 9.5%).
Employment Industries by Sex in Peavine
The Peavine industries that see more men than women are Construction (100.0%), Manufacturing (100.0%), and Wholesale Trade (100.0%), whereas the industries that tend to have a higher number of women are Agriculture, Fishing & Hunting (100.0%), Health Care & Social Assistance (100.0%), and Educational Services (72.2%).
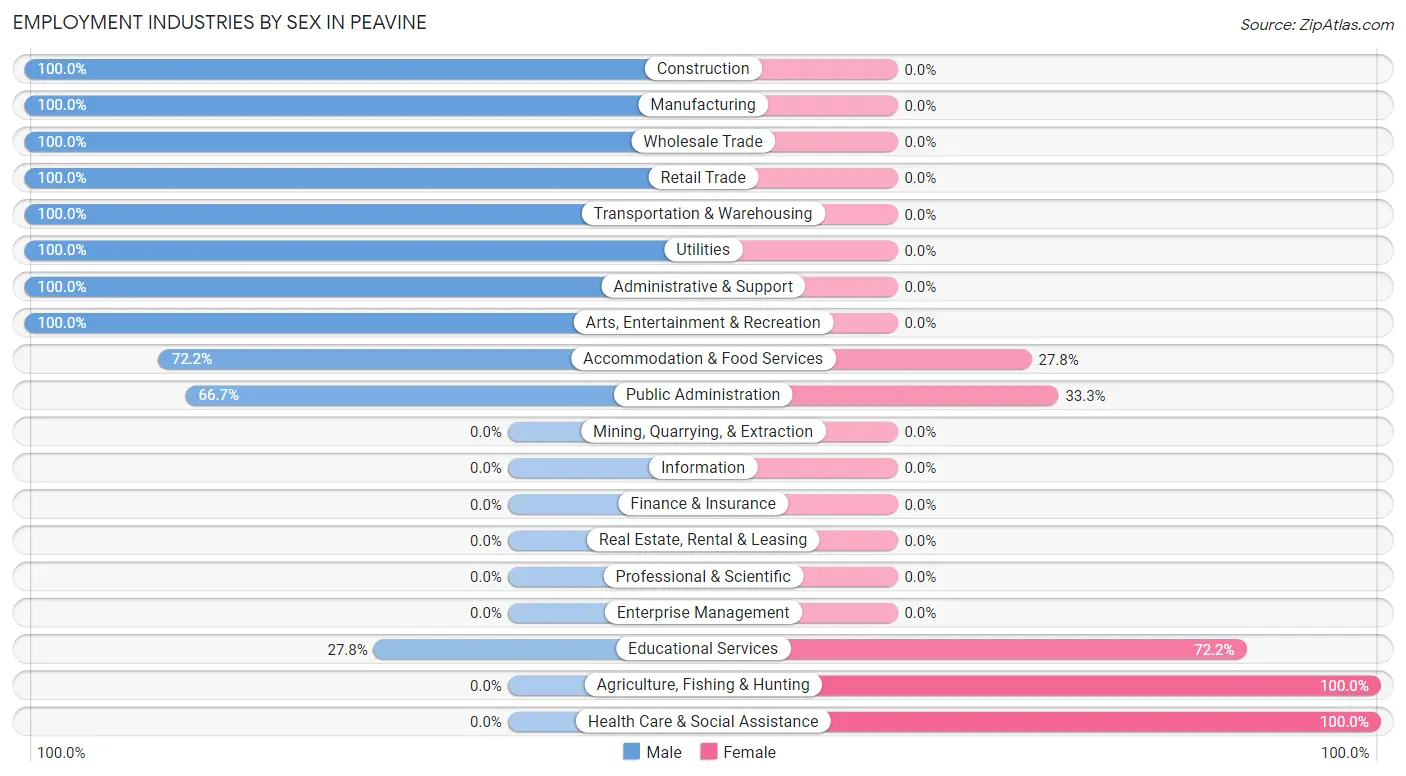
| Industry | Male | Female |
| Agriculture, Fishing & Hunting | 0 (0.0%) | 4 (100.0%) |
| Mining, Quarrying, & Extraction | 0 (0.0%) | 0 (0.0%) |
| Construction | 6 (100.0%) | 0 (0.0%) |
| Manufacturing | 29 (100.0%) | 0 (0.0%) |
| Wholesale Trade | 5 (100.0%) | 0 (0.0%) |
| Retail Trade | 16 (100.0%) | 0 (0.0%) |
| Transportation & Warehousing | 9 (100.0%) | 0 (0.0%) |
| Utilities | 4 (100.0%) | 0 (0.0%) |
| Information | 0 (0.0%) | 0 (0.0%) |
| Finance & Insurance | 0 (0.0%) | 0 (0.0%) |
| Real Estate, Rental & Leasing | 0 (0.0%) | 0 (0.0%) |
| Professional & Scientific | 0 (0.0%) | 0 (0.0%) |
| Enterprise Management | 0 (0.0%) | 0 (0.0%) |
| Administrative & Support | 3 (100.0%) | 0 (0.0%) |
| Educational Services | 5 (27.8%) | 13 (72.2%) |
| Health Care & Social Assistance | 0 (0.0%) | 13 (100.0%) |
| Arts, Entertainment & Recreation | 3 (100.0%) | 0 (0.0%) |
| Accommodation & Food Services | 13 (72.2%) | 5 (27.8%) |
| Public Administration | 6 (66.7%) | 3 (33.3%) |
| Total | 99 (72.3%) | 38 (27.7%) |
Education in Peavine
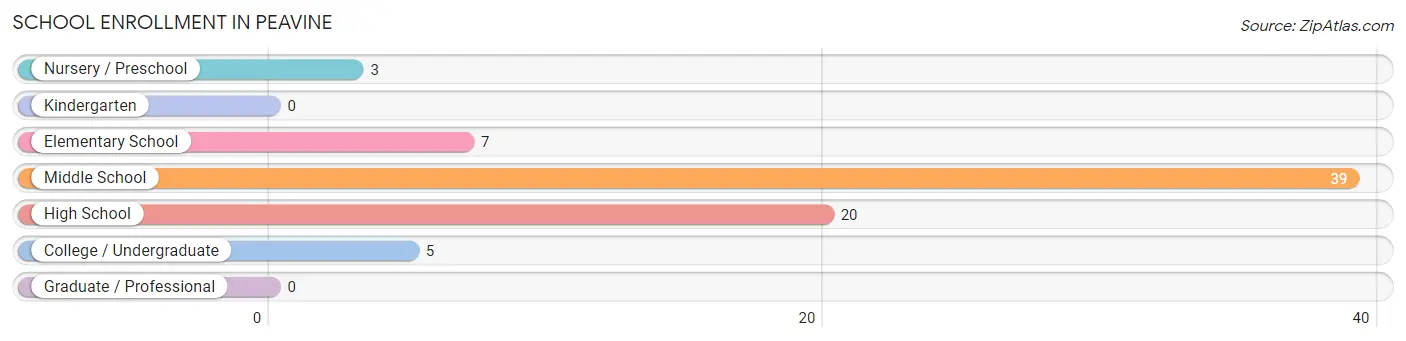
School Enrollment in Peavine
The most common levels of schooling among the 74 students in Peavine are middle school (39 | 52.7%), high school (20 | 27.0%), and elementary school (7 | 9.5%).
| School Level | # Students | % Students |
| Nursery / Preschool | 3 | 4.1% |
| Kindergarten | 0 | 0.0% |
| Elementary School | 7 | 9.5% |
| Middle School | 39 | 52.7% |
| High School | 20 | 27.0% |
| College / Undergraduate | 5 | 6.8% |
| Graduate / Professional | 0 | 0.0% |
| Total | 74 | 100.0% |
School Enrollment by Age by Funding Source in Peavine
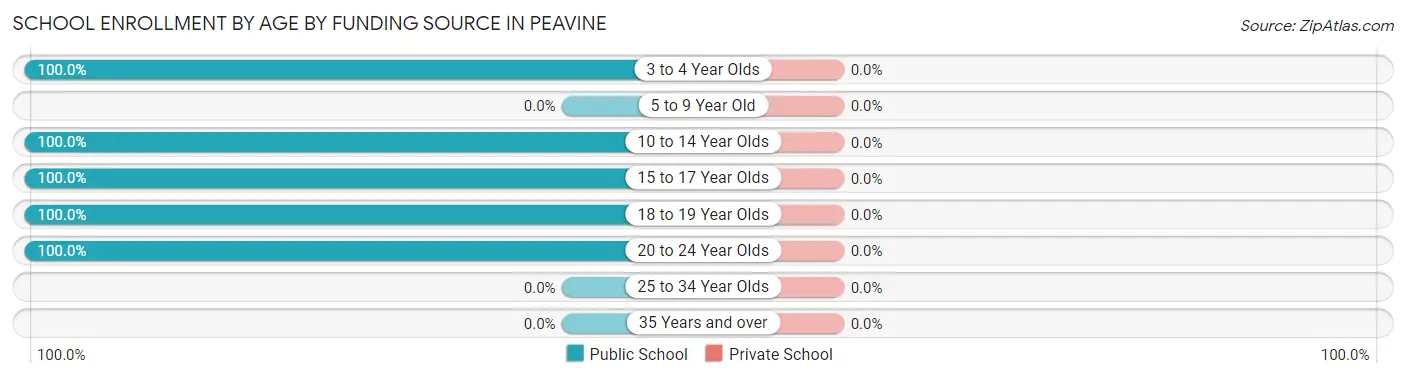
| Age Bracket | Public School | Private School |
| 3 to 4 Year Olds | 3 (100.0%) | 0 (0.0%) |
| 5 to 9 Year Old | 0 (0.0%) | 0 (0.0%) |
| 10 to 14 Year Olds | 46 (100.0%) | 0 (0.0%) |
| 15 to 17 Year Olds | 17 (100.0%) | 0 (0.0%) |
| 18 to 19 Year Olds | 3 (100.0%) | 0 (0.0%) |
| 20 to 24 Year Olds | 5 (100.0%) | 0 (0.0%) |
| 25 to 34 Year Olds | 0 (0.0%) | 0 (0.0%) |
| 35 Years and over | 0 (0.0%) | 0 (0.0%) |
| Total | 74 (100.0%) | 0 (0.0%) |
Educational Attainment by Field of Study in Peavine
Science & technology (7 | 33.3%), bio, nature & agricultural (6 | 28.6%), education (5 | 23.8%), and psychology (3 | 14.3%) are the most common fields of study among 21 individuals in Peavine who have obtained a bachelor's degree or higher.
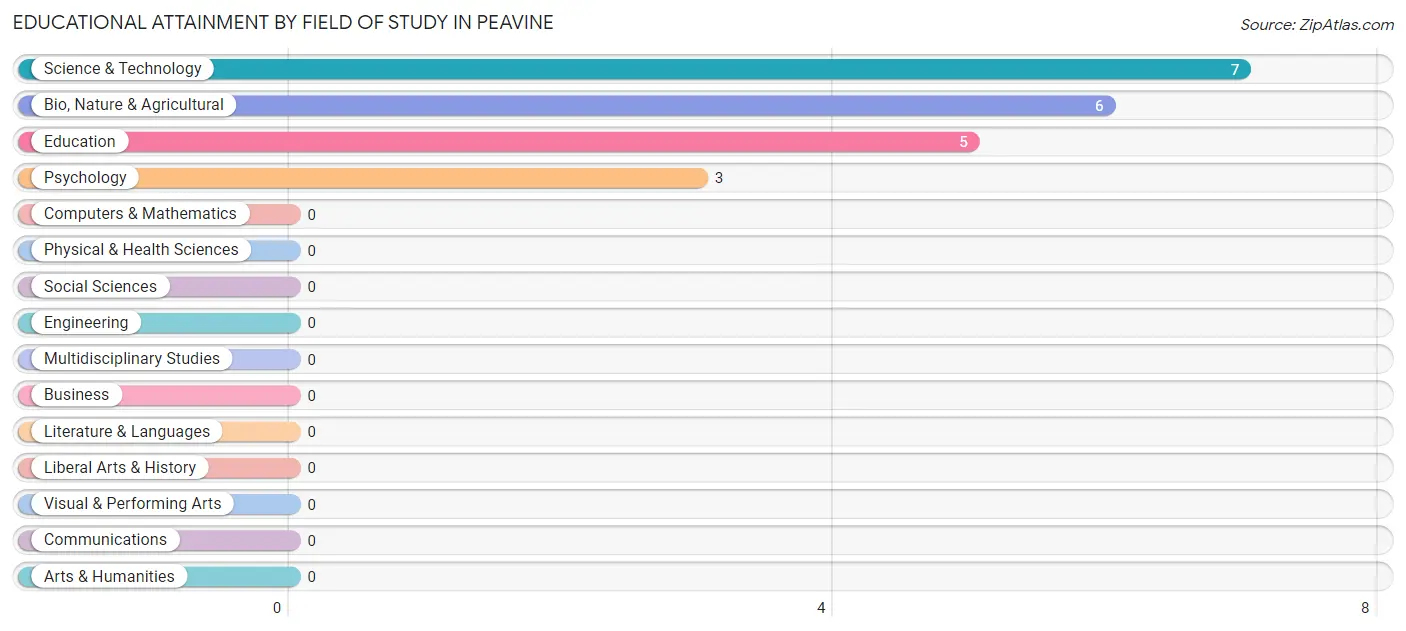
| Field of Study | # Graduates | % Graduates |
| Computers & Mathematics | 0 | 0.0% |
| Bio, Nature & Agricultural | 6 | 28.6% |
| Physical & Health Sciences | 0 | 0.0% |
| Psychology | 3 | 14.3% |
| Social Sciences | 0 | 0.0% |
| Engineering | 0 | 0.0% |
| Multidisciplinary Studies | 0 | 0.0% |
| Science & Technology | 7 | 33.3% |
| Business | 0 | 0.0% |
| Education | 5 | 23.8% |
| Literature & Languages | 0 | 0.0% |
| Liberal Arts & History | 0 | 0.0% |
| Visual & Performing Arts | 0 | 0.0% |
| Communications | 0 | 0.0% |
| Arts & Humanities | 0 | 0.0% |
| Total | 21 | 100.0% |
Transportation & Commute in Peavine
Vehicle Availability by Sex in Peavine
The most prevalent vehicle ownership categories in Peavine are males with 3 vehicles (37, accounting for 37.4%) and females with 3 vehicles (4, making up 97.4%).
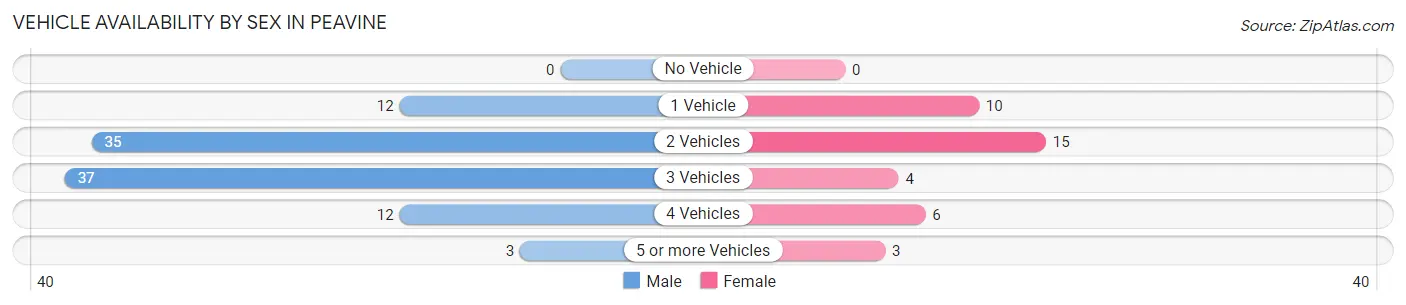
| Vehicles Available | Male | Female |
| No Vehicle | 0 (0.0%) | 0 (0.0%) |
| 1 Vehicle | 12 (12.1%) | 10 (26.3%) |
| 2 Vehicles | 35 (35.3%) | 15 (39.5%) |
| 3 Vehicles | 37 (37.4%) | 4 (10.5%) |
| 4 Vehicles | 12 (12.1%) | 6 (15.8%) |
| 5 or more Vehicles | 3 (3.0%) | 3 (7.9%) |
| Total | 99 (100.0%) | 38 (100.0%) |
Commute Time in Peavine
The most frequently occuring commute durations in Peavine are 90 or more minutes (32 commuters, 23.9%), 10 to 14 minutes (25 commuters, 18.7%), and 15 to 19 minutes (20 commuters, 14.9%).
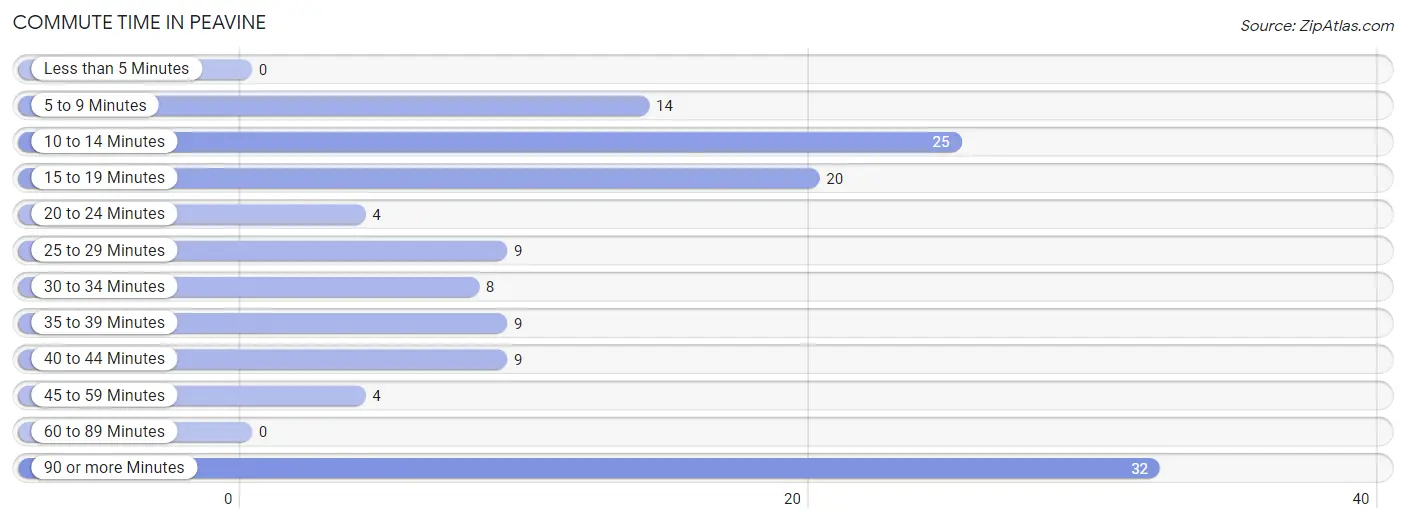
| Commute Time | # Commuters | % Commuters |
| Less than 5 Minutes | 0 | 0.0% |
| 5 to 9 Minutes | 14 | 10.4% |
| 10 to 14 Minutes | 25 | 18.7% |
| 15 to 19 Minutes | 20 | 14.9% |
| 20 to 24 Minutes | 4 | 3.0% |
| 25 to 29 Minutes | 9 | 6.7% |
| 30 to 34 Minutes | 8 | 6.0% |
| 35 to 39 Minutes | 9 | 6.7% |
| 40 to 44 Minutes | 9 | 6.7% |
| 45 to 59 Minutes | 4 | 3.0% |
| 60 to 89 Minutes | 0 | 0.0% |
| 90 or more Minutes | 32 | 23.9% |
Commute Time by Sex in Peavine
The most common commute times in Peavine are 90 or more minutes (32 commuters, 32.3%) for males and 15 to 19 minutes (10 commuters, 28.6%) for females.
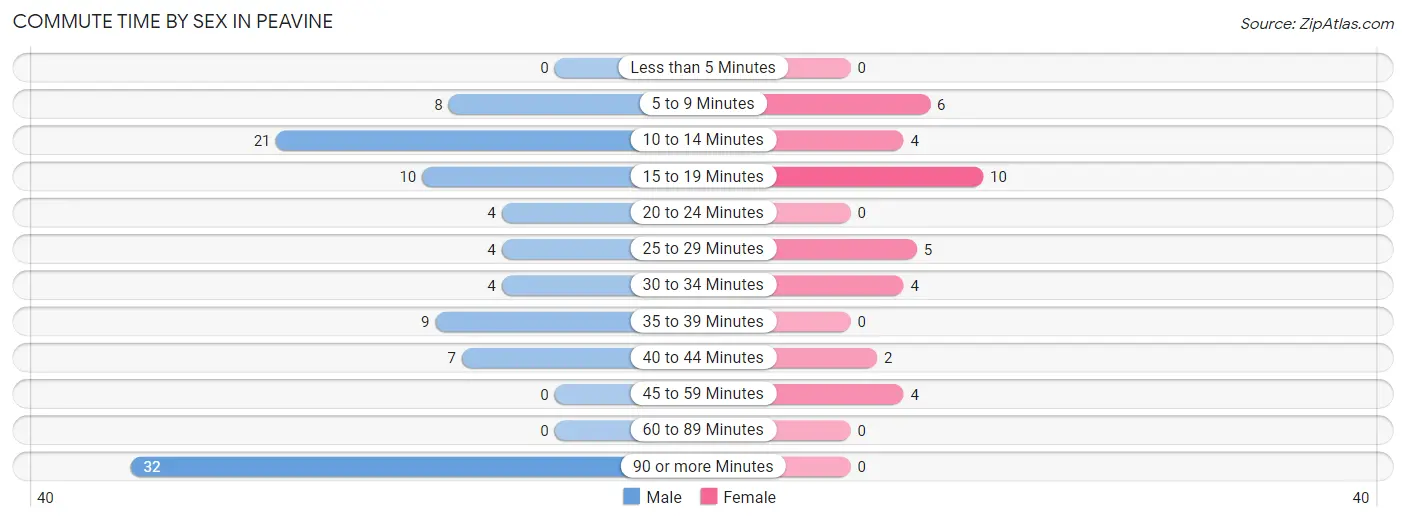
| Commute Time | Male | Female |
| Less than 5 Minutes | 0 (0.0%) | 0 (0.0%) |
| 5 to 9 Minutes | 8 (8.1%) | 6 (17.1%) |
| 10 to 14 Minutes | 21 (21.2%) | 4 (11.4%) |
| 15 to 19 Minutes | 10 (10.1%) | 10 (28.6%) |
| 20 to 24 Minutes | 4 (4.0%) | 0 (0.0%) |
| 25 to 29 Minutes | 4 (4.0%) | 5 (14.3%) |
| 30 to 34 Minutes | 4 (4.0%) | 4 (11.4%) |
| 35 to 39 Minutes | 9 (9.1%) | 0 (0.0%) |
| 40 to 44 Minutes | 7 (7.1%) | 2 (5.7%) |
| 45 to 59 Minutes | 0 (0.0%) | 4 (11.4%) |
| 60 to 89 Minutes | 0 (0.0%) | 0 (0.0%) |
| 90 or more Minutes | 32 (32.3%) | 0 (0.0%) |
Time of Departure to Work by Sex in Peavine
The most frequent times of departure to work in Peavine are 4:00 PM to 11:59 PM (38, 38.4%) for males and 7:30 AM to 7:59 AM (11, 31.4%) for females.
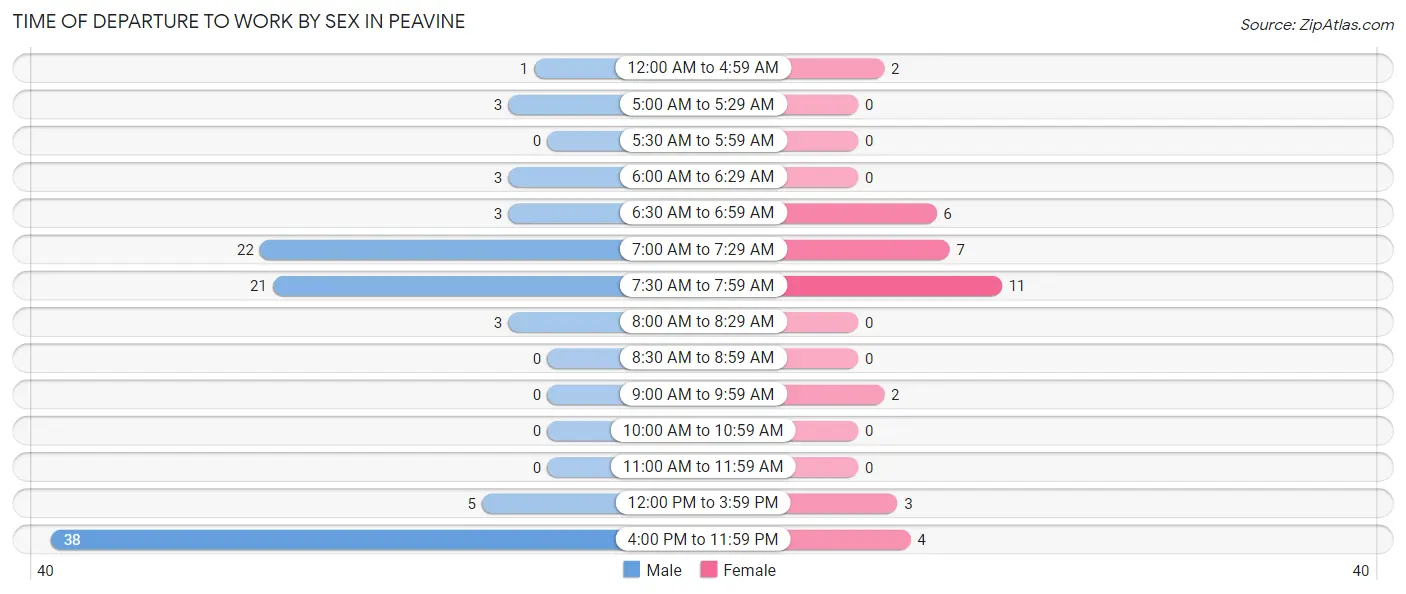
| Time of Departure | Male | Female |
| 12:00 AM to 4:59 AM | 1 (1.0%) | 2 (5.7%) |
| 5:00 AM to 5:29 AM | 3 (3.0%) | 0 (0.0%) |
| 5:30 AM to 5:59 AM | 0 (0.0%) | 0 (0.0%) |
| 6:00 AM to 6:29 AM | 3 (3.0%) | 0 (0.0%) |
| 6:30 AM to 6:59 AM | 3 (3.0%) | 6 (17.1%) |
| 7:00 AM to 7:29 AM | 22 (22.2%) | 7 (20.0%) |
| 7:30 AM to 7:59 AM | 21 (21.2%) | 11 (31.4%) |
| 8:00 AM to 8:29 AM | 3 (3.0%) | 0 (0.0%) |
| 8:30 AM to 8:59 AM | 0 (0.0%) | 0 (0.0%) |
| 9:00 AM to 9:59 AM | 0 (0.0%) | 2 (5.7%) |
| 10:00 AM to 10:59 AM | 0 (0.0%) | 0 (0.0%) |
| 11:00 AM to 11:59 AM | 0 (0.0%) | 0 (0.0%) |
| 12:00 PM to 3:59 PM | 5 (5.1%) | 3 (8.6%) |
| 4:00 PM to 11:59 PM | 38 (38.4%) | 4 (11.4%) |
| Total | 99 (100.0%) | 35 (100.0%) |
Housing Occupancy in Peavine
Occupancy by Ownership in Peavine
Of the total 111 dwellings in Peavine, owner-occupied units account for 93 (83.8%), while renter-occupied units make up 18 (16.2%).
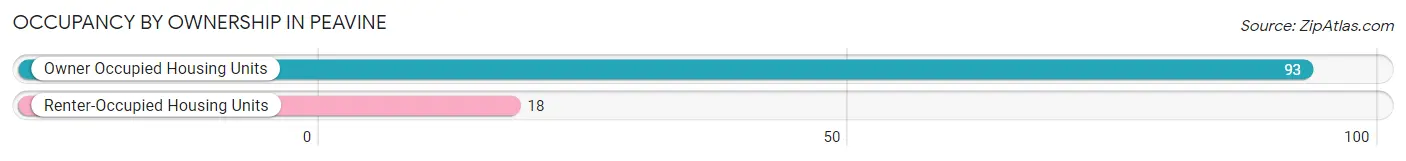
| Occupancy | # Housing Units | % Housing Units |
| Owner Occupied Housing Units | 93 | 83.8% |
| Renter-Occupied Housing Units | 18 | 16.2% |
| Total Occupied Housing Units | 111 | 100.0% |
Occupancy by Household Size in Peavine
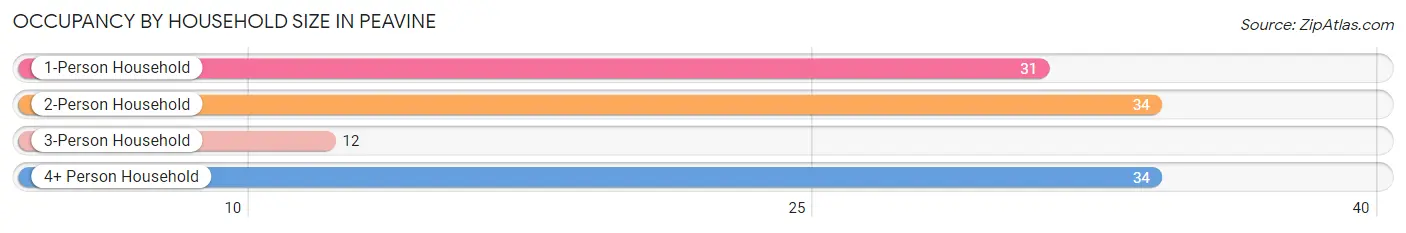
| Household Size | # Housing Units | % Housing Units |
| 1-Person Household | 31 | 27.9% |
| 2-Person Household | 34 | 30.6% |
| 3-Person Household | 12 | 10.8% |
| 4+ Person Household | 34 | 30.6% |
| Total Housing Units | 111 | 100.0% |
Occupancy by Ownership by Household Size in Peavine
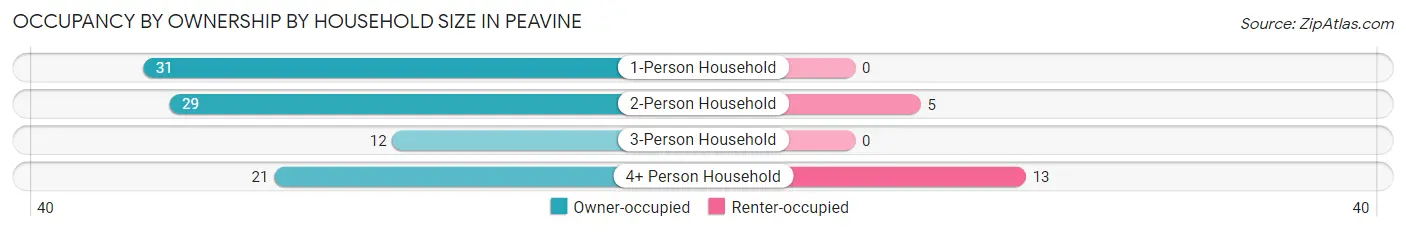
| Household Size | Owner-occupied | Renter-occupied |
| 1-Person Household | 31 (100.0%) | 0 (0.0%) |
| 2-Person Household | 29 (85.3%) | 5 (14.7%) |
| 3-Person Household | 12 (100.0%) | 0 (0.0%) |
| 4+ Person Household | 21 (61.8%) | 13 (38.2%) |
| Total Housing Units | 93 (83.8%) | 18 (16.2%) |
Occupancy by Educational Attainment in Peavine
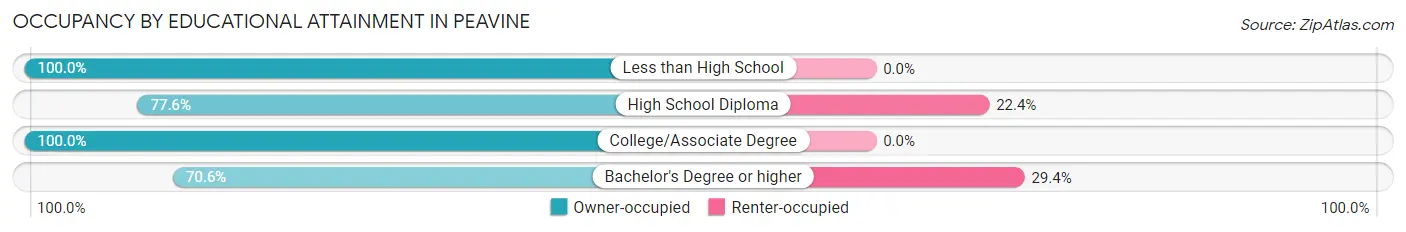
| Household Size | Owner-occupied | Renter-occupied |
| Less than High School | 14 (100.0%) | 0 (0.0%) |
| High School Diploma | 45 (77.6%) | 13 (22.4%) |
| College/Associate Degree | 22 (100.0%) | 0 (0.0%) |
| Bachelor's Degree or higher | 12 (70.6%) | 5 (29.4%) |
Occupancy by Age of Householder in Peavine
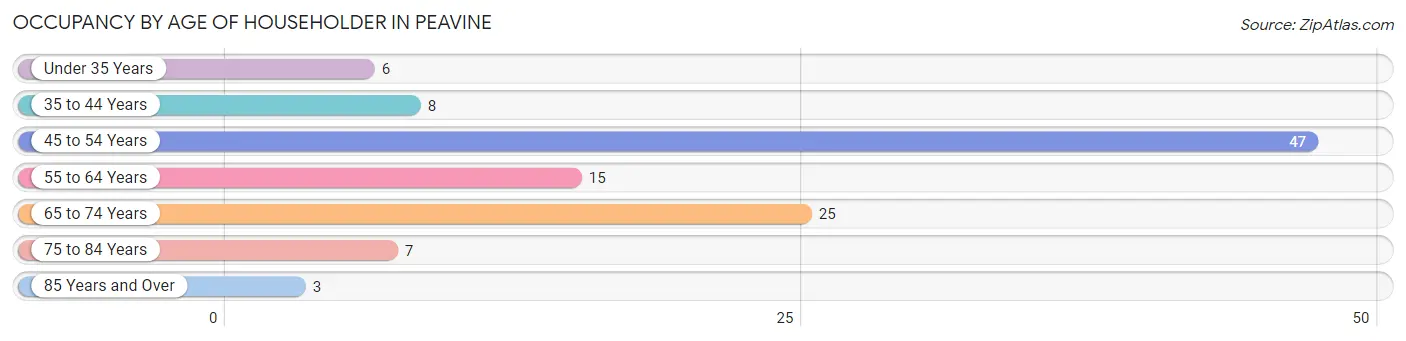
| Age Bracket | # Households | % Households |
| Under 35 Years | 6 | 5.4% |
| 35 to 44 Years | 8 | 7.2% |
| 45 to 54 Years | 47 | 42.3% |
| 55 to 64 Years | 15 | 13.5% |
| 65 to 74 Years | 25 | 22.5% |
| 75 to 84 Years | 7 | 6.3% |
| 85 Years and Over | 3 | 2.7% |
| Total | 111 | 100.0% |
Housing Finances in Peavine
Median Income by Occupancy in Peavine
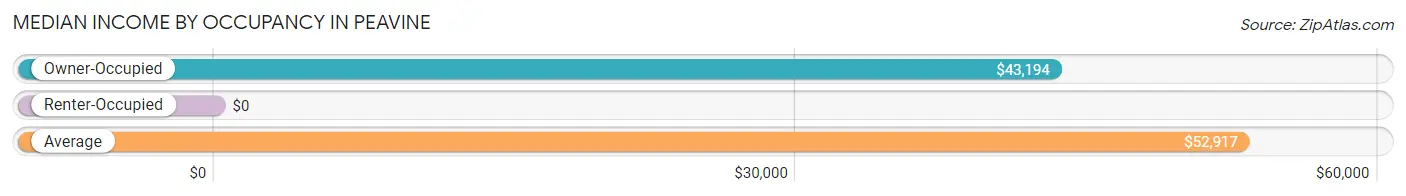
| Occupancy Type | # Households | Median Income |
| Owner-Occupied | 93 (83.8%) | $43,194 |
| Renter-Occupied | 18 (16.2%) | $0 |
| Average | 111 (100.0%) | $52,917 |
Occupancy by Householder Income Bracket in Peavine
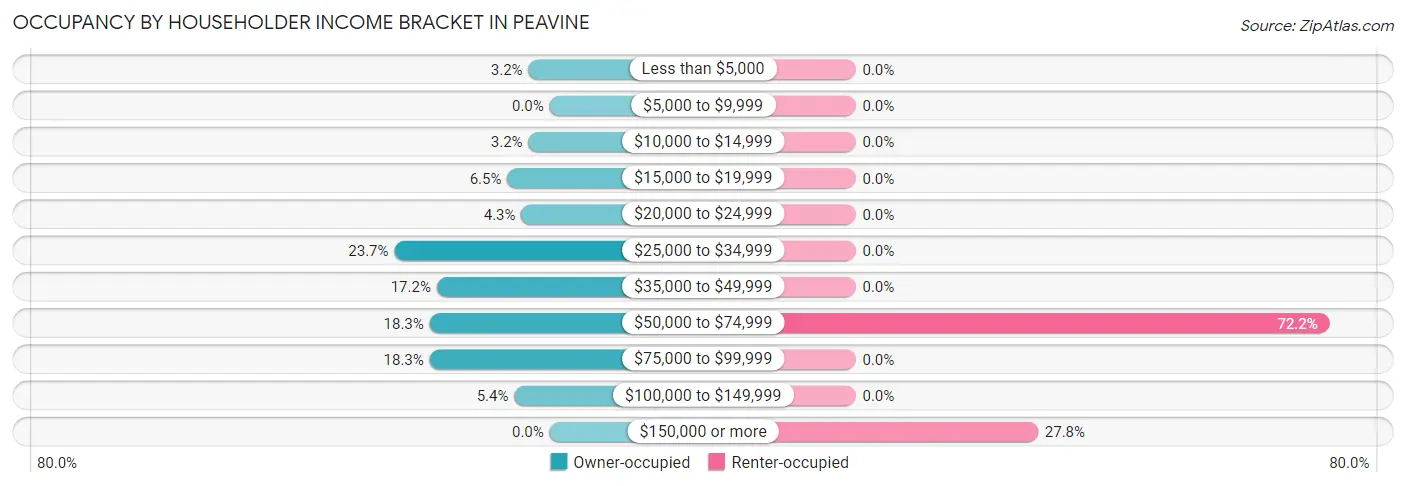
| Income Bracket | Owner-occupied | Renter-occupied |
| Less than $5,000 | 3 (3.2%) | 0 (0.0%) |
| $5,000 to $9,999 | 0 (0.0%) | 0 (0.0%) |
| $10,000 to $14,999 | 3 (3.2%) | 0 (0.0%) |
| $15,000 to $19,999 | 6 (6.5%) | 0 (0.0%) |
| $20,000 to $24,999 | 4 (4.3%) | 0 (0.0%) |
| $25,000 to $34,999 | 22 (23.7%) | 0 (0.0%) |
| $35,000 to $49,999 | 16 (17.2%) | 0 (0.0%) |
| $50,000 to $74,999 | 17 (18.3%) | 13 (72.2%) |
| $75,000 to $99,999 | 17 (18.3%) | 0 (0.0%) |
| $100,000 to $149,999 | 5 (5.4%) | 0 (0.0%) |
| $150,000 or more | 0 (0.0%) | 5 (27.8%) |
| Total | 93 (100.0%) | 18 (100.0%) |
Monthly Housing Cost Tiers in Peavine
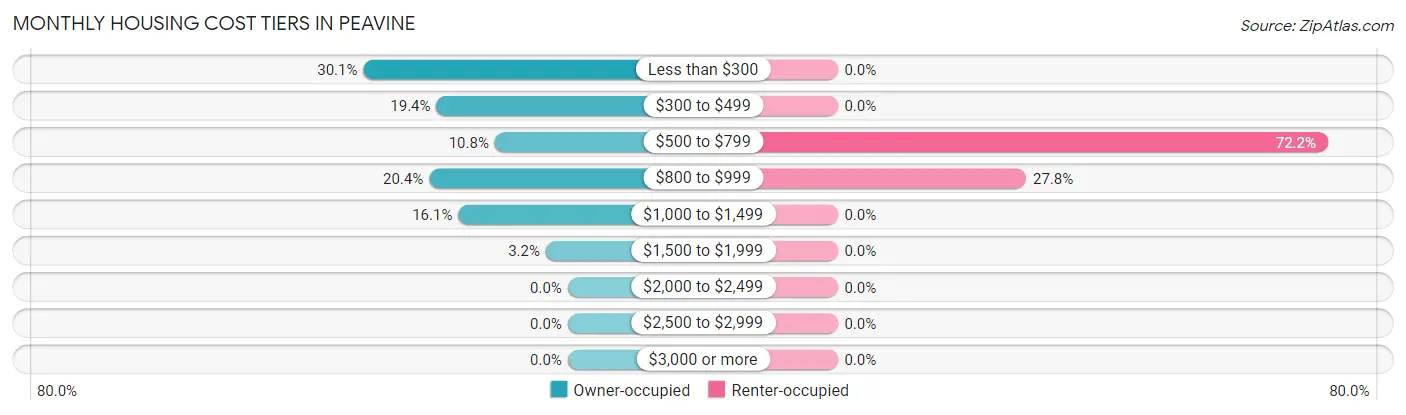
| Monthly Cost | Owner-occupied | Renter-occupied |
| Less than $300 | 28 (30.1%) | 0 (0.0%) |
| $300 to $499 | 18 (19.4%) | 0 (0.0%) |
| $500 to $799 | 10 (10.7%) | 13 (72.2%) |
| $800 to $999 | 19 (20.4%) | 5 (27.8%) |
| $1,000 to $1,499 | 15 (16.1%) | 0 (0.0%) |
| $1,500 to $1,999 | 3 (3.2%) | 0 (0.0%) |
| $2,000 to $2,499 | 0 (0.0%) | 0 (0.0%) |
| $2,500 to $2,999 | 0 (0.0%) | 0 (0.0%) |
| $3,000 or more | 0 (0.0%) | 0 (0.0%) |
| Total | 93 (100.0%) | 18 (100.0%) |
Physical Housing Characteristics in Peavine
Housing Structures in Peavine
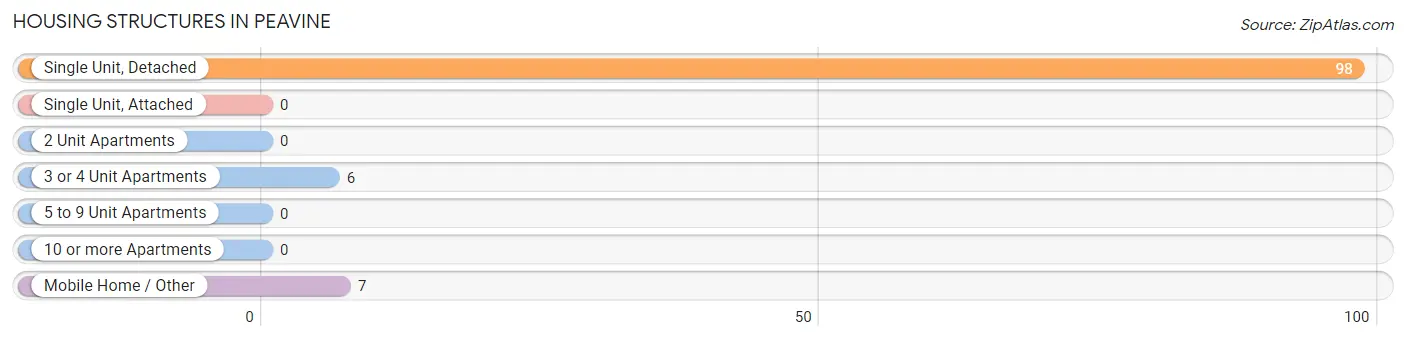
| Structure Type | # Housing Units | % Housing Units |
| Single Unit, Detached | 98 | 88.3% |
| Single Unit, Attached | 0 | 0.0% |
| 2 Unit Apartments | 0 | 0.0% |
| 3 or 4 Unit Apartments | 6 | 5.4% |
| 5 to 9 Unit Apartments | 0 | 0.0% |
| 10 or more Apartments | 0 | 0.0% |
| Mobile Home / Other | 7 | 6.3% |
| Total | 111 | 100.0% |
Housing Structures by Occupancy in Peavine
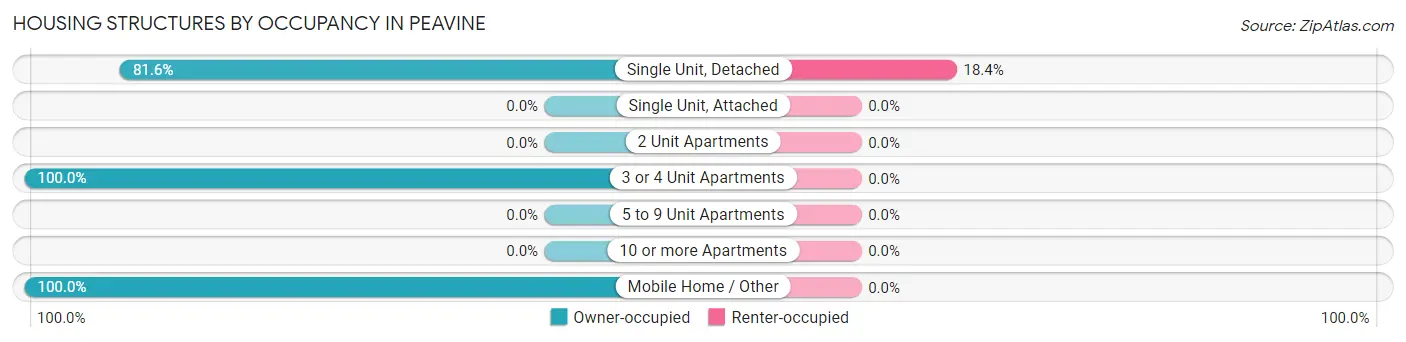
| Structure Type | Owner-occupied | Renter-occupied |
| Single Unit, Detached | 80 (81.6%) | 18 (18.4%) |
| Single Unit, Attached | 0 (0.0%) | 0 (0.0%) |
| 2 Unit Apartments | 0 (0.0%) | 0 (0.0%) |
| 3 or 4 Unit Apartments | 6 (100.0%) | 0 (0.0%) |
| 5 to 9 Unit Apartments | 0 (0.0%) | 0 (0.0%) |
| 10 or more Apartments | 0 (0.0%) | 0 (0.0%) |
| Mobile Home / Other | 7 (100.0%) | 0 (0.0%) |
| Total | 93 (83.8%) | 18 (16.2%) |
Housing Structures by Number of Rooms in Peavine
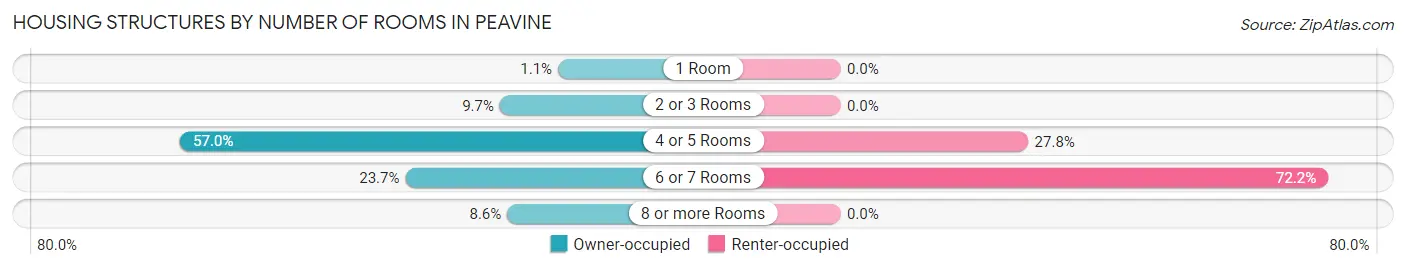
| Number of Rooms | Owner-occupied | Renter-occupied |
| 1 Room | 1 (1.1%) | 0 (0.0%) |
| 2 or 3 Rooms | 9 (9.7%) | 0 (0.0%) |
| 4 or 5 Rooms | 53 (57.0%) | 5 (27.8%) |
| 6 or 7 Rooms | 22 (23.7%) | 13 (72.2%) |
| 8 or more Rooms | 8 (8.6%) | 0 (0.0%) |
| Total | 93 (100.0%) | 18 (100.0%) |
Housing Structure by Heating Type in Peavine
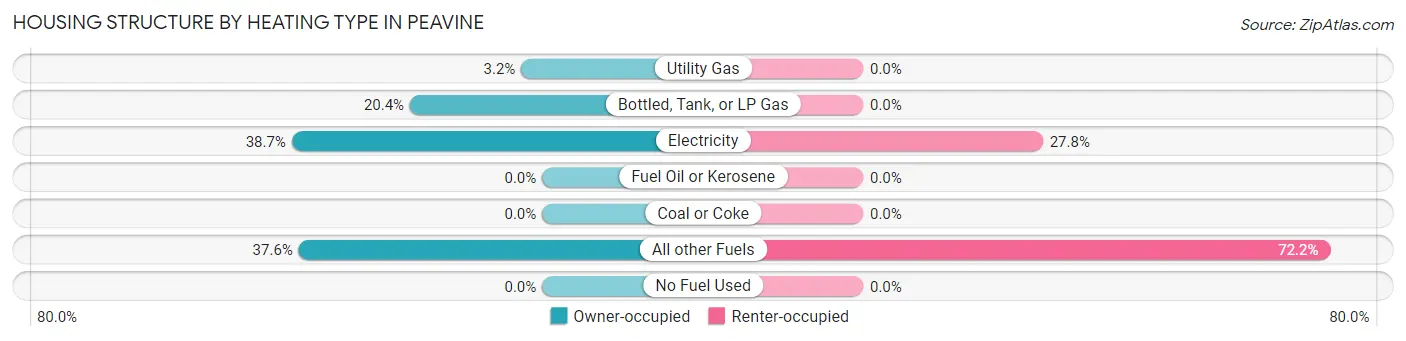
| Heating Type | Owner-occupied | Renter-occupied |
| Utility Gas | 3 (3.2%) | 0 (0.0%) |
| Bottled, Tank, or LP Gas | 19 (20.4%) | 0 (0.0%) |
| Electricity | 36 (38.7%) | 5 (27.8%) |
| Fuel Oil or Kerosene | 0 (0.0%) | 0 (0.0%) |
| Coal or Coke | 0 (0.0%) | 0 (0.0%) |
| All other Fuels | 35 (37.6%) | 13 (72.2%) |
| No Fuel Used | 0 (0.0%) | 0 (0.0%) |
| Total | 93 (100.0%) | 18 (100.0%) |
Household Vehicle Usage in Peavine
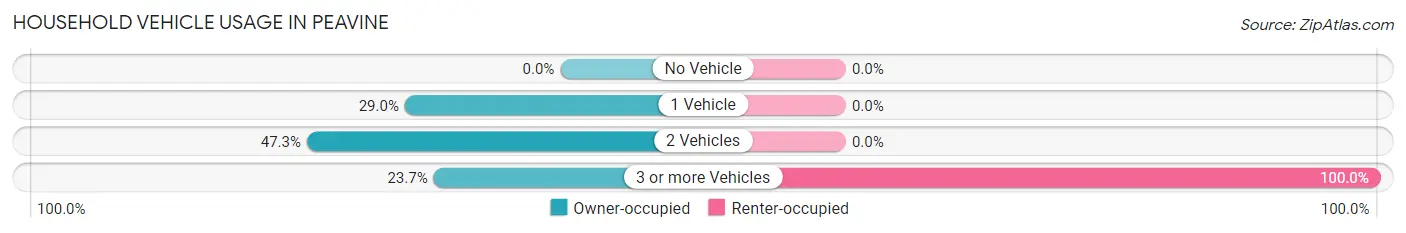
| Vehicles per Household | Owner-occupied | Renter-occupied |
| No Vehicle | 0 (0.0%) | 0 (0.0%) |
| 1 Vehicle | 27 (29.0%) | 0 (0.0%) |
| 2 Vehicles | 44 (47.3%) | 0 (0.0%) |
| 3 or more Vehicles | 22 (23.7%) | 18 (100.0%) |
| Total | 93 (100.0%) | 18 (100.0%) |
Real Estate & Mortgages in Peavine
Real Estate and Mortgage Overview in Peavine
| Characteristic | Without Mortgage | With Mortgage |
| Housing Units | 49 | 44 |
| Median Property Value | $92,100 | $120,800 |
| Median Household Income | $34,375 | $0 |
| Monthly Housing Costs | $245 | $0 |
| Real Estate Taxes | $650 | $6 |
Property Value by Mortgage Status in Peavine
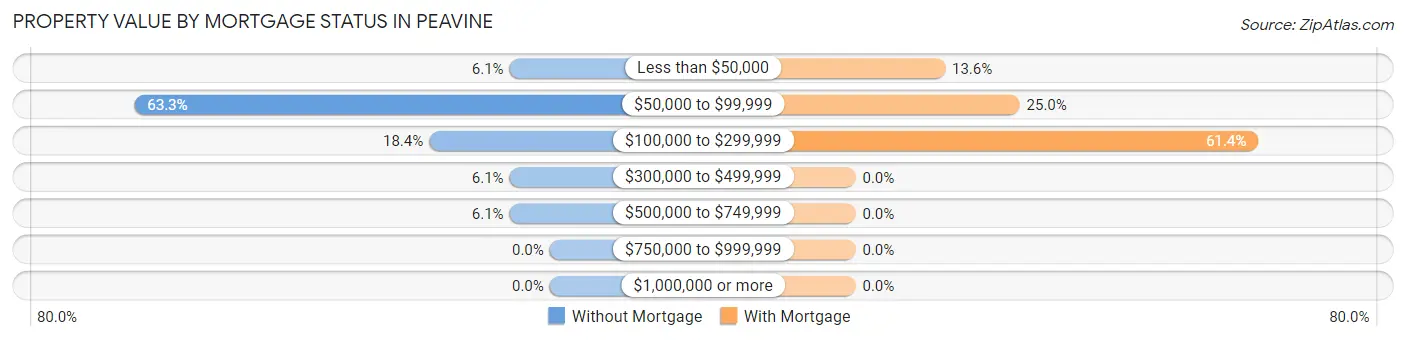
| Property Value | Without Mortgage | With Mortgage |
| Less than $50,000 | 3 (6.1%) | 6 (13.6%) |
| $50,000 to $99,999 | 31 (63.3%) | 11 (25.0%) |
| $100,000 to $299,999 | 9 (18.4%) | 27 (61.4%) |
| $300,000 to $499,999 | 3 (6.1%) | 0 (0.0%) |
| $500,000 to $749,999 | 3 (6.1%) | 0 (0.0%) |
| $750,000 to $999,999 | 0 (0.0%) | 0 (0.0%) |
| $1,000,000 or more | 0 (0.0%) | 0 (0.0%) |
| Total | 49 (100.0%) | 44 (100.0%) |
Household Income by Mortgage Status in Peavine
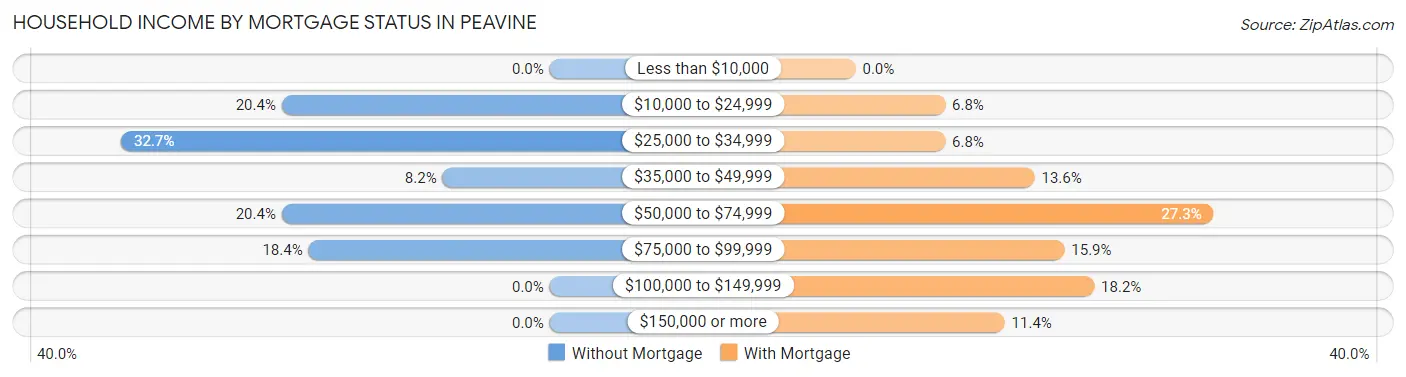
| Household Income | Without Mortgage | With Mortgage |
| Less than $10,000 | 0 (0.0%) | 0 (0.0%) |
| $10,000 to $24,999 | 10 (20.4%) | 3 (6.8%) |
| $25,000 to $34,999 | 16 (32.7%) | 3 (6.8%) |
| $35,000 to $49,999 | 4 (8.2%) | 6 (13.6%) |
| $50,000 to $74,999 | 10 (20.4%) | 12 (27.3%) |
| $75,000 to $99,999 | 9 (18.4%) | 7 (15.9%) |
| $100,000 to $149,999 | 0 (0.0%) | 8 (18.2%) |
| $150,000 or more | 0 (0.0%) | 5 (11.4%) |
| Total | 49 (100.0%) | 44 (100.0%) |
Property Value to Household Income Ratio in Peavine
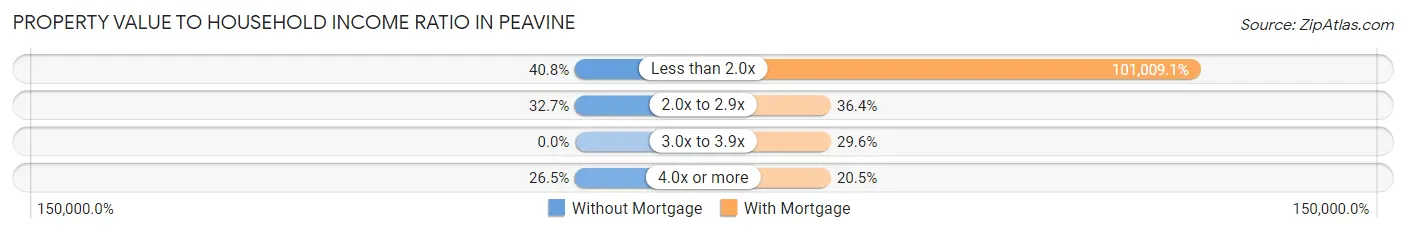
| Value-to-Income Ratio | Without Mortgage | With Mortgage |
| Less than 2.0x | 20 (40.8%) | 44,444 (101,009.1%) |
| 2.0x to 2.9x | 16 (32.7%) | 16 (36.4%) |
| 3.0x to 3.9x | 0 (0.0%) | 13 (29.5%) |
| 4.0x or more | 13 (26.5%) | 9 (20.4%) |
| Total | 49 (100.0%) | 44 (100.0%) |
Real Estate Taxes by Mortgage Status in Peavine
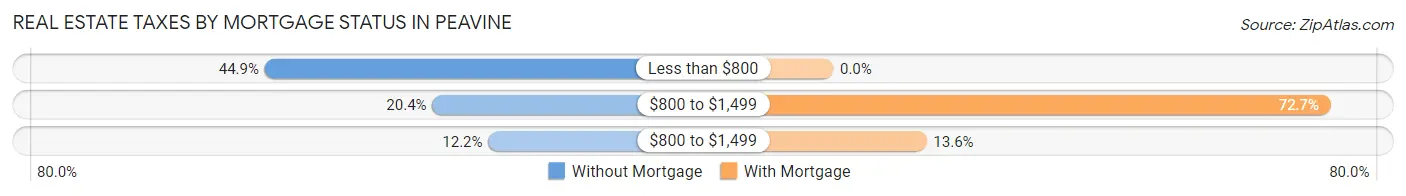
| Property Taxes | Without Mortgage | With Mortgage |
| Less than $800 | 22 (44.9%) | 0 (0.0%) |
| $800 to $1,499 | 10 (20.4%) | 32 (72.7%) |
| $800 to $1,499 | 6 (12.2%) | 6 (13.6%) |
| Total | 49 (100.0%) | 44 (100.0%) |
Health & Disability in Peavine
Health Insurance Coverage by Age in Peavine

| Age Bracket | With Coverage | Without Coverage |
| Under 6 Years | 10 (100.0%) | 0 (0.0%) |
| 6 to 18 Years | 59 (89.4%) | 7 (10.6%) |
| 19 to 25 Years | 16 (59.3%) | 11 (40.7%) |
| 26 to 34 Years | 21 (63.6%) | 12 (36.4%) |
| 35 to 44 Years | 26 (83.9%) | 5 (16.1%) |
| 45 to 54 Years | 37 (60.7%) | 24 (39.3%) |
| 55 to 64 Years | 14 (48.3%) | 15 (51.7%) |
| 65 to 74 Years | 48 (100.0%) | 0 (0.0%) |
| 75 Years and older | 13 (100.0%) | 0 (0.0%) |
| Total | 244 (76.7%) | 74 (23.3%) |
Health Insurance Coverage by Citizenship Status in Peavine
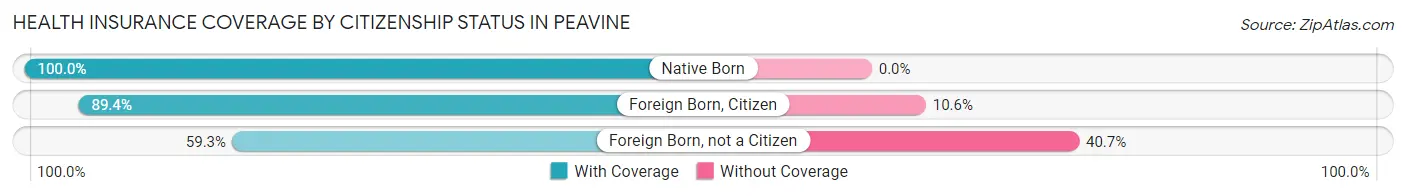
| Citizenship Status | With Coverage | Without Coverage |
| Native Born | 10 (100.0%) | 0 (0.0%) |
| Foreign Born, Citizen | 59 (89.4%) | 7 (10.6%) |
| Foreign Born, not a Citizen | 16 (59.3%) | 11 (40.7%) |
Health Insurance Coverage by Household Income in Peavine
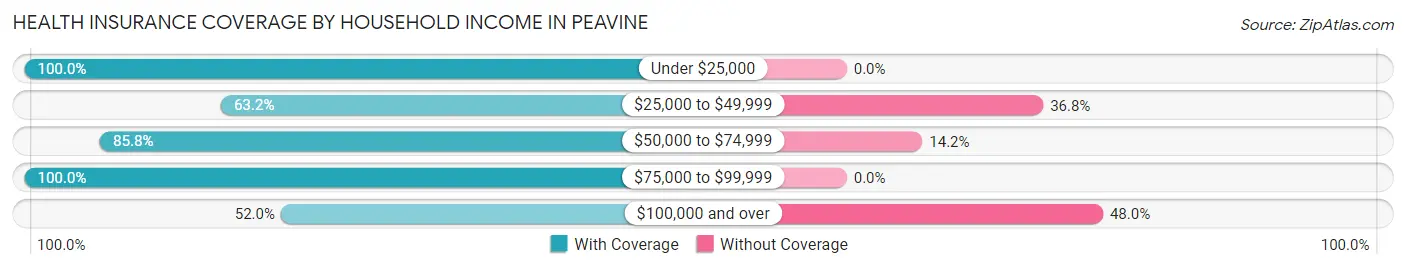
| Household Income | With Coverage | Without Coverage |
| Under $25,000 | 20 (100.0%) | 0 (0.0%) |
| $25,000 to $49,999 | 79 (63.2%) | 46 (36.8%) |
| $50,000 to $74,999 | 97 (85.8%) | 16 (14.2%) |
| $75,000 to $99,999 | 35 (100.0%) | 0 (0.0%) |
| $100,000 and over | 13 (52.0%) | 12 (48.0%) |
Public vs Private Health Insurance Coverage by Age in Peavine
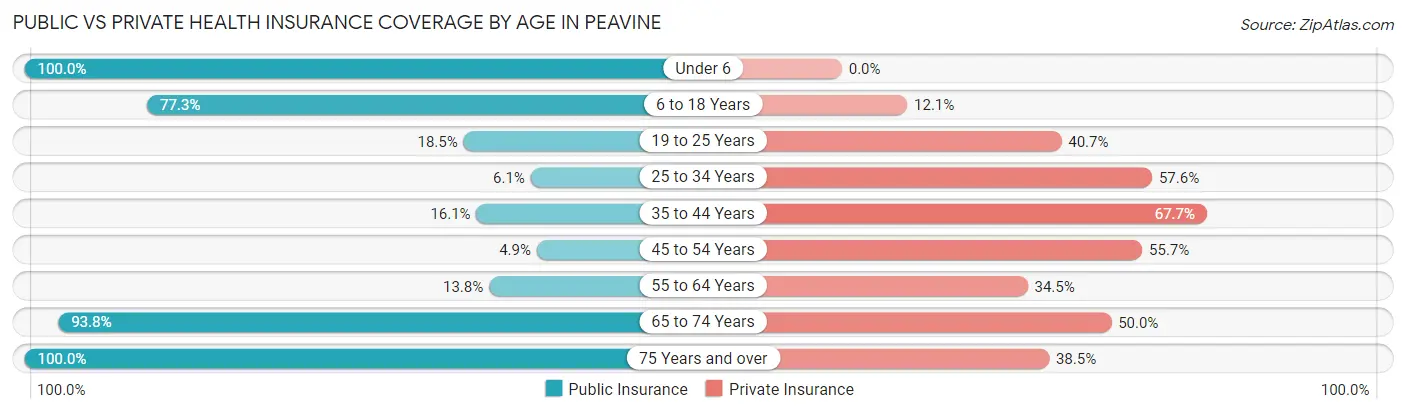
| Age Bracket | Public Insurance | Private Insurance |
| Under 6 | 10 (100.0%) | 0 (0.0%) |
| 6 to 18 Years | 51 (77.3%) | 8 (12.1%) |
| 19 to 25 Years | 5 (18.5%) | 11 (40.7%) |
| 25 to 34 Years | 2 (6.1%) | 19 (57.6%) |
| 35 to 44 Years | 5 (16.1%) | 21 (67.7%) |
| 45 to 54 Years | 3 (4.9%) | 34 (55.7%) |
| 55 to 64 Years | 4 (13.8%) | 10 (34.5%) |
| 65 to 74 Years | 45 (93.8%) | 24 (50.0%) |
| 75 Years and over | 13 (100.0%) | 5 (38.5%) |
| Total | 138 (43.4%) | 132 (41.5%) |
Disability Status by Sex by Age in Peavine
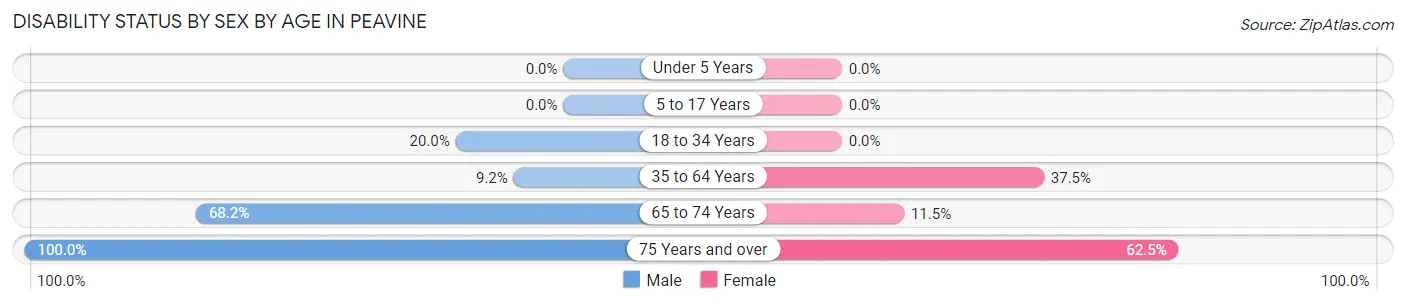
| Age Bracket | Male | Female |
| Under 5 Years | 0 (0.0%) | 0 (0.0%) |
| 5 to 17 Years | 0 (0.0%) | 0 (0.0%) |
| 18 to 34 Years | 9 (20.0%) | 0 (0.0%) |
| 35 to 64 Years | 6 (9.2%) | 21 (37.5%) |
| 65 to 74 Years | 15 (68.2%) | 3 (11.5%) |
| 75 Years and over | 5 (100.0%) | 5 (62.5%) |
Disability Class by Sex by Age in Peavine
Disability Class: Hearing Difficulty
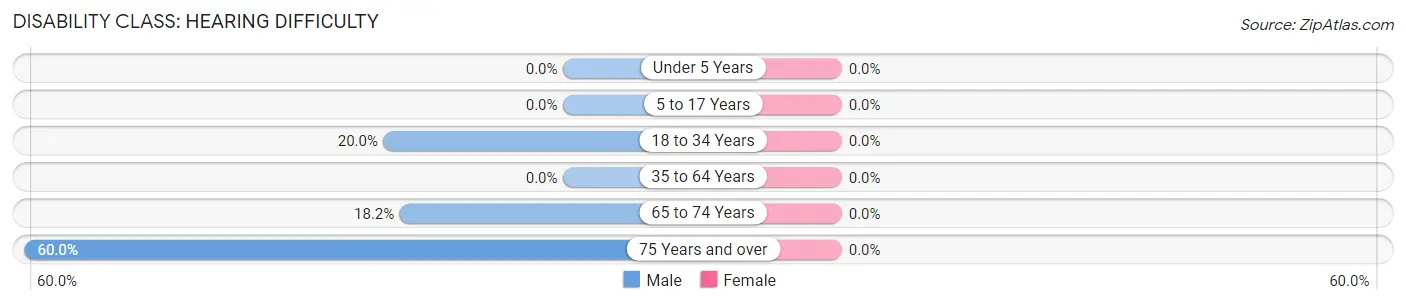
| Age Bracket | Male | Female |
| Under 5 Years | 0 (0.0%) | 0 (0.0%) |
| 5 to 17 Years | 0 (0.0%) | 0 (0.0%) |
| 18 to 34 Years | 9 (20.0%) | 0 (0.0%) |
| 35 to 64 Years | 0 (0.0%) | 0 (0.0%) |
| 65 to 74 Years | 4 (18.2%) | 0 (0.0%) |
| 75 Years and over | 3 (60.0%) | 0 (0.0%) |
Disability Class: Vision Difficulty
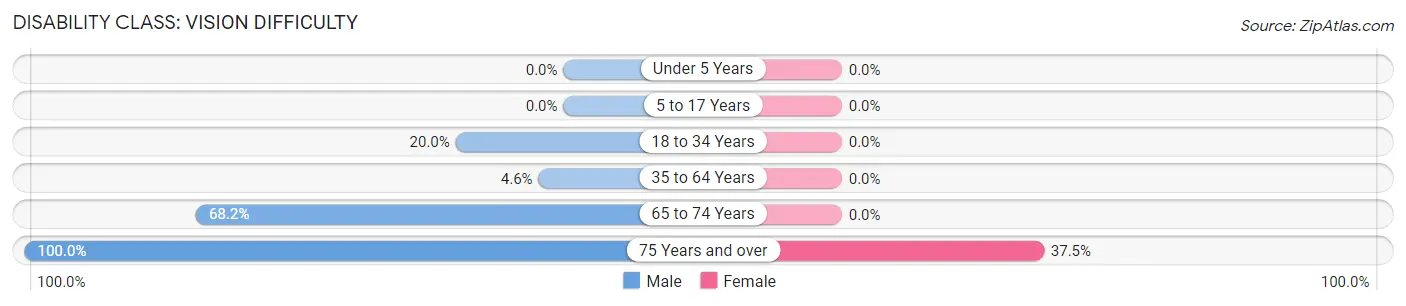
| Age Bracket | Male | Female |
| Under 5 Years | 0 (0.0%) | 0 (0.0%) |
| 5 to 17 Years | 0 (0.0%) | 0 (0.0%) |
| 18 to 34 Years | 9 (20.0%) | 0 (0.0%) |
| 35 to 64 Years | 3 (4.6%) | 0 (0.0%) |
| 65 to 74 Years | 15 (68.2%) | 0 (0.0%) |
| 75 Years and over | 5 (100.0%) | 3 (37.5%) |
Disability Class: Cognitive Difficulty
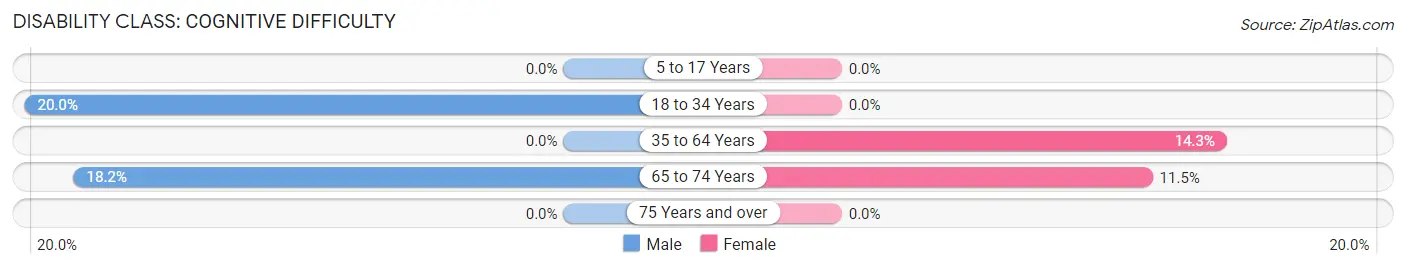
| Age Bracket | Male | Female |
| 5 to 17 Years | 0 (0.0%) | 0 (0.0%) |
| 18 to 34 Years | 9 (20.0%) | 0 (0.0%) |
| 35 to 64 Years | 0 (0.0%) | 8 (14.3%) |
| 65 to 74 Years | 4 (18.2%) | 3 (11.5%) |
| 75 Years and over | 0 (0.0%) | 0 (0.0%) |
Disability Class: Ambulatory Difficulty
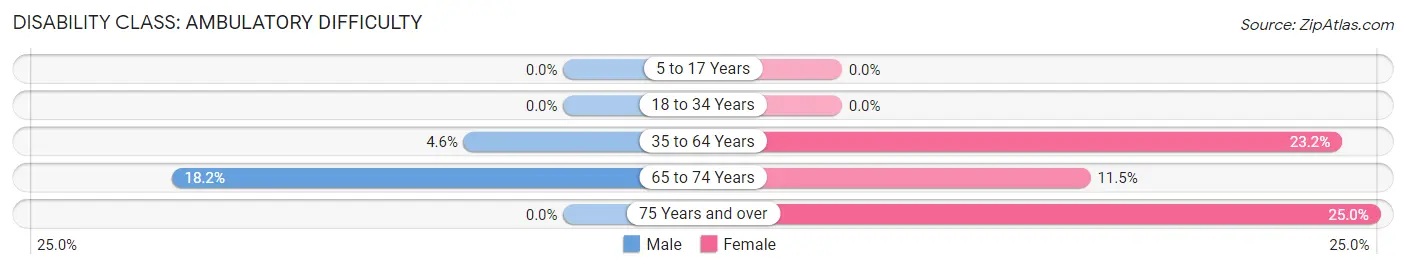
| Age Bracket | Male | Female |
| 5 to 17 Years | 0 (0.0%) | 0 (0.0%) |
| 18 to 34 Years | 0 (0.0%) | 0 (0.0%) |
| 35 to 64 Years | 3 (4.6%) | 13 (23.2%) |
| 65 to 74 Years | 4 (18.2%) | 3 (11.5%) |
| 75 Years and over | 0 (0.0%) | 2 (25.0%) |
Disability Class: Self-Care Difficulty
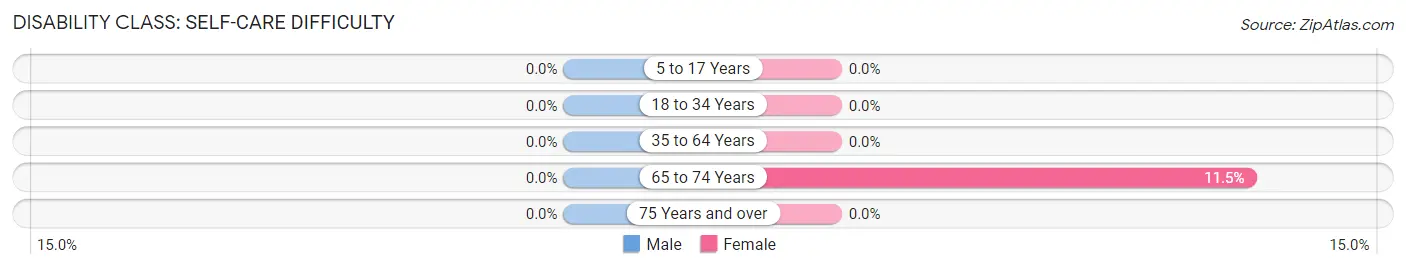
| Age Bracket | Male | Female |
| 5 to 17 Years | 0 (0.0%) | 0 (0.0%) |
| 18 to 34 Years | 0 (0.0%) | 0 (0.0%) |
| 35 to 64 Years | 0 (0.0%) | 0 (0.0%) |
| 65 to 74 Years | 0 (0.0%) | 3 (11.5%) |
| 75 Years and over | 0 (0.0%) | 0 (0.0%) |
Technology Access in Peavine
Computing Device Access in Peavine
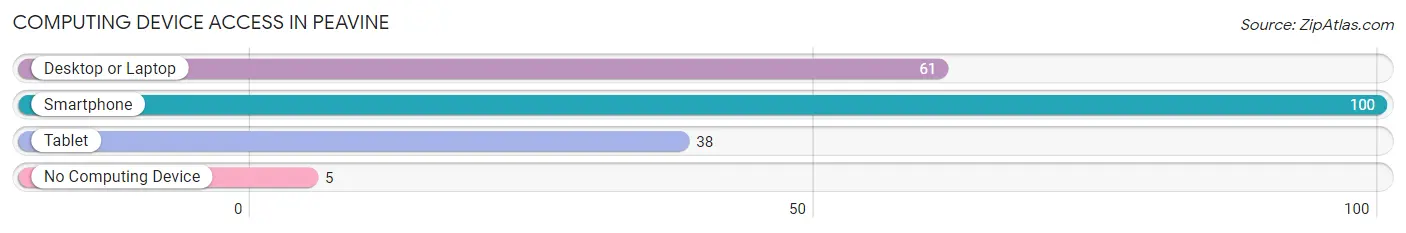
| Device Type | # Households | % Households |
| Desktop or Laptop | 61 | 54.9% |
| Smartphone | 100 | 90.1% |
| Tablet | 38 | 34.2% |
| No Computing Device | 5 | 4.5% |
| Total | 111 | 100.0% |
Internet Access in Peavine
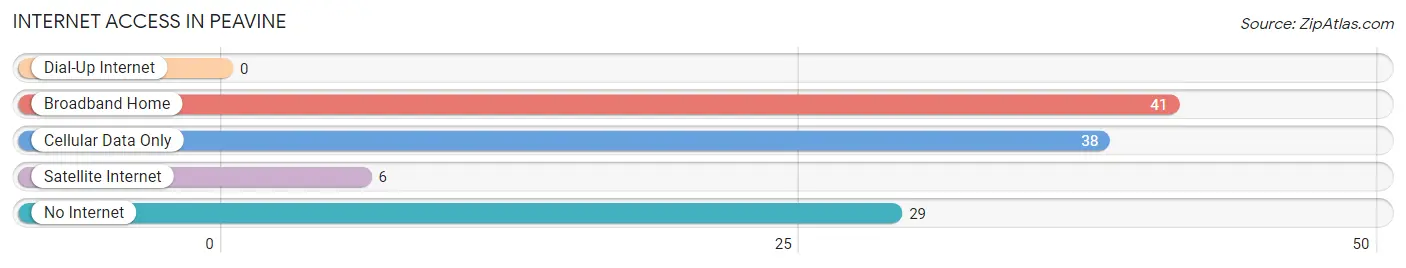
| Internet Type | # Households | % Households |
| Dial-Up Internet | 0 | 0.0% |
| Broadband Home | 41 | 36.9% |
| Cellular Data Only | 38 | 34.2% |
| Satellite Internet | 6 | 5.4% |
| No Internet | 29 | 26.1% |
| Total | 111 | 100.0% |
Peavine Summary
Peavine, Oklahoma is a small unincorporated community located in the southeastern corner of the state. It is situated in the foothills of the Ouachita Mountains, approximately 20 miles south of the Arkansas border. The town is home to a population of just over 200 people, and is known for its rural charm and friendly atmosphere.
History
Peavine was first settled in the late 1800s by a group of settlers from Arkansas. The town was originally known as “Pea Ridge”, but the name was changed to Peavine in the early 1900s. The town was officially incorporated in 1910, and the first post office was established in 1911.
The town was originally a farming community, and the main crops grown were cotton, corn, and wheat. The town also had a small sawmill, which provided lumber for the local area.
In the early 1900s, the town began to experience a period of growth. The population increased from just over 100 in 1910 to nearly 500 by 1920. This growth was largely due to the discovery of oil in the area. The oil boom brought in new businesses and jobs, and the town’s population continued to grow throughout the 1920s and 1930s.
Geography
Peavine is located in the southeastern corner of Oklahoma, in the foothills of the Ouachita Mountains. The town is situated on the banks of the Little River, which flows through the area. The town is surrounded by rolling hills and lush forests, and is home to a variety of wildlife.
The climate in Peavine is generally mild, with hot summers and cool winters. The average annual temperature is around 65 degrees Fahrenheit, and the average annual precipitation is around 40 inches.
Economy
The economy of Peavine is largely based on agriculture and tourism. The town is home to several small farms, which produce a variety of crops, including cotton, corn, and wheat. The town also has a small sawmill, which provides lumber for the local area.
In recent years, the town has become a popular tourist destination. The town is home to several historic sites, including the Peavine Museum and the Peavine Cemetery. The town also has several outdoor recreation areas, including hiking trails, fishing spots, and camping sites.
Demographics
As of the 2010 census, the population of Peavine was 203. The racial makeup of the town was 97.5% White, 0.5% African American, 0.5% Native American, 0.5% Asian, and 1% from other races. The median household income was $31,250, and the median age was 44.
Conclusion
Peavine, Oklahoma is a small unincorporated community located in the southeastern corner of the state. It is situated in the foothills of the Ouachita Mountains, and is home to a population of just over 200 people. The town is known for its rural charm and friendly atmosphere, and is a popular tourist destination. The economy of Peavine is largely based on agriculture and tourism, and the town is home to several small farms and historic sites. The population of Peavine is 97.5% White, 0.5% African American, 0.5% Native American, 0.5% Asian, and 1% from other races. The median household income is $31,250, and the median age is 44.
Common Questions
What is Per Capita Income in Peavine?
Per Capita income in Peavine is $21,354.
What is the Median Family Income in Peavine?
Median Family Income in Peavine is $62,692.
What is the Median Household income in Peavine?
Median Household Income in Peavine is $52,917.
What is Income or Wage Gap in Peavine?
Income or Wage Gap in Peavine is 11.1%.
Women in Peavine earn 88.9 cents for every dollar earned by a man.
What is Inequality or Gini Index in Peavine?
Inequality or Gini Index in Peavine is 0.34.
What is the Total Population of Peavine?
Total Population of Peavine is 318.
What is the Total Male Population of Peavine?
Total Male Population of Peavine is 189.
What is the Total Female Population of Peavine?
Total Female Population of Peavine is 129.
What is the Ratio of Males per 100 Females in Peavine?
There are 146.51 Males per 100 Females in Peavine.
What is the Ratio of Females per 100 Males in Peavine?
There are 68.25 Females per 100 Males in Peavine.
What is the Median Population Age in Peavine?
Median Population Age in Peavine is 43.3 Years.
What is the Average Family Size in Peavine
Average Family Size in Peavine is 3.7 People.
What is the Average Household Size in Peavine
Average Household Size in Peavine is 2.9 People.
How Large is the Labor Force in Peavine?
There are 140 People in the Labor Forcein in Peavine.
What is the Percentage of People in the Labor Force in Peavine?
54.3% of People are in the Labor Force in Peavine.
What is the Unemployment Rate in Peavine?
Unemployment Rate in Peavine is 2.1%.