Zip Codes with the Highest Percentage of Population Employed in Food Preparation & Serving in Ponca City, OK
RELATED REPORTS & OPTIONS
Food Preparation & Serving
Ponca City
Compare Zip Codes
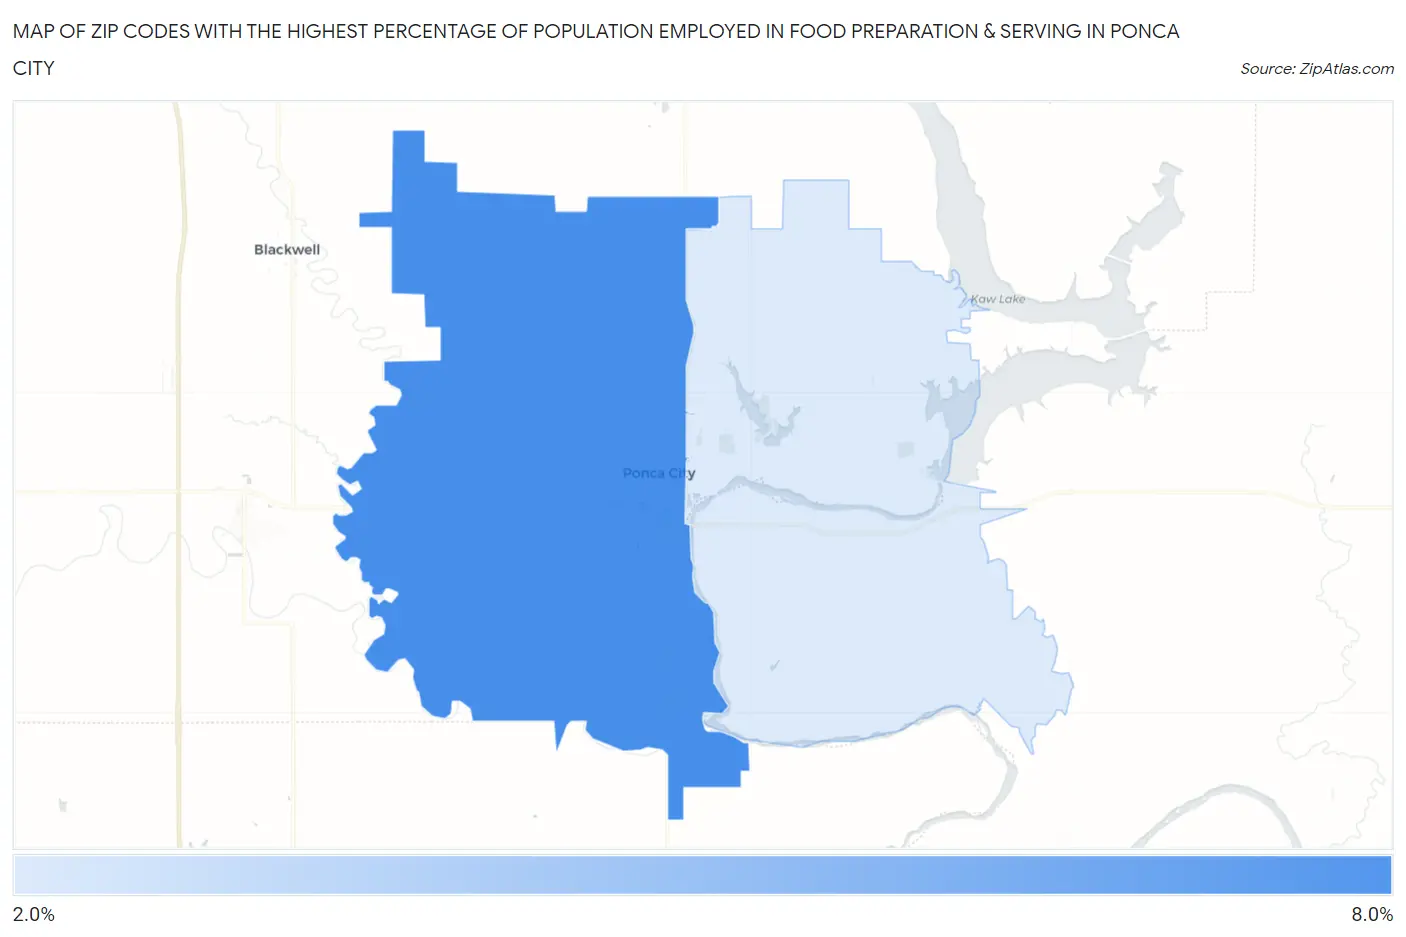
Map of Zip Codes with the Highest Percentage of Population Employed in Food Preparation & Serving in Ponca City
2.7%
6.9%
Zip Codes with the Highest Percentage of Population Employed in Food Preparation & Serving in Ponca City, OK
| Zip Code | % Employed | vs State | vs National | |
| 1. | 74601 | 6.9% | 5.6%(+1.29)#155 | 5.3%(+1.60)#6,854 |
| 2. | 74604 | 2.7% | 5.6%(-2.92)#474 | 5.3%(-2.61)#22,511 |
1
Common Questions
What are the Top Zip Codes with the Highest Percentage of Population Employed in Food Preparation & Serving in Ponca City, OK?
Top Zip Codes with the Highest Percentage of Population Employed in Food Preparation & Serving in Ponca City, OK are:
What zip code has the Highest Percentage of Population Employed in Food Preparation & Serving in Ponca City, OK?
74601 has the Highest Percentage of Population Employed in Food Preparation & Serving in Ponca City, OK with 6.9%.
What is the Percentage of Population Employed in Food Preparation & Serving in Ponca City, OK?
Percentage of Population Employed in Food Preparation & Serving in Ponca City is 6.0%.
What is the Percentage of Population Employed in Food Preparation & Serving in Oklahoma?
Percentage of Population Employed in Food Preparation & Serving in Oklahoma is 5.6%.
What is the Percentage of Population Employed in Food Preparation & Serving in the United States?
Percentage of Population Employed in Food Preparation & Serving in the United States is 5.3%.