Zip Codes with the Highest Percentage of Population Employed in Food Preparation & Serving in Claremore, OK
RELATED REPORTS & OPTIONS
Food Preparation & Serving
Claremore
Compare Zip Codes
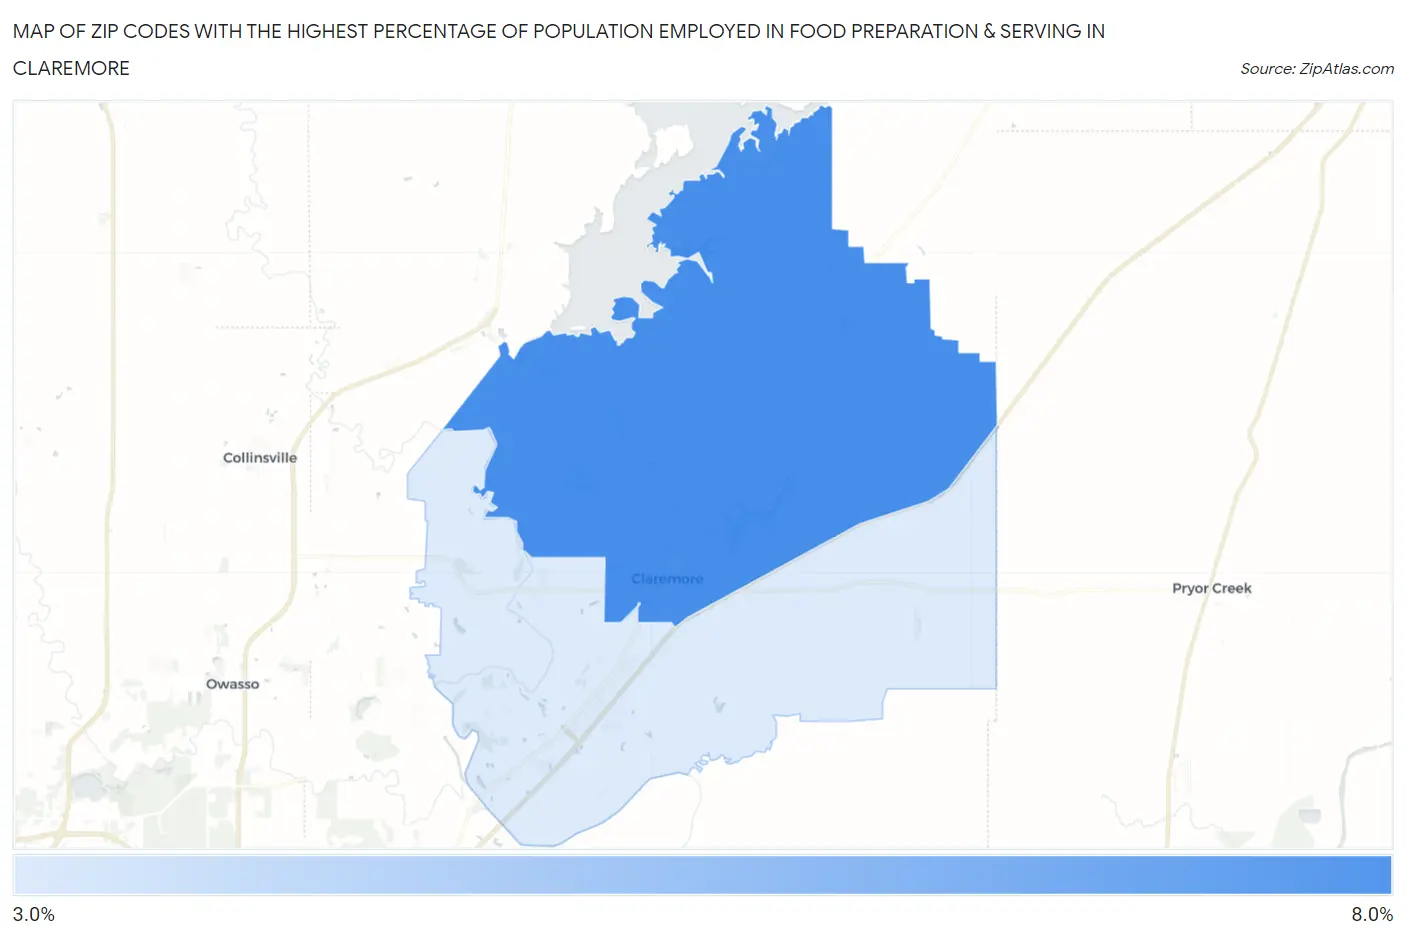
Map of Zip Codes with the Highest Percentage of Population Employed in Food Preparation & Serving in Claremore
3.2%
6.4%
Zip Codes with the Highest Percentage of Population Employed in Food Preparation & Serving in Claremore, OK
| Zip Code | % Employed | vs State | vs National | |
| 1. | 74017 | 6.4% | 5.6%(+0.798)#178 | 5.3%(+1.11)#8,157 |
| 2. | 74019 | 3.2% | 5.6%(-2.36)#423 | 5.3%(-2.05)#20,362 |
1
Common Questions
What are the Top Zip Codes with the Highest Percentage of Population Employed in Food Preparation & Serving in Claremore, OK?
Top Zip Codes with the Highest Percentage of Population Employed in Food Preparation & Serving in Claremore, OK are:
What zip code has the Highest Percentage of Population Employed in Food Preparation & Serving in Claremore, OK?
74017 has the Highest Percentage of Population Employed in Food Preparation & Serving in Claremore, OK with 6.4%.
What is the Percentage of Population Employed in Food Preparation & Serving in Claremore, OK?
Percentage of Population Employed in Food Preparation & Serving in Claremore is 7.1%.
What is the Percentage of Population Employed in Food Preparation & Serving in Oklahoma?
Percentage of Population Employed in Food Preparation & Serving in Oklahoma is 5.6%.
What is the Percentage of Population Employed in Food Preparation & Serving in the United States?
Percentage of Population Employed in Food Preparation & Serving in the United States is 5.3%.