Cedar Crest, OK Map & Demographics
Cedar Crest Map
Cedar Crest Overview
$22,843
PER CAPITA INCOME
$73,438
AVG FAMILY INCOME
$41,500
AVG HOUSEHOLD INCOME
27.2%
WAGE / INCOME GAP [ % ]
72.8¢/ $1
WAGE / INCOME GAP [ $ ]
0.36
INEQUALITY / GINI INDEX
257
TOTAL POPULATION
134
MALE POPULATION
123
FEMALE POPULATION
108.94
MALES / 100 FEMALES
91.79
FEMALES / 100 MALES
49.6
MEDIAN AGE
3.0
AVG FAMILY SIZE
2.2
AVG HOUSEHOLD SIZE
104
LABOR FORCE [ PEOPLE ]
46.6%
PERCENT IN LABOR FORCE
Income in Cedar Crest
Income Overview in Cedar Crest
Per Capita Income in Cedar Crest is $22,843, while median incomes of families and households are $73,438 and $41,500 respectively.
| Characteristic | Number | Measure |
| Per Capita Income | 257 | $22,843 |
| Median Family Income | 61 | $73,438 |
| Mean Family Income | 61 | $62,310 |
| Median Household Income | 118 | $41,500 |
| Mean Household Income | 118 | $47,103 |
| Income Deficit | 61 | $0 |
| Wage / Income Gap (%) | 257 | 27.19% |
| Wage / Income Gap ($) | 257 | 72.81¢ per $1 |
| Gini / Inequality Index | 257 | 0.36 |
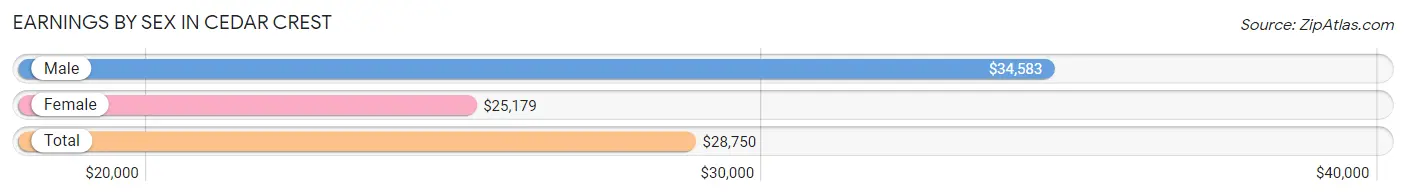
Earnings by Sex in Cedar Crest
Average Earnings in Cedar Crest are $28,750, $34,583 for men and $25,179 for women, a difference of 27.2%.
| Sex | Number | Average Earnings |
| Male | 41 (39.4%) | $34,583 |
| Female | 63 (60.6%) | $25,179 |
| Total | 104 (100.0%) | $28,750 |
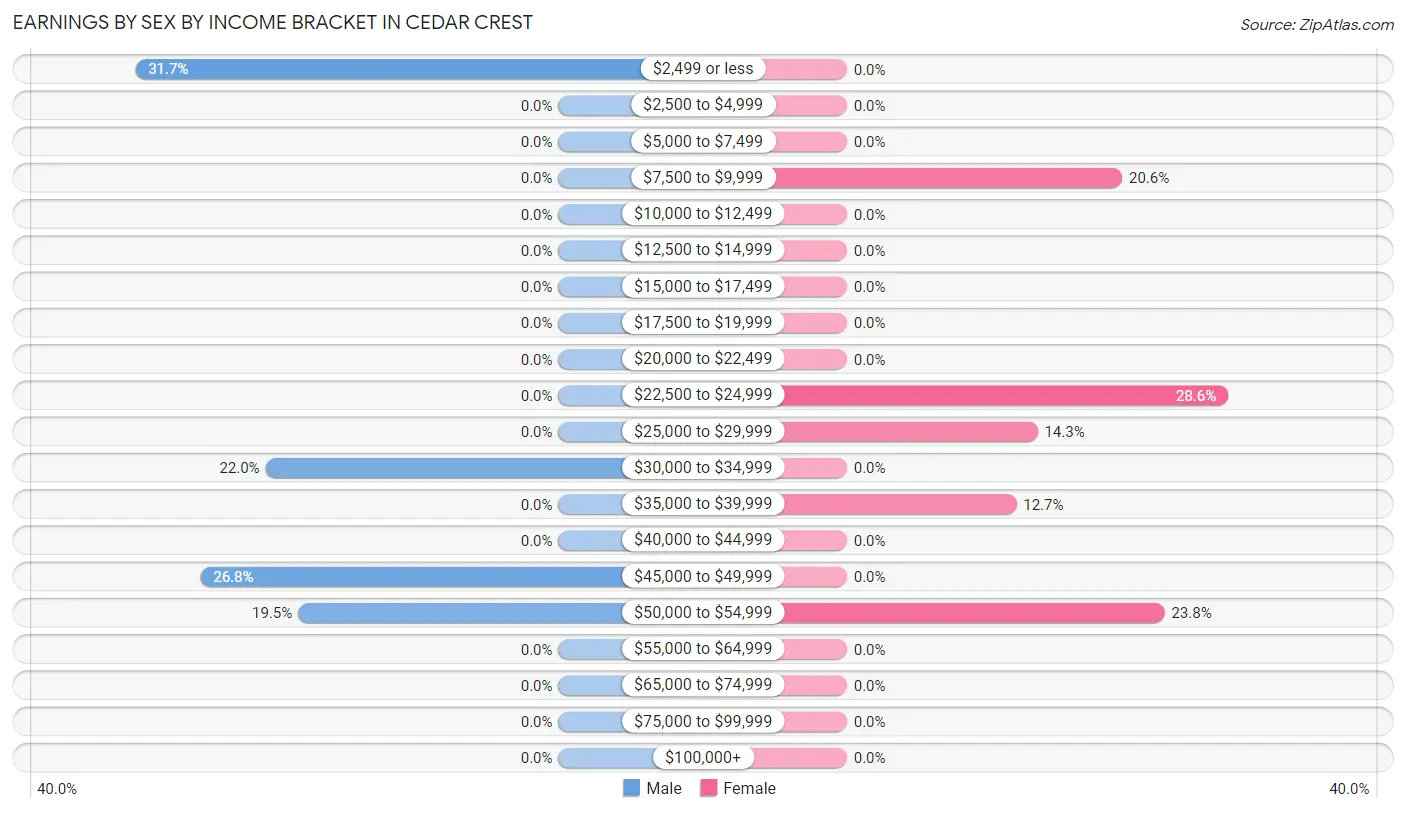
Earnings by Sex by Income Bracket in Cedar Crest
The most common earnings brackets in Cedar Crest are $2,499 or less for men (13 | 31.7%) and $22,500 to $24,999 for women (18 | 28.6%).
| Income | Male | Female |
| $2,499 or less | 13 (31.7%) | 0 (0.0%) |
| $2,500 to $4,999 | 0 (0.0%) | 0 (0.0%) |
| $5,000 to $7,499 | 0 (0.0%) | 0 (0.0%) |
| $7,500 to $9,999 | 0 (0.0%) | 13 (20.6%) |
| $10,000 to $12,499 | 0 (0.0%) | 0 (0.0%) |
| $12,500 to $14,999 | 0 (0.0%) | 0 (0.0%) |
| $15,000 to $17,499 | 0 (0.0%) | 0 (0.0%) |
| $17,500 to $19,999 | 0 (0.0%) | 0 (0.0%) |
| $20,000 to $22,499 | 0 (0.0%) | 0 (0.0%) |
| $22,500 to $24,999 | 0 (0.0%) | 18 (28.6%) |
| $25,000 to $29,999 | 0 (0.0%) | 9 (14.3%) |
| $30,000 to $34,999 | 9 (22.0%) | 0 (0.0%) |
| $35,000 to $39,999 | 0 (0.0%) | 8 (12.7%) |
| $40,000 to $44,999 | 0 (0.0%) | 0 (0.0%) |
| $45,000 to $49,999 | 11 (26.8%) | 0 (0.0%) |
| $50,000 to $54,999 | 8 (19.5%) | 15 (23.8%) |
| $55,000 to $64,999 | 0 (0.0%) | 0 (0.0%) |
| $65,000 to $74,999 | 0 (0.0%) | 0 (0.0%) |
| $75,000 to $99,999 | 0 (0.0%) | 0 (0.0%) |
| $100,000+ | 0 (0.0%) | 0 (0.0%) |
| Total | 41 (100.0%) | 63 (100.0%) |
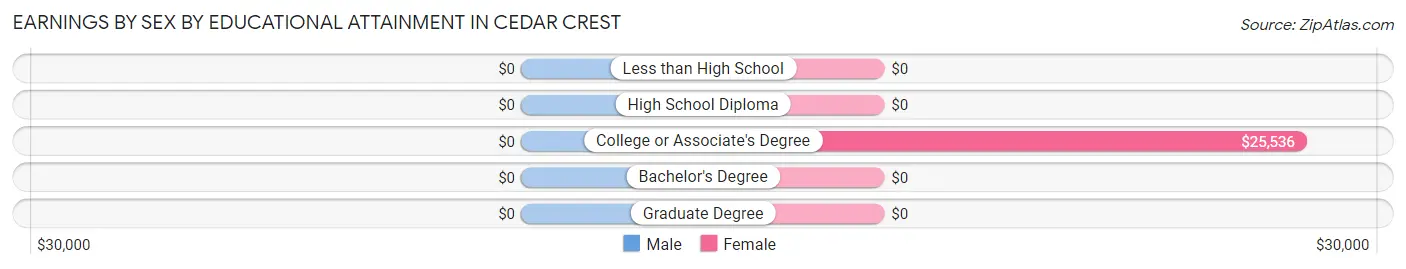
Earnings by Sex by Educational Attainment in Cedar Crest
| Educational Attainment | Male Income | Female Income |
| Less than High School | - | - |
| High School Diploma | - | - |
| College or Associate's Degree | - | - |
| Bachelor's Degree | - | - |
| Graduate Degree | - | - |
| Total | - | - |
Family Income in Cedar Crest
Family Income Brackets in Cedar Crest
According to the Cedar Crest family income data, there are 16 families falling into the $75,000 to $99,999 income range, which is the most common income bracket and makes up 26.2% of all families.
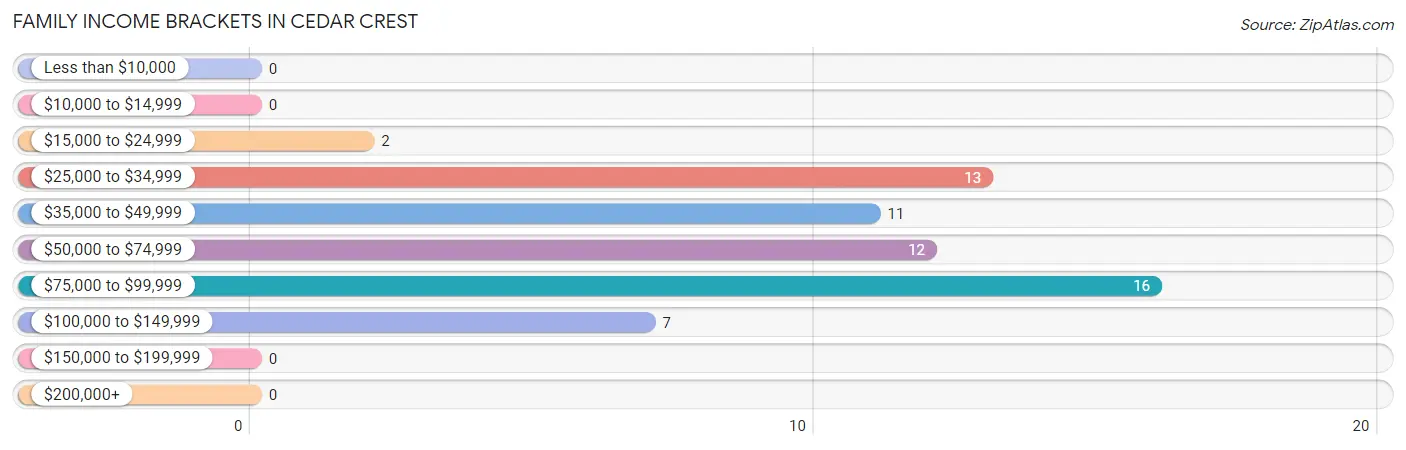
| Income Bracket | # Families | % Families |
| Less than $10,000 | 0 | 0.0% |
| $10,000 to $14,999 | 0 | 0.0% |
| $15,000 to $24,999 | 2 | 3.3% |
| $25,000 to $34,999 | 13 | 21.3% |
| $35,000 to $49,999 | 11 | 18.0% |
| $50,000 to $74,999 | 12 | 19.7% |
| $75,000 to $99,999 | 16 | 26.2% |
| $100,000 to $149,999 | 7 | 11.5% |
| $150,000 to $199,999 | 0 | 0.0% |
| $200,000+ | 0 | 0.0% |
Family Income by Famaliy Size in Cedar Crest
3-person families (29 | 47.5%) account for the highest median family income in Cedar Crest with $92,656 per family, while 3-person families (29 | 47.5%) have the highest median income of $30,885 per family member.
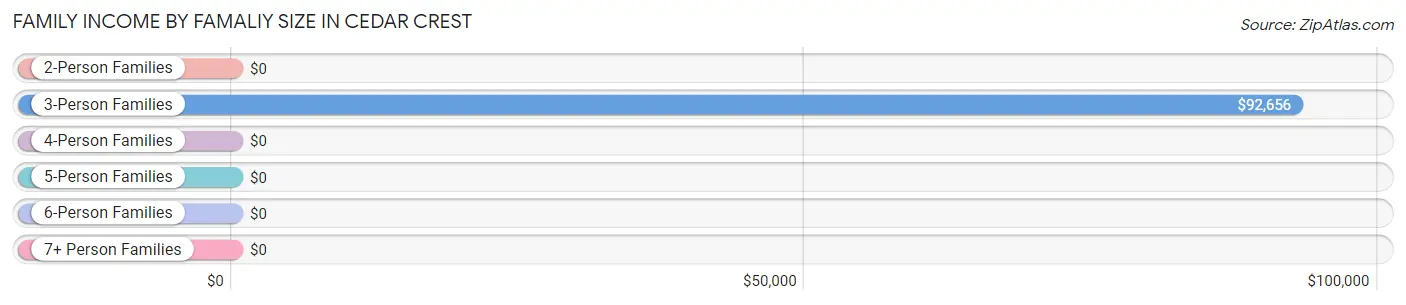
| Income Bracket | # Families | Median Income |
| 2-Person Families | 19 (31.1%) | $0 |
| 3-Person Families | 29 (47.5%) | $92,656 |
| 4-Person Families | 13 (21.3%) | $0 |
| 5-Person Families | 0 (0.0%) | $0 |
| 6-Person Families | 0 (0.0%) | $0 |
| 7+ Person Families | 0 (0.0%) | $0 |
| Total | 61 (100.0%) | $73,438 |
Family Income by Number of Earners in Cedar Crest
| Number of Earners | # Families | Median Income |
| No Earners | 21 (34.4%) | $0 |
| 1 Earner | 13 (21.3%) | $0 |
| 2 Earners | 19 (31.1%) | $0 |
| 3+ Earners | 8 (13.1%) | $0 |
| Total | 61 (100.0%) | $73,438 |
Household Income in Cedar Crest
Household Income Brackets in Cedar Crest
With 32 households falling in the category, the $50,000 to $74,999 income range is the most frequent in Cedar Crest, accounting for 27.1% of all households.
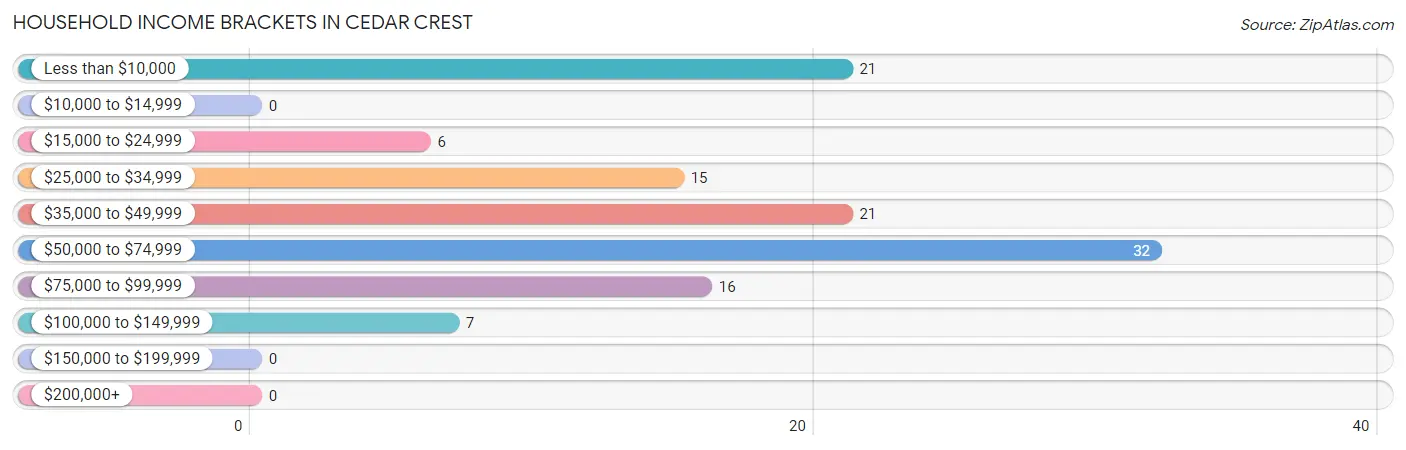
| Income Bracket | # Households | % Households |
| Less than $10,000 | 21 | 17.8% |
| $10,000 to $14,999 | 0 | 0.0% |
| $15,000 to $24,999 | 6 | 5.1% |
| $25,000 to $34,999 | 15 | 12.7% |
| $35,000 to $49,999 | 21 | 17.8% |
| $50,000 to $74,999 | 32 | 27.1% |
| $75,000 to $99,999 | 16 | 13.6% |
| $100,000 to $149,999 | 7 | 5.9% |
| $150,000 to $199,999 | 0 | 0.0% |
| $200,000+ | 0 | 0.0% |
Household Income by Householder Age in Cedar Crest
The median household income in Cedar Crest is $41,500, with the highest median household income of $74,107 found in the 45 to 64 years age bracket for the primary householder. A total of 56 households (47.5%) fall into this category. Meanwhile, the 15 to 24 years age bracket for the primary householder has the lowest median household income of $0, with 8 households (6.8%) in this group.
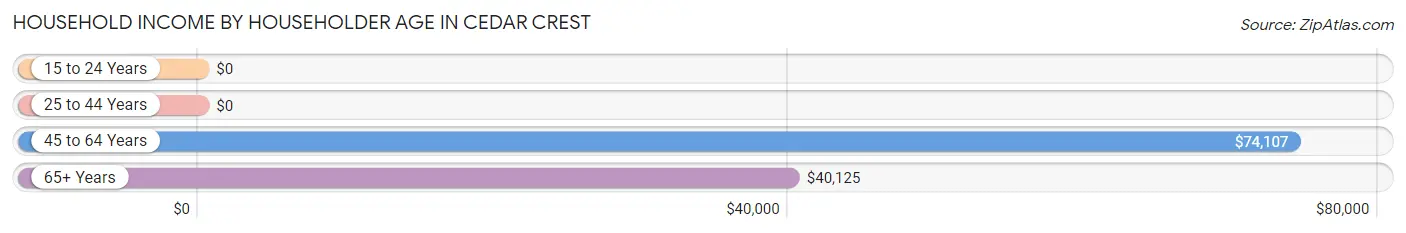
| Income Bracket | # Households | Median Income |
| 15 to 24 Years | 8 (6.8%) | $0 |
| 25 to 44 Years | 15 (12.7%) | $0 |
| 45 to 64 Years | 56 (47.5%) | $74,107 |
| 65+ Years | 39 (33.1%) | $40,125 |
| Total | 118 (100.0%) | $41,500 |
Poverty in Cedar Crest
Income Below Poverty by Sex and Age in Cedar Crest
With 29.1% poverty level for males and 44.7% for females among the residents of Cedar Crest, 25 to 34 year old males and under 5 year old females are the most vulnerable to poverty, with 2 males (100.0%) and 25 females (100.0%) in their respective age groups living below the poverty level.
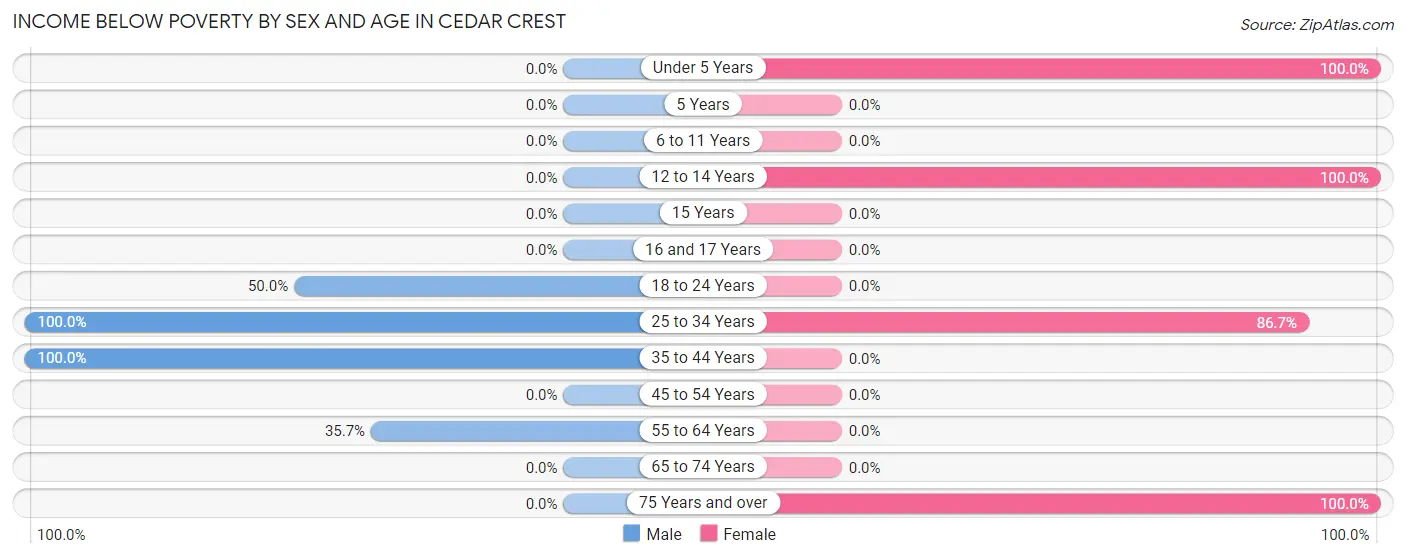
| Age Bracket | Male | Female |
| Under 5 Years | 0 (0.0%) | 25 (100.0%) |
| 5 Years | 0 (0.0%) | 0 (0.0%) |
| 6 to 11 Years | 0 (0.0%) | 0 (0.0%) |
| 12 to 14 Years | 0 (0.0%) | 9 (100.0%) |
| 15 Years | 0 (0.0%) | 0 (0.0%) |
| 16 and 17 Years | 0 (0.0%) | 0 (0.0%) |
| 18 to 24 Years | 9 (50.0%) | 0 (0.0%) |
| 25 to 34 Years | 2 (100.0%) | 13 (86.7%) |
| 35 to 44 Years | 13 (100.0%) | 0 (0.0%) |
| 45 to 54 Years | 0 (0.0%) | 0 (0.0%) |
| 55 to 64 Years | 15 (35.7%) | 0 (0.0%) |
| 65 to 74 Years | 0 (0.0%) | 0 (0.0%) |
| 75 Years and over | 0 (0.0%) | 8 (100.0%) |
| Total | 39 (29.1%) | 55 (44.7%) |
Income Above Poverty by Sex and Age in Cedar Crest
According to the poverty statistics in Cedar Crest, males aged 16 and 17 years and females aged 18 to 24 years are the age groups that are most secure financially, with 100.0% of males and 100.0% of females in these age groups living above the poverty line.
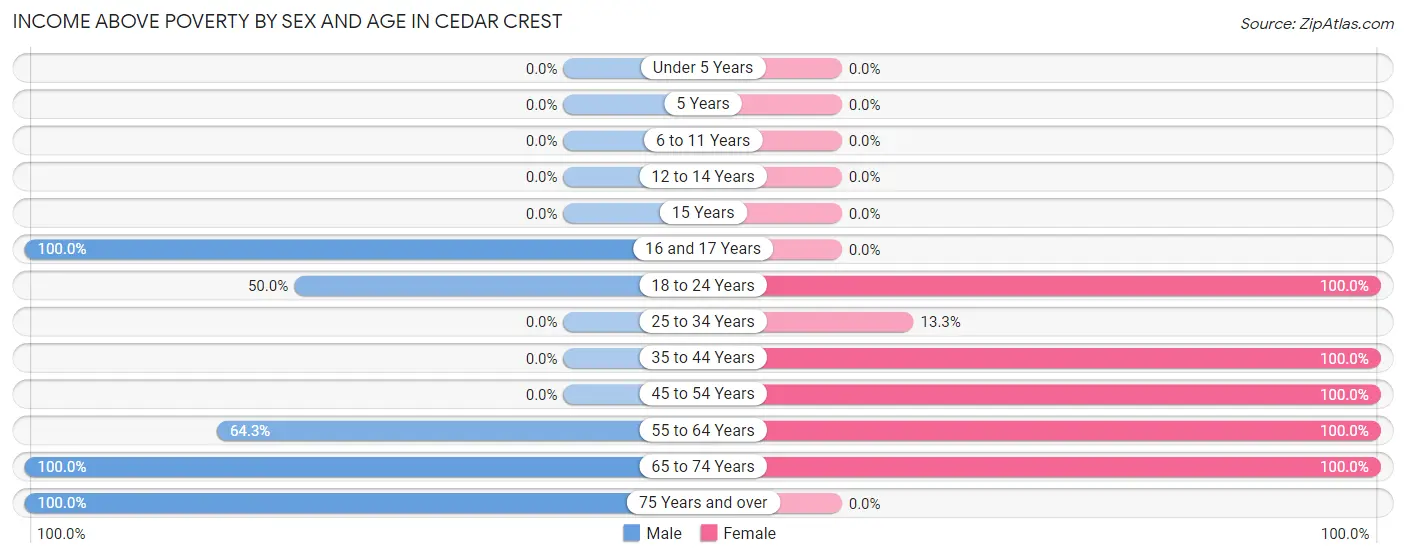
| Age Bracket | Male | Female |
| Under 5 Years | 0 (0.0%) | 0 (0.0%) |
| 5 Years | 0 (0.0%) | 0 (0.0%) |
| 6 to 11 Years | 0 (0.0%) | 0 (0.0%) |
| 12 to 14 Years | 0 (0.0%) | 0 (0.0%) |
| 15 Years | 0 (0.0%) | 0 (0.0%) |
| 16 and 17 Years | 20 (100.0%) | 0 (0.0%) |
| 18 to 24 Years | 9 (50.0%) | 8 (100.0%) |
| 25 to 34 Years | 0 (0.0%) | 2 (13.3%) |
| 35 to 44 Years | 0 (0.0%) | 7 (100.0%) |
| 45 to 54 Years | 0 (0.0%) | 20 (100.0%) |
| 55 to 64 Years | 27 (64.3%) | 21 (100.0%) |
| 65 to 74 Years | 31 (100.0%) | 10 (100.0%) |
| 75 Years and over | 8 (100.0%) | 0 (0.0%) |
| Total | 95 (70.9%) | 68 (55.3%) |
Income Below Poverty Among Married-Couple Families in Cedar Crest
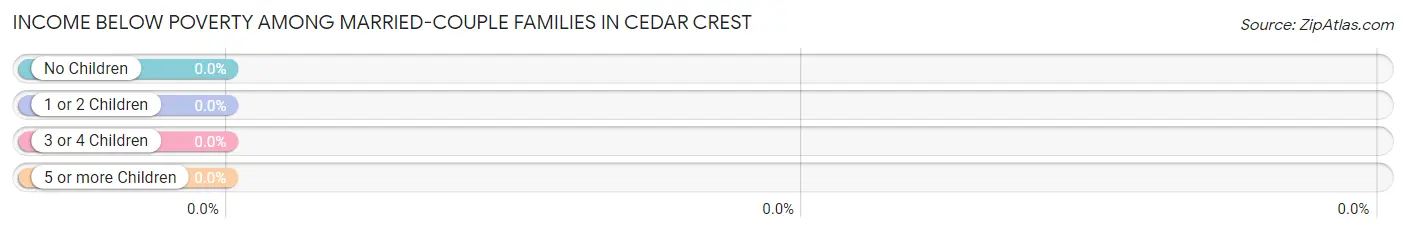
| Children | Above Poverty | Below Poverty |
| No Children | 26 (100.0%) | 0 (0.0%) |
| 1 or 2 Children | 20 (100.0%) | 0 (0.0%) |
| 3 or 4 Children | 0 (0.0%) | 0 (0.0%) |
| 5 or more Children | 0 (0.0%) | 0 (0.0%) |
| Total | 46 (100.0%) | 0 (0.0%) |
Income Below Poverty Among Single-Parent Households in Cedar Crest
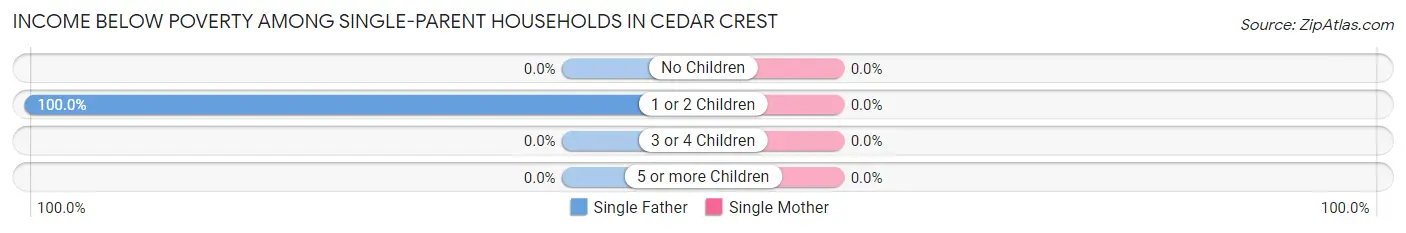
| Children | Single Father | Single Mother |
| No Children | 0 (0.0%) | 0 (0.0%) |
| 1 or 2 Children | 15 (100.0%) | 0 (0.0%) |
| 3 or 4 Children | 0 (0.0%) | 0 (0.0%) |
| 5 or more Children | 0 (0.0%) | 0 (0.0%) |
| Total | 15 (100.0%) | 0 (0.0%) |
Income Below Poverty Among Married-Couple vs Single-Parent Households in Cedar Crest
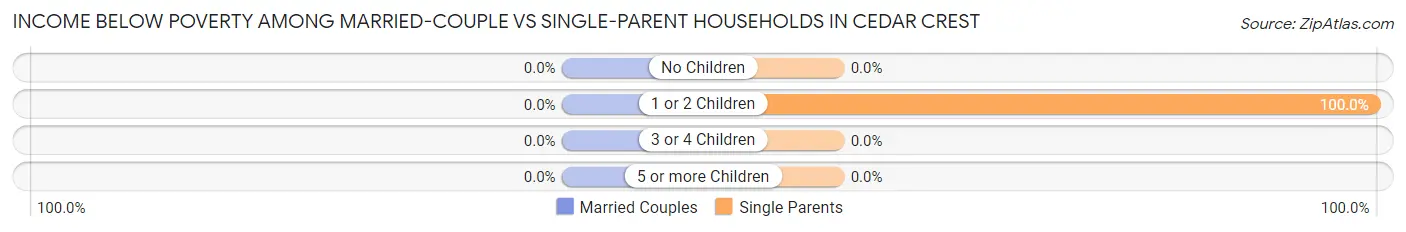
| Children | Married-Couple Families | Single-Parent Households |
| No Children | 0 (0.0%) | 0 (0.0%) |
| 1 or 2 Children | 0 (0.0%) | 15 (100.0%) |
| 3 or 4 Children | 0 (0.0%) | 0 (0.0%) |
| 5 or more Children | 0 (0.0%) | 0 (0.0%) |
| Total | 0 (0.0%) | 15 (100.0%) |
Race in Cedar Crest
The most populous races in Cedar Crest are White / Caucasian (158 | 61.5%), Native / Alaskan (66 | 25.7%), and Two or more Races (33 | 12.8%).
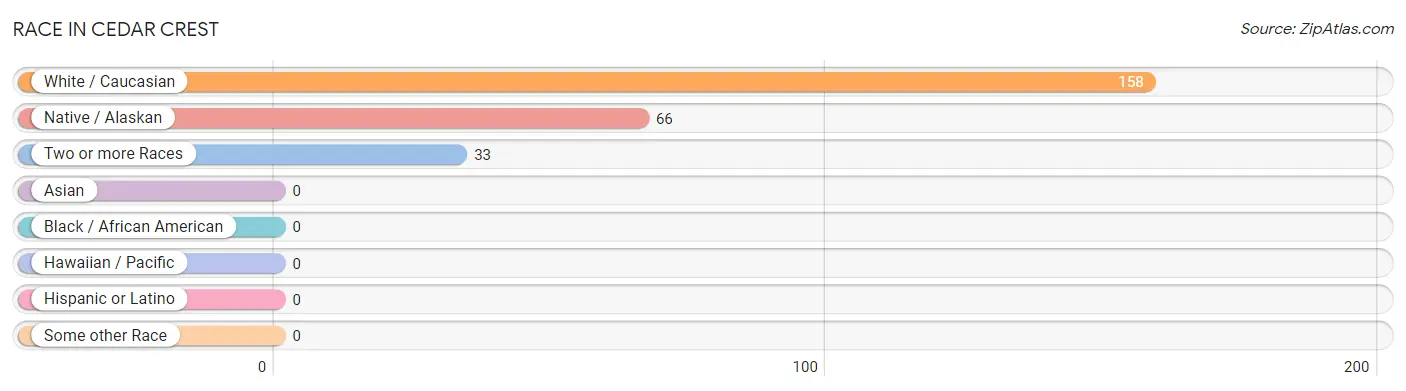
| Race | # Population | % Population |
| Asian | 0 | 0.0% |
| Black / African American | 0 | 0.0% |
| Hawaiian / Pacific | 0 | 0.0% |
| Hispanic or Latino | 0 | 0.0% |
| Native / Alaskan | 66 | 25.7% |
| White / Caucasian | 158 | 61.5% |
| Two or more Races | 33 | 12.8% |
| Some other Race | 0 | 0.0% |
| Total | 257 | 100.0% |
Ancestry in Cedar Crest
The most populous ancestries reported in Cedar Crest are Cherokee (99 | 38.5%), German (29 | 11.3%), American (23 | 8.9%), Irish (23 | 8.9%), and English (10 | 3.9%), together accounting for 71.6% of all Cedar Crest residents.
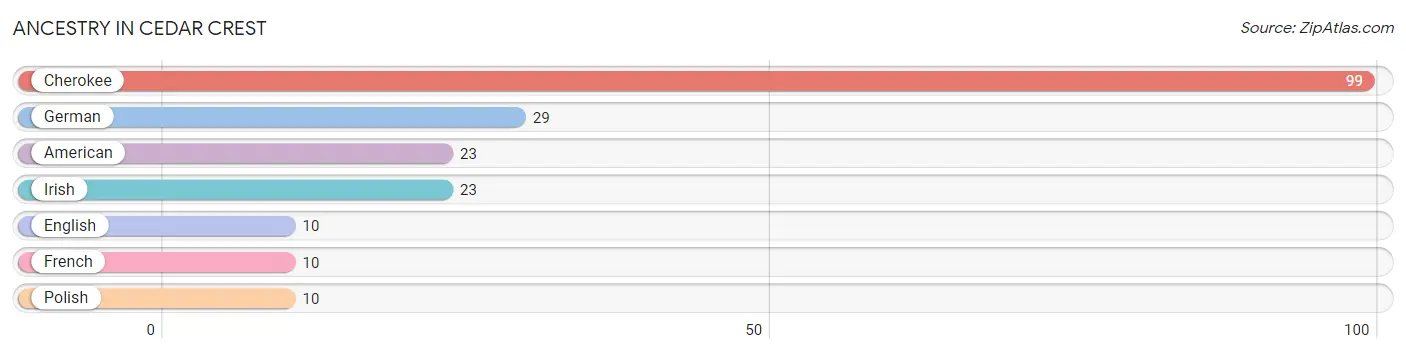
| Ancestry | # Population | % Population |
| American | 23 | 8.9% |
| Cherokee | 99 | 38.5% |
| English | 10 | 3.9% |
| French | 10 | 3.9% |
| German | 29 | 11.3% |
| Irish | 23 | 8.9% |
| Polish | 10 | 3.9% | View All 7 Rows |
Immigrants in Cedar Crest

| Immigration Origin | # Population | % Population | View All 0 Rows |
Sex and Age in Cedar Crest
Sex and Age in Cedar Crest
The most populous age groups in Cedar Crest are 15 to 19 Years (25 | 18.7%) for men and Under 5 Years (25 | 20.3%) for women.
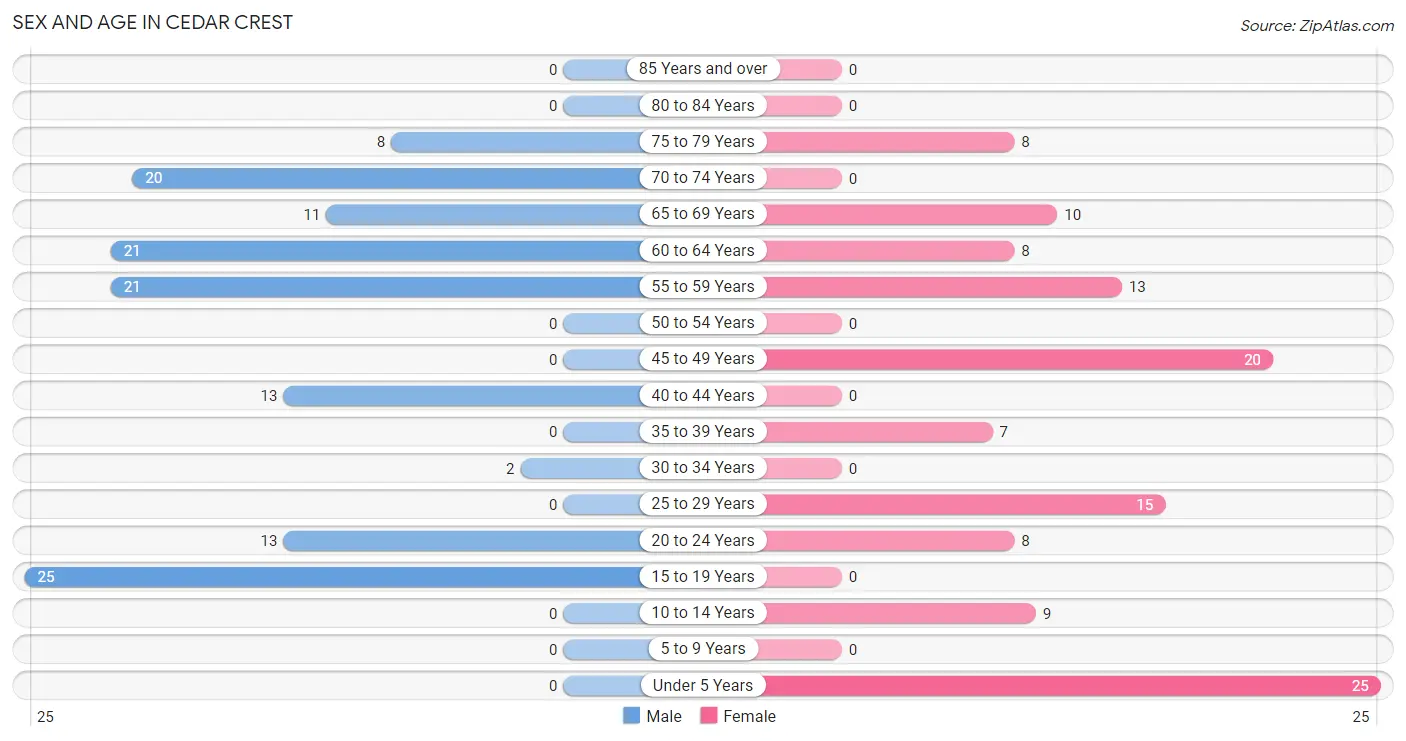
| Age Bracket | Male | Female |
| Under 5 Years | 0 (0.0%) | 25 (20.3%) |
| 5 to 9 Years | 0 (0.0%) | 0 (0.0%) |
| 10 to 14 Years | 0 (0.0%) | 9 (7.3%) |
| 15 to 19 Years | 25 (18.7%) | 0 (0.0%) |
| 20 to 24 Years | 13 (9.7%) | 8 (6.5%) |
| 25 to 29 Years | 0 (0.0%) | 15 (12.2%) |
| 30 to 34 Years | 2 (1.5%) | 0 (0.0%) |
| 35 to 39 Years | 0 (0.0%) | 7 (5.7%) |
| 40 to 44 Years | 13 (9.7%) | 0 (0.0%) |
| 45 to 49 Years | 0 (0.0%) | 20 (16.3%) |
| 50 to 54 Years | 0 (0.0%) | 0 (0.0%) |
| 55 to 59 Years | 21 (15.7%) | 13 (10.6%) |
| 60 to 64 Years | 21 (15.7%) | 8 (6.5%) |
| 65 to 69 Years | 11 (8.2%) | 10 (8.1%) |
| 70 to 74 Years | 20 (14.9%) | 0 (0.0%) |
| 75 to 79 Years | 8 (6.0%) | 8 (6.5%) |
| 80 to 84 Years | 0 (0.0%) | 0 (0.0%) |
| 85 Years and over | 0 (0.0%) | 0 (0.0%) |
| Total | 134 (100.0%) | 123 (100.0%) |
Families and Households in Cedar Crest
Median Family Size in Cedar Crest
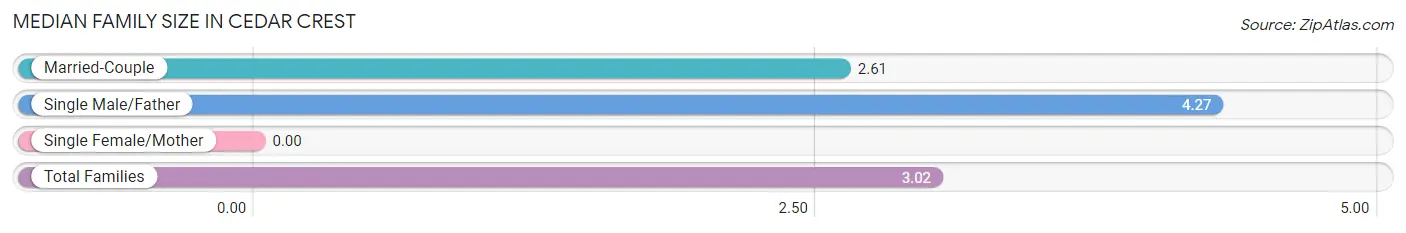
| Family Type | # Families | Family Size |
| Married-Couple | 46 (75.4%) | 2.61 |
| Single Male/Father | 15 (24.6%) | 4.27 |
| Single Female/Mother | 0 (0.0%) | - |
| Total Families | 61 (100.0%) | 3.02 |
Median Household Size in Cedar Crest
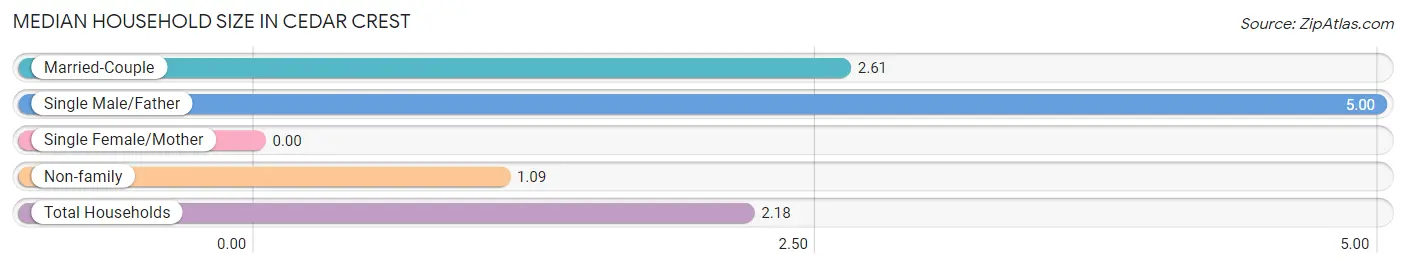
| Household Type | # Households | Household Size |
| Married-Couple | 46 (39.0%) | 2.61 |
| Single Male/Father | 15 (12.7%) | 5.00 |
| Single Female/Mother | 0 (0.0%) | - |
| Non-family | 57 (48.3%) | 1.09 |
| Total Households | 118 (100.0%) | 2.18 |
Household Size by Marriage Status in Cedar Crest
Out of a total of 118 households in Cedar Crest, 61 (51.7%) are family households, while 57 (48.3%) are nonfamily households. The most numerous type of family households are 3-person households, comprising 27, and the most common type of nonfamily households are 1-person households, comprising 49.
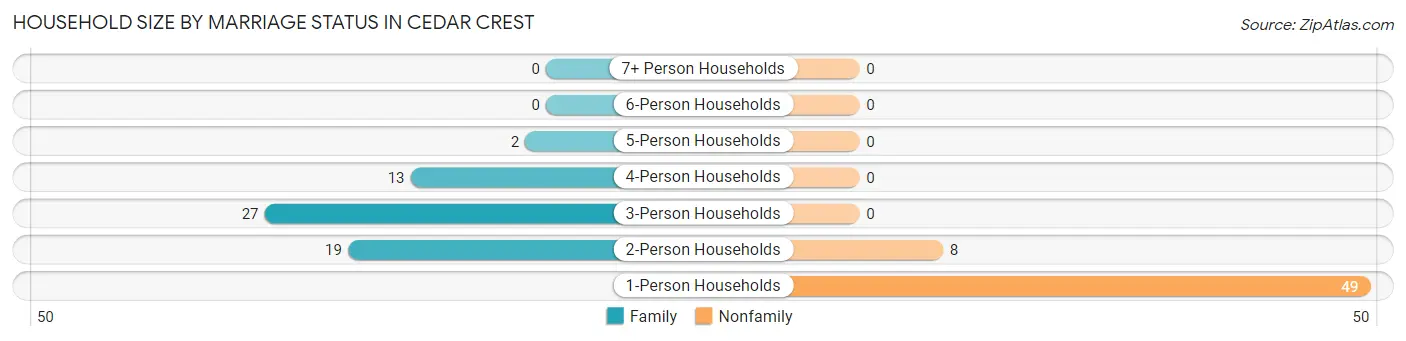
| Household Size | Family Households | Nonfamily Households |
| 1-Person Households | - | 49 (41.5%) |
| 2-Person Households | 19 (16.1%) | 8 (6.8%) |
| 3-Person Households | 27 (22.9%) | 0 (0.0%) |
| 4-Person Households | 13 (11.0%) | 0 (0.0%) |
| 5-Person Households | 2 (1.7%) | 0 (0.0%) |
| 6-Person Households | 0 (0.0%) | 0 (0.0%) |
| 7+ Person Households | 0 (0.0%) | 0 (0.0%) |
| Total | 61 (51.7%) | 57 (48.3%) |
Female Fertility in Cedar Crest
Fertility by Age in Cedar Crest
| Age Bracket | Women with Births | Births / 1,000 Women |
| 15 to 19 years | 0 (0.0%) | 0.0 |
| 20 to 34 years | 0 (0.0%) | 0.0 |
| 35 to 50 years | 0 (0.0%) | 0.0 |
| Total | 0 (0.0%) | 0.0 |
Fertility by Age by Marriage Status in Cedar Crest
| Age Bracket | Married | Unmarried |
| 15 to 19 years | 0 (0.0%) | 0 (0.0%) |
| 20 to 34 years | 0 (0.0%) | 0 (0.0%) |
| 35 to 50 years | 0 (0.0%) | 0 (0.0%) |
| Total | 0 (0.0%) | 0 (0.0%) |
Fertility by Education in Cedar Crest
| Educational Attainment | Women with Births | Births / 1,000 Women |
| Less than High School | 0 (0.0%) | 0.0 |
| High School Diploma | 0 (0.0%) | 0.0 |
| College or Associate's Degree | 0 (0.0%) | 0.0 |
| Bachelor's Degree | 0 (0.0%) | 0.0 |
| Graduate Degree | 0 (0.0%) | 0.0 |
| Total | 0 (0.0%) | 0.0 |
Fertility by Education by Marriage Status in Cedar Crest
| Educational Attainment | Married | Unmarried |
| Less than High School | 0 (0.0%) | 0 (0.0%) |
| High School Diploma | 0 (0.0%) | 0 (0.0%) |
| College or Associate's Degree | 0 (0.0%) | 0 (0.0%) |
| Bachelor's Degree | 0 (0.0%) | 0 (0.0%) |
| Graduate Degree | 0 (0.0%) | 0 (0.0%) |
| Total | 0 (0.0%) | 0 (0.0%) |
Employment Characteristics in Cedar Crest
Employment by Class of Employer in Cedar Crest
Among the 104 employed individuals in Cedar Crest, private company employees (102 | 98.1%), and federal government employees (2 | 1.9%) make up the most common classes of employment.
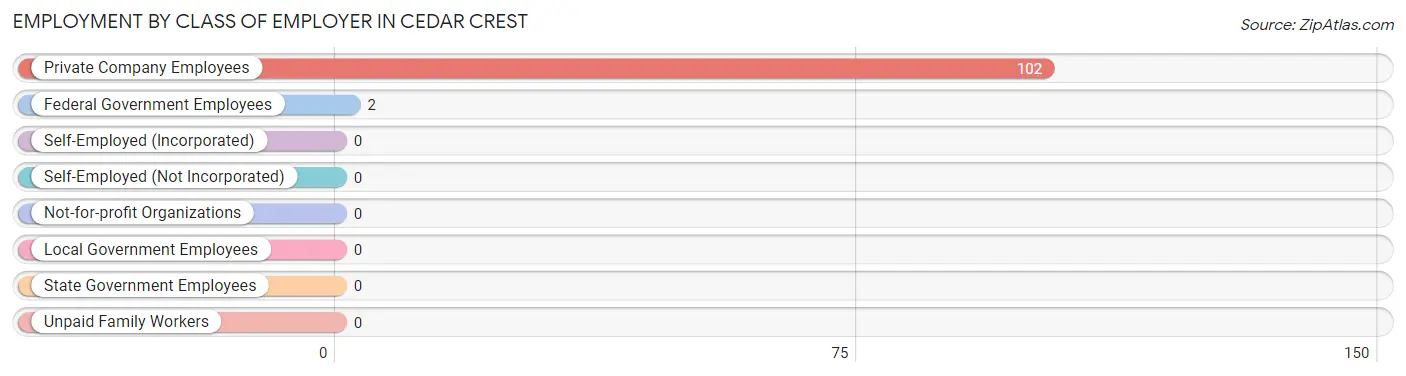
| Employer Class | # Employees | % Employees |
| Private Company Employees | 102 | 98.1% |
| Self-Employed (Incorporated) | 0 | 0.0% |
| Self-Employed (Not Incorporated) | 0 | 0.0% |
| Not-for-profit Organizations | 0 | 0.0% |
| Local Government Employees | 0 | 0.0% |
| State Government Employees | 0 | 0.0% |
| Federal Government Employees | 2 | 1.9% |
| Unpaid Family Workers | 0 | 0.0% |
| Total | 104 | 100.0% |
Employment Status by Age in Cedar Crest
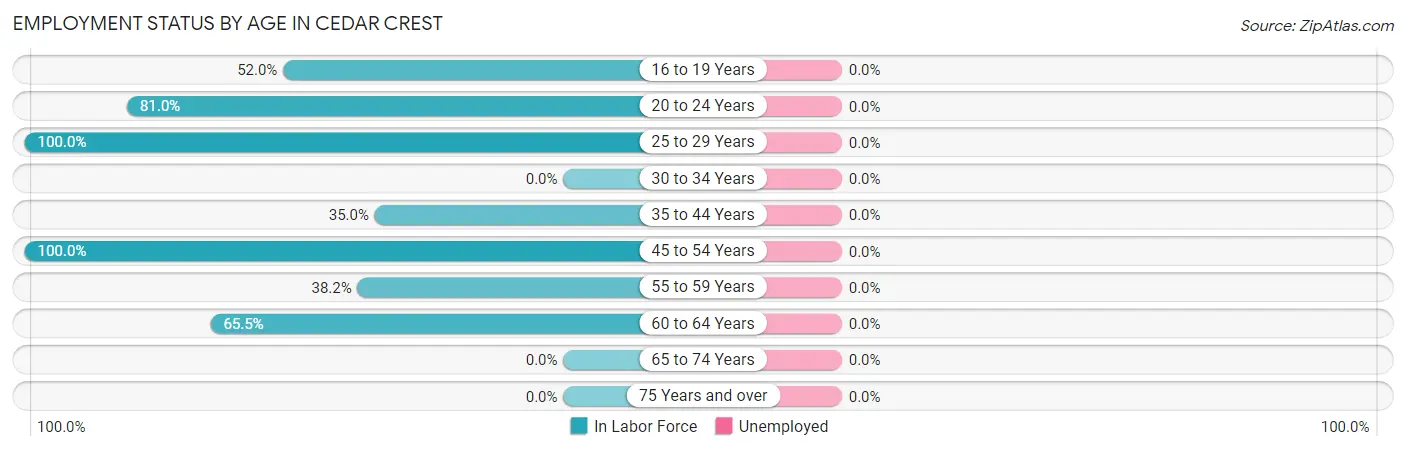
| Age Bracket | In Labor Force | Unemployed |
| 16 to 19 Years | 13 (52.0%) | 0 (0.0%) |
| 20 to 24 Years | 17 (81.0%) | 0 (0.0%) |
| 25 to 29 Years | 15 (100.0%) | 0 (0.0%) |
| 30 to 34 Years | 0 (0.0%) | 0 (0.0%) |
| 35 to 44 Years | 7 (35.0%) | 0 (0.0%) |
| 45 to 54 Years | 20 (100.0%) | 0 (0.0%) |
| 55 to 59 Years | 13 (38.2%) | 0 (0.0%) |
| 60 to 64 Years | 19 (65.5%) | 0 (0.0%) |
| 65 to 74 Years | 0 (0.0%) | 0 (0.0%) |
| 75 Years and over | 0 (0.0%) | 0 (0.0%) |
| Total | 104 (46.6%) | 0 (0.0%) |
Employment Status by Educational Attainment in Cedar Crest
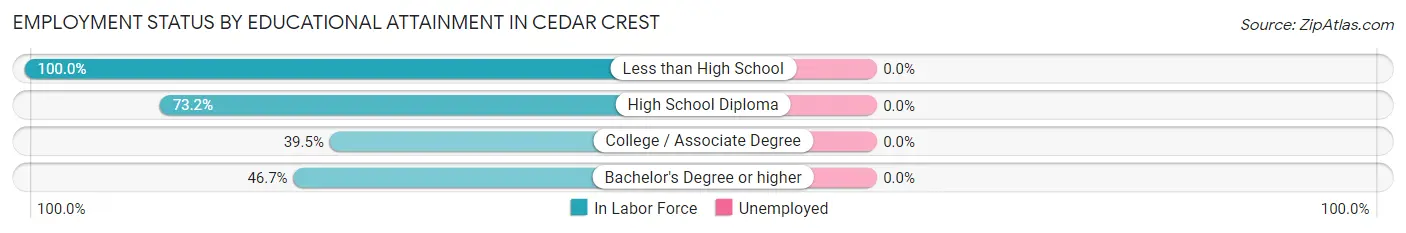
| Educational Attainment | In Labor Force | Unemployed |
| Less than High School | 11 (100.0%) | 0 (0.0%) |
| High School Diploma | 41 (73.2%) | 0 (0.0%) |
| College / Associate Degree | 15 (39.5%) | 0 (0.0%) |
| Bachelor's Degree or higher | 7 (46.7%) | 0 (0.0%) |
| Total | 74 (61.7%) | 0 (0.0%) |
Employment Occupations by Sex in Cedar Crest
Management, Business, Science and Arts Occupations
The most common Management, Business, Science and Arts occupations in Cedar Crest are Management (27 | 26.0%), and Health Diagnosing & Treating (8 | 7.7%).
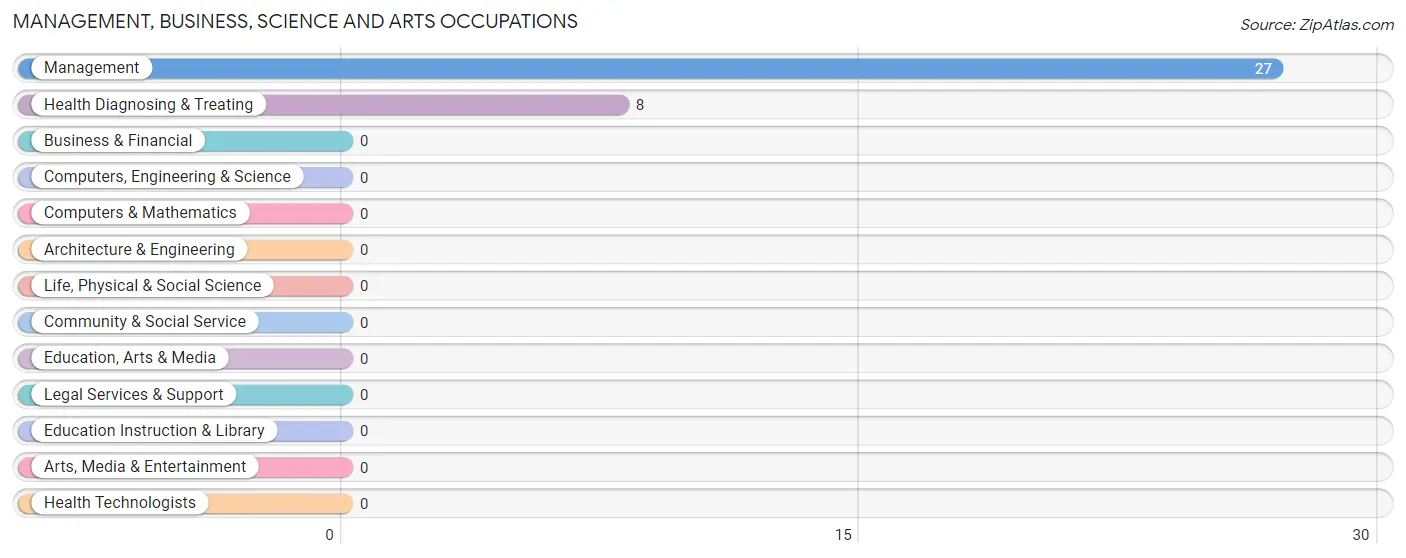
Management, Business, Science and Arts Occupations by Sex
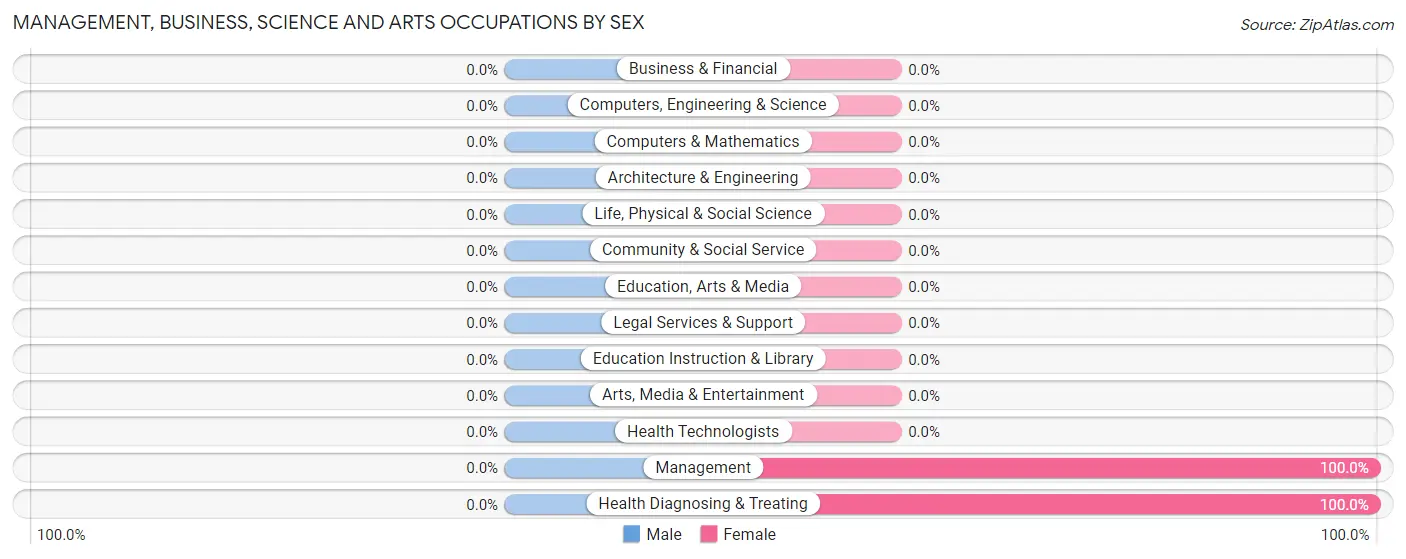
| Occupation | Male | Female |
| Management | 0 (0.0%) | 27 (100.0%) |
| Business & Financial | 0 (0.0%) | 0 (0.0%) |
| Computers, Engineering & Science | 0 (0.0%) | 0 (0.0%) |
| Computers & Mathematics | 0 (0.0%) | 0 (0.0%) |
| Architecture & Engineering | 0 (0.0%) | 0 (0.0%) |
| Life, Physical & Social Science | 0 (0.0%) | 0 (0.0%) |
| Community & Social Service | 0 (0.0%) | 0 (0.0%) |
| Education, Arts & Media | 0 (0.0%) | 0 (0.0%) |
| Legal Services & Support | 0 (0.0%) | 0 (0.0%) |
| Education Instruction & Library | 0 (0.0%) | 0 (0.0%) |
| Arts, Media & Entertainment | 0 (0.0%) | 0 (0.0%) |
| Health Diagnosing & Treating | 0 (0.0%) | 8 (100.0%) |
| Health Technologists | 0 (0.0%) | 0 (0.0%) |
| Total (Category) | 0 (0.0%) | 35 (100.0%) |
| Total (Overall) | 41 (39.4%) | 63 (60.6%) |
Services Occupations
The most common Services occupations in Cedar Crest are , and Food Preparation & Serving (21 | 20.2%).
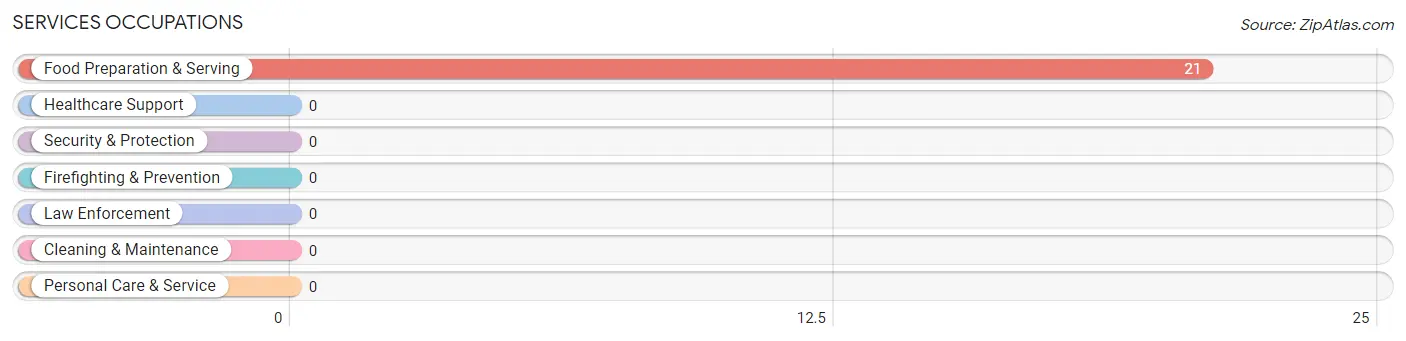
Services Occupations by Sex
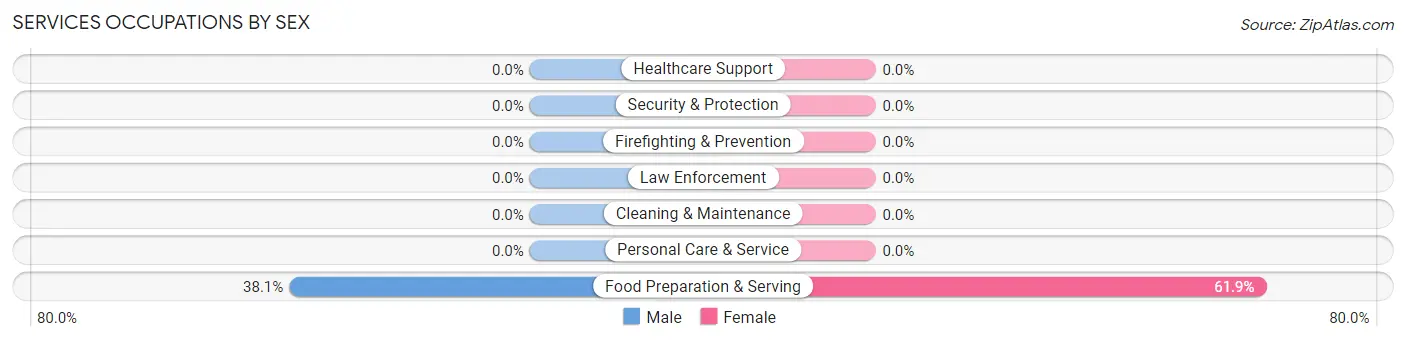
| Occupation | Male | Female |
| Healthcare Support | 0 (0.0%) | 0 (0.0%) |
| Security & Protection | 0 (0.0%) | 0 (0.0%) |
| Firefighting & Prevention | 0 (0.0%) | 0 (0.0%) |
| Law Enforcement | 0 (0.0%) | 0 (0.0%) |
| Food Preparation & Serving | 8 (38.1%) | 13 (61.9%) |
| Cleaning & Maintenance | 0 (0.0%) | 0 (0.0%) |
| Personal Care & Service | 0 (0.0%) | 0 (0.0%) |
| Total (Category) | 8 (38.1%) | 13 (61.9%) |
| Total (Overall) | 41 (39.4%) | 63 (60.6%) |
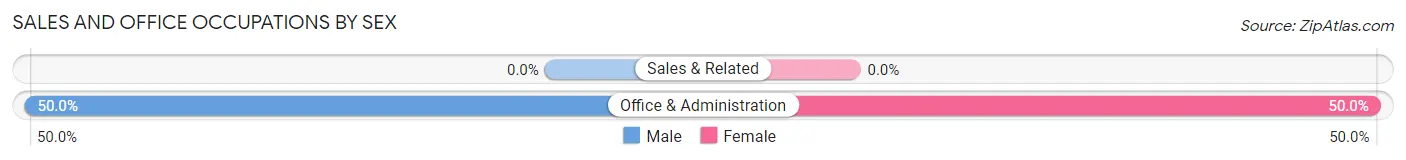
Sales and Office Occupations
The most common Sales and Office occupations in Cedar Crest are , and Office & Administration (18 | 17.3%).
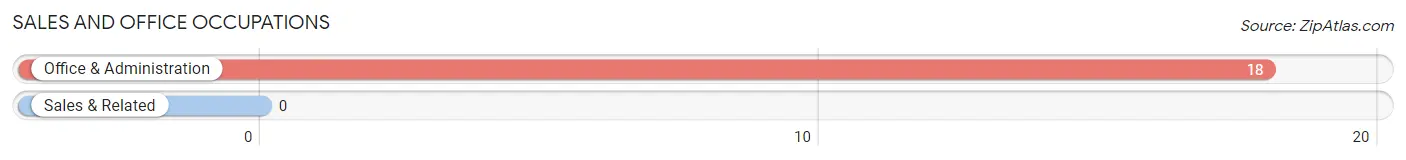
Sales and Office Occupations by Sex
| Occupation | Male | Female |
| Sales & Related | 0 (0.0%) | 0 (0.0%) |
| Office & Administration | 9 (50.0%) | 9 (50.0%) |
| Total (Category) | 9 (50.0%) | 9 (50.0%) |
| Total (Overall) | 41 (39.4%) | 63 (60.6%) |
Natural Resources, Construction and Maintenance Occupations
The most common Natural Resources, Construction and Maintenance occupations in Cedar Crest are , and Construction & Extraction (19 | 18.3%).
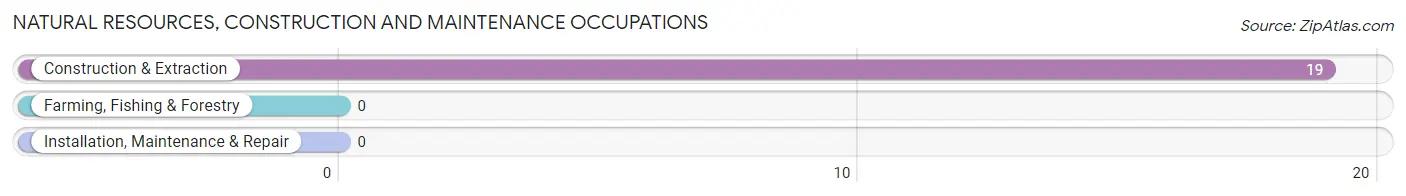
Natural Resources, Construction and Maintenance Occupations by Sex
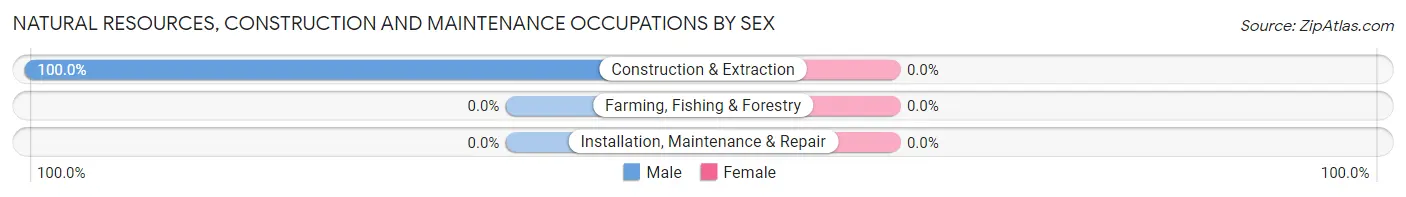
| Occupation | Male | Female |
| Farming, Fishing & Forestry | 0 (0.0%) | 0 (0.0%) |
| Construction & Extraction | 19 (100.0%) | 0 (0.0%) |
| Installation, Maintenance & Repair | 0 (0.0%) | 0 (0.0%) |
| Total (Category) | 19 (100.0%) | 0 (0.0%) |
| Total (Overall) | 41 (39.4%) | 63 (60.6%) |
Production, Transportation and Moving Occupations
The most common Production, Transportation and Moving occupations in Cedar Crest are , and Production (11 | 10.6%).
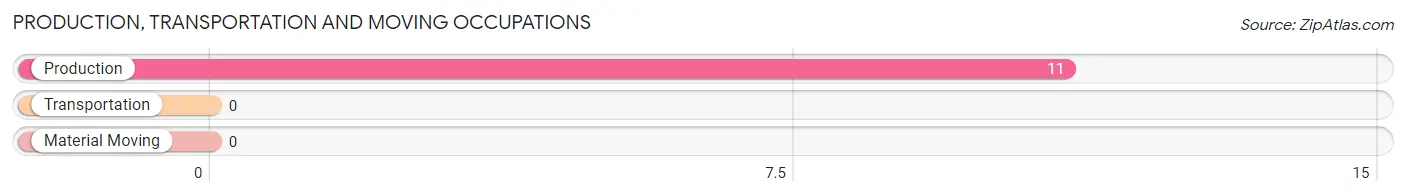
Production, Transportation and Moving Occupations by Sex
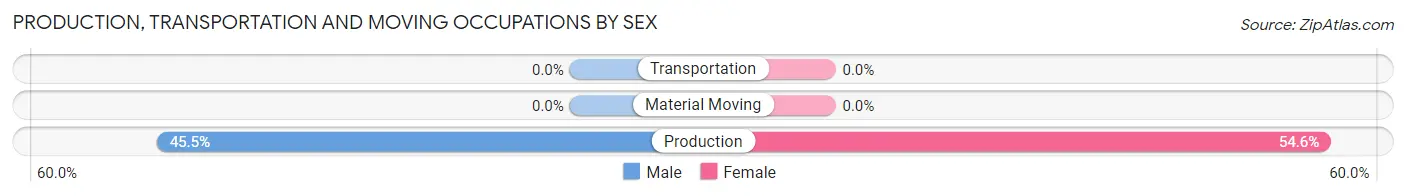
| Occupation | Male | Female |
| Production | 5 (45.5%) | 6 (54.5%) |
| Transportation | 0 (0.0%) | 0 (0.0%) |
| Material Moving | 0 (0.0%) | 0 (0.0%) |
| Total (Category) | 5 (45.5%) | 6 (54.5%) |
| Total (Overall) | 41 (39.4%) | 63 (60.6%) |
Employment Industries by Sex in Cedar Crest
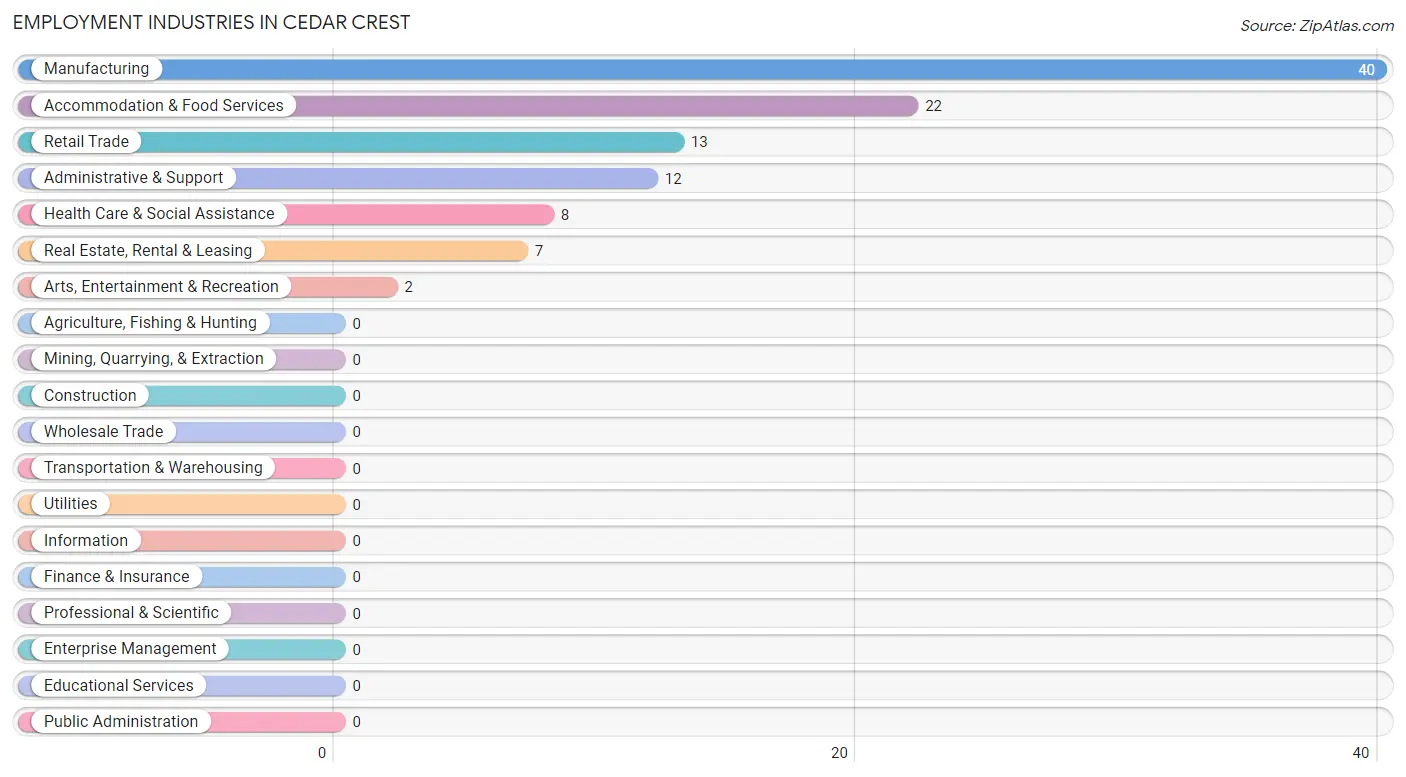
Employment Industries in Cedar Crest
The major employment industries in Cedar Crest include Manufacturing (40 | 38.5%), Accommodation & Food Services (22 | 21.1%), Retail Trade (13 | 12.5%), Administrative & Support (12 | 11.5%), and Health Care & Social Assistance (8 | 7.7%).
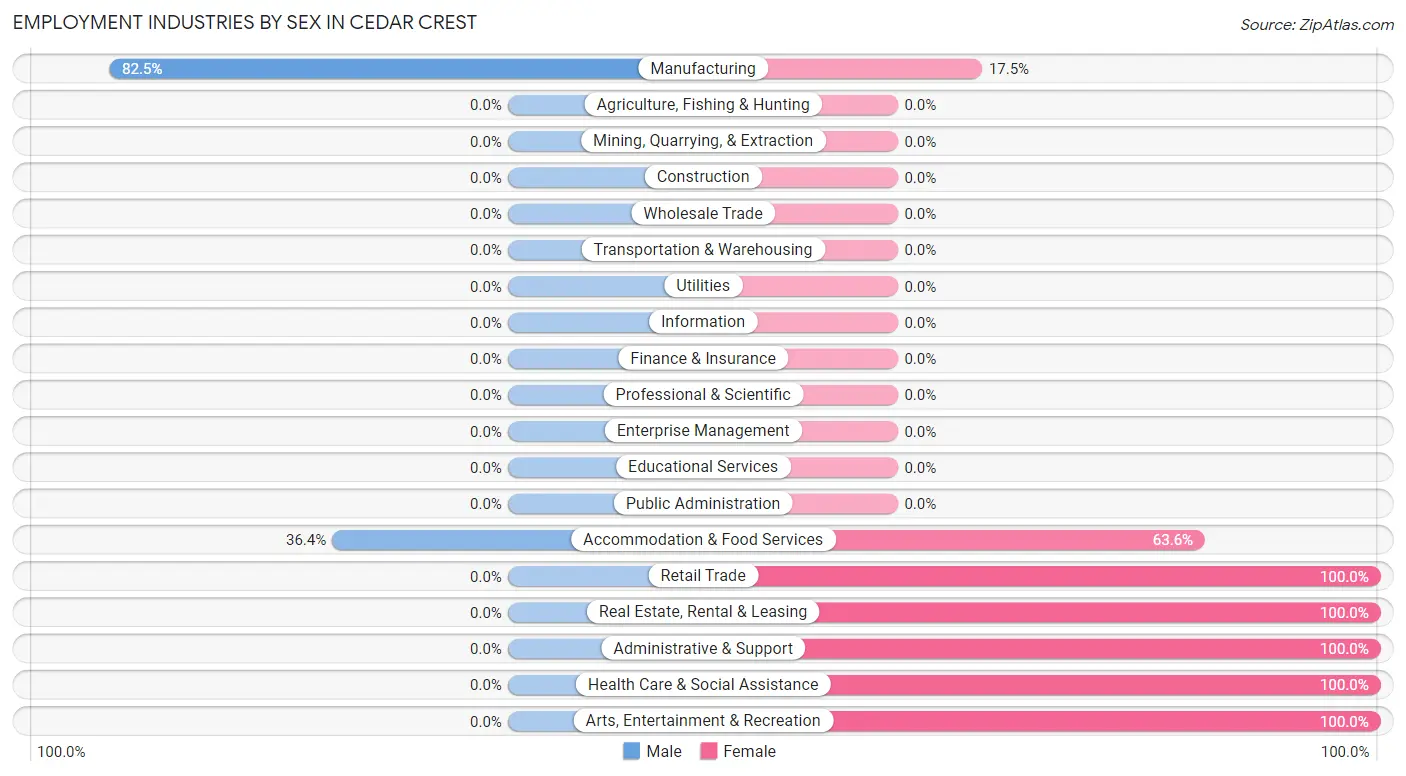
Employment Industries by Sex in Cedar Crest
The Cedar Crest industries that see more men than women are Manufacturing (82.5%), and Accommodation & Food Services (36.4%), whereas the industries that tend to have a higher number of women are Retail Trade (100.0%), Real Estate, Rental & Leasing (100.0%), and Administrative & Support (100.0%).
| Industry | Male | Female |
| Agriculture, Fishing & Hunting | 0 (0.0%) | 0 (0.0%) |
| Mining, Quarrying, & Extraction | 0 (0.0%) | 0 (0.0%) |
| Construction | 0 (0.0%) | 0 (0.0%) |
| Manufacturing | 33 (82.5%) | 7 (17.5%) |
| Wholesale Trade | 0 (0.0%) | 0 (0.0%) |
| Retail Trade | 0 (0.0%) | 13 (100.0%) |
| Transportation & Warehousing | 0 (0.0%) | 0 (0.0%) |
| Utilities | 0 (0.0%) | 0 (0.0%) |
| Information | 0 (0.0%) | 0 (0.0%) |
| Finance & Insurance | 0 (0.0%) | 0 (0.0%) |
| Real Estate, Rental & Leasing | 0 (0.0%) | 7 (100.0%) |
| Professional & Scientific | 0 (0.0%) | 0 (0.0%) |
| Enterprise Management | 0 (0.0%) | 0 (0.0%) |
| Administrative & Support | 0 (0.0%) | 12 (100.0%) |
| Educational Services | 0 (0.0%) | 0 (0.0%) |
| Health Care & Social Assistance | 0 (0.0%) | 8 (100.0%) |
| Arts, Entertainment & Recreation | 0 (0.0%) | 2 (100.0%) |
| Accommodation & Food Services | 8 (36.4%) | 14 (63.6%) |
| Public Administration | 0 (0.0%) | 0 (0.0%) |
| Total | 41 (39.4%) | 63 (60.6%) |
Education in Cedar Crest
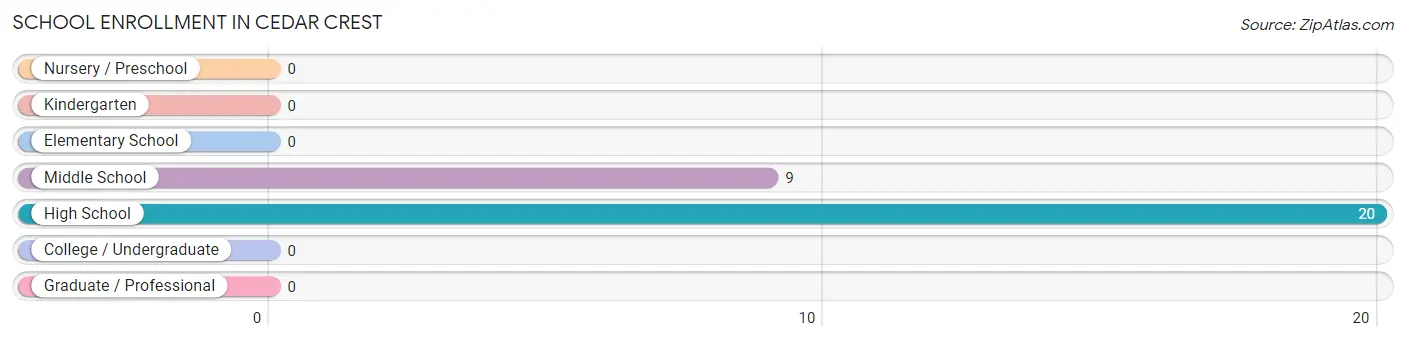
School Enrollment in Cedar Crest
The most common levels of schooling among the 29 students in Cedar Crest are high school (20 | 69.0%), and middle school (9 | 31.0%).
| School Level | # Students | % Students |
| Nursery / Preschool | 0 | 0.0% |
| Kindergarten | 0 | 0.0% |
| Elementary School | 0 | 0.0% |
| Middle School | 9 | 31.0% |
| High School | 20 | 69.0% |
| College / Undergraduate | 0 | 0.0% |
| Graduate / Professional | 0 | 0.0% |
| Total | 29 | 100.0% |
School Enrollment by Age by Funding Source in Cedar Crest
Out of a total of 29 students who are enrolled in schools in Cedar Crest, 12 (41.4%) attend a private institution, while the remaining 17 (58.6%) are enrolled in public schools. The age group of 15 to 17 year olds has the highest likelihood of being enrolled in private schools, with 12 (60.0% in the age bracket) enrolled. Conversely, the age group of 10 to 14 year olds has the lowest likelihood of being enrolled in a private school, with 9 (100.0% in the age bracket) attending a public institution.
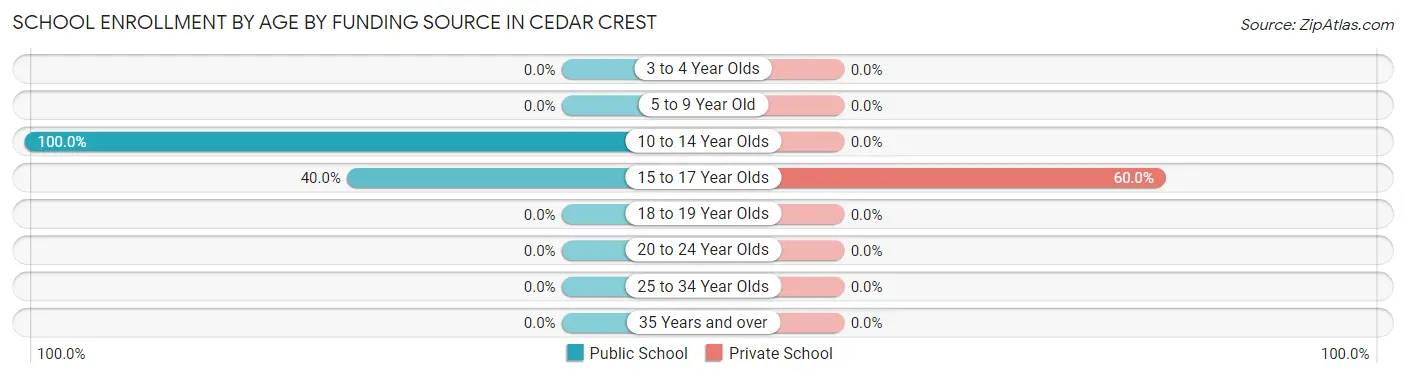
| Age Bracket | Public School | Private School |
| 3 to 4 Year Olds | 0 (0.0%) | 0 (0.0%) |
| 5 to 9 Year Old | 0 (0.0%) | 0 (0.0%) |
| 10 to 14 Year Olds | 9 (100.0%) | 0 (0.0%) |
| 15 to 17 Year Olds | 8 (40.0%) | 12 (60.0%) |
| 18 to 19 Year Olds | 0 (0.0%) | 0 (0.0%) |
| 20 to 24 Year Olds | 0 (0.0%) | 0 (0.0%) |
| 25 to 34 Year Olds | 0 (0.0%) | 0 (0.0%) |
| 35 Years and over | 0 (0.0%) | 0 (0.0%) |
| Total | 17 (58.6%) | 12 (41.4%) |
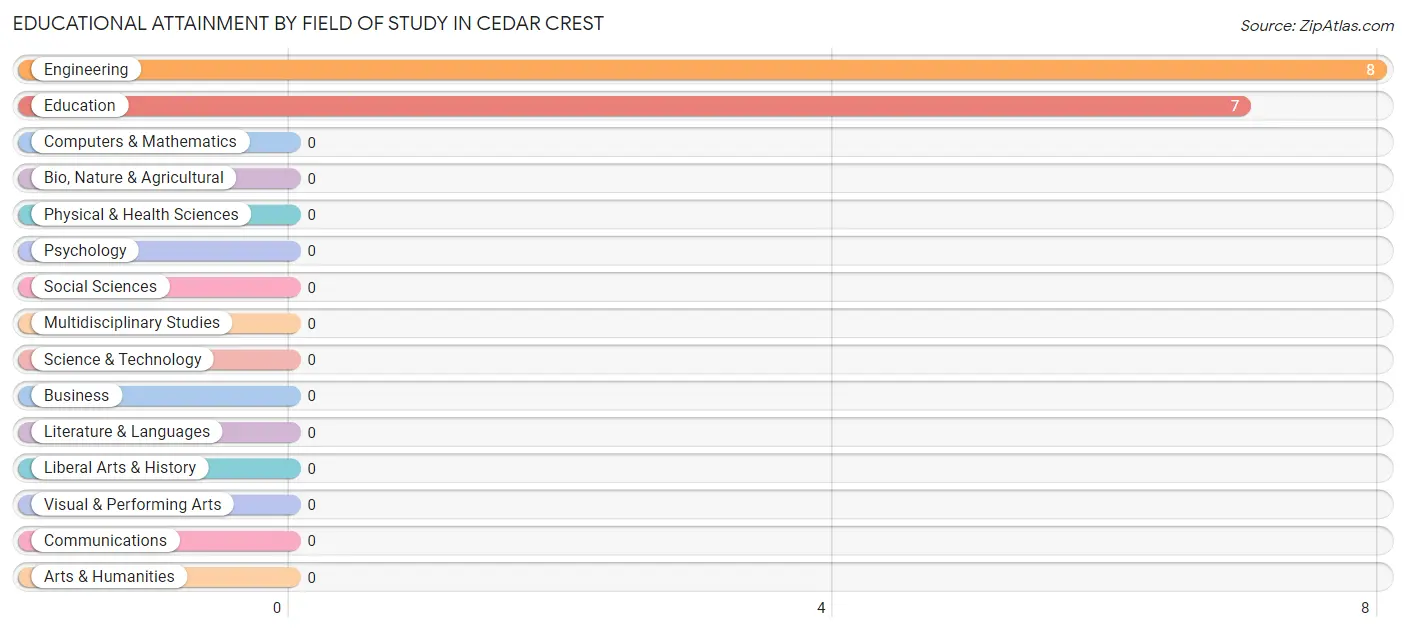
Educational Attainment by Field of Study in Cedar Crest
Engineering (8 | 53.3%), and education (7 | 46.7%) are the most common fields of study among 15 individuals in Cedar Crest who have obtained a bachelor's degree or higher.
| Field of Study | # Graduates | % Graduates |
| Computers & Mathematics | 0 | 0.0% |
| Bio, Nature & Agricultural | 0 | 0.0% |
| Physical & Health Sciences | 0 | 0.0% |
| Psychology | 0 | 0.0% |
| Social Sciences | 0 | 0.0% |
| Engineering | 8 | 53.3% |
| Multidisciplinary Studies | 0 | 0.0% |
| Science & Technology | 0 | 0.0% |
| Business | 0 | 0.0% |
| Education | 7 | 46.7% |
| Literature & Languages | 0 | 0.0% |
| Liberal Arts & History | 0 | 0.0% |
| Visual & Performing Arts | 0 | 0.0% |
| Communications | 0 | 0.0% |
| Arts & Humanities | 0 | 0.0% |
| Total | 15 | 100.0% |
Transportation & Commute in Cedar Crest
Vehicle Availability by Sex in Cedar Crest
The most prevalent vehicle ownership categories in Cedar Crest are males with 2 vehicles (21, accounting for 51.2%) and females with 2 vehicles (18, making up 33.3%).
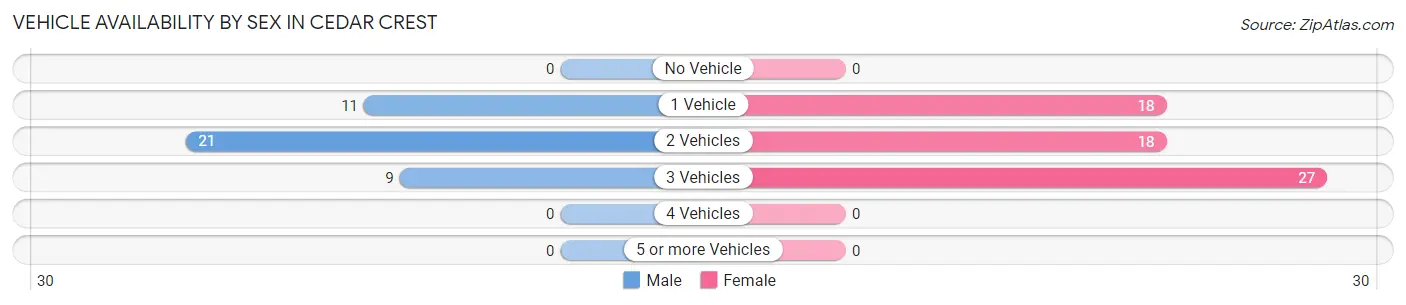
| Vehicles Available | Male | Female |
| No Vehicle | 0 (0.0%) | 0 (0.0%) |
| 1 Vehicle | 11 (26.8%) | 18 (28.6%) |
| 2 Vehicles | 21 (51.2%) | 18 (28.6%) |
| 3 Vehicles | 9 (22.0%) | 27 (42.9%) |
| 4 Vehicles | 0 (0.0%) | 0 (0.0%) |
| 5 or more Vehicles | 0 (0.0%) | 0 (0.0%) |
| Total | 41 (100.0%) | 63 (100.0%) |
Commute Time in Cedar Crest
The most frequently occuring commute durations in Cedar Crest are less than 5 minutes (39 commuters, 40.2%), 30 to 34 minutes (30 commuters, 30.9%), and 5 to 9 minutes (8 commuters, 8.3%).
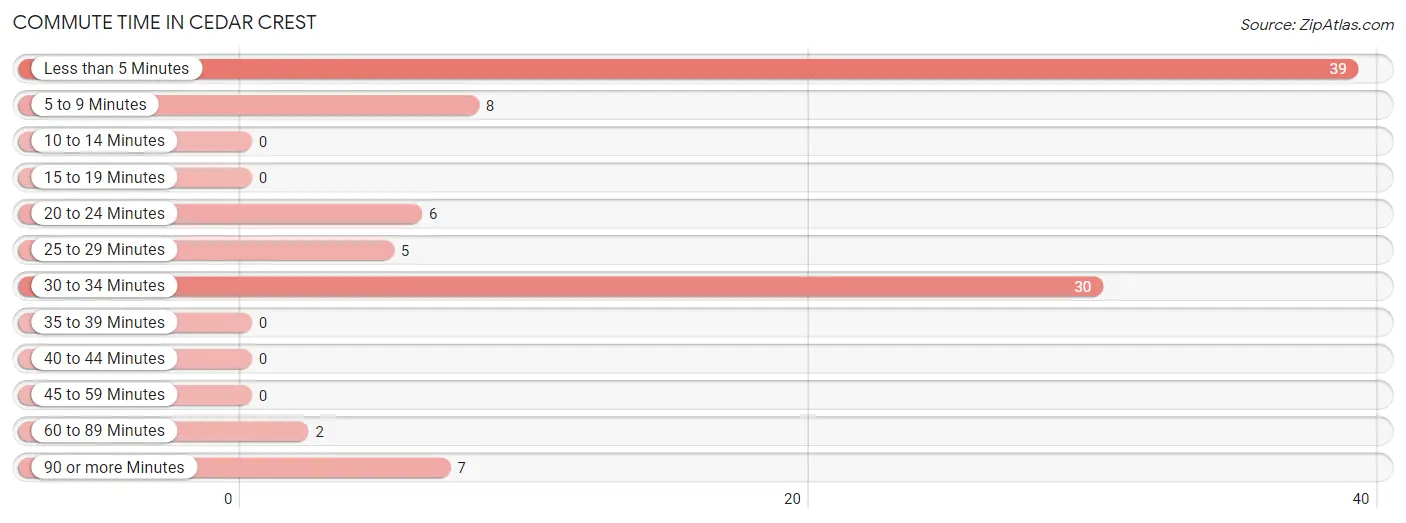
| Commute Time | # Commuters | % Commuters |
| Less than 5 Minutes | 39 | 40.2% |
| 5 to 9 Minutes | 8 | 8.3% |
| 10 to 14 Minutes | 0 | 0.0% |
| 15 to 19 Minutes | 0 | 0.0% |
| 20 to 24 Minutes | 6 | 6.2% |
| 25 to 29 Minutes | 5 | 5.1% |
| 30 to 34 Minutes | 30 | 30.9% |
| 35 to 39 Minutes | 0 | 0.0% |
| 40 to 44 Minutes | 0 | 0.0% |
| 45 to 59 Minutes | 0 | 0.0% |
| 60 to 89 Minutes | 2 | 2.1% |
| 90 or more Minutes | 7 | 7.2% |
Commute Time by Sex in Cedar Crest
The most common commute times in Cedar Crest are less than 5 minutes (19 commuters, 46.3%) for males and 30 to 34 minutes (21 commuters, 37.5%) for females.
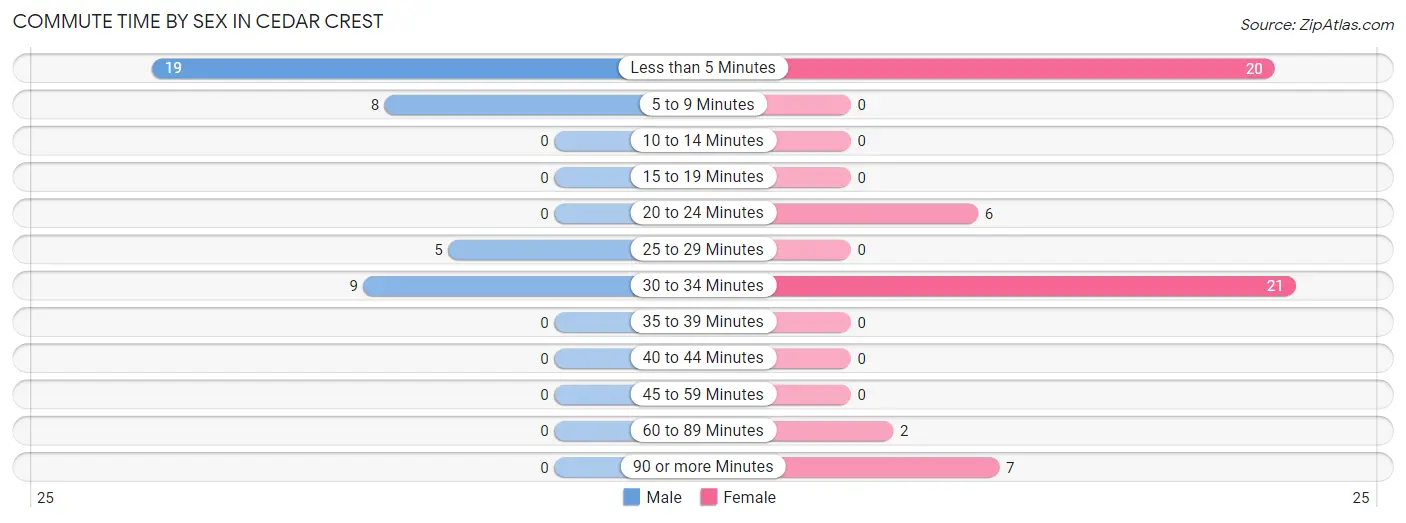
| Commute Time | Male | Female |
| Less than 5 Minutes | 19 (46.3%) | 20 (35.7%) |
| 5 to 9 Minutes | 8 (19.5%) | 0 (0.0%) |
| 10 to 14 Minutes | 0 (0.0%) | 0 (0.0%) |
| 15 to 19 Minutes | 0 (0.0%) | 0 (0.0%) |
| 20 to 24 Minutes | 0 (0.0%) | 6 (10.7%) |
| 25 to 29 Minutes | 5 (12.2%) | 0 (0.0%) |
| 30 to 34 Minutes | 9 (22.0%) | 21 (37.5%) |
| 35 to 39 Minutes | 0 (0.0%) | 0 (0.0%) |
| 40 to 44 Minutes | 0 (0.0%) | 0 (0.0%) |
| 45 to 59 Minutes | 0 (0.0%) | 0 (0.0%) |
| 60 to 89 Minutes | 0 (0.0%) | 2 (3.6%) |
| 90 or more Minutes | 0 (0.0%) | 7 (12.5%) |
Time of Departure to Work by Sex in Cedar Crest
The most frequent times of departure to work in Cedar Crest are 7:00 AM to 7:29 AM (20, 48.8%) for males and 4:00 PM to 11:59 PM (13, 23.2%) for females.
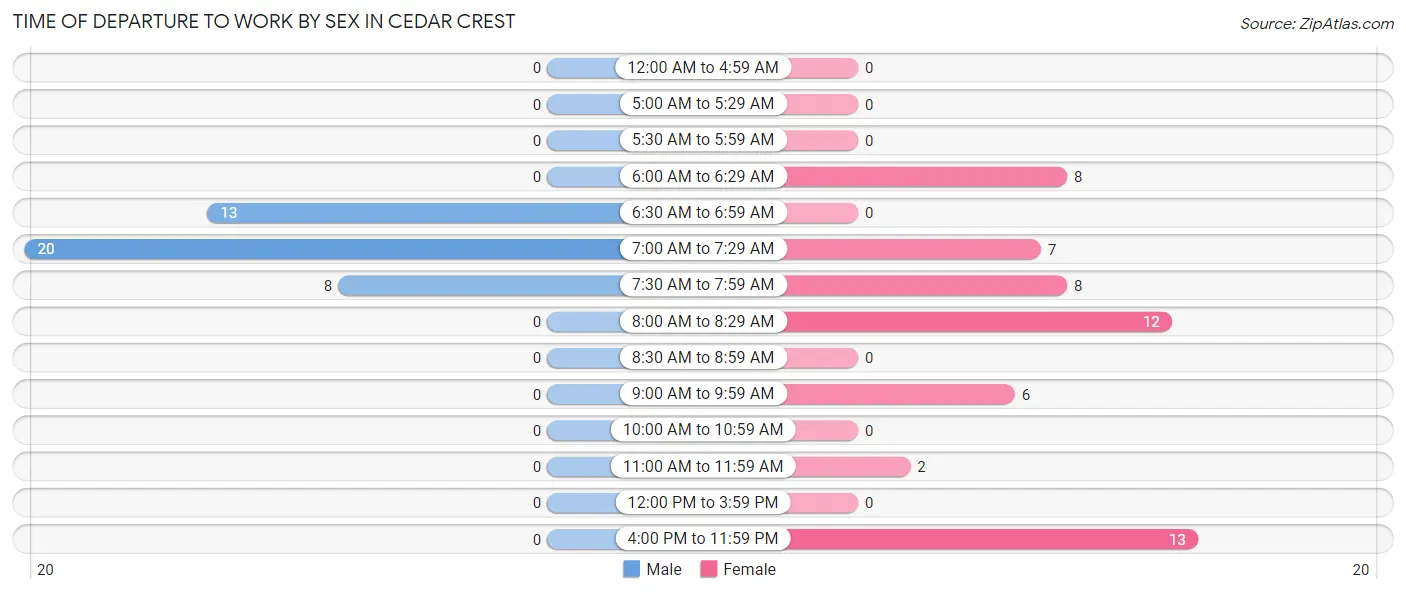
| Time of Departure | Male | Female |
| 12:00 AM to 4:59 AM | 0 (0.0%) | 0 (0.0%) |
| 5:00 AM to 5:29 AM | 0 (0.0%) | 0 (0.0%) |
| 5:30 AM to 5:59 AM | 0 (0.0%) | 0 (0.0%) |
| 6:00 AM to 6:29 AM | 0 (0.0%) | 8 (14.3%) |
| 6:30 AM to 6:59 AM | 13 (31.7%) | 0 (0.0%) |
| 7:00 AM to 7:29 AM | 20 (48.8%) | 7 (12.5%) |
| 7:30 AM to 7:59 AM | 8 (19.5%) | 8 (14.3%) |
| 8:00 AM to 8:29 AM | 0 (0.0%) | 12 (21.4%) |
| 8:30 AM to 8:59 AM | 0 (0.0%) | 0 (0.0%) |
| 9:00 AM to 9:59 AM | 0 (0.0%) | 6 (10.7%) |
| 10:00 AM to 10:59 AM | 0 (0.0%) | 0 (0.0%) |
| 11:00 AM to 11:59 AM | 0 (0.0%) | 2 (3.6%) |
| 12:00 PM to 3:59 PM | 0 (0.0%) | 0 (0.0%) |
| 4:00 PM to 11:59 PM | 0 (0.0%) | 13 (23.2%) |
| Total | 41 (100.0%) | 56 (100.0%) |
Housing Occupancy in Cedar Crest
Occupancy by Ownership in Cedar Crest
Of the total 118 dwellings in Cedar Crest, owner-occupied units account for 65 (55.1%), while renter-occupied units make up 53 (44.9%).
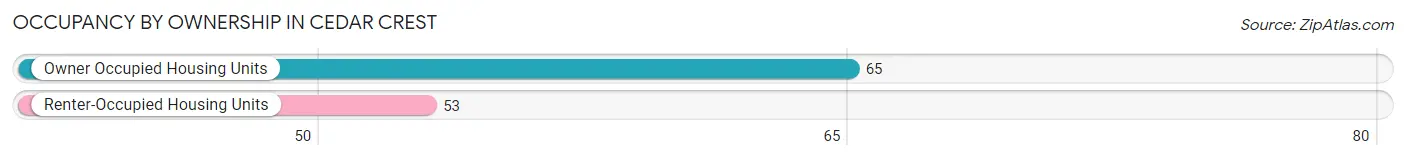
| Occupancy | # Housing Units | % Housing Units |
| Owner Occupied Housing Units | 65 | 55.1% |
| Renter-Occupied Housing Units | 53 | 44.9% |
| Total Occupied Housing Units | 118 | 100.0% |
Occupancy by Household Size in Cedar Crest
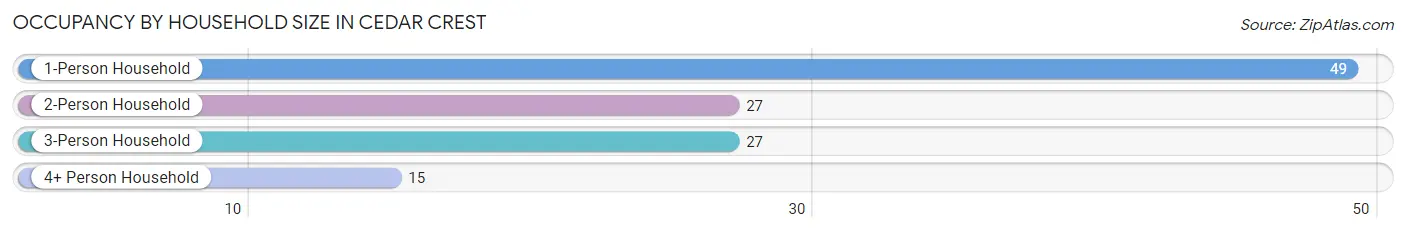
| Household Size | # Housing Units | % Housing Units |
| 1-Person Household | 49 | 41.5% |
| 2-Person Household | 27 | 22.9% |
| 3-Person Household | 27 | 22.9% |
| 4+ Person Household | 15 | 12.7% |
| Total Housing Units | 118 | 100.0% |
Occupancy by Ownership by Household Size in Cedar Crest
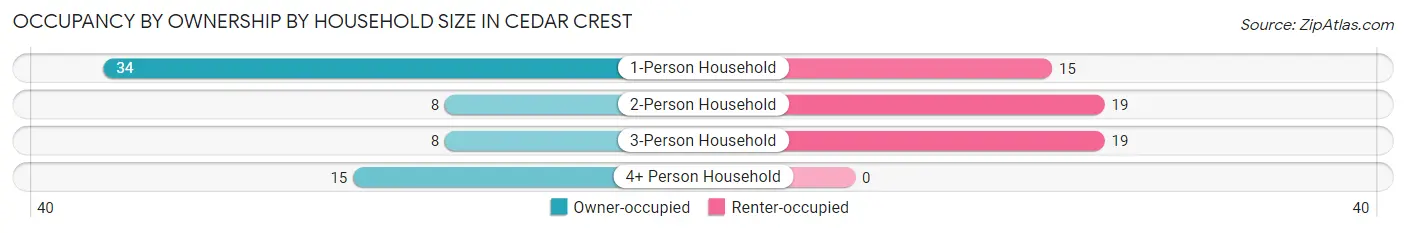
| Household Size | Owner-occupied | Renter-occupied |
| 1-Person Household | 34 (69.4%) | 15 (30.6%) |
| 2-Person Household | 8 (29.6%) | 19 (70.4%) |
| 3-Person Household | 8 (29.6%) | 19 (70.4%) |
| 4+ Person Household | 15 (100.0%) | 0 (0.0%) |
| Total Housing Units | 65 (55.1%) | 53 (44.9%) |
Occupancy by Educational Attainment in Cedar Crest
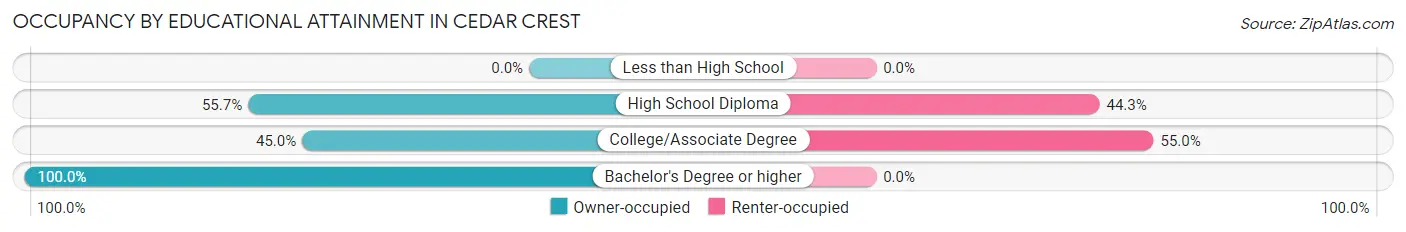
| Household Size | Owner-occupied | Renter-occupied |
| Less than High School | 0 (0.0%) | 0 (0.0%) |
| High School Diploma | 39 (55.7%) | 31 (44.3%) |
| College/Associate Degree | 18 (45.0%) | 22 (55.0%) |
| Bachelor's Degree or higher | 8 (100.0%) | 0 (0.0%) |
Occupancy by Age of Householder in Cedar Crest
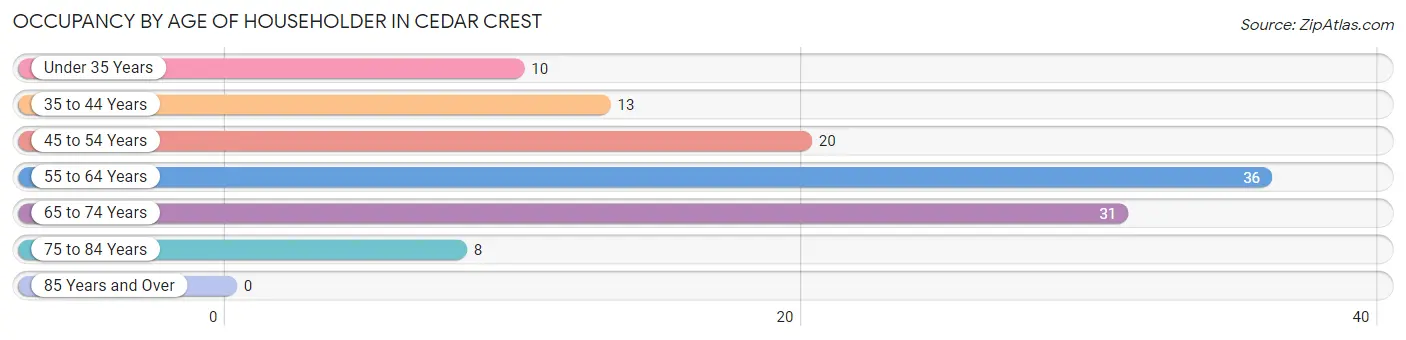
| Age Bracket | # Households | % Households |
| Under 35 Years | 10 | 8.5% |
| 35 to 44 Years | 13 | 11.0% |
| 45 to 54 Years | 20 | 17.0% |
| 55 to 64 Years | 36 | 30.5% |
| 65 to 74 Years | 31 | 26.3% |
| 75 to 84 Years | 8 | 6.8% |
| 85 Years and Over | 0 | 0.0% |
| Total | 118 | 100.0% |
Housing Finances in Cedar Crest
Median Income by Occupancy in Cedar Crest
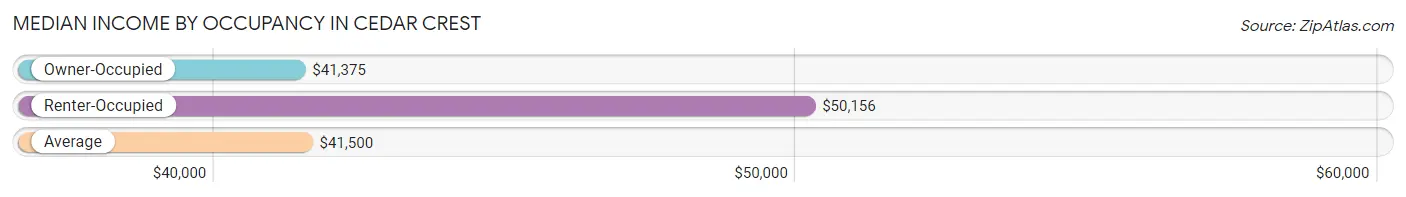
| Occupancy Type | # Households | Median Income |
| Owner-Occupied | 65 (55.1%) | $41,375 |
| Renter-Occupied | 53 (44.9%) | $50,156 |
| Average | 118 (100.0%) | $41,500 |
Occupancy by Householder Income Bracket in Cedar Crest
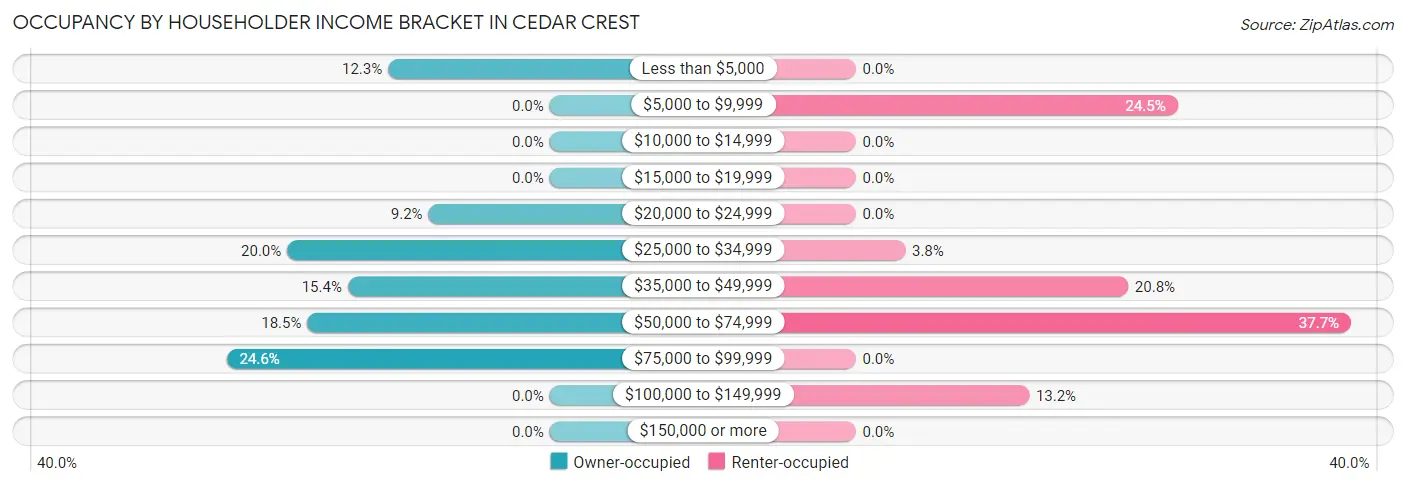
| Income Bracket | Owner-occupied | Renter-occupied |
| Less than $5,000 | 8 (12.3%) | 0 (0.0%) |
| $5,000 to $9,999 | 0 (0.0%) | 13 (24.5%) |
| $10,000 to $14,999 | 0 (0.0%) | 0 (0.0%) |
| $15,000 to $19,999 | 0 (0.0%) | 0 (0.0%) |
| $20,000 to $24,999 | 6 (9.2%) | 0 (0.0%) |
| $25,000 to $34,999 | 13 (20.0%) | 2 (3.8%) |
| $35,000 to $49,999 | 10 (15.4%) | 11 (20.7%) |
| $50,000 to $74,999 | 12 (18.5%) | 20 (37.7%) |
| $75,000 to $99,999 | 16 (24.6%) | 0 (0.0%) |
| $100,000 to $149,999 | 0 (0.0%) | 7 (13.2%) |
| $150,000 or more | 0 (0.0%) | 0 (0.0%) |
| Total | 65 (100.0%) | 53 (100.0%) |
Monthly Housing Cost Tiers in Cedar Crest
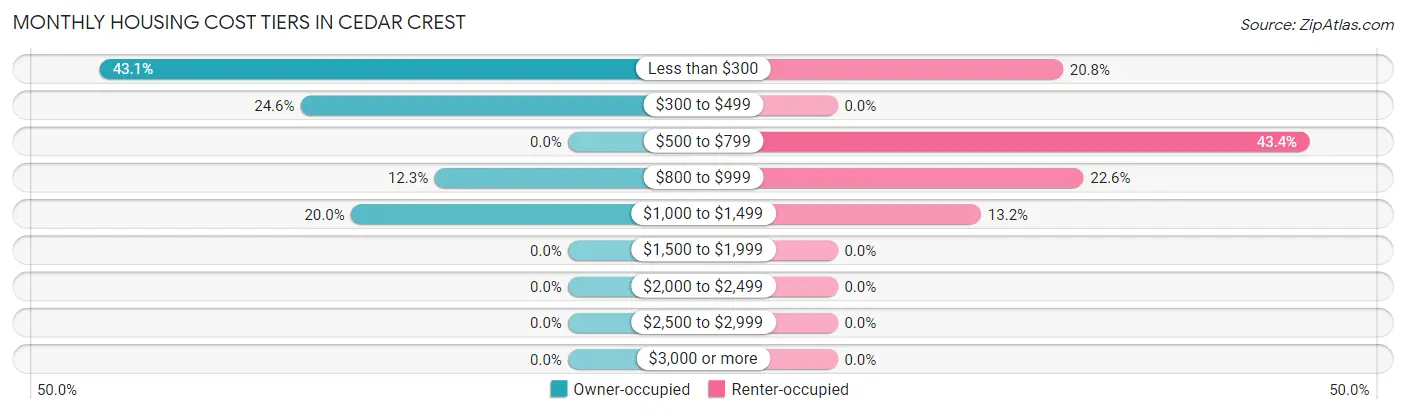
| Monthly Cost | Owner-occupied | Renter-occupied |
| Less than $300 | 28 (43.1%) | 11 (20.7%) |
| $300 to $499 | 16 (24.6%) | 0 (0.0%) |
| $500 to $799 | 0 (0.0%) | 23 (43.4%) |
| $800 to $999 | 8 (12.3%) | 12 (22.6%) |
| $1,000 to $1,499 | 13 (20.0%) | 7 (13.2%) |
| $1,500 to $1,999 | 0 (0.0%) | 0 (0.0%) |
| $2,000 to $2,499 | 0 (0.0%) | 0 (0.0%) |
| $2,500 to $2,999 | 0 (0.0%) | 0 (0.0%) |
| $3,000 or more | 0 (0.0%) | 0 (0.0%) |
| Total | 65 (100.0%) | 53 (100.0%) |
Physical Housing Characteristics in Cedar Crest
Housing Structures in Cedar Crest
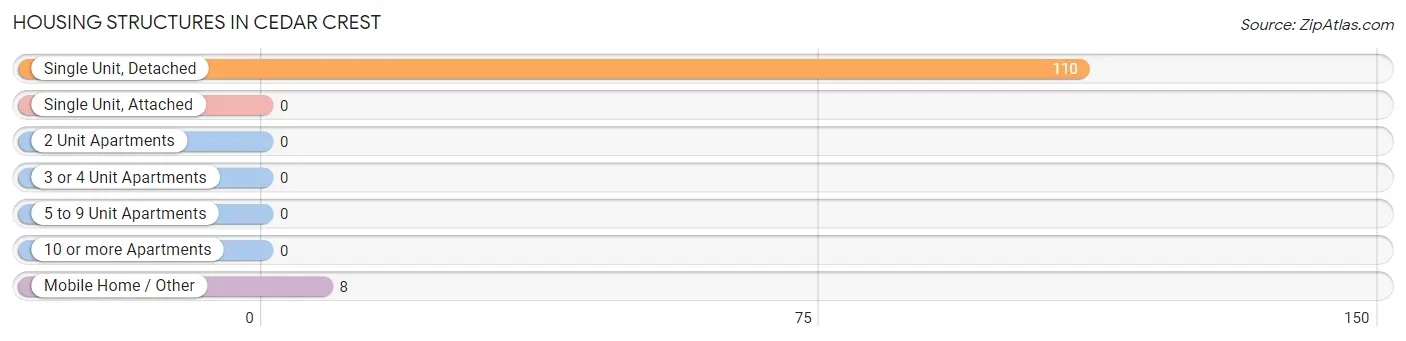
| Structure Type | # Housing Units | % Housing Units |
| Single Unit, Detached | 110 | 93.2% |
| Single Unit, Attached | 0 | 0.0% |
| 2 Unit Apartments | 0 | 0.0% |
| 3 or 4 Unit Apartments | 0 | 0.0% |
| 5 to 9 Unit Apartments | 0 | 0.0% |
| 10 or more Apartments | 0 | 0.0% |
| Mobile Home / Other | 8 | 6.8% |
| Total | 118 | 100.0% |
Housing Structures by Occupancy in Cedar Crest
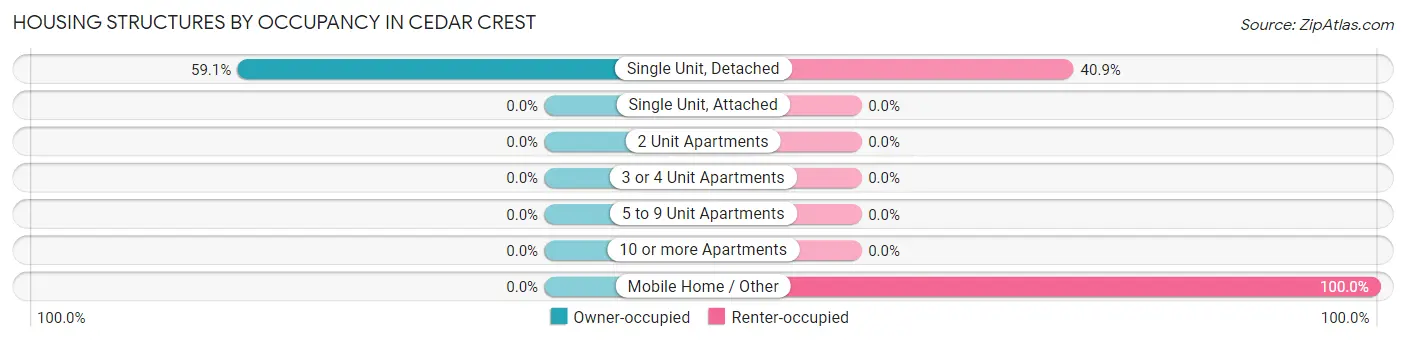
| Structure Type | Owner-occupied | Renter-occupied |
| Single Unit, Detached | 65 (59.1%) | 45 (40.9%) |
| Single Unit, Attached | 0 (0.0%) | 0 (0.0%) |
| 2 Unit Apartments | 0 (0.0%) | 0 (0.0%) |
| 3 or 4 Unit Apartments | 0 (0.0%) | 0 (0.0%) |
| 5 to 9 Unit Apartments | 0 (0.0%) | 0 (0.0%) |
| 10 or more Apartments | 0 (0.0%) | 0 (0.0%) |
| Mobile Home / Other | 0 (0.0%) | 8 (100.0%) |
| Total | 65 (55.1%) | 53 (44.9%) |
Housing Structures by Number of Rooms in Cedar Crest
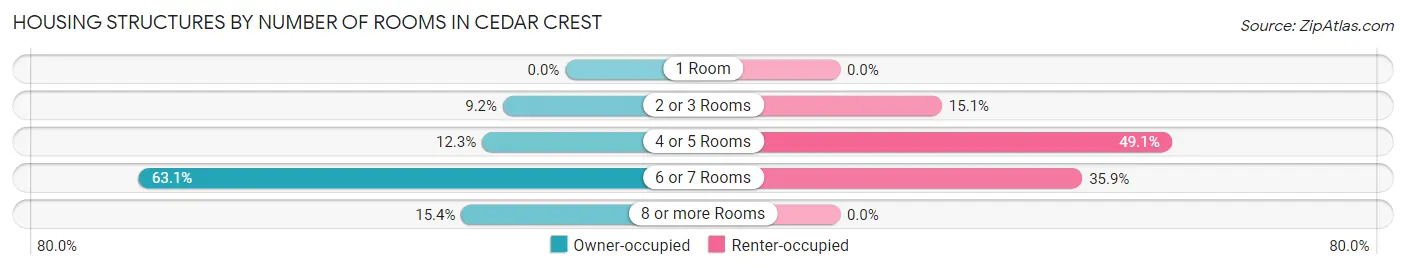
| Number of Rooms | Owner-occupied | Renter-occupied |
| 1 Room | 0 (0.0%) | 0 (0.0%) |
| 2 or 3 Rooms | 6 (9.2%) | 8 (15.1%) |
| 4 or 5 Rooms | 8 (12.3%) | 26 (49.1%) |
| 6 or 7 Rooms | 41 (63.1%) | 19 (35.8%) |
| 8 or more Rooms | 10 (15.4%) | 0 (0.0%) |
| Total | 65 (100.0%) | 53 (100.0%) |
Housing Structure by Heating Type in Cedar Crest
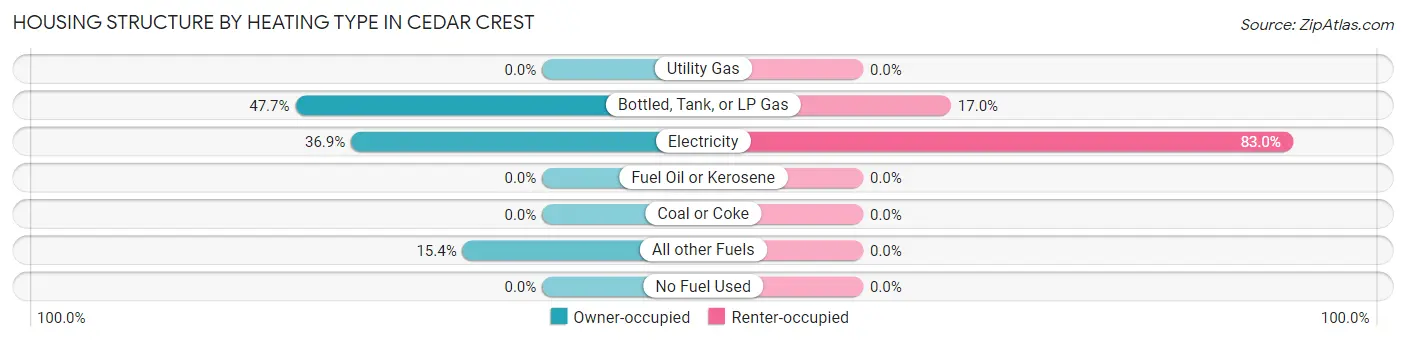
| Heating Type | Owner-occupied | Renter-occupied |
| Utility Gas | 0 (0.0%) | 0 (0.0%) |
| Bottled, Tank, or LP Gas | 31 (47.7%) | 9 (17.0%) |
| Electricity | 24 (36.9%) | 44 (83.0%) |
| Fuel Oil or Kerosene | 0 (0.0%) | 0 (0.0%) |
| Coal or Coke | 0 (0.0%) | 0 (0.0%) |
| All other Fuels | 10 (15.4%) | 0 (0.0%) |
| No Fuel Used | 0 (0.0%) | 0 (0.0%) |
| Total | 65 (100.0%) | 53 (100.0%) |
Household Vehicle Usage in Cedar Crest
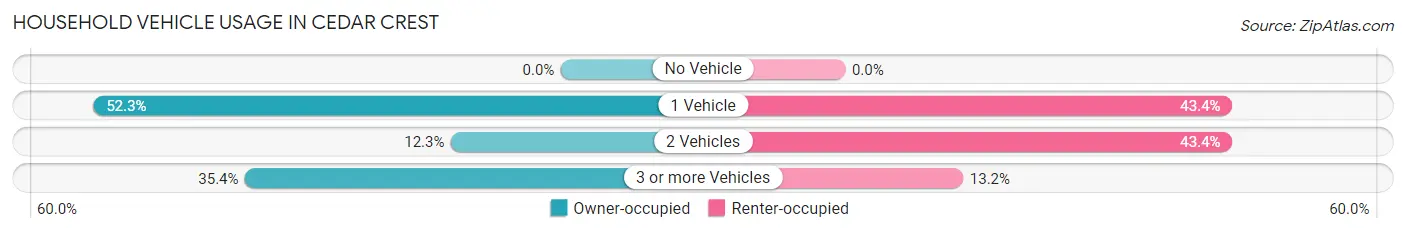
| Vehicles per Household | Owner-occupied | Renter-occupied |
| No Vehicle | 0 (0.0%) | 0 (0.0%) |
| 1 Vehicle | 34 (52.3%) | 23 (43.4%) |
| 2 Vehicles | 8 (12.3%) | 23 (43.4%) |
| 3 or more Vehicles | 23 (35.4%) | 7 (13.2%) |
| Total | 65 (100.0%) | 53 (100.0%) |
Real Estate & Mortgages in Cedar Crest
Real Estate and Mortgage Overview in Cedar Crest
| Characteristic | Without Mortgage | With Mortgage |
| Housing Units | 44 | 21 |
| Median Property Value | - | - |
| Median Household Income | $42,000 | $0 |
| Monthly Housing Costs | $225 | $0 |
| Real Estate Taxes | $400 | $0 |
Property Value by Mortgage Status in Cedar Crest
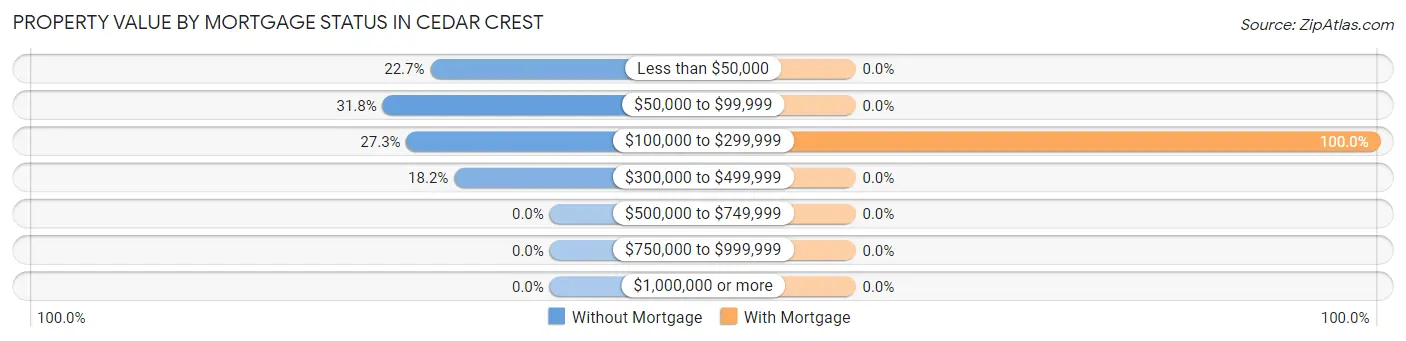
| Property Value | Without Mortgage | With Mortgage |
| Less than $50,000 | 10 (22.7%) | 0 (0.0%) |
| $50,000 to $99,999 | 14 (31.8%) | 0 (0.0%) |
| $100,000 to $299,999 | 12 (27.3%) | 21 (100.0%) |
| $300,000 to $499,999 | 8 (18.2%) | 0 (0.0%) |
| $500,000 to $749,999 | 0 (0.0%) | 0 (0.0%) |
| $750,000 to $999,999 | 0 (0.0%) | 0 (0.0%) |
| $1,000,000 or more | 0 (0.0%) | 0 (0.0%) |
| Total | 44 (100.0%) | 21 (100.0%) |
Household Income by Mortgage Status in Cedar Crest
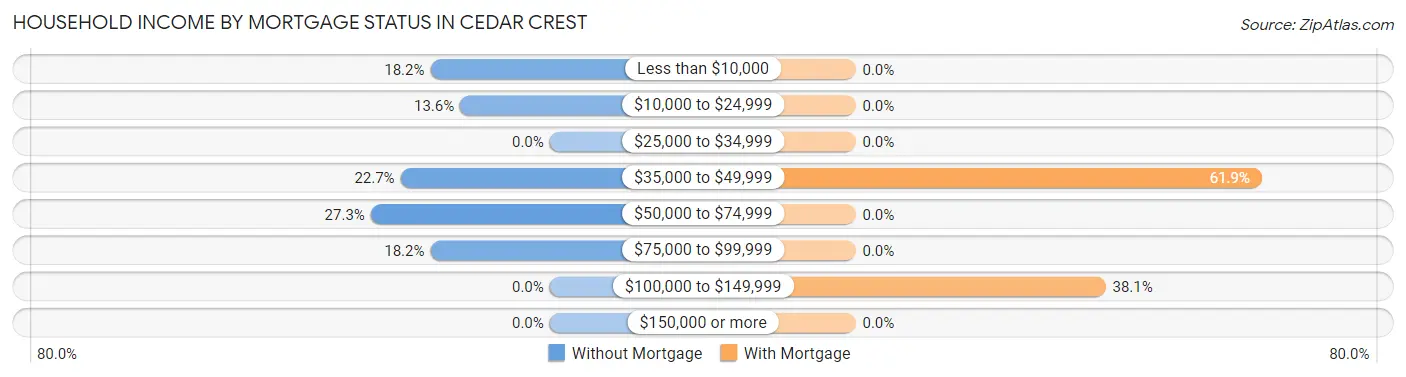
| Household Income | Without Mortgage | With Mortgage |
| Less than $10,000 | 8 (18.2%) | 0 (0.0%) |
| $10,000 to $24,999 | 6 (13.6%) | 0 (0.0%) |
| $25,000 to $34,999 | 0 (0.0%) | 0 (0.0%) |
| $35,000 to $49,999 | 10 (22.7%) | 13 (61.9%) |
| $50,000 to $74,999 | 12 (27.3%) | 0 (0.0%) |
| $75,000 to $99,999 | 8 (18.2%) | 0 (0.0%) |
| $100,000 to $149,999 | 0 (0.0%) | 8 (38.1%) |
| $150,000 or more | 0 (0.0%) | 0 (0.0%) |
| Total | 44 (100.0%) | 21 (100.0%) |
Property Value to Household Income Ratio in Cedar Crest
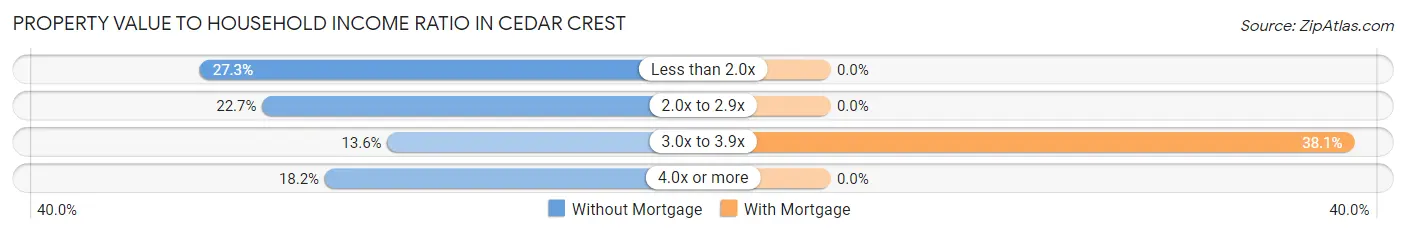
| Value-to-Income Ratio | Without Mortgage | With Mortgage |
| Less than 2.0x | 12 (27.3%) | 0 (0.0%) |
| 2.0x to 2.9x | 10 (22.7%) | 0 (0.0%) |
| 3.0x to 3.9x | 6 (13.6%) | 8 (38.1%) |
| 4.0x or more | 8 (18.2%) | 0 (0.0%) |
| Total | 44 (100.0%) | 21 (100.0%) |
Real Estate Taxes by Mortgage Status in Cedar Crest
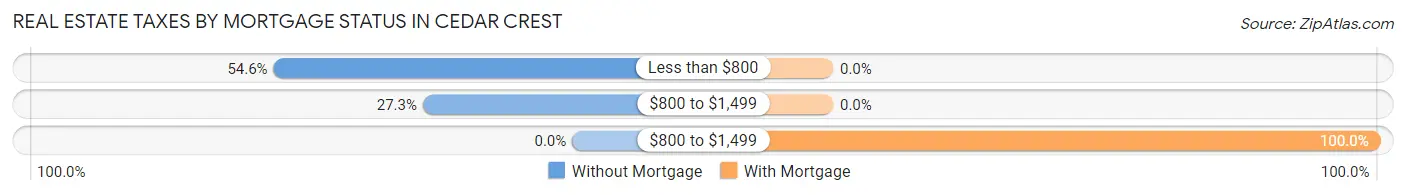
| Property Taxes | Without Mortgage | With Mortgage |
| Less than $800 | 24 (54.5%) | 0 (0.0%) |
| $800 to $1,499 | 12 (27.3%) | 0 (0.0%) |
| $800 to $1,499 | 0 (0.0%) | 21 (100.0%) |
| Total | 44 (100.0%) | 21 (100.0%) |
Health & Disability in Cedar Crest
Health Insurance Coverage by Age in Cedar Crest
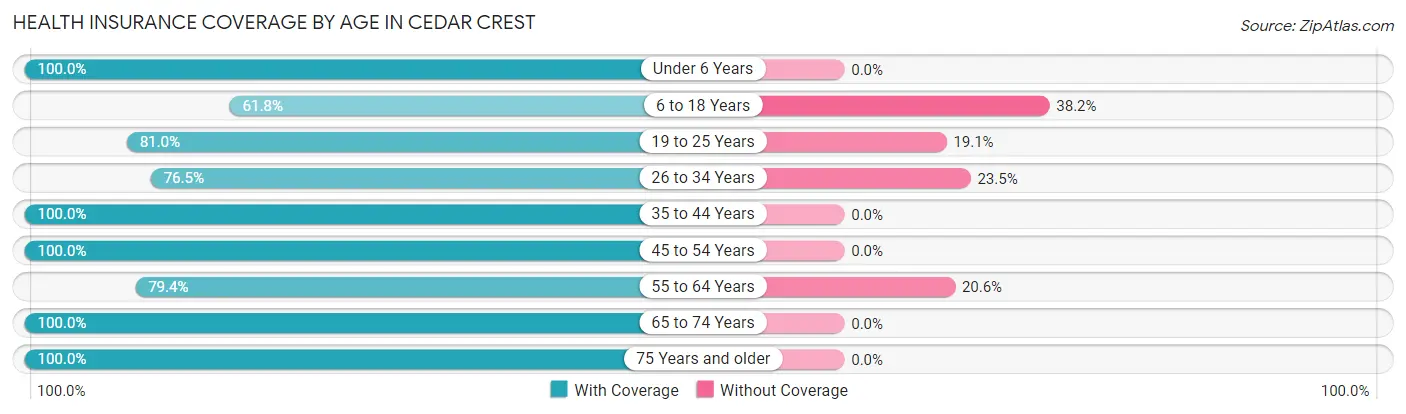
| Age Bracket | With Coverage | Without Coverage |
| Under 6 Years | 25 (100.0%) | 0 (0.0%) |
| 6 to 18 Years | 21 (61.8%) | 13 (38.2%) |
| 19 to 25 Years | 17 (80.9%) | 4 (19.1%) |
| 26 to 34 Years | 13 (76.5%) | 4 (23.5%) |
| 35 to 44 Years | 20 (100.0%) | 0 (0.0%) |
| 45 to 54 Years | 20 (100.0%) | 0 (0.0%) |
| 55 to 64 Years | 50 (79.4%) | 13 (20.6%) |
| 65 to 74 Years | 41 (100.0%) | 0 (0.0%) |
| 75 Years and older | 16 (100.0%) | 0 (0.0%) |
| Total | 223 (86.8%) | 34 (13.2%) |
Health Insurance Coverage by Citizenship Status in Cedar Crest
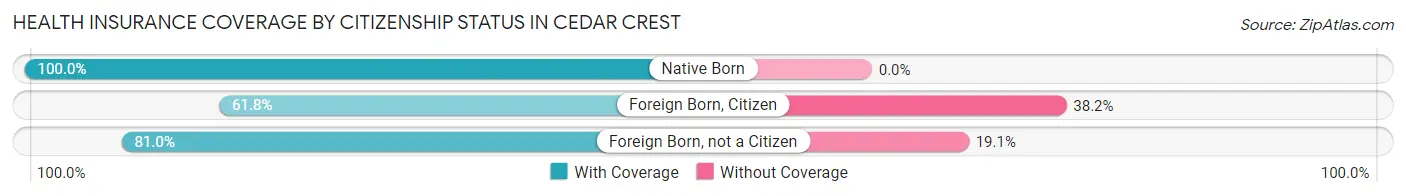
| Citizenship Status | With Coverage | Without Coverage |
| Native Born | 25 (100.0%) | 0 (0.0%) |
| Foreign Born, Citizen | 21 (61.8%) | 13 (38.2%) |
| Foreign Born, not a Citizen | 17 (80.9%) | 4 (19.1%) |
Health Insurance Coverage by Household Income in Cedar Crest
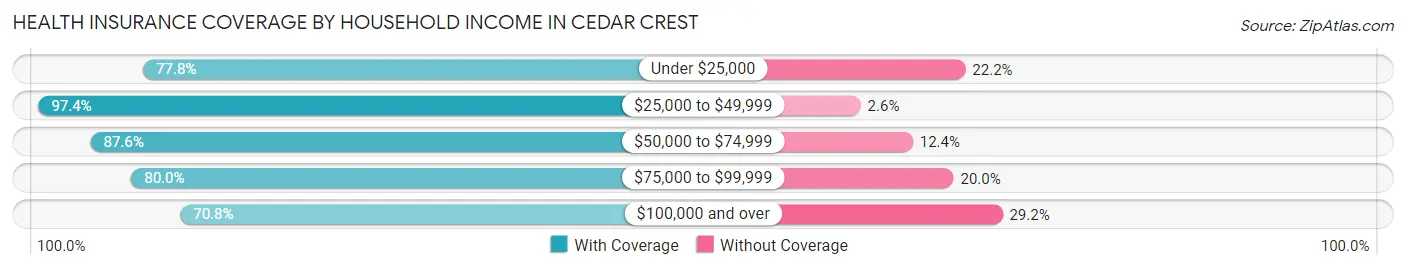
| Household Income | With Coverage | Without Coverage |
| Under $25,000 | 21 (77.8%) | 6 (22.2%) |
| $25,000 to $49,999 | 75 (97.4%) | 2 (2.6%) |
| $50,000 to $74,999 | 78 (87.6%) | 11 (12.4%) |
| $75,000 to $99,999 | 32 (80.0%) | 8 (20.0%) |
| $100,000 and over | 17 (70.8%) | 7 (29.2%) |
Public vs Private Health Insurance Coverage by Age in Cedar Crest
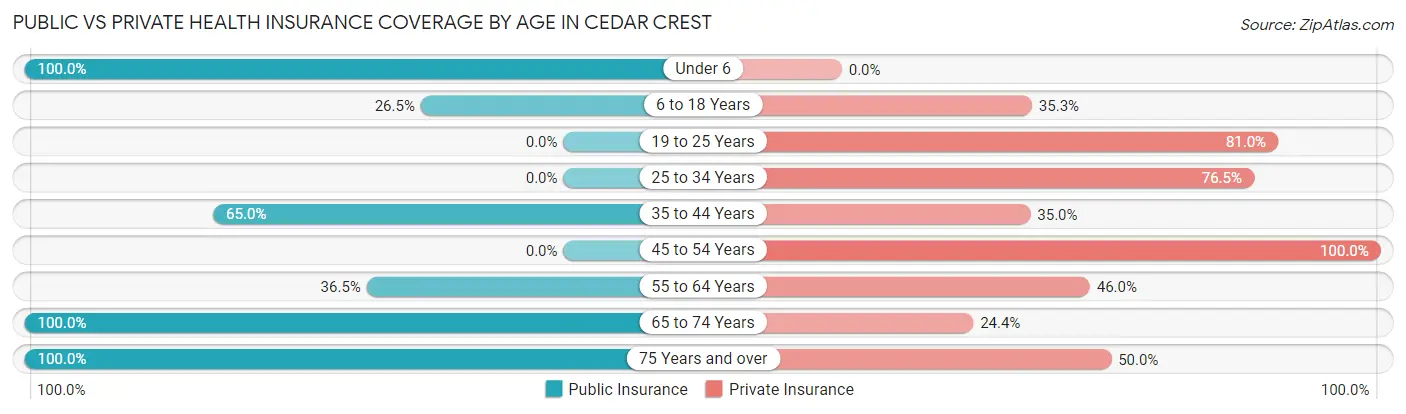
| Age Bracket | Public Insurance | Private Insurance |
| Under 6 | 25 (100.0%) | 0 (0.0%) |
| 6 to 18 Years | 9 (26.5%) | 12 (35.3%) |
| 19 to 25 Years | 0 (0.0%) | 17 (80.9%) |
| 25 to 34 Years | 0 (0.0%) | 13 (76.5%) |
| 35 to 44 Years | 13 (65.0%) | 7 (35.0%) |
| 45 to 54 Years | 0 (0.0%) | 20 (100.0%) |
| 55 to 64 Years | 23 (36.5%) | 29 (46.0%) |
| 65 to 74 Years | 41 (100.0%) | 10 (24.4%) |
| 75 Years and over | 16 (100.0%) | 8 (50.0%) |
| Total | 127 (49.4%) | 116 (45.1%) |
Disability Status by Sex by Age in Cedar Crest
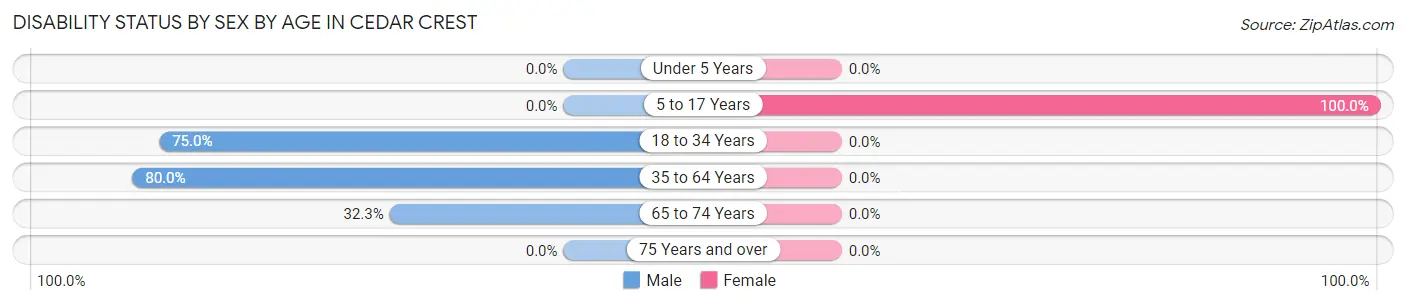
| Age Bracket | Male | Female |
| Under 5 Years | 0 (0.0%) | 0 (0.0%) |
| 5 to 17 Years | 0 (0.0%) | 9 (100.0%) |
| 18 to 34 Years | 15 (75.0%) | 0 (0.0%) |
| 35 to 64 Years | 44 (80.0%) | 0 (0.0%) |
| 65 to 74 Years | 10 (32.3%) | 0 (0.0%) |
| 75 Years and over | 0 (0.0%) | 0 (0.0%) |
Disability Class by Sex by Age in Cedar Crest
Disability Class: Hearing Difficulty
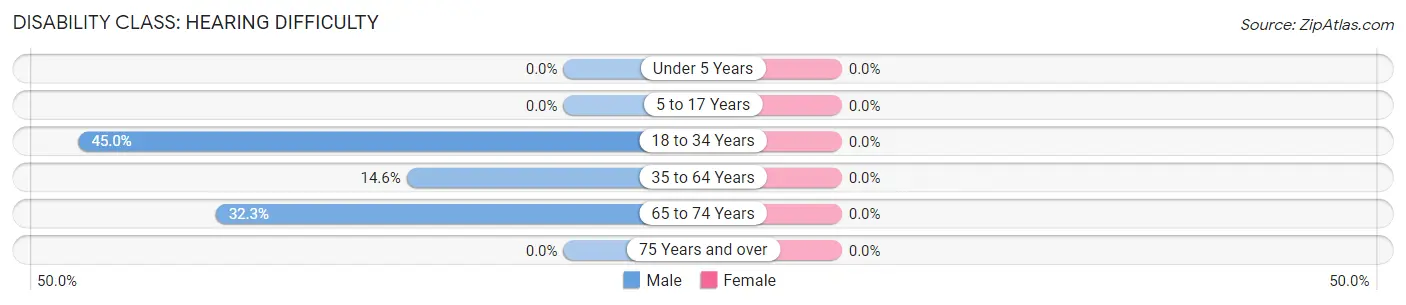
| Age Bracket | Male | Female |
| Under 5 Years | 0 (0.0%) | 0 (0.0%) |
| 5 to 17 Years | 0 (0.0%) | 0 (0.0%) |
| 18 to 34 Years | 9 (45.0%) | 0 (0.0%) |
| 35 to 64 Years | 8 (14.5%) | 0 (0.0%) |
| 65 to 74 Years | 10 (32.3%) | 0 (0.0%) |
| 75 Years and over | 0 (0.0%) | 0 (0.0%) |
Disability Class: Vision Difficulty
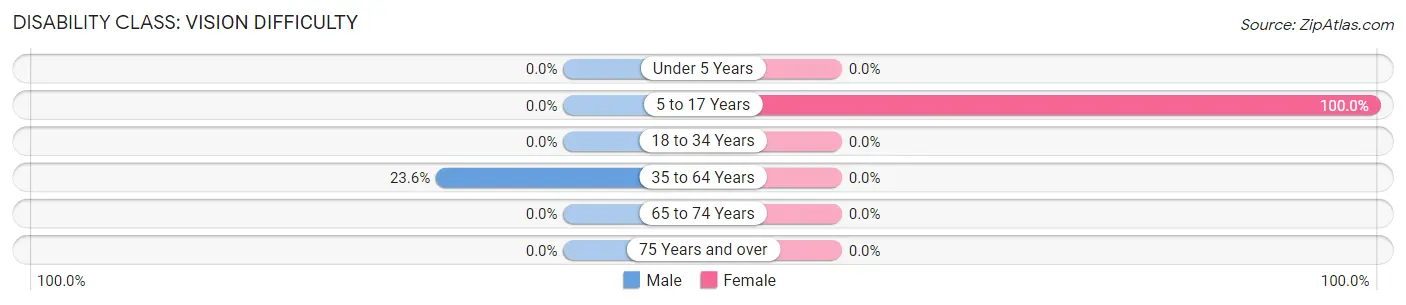
| Age Bracket | Male | Female |
| Under 5 Years | 0 (0.0%) | 0 (0.0%) |
| 5 to 17 Years | 0 (0.0%) | 9 (100.0%) |
| 18 to 34 Years | 0 (0.0%) | 0 (0.0%) |
| 35 to 64 Years | 13 (23.6%) | 0 (0.0%) |
| 65 to 74 Years | 0 (0.0%) | 0 (0.0%) |
| 75 Years and over | 0 (0.0%) | 0 (0.0%) |
Disability Class: Cognitive Difficulty
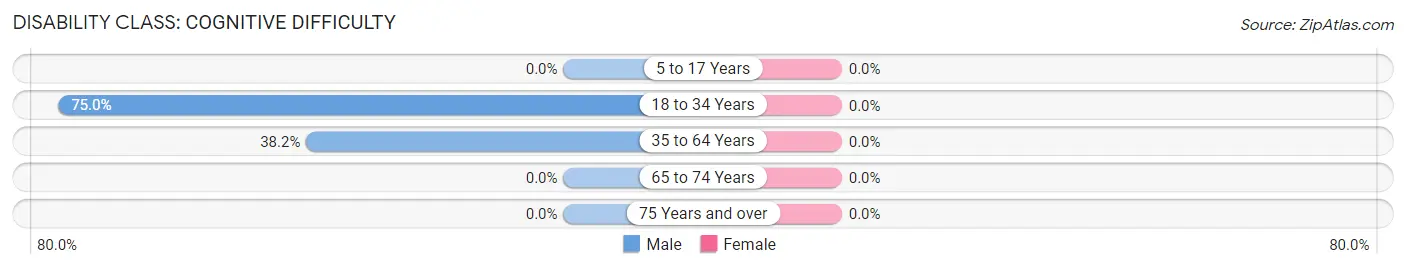
| Age Bracket | Male | Female |
| 5 to 17 Years | 0 (0.0%) | 0 (0.0%) |
| 18 to 34 Years | 15 (75.0%) | 0 (0.0%) |
| 35 to 64 Years | 21 (38.2%) | 0 (0.0%) |
| 65 to 74 Years | 0 (0.0%) | 0 (0.0%) |
| 75 Years and over | 0 (0.0%) | 0 (0.0%) |
Disability Class: Ambulatory Difficulty
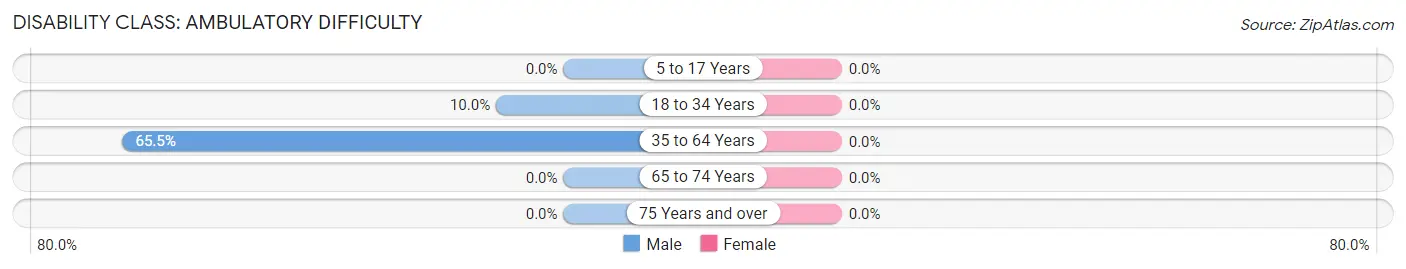
| Age Bracket | Male | Female |
| 5 to 17 Years | 0 (0.0%) | 0 (0.0%) |
| 18 to 34 Years | 2 (10.0%) | 0 (0.0%) |
| 35 to 64 Years | 36 (65.4%) | 0 (0.0%) |
| 65 to 74 Years | 0 (0.0%) | 0 (0.0%) |
| 75 Years and over | 0 (0.0%) | 0 (0.0%) |
Disability Class: Self-Care Difficulty
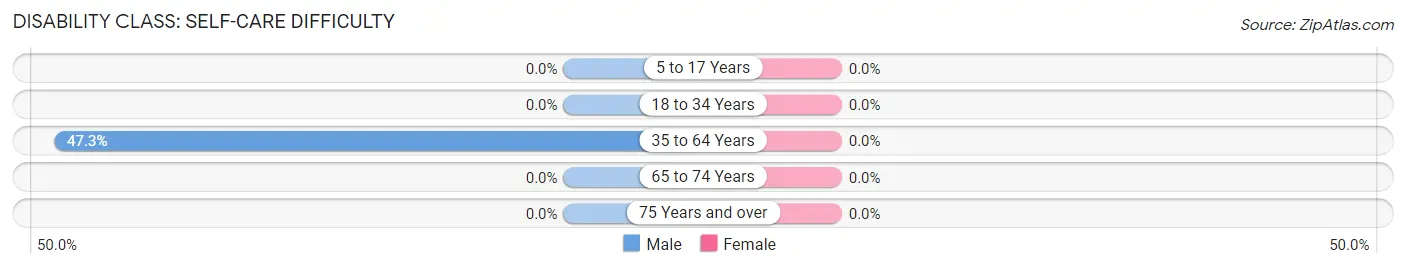
| Age Bracket | Male | Female |
| 5 to 17 Years | 0 (0.0%) | 0 (0.0%) |
| 18 to 34 Years | 0 (0.0%) | 0 (0.0%) |
| 35 to 64 Years | 26 (47.3%) | 0 (0.0%) |
| 65 to 74 Years | 0 (0.0%) | 0 (0.0%) |
| 75 Years and over | 0 (0.0%) | 0 (0.0%) |
Technology Access in Cedar Crest
Computing Device Access in Cedar Crest
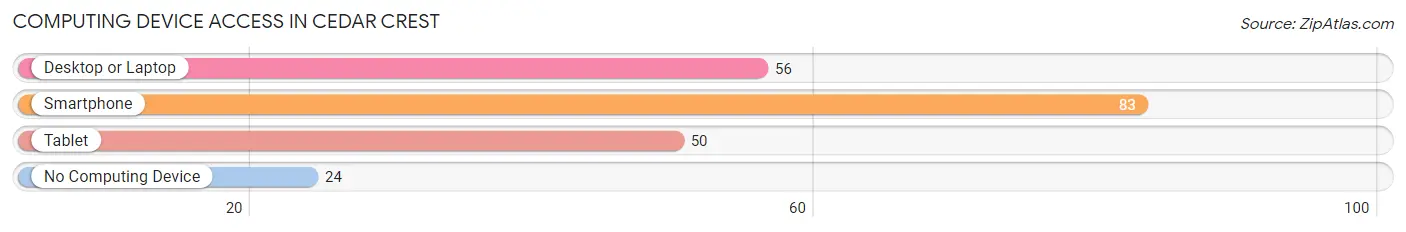
| Device Type | # Households | % Households |
| Desktop or Laptop | 56 | 47.5% |
| Smartphone | 83 | 70.3% |
| Tablet | 50 | 42.4% |
| No Computing Device | 24 | 20.3% |
| Total | 118 | 100.0% |
Internet Access in Cedar Crest
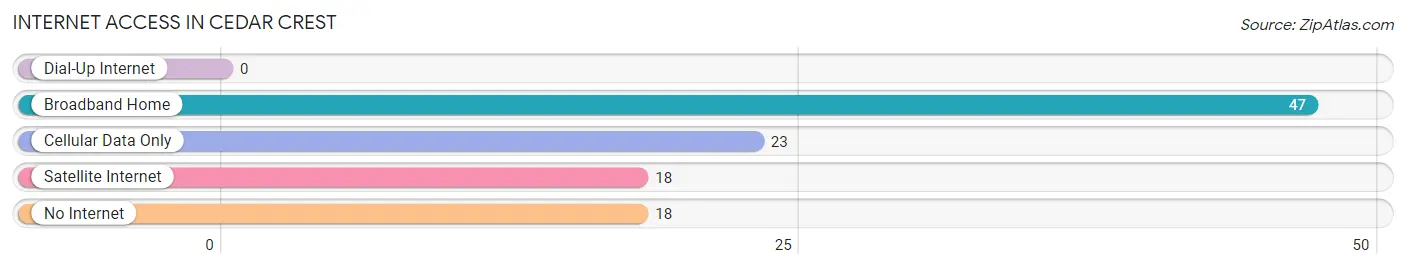
| Internet Type | # Households | % Households |
| Dial-Up Internet | 0 | 0.0% |
| Broadband Home | 47 | 39.8% |
| Cellular Data Only | 23 | 19.5% |
| Satellite Internet | 18 | 15.2% |
| No Internet | 18 | 15.2% |
| Total | 118 | 100.0% |
Cedar Crest Summary
Cedar Crest is a small unincorporated community located in the northeastern corner of Oklahoma, in the foothills of the Ozark Mountains. It is situated in Adair County, approximately 10 miles south of the Arkansas border. The town was founded in the late 1800s and has a population of approximately 200 people.
History
Cedar Crest was founded in the late 1800s by a group of settlers from Arkansas. The town was named after the cedar trees that grew in the area. The settlers built a small church and a general store, and the town quickly grew. By the early 1900s, Cedar Crest had a post office, a school, and several businesses.
In the 1920s, the town was home to a large sawmill, which provided employment for many of the town’s residents. The sawmill was destroyed in a fire in the 1930s, and the town’s economy suffered as a result. In the 1940s, the town was home to a large poultry farm, which provided employment for many of the town’s residents.
In the 1950s, the town was home to a large dairy farm, which provided employment for many of the town’s residents. The dairy farm closed in the 1960s, and the town’s economy suffered as a result. In the 1970s, the town was home to a large cattle ranch, which provided employment for many of the town’s residents. The cattle ranch closed in the 1980s, and the town’s economy suffered as a result.
Geography
Cedar Crest is located in the northeastern corner of Oklahoma, in the foothills of the Ozark Mountains. The town is situated in Adair County, approximately 10 miles south of the Arkansas border. The town is located on the banks of the Illinois River, which flows through the area. The town is surrounded by rolling hills and forests, and is home to a variety of wildlife, including deer, turkey, and other small game.
Economy
Cedar Crest’s economy is largely based on agriculture. The town is home to several small farms, which produce a variety of crops, including corn, soybeans, wheat, and hay. The town is also home to several small businesses, including a general store, a gas station, and a restaurant.
Demographics
As of the 2010 census, the population of Cedar Crest was approximately 200 people. The town is predominantly white, with a small minority population. The median household income in the town is approximately $30,000, and the median home value is approximately $90,000. The town has a high rate of poverty, with approximately 25% of the population living below the poverty line.
Common Questions
What is Per Capita Income in Cedar Crest?
Per Capita income in Cedar Crest is $22,843.
What is the Median Family Income in Cedar Crest?
Median Family Income in Cedar Crest is $73,438.
What is the Median Household income in Cedar Crest?
Median Household Income in Cedar Crest is $41,500.
What is Income or Wage Gap in Cedar Crest?
Income or Wage Gap in Cedar Crest is 27.2%.
Women in Cedar Crest earn 72.8 cents for every dollar earned by a man.
What is Inequality or Gini Index in Cedar Crest?
Inequality or Gini Index in Cedar Crest is 0.36.
What is the Total Population of Cedar Crest?
Total Population of Cedar Crest is 257.
What is the Total Male Population of Cedar Crest?
Total Male Population of Cedar Crest is 134.
What is the Total Female Population of Cedar Crest?
Total Female Population of Cedar Crest is 123.
What is the Ratio of Males per 100 Females in Cedar Crest?
There are 108.94 Males per 100 Females in Cedar Crest.
What is the Ratio of Females per 100 Males in Cedar Crest?
There are 91.79 Females per 100 Males in Cedar Crest.
What is the Median Population Age in Cedar Crest?
Median Population Age in Cedar Crest is 49.6 Years.
What is the Average Family Size in Cedar Crest
Average Family Size in Cedar Crest is 3.0 People.
What is the Average Household Size in Cedar Crest
Average Household Size in Cedar Crest is 2.2 People.
How Large is the Labor Force in Cedar Crest?
There are 104 People in the Labor Forcein in Cedar Crest.
What is the Percentage of People in the Labor Force in Cedar Crest?
46.6% of People are in the Labor Force in Cedar Crest.