Flute Springs, OK Map & Demographics
Flute Springs Map
Flute Springs Overview
$19,304
PER CAPITA INCOME
$69,583
AVG FAMILY INCOME
0.43
INEQUALITY / GINI INDEX
97
TOTAL POPULATION
60
MALE POPULATION
37
FEMALE POPULATION
162.16
MALES / 100 FEMALES
61.67
FEMALES / 100 MALES
33.8
MEDIAN AGE
3.7
AVG FAMILY SIZE
3.2
AVG HOUSEHOLD SIZE
45
LABOR FORCE [ PEOPLE ]
59.2%
PERCENT IN LABOR FORCE
20.0%
UNEMPLOYMENT RATE
Income in Flute Springs
Income Overview in Flute Springs
| Characteristic | Number | Measure |
| Per Capita Income | 97 | $19,304 |
| Median Family Income | 19 | $69,583 |
| Mean Family Income | 19 | $78,479 |
| Median Household Income | 30 | $0 |
| Mean Household Income | 30 | $59,137 |
| Income Deficit | 19 | $0 |
| Wage / Income Gap (%) | 97 | 0.00% |
| Wage / Income Gap ($) | 97 | 100.00¢ per $1 |
| Gini / Inequality Index | 97 | 0.43 |
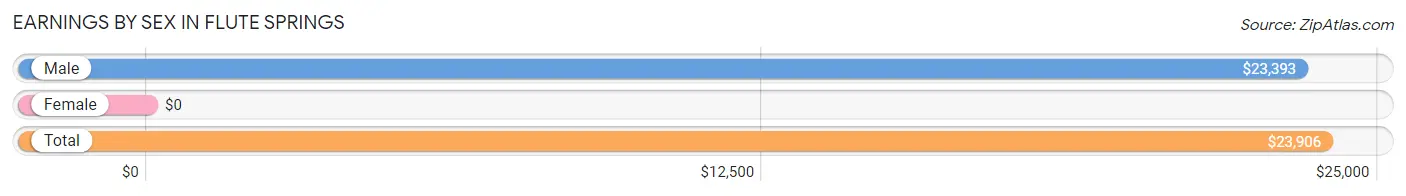
Earnings by Sex in Flute Springs
| Sex | Number | Average Earnings |
| Male | 31 (68.9%) | $23,393 |
| Female | 14 (31.1%) | $0 |
| Total | 45 (100.0%) | $23,906 |
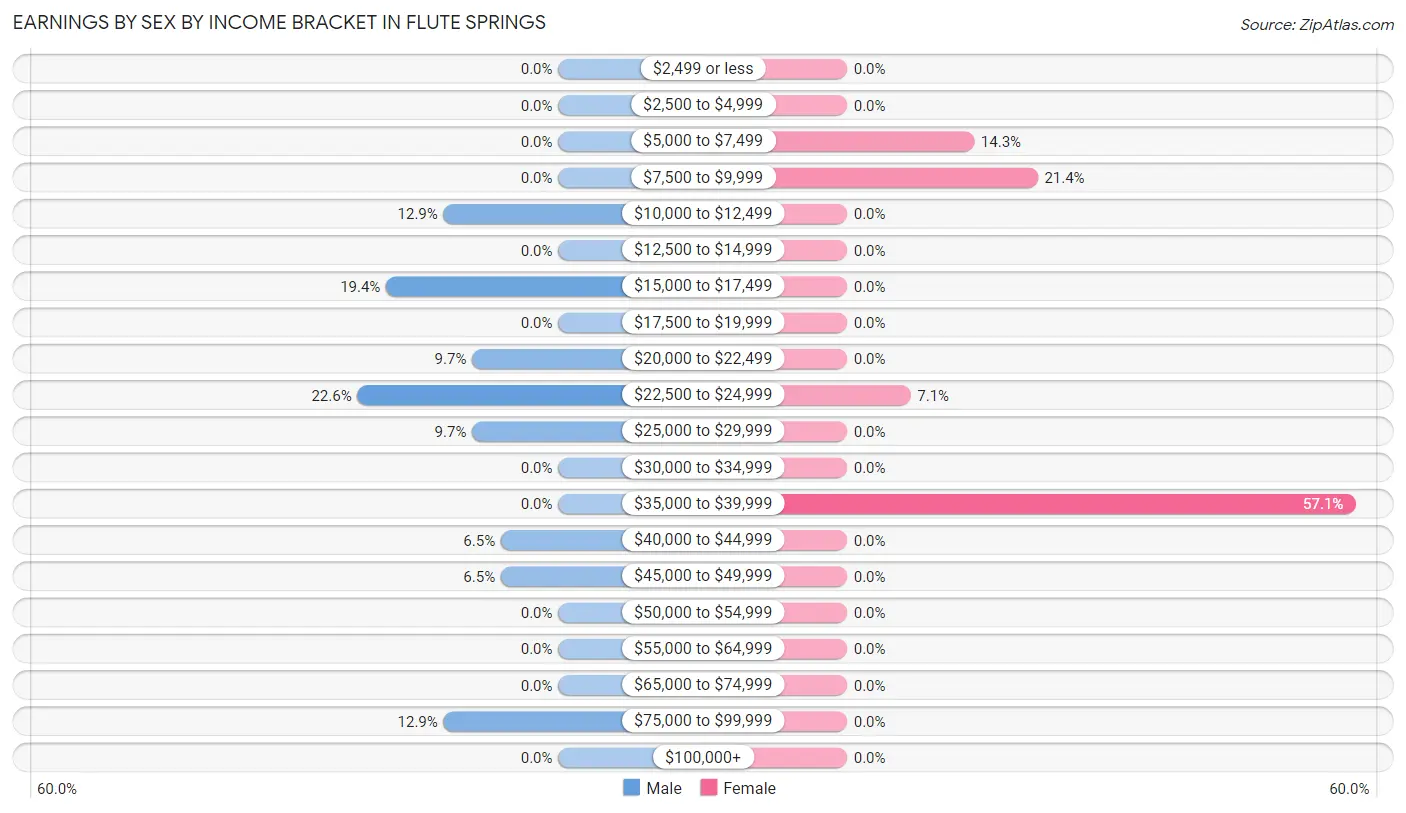
Earnings by Sex by Income Bracket in Flute Springs
The most common earnings brackets in Flute Springs are $22,500 to $24,999 for men (7 | 22.6%) and $35,000 to $39,999 for women (8 | 57.1%).
| Income | Male | Female |
| $2,499 or less | 0 (0.0%) | 0 (0.0%) |
| $2,500 to $4,999 | 0 (0.0%) | 0 (0.0%) |
| $5,000 to $7,499 | 0 (0.0%) | 2 (14.3%) |
| $7,500 to $9,999 | 0 (0.0%) | 3 (21.4%) |
| $10,000 to $12,499 | 4 (12.9%) | 0 (0.0%) |
| $12,500 to $14,999 | 0 (0.0%) | 0 (0.0%) |
| $15,000 to $17,499 | 6 (19.4%) | 0 (0.0%) |
| $17,500 to $19,999 | 0 (0.0%) | 0 (0.0%) |
| $20,000 to $22,499 | 3 (9.7%) | 0 (0.0%) |
| $22,500 to $24,999 | 7 (22.6%) | 1 (7.1%) |
| $25,000 to $29,999 | 3 (9.7%) | 0 (0.0%) |
| $30,000 to $34,999 | 0 (0.0%) | 0 (0.0%) |
| $35,000 to $39,999 | 0 (0.0%) | 8 (57.1%) |
| $40,000 to $44,999 | 2 (6.5%) | 0 (0.0%) |
| $45,000 to $49,999 | 2 (6.5%) | 0 (0.0%) |
| $50,000 to $54,999 | 0 (0.0%) | 0 (0.0%) |
| $55,000 to $64,999 | 0 (0.0%) | 0 (0.0%) |
| $65,000 to $74,999 | 0 (0.0%) | 0 (0.0%) |
| $75,000 to $99,999 | 4 (12.9%) | 0 (0.0%) |
| $100,000+ | 0 (0.0%) | 0 (0.0%) |
| Total | 31 (100.0%) | 14 (100.0%) |
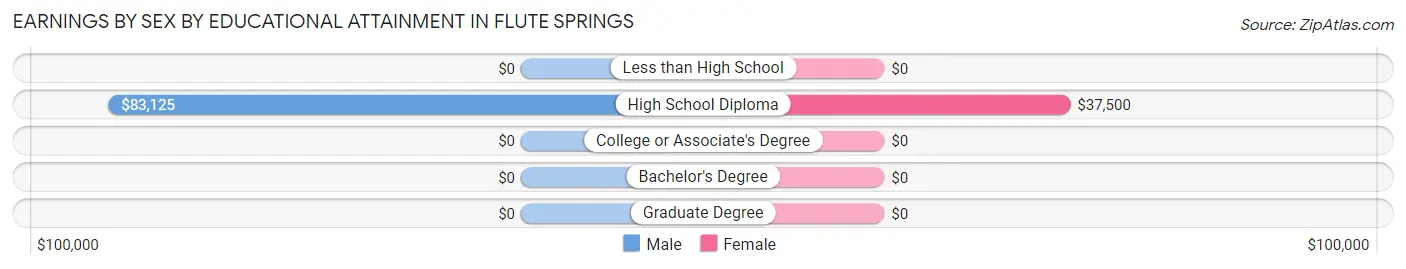
Earnings by Sex by Educational Attainment in Flute Springs
| Educational Attainment | Male Income | Female Income |
| Less than High School | - | - |
| High School Diploma | $83,125 | $37,500 |
| College or Associate's Degree | - | - |
| Bachelor's Degree | - | - |
| Graduate Degree | - | - |
| Total | - | - |
Family Income in Flute Springs
Family Income Brackets in Flute Springs
According to the Flute Springs family income data, there are 7 families falling into the $75,000 to $99,999 income range, which is the most common income bracket and makes up 36.8% of all families.
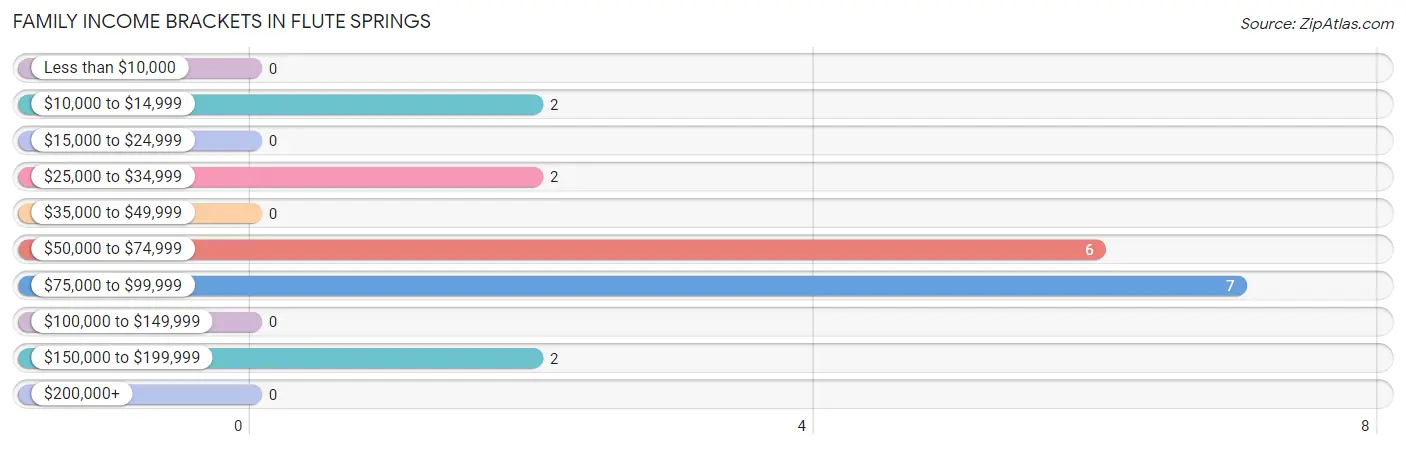
| Income Bracket | # Families | % Families |
| Less than $10,000 | 0 | 0.0% |
| $10,000 to $14,999 | 2 | 10.5% |
| $15,000 to $24,999 | 0 | 0.0% |
| $25,000 to $34,999 | 2 | 10.5% |
| $35,000 to $49,999 | 0 | 0.0% |
| $50,000 to $74,999 | 6 | 31.6% |
| $75,000 to $99,999 | 7 | 36.8% |
| $100,000 to $149,999 | 0 | 0.0% |
| $150,000 to $199,999 | 2 | 10.5% |
| $200,000+ | 0 | 0.0% |
Family Income by Famaliy Size in Flute Springs
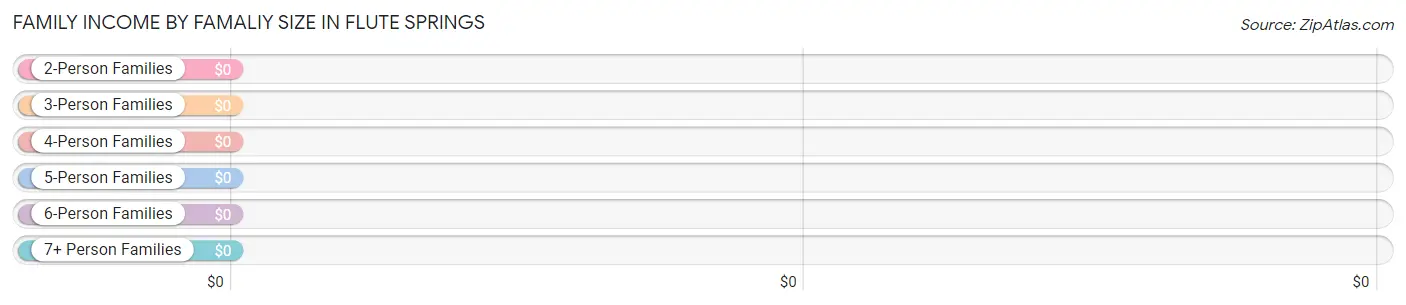
| Income Bracket | # Families | Median Income |
| 2-Person Families | 3 (15.8%) | $0 |
| 3-Person Families | 9 (47.4%) | $0 |
| 4-Person Families | 2 (10.5%) | $0 |
| 5-Person Families | 3 (15.8%) | $0 |
| 6-Person Families | 0 (0.0%) | $0 |
| 7+ Person Families | 2 (10.5%) | $0 |
| Total | 19 (100.0%) | $69,583 |
Family Income by Number of Earners in Flute Springs
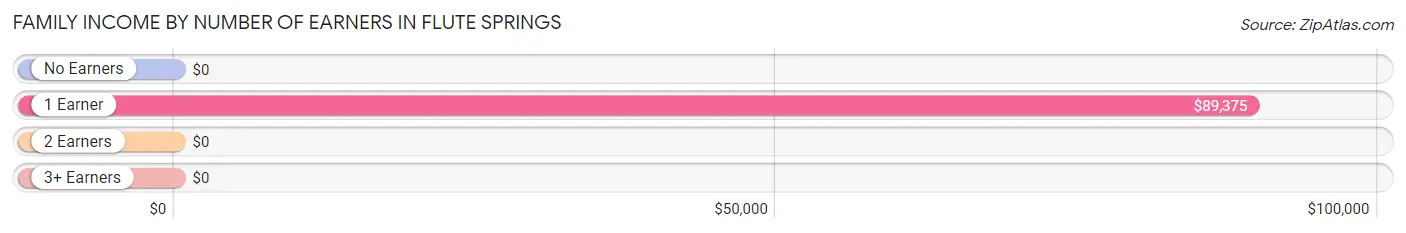
| Number of Earners | # Families | Median Income |
| No Earners | 5 (26.3%) | $0 |
| 1 Earner | 7 (36.8%) | $89,375 |
| 2 Earners | 2 (10.5%) | $0 |
| 3+ Earners | 5 (26.3%) | $0 |
| Total | 19 (100.0%) | $69,583 |
Household Income in Flute Springs
Household Income Brackets in Flute Springs
With 10 households falling in the category, the $75,000 to $99,999 income range is the most frequent in Flute Springs, accounting for 33.3% of all households.
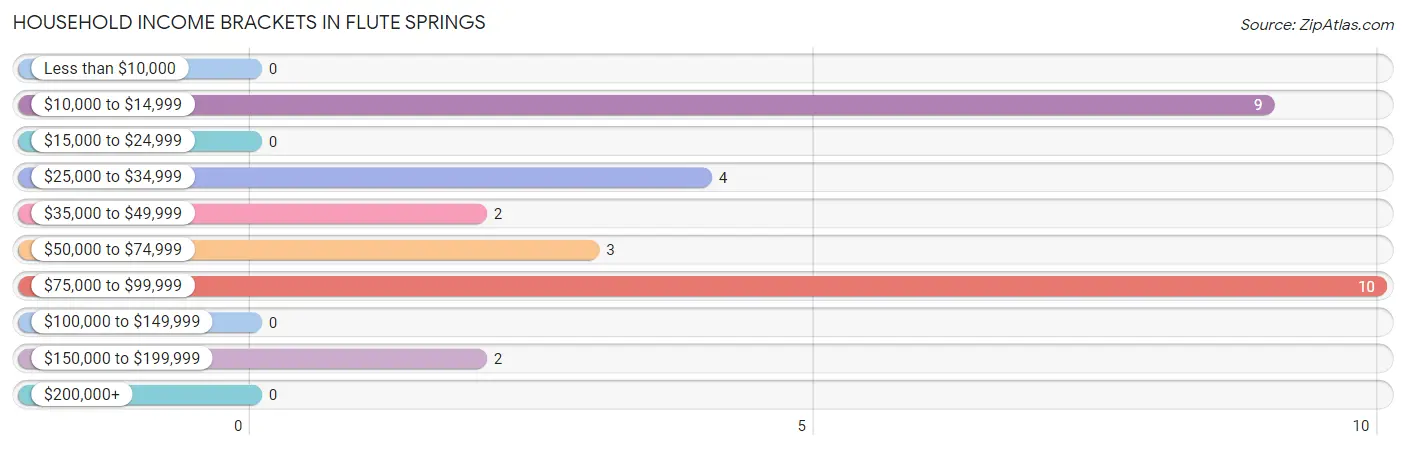
| Income Bracket | # Households | % Households |
| Less than $10,000 | 0 | 0.0% |
| $10,000 to $14,999 | 9 | 30.0% |
| $15,000 to $24,999 | 0 | 0.0% |
| $25,000 to $34,999 | 4 | 13.3% |
| $35,000 to $49,999 | 2 | 6.7% |
| $50,000 to $74,999 | 3 | 10.0% |
| $75,000 to $99,999 | 10 | 33.3% |
| $100,000 to $149,999 | 0 | 0.0% |
| $150,000 to $199,999 | 2 | 6.7% |
| $200,000+ | 0 | 0.0% |
Household Income by Householder Age in Flute Springs
The median household income in Flute Springs is $0, with the highest median household income of $52,500 found in the 45 to 64 years age bracket for the primary householder. A total of 14 households (46.7%) fall into this category.
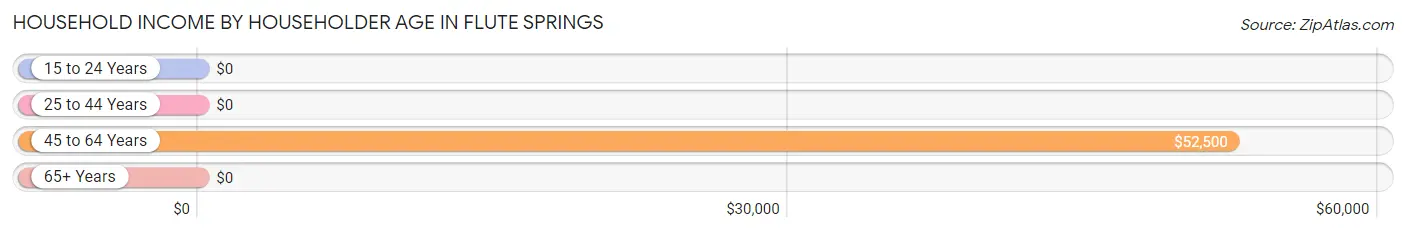
| Income Bracket | # Households | Median Income |
| 15 to 24 Years | 0 (0.0%) | $0 |
| 25 to 44 Years | 9 (30.0%) | $0 |
| 45 to 64 Years | 14 (46.7%) | $52,500 |
| 65+ Years | 7 (23.3%) | $0 |
| Total | 30 (100.0%) | $0 |
Poverty in Flute Springs
Income Below Poverty by Sex and Age in Flute Springs
With 31.7% poverty level for males and 18.9% for females among the residents of Flute Springs, 16 and 17 year old males and 45 to 54 year old females are the most vulnerable to poverty, with 1 males (100.0%) and 5 females (71.4%) in their respective age groups living below the poverty level.
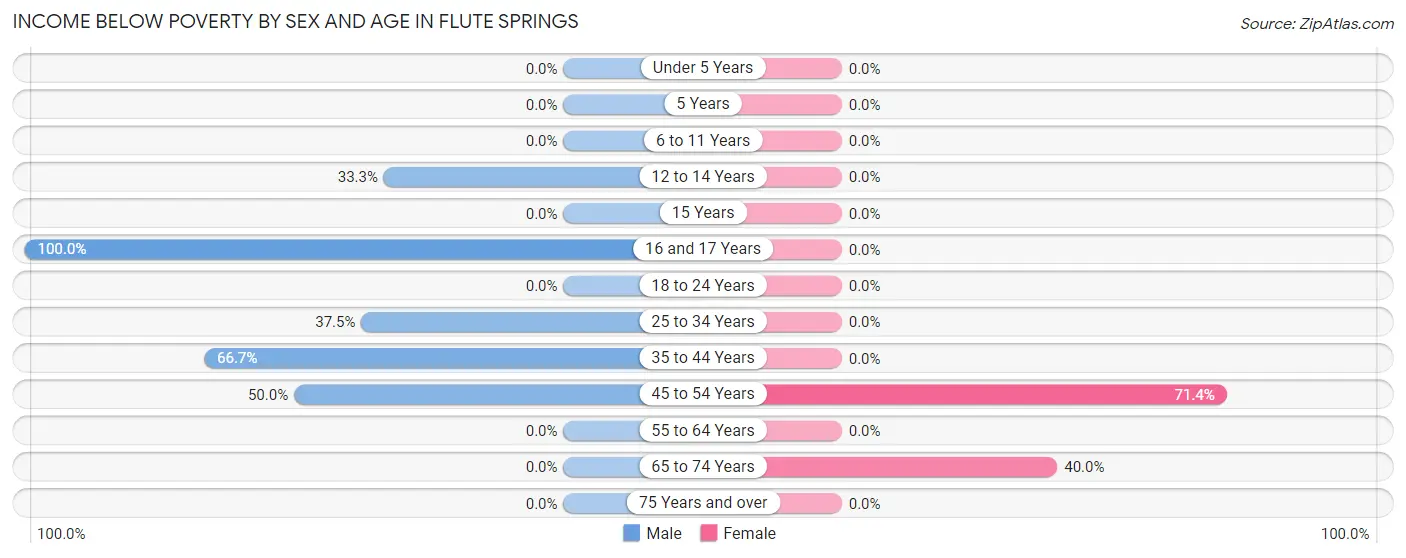
| Age Bracket | Male | Female |
| Under 5 Years | 0 (0.0%) | 0 (0.0%) |
| 5 Years | 0 (0.0%) | 0 (0.0%) |
| 6 to 11 Years | 0 (0.0%) | 0 (0.0%) |
| 12 to 14 Years | 2 (33.3%) | 0 (0.0%) |
| 15 Years | 0 (0.0%) | 0 (0.0%) |
| 16 and 17 Years | 1 (100.0%) | 0 (0.0%) |
| 18 to 24 Years | 0 (0.0%) | 0 (0.0%) |
| 25 to 34 Years | 6 (37.5%) | 0 (0.0%) |
| 35 to 44 Years | 4 (66.7%) | 0 (0.0%) |
| 45 to 54 Years | 6 (50.0%) | 5 (71.4%) |
| 55 to 64 Years | 0 (0.0%) | 0 (0.0%) |
| 65 to 74 Years | 0 (0.0%) | 2 (40.0%) |
| 75 Years and over | 0 (0.0%) | 0 (0.0%) |
| Total | 19 (31.7%) | 7 (18.9%) |
Income Above Poverty by Sex and Age in Flute Springs
According to the poverty statistics in Flute Springs, males aged 6 to 11 years and females aged under 5 years are the age groups that are most secure financially, with 100.0% of males and 100.0% of females in these age groups living above the poverty line.
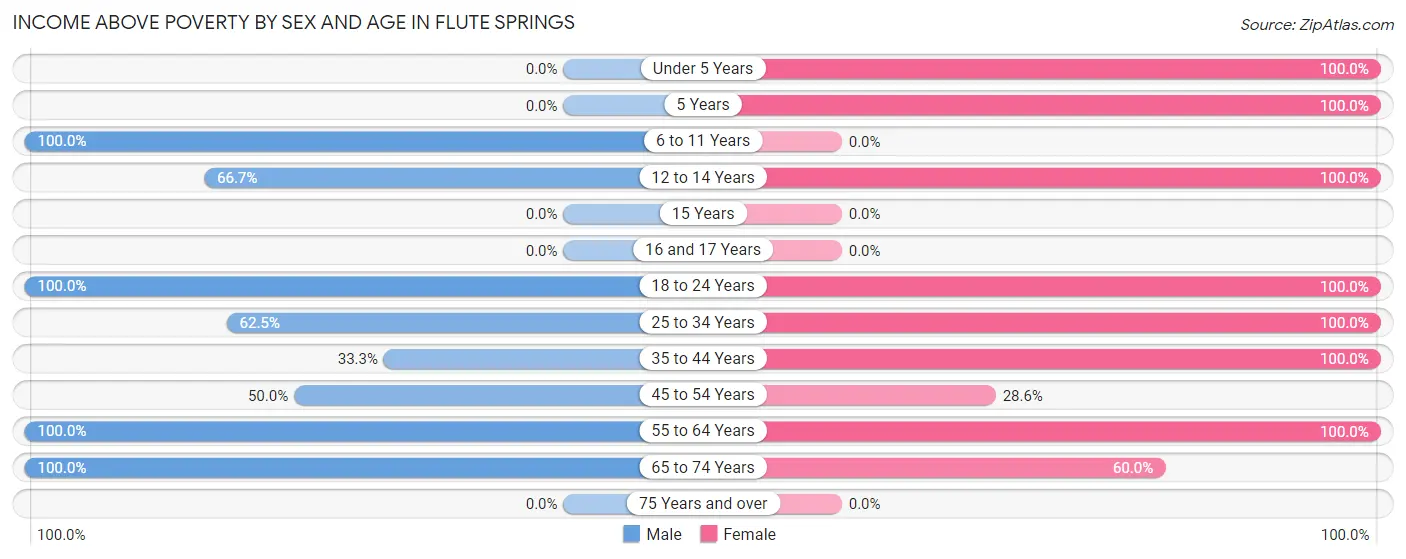
| Age Bracket | Male | Female |
| Under 5 Years | 0 (0.0%) | 3 (100.0%) |
| 5 Years | 0 (0.0%) | 2 (100.0%) |
| 6 to 11 Years | 6 (100.0%) | 0 (0.0%) |
| 12 to 14 Years | 4 (66.7%) | 4 (100.0%) |
| 15 Years | 0 (0.0%) | 0 (0.0%) |
| 16 and 17 Years | 0 (0.0%) | 0 (0.0%) |
| 18 to 24 Years | 7 (100.0%) | 3 (100.0%) |
| 25 to 34 Years | 10 (62.5%) | 7 (100.0%) |
| 35 to 44 Years | 2 (33.3%) | 3 (100.0%) |
| 45 to 54 Years | 6 (50.0%) | 2 (28.6%) |
| 55 to 64 Years | 3 (100.0%) | 3 (100.0%) |
| 65 to 74 Years | 3 (100.0%) | 3 (60.0%) |
| 75 Years and over | 0 (0.0%) | 0 (0.0%) |
| Total | 41 (68.3%) | 30 (81.1%) |
Income Below Poverty Among Married-Couple Families in Flute Springs
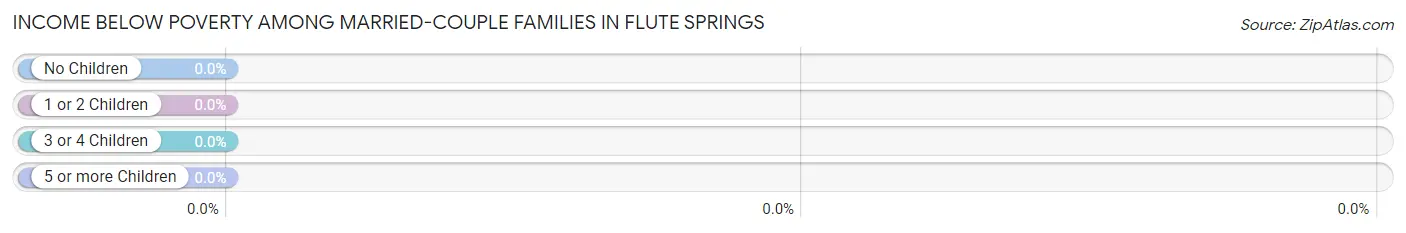
| Children | Above Poverty | Below Poverty |
| No Children | 6 (100.0%) | 0 (0.0%) |
| 1 or 2 Children | 6 (100.0%) | 0 (0.0%) |
| 3 or 4 Children | 0 (0.0%) | 0 (0.0%) |
| 5 or more Children | 0 (0.0%) | 0 (0.0%) |
| Total | 12 (100.0%) | 0 (0.0%) |
Income Below Poverty Among Single-Parent Households in Flute Springs
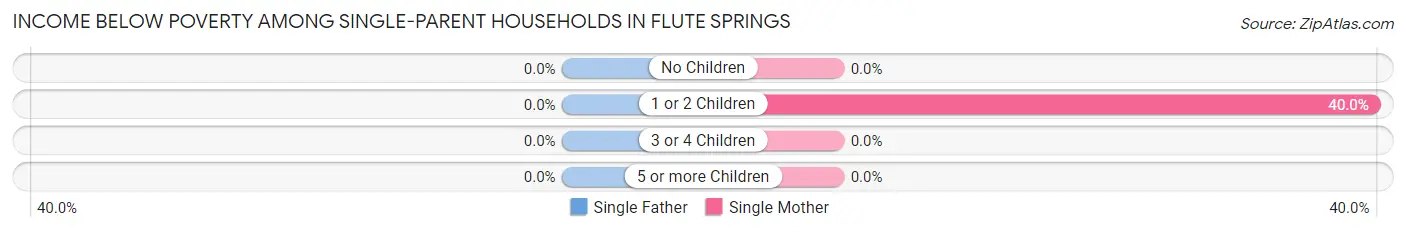
| Children | Single Father | Single Mother |
| No Children | 0 (0.0%) | 0 (0.0%) |
| 1 or 2 Children | 0 (0.0%) | 2 (40.0%) |
| 3 or 4 Children | 0 (0.0%) | 0 (0.0%) |
| 5 or more Children | 0 (0.0%) | 0 (0.0%) |
| Total | 0 (0.0%) | 2 (40.0%) |
Income Below Poverty Among Married-Couple vs Single-Parent Households in Flute Springs
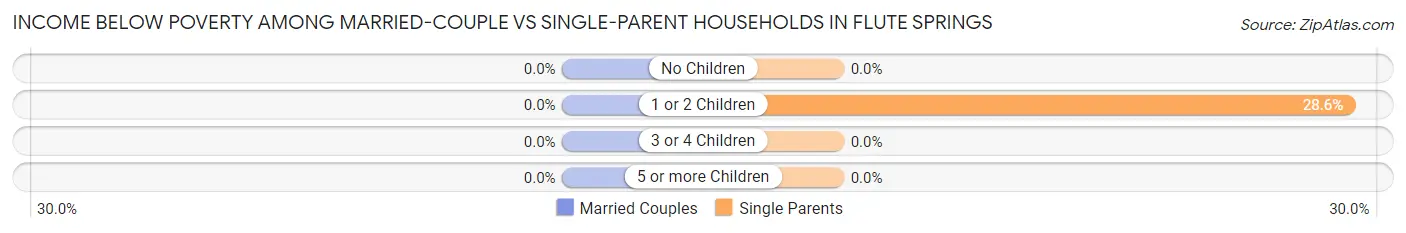
| Children | Married-Couple Families | Single-Parent Households |
| No Children | 0 (0.0%) | 0 (0.0%) |
| 1 or 2 Children | 0 (0.0%) | 2 (28.6%) |
| 3 or 4 Children | 0 (0.0%) | 0 (0.0%) |
| 5 or more Children | 0 (0.0%) | 0 (0.0%) |
| Total | 0 (0.0%) | 2 (28.6%) |
Race in Flute Springs
The most populous races in Flute Springs are Native / Alaskan (66 | 68.0%), Two or more Races (21 | 21.6%), and White / Caucasian (10 | 10.3%).
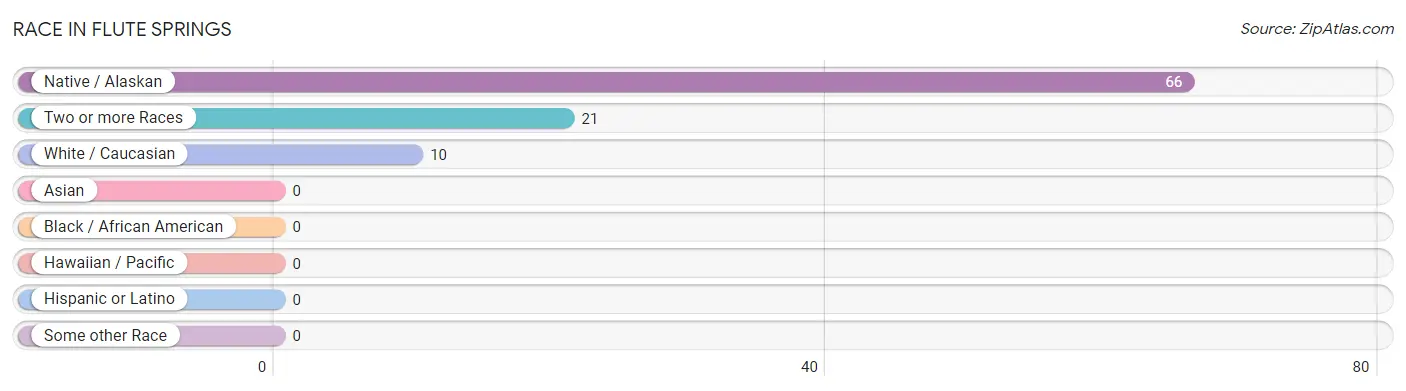
| Race | # Population | % Population |
| Asian | 0 | 0.0% |
| Black / African American | 0 | 0.0% |
| Hawaiian / Pacific | 0 | 0.0% |
| Hispanic or Latino | 0 | 0.0% |
| Native / Alaskan | 66 | 68.0% |
| White / Caucasian | 10 | 10.3% |
| Two or more Races | 21 | 21.6% |
| Some other Race | 0 | 0.0% |
| Total | 97 | 100.0% |
Ancestry in Flute Springs
The most populous ancestries reported in Flute Springs are Cherokee (85 | 87.6%), and Irish (6 | 6.2%), together accounting for 93.8% of all Flute Springs residents.
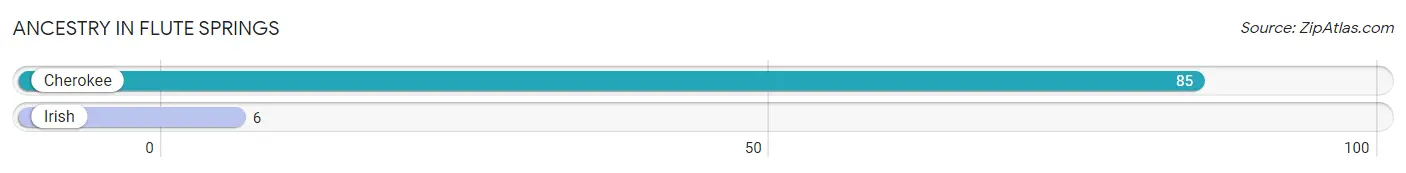
| Ancestry | # Population | % Population |
| Cherokee | 85 | 87.6% |
| Irish | 6 | 6.2% | View All 2 Rows |
Immigrants in Flute Springs

| Immigration Origin | # Population | % Population | View All 0 Rows |
Sex and Age in Flute Springs
Sex and Age in Flute Springs
The most populous age groups in Flute Springs are 30 to 34 Years (16 | 26.7%) for men and 30 to 34 Years (7 | 18.9%) for women.
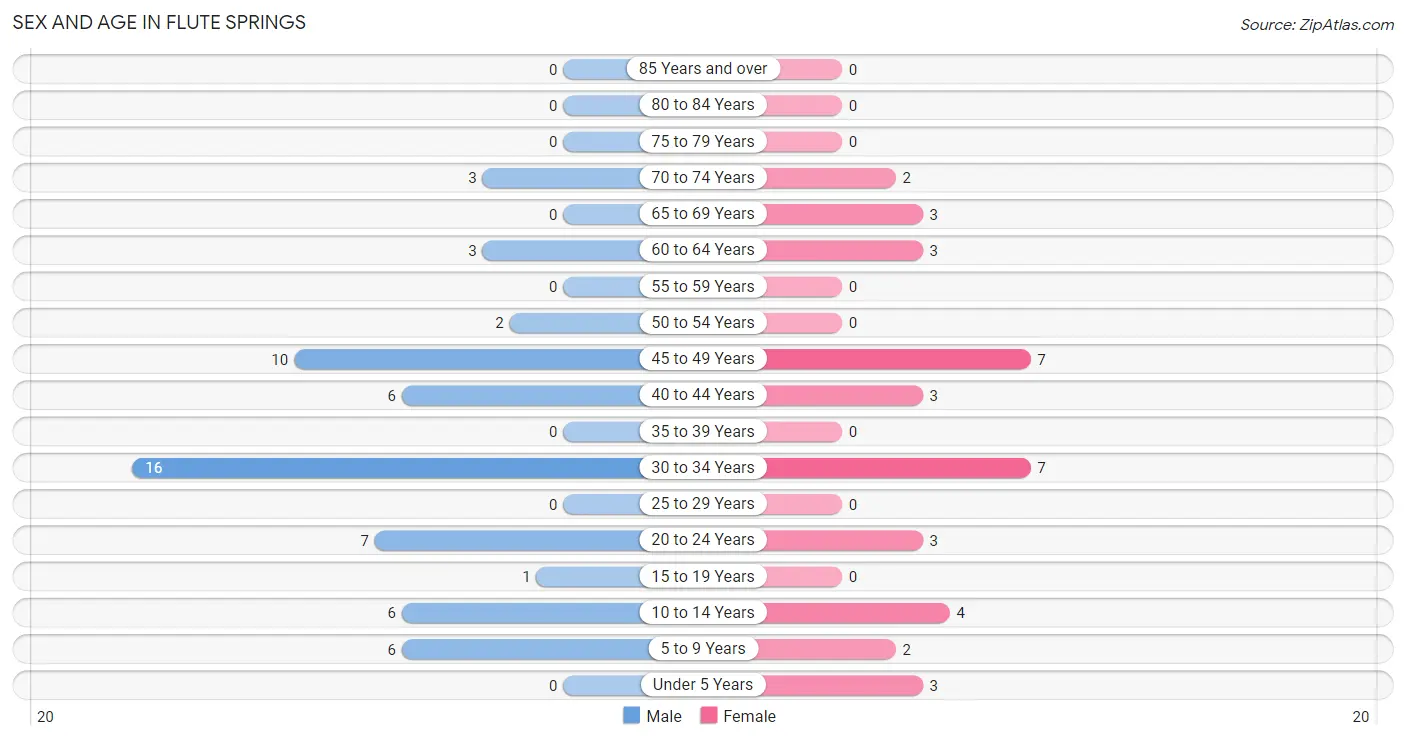
| Age Bracket | Male | Female |
| Under 5 Years | 0 (0.0%) | 3 (8.1%) |
| 5 to 9 Years | 6 (10.0%) | 2 (5.4%) |
| 10 to 14 Years | 6 (10.0%) | 4 (10.8%) |
| 15 to 19 Years | 1 (1.7%) | 0 (0.0%) |
| 20 to 24 Years | 7 (11.7%) | 3 (8.1%) |
| 25 to 29 Years | 0 (0.0%) | 0 (0.0%) |
| 30 to 34 Years | 16 (26.7%) | 7 (18.9%) |
| 35 to 39 Years | 0 (0.0%) | 0 (0.0%) |
| 40 to 44 Years | 6 (10.0%) | 3 (8.1%) |
| 45 to 49 Years | 10 (16.7%) | 7 (18.9%) |
| 50 to 54 Years | 2 (3.3%) | 0 (0.0%) |
| 55 to 59 Years | 0 (0.0%) | 0 (0.0%) |
| 60 to 64 Years | 3 (5.0%) | 3 (8.1%) |
| 65 to 69 Years | 0 (0.0%) | 3 (8.1%) |
| 70 to 74 Years | 3 (5.0%) | 2 (5.4%) |
| 75 to 79 Years | 0 (0.0%) | 0 (0.0%) |
| 80 to 84 Years | 0 (0.0%) | 0 (0.0%) |
| 85 Years and over | 0 (0.0%) | 0 (0.0%) |
| Total | 60 (100.0%) | 37 (100.0%) |
Families and Households in Flute Springs
Median Family Size in Flute Springs
The median family size in Flute Springs is 3.74 persons per family, with single female/mother families (5 | 26.3%) accounting for the largest median family size of 4 persons per family. On the other hand, single male/father families (2 | 10.5%) represent the smallest median family size with 3.00 persons per family.
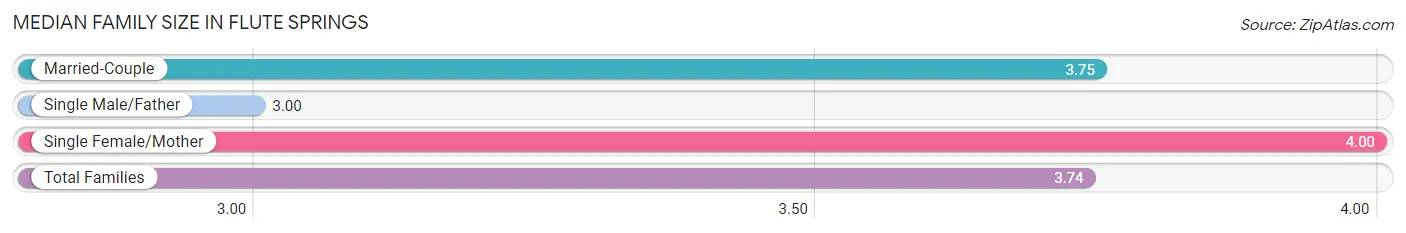
| Family Type | # Families | Family Size |
| Married-Couple | 12 (63.2%) | 3.75 |
| Single Male/Father | 2 (10.5%) | 3.00 |
| Single Female/Mother | 5 (26.3%) | 4.00 |
| Total Families | 19 (100.0%) | 3.74 |
Median Household Size in Flute Springs
The median household size in Flute Springs is 3.23 persons per household, with single female/mother households (5 | 16.7%) accounting for the largest median household size of 5.4 persons per household. non-family households (11 | 36.7%) represent the smallest median household size with 1.73 persons per household.
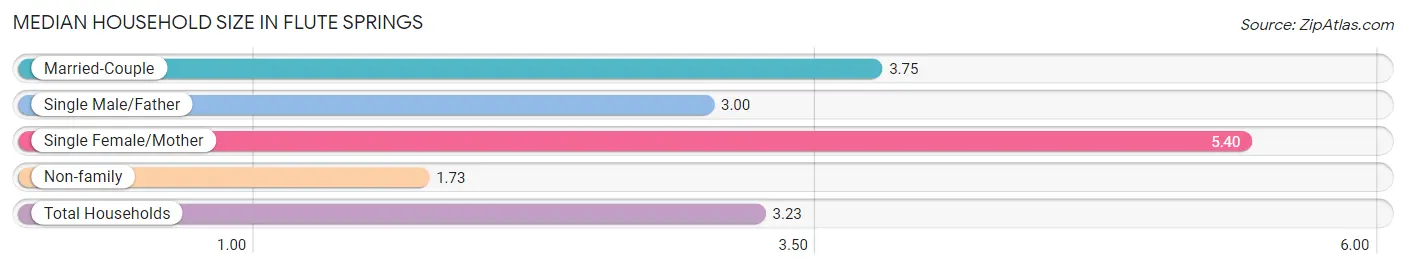
| Household Type | # Households | Household Size |
| Married-Couple | 12 (40.0%) | 3.75 |
| Single Male/Father | 2 (6.7%) | 3.00 |
| Single Female/Mother | 5 (16.7%) | 5.40 |
| Non-family | 11 (36.7%) | 1.73 |
| Total Households | 30 (100.0%) | 3.23 |
Household Size by Marriage Status in Flute Springs
Out of a total of 30 households in Flute Springs, 19 (63.3%) are family households, while 11 (36.7%) are nonfamily households. The most numerous type of family households are 3-person households, comprising 7, and the most common type of nonfamily households are 1-person households, comprising 9.
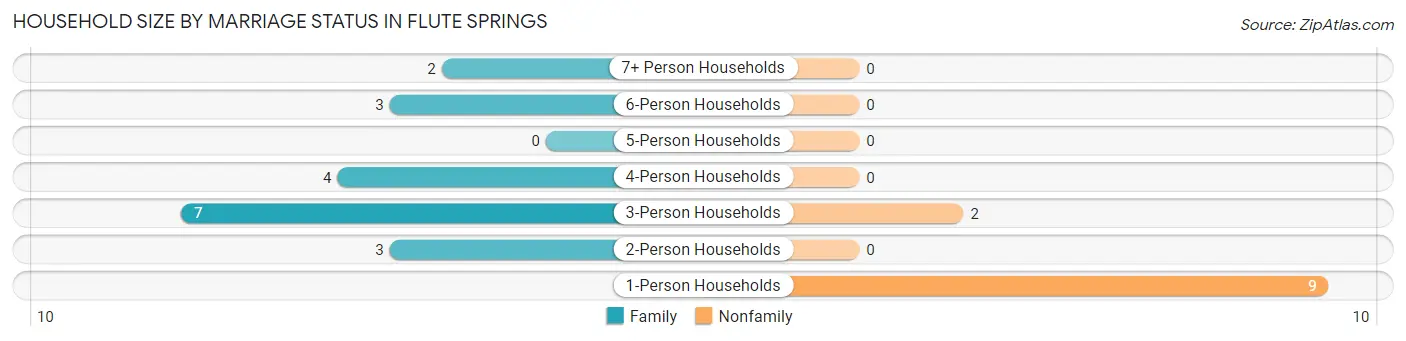
| Household Size | Family Households | Nonfamily Households |
| 1-Person Households | - | 9 (30.0%) |
| 2-Person Households | 3 (10.0%) | 0 (0.0%) |
| 3-Person Households | 7 (23.3%) | 2 (6.7%) |
| 4-Person Households | 4 (13.3%) | 0 (0.0%) |
| 5-Person Households | 0 (0.0%) | 0 (0.0%) |
| 6-Person Households | 3 (10.0%) | 0 (0.0%) |
| 7+ Person Households | 2 (6.7%) | 0 (0.0%) |
| Total | 19 (63.3%) | 11 (36.7%) |
Female Fertility in Flute Springs
Fertility by Age in Flute Springs
| Age Bracket | Women with Births | Births / 1,000 Women |
| 15 to 19 years | 0 (0.0%) | 0.0 |
| 20 to 34 years | 0 (0.0%) | 0.0 |
| 35 to 50 years | 0 (0.0%) | 0.0 |
| Total | 0 (0.0%) | 0.0 |
Fertility by Age by Marriage Status in Flute Springs
| Age Bracket | Married | Unmarried |
| 15 to 19 years | 0 (0.0%) | 0 (0.0%) |
| 20 to 34 years | 0 (0.0%) | 0 (0.0%) |
| 35 to 50 years | 0 (0.0%) | 0 (0.0%) |
| Total | 0 (0.0%) | 0 (0.0%) |
Fertility by Education in Flute Springs
| Educational Attainment | Women with Births | Births / 1,000 Women |
| Less than High School | 0 (0.0%) | 0.0 |
| High School Diploma | 0 (0.0%) | 0.0 |
| College or Associate's Degree | 0 (0.0%) | 0.0 |
| Bachelor's Degree | 0 (0.0%) | 0.0 |
| Graduate Degree | 0 (0.0%) | 0.0 |
| Total | 0 (0.0%) | 0.0 |
Fertility by Education by Marriage Status in Flute Springs
| Educational Attainment | Married | Unmarried |
| Less than High School | 0 (0.0%) | 0 (0.0%) |
| High School Diploma | 0 (0.0%) | 0 (0.0%) |
| College or Associate's Degree | 0 (0.0%) | 0 (0.0%) |
| Bachelor's Degree | 0 (0.0%) | 0 (0.0%) |
| Graduate Degree | 0 (0.0%) | 0 (0.0%) |
| Total | 0 (0.0%) | 0 (0.0%) |
Employment Characteristics in Flute Springs
Employment by Class of Employer in Flute Springs
Among the 36 employed individuals in Flute Springs, private company employees (25 | 69.4%), self-employed (not incorporated) (5 | 13.9%), and local government employees (3 | 8.3%) make up the most common classes of employment.
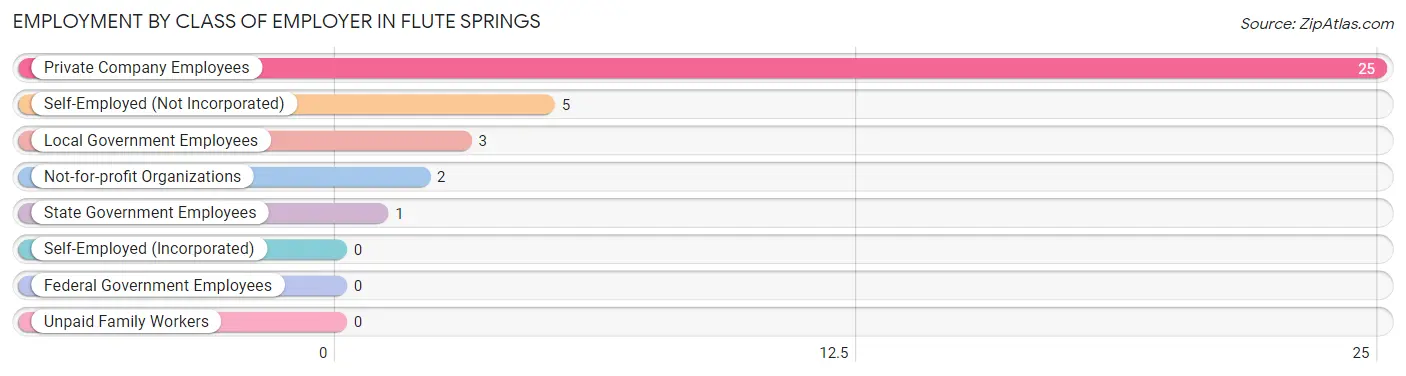
| Employer Class | # Employees | % Employees |
| Private Company Employees | 25 | 69.4% |
| Self-Employed (Incorporated) | 0 | 0.0% |
| Self-Employed (Not Incorporated) | 5 | 13.9% |
| Not-for-profit Organizations | 2 | 5.6% |
| Local Government Employees | 3 | 8.3% |
| State Government Employees | 1 | 2.8% |
| Federal Government Employees | 0 | 0.0% |
| Unpaid Family Workers | 0 | 0.0% |
| Total | 36 | 100.0% |
Employment Status by Age in Flute Springs
According to the labor force statistics for Flute Springs, out of the total population over 16 years of age (76), 59.2% or 45 individuals are in the labor force, with 20.0% or 9 of them unemployed. The age group with the highest labor force participation rate is 20 to 24 years, with 100.0% or 10 individuals in the labor force. Within the labor force, the 30 to 34 years age range has the highest percentage of unemployed individuals, with 31.6% or 6 of them being unemployed.
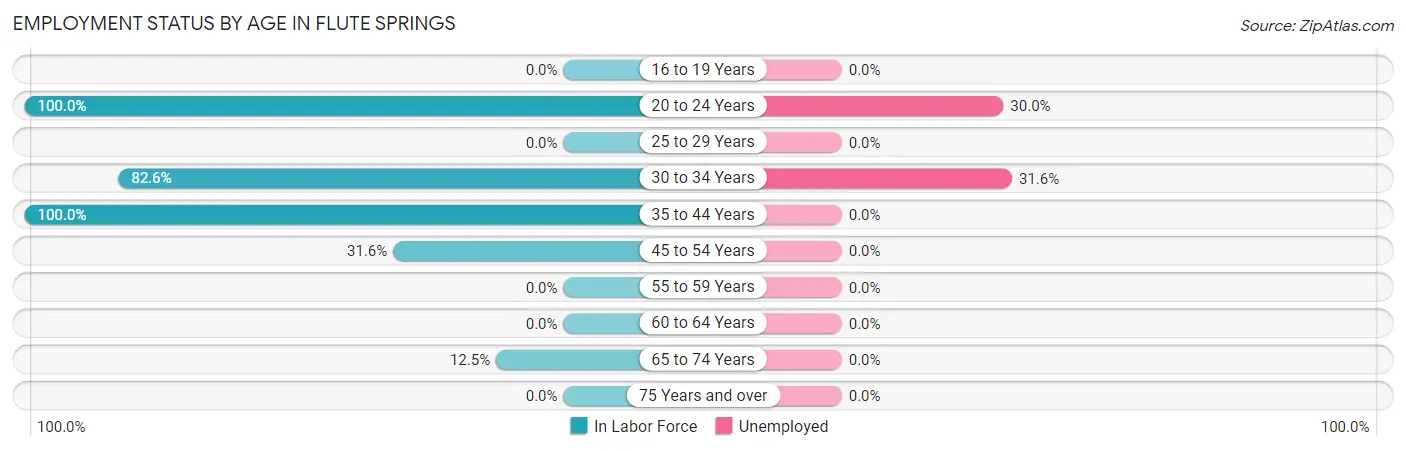
| Age Bracket | In Labor Force | Unemployed |
| 16 to 19 Years | 0 (0.0%) | 0 (0.0%) |
| 20 to 24 Years | 10 (100.0%) | 3 (30.0%) |
| 25 to 29 Years | 0 (0.0%) | 0 (0.0%) |
| 30 to 34 Years | 19 (82.6%) | 6 (31.6%) |
| 35 to 44 Years | 9 (100.0%) | 0 (0.0%) |
| 45 to 54 Years | 6 (31.6%) | 0 (0.0%) |
| 55 to 59 Years | 0 (0.0%) | 0 (0.0%) |
| 60 to 64 Years | 0 (0.0%) | 0 (0.0%) |
| 65 to 74 Years | 1 (12.5%) | 0 (0.0%) |
| 75 Years and over | 0 (0.0%) | 0 (0.0%) |
| Total | 45 (59.2%) | 9 (20.0%) |
Employment Status by Educational Attainment in Flute Springs
According to labor force statistics for Flute Springs, 59.6% of individuals (34) out of the total population between 25 and 64 years of age (57) are in the labor force, with 17.6% or 6 of them being unemployed. The group with the highest labor force participation rate are those with the educational attainment of college / associate degree, with 75.0% or 9 individuals in the labor force. Within the labor force, individuals with less than high school education have the highest percentage of unemployment, with 50.0% or 4 of them being unemployed.
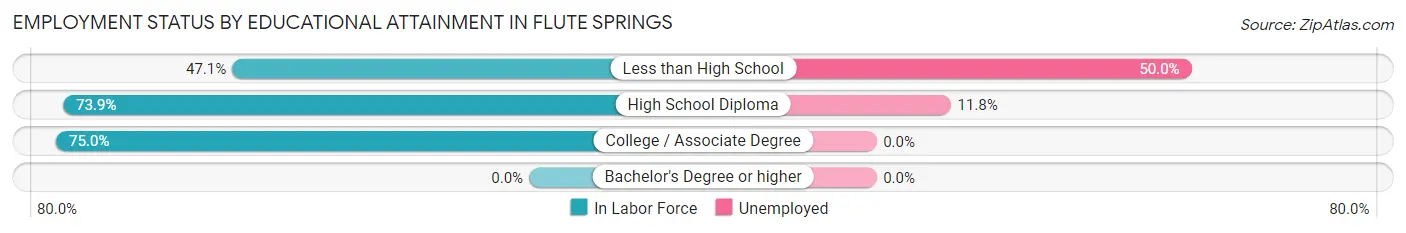
| Educational Attainment | In Labor Force | Unemployed |
| Less than High School | 8 (47.1%) | 8 (50.0%) |
| High School Diploma | 17 (73.9%) | 3 (11.8%) |
| College / Associate Degree | 9 (75.0%) | 0 (0.0%) |
| Bachelor's Degree or higher | 0 (0.0%) | 0 (0.0%) |
| Total | 34 (59.6%) | 10 (17.6%) |
Employment Occupations by Sex in Flute Springs
Management, Business, Science and Arts Occupations
The most common Management, Business, Science and Arts occupations in Flute Springs are Business & Financial (2 | 5.6%), and Management (1 | 2.8%).
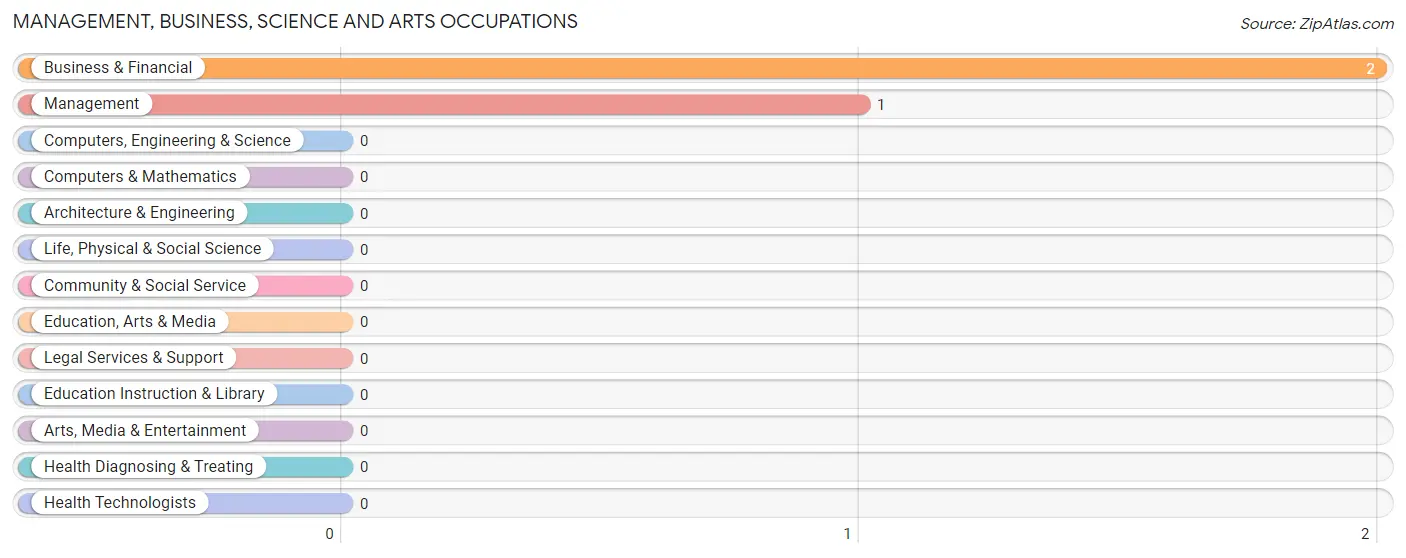
Management, Business, Science and Arts Occupations by Sex
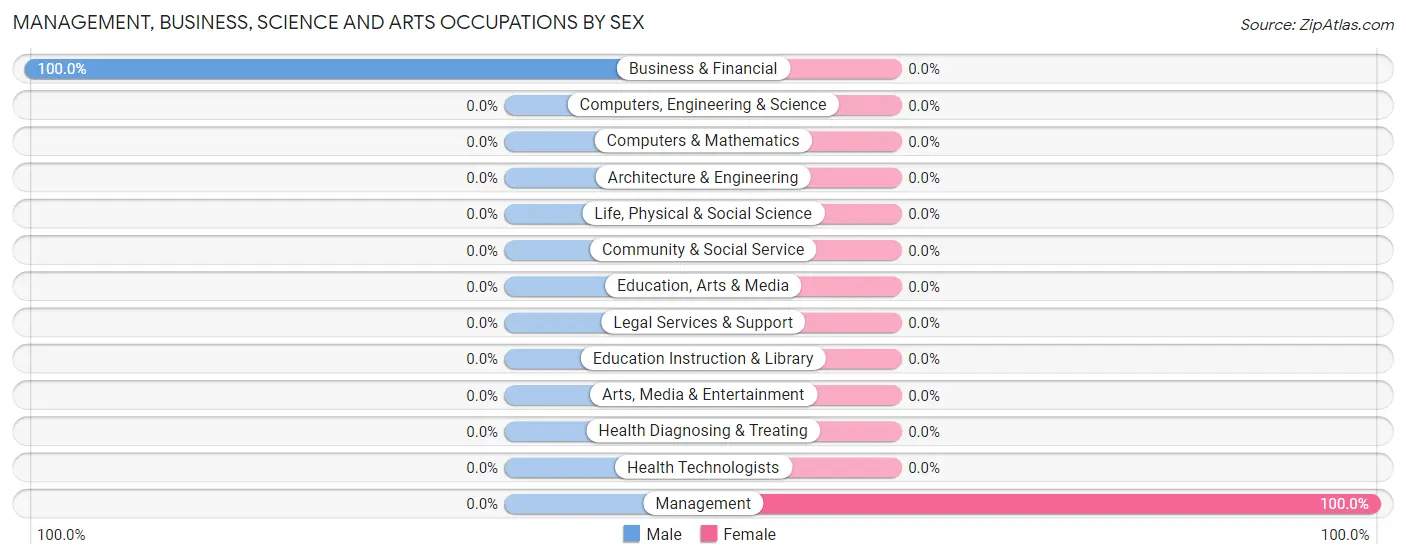
| Occupation | Male | Female |
| Management | 0 (0.0%) | 1 (100.0%) |
| Business & Financial | 2 (100.0%) | 0 (0.0%) |
| Computers, Engineering & Science | 0 (0.0%) | 0 (0.0%) |
| Computers & Mathematics | 0 (0.0%) | 0 (0.0%) |
| Architecture & Engineering | 0 (0.0%) | 0 (0.0%) |
| Life, Physical & Social Science | 0 (0.0%) | 0 (0.0%) |
| Community & Social Service | 0 (0.0%) | 0 (0.0%) |
| Education, Arts & Media | 0 (0.0%) | 0 (0.0%) |
| Legal Services & Support | 0 (0.0%) | 0 (0.0%) |
| Education Instruction & Library | 0 (0.0%) | 0 (0.0%) |
| Arts, Media & Entertainment | 0 (0.0%) | 0 (0.0%) |
| Health Diagnosing & Treating | 0 (0.0%) | 0 (0.0%) |
| Health Technologists | 0 (0.0%) | 0 (0.0%) |
| Total (Category) | 2 (66.7%) | 1 (33.3%) |
| Total (Overall) | 27 (75.0%) | 9 (25.0%) |
Services Occupations
The most common Services occupations in Flute Springs are Food Preparation & Serving (7 | 19.4%), Security & Protection (3 | 8.3%), Firefighting & Prevention (3 | 8.3%), and Cleaning & Maintenance (2 | 5.6%).
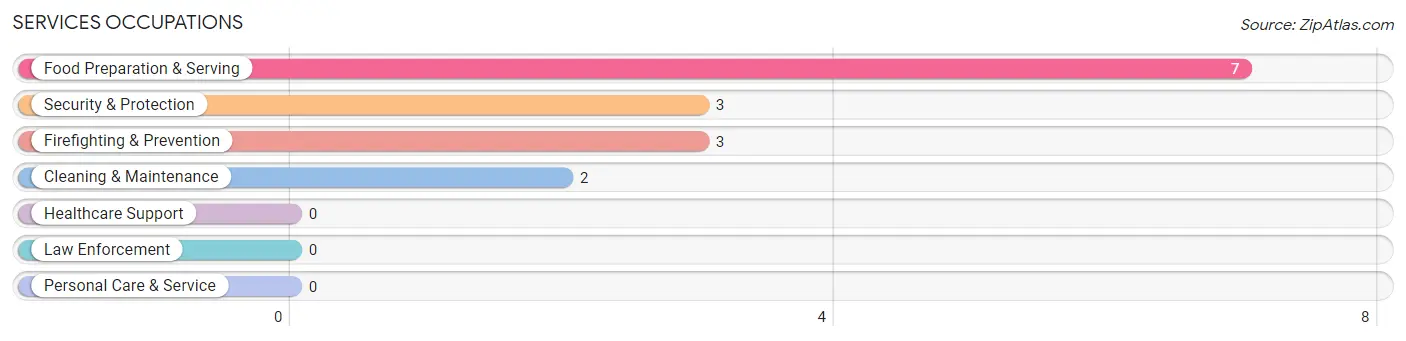
Services Occupations by Sex
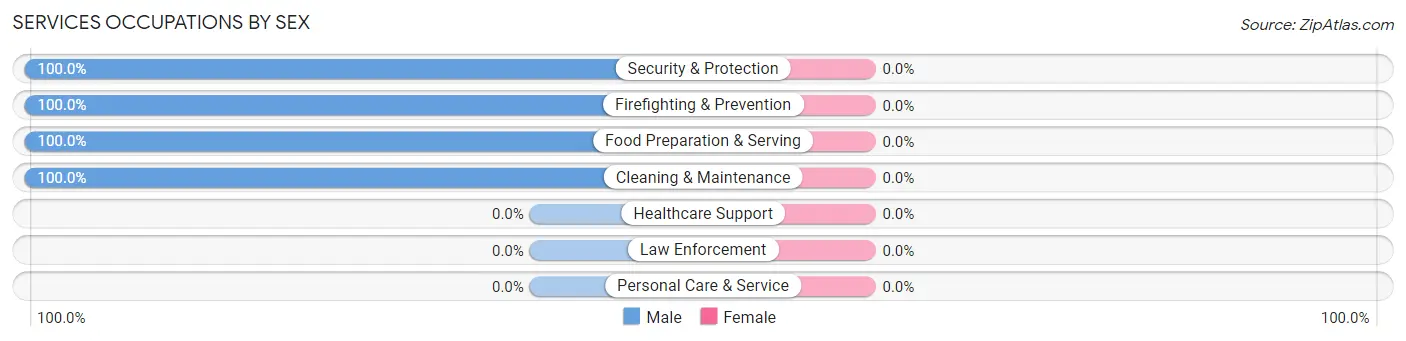
| Occupation | Male | Female |
| Healthcare Support | 0 (0.0%) | 0 (0.0%) |
| Security & Protection | 3 (100.0%) | 0 (0.0%) |
| Firefighting & Prevention | 3 (100.0%) | 0 (0.0%) |
| Law Enforcement | 0 (0.0%) | 0 (0.0%) |
| Food Preparation & Serving | 7 (100.0%) | 0 (0.0%) |
| Cleaning & Maintenance | 2 (100.0%) | 0 (0.0%) |
| Personal Care & Service | 0 (0.0%) | 0 (0.0%) |
| Total (Category) | 12 (100.0%) | 0 (0.0%) |
| Total (Overall) | 27 (75.0%) | 9 (25.0%) |
Sales and Office Occupations
The most common Sales and Office occupations in Flute Springs are , and Sales & Related (3 | 8.3%).
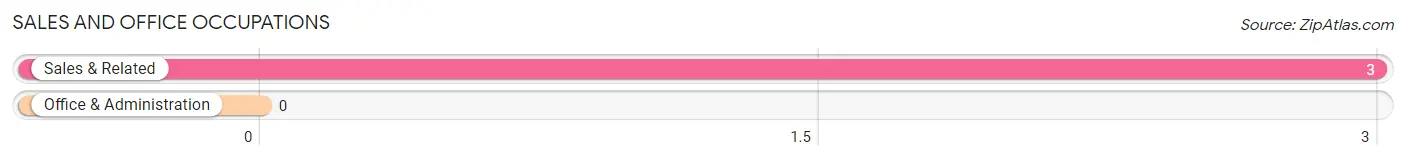
Sales and Office Occupations by Sex
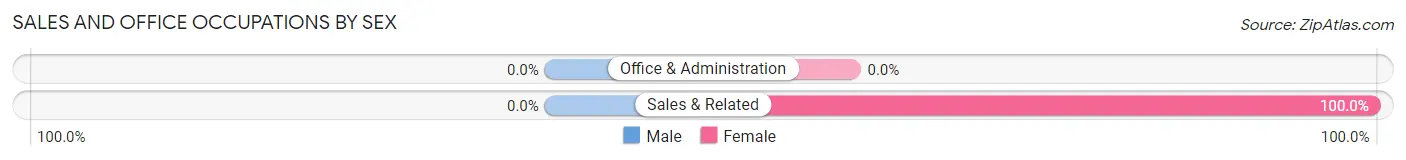
| Occupation | Male | Female |
| Sales & Related | 0 (0.0%) | 3 (100.0%) |
| Office & Administration | 0 (0.0%) | 0 (0.0%) |
| Total (Category) | 0 (0.0%) | 3 (100.0%) |
| Total (Overall) | 27 (75.0%) | 9 (25.0%) |
Natural Resources, Construction and Maintenance Occupations
The most common Natural Resources, Construction and Maintenance occupations in Flute Springs are , and Construction & Extraction (13 | 36.1%).
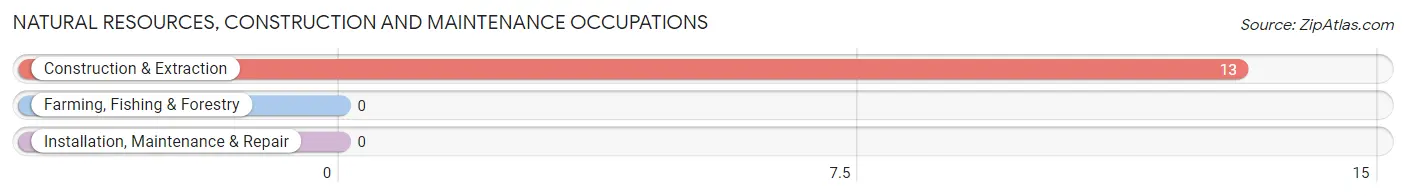
Natural Resources, Construction and Maintenance Occupations by Sex
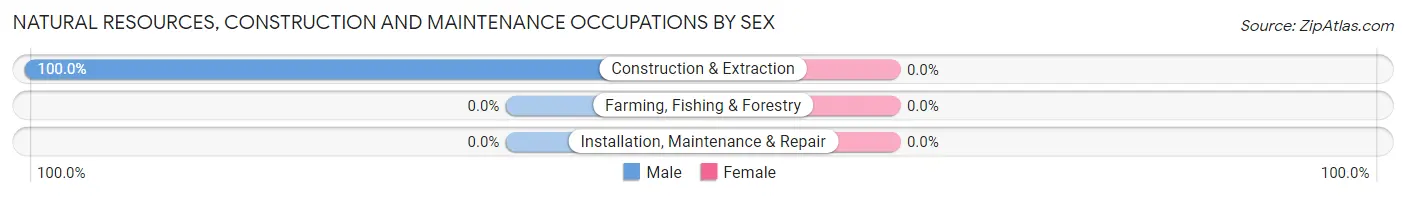
| Occupation | Male | Female |
| Farming, Fishing & Forestry | 0 (0.0%) | 0 (0.0%) |
| Construction & Extraction | 13 (100.0%) | 0 (0.0%) |
| Installation, Maintenance & Repair | 0 (0.0%) | 0 (0.0%) |
| Total (Category) | 13 (100.0%) | 0 (0.0%) |
| Total (Overall) | 27 (75.0%) | 9 (25.0%) |
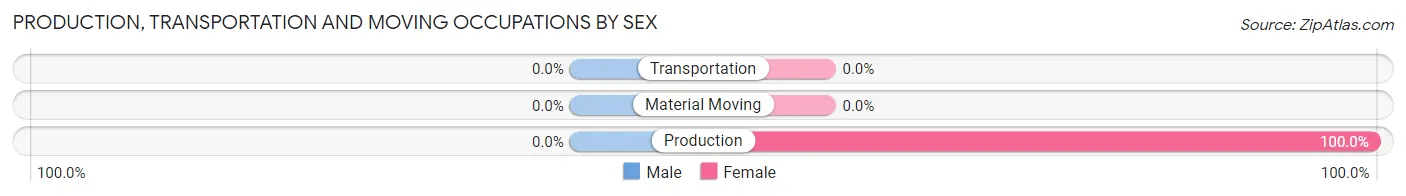
Production, Transportation and Moving Occupations
The most common Production, Transportation and Moving occupations in Flute Springs are , and Production (5 | 13.9%).
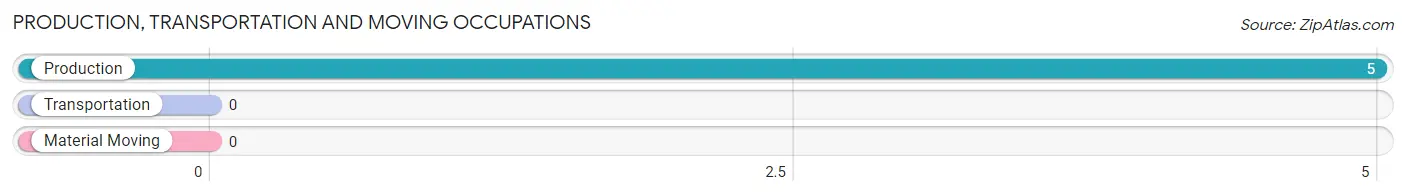
Production, Transportation and Moving Occupations by Sex
| Occupation | Male | Female |
| Production | 0 (0.0%) | 5 (100.0%) |
| Transportation | 0 (0.0%) | 0 (0.0%) |
| Material Moving | 0 (0.0%) | 0 (0.0%) |
| Total (Category) | 0 (0.0%) | 5 (100.0%) |
| Total (Overall) | 27 (75.0%) | 9 (25.0%) |
Employment Industries by Sex in Flute Springs
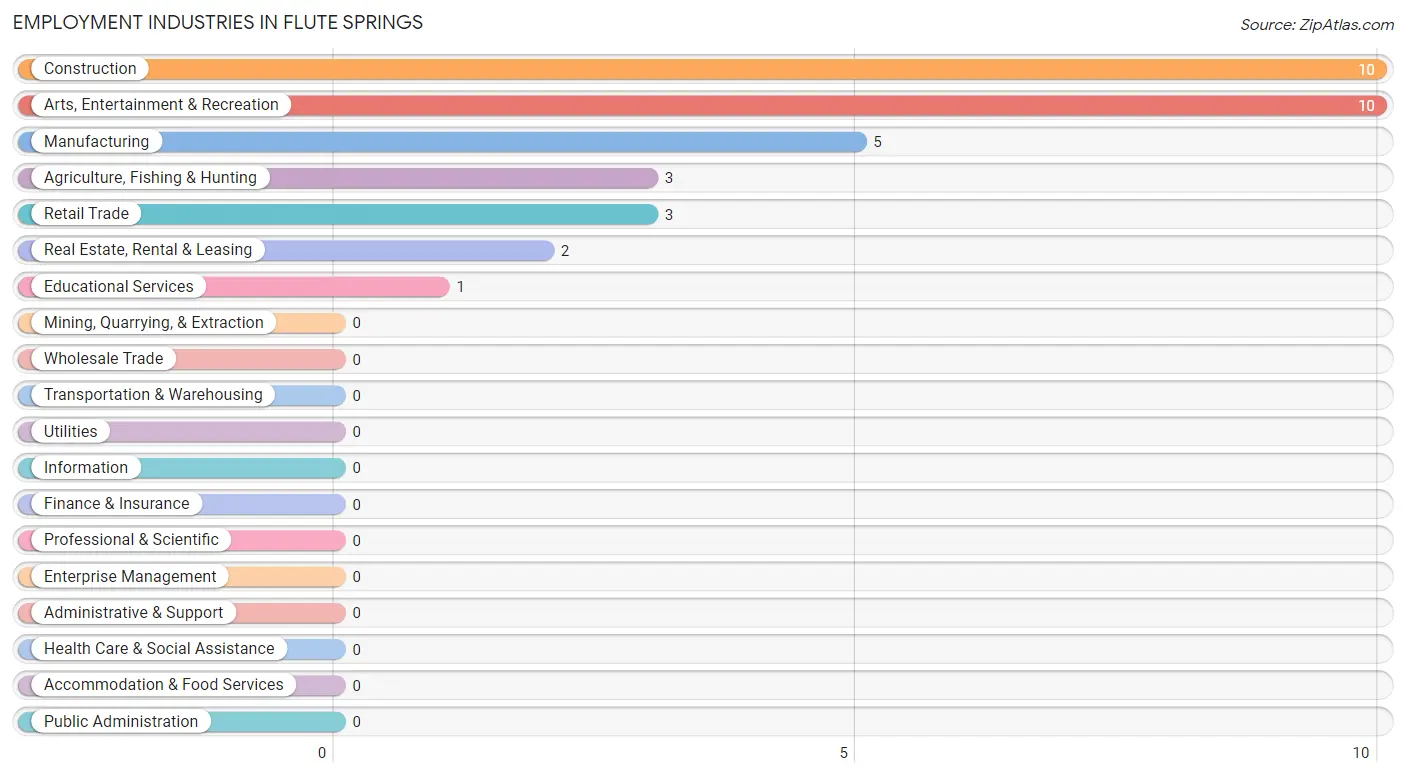
Employment Industries in Flute Springs
The major employment industries in Flute Springs include Construction (10 | 27.8%), Arts, Entertainment & Recreation (10 | 27.8%), Manufacturing (5 | 13.9%), Agriculture, Fishing & Hunting (3 | 8.3%), and Retail Trade (3 | 8.3%).
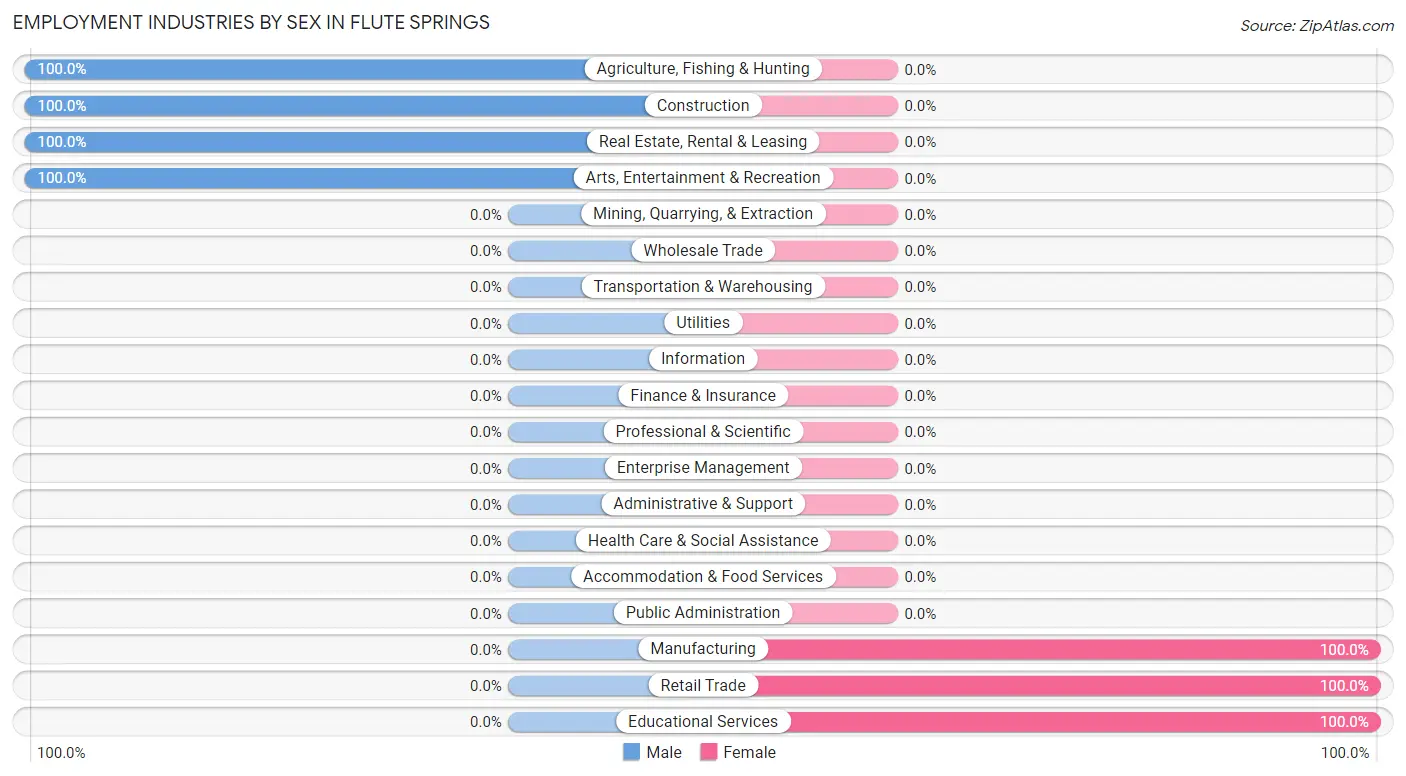
Employment Industries by Sex in Flute Springs
The Flute Springs industries that see more men than women are Agriculture, Fishing & Hunting (100.0%), Construction (100.0%), and Real Estate, Rental & Leasing (100.0%), whereas the industries that tend to have a higher number of women are Manufacturing (100.0%), Retail Trade (100.0%), and Educational Services (100.0%).
| Industry | Male | Female |
| Agriculture, Fishing & Hunting | 3 (100.0%) | 0 (0.0%) |
| Mining, Quarrying, & Extraction | 0 (0.0%) | 0 (0.0%) |
| Construction | 10 (100.0%) | 0 (0.0%) |
| Manufacturing | 0 (0.0%) | 5 (100.0%) |
| Wholesale Trade | 0 (0.0%) | 0 (0.0%) |
| Retail Trade | 0 (0.0%) | 3 (100.0%) |
| Transportation & Warehousing | 0 (0.0%) | 0 (0.0%) |
| Utilities | 0 (0.0%) | 0 (0.0%) |
| Information | 0 (0.0%) | 0 (0.0%) |
| Finance & Insurance | 0 (0.0%) | 0 (0.0%) |
| Real Estate, Rental & Leasing | 2 (100.0%) | 0 (0.0%) |
| Professional & Scientific | 0 (0.0%) | 0 (0.0%) |
| Enterprise Management | 0 (0.0%) | 0 (0.0%) |
| Administrative & Support | 0 (0.0%) | 0 (0.0%) |
| Educational Services | 0 (0.0%) | 1 (100.0%) |
| Health Care & Social Assistance | 0 (0.0%) | 0 (0.0%) |
| Arts, Entertainment & Recreation | 10 (100.0%) | 0 (0.0%) |
| Accommodation & Food Services | 0 (0.0%) | 0 (0.0%) |
| Public Administration | 0 (0.0%) | 0 (0.0%) |
| Total | 27 (75.0%) | 9 (25.0%) |
Education in Flute Springs
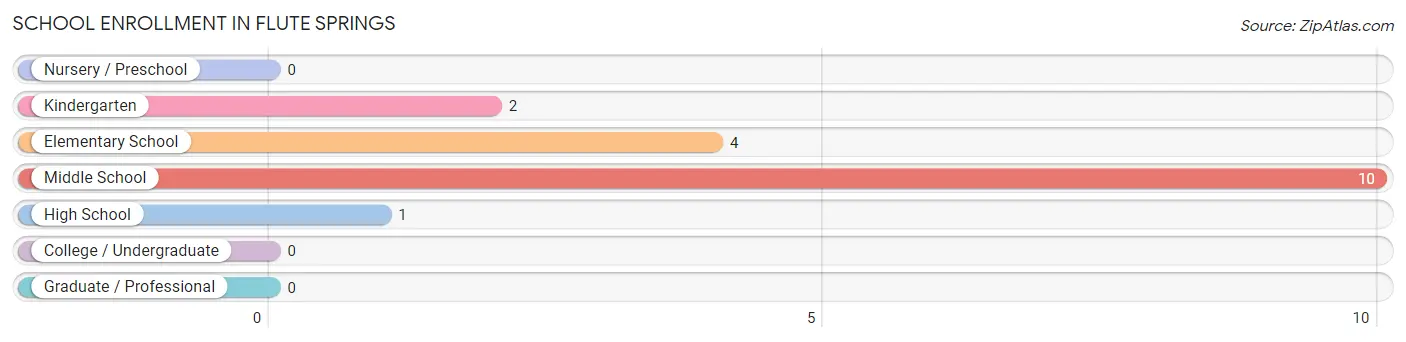
School Enrollment in Flute Springs
The most common levels of schooling among the 17 students in Flute Springs are middle school (10 | 58.8%), elementary school (4 | 23.5%), and kindergarten (2 | 11.8%).
| School Level | # Students | % Students |
| Nursery / Preschool | 0 | 0.0% |
| Kindergarten | 2 | 11.8% |
| Elementary School | 4 | 23.5% |
| Middle School | 10 | 58.8% |
| High School | 1 | 5.9% |
| College / Undergraduate | 0 | 0.0% |
| Graduate / Professional | 0 | 0.0% |
| Total | 17 | 100.0% |
School Enrollment by Age by Funding Source in Flute Springs
Out of a total of 17 students who are enrolled in schools in Flute Springs, 4 (23.5%) attend a private institution, while the remaining 13 (76.5%) are enrolled in public schools. The age group of 5 to 9 year old has the highest likelihood of being enrolled in private schools, with 4 (66.7% in the age bracket) enrolled. Conversely, the age group of 10 to 14 year olds has the lowest likelihood of being enrolled in a private school, with 10 (100.0% in the age bracket) attending a public institution.
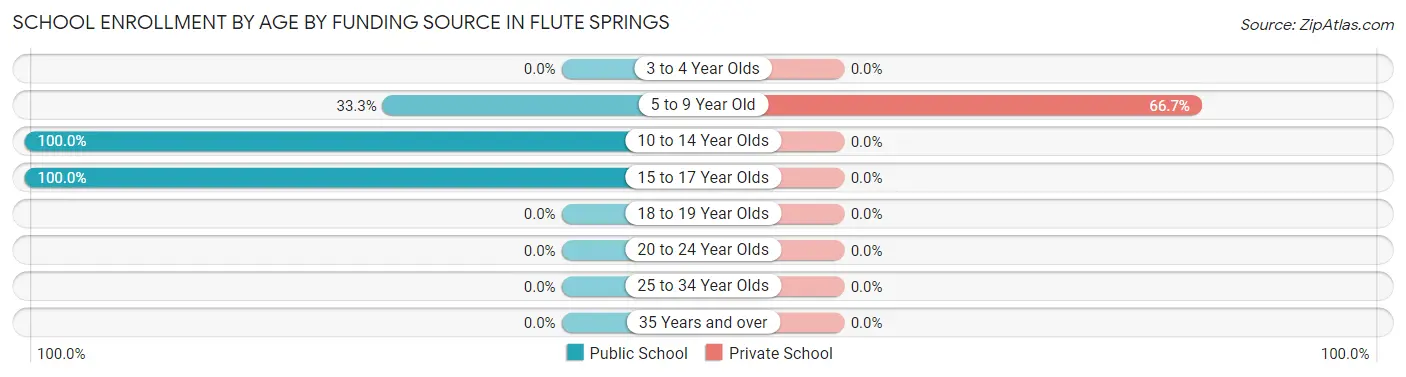
| Age Bracket | Public School | Private School |
| 3 to 4 Year Olds | 0 (0.0%) | 0 (0.0%) |
| 5 to 9 Year Old | 2 (33.3%) | 4 (66.7%) |
| 10 to 14 Year Olds | 10 (100.0%) | 0 (0.0%) |
| 15 to 17 Year Olds | 1 (100.0%) | 0 (0.0%) |
| 18 to 19 Year Olds | 0 (0.0%) | 0 (0.0%) |
| 20 to 24 Year Olds | 0 (0.0%) | 0 (0.0%) |
| 25 to 34 Year Olds | 0 (0.0%) | 0 (0.0%) |
| 35 Years and over | 0 (0.0%) | 0 (0.0%) |
| Total | 13 (76.5%) | 4 (23.5%) |
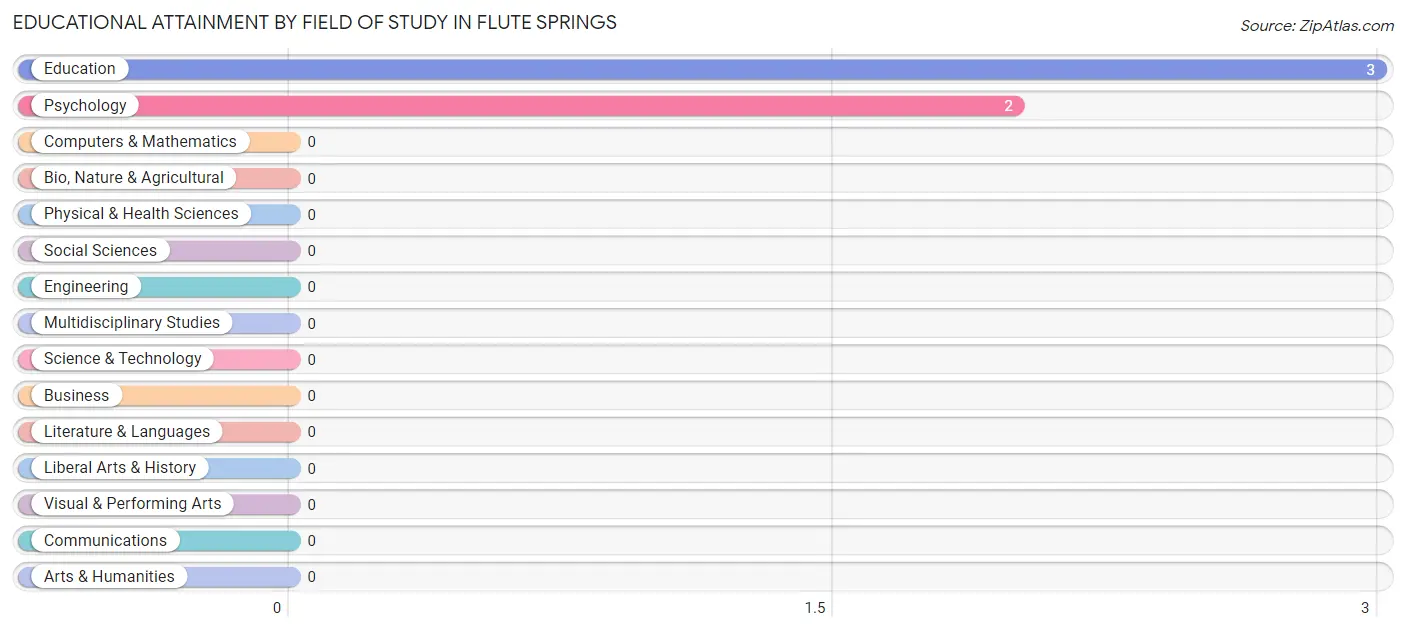
Educational Attainment by Field of Study in Flute Springs
Education (3 | 60.0%), and psychology (2 | 40.0%) are the most common fields of study among 5 individuals in Flute Springs who have obtained a bachelor's degree or higher.
| Field of Study | # Graduates | % Graduates |
| Computers & Mathematics | 0 | 0.0% |
| Bio, Nature & Agricultural | 0 | 0.0% |
| Physical & Health Sciences | 0 | 0.0% |
| Psychology | 2 | 40.0% |
| Social Sciences | 0 | 0.0% |
| Engineering | 0 | 0.0% |
| Multidisciplinary Studies | 0 | 0.0% |
| Science & Technology | 0 | 0.0% |
| Business | 0 | 0.0% |
| Education | 3 | 60.0% |
| Literature & Languages | 0 | 0.0% |
| Liberal Arts & History | 0 | 0.0% |
| Visual & Performing Arts | 0 | 0.0% |
| Communications | 0 | 0.0% |
| Arts & Humanities | 0 | 0.0% |
| Total | 5 | 100.0% |
Transportation & Commute in Flute Springs
Vehicle Availability by Sex in Flute Springs
The most prevalent vehicle ownership categories in Flute Springs are males with 2 vehicles (9, accounting for 33.3%) and females with 2 vehicles (4, making up 100.0%).
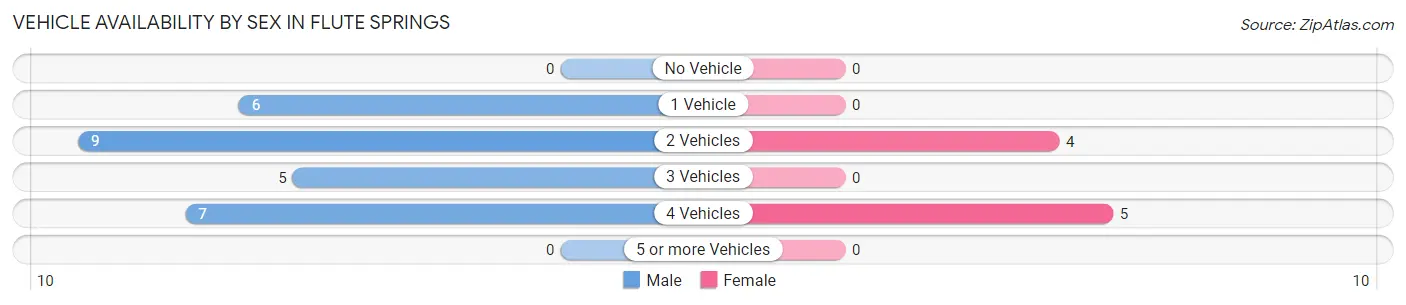
| Vehicles Available | Male | Female |
| No Vehicle | 0 (0.0%) | 0 (0.0%) |
| 1 Vehicle | 6 (22.2%) | 0 (0.0%) |
| 2 Vehicles | 9 (33.3%) | 4 (44.4%) |
| 3 Vehicles | 5 (18.5%) | 0 (0.0%) |
| 4 Vehicles | 7 (25.9%) | 5 (55.6%) |
| 5 or more Vehicles | 0 (0.0%) | 0 (0.0%) |
| Total | 27 (100.0%) | 9 (100.0%) |
Commute Time in Flute Springs
The most frequently occuring commute durations in Flute Springs are 60 to 89 minutes (12 commuters, 33.3%), 30 to 34 minutes (10 commuters, 27.8%), and 90 or more minutes (6 commuters, 16.7%).
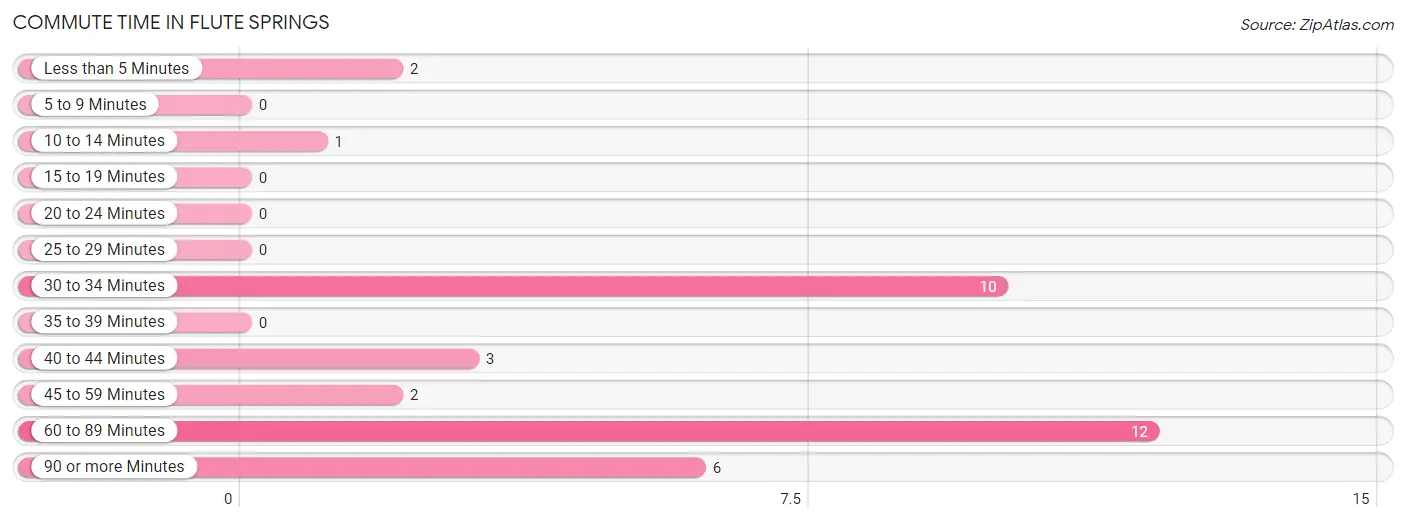
| Commute Time | # Commuters | % Commuters |
| Less than 5 Minutes | 2 | 5.6% |
| 5 to 9 Minutes | 0 | 0.0% |
| 10 to 14 Minutes | 1 | 2.8% |
| 15 to 19 Minutes | 0 | 0.0% |
| 20 to 24 Minutes | 0 | 0.0% |
| 25 to 29 Minutes | 0 | 0.0% |
| 30 to 34 Minutes | 10 | 27.8% |
| 35 to 39 Minutes | 0 | 0.0% |
| 40 to 44 Minutes | 3 | 8.3% |
| 45 to 59 Minutes | 2 | 5.6% |
| 60 to 89 Minutes | 12 | 33.3% |
| 90 or more Minutes | 6 | 16.7% |
Commute Time by Sex in Flute Springs
The most common commute times in Flute Springs are 60 to 89 minutes (12 commuters, 44.4%) for males and 30 to 34 minutes (8 commuters, 88.9%) for females.
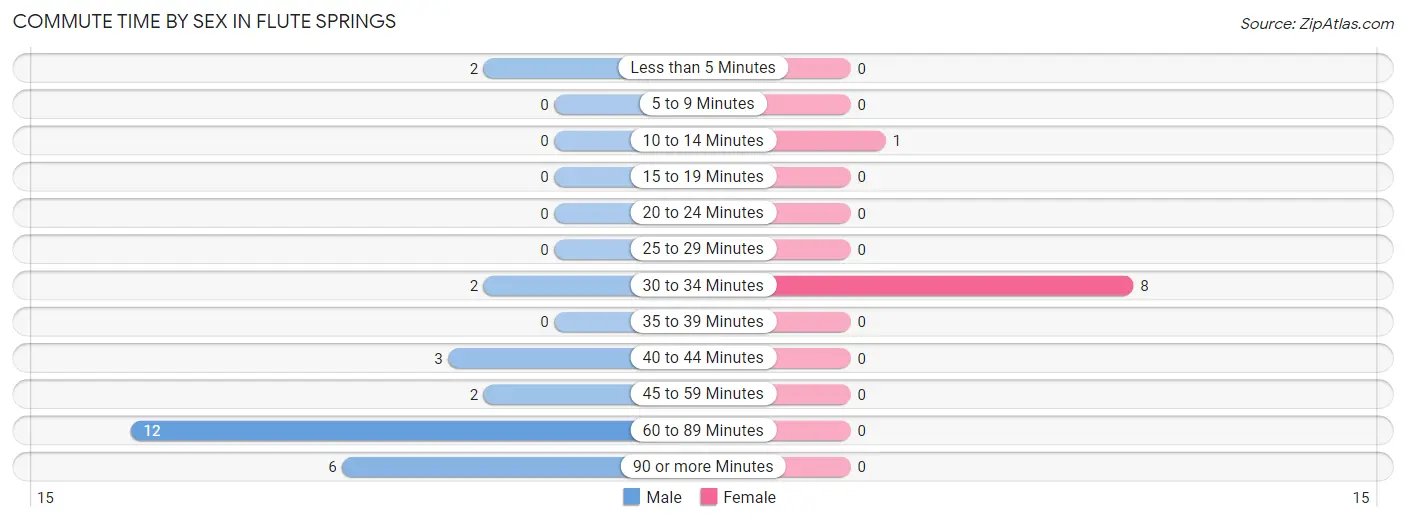
| Commute Time | Male | Female |
| Less than 5 Minutes | 2 (7.4%) | 0 (0.0%) |
| 5 to 9 Minutes | 0 (0.0%) | 0 (0.0%) |
| 10 to 14 Minutes | 0 (0.0%) | 1 (11.1%) |
| 15 to 19 Minutes | 0 (0.0%) | 0 (0.0%) |
| 20 to 24 Minutes | 0 (0.0%) | 0 (0.0%) |
| 25 to 29 Minutes | 0 (0.0%) | 0 (0.0%) |
| 30 to 34 Minutes | 2 (7.4%) | 8 (88.9%) |
| 35 to 39 Minutes | 0 (0.0%) | 0 (0.0%) |
| 40 to 44 Minutes | 3 (11.1%) | 0 (0.0%) |
| 45 to 59 Minutes | 2 (7.4%) | 0 (0.0%) |
| 60 to 89 Minutes | 12 (44.4%) | 0 (0.0%) |
| 90 or more Minutes | 6 (22.2%) | 0 (0.0%) |
Time of Departure to Work by Sex in Flute Springs
The most frequent times of departure to work in Flute Springs are 12:00 PM to 3:59 PM (7, 25.9%) for males and 5:30 AM to 5:59 AM (5, 55.6%) for females.
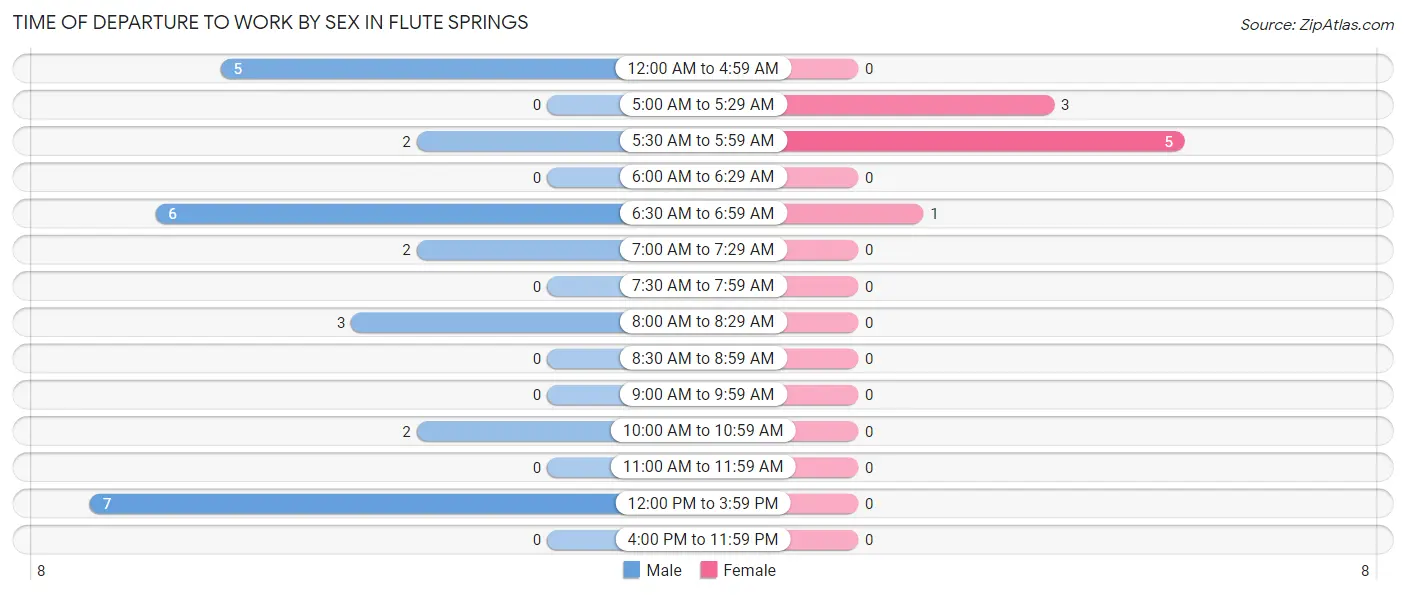
| Time of Departure | Male | Female |
| 12:00 AM to 4:59 AM | 5 (18.5%) | 0 (0.0%) |
| 5:00 AM to 5:29 AM | 0 (0.0%) | 3 (33.3%) |
| 5:30 AM to 5:59 AM | 2 (7.4%) | 5 (55.6%) |
| 6:00 AM to 6:29 AM | 0 (0.0%) | 0 (0.0%) |
| 6:30 AM to 6:59 AM | 6 (22.2%) | 1 (11.1%) |
| 7:00 AM to 7:29 AM | 2 (7.4%) | 0 (0.0%) |
| 7:30 AM to 7:59 AM | 0 (0.0%) | 0 (0.0%) |
| 8:00 AM to 8:29 AM | 3 (11.1%) | 0 (0.0%) |
| 8:30 AM to 8:59 AM | 0 (0.0%) | 0 (0.0%) |
| 9:00 AM to 9:59 AM | 0 (0.0%) | 0 (0.0%) |
| 10:00 AM to 10:59 AM | 2 (7.4%) | 0 (0.0%) |
| 11:00 AM to 11:59 AM | 0 (0.0%) | 0 (0.0%) |
| 12:00 PM to 3:59 PM | 7 (25.9%) | 0 (0.0%) |
| 4:00 PM to 11:59 PM | 0 (0.0%) | 0 (0.0%) |
| Total | 27 (100.0%) | 9 (100.0%) |
Housing Occupancy in Flute Springs
Occupancy by Ownership in Flute Springs
Of the total 30 dwellings in Flute Springs, owner-occupied units account for 21 (70.0%), while renter-occupied units make up 9 (30.0%).
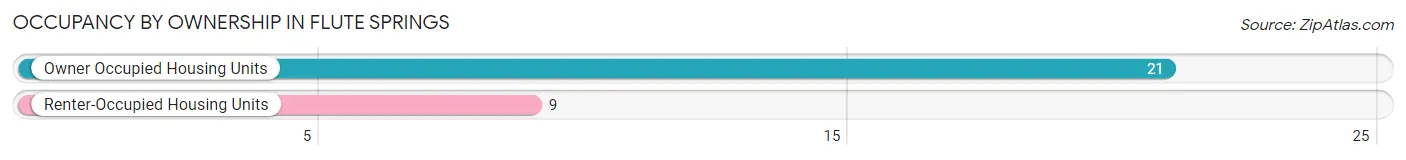
| Occupancy | # Housing Units | % Housing Units |
| Owner Occupied Housing Units | 21 | 70.0% |
| Renter-Occupied Housing Units | 9 | 30.0% |
| Total Occupied Housing Units | 30 | 100.0% |
Occupancy by Household Size in Flute Springs
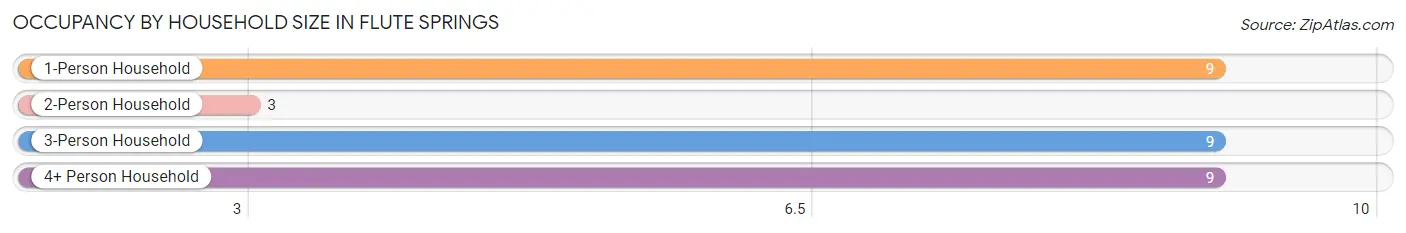
| Household Size | # Housing Units | % Housing Units |
| 1-Person Household | 9 | 30.0% |
| 2-Person Household | 3 | 10.0% |
| 3-Person Household | 9 | 30.0% |
| 4+ Person Household | 9 | 30.0% |
| Total Housing Units | 30 | 100.0% |
Occupancy by Ownership by Household Size in Flute Springs
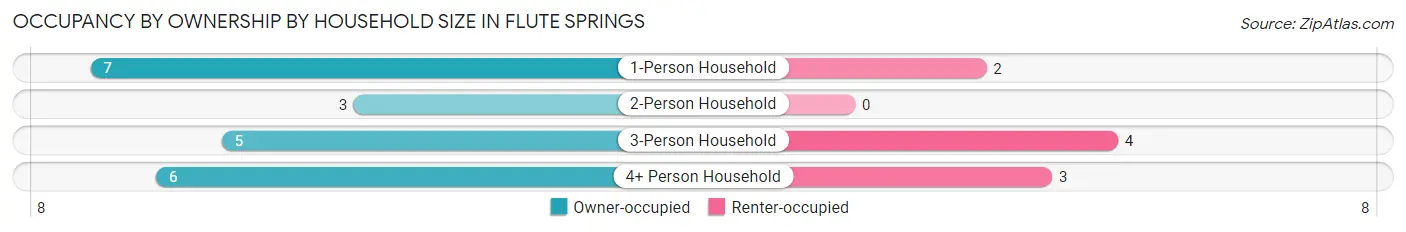
| Household Size | Owner-occupied | Renter-occupied |
| 1-Person Household | 7 (77.8%) | 2 (22.2%) |
| 2-Person Household | 3 (100.0%) | 0 (0.0%) |
| 3-Person Household | 5 (55.6%) | 4 (44.4%) |
| 4+ Person Household | 6 (66.7%) | 3 (33.3%) |
| Total Housing Units | 21 (70.0%) | 9 (30.0%) |
Occupancy by Educational Attainment in Flute Springs
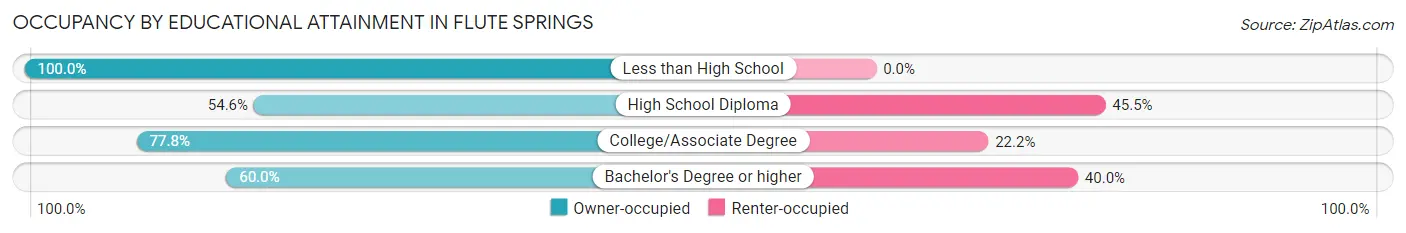
| Household Size | Owner-occupied | Renter-occupied |
| Less than High School | 5 (100.0%) | 0 (0.0%) |
| High School Diploma | 6 (54.5%) | 5 (45.5%) |
| College/Associate Degree | 7 (77.8%) | 2 (22.2%) |
| Bachelor's Degree or higher | 3 (60.0%) | 2 (40.0%) |
Occupancy by Age of Householder in Flute Springs
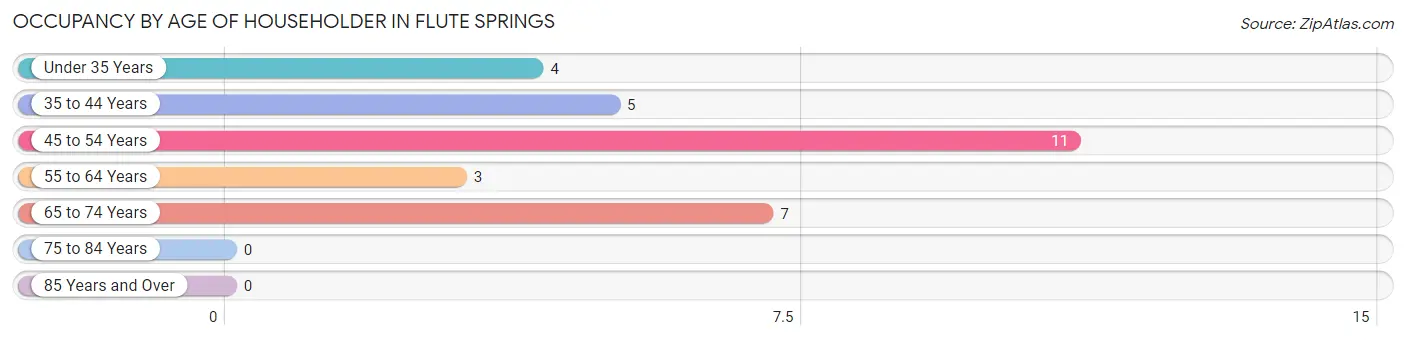
| Age Bracket | # Households | % Households |
| Under 35 Years | 4 | 13.3% |
| 35 to 44 Years | 5 | 16.7% |
| 45 to 54 Years | 11 | 36.7% |
| 55 to 64 Years | 3 | 10.0% |
| 65 to 74 Years | 7 | 23.3% |
| 75 to 84 Years | 0 | 0.0% |
| 85 Years and Over | 0 | 0.0% |
| Total | 30 | 100.0% |
Housing Finances in Flute Springs
Median Income by Occupancy in Flute Springs
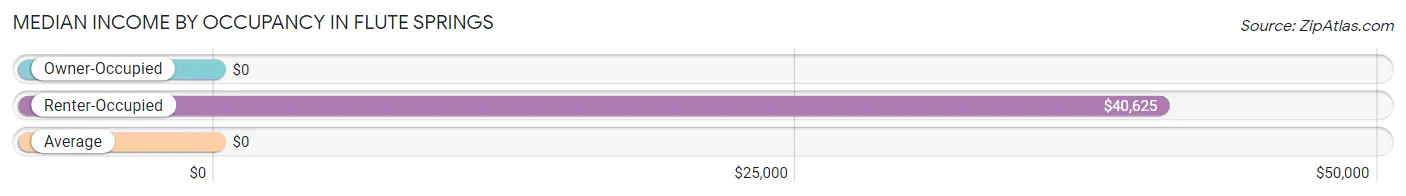
| Occupancy Type | # Households | Median Income |
| Owner-Occupied | 21 (70.0%) | $0 |
| Renter-Occupied | 9 (30.0%) | $40,625 |
| Average | 30 (100.0%) | $0 |
Occupancy by Householder Income Bracket in Flute Springs
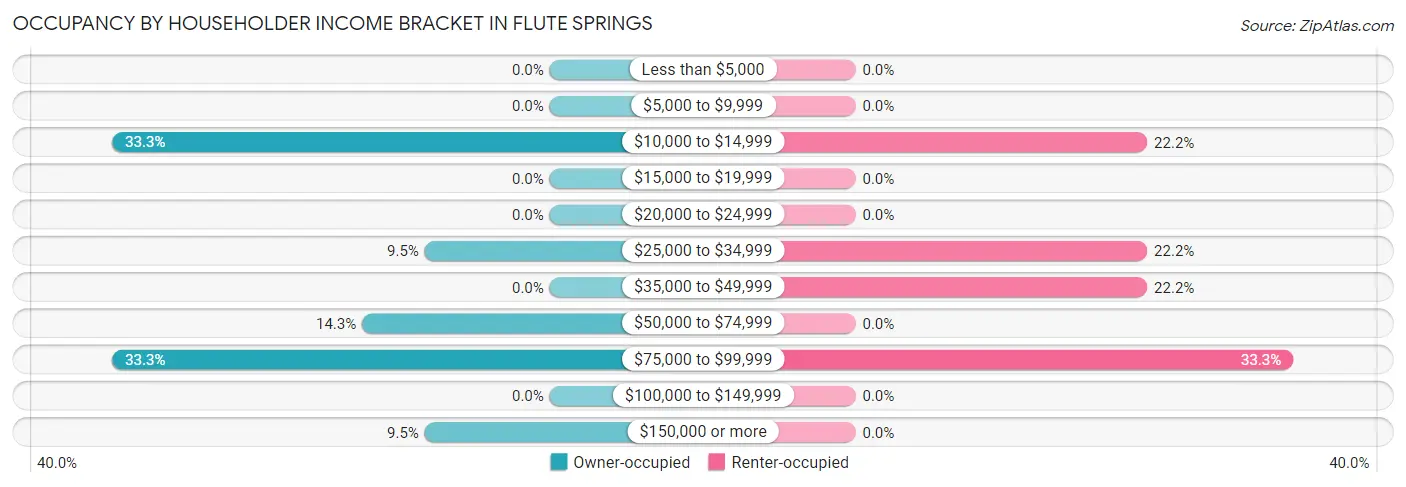
| Income Bracket | Owner-occupied | Renter-occupied |
| Less than $5,000 | 0 (0.0%) | 0 (0.0%) |
| $5,000 to $9,999 | 0 (0.0%) | 0 (0.0%) |
| $10,000 to $14,999 | 7 (33.3%) | 2 (22.2%) |
| $15,000 to $19,999 | 0 (0.0%) | 0 (0.0%) |
| $20,000 to $24,999 | 0 (0.0%) | 0 (0.0%) |
| $25,000 to $34,999 | 2 (9.5%) | 2 (22.2%) |
| $35,000 to $49,999 | 0 (0.0%) | 2 (22.2%) |
| $50,000 to $74,999 | 3 (14.3%) | 0 (0.0%) |
| $75,000 to $99,999 | 7 (33.3%) | 3 (33.3%) |
| $100,000 to $149,999 | 0 (0.0%) | 0 (0.0%) |
| $150,000 or more | 2 (9.5%) | 0 (0.0%) |
| Total | 21 (100.0%) | 9 (100.0%) |
Monthly Housing Cost Tiers in Flute Springs
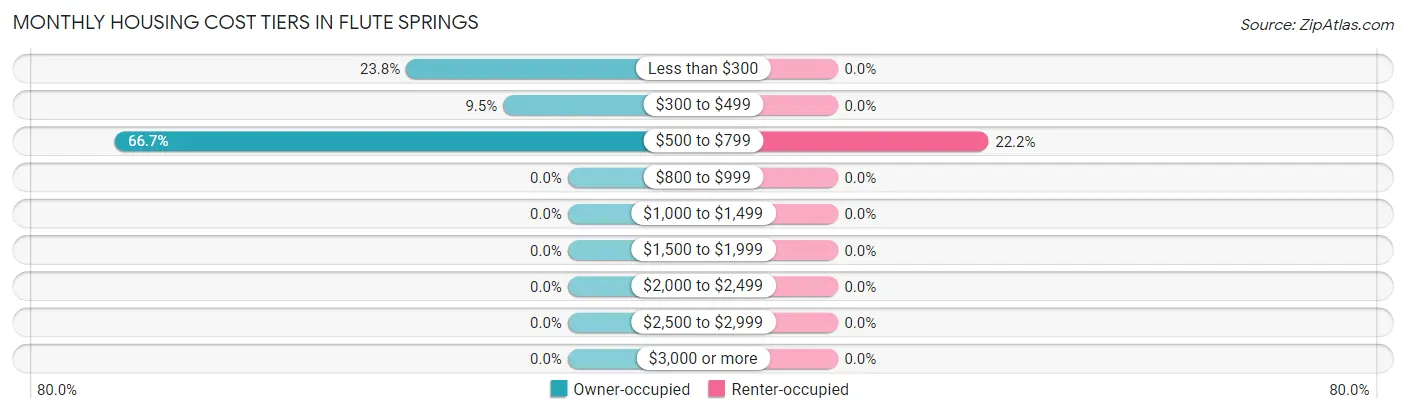
| Monthly Cost | Owner-occupied | Renter-occupied |
| Less than $300 | 5 (23.8%) | 0 (0.0%) |
| $300 to $499 | 2 (9.5%) | 0 (0.0%) |
| $500 to $799 | 14 (66.7%) | 2 (22.2%) |
| $800 to $999 | 0 (0.0%) | 0 (0.0%) |
| $1,000 to $1,499 | 0 (0.0%) | 0 (0.0%) |
| $1,500 to $1,999 | 0 (0.0%) | 0 (0.0%) |
| $2,000 to $2,499 | 0 (0.0%) | 0 (0.0%) |
| $2,500 to $2,999 | 0 (0.0%) | 0 (0.0%) |
| $3,000 or more | 0 (0.0%) | 0 (0.0%) |
| Total | 21 (100.0%) | 9 (100.0%) |
Physical Housing Characteristics in Flute Springs
Housing Structures in Flute Springs
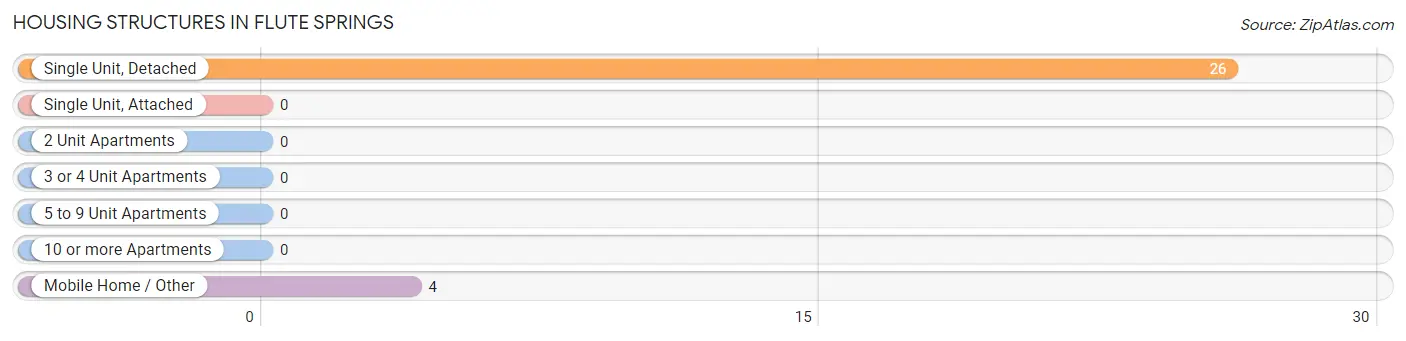
| Structure Type | # Housing Units | % Housing Units |
| Single Unit, Detached | 26 | 86.7% |
| Single Unit, Attached | 0 | 0.0% |
| 2 Unit Apartments | 0 | 0.0% |
| 3 or 4 Unit Apartments | 0 | 0.0% |
| 5 to 9 Unit Apartments | 0 | 0.0% |
| 10 or more Apartments | 0 | 0.0% |
| Mobile Home / Other | 4 | 13.3% |
| Total | 30 | 100.0% |
Housing Structures by Occupancy in Flute Springs
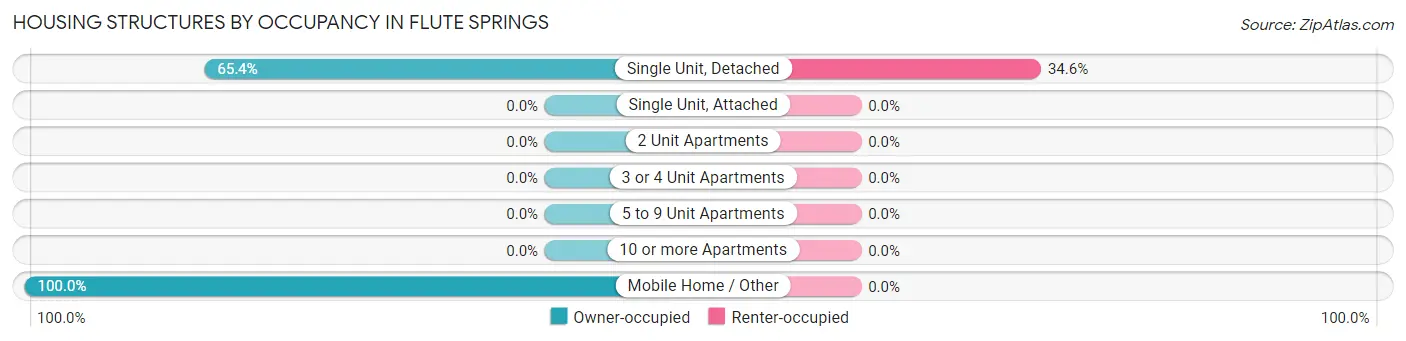
| Structure Type | Owner-occupied | Renter-occupied |
| Single Unit, Detached | 17 (65.4%) | 9 (34.6%) |
| Single Unit, Attached | 0 (0.0%) | 0 (0.0%) |
| 2 Unit Apartments | 0 (0.0%) | 0 (0.0%) |
| 3 or 4 Unit Apartments | 0 (0.0%) | 0 (0.0%) |
| 5 to 9 Unit Apartments | 0 (0.0%) | 0 (0.0%) |
| 10 or more Apartments | 0 (0.0%) | 0 (0.0%) |
| Mobile Home / Other | 4 (100.0%) | 0 (0.0%) |
| Total | 21 (70.0%) | 9 (30.0%) |
Housing Structures by Number of Rooms in Flute Springs
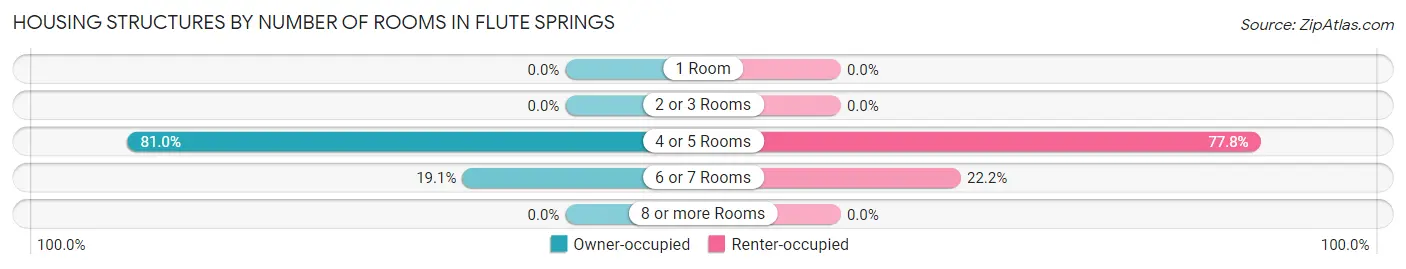
| Number of Rooms | Owner-occupied | Renter-occupied |
| 1 Room | 0 (0.0%) | 0 (0.0%) |
| 2 or 3 Rooms | 0 (0.0%) | 0 (0.0%) |
| 4 or 5 Rooms | 17 (80.9%) | 7 (77.8%) |
| 6 or 7 Rooms | 4 (19.1%) | 2 (22.2%) |
| 8 or more Rooms | 0 (0.0%) | 0 (0.0%) |
| Total | 21 (100.0%) | 9 (100.0%) |
Housing Structure by Heating Type in Flute Springs
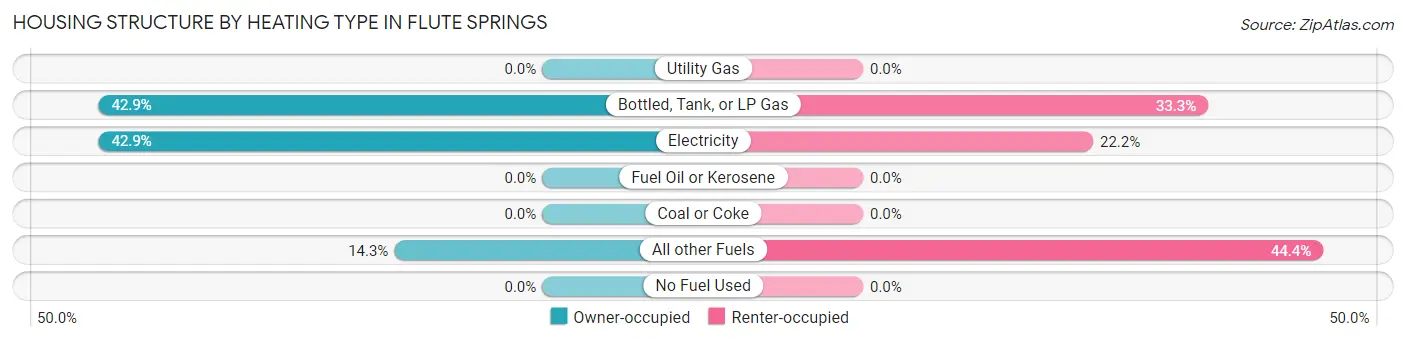
| Heating Type | Owner-occupied | Renter-occupied |
| Utility Gas | 0 (0.0%) | 0 (0.0%) |
| Bottled, Tank, or LP Gas | 9 (42.9%) | 3 (33.3%) |
| Electricity | 9 (42.9%) | 2 (22.2%) |
| Fuel Oil or Kerosene | 0 (0.0%) | 0 (0.0%) |
| Coal or Coke | 0 (0.0%) | 0 (0.0%) |
| All other Fuels | 3 (14.3%) | 4 (44.4%) |
| No Fuel Used | 0 (0.0%) | 0 (0.0%) |
| Total | 21 (100.0%) | 9 (100.0%) |
Household Vehicle Usage in Flute Springs
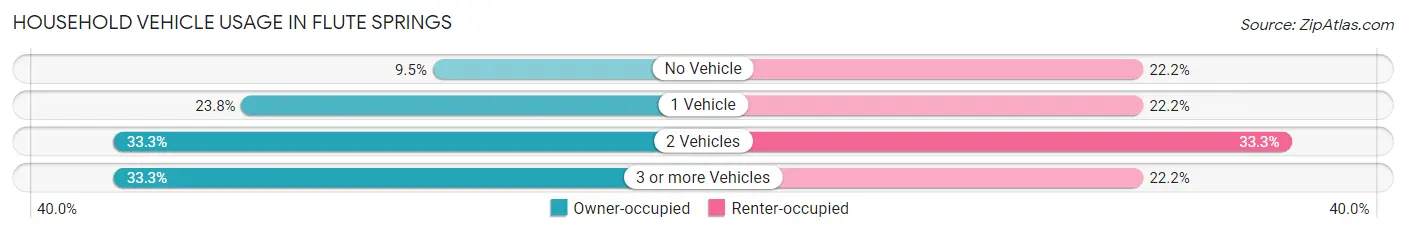
| Vehicles per Household | Owner-occupied | Renter-occupied |
| No Vehicle | 2 (9.5%) | 2 (22.2%) |
| 1 Vehicle | 5 (23.8%) | 2 (22.2%) |
| 2 Vehicles | 7 (33.3%) | 3 (33.3%) |
| 3 or more Vehicles | 7 (33.3%) | 2 (22.2%) |
| Total | 21 (100.0%) | 9 (100.0%) |
Real Estate & Mortgages in Flute Springs
Real Estate and Mortgage Overview in Flute Springs
| Characteristic | Without Mortgage | With Mortgage |
| Housing Units | 14 | 7 |
| Median Property Value | $110,000 | $65,000 |
| Median Household Income | $73,750 | $0 |
| Monthly Housing Costs | $450 | $0 |
| Real Estate Taxes | $275 | $2 |
Property Value by Mortgage Status in Flute Springs
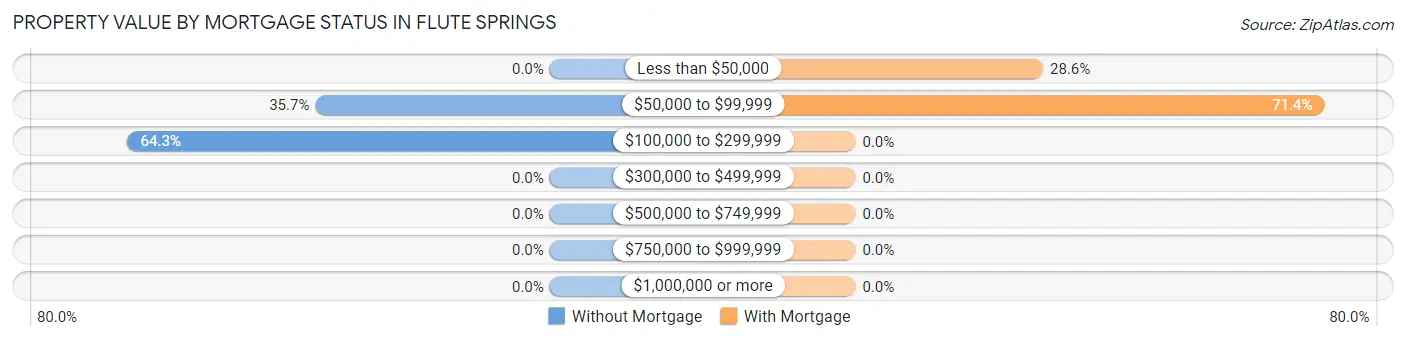
| Property Value | Without Mortgage | With Mortgage |
| Less than $50,000 | 0 (0.0%) | 2 (28.6%) |
| $50,000 to $99,999 | 5 (35.7%) | 5 (71.4%) |
| $100,000 to $299,999 | 9 (64.3%) | 0 (0.0%) |
| $300,000 to $499,999 | 0 (0.0%) | 0 (0.0%) |
| $500,000 to $749,999 | 0 (0.0%) | 0 (0.0%) |
| $750,000 to $999,999 | 0 (0.0%) | 0 (0.0%) |
| $1,000,000 or more | 0 (0.0%) | 0 (0.0%) |
| Total | 14 (100.0%) | 7 (100.0%) |
Household Income by Mortgage Status in Flute Springs
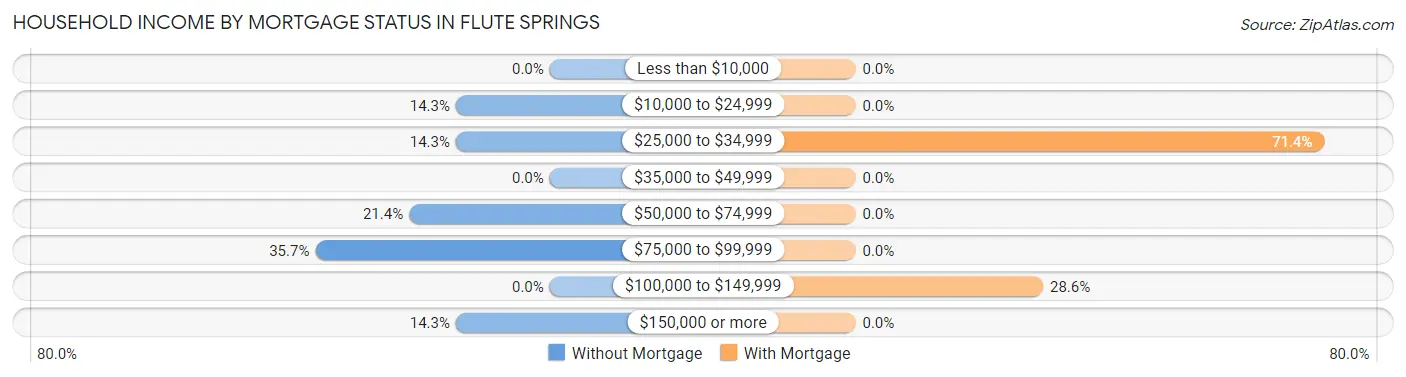
| Household Income | Without Mortgage | With Mortgage |
| Less than $10,000 | 0 (0.0%) | 0 (0.0%) |
| $10,000 to $24,999 | 2 (14.3%) | 0 (0.0%) |
| $25,000 to $34,999 | 2 (14.3%) | 5 (71.4%) |
| $35,000 to $49,999 | 0 (0.0%) | 0 (0.0%) |
| $50,000 to $74,999 | 3 (21.4%) | 0 (0.0%) |
| $75,000 to $99,999 | 5 (35.7%) | 0 (0.0%) |
| $100,000 to $149,999 | 0 (0.0%) | 2 (28.6%) |
| $150,000 or more | 2 (14.3%) | 0 (0.0%) |
| Total | 14 (100.0%) | 7 (100.0%) |
Property Value to Household Income Ratio in Flute Springs
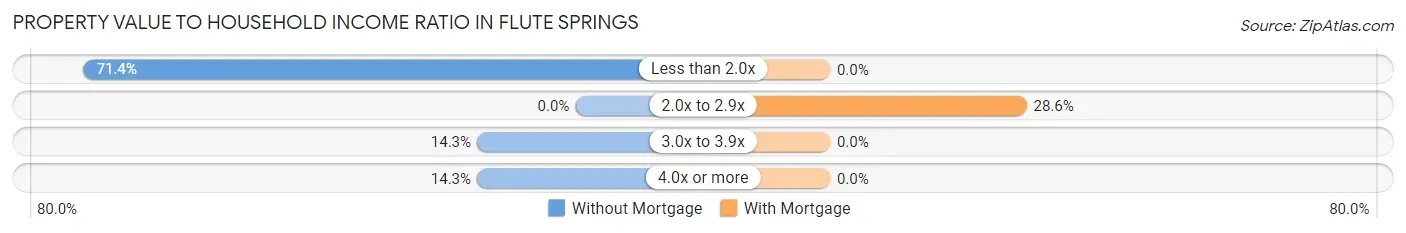
| Value-to-Income Ratio | Without Mortgage | With Mortgage |
| Less than 2.0x | 10 (71.4%) | 0 (0.0%) |
| 2.0x to 2.9x | 0 (0.0%) | 2 (28.6%) |
| 3.0x to 3.9x | 2 (14.3%) | 0 (0.0%) |
| 4.0x or more | 2 (14.3%) | 0 (0.0%) |
| Total | 14 (100.0%) | 7 (100.0%) |
Real Estate Taxes by Mortgage Status in Flute Springs
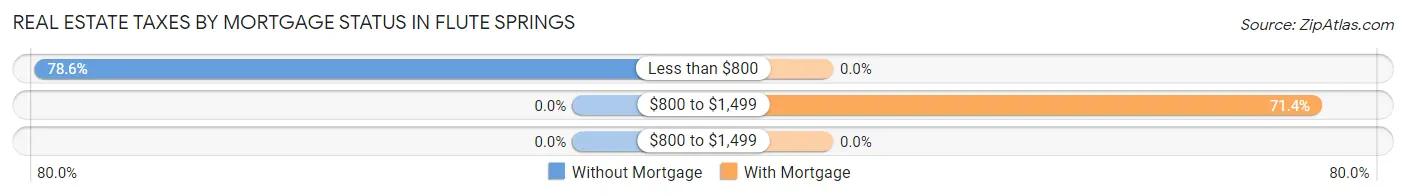
| Property Taxes | Without Mortgage | With Mortgage |
| Less than $800 | 11 (78.6%) | 0 (0.0%) |
| $800 to $1,499 | 0 (0.0%) | 5 (71.4%) |
| $800 to $1,499 | 0 (0.0%) | 0 (0.0%) |
| Total | 14 (100.0%) | 7 (100.0%) |
Health & Disability in Flute Springs
Health Insurance Coverage by Age in Flute Springs
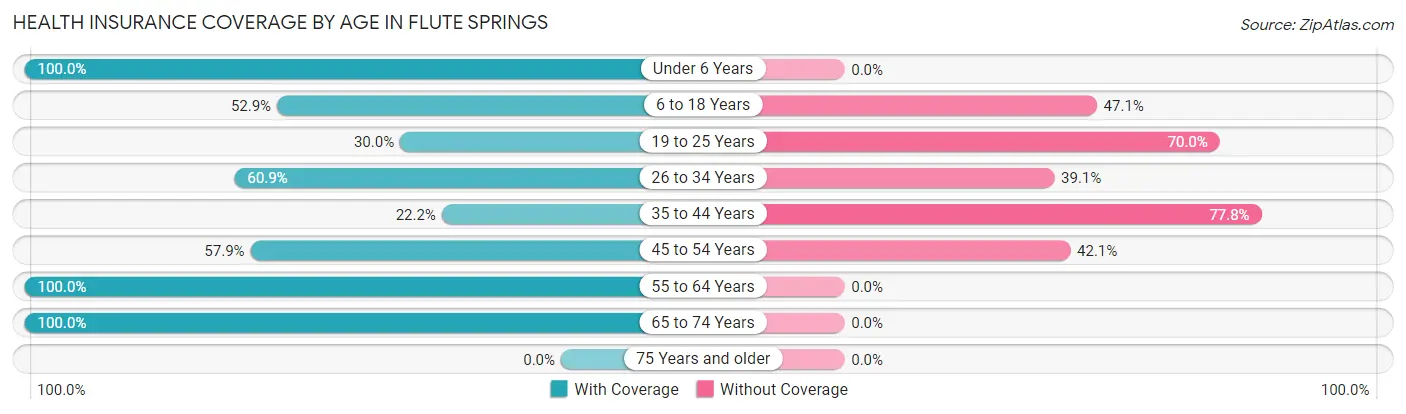
| Age Bracket | With Coverage | Without Coverage |
| Under 6 Years | 5 (100.0%) | 0 (0.0%) |
| 6 to 18 Years | 9 (52.9%) | 8 (47.1%) |
| 19 to 25 Years | 3 (30.0%) | 7 (70.0%) |
| 26 to 34 Years | 14 (60.9%) | 9 (39.1%) |
| 35 to 44 Years | 2 (22.2%) | 7 (77.8%) |
| 45 to 54 Years | 11 (57.9%) | 8 (42.1%) |
| 55 to 64 Years | 6 (100.0%) | 0 (0.0%) |
| 65 to 74 Years | 8 (100.0%) | 0 (0.0%) |
| 75 Years and older | 0 (0.0%) | 0 (0.0%) |
| Total | 58 (59.8%) | 39 (40.2%) |
Health Insurance Coverage by Citizenship Status in Flute Springs
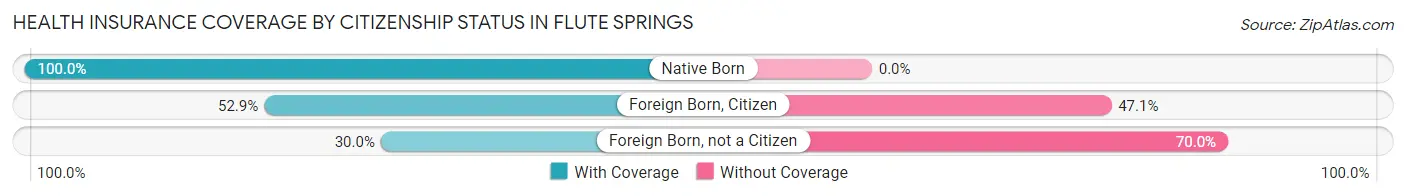
| Citizenship Status | With Coverage | Without Coverage |
| Native Born | 5 (100.0%) | 0 (0.0%) |
| Foreign Born, Citizen | 9 (52.9%) | 8 (47.1%) |
| Foreign Born, not a Citizen | 3 (30.0%) | 7 (70.0%) |
Health Insurance Coverage by Household Income in Flute Springs
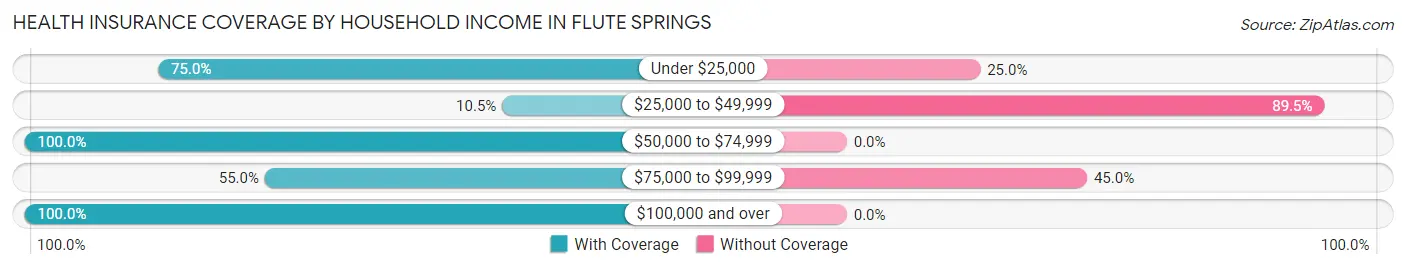
| Household Income | With Coverage | Without Coverage |
| Under $25,000 | 12 (75.0%) | 4 (25.0%) |
| $25,000 to $49,999 | 2 (10.5%) | 17 (89.5%) |
| $50,000 to $74,999 | 6 (100.0%) | 0 (0.0%) |
| $75,000 to $99,999 | 22 (55.0%) | 18 (45.0%) |
| $100,000 and over | 16 (100.0%) | 0 (0.0%) |
Public vs Private Health Insurance Coverage by Age in Flute Springs
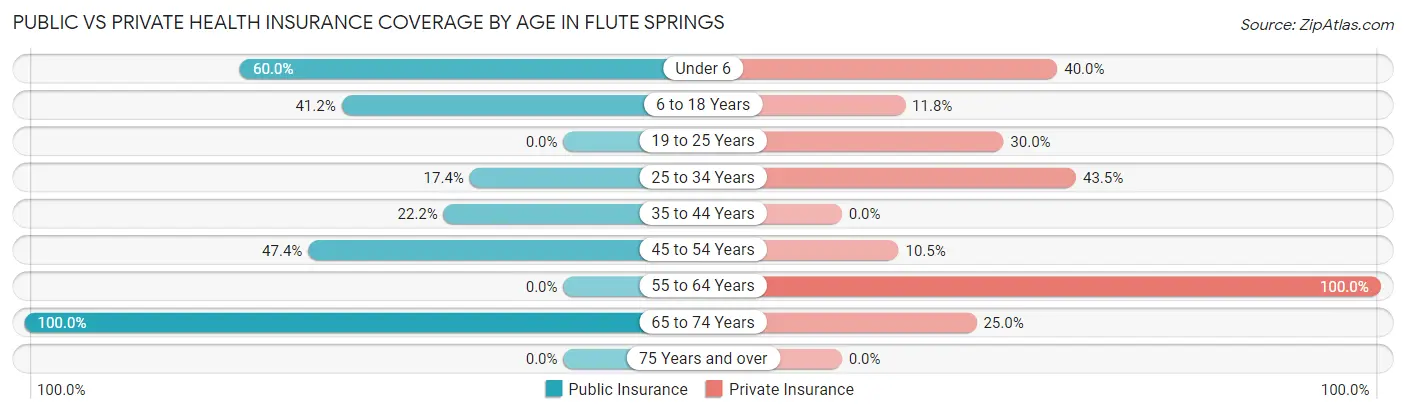
| Age Bracket | Public Insurance | Private Insurance |
| Under 6 | 3 (60.0%) | 2 (40.0%) |
| 6 to 18 Years | 7 (41.2%) | 2 (11.8%) |
| 19 to 25 Years | 0 (0.0%) | 3 (30.0%) |
| 25 to 34 Years | 4 (17.4%) | 10 (43.5%) |
| 35 to 44 Years | 2 (22.2%) | 0 (0.0%) |
| 45 to 54 Years | 9 (47.4%) | 2 (10.5%) |
| 55 to 64 Years | 0 (0.0%) | 6 (100.0%) |
| 65 to 74 Years | 8 (100.0%) | 2 (25.0%) |
| 75 Years and over | 0 (0.0%) | 0 (0.0%) |
| Total | 33 (34.0%) | 27 (27.8%) |
Disability Status by Sex by Age in Flute Springs
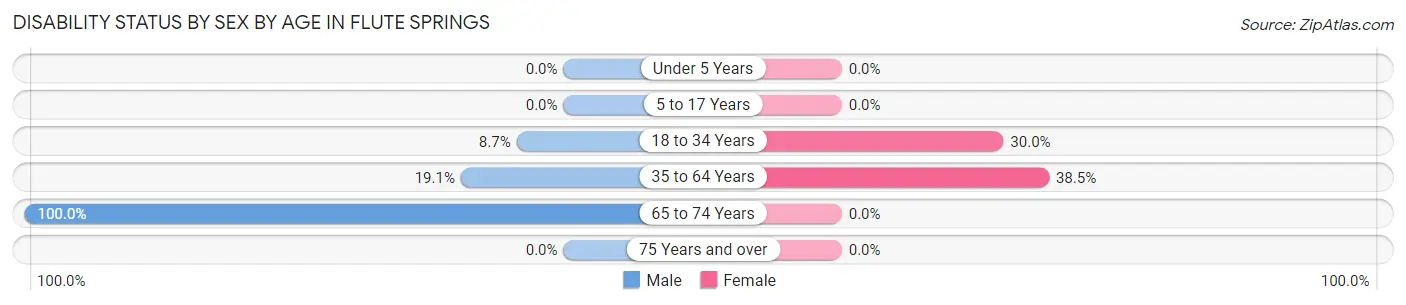
| Age Bracket | Male | Female |
| Under 5 Years | 0 (0.0%) | 0 (0.0%) |
| 5 to 17 Years | 0 (0.0%) | 0 (0.0%) |
| 18 to 34 Years | 2 (8.7%) | 3 (30.0%) |
| 35 to 64 Years | 4 (19.1%) | 5 (38.5%) |
| 65 to 74 Years | 3 (100.0%) | 0 (0.0%) |
| 75 Years and over | 0 (0.0%) | 0 (0.0%) |
Disability Class by Sex by Age in Flute Springs
Disability Class: Hearing Difficulty
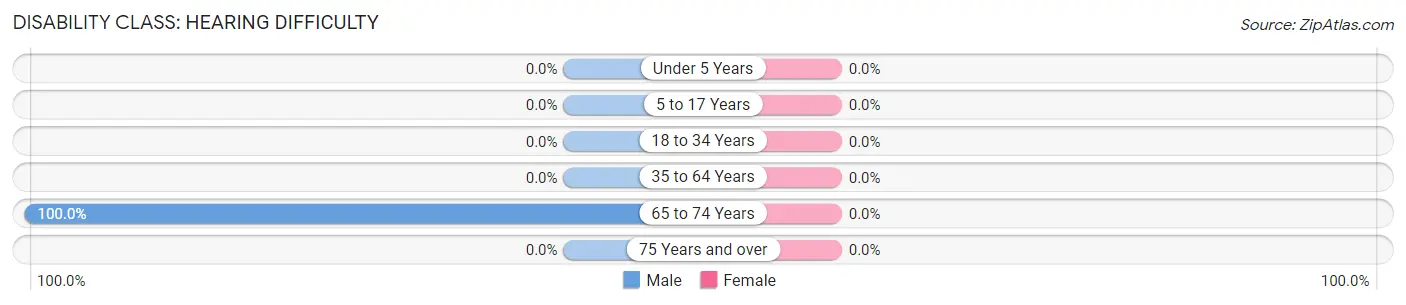
| Age Bracket | Male | Female |
| Under 5 Years | 0 (0.0%) | 0 (0.0%) |
| 5 to 17 Years | 0 (0.0%) | 0 (0.0%) |
| 18 to 34 Years | 0 (0.0%) | 0 (0.0%) |
| 35 to 64 Years | 0 (0.0%) | 0 (0.0%) |
| 65 to 74 Years | 3 (100.0%) | 0 (0.0%) |
| 75 Years and over | 0 (0.0%) | 0 (0.0%) |
Disability Class: Vision Difficulty
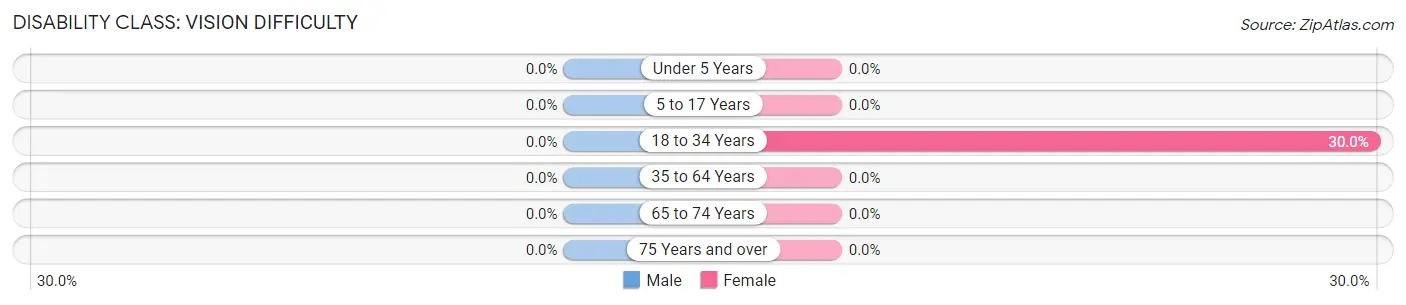
| Age Bracket | Male | Female |
| Under 5 Years | 0 (0.0%) | 0 (0.0%) |
| 5 to 17 Years | 0 (0.0%) | 0 (0.0%) |
| 18 to 34 Years | 0 (0.0%) | 3 (30.0%) |
| 35 to 64 Years | 0 (0.0%) | 0 (0.0%) |
| 65 to 74 Years | 0 (0.0%) | 0 (0.0%) |
| 75 Years and over | 0 (0.0%) | 0 (0.0%) |
Disability Class: Cognitive Difficulty
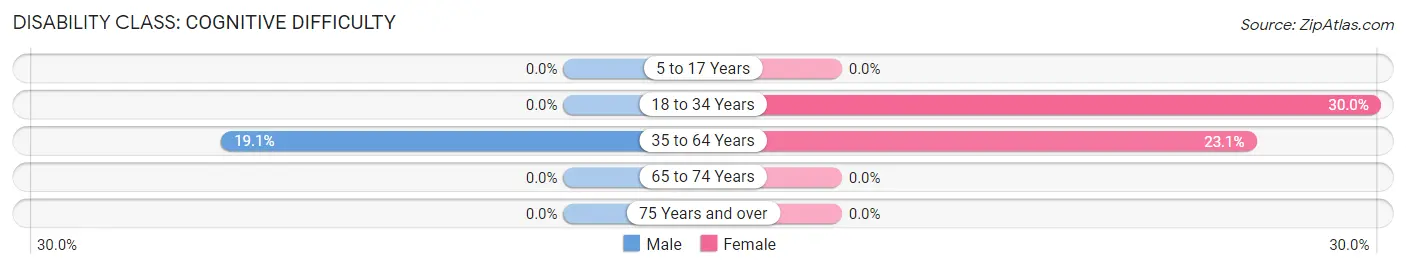
| Age Bracket | Male | Female |
| 5 to 17 Years | 0 (0.0%) | 0 (0.0%) |
| 18 to 34 Years | 0 (0.0%) | 3 (30.0%) |
| 35 to 64 Years | 4 (19.1%) | 3 (23.1%) |
| 65 to 74 Years | 0 (0.0%) | 0 (0.0%) |
| 75 Years and over | 0 (0.0%) | 0 (0.0%) |
Disability Class: Ambulatory Difficulty
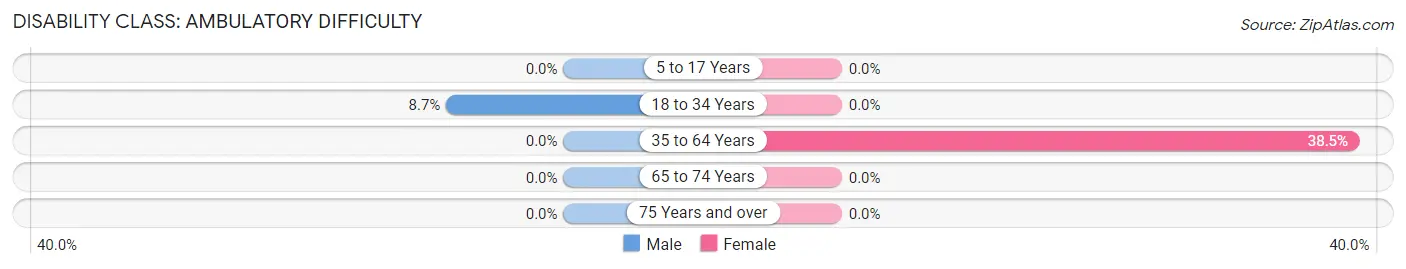
| Age Bracket | Male | Female |
| 5 to 17 Years | 0 (0.0%) | 0 (0.0%) |
| 18 to 34 Years | 2 (8.7%) | 0 (0.0%) |
| 35 to 64 Years | 0 (0.0%) | 5 (38.5%) |
| 65 to 74 Years | 0 (0.0%) | 0 (0.0%) |
| 75 Years and over | 0 (0.0%) | 0 (0.0%) |
Disability Class: Self-Care Difficulty
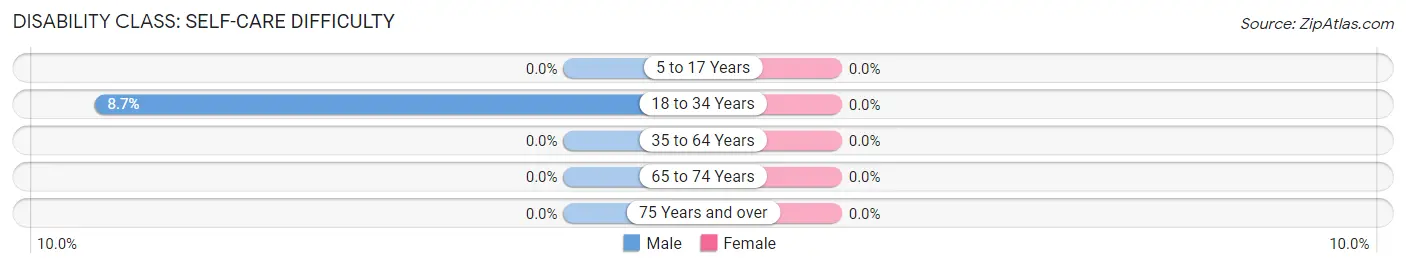
| Age Bracket | Male | Female |
| 5 to 17 Years | 0 (0.0%) | 0 (0.0%) |
| 18 to 34 Years | 2 (8.7%) | 0 (0.0%) |
| 35 to 64 Years | 0 (0.0%) | 0 (0.0%) |
| 65 to 74 Years | 0 (0.0%) | 0 (0.0%) |
| 75 Years and over | 0 (0.0%) | 0 (0.0%) |
Technology Access in Flute Springs
Computing Device Access in Flute Springs
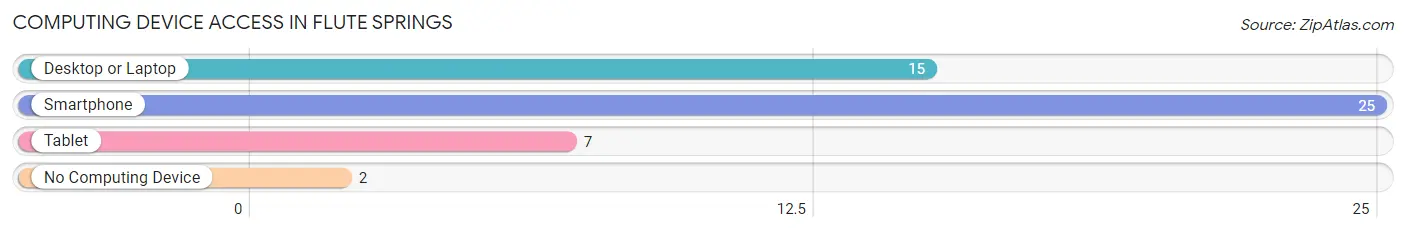
| Device Type | # Households | % Households |
| Desktop or Laptop | 15 | 50.0% |
| Smartphone | 25 | 83.3% |
| Tablet | 7 | 23.3% |
| No Computing Device | 2 | 6.7% |
| Total | 30 | 100.0% |
Internet Access in Flute Springs
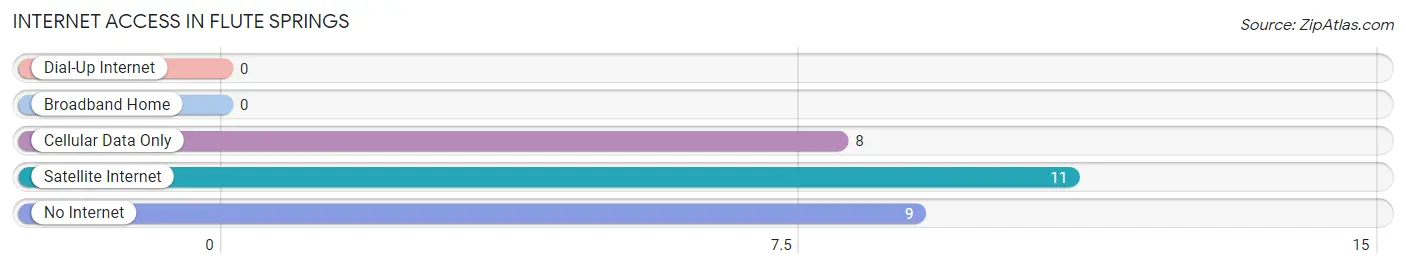
| Internet Type | # Households | % Households |
| Dial-Up Internet | 0 | 0.0% |
| Broadband Home | 0 | 0.0% |
| Cellular Data Only | 8 | 26.7% |
| Satellite Internet | 11 | 36.7% |
| No Internet | 9 | 30.0% |
| Total | 30 | 100.0% |
Flute Springs Summary
Flute Springs, Oklahoma is a small town located in the southeastern corner of the state. It is situated in the foothills of the Ouachita Mountains, and is surrounded by rolling hills and lush forests. The town was founded in the late 1800s by a group of settlers who were looking for a place to settle and start a new life.
The town of Flute Springs is located in Pushmataha County, Oklahoma. It is situated in the foothills of the Ouachita Mountains, and is surrounded by rolling hills and lush forests. The town was founded in the late 1800s by a group of settlers who were looking for a place to settle and start a new life. The town was named after the nearby Flute Springs, which was a popular spot for the settlers to gather and play music.
The population of Flute Springs in 2000 was approximately 500 people. The town is predominantly white, with a small minority population of African Americans and Native Americans. The median household income in 2000 was $25,000, and the median home value was $50,000. The town is served by the Pushmataha County School District, which provides education for students in grades K-12.
The economy of Flute Springs is largely based on agriculture and forestry. The town is home to several small farms, as well as a few larger farms that produce hay, corn, and other crops. The town also has a sawmill, which produces lumber for the local market. In addition, there are several small businesses in the town, including a grocery store, a hardware store, and a few restaurants.
The town of Flute Springs is a quiet, rural community with a strong sense of community and pride. The town is home to several churches, and there are several community events held throughout the year. The town is also home to a number of recreational activities, including fishing, hunting, and camping.
Flute Springs is a small town with a rich history and a bright future. The town is home to a diverse population, and the economy is largely based on agriculture and forestry. The town is a great place to live, work, and raise a family.
Common Questions
What is Per Capita Income in Flute Springs?
Per Capita income in Flute Springs is $19,304.
What is the Median Family Income in Flute Springs?
Median Family Income in Flute Springs is $69,583.
What is Inequality or Gini Index in Flute Springs?
Inequality or Gini Index in Flute Springs is 0.43.
What is the Total Population of Flute Springs?
Total Population of Flute Springs is 97.
What is the Total Male Population of Flute Springs?
Total Male Population of Flute Springs is 60.
What is the Total Female Population of Flute Springs?
Total Female Population of Flute Springs is 37.
What is the Ratio of Males per 100 Females in Flute Springs?
There are 162.16 Males per 100 Females in Flute Springs.
What is the Ratio of Females per 100 Males in Flute Springs?
There are 61.67 Females per 100 Males in Flute Springs.
What is the Median Population Age in Flute Springs?
Median Population Age in Flute Springs is 33.8 Years.
What is the Average Family Size in Flute Springs
Average Family Size in Flute Springs is 3.7 People.
What is the Average Household Size in Flute Springs
Average Household Size in Flute Springs is 3.2 People.
How Large is the Labor Force in Flute Springs?
There are 45 People in the Labor Forcein in Flute Springs.
What is the Percentage of People in the Labor Force in Flute Springs?
59.2% of People are in the Labor Force in Flute Springs.
What is the Unemployment Rate in Flute Springs?
Unemployment Rate in Flute Springs is 20.0%.